ANNUAL OPERATING BUDGET Fiscal Year 2022-2023

Welcome message from author
This document is posted to help you gain knowledge. Please leave a comment to let me know what you think about it! Share it to your friends and learn new things together.
Transcript
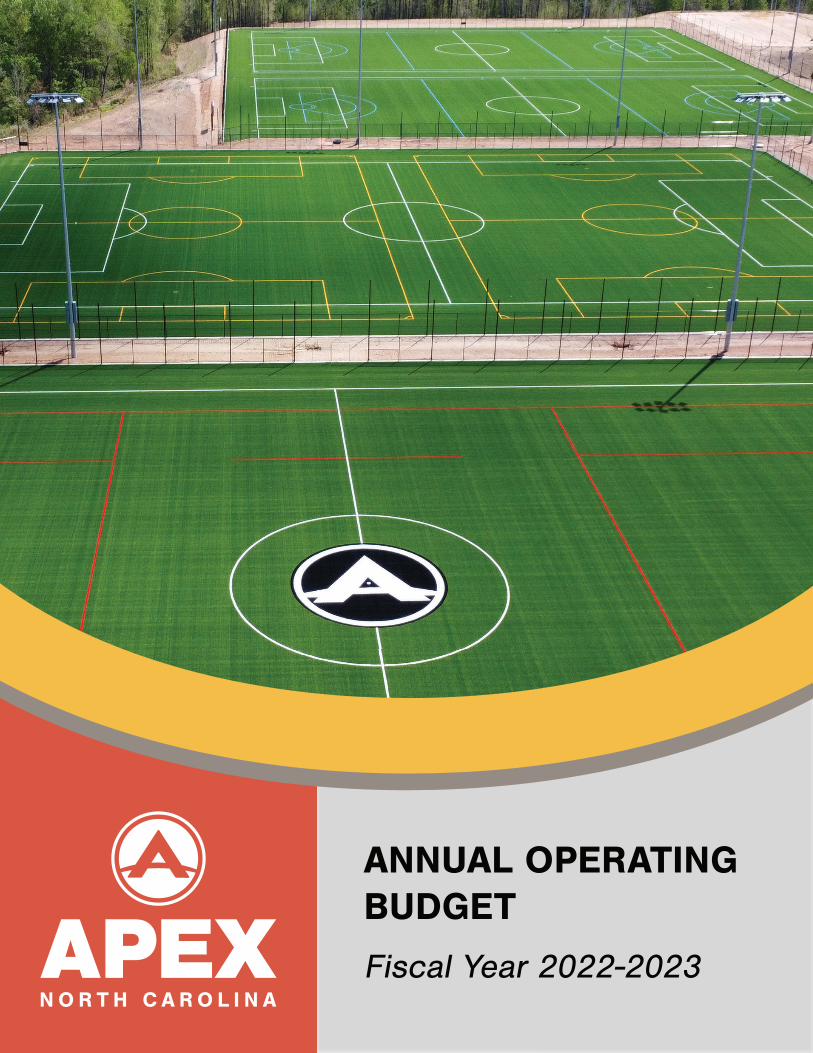
ANNUAL OPERATINGBUDGET
Fiscal Year 2022-2023
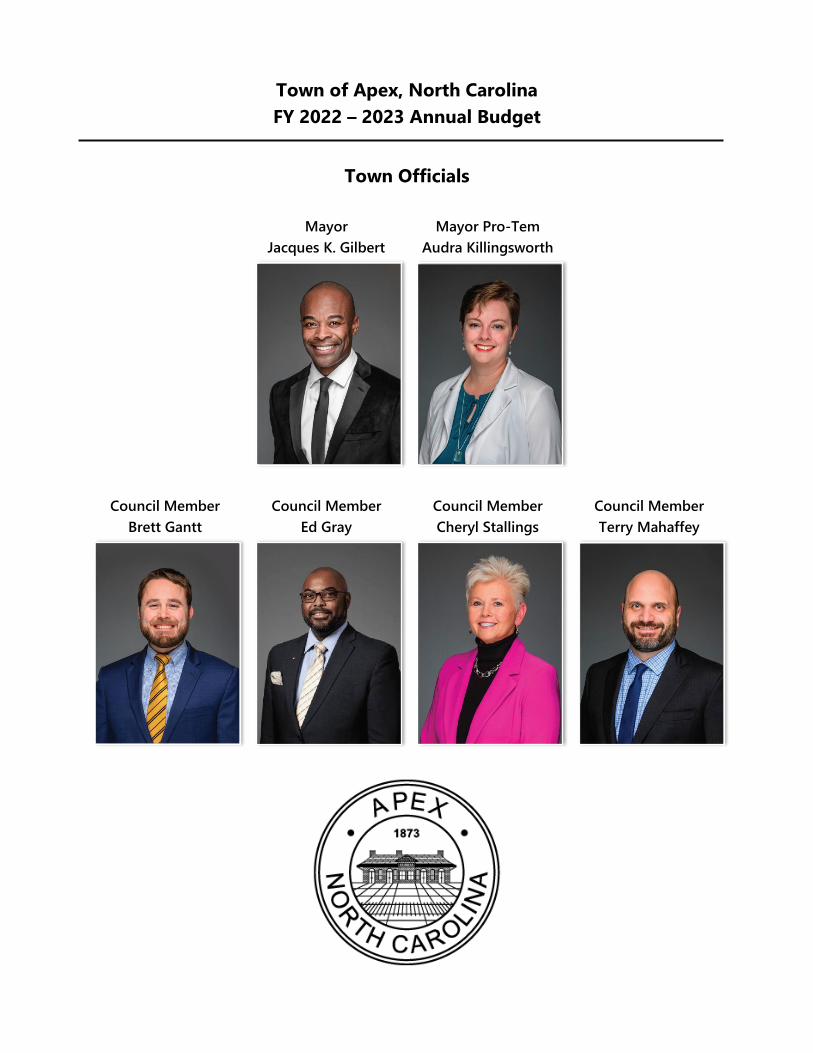
Town of Apex, North Carolina
FY 2022 – 2023 Annual Budget
Town Officials
Mayor
Jacques K. Gilbert
Mayor Pro-Tem
Audra Killingsworth
Council Member
Brett Gantt
Council Member
Ed Gray
Council Member
Cheryl Stallings
Council Member
Terry Mahaffey
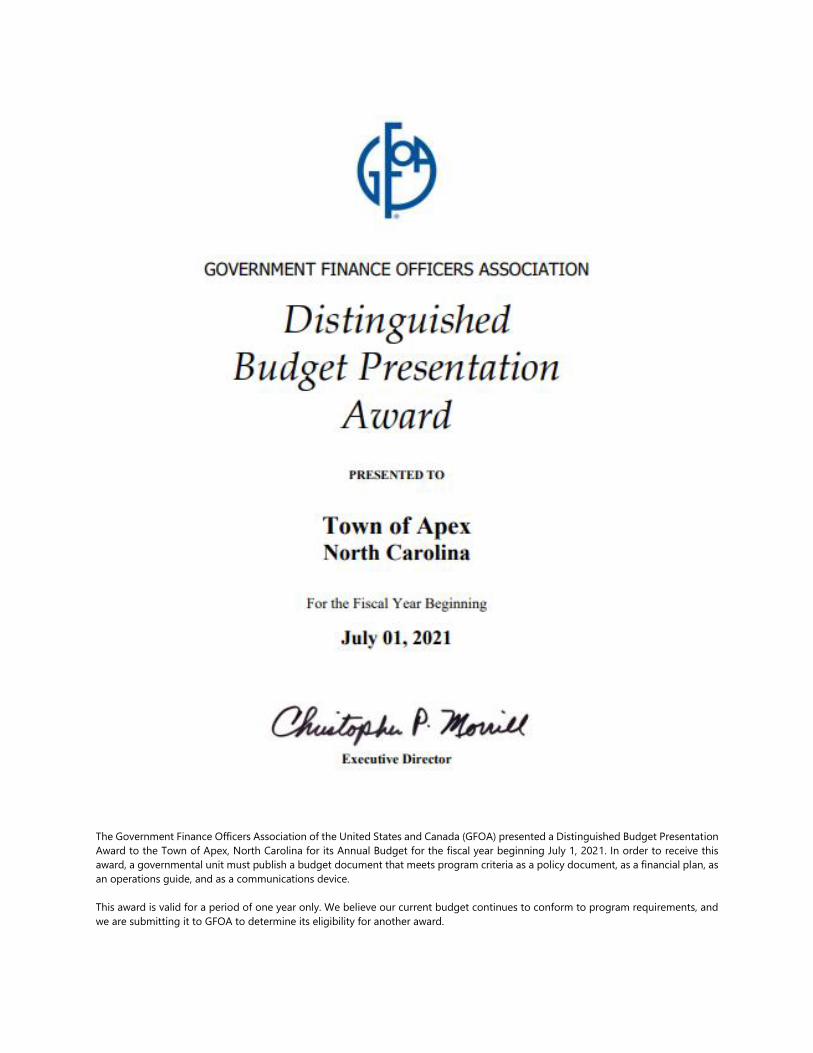
The Government Finance Officers Association of the United States and Canada (GFOA) presented a Distinguished Budget Presentation
Award to the Town of Apex, North Carolina for its Annual Budget for the fiscal year beginning July 1, 2021. In order to receive this
award, a governmental unit must publish a budget document that meets program criteria as a policy document, as a financial plan, as
an operations guide, and as a communications device.
This award is valid for a period of one year only. We believe our current budget continues to conform to program requirements, and
we are submitting it to GFOA to determine its eligibility for another award.
Town of Apex, North Carolina
FY 2022 – 2023 Annual Budget
Table of Contents
Budget Guide
Budget Guide ................................................................................ 1
Budget Message .......................................................................... 5
Budget Ordinance ..................................................................... 20
Fee Schedule ............................................................................... 25
Community & Organizational Profile
History ........................................................................................... 34
Geography ................................................................................... 35
Demographics ............................................................................ 35
Housing ......................................................................................... 36
Local Economy ........................................................................... 36
Government................................................................................. 38
Strategic Goals & Budget Alignment ................................ 40
Performance Measures ........................................................... 45
Financial Policies ........................................................................ 59
Financial Management System ............................................ 63
CIP & Budget Schedule .......................................................... 67
Budget Process .......................................................................... 68
Financial Summaries
Town Revenues .......................................................................... 71
Town Expenditures ................................................................... 74
Revenues vs. Expenditures .................................................... 78
Revenue Assumptions ............................................................. 79
Fund Balance ............................................................................... 82
Debt Obligation ......................................................................... 84
General Fund
Revenues ...................................................................................... 87
Expenditures ................................................................................ 93
General Government
Governing Body ......................................................................... 99
Administration ......................................................................... 103
Human Resources .................................................................. 107
Information Technology ...................................................... 111
Legal Services .......................................................................... 115
Communications ..................................................................... 118
Budget, Performance & Strategy ..................................... 121
Finance ........................................................................................ 124
Community & Neighborhood Connections ................. 128
Planning & Development
Economic Development ....................................................... 132
Planning...................................................................................... 136
Building Inspections & Permitting ................................... 140
Transportation & Infrastructure Development ........... 144
Public Safety
Police ........................................................................................... 148
Emergency Communications ............................................. 152
Fire ................................................................................................ 156
Public Works & Infrastructure
Public Works Administration .............................................. 160
Streets.......................................................................................... 163
Solid Waste Services .............................................................. 167
Facility Services ........................................................................ 170
Fleet Services ............................................................................ 174
Recreation & Culture
Parks & Recreation ................................................................. 177
Cultural Arts Center ............................................................... 181
Non-Departmental
Debt Service .............................................................................. 185
Other Financing Uses ........................................................... 185
Cemetery .................................................................................... 185
Special Appropriations ......................................................... 186
Contingency ............................................................................. 186
Electric Fund
Revenues .................................................................................... 187
Expenditures ............................................................................. 191
Electric Utility ........................................................................... 195
Electric Fund Non-Departmental ..................................... 199
Water & Sewer Fund
Revenues ................................................................................... 200
Expenditures ............................................................................. 204
Water & Sewer Utility ........................................................... 209
Water Sewer Administration .............................................. 211
Stormwater ............................................................................... 213
Water Treatment .................................................................... 215
Water Maintenance ............................................................... 217
Sewer Treatment .................................................................... 219
Sewer Maintenance ............................................................... 221
Water & Sewer Fund Non-Departmental ..................... 223
Capital Reserve Funds
Fire Capital Reserve ............................................................... 224
Transportation Capital Reserve ........................................ 224
Eva Perry Library Fund .......................................................... 225
Recreation Capital Reserve ................................................. 225
Water & Sewer Capital Reserves ...................................... 226
Other Funds
Health & Dental Fund ........................................................... 227
State & Federal Police Funds ............................................. 228
Police & Fire Donation Funds ............................................ 229
Affordable Housing Fund .................................................... 229
Cemetery Fund ........................................................................ 230
Supplemental Information
Approved Position Requests .............................................. 232
Personnel Summary ............................................................... 234
Non-Profit Funding ................................................................ 239
Glossary ...................................................................................... 241
Capital Improvement Plan
Capital Improvement Plan Index .................................... CIPii
Overview of the Capital Improvement Plan ............... CIP1
General Fund ........................................................................CIP10
CIP Financial Impact Analysis on General Fund ......CIP33
Electric Utility ........................................................................CIP38
Water and Sewer Utility ....................................................CIP42
Project Funding Detail ......................................................CIP48
Budget Guide
Budget Guide
The purpose of the Budget Guide is to introduce readers to the budget process and assist readers in understanding the
information in the budget document. The budget serves as an operations guide, financial plan, communications device,
policy document, and a resource for information about the Town of Apex. The Budget Guide will briefly describe the sections
contained within the budget document while explaining how to read charts and graphs and interpret numbers.
The Budget Document
The Town of Apex’s budget document consists of nine major sections: Budget Message and Ordinance, Community and
Organizational Profile, Financial Summaries, General Fund, Electric Fund, Water & Sewer Fund, Other Funds, Supplemental
Information, and Capital Improvement Plan.
Budget Message & Ordinance
The Budget Message is a letter from the Town Manager to Town Council that provides an overview of the upcoming fiscal
year budget and how it fits with Town Council’s priorities. The message includes issues facing the development of the
budget, significant budgetary items and trends, and the budgetary effect on short and long-term plans. This section also
contains the Budget Ordinance, which by statute sets the spending limits for the upcoming budget period (July 1 to June
30) when adopted by the Town Council and the approved Fee Schedule.
Community & Organizational Profile
This section of the document highlights general information about the Apex community including historical, geographical,
demographic, and economic features. Within the organizational profile, the reader will find information about the town’s
governmental structure and the financial policies and management systems that guide the budget process.
Financial Summaries
The Financial Summaries provide a summary of revenues, expenditures, fund balance, and debt obligation for the town’s
funds. Information provided in both numerical and narrative format easily helps the reader determine how much money
each fund is generating and spending.
Funds & Line Items
The fund is an independent fiscal and accounting entity. Funds make it easier to keep track of accounts that operate similar
types of activity and share the same set of accounting records. The Town of Apex operates three major funds: the General
Fund, Electric Fund, and Water & Sewer Fund. The town also operates several non-major funds.
General Fund. The General Fund accounts for most town operations such as general government, public safety, and
transportation. The reader will find information on each department, including a description of the department’s purpose,
prior year accomplishments, coming year initiatives and projects, budget highlights, budget trends, and personnel counts.
Electric Fund. The Electric Fund is an enterprise fund, which means it operates like a business. Electric customers pay energy
and demand charge fees to cover the cost of power delivery and use. This fund operates as a single department and
information is similar to the department sections in the General Fund.
1
Budget Guide
Water & Sewer Fund. The Water & Sewer Fund is an enterprise fund. Customers pay fees for water consumption and sewer
usage to cover the cost of water treatment and distribution and wastewater collection and treatment. This fund includes six
divisions, with the addition of Stormwater in FY 22-23 containing information similar to the department sections in the
General Fund.
Other Funds. The town’s other funds include the Affordable Housing Fund, Cemetery Fund, Fire and Police grant and
donation funds, the Eva Perry Library Fund, and capital reserve funds for fire, transportation, recreation, and water and sewer
capital projects. Each fund accounts for revenues and expenditures associated with a special function or area.
The budget for each fund consists of individual line items that represent specific expenditures and revenues. Examples of
line item expenditures include salaries, insurance, maintenance and repair, supplies, and capital outlay. Examples of line item
revenues include property tax revenues, sales tax revenues, grants, and fees. Line items are the most detailed way to list
budgeted expenditure and revenue information.
Capital Improvement Plan
The Apex Capital Improvement Plan (CIP) represents a multiyear forecast of the town’s capital needs. The CIP not only
identifies capital projects, but also the financing required for the projects and their impact on the operating budget. The CIP
includes project impact analysis and a description of each project.
Supplemental Information
This section contains other financial information about the Town of Apex, the Pay and Classification Schedule and Personnel
Listing, and a glossary of terms used throughout the document.
How to Read the Budget Document
The budget document contains an abundance of diverse and valuable information. With all the information and numbers,
wading through the document and deciphering what everything means can be difficult for any reader. This section is meant
to assist the reader’s understanding of presented data and show how the reader can connect the data with other supporting
information.
Sections of the budget are identified in the top right corner of each page. These headings identify the subject, fund,
department, or division being discussed and assist the reader in locating the information for which they are looking. Within
each section, bold and underlined headings identify major topics related to that section. Under these headings, the reader
may find written information, as well as information presented in table or chart form. The document highlights other
important terms and categories by identifying them in bold or italic.
Under the General Fund, Electric Fund, and Water & Sewer Fund, the reader will find the individual departments and divisions
sections. This document places an emphasis on the town’s departments and divisions because these sections represent the
operational plans for those responsible for directly providing services to citizens.
Interpreting Tables & Charts
The budget document uses tables and charts to summarize information through numbers. The tables and charts allow
readers to easily compare funds and departments and identify trends. Most sections contain tables and charts like the ones
below. The diagrams identify the major characteristics of each table and chart and explain what information the reader can
find.
2
Budget Guide
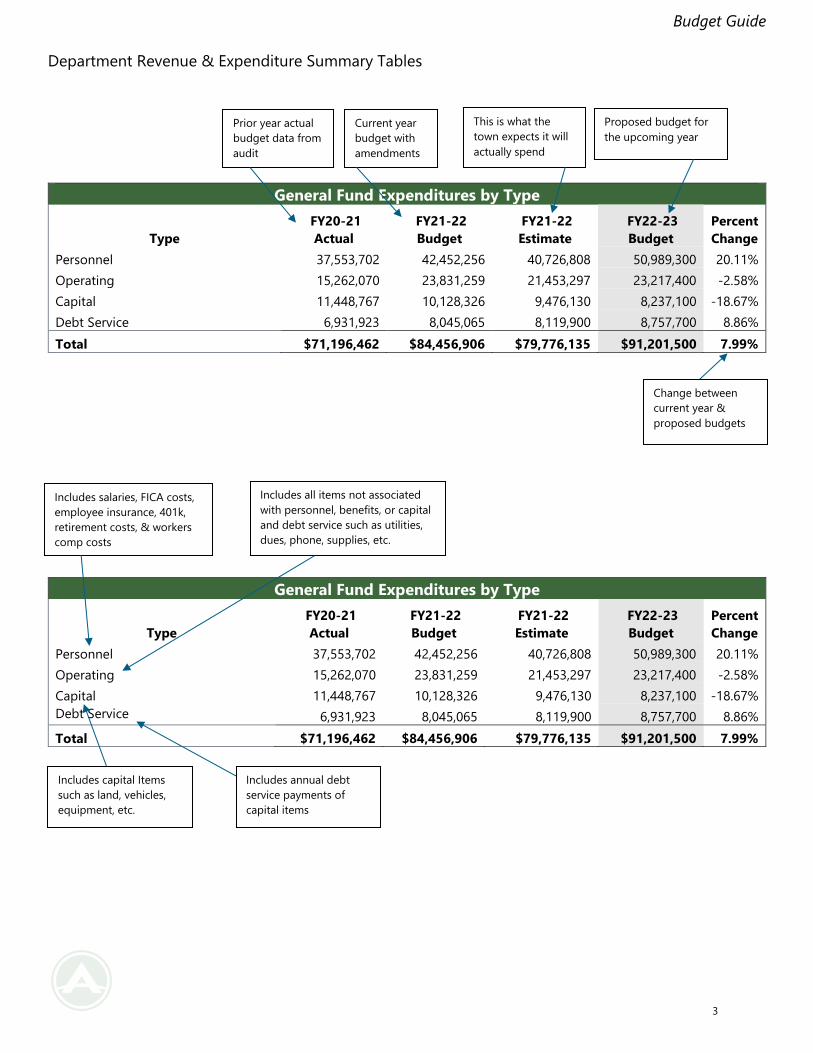
Department Revenue & Expenditure Summary Tables
General Fund Expenditures by Type
Type
FY20-21
Actual
FY21-22
Budget
FY21-22
Estimate
FY22-23
Budget
Percent
Change
Personnel 37,553,702 42,452,256 40,726,808 50,989,300 20.11%
Operating 15,262,070 23,831,259 21,453,297 23,217,400 -2.58%
Capital 11,448,767 10,128,326 9,476,130 8,237,100 -18.67%
Debt Service 6,931,923 8,045,065 8,119,900 8,757,700 8.86%
Total $71,196,462 $84,456,906 $79,776,135 $91,201,500 7.99%
Prior year actual
budget data from
audit
Proposed budget for
the upcoming year
This is what the
town expects it will
actually spend
Current year
budget with
amendments
Change between
current year &
proposed budgets
Includes all items not associated
with personnel, benefits, or capital
and debt service such as utilities,
dues, phone, supplies, etc.
Includes salaries, FICA costs,
employee insurance, 401k,
retirement costs, & workers
comp costs
Includes annual debt
service payments of
capital items
Includes capital Items
such as land, vehicles,
equipment, etc.
3
Budget Guide
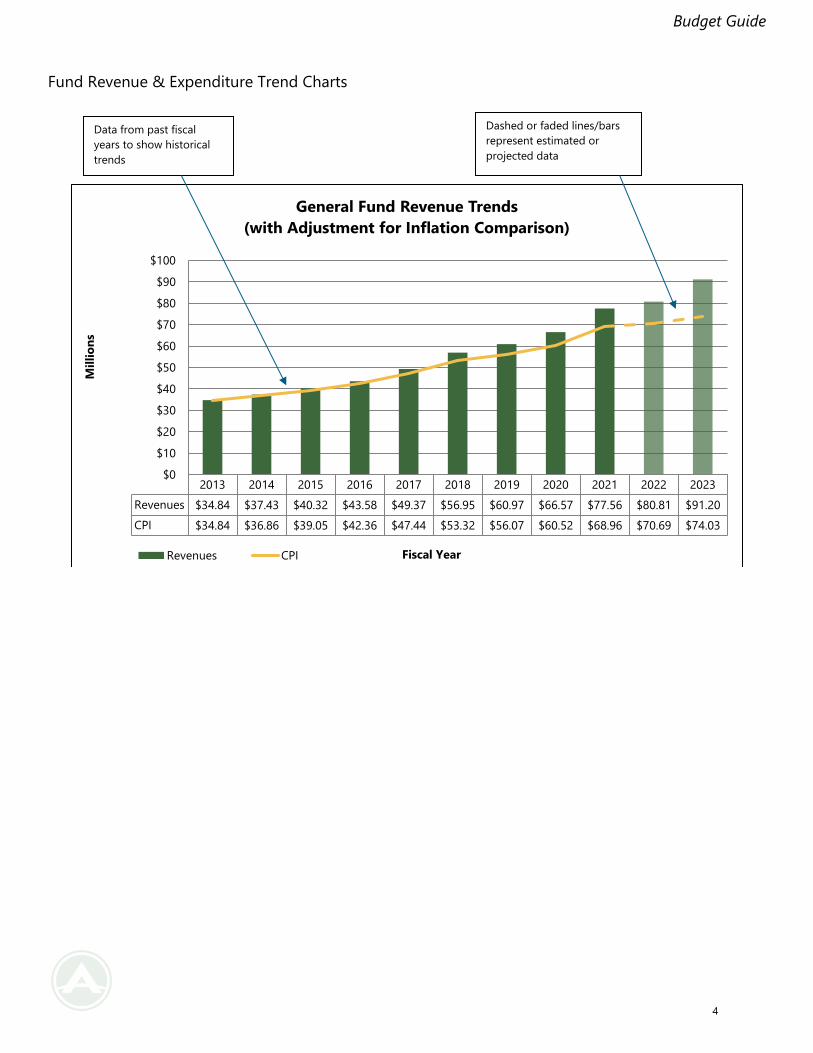
Fund Revenue & Expenditure Trend Charts
2013 2014 2015 2016 2017 2018 2019 2020 2021 2022 2023
Revenues $34.84 $37.43 $40.32 $43.58 $49.37 $56.95 $60.97 $66.57 $77.56 $80.81 $91.20
CPI $34.84 $36.86 $39.05 $42.36 $47.44 $53.32 $56.07 $60.52 $68.96 $70.69 $74.03
$0
$10
$20
$30
$40
$50
$60
$70
$80
$90
$100
Mil
lio
ns
Fiscal Year
General Fund Revenue Trends
(with Adjustment for Inflation Comparison)
Revenues CPI
Dashed or faded lines/bars
represent estimated or
projected data
Data from past fiscal
years to show historical
trends
4
Budget Message
Town of Apex, North Carolina
FY 2022 – 2023 Annual Budget
Budget Message
The Honorable Jacques K. Gilbert, Mayor
Members of the Apex Town Council
Dear Mayor Gilbert and Apex Town Council:
In accordance with the Local Government Budget and Fiscal Control Act and NC General Statute 159-11, I am pleased to
present the proposed Annual Budget for Fiscal Year 2022-2023 for your consideration.
Multiple factors influence the annual budget process, including the condition of the national, state, and local economies
and the needs identified in our community by elected officials, staff, advisory boards, and residents. While our most recent
resident survey responses were overwhelmingly positive, and the town continues to receive AAA bond ratings from Standard
& Poor’s Corporation and Aaa with Moody’s Investors Service, there are opportunities for improvement, and the town will
continue to strive to provide outstanding services. Considering the external effects of the economy, the needs identified for
our community, and feedback from the residents’ survey, the proposed budget represents a significant amount of careful
consideration and study in order for the town to meet its obligations, fulfill its goals, and remain fiscally healthy.
During budget preparation, town staff followed guidance from Town Council’s strategic goals to develop a proactive budget
that will balance improving current town programs and services with development of new programs and projects. In
September 2021, Town Council asked the Executive Leadership Team to incorporate staff expertise into the Council’s vision,
mission, and strategic goals as part of the town’s further development of its strategic plan. The budget will highlight Town
Council’s strategic goals throughout and present elements from the strategic plan and selected performance indicators.
Town Council’s strategic goals are:
High Performing Government: Deliver exceptional service valuing an engaged workforce with an emphasis
on efficiency, collaboration, innovation, and inclusion.
Responsible Development: Encourage equitable and sustainable development that provides accessibility
and connectivity throughout the community.
Environmental Leadership: Commit to sustaining natural resources and environmental well-being.
Economic Vitality: Improve and sustain an environment that invites and retains a diversity of residents,
employment opportunities, and businesses.
Welcoming Community: Create a safe and welcoming environment fostering community connections
and high-quality recreational and cultural experiences supporting a sense of belonging.
5
Budget Message
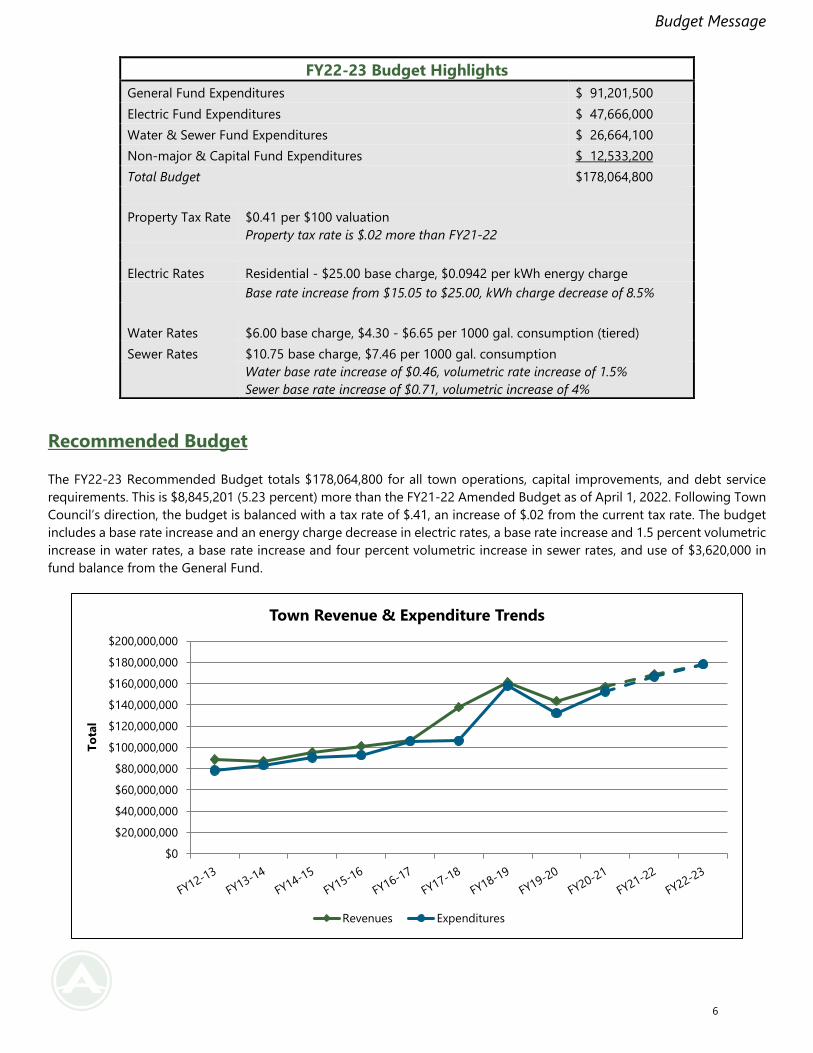
Recommended Budget
The FY22-23 Recommended Budget totals $178,064,800 for all town operations, capital improvements, and debt service
requirements. This is $8,845,201 (5.23 percent) more than the FY21-22 Amended Budget as of April 1, 2022. Following Town
Council’s direction, the budget is balanced with a tax rate of $.41, an increase of $.02 from the current tax rate. The budget
includes a base rate increase and an energy charge decrease in electric rates, a base rate increase and 1.5 percent volumetric
increase in water rates, a base rate increase and four percent volumetric increase in sewer rates, and use of $3,620,000 in
fund balance from the General Fund.
$0
$20,000,000
$40,000,000
$60,000,000
$80,000,000
$100,000,000
$120,000,000
$140,000,000
$160,000,000
$180,000,000
$200,000,000
To
tal
Town Revenue & Expenditure Trends
Revenues Expenditures
FY22-23 Budget Highlights
General Fund Expenditures $ 91,201,500
Electric Fund Expenditures $ 47,666,000
Water & Sewer Fund Expenditures $ 26,664,100
Non-major & Capital Fund Expenditures $ 12,533,200
Total Budget $178,064,800
Property Tax Rate $0.41 per $100 valuation
Property tax rate is $.02 more than FY21-22
Electric Rates Residential - $25.00 base charge, $0.0942 per kWh energy charge
Base rate increase from $15.05 to $25.00, kWh charge decrease of 8.5%
Water Rates $6.00 base charge, $4.30 - $6.65 per 1000 gal. consumption (tiered)
Sewer Rates $10.75 base charge, $7.46 per 1000 gal. consumption
Water base rate increase of $0.46, volumetric rate increase of 1.5%
Sewer base rate increase of $0.71, volumetric increase of 4%
6
Budget Message
General Fund
The General Fund accounts for resources not required legally or by sound financial management to be accounted for in
another fund. The General Fund includes services that cannot be operated as a business enterprise and rely on tax dollars
as their primary source of revenue. The FY22-23 Recommended Budget for the General Fund totals $91,201,500, which is
7.99 percent more than the FY21-22 Amended Budget of $84,456,906 as of April 1, 2022.
General Fund Expenditures
Apex’s population continues to grow at a rapid pace, with a five-year average of 7.6 percent. The new growth brings about
increasing demands on town services. To keep pace with this demand and provide new services, the town must provide for
necessary resources in the budget. These resources include personnel, supplies, equipment, and investment in facilities and
infrastructure. The Town of Apex is dedicated to sound financial management and diligently evaluates all expenditures to
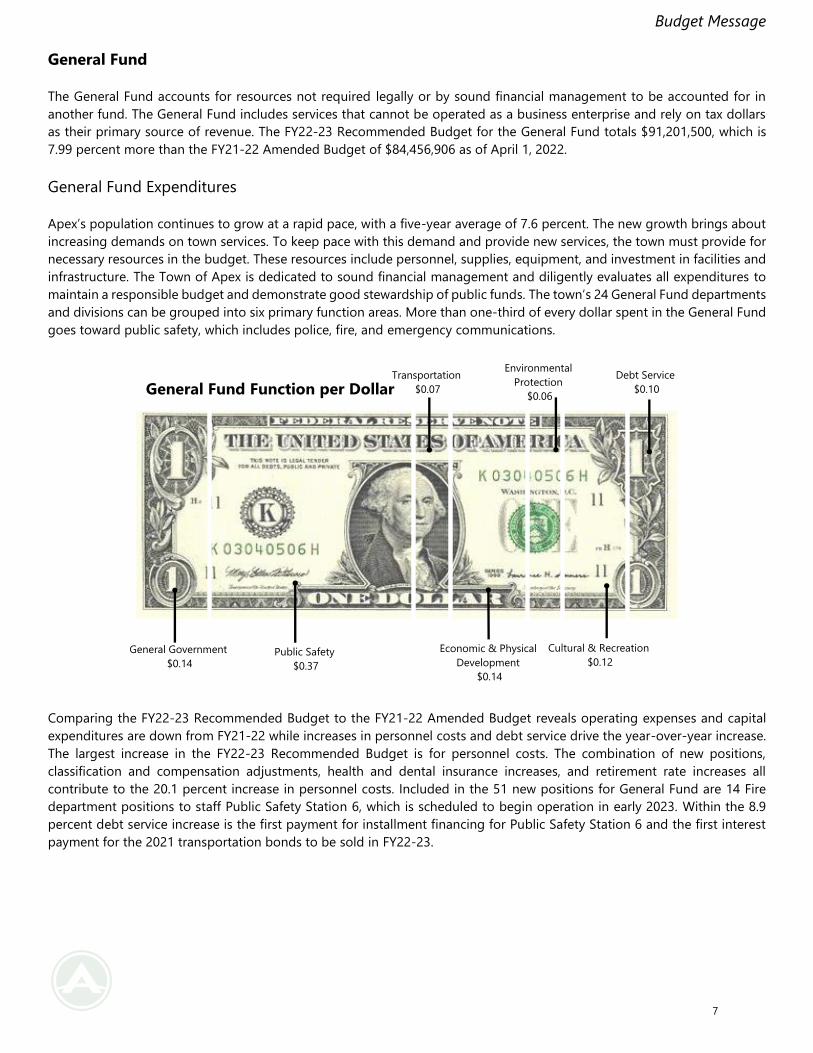
maintain a responsible budget and demonstrate good stewardship of public funds. The town’s 24 General Fund departments
and divisions can be grouped into six primary function areas. More than one-third of every dollar spent in the General Fund
goes toward public safety, which includes police, fire, and emergency communications.
Comparing the FY22-23 Recommended Budget to the FY21-22 Amended Budget reveals operating expenses and capital
expenditures are down from FY21-22 while increases in personnel costs and debt service drive the year-over-year increase.
The largest increase in the FY22-23 Recommended Budget is for personnel costs. The combination of new positions,
classification and compensation adjustments, health and dental insurance increases, and retirement rate increases all
contribute to the 20.1 percent increase in personnel costs. Included in the 51 new positions for General Fund are 14 Fire
department positions to staff Public Safety Station 6, which is scheduled to begin operation in early 2023. Within the 8.9
percent debt service increase is the first payment for installment financing for Public Safety Station 6 and the first interest
payment for the 2021 transportation bonds to be sold in FY22-23.
General Government
$0.14 Public Safety
$0.37
Transportation
$0.07
Economic & Physical
Development
$0.14
Environmental
Protection
$0.06
Cultural & Recreation
$0.12
Debt Service
$0.10 General Fund Function per Dollar
7
Budget Message
General Fund Expenditures by Type
Type
FY20-21
Actual
FY21-22
Budget
FY21-22
Estimate
FY22-23
Budget
Percent
Change
Personnel 37,553,702 42,452,256 40,726,808 50,989,300 20.11%
Operating 15,262,070 23,831,259 21,453,297 23,217,400 -2.58%
Capital 11,448,767 10,128,326 9,476,130 8,237,100 -18.67%
Debt Service 6,931,923 8,045,065 8,119,900 8,757,700 8.86%
Total $71,196,462 $84,456,906 $79,776,135 $91,201,500 7.99%
General Fund Department/Division Budgets
Department/Division
FY20-21
Actual
FY21-22
Budget
FY22-23
Budget
Percent
Change
FY21-22
Variance
Governing Body 169,148 326,450 256,100 -21.55% (70,350)
Administration 1,434,298 2,208,676 1,695,100 -23.25% (513,576)
Human Resources 1,379,528 1,930,407 1,988,600 3.01% 58,193
Information Technology 2,166,420 2,866,339 2,920,100 1.88% 53,761
Legal Services 458,514 546,419 578,800 5.93% 32,381
Economic Development 525,807 632,646 659,400 4.23% 26,754
Communications - - 562,100 - 562,100
Budget, Performance Mgmt. & Strategy - - 801,500 - 801,500
Finance 847,083 871,415 1,022,200 17.30% 150,785
Community & Neighborhood Connections - - 541,600 - 541,600
Planning 2,264,031 3,568,066 4,008,900 12.35% 440,834
Facility Services 1,563,280 2,496,279 1,432,600 -42.61% (1,063,679)
Police 12,618,221 14,583,894 16,769,300 14.99% 2,185,406
911 Communications 1,080,347 1,288,631 1,548,700 20.18% 260,069
Fire 10,898,546 12,286,335 15,866,700 29.14% 3,580,365
Transportation & Infrastructure Development 1,167,706 1,466,762 3,409,000 132.42% 1,942,238
Public Works Administration 1,811,358 2,715,338 550,100 -79.74% (2,165,238)
Streets 3,472,615 5,484,410 4,544,500 -17.14% (939,910)
Solid Waste 5,189,105 6,298,116 5,854,600 -7.04% (443,516)
Fleet Services 462,609 608,908 548,800 -9.87% (60,108)
Inspections & Permitting 2,502,560 3,228,834 2,984,300 -7.57% (244,534)
Parks & Recreation 5,041,211 6,636,489 7,242,200 9.13% 605,711
Cultural Arts Center 443,601 870,955 1,101,000 26.41% 230,045
Cemetery 37,840 50,800 51,000 0.39% 200
Special Appropriations 174,387 607,272 72,000 -88.14% (535,272)
Other Uses 8,556,325 4,688,400 5,284,600 12.72% 596,200
Debt Service 6,931,923 8,045,065 8,757,700 8.86% 712,635
Contingency - 150,000 150,000 0.00% -
Total $71,196,462 $84,456,906 $91,201,500 7.99% $6,744,594
General Fund Capital Highlights
In order to continue providing outstanding services to the community, the town intends to continue investing in
infrastructure and other capital needs during FY22-23. General Fund capital expenditures are noticeably less for FY22-23 at
9.03 percent as opposed to 11.99 percent in FY21-22 and 16.08 percent FY20-21. Even with a more positive economic
outlook post-pandemic, Town Council recognized that beginning construction on the proposed transportation projects
presented a challenge while relying only on natural revenue growth. To address this challenge, Town Council chose to seek
a bond referendum in November 2021 for $42 million in transportation projects to be completed over the next decade.
8
Budget Message
Additionally, Council has set a goal to increase capital spending to a level comparable to past years as a percentage of the
overall General Fund budget. Analysis and projections to achieve this goal along with more information about capital
projects, including project descriptions, expected funding sources, debt and operating impacts, and schedules, is located in
the Capital Improvement Plan section of the budget document. Highlighted below are some of the significant capital
projects included in the FY22-23 Recommended Budget. These projects are all related to General Fund activities and may
be included in the General Fund budget or a corresponding capital project fund.
Annual Pavement Management – Street Resurfacing ($2,000,000)
The town is responsible for maintaining over 220 miles of municipal streets with the annual resurfacing
contract providing for most of the pavement maintenance needs. Street mileage is growing annually with
ongoing development. This annual program addresses deficiencies in pavement condition throughout Apex
to prevent issues such as potholes, alligator cracking, and rutting in order to provide a safe and reliable
transportation system. The Powell Bill program provides an annual funding allocation from the state based
on public centerline miles of road accepted and maintained by the town. Current and future resurfacing
costs continue to exceed Powell Bill allocations. The proposed bond referendum includes $5.0 million to
address a backlog of pavement management projects.
GPS Emergency Vehicle Preemption ($260,000)
In the first year, this project includes installing GPS preempt in 10 traffic signals and outfitting all fire vehicles
with GPS preempt capability. Emergency vehicle preemption is designed to give emergency response
vehicles a green light on their approach to a signalized intersection while providing a red light to conflicting
approaches. Existing infrared preemption is only available for certain directions at four signals town wide
and the Apex Fire Department no longer has infrared emitters.
Justice Heights Street Extension ($250,000)
This project includes extending Justice Heights Street from its existing stub west of South Salem Street to
intersect with the Apex Peakway and includes sidewalk on the north side of the street. The project would
improve local connectivity for traffic flow south of NC 55 and pedestrian connectivity between Salem Street
and Apex Peakway through the Justice Heights neighborhood. The FY22-23 Recommended Budget includes
$250,000 for study and design.
Felton Grove High School Road Improvements Cost Share ($500,000)
This project will contribute funds toward offsite intersection improvements as part of the construction of
proposed Felton Grove High School that are beyond the required improvements for Wake County Public
School System (WCPSS). This project addresses capacity and safety issues at multiple access points to the
school. Funding is being prioritized ahead of construction in order to enter into an agreement with the
school with full payment in 2025.
Ragan Road Sidepath ($200,000)
This project includes creating a connection from the current end of the Ragan Road sidepath to the
American Tobacco Trail. Currently, there is no public access along Ragan Road to the American Tobacco
Trail. Initial funding is for study and design.
Safe Routes to School ($1,710,000)
The town annually budgets for Safe Routes to School (SRTS) projects to improve and add to existing town
infrastructure related to pedestrian and bicycle traffic to and from schools. A portion of the 2021
transportation bonds are dedicated to SRTS projects. The FY22-23 Budget includes funding for Downtown
Apex Safe Routes to School and transit connections, construction of a high-priority SRTS project serving
Thales Academy, sidewalk along the east side of N. Salem Street from north of Apex Peakway to Peak United
Methodist Church, design of a high priority SRTS project serving Apex Middle School, sidewalk along N.
9
Budget Message
Hughes Street from E. Chatham Street to Apex Community Center, and sidewalk along S. Mason Street from
E. Moore Street to E. Chatham Street.
Tingen Road Pedestrian Bridge ($150,000)
This allocation is for the study of a pedestrian bridge over the railroad crossing of Tingen Road. The current
at-grade railroad crossing will be closed as part of the Apex Peakway Southwest Connector project per the
agreement with CSX. A pedestrian bridge will provide members of the community a safe way to cross the
railroad tracks on Tingen Road to access downtown Apex, multi-family residential developments, multiple
churches, and Apex Elementary School. A feasibility study will determine more accurate scope and cost.
Wayfinding Signage Fabrication & Installation ($320,000) This project includes fabrication and installation of Wayfinding signage throughout town. Sign types include
parking directional, vehicular directional, pedestrian directional, destination identification, and gateway
signage. This project was identified as part of the Downtown Plan & Parking Study and is an extension of
the Community Branding Study.
General Fund Revenues
The Town of Apex continues to experience growth in its primary revenue sources – ad valorem taxes and sales tax. Population
growth, steady development, and increasing property values have naturally contributed to a growing tax base that helps
Apex retain a modest tax rate while providing exceptional services. The total assessed value in Apex has increased by 160.4
percent in the past ten years, including revaluations in 2016 and 2020. The FY22-23 tax base for Apex is projected to grow
by $704,163,500 (6.29 percent) to $11,905,025,641 and each penny on the tax rate is equivalent to $1,189,312 in revenue.
Excluding property tax and sales tax revenues and use of fund balance, all other General Fund revenues collectively represent
a modest 1.28 percent increase from the FY21-22 Amended Budget. Overall, the FY22-23 Budget reflects a 7.99 percent
increase in revenues when compared to the FY21-22 Amended Budget.
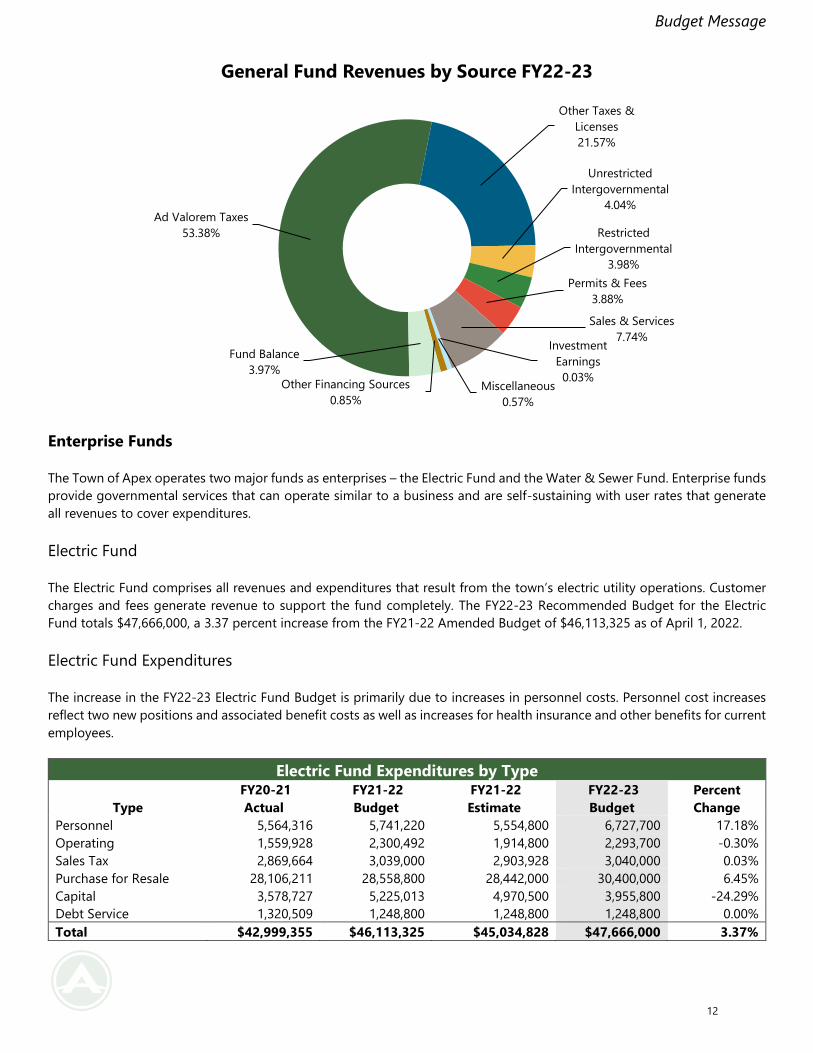
Ad Valorem Tax
Property taxes represent 53.4 percent of General Fund
revenues. For FY22-23, the ad valorem tax base is an
estimated $11.91 billion, which will generate $48.68
million in property tax revenue with a tax rate of $0.41
per $100 valuation at a 99.9 percent collection rate.
This represents an increase in ad valorem revenue of
$5.99 million (14.02 percent). The tax rate is $.02 more
than the FY21-22 tax rate. In November 2021, Apex
residents overwhelmingly approved $42 million in
general obligation bonds for streets and sidewalk
projects. In order to repay the debt service on the
approved bonds, the town will increase the tax rate by
$.03 in two increments – $.014 in FY22-23 and $.016 in
FY25-26. The FY22-23 tax rate includes a $.014 increase
for the first increment of the 2021 transportation bonds and a $.006 increase to contribute toward growing personnel needs
and capital projects.
Local Option Sales Tax
Sales tax represents the town’s second largest revenue source in the General Fund at $19.34 million (21.74 percent). The
State of North Carolina collects sales tax and distributes it to the local units. Sales tax revenues are distributed on a
4.845.28
6.47
7.86
10.3611.20
11.91
0
2
4
6
8
10
12
14
$B
illi
on
s
Assessed Value by Year
10
Budget Message
proportional population basis in Wake County. The population growth in Apex has allowed the town to increase its share of
sales tax revenues. Sales tax revenues have increased the past several years as the economy rebounded from the pandemic
and with the natural growth in Wake County. The impacts of inflation, international instability, and the lingering effects of
the COVID-19 pandemic on the economy temper sales tax projections for the coming year. The town, however, has
continued to see a positive trend during FY21-22 with sales tax revenues being up 12.9 percent over the previous year
through the January distribution. The FY22-23 sale tax estimates reflect this positive trend, albeit with a more modest growth
rate of eight percent over the current end of year projections.
Solid Waste, Recycling, & Yard Waste Fees
The town currently contracts with a private hauler for solid waste
and recycling collections. The solid waste and recycling fees offset
the town’s contract cost. Solid waste fees will generate $2,852,000
and recycling fees will generate $1,257,400 in FY22-23. The town
conducts its own yard waste collection and covers the cost with a
monthly yard waste fee. The yard waste fee will generate
$2,122,200. Solid waste and recycling fees will increase in
accordance with our service contract in FY22-23. Solid waste
fees include the standard adjustment for inflation of 2.50 percent
included in the service contract. Recycling fees decreased due to a
processing fee reduction from $1.27 per unit to $0.75. Landfill
disposal fees are increasing by $5.00 per ton in the new fiscal year, creating an additional cost incorporated into the fees.
Fund Balance Appropriation
Fund balance is, simply explained, the amount of assets in excess of liabilities in a given fund. These funds enable the town
to meet financial obligations without interruptions due to cash flow, generate investment income, eliminate the need for
short-term borrowing, and provide a reserve of funds to respond to emergencies or opportunities. Occasionally, the town
will use money from fund balance to cover one-time expenses such as specific capital items. The town evaluates any decision
to use fund balance carefully and often plans the use in advance to ensure adherence to the town’s fund balance policy.
The FY22-23 Recommended Budget includes a fund balance allocation of $3,620,000, including $1,500,000 for a ladder
truck replacement, $400,000 for Eva Perry Library repairs, $325,000 for development of the police firing and training range,
$320,000 for installation of wayfinding signage, $225,000 for development of the Hunter Street Bike Track, $650,000 for
Beaver Creek Greenway improvements, and $200,000 for the Ragan Road side path design.
General Fund Revenues by Source
Source
FY20-21
Actual
FY21-22
Budget
FY21-22
Estimate
FY22-23
Budget
Percent
Change
Ad Valorem Taxes 39,461,896 42,698,700 43,441,500 48,684,400 14.02%
Other Taxes & Licenses 16,061,247 15,967,400 18,106,442 19,670,000 23.19%
Unrestricted Intergovernmental 3,407,570 3,215,000 3,526,306 3,680,000 14.46%
Restricted Intergovernmental 4,665,171 3,372,500 3,542,648 3,632,400 7.71%
Permits & Fees 4,953,091 3,534,300 3,376,362 3,537,000 0.08%
Sales & Services 6,166,557 6,809,900 6,623,454 7,058,200 3.65%
Investment Earnings 654,438 40,000 10,031 25,000 -37.50%
Miscellaneous 575,121 386,977 548,250 519,500 34.25%
Other Financing Sources 1,612,441 1,625,000 1,635,500 775,000 -52.31%
Fund Balance - 6,807,129 - 3,620,000 -46.82%
Total $77,557,531 $84,456,906 $80,810,492 $91,201,500 7.99%
Solid Waste, Recycling, & Yard Waste
Monthly Charges
FY21-22 FY22-23
Yard Waste Collection $7.83 $7.83
Residential Roll-Out Cart $8.94 $9.61
Commercial Roll-Out Cart $18.75 $20.12
Recycling (per Bin or Cart) $4.98 $4.55
4-CY Dumpster Service $131.40 $141.18
6-CY Dumpster Service $155.46 $169.09
8-CY Dumpster Service $177.64 $194.00
11
Budget Message
Enterprise Funds
The Town of Apex operates two major funds as enterprises – the Electric Fund and the Water & Sewer Fund. Enterprise funds
provide governmental services that can operate similar to a business and are self-sustaining with user rates that generate
all revenues to cover expenditures.
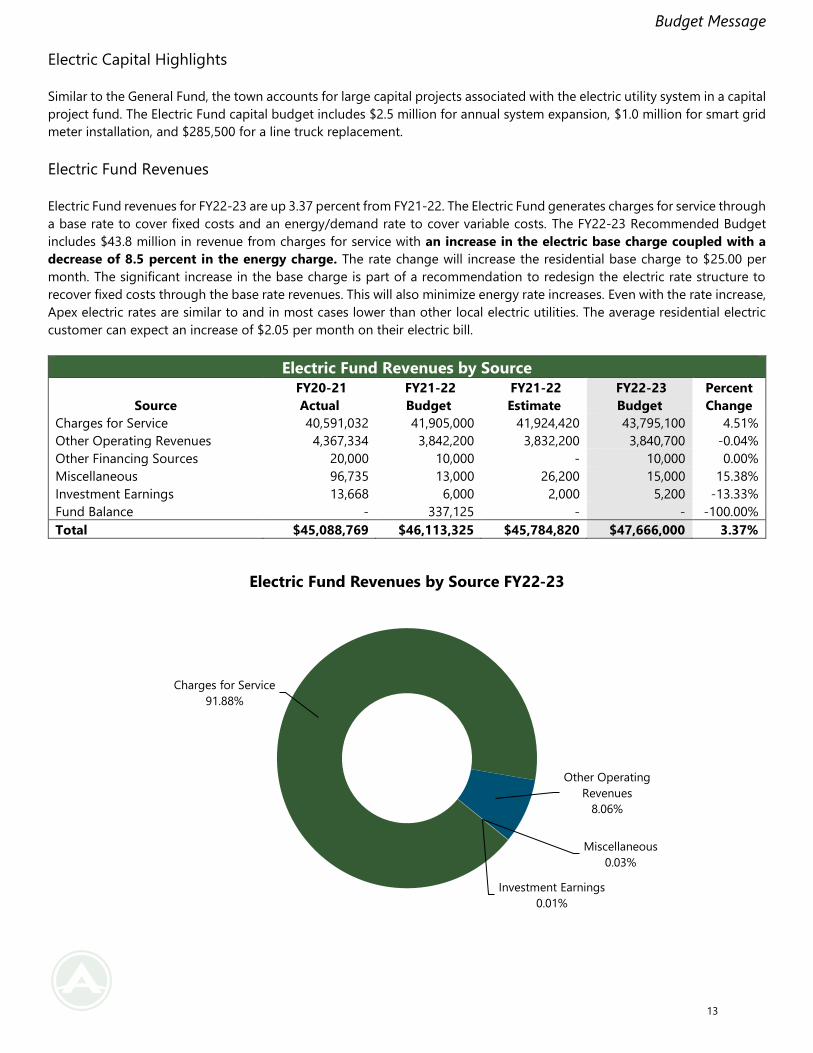
Electric Fund
The Electric Fund comprises all revenues and expenditures that result from the town’s electric utility operations. Customer
charges and fees generate revenue to support the fund completely. The FY22-23 Recommended Budget for the Electric
Fund totals $47,666,000, a 3.37 percent increase from the FY21-22 Amended Budget of $46,113,325 as of April 1, 2022.
Electric Fund Expenditures
The increase in the FY22-23 Electric Fund Budget is primarily due to increases in personnel costs. Personnel cost increases
reflect two new positions and associated benefit costs as well as increases for health insurance and other benefits for current
employees.
Electric Fund Expenditures by Type
Type
FY20-21
Actual
FY21-22
Budget
FY21-22
Estimate
FY22-23
Budget
Percent
Change
Personnel 5,564,316 5,741,220 5,554,800 6,727,700 17.18%
Operating 1,559,928 2,300,492 1,914,800 2,293,700 -0.30%
Sales Tax 2,869,664 3,039,000 2,903,928 3,040,000 0.03%
Purchase for Resale 28,106,211 28,558,800 28,442,000 30,400,000 6.45%
Capital 3,578,727 5,225,013 4,970,500 3,955,800 -24.29%
Debt Service 1,320,509 1,248,800 1,248,800 1,248,800 0.00%
Total $42,999,355 $46,113,325 $45,034,828 $47,666,000 3.37%
Ad Valorem Taxes
53.38%
Other Taxes &
Licenses
21.57%
Unrestricted
Intergovernmental
4.04%
Restricted
Intergovernmental
3.98%
Permits & Fees
3.88%
Sales & Services
7.74%Investment
Earnings
0.03%Miscellaneous
0.57%
Other Financing Sources
0.85%
Fund Balance
3.97%
General Fund Revenues by Source FY22-23
12
Budget Message
Electric Capital Highlights
Similar to the General Fund, the town accounts for large capital projects associated with the electric utility system in a capital
project fund. The Electric Fund capital budget includes $2.5 million for annual system expansion, $1.0 million for smart grid
meter installation, and $285,500 for a line truck replacement.
Electric Fund Revenues
Electric Fund revenues for FY22-23 are up 3.37 percent from FY21-22. The Electric Fund generates charges for service through
a base rate to cover fixed costs and an energy/demand rate to cover variable costs. The FY22-23 Recommended Budget
includes $43.8 million in revenue from charges for service with an increase in the electric base charge coupled with a
decrease of 8.5 percent in the energy charge. The rate change will increase the residential base charge to $25.00 per
month. The significant increase in the base charge is part of a recommendation to redesign the electric rate structure to
recover fixed costs through the base rate revenues. This will also minimize energy rate increases. Even with the rate increase,
Apex electric rates are similar to and in most cases lower than other local electric utilities. The average residential electric
customer can expect an increase of $2.05 per month on their electric bill.
Electric Fund Revenues by Source
Source
FY20-21
Actual
FY21-22
Budget
FY21-22
Estimate
FY22-23
Budget
Percent
Change
Charges for Service 40,591,032 41,905,000 41,924,420 43,795,100 4.51%
Other Operating Revenues 4,367,334 3,842,200 3,832,200 3,840,700 -0.04%
Other Financing Sources 20,000 10,000 - 10,000 0.00%
Miscellaneous 96,735 13,000 26,200 15,000 15.38%
Investment Earnings 13,668 6,000 2,000 5,200 -13.33%
Fund Balance - 337,125 - - -100.00%
Total $45,088,769 $46,113,325 $45,784,820 $47,666,000 3.37%
Charges for Service
91.88%
Other Operating
Revenues
8.06%
Miscellaneous
0.03%
Investment Earnings
0.01%
Electric Fund Revenues by Source FY22-23
13
Budget Message
Water & Sewer Fund
The Water & Sewer Fund comprises all revenues and expenditures that result from the town’s water and sewer utility
operations. Customer charges and fees generate enough revenue to support the fund completely. The FY22-23
Recommended Budget for the Water and Sewer Fund totals $26,664,100, an 8.16 percent increase from the FY21-22
Amended Budget of $24,653,210 as of April 1, 2022. Beginning January 1, 2022, the town began operating its stormwater
activities as a self-supporting utility and incorporated stormwater expenses as a distinct division within the Water & Sewer
Fund.
Water & Sewer Fund Expenditures
The FY22-23 Water & Sewer Fund Budget reflects an increase in all expenditure categories except capital. New positions
and reassignment of the grounds and easement and sewer outfall maintenance teams to water and sewer divisions, including
stormwater, primarily account for the significant increase in personnel cost. Additionally, a full year of stormwater operations
included in the Water & Sewer Fund influences the increase in the FY22-23 Budget. The FY22-23 Recommended Budget
includes $135,000 as part of the town’s continued annual commitment to watershed protection.
Water & Sewer Fund Expenditures by Type
Type
FY20-21
Actual
FY21-22
Budget
FY21-22
Estimate
FY22-23
Budget
Percent
Change
Personnel 6,834,655 7,153,880 6,603,200 9,269,700 29.58%
Operating 3,305,540 5,344,697 4,645,950 6,313,100 18.12%
Purchase for Resale 4,043,601 4,235,000 1,966,000 4,600,000 8.62%
Capital 5,543,969 4,198,533 3,782,883 2,728,900 -35.00%
Debt Service 4,268,690 3,721,100 3,721,100 3,752,400 0.84%
Total $23,996,455 $24,653,210 $20,719,133 $26,664,100 8.16%
Water & Sewer Fund Department/Division Budgets
Department/Division
FY20-21
Actual
FY21-22
Budget
FY22-23
Budget
Percent
Change
FY21-22
Variance
Water-Sewer Admin. 3,525,394 4,469,145 4,837,200 8.24% 368,055
Stormwater - 205,900 1,935,600 840.07% 1,729,700
Water Treatment 2,341,750 2,593,125 2,800,700 8.00% 207,575
Water Maintenance 2,879,420 3,752,795 4,093,700 9.08% 340,905
Sewer Treatment 6,757,908 4,596,498 3,942,500 -14.23% (653,998)
Sewer Maintenance 2,493,293 3,264,647 3,802,000 16.46% 537,353
Debt Service 4,268,690 3,721,100 3,752,400 0.84% 31,300
Other Financing Uses 1,730,000 1,900,000 1,400,000 -26.32% (500,000)
Special Appropriation - - - - -
Contingency - 150,000 100,000 -33.33% (50,000)
Total $23,996,455 $24,653,210 $26,664,100 8.16% $2,010,890
Water & Sewer Capital Highlights
Similar to the General Fund, the town accounts for large capital projects associated with the water and sewer utility system
in a capital project fund as well as within the operating fund itself. The Water & Sewer Capital Project fund will include
$5,422,200 in FY22-23 for design work for the Big Branch 2 Pump Station ($1.0 million), the Beaver Creek Commons Gravity
Sewer Extension ($1.4 million), continuation of the Western Transmission Main project ($2.1 million), and the Cary-Apex
14
Budget Message
water and sewer projects ($922,200). Of this total, coverage for only $1.4 million will come from the Water & Sewer operating
fund. Water & Sewer Capital Reserves will fund the remaining $4.02 million. The Water & Sewer operating budget includes
additional capital expenditures totaling $1,328,900 for the Beaver Creek streambank restoration (stormwater), a crane truck,
miscellaneous water meter installations and water main connections, and various vehicle and equipment replacements.
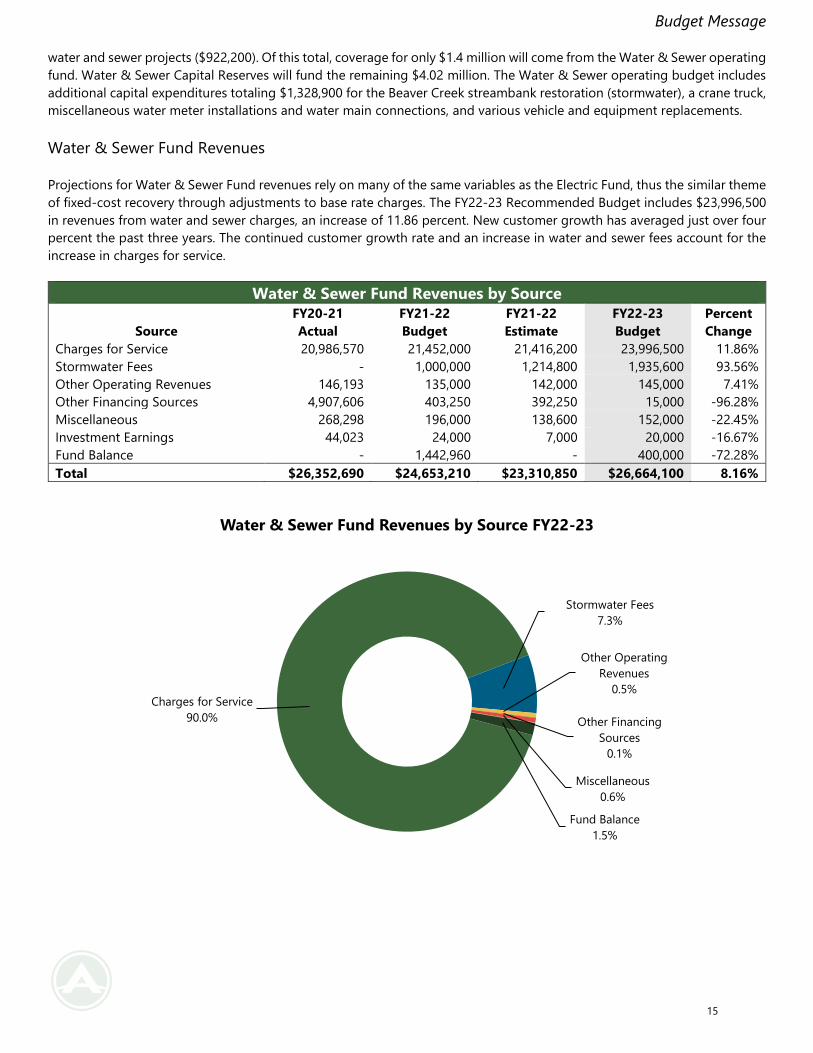
Water & Sewer Fund Revenues
Projections for Water & Sewer Fund revenues rely on many of the same variables as the Electric Fund, thus the similar theme
of fixed-cost recovery through adjustments to base rate charges. The FY22-23 Recommended Budget includes $23,996,500
in revenues from water and sewer charges, an increase of 11.86 percent. New customer growth has averaged just over four
percent the past three years. The continued customer growth rate and an increase in water and sewer fees account for the
increase in charges for service.
Water & Sewer Fund Revenues by Source
Source
FY20-21
Actual
FY21-22
Budget
FY21-22
Estimate
FY22-23
Budget
Percent
Change
Charges for Service 20,986,570 21,452,000 21,416,200 23,996,500 11.86%
Stormwater Fees - 1,000,000 1,214,800 1,935,600 93.56%
Other Operating Revenues 146,193 135,000 142,000 145,000 7.41%
Other Financing Sources 4,907,606 403,250 392,250 15,000 -96.28%
Miscellaneous 268,298 196,000 138,600 152,000 -22.45%
Investment Earnings 44,023 24,000 7,000 20,000 -16.67%
Fund Balance - 1,442,960 - 400,000 -72.28%
Total $26,352,690 $24,653,210 $23,310,850 $26,664,100 8.16%
Charges for Service
90.0%
Stormwater Fees
7.3%
Other Operating
Revenues
0.5%
Other Financing
Sources
0.1%
Miscellaneous
0.6%
Fund Balance
1.5%
Water & Sewer Fund Revenues by Source FY22-23
15
Budget Message
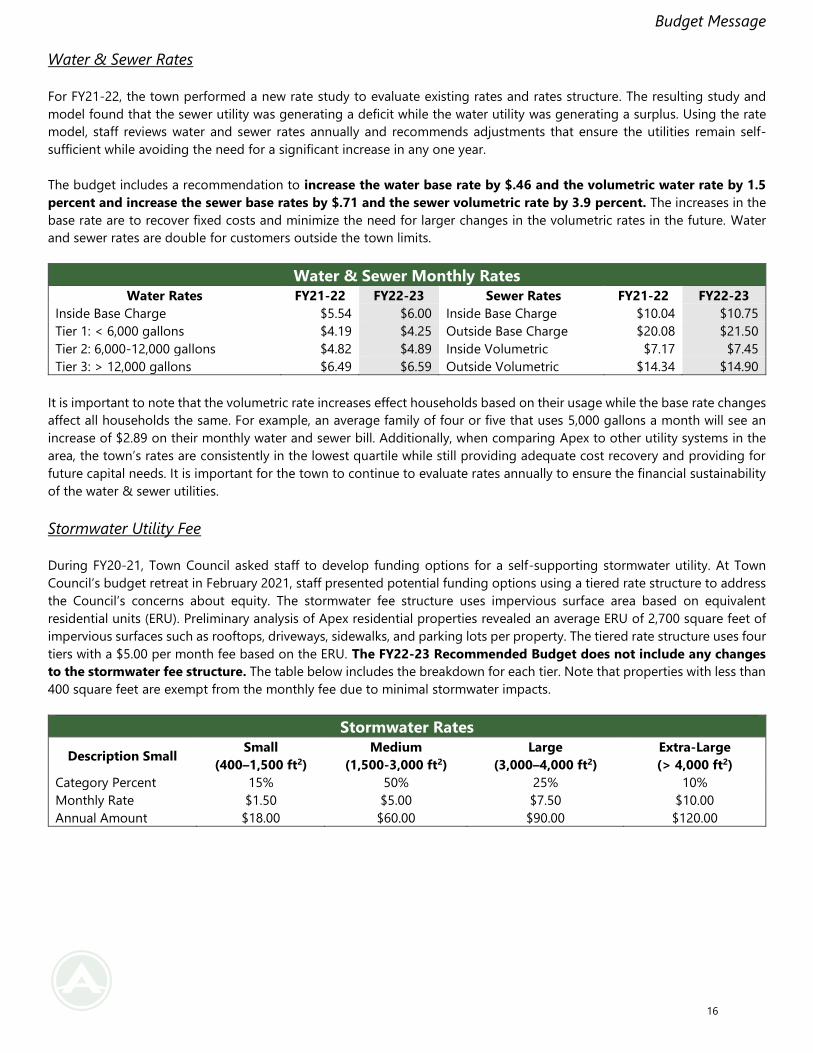
Water & Sewer Rates
For FY21-22, the town performed a new rate study to evaluate existing rates and rates structure. The resulting study and
model found that the sewer utility was generating a deficit while the water utility was generating a surplus. Using the rate
model, staff reviews water and sewer rates annually and recommends adjustments that ensure the utilities remain self-
sufficient while avoiding the need for a significant increase in any one year.
The budget includes a recommendation to increase the water base rate by $.46 and the volumetric water rate by 1.5
percent and increase the sewer base rates by $.71 and the sewer volumetric rate by 3.9 percent. The increases in the
base rate are to recover fixed costs and minimize the need for larger changes in the volumetric rates in the future. Water
and sewer rates are double for customers outside the town limits.
Water & Sewer Monthly Rates
Water Rates FY21-22 FY22-23 Sewer Rates FY21-22 FY22-23
Inside Base Charge $5.54 $6.00 Inside Base Charge $10.04 $10.75
Tier 1: < 6,000 gallons $4.19 $4.25 Outside Base Charge $20.08 $21.50
Tier 2: 6,000-12,000 gallons $4.82 $4.89 Inside Volumetric $7.17 $7.45
Tier 3: > 12,000 gallons $6.49 $6.59 Outside Volumetric $14.34 $14.90
It is important to note that the volumetric rate increases effect households based on their usage while the base rate changes
affect all households the same. For example, an average family of four or five that uses 5,000 gallons a month will see an
increase of $2.89 on their monthly water and sewer bill. Additionally, when comparing Apex to other utility systems in the
area, the town’s rates are consistently in the lowest quartile while still providing adequate cost recovery and providing for
future capital needs. It is important for the town to continue to evaluate rates annually to ensure the financial sustainability
of the water & sewer utilities.
Stormwater Utility Fee
During FY20-21, Town Council asked staff to develop funding options for a self-supporting stormwater utility. At Town
Council’s budget retreat in February 2021, staff presented potential funding options using a tiered rate structure to address
the Council’s concerns about equity. The stormwater fee structure uses impervious surface area based on equivalent
residential units (ERU). Preliminary analysis of Apex residential properties revealed an average ERU of 2,700 square feet of
impervious surfaces such as rooftops, driveways, sidewalks, and parking lots per property. The tiered rate structure uses four
tiers with a $5.00 per month fee based on the ERU. The FY22-23 Recommended Budget does not include any changes
to the stormwater fee structure. The table below includes the breakdown for each tier. Note that properties with less than
400 square feet are exempt from the monthly fee due to minimal stormwater impacts.
Stormwater Rates
Description Small Small
(400–1,500 ft2)
Medium
(1,500‐3,000 ft2)
Large
(3,000–4,000 ft2)
Extra‐Large
(> 4,000 ft2)
Category Percent 15% 50% 25% 10%
Monthly Rate $1.50 $5.00 $7.50 $10.00
Annual Amount $18.00 $60.00 $90.00 $120.00
16
Budget Message
Organization Review
To perform at an even higher level and ensure Apex remains “the peak of good living,” the town undertook an organizational
assessment and committed to develop its organization-wide strategic plan further. Organization growth has not kept pace
with development as population growth in Apex has increased demand for services and stretched operational capacity. The
purpose of the organizational assessment was to determine an optimal organization structure and identify gaps in workforce
capacity. The town intends to implement the recommendations from the study in phases over multiple fiscal years with the
highest priority recommendations in the FY22-23 Budget. Details regarding changes in organizational structure,
reassignment of positions, and new positions are located in the Community and Organizational Profile section of the budget
as well as in department-specific budget sections.
Core Values
Our Peak Principles, which represent our core values, are our foundation for how we interact with one another and the public
as we serve our community.
Peak Pledge: We will perform at the highest level by empowering our peers, remaining accountable to each other and those
we serve, and continuing the pursuit of knowledge.
Performance: Being stewards of public resources and trust, we will maintain a culture that values exceptional
customer service through efficiency and focus on our work.
Empowerment: Knowing that good ideas come from employees at all levels across all departments and divisions, we
will maintain a culture that empowers everyone to express their thoughts and provides opportunities to become
part of real solutions.
Accountability: Knowing that we are entrusted to be stewards of the public’s resources, we will maintain an
atmosphere of openness and transparency to one another and to those we serve.
Knowledge: A workforce that pursues knowledge is one that will be better able to anticipate new challenges and
respond to those presented.
Personnel
Employee Performance Evaluation and Compensation: The town’s performance evaluation and compensation system is
structured around the Town’s Peak Principles and the establishment of clear performance goals and objectives for each
employee. Compensation under the system relies on adjustments based off the midpoint (job rate) of the employee’s salary
range, or actual salary, depending on which amount is higher. The town awards merit pay in October following the annual
employee performance reviews conducted between July 1 and August 31. Employees do not receive other pay increases
during the year unless they qualify for a pay adjustment for position reclassification or receive a promotion with greater
responsibility. Beginning in FY20-21, the town implemented a $15.00 living wage as a baseline for the town’s compensation
plan. The living wage receives the same annual inflationary adjustment as the town’s salary range structure. For FY22-23, the
town plans to adjust its standard merit-based practice based on other compensation recommendations from the pay and
classification portion of the organizational assessment. The total estimated cost for FY22-23 is $2.43 million across all funds.
Employer Retirement Contribution: The North Carolina Local Government Retirement System has notified local governments
that the Annual Contribution Rate (ACR) will increase in FY22-23. The employer contribution will increase from 11.39 to 12.13
percent for regular employees and from 12.04 to 13.04 percent for law enforcement officers. Local government employees
17
Budget Message
currently contribute six percent of their salary. The town’s retirement contributions represent $5,424,600 in FY22-23, an
increase of $1,290,854 (31.23 percent).
401(k) Contribution: The town provides a five percent 401(k) contribution for all full-time employees. North Carolina General
Statutes mandate 401(k) contributions for sworn law enforcement at five percent, a cost of $413,900 in the FY22-23 Budget.
Contributions for all other employees represent $1,921,300 in FY22-23.
Health Insurance: While the town has been able to mitigate rate increases in the past two years, substantial claims have
resulted in increases in both health and dental premiums. The town will experience a 13.3 percent increase for healthcare
premiums in FY22-23. The rate increase alone accounts for $999,182 in increased healthcare costs. The FY22-23
Recommended Budget includes $7,367,900 for healthcare premiums across all funds. The town’s self-funded dental plan
will experience a 1.9 percent increase in insurance premiums for FY22-23, at a cost of $339,000.
Retiree Medical Insurance: The town offers qualifying retired employees a medical insurance benefit until they qualify for the
Federal Medicare Insurance Program. The cost for the retiree insurance is classified as other post-employment benefits
(OPEB). In addition to the annual retiree medical insurance cost, the Recommended Budget includes additional funds for an
OPEB trust fund. To prevent long-term financial stress and follow sound financial practices, the town allocates additional
funds for long-term OPEB costs annually. The FY22-23 Recommended Budget includes $350,000 for long-term OPEB
expenditures - $266,000 in General Fund, $49,000 in the Electric Fund, and $35,000 in the Water & Sewer Fund. The FY22-
23 Budget includes a total of $103,000 to cover pay-as-go Retiree Medical Insurance and long-term OPEB costs in all funds.
As of July 1, 2020, the town no longer offers the retiree medical insurance benefit to new employees. The purpose of
eliminating this benefit is to reduce the town’s long-term liability, which currently stands at $43.73 million. While the long-
term liability will continue to increase some over the next few years, it will eventually begin to decrease with contributions
to the trust fund and no additional participants to the program.
Police Special Separation Allowance: North Carolina General Statutes provide for special compensation to retired law
enforcement officers meeting specified criteria. The statutes require the town to compensate the officer until they reach age
62. The Special Separation Allowance budget in FY22-23 is $152,700.
Position Reclassifications: Typically, the town contracts with a consulting group to study approximately one third of the
town’s positions each year to determine if the positions are correctly classified and if the salary ranges assigned to the
positions are appropriate based on the area labor market. This year, the town reviewed all positions as part of the
organizational assessment. Two of the more prominent reclassifications involve elevation to a director level for the
Communications Manager and Budget and Performance Manager with the study recommendations to add a
Communications department and Budget, Performance, and Strategy department to the organizational structure.
Additional Positions: The FY22-23 Recommended Budget includes 51 new full-time positions in the General Fund, two new
full-time positions in the Electric Fund, and three new full-time positions in the Water and Sewer Fund. town staff worked
together to prioritize these positions with assistance from the organizational assessment consultant from an initial request
of over 100 new full-time positions. Staff is developing a three-year implantation plan developed to manage the addition
of new positions over the next several years. All new positions will bring the total approved full-time positions to 605 and
increase personnel costs by $5,552,337 for FY22-23. A breakdown of the recommended positions with costs is located in
the Supplemental Section of the budget document.
Fund Balance
The North Carolina Local Government Commission recommends that local governments maintain a minimum unassigned
fund balance of no less than eight percent of expenditures. The Town of Apex has adopted a formal fund balance policy of
maintaining a fund balance for the General Fund of at least 25 percent of expenditures. The Town of Apex’s estimated non-
committed or non-restricted fund balance as of June 30, 2022, is $35.53 million or 39.95 percent of FY22-23 expenditures.
18
Budget Message
The recommended budget does include use of fund balance to cover some capital costs. The town does not use reserves
for operating costs and carefully evaluates the use of fund balance for unanticipated opportunities and capital expenses.
The use of $3,620,000 in FY22-23 will still keep the available fund balance above 25 percent.
The North Carolina Local Government Commission does not have a specific recommendation regarding how much fund
balance or retained earnings a local government enterprise operation should maintain. The town does not a have a defined
goal for fund balance for either enterprise fund. The town seeks to ensure both funds are financially stable and contain
healthy reserves. The Town of Apex’s estimated fund balance as of June 30, 2022 for the Water & Sewer Fund is $26.4 million
(127.4 percent). The estimated fund balance for the Electric Fund is $13.39 million (29.7 percent); however, most of this is
amount is restricted. The FY22-23 Recommended Budget does not include use of fund balance in the Electric Fund. The
budget does include an allocation of $400,000 in the Water & Sewer Fund.
In summary, the Recommended Budget is a balanced budget in accordance with state statutes, and it attempts to address
the priorities set by Town Council for the 2022-2023 Fiscal Year. While it is typically difficult to fund all the requests made
by departments or external agencies, the budget team did an excellent job in preparation of this budget to include as many
requests as possible and ensure alignment with Town Council’s strategic goals. The town has benefited from growth, and it
is in a solid financial position going into FY22-23. The FY22-23 Recommended Budget is fiscally sound and addresses the
top priority needs of the town. The town’s sound financial practices and conservative budgeting approach have positioned
it to continue delivering high-level services for Apex residents. This budget reflects our commitment to maintaining and
improving our community and positioning Apex to be financially sound in the future.
I wish to extend my sincere appreciation to the Budget Office and Finance Department and other town team members who
helped to prepare this budget. I recommend this proposed budget for Fiscal Year 2022-2023 to the Apex Town Council.
Respectfully submitted,
Catherine H. Crosby
Town Manager
19
Budget Ordinance
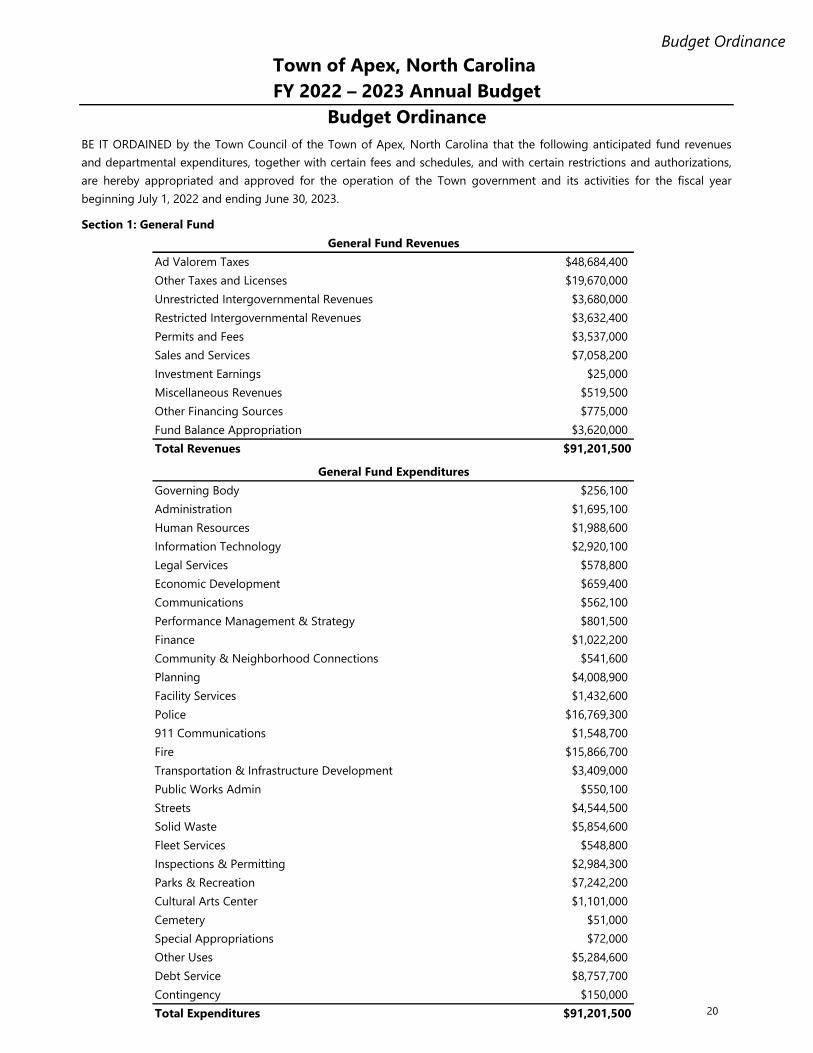
Section 1: General Fund
$48,684,400
$19,670,000
$3,680,000
$3,632,400
$3,537,000
$7,058,200
$25,000
$519,500
$775,000
$3,620,000
$91,201,500
$256,100
$1,695,100
$1,988,600
$2,920,100
$578,800
$659,400
$562,100
$801,500
$1,022,200
$541,600
$4,008,900
$1,432,600
$16,769,300
$1,548,700
$15,866,700
$3,409,000
$550,100
$4,544,500
$5,854,600
$548,800
$2,984,300
$7,242,200
$1,101,000
$51,000
$72,000
$5,284,600
$8,757,700
$150,000
$91,201,500
Streets
Solid Waste
Fleet Services
Inspections & Permitting
Parks & Recreation
Cultural Arts Center
Contingency
Total Expenditures
General Fund Expenditures
Governing Body
Administration
Human Resources
Cemetery
Special Appropriations
Community & Neighborhood Connections
Planning
Facility Services
Police
Other Uses
Debt Service
911 Communications
Fire
Information Technology
Legal Services
Economic Development
Communications
Performance Management & Strategy
Finance
Transportation & Infrastructure Development
Public Works Admin
Town of Apex, North Carolina
FY 2022 – 2023 Annual Budget
Budget Ordinance
BE IT ORDAINED by the Town Council of the Town of Apex, North Carolina that the following anticipated fund revenues
and departmental expenditures, together with certain fees and schedules, and with certain restrictions and authorizations,
are hereby appropriated and approved for the operation of the Town government and its activities for the fiscal year
beginning July 1, 2022 and ending June 30, 2023.
General Fund Revenues
Ad Valorem Taxes
Miscellaneous Revenues
Other Financing Sources
Total Revenues
Fund Balance Appropriation
Other Taxes and Licenses
Unrestricted Intergovernmental Revenues
Restricted Intergovernmental Revenues
Permits and Fees
Sales and Services
Investment Earnings
20
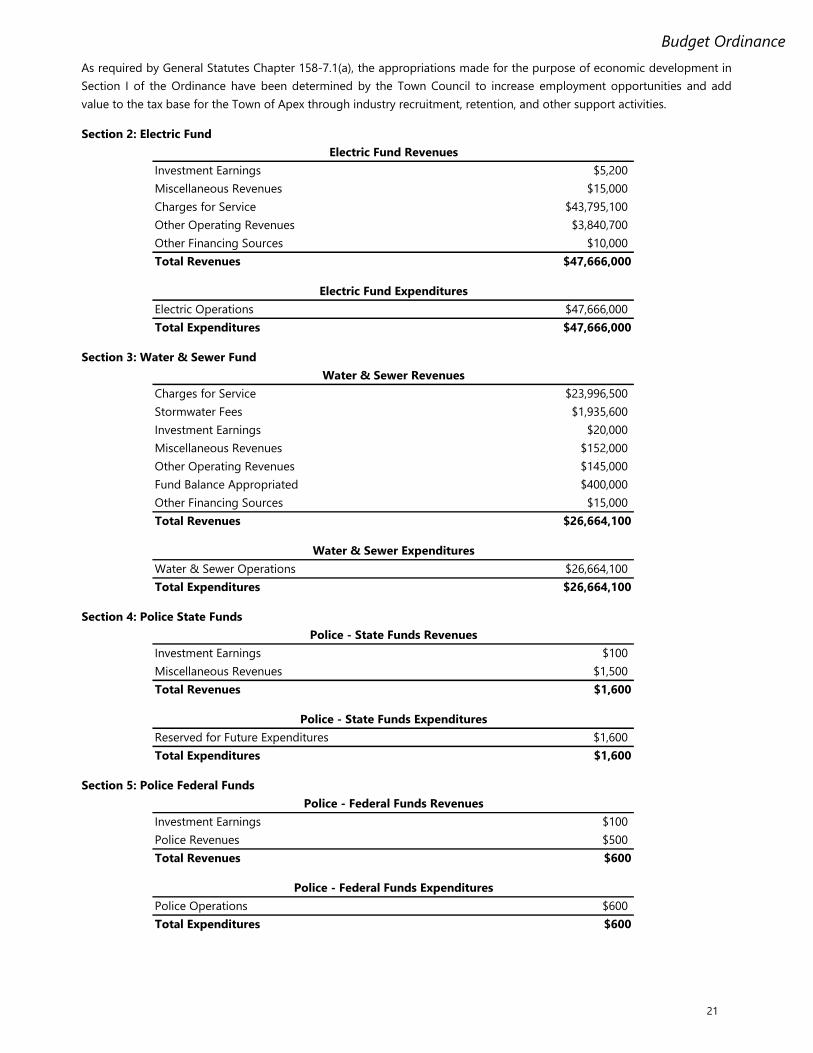
Budget Ordinance
$5,200
$15,000
$43,795,100
$3,840,700
$10,000
$47,666,000
$47,666,000
$47,666,000
$23,996,500
$1,935,600
$20,000
$152,000
$145,000
$400,000
$15,000
$26,664,100
$26,664,100
$26,664,100
$100
$1,500
$1,600
$1,600
$1,600
$100
$500
$600
$600
$600
Electric Fund Revenues
Other Operating Revenues
Other Financing Sources
Investment Earnings
Miscellaneous Revenues
Section 3: Water & Sewer Fund
Water & Sewer Revenues
Total Expenditures
Charges for Service
Investment Earnings
Miscellaneous Revenues
Police Operations
Section 5: Police Federal Funds
Total Expenditures
Total Expenditures
Water & Sewer Operations
Investment Earnings
Miscellaneous Revenues
Reserved for Future Expenditures
Investment Earnings
Police Revenues
Charges for Service
Other Financing Sources
Electric Operations
Other Operating Revenues
Total Revenues
Police - Federal Funds Expenditures
Total Expenditures
Total Revenues
Police - Federal Funds Revenues
Total Revenues
Fund Balance Appropriated
Stormwater Fees
Electric Fund Expenditures
Water & Sewer Expenditures
Section 4: Police State Funds
Police - State Funds Revenues
Total Revenues
Police - State Funds Expenditures
As required by General Statutes Chapter 158-7.1(a), the appropriations made for the purpose of economic development in
Section I of the Ordinance have been determined by the Town Council to increase employment opportunities and add
value to the tax base for the Town of Apex through industry recruitment, retention, and other support activities.
Section 2: Electric Fund
21
Budget Ordinance
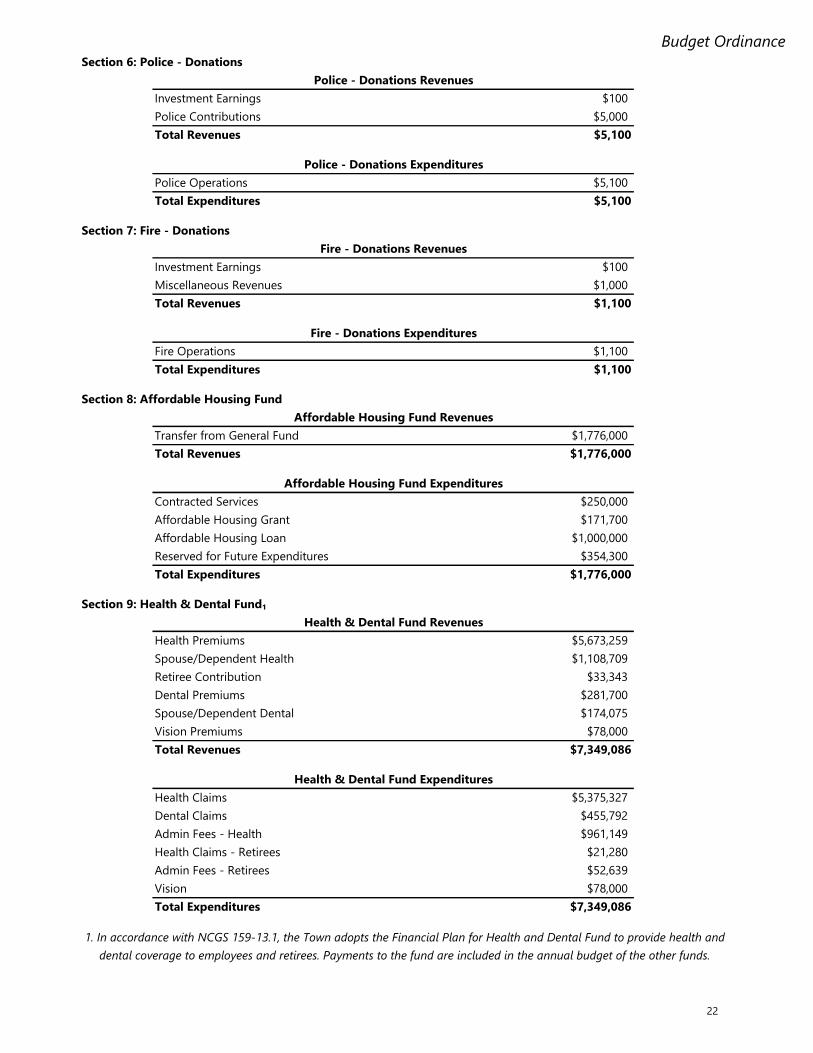
$100
$5,000
$5,100
$5,100
$5,100
$100
$1,000
$1,100
$1,100
$1,100
$1,776,000
$1,776,000
$250,000
$171,700
$1,000,000
$354,300
$1,776,000
$5,673,259
$1,108,709
Retiree Contribution $33,343
$281,700
$174,075
Vision Premiums $78,000
$7,349,086
$5,375,327
$455,792
$961,149
$21,280
$52,639
$78,000
$7,349,086
Fire - Donations Expenditures
Section 9: Health & Dental Fund₁
Police Operations
Total Expenditures
Investment Earnings
Miscellaneous Revenues
Fire Operations
Admin Fees - Health
Vision
Police - Donations Expenditures
Section 7: Fire - Donations
Police Contributions
Section 6: Police - Donations
Police - Donations Revenues
Total Revenues
Investment Earnings
Fire - Donations Revenues
Total Revenues
Health Claims
Health & Dental Fund Revenues
Total Revenues
Health & Dental Fund Expenditures
1. In accordance with NCGS 159-13.1, the Town adopts the Financial Plan for Health and Dental Fund to provide health and
dental coverage to employees and retirees. Payments to the fund are included in the annual budget of the other funds.
Contracted Services
Affordable Housing Grant
Total Expenditures
Reserved for Future Expenditures
Transfer from General Fund
Health Claims - Retirees
Affordable Housing Fund Expenditures
Affordable Housing Loan
Section 8: Affordable Housing Fund
Dental Claims
Admin Fees - Retirees
Total Expenditures
Health Premiums
Spouse/Dependent Health
Dental Premiums
Spouse/Dependent Dental
Affordable Housing Fund Revenues
Total Revenues
Total Expenditures
22
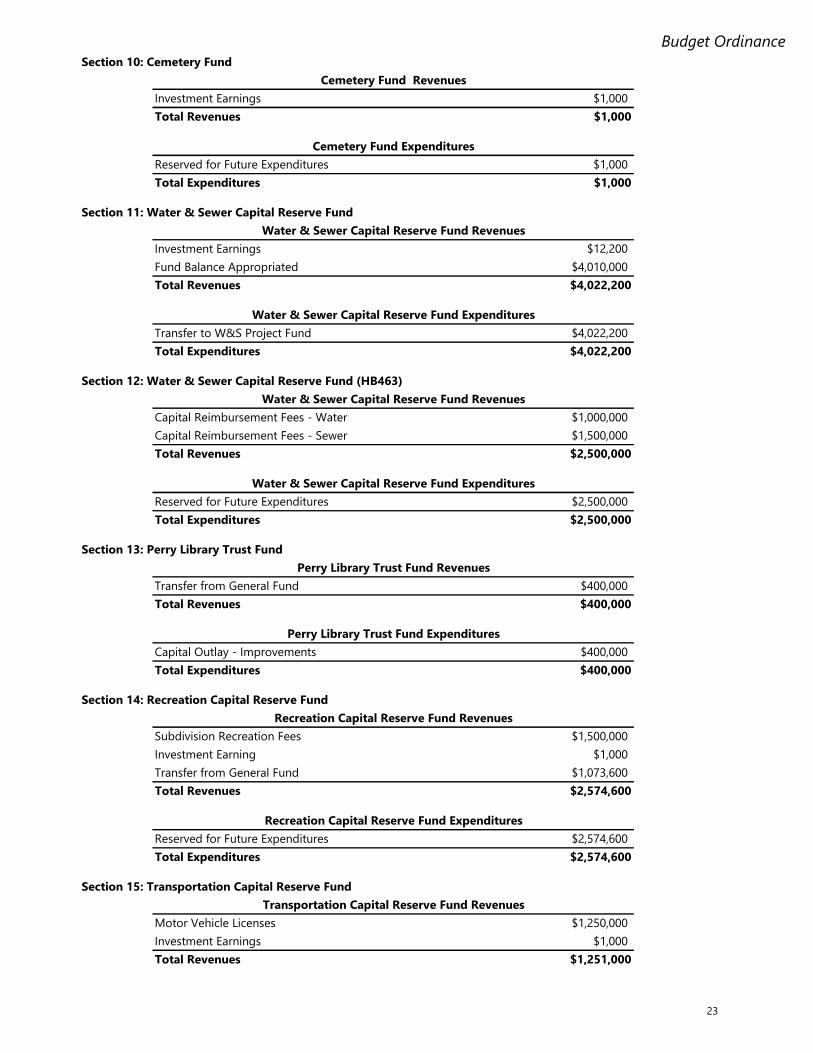
Budget Ordinance
$1,000
$1,000
$1,000
$1,000
$12,200
$4,010,000
$4,022,200
$4,022,200
Total Expenditures $4,022,200
$1,000,000
$1,500,000
$2,500,000
$2,500,000
Total Expenditures $2,500,000
$400,000
$400,000
$400,000
Total Expenditures $400,000
$1,500,000
$1,000
$1,073,600
$2,574,600
$2,574,600
$2,574,600
$1,250,000
$1,000
$1,251,000
Water & Sewer Capital Reserve Fund Expenditures
Transfer to W&S Project Fund
Recreation Capital Reserve Fund Revenues
Transfer from General Fund
Section 13: Perry Library Trust Fund
Perry Library Trust Fund Revenues
Section 14: Recreation Capital Reserve Fund
Cemetery Fund Revenues
Investment Earnings
Section 12: Water & Sewer Capital Reserve Fund (HB463)
Water & Sewer Capital Reserve Fund Revenues
Capital Reimbursement Fees - Water
Total Expenditures
Total Revenues
Water & Sewer Capital Reserve Fund Expenditures
Investment Earnings
Fund Balance Appropriated
Total Revenues
Perry Library Trust Fund Expenditures
Reserved for Future Expenditures
Section 10: Cemetery Fund
Reserved for Future Expenditures
Capital Outlay - Improvements
Reserved for Future Expenditures
Total Revenues
Cemetery Fund Expenditures
Capital Reimbursement Fees - Sewer
Section 11: Water & Sewer Capital Reserve Fund
Water & Sewer Capital Reserve Fund Revenues
Subdivision Recreation Fees
Investment Earning
Transfer from General Fund
Total Revenues
Total Expenditures
Motor Vehicle Licenses
Investment Earnings
Section 15: Transportation Capital Reserve Fund
Transportation Capital Reserve Fund Revenues
Total Revenues
Recreation Capital Reserve Fund Expenditures
Total Revenues
23
Budget Ordinance
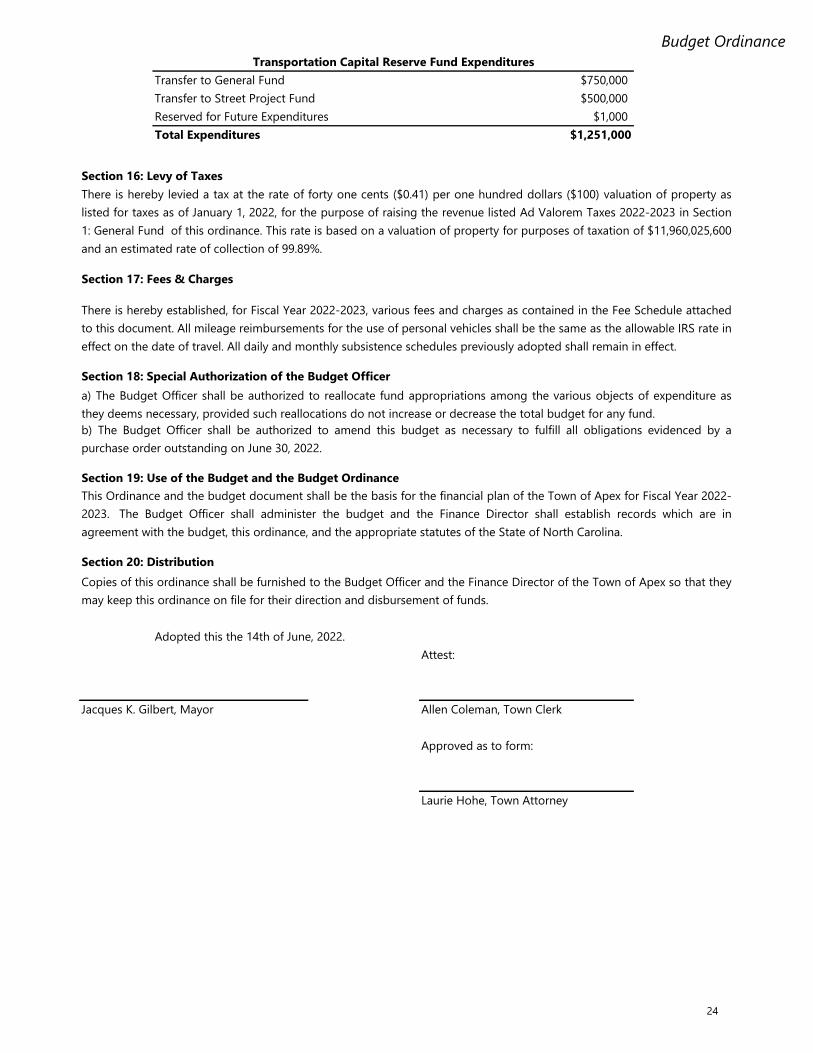
$750,000
$500,000
$1,000
$1,251,000
Attest:
Jacques K. Gilbert, Mayor Allen Coleman, Town Clerk
Total Expenditures
Laurie Hohe, Town Attorney
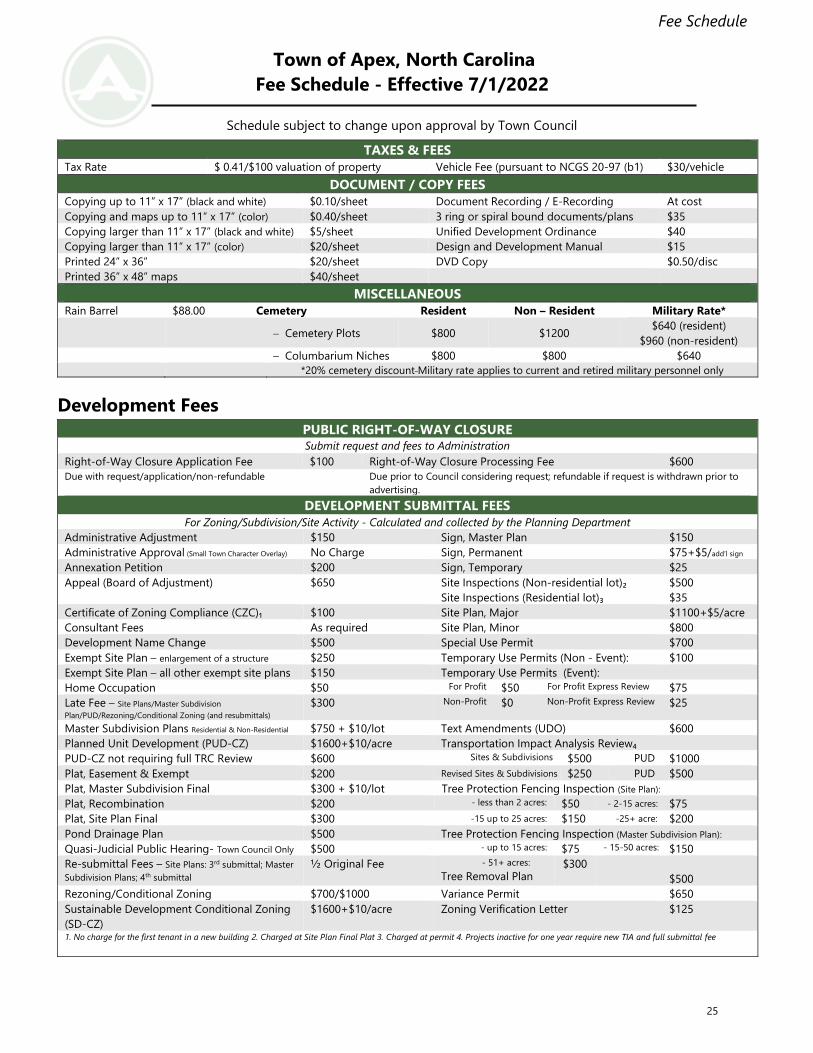
Section 17: Fees & Charges
There is hereby established, for Fiscal Year 2022-2023, various fees and charges as contained in the Fee Schedule attached
to this document. All mileage reimbursements for the use of personal vehicles shall be the same as the allowable IRS rate in
effect on the date of travel. All daily and monthly subsistence schedules previously adopted shall remain in effect.
Section 18: Special Authorization of the Budget Officer
a) The Budget Officer shall be authorized to reallocate fund appropriations among the various objects of expenditure as
they deems necessary, provided such reallocations do not increase or decrease the total budget for any fund.
b) The Budget Officer shall be authorized to amend this budget as necessary to fulfill all obligations evidenced by a
purchase order outstanding on June 30, 2022.
Section 16: Levy of Taxes
Section 20: Distribution
Copies of this ordinance shall be furnished to the Budget Officer and the Finance Director of the Town of Apex so that they
may keep this ordinance on file for their direction and disbursement of funds.
Adopted this the 14th of June, 2022.
This Ordinance and the budget document shall be the basis for the financial plan of the Town of Apex for Fiscal Year 2022-
2023. The Budget Officer shall administer the budget and the Finance Director shall establish records which are in
agreement with the budget, this ordinance, and the appropriate statutes of the State of North Carolina.
There is hereby levied a tax at the rate of forty one cents ($0.41) per one hundred dollars ($100) valuation of property as
listed for taxes as of January 1, 2022, for the purpose of raising the revenue listed Ad Valorem Taxes 2022-2023 in Section
1: General Fund of this ordinance. This rate is based on a valuation of property for purposes of taxation of $11,960,025,600
and an estimated rate of collection of 99.89%.
Approved as to form:
Section 19: Use of the Budget and the Budget Ordinance
Transfer to General Fund
Transfer to Street Project Fund
Reserved for Future Expenditures
Transportation Capital Reserve Fund Expenditures
24
Fee Schedule
Town of Apex, North Carolina
Fee Schedule - Effective 7/1/2022
Schedule subject to change upon approval by Town Council
TAXES & FEES
Tax Rate $ 0.41/$100 valuation of property Vehicle Fee (pursuant to NCGS 20-97 (b1) $30/vehicle
DOCUMENT / COPY FEES
Copying up to 11” x 17” (black and white) $0.10/sheet Document Recording / E-Recording At cost
Copying and maps up to 11” x 17” (color) $0.40/sheet 3 ring or spiral bound documents/plans $35
Copying larger than 11” x 17” (black and white) $5/sheet Unified Development Ordinance $40
Copying larger than 11” x 17” (color) $20/sheet Design and Development Manual $15
Printed 24” x 36” $20/sheet DVD Copy $0.50/disc
Printed 36” x 48” maps $40/sheet
MISCELLANEOUS
Rain Barrel $88.00 Cemetery Resident Non – Resident Military Rate*
− Cemetery Plots $800 $1200 $640 (resident)
$960 (non-resident)
− Columbarium Niches $800 $800 $640
*20% cemetery discount Military rate applies to current and retired military personnel only
Development Fees
PUBLIC RIGHT-OF-WAY CLOSURE Submit request and fees to Administration
Right-of-Way Closure Application Fee $100 Right-of-Way Closure Processing Fee $600
Due with request/application/non-refundable Due prior to Council considering request; refundable if request is withdrawn prior to
advertising.
DEVELOPMENT SUBMITTAL FEES
For Zoning/Subdivision/Site Activity - Calculated and collected by the Planning Department
Administrative Adjustment $150 Sign, Master Plan $150
Administrative Approval (Small Town Character Overlay) No Charge Sign, Permanent $75+$5/add’l sign
Annexation Petition $200 Sign, Temporary $25
Appeal (Board of Adjustment) $650 Site Inspections (Non-residential lot)₂
Site Inspections (Residential lot)₃
$500
$35
Certificate of Zoning Compliance (CZC)₁ $100 Site Plan, Major $1100+$5/acre
Consultant Fees As required Site Plan, Minor $800
Development Name Change $500 Special Use Permit $700
Exempt Site Plan – enlargement of a structure $250 Temporary Use Permits (Non - Event): $100
Exempt Site Plan – all other exempt site plans $150 Temporary Use Permits (Event):
Home Occupation $50 For Profit $50 For Profit Express Review $75
Late Fee – Site Plans/Master Subdivision
Plan/PUD/Rezoning/Conditional Zoning (and resubmittals)
$300 Non-Profit $0 Non-Profit Express Review $25
Master Subdivision Plans Residential & Non-Residential $750 + $10/lot Text Amendments (UDO) $600
Planned Unit Development (PUD-CZ) $1600+$10/acre Transportation Impact Analysis Review₄
PUD-CZ not requiring full TRC Review $600 Sites & Subdivisions $500 PUD $1000
Plat, Easement & Exempt $200 Revised Sites & Subdivisions $250 PUD $500
Plat, Master Subdivision Final $300 + $10/lot Tree Protection Fencing Inspection (Site Plan):
Plat, Recombination $200 - less than 2 acres: $50 - 2-15 acres: $75
Plat, Site Plan Final $300 -15 up to 25 acres: $150 -25+ acre: $200
Pond Drainage Plan $500 Tree Protection Fencing Inspection (Master Subdivision Plan):
Quasi-Judicial Public Hearing- Town Council Only $500 - up to 15 acres: $75 - 15-50 acres: $150
Re-submittal Fees – Site Plans: 3rd submittal; Master
Subdivision Plans; 4th submittal ½ Original Fee - 51+ acres:
Tree Removal Plan $300
$500
Rezoning/Conditional Zoning $700/$1000 Variance Permit $650
Sustainable Development Conditional Zoning
(SD-CZ)
$1600+$10/acre Zoning Verification Letter $125
1. No charge for the first tenant in a new building 2. Charged at Site Plan Final Plat 3. Charged at permit 4. Projects inactive for one year require new TIA and full submittal fee
25
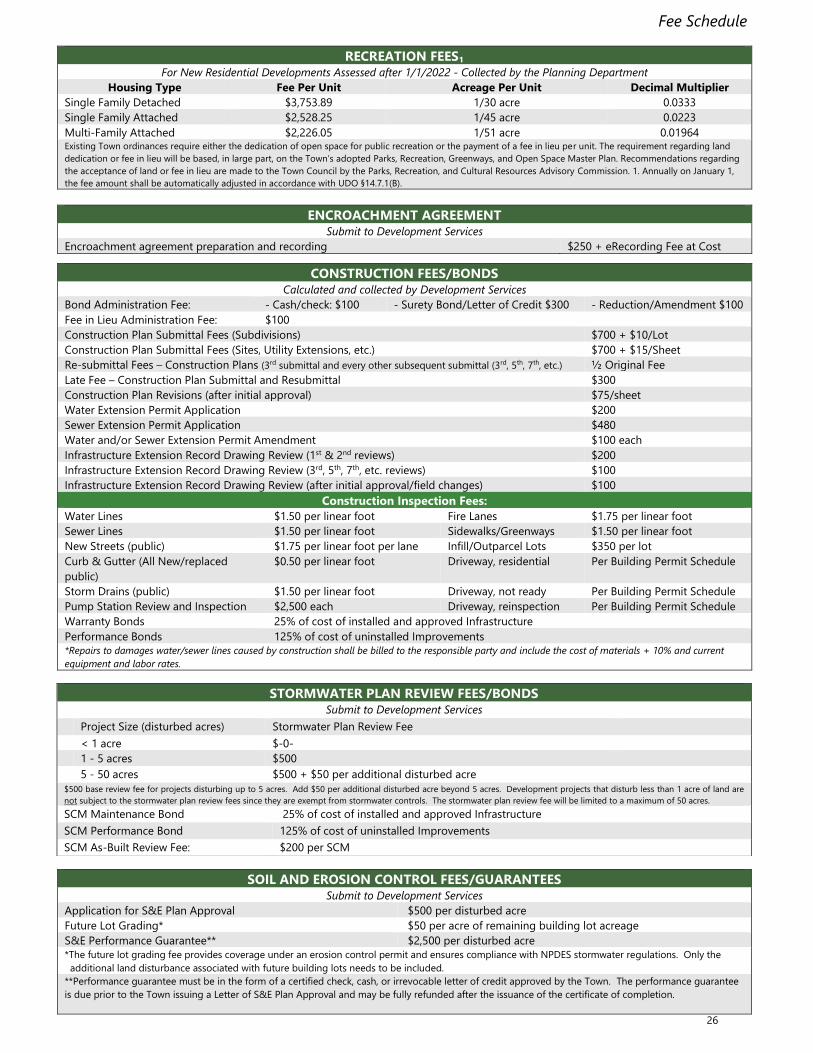
Fee Schedule
RECREATION FEES₁
For New Residential Developments Assessed after 1/1/2022 - Collected by the Planning Department
Housing Type Fee Per Unit Acreage Per Unit Decimal Multiplier
Single Family Detached $3,753.89 1/30 acre 0.0333
Single Family Attached $2,528.25 1/45 acre 0.0223
Multi-Family Attached $2,226.05 1/51 acre 0.01964 Existing Town ordinances require either the dedication of open space for public recreation or the payment of a fee in lieu per unit. The requirement regarding land
dedication or fee in lieu will be based, in large part, on the Town’s adopted Parks, Recreation, Greenways, and Open Space Master Plan. Recommendations regarding
the acceptance of land or fee in lieu are made to the Town Council by the Parks, Recreation, and Cultural Resources Advisory Commission. 1. Annually on January 1,
the fee amount shall be automatically adjusted in accordance with UDO §14.7.1(B).
ENCROACHMENT AGREEMENT Submit to Development Services
Encroachment agreement preparation and recording $250 + eRecording Fee at Cost
CONSTRUCTION FEES/BONDS Calculated and collected by Development Services
Bond Administration Fee: - Cash/check: $100 - Surety Bond/Letter of Credit $300 - Reduction/Amendment $100
Fee in Lieu Administration Fee: $100
Construction Plan Submittal Fees (Subdivisions) $700 + $10/Lot
Construction Plan Submittal Fees (Sites, Utility Extensions, etc.) $700 + $15/Sheet
Re-submittal Fees – Construction Plans (3rd submittal and every other subsequent submittal (3rd, 5th, 7th, etc.) ½ Original Fee
Late Fee – Construction Plan Submittal and Resubmittal $300
Construction Plan Revisions (after initial approval) $75/sheet
Water Extension Permit Application $200
Sewer Extension Permit Application $480
Water and/or Sewer Extension Permit Amendment $100 each
Infrastructure Extension Record Drawing Review (1st & 2nd reviews) $200
Infrastructure Extension Record Drawing Review (3rd, 5th, 7th, etc. reviews) $100
Infrastructure Extension Record Drawing Review (after initial approval/field changes) $100
Construction Inspection Fees:
Water Lines $1.50 per linear foot Fire Lanes $1.75 per linear foot
Sewer Lines $1.50 per linear foot Sidewalks/Greenways $1.50 per linear foot
New Streets (public) $1.75 per linear foot per lane Infill/Outparcel Lots $350 per lot
Curb & Gutter (All New/replaced
public)
$0.50 per linear foot Driveway, residential Per Building Permit Schedule
Storm Drains (public) $1.50 per linear foot Driveway, not ready Per Building Permit Schedule
Pump Station Review and Inspection $2,500 each Driveway, reinspection Per Building Permit Schedule
Warranty Bonds 25% of cost of installed and approved Infrastructure
Performance Bonds 125% of cost of uninstalled Improvements
*Repairs to damages water/sewer lines caused by construction shall be billed to the responsible party and include the cost of materials + 10% and current
equipment and labor rates.
SOIL AND EROSION CONTROL FEES/GUARANTEES Submit to Development Services
Application for S&E Plan Approval $500 per disturbed acre
Future Lot Grading* $50 per acre of remaining building lot acreage
S&E Performance Guarantee** $2,500 per disturbed acre
*The future lot grading fee provides coverage under an erosion control permit and ensures compliance with NPDES stormwater regulations. Only the
additional land disturbance associated with future building lots needs to be included.
**Performance guarantee must be in the form of a certified check, cash, or irrevocable letter of credit approved by the Town. The performance guarantee
is due prior to the Town issuing a Letter of S&E Plan Approval and may be fully refunded after the issuance of the certificate of completion.
STORMWATER PLAN REVIEW FEES/BONDS Submit to Development Services
Project Size (disturbed acres) Stormwater Plan Review Fee
< 1 acre $-0-
1 - 5 acres $500
5 - 50 acres $500 + $50 per additional disturbed acre
$500 base review fee for projects disturbing up to 5 acres. Add $50 per additional disturbed acre beyond 5 acres. Development projects that disturb less than 1 acre of land are
not subject to the stormwater plan review fees since they are exempt from stormwater controls. The stormwater plan review fee will be limited to a maximum of 50 acres.
SCM Maintenance Bond 25% of cost of installed and approved Infrastructure
SCM Performance Bond 125% of cost of uninstalled Improvements
SCM As-Built Review Fee: $200 per SCM
26
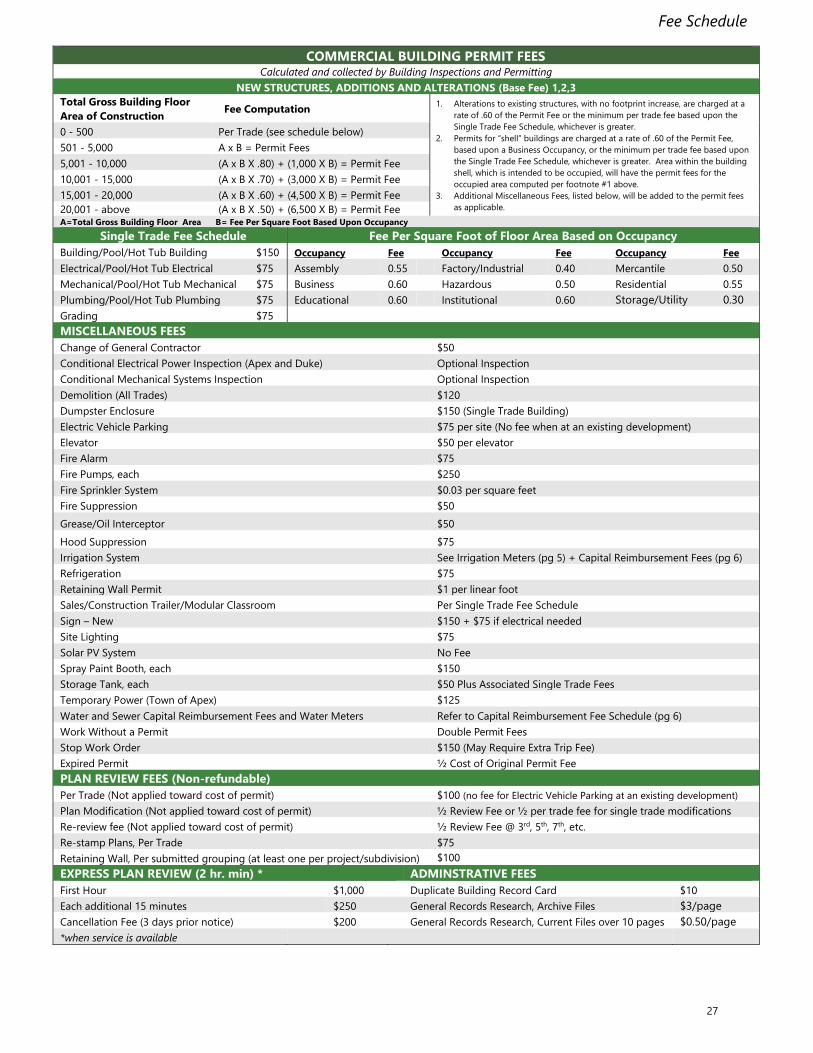
Fee Schedule
COMMERCIAL BUILDING PERMIT FEES
Calculated and collected by Building Inspections and Permitting
NEW STRUCTURES, ADDITIONS AND ALTERATIONS (Base Fee) 1,2,3
Total Gross Building Floor
Area of Construction Fee Computation
1. Alterations to existing structures, with no footprint increase, are charged at a
rate of .60 of the Permit Fee or the minimum per trade fee based upon the
Single Trade Fee Schedule, whichever is greater.
2. Permits for “shell” buildings are charged at a rate of .60 of the Permit Fee,
based upon a Business Occupancy, or the minimum per trade fee based upon
the Single Trade Fee Schedule, whichever is greater. Area within the building
shell, which is intended to be occupied, will have the permit fees for the
occupied area computed per footnote #1 above.
3. Additional Miscellaneous Fees, listed below, will be added to the permit fees
as applicable.
0 - 500 Per Trade (see schedule below)
501 - 5,000 A x B = Permit Fees
5,001 - 10,000 (A x B X .80) + (1,000 X B) = Permit Fee
10,001 - 15,000 (A x B X .70) + (3,000 X B) = Permit Fee
15,001 - 20,000 (A x B X .60) + (4,500 X B) = Permit Fee
20,001 - above (A x B X .50) + (6,500 X B) = Permit Fee A=Total Gross Building Floor Area B= Fee Per Square Foot Based Upon Occupancy
Single Trade Fee Schedule Fee Per Square Foot of Floor Area Based on Occupancy
Building/Pool/Hot Tub Building $150 Occupancy Fee Occupancy Fee Occupancy Fee
Electrical/Pool/Hot Tub Electrical $75 Assembly 0.55 Factory/Industrial 0.40 Mercantile 0.50
Mechanical/Pool/Hot Tub Mechanical $75 Business 0.60 Hazardous 0.50 Residential 0.55
Plumbing/Pool/Hot Tub Plumbing $75 Educational 0.60 Institutional 0.60 Storage/Utility 0.30
Grading $75
MISCELLANEOUS FEES
Change of General Contractor $50
Conditional Electrical Power Inspection (Apex and Duke) Optional Inspection
Conditional Mechanical Systems Inspection Optional Inspection
Demolition (All Trades) $120
Dumpster Enclosure $150 (Single Trade Building)
Electric Vehicle Parking $75 per site (No fee when at an existing development)
Elevator $50 per elevator
Fire Alarm $75
Fire Pumps, each $250
Fire Sprinkler System $0.03 per square feet
Fire Suppression $50
Grease/Oil Interceptor $50
Hood Suppression $75
Irrigation System See Irrigation Meters (pg 5) + Capital Reimbursement Fees (pg 6)
Refrigeration $75
Retaining Wall Permit $1 per linear foot
Sales/Construction Trailer/Modular Classroom Per Single Trade Fee Schedule
Sign – New $150 + $75 if electrical needed
Site Lighting $75
Solar PV System No Fee
Spray Paint Booth, each $150
Storage Tank, each $50 Plus Associated Single Trade Fees
Temporary Power (Town of Apex) $125
Water and Sewer Capital Reimbursement Fees and Water Meters Refer to Capital Reimbursement Fee Schedule (pg 6)
Work Without a Permit Double Permit Fees
Stop Work Order $150 (May Require Extra Trip Fee)
Expired Permit ½ Cost of Original Permit Fee
PLAN REVIEW FEES (Non-refundable)
Per Trade (Not applied toward cost of permit) $100 (no fee for Electric Vehicle Parking at an existing development)
Plan Modification (Not applied toward cost of permit) ½ Review Fee or ½ per trade fee for single trade modifications
Re-review fee (Not applied toward cost of permit) ½ Review Fee @ 3rd, 5th, 7th, etc.
Re-stamp Plans, Per Trade $75
Retaining Wall, Per submitted grouping (at least one per project/subdivision) $100
EXPRESS PLAN REVIEW (2 hr. min) * ADMINSTRATIVE FEES
First Hour $1,000 Duplicate Building Record Card $10
Each additional 15 minutes $250 General Records Research, Archive Files $3/page
Cancellation Fee (3 days prior notice) $200 General Records Research, Current Files over 10 pages $0.50/page
*when service is available
27
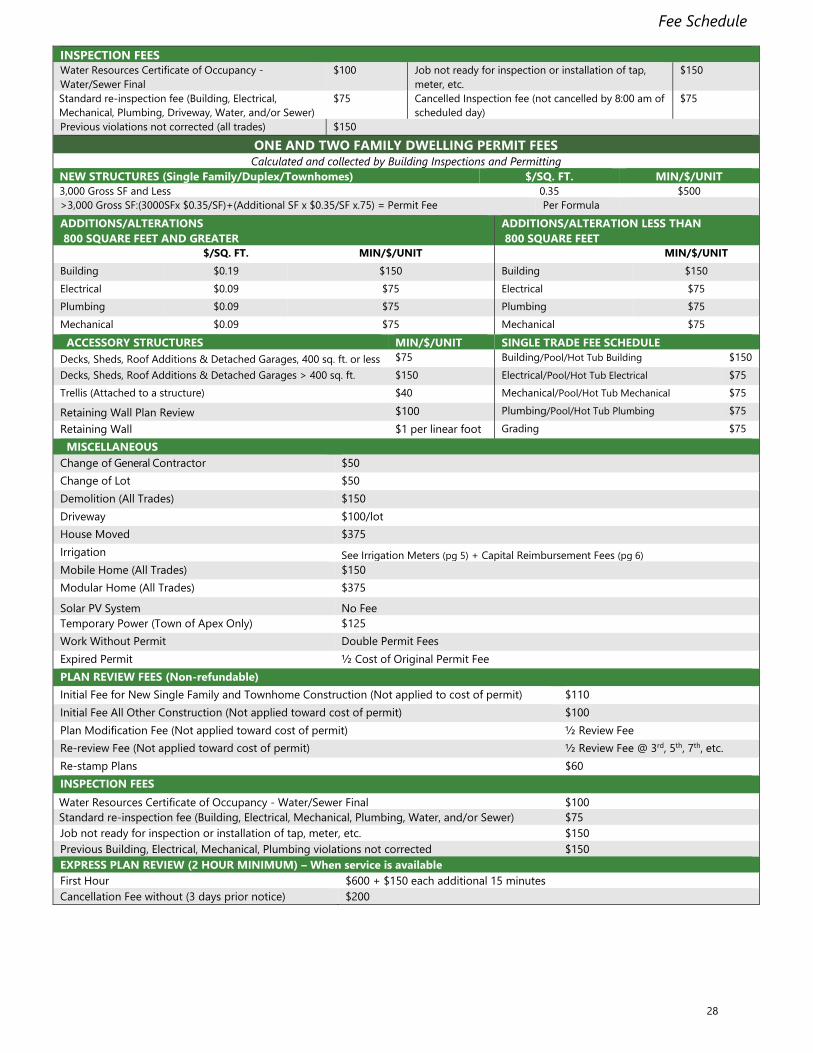
Fee Schedule
INSPECTION FEES
Water Resources Certificate of Occupancy -
Water/Sewer Final
$100 Job not ready for inspection or installation of tap,
meter, etc.
$150
Standard re-inspection fee (Building, Electrical,
Mechanical, Plumbing, Driveway, Water, and/or Sewer)
$75 Cancelled Inspection fee (not cancelled by 8:00 am of
scheduled day)
$75
Previous violations not corrected (all trades) $150
ONE AND TWO FAMILY DWELLING PERMIT FEES Calculated and collected by Building Inspections and Permitting
NEW STRUCTURES (Single Family/Duplex/Townhomes) $/SQ. FT. MIN/$/UNIT
3,000 Gross SF and Less 0.35 $500
>3,000 Gross SF:(3000SFx $0.35/SF)+(Additional SF x $0.35/SF x.75) = Permit Fee Per Formula
ADDITIONS/ALTERATIONS
800 SQUARE FEET AND GREATER
ADDITIONS/ALTERATION LESS THAN
800 SQUARE FEET
$/SQ. FT. MIN/$/UNIT MIN/$/UNIT
Building $0.19 $150 Building $150
Electrical $0.09 $75 Electrical $75
Plumbing $0.09 $75 Plumbing $75
Mechanical $0.09 $75 Mechanical $75
ACCESSORY STRUCTURES MIN/$/UNIT SINGLE TRADE FEE SCHEDULE
Decks, Sheds, Roof Additions & Detached Garages, 400 sq. ft. or less $75 Building/Pool/Hot Tub Building $150
Decks, Sheds, Roof Additions & Detached Garages > 400 sq. ft. $150 Electrical/Pool/Hot Tub Electrical $75
Trellis (Attached to a structure) $40 Mechanical/Pool/Hot Tub Mechanical $75
Retaining Wall Plan Review $100 Plumbing/Pool/Hot Tub Plumbing $75
Retaining Wall $1 per linear foot Grading $75
MISCELLANEOUS
Change of General Contractor $50
Change of Lot $50
Demolition (All Trades) $150
Driveway $100/lot
House Moved $375
Irrigation See Irrigation Meters (pg 5) + Capital Reimbursement Fees (pg 6)
Mobile Home (All Trades) $150
Modular Home (All Trades) $375
Solar PV System No Fee
Temporary Power (Town of Apex Only) $125
Work Without Permit Double Permit Fees
Expired Permit ½ Cost of Original Permit Fee
PLAN REVIEW FEES (Non-refundable)
Initial Fee for New Single Family and Townhome Construction (Not applied to cost of permit) $110
Initial Fee All Other Construction (Not applied toward cost of permit) $100
Plan Modification Fee (Not applied toward cost of permit) ½ Review Fee
Re-review Fee (Not applied toward cost of permit) ½ Review Fee @ 3rd, 5th, 7th, etc.
Re-stamp Plans $60
INSPECTION FEES
Water Resources Certificate of Occupancy - Water/Sewer Final $100
Standard re-inspection fee (Building, Electrical, Mechanical, Plumbing, Water, and/or Sewer) $75
Job not ready for inspection or installation of tap, meter, etc. $150
Previous Building, Electrical, Mechanical, Plumbing violations not corrected $150
EXPRESS PLAN REVIEW (2 HOUR MINIMUM) – When service is available
First Hour $600 + $150 each additional 15 minutes
Cancellation Fee without (3 days prior notice) $200
28
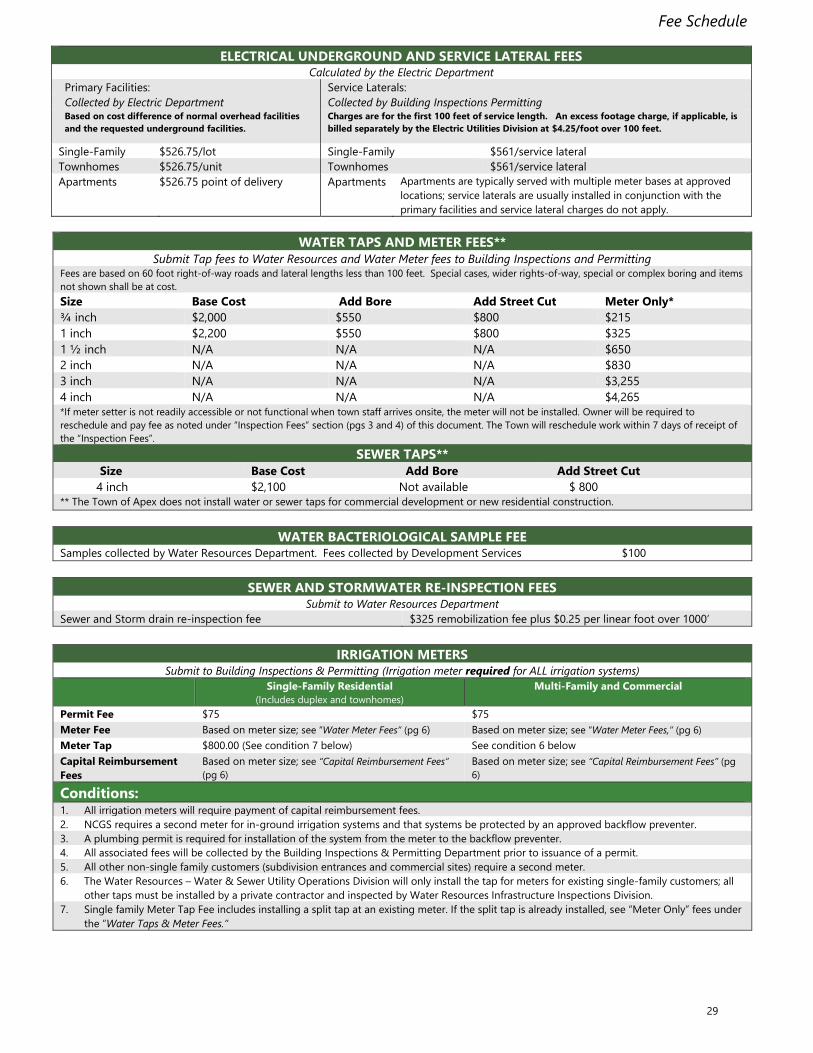
Fee Schedule
ELECTRICAL UNDERGROUND AND SERVICE LATERAL FEES Calculated by the Electric Department
Primary Facilities: Service Laterals:
Collected by Electric Department Collected by Building Inspections Permitting Based on cost difference of normal overhead facilities
and the requested underground facilities.
Charges are for the first 100 feet of service length. An excess footage charge, if applicable, is
billed separately by the Electric Utilities Division at $4.25/foot over 100 feet.
Single-Family $$526.75/lot Single-Family $561/service lateral
Townhomes $$526.75/unit Townhomes $561/service lateral
Apartments $$526.75 point of delivery Apartments Apartments are typically served with multiple meter bases at approved
locations; service laterals are usually installed in conjunction with the
primary facilities and service lateral charges do not apply.
WATER TAPS AND METER FEES**
Submit Tap fees to Water Resources and Water Meter fees to Building Inspections and Permitting Fees are based on 60 foot right-of-way roads and lateral lengths less than 100 feet. Special cases, wider rights-of-way, special or complex boring and items
not shown shall be at cost.
Size Base Cost Add Bore Add Street Cut Meter Only*
¾ inch $2,000 $550 $800 $215
1 inch $2,200 $550 $800 $325
1 ½ inch N/A N/A N/A $650
2 inch N/A N/A N/A $830
3 inch N/A N/A N/A $3,255
4 inch N/A N/A N/A $4,265
*If meter setter is not readily accessible or not functional when town staff arrives onsite, the meter will not be installed. Owner will be required to
reschedule and pay fee as noted under “Inspection Fees” section (pgs 3 and 4) of this document. The Town will reschedule work within 7 days of receipt of
the “Inspection Fees”.
SEWER TAPS**
Size Base Cost Add Bore Add Street Cut
4 inch $2,100 Not available $ 800
** The Town of Apex does not install water or sewer taps for commercial development or new residential construction.
WATER BACTERIOLOGICAL SAMPLE FEE Samples collected by Water Resources Department. Fees collected by Development Services $100
SEWER AND STORMWATER RE-INSPECTION FEES
Submit to Water Resources Department
Sewer and Storm drain re-inspection fee $325 remobilization fee plus $0.25 per linear foot over 1000’
IRRIGATION METERS Submit to Building Inspections & Permitting (Irrigation meter required for ALL irrigation systems)
Single-Family Residential
(Includes duplex and townhomes)
Multi-Family and Commercial
Permit Fee $75 $75
Meter Fee Based on meter size; see “Water Meter Fees” (pg 6) Based on meter size; see “Water Meter Fees,” (pg 6)
Meter Tap $800.00 (See condition 7 below) See condition 6 below
Capital Reimbursement
Fees
Based on meter size; see “Capital Reimbursement Fees”
(pg 6)
Based on meter size; see “Capital Reimbursement Fees” (pg
6)
Conditions: 1. All irrigation meters will require payment of capital reimbursement fees.
2. NCGS requires a second meter for in-ground irrigation systems and that systems be protected by an approved backflow preventer.
3. A plumbing permit is required for installation of the system from the meter to the backflow preventer.
4. All associated fees will be collected by the Building Inspections & Permitting Department prior to issuance of a permit.
5. All other non-single family customers (subdivision entrances and commercial sites) require a second meter.
6. The Water Resources – Water & Sewer Utility Operations Division will only install the tap for meters for existing single-family customers; all
other taps must be installed by a private contractor and inspected by Water Resources Infrastructure Inspections Division.
7. Single family Meter Tap Fee includes installing a split tap at an existing meter. If the split tap is already installed, see “Meter Only” fees under
the “Water Taps & Meter Fees.”
29
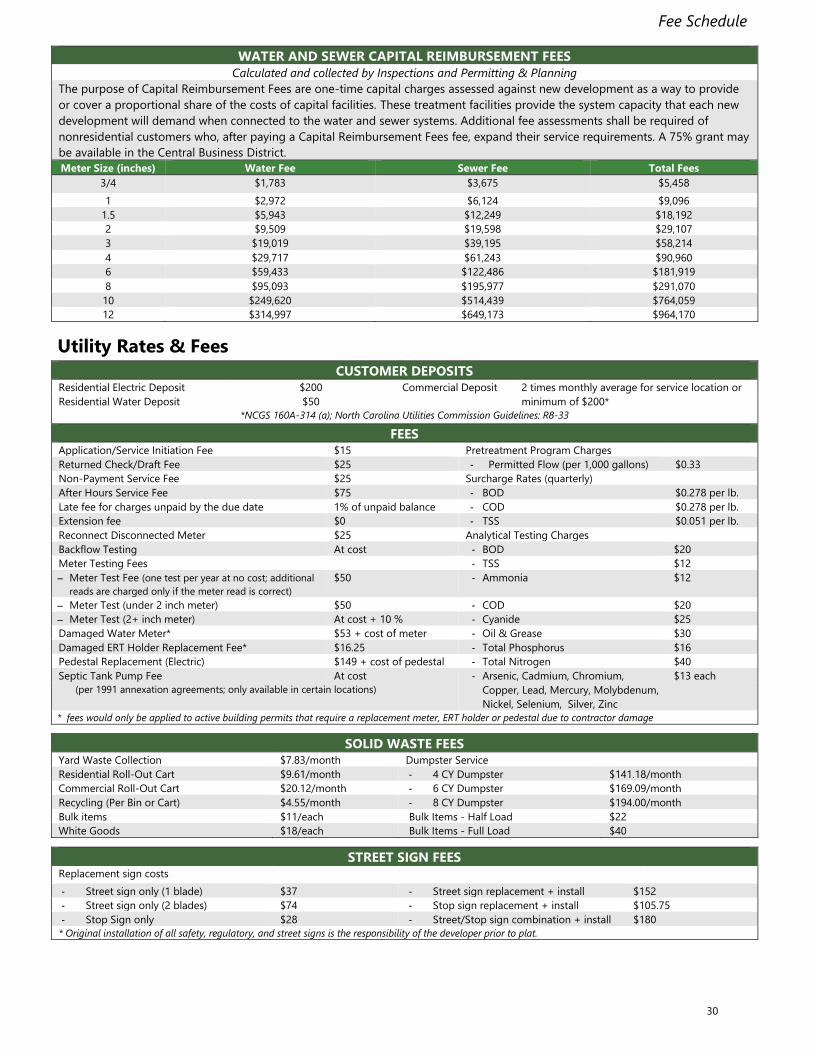
Fee Schedule
WATER AND SEWER CAPITAL REIMBURSEMENT FEES
Calculated and collected by Inspections and Permitting & Planning
The purpose of Capital Reimbursement Fees are one-time capital charges assessed against new development as a way to provide
or cover a proportional share of the costs of capital facilities. These treatment facilities provide the system capacity that each new
development will demand when connected to the water and sewer systems. Additional fee assessments shall be required of
nonresidential customers who, after paying a Capital Reimbursement Fees fee, expand their service requirements. A 75% grant may
be available in the Central Business District.
Meter Size (inches) Water Fee Sewer Fee Total Fees
3/4 $1,783 $3,675 $5,458
1 $2,972 $6,124 $9,096
1.5 $5,943 $12,249 $18,192
2 $9,509 $19,598 $29,107
3 $19,019 $39,195 $58,214
4 $29,717 $61,243 $90,960
6 $59,433 $122,486 $181,919
8 $95,093 $195,977 $291,070
10 $249,620 $514,439 $764,059
12 $314,997 $649,173 $964,170
Utility Rates & Fees
CUSTOMER DEPOSITS Residential Electric Deposit $200 Commercial Deposit 2 times monthly average for service location or
minimum of $200* Residential Water Deposit $50
*NCGS 160A-314 (a); North Carolina Utilities Commission Guidelines: R8-33
FEES Application/Service Initiation Fee $15 Pretreatment Program Charges
Returned Check/Draft Fee $25 - Permitted Flow (per 1,000 gallons) $0.33
Non-Payment Service Fee $25 Surcharge Rates (quarterly)
After Hours Service Fee $75 - BOD $0.278 per lb.
Late fee for charges unpaid by the due date 1% of unpaid balance - COD $0.278 per lb.
Extension fee $0 - TSS $0.051 per lb.
Reconnect Disconnected Meter $25 Analytical Testing Charges
Backflow Testing At cost - BOD $20
Meter Testing Fees - TSS $12
− Meter Test Fee (one test per year at no cost; additional
reads are charged only if the meter read is correct)
$50 - Ammonia $12
− Meter Test (under 2 inch meter) $50 - COD $20
− Meter Test (2+ inch meter) At cost + 10 % - Cyanide $25
Damaged Water Meter* $53 + cost of meter - Oil & Grease $30
Damaged ERT Holder Replacement Fee* $16.25 - Total Phosphorus $16
Pedestal Replacement (Electric) $149 + cost of pedestal - Total Nitrogen $40
Septic Tank Pump Fee At cost - Arsenic, Cadmium, Chromium,
Copper, Lead, Mercury, Molybdenum,
Nickel, Selenium, Silver, Zinc
$13 each
(per 1991 annexation agreements; only available in certain locations)
* fees would only be applied to active building permits that require a replacement meter, ERT holder or pedestal due to contractor damage
SOLID WASTE FEES Yard Waste Collection $7.83/month Dumpster Service
Residential Roll-Out Cart $9.61/month - 4 CY Dumpster $141.18/month
Commercial Roll-Out Cart $20.12/month - 6 CY Dumpster $169.09/month
Recycling (Per Bin or Cart) $4.55/month - 8 CY Dumpster $194.00/month
Bulk items $11/each Bulk Items - Half Load $22
White Goods $18/each Bulk Items - Full Load $40
STREET SIGN FEES Replacement sign costs
- Street sign only (1 blade) $37 - Street sign replacement + install $152
- Street sign only (2 blades) $74 - Stop sign replacement + install $105.75
- Stop Sign only $28 - Street/Stop sign combination + install $180
* Original installation of all safety, regulatory, and street signs is the responsibility of the developer prior to plat.
30
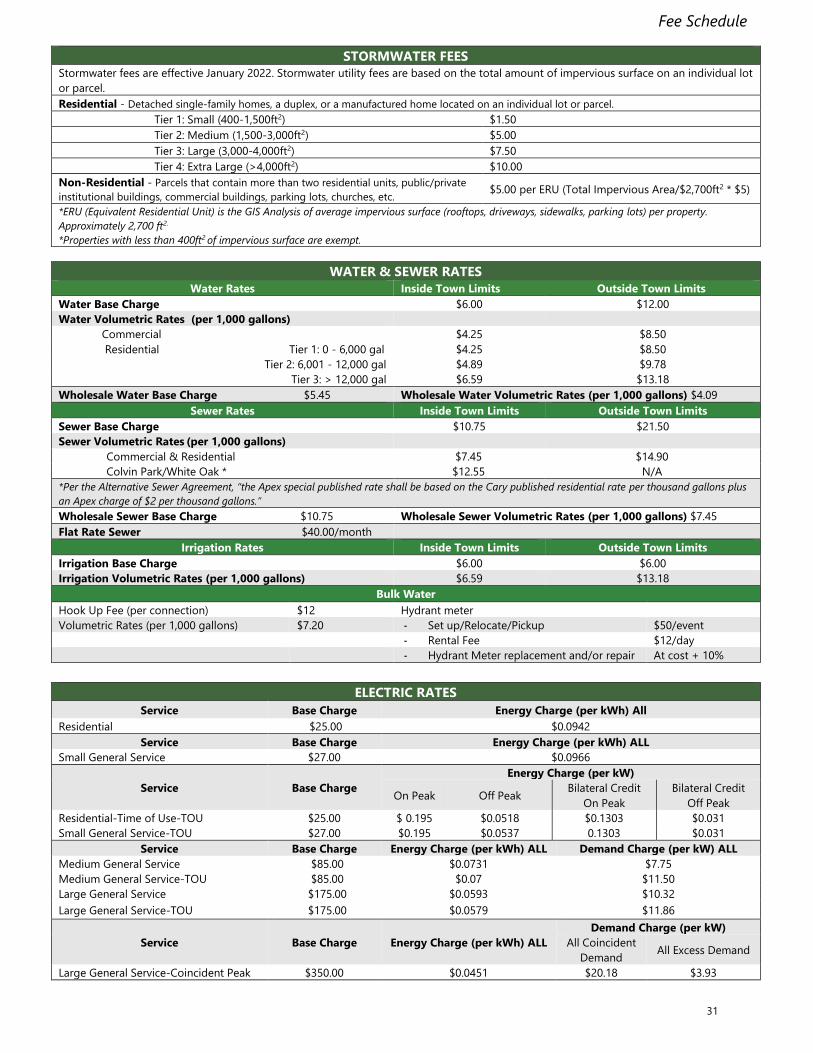
Fee Schedule
STORMWATER FEES
Stormwater fees are effective January 2022. Stormwater utility fees are based on the total amount of impervious surface on an individual lot
or parcel.
Residential - Detached single-family homes, a duplex, or a manufactured home located on an individual lot or parcel.
Tier 1: Small (400-1,500ft2) $1.50
Tier 2: Medium (1,500-3,000ft2) $5.00
Tier 3: Large (3,000-4,000ft2) $7.50
Tier 4: Extra Large (>4,000ft2) $10.00
Non-Residential - Parcels that contain more than two residential units, public/private
institutional buildings, commercial buildings, parking lots, churches, etc. $5.00 per ERU (Total Impervious Area/$2,700ft2 * $5)
*ERU (Equivalent Residential Unit) is the GIS Analysis of average impervious surface (rooftops, driveways, sidewalks, parking lots) per property.
Approximately 2,700 ft2.
*Properties with less than 400ft2 of impervious surface are exempt.
WATER & SEWER RATES
Water Rates Inside Town Limits Outside Town Limits
Water Base Charge $6.00 $12.00
Water Volumetric Rates (per 1,000 gallons)
Commercial $4.25 $8.50
Residential Tier 1: 0 - 6,000 gal $4.25 $8.50
Tier 2: 6,001 - 12,000 gal $4.89 $9.78
Tier 3: > 12,000 gal $6.59 $13.18
Wholesale Water Base Charge $5.45 Wholesale Water Volumetric Rates (per 1,000 gallons) $4.09
Sewer Rates Inside Town Limits Outside Town Limits
Sewer Base Charge $10.75 $21.50
Sewer Volumetric Rates (per 1,000 gallons)
Commercial & Residential $7.45 $14.90
Colvin Park/White Oak * $12.55 N/A
*Per the Alternative Sewer Agreement, “the Apex special published rate shall be based on the Cary published residential rate per thousand gallons plus
an Apex charge of $2 per thousand gallons.”
Wholesale Sewer Base Charge $10.75 Wholesale Sewer Volumetric Rates (per 1,000 gallons) $7.45
Flat Rate Sewer $40.00/month
Irrigation Rates Inside Town Limits Outside Town Limits
Irrigation Base Charge $6.00 $6.00
Irrigation Volumetric Rates (per 1,000 gallons) $6.59 $13.18
Bulk Water
Hook Up Fee (per connection) $12 Hydrant meter
Volumetric Rates (per 1,000 gallons) $7.20 - Set up/Relocate/Pickup $50/event
- Rental Fee $12/day
- Hydrant Meter replacement and/or repair At cost + 10%
ELECTRIC RATES
Service Base Charge Energy Charge (per kWh) All
Residential $25.00 $0.0942
Service Base Charge Energy Charge (per kWh) ALL
Small General Service $27.00 $0.0966
Service Base Charge
Energy Charge (per kW)
On Peak Off Peak Bilateral Credit
On Peak
Bilateral Credit
Off Peak
Residential-Time of Use-TOU $25.00 $ 0.195 $0.0518 $0.1303 $0.031
Small General Service-TOU $27.00 $0.195 $0.0537 0.1303 $0.031
Service Base Charge Energy Charge (per kWh) ALL Demand Charge (per kW) ALL
Medium General Service $85.00 $0.0731 $7.75
Medium General Service-TOU $85.00 $0.07 $11.50
Large General Service $175.00 $0.0593 $10.32
Large General Service-TOU $175.00 $0.0579 $11.86
Service Base Charge Energy Charge (per kWh) ALL
Demand Charge (per kW)
All Coincident
Demand All Excess Demand
Large General Service-Coincident Peak $350.00 $0.0451 $20.18 $3.93
31
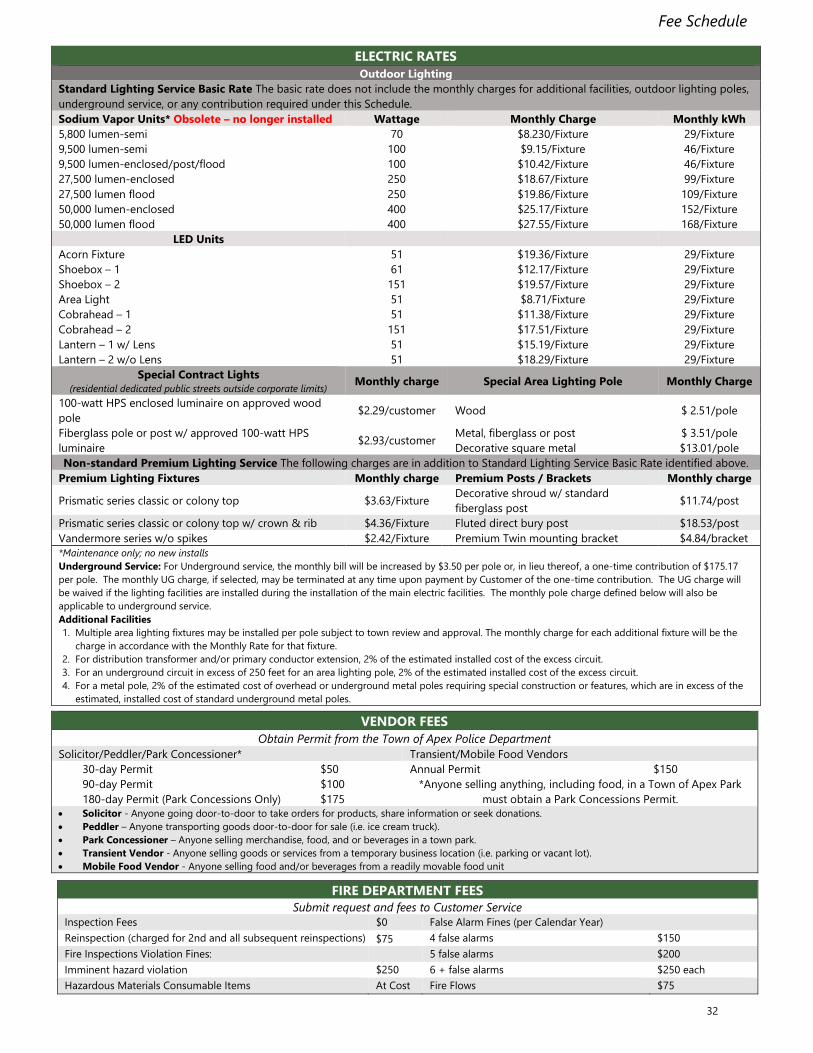
Fee Schedule
ELECTRIC RATES
Outdoor Lighting
Standard Lighting Service Basic Rate The basic rate does not include the monthly charges for additional facilities, outdoor lighting poles,
underground service, or any contribution required under this Schedule.
Sodium Vapor Units* Obsolete – no longer installed Wattage Monthly Charge Monthly kWh
5,800 lumen-semi 70 $8.230/Fixture 29/Fixture
9,500 lumen-semi 100 $9.15/Fixture 46/Fixture
9,500 lumen-enclosed/post/flood 100 $10.42/Fixture 46/Fixture
27,500 lumen-enclosed 250 $18.67/Fixture 99/Fixture
27,500 lumen flood 250 $19.86/Fixture 109/Fixture
50,000 lumen-enclosed 400 $25.17/Fixture 152/Fixture
50,000 lumen flood 400 $27.55/Fixture 168/Fixture
LED Units
Acorn Fixture 51 $19.36/Fixture 29/Fixture
Shoebox – 1 61 $12.17/Fixture 29/Fixture
Shoebox – 2 151 $19.57/Fixture 29/Fixture
Area Light 51 $8.71/Fixture 29/Fixture
Cobrahead – 1 51 $11.38/Fixture 29/Fixture
Cobrahead – 2 151 $17.51/Fixture 29/Fixture
Lantern – 1 w/ Lens 51 $15.19/Fixture 29/Fixture
Lantern – 2 w/o Lens 51 $18.29/Fixture 29/Fixture
Special Contract Lights
(residential dedicated public streets outside corporate limits) Monthly charge Special Area Lighting Pole Monthly Charge
100-watt HPS enclosed luminaire on approved wood
pole $2.29/customer Wood $ 2.51/pole
Fiberglass pole or post w/ approved 100-watt HPS
luminaire $2.93/customer
Metal, fiberglass or post
Decorative square metal
$ 3.51/pole
$13.01/pole
Non-standard Premium Lighting Service The following charges are in addition to Standard Lighting Service Basic Rate identified above.
Premium Lighting Fixtures Monthly charge Premium Posts / Brackets Monthly charge
Prismatic series classic or colony top $3.63/Fixture Decorative shroud w/ standard
fiberglass post $11.74/post
Prismatic series classic or colony top w/ crown & rib $4.36/Fixture Fluted direct bury post $18.53/post
Vandermore series w/o spikes $2.42/Fixture Premium Twin mounting bracket $4.84/bracket
*Maintenance only; no new installs
Underground Service: For Underground service, the monthly bill will be increased by $3.50 per pole or, in lieu thereof, a one-time contribution of $175.17
per pole. The monthly UG charge, if selected, may be terminated at any time upon payment by Customer of the one-time contribution. The UG charge will
be waived if the lighting facilities are installed during the installation of the main electric facilities. The monthly pole charge defined below will also be
applicable to underground service.
Additional Facilities
1. Multiple area lighting fixtures may be installed per pole subject to town review and approval. The monthly charge for each additional fixture will be the
charge in accordance with the Monthly Rate for that fixture.
2. For distribution transformer and/or primary conductor extension, 2% of the estimated installed cost of the excess circuit.
3. For an underground circuit in excess of 250 feet for an area lighting pole, 2% of the estimated installed cost of the excess circuit.
4. For a metal pole, 2% of the estimated cost of overhead or underground metal poles requiring special construction or features, which are in excess of the
estimated, installed cost of standard underground metal poles.
VENDOR FEES
Obtain Permit from the Town of Apex Police Department
Solicitor/Peddler/Park Concessioner* Transient/Mobile Food Vendors
30-day Permit $50 Annual Permit $150
90-day Permit $100 *Anyone selling anything, including food, in a Town of Apex Park
must obtain a Park Concessions Permit. 180-day Permit (Park Concessions Only) $175
• Solicitor - Anyone going door-to-door to take orders for products, share information or seek donations.
• Peddler – Anyone transporting goods door-to-door for sale (i.e. ice cream truck).
• Park Concessioner – Anyone selling merchandise, food, and or beverages in a town park.
• Transient Vendor - Anyone selling goods or services from a temporary business location (i.e. parking or vacant lot).
• Mobile Food Vendor - Anyone selling food and/or beverages from a readily movable food unit
FIRE DEPARTMENT FEES
Submit request and fees to Customer Service
Inspection Fees $0 False Alarm Fines (per Calendar Year)
Reinspection (charged for 2nd and all subsequent reinspections) $75 4 false alarms $150
Fire Inspections Violation Fines: 5 false alarms $200
Imminent hazard violation $250 6 + false alarms $250 each
Hazardous Materials Consumable Items At Cost Fire Flows $75
32
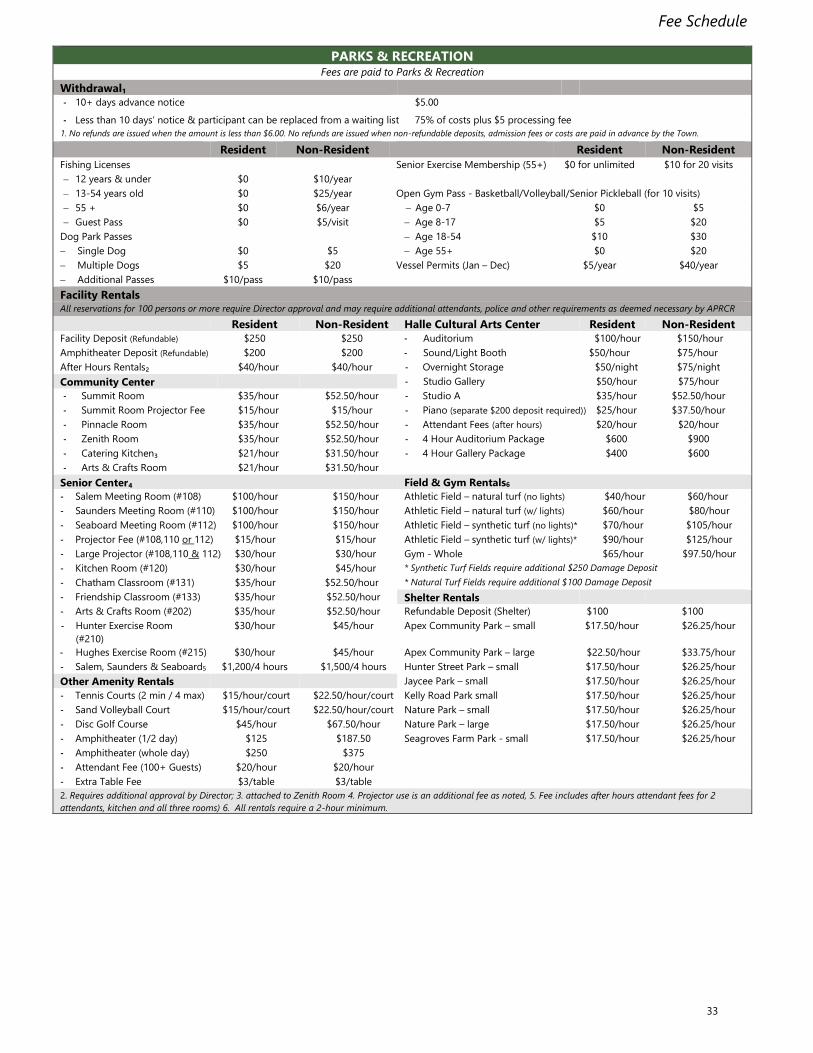
Fee Schedule
PARKS & RECREATION Fees are paid to Parks & Recreation
Withdrawal₁
- 10+ days advance notice $5.00
- Less than 10 days’ notice & participant can be replaced from a waiting list 75% of costs plus $5 processing fee
1. No refunds are issued when the amount is less than $6.00. No refunds are issued when non-refundable deposits, admission fees or costs are paid in advance by the Town.
Resident Non-Resident Resident Non-Resident
Fishing Licenses Senior Exercise Membership (55+) $0 for unlimited $10 for 20 visits
− 12 years & under $0 $10/year
− 13-54 years old $0 $25/year Open Gym Pass - Basketball/Volleyball/Senior Pickleball (for 10 visits)
− 55 + $0 $6/year − Age 0-7 $0 $5
− Guest Pass $0 $5/visit − Age 8-17 $5 $20
Dog Park Passes − Age 18-54 $10 $30
− Single Dog $0 $5 − Age 55+ $0 $20
− Multiple Dogs $5 $20 Vessel Permits (Jan – Dec) $5/year $40/year
− Additional Passes $10/pass $10/pass
Facility Rentals All reservations for 100 persons or more require Director approval and may require additional attendants, police and other requirements as deemed necessary by APRCR
Resident Non-Resident Halle Cultural Arts Center Resident Non-Resident
Facility Deposit (Refundable) $250 $250 - Auditorium $100/hour $150/hour
Amphitheater Deposit (Refundable) $200 $200 - Sound/Light Booth $50/hour $75/hour
After Hours Rentals₂ $40/hour $40/hour - Overnight Storage $50/night $75/night
Community Center - Studio Gallery $50/hour $75/hour
- Summit Room $35/hour $52.50/hour - Studio A $35/hour $52.50/hour
- Summit Room Projector Fee $15/hour $15/hour - Piano (separate $200 deposit required)) $25/hour $37.50/hour
- Pinnacle Room $35/hour $52.50/hour - Attendant Fees (after hours) $20/hour $20/hour
- Zenith Room $35/hour $52.50/hour - 4 Hour Auditorium Package $600 $900
- Catering Kitchen₃ $21/hour $31.50/hour - 4 Hour Gallery Package $400 $600
- Arts & Crafts Room $21/hour $31.50/hour
Senior Center₄ Field & Gym Rentals6
- Salem Meeting Room (#108) $100/hour $150/hour Athletic Field – natural turf (no lights) $40/hour $60/hour
- Saunders Meeting Room (#110) $100/hour $150/hour Athletic Field – natural turf (w/ lights) $60/hour $80/hour
- Seaboard Meeting Room (#112) $100/hour $150/hour Athletic Field – synthetic turf (no lights)* $70/hour $105/hour
- Projector Fee (#108,110 or 112) $15/hour $15/hour Athletic Field – synthetic turf (w/ lights)* $90/hour $125/hour
- Large Projector (#108,110 & 112) $30/hour $30/hour Gym - Whole $65/hour $97.50/hour
- Kitchen Room (#120) $30/hour $45/hour * Synthetic Turf Fields require additional $250 Damage Deposit
- Chatham Classroom (#131) $35/hour $52.50/hour * Natural Turf Fields require additional $100 Damage Deposit
- Friendship Classroom (#133) $35/hour $52.50/hour Shelter Rentals
- Arts & Crafts Room (#202) $35/hour $52.50/hour Refundable Deposit (Shelter) $100 $100
- Hunter Exercise Room
(#210)
$30/hour $45/hour Apex Community Park – small $17.50/hour $26.25/hour
- Hughes Exercise Room (#215) $30/hour $45/hour Apex Community Park – large $22.50/hour $33.75/hour
- Salem, Saunders & Seaboard5 $1,200/4 hours $1,500/4 hours Hunter Street Park – small $17.50/hour $26.25/hour
Other Amenity Rentals Jaycee Park – small $17.50/hour $26.25/hour
- Tennis Courts (2 min / 4 max) $15/hour/court $22.50/hour/court Kelly Road Park small $17.50/hour $26.25/hour
- Sand Volleyball Court $15/hour/court $22.50/hour/court Nature Park – small $17.50/hour $26.25/hour
- Disc Golf Course $45/hour $67.50/hour Nature Park – large $17.50/hour $26.25/hour
- Amphitheater (1/2 day) $125 $187.50 Seagroves Farm Park - small $17.50/hour $26.25/hour
- Amphitheater (whole day) $250 $375
- Attendant Fee (100+ Guests) $20/hour $20/hour
- Extra Table Fee $3/table $3/table
2. Requires additional approval by Director; 3. attached to Zenith Room 4. Projector use is an additional fee as noted, 5. Fee includes after hours attendant fees for 2
attendants, kitchen and all three rooms) 6. All rentals require a 2-hour minimum.
33
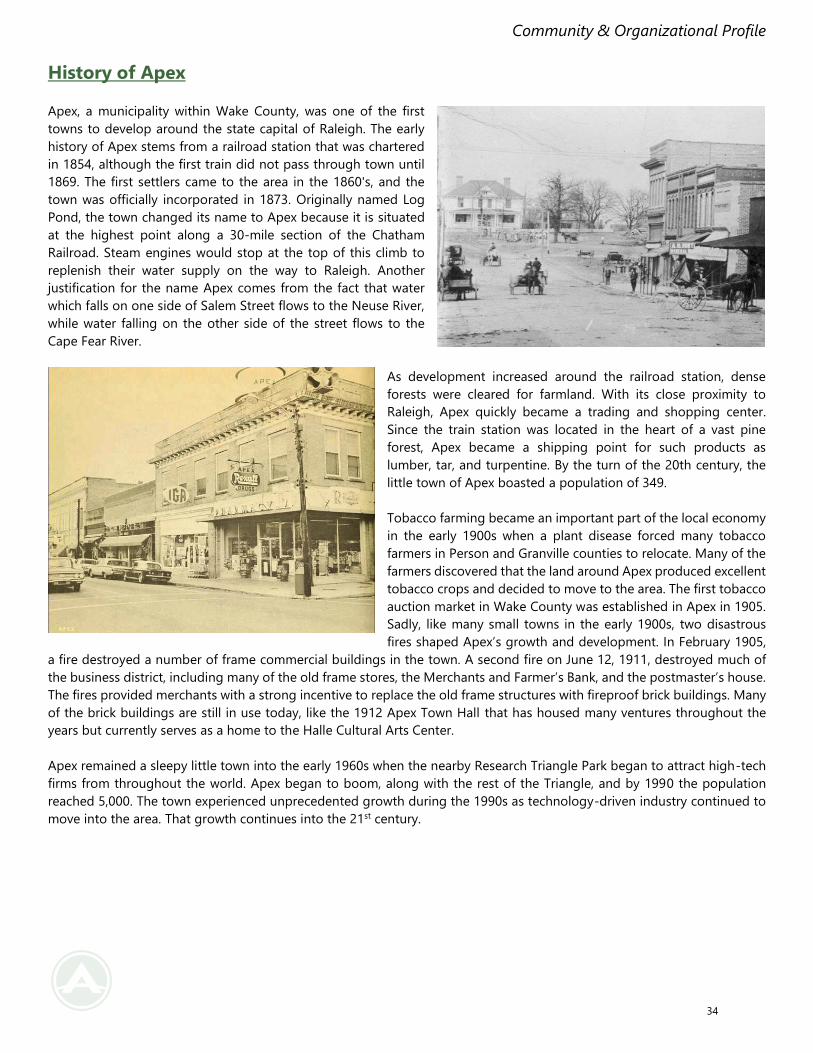
Community & Organizational Profile
History of Apex
Apex, a municipality within Wake County, was one of the first
towns to develop around the state capital of Raleigh. The early
history of Apex stems from a railroad station that was chartered
in 1854, although the first train did not pass through town until
1869. The first settlers came to the area in the 1860's, and the
town was officially incorporated in 1873. Originally named Log
Pond, the town changed its name to Apex because it is situated
at the highest point along a 30-mile section of the Chatham
Railroad. Steam engines would stop at the top of this climb to
replenish their water supply on the way to Raleigh. Another
justification for the name Apex comes from the fact that water
which falls on one side of Salem Street flows to the Neuse River,
while water falling on the other side of the street flows to the
Cape Fear River.
As development increased around the railroad station, dense
forests were cleared for farmland. With its close proximity to
Raleigh, Apex quickly became a trading and shopping center.
Since the train station was located in the heart of a vast pine
forest, Apex became a shipping point for such products as
lumber, tar, and turpentine. By the turn of the 20th century, the
little town of Apex boasted a population of 349.
Tobacco farming became an important part of the local economy
in the early 1900s when a plant disease forced many tobacco
farmers in Person and Granville counties to relocate. Many of the
farmers discovered that the land around Apex produced excellent
tobacco crops and decided to move to the area. The first tobacco
auction market in Wake County was established in Apex in 1905.
Sadly, like many small towns in the early 1900s, two disastrous
fires shaped Apex’s growth and development. In February 1905,
a fire destroyed a number of frame commercial buildings in the town. A second fire on June 12, 1911, destroyed much of
the business district, including many of the old frame stores, the Merchants and Farmer’s Bank, and the postmaster’s house.
The fires provided merchants with a strong incentive to replace the old frame structures with fireproof brick buildings. Many
of the brick buildings are still in use today, like the 1912 Apex Town Hall that has housed many ventures throughout the
years but currently serves as a home to the Halle Cultural Arts Center.
Apex remained a sleepy little town into the early 1960s when the nearby Research Triangle Park began to attract high-tech
firms from throughout the world. Apex began to boom, along with the rest of the Triangle, and by 1990 the population
reached 5,000. The town experienced unprecedented growth during the 1990s as technology-driven industry continued to
move into the area. That growth continues into the 21st century.
34
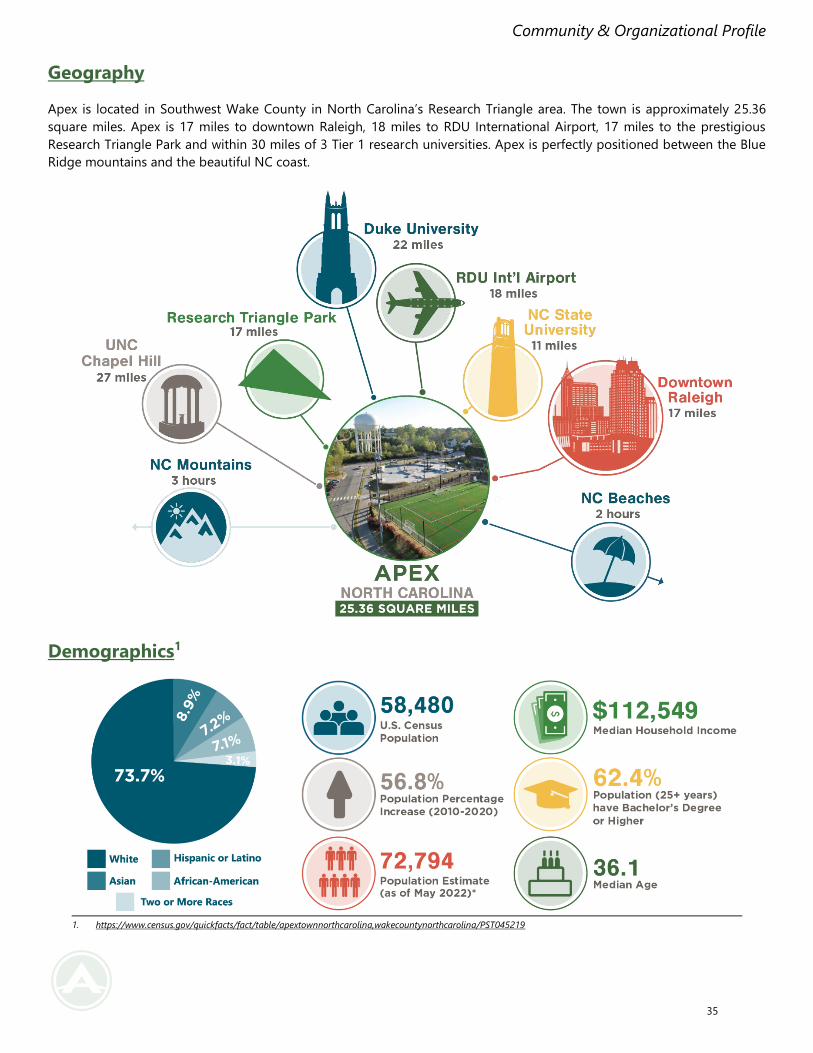
Community & Organizational Profile
Geography
Apex is located in Southwest Wake County in North Carolina’s Research Triangle area. The town is approximately 25.36
square miles. Apex is 17 miles to downtown Raleigh, 18 miles to RDU International Airport, 17 miles to the prestigious
Research Triangle Park and within 30 miles of 3 Tier 1 research universities. Apex is perfectly positioned between the Blue
Ridge mountains and the beautiful NC coast.
Demographics1
1. https://www.census.gov/quickfacts/fact/table/apextownnorthcarolina,wakecountynorthcarolina/PST045219
35
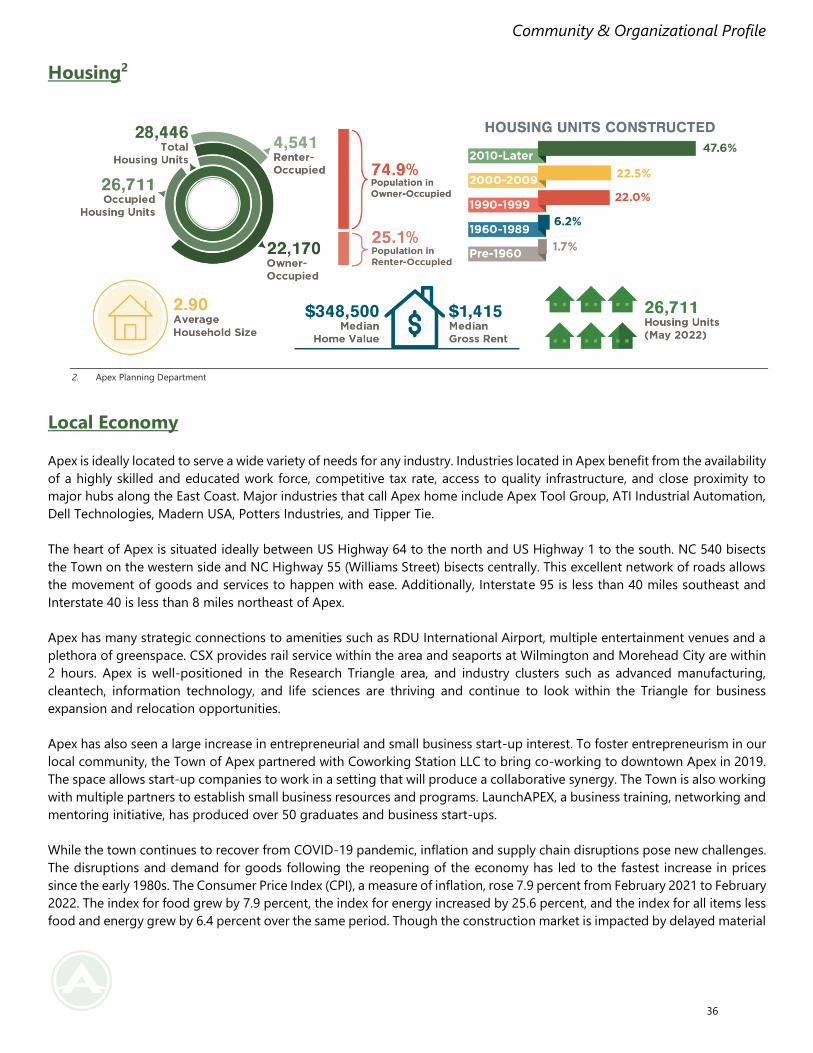
Community & Organizational Profile
Housing2
2. Apex Planning Department
Local Economy
Apex is ideally located to serve a wide variety of needs for any industry. Industries located in Apex benefit from the availability
of a highly skilled and educated work force, competitive tax rate, access to quality infrastructure, and close proximity to
major hubs along the East Coast. Major industries that call Apex home include Apex Tool Group, ATI Industrial Automation,
Dell Technologies, Madern USA, Potters Industries, and Tipper Tie.
The heart of Apex is situated ideally between US Highway 64 to the north and US Highway 1 to the south. NC 540 bisects
the Town on the western side and NC Highway 55 (Williams Street) bisects centrally. This excellent network of roads allows
the movement of goods and services to happen with ease. Additionally, Interstate 95 is less than 40 miles southeast and
Interstate 40 is less than 8 miles northeast of Apex.
Apex has many strategic connections to amenities such as RDU International Airport, multiple entertainment venues and a
plethora of greenspace. CSX provides rail service within the area and seaports at Wilmington and Morehead City are within
2 hours. Apex is well-positioned in the Research Triangle area, and industry clusters such as advanced manufacturing,
cleantech, information technology, and life sciences are thriving and continue to look within the Triangle for business
expansion and relocation opportunities.
Apex has also seen a large increase in entrepreneurial and small business start-up interest. To foster entrepreneurism in our
local community, the Town of Apex partnered with Coworking Station LLC to bring co-working to downtown Apex in 2019.
The space allows start-up companies to work in a setting that will produce a collaborative synergy. The Town is also working
with multiple partners to establish small business resources and programs. LaunchAPEX, a business training, networking and
mentoring initiative, has produced over 50 graduates and business start-ups.
While the town continues to recover from COVID-19 pandemic, inflation and supply chain disruptions pose new challenges.
The disruptions and demand for goods following the reopening of the economy has led to the fastest increase in prices
since the early 1980s. The Consumer Price Index (CPI), a measure of inflation, rose 7.9 percent from February 2021 to February
2022. The index for food grew by 7.9 percent, the index for energy increased by 25.6 percent, and the index for all items less
food and energy grew by 6.4 percent over the same period. Though the construction market is impacted by delayed material
36
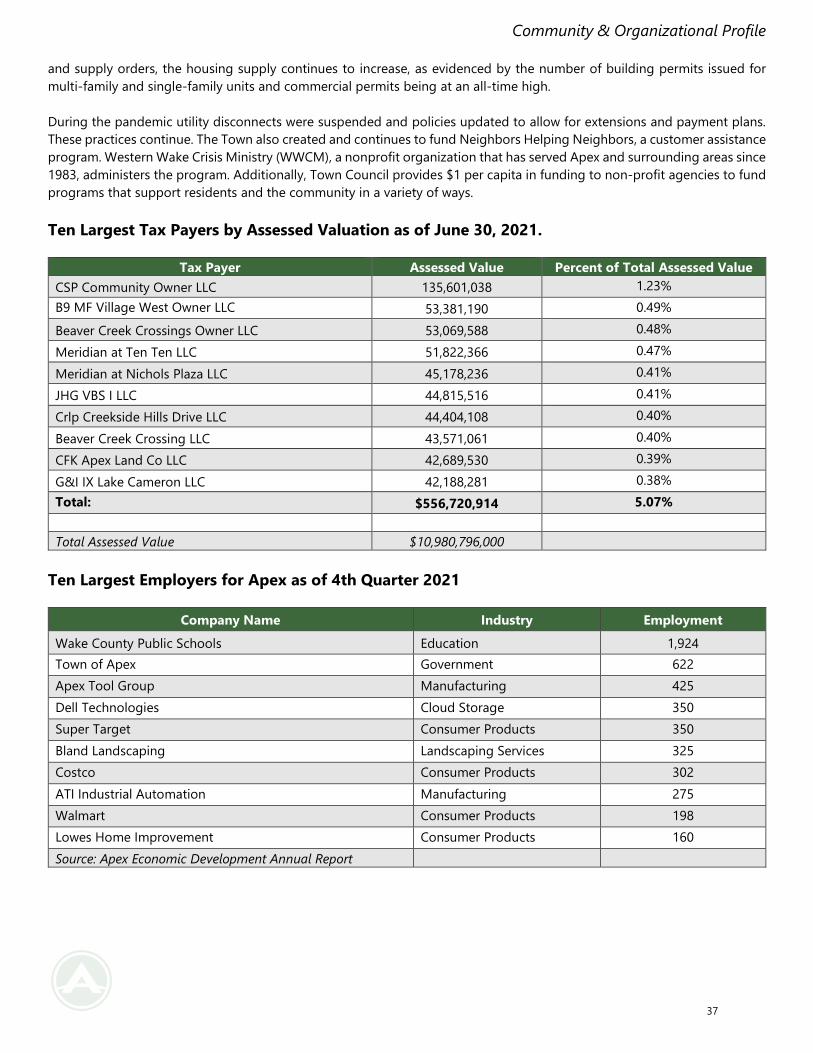
Community & Organizational Profile
and supply orders, the housing supply continues to increase, as evidenced by the number of building permits issued for
multi-family and single-family units and commercial permits being at an all-time high.
During the pandemic utility disconnects were suspended and policies updated to allow for extensions and payment plans.
These practices continue. The Town also created and continues to fund Neighbors Helping Neighbors, a customer assistance
program. Western Wake Crisis Ministry (WWCM), a nonprofit organization that has served Apex and surrounding areas since
1983, administers the program. Additionally, Town Council provides $1 per capita in funding to non-profit agencies to fund
programs that support residents and the community in a variety of ways.
Ten Largest Tax Payers by Assessed Valuation as of June 30, 2021.
Tax Payer Assessed Value Percent of Total Assessed Value
CSP Community Owner LLC 135,601,038 1.23%
B9 MF Village West Owner LLC 53,381,190 0.49%
Beaver Creek Crossings Owner LLC 53,069,588 0.48%
Meridian at Ten Ten LLC 51,822,366 0.47%
Meridian at Nichols Plaza LLC 45,178,236 0.41%
JHG VBS I LLC 44,815,516 0.41%
Crlp Creekside Hills Drive LLC 44,404,108 0.40%
Beaver Creek Crossing LLC 43,571,061 0.40%
CFK Apex Land Co LLC 42,689,530 0.39%
G&I IX Lake Cameron LLC 42,188,281 0.38%
Total: $556,720,914 5.07%
Total Assessed Value $10,980,796,000
Ten Largest Employers for Apex as of 4th Quarter 2021
Company Name Industry Employment
Wake County Public Schools Education 1,924
Town of Apex Government 622
Apex Tool Group Manufacturing 425
Dell Technologies Cloud Storage 350
Super Target Consumer Products 350
Bland Landscaping Landscaping Services 325
Costco Consumer Products 302
ATI Industrial Automation Manufacturing 275
Walmart Consumer Products 198
Lowes Home Improvement Consumer Products 160
Source: Apex Economic Development Annual Report
37
Community & Organizational Profile
Government
The Town operates under a council-manager form of government, whereby the Mayor and Town Council address the
legislative needs of the town with five council members representing residents at-large. Citizens elect the mayor and
councilmembers to staggered four-year terms. The mayor is the presiding officer of the Council. The Town Council selects
a mayor pro tem from within the Council. The mayor pro tem serves as mayor in the absence or incapacitation of the mayor.
Through this arrangement, the Town Council sets and directs policy regarding the operations of town government. Apex’s
elections are non-partisan and elections occur in odd numbered years. Town Council appoints a town manager to implement
its policies and administer the overall town organization. Apex is a full-service town and provides essential public services
including fire and police protection, recreation, public works, electric utilities, stormwater and water and sewer.
The Town undertook an organizational assessment and committed to develop its organization-wide strategic plan further.
Organizational growth has not kept pace with development as population growth in Apex has increased demand for services
and stretched operational capacity. The purpose of the organizational assessment was to determine an optimal organization
structure and identify gaps in workforce capacity. The Town intends to implement the recommendations from the study in
phases over multiple fiscal years with the highest priority recommendations in the FY22-23 Budget. Details regarding
changes in organizational structure, reassignment of positions, and new positions are located in department-specific budget
sections. The study resulted in identification and realignment of departments into four primary focus areas described below.
Town Administration
The Town Council appoints the Town Manager to implement Council policies and administer the overall town organization
and direct, coordinate, and evaluate the performance of Town services. The Town Manager serves at the pleasure of the
Town Council. The Town Manager provides oversight for the Administrative departments of the Town that includes the
Town Clerk; Diversity, Equity, and Inclusion; and Human Resources.
Community & Safety
An Assistant Town Manager will lead the newly aligned Community and Safety functions. These departments regularly
interact with residents and provide services and programs focused on creating opportunities for residents to build
relationships and engage with other residents and town staff. The newly formed Community & Neighborhood Connections
department will be responsible for executing the Town Council's affordable housing and equitable community engagement
goals. This focus area also includes Police, Fire, and Parks, Recreation, and Cultural Resources.
Performance & Strategy
A new position of Deputy Town Manager will lead the newly aligned Performance & Strategy functions. The functions are
primarily internal support departments or require internal collaboration for product development. The newly formed
Communications department will be responsible for growing a strategic communication plan that provides a framework for
the organization to enhance two-way communication, improve internal and external relationships, and encourage public
information and participation. The newly formed Budget, Performance, & Strategy department is responsible for
compilation, review, analysis, and presentation of data submitted for inclusion in the annual operating budget and Capital
Improvement Plan, as well as the development and management of performance measures and organizational alignment
with the Town’s strategic plan. This focus area also includes Finance, Information Technology, and Economic Development.
Development & Operations
An Assistant Town Manager will lead the newly aligned Development & Operations functions. The functions primarily focus
on service delivery, including utilities and public works. The newly formed Transportation & Infrastructure department will
be responsible for construction management and monitoring of the construction phase of capital improvement projects for
compliance with approved plans and specifications. The department will include development services, infrastructure
inspections, transportation engineering, and property acquisition. This focus area also includes Public Works; consisting of
38
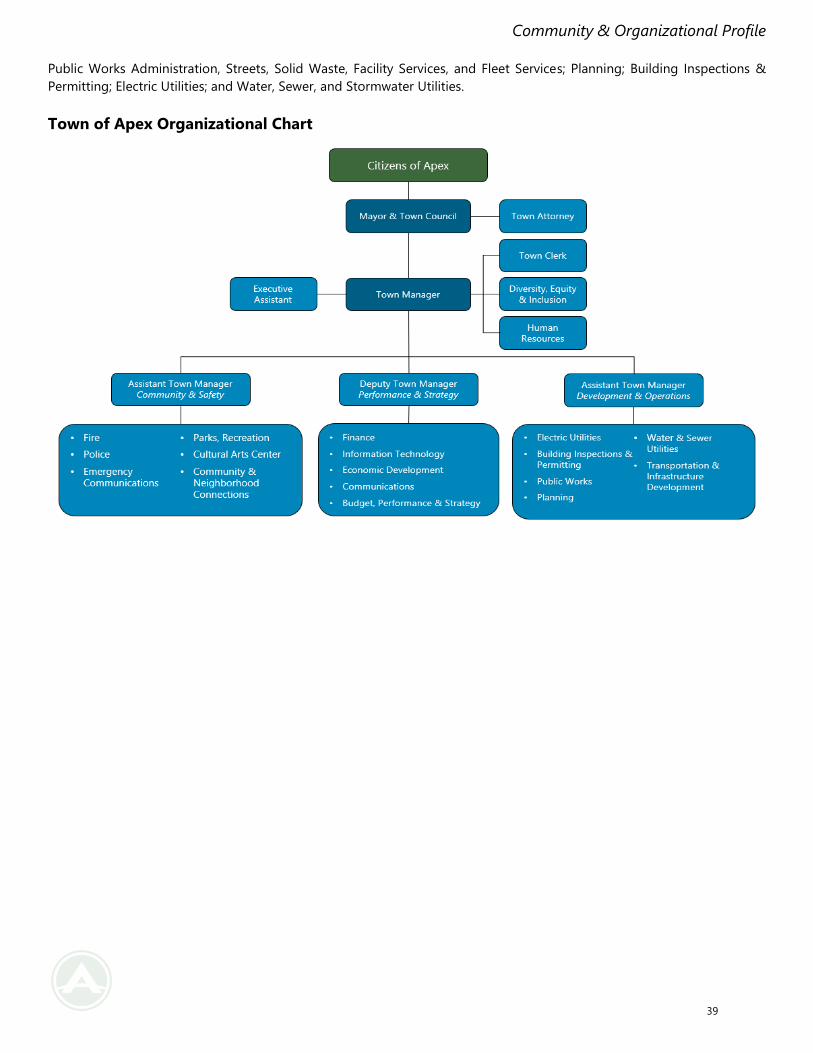
Community & Organizational Profile
Public Works Administration, Streets, Solid Waste, Facility Services, and Fleet Services; Planning; Building Inspections &
Permitting; Electric Utilities; and Water, Sewer, and Stormwater Utilities.
Town of Apex Organizational Chart
39
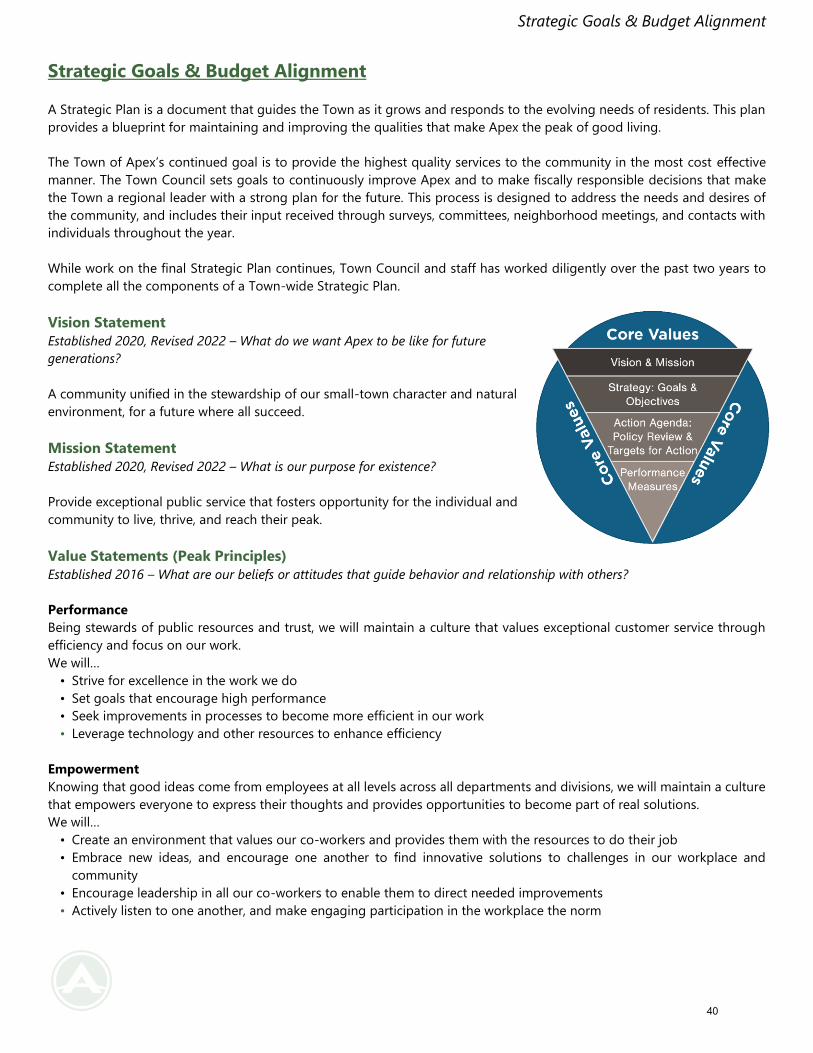
Strategic Goals & Budget Alignment
Strategic Goals & Budget Alignment
A Strategic Plan is a document that guides the Town as it grows and responds to the evolving needs of residents. This plan
provides a blueprint for maintaining and improving the qualities that make Apex the peak of good living.
The Town of Apex’s continued goal is to provide the highest quality services to the community in the most cost effective
manner. The Town Council sets goals to continuously improve Apex and to make fiscally responsible decisions that make
the Town a regional leader with a strong plan for the future. This process is designed to address the needs and desires of
the community, and includes their input received through surveys, committees, neighborhood meetings, and contacts with
individuals throughout the year.
While work on the final Strategic Plan continues, Town Council and staff has worked diligently over the past two years to
complete all the components of a Town-wide Strategic Plan.
Vision Statement
Established 2020, Revised 2022 – What do we want Apex to be like for future
generations?
A community unified in the stewardship of our small-town character and natural
environment, for a future where all succeed.
Mission Statement
Established 2020, Revised 2022 – What is our purpose for existence?
Provide exceptional public service that fosters opportunity for the individual and
community to live, thrive, and reach their peak.
Value Statements (Peak Principles)
Established 2016 – What are our beliefs or attitudes that guide behavior and relationship with others?
Performance
Being stewards of public resources and trust, we will maintain a culture that values exceptional customer service through
efficiency and focus on our work.
We will…
• Strive for excellence in the work we do
• Set goals that encourage high performance
• Seek improvements in processes to become more efficient in our work
• Leverage technology and other resources to enhance efficiency
Empowerment
Knowing that good ideas come from employees at all levels across all departments and divisions, we will maintain a culture
that empowers everyone to express their thoughts and provides opportunities to become part of real solutions.
We will…
• Create an environment that values our co-workers and provides them with the resources to do their job
• Embrace new ideas, and encourage one another to find innovative solutions to challenges in our workplace and
community
• Encourage leadership in all our co-workers to enable them to direct needed improvements
• Actively listen to one another, and make engaging participation in the workplace the norm
40
Strategic Goals & Budget Alignment
Accountability
Knowing that we are entrusted to be stewards of the public’s resources, we will maintain an atmosphere of openness and
transparency to one another and to those we serve.
We will…
• Act with integrity at all times, and hold one another to the highest ethical standards
• Report the results of our work internally and externally, and hold one another accountable to meet our goals
• Be vigilant in our work to ensure we focus on the safety of ourselves, our co-workers, and those we serve
• Not tolerate the mistreatment of employees by supervisors, fellow employees, or those outside the organization
Knowledge
A workforce that pursues knowledge is one that will be better able to anticipate new challenges and respond to those
presented.
We will…
• Value continued learning as a way to develop our workforce
• Provide opportunities for all to learn through internal and external training opportunities
• Recruit new employees that have a history of and/or passion for actively pursuing knowledge
Strategic Goal Statements
Established 2020, revised 2022 – What do we want to achieve for our community & what needs to be done first?
High Performing Government
Deliver exceptional service valuing an engaged workforce with an emphasis on efficiency, collaboration, innovation,
and inclusion.
Objectives
• Use resources efficiently and effectively
• Provide customer-focused service
• Attract, retain, and develop our workforce
• Promote a culture of innovation and creativity
• Maintain transparency in stewardship of public resources
A Welcoming Community
Create a safe and welcoming environment fostering community connections and high-quality recreational and cultural
experiences supporting a sense of belonging.
Objectives
• Ensure safe places and spaces
• Foster community connections
• Create a sense of belonging
• Encourage a healthy and active lifestyle
• Enhance communications for a more informed community
Environmental Leadership
Commit to sustaining natural resources and environmental well-being.
Objectives
• Adopt clean energy and efficiency measures
• Preserve natural resources and habitats
• Reduce environmental waste
• Proactively address climate vulnerability
41
Strategic Goals & Budget Alignment
Economic Vitality
Improve and sustain an environment that invites and retains a diversity of residents, employment opportunities, and
businesses.
Objectives
• Recruit, retain, and develop businesses
• Leverage community assets to benefit businesses and residents
• Engage in placemaking
• Identify key opportunities to strengthen economic environment
Responsible Development
Encourage equitable and sustainable development that provides accessibility and connectivity throughout the community.
Objectives
• Plan for and invest in infrastructure
• Provide and promote mobility
• Support diverse housing options
• Balance impacts of growth and development
Utilizing the Draft Initiatives for each strategic goal (major projects/actions that are underway and new ideas based on
Council priorities and discussion in the 2022 retreat), staff identified various resources needed to begin working towards
the initiatives. The next couple of pages highlight funds allocated in the FY23 budget to specific items identified by Town
Council as priorities.
42
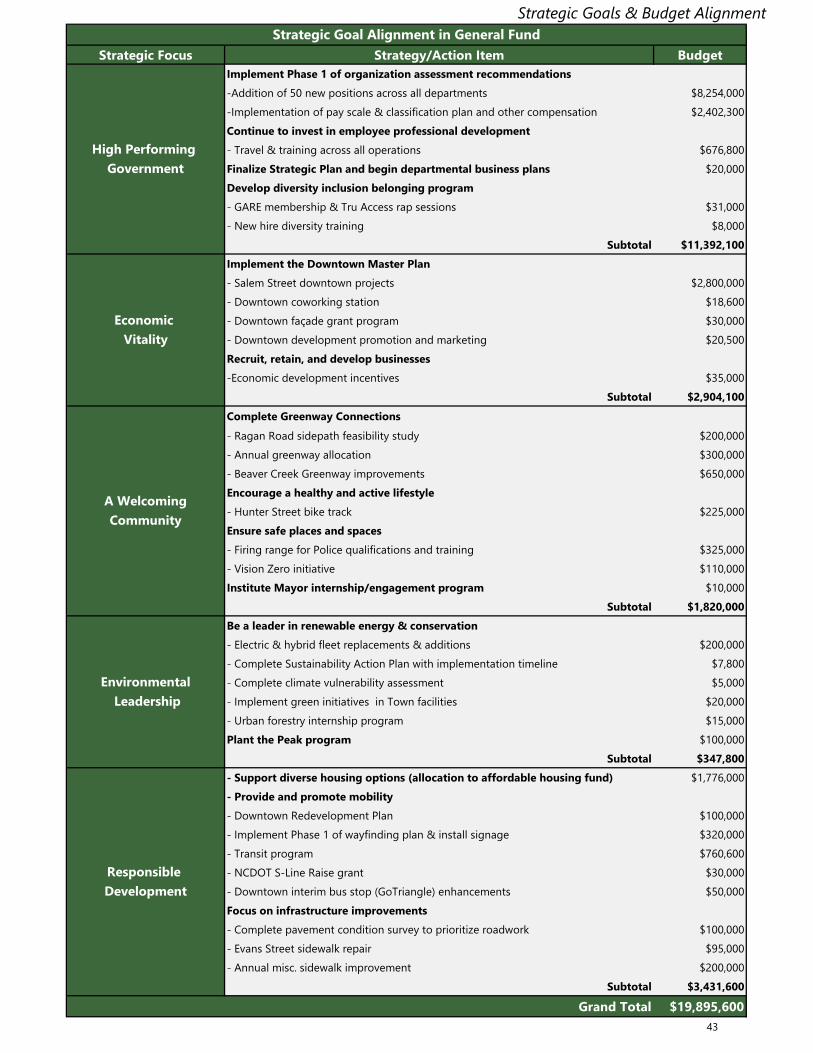
Strategic Focus Strategy/Action Item BudgetImplement Phase 1 of organization assessment recommendations-Addition of 50 new positions across all departments $8,254,000 -Implementation of pay scale & classification plan and other compensation $2,402,300 Continue to invest in employee professional development- Travel & training across all operations $676,800 Finalize Strategic Plan and begin departmental business plans $20,000 Develop diversity inclusion belonging program - GARE membership & Tru Access rap sessions $31,000 - New hire diversity training $8,000
Subtotal $11,392,100 Implement the Downtown Master Plan- Salem Street downtown projects $2,800,000 - Downtown coworking station $18,600 - Downtown façade grant program $30,000 - Downtown development promotion and marketing $20,500 Recruit, retain, and develop businesses-Economic development incentives $35,000
Subtotal $2,904,100 Complete Greenway Connections - Ragan Road sidepath feasibility study $200,000 - Annual greenway allocation $300,000 - Beaver Creek Greenway improvements $650,000 Encourage a healthy and active lifestyle- Hunter Street bike track $225,000Ensure safe places and spaces- Firing range for Police qualifications and training $325,000- Vision Zero initiative $110,000 Institute Mayor internship/engagement program $10,000
Subtotal $1,820,000 Be a leader in renewable energy & conservation - Electric & hybrid fleet replacements & additions $200,000 - Complete Sustainability Action Plan with implementation timeline $7,800 - Complete climate vulnerability assessment $5,000 - Implement green initiatives in Town facilities $20,000 - Urban forestry internship program $15,000 Plant the Peak program $100,000
Subtotal $347,800 - Support diverse housing options (allocation to affordable housing fund) $1,776,000 - Provide and promote mobility- Downtown Redevelopment Plan $100,000 - Implement Phase 1 of wayfinding plan & install signage $320,000- Transit program $760,600 - NCDOT S-Line Raise grant $30,000 - Downtown interim bus stop (GoTriangle) enhancements $50,000 Focus on infrastructure improvements- Complete pavement condition survey to prioritize roadwork $100,000 - Evans Street sidewalk repair $95,000 - Annual misc. sidewalk improvement $200,000
Subtotal $3,431,600
Grand Total $19,895,600
Responsible Development
Strategic Goal Alignment in General Fund
Environmental Leadership
Economic Vitality
High Performing Government
A WelcomingCommunity
43
Strategic Goals & Budget Alignment
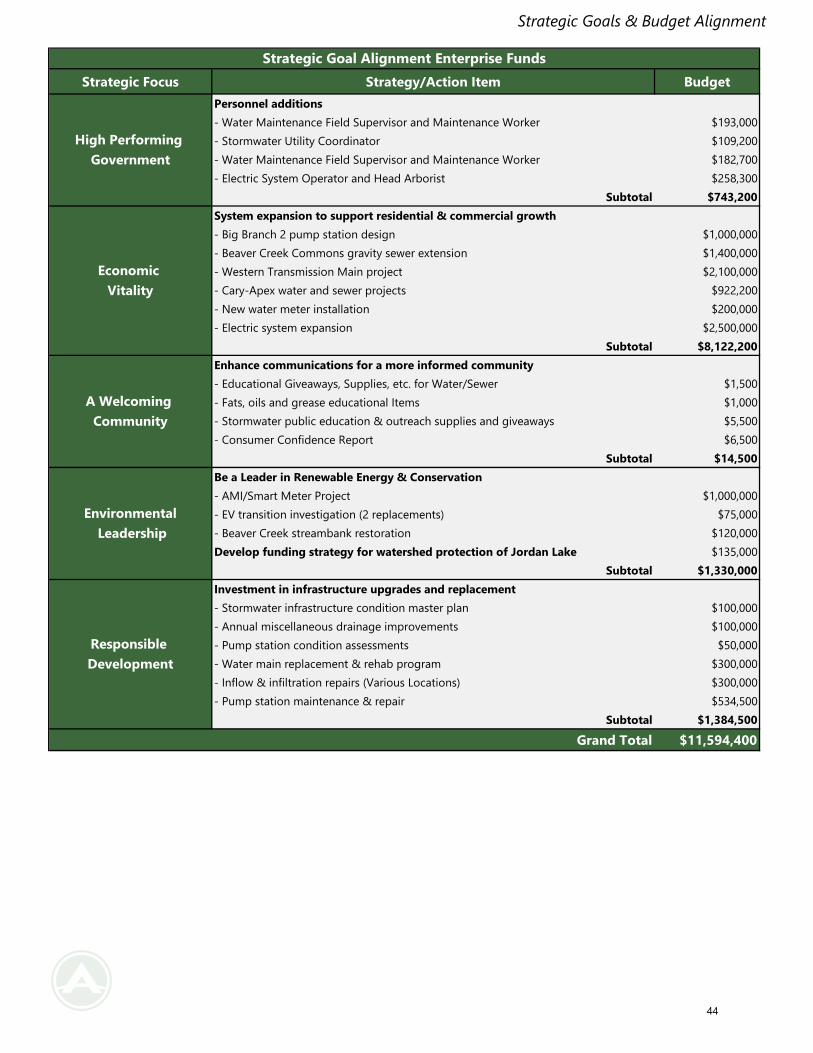
Strategic Focus Strategy/Action Item BudgetPersonnel additions- Water Maintenance Field Supervisor and Maintenance Worker $193,000- Stormwater Utility Coordinator $109,200- Water Maintenance Field Supervisor and Maintenance Worker $182,700- Electric System Operator and Head Arborist $258,300
Subtotal $743,200System expansion to support residential & commercial growth- Big Branch 2 pump station design $1,000,000- Beaver Creek Commons gravity sewer extension $1,400,000- Western Transmission Main project $2,100,000- Cary-Apex water and sewer projects $922,200- New water meter installation $200,000- Electric system expansion $2,500,000
Subtotal $8,122,200Enhance communications for a more informed community- Educational Giveaways, Supplies, etc. for Water/Sewer $1,500- Fats, oils and grease educational Items $1,000- Stormwater public education & outreach supplies and giveaways $5,500- Consumer Confidence Report $6,500
Subtotal $14,500Be a Leader in Renewable Energy & Conservation - AMI/Smart Meter Project $1,000,000- EV transition investigation (2 replacements) $75,000- Beaver Creek streambank restoration $120,000Develop funding strategy for watershed protection of Jordan Lake $135,000
Subtotal $1,330,000Investment in infrastructure upgrades and replacement- Stormwater infrastructure condition master plan $100,000- Annual miscellaneous drainage improvements $100,000- Pump station condition assessments $50,000- Water main replacement & rehab program $300,000- Inflow & infiltration repairs (Various Locations) $300,000- Pump station maintenance & repair $534,500
Subtotal $1,384,500
Grand Total $11,594,400
Responsible Development
Environmental Leadership
Strategic Goal Alignment Enterprise Funds
Economic Vitality
A Welcoming Community
High Performing Government
44
Strategic Goals & Budget Alignment
Performance Measures
Performance Measures
The Town of Apex is moving toward a performance-based management process while also working to develop a town-wide
strategic plan. To aid in this process, town departments worked to revise their mission statements for FY19-20 and are
continuing to work to develop goals and objectives that are in line with Town Council priorities. In January 2020, Town
Council adopted new vision and mission statements and revised their strategic focus areas with new goals. After review and
minor amendment by the extended leadership team comprised of staff, strategic goals were updated with Town Council
agreement in May of 2022. Part of the strategic plan development includes establishing performance measures in each of
Council’s five focus areas that include:
High Performing Government: Deliver exceptional service valuing an engaged workforce with an emphasis
on efficiency, collaboration, innovation, and inclusion.
Responsible Development: Encourage equitable and sustainable development that provides accessibility
and connectivity throughout the community.
Environmental Leadership: Commit to sustaining natural resources and environmental well-being.
Economic Vitality: Improve and sustain an environment that invites and retains a diversity of residents,
employment opportunities, and businesses.
Welcoming Community: Create a safe and welcoming environment fostering community connections
and high-quality recreational and cultural experiences supporting a sense of belonging.
These focus areas help guide the development of departmental action plans that help the Town achieve these strategic
priorities. Developing new goals and objectives means some historical data may not be available or relevant and a trend will
not be identifiable until three to five years of new data collection. The Town of Apex participates in the UNC School of
Government benchmarking project and is able to report relevant data from that study for the prior year. The tables and
charts below reflect the Town’s use of the benchmark data to inform decisions that align with Town Council’s priorities. The
Town hopes the performance measure information will assist the reader in identifying performance trends related to Town
Council’s priorities.
45
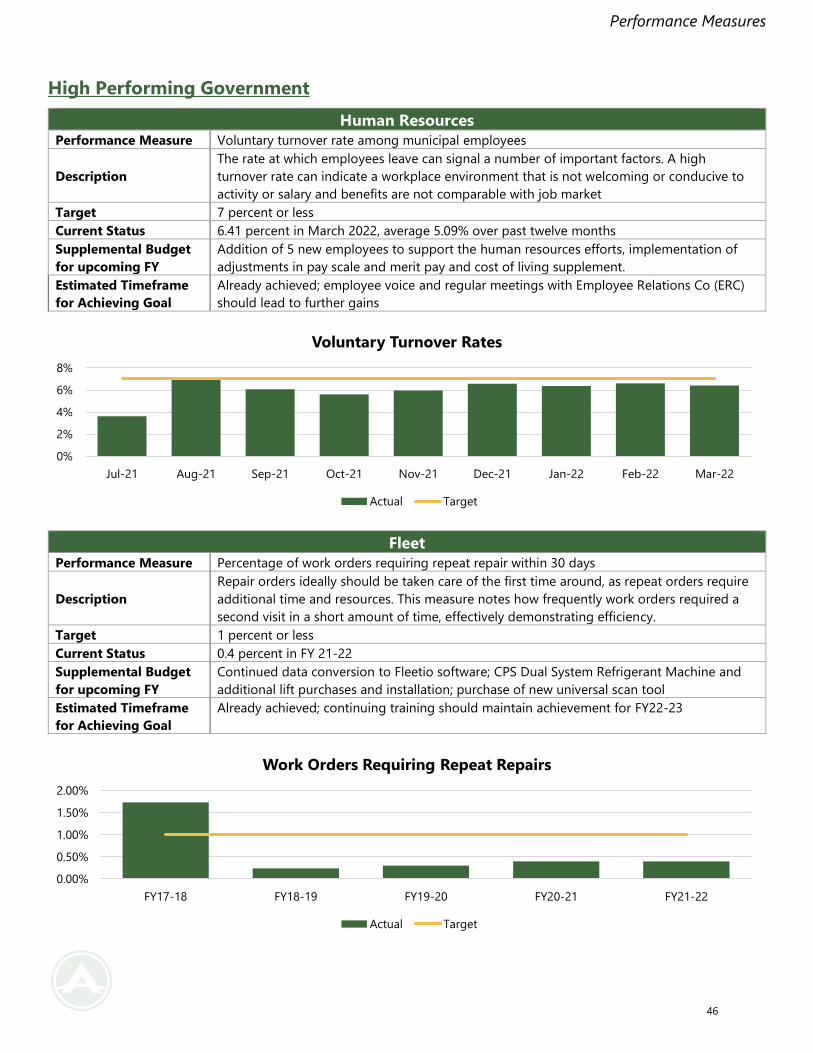
Performance Measures
High Performing Government
Human Resources
Performance Measure Voluntary turnover rate among municipal employees
Description
The rate at which employees leave can signal a number of important factors. A high
turnover rate can indicate a workplace environment that is not welcoming or conducive to
activity or salary and benefits are not comparable with job market
Target 7 percent or less
Current Status 6.41 percent in March 2022, average 5.09% over past twelve months
Supplemental Budget
for upcoming FY
Addition of 5 new employees to support the human resources efforts, implementation of
adjustments in pay scale and merit pay and cost of living supplement.
Estimated Timeframe
for Achieving Goal
Already achieved; employee voice and regular meetings with Employee Relations Co (ERC)
should lead to further gains
Fleet
Performance Measure Percentage of work orders requiring repeat repair within 30 days
Description
Repair orders ideally should be taken care of the first time around, as repeat orders require
additional time and resources. This measure notes how frequently work orders required a
second visit in a short amount of time, effectively demonstrating efficiency.
Target 1 percent or less
Current Status 0.4 percent in FY 21-22
Supplemental Budget
for upcoming FY
Continued data conversion to Fleetio software; CPS Dual System Refrigerant Machine and
additional lift purchases and installation; purchase of new universal scan tool
Estimated Timeframe
for Achieving Goal
Already achieved; continuing training should maintain achievement for FY22-23
0%
2%
4%
6%
8%
Jul-21 Aug-21 Sep-21 Oct-21 Nov-21 Dec-21 Jan-22 Feb-22 Mar-22
Voluntary Turnover Rates
Actual Target
0.00%
0.50%
1.00%
1.50%
2.00%
FY17-18 FY18-19 FY19-20 FY20-21 FY21-22
Work Orders Requiring Repeat Repairs
Actual Target
46
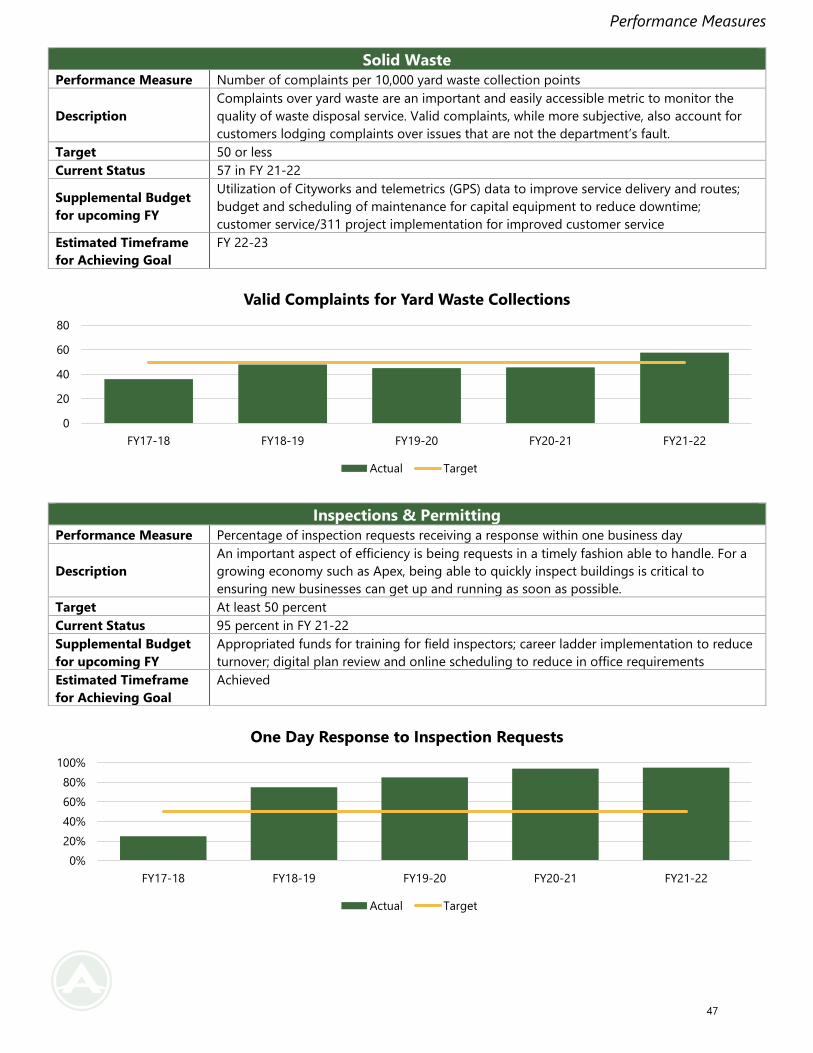
Performance Measures
Solid Waste
Performance Measure Number of complaints per 10,000 yard waste collection points
Description
Complaints over yard waste are an important and easily accessible metric to monitor the
quality of waste disposal service. Valid complaints, while more subjective, also account for
customers lodging complaints over issues that are not the department’s fault.
Target 50 or less
Current Status 57 in FY 21-22
Supplemental Budget
for upcoming FY
Utilization of Cityworks and telemetrics (GPS) data to improve service delivery and routes;
budget and scheduling of maintenance for capital equipment to reduce downtime;
customer service/311 project implementation for improved customer service
Estimated Timeframe
for Achieving Goal
FY 22-23
0
20
40
60
80
FY17-18 FY18-19 FY19-20 FY20-21 FY21-22
Valid Complaints for Yard Waste Collections
Actual Target
0%
20%
40%
60%
80%
100%
FY17-18 FY18-19 FY19-20 FY20-21 FY21-22
One Day Response to Inspection Requests
Actual Target
Inspections & Permitting
Performance Measure Percentage of inspection requests receiving a response within one business day
Description
An important aspect of efficiency is being requests in a timely fashion able to handle. For a
growing economy such as Apex, being able to quickly inspect buildings is critical to
ensuring new businesses can get up and running as soon as possible.
Target At least 50 percent
Current Status 95 percent in FY 21-22
Supplemental Budget
for upcoming FY
Appropriated funds for training for field inspectors; career ladder implementation to reduce
turnover; digital plan review and online scheduling to reduce in office requirements
Estimated Timeframe
for Achieving Goal
Achieved
47
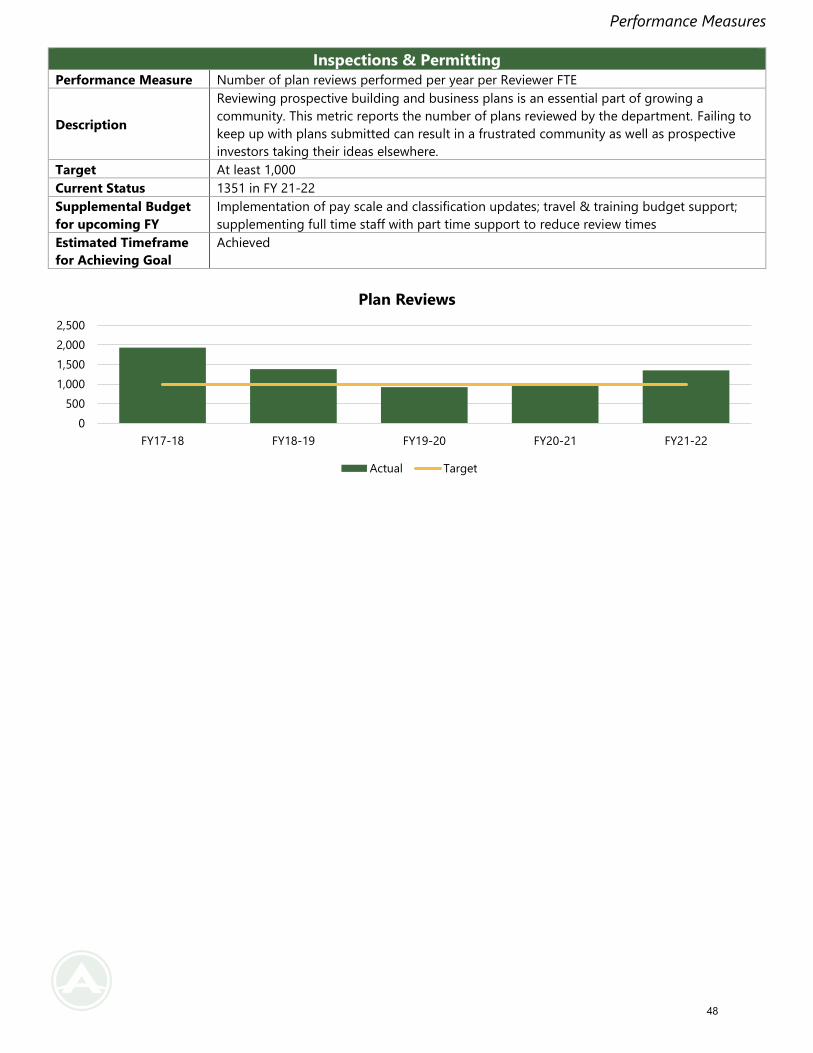
Performance Measures
Inspections & Permitting
Performance Measure Number of plan reviews performed per year per Reviewer FTE
Description
Reviewing prospective building and business plans is an essential part of growing a
community. This metric reports the number of plans reviewed by the department. Failing to
keep up with plans submitted can result in a frustrated community as well as prospective
investors taking their ideas elsewhere.
Target At least 1,000
Current Status 1351 in FY 21-22
Supplemental Budget
for upcoming FY
Implementation of pay scale and classification updates; travel & training budget support;
supplementing full time staff with part time support to reduce review times
Estimated Timeframe
for Achieving Goal
Achieved
0
500
1,000
1,500
2,000
2,500
FY17-18 FY18-19 FY19-20 FY20-21 FY21-22
Plan Reviews
Actual Target
48
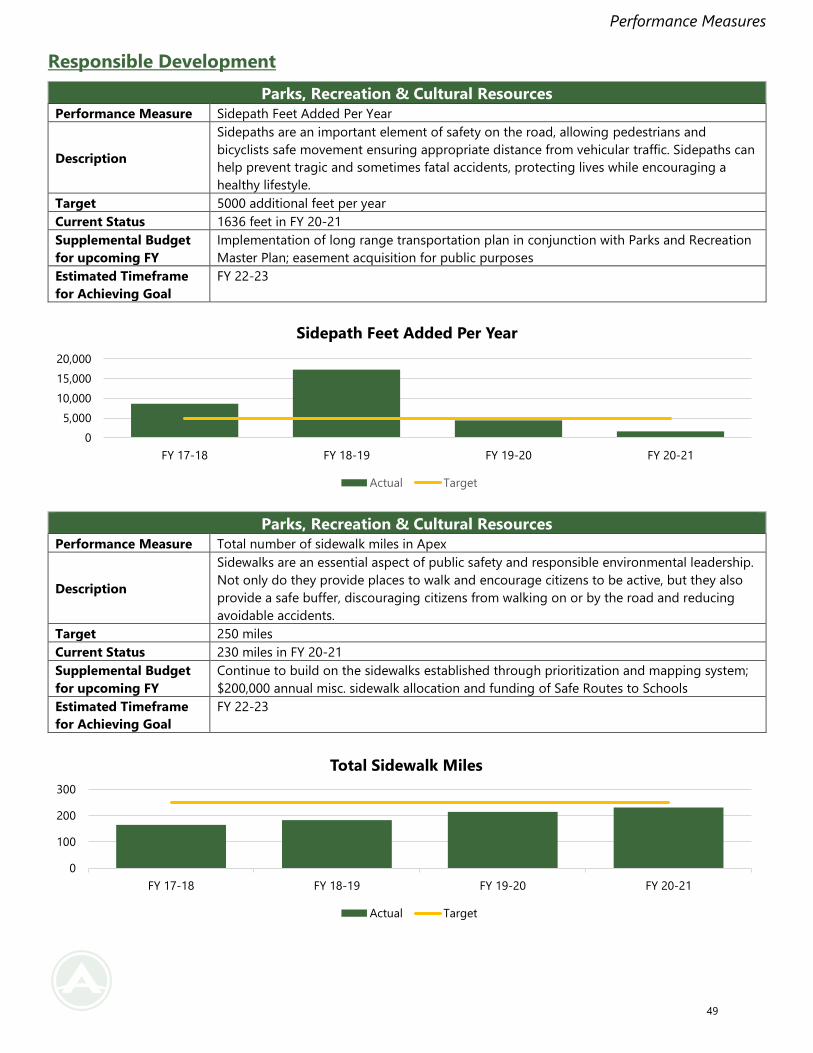
Performance Measures
Responsible Development
Parks, Recreation & Cultural Resources
Performance Measure Sidepath Feet Added Per Year
Description
Sidepaths are an important element of safety on the road, allowing pedestrians and
bicyclists safe movement ensuring appropriate distance from vehicular traffic. Sidepaths can
help prevent tragic and sometimes fatal accidents, protecting lives while encouraging a
healthy lifestyle.
Target 5000 additional feet per year
Current Status 1636 feet in FY 20-21
Supplemental Budget
for upcoming FY
Implementation of long range transportation plan in conjunction with Parks and Recreation
Master Plan; easement acquisition for public purposes
Estimated Timeframe
for Achieving Goal
FY 22-23
Parks, Recreation & Cultural Resources
Performance Measure Total number of sidewalk miles in Apex
Description
Sidewalks are an essential aspect of public safety and responsible environmental leadership.
Not only do they provide places to walk and encourage citizens to be active, but they also
provide a safe buffer, discouraging citizens from walking on or by the road and reducing
avoidable accidents.
Target 250 miles
Current Status 230 miles in FY 20-21
Supplemental Budget
for upcoming FY
Continue to build on the sidewalks established through prioritization and mapping system;
$200,000 annual misc. sidewalk allocation and funding of Safe Routes to Schools
Estimated Timeframe
for Achieving Goal
FY 22-23
0
5,000
10,000
15,000
20,000
FY 17-18 FY 18-19 FY 19-20 FY 20-21
Sidepath Feet Added Per Year
Actual Target
0
100
200
300
FY 17-18 FY 18-19 FY 19-20 FY 20-21
Total Sidewalk Miles
Actual Target
49
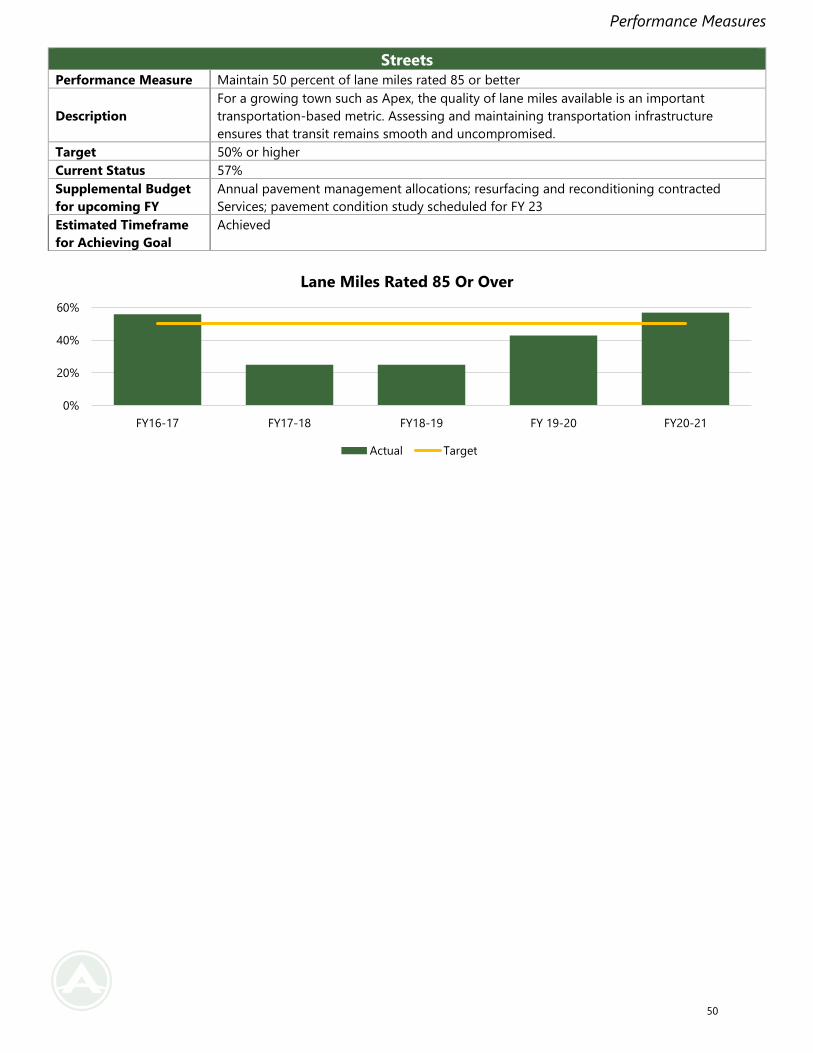
Performance Measures
Streets
Performance Measure Maintain 50 percent of lane miles rated 85 or better
Description
For a growing town such as Apex, the quality of lane miles available is an important
transportation-based metric. Assessing and maintaining transportation infrastructure
ensures that transit remains smooth and uncompromised.
Target 50% or higher
Current Status 57%
Supplemental Budget
for upcoming FY
Annual pavement management allocations; resurfacing and reconditioning contracted
Services; pavement condition study scheduled for FY 23
Estimated Timeframe
for Achieving Goal
Achieved
0%
20%
40%
60%
FY16-17 FY17-18 FY18-19 FY 19-20 FY20-21
Lane Miles Rated 85 Or Over
Actual Target
50
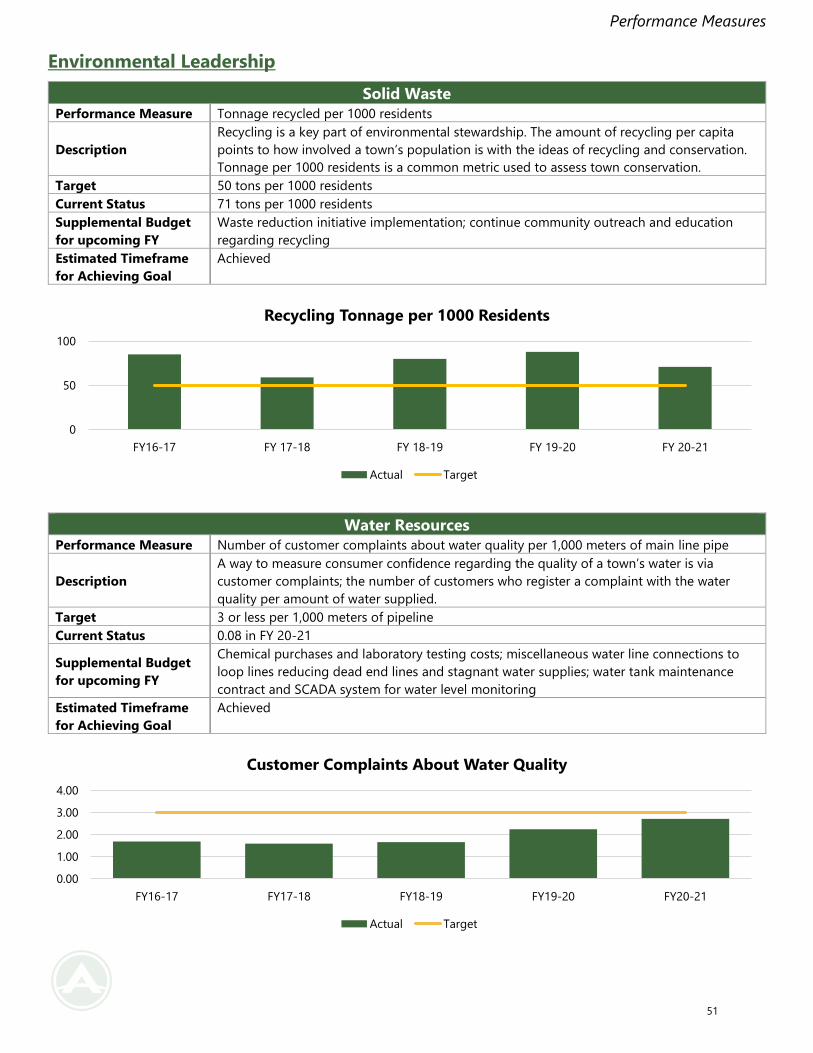
Performance Measures
Environmental Leadership
Solid Waste
Performance Measure Tonnage recycled per 1000 residents
Description
Recycling is a key part of environmental stewardship. The amount of recycling per capita
points to how involved a town’s population is with the ideas of recycling and conservation.
Tonnage per 1000 residents is a common metric used to assess town conservation.
Target 50 tons per 1000 residents
Current Status 71 tons per 1000 residents
Supplemental Budget
for upcoming FY
Waste reduction initiative implementation; continue community outreach and education
regarding recycling
Estimated Timeframe
for Achieving Goal
Achieved
Water Resources
Performance Measure Number of customer complaints about water quality per 1,000 meters of main line pipe
Description
A way to measure consumer confidence regarding the quality of a town’s water is via
customer complaints; the number of customers who register a complaint with the water
quality per amount of water supplied.
Target 3 or less per 1,000 meters of pipeline
Current Status 0.08 in FY 20-21
Supplemental Budget
for upcoming FY
Chemical purchases and laboratory testing costs; miscellaneous water line connections to
loop lines reducing dead end lines and stagnant water supplies; water tank maintenance
contract and SCADA system for water level monitoring
Estimated Timeframe
for Achieving Goal
Achieved
0
50
100
FY16-17 FY 17-18 FY 18-19 FY 19-20 FY 20-21
Recycling Tonnage per 1000 Residents
Actual Target
0.00
1.00
2.00
3.00
4.00
FY16-17 FY17-18 FY18-19 FY19-20 FY20-21
Customer Complaints About Water Quality
Actual Target
51
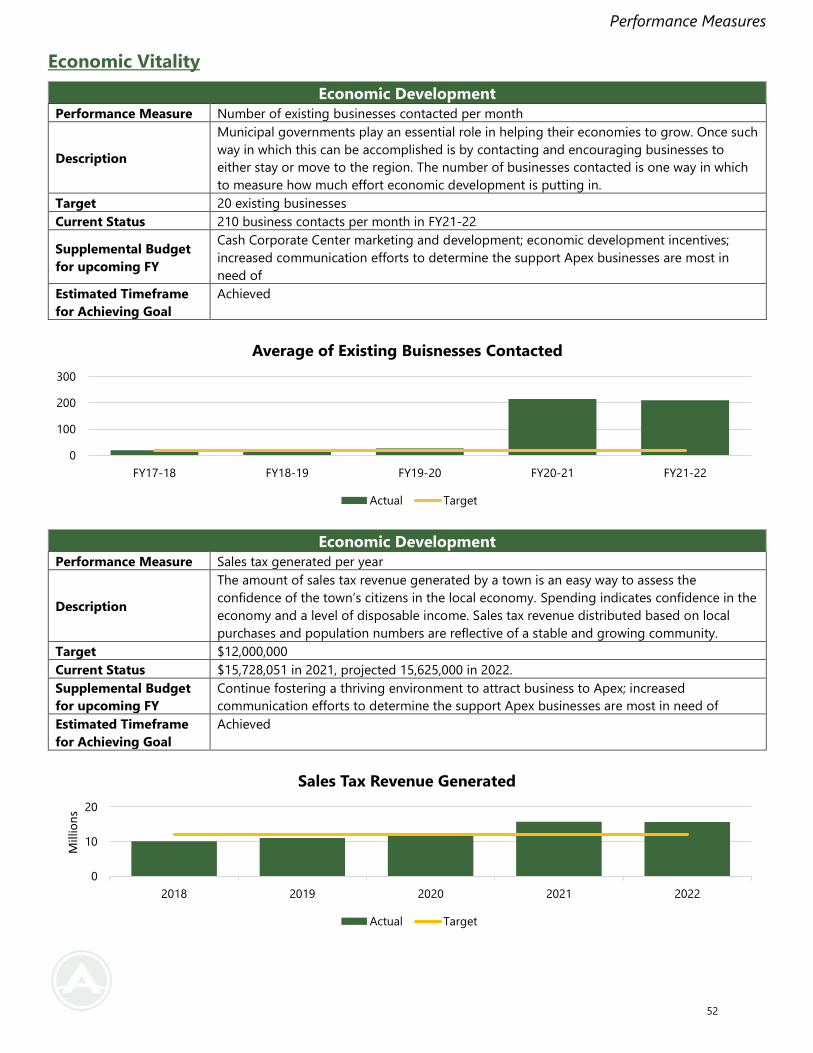
Performance Measures
Economic Vitality
Economic Development
Performance Measure Number of existing businesses contacted per month
Description
Municipal governments play an essential role in helping their economies to grow. Once such
way in which this can be accomplished is by contacting and encouraging businesses to
either stay or move to the region. The number of businesses contacted is one way in which
to measure how much effort economic development is putting in.
Target 20 existing businesses
Current Status 210 business contacts per month in FY21-22
Supplemental Budget
for upcoming FY
Cash Corporate Center marketing and development; economic development incentives;
increased communication efforts to determine the support Apex businesses are most in
need of
Estimated Timeframe
for Achieving Goal
Achieved
Economic Development
Performance Measure Sales tax generated per year
Description
The amount of sales tax revenue generated by a town is an easy way to assess the
confidence of the town’s citizens in the local economy. Spending indicates confidence in the
economy and a level of disposable income. Sales tax revenue distributed based on local
purchases and population numbers are reflective of a stable and growing community.
Target $12,000,000
Current Status $15,728,051 in 2021, projected 15,625,000 in 2022.
Supplemental Budget
for upcoming FY
Continue fostering a thriving environment to attract business to Apex; increased
communication efforts to determine the support Apex businesses are most in need of
Estimated Timeframe
for Achieving Goal
Achieved
0
100
200
300
FY17-18 FY18-19 FY19-20 FY20-21 FY21-22
Average of Existing Buisnesses Contacted
Actual Target
0
10
20
2018 2019 2020 2021 2022
Millions
Sales Tax Revenue Generated
Actual Target
52
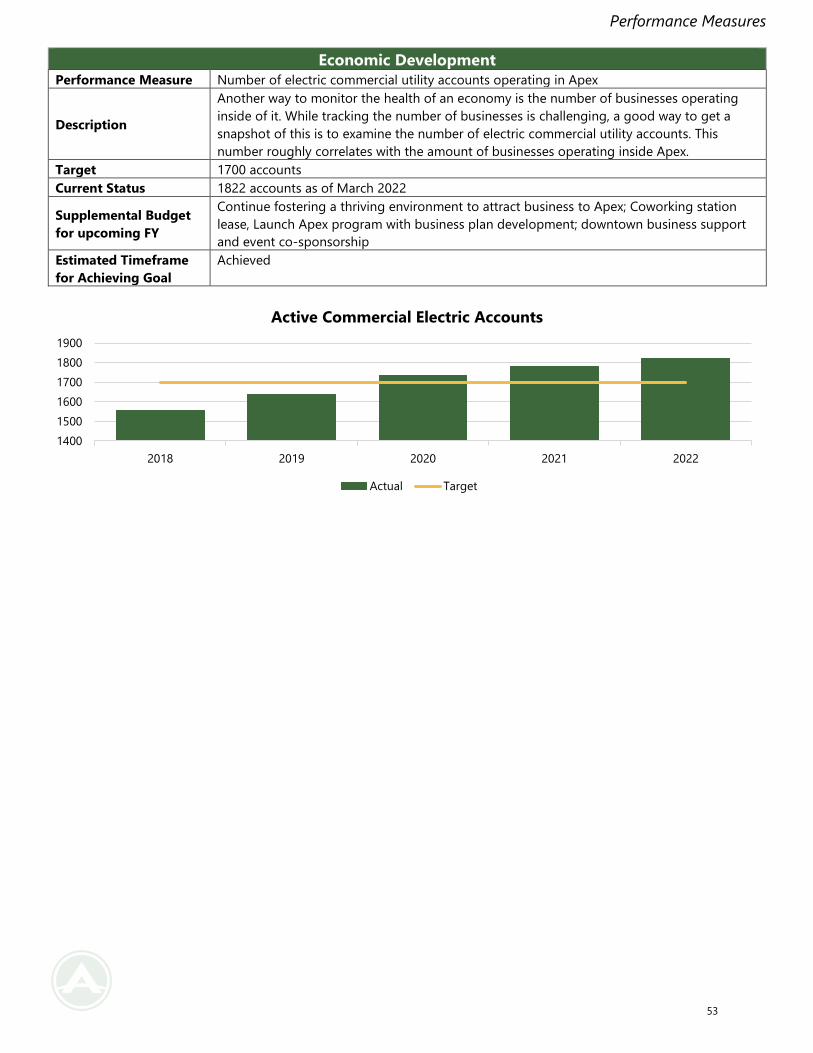
Performance Measures
Economic Development
Performance Measure Number of electric commercial utility accounts operating in Apex
Description
Another way to monitor the health of an economy is the number of businesses operating
inside of it. While tracking the number of businesses is challenging, a good way to get a
snapshot of this is to examine the number of electric commercial utility accounts. This
number roughly correlates with the amount of businesses operating inside Apex.
Target 1700 accounts
Current Status 1822 accounts as of March 2022
Supplemental Budget
for upcoming FY
Continue fostering a thriving environment to attract business to Apex; Coworking station
lease, Launch Apex program with business plan development; downtown business support
and event co-sponsorship
Estimated Timeframe
for Achieving Goal
Achieved
1400
1500
1600
1700
1800
1900
2018 2019 2020 2021 2022
Active Commercial Electric Accounts
Actual Target
53
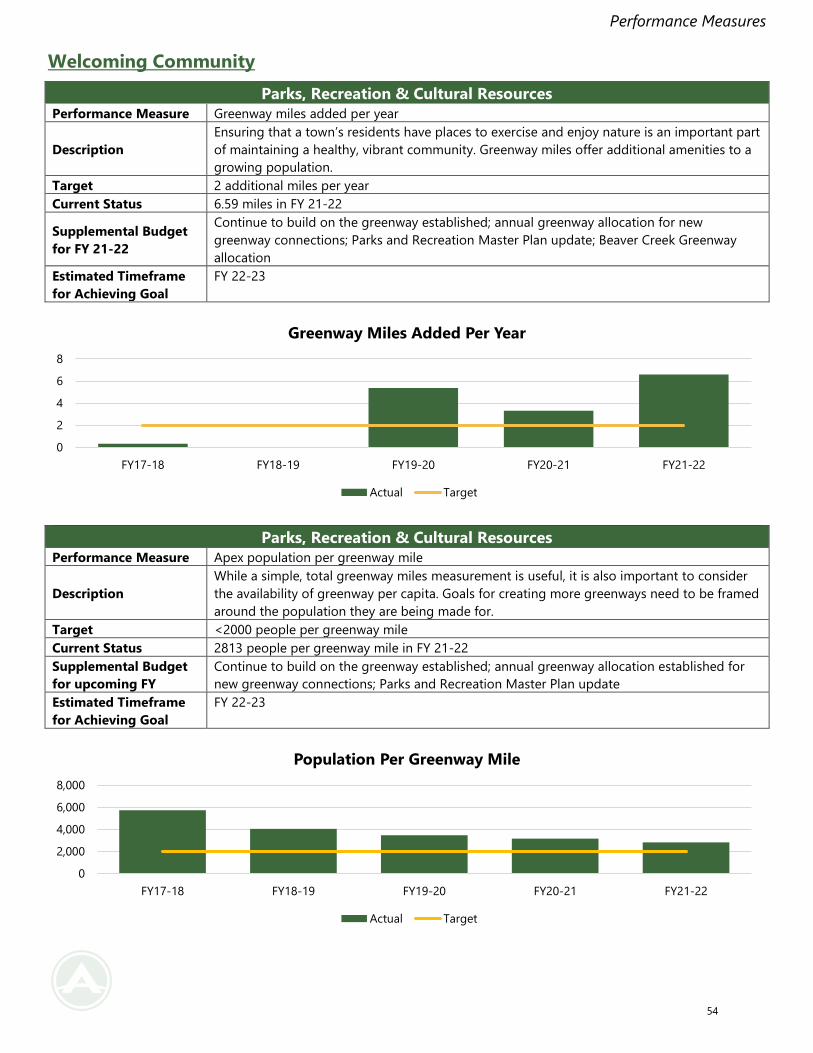
Performance Measures
Welcoming Community
Parks, Recreation & Cultural Resources
Performance Measure Greenway miles added per year
Description
Ensuring that a town’s residents have places to exercise and enjoy nature is an important part
of maintaining a healthy, vibrant community. Greenway miles offer additional amenities to a
growing population.
Target 2 additional miles per year
Current Status 6.59 miles in FY 21-22
Supplemental Budget
for FY 21-22
Continue to build on the greenway established; annual greenway allocation for new
greenway connections; Parks and Recreation Master Plan update; Beaver Creek Greenway
allocation
Estimated Timeframe
for Achieving Goal
FY 22-23
Parks, Recreation & Cultural Resources
Performance Measure Apex population per greenway mile
Description
While a simple, total greenway miles measurement is useful, it is also important to consider
the availability of greenway per capita. Goals for creating more greenways need to be framed
around the population they are being made for.
Target <2000 people per greenway mile
Current Status 2813 people per greenway mile in FY 21-22
Supplemental Budget
for upcoming FY
Continue to build on the greenway established; annual greenway allocation established for
new greenway connections; Parks and Recreation Master Plan update
Estimated Timeframe
for Achieving Goal
FY 22-23
0
2
4
6
8
FY17-18 FY18-19 FY19-20 FY20-21 FY21-22
Greenway Miles Added Per Year
Actual Target
0
2,000
4,000
6,000
8,000
FY17-18 FY18-19 FY19-20 FY20-21 FY21-22
Population Per Greenway Mile
Actual Target
54
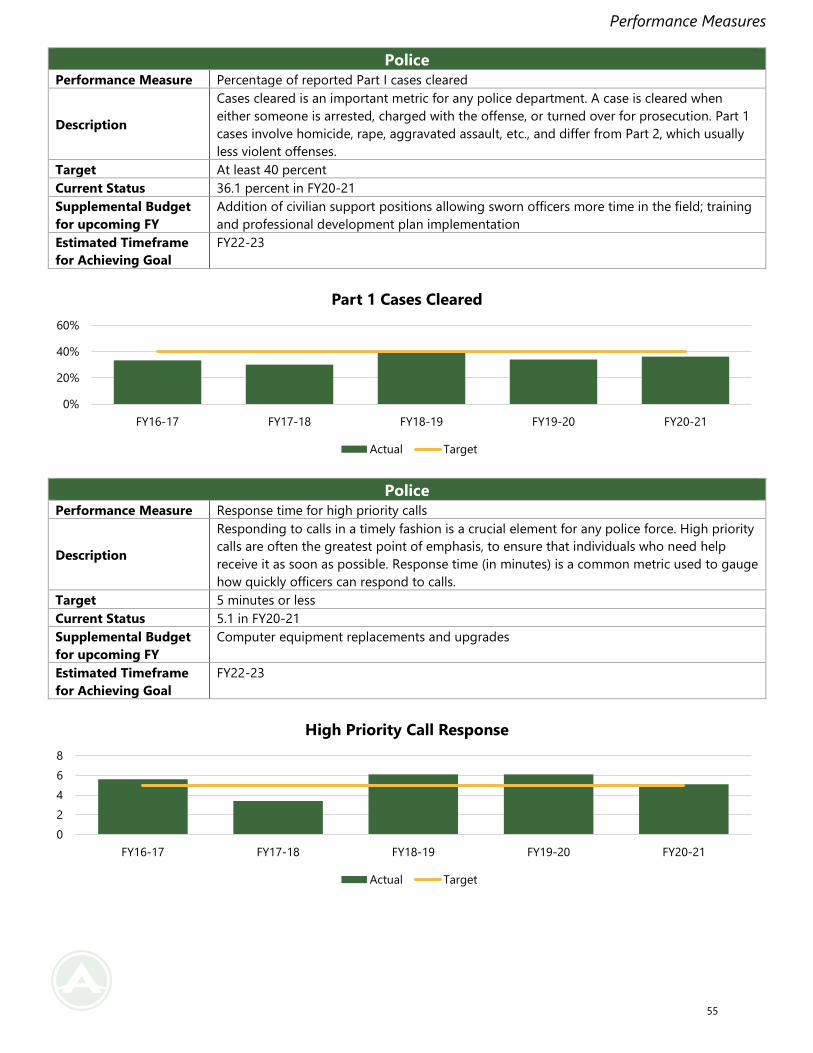
Performance Measures
Police
Performance Measure Percentage of reported Part I cases cleared
Description
Cases cleared is an important metric for any police department. A case is cleared when
either someone is arrested, charged with the offense, or turned over for prosecution. Part 1
cases involve homicide, rape, aggravated assault, etc., and differ from Part 2, which usually
less violent offenses.
Target At least 40 percent
Current Status 36.1 percent in FY20-21
Supplemental Budget
for upcoming FY
Addition of civilian support positions allowing sworn officers more time in the field; training
and professional development plan implementation
Estimated Timeframe
for Achieving Goal
FY22-23
Police
Performance Measure Response time for high priority calls
Description
Responding to calls in a timely fashion is a crucial element for any police force. High priority
calls are often the greatest point of emphasis, to ensure that individuals who need help
receive it as soon as possible. Response time (in minutes) is a common metric used to gauge
how quickly officers can respond to calls.
Target 5 minutes or less
Current Status 5.1 in FY20-21
Supplemental Budget
for upcoming FY
Computer equipment replacements and upgrades
Estimated Timeframe
for Achieving Goal
FY22-23
0%
20%
40%
60%
FY16-17 FY17-18 FY18-19 FY19-20 FY20-21
Part 1 Cases Cleared
Actual Target
0
2
4
6
8
FY16-17 FY17-18 FY18-19 FY19-20 FY20-21
High Priority Call Response
Actual Target
55
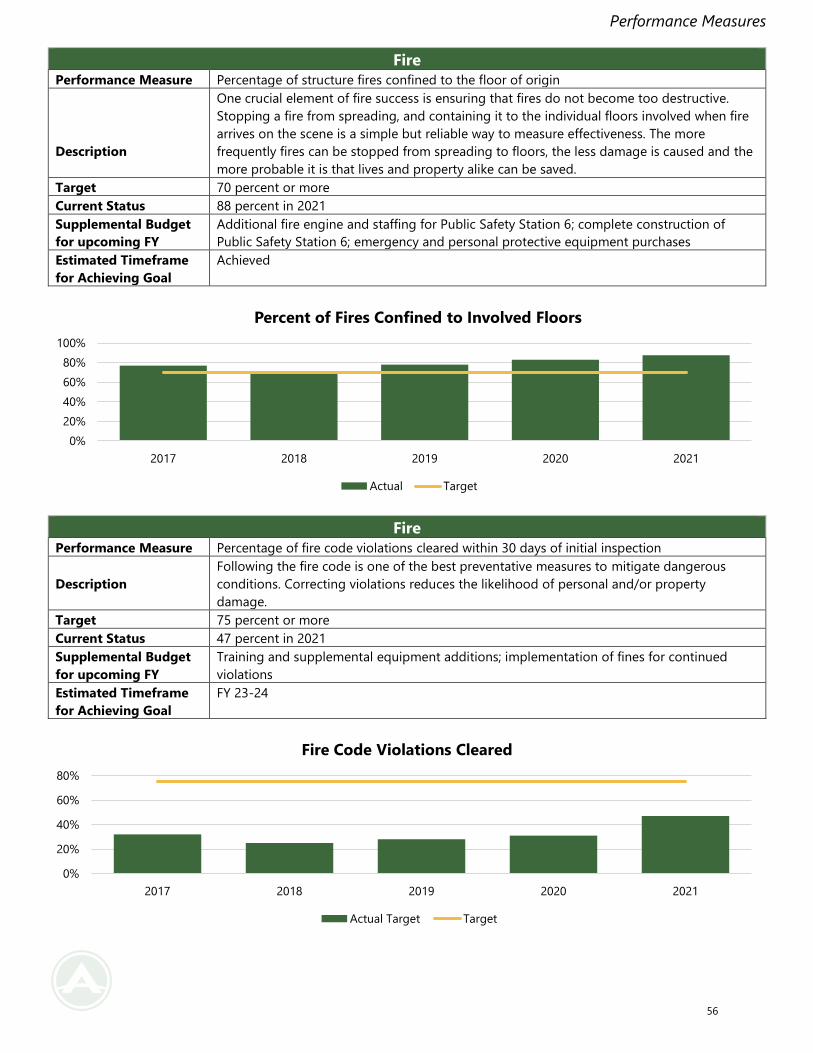
Performance Measures
Fire
Performance Measure Percentage of structure fires confined to the floor of origin
Description
One crucial element of fire success is ensuring that fires do not become too destructive.
Stopping a fire from spreading, and containing it to the individual floors involved when fire
arrives on the scene is a simple but reliable way to measure effectiveness. The more
frequently fires can be stopped from spreading to floors, the less damage is caused and the
more probable it is that lives and property alike can be saved.
Target 70 percent or more
Current Status 88 percent in 2021
Supplemental Budget
for upcoming FY
Additional fire engine and staffing for Public Safety Station 6; complete construction of
Public Safety Station 6; emergency and personal protective equipment purchases
Estimated Timeframe
for Achieving Goal
Achieved
Fire
Performance Measure Percentage of fire code violations cleared within 30 days of initial inspection
Description
Following the fire code is one of the best preventative measures to mitigate dangerous
conditions. Correcting violations reduces the likelihood of personal and/or property
damage.
Target 75 percent or more
Current Status 47 percent in 2021
Supplemental Budget
for upcoming FY
Training and supplemental equipment additions; implementation of fines for continued
violations
Estimated Timeframe
for Achieving Goal
FY 23-24
0%
20%
40%
60%
80%
100%
2017 2018 2019 2020 2021
Percent of Fires Confined to Involved Floors
Actual Target
0%
20%
40%
60%
80%
2017 2018 2019 2020 2021
Fire Code Violations Cleared
Actual Target Target
56
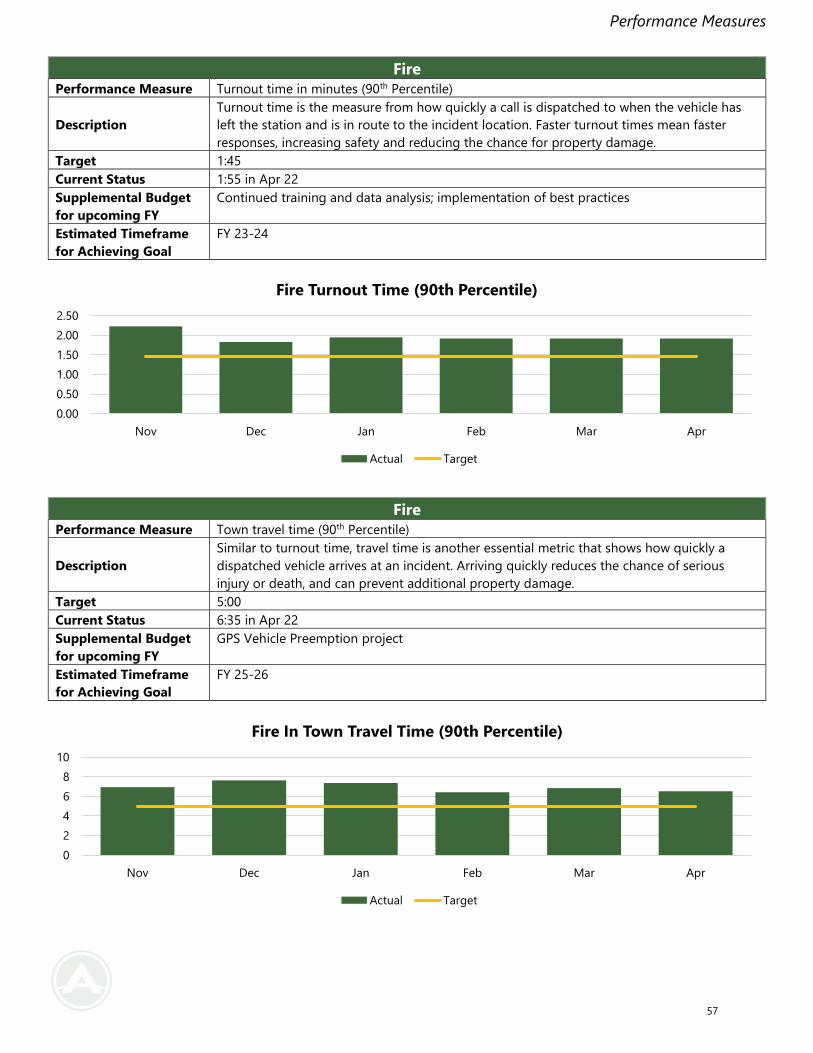
Performance Measures
Fire
Performance Measure Turnout time in minutes (90th Percentile)
Description
Turnout time is the measure from how quickly a call is dispatched to when the vehicle has
left the station and is in route to the incident location. Faster turnout times mean faster
responses, increasing safety and reducing the chance for property damage.
Target 1:45
Current Status 1:55 in Apr 22
Supplemental Budget
for upcoming FY
Continued training and data analysis; implementation of best practices
Estimated Timeframe
for Achieving Goal
FY 23-24
Fire
Performance Measure Town travel time (90th Percentile)
Description
Similar to turnout time, travel time is another essential metric that shows how quickly a
dispatched vehicle arrives at an incident. Arriving quickly reduces the chance of serious
injury or death, and can prevent additional property damage.
Target 5:00
Current Status 6:35 in Apr 22
Supplemental Budget
for upcoming FY
GPS Vehicle Preemption project
Estimated Timeframe
for Achieving Goal
FY 25-26
0.00
0.50
1.00
1.50
2.00
2.50
Nov Dec Jan Feb Mar Apr
Fire Turnout Time (90th Percentile)
Actual Target
0
2
4
6
8
10
Nov Dec Jan Feb Mar Apr
Fire In Town Travel Time (90th Percentile)
Actual Target
57
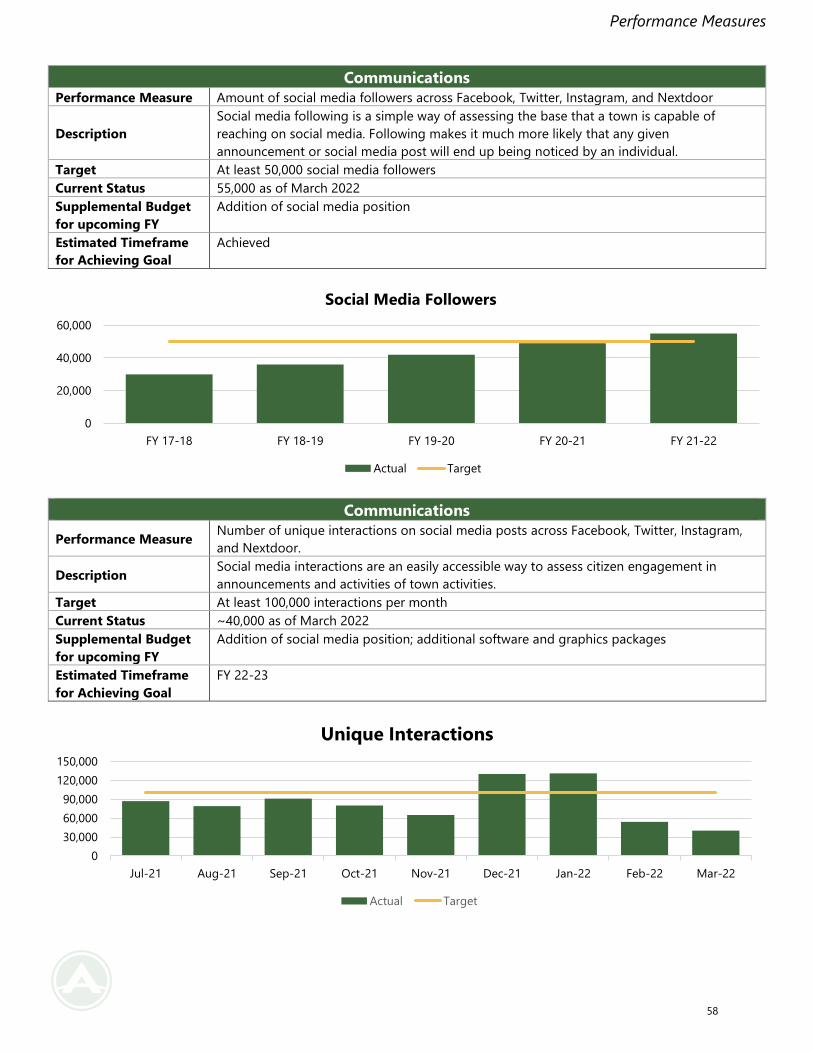
Performance Measures
Communications
Performance Measure Amount of social media followers across Facebook, Twitter, Instagram, and Nextdoor
Description
Social media following is a simple way of assessing the base that a town is capable of
reaching on social media. Following makes it much more likely that any given
announcement or social media post will end up being noticed by an individual.
Target At least 50,000 social media followers
Current Status 55,000 as of March 2022
Supplemental Budget
for upcoming FY
Addition of social media position
Estimated Timeframe
for Achieving Goal
Achieved
Communications
Performance Measure Number of unique interactions on social media posts across Facebook, Twitter, Instagram,
and Nextdoor.
Description Social media interactions are an easily accessible way to assess citizen engagement in
announcements and activities of town activities.
Target At least 100,000 interactions per month
Current Status ~40,000 as of March 2022
Supplemental Budget
for upcoming FY
Addition of social media position; additional software and graphics packages
Estimated Timeframe
for Achieving Goal
FY 22-23
0
20,000
40,000
60,000
FY 17-18 FY 18-19 FY 19-20 FY 20-21 FY 21-22
Social Media Followers
Actual Target
0
30,000
60,000
90,000
120,000
150,000
Jul-21 Aug-21 Sep-21 Oct-21 Nov-21 Dec-21 Jan-22 Feb-22 Mar-22
Unique Interactions
Actual Target
58
Financial Policies
Fiscal Policy Guidelines
This fiscal policy is a statement of the guidelines and goals that will influence and guide the financial management practice
of the Town of Apex, North Carolina. A fiscal policy that is adopted, adhered to, and regularly reviewed is recognized as the
cornerstone of sound financial management.
Effective Fiscal Policy:
- Contributes significantly to the Town's ability to insulate itself from fiscal crisis,
- Enhances short term and long term financial credit ability by helping to achieve the highest credit and bond ratings
possible,
- Promotes long-term financial stability by establishing clear and consistent guidelines,
- Directs attention to the total financial picture of the Town rather than single issue areas,
- Promotes the view of linking long-run financial planning with day to day operations, and
- Provides the Town Council, citizens, and the Town's professional management a framework for measuring the fiscal
impact of government services against established fiscal parameters and guidelines.
To these ends, the following fiscal policy statements are presented.
Balanced Budget
- Pursuant to North Carolina General Statutes (N.C.G.S.) 159‐11, the Town will adopt a balanced budget. The North
Carolina Local Government Budget and Fiscal Control Act defines a balanced budget as the sum of estimated net
revenues and appropriated fund balance in each fund is equal to appropriations in that fund.
Budget Development Policies
- The Town will develop the Annual Budget in conjunction with a stated program of performance objectives and measures
with which to gauge progress toward meeting those objectives.
- Water, sewer, and electric rates will be established at the appropriate level to enable the related funds to be self-
supporting.
- One-time or other special revenues will not be used to finance continuing Town operations but instead will be used for
funding special projects.
- The Town will pursue an aggressive policy seeking the collection of delinquent utility, license, permit, and other fees
due to the Town.
- The Town Council will receive a financial report at the end of each quarter showing year-to-date revenues and
expenditures and comparing each amount to the budget as amended.
59
Financial Policies
Cash Management and Investment Policies
- It is the intent of the Town that public funds will be invested to the extent possible to reduce the need for property tax
revenues. Funds will be invested with the chief objectives of safety of principal, liquidity, and yield, in that order. All
deposits and investments of Town funds will be in accordance with N.C.G.S. 159.
- The Town will use a Central Depository to maximize the availability and mobility of cash for all funds that can be legally
and practically combined.
- Cash Flows will be forecasted and investments will be made to mature when funds are projected to be needed to meet
cash flow requirements.
- The Town shall aim to maintain an Operating Reserve equal to or greater than 90 Days Cash on Hand (DCOH) for both
the Electric Fund and the Water & Sewer Fund. DCOH represents the number of days the Town can continue paying its
operating expensive with current cash reserves. This indicates when rates need to be adjusted and provides a picture of
each fund’s financial health. DCOH shall be calculated after the audit is completed and based upon the information in
the audited financial statements. DCOH is calculated as follows: Unrestricted cash and liquid investments times 365
divided by operating and maintenance expenses, which is expressed in days.
- Liquidity: No less than 20 percent of funds available for investment will be maintained in liquid investments at any point
in time.
- Maturity: All investments will mature in no more than thirty-six (36) months from their purchase date.
- Custody: All investments will be purchased "payment-versus-delivery" and if certificated will be held by the Finance
Officer in the name of the Town. All non-certificated investment will be held in book-entry form in the name of the Town
with the Town's third party Custodian (Safekeeping Agent).
- Authorized Investments: The Town may deposit Town Funds into any Board approved Official Depository, if such funds
are secured in accordance with N.C.G.S. 159(31). The Town may invest Town Funds in the North Carolina Capital
Management Trust, US Treasury Securities, US Agency Securities specifically authorized in N.C.G.S. 159 and rated no
lower than "AAA", and Commercial Paper meeting the requirements of N.C.G.S. 159 plus having a national bond rating.
- Diversification: No more than 5 percent of the Town's investment funds may be invested in a specific company's
commercial paper and no more than 20 percent of the Town's investment funds may be invested in commercial paper.
No more than 25 percent of the Town's investments may be invested in any one US Agency's Securities.
- Allocation: Investment income will be allocated to each participating fund or account based on a fair and equitable
formula determined by the Finance Director.
- Reporting: The Town Council will receive copies of the Town's "Report of Deposits and Investments" (LGC Form 203)
filed semiannually with the Local Government Commission.
Capital Improvement Budget Policies
- The Town will prioritize all capital improvements in accordance with an adopted capital improvement program.
- The Town will develop a five-year, with horizon, plan for capital improvements and review and update the plan annually.
60
Financial Policies
- The Town will coordinate development of the capital improvement program with development of the operating budget.
- The Town will use intergovernmental assistance to finance only those capital improvements that are consistent with the
capital improvement plan and Town priorities.
- The Town will maintain all its assets at a level adequate to protect the Town's capital investment and to minimize future
maintenance and replacement costs.
- The Town will identify the estimated costs and potential funding sources for each capital project proposal before it is
submitted for approval.
- The Town will attempt to determine the least costly and most flexible financing method for all new projects.
Debt Policies
General
- The Town will confine long-term borrowing to capital improvement or projects that cannot be financed from current
revenues except where approved justification is provided.
- The Town will utilize a balanced approach to capital funding utilizing debt financing, draws on capital reserves and/or
fund balances in excess of policy targets, and current-year (pay-as-you-go) appropriations.
- When the Town finances capital improvements or other projects by issuing bonds or entering into capital leases, it will
repay the debt within a period not to exceed the expected useful life of the project. Target debt ratios will be annually
calculated and included in the review of financial trends.
- Where feasible, the Town will explore the usage of special assessment, revenue, or other self-supporting bonds instead
of general obligation bonds.
- The Town will retire tax anticipation debt, if any, annually and will retire bond anticipation debt within six months after
completion of the project.
Tax Supported Debt
- Net debt as a percentage of total assessed value of taxable property should not exceed 2.5 percent. Net debt is defined
as any and all debt that is tax-supported.
- The ratio of debt service expenditures as a percent of total governmental fund expenditures should not exceed 12
percent with an aggregate ten-year principal payout ratio target of 55 percent or better.
Purchasing Policy
- The Town will create purchases orders for purchases of goods or services over $2,500 prior to creating an obligation by
contract or order placement.
- The Town’s procurement and vendor cards will be used when the purchase does not exceed the transaction limits for a
purchase order.
61
Financial Policies
- The Town will follow the guidelines for all formal and informal bids for qualifying apparatus, supplies, materials and
equipment and construction contracts.
- Purchases must be necessary to perform the scope of work and must avoid acquisition of unnecessary or duplicative
items.
- Strategic sourcing is considered with other departments and/or agencies who have similar needs to consolidate
procurements and services to obtain better pricing.
- Documentation will be maintained detailing the history of all procurements.
Reserve Policies
- Unassigned Fund Balances will mean funds that remain available for appropriation by the Town Council after all
commitments for future expenditures, required reserves defined by State statutes, and previous Council designations
have been calculated. The Town will define these remaining amounts as "available fund balances."
- Available fund balances at the close of each fiscal year should be at least 25 percent of the total Annual Operating
Budget of the Town.
- The Town Council may, from time-to-time, appropriate fund balances that will reduce available fund balances below the
25 percent policy for the purposes of a declared fiscal emergency or other such global purpose as to protect the long-
term fiscal security of the Town of Apex. In such circumstances, the Council will adopt a plan to restore the available
fund balances to the policy level within 36 months from the date of the appropriation. If restoration cannot be
accomplished within such time period without severe hardship to the Town, then the Council will establish a different
but appropriate time period.
62
Financial Management System
Reporting Entity
The Town of Apex is a municipal corporation that is governed by an elected mayor and a five-member council. As required
by generally accepted accounting principles, financial statements present all funds and account groups that are controlled
by or financially dependent upon the Town.
Basis of Presentation
The accounts of the Town are organized and operated on the basis of funds. A fund is an independent fiscal and accounting
entity with a self-balancing set of accounts comprised of assets, liabilities, fund equity, revenues, and expenditures or
expenses as appropriate. Fund accounting segregates funds according to their intended purpose and it is used to aid
management in demonstrating compliance with finance-related legal and contractual provisions.
Governmental Funds
Governmental funds account for the Town’s governmental functions. The Town of Apex’s governmental funds include:
General Fund. The General Fund is the largest and most important governmental fund and the only governmental fund
considered a major fund. It is the primary operating fund of the Town. Any transaction that cannot be accounted for in
another fund is recorded in the General Fund. The primary revenue sources are ad valorem taxes, state-collected revenues,
and various other taxes and licenses. The primary expenditures are for general government, public safety, and public works
services.
Special Revenue Funds. Special Revenue Funds are used to account for the proceeds of specific revenue sources (other than
expendable trusts or major capital projects) that are legally restricted to expenditures for specified purposes. The Town’s
special revenue funds include the Affordable Housing Fund, Police State Funds, Police Federal Funds, Police Donations, Fire
Donations, and Eva Perry Library Fund.
Permanent Funds. Permanent funds are used to report resources that are restricted to the extent that only earnings, not
principal, may be used for purposes that support the Town's programs. The Cemetery Fund is the Town’s only permanent
fund and it accounts for funds reserved for the perpetual care of the municipal cemetery.
Capital Project Funds. Various Capital Project funds are used to account for financial resources to be used for non-major
acquisitions or construction. The Town maintains capital reserve funds for Fire, Recreation, and Transportation.
Proprietary Funds
Proprietary funds account for the Town’s business-like activities. There are two types of proprietary funds- enterprise funds
and internal service funds. Enterprise funds account for operations that are financed and operated in a manner similar to
private business enterprises. Internal service funds are similar to enterprise funds except they account for services performed
by one department for another. The Town has two enterprise funds and one internal service fund.
Electric Fund. This fund is used to account for the Town’s electric operations. The major revenue source in this fund is electric
user charges.
Water & Sewer Fund. This fund is used to account for the Town’s water and sewer operations. The major revenue sources in
this fund are water and sewer user charges. The Town also maintains a Water & Sewer Capital Reserve Fund that receives
revenue from capital reimbursement fees.
63
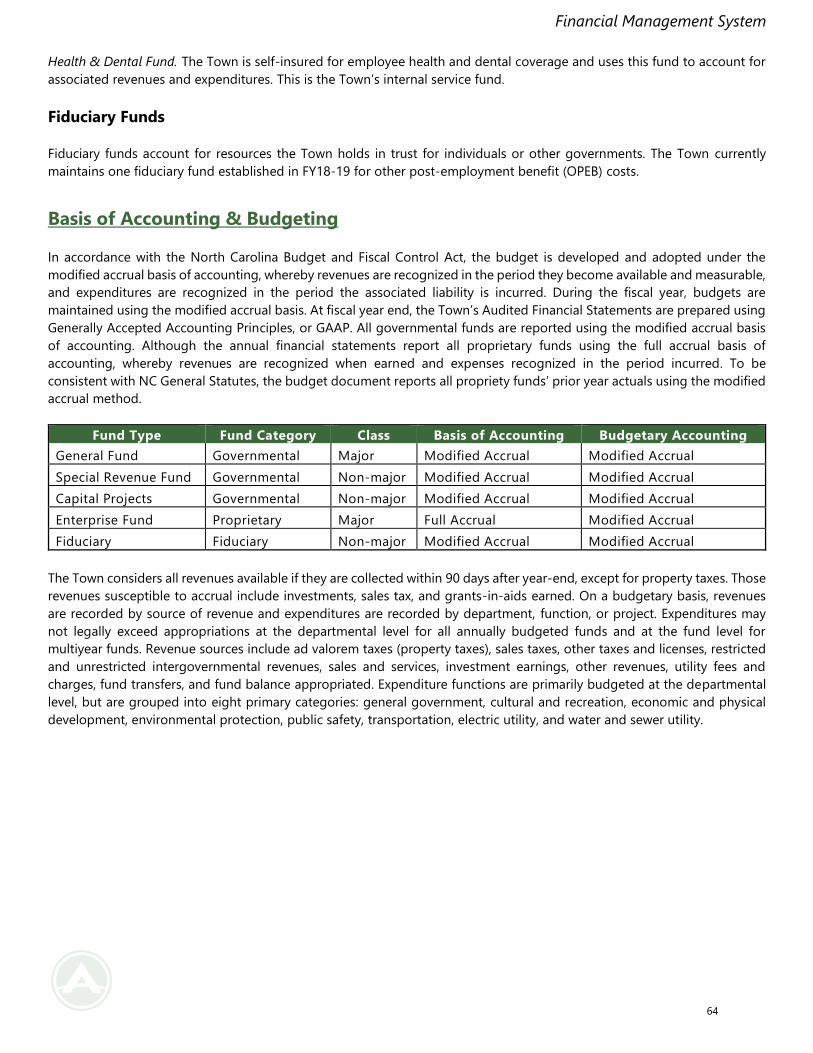
Financial Management System
Health & Dental Fund. The Town is self-insured for employee health and dental coverage and uses this fund to account for
associated revenues and expenditures. This is the Town’s internal service fund.
Fiduciary Funds
Fiduciary funds account for resources the Town holds in trust for individuals or other governments. The Town currently
maintains one fiduciary fund established in FY18-19 for other post-employment benefit (OPEB) costs.
Basis of Accounting & Budgeting
In accordance with the North Carolina Budget and Fiscal Control Act, the budget is developed and adopted under the
modified accrual basis of accounting, whereby revenues are recognized in the period they become available and measurable,
and expenditures are recognized in the period the associated liability is incurred. During the fiscal year, budgets are
maintained using the modified accrual basis. At fiscal year end, the Town’s Audited Financial Statements are prepared using
Generally Accepted Accounting Principles, or GAAP. All governmental funds are reported using the modified accrual basis
of accounting. Although the annual financial statements report all proprietary funds using the full accrual basis of
accounting, whereby revenues are recognized when earned and expenses recognized in the period incurred. To be
consistent with NC General Statutes, the budget document reports all propriety funds’ prior year actuals using the modified
accrual method.
Fund Type Fund Category Class Basis of Accounting Budgetary Accounting
General Fund Governmental Major Modified Accrual Modified Accrual
Special Revenue Fund Governmental Non-major Modified Accrual Modified Accrual
Capital Projects Governmental Non-major Modified Accrual Modified Accrual
Enterprise Fund Proprietary Major Full Accrual Modified Accrual
Fiduciary Fiduciary Non-major Modified Accrual Modified Accrual
The Town considers all revenues available if they are collected within 90 days after year-end, except for property taxes. Those
revenues susceptible to accrual include investments, sales tax, and grants-in-aids earned. On a budgetary basis, revenues
are recorded by source of revenue and expenditures are recorded by department, function, or project. Expenditures may
not legally exceed appropriations at the departmental level for all annually budgeted funds and at the fund level for
multiyear funds. Revenue sources include ad valorem taxes (property taxes), sales taxes, other taxes and licenses, restricted
and unrestricted intergovernmental revenues, sales and services, investment earnings, other revenues, utility fees and
charges, fund transfers, and fund balance appropriated. Expenditure functions are primarily budgeted at the departmental
level, but are grouped into eight primary categories: general government, cultural and recreation, economic and physical
development, environmental protection, public safety, transportation, electric utility, and water and sewer utility.
64
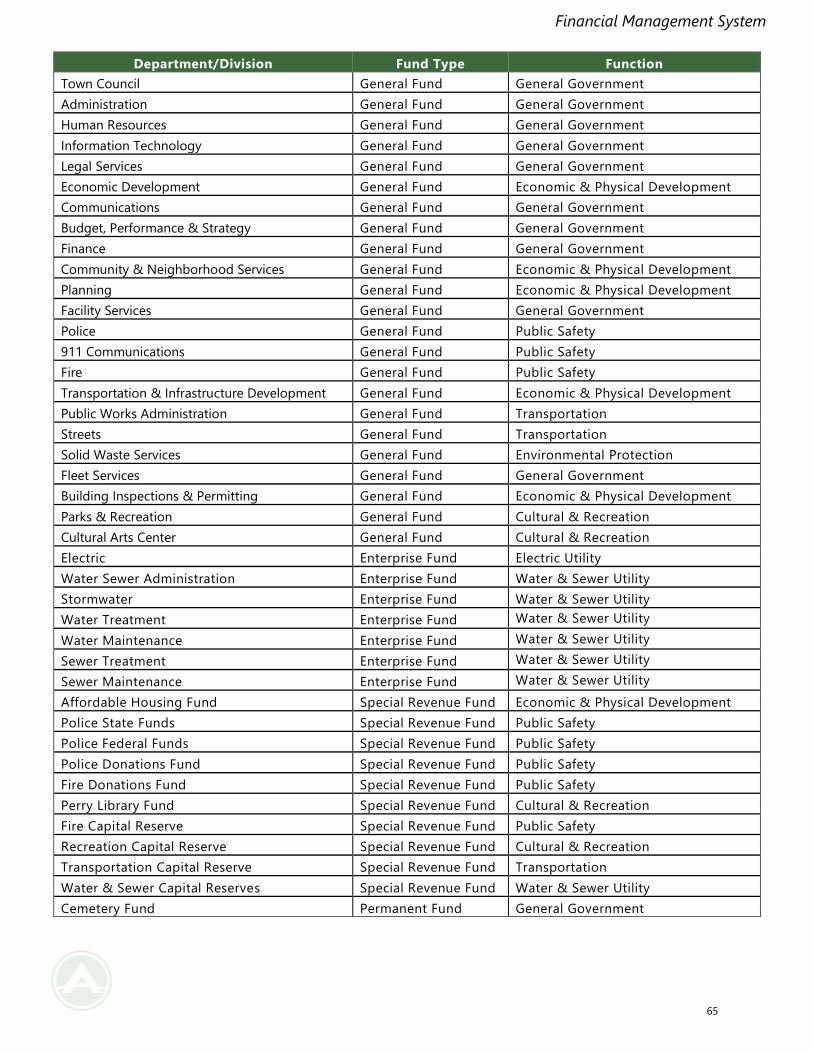
Financial Management System
Department/Division Fund Type Function
Town Council General Fund General Government
Administration General Fund General Government
Human Resources General Fund General Government
Information Technology General Fund General Government
Legal Services General Fund General Government
Economic Development General Fund Economic & Physical Development
Communications General Fund General Government
Budget, Performance & Strategy General Fund General Government
Finance General Fund General Government
Community & Neighborhood Services General Fund Economic & Physical Development
Planning General Fund Economic & Physical Development
Facility Services General Fund General Government
Police General Fund Public Safety
911 Communications General Fund Public Safety
Fire General Fund Public Safety
Transportation & Infrastructure Development General Fund Economic & Physical Development
Public Works Administration General Fund Transportation
Streets General Fund Transportation
Solid Waste Services General Fund Environmental Protection
Fleet Services General Fund General Government
Building Inspections & Permitting General Fund Economic & Physical Development
Parks & Recreation General Fund Cultural & Recreation
Cultural Arts Center General Fund Cultural & Recreation
Electric Enterprise Fund Electric Utility
Water Sewer Administration Enterprise Fund Water & Sewer Utility
Stormwater Enterprise Fund Water & Sewer Utility
Water Treatment Enterprise Fund Water & Sewer Utility
Water Maintenance Enterprise Fund Water & Sewer Utility
Sewer Treatment Enterprise Fund Water & Sewer Utility
Sewer Maintenance Enterprise Fund Water & Sewer Utility
Affordable Housing Fund Special Revenue Fund Economic & Physical Development
Police State Funds Special Revenue Fund Public Safety
Police Federal Funds Special Revenue Fund Public Safety
Police Donations Fund Special Revenue Fund Public Safety
Fire Donations Fund Special Revenue Fund Public Safety
Perry Library Fund Special Revenue Fund Cultural & Recreation
Fire Capital Reserve Special Revenue Fund Public Safety
Recreation Capital Reserve Special Revenue Fund Cultural & Recreation
Transportation Capital Reserve Special Revenue Fund Transportation
Water & Sewer Capital Reserves Special Revenue Fund Water & Sewer Utility
Cemetery Fund Permanent Fund General Government
65
Financial Management System
Budgetary Data
Town Council adopts the budget as required by the North Carolina General Statutes. An annual budget is adopted for the
General Fund, Electric Fund, Water & Sewer Fund, and Special Revenue Funds. All annual appropriations lapse at the fiscal
year-end. Project ordinances are adopted for the Capital Project Funds. Expenditures may not legally exceed appropriations
at the department level for all annually budgeted funds. Upon Town Council’s adoption of the budget ordinance, the Budget
Officer has the authority to reallocate fund appropriations for expenditures as he or she deems necessary, provided such
reallocations do not increase or decrease the total budget for any fund. Town Council must approve all amendments that
increase or decrease the total budget for any fund. If necessary, Town Council must adopt an interim budget that covers the
period from July 1 until the annual budget ordinance can be adopted.
Budget Calendar
North Carolina General Statutes 159-10 through 159-13 set forth requirements for a budget calendar to denote specific
days on which certain steps of the budget process are to be performed. The Town’s complete budget calendar can be viewed
under the Budget Calendar section of the budget document.
N.C.G.S. prescribed dates:
N.C.G.S. 159-10
Before April 30 of each fiscal year (or an earlier date fixed by the budget officer), each department head shall transmit to the
budget officer the budget requests and revenue estimates for his department for the budget year.
N.C.G.S. 159-11 (b)
The budget with a budget message shall be submitted to the governing board no later than June 1.
N.C.G.S. 159-1 (a)
Not earlier than 10 days after the day the budget is presented to the board and not later than July 1, the governing board
shall adopt a budget ordinance making appropriations and levying taxes for the budget year in such sums as the board may
consider sufficient and proper, whether greater or less than the sums recommended in the budget.
66
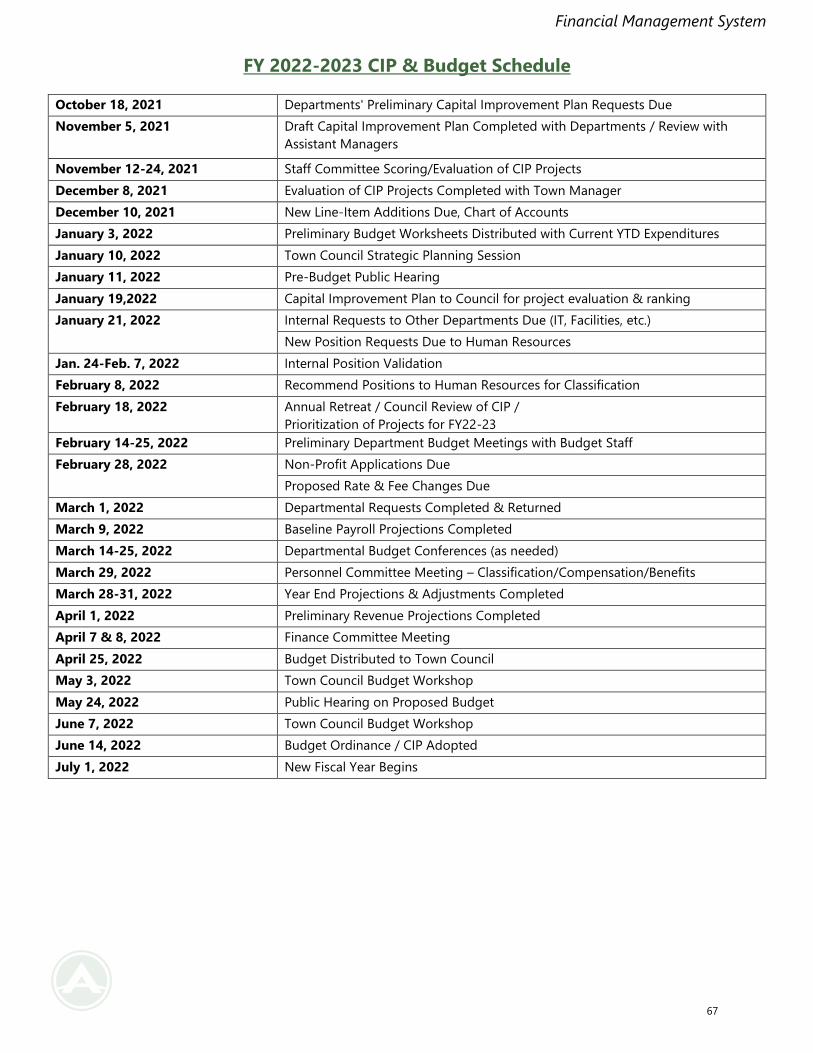
Financial Management System
FY 2022-2023 CIP & Budget Schedule
October 18, 2021 Departments' Preliminary Capital Improvement Plan Requests Due
November 5, 2021 Draft Capital Improvement Plan Completed with Departments / Review with
Assistant Managers
November 12-24, 2021 Staff Committee Scoring/Evaluation of CIP Projects
December 8, 2021 Evaluation of CIP Projects Completed with Town Manager
December 10, 2021 New Line-Item Additions Due, Chart of Accounts
January 3, 2022 Preliminary Budget Worksheets Distributed with Current YTD Expenditures
January 10, 2022 Town Council Strategic Planning Session
January 11, 2022 Pre-Budget Public Hearing
January 19,2022 Capital Improvement Plan to Council for project evaluation & ranking
January 21, 2022 Internal Requests to Other Departments Due (IT, Facilities, etc.)
New Position Requests Due to Human Resources
Jan. 24-Feb. 7, 2022 Internal Position Validation
February 8, 2022 Recommend Positions to Human Resources for Classification
February 18, 2022 Annual Retreat / Council Review of CIP /
Prioritization of Projects for FY22-23
February 14-25, 2022 Preliminary Department Budget Meetings with Budget Staff
February 28, 2022 Non-Profit Applications Due
Proposed Rate & Fee Changes Due
March 1, 2022 Departmental Requests Completed & Returned
March 9, 2022 Baseline Payroll Projections Completed
March 14-25, 2022 Departmental Budget Conferences (as needed)
March 29, 2022 Personnel Committee Meeting – Classification/Compensation/Benefits
March 28-31, 2022 Year End Projections & Adjustments Completed
April 1, 2022 Preliminary Revenue Projections Completed
April 7 & 8, 2022 Finance Committee Meeting
April 25, 2022 Budget Distributed to Town Council
May 3, 2022 Town Council Budget Workshop
May 24, 2022 Public Hearing on Proposed Budget
June 7, 2022 Town Council Budget Workshop
June 14, 2022 Budget Ordinance / CIP Adopted
July 1, 2022 New Fiscal Year Begins
67
Budget Process
Budget Process
The importance of the budget cannot be overstated. The budget document outlines policy direction, guides management
decisions, and provides citizens with an understanding of how the Town uses public money, establishing accountability. The
Town operates under an annual budget ordinance adopted by the Town Council in accordance with the provisions of
N.C.G.S. 159, also known as the Local Government Budget and Fiscal Control Act (LGBFCA). The Town Council must adopt a
balanced budget before the start of the fiscal year on July 1. Five phases shape the budget process: 1) goal setting and
direction, 2) preparation and requests, 3) adoption, 4) implementation, and 5) summary of transactions.
Goal Setting, Direction & Community Engagement
Because the budget is such an important tool, it is important that clear goals and direction be established before actual
preparation begins. Receiving public input is a key component for Town Council and staff in setting goals. A public hearing
in December each year provides the first opportunity for citizen input regarding development of the annual budget. Citizens
also have the ability to submit feedback regarding the budget via email or online throughout the year.
The Town’s budget engagement process was designed to inform the public on the budget process and to collect feedback
to help shape budget recommendations and ensure alignment with the priorities set by Town Council and reflect community
goals. The town’s engagement campaign leveraged digital and in person opportunities of key materials to inform the public
of the budget process and encourage participation in providing meaningful feedback. Key public touchpoints included
community meetings and a resident budget priorities survey.
Throughout the year Town Administration held a variety of neighborhood meetings and downtown meetings to gain
feedback from the community. Town staff, including the Town Manager and Assistant Town Managers were available to
answer questions and provide information on town services and how to stay connected throughout the budget process.
The annual resident budget priorities survey was designed by the Budget, Performance & Strategy department and
distributed with the help of the Communications team. The purpose of creating the resident budget priorities survey was to
gain constructive insights into the budgeting preferences of those who work, live, and play in the Town of Apex with the
goal of gaining input from a larger number of residents than it typically reaches during its two annual budget hearings. With
413 survey responses, the Town was able to successfully gain a broader understanding of picture of the needs and desires
of Apex residents. The results of the survey were presented to Town Council at their annual Budget Retreat in February.
More information and survey and results can be found under the CIP Process Section of the CIP document located in the
Supplemental Information section.
Town Council conducts a strategic planning retreat in January to review the Town’s vision, mission, and strategic goals. In
February, Town Council takes part in a retreat with town staff to evaluate Town Council’s existing goals and directives and
to discuss any needed changes to those goals. By establishing a clear vision, mission, goals, and directives, Town Council
provides town staff with direction in setting priorities that help guide budget formulation. Assisting in providing direction
during budget development are two Town Council committees- the Personnel Committee and the Finance Committee. Both
of these committees meet with budget staff periodically between the February retreat and the initial budget submission in
April. Additionally, Town Council and staff meet in another workshop setting in early April to discuss a draft of the proposed
budget. The purpose of this meeting is to review alignment of the budget with the goals and directives and to address other
priorities that may have arisen after department directors submitted their requests and staff developed a preliminary budget.
Preparation & Requests
Preparation for the Town budget begins in September with planning for the Capital Improvement Plan (CIP). Department
directors meet with their staff to determine the capital needs within each division. Department directors are responsible for
68
Budget Process
completing the appropriate CIP project forms and submitting their requests by the middle of October. Once CIP requests
are made, budget staff and the Finance department work to develop revenue and expenditure projections to estimate the
CIP effects on the Town’s operating budget and financial condition. The budget team meets with the Finance Director and
Town Manager to prioritize the projects and determine when and how to finance them within the CIP. In early January, town
staff presents the CIP to Town Council to receive feedback and further direction in developing the final CIP.
At the beginning of January, budget staff provides each department with a budget packet containing their current operating
budget, budget worksheets and instructions. Department directors are responsible for estimating departmental
expenditures and submitting their requests and proposed departmental budgets by March 1. The Finance department
develops revenue estimates and meets with the Town Manager and budget staff to begin determining department
allocations. Allocations are based on Town Council priorities and maintaining core services. Once the Town Manager, in
conjunction with the budget staff, develops a balanced budget in early April, they present it to Town Council to discuss at a
budget workshop in order to receive feedback and direction. After the workshop, the Town Manager makes the necessary
revisions and submits the budget to Town Council for a public hearing at a Town Council meeting in May to receive citizen
input. After receiving citizen feedback, Town Council may deem it necessary to conduct another workshop in mid-May. After
the public hearing and subsequent workshop, budget staff makes the final revisions and Town Council approves the budget
at the first council meeting in June.
Adoption
At their first June meeting, Town Council officially adopts the budget by approving a budget ordinance. The budget
ordinance establishes the spending limits for each department in the upcoming fiscal year. The adopted budget document
is a guide that provides Town Council and management staff with a mechanism for evaluating budgetary and organizational
performance.
Implementation
Once the budget is adopted, departments have the ability to submit requisitions and obtain purchase orders from the
Finance department. The purchase orders represent the specific amount of money each department is spending for a specific
item or service to perform town services. The implementation phase may also include budget transfers and budget
amendments throughout the fiscal year. Changes in revenues and expenditures can occur that require the budget to be
amended or funds to be transferred between accounts to adjust to the changes. Transfers and amendments allow Town
Council and the management staff to be proactive in addressing changes in the economy or taking advantage of unforeseen
opportunities. Budget transfers and amendments must adhere to the balanced budget requirements and impose no
additional tax levy liability on citizens.
Budget Transfers & Amendments
A budget transfer occurs when allocated resources within the departmental budget are transferred from one line item
revenue or expenditure to another line item. A department head may request a transfer or the Finance Director may notice
the need for a transfer and make a recommendation to the Town Manager for the transfer.
A budget amendment typically involves larger sums of money being transferred between funds or departments or is needed
to address needs for increases in resources. Budget staff, in conjunction with the Finance Director prepares budget
amendments and submits them to Town Council for approval.
69
Budget Process
Summary of Transactions
The final phase of the budget process involves reporting on all financial transactions throughout the fiscal year and
performing a financial audit. Budget staff and the Finance Director prepare monthly reports throughout the fiscal year so
that Town Council and management can monitor the Town’s expenditures and revenues. At the end of the year, the Finance
Director is responsible for generating an end-of-year report that details the Town’s expenditures and revenues for each
fund. This is done with the help of an independent auditor who annually reviews the Town’s finances in order to certify that
the final reports accurately represent the Town’s financial condition. The Annual Financial Information Report (AFIR) must
be submitted to the NC Department of State Treasurer by November 1, of the following fiscal year. Current and past annual
reports are available for citizen review at Town Hall or online through the NC Department of State Treasurer website.
70
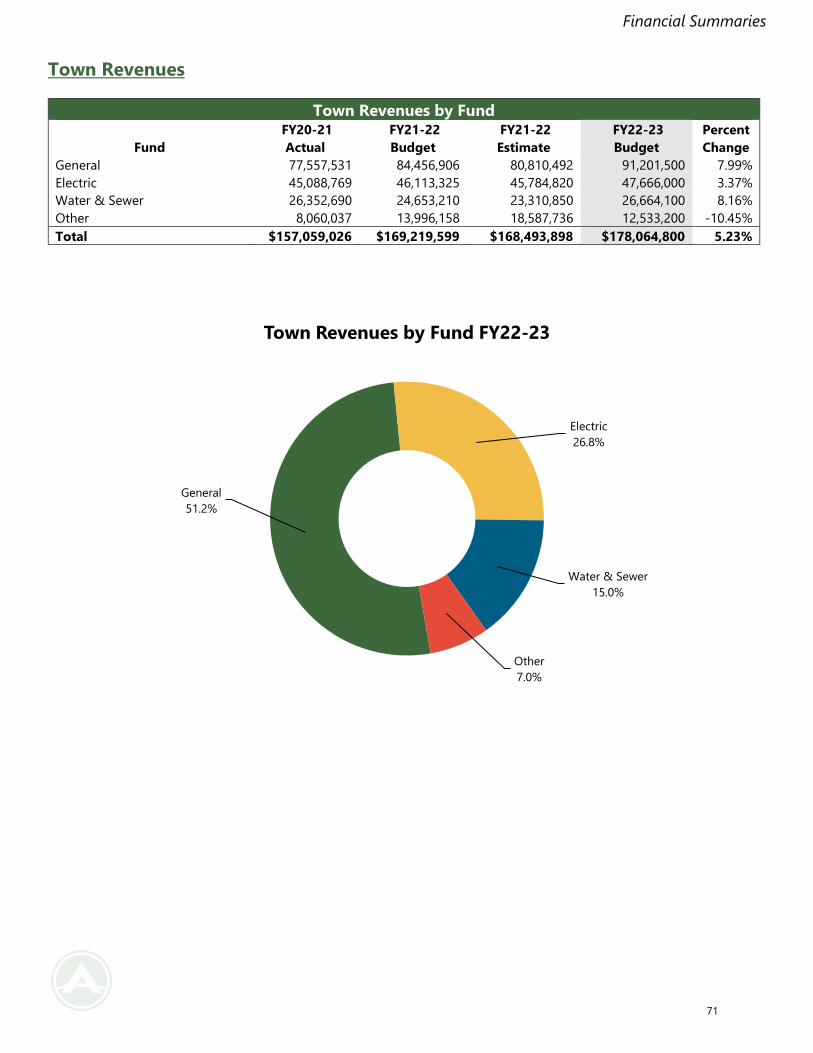
Financial Summaries
Town Revenues
Town Revenues by Fund
Fund
FY20-21
Actual
FY21-22
Budget
FY21-22
Estimate
FY22-23
Budget
Percent
Change
General 77,557,531 84,456,906 80,810,492 91,201,500 7.99%
Electric 45,088,769 46,113,325 45,784,820 47,666,000 3.37%
Water & Sewer 26,352,690 24,653,210 23,310,850 26,664,100 8.16%
Other 8,060,037 13,996,158 18,587,736 12,533,200 -10.45%
Total $157,059,026 $169,219,599 $168,493,898 $178,064,800 5.23%
General
51.2%
Electric
26.8%
Water & Sewer
15.0%
Other
7.0%
Town Revenues by Fund FY22-23
71
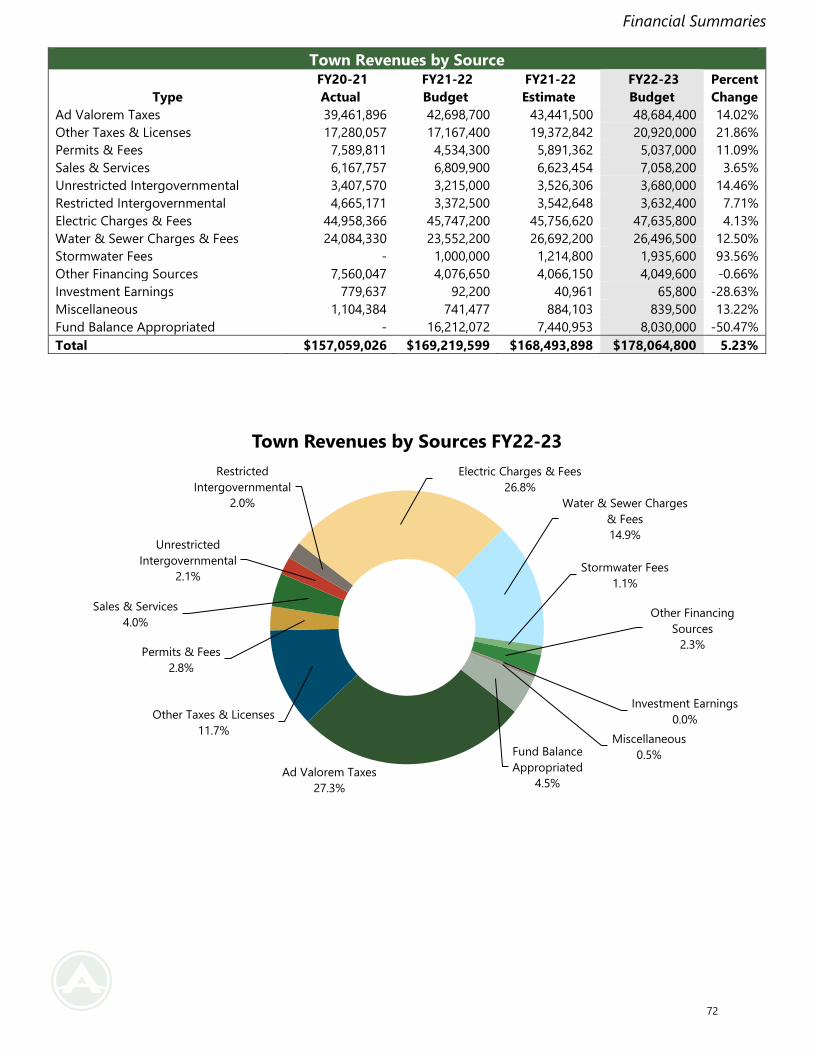
Financial Summaries
Town Revenues by Source
Type
FY20-21
Actual
FY21-22
Budget
FY21-22
Estimate
FY22-23
Budget
Percent
Change
Ad Valorem Taxes 39,461,896 42,698,700 43,441,500 48,684,400 14.02%
Other Taxes & Licenses 17,280,057 17,167,400 19,372,842 20,920,000 21.86%
Permits & Fees 7,589,811 4,534,300 5,891,362 5,037,000 11.09%
Sales & Services 6,167,757 6,809,900 6,623,454 7,058,200 3.65%
Unrestricted Intergovernmental 3,407,570 3,215,000 3,526,306 3,680,000 14.46%
Restricted Intergovernmental 4,665,171 3,372,500 3,542,648 3,632,400 7.71%
Electric Charges & Fees 44,958,366 45,747,200 45,756,620 47,635,800 4.13%
Water & Sewer Charges & Fees 24,084,330 23,552,200 26,692,200 26,496,500 12.50%
Stormwater Fees - 1,000,000 1,214,800 1,935,600 93.56%
Other Financing Sources 7,560,047 4,076,650 4,066,150 4,049,600 -0.66%
Investment Earnings 779,637 92,200 40,961 65,800 -28.63%
Miscellaneous 1,104,384 741,477 884,103 839,500 13.22%
Fund Balance Appropriated - 16,212,072 7,440,953 8,030,000 -50.47%
Total $157,059,026 $169,219,599 $168,493,898 $178,064,800 5.23%
Ad Valorem Taxes
27.3%
Other Taxes & Licenses
11.7%
Permits & Fees
2.8%
Sales & Services
4.0%
Unrestricted
Intergovernmental
2.1%
Restricted
Intergovernmental
2.0%
Electric Charges & Fees
26.8%
Water & Sewer Charges
& Fees
14.9%
Stormwater Fees
1.1%
Other Financing
Sources
2.3%
Investment Earnings
0.0%
Miscellaneous
0.5%Fund Balance
Appropriated
4.5%
Town Revenues by Sources FY22-23
72
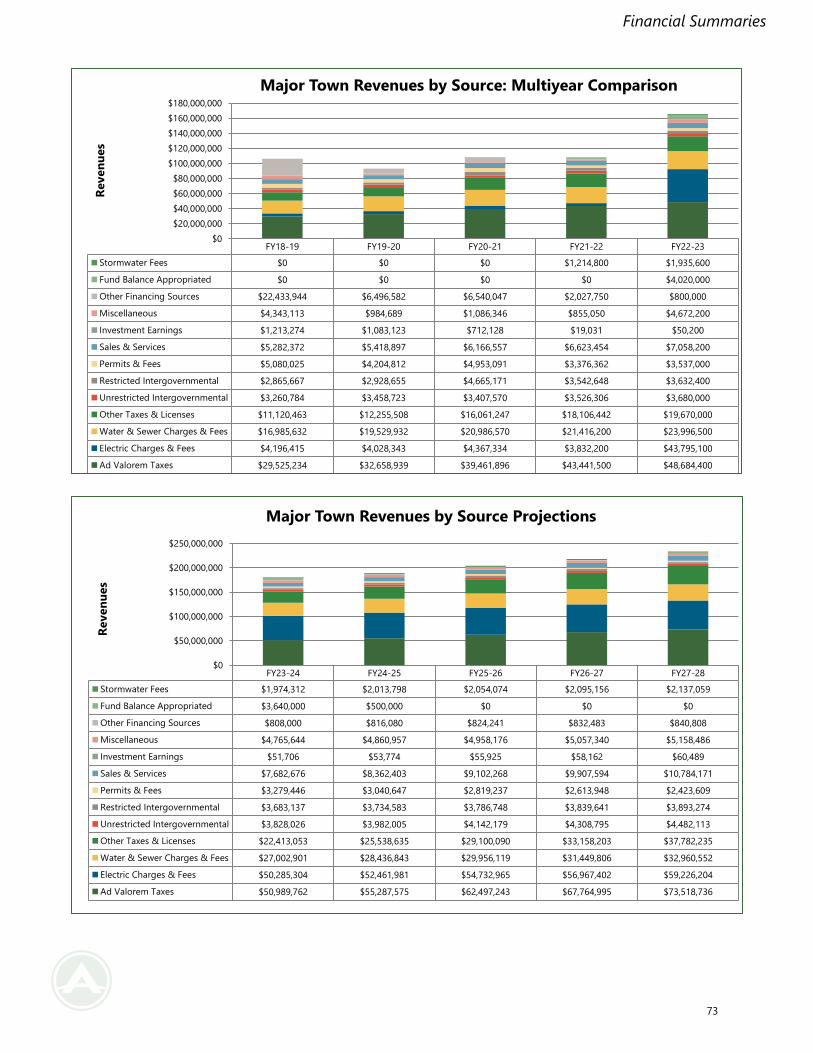
Financial Summaries
FY18-19 FY19-20 FY20-21 FY21-22 FY22-23
Stormwater Fees $0 $0 $0 $1,214,800 $1,935,600
Fund Balance Appropriated $0 $0 $0 $0 $4,020,000
Other Financing Sources $22,433,944 $6,496,582 $6,540,047 $2,027,750 $800,000
Miscellaneous $4,343,113 $984,689 $1,086,346 $855,050 $4,672,200
Investment Earnings $1,213,274 $1,083,123 $712,128 $19,031 $50,200
Sales & Services $5,282,372 $5,418,897 $6,166,557 $6,623,454 $7,058,200
Permits & Fees $5,080,025 $4,204,812 $4,953,091 $3,376,362 $3,537,000
Restricted Intergovernmental $2,865,667 $2,928,655 $4,665,171 $3,542,648 $3,632,400
Unrestricted Intergovernmental $3,260,784 $3,458,723 $3,407,570 $3,526,306 $3,680,000
Other Taxes & Licenses $11,120,463 $12,255,508 $16,061,247 $18,106,442 $19,670,000
Water & Sewer Charges & Fees $16,985,632 $19,529,932 $20,986,570 $21,416,200 $23,996,500
Electric Charges & Fees $4,196,415 $4,028,343 $4,367,334 $3,832,200 $43,795,100
Ad Valorem Taxes $29,525,234 $32,658,939 $39,461,896 $43,441,500 $48,684,400
$0
$20,000,000
$40,000,000
$60,000,000
$80,000,000
$100,000,000
$120,000,000
$140,000,000
$160,000,000
$180,000,000R
even
ues
Major Town Revenues by Source: Multiyear Comparison
FY23-24 FY24-25 FY25-26 FY26-27 FY27-28
Stormwater Fees $1,974,312 $2,013,798 $2,054,074 $2,095,156 $2,137,059
Fund Balance Appropriated $3,640,000 $500,000 $0 $0 $0
Other Financing Sources $808,000 $816,080 $824,241 $832,483 $840,808
Miscellaneous $4,765,644 $4,860,957 $4,958,176 $5,057,340 $5,158,486
Investment Earnings $51,706 $53,774 $55,925 $58,162 $60,489
Sales & Services $7,682,676 $8,362,403 $9,102,268 $9,907,594 $10,784,171
Permits & Fees $3,279,446 $3,040,647 $2,819,237 $2,613,948 $2,423,609
Restricted Intergovernmental $3,683,137 $3,734,583 $3,786,748 $3,839,641 $3,893,274
Unrestricted Intergovernmental $3,828,026 $3,982,005 $4,142,179 $4,308,795 $4,482,113
Other Taxes & Licenses $22,413,053 $25,538,635 $29,100,090 $33,158,203 $37,782,235
Water & Sewer Charges & Fees $27,002,901 $28,436,843 $29,956,119 $31,449,806 $32,960,552
Electric Charges & Fees $50,285,304 $52,461,981 $54,732,965 $56,967,402 $59,226,204
Ad Valorem Taxes $50,989,762 $55,287,575 $62,497,243 $67,764,995 $73,518,736
$0
$50,000,000
$100,000,000
$150,000,000
$200,000,000
$250,000,000
Reven
ues
Major Town Revenues by Source Projections
73
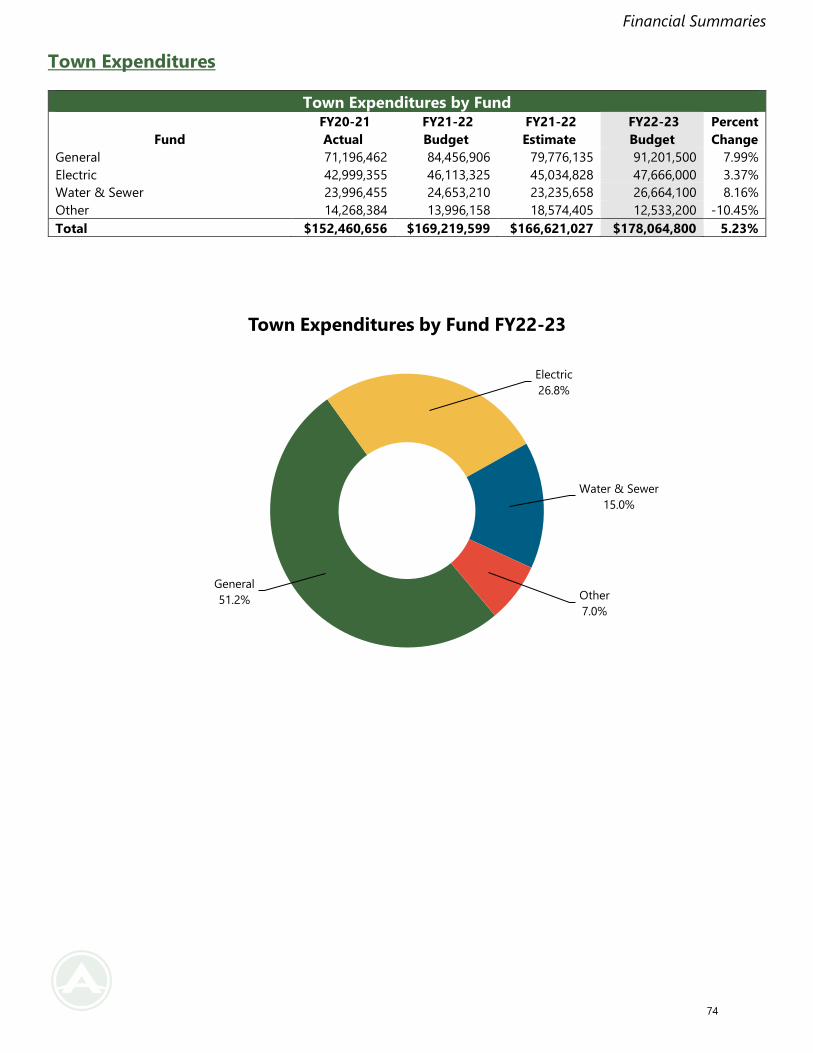
Financial Summaries
Town Expenditures
Town Expenditures by Fund
Fund
FY20-21
Actual
FY21-22
Budget
FY21-22
Estimate
FY22-23
Budget
Percent
Change
General 71,196,462 84,456,906 79,776,135 91,201,500 7.99%
Electric 42,999,355 46,113,325 45,034,828 47,666,000 3.37%
Water & Sewer 23,996,455 24,653,210 23,235,658 26,664,100 8.16%
Other 14,268,384 13,996,158 18,574,405 12,533,200 -10.45%
Total $152,460,656 $169,219,599 $166,621,027 $178,064,800 5.23%
General
51.2%
Electric
26.8%
Water & Sewer
15.0%
Other
7.0%
Town Expenditures by Fund FY22-23
74
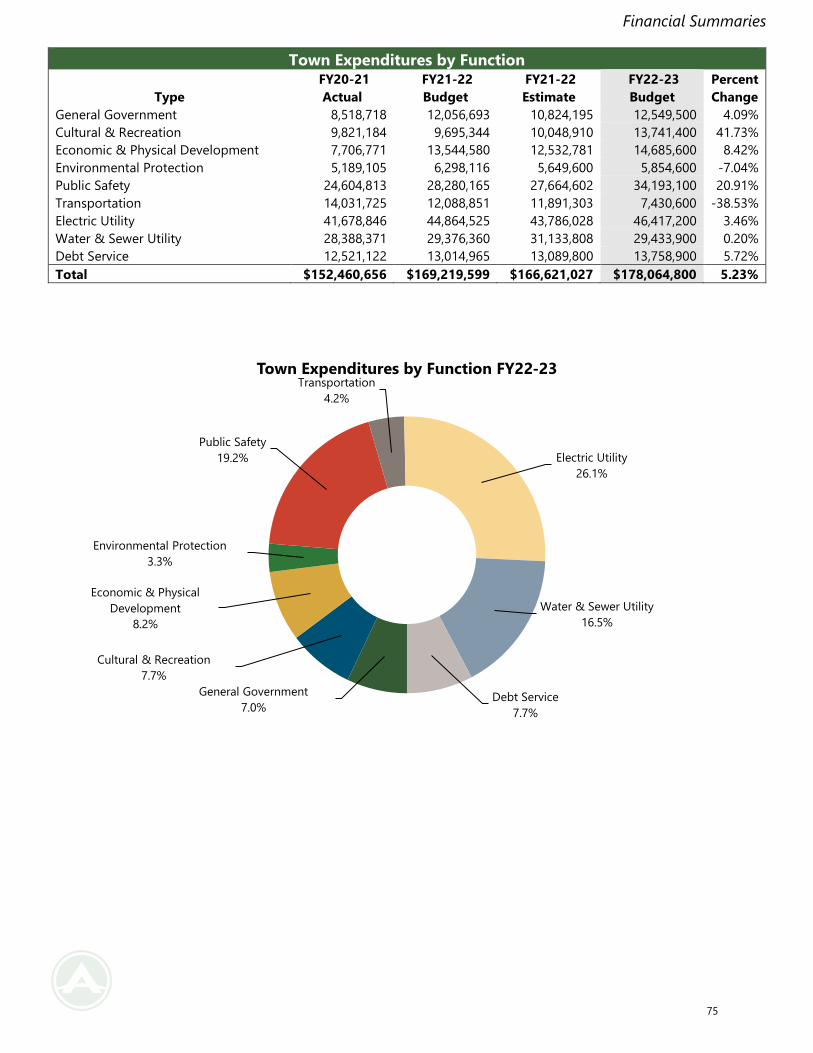
Financial Summaries
Town Expenditures by Function
Type
FY20-21
Actual
FY21-22
Budget
FY21-22
Estimate
FY22-23
Budget
Percent
Change
General Government 8,518,718 12,056,693 10,824,195 12,549,500 4.09%
Cultural & Recreation 9,821,184 9,695,344 10,048,910 13,741,400 41.73%
Economic & Physical Development 7,706,771 13,544,580 12,532,781 14,685,600 8.42%
Environmental Protection 5,189,105 6,298,116 5,649,600 5,854,600 -7.04%
Public Safety 24,604,813 28,280,165 27,664,602 34,193,100 20.91%
Transportation 14,031,725 12,088,851 11,891,303 7,430,600 -38.53%
Electric Utility 41,678,846 44,864,525 43,786,028 46,417,200 3.46%
Water & Sewer Utility 28,388,371 29,376,360 31,133,808 29,433,900 0.20%
Debt Service 12,521,122 13,014,965 13,089,800 13,758,900 5.72%
Total $152,460,656 $169,219,599 $166,621,027 $178,064,800 5.23%
General Government
7.0%
Cultural & Recreation
7.7%
Economic & Physical
Development
8.2%
Environmental Protection
3.3%
Public Safety
19.2%
Transportation
4.2%
Electric Utility
26.1%
Water & Sewer Utility
16.5%
Debt Service
7.7%
Town Expenditures by Function FY22-23
75
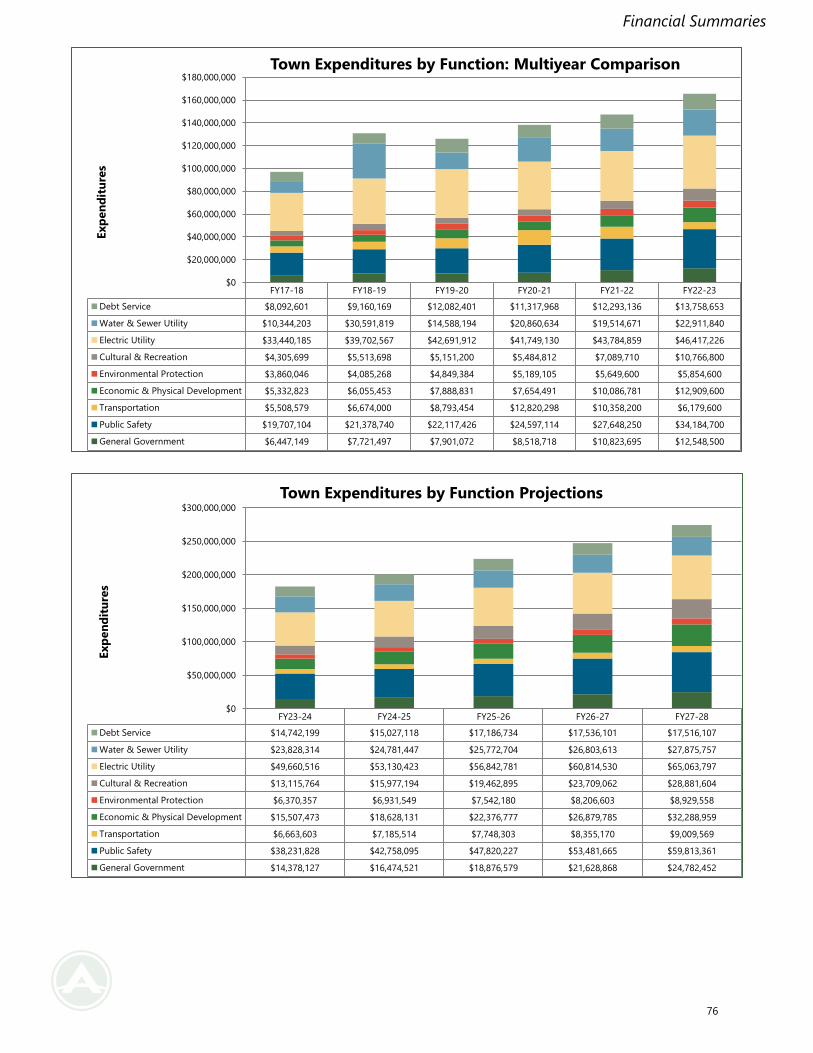
Financial Summaries
FY17-18 FY18-19 FY19-20 FY20-21 FY21-22 FY22-23
Debt Service $8,092,601 $9,160,169 $12,082,401 $11,317,968 $12,293,136 $13,758,653
Water & Sewer Utility $10,344,203 $30,591,819 $14,588,194 $20,860,634 $19,514,671 $22,911,840
Electric Utility $33,440,185 $39,702,567 $42,691,912 $41,749,130 $43,784,859 $46,417,226
Cultural & Recreation $4,305,699 $5,513,698 $5,151,200 $5,484,812 $7,089,710 $10,766,800
Environmental Protection $3,860,046 $4,085,268 $4,849,384 $5,189,105 $5,649,600 $5,854,600
Economic & Physical Development $5,332,823 $6,055,453 $7,888,831 $7,654,491 $10,086,781 $12,909,600
Transportation $5,508,579 $6,674,000 $8,793,454 $12,820,298 $10,358,200 $6,179,600
Public Safety $19,707,104 $21,378,740 $22,117,426 $24,597,114 $27,648,250 $34,184,700
General Government $6,447,149 $7,721,497 $7,901,072 $8,518,718 $10,823,695 $12,548,500
$0
$20,000,000
$40,000,000
$60,000,000
$80,000,000
$100,000,000
$120,000,000
$140,000,000
$160,000,000
$180,000,000
Exp
en
dit
ure
s
Town Expenditures by Function: Multiyear Comparison
FY23-24 FY24-25 FY25-26 FY26-27 FY27-28
Debt Service $14,742,199 $15,027,118 $17,186,734 $17,536,101 $17,516,107
Water & Sewer Utility $23,828,314 $24,781,447 $25,772,704 $26,803,613 $27,875,757
Electric Utility $49,660,516 $53,130,423 $56,842,781 $60,814,530 $65,063,797
Cultural & Recreation $13,115,764 $15,977,194 $19,462,895 $23,709,062 $28,881,604
Environmental Protection $6,370,357 $6,931,549 $7,542,180 $8,206,603 $8,929,558
Economic & Physical Development $15,507,473 $18,628,131 $22,376,777 $26,879,785 $32,288,959
Transportation $6,663,603 $7,185,514 $7,748,303 $8,355,170 $9,009,569
Public Safety $38,231,828 $42,758,095 $47,820,227 $53,481,665 $59,813,361
General Government $14,378,127 $16,474,521 $18,876,579 $21,628,868 $24,782,452
$0
$50,000,000
$100,000,000
$150,000,000
$200,000,000
$250,000,000
$300,000,000
Exp
en
dit
ure
s
Town Expenditures by Function Projections
76
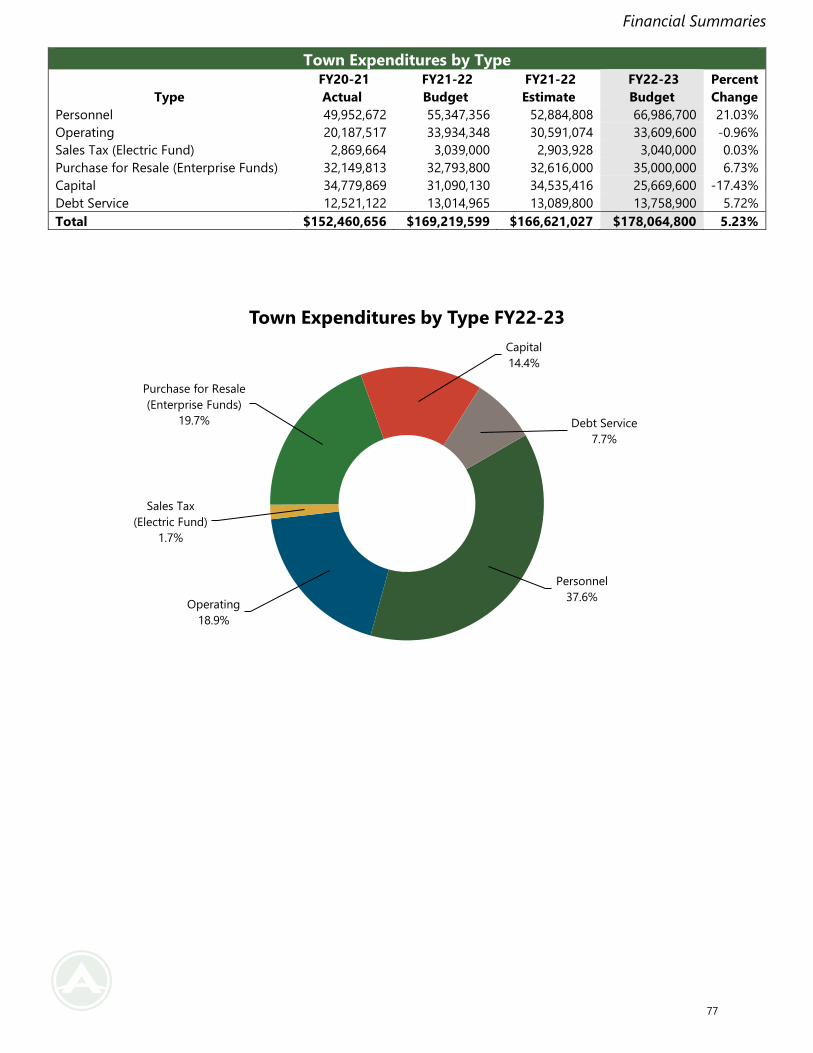
Financial Summaries
Town Expenditures by Type
Type
FY20-21
Actual
FY21-22
Budget
FY21-22
Estimate
FY22-23
Budget
Percent
Change
Personnel 49,952,672 55,347,356 52,884,808 66,986,700 21.03%
Operating 20,187,517 33,934,348 30,591,074 33,609,600 -0.96%
Sales Tax (Electric Fund) 2,869,664 3,039,000 2,903,928 3,040,000 0.03%
Purchase for Resale (Enterprise Funds) 32,149,813 32,793,800 32,616,000 35,000,000 6.73%
Capital 34,779,869 31,090,130 34,535,416 25,669,600 -17.43%
Debt Service 12,521,122 13,014,965 13,089,800 13,758,900 5.72%
Total $152,460,656 $169,219,599 $166,621,027 $178,064,800 5.23%
Personnel
37.6%Operating
18.9%
Sales Tax
(Electric Fund)
1.7%
Purchase for Resale
(Enterprise Funds)
19.7%
Capital
14.4%
Debt Service
7.7%
Town Expenditures by Type FY22-23
77
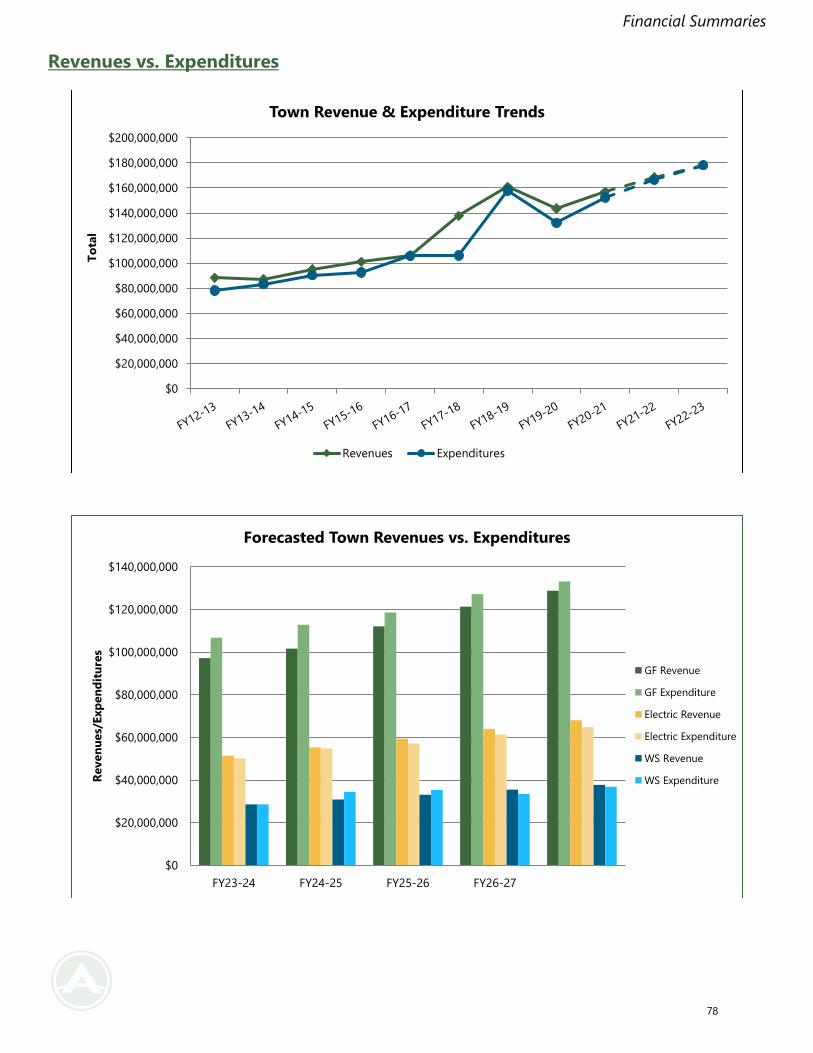
Financial Summaries
Revenues vs. Expenditures
$0
$20,000,000
$40,000,000
$60,000,000
$80,000,000
$100,000,000
$120,000,000
$140,000,000
$160,000,000
$180,000,000
$200,000,000
To
tal
Town Revenue & Expenditure Trends
Revenues Expenditures
$0
$20,000,000
$40,000,000
$60,000,000
$80,000,000
$100,000,000
$120,000,000
$140,000,000
FY23-24 FY24-25 FY25-26 FY26-27
Reven
ues/
Exp
en
dit
ure
s
Forecasted Town Revenues vs. Expenditures
GF Revenue
GF Expenditure
Electric Revenue
Electric Expenditure
WS Revenue
WS Expenditure
78
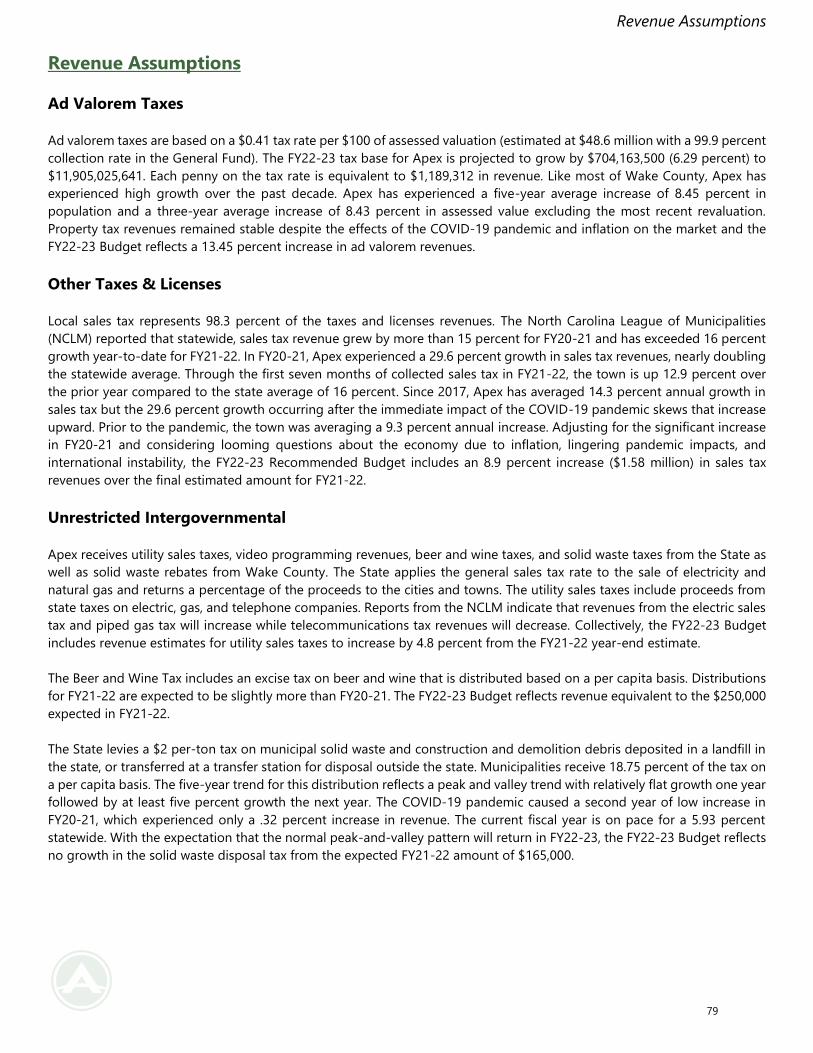
Revenue Assumptions
Revenue Assumptions
Ad Valorem Taxes
Ad valorem taxes are based on a $0.41 tax rate per $100 of assessed valuation (estimated at $48.6 million with a 99.9 percent
collection rate in the General Fund). The FY22-23 tax base for Apex is projected to grow by $704,163,500 (6.29 percent) to
$11,905,025,641. Each penny on the tax rate is equivalent to $1,189,312 in revenue. Like most of Wake County, Apex has
experienced high growth over the past decade. Apex has experienced a five-year average increase of 8.45 percent in
population and a three-year average increase of 8.43 percent in assessed value excluding the most recent revaluation.
Property tax revenues remained stable despite the effects of the COVID-19 pandemic and inflation on the market and the
FY22-23 Budget reflects a 13.45 percent increase in ad valorem revenues.
Other Taxes & Licenses
Local sales tax represents 98.3 percent of the taxes and licenses revenues. The North Carolina League of Municipalities
(NCLM) reported that statewide, sales tax revenue grew by more than 15 percent for FY20-21 and has exceeded 16 percent
growth year-to-date for FY21-22. In FY20-21, Apex experienced a 29.6 percent growth in sales tax revenues, nearly doubling
the statewide average. Through the first seven months of collected sales tax in FY21-22, the town is up 12.9 percent over
the prior year compared to the state average of 16 percent. Since 2017, Apex has averaged 14.3 percent annual growth in
sales tax but the 29.6 percent growth occurring after the immediate impact of the COVID-19 pandemic skews that increase
upward. Prior to the pandemic, the town was averaging a 9.3 percent annual increase. Adjusting for the significant increase
in FY20-21 and considering looming questions about the economy due to inflation, lingering pandemic impacts, and
international instability, the FY22-23 Recommended Budget includes an 8.9 percent increase ($1.58 million) in sales tax
revenues over the final estimated amount for FY21-22.
Unrestricted Intergovernmental
Apex receives utility sales taxes, video programming revenues, beer and wine taxes, and solid waste taxes from the State as
well as solid waste rebates from Wake County. The State applies the general sales tax rate to the sale of electricity and
natural gas and returns a percentage of the proceeds to the cities and towns. The utility sales taxes include proceeds from
state taxes on electric, gas, and telephone companies. Reports from the NCLM indicate that revenues from the electric sales
tax and piped gas tax will increase while telecommunications tax revenues will decrease. Collectively, the FY22-23 Budget
includes revenue estimates for utility sales taxes to increase by 4.8 percent from the FY21-22 year-end estimate.
The Beer and Wine Tax includes an excise tax on beer and wine that is distributed based on a per capita basis. Distributions
for FY21-22 are expected to be slightly more than FY20-21. The FY22-23 Budget reflects revenue equivalent to the $250,000
expected in FY21-22.
The State levies a $2 per-ton tax on municipal solid waste and construction and demolition debris deposited in a landfill in
the state, or transferred at a transfer station for disposal outside the state. Municipalities receive 18.75 percent of the tax on
a per capita basis. The five-year trend for this distribution reflects a peak and valley trend with relatively flat growth one year
followed by at least five percent growth the next year. The COVID-19 pandemic caused a second year of low increase in
FY20-21, which experienced only a .32 percent increase in revenue. The current fiscal year is on pace for a 5.93 percent
statewide. With the expectation that the normal peak-and-valley pattern will return in FY22-23, the FY22-23 Budget reflects
no growth in the solid waste disposal tax from the expected FY21-22 amount of $165,000.
79
Revenue Assumptions
Restricted Governmental
In 2016, the General Assembly began appropriating dollars for Powell Bill funds instead of relying on the previous
distribution method based on gas tax revenues. The State maintained a total appropriation of $147.5 million for several
years before increasing the allocation to $154.9 million in FY21-22. The NCLM expects the same allocation to be part of the
State’s budget for FY22-23. Seventy-five percent of the Powell Bill distribution is calculated based on municipal populations.
The projected per capita allocation for the FY22-23 Powell Bill distribution is $21.66. The remaining 25 percent of the
distribution is allocated based on the number of municipally maintained street system miles. The projected value of the
mileage-based allocation for the FY22-23 Powell Bill distribution is $1,675.48 per street mile. Using these values, the Town
estimates its FY22-23 Powell Bill allocation to be $1.7 million.
Contributions from other agencies, including Wake County Public Schools and Wake County, are determined by established
contracts or agreements. Revenues from Wake County Public Schools partially offset costs for resource officers at high
school and middle school campuses. Wake County collects a fire district tax of $.096 per $100 of valuation on property not
within municipal corporate limits. The County distributes revenues from the fire district tax based on a weighted formula
that includes service demand, population, property value, heated square footage, and land area. Apex receives a portion of
the fire tax revenues for the delivery of fire protection services to residents within the Apex Fire District who do not live
within the town’s corporate limits. The Town will receive $1,363,000 from Wake County for extraterritorial fire protection
services in FY22-23.
Permits & Fees
Permit and fee revenues are predominantly associated with development related services such as planning applications and
building inspections. Despite the pandemic, supply chain issues, and inflationary effects on building materials, Apex’s
population continues to grow. As of April 1, 2022, the Town has issued permits for 5,748 of 8,426 approved residential units.
Of the total $3.54 million permit and fee revenues in the FY22-23 Budget, $2.51 million is restricted by General Statutes
specifically for building inspections and permitting related activities.
Sales & Services
Sales and services revenues primarily consist of revenues from solid waste services and recreation fees. Solid waste, yard
waste, and recycling collections comprise $6.26 million in FY22-23, a 5.95 percent increase over year-end estimates for FY21-
22. Customer counts for solid waste collection are expected to increase 3.5 percent between for FY22-23. Collection fees for
solid waste and recycling will increase in FY22-23 by 1.1 percent. The FY22-23 Budget includes $784,600 in revenues from
recreation and cultural activity fees and facility rentals, which represents a 9.46 percent increase from FY21-22 as
participation numbers recover from the effects of the pandemic.
Other Financing Sources
Other financing sources represents revenues generated from sales of capital assets, bond sales, and transfers in from other
funds. Total fund transfers in FY22-23 consist of $750,000 to the General Fund from the Transportation Reserve Fund for
pavement management.
Investment Earnings
Investment earnings had been steadily rising until the COVID-19 pandemic and initial recession. Estimates for FY22-23 are
significantly less than current year revenues due to low rates of return. The FY22-23 Recommended Budget includes $25,000
in the General Fund, $5,200 in the Electric Fund, and $20,000 in the Water and Sewer Fund.
80
Revenue Assumptions
Electric Charges
The FY22-23 Budget includes $41.92 million in revenue from electric charges for service. This amount represents a 4.51
percent increase from FY21-22. The budget includes an increase in the electric base rate and a decrease in the energy
demand rate. The FY22-23 Budget uses a customer growth projection of three percent.
Other Operating Revenue
Other operating revenues are associated with the enterprise funds and represent sales tax, underground and service lateral
fees, electric meters in the Electric Fund ($3.84 million), and water tank rentals in the Water and Sewer Fund ($145,000). Sales
tax on electricity sales makes up 79.3 percent of other operating revenues for the Electric Fund at $3.05 million. This amount
is a 4.23 percent increase over FY22-23.
Water & Sewer Charges
The Town estimates revenues of approximately $24 million from water & sewer charges in FY22-23, an 11.86 percent increase
from budgeted revenues for FY21-22. The increase is the result of an expected four-percent increase in accounts and
increases in both base and volumetric rates for water and sewer.
Fund Balances
The Town plans to appropriate $3,620,000 from the General Fund fund balance and $400,000 for the Water and Sewer Fund
for FY22-23. The FY22-23 Budget does not include appropriation of reserves for the Electric Fund.
81
Fund Balance
Fund Balance
Fund balance is the difference between the assets and liabilities in a fund. Fund balance acts as a reserve or “rainy day” fund
for unanticipated incidents or opportunities. Revenues and expenditures in the budget are estimates for the current fiscal
year. Often, revenues and expenditures do not exactly offset each other at the end of the fiscal year. If revenues exceed
expenditures, the result is a surplus of money added to the fund balance. If expenditures exceed revenues, the result is a
deficit and the Town withdraws money from the fund balance to balance the budget.
The North Carolina Local Government Commission (LGC) recommends units of government retain an amount of unreserved
fund balance in the General Fund of at least 8 percent of appropriations of the fund. Apex Town Council has adopted a
policy recommending the Town maintain a fund balance of 25 percent for the General Fund.
Purpose of Fund Balance
Fund Balance is available to help balance the Town’s budget in the event expenditures exceed revenues. A strong fund
balance helps the Town achieve a solid bond rating but also helps the Town in other ways, including:
• paying for unexpected expenses or to make up for revenue shortfalls,
• balancing the budget without increasing taxes or rates,
• responding to emergencies,
• taking advantage of unexpected opportunities, and
• paying for capital projects or needs without needing to borrow money.
Issues Concerning Fund Balance
An inadequate fund balance can lead to cash flow problems, disruption of services, or the inability of the Town to respond
in an emergency. Building a strong fund balance requires a substantial amount of time and often includes increases in taxes
and fees and/or significant expenditure cuts. For these reasons, fund balance should be managed effectively to ensure it is
not regularly used to offset operating deficits. While a strong fund balance provides the Town with flexibility and financial
security, excessive fund balance can be an indicator that taxes or fees are too high or that the Town may not be spending
money adequately to respond to the needs of citizens or the organization.
Amount of Fund Balance
The LGC recommends a minimum fund balance of 8 percent but most local governments carry a higher percentage. Good
benchmarks for the appropriate amount of fund balance include ensuring enough revenue to avoid cash flow problems,
typically about four to six (4-6) months of operating expenses, and the average fund balance percentage within a peer
group. The average fund balance for North Carolina municipalities in Apex’s population range that operate an electric system
is 40.22 percent. The LGC designates this group as municipalities with electric systems and populations above 50,000 people.
There are no general guidelines for fund balance levels in enterprise funds, such as the Electric Fund or Water & Sewer Fund.
The chart below includes unassigned and assigned fund balance for the Town’s major funds. The budget discusses the
Town’s use of fund balance for FY22-23 in the revenues sections for each fund.
82
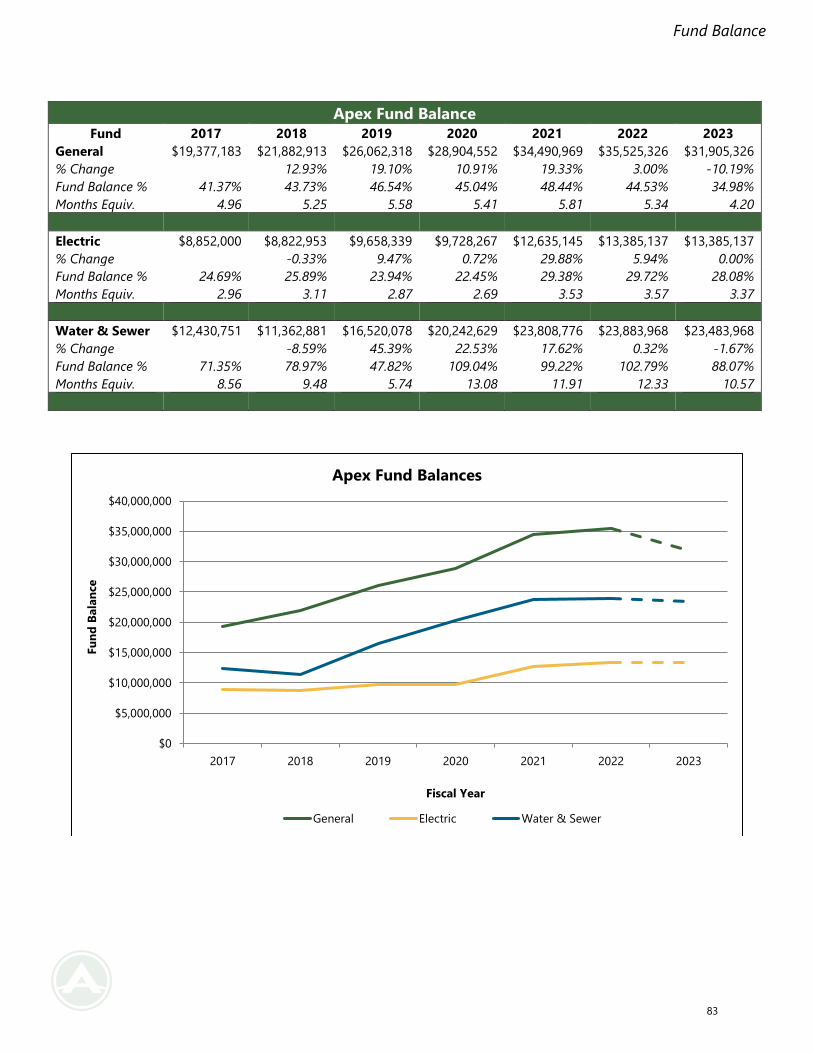
Fund Balance
Apex Fund Balance
Fund 2017 2018 2019 2020 2021 2022 2023
General $19,377,183 $21,882,913 $26,062,318 $28,904,552 $34,490,969 $35,525,326 $31,905,326
% Change 12.93% 19.10% 10.91% 19.33% 3.00% -10.19%
Fund Balance % 41.37% 43.73% 46.54% 45.04% 48.44% 44.53% 34.98%
Months Equiv. 4.96 5.25 5.58 5.41 5.81 5.34 4.20
Electric $8,852,000 $8,822,953 $9,658,339 $9,728,267 $12,635,145 $13,385,137 $13,385,137
% Change -0.33% 9.47% 0.72% 29.88% 5.94% 0.00%
Fund Balance % 24.69% 25.89% 23.94% 22.45% 29.38% 29.72% 28.08%
Months Equiv. 2.96 3.11 2.87 2.69 3.53 3.57 3.37
Water & Sewer $12,430,751 $11,362,881 $16,520,078 $20,242,629 $23,808,776 $23,883,968 $23,483,968
% Change -8.59% 45.39% 22.53% 17.62% 0.32% -1.67%
Fund Balance % 71.35% 78.97% 47.82% 109.04% 99.22% 102.79% 88.07%
Months Equiv. 8.56 9.48 5.74 13.08 11.91 12.33 10.57
$0
$5,000,000
$10,000,000
$15,000,000
$20,000,000
$25,000,000
$30,000,000
$35,000,000
$40,000,000
2017 2018 2019 2020 2021 2022 2023
Fu
nd
Bala
nce
Fiscal Year
Apex Fund Balances
General Electric Water & Sewer
83
Debt Obligation
Debt Obligation
The Town may choose to take on debt through financing to pay for major projects or large equipment. Issuing debt to pay
for major projects and equipment allows the Town to reduce its immediate burden to pay for large capital projects. This
allows the cost to be spread out over time and shares the financing burden among the taxpayers who receive the most
benefit from the project. North Carolina General Statute 159-55 limits local government debt to a maximum of 8 percent of
the unit’s taxable assessed valuation. This limit amounts to $956,802,048 using the valuation for FY 22-23.
Types of Debt Financing
The following is a common list of financing options used by local governments in North Carolina to issue debt.
General Obligation Bonds
General Obligation (GO) bonds require voter approval because the debt is secured by the taxing power of the local
government. When a local government issues GO bonds, they promise to pay back the loan by using all revenue available
at its disposal, including its ability to raise taxes. GO bonds in North Carolina require approval of the North Carolina Local
Government Commission (LGC). GO bonds typically have the lowest interest rates and twenty-year terms.
Revenue Bonds
Revenue bonds are secured and repaid from specific revenues and can only be used to finance revenue-producing projects.
Revenues earned from these projects repay the bond. These revenues are most often the net earnings from enterprise or
self-supporting utilities. Revenue bonds are commonly used to finance electric or water and sewer capital improvements.
The LGC requires an independent, nationally recognized consulting firm to conduct a feasibility study and that revenues
from the project be 20 percent greater than total debt service costs and operating expenses of the projects.
Installment Purchase Agreements
Installment purchase (IP) (or lease-purchase) financing can be either short-term or long-term. This type of obligation is
privately placed with a financial institution or vendor. The security for the obligation is the asset being purchased or
constructed. Bank qualified IP agreements, when less than $10 million borrowed in the calendar year, allow local
governments to borrow money at a lower rate than conventional loans because lenders do not have to pay taxes on the
interest portion of the payments it receives. This type of financing is typically used for items such as large equipment and
some facilities. For large IP agreements, the LGC must approve the debt.
Certificates of Participation
Certificates of Participation (COPs) operate similar to an IP except that the debt is publically traded rather than privately
placed. COPs typically have higher interest rates than GO bonds because the debt is secured by a pledge of the asset being
purchased or constructed and funds resulting from the project being financed and cannot be secured by the “full faith and
credit” of the government. The local government uses revenue to pay off debt on a capital project. Unlike revenue bonds,
local governments can use the revenue from the entire unit to pay off the debt and are not limited to using revenue only
produced by the financed project. COPs are typically financed for ten- to twenty-year terms. This type of financing should
be considered for a revenue-generating project.
84
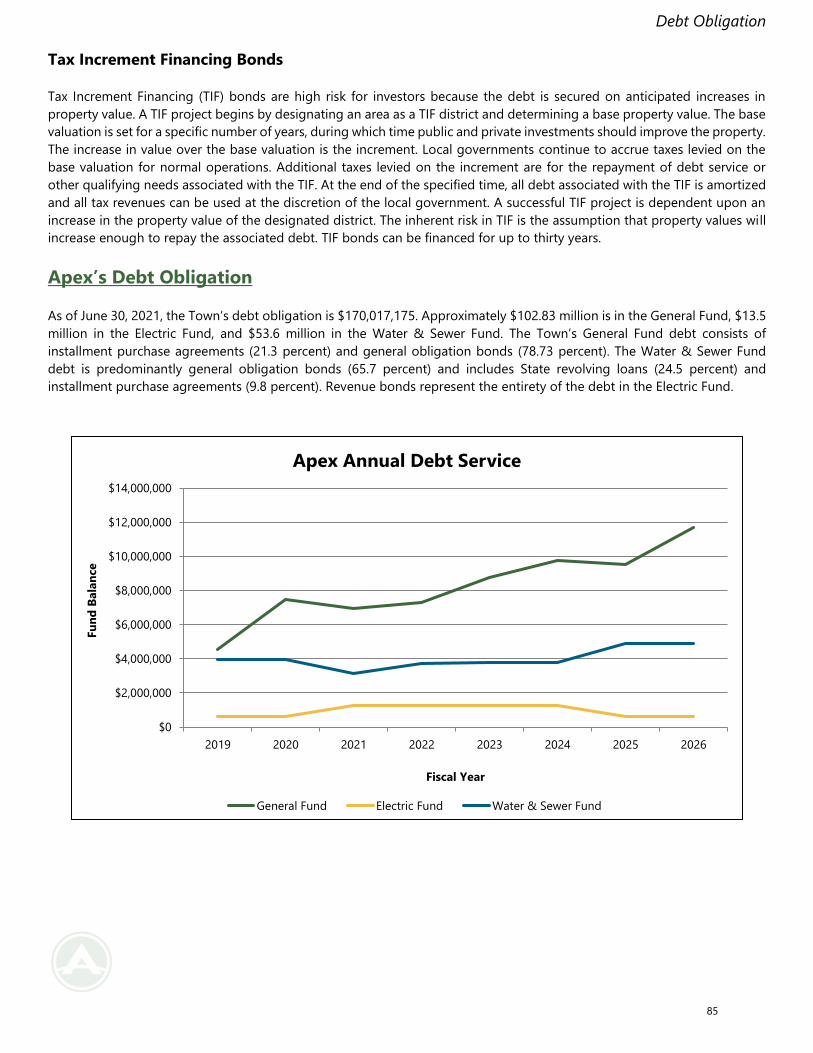
Debt Obligation
Tax Increment Financing Bonds
Tax Increment Financing (TIF) bonds are high risk for investors because the debt is secured on anticipated increases in
property value. A TIF project begins by designating an area as a TIF district and determining a base property value. The base
valuation is set for a specific number of years, during which time public and private investments should improve the property.
The increase in value over the base valuation is the increment. Local governments continue to accrue taxes levied on the
base valuation for normal operations. Additional taxes levied on the increment are for the repayment of debt service or
other qualifying needs associated with the TIF. At the end of the specified time, all debt associated with the TIF is amortized
and all tax revenues can be used at the discretion of the local government. A successful TIF project is dependent upon an
increase in the property value of the designated district. The inherent risk in TIF is the assumption that property values will
increase enough to repay the associated debt. TIF bonds can be financed for up to thirty years.
Apex’s Debt Obligation
As of June 30, 2021, the Town’s debt obligation is $170,017,175. Approximately $102.83 million is in the General Fund, $13.5
million in the Electric Fund, and $53.6 million in the Water & Sewer Fund. The Town’s General Fund debt consists of
installment purchase agreements (21.3 percent) and general obligation bonds (78.73 percent). The Water & Sewer Fund
debt is predominantly general obligation bonds (65.7 percent) and includes State revolving loans (24.5 percent) and
installment purchase agreements (9.8 percent). Revenue bonds represent the entirety of the debt in the Electric Fund.
$0
$2,000,000
$4,000,000
$6,000,000
$8,000,000
$10,000,000
$12,000,000
$14,000,000
2019 2020 2021 2022 2023 2024 2025 2026
Fu
nd
Bala
nce
Fiscal Year
Apex Annual Debt Service
General Fund Electric Fund Water & Sewer Fund
85
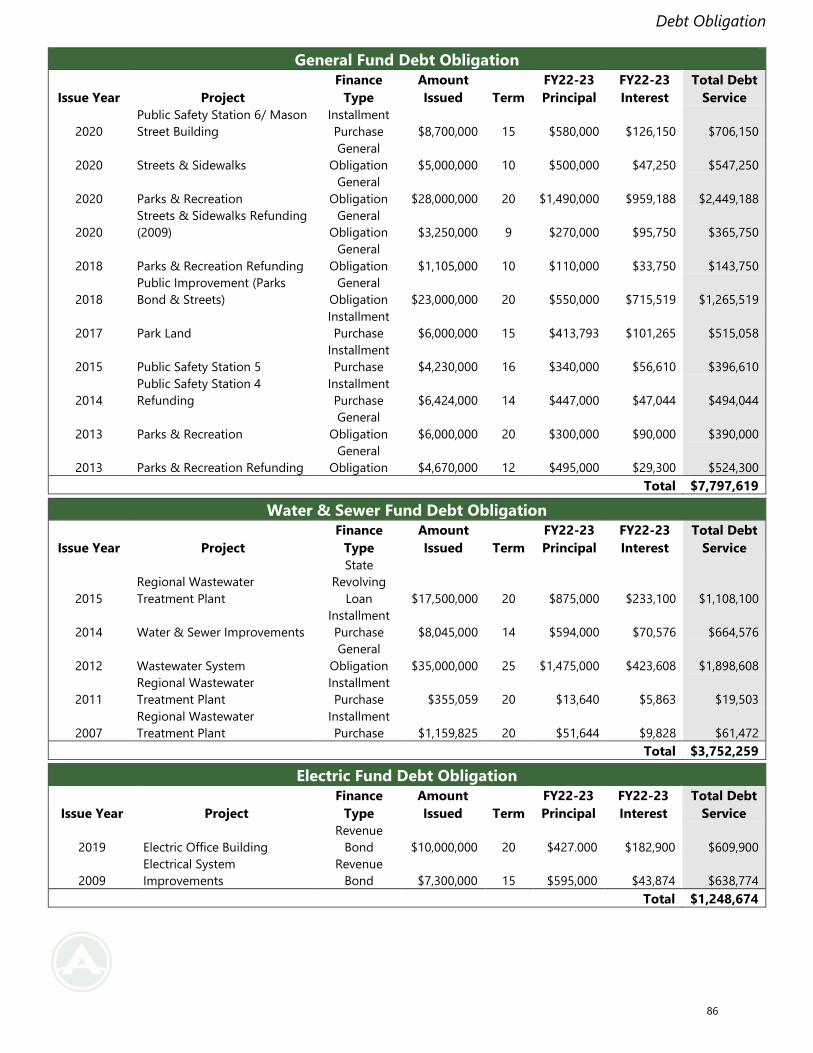
Debt Obligation
General Fund Debt Obligation
Issue Year Project
Finance
Type
Amount
Issued Term
FY22-23
Principal
FY22-23
Interest
Total Debt
Service
2020
Public Safety Station 6/ Mason
Street Building
Installment
Purchase $8,700,000 15 $580,000 $126,150 $706,150
2020 Streets & Sidewalks
General
Obligation $5,000,000 10 $500,000 $47,250 $547,250
2020 Parks & Recreation
General
Obligation $28,000,000 20 $1,490,000 $959,188 $2,449,188
2020
Streets & Sidewalks Refunding
(2009)
General
Obligation $3,250,000 9 $270,000 $95,750 $365,750
2018 Parks & Recreation Refunding
General
Obligation $1,105,000 10 $110,000 $33,750 $143,750
2018
Public Improvement (Parks
Bond & Streets)
General
Obligation $23,000,000 20 $550,000 $715,519 $1,265,519
2017 Park Land
Installment
Purchase $6,000,000 15 $413,793 $101,265 $515,058
2015 Public Safety Station 5
Installment
Purchase $4,230,000 16 $340,000 $56,610 $396,610
2014
Public Safety Station 4
Refunding
Installment
Purchase $6,424,000 14 $447,000 $47,044 $494,044
2013 Parks & Recreation
General
Obligation $6,000,000 20 $300,000 $90,000 $390,000
2013 Parks & Recreation Refunding
General
Obligation $4,670,000 12 $495,000 $29,300 $524,300
Total $7,797,619
Water & Sewer Fund Debt Obligation
Issue Year Project
Finance
Type
Amount
Issued Term
FY22-23
Principal
FY22-23
Interest
Total Debt
Service
2015
Regional Wastewater
Treatment Plant
State
Revolving
Loan $17,500,000 20 $875,000 $233,100 $1,108,100
2014 Water & Sewer Improvements
Installment
Purchase $8,045,000 14 $594,000 $70,576 $664,576
2012 Wastewater System
General
Obligation $35,000,000 25 $1,475,000 $423,608 $1,898,608
2011
Regional Wastewater
Treatment Plant
Installment
Purchase $355,059 20 $13,640 $5,863 $19,503
2007
Regional Wastewater
Treatment Plant
Installment
Purchase $1,159,825 20 $51,644 $9,828 $61,472
Total $3,752,259
Electric Fund Debt Obligation
Issue Year Project
Finance
Type
Amount
Issued Term
FY22-23
Principal
FY22-23
Interest
Total Debt
Service
2019 Electric Office Building
Revenue
Bond $10,000,000 20 $427.000 $182,900 $609,900
2009
Electrical System
Improvements
Revenue
Bond $7,300,000 15 $595,000 $43,874 $638,774
Total $1,248,674
86
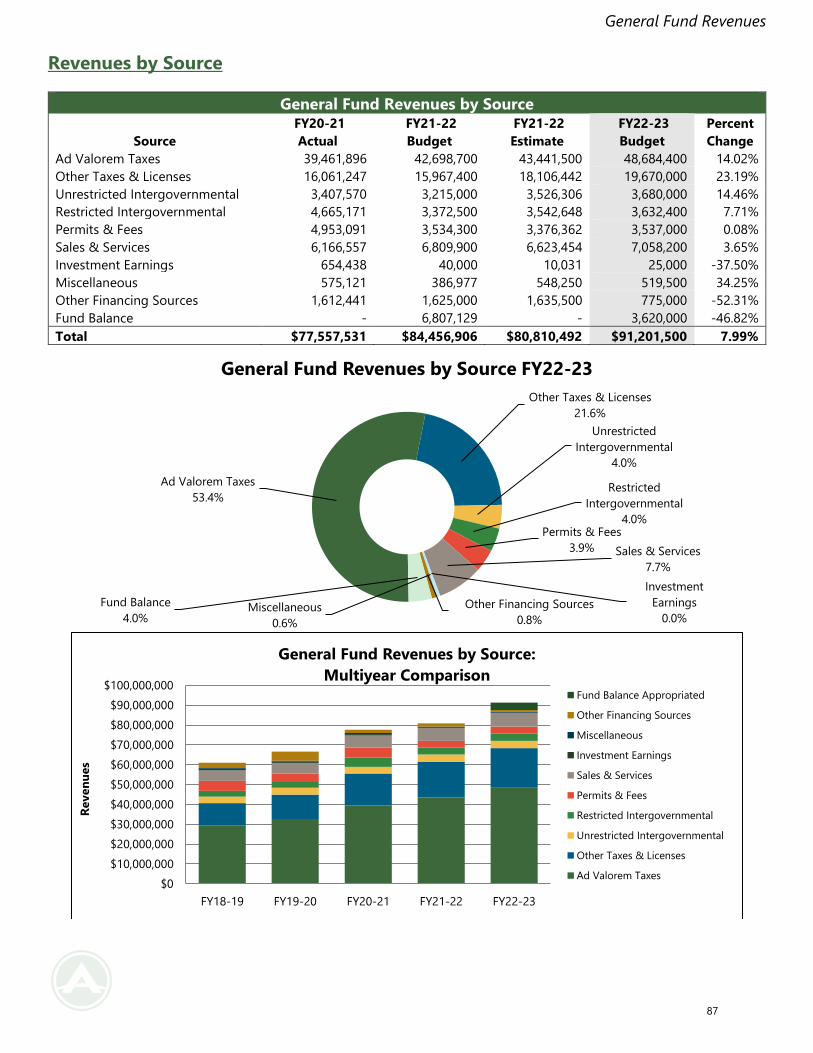
General Fund Revenues
Revenues by Source
General Fund Revenues by Source
Source
FY20-21
Actual
FY21-22
Budget
FY21-22
Estimate
FY22-23
Budget
Percent
Change
Ad Valorem Taxes 39,461,896 42,698,700 43,441,500 48,684,400 14.02%
Other Taxes & Licenses 16,061,247 15,967,400 18,106,442 19,670,000 23.19%
Unrestricted Intergovernmental 3,407,570 3,215,000 3,526,306 3,680,000 14.46%
Restricted Intergovernmental 4,665,171 3,372,500 3,542,648 3,632,400 7.71%
Permits & Fees 4,953,091 3,534,300 3,376,362 3,537,000 0.08%
Sales & Services 6,166,557 6,809,900 6,623,454 7,058,200 3.65%
Investment Earnings 654,438 40,000 10,031 25,000 -37.50%
Miscellaneous 575,121 386,977 548,250 519,500 34.25%
Other Financing Sources 1,612,441 1,625,000 1,635,500 775,000 -52.31%
Fund Balance - 6,807,129 - 3,620,000 -46.82%
Total $77,557,531 $84,456,906 $80,810,492 $91,201,500 7.99%
Ad Valorem Taxes
53.4%
Other Taxes & Licenses
21.6%
Unrestricted
Intergovernmental
4.0%
Restricted
Intergovernmental
4.0%Permits & Fees
3.9% Sales & Services
7.7%
Investment
Earnings
0.0%Miscellaneous
0.6%
Other Financing Sources
0.8%
Fund Balance
4.0%
General Fund Revenues by Source FY22-23
$0
$10,000,000
$20,000,000
$30,000,000
$40,000,000
$50,000,000
$60,000,000
$70,000,000
$80,000,000
$90,000,000
$100,000,000
FY18-19 FY19-20 FY20-21 FY21-22 FY22-23
Reven
ues
General Fund Revenues by Source:
Multiyear Comparison Fund Balance Appropriated
Other Financing Sources
Miscellaneous
Investment Earnings
Sales & Services
Permits & Fees
Restricted Intergovernmental
Unrestricted Intergovernmental
Other Taxes & Licenses
Ad Valorem Taxes
87
General Fund Revenues
Source Descriptions
Ad Valorem Taxes
Ad valorem taxes are taxes paid on real and personal property located within the Apex town limits. Taxes for real and
personal property are levied based upon the preceding January 1 valuations of the property and the tax rate established by
Town Council. Wake County revalues real and personal property every four years, with the most recent occurring in 2020.
The Town contracts with the Wake County Tax Department to levy and collect ad valorem taxes. The Town’s average
collection is 99.89 percent. Ad valorem taxes typically comprise approximately one-half of all General Fund revenues with
an estimated $48.68 million in FY22-23 at a tax rate of $.41 per $100 valuation.
Other Taxes & Licenses
The State of North Carolina collects local option sales tax on behalf of Wake County. The local option sales tax rate of $0.025
consists of four separate taxes authorized by North Carolina General Statutes: Article 39 at $0.01, Article 40 at $0.005, Article
42 at $0.005 and Article 44 at $0.005. In October of 2008, the State eliminated the per capita portion of the Article 44 sales
tax and replaced it with a “hold harmless” reimbursement. This local government sales and use tax is applied to sales made
in the county and is allocated among the county and municipalities within the county on a per capita basis. Along with rental
vehicle taxes and one-sixth of the municipal vehicle tax, sales tax revenues makeup the “other taxes and licenses” category.
In prior years, this category included all of the municipal vehicle tax provided for in N.C.G.S. 20-97 (b1). As of FY18-19,
revenues generated through the municipal vehicle tax that are not dedicated to transit go directly to the Transportation
Capital Reserve. Other taxes & licenses revenues represent the General Fund’s second largest revenue source for FY22-23
at $19.67 million.
Unrestricted Intergovernmental
The largest portion of unrestricted intergovernmental revenues consists of Utility Sales Taxes (CATV, electric, gas, and
telecommunications), solid waste rebates from Wake County, and the Beer and Wine Tax. Utility sales taxes represent the
largest amount of unrestricted intergovernmental revenues at $3.26 million. The tax is based on gross receipts of the sales
of utility companies within the Town’s corporate limits. The State levies a beer and wine tax on the sale of malt beverages,
fortified wine, and unfortified wine. The State annually distributes a percentage of the tax on the sales of these beverages
generated within the Town’s corporate limits. Beer and wine tax revenues are $250,000 in the FY22-23 Budget.
Restricted Governmental
Restricted intergovernmental revenues include Powell Bill funds and other federal, state, or local government funds or grants
that are restricted for a specific purpose. Powell Bill revenue comes from an appropriation by the State as part of the
biennium budget. The State calculates the annual Powell Bill distribution based on population and the number of road miles
maintained by the Town. Fire tax collections represent revenues collected from residents within the Apex Fire District who
do not live within the Town’s corporate limits. Wake County sets the fire tax rate. The Town receives annual revenues from
the Wake County Public School System to cover partial costs associated with providing resource officers on school campuses.
The Town expects to receive $3.63 million in restricted intergovernmental revenues in FY22-23.
Permits & Fees
Permits and fees predominantly consist of fees associated with development collected through the Planning department
and the Inspections and Permitting department. Use of revenues generated by these fees is mostly restricted to Inspections
and Permitting costs. The FY22-23 budget includes $2.5 million in expected fees specifically for Inspections and Permitting.
Overall, permits and fees revenues account for $3.53 million in the FY22-23 Budget.
88
General Fund Revenues
Sales & Services
Sales and services fees primarily consist of revenues from solid waste, yard waste, and recycling collections and recreation
participation and facility user fees. Refuse collection fees account for $2.85 million in the FY22-23 budget and yard waste
and recycling collection fees account for $2.12 million and $1.26 million respectively. The monthly residential collections
rates are $9.61 for garbage, $7.83 for yard waste, and $4.55 for recycling for FY22-23. Recreation participation and facility
user fees represent $796,600 in the FY22-23 Budget.
Investment Earnings
Investment earnings include the return earned on cash and investment balances. Interest is earned on the cash balances
invested with the North Carolina Capital Management Trust (NCCMT) and other allowable investments in various CD’s and
money market accounts. Investment earnings account for $25,000 in the FY22-23 Budget.
Miscellaneous Revenues
Other revenues represent miscellaneous revenues such as ABC revenues, court fees, parking fines, or revenues that do not
easily fit into other categories. These revenues account for $519,500 in the FY22-23 Budget.
Other Financing Sources
Other financing sources represent revenues received from sale of capital assets and transfers in from capital reserves. These
revenues account for $775,000 in the FY22-23 Budget.
Fund Balance Allocation
Allocations from fund balance represent use of reserve funds. The Town typically uses reserves for specific capital projects,
onetime opportunities, or emergency operations. Fund balance appropriations of $3,620,000 in the FY22-23 budget include
$325,000 for the Firearms Training Range, $400,000 for Eva Perry Library Improvements, $1,500,000 for Aerial Apparatus
Truck, $225,000 for Hunter Street Bike Track, $650,000 for Beaver Creek Greenway, 200,000 for Ragan Road Sidepath, and
$320,000 for Wayfinding Signage.
89
General Fund Revenues
Revenues by Line Item
General Fund Revenues
Line Item
FY20-21
Actual
FY21-22
Budget
FY21-22
Estimate
FY22-23
Recommend
Percent
Change
Current Year Taxes 36,313,685 39,600,200 40,195,000 44,928,000 13.45%
Vehicle Taxes 3,075,490 3,057,000 3,168,000 3,684,400 20.52%
Prior Years 25,659 11,500 31,500 32,000 178.26%
Penalties and Interest 47,062 30,000 47,000 40,000 33.33%
Sales Taxes 15,728,052 15,635,000 17,758,442 19,335,000 23.66%
Motor Vehicle Licenses 242,299 252,400 252,000 250,000 -0.95%
Rental Vehicle Taxes 90,896 80,000 96,000 85,000 6.25%
Utility Franchise 2,941,206 2,760,000 3,109,376 3,265,000 18.30%
Beer and Wine 256,102 225,000 250,000 250,000 11.11%
Solid Waste Rebates - Wake Co 210,262 230,000 166,930 165,000 -28.26%
Powell Bill 1,456,881 1,395,100 1,683,148 1,700,000 21.86%
Police Grants 215,936 190,700 190,700 160,000 -16.10%
Wake County Grants 103,427 413,300 413,300 408,500 -1.16%
Electronics Recycling Funds 7,374 7,400 - - -100.00%
Federal Grants 1,623,799 - 500 - -
FEMA 12,795 - - - -
Fire District - Wake County 1,244,959 1,366,000 1,255,000 1,363,900 -0.15%
Residential Permits 2,444,686 2,200,000 1,713,062 2,000,000 -9.09%
Homeowner Recovery Fees 1,736 1,800 1,300 1,000 -44.44%
Commercial Permits 245,814 225,000 480,000 365,000 62.22%
Reinspection Fees 134,868 150,000 115,000 105,000 -30.00%
Fire Inspections 12,781 12,000 43,000 35,000 191.67%
Driveway Inspection Fees 141,900 135,000 93,000 100,000 -25.93%
Driveway Reinspection Fee 4,200 7,000 2,000 2,000 -71.43%
Subdivision Inspections 511,969 375,000 470,000 500,000 33.33%
Erosion and Site Inspection 103,815 100,000 133,800 130,000 30.00%
Subdivision Approval Fees 153,300 150,000 130,000 125,000 -16.67%
Rezoning Application Fees 28,730 21,000 30,000 25,000 19.05%
Annexation Application Fees 3,400 5,000 3,200 3,000 -40.00%
Water & Sewer Extension Fees 7,500 8,000 10,000 8,000 0.00%
Variance Application Fees 1,800 500 1,500 500 0.00%
Other Application Fees 103,856 90,000 80,000 80,000 -11.11%
Encroachment Agreement Fee 4,928 4,000 4,500 4,000 0.00%
Bond Administration Fee 32,470 21,500 32,000 30,000 39.53%
As-Built Drawing Review 21,200 20,000 15,000 15,000 -25.00%
Fines and Penalties 500 - 13,000 - -
Refuse Collection Fees 2,343,397 2,600,000 2,600,000 2,852,000 9.69%
Refuse Bulk Pick-Up Fees 34,793 30,000 24,000 30,000 0.00%
Yard Waste Fees 1,877,580 2,079,600 2,067,200 2,122,200 2.05%
Recycling Collection Fees 1,194,192 1,360,600 1,219,000 1,257,400 -7.58%
Non-Athletic Programs 101,469 150,000 100,000 100,000 -33.33%
Fishing & Boating Licenses 1,776 1,200 582 1,000 -16.67%
Senior Programs 24,906 25,000 50,000 45,000 80.00%
Senior Trips 3,969 10,000 6,500 10,000 0.00%
Instructional Athletics 23,973 15,000 20,000 20,000 33.33%
90
General Fund Revenues
General Fund Revenues Continued
Line Item
FY20-21
Actual
FY21-22
Budget
FY21-22
Estimate
FY22-23
Recommend
Percent
Change
Youth Leagues 134,800 100,000 115,000 120,000 20.00%
Adult Leagues 63,403 75,000 75,000 75,000 0.00%
Active Net/Turkey Trot 1,605 8,000 35,000 15,000 87.50%
Community Center Rentals 106,853 65,000 102,000 110,000 69.23%
Miscellaneous POS 8,034 2,500 2,500 2,500 0.00%
Planning Documents 20 - - - -
Turf Field Rentals 143,996 100,000 108,000 130,000 30.00%
CAC Rentals 9,767 50,000 20,000 25,000 -50.00%
E-Tickets 3,555 20,000 20,000 25,000 25.00%
Grants 2,350 - 5,000 - -
Art/Sales Commissions 562 - 500 500 -
CAC Programs 51,730 65,000 30,572 65,000 0.00%
Sponsorships 1,600 6,000 5,075 7,500 25.00%
Concessions 40 3,000 500 3,000 0.00%
Art Center Miscellaneous 24 2,000 25 100 -95.00%
Dog Park Passes 34,462 30,000 22,000 30,000 0.00%
Duke-Harris Plant (Fire) - 12,000 - 12,000 0.00%
Special Events 50 - - - -
PY Grant Repayment 637,750 - - - -
Interest Earned 95,125 40,000 10,000 25,000 -37.50%
Powell Bill Interest 439 - 30 - -
Tricentennial Interest 12 - 1 - -
Miscellaneous Revenue 65,335 50,000 100,000 50,000 0.00%
Cash Short and Over - - - - -
ABC Revenues 351,531 300,000 425,000 450,000 -
Court Costs and Officer Fees 16,716 12,000 12,000 12,000 -96.00%
Vendor Permits 8,900 8,500 6,000 8,500 -29.17%
Recreation Donations 12,000 - - - -
Fire Department Donations - - 750 - -
Donations - 9/11 Memorial 3,976 600 - - -100.00%
Promotional Activities/Items 2,549 2,500 3,000 2,500 0.00%
Insurance Refunds 119,414 21,877 - - -100.00%
NCLM Safety Grant 1,250 - 2,500 5,000 -
Sale of Capital Assets 45,192 25,000 35,500 25,000 0.00%
Transfer from W/S (Stormwater) - 1,000,000 1,000,000 - -100.00%
Transfer from Rec. Captl Reserve Fund 568,072 - - - -
Transfer from Transportation Reserve Fund 361,427 600,000 600,000 750,000 25.00%
Fund Balance Appropriated - Budget - 1,549,000 - 3,620,000 133.70%
Fund Balance Appropriated - Amend - 2,262,600 - - -100.00%
Fund Bal App - PO Carryover - 2,995,529 - - -100.00%
Total $77,557,531 $84,456,906 $80,810,492 $91,201,500 7.99%
91
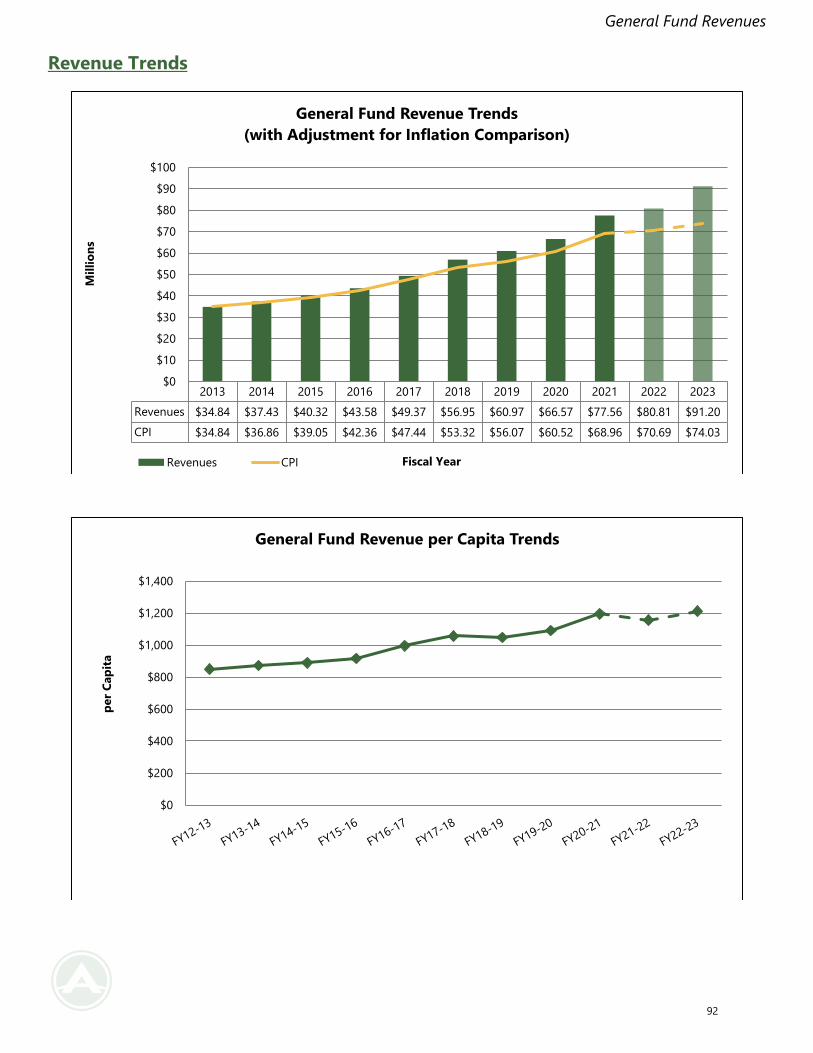
General Fund Revenues
Revenue Trends
2013 2014 2015 2016 2017 2018 2019 2020 2021 2022 2023
Revenues $34.84 $37.43 $40.32 $43.58 $49.37 $56.95 $60.97 $66.57 $77.56 $80.81 $91.20
CPI $34.84 $36.86 $39.05 $42.36 $47.44 $53.32 $56.07 $60.52 $68.96 $70.69 $74.03
$0
$10
$20
$30
$40
$50
$60
$70
$80
$90
$100
Mil
lio
ns
Fiscal Year
General Fund Revenue Trends
(with Adjustment for Inflation Comparison)
Revenues CPI
$0
$200
$400
$600
$800
$1,000
$1,200
$1,400
per
Cap
ita
General Fund Revenue per Capita Trends
92
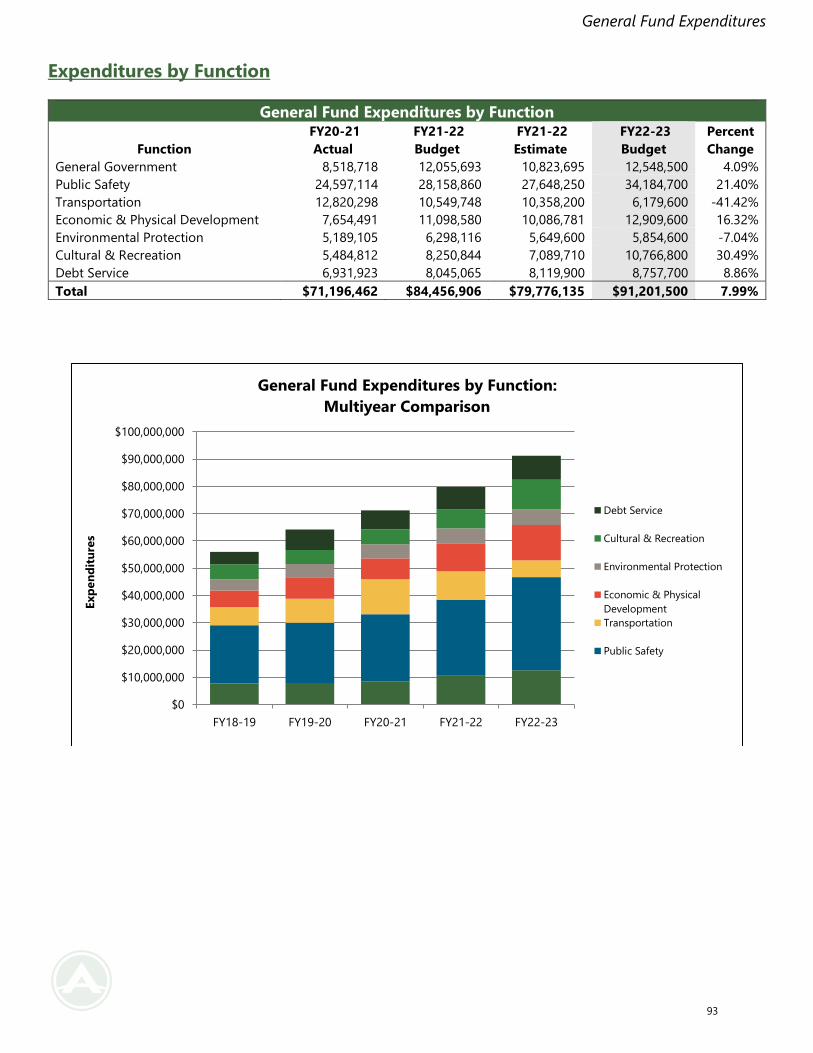
General Fund Expenditures
Expenditures by Function
General Fund Expenditures by Function
Function
FY20-21
Actual
FY21-22
Budget
FY21-22
Estimate
FY22-23
Budget
Percent
Change
General Government 8,518,718 12,055,693 10,823,695 12,548,500 4.09%
Public Safety 24,597,114 28,158,860 27,648,250 34,184,700 21.40%
Transportation 12,820,298 10,549,748 10,358,200 6,179,600 -41.42%
Economic & Physical Development 7,654,491 11,098,580 10,086,781 12,909,600 16.32%
Environmental Protection 5,189,105 6,298,116 5,649,600 5,854,600 -7.04%
Cultural & Recreation 5,484,812 8,250,844 7,089,710 10,766,800 30.49%
Debt Service 6,931,923 8,045,065 8,119,900 8,757,700 8.86%
Total $71,196,462 $84,456,906 $79,776,135 $91,201,500 7.99%
$0
$10,000,000
$20,000,000
$30,000,000
$40,000,000
$50,000,000
$60,000,000
$70,000,000
$80,000,000
$90,000,000
$100,000,000
FY18-19 FY19-20 FY20-21 FY21-22 FY22-23
Exp
en
dit
ure
s
General Fund Expenditures by Function:
Multiyear Comparison
Debt Service
Cultural & Recreation
Environmental Protection
Economic & Physical
Development
Transportation
Public Safety
93
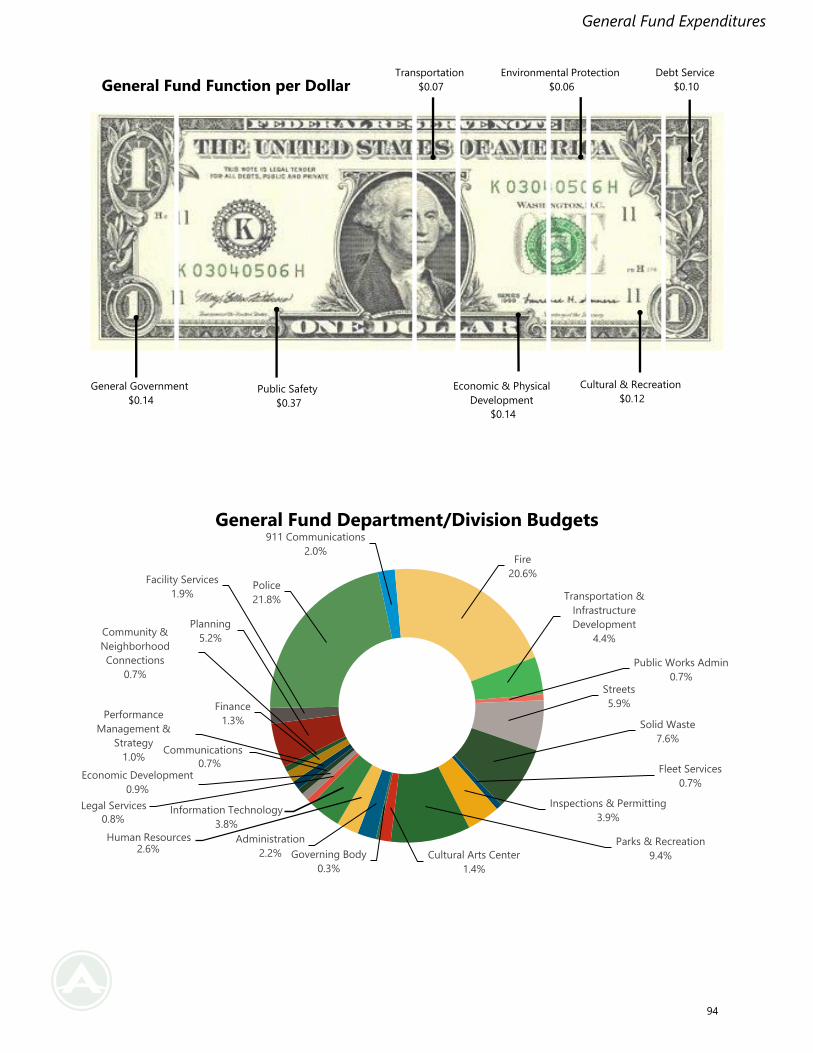
General Fund Expenditures
General Government
$0.14 Public Safety
$0.37
Transportation
$0.07
Economic & Physical
Development
$0.14
Environmental Protection
$0.06
Cultural & Recreation
$0.12
Debt Service
$0.10 General Fund Function per Dollar
Governing Body
0.3%
Administration
2.2%
Human Resources2.6%
Information Technology
3.8%
Legal Services
0.8%
Economic Development 0.9%
Communications
0.7%
Performance
Management &
Strategy
1.0%
Finance
1.3%
Community &
Neighborhood
Connections
0.7%
Planning
5.2%
Facility Services
1.9%Police
21.8%
911 Communications
2.0%Fire
20.6%
Transportation &
Infrastructure
Development
4.4%
Public Works Admin
0.7%Streets
5.9%
Solid Waste
7.6%
Fleet Services
0.7%
Inspections & Permitting
3.9%
Parks & Recreation
9.4%Cultural Arts Center
1.4%
General Fund Department/Division Budgets
94
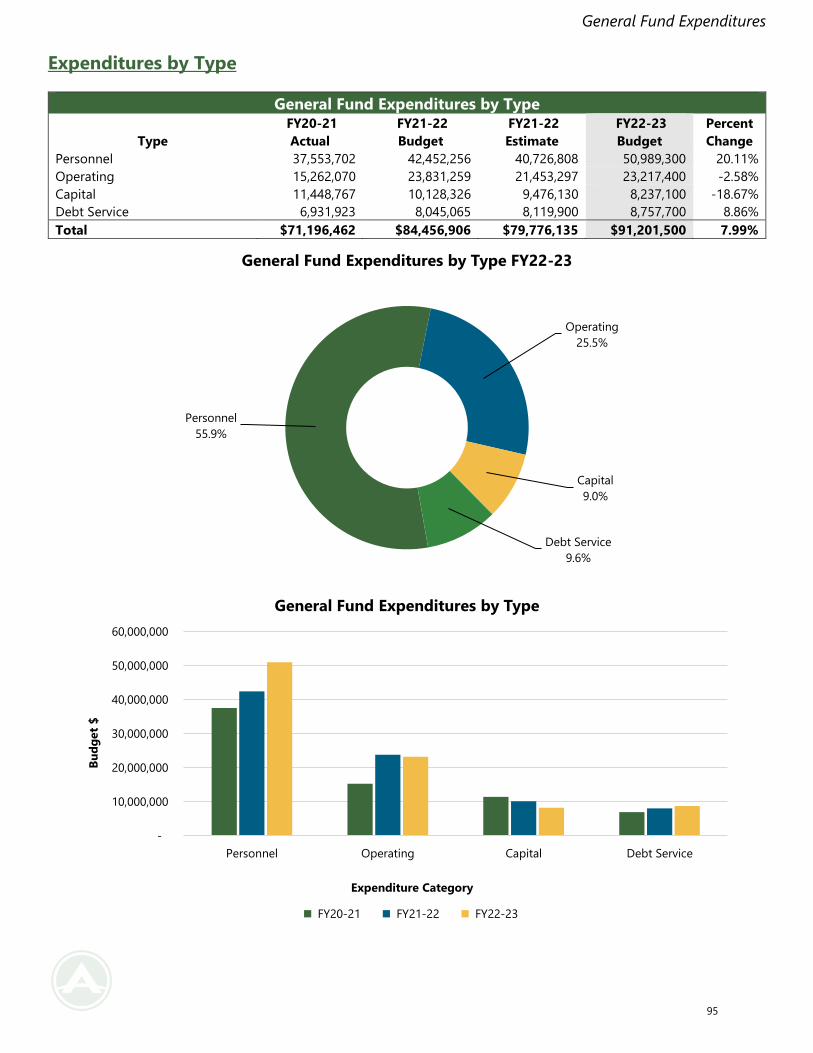
General Fund Expenditures
Expenditures by Type
General Fund Expenditures by Type
Type
FY20-21
Actual
FY21-22
Budget
FY21-22
Estimate
FY22-23
Budget
Percent
Change
Personnel 37,553,702 42,452,256 40,726,808 50,989,300 20.11%
Operating 15,262,070 23,831,259 21,453,297 23,217,400 -2.58%
Capital 11,448,767 10,128,326 9,476,130 8,237,100 -18.67%
Debt Service 6,931,923 8,045,065 8,119,900 8,757,700 8.86%
Total $71,196,462 $84,456,906 $79,776,135 $91,201,500 7.99%
Personnel
55.9%
Operating
25.5%
Capital
9.0%
Debt Service
9.6%
General Fund Expenditures by Type FY22-23
-
10,000,000
20,000,000
30,000,000
40,000,000
50,000,000
60,000,000
Personnel Operating Capital Debt Service
Bu
dg
et
$
Expenditure Category
General Fund Expenditures by Type
FY20-21 FY21-22 FY22-23
95
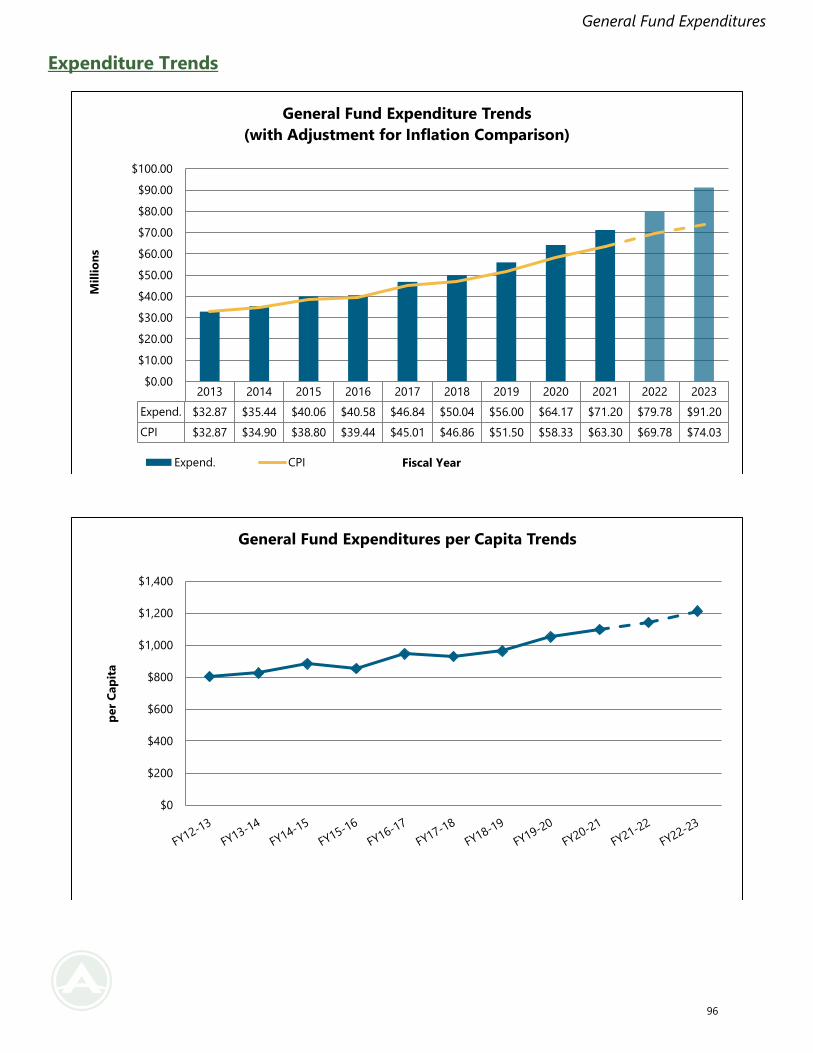
General Fund Expenditures
Expenditure Trends
2013 2014 2015 2016 2017 2018 2019 2020 2021 2022 2023
Expend. $32.87 $35.44 $40.06 $40.58 $46.84 $50.04 $56.00 $64.17 $71.20 $79.78 $91.20
CPI $32.87 $34.90 $38.80 $39.44 $45.01 $46.86 $51.50 $58.33 $63.30 $69.78 $74.03
$0.00
$10.00
$20.00
$30.00
$40.00
$50.00
$60.00
$70.00
$80.00
$90.00
$100.00
Mil
lio
ns
Fiscal Year
General Fund Expenditure Trends
(with Adjustment for Inflation Comparison)
Expend. CPI
$0
$200
$400
$600
$800
$1,000
$1,200
$1,400
per
Cap
ita
General Fund Expenditures per Capita Trends
96
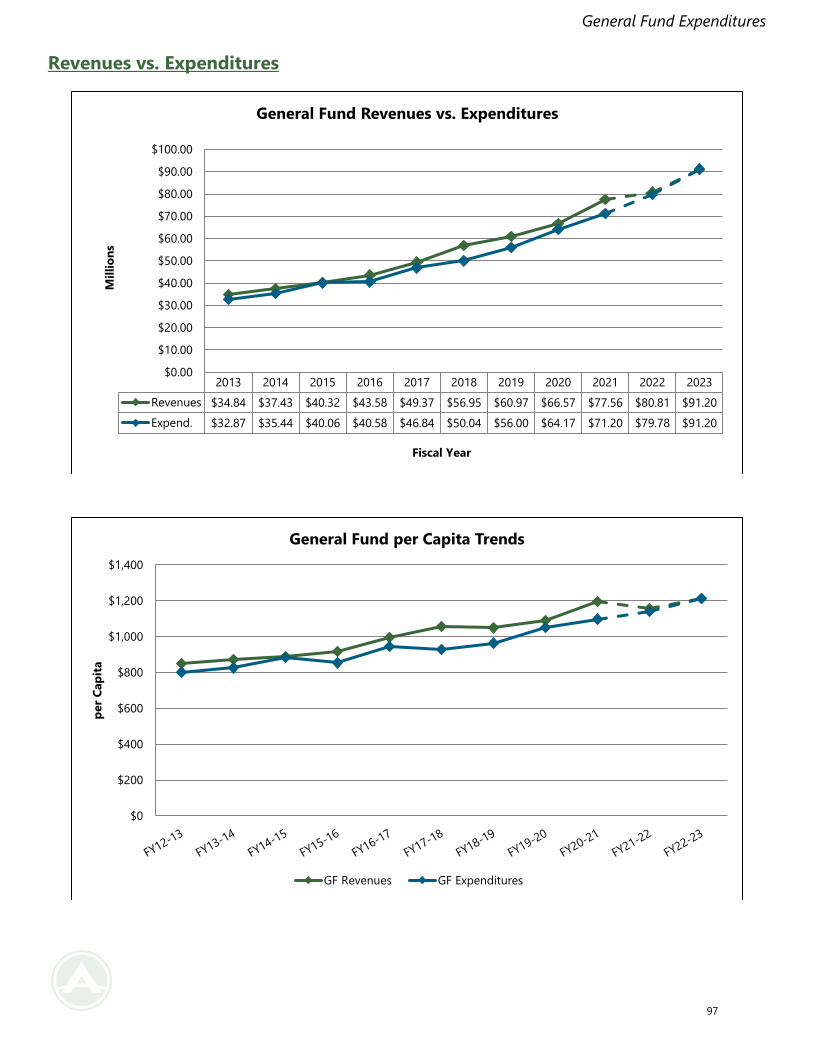
General Fund Expenditures
Revenues vs. Expenditures
2013 2014 2015 2016 2017 2018 2019 2020 2021 2022 2023
Revenues $34.84 $37.43 $40.32 $43.58 $49.37 $56.95 $60.97 $66.57 $77.56 $80.81 $91.20
Expend. $32.87 $35.44 $40.06 $40.58 $46.84 $50.04 $56.00 $64.17 $71.20 $79.78 $91.20
$0.00
$10.00
$20.00
$30.00
$40.00
$50.00
$60.00
$70.00
$80.00
$90.00
$100.00
Mil
lio
ns
Fiscal Year
General Fund Revenues vs. Expenditures
$0
$200
$400
$600
$800
$1,000
$1,200
$1,400
per
Cap
ita
General Fund per Capita Trends
GF Revenues GF Expenditures
97
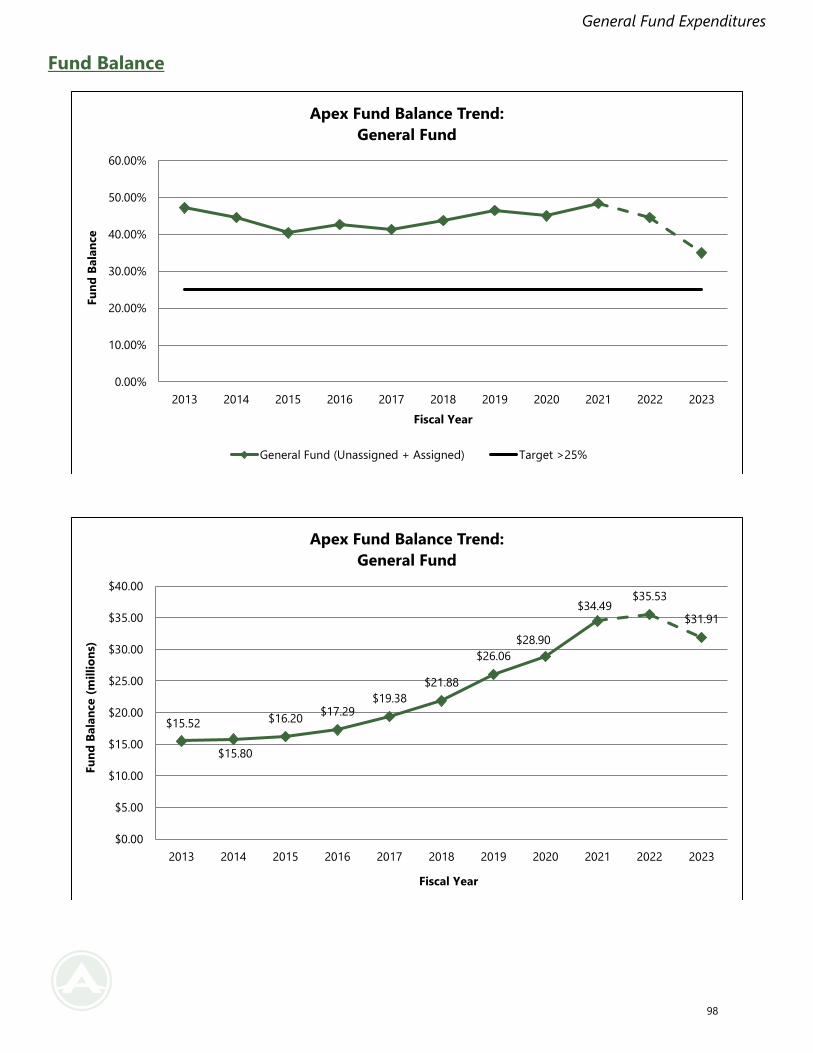
General Fund Expenditures
Fund Balance
0.00%
10.00%
20.00%
30.00%
40.00%
50.00%
60.00%
2013 2014 2015 2016 2017 2018 2019 2020 2021 2022 2023
Fu
nd
Bala
nce
Fiscal Year
Apex Fund Balance Trend:
General Fund
General Fund (Unassigned + Assigned) Target >25%
$15.52
$15.80
$16.20$17.29
$19.38
$21.88
$26.06
$28.90
$34.49$35.53
$31.91
$0.00
$5.00
$10.00
$15.00
$20.00
$25.00
$30.00
$35.00
$40.00
2013 2014 2015 2016 2017 2018 2019 2020 2021 2022 2023
Fu
nd
Bala
nce (
mil
lio
ns)
Fiscal Year
Apex Fund Balance Trend:
General Fund
98
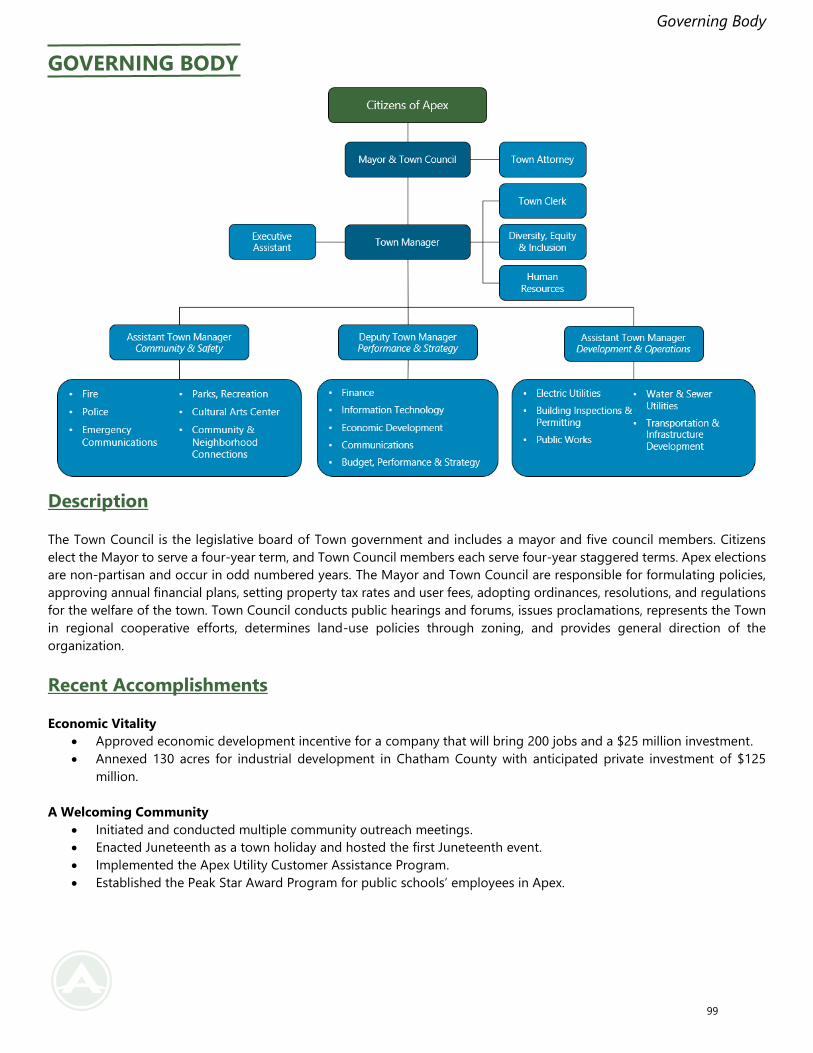
Governing Body
GOVERNING BODY
Description
The Town Council is the legislative board of Town government and includes a mayor and five council members. Citizens
elect the Mayor to serve a four-year term, and Town Council members each serve four-year staggered terms. Apex elections
are non-partisan and occur in odd numbered years. The Mayor and Town Council are responsible for formulating policies,
approving annual financial plans, setting property tax rates and user fees, adopting ordinances, resolutions, and regulations
for the welfare of the town. Town Council conducts public hearings and forums, issues proclamations, represents the Town
in regional cooperative efforts, determines land-use policies through zoning, and provides general direction of the
organization.
Recent Accomplishments
Economic Vitality
• Approved economic development incentive for a company that will bring 200 jobs and a $25 million investment.
• Annexed 130 acres for industrial development in Chatham County with anticipated private investment of $125
million.
A Welcoming Community
• Initiated and conducted multiple community outreach meetings.
• Enacted Juneteenth as a town holiday and hosted the first Juneteenth event.
• Implemented the Apex Utility Customer Assistance Program.
• Established the Peak Star Award Program for public schools’ employees in Apex.
99
Governing Body
High Performing Government
• Approval of Organization Assessment.
• Adoption of Strategic Plan.
Environmental Leadership
• Approved and participated in first EarthFest event.
• Approved a pollinator project to improve the health of rights-of-way by natural methods, including native plants
and bees.
• Created and funded an Urban Forester position.
Responsible Development
• Established the Housing Advisory Board.
• Approved and held successful bond referendum for transportation projects including Safe Routes to School and the
Peakway Bridge.
FY 2022-2023 Budget Highlights
• The Governing Body budget decreased 21.55 percent in FY22-23 primarily due to the off year for municipal elections.
• The Governing Body budget accounts for 0.28 percent of the General Fund budget and is equivalent to $0.002 on
the tax rate.
• The Town plans to spend $3.41 per capita for the Governing Body in FY22-23.
• Major budget changes include $10,000 in professional services for a retreat facilitator and $24,000 in meeting &
event provisions for the Town holiday lunch.
100
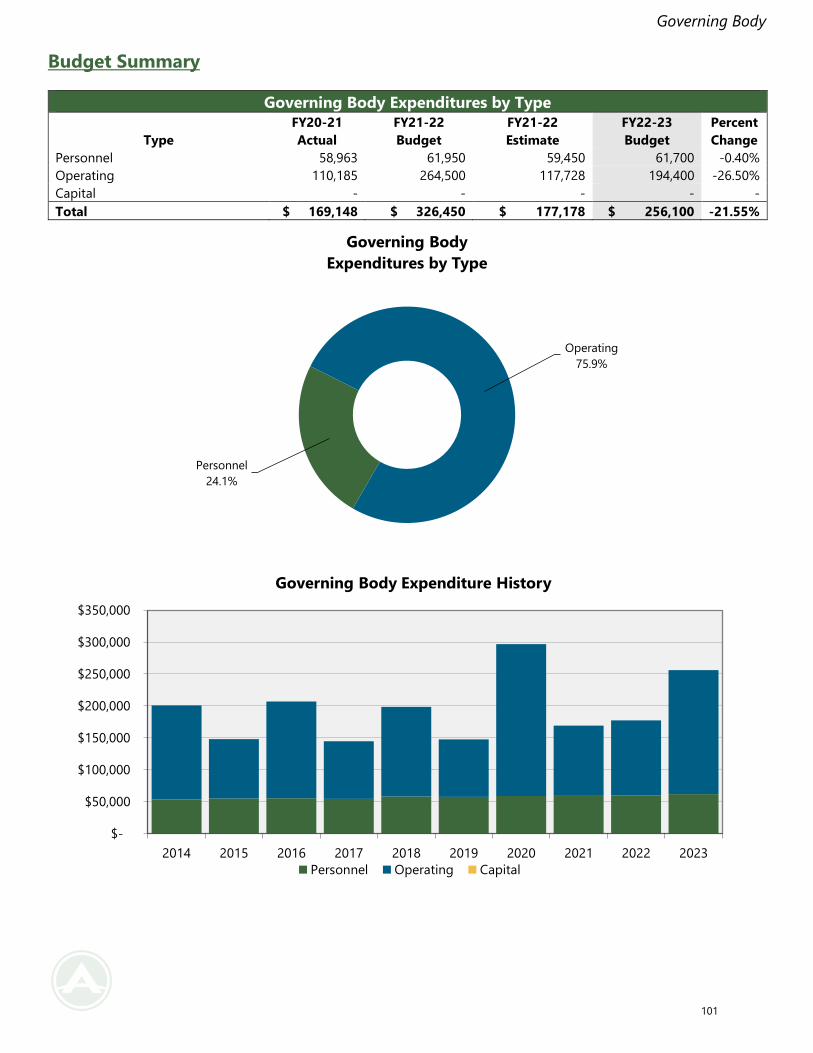
Governing Body
Budget Summary
Governing Body Expenditures by Type
Type
FY20-21
Actual
FY21-22
Budget
FY21-22
Estimate
FY22-23
Budget
Percent
Change
Personnel 58,963 61,950 59,450 61,700 -0.40%
Operating 110,185 264,500 117,728 194,400 -26.50%
Capital - - - - -
Total $ 169,148 $ 326,450 $ 177,178 $ 256,100 -21.55%
Personnel
24.1%
Operating
75.9%
Governing Body
Expenditures by Type
$-
$50,000
$100,000
$150,000
$200,000
$250,000
$300,000
$350,000
2014 2015 2016 2017 2018 2019 2020 2021 2022 2023
Governing Body Expenditure History
Personnel Operating Capital
101
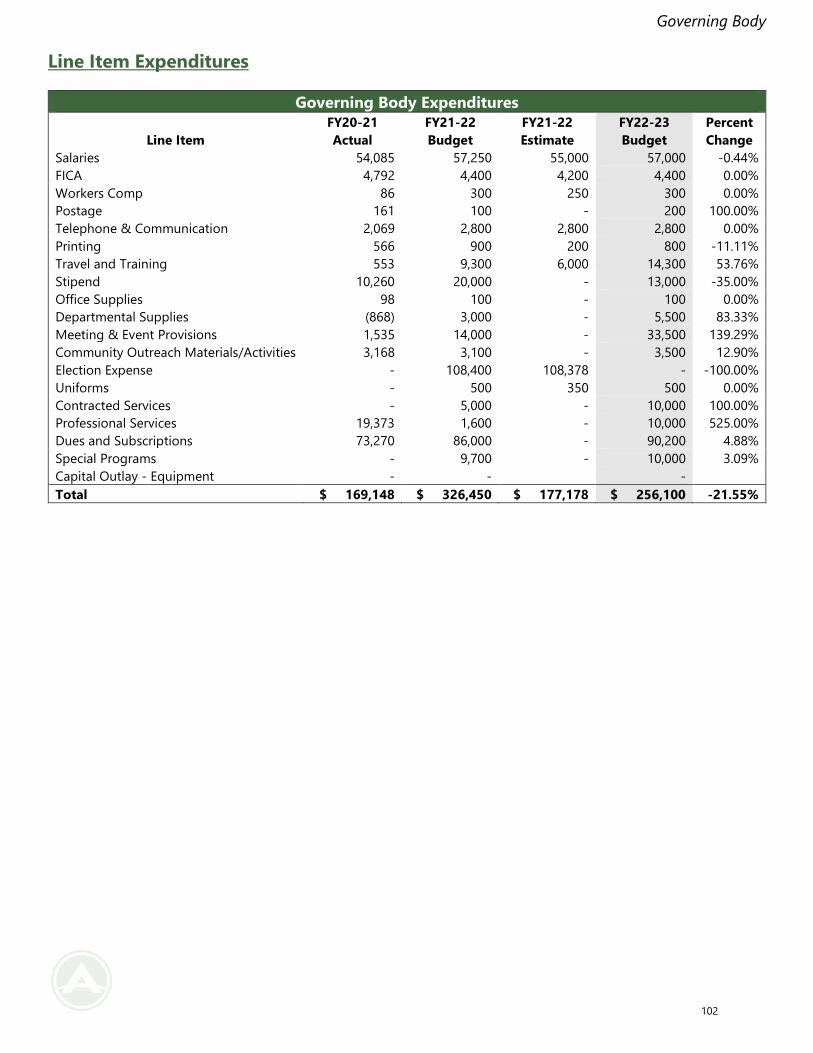
Governing Body
Line Item Expenditures
Governing Body Expenditures
Line Item
FY20-21
Actual
FY21-22
Budget
FY21-22
Estimate
FY22-23
Budget
Percent
Change
Salaries 54,085 57,250 55,000 57,000 -0.44%
FICA 4,792 4,400 4,200 4,400 0.00%
Workers Comp 86 300 250 300 0.00%
Postage 161 100 - 200 100.00%
Telephone & Communication 2,069 2,800 2,800 2,800 0.00%
Printing 566 900 200 800 -11.11%
Travel and Training 553 9,300 6,000 14,300 53.76%
Stipend 10,260 20,000 - 13,000 -35.00%
Office Supplies 98 100 - 100 0.00%
Departmental Supplies (868) 3,000 - 5,500 83.33%
Meeting & Event Provisions 1,535 14,000 - 33,500 139.29%
Community Outreach Materials/Activities 3,168 3,100 - 3,500 12.90%
Election Expense - 108,400 108,378 - -100.00%
Uniforms - 500 350 500 0.00%
Contracted Services - 5,000 - 10,000 100.00%
Professional Services 19,373 1,600 - 10,000 525.00%
Dues and Subscriptions 73,270 86,000 - 90,200 4.88%
Special Programs - 9,700 - 10,000 3.09%
Capital Outlay - Equipment - - -
Total $ 169,148 $ 326,450 $ 177,178 $ 256,100 -21.55%
102
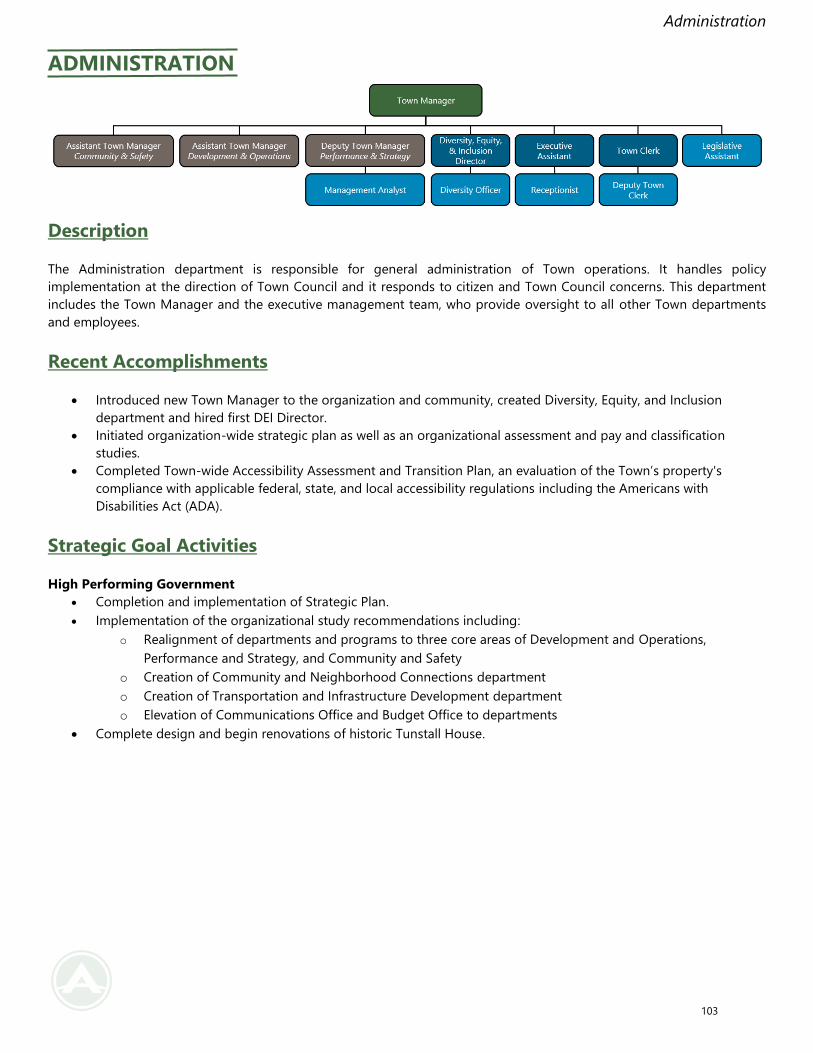
Administration
ADMINISTRATION
Description
The Administration department is responsible for general administration of Town operations. It handles policy
implementation at the direction of Town Council and it responds to citizen and Town Council concerns. This department
includes the Town Manager and the executive management team, who provide oversight to all other Town departments
and employees.
Recent Accomplishments
• Introduced new Town Manager to the organization and community, created Diversity, Equity, and Inclusion
department and hired first DEI Director.
• Initiated organization-wide strategic plan as well as an organizational assessment and pay and classification
studies.
• Completed Town-wide Accessibility Assessment and Transition Plan, an evaluation of the Town’s property's
compliance with applicable federal, state, and local accessibility regulations including the Americans with
Disabilities Act (ADA).
Strategic Goal Activities
High Performing Government
• Completion and implementation of Strategic Plan.
• Implementation of the organizational study recommendations including:
o Realignment of departments and programs to three core areas of Development and Operations,
Performance and Strategy, and Community and Safety
o Creation of Community and Neighborhood Connections department
o Creation of Transportation and Infrastructure Development department
o Elevation of Communications Office and Budget Office to departments
• Complete design and begin renovations of historic Tunstall House.
103
Administration
FY 2022-2023 Budget Highlights
• The Administration department budget decreased 23.25 percent in FY22-23.
• The Administration budget accounts for 1.86 percent of the General Fund budget and is equivalent to $0.014 on
the tax rate.
• The Town plans to spend $22.55 per capita for Administration in FY22-23.
• Major budget changes include elevation of the Communications team and Budget team into individual departments
and the Development Services team and Capital Projects team moving to the Transportation & Infrastructure
Development department. The Office of the Town Clerk, previously its own department, is reassigned to
Administration.
• The Administration budget also includes the Diversity, Equity, and Inclusion Office that the Town created with the
hiring of it first DEI Director in February 2022.
• Administration will add two new positions in FY22-23, a Deputy Town Manager and a Management Analyst. With
the significant amount of position reassignment, the budget reflects a significant decrease in all aspects of the
Administration budget for FY22-23.
104
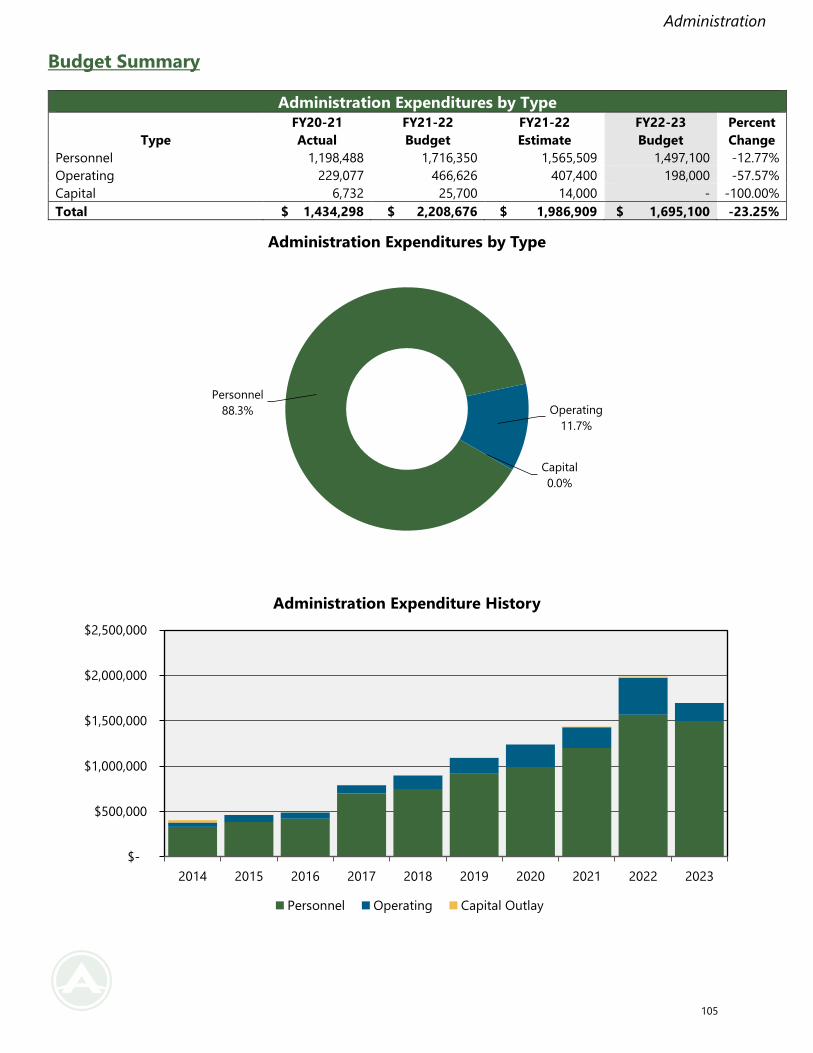
Administration
Budget Summary
Administration Expenditures by Type
Type
FY20-21
Actual
FY21-22
Budget
FY21-22
Estimate
FY22-23
Budget
Percent
Change
Personnel 1,198,488 1,716,350 1,565,509 1,497,100 -12.77%
Operating 229,077 466,626 407,400 198,000 -57.57%
Capital 6,732 25,700 14,000 - -100.00%
Total $ 1,434,298 $ 2,208,676 $ 1,986,909 $ 1,695,100 -23.25%
Personnel
88.3% Operating
11.7%
Capital
0.0%
Administration Expenditures by Type
$-
$500,000
$1,000,000
$1,500,000
$2,000,000
$2,500,000
2014 2015 2016 2017 2018 2019 2020 2021 2022 2023
Administration Expenditure History
Personnel Operating Capital Outlay
105
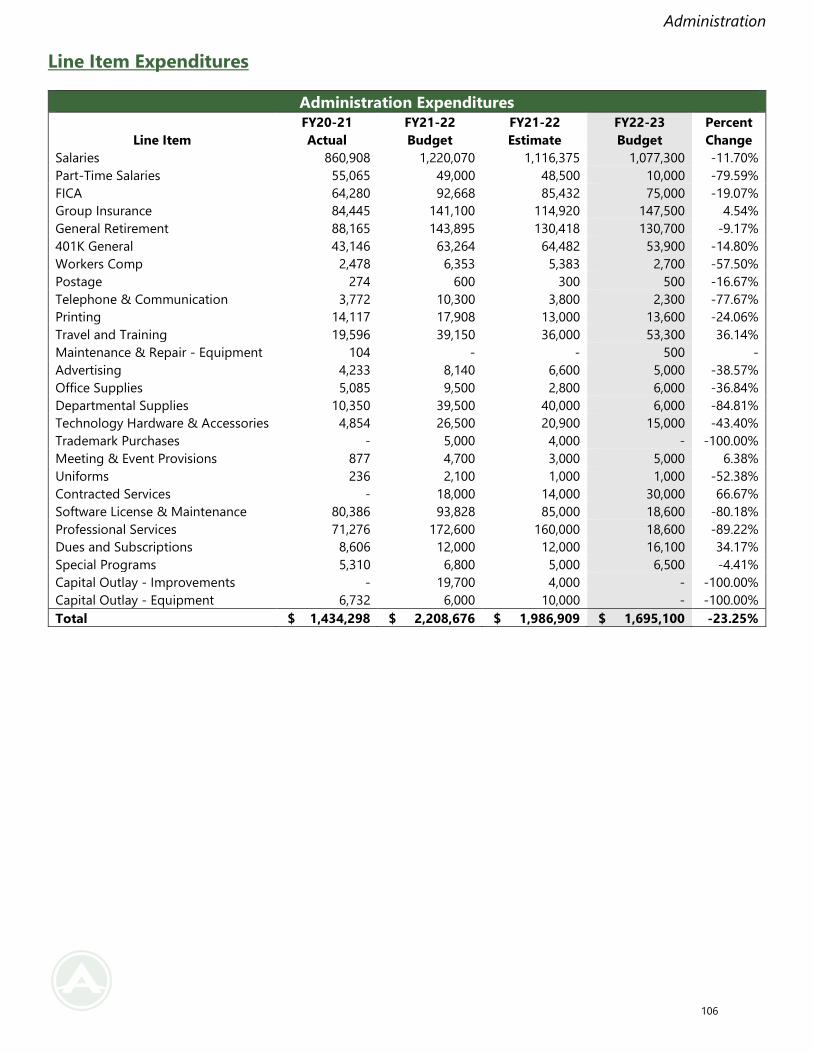
Administration
Line Item Expenditures
Administration Expenditures
Line Item
FY20-21
Actual
FY21-22
Budget
FY21-22
Estimate
FY22-23
Budget
Percent
Change
Salaries 860,908 1,220,070 1,116,375 1,077,300 -11.70%
Part-Time Salaries 55,065 49,000 48,500 10,000 -79.59%
FICA 64,280 92,668 85,432 75,000 -19.07%
Group Insurance 84,445 141,100 114,920 147,500 4.54%
General Retirement 88,165 143,895 130,418 130,700 -9.17%
401K General 43,146 63,264 64,482 53,900 -14.80%
Workers Comp 2,478 6,353 5,383 2,700 -57.50%
Postage 274 600 300 500 -16.67%
Telephone & Communication 3,772 10,300 3,800 2,300 -77.67%
Printing 14,117 17,908 13,000 13,600 -24.06%
Travel and Training 19,596 39,150 36,000 53,300 36.14%
Maintenance & Repair - Equipment 104 - - 500 -
Advertising 4,233 8,140 6,600 5,000 -38.57%
Office Supplies 5,085 9,500 2,800 6,000 -36.84%
Departmental Supplies 10,350 39,500 40,000 6,000 -84.81%
Technology Hardware & Accessories 4,854 26,500 20,900 15,000 -43.40%
Trademark Purchases - 5,000 4,000 - -100.00%
Meeting & Event Provisions 877 4,700 3,000 5,000 6.38%
Uniforms 236 2,100 1,000 1,000 -52.38%
Contracted Services - 18,000 14,000 30,000 66.67%
Software License & Maintenance 80,386 93,828 85,000 18,600 -80.18%
Professional Services 71,276 172,600 160,000 18,600 -89.22%
Dues and Subscriptions 8,606 12,000 12,000 16,100 34.17%
Special Programs 5,310 6,800 5,000 6,500 -4.41%
Capital Outlay - Improvements - 19,700 4,000 - -100.00%
Capital Outlay - Equipment 6,732 6,000 10,000 - -100.00%
Total $ 1,434,298 $ 2,208,676 $ 1,986,909 $ 1,695,100 -23.25%
106
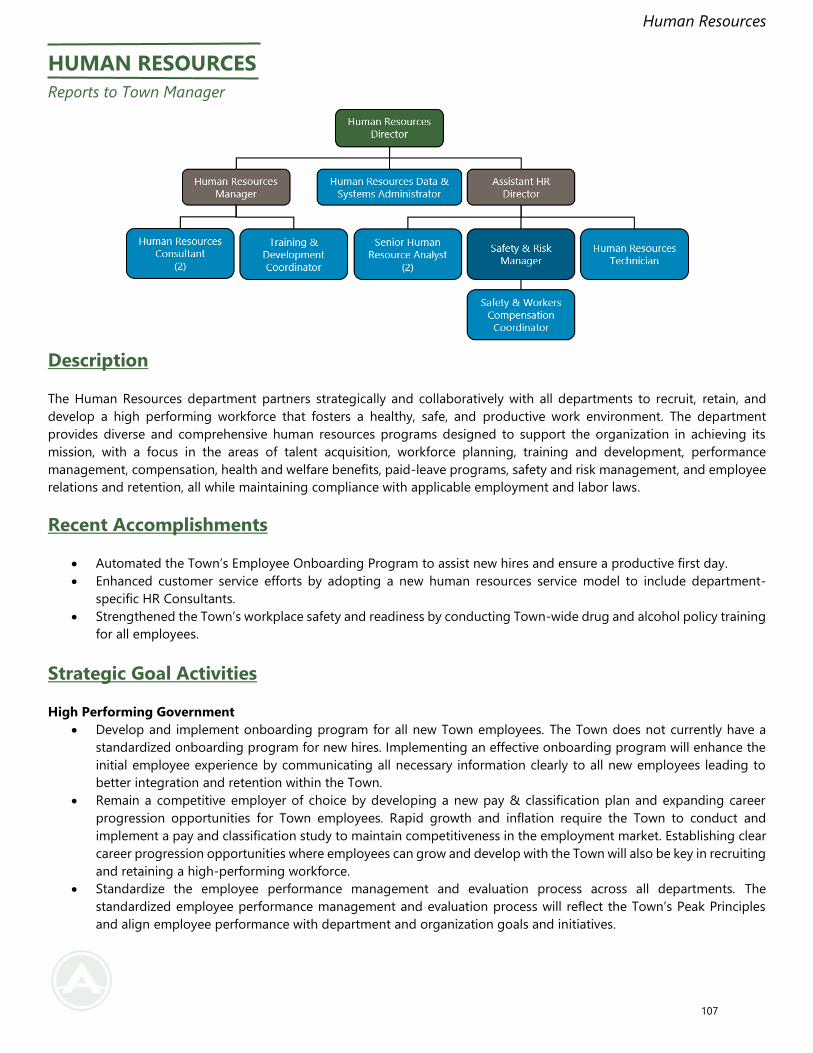
Human Resources
HUMAN RESOURCES
Reports to Town Manager
Description
The Human Resources department partners strategically and collaboratively with all departments to recruit, retain, and
develop a high performing workforce that fosters a healthy, safe, and productive work environment. The department
provides diverse and comprehensive human resources programs designed to support the organization in achieving its
mission, with a focus in the areas of talent acquisition, workforce planning, training and development, performance
management, compensation, health and welfare benefits, paid-leave programs, safety and risk management, and employee
relations and retention, all while maintaining compliance with applicable employment and labor laws.
Recent Accomplishments
• Automated the Town’s Employee Onboarding Program to assist new hires and ensure a productive first day.
• Enhanced customer service efforts by adopting a new human resources service model to include department-
specific HR Consultants.
• Strengthened the Town’s workplace safety and readiness by conducting Town-wide drug and alcohol policy training
for all employees.
Strategic Goal Activities
High Performing Government
• Develop and implement onboarding program for all new Town employees. The Town does not currently have a
standardized onboarding program for new hires. Implementing an effective onboarding program will enhance the
initial employee experience by communicating all necessary information clearly to all new employees leading to
better integration and retention within the Town.
• Remain a competitive employer of choice by developing a new pay & classification plan and expanding career
progression opportunities for Town employees. Rapid growth and inflation require the Town to conduct and
implement a pay and classification study to maintain competitiveness in the employment market. Establishing clear
career progression opportunities where employees can grow and develop with the Town will also be key in recruiting
and retaining a high-performing workforce.
• Standardize the employee performance management and evaluation process across all departments. The
standardized employee performance management and evaluation process will reflect the Town’s Peak Principles
and align employee performance with department and organization goals and initiatives.
107
Human Resources
FY 2022-2023 Budget Highlights
• The Human Resources department budget increased 3.01 percent in FY22-23.
• The Human Resources budget accounts for 2.18 percent of the General Fund budget and is equivalent to $0.017 on
the tax rate.
• The Town plans to spend $26.45 per capita for Human Resources in FY22-23.
• Major budget changes include the addition of four new positions, including, Training & Development Coordinator,
Senior Human Resources Analyst, Safety & Workers Compensation Coordinators, and an Assistant HR Director and
the costs associated with onboarding. There is an increase in capital equipment due office furniture needed to
change locations within Town Hall.
108
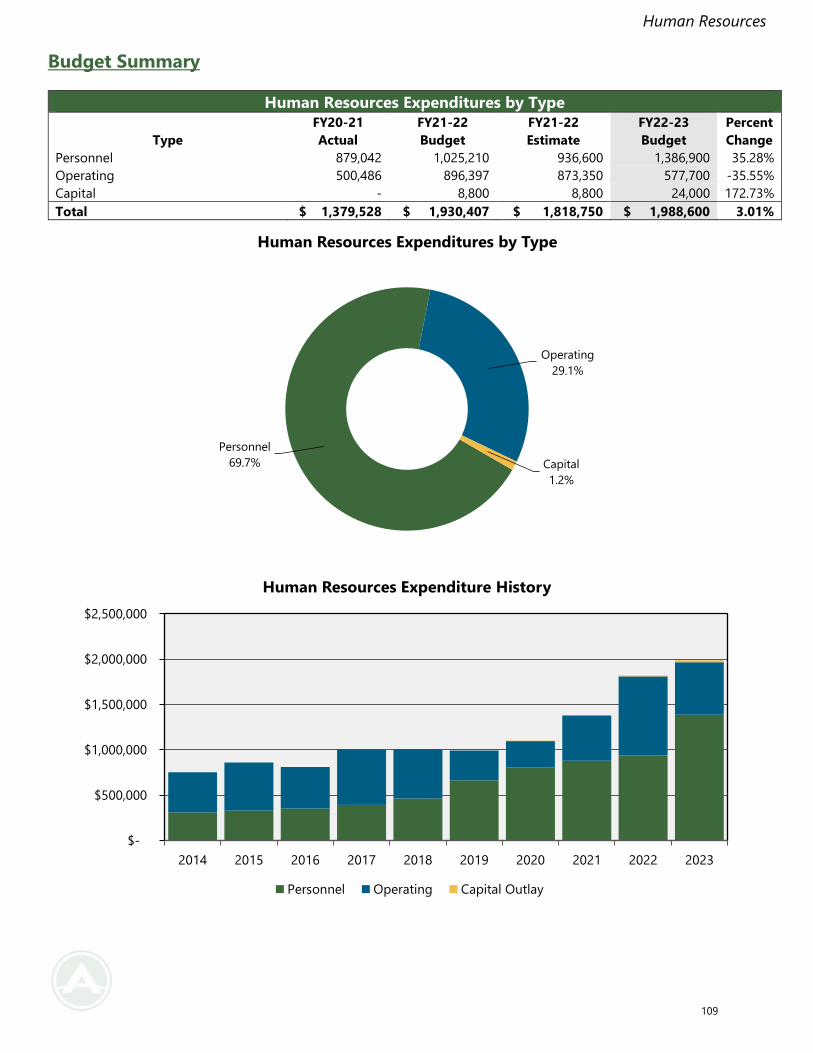
Human Resources
Budget Summary
Human Resources Expenditures by Type
Type
FY20-21
Actual
FY21-22
Budget
FY21-22
Estimate
FY22-23
Budget
Percent
Change
Personnel 879,042 1,025,210 936,600 1,386,900 35.28%
Operating 500,486 896,397 873,350 577,700 -35.55%
Capital - 8,800 8,800 24,000 172.73%
Total $ 1,379,528 $ 1,930,407 $ 1,818,750 $ 1,988,600 3.01%
Personnel
69.7%
Operating
29.1%
Capital
1.2%
Human Resources Expenditures by Type
$-
$500,000
$1,000,000
$1,500,000
$2,000,000
$2,500,000
2014 2015 2016 2017 2018 2019 2020 2021 2022 2023
Human Resources Expenditure History
Personnel Operating Capital Outlay
109
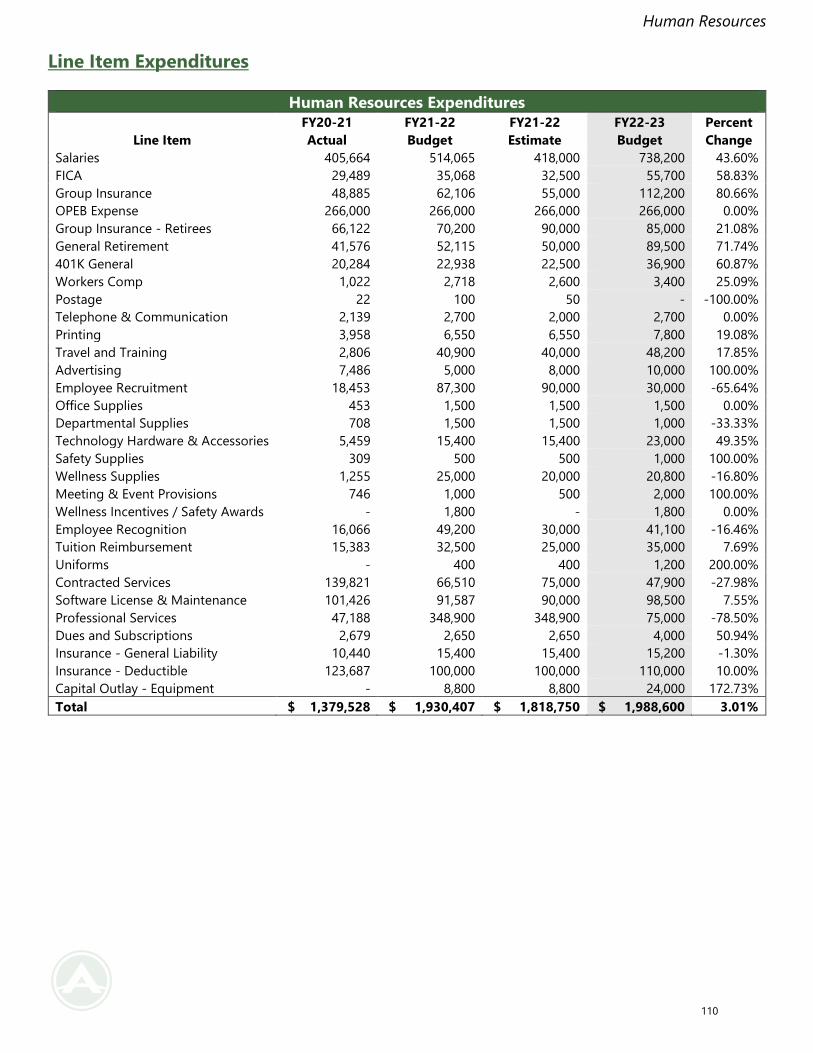
Human Resources
Line Item Expenditures
Human Resources Expenditures
Line Item
FY20-21
Actual
FY21-22
Budget
FY21-22
Estimate
FY22-23
Budget
Percent
Change
Salaries 405,664 514,065 418,000 738,200 43.60%
FICA 29,489 35,068 32,500 55,700 58.83%
Group Insurance 48,885 62,106 55,000 112,200 80.66%
OPEB Expense 266,000 266,000 266,000 266,000 0.00%
Group Insurance - Retirees 66,122 70,200 90,000 85,000 21.08%
General Retirement 41,576 52,115 50,000 89,500 71.74%
401K General 20,284 22,938 22,500 36,900 60.87%
Workers Comp 1,022 2,718 2,600 3,400 25.09%
Postage 22 100 50 - -100.00%
Telephone & Communication 2,139 2,700 2,000 2,700 0.00%
Printing 3,958 6,550 6,550 7,800 19.08%
Travel and Training 2,806 40,900 40,000 48,200 17.85%
Advertising 7,486 5,000 8,000 10,000 100.00%
Employee Recruitment 18,453 87,300 90,000 30,000 -65.64%
Office Supplies 453 1,500 1,500 1,500 0.00%
Departmental Supplies 708 1,500 1,500 1,000 -33.33%
Technology Hardware & Accessories 5,459 15,400 15,400 23,000 49.35%
Safety Supplies 309 500 500 1,000 100.00%
Wellness Supplies 1,255 25,000 20,000 20,800 -16.80%
Meeting & Event Provisions 746 1,000 500 2,000 100.00%
Wellness Incentives / Safety Awards - 1,800 - 1,800 0.00%
Employee Recognition 16,066 49,200 30,000 41,100 -16.46%
Tuition Reimbursement 15,383 32,500 25,000 35,000 7.69%
Uniforms - 400 400 1,200 200.00%
Contracted Services 139,821 66,510 75,000 47,900 -27.98%
Software License & Maintenance 101,426 91,587 90,000 98,500 7.55%
Professional Services 47,188 348,900 348,900 75,000 -78.50%
Dues and Subscriptions 2,679 2,650 2,650 4,000 50.94%
Insurance - General Liability 10,440 15,400 15,400 15,200 -1.30%
Insurance - Deductible 123,687 100,000 100,000 110,000 10.00%
Capital Outlay - Equipment - 8,800 8,800 24,000 172.73%
Total $ 1,379,528 $ 1,930,407 $ 1,818,750 $ 1,988,600 3.01%
110
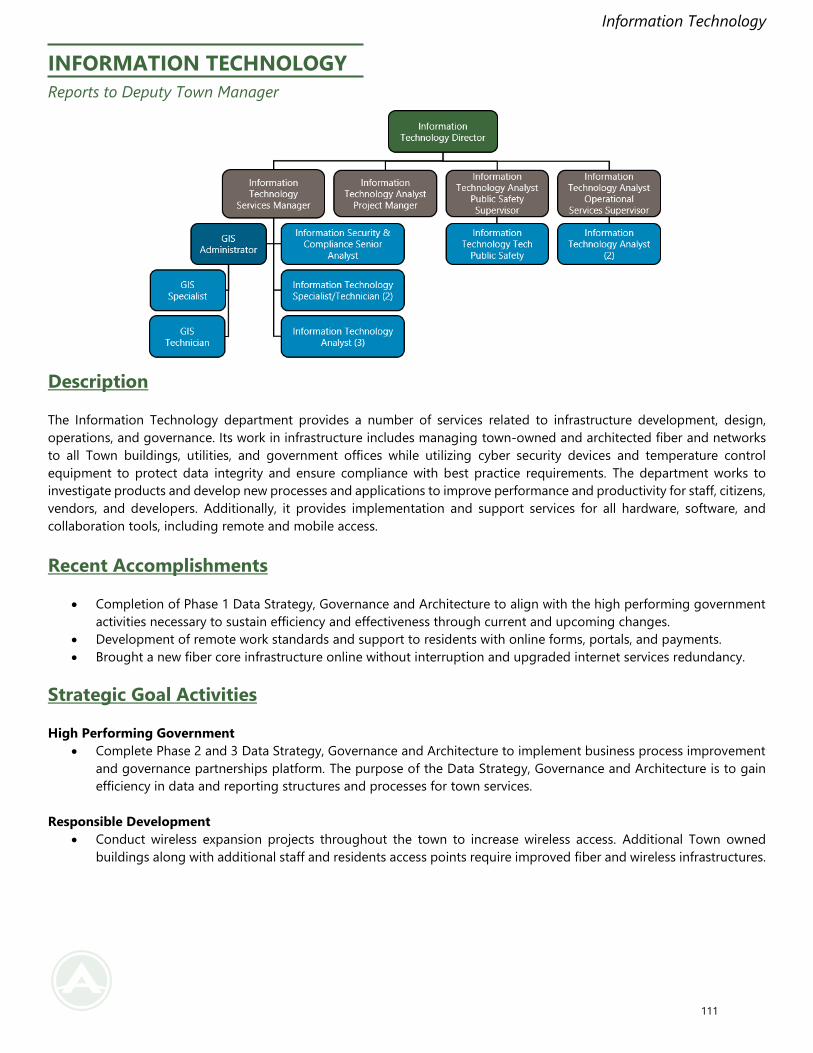
Information Technology
INFORMATION TECHNOLOGY
Reports to Deputy Town Manager
Description
The Information Technology department provides a number of services related to infrastructure development, design,
operations, and governance. Its work in infrastructure includes managing town-owned and architected fiber and networks
to all Town buildings, utilities, and government offices while utilizing cyber security devices and temperature control
equipment to protect data integrity and ensure compliance with best practice requirements. The department works to
investigate products and develop new processes and applications to improve performance and productivity for staff, citizens,
vendors, and developers. Additionally, it provides implementation and support services for all hardware, software, and
collaboration tools, including remote and mobile access.
Recent Accomplishments
• Completion of Phase 1 Data Strategy, Governance and Architecture to align with the high performing government
activities necessary to sustain efficiency and effectiveness through current and upcoming changes.
• Development of remote work standards and support to residents with online forms, portals, and payments.
• Brought a new fiber core infrastructure online without interruption and upgraded internet services redundancy.
Strategic Goal Activities
High Performing Government
• Complete Phase 2 and 3 Data Strategy, Governance and Architecture to implement business process improvement
and governance partnerships platform. The purpose of the Data Strategy, Governance and Architecture is to gain
efficiency in data and reporting structures and processes for town services.
Responsible Development
• Conduct wireless expansion projects throughout the town to increase wireless access. Additional Town owned
buildings along with additional staff and residents access points require improved fiber and wireless infrastructures.
111
Information Technology
A Welcoming Community
• Implementation of 311 to streamline Town assistance to residents. The 311-customer service is to provide direct
assistance to residents. Additionally, data collected through 311 services can be used to forecast future needs and
appropriateness of solutions.
FY 2022-2023 Budget Highlights
• The Information Technology department budget increased by 1.88 percent in FY22-23.
• The Information Technology budget accounts for 3.20 percent of the General Fund budget and is equivalent to
$0.025 on the tax rate.
• The Town plans to spend $38.84 per capita for Information Technology in FY22-23.
• Major budget changes include the additions of four new positions including IT Analyst (Project Manager), IT Analyst
(A/V& Broadcasting), IT Analyst (Public Safety), and GIS Technician (Utilities), and the associated onboarding costs.
Currently, the functions of these full-time positions are contracted out. The overall operating budget decreased by
bringing these positions in-house.
112
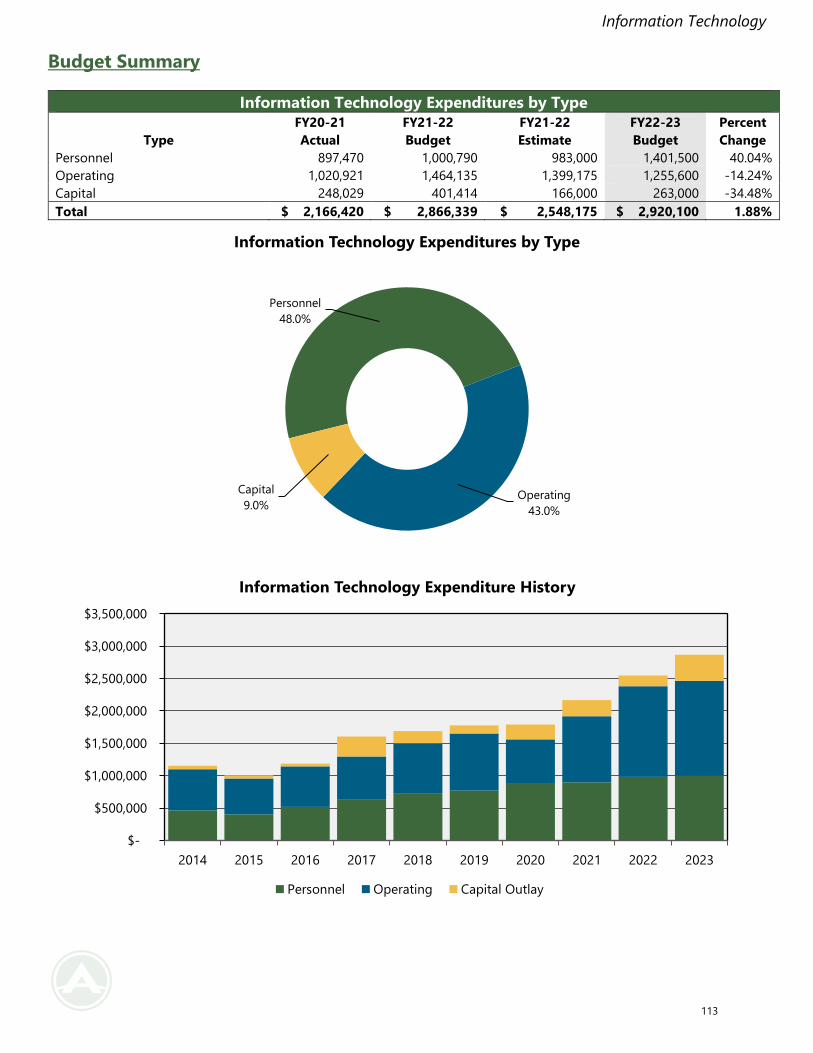
Information Technology
Budget Summary
Information Technology Expenditures by Type
Type
FY20-21
Actual
FY21-22
Budget
FY21-22
Estimate
FY22-23
Budget
Percent
Change
Personnel 897,470 1,000,790 983,000 1,401,500 40.04%
Operating 1,020,921 1,464,135 1,399,175 1,255,600 -14.24%
Capital 248,029 401,414 166,000 263,000 -34.48%
Total $ 2,166,420 $ 2,866,339 $ 2,548,175 $ 2,920,100 1.88%
Personnel
48.0%
Operating
43.0%
Capital
9.0%
Information Technology Expenditures by Type
$-
$500,000
$1,000,000
$1,500,000
$2,000,000
$2,500,000
$3,000,000
$3,500,000
2014 2015 2016 2017 2018 2019 2020 2021 2022 2023
Information Technology Expenditure History
Personnel Operating Capital Outlay
113
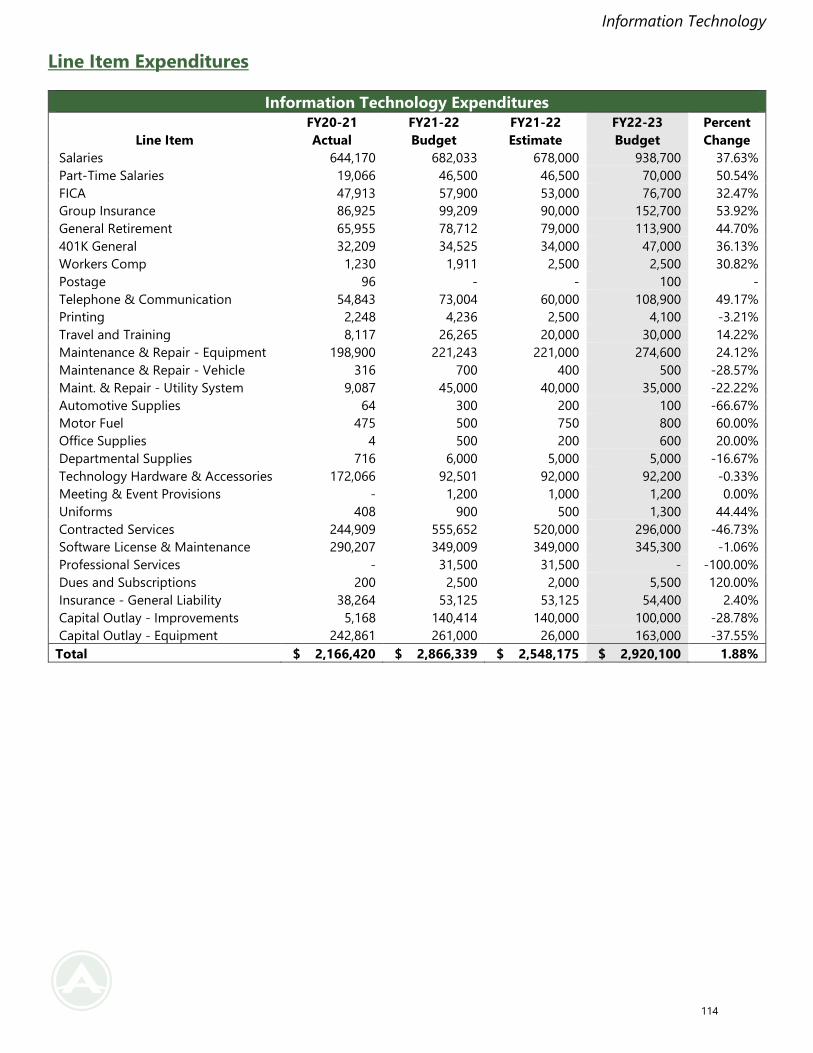
Information Technology
Line Item Expenditures
Information Technology Expenditures
Line Item
FY20-21
Actual
FY21-22
Budget
FY21-22
Estimate
FY22-23
Budget
Percent
Change
Salaries 644,170 682,033 678,000 938,700 37.63%
Part-Time Salaries 19,066 46,500 46,500 70,000 50.54%
FICA 47,913 57,900 53,000 76,700 32.47%
Group Insurance 86,925 99,209 90,000 152,700 53.92%
General Retirement 65,955 78,712 79,000 113,900 44.70%
401K General 32,209 34,525 34,000 47,000 36.13%
Workers Comp 1,230 1,911 2,500 2,500 30.82%
Postage 96 - - 100 -
Telephone & Communication 54,843 73,004 60,000 108,900 49.17%
Printing 2,248 4,236 2,500 4,100 -3.21%
Travel and Training 8,117 26,265 20,000 30,000 14.22%
Maintenance & Repair - Equipment 198,900 221,243 221,000 274,600 24.12%
Maintenance & Repair - Vehicle 316 700 400 500 -28.57%
Maint. & Repair - Utility System 9,087 45,000 40,000 35,000 -22.22%
Automotive Supplies 64 300 200 100 -66.67%
Motor Fuel 475 500 750 800 60.00%
Office Supplies 4 500 200 600 20.00%
Departmental Supplies 716 6,000 5,000 5,000 -16.67%
Technology Hardware & Accessories 172,066 92,501 92,000 92,200 -0.33%
Meeting & Event Provisions - 1,200 1,000 1,200 0.00%
Uniforms 408 900 500 1,300 44.44%
Contracted Services 244,909 555,652 520,000 296,000 -46.73%
Software License & Maintenance 290,207 349,009 349,000 345,300 -1.06%
Professional Services - 31,500 31,500 - -100.00%
Dues and Subscriptions 200 2,500 2,000 5,500 120.00%
Insurance - General Liability 38,264 53,125 53,125 54,400 2.40%
Capital Outlay - Improvements 5,168 140,414 140,000 100,000 -28.78%
Capital Outlay - Equipment 242,861 261,000 26,000 163,000 -37.55%
Total $ 2,166,420 $ 2,866,339 $ 2,548,175 $ 2,920,100 1.88%
114
Legal Services
LEGAL SERVICES
Reports to Town Council
Description
The Town Attorney is appointed by and reports to Town Council and is responsible for providing legal advice to Town
Council and Town staff. The Legal Services department exclusively serves the Town of Apex and is unable to provide legal
advice or representation to citizens on any matter. The department provides a number of services, including drafting and
reviewing ordinances, resolutions, contracts, deeds and easements, policies, and other legal documents; representing and
advising Town Council and staff at public meetings such as Town Council meetings, public hearings, quasi-judicial hearings,
and board of adjustment hearings; and representing the Town in claims and litigation in collaboration with outside counsel.
Recent Accomplishments
• Provided legal assistance and advice for multiple development agreements, purchases of properties, and sales of
properties related to the Cash Corporate Center Industrial Park.
• Provided legal assistance and advice on policies and expenditure related to American Rescue Plan Act (ARPA) funds.
• Rewrote Code of Ordinance to reflect changes required by Senate Bill 300.
Strategic Goal Activities
High Performing Government
• Implementation of matter management software to assist in providing quality, timely, and responsive legal
representation on all matters. This technology software will be used to manage workload of attorneys and help to
continue timely responses to request for legal services.
• Provide educational information on a variety of legal topics to town staff through online portal. The online portal
will empower staff by providing a resource for frequently asked legal questions. Staff will be able independently
locate the answer to their common legal questions. This also frees up the legal staff to work efficiently on more
complex matters.
• Review and evaluate contract management technology and work with operational staff to implement. A centralized
and automated contract process will free up legal and operational staff to work on more complex matters. The
technology will assist all departments as each Town department requires some contracts, and will equip
departments to maintain compliance with the contracts.
FY 2022-2023 Budget Highlights
• The Legal Services department budget increased 5.93 percent in FY22-23.
• The Legal Services budget accounts for 0.63 percent of the General Fund budget and is equivalent to $0.005 on the
tax rate.
• The Town plans to spend $7.70 per capita for legal services in FY22-23.
• Major budget changes include increases are for the transition of the Paralegal from a part-time position to a full-
time position as well as an increase in technology and hardware due to regularly scheduled computer replacements.
• The budget includes $30,000 for outside counsel consulting fees.
115
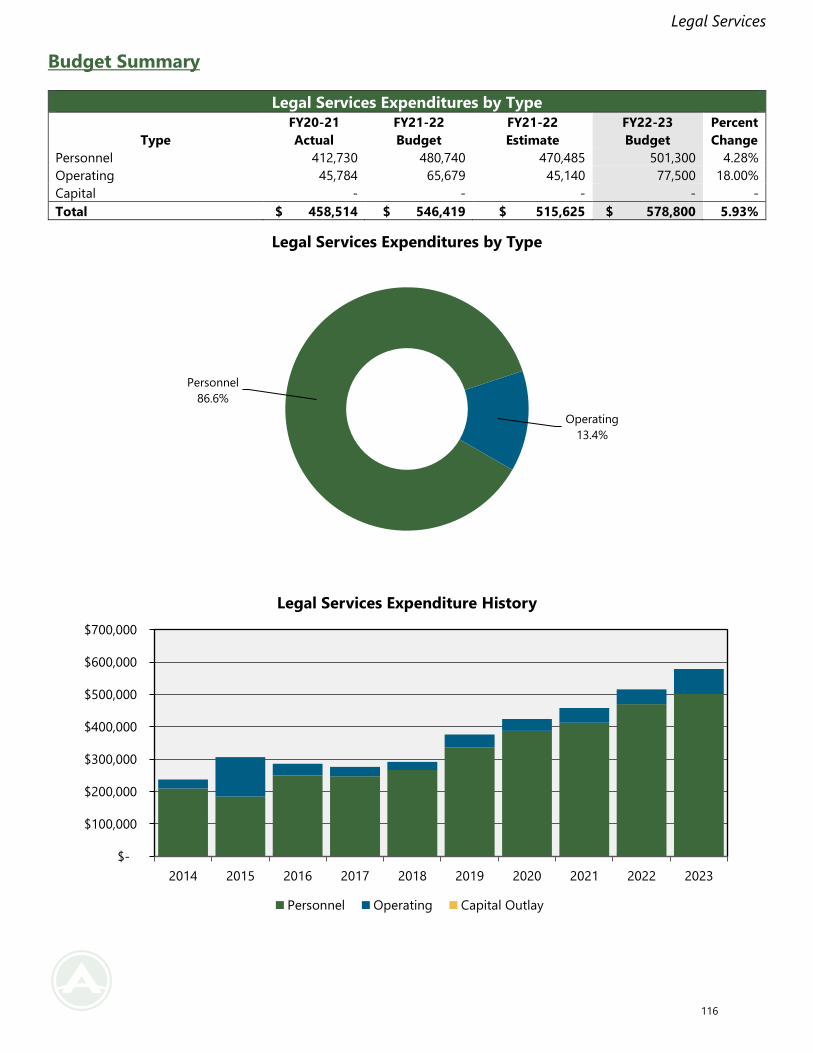
Legal Services
Budget Summary
Legal Services Expenditures by Type
Type
FY20-21
Actual
FY21-22
Budget
FY21-22
Estimate
FY22-23
Budget
Percent
Change
Personnel 412,730 480,740 470,485 501,300 4.28%
Operating 45,784 65,679 45,140 77,500 18.00%
Capital - - - - -
Total $ 458,514 $ 546,419 $ 515,625 $ 578,800 5.93%
Personnel
86.6%
Operating
13.4%
Legal Services Expenditures by Type
$-
$100,000
$200,000
$300,000
$400,000
$500,000
$600,000
$700,000
2014 2015 2016 2017 2018 2019 2020 2021 2022 2023
Legal Services Expenditure History
Personnel Operating Capital Outlay
116
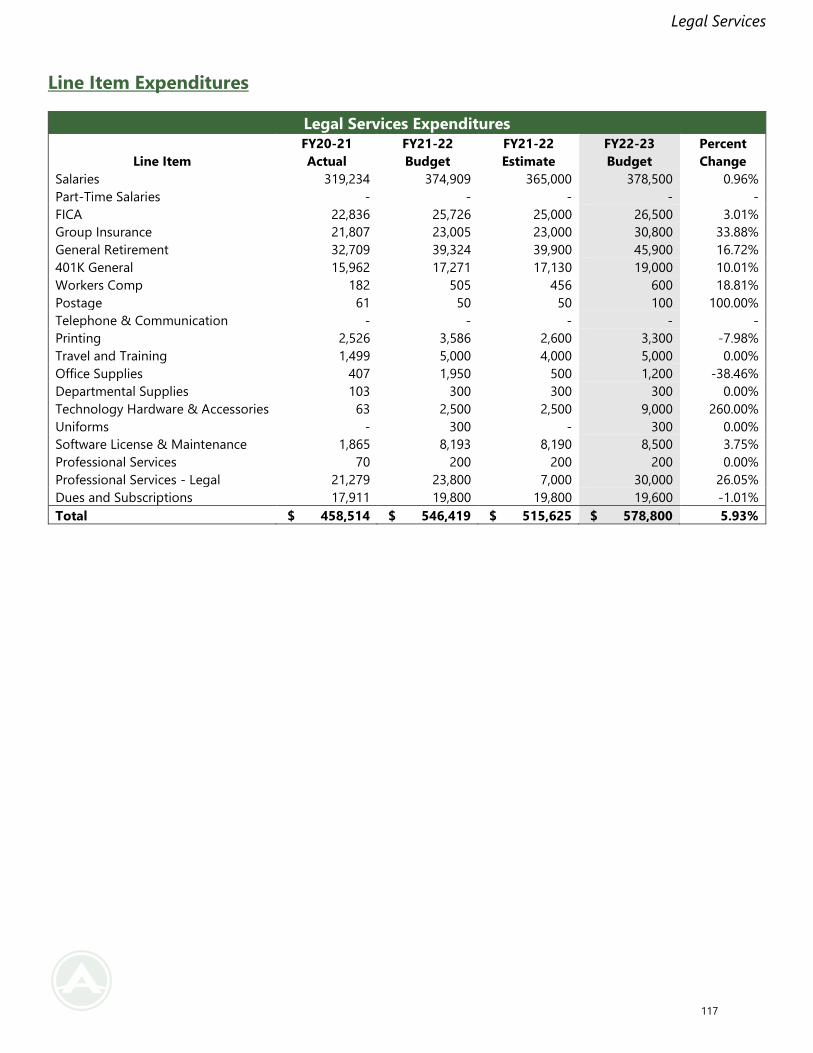
Legal Services
Line Item Expenditures
Legal Services Expenditures
Line Item
FY20-21
Actual
FY21-22
Budget
FY21-22
Estimate
FY22-23
Budget
Percent
Change
Salaries 319,234 374,909 365,000 378,500 0.96%
Part-Time Salaries - - - - -
FICA 22,836 25,726 25,000 26,500 3.01%
Group Insurance 21,807 23,005 23,000 30,800 33.88%
General Retirement 32,709 39,324 39,900 45,900 16.72%
401K General 15,962 17,271 17,130 19,000 10.01%
Workers Comp 182 505 456 600 18.81%
Postage 61 50 50 100 100.00%
Telephone & Communication - - - - -
Printing 2,526 3,586 2,600 3,300 -7.98%
Travel and Training 1,499 5,000 4,000 5,000 0.00%
Office Supplies 407 1,950 500 1,200 -38.46%
Departmental Supplies 103 300 300 300 0.00%
Technology Hardware & Accessories 63 2,500 2,500 9,000 260.00%
Uniforms - 300 - 300 0.00%
Software License & Maintenance 1,865 8,193 8,190 8,500 3.75%
Professional Services 70 200 200 200 0.00%
Professional Services - Legal 21,279 23,800 7,000 30,000 26.05%
Dues and Subscriptions 17,911 19,800 19,800 19,600 -1.01%
Total $ 458,514 $ 546,419 $ 515,625 $ 578,800 5.93%
117
Communications
COMMUNICATIONS
Reports to Deputy Town Manager
Description
The Communications department is responsible for growing a strategic communication plan that provides a framework for
the organization to enhance two-way communication, improve internal and external relationships, and encourage public
information and participation.
Recent Accomplishments
• Creation and execution of communications plans for projects including: Streets and Sidewalks Bond, Stormwater
Utility Fee, Vision Zero, several special events, and a major solid waste collection schedule reroute.
• Expanded visual storytelling through the addition of team member dedicated to photography and videography.
• Expanded communication opportunities for residents through the implementation of website chatbot as well as
launching the monthly resident eNewsletter, “All in Apex”.
• Received the Excellence in Communications Award from the North Carolina City and County Communicators for our
employee newsletter.
Strategic Goal Activities
A Welcoming Community
• Increase number of social media posts by 30 percent in FY 2023, with the addition of the Digital Media Specialist.
This goal will reframe how the Town views social media from a “check the box” activity towards posting proactively
with content that engages residents. This can only be accomplished with more frequent and intentional efforts by
staff.
• Celebrate Apex’s Sesquicentennial. This year-long effort will celebrate the Town’s 150th anniversary of incorporation.
High Performing Government
• Improve the quality and quantity of photography and videography projects. High quality photos and videos are
critical to driving social media reach. In addition, the photography and videography can be used as visuals to
demonstrate the Peak Principles in action.
FY 2022-2023 Budget Highlights
• The Communications department is a new department in FY22-23, breaking out from Administration.
• The Communications budget accounts for 0.62 percent of the General Fund budget and is equivalent to $0.005 on
the tax rate.
• The Town plans to spend $7.48 per capita for Communications in FY22-23.
• Major budget costs include the addition of one new position, Digital Media Specialist, and the associated
onboarding costs.
118
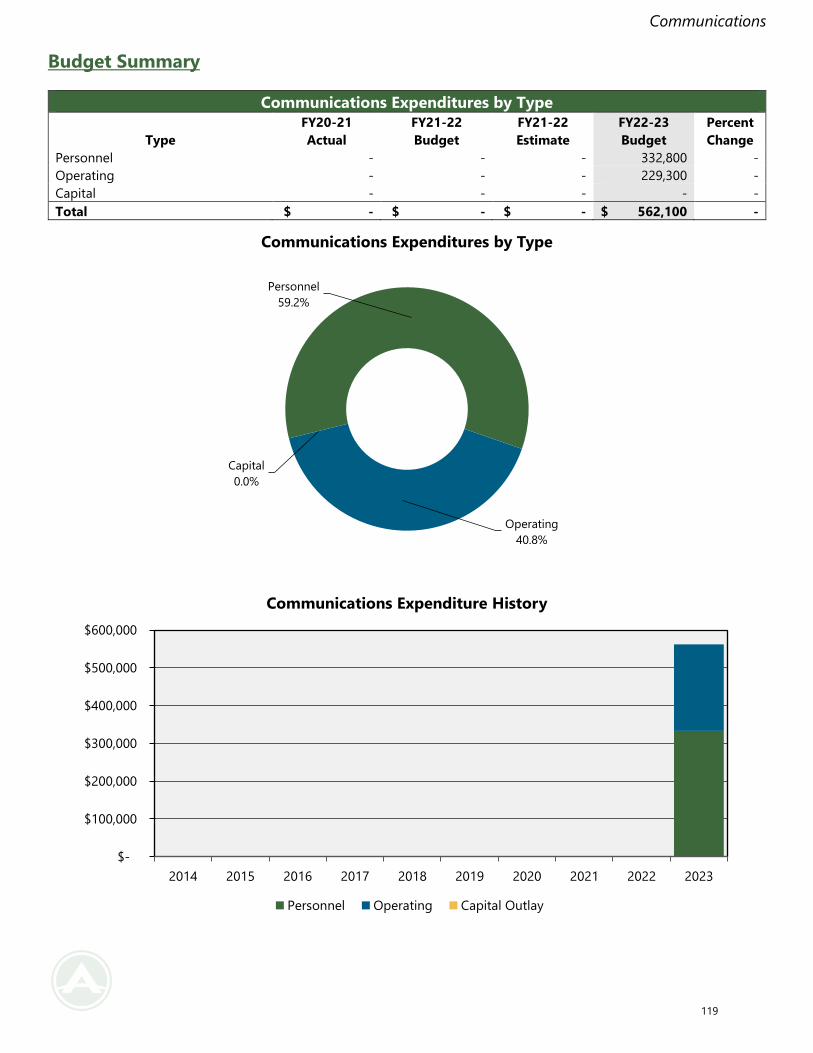
Communications
Budget Summary
Communications Expenditures by Type
Type
FY20-21
Actual
FY21-22
Budget
FY21-22
Estimate
FY22-23
Budget
Percent
Change
Personnel - - - 332,800 -
Operating - - - 229,300 -
Capital - - - - -
Total $ - $ - $ - $ 562,100 -
Personnel
59.2%
Operating
40.8%
Capital
0.0%
Communications Expenditures by Type
$-
$100,000
$200,000
$300,000
$400,000
$500,000
$600,000
2014 2015 2016 2017 2018 2019 2020 2021 2022 2023
Communications Expenditure History
Personnel Operating Capital Outlay
119
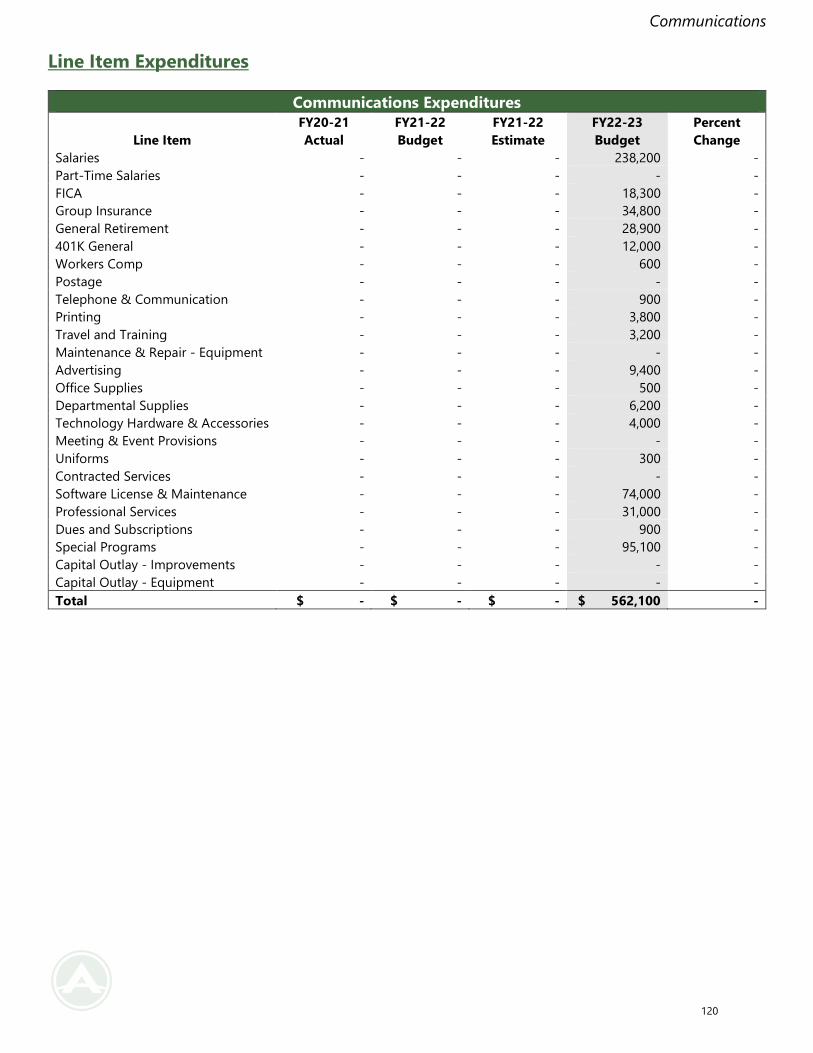
Communications
Line Item Expenditures
Communications Expenditures
Line Item
FY20-21
Actual
FY21-22
Budget
FY21-22
Estimate
FY22-23
Budget
Percent
Change
Salaries - - - 238,200 -
Part-Time Salaries - - - - -
FICA - - - 18,300 -
Group Insurance - - - 34,800 -
General Retirement - - - 28,900 -
401K General - - - 12,000 -
Workers Comp - - - 600 -
Postage - - - - -
Telephone & Communication - - - 900 -
Printing - - - 3,800 -
Travel and Training - - - 3,200 -
Maintenance & Repair - Equipment - - - - -
Advertising - - - 9,400 -
Office Supplies - - - 500 -
Departmental Supplies - - - 6,200 -
Technology Hardware & Accessories - - - 4,000 -
Meeting & Event Provisions - - - - -
Uniforms - - - 300 -
Contracted Services - - - - -
Software License & Maintenance - - - 74,000 -
Professional Services - - - 31,000 -
Dues and Subscriptions - - - 900 -
Special Programs - - - 95,100 -
Capital Outlay - Improvements - - - - -
Capital Outlay - Equipment - - - - -
Total $ - $ - $ - $ 562,100 -
120
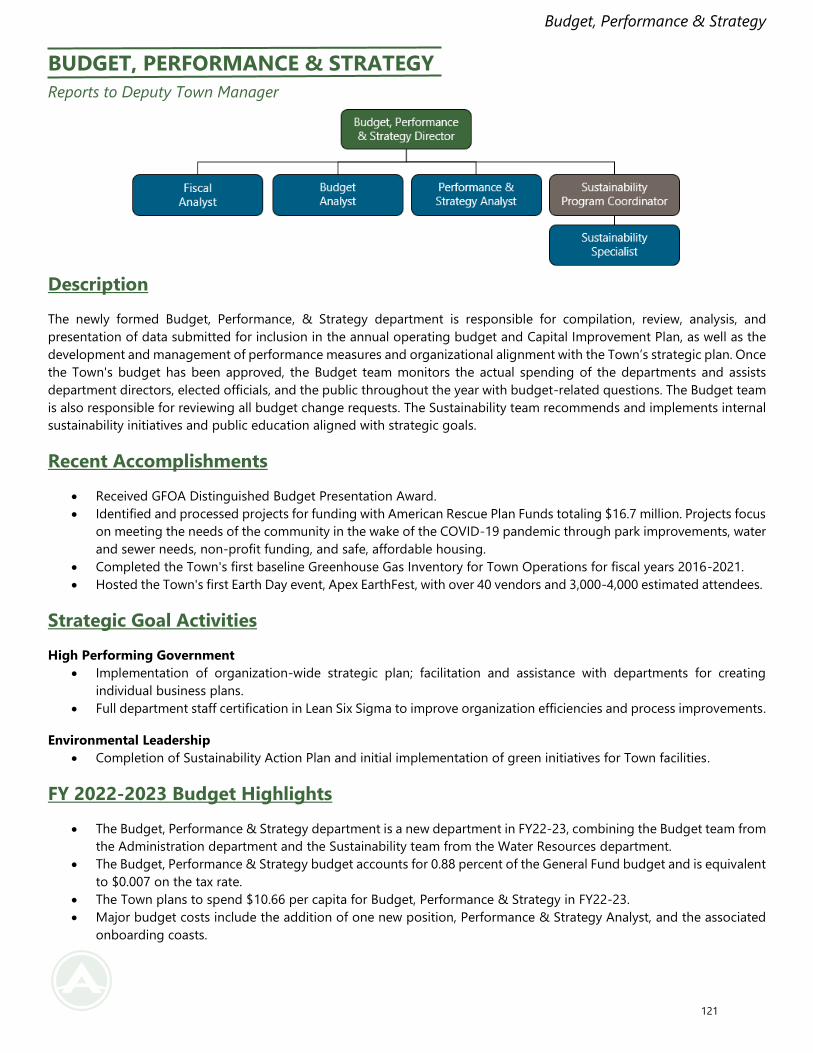
Budget, Performance & Strategy
BUDGET, PERFORMANCE & STRATEGY
Reports to Deputy Town Manager
Description
The newly formed Budget, Performance, & Strategy department is responsible for compilation, review, analysis, and
presentation of data submitted for inclusion in the annual operating budget and Capital Improvement Plan, as well as the
development and management of performance measures and organizational alignment with the Town’s strategic plan. Once
the Town's budget has been approved, the Budget team monitors the actual spending of the departments and assists
department directors, elected officials, and the public throughout the year with budget-related questions. The Budget team
is also responsible for reviewing all budget change requests. The Sustainability team recommends and implements internal
sustainability initiatives and public education aligned with strategic goals.
Recent Accomplishments
• Received GFOA Distinguished Budget Presentation Award.
• Identified and processed projects for funding with American Rescue Plan Funds totaling $16.7 million. Projects focus
on meeting the needs of the community in the wake of the COVID-19 pandemic through park improvements, water
and sewer needs, non-profit funding, and safe, affordable housing.
• Completed the Town's first baseline Greenhouse Gas Inventory for Town Operations for fiscal years 2016-2021.
• Hosted the Town's first Earth Day event, Apex EarthFest, with over 40 vendors and 3,000-4,000 estimated attendees.
Strategic Goal Activities
High Performing Government
• Implementation of organization-wide strategic plan; facilitation and assistance with departments for creating
individual business plans.
• Full department staff certification in Lean Six Sigma to improve organization efficiencies and process improvements.
Environmental Leadership
• Completion of Sustainability Action Plan and initial implementation of green initiatives for Town facilities.
FY 2022-2023 Budget Highlights
• The Budget, Performance & Strategy department is a new department in FY22-23, combining the Budget team from
the Administration department and the Sustainability team from the Water Resources department.
• The Budget, Performance & Strategy budget accounts for 0.88 percent of the General Fund budget and is equivalent
to $0.007 on the tax rate.
• The Town plans to spend $10.66 per capita for Budget, Performance & Strategy in FY22-23.
• Major budget costs include the addition of one new position, Performance & Strategy Analyst, and the associated
onboarding coasts.
121
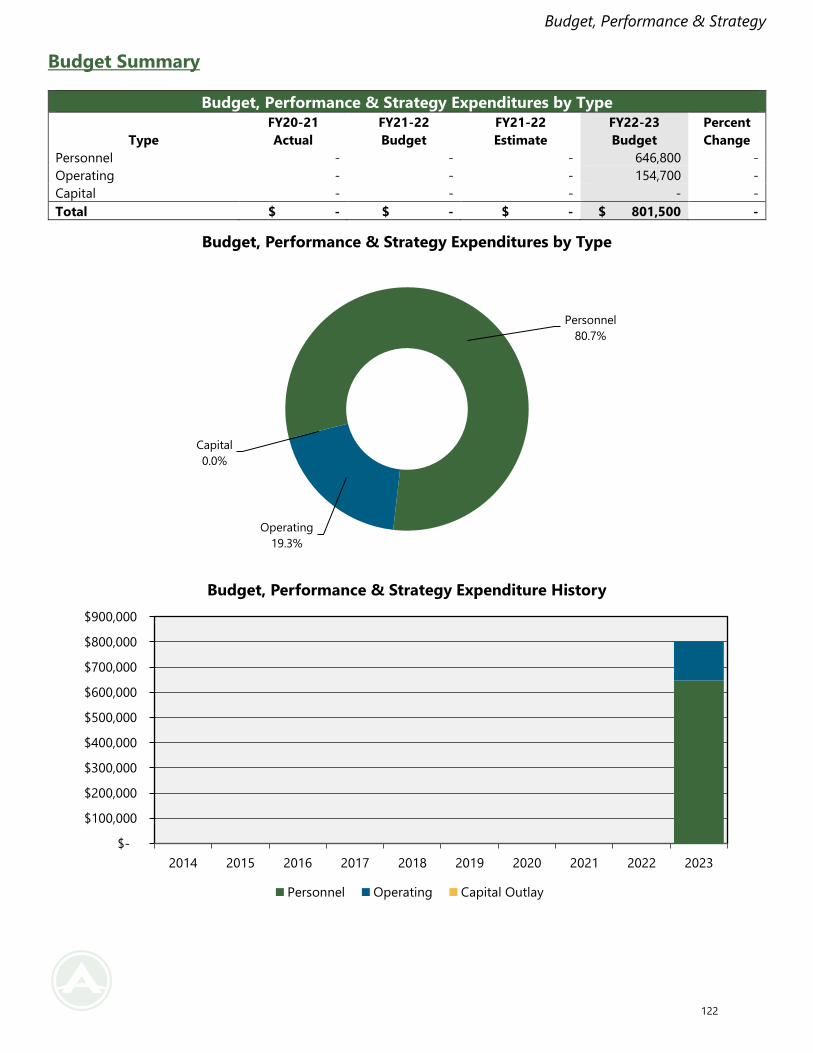
Budget, Performance & Strategy
Budget Summary
Budget, Performance & Strategy Expenditures by Type
Type
FY20-21
Actual
FY21-22
Budget
FY21-22
Estimate
FY22-23
Budget
Percent
Change
Personnel - - - 646,800 -
Operating - - - 154,700 -
Capital - - - - -
Total $ - $ - $ - $ 801,500 -
Personnel
80.7%
Operating
19.3%
Capital
0.0%
Budget, Performance & Strategy Expenditures by Type
$-
$100,000
$200,000
$300,000
$400,000
$500,000
$600,000
$700,000
$800,000
$900,000
2014 2015 2016 2017 2018 2019 2020 2021 2022 2023
Budget, Performance & Strategy Expenditure History
Personnel Operating Capital Outlay
122
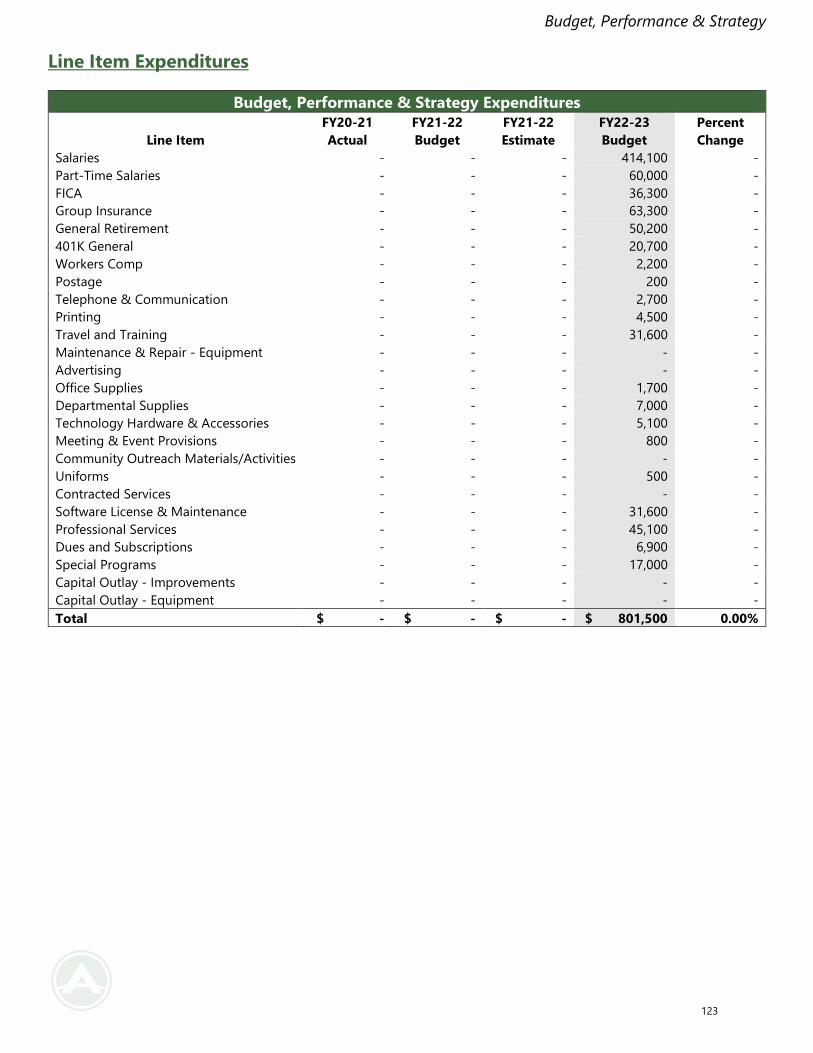
Budget, Performance & Strategy
Line Item Expenditures
Budget, Performance & Strategy Expenditures
Line Item
FY20-21
Actual
FY21-22
Budget
FY21-22
Estimate
FY22-23
Budget
Percent
Change
Salaries - - - 414,100 -
Part-Time Salaries - - - 60,000 -
FICA - - - 36,300 -
Group Insurance - - - 63,300 -
General Retirement - - - 50,200 -
401K General - - - 20,700 -
Workers Comp - - - 2,200 -
Postage - - - 200 -
Telephone & Communication - - - 2,700 -
Printing - - - 4,500 -
Travel and Training - - - 31,600 -
Maintenance & Repair - Equipment - - - - -
Advertising - - - - -
Office Supplies - - - 1,700 -
Departmental Supplies - - - 7,000 -
Technology Hardware & Accessories - - - 5,100 -
Meeting & Event Provisions - - - 800 -
Community Outreach Materials/Activities - - - - -
Uniforms - - - 500 -
Contracted Services - - - - -
Software License & Maintenance - - - 31,600 -
Professional Services - - - 45,100 -
Dues and Subscriptions - - - 6,900 -
Special Programs - - - 17,000 -
Capital Outlay - Improvements - - - - -
Capital Outlay - Equipment - - - - -
Total $ - $ - $ - $ 801,500 0.00%
123
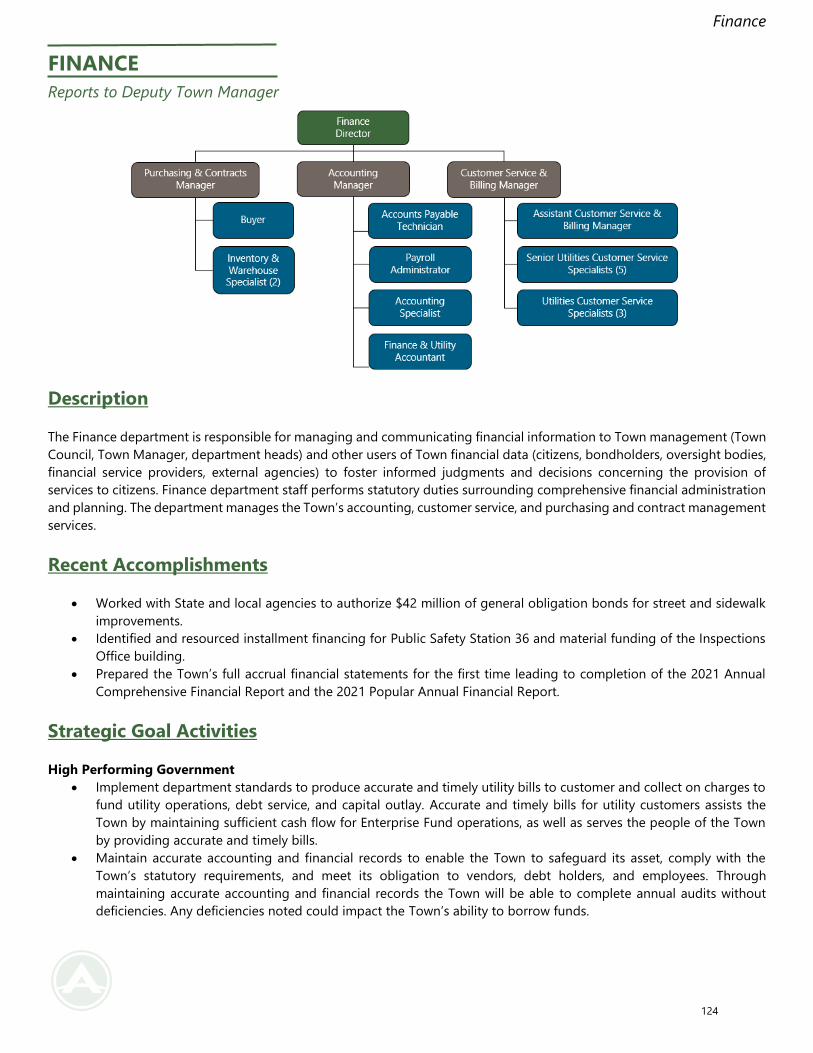
Finance
FINANCE
Reports to Deputy Town Manager
Description
The Finance department is responsible for managing and communicating financial information to Town management (Town
Council, Town Manager, department heads) and other users of Town financial data (citizens, bondholders, oversight bodies,
financial service providers, external agencies) to foster informed judgments and decisions concerning the provision of
services to citizens. Finance department staff performs statutory duties surrounding comprehensive financial administration
and planning. The department manages the Town’s accounting, customer service, and purchasing and contract management
services.
Recent Accomplishments
• Worked with State and local agencies to authorize $42 million of general obligation bonds for street and sidewalk
improvements.
• Identified and resourced installment financing for Public Safety Station 36 and material funding of the Inspections
Office building.
• Prepared the Town’s full accrual financial statements for the first time leading to completion of the 2021 Annual
Comprehensive Financial Report and the 2021 Popular Annual Financial Report.
Strategic Goal Activities
High Performing Government
• Implement department standards to produce accurate and timely utility bills to customer and collect on charges to
fund utility operations, debt service, and capital outlay. Accurate and timely bills for utility customers assists the
Town by maintaining sufficient cash flow for Enterprise Fund operations, as well as serves the people of the Town
by providing accurate and timely bills.
• Maintain accurate accounting and financial records to enable the Town to safeguard its asset, comply with the
Town’s statutory requirements, and meet its obligation to vendors, debt holders, and employees. Through
maintaining accurate accounting and financial records the Town will be able to complete annual audits without
deficiencies. Any deficiencies noted could impact the Town’s ability to borrow funds.
124
Finance
• To maintain a sufficient inventory of equipment, supplies and materials to enable the Town to provide services and
meets the needs of citizens of Apex. Sufficient inventory is needed to fulfill the Town’s strategic goals because
without sufficient inventory projects are delayed or halted due to lack of supplies.
FY 2022-2023 Budget Highlights
• The Finance department budget increased 17.30 percent in FY22-22.
• The Finance budget accounts for 1.12 percent of the General Fund budget and is equivalent to $0.009 on the tax
rate.
• The Town plans to spend $13.60 per capita for Finance in FY22-23.
• Major budget changes include an increase in tax collection fees from Wake County and the DMV.
125
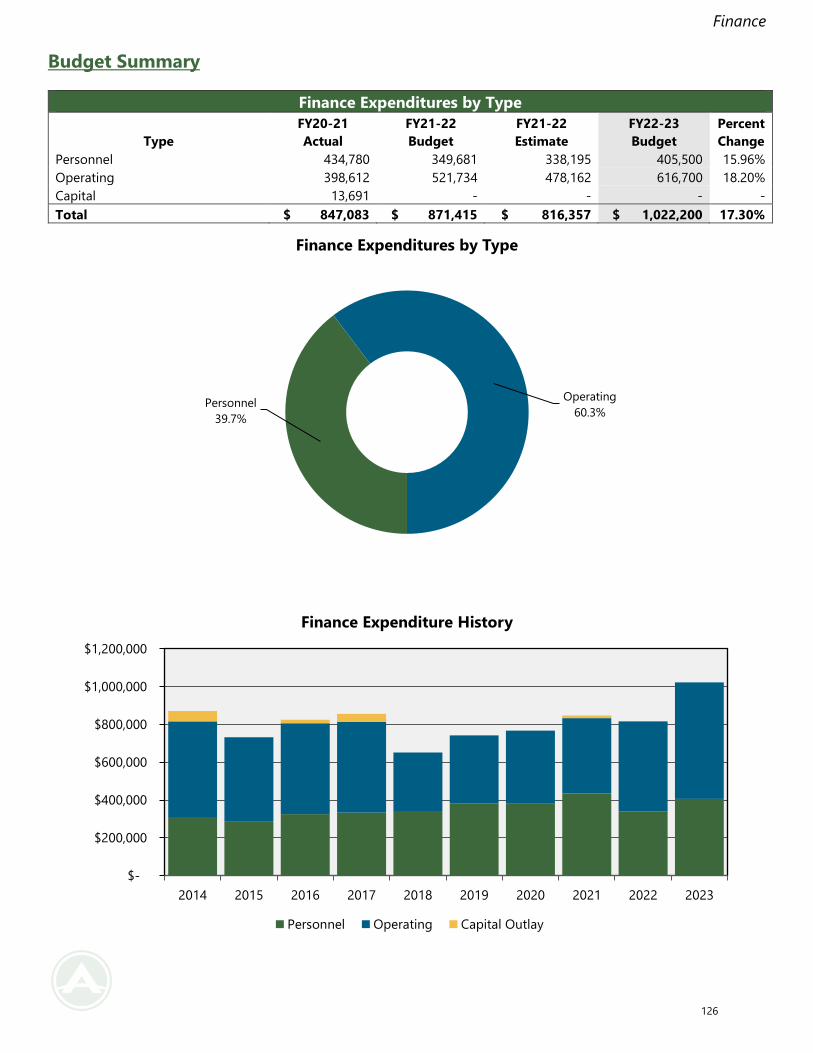
Finance
Budget Summary
Finance Expenditures by Type
Type
FY20-21
Actual
FY21-22
Budget
FY21-22
Estimate
FY22-23
Budget
Percent
Change
Personnel 434,780 349,681 338,195 405,500 15.96%
Operating 398,612 521,734 478,162 616,700 18.20%
Capital 13,691 - - - -
Total $ 847,083 $ 871,415 $ 816,357 $ 1,022,200 17.30%
Personnel
39.7%
Operating
60.3%
Finance Expenditures by Type
$-
$200,000
$400,000
$600,000
$800,000
$1,000,000
$1,200,000
2014 2015 2016 2017 2018 2019 2020 2021 2022 2023
Finance Expenditure History
Personnel Operating Capital Outlay
126
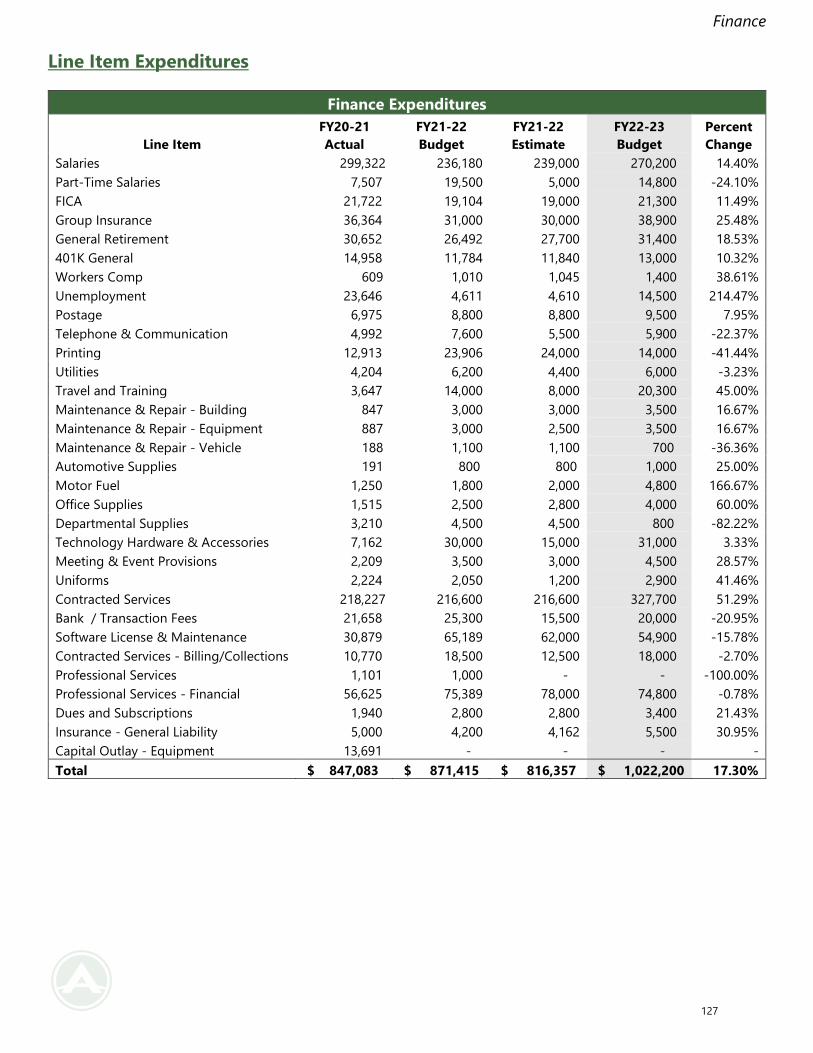
Finance
Line Item Expenditures
Finance Expenditures
Line Item
FY20-21
Actual
FY21-22
Budget
FY21-22
Estimate
FY22-23
Budget
Percent
Change
Salaries 299,322 236,180 239,000 270,200 14.40%
Part-Time Salaries 7,507 19,500 5,000 14,800 -24.10%
FICA 21,722 19,104 19,000 21,300 11.49%
Group Insurance 36,364 31,000 30,000 38,900 25.48%
General Retirement 30,652 26,492 27,700 31,400 18.53%
401K General 14,958 11,784 11,840 13,000 10.32%
Workers Comp 609 1,010 1,045 1,400 38.61%
Unemployment 23,646 4,611 4,610 14,500 214.47%
Postage 6,975 8,800 8,800 9,500 7.95%
Telephone & Communication 4,992 7,600 5,500 5,900 -22.37%
Printing 12,913 23,906 24,000 14,000 -41.44%
Utilities 4,204 6,200 4,400 6,000 -3.23%
Travel and Training 3,647 14,000 8,000 20,300 45.00%
Maintenance & Repair - Building 847 3,000 3,000 3,500 16.67%
Maintenance & Repair - Equipment 887 3,000 2,500 3,500 16.67%
Maintenance & Repair - Vehicle 188 1,100 1,100 700 -36.36%
Automotive Supplies 191 800 800 1,000 25.00%
Motor Fuel 1,250 1,800 2,000 4,800 166.67%
Office Supplies 1,515 2,500 2,800 4,000 60.00%
Departmental Supplies 3,210 4,500 4,500 800 -82.22%
Technology Hardware & Accessories 7,162 30,000 15,000 31,000 3.33%
Meeting & Event Provisions 2,209 3,500 3,000 4,500 28.57%
Uniforms 2,224 2,050 1,200 2,900 41.46%
Contracted Services 218,227 216,600 216,600 327,700 51.29%
Bank / Transaction Fees 21,658 25,300 15,500 20,000 -20.95%
Software License & Maintenance 30,879 65,189 62,000 54,900 -15.78%
Contracted Services - Billing/Collections 10,770 18,500 12,500 18,000 -2.70%
Professional Services 1,101 1,000 - - -100.00%
Professional Services - Financial 56,625 75,389 78,000 74,800 -0.78%
Dues and Subscriptions 1,940 2,800 2,800 3,400 21.43%
Insurance - General Liability 5,000 4,200 4,162 5,500 30.95%
Capital Outlay - Equipment 13,691 - - - -
Total $ 847,083 $ 871,415 $ 816,357 $ 1,022,200 17.30%
127
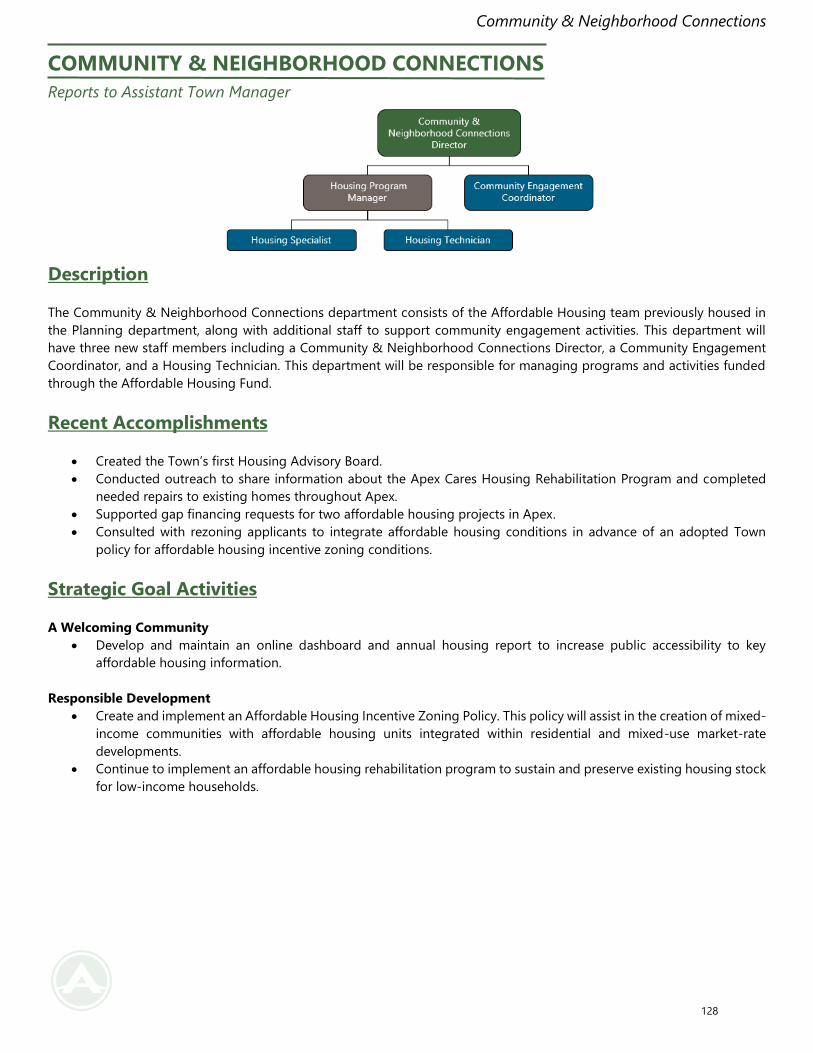
Community & Neighborhood Connections
COMMUNITY & NEIGHBORHOOD CONNECTIONS
Reports to Assistant Town Manager
Description
The Community & Neighborhood Connections department consists of the Affordable Housing team previously housed in
the Planning department, along with additional staff to support community engagement activities. This department will
have three new staff members including a Community & Neighborhood Connections Director, a Community Engagement
Coordinator, and a Housing Technician. This department will be responsible for managing programs and activities funded
through the Affordable Housing Fund.
Recent Accomplishments
• Created the Town’s first Housing Advisory Board.
• Conducted outreach to share information about the Apex Cares Housing Rehabilitation Program and completed
needed repairs to existing homes throughout Apex.
• Supported gap financing requests for two affordable housing projects in Apex.
• Consulted with rezoning applicants to integrate affordable housing conditions in advance of an adopted Town
policy for affordable housing incentive zoning conditions.
Strategic Goal Activities
A Welcoming Community
• Develop and maintain an online dashboard and annual housing report to increase public accessibility to key
affordable housing information.
Responsible Development
• Create and implement an Affordable Housing Incentive Zoning Policy. This policy will assist in the creation of mixed-
income communities with affordable housing units integrated within residential and mixed-use market-rate
developments.
• Continue to implement an affordable housing rehabilitation program to sustain and preserve existing housing stock
for low-income households.
128
Community & Neighborhood Connections
FY 2022-2023 Budget Highlights
• The Community & Neighborhood Connections department is a new department in FY22-23.
• The Community & Neighborhood Connections budget accounts for 0.59 percent of the General Fund budget and
is equivalent to $0.005 on the tax rate.
• The Town plans to spend $7.20 per capita for Community & Neighborhood Connections in FY22-23.
• Major budget changes include the addition of four new staff members, Community and Neighborhood Connections
Director, Community Engagement Coordinator, Housing Specialist, and Housing Technician, and the associated
onboarding costs.
129
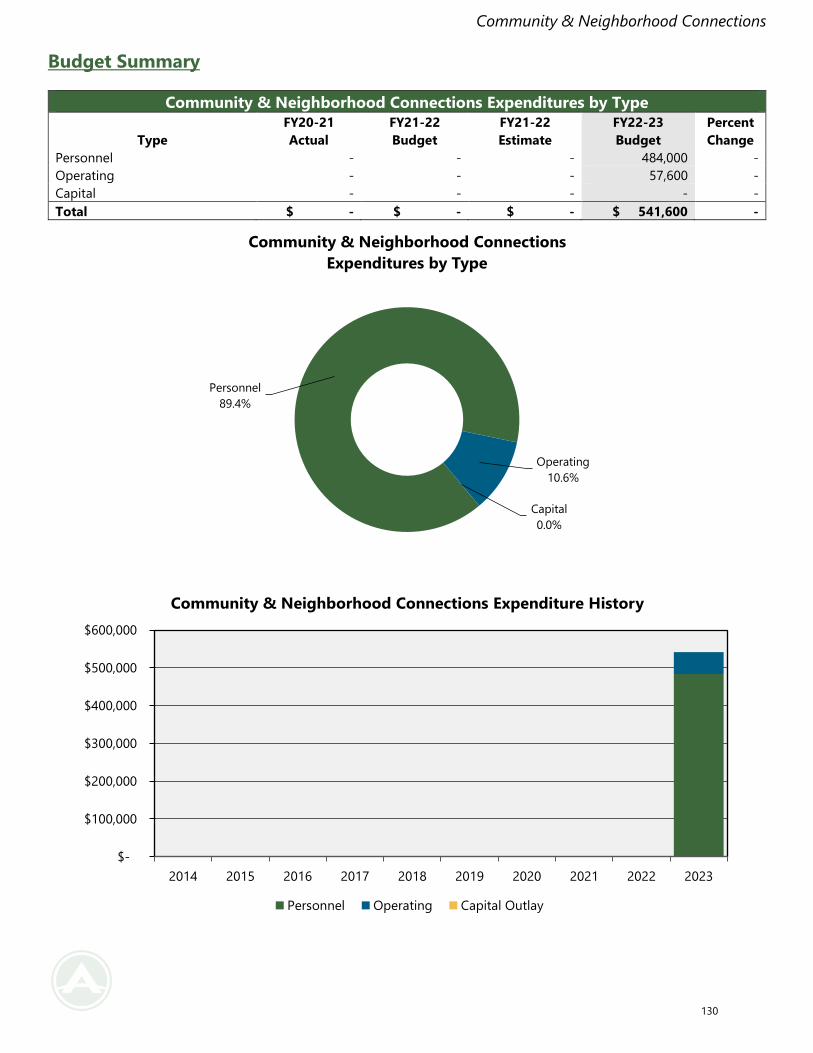
Community & Neighborhood Connections
Budget Summary
Community & Neighborhood Connections Expenditures by Type
Type
FY20-21
Actual
FY21-22
Budget
FY21-22
Estimate
FY22-23
Budget
Percent
Change
Personnel - - - 484,000 -
Operating - - - 57,600 -
Capital - - - - -
Total $ - $ - $ - $ 541,600 -
Personnel
89.4%
Operating
10.6%
Capital
0.0%
Community & Neighborhood Connections
Expenditures by Type
$-
$100,000
$200,000
$300,000
$400,000
$500,000
$600,000
2014 2015 2016 2017 2018 2019 2020 2021 2022 2023
Community & Neighborhood Connections Expenditure History
Personnel Operating Capital Outlay
130
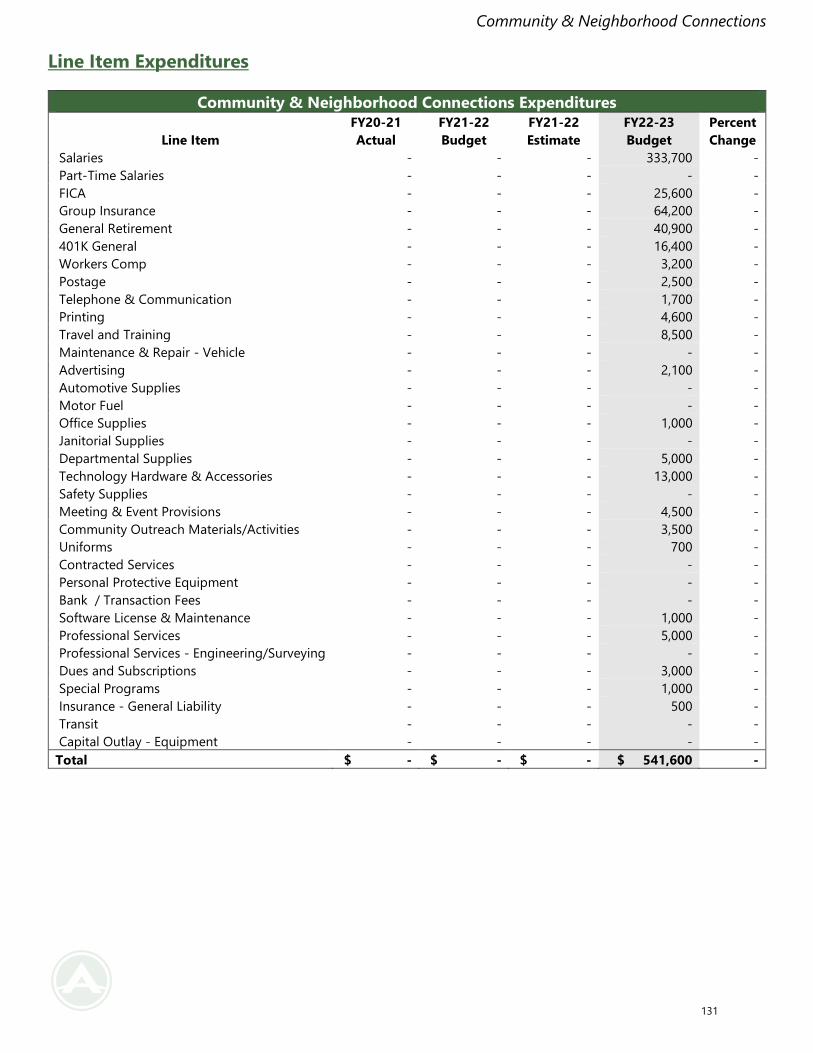
Community & Neighborhood Connections
Line Item Expenditures
Community & Neighborhood Connections Expenditures
Line Item
FY20-21
Actual
FY21-22
Budget
FY21-22
Estimate
FY22-23
Budget
Percent
Change
Salaries - - - 333,700 -
Part-Time Salaries - - - - -
FICA - - - 25,600 -
Group Insurance - - - 64,200 -
General Retirement - - - 40,900 -
401K General - - - 16,400 -
Workers Comp - - - 3,200 -
Postage - - - 2,500 -
Telephone & Communication - - - 1,700 -
Printing - - - 4,600 -
Travel and Training - - - 8,500 -
Maintenance & Repair - Vehicle - - - - -
Advertising - - - 2,100 -
Automotive Supplies - - - - -
Motor Fuel - - - - -
Office Supplies - - - 1,000 -
Janitorial Supplies - - - - -
Departmental Supplies - - - 5,000 -
Technology Hardware & Accessories - - - 13,000 -
Safety Supplies - - - - -
Meeting & Event Provisions - - - 4,500 -
Community Outreach Materials/Activities - - - 3,500 -
Uniforms - - - 700 -
Contracted Services - - - - -
Personal Protective Equipment - - - - -
Bank / Transaction Fees - - - - -
Software License & Maintenance - - - 1,000 -
Professional Services - - - 5,000 -
Professional Services - Engineering/Surveying - - - - -
Dues and Subscriptions - - - 3,000 -
Special Programs - - - 1,000 -
Insurance - General Liability - - - 500 -
Transit - - - - -
Capital Outlay - Equipment - - - - -
Total $ - $ - $ - $ 541,600 -
131
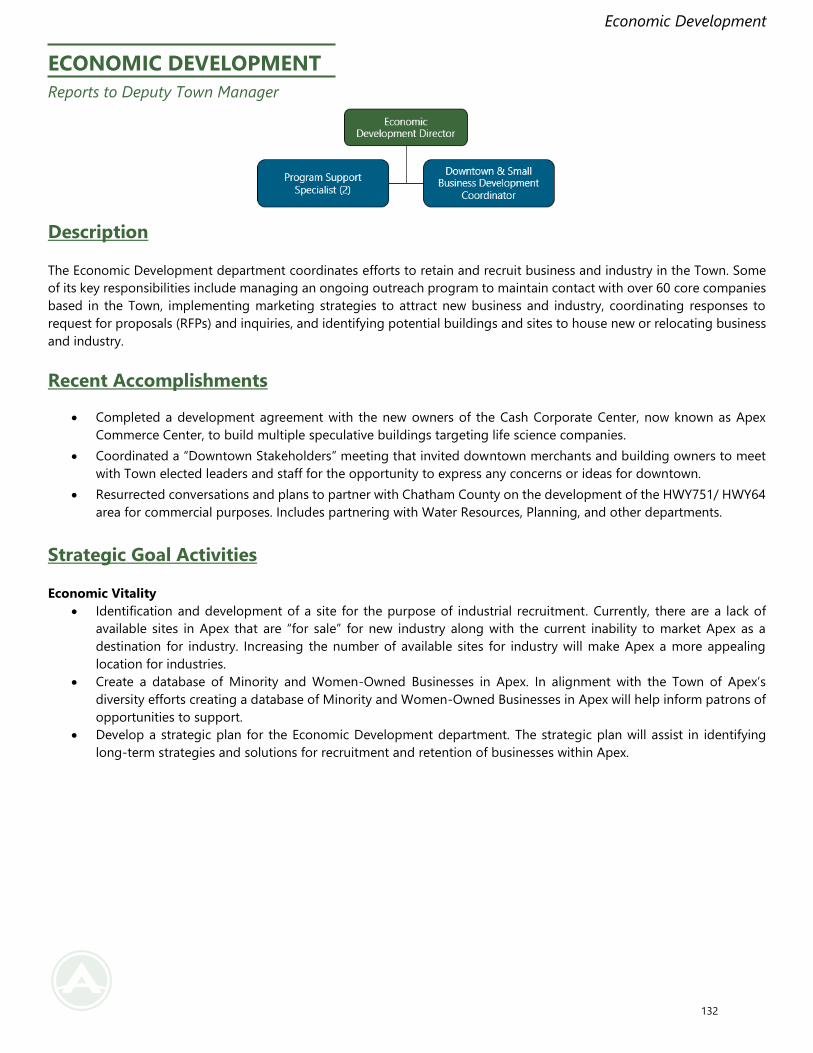
Economic Development
ECONOMIC DEVELOPMENT
Reports to Deputy Town Manager
Description
The Economic Development department coordinates efforts to retain and recruit business and industry in the Town. Some
of its key responsibilities include managing an ongoing outreach program to maintain contact with over 60 core companies
based in the Town, implementing marketing strategies to attract new business and industry, coordinating responses to
request for proposals (RFPs) and inquiries, and identifying potential buildings and sites to house new or relocating business
and industry.
Recent Accomplishments
• Completed a development agreement with the new owners of the Cash Corporate Center, now known as Apex
Commerce Center, to build multiple speculative buildings targeting life science companies.
• Coordinated a “Downtown Stakeholders” meeting that invited downtown merchants and building owners to meet
with Town elected leaders and staff for the opportunity to express any concerns or ideas for downtown.
• Resurrected conversations and plans to partner with Chatham County on the development of the HWY751/ HWY64
area for commercial purposes. Includes partnering with Water Resources, Planning, and other departments.
Strategic Goal Activities
Economic Vitality
• Identification and development of a site for the purpose of industrial recruitment. Currently, there are a lack of
available sites in Apex that are “for sale” for new industry along with the current inability to market Apex as a
destination for industry. Increasing the number of available sites for industry will make Apex a more appealing
location for industries.
• Create a database of Minority and Women-Owned Businesses in Apex. In alignment with the Town of Apex’s
diversity efforts creating a database of Minority and Women-Owned Businesses in Apex will help inform patrons of
opportunities to support.
• Develop a strategic plan for the Economic Development department. The strategic plan will assist in identifying
long-term strategies and solutions for recruitment and retention of businesses within Apex.
132
Economic Development
FY 2022-2023 Budget Highlights
• The Economic Development department budget decreased by 4.23 percent in FY22-23.
• The Economic Development budget accounts for 0.72 percent of the General Fund budget and is equivalent to
$0.006 on the tax rate.
• The Town plans to spend $8.77 per capita for Economic Development services in FY22-23.
• Major budget changes include the addition of the costs related to maintaining The Depot. These costs were
previously included under the Facilities Services department but are now part of the Economic Development
department.
133
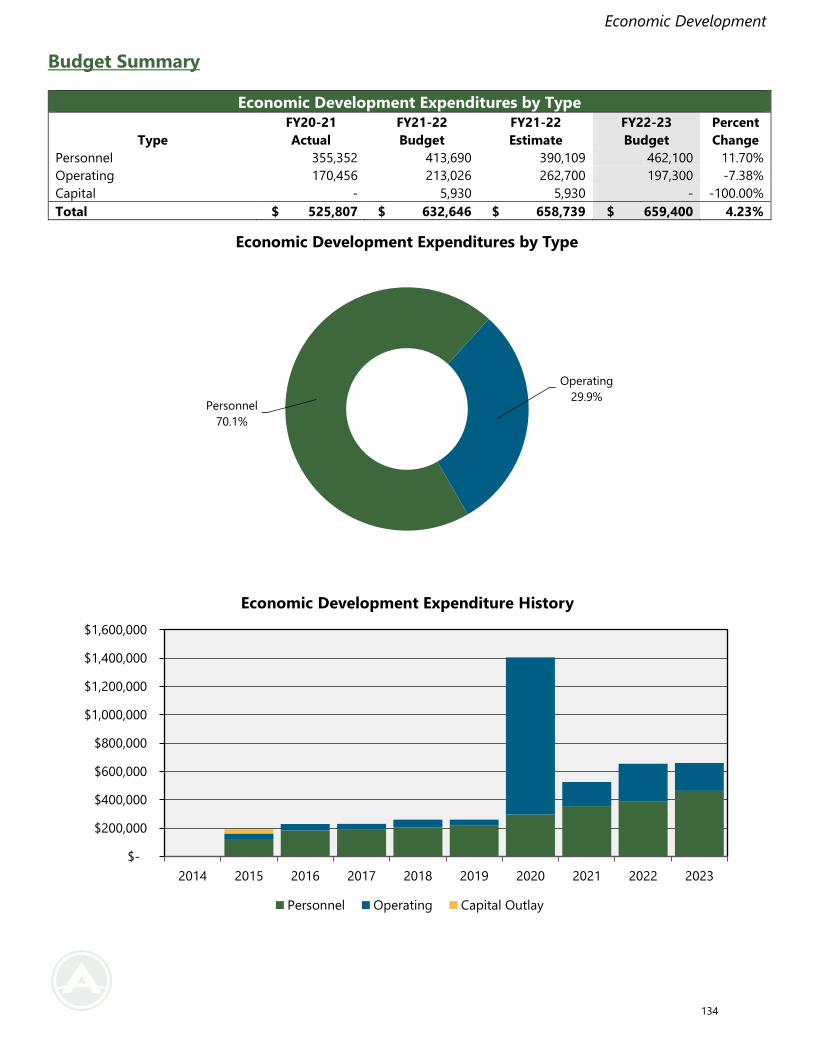
Economic Development
Budget Summary
Economic Development Expenditures by Type
Type
FY20-21
Actual
FY21-22
Budget
FY21-22
Estimate
FY22-23
Budget
Percent
Change
Personnel 355,352 413,690 390,109 462,100 11.70%
Operating 170,456 213,026 262,700 197,300 -7.38%
Capital - 5,930 5,930 - -100.00%
Total $ 525,807 $ 632,646 $ 658,739 $ 659,400 4.23%
Personnel
70.1%
Operating
29.9%
Economic Development Expenditures by Type
$-
$200,000
$400,000
$600,000
$800,000
$1,000,000
$1,200,000
$1,400,000
$1,600,000
2014 2015 2016 2017 2018 2019 2020 2021 2022 2023
Economic Development Expenditure History
Personnel Operating Capital Outlay
134
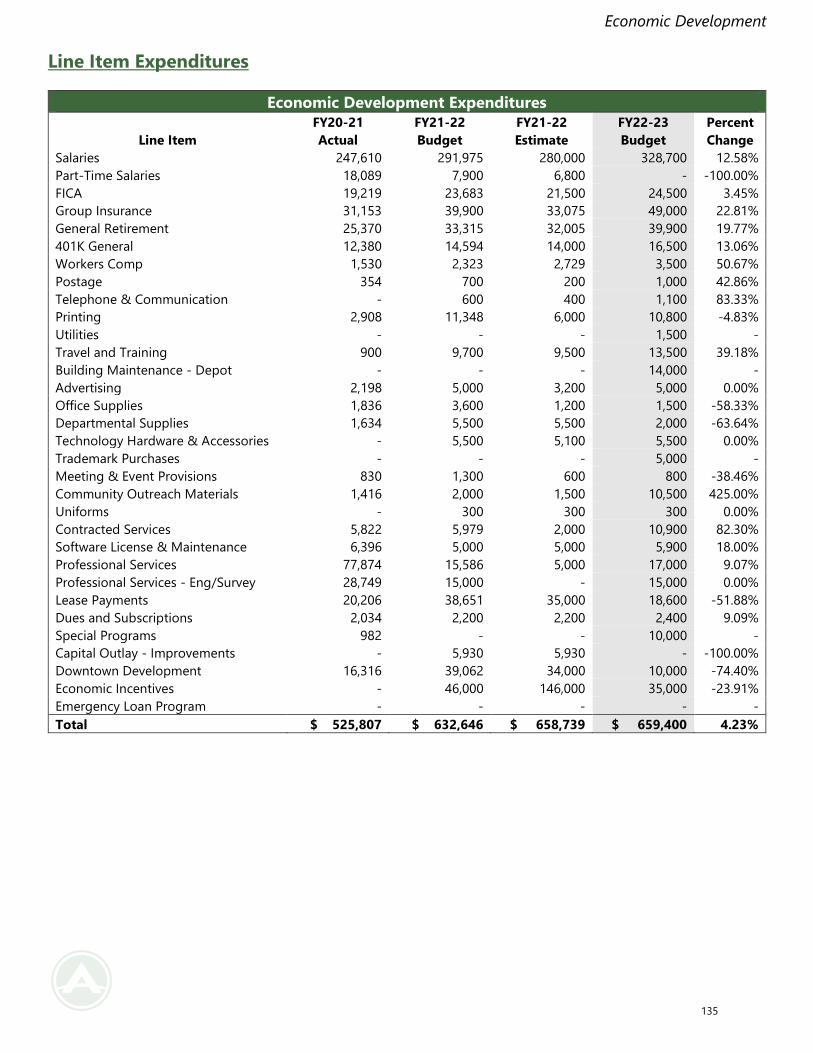
Economic Development
Line Item Expenditures
Economic Development Expenditures
Line Item
FY20-21
Actual
FY21-22
Budget
FY21-22
Estimate
FY22-23
Budget
Percent
Change
Salaries 247,610 291,975 280,000 328,700 12.58%
Part-Time Salaries 18,089 7,900 6,800 - -100.00%
FICA 19,219 23,683 21,500 24,500 3.45%
Group Insurance 31,153 39,900 33,075 49,000 22.81%
General Retirement 25,370 33,315 32,005 39,900 19.77%
401K General 12,380 14,594 14,000 16,500 13.06%
Workers Comp 1,530 2,323 2,729 3,500 50.67%
Postage 354 700 200 1,000 42.86%
Telephone & Communication - 600 400 1,100 83.33%
Printing 2,908 11,348 6,000 10,800 -4.83%
Utilities - - - 1,500 -
Travel and Training 900 9,700 9,500 13,500 39.18%
Building Maintenance - Depot - - - 14,000 -
Advertising 2,198 5,000 3,200 5,000 0.00%
Office Supplies 1,836 3,600 1,200 1,500 -58.33%
Departmental Supplies 1,634 5,500 5,500 2,000 -63.64%
Technology Hardware & Accessories - 5,500 5,100 5,500 0.00%
Trademark Purchases - - - 5,000 -
Meeting & Event Provisions 830 1,300 600 800 -38.46%
Community Outreach Materials 1,416 2,000 1,500 10,500 425.00%
Uniforms - 300 300 300 0.00%
Contracted Services 5,822 5,979 2,000 10,900 82.30%
Software License & Maintenance 6,396 5,000 5,000 5,900 18.00%
Professional Services 77,874 15,586 5,000 17,000 9.07%
Professional Services - Eng/Survey 28,749 15,000 - 15,000 0.00%
Lease Payments 20,206 38,651 35,000 18,600 -51.88%
Dues and Subscriptions 2,034 2,200 2,200 2,400 9.09%
Special Programs 982 - - 10,000 -
Capital Outlay - Improvements - 5,930 5,930 - -100.00%
Downtown Development 16,316 39,062 34,000 10,000 -74.40%
Economic Incentives - 46,000 146,000 35,000 -23.91%
Emergency Loan Program - - - - -
Total $ 525,807 $ 632,646 $ 658,739 $ 659,400 4.23%
135
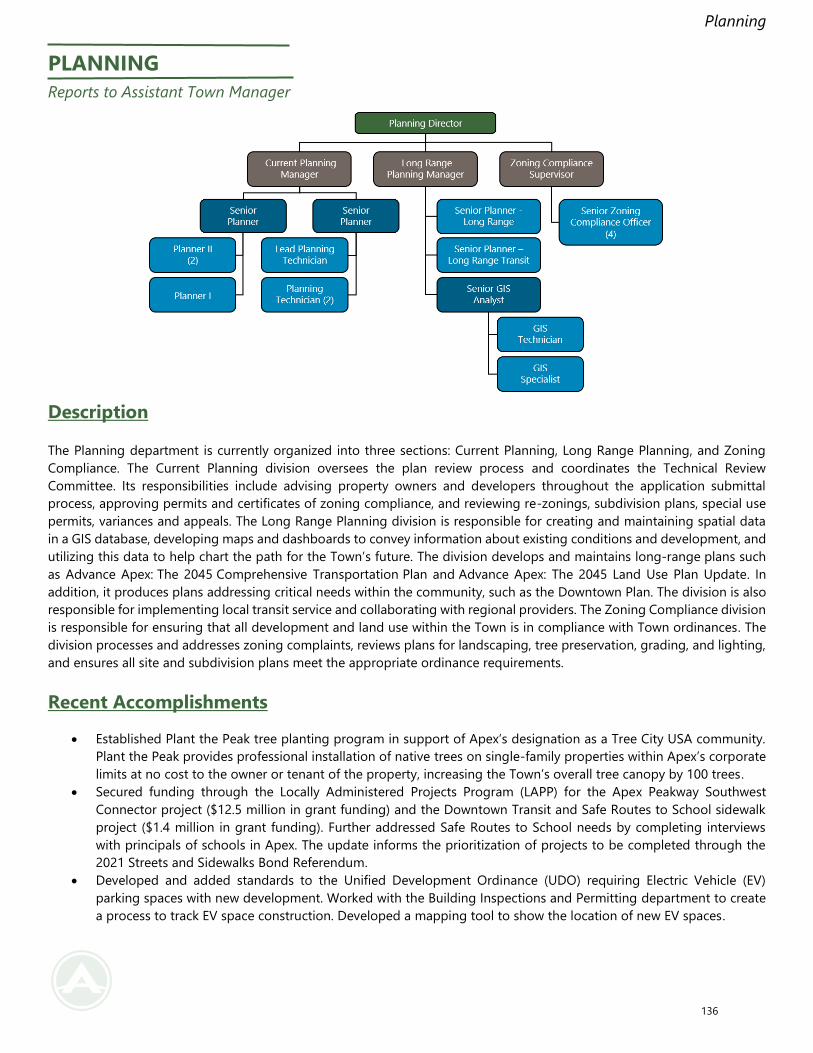
Planning
PLANNING
Reports to Assistant Town Manager
Description
The Planning department is currently organized into three sections: Current Planning, Long Range Planning, and Zoning
Compliance. The Current Planning division oversees the plan review process and coordinates the Technical Review
Committee. Its responsibilities include advising property owners and developers throughout the application submittal
process, approving permits and certificates of zoning compliance, and reviewing re-zonings, subdivision plans, special use
permits, variances and appeals. The Long Range Planning division is responsible for creating and maintaining spatial data
in a GIS database, developing maps and dashboards to convey information about existing conditions and development, and
utilizing this data to help chart the path for the Town’s future. The division develops and maintains long-range plans such
as Advance Apex: The 2045 Comprehensive Transportation Plan and Advance Apex: The 2045 Land Use Plan Update. In
addition, it produces plans addressing critical needs within the community, such as the Downtown Plan. The division is also
responsible for implementing local transit service and collaborating with regional providers. The Zoning Compliance division
is responsible for ensuring that all development and land use within the Town is in compliance with Town ordinances. The
division processes and addresses zoning complaints, reviews plans for landscaping, tree preservation, grading, and lighting,
and ensures all site and subdivision plans meet the appropriate ordinance requirements.
Recent Accomplishments
• Established Plant the Peak tree planting program in support of Apex’s designation as a Tree City USA community.
Plant the Peak provides professional installation of native trees on single-family properties within Apex’s corporate
limits at no cost to the owner or tenant of the property, increasing the Town’s overall tree canopy by 100 trees.
• Secured funding through the Locally Administered Projects Program (LAPP) for the Apex Peakway Southwest
Connector project ($12.5 million in grant funding) and the Downtown Transit and Safe Routes to School sidewalk
project ($1.4 million in grant funding). Further addressed Safe Routes to School needs by completing interviews
with principals of schools in Apex. The update informs the prioritization of projects to be completed through the
2021 Streets and Sidewalks Bond Referendum.
• Developed and added standards to the Unified Development Ordinance (UDO) requiring Electric Vehicle (EV)
parking spaces with new development. Worked with the Building Inspections and Permitting department to create
a process to track EV space construction. Developed a mapping tool to show the location of new EV spaces.
136
Planning
Strategic Goal Activities
Responsible Development
• Launch GoApex Route 1 in 2022 and carry out an extensive marketing, education, and outreach campaign to spread
the word about the new service. Continue to lead Apex’s participation in NCDOT’s Transit Oriented Development
Plan to support future passenger rail.
• Review development policies and complete ordinance amendments for various emerging issues such as food truck
courts, tiny house developments, and Accessory Dwelling Unit (ADU) standards. Review requests from the
community for updating development policies based on emerging issues and implementation of adopted plans
including the Downtown Master Plan and Parking Study and the Affordable Housing Plan.
• Conduct a public engagement process to review and consider amendments to both Advance Apex: The 2045 Land
Use Plan and Advance Apex: The 2045 Transportation Plan for the area north of US 64 adjacent to and inside
Chatham County in support of economic development projects in this area.
FY 2022-2023 Budget Highlights
• The Planning department budget increased by 12.35 percent in FY22-23.
• The Planning budget accounts for 4.40 percent of the General Fund budget and is equivalent to $0.034 on the tax
rate.
• The Town plans to spend $53.33 per capita for Planning in FY22-23.
• Major budget changes include the addition of one new staff member, Planner I, and the associated onboarding
costs.
• The budget also includes $320,000 for wayfinding implementation and $135,000 in special program for the Historical
Marker program, Façade Grant program and the Plant the Peak program.
137
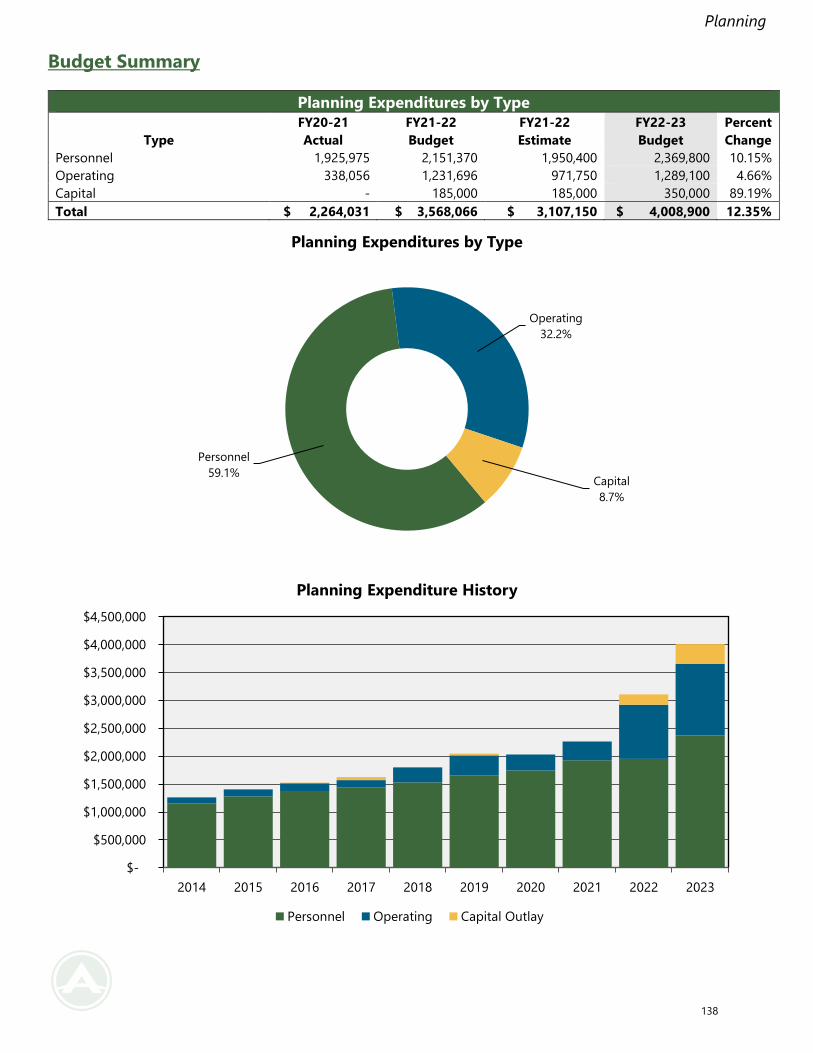
Planning
Budget Summary
Planning Expenditures by Type
Type
FY20-21
Actual
FY21-22
Budget
FY21-22
Estimate
FY22-23
Budget
Percent
Change
Personnel 1,925,975 2,151,370 1,950,400 2,369,800 10.15%
Operating 338,056 1,231,696 971,750 1,289,100 4.66%
Capital - 185,000 185,000 350,000 89.19%
Total $ 2,264,031 $ 3,568,066 $ 3,107,150 $ 4,008,900 12.35%
Personnel
59.1%
Operating
32.2%
Capital
8.7%
Planning Expenditures by Type
$-
$500,000
$1,000,000
$1,500,000
$2,000,000
$2,500,000
$3,000,000
$3,500,000
$4,000,000
$4,500,000
2014 2015 2016 2017 2018 2019 2020 2021 2022 2023
Planning Expenditure History
Personnel Operating Capital Outlay
138
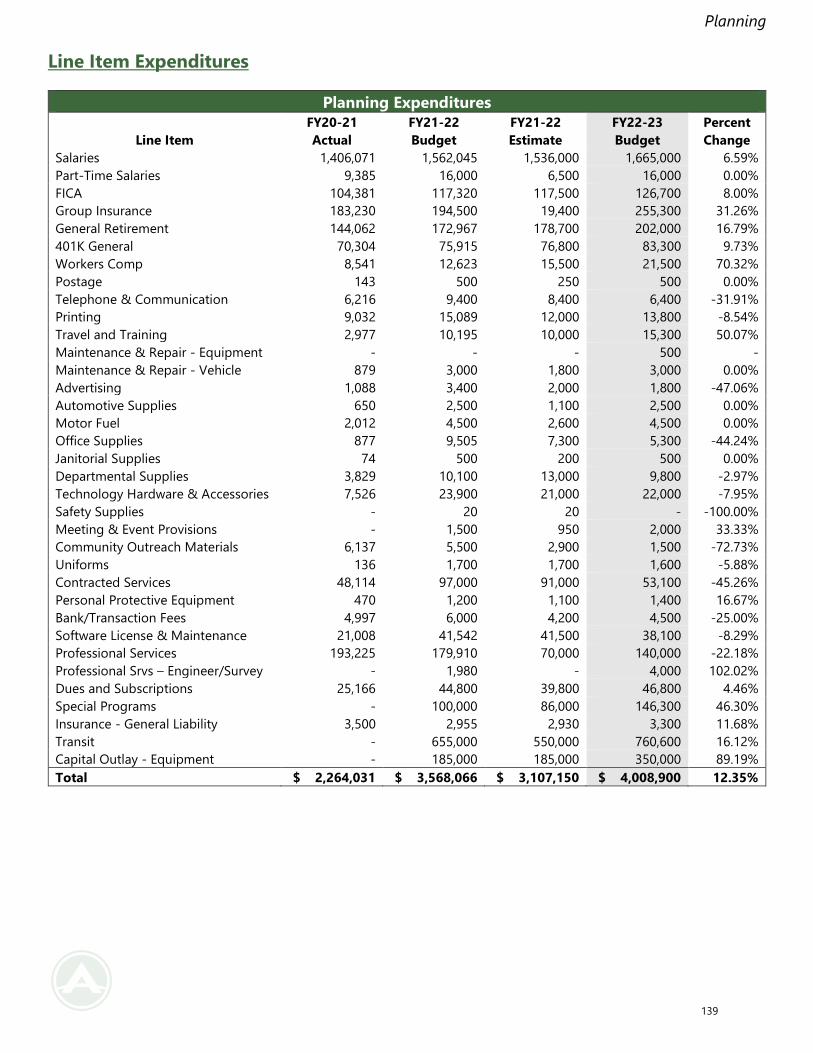
Planning
Line Item Expenditures
Planning Expenditures
Line Item
FY20-21
Actual
FY21-22
Budget
FY21-22
Estimate
FY22-23
Budget
Percent
Change
Salaries 1,406,071 1,562,045 1,536,000 1,665,000 6.59%
Part-Time Salaries 9,385 16,000 6,500 16,000 0.00%
FICA 104,381 117,320 117,500 126,700 8.00%
Group Insurance 183,230 194,500 19,400 255,300 31.26%
General Retirement 144,062 172,967 178,700 202,000 16.79%
401K General 70,304 75,915 76,800 83,300 9.73%
Workers Comp 8,541 12,623 15,500 21,500 70.32%
Postage 143 500 250 500 0.00%
Telephone & Communication 6,216 9,400 8,400 6,400 -31.91%
Printing 9,032 15,089 12,000 13,800 -8.54%
Travel and Training 2,977 10,195 10,000 15,300 50.07%
Maintenance & Repair - Equipment - - - 500 -
Maintenance & Repair - Vehicle 879 3,000 1,800 3,000 0.00%
Advertising 1,088 3,400 2,000 1,800 -47.06%
Automotive Supplies 650 2,500 1,100 2,500 0.00%
Motor Fuel 2,012 4,500 2,600 4,500 0.00%
Office Supplies 877 9,505 7,300 5,300 -44.24%
Janitorial Supplies 74 500 200 500 0.00%
Departmental Supplies 3,829 10,100 13,000 9,800 -2.97%
Technology Hardware & Accessories 7,526 23,900 21,000 22,000 -7.95%
Safety Supplies - 20 20 - -100.00%
Meeting & Event Provisions - 1,500 950 2,000 33.33%
Community Outreach Materials 6,137 5,500 2,900 1,500 -72.73%
Uniforms 136 1,700 1,700 1,600 -5.88%
Contracted Services 48,114 97,000 91,000 53,100 -45.26%
Personal Protective Equipment 470 1,200 1,100 1,400 16.67%
Bank/Transaction Fees 4,997 6,000 4,200 4,500 -25.00%
Software License & Maintenance 21,008 41,542 41,500 38,100 -8.29%
Professional Services 193,225 179,910 70,000 140,000 -22.18%
Professional Srvs – Engineer/Survey - 1,980 - 4,000 102.02%
Dues and Subscriptions 25,166 44,800 39,800 46,800 4.46%
Special Programs - 100,000 86,000 146,300 46.30%
Insurance - General Liability 3,500 2,955 2,930 3,300 11.68%
Transit - 655,000 550,000 760,600 16.12%
Capital Outlay - Equipment - 185,000 185,000 350,000 89.19%
Total $ 2,264,031 $ 3,568,066 $ 3,107,150 $ 4,008,900 12.35%
139
Building Inspections & Permitting
BUILDING INSPECTIONS & PERMITTING
Reports to Assistant Town Manager
Description
The primary responsibility of the Building Inspections & Permits department is to enforce the North Carolina Building Codes
as required by North Carolina General Statutes and adopted by the North Carolina Building Code Council. This includes
reviewing and approving building plans, performing field inspections, and serving as a resource to the Town and its residents
for any questions related to state and local codes and/or ordinances related to the building construction industry.
Recent Accomplishments
• Conducted electronic plan review for additional electric vehicle charging stations under the IDT Plan Review System.
• Adopted new remote virtual inspections to continue to serve the public during the COVID-19 pandemic.
• Implemented electronic plan review using IDT for inspections on residential additions and alternations.
Strategic Goal Activities
High Performing Government
• Attract and retain competitive talent. The Town currently has one open Field Inspector positions and an open Permits
Specialist position which impacts the timeliness of service provisions to residents. Staffing at capacity and retaining
talent will help in keeping service levels at the community expectation.
• Enable plan review and inspection process filing and communications through online portal. Contractors and citizens
have asked to be able to submit plans electronically. To meet the requests of customers the Town is moving towards
being able to submit all documentations for review through an online portal.
• Evaluate and restructure career progression ladder to suit further growth and department needs.
140
Building Inspections & Permitting
FY 2022-2023 Budget Highlights
• The Building Inspections & Permitting department budget decreased 7.57 percent in FY22-23.
• The Building Inspections & Permitting budget accounts for 3.27 percent of the General Fund budget and is
equivalent to $0.025 on the tax rate.
• The Town plans to spend $39.70 per capita for Building Inspections & Permitting in FY22-23.
• Major budget changes from prior year include the completion of the ADA Transition Plan, decreasing professional
services over $100,000.
141
Building Inspections & Permitting
Budget Summary
Building Inspections & Permitting Expenditures by Type
Type
FY20-21
Actual
FY21-22
Budget
FY21-22
Estimate
FY22-23
Budget
Percent
Change
Personnel 2,251,787 2,819,410 2,406,000 2,714,800 -3.71%
Operating 229,284 381,424 329,300 269,500 -29.34%
Capital 21,489 28,000 25,000 - -100.00%
Total $ 2,502,560 $ 3,228,834 $ 2,760,300 $ 2,984,300 -7.57%
Personnel
91.0%
Operating
9.0%
Capital
0.0%
Building Inspections & Permitting
Expenditures by Type
$-
$500,000
$1,000,000
$1,500,000
$2,000,000
$2,500,000
$3,000,000
$3,500,000
2014 2015 2016 2017 2018 2019 2020 2021 2022 2023
Building Inspections & Permitting Expenditure History
Personnel Operating Capital Outlay
142
Building Inspections & Permitting
Line Item Expenditures
Building Inspections & Permitting Expenditures
Line Item
FY20-21
Actual
FY21-22
Budget
FY21-22
Estimate
FY22-23
Budget
Percent
Change
Salaries 1,620,669 1,884,490 1,700,000 1,878,700 -0.31%
Part-Time Salaries 36,193 193,300 45,000 40,200 -79.20%
FICA 119,917 158,900 128,000 145,600 -8.37%
Group Insurance 217,641 253,700 230,000 302,400 19.20%
General Retirement 165,839 214,625 198,000 227,900 6.19%
401K General 81,192 94,225 85,000 94,000 -0.24%
Workers Comp 10,335 20,170 20,000 26,000 28.90%
Postage - - - 500 -
Telephone & Communication 15,835 19,500 17,000 21,200 8.72%
Printing 11,162 17,818 14,000 14,900 -16.38%
Utilities - - - - -
Travel and Training 22,958 56,700 38,000 50,000 -11.82%
Maintenance & Repair - Building - - - - -
Maintenance & Repair - Vehicle 3,973 4,800 3,400 5,100 6.25%
Automotive Supplies 2,600 5,000 5,200 5,000 0.00%
Motor Fuel 14,059 15,000 19,000 21,000 40.00%
Office Supplies 1,202 5,000 2,400 4,000 -20.00%
Departmental Supplies 1,839 7,500 2,500 2,000 -73.33%
Technology Hardware & Accessories 2,545 30,500 30,000 25,500 -16.39%
Safety Supplies - 1,000 - 900 -10.00%
Medical Supplies 28 - - 200 -
Meeting & Event Provisions 632 4,400 3,000 4,500 2.27%
Uniforms 6,400 8,300 6,200 8,900 7.23%
Contracted Services 1,115 6,000 6,000 4,400 -26.67%
Personal Protective Equipment 1,732 2,000 2,000 2,000 0.00%
Bank / Transaction Fees 11,431 22,500 11,600 20,000 -11.11%
Software License & Maintenance 35,680 54,394 54,000 59,000 8.47%
Professional Services 85,068 110,512 105,600 5,000 -95.48%
Dues and Subscriptions 325 500 500 500 0.00%
Insurance - General Liability 10,700 10,000 8,900 14,900 49.00%
Capital Outlay - Land - - - - -
Capital Outlay - Improvements - - - - -
Capital Outlay - Equipment 21,489 28,000 25,000 - -100.00%
Total $ 2,502,560 $ 3,228,834 $ 2,760,300 $ 2,984,300 -7.57%
143
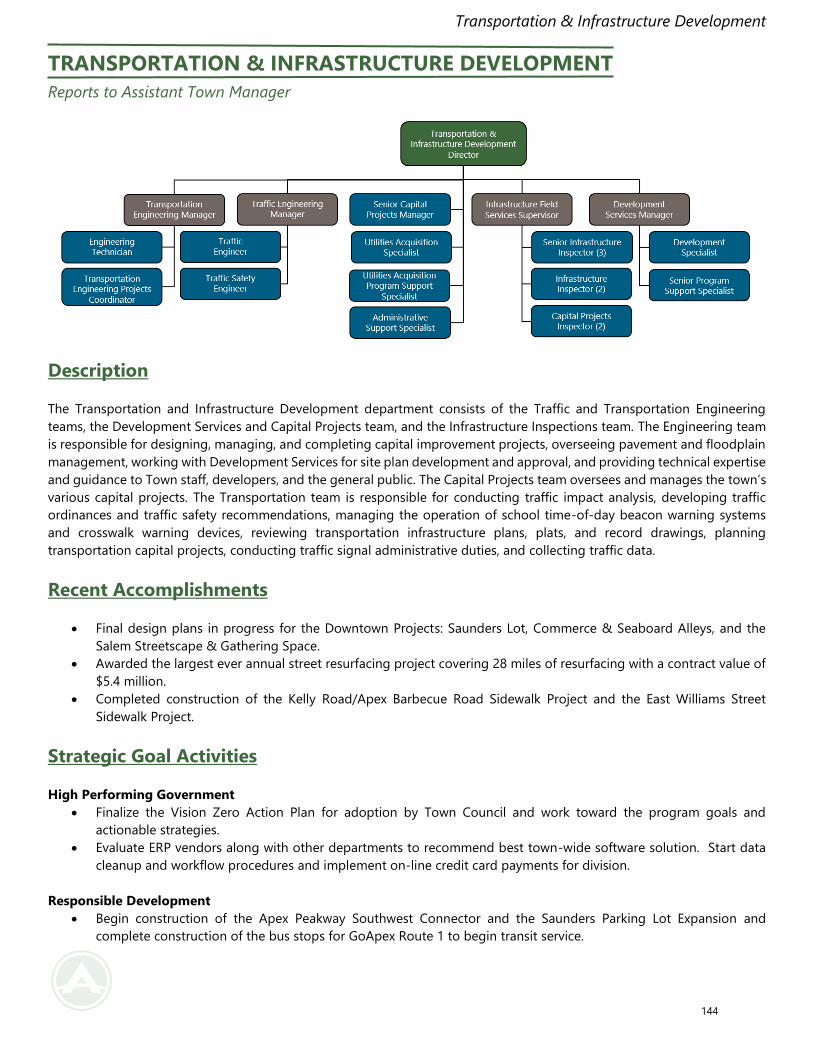
Transportation & Infrastructure Development
TRANSPORTATION & INFRASTRUCTURE DEVELOPMENT
Reports to Assistant Town Manager
Description
The Transportation and Infrastructure Development department consists of the Traffic and Transportation Engineering
teams, the Development Services and Capital Projects team, and the Infrastructure Inspections team. The Engineering team
is responsible for designing, managing, and completing capital improvement projects, overseeing pavement and floodplain
management, working with Development Services for site plan development and approval, and providing technical expertise
and guidance to Town staff, developers, and the general public. The Capital Projects team oversees and manages the town’s
various capital projects. The Transportation team is responsible for conducting traffic impact analysis, developing traffic
ordinances and traffic safety recommendations, managing the operation of school time-of-day beacon warning systems
and crosswalk warning devices, reviewing transportation infrastructure plans, plats, and record drawings, planning
transportation capital projects, conducting traffic signal administrative duties, and collecting traffic data.
Recent Accomplishments
• Final design plans in progress for the Downtown Projects: Saunders Lot, Commerce & Seaboard Alleys, and the
Salem Streetscape & Gathering Space.
• Awarded the largest ever annual street resurfacing project covering 28 miles of resurfacing with a contract value of
$5.4 million.
• Completed construction of the Kelly Road/Apex Barbecue Road Sidewalk Project and the East Williams Street
Sidewalk Project.
Strategic Goal Activities
High Performing Government
• Finalize the Vision Zero Action Plan for adoption by Town Council and work toward the program goals and
actionable strategies.
• Evaluate ERP vendors along with other departments to recommend best town-wide software solution. Start data
cleanup and workflow procedures and implement on-line credit card payments for division.
Responsible Development
• Begin construction of the Apex Peakway Southwest Connector and the Saunders Parking Lot Expansion and
complete construction of the bus stops for GoApex Route 1 to begin transit service.
144
Transportation & Infrastructure Development
FY 2022-2023 Budget Highlights
• The Transportation & Infrastructure Development department budget increased by 132.42 percent in FY22-23 due
to the Town reorganization. This department was formerly the Public Works & Transportation. This department now
houses the development services and capital projects positions, formerly in the Administration department, as well
as infrastructure positions, formerly in the Water Resources department. The public works administrative positions
have move into the newly formed Public Works Administration department.
• The Transportation & Infrastructure Development budget accounts for 3.74 percent of the General Fund budget
and is equivalent to $0.029 on the tax rate.
• The Town plans to spend $45.35 per capita for Transportation & Infrastructure Development in FY22-23.
• Major budget changes include the addition of five new positions, including a Traffic Safety Engineer, a Construction
& Facilities Director, an Administrative Support position, a Capital Projects Inspector, and a Utilities Acquisition
Program Support Specialist, and the associated onboarding costs.
• The budget includes capital improvements, including GPS Vehicle preemption and capital equipment, including one
additional vehicle associated with new personnel.
145
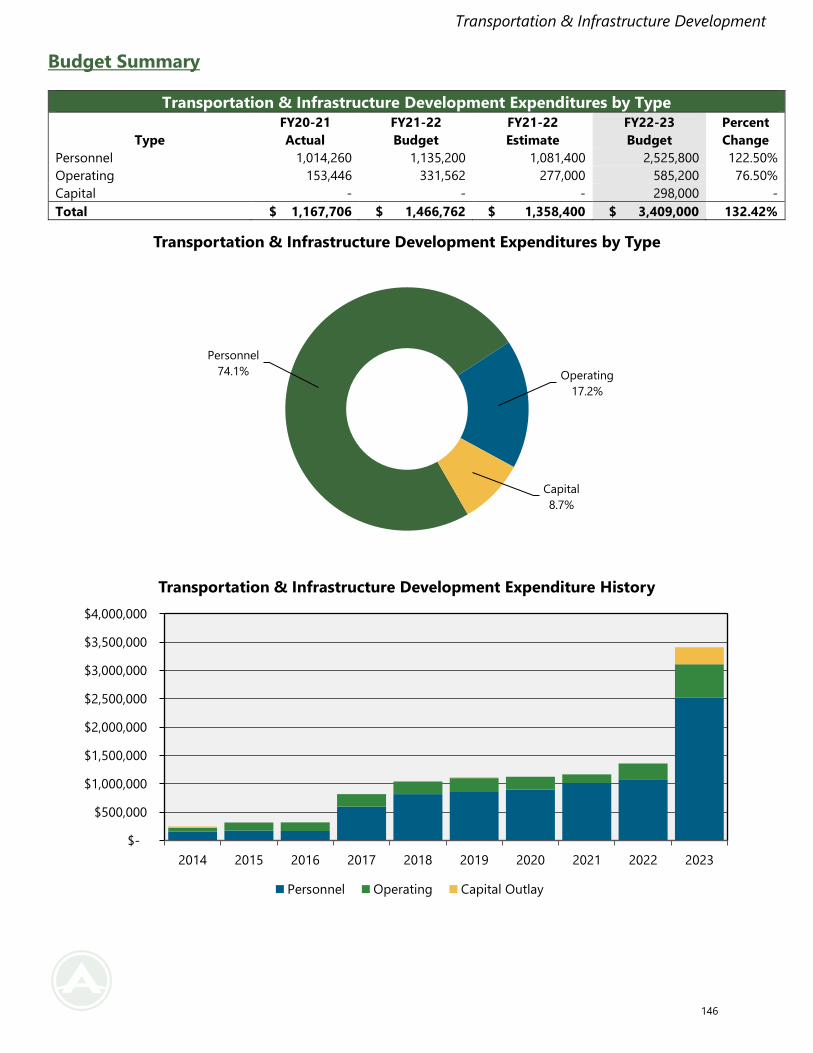
Transportation & Infrastructure Development
Budget Summary
Transportation & Infrastructure Development Expenditures by Type
Type
FY20-21
Actual
FY21-22
Budget
FY21-22
Estimate
FY22-23
Budget
Percent
Change
Personnel 1,014,260 1,135,200 1,081,400 2,525,800 122.50%
Operating 153,446 331,562 277,000 585,200 76.50%
Capital - - - 298,000 -
Total $ 1,167,706 $ 1,466,762 $ 1,358,400 $ 3,409,000 132.42%
Personnel
74.1% Operating
17.2%
Capital
8.7%
Transportation & Infrastructure Development Expenditures by Type
$-
$500,000
$1,000,000
$1,500,000
$2,000,000
$2,500,000
$3,000,000
$3,500,000
$4,000,000
2014 2015 2016 2017 2018 2019 2020 2021 2022 2023
Transportation & Infrastructure Development Expenditure History
Personnel Operating Capital Outlay
146
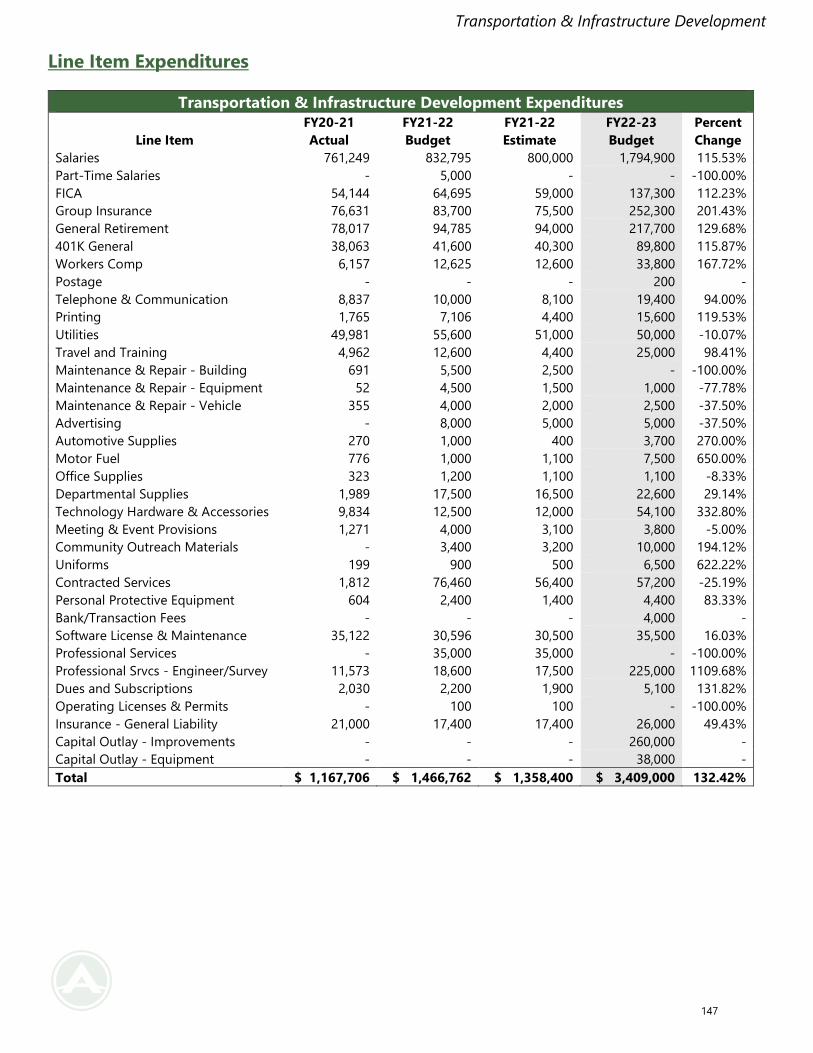
Transportation & Infrastructure Development
Line Item Expenditures
Transportation & Infrastructure Development Expenditures
Line Item
FY20-21
Actual
FY21-22
Budget
FY21-22
Estimate
FY22-23
Budget
Percent
Change
Salaries 761,249 832,795 800,000 1,794,900 115.53%
Part-Time Salaries - 5,000 - - -100.00%
FICA 54,144 64,695 59,000 137,300 112.23%
Group Insurance 76,631 83,700 75,500 252,300 201.43%
General Retirement 78,017 94,785 94,000 217,700 129.68%
401K General 38,063 41,600 40,300 89,800 115.87%
Workers Comp 6,157 12,625 12,600 33,800 167.72%
Postage - - - 200 -
Telephone & Communication 8,837 10,000 8,100 19,400 94.00%
Printing 1,765 7,106 4,400 15,600 119.53%
Utilities 49,981 55,600 51,000 50,000 -10.07%
Travel and Training 4,962 12,600 4,400 25,000 98.41%
Maintenance & Repair - Building 691 5,500 2,500 - -100.00%
Maintenance & Repair - Equipment 52 4,500 1,500 1,000 -77.78%
Maintenance & Repair - Vehicle 355 4,000 2,000 2,500 -37.50%
Advertising - 8,000 5,000 5,000 -37.50%
Automotive Supplies 270 1,000 400 3,700 270.00%
Motor Fuel 776 1,000 1,100 7,500 650.00%
Office Supplies 323 1,200 1,100 1,100 -8.33%
Departmental Supplies 1,989 17,500 16,500 22,600 29.14%
Technology Hardware & Accessories 9,834 12,500 12,000 54,100 332.80%
Meeting & Event Provisions 1,271 4,000 3,100 3,800 -5.00%
Community Outreach Materials - 3,400 3,200 10,000 194.12%
Uniforms 199 900 500 6,500 622.22%
Contracted Services 1,812 76,460 56,400 57,200 -25.19%
Personal Protective Equipment 604 2,400 1,400 4,400 83.33%
Bank/Transaction Fees - - - 4,000 -
Software License & Maintenance 35,122 30,596 30,500 35,500 16.03%
Professional Services - 35,000 35,000 - -100.00%
Professional Srvcs - Engineer/Survey 11,573 18,600 17,500 225,000 1109.68%
Dues and Subscriptions 2,030 2,200 1,900 5,100 131.82%
Operating Licenses & Permits - 100 100 - -100.00%
Insurance - General Liability 21,000 17,400 17,400 26,000 49.43%
Capital Outlay - Improvements - - - 260,000 -
Capital Outlay - Equipment - - - 38,000 -
Total $ 1,167,706 $ 1,466,762 $ 1,358,400 $ 3,409,000 132.42%
147
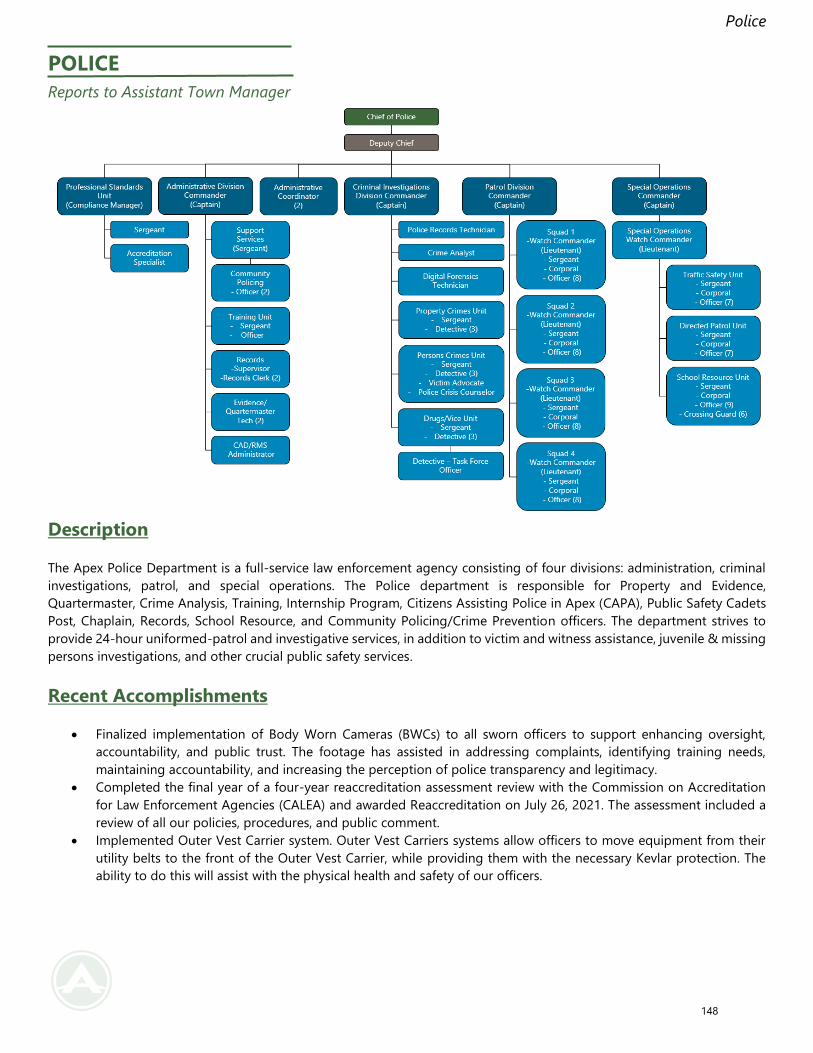
Police
POLICE
Reports to Assistant Town Manager
Description
The Apex Police Department is a full-service law enforcement agency consisting of four divisions: administration, criminal
investigations, patrol, and special operations. The Police department is responsible for Property and Evidence,
Quartermaster, Crime Analysis, Training, Internship Program, Citizens Assisting Police in Apex (CAPA), Public Safety Cadets
Post, Chaplain, Records, School Resource, and Community Policing/Crime Prevention officers. The department strives to
provide 24-hour uniformed-patrol and investigative services, in addition to victim and witness assistance, juvenile & missing
persons investigations, and other crucial public safety services.
Recent Accomplishments
• Finalized implementation of Body Worn Cameras (BWCs) to all sworn officers to support enhancing oversight,
accountability, and public trust. The footage has assisted in addressing complaints, identifying training needs,
maintaining accountability, and increasing the perception of police transparency and legitimacy.
• Completed the final year of a four-year reaccreditation assessment review with the Commission on Accreditation
for Law Enforcement Agencies (CALEA) and awarded Reaccreditation on July 26, 2021. The assessment included a
review of all our policies, procedures, and public comment.
• Implemented Outer Vest Carrier system. Outer Vest Carriers systems allow officers to move equipment from their
utility belts to the front of the Outer Vest Carrier, while providing them with the necessary Kevlar protection. The
ability to do this will assist with the physical health and safety of our officers.
148
Police
Strategic Goal Activities
High Performing Government
• Enhance accountability of work performance. A review of internal quality control metrics and input from community
stakeholders assisted in identifying the need for enhanced accountability. Benchmark Analytics software will assist
to better capture and review work performance metrics. In addition, an increase in training will enhance the
knowledge, skills and abilities of all our staff.
• Implement software to assist in information collection, distribution of police reports, and an increase for calls for
service. As population grows, the increase in calls for service continues to grow. The Police-to-Citizen police report
portal is an online self-reporting tool. The software will be implemented to assist residents in reporting incidents
that do not require officers’ immediate responses.
A Welcoming Community
• Creating an outdoor training center to be used for a firearms range and large-scale critical incident training center
for all Town departments. The department will not need to schedule firearms range time with an outside entity with
limited scheduling options and will be able to have an internal firearms range and space for critical incident training
with Town departments. This will also help to better prepare staff for various emergency situations.
FY 2022-2023 Budget Highlights
• The Police department budget increased 14.99 percent in FY22-23.
• The Police budget accounts for 18.39 percent of the General Fund budget and is equivalent to $0.141 on the tax
rate.
• The Town plans to spend $223.06 per capita for Police in FY22-23.
• Major budget changes include the addition of five new staff members including two Lieutenant/Watch
Commanders, a part-time Administrative Coordinator, a Captain, and an Evidence/Quartermaster Clerk, and the
associated onboarding costs.
• The budget includes an increase in capital equipment, including ten vehicle replacements and four vehicle additions.
• Increases in operating expenditures are due to equipment and gear for new positions as well as increases in fuel
costs.
149
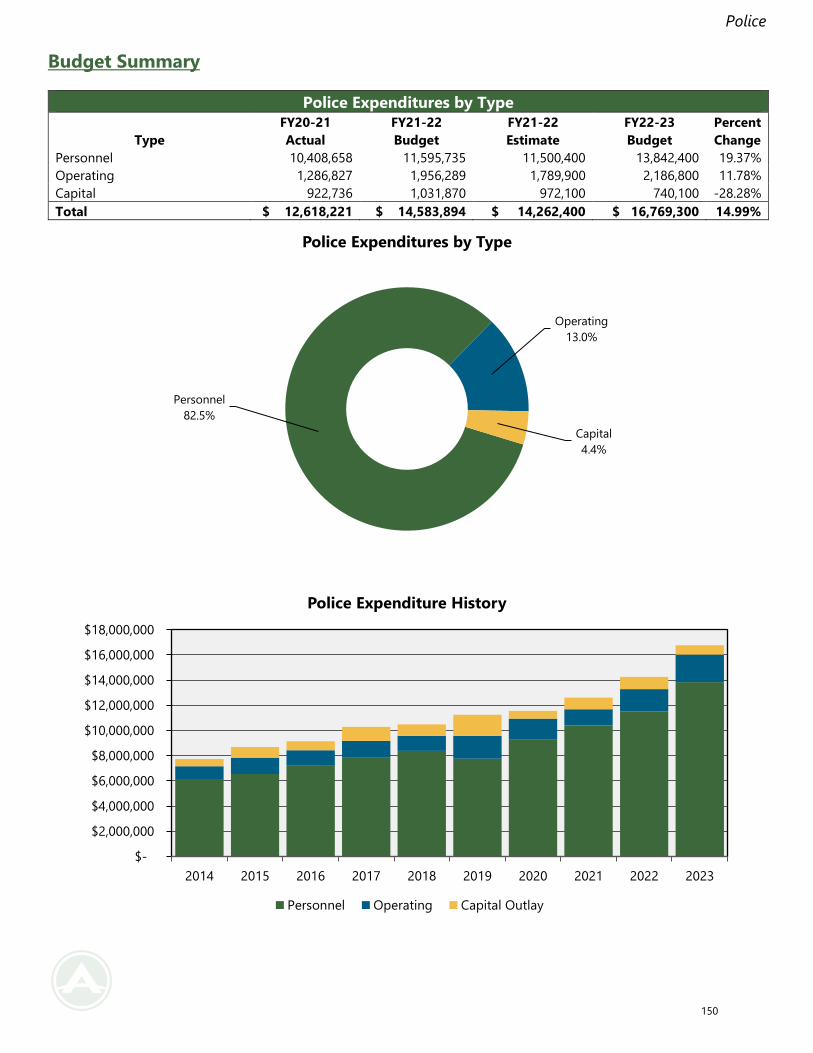
Police
Budget Summary
Police Expenditures by Type
Type
FY20-21
Actual
FY21-22
Budget
FY21-22
Estimate
FY22-23
Budget
Percent
Change
Personnel 10,408,658 11,595,735 11,500,400 13,842,400 19.37%
Operating 1,286,827 1,956,289 1,789,900 2,186,800 11.78%
Capital 922,736 1,031,870 972,100 740,100 -28.28%
Total $ 12,618,221 $ 14,583,894 $ 14,262,400 $ 16,769,300 14.99%
Personnel
82.5%
Operating
13.0%
Capital
4.4%
Police Expenditures by Type
$-
$2,000,000
$4,000,000
$6,000,000
$8,000,000
$10,000,000
$12,000,000
$14,000,000
$16,000,000
$18,000,000
2014 2015 2016 2017 2018 2019 2020 2021 2022 2023
Police Expenditure History
Personnel Operating Capital Outlay
150
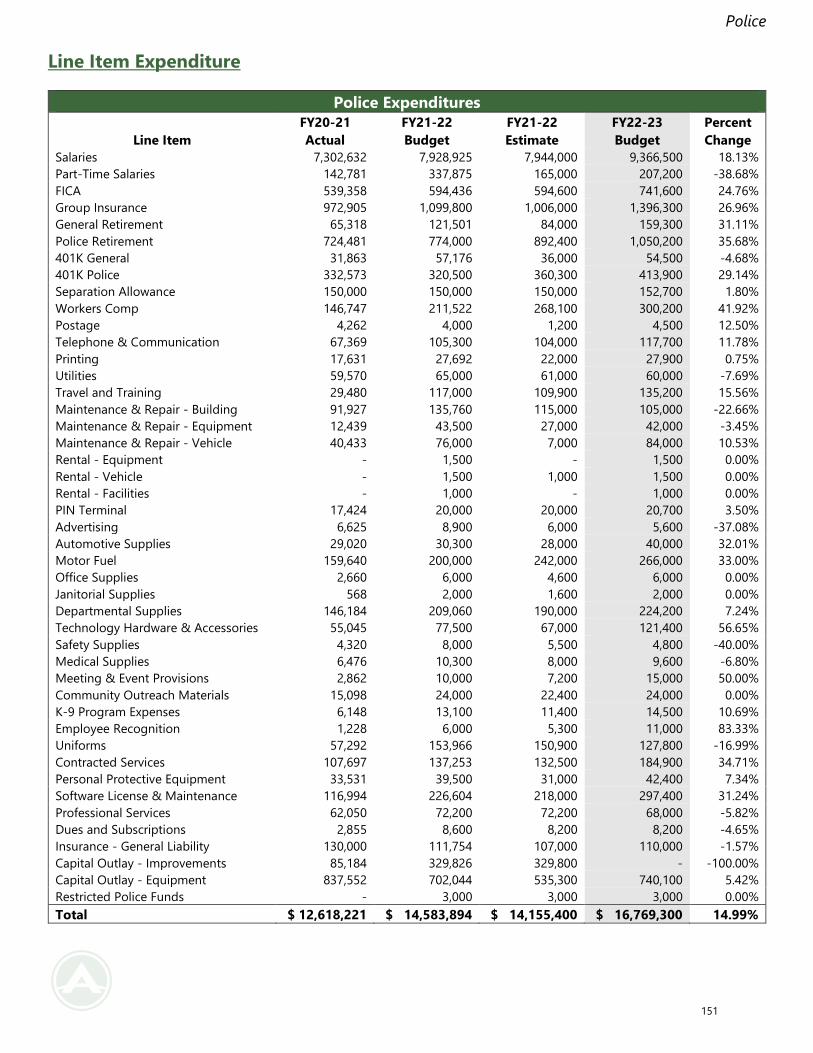
Police
Line Item Expenditure
Police Expenditures
Line Item
FY20-21
Actual
FY21-22
Budget
FY21-22
Estimate
FY22-23
Budget
Percent
Change
Salaries 7,302,632 7,928,925 7,944,000 9,366,500 18.13%
Part-Time Salaries 142,781 337,875 165,000 207,200 -38.68%
FICA 539,358 594,436 594,600 741,600 24.76%
Group Insurance 972,905 1,099,800 1,006,000 1,396,300 26.96%
General Retirement 65,318 121,501 84,000 159,300 31.11%
Police Retirement 724,481 774,000 892,400 1,050,200 35.68%
401K General 31,863 57,176 36,000 54,500 -4.68%
401K Police 332,573 320,500 360,300 413,900 29.14%
Separation Allowance 150,000 150,000 150,000 152,700 1.80%
Workers Comp 146,747 211,522 268,100 300,200 41.92%
Postage 4,262 4,000 1,200 4,500 12.50%
Telephone & Communication 67,369 105,300 104,000 117,700 11.78%
Printing 17,631 27,692 22,000 27,900 0.75%
Utilities 59,570 65,000 61,000 60,000 -7.69%
Travel and Training 29,480 117,000 109,900 135,200 15.56%
Maintenance & Repair - Building 91,927 135,760 115,000 105,000 -22.66%
Maintenance & Repair - Equipment 12,439 43,500 27,000 42,000 -3.45%
Maintenance & Repair - Vehicle 40,433 76,000 7,000 84,000 10.53%
Rental - Equipment - 1,500 - 1,500 0.00%
Rental - Vehicle - 1,500 1,000 1,500 0.00%
Rental - Facilities - 1,000 - 1,000 0.00%
PIN Terminal 17,424 20,000 20,000 20,700 3.50%
Advertising 6,625 8,900 6,000 5,600 -37.08%
Automotive Supplies 29,020 30,300 28,000 40,000 32.01%
Motor Fuel 159,640 200,000 242,000 266,000 33.00%
Office Supplies 2,660 6,000 4,600 6,000 0.00%
Janitorial Supplies 568 2,000 1,600 2,000 0.00%
Departmental Supplies 146,184 209,060 190,000 224,200 7.24%
Technology Hardware & Accessories 55,045 77,500 67,000 121,400 56.65%
Safety Supplies 4,320 8,000 5,500 4,800 -40.00%
Medical Supplies 6,476 10,300 8,000 9,600 -6.80%
Meeting & Event Provisions 2,862 10,000 7,200 15,000 50.00%
Community Outreach Materials 15,098 24,000 22,400 24,000 0.00%
K-9 Program Expenses 6,148 13,100 11,400 14,500 10.69%
Employee Recognition 1,228 6,000 5,300 11,000 83.33%
Uniforms 57,292 153,966 150,900 127,800 -16.99%
Contracted Services 107,697 137,253 132,500 184,900 34.71%
Personal Protective Equipment 33,531 39,500 31,000 42,400 7.34%
Software License & Maintenance 116,994 226,604 218,000 297,400 31.24%
Professional Services 62,050 72,200 72,200 68,000 -5.82%
Dues and Subscriptions 2,855 8,600 8,200 8,200 -4.65%
Insurance - General Liability 130,000 111,754 107,000 110,000 -1.57%
Capital Outlay - Improvements 85,184 329,826 329,800 - -100.00%
Capital Outlay - Equipment 837,552 702,044 535,300 740,100 5.42%
Restricted Police Funds - 3,000 3,000 3,000 0.00%
Total $ 12,618,221 $ 14,583,894 $ 14,155,400 $ 16,769,300 14.99%
151
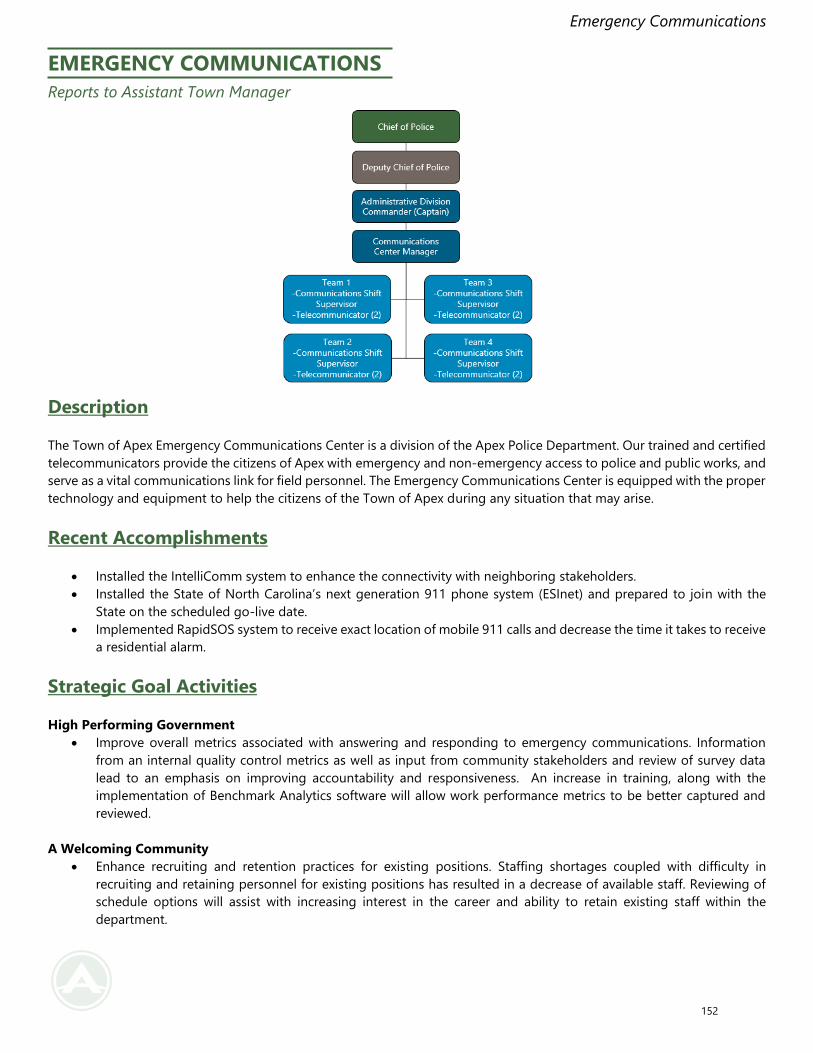
Emergency Communications
EMERGENCY COMMUNICATIONS
Reports to Assistant Town Manager
Description
The Town of Apex Emergency Communications Center is a division of the Apex Police Department. Our trained and certified
telecommunicators provide the citizens of Apex with emergency and non-emergency access to police and public works, and
serve as a vital communications link for field personnel. The Emergency Communications Center is equipped with the proper
technology and equipment to help the citizens of the Town of Apex during any situation that may arise.
Recent Accomplishments
• Installed the IntelliComm system to enhance the connectivity with neighboring stakeholders.
• Installed the State of North Carolina’s next generation 911 phone system (ESInet) and prepared to join with the
State on the scheduled go-live date.
• Implemented RapidSOS system to receive exact location of mobile 911 calls and decrease the time it takes to receive
a residential alarm.
Strategic Goal Activities
High Performing Government
• Improve overall metrics associated with answering and responding to emergency communications. Information
from an internal quality control metrics as well as input from community stakeholders and review of survey data
lead to an emphasis on improving accountability and responsiveness. An increase in training, along with the
implementation of Benchmark Analytics software will allow work performance metrics to be better captured and
reviewed.
A Welcoming Community
• Enhance recruiting and retention practices for existing positions. Staffing shortages coupled with difficulty in
recruiting and retaining personnel for existing positions has resulted in a decrease of available staff. Reviewing of
schedule options will assist with increasing interest in the career and ability to retain existing staff within the
department.
152
Emergency Communications
• Establish a Communications Backup Center at Public Safety Station 36. A backup center for the emergency
communications center is necessary in case of hardware or software failure at the primary Emergency
Communications Center. While calls can temporarily be sent to neighboring agencies, the redundant equipment
will enable Apex Communications to reinstate control at a continuance of operations site.
FY 2022-2023 Budget Highlights
• The Emergency Communications department budget increased 20.18 percent in FY22-23.
• The Emergency Communications budget accounts for 1.70 percent of the General Fund budget and is equivalent to
$0.013 on the tax rate.
• The Town plans to spend $20.60 per capita for Emergency Communications in FY22-23.
• Major budget changes this year include an overall increase due to increases in personnel costs. The percentage
increase in personnel costs over the FY21-22 Amended Budget is misleading due to lapsed salaries from FY22.
Recruitment for telecommunicators has proven challenging, but the Town has been successful and is currently fully
staffed. A significant increase in technology & hardware is due to regular computer replacement schedule.
153
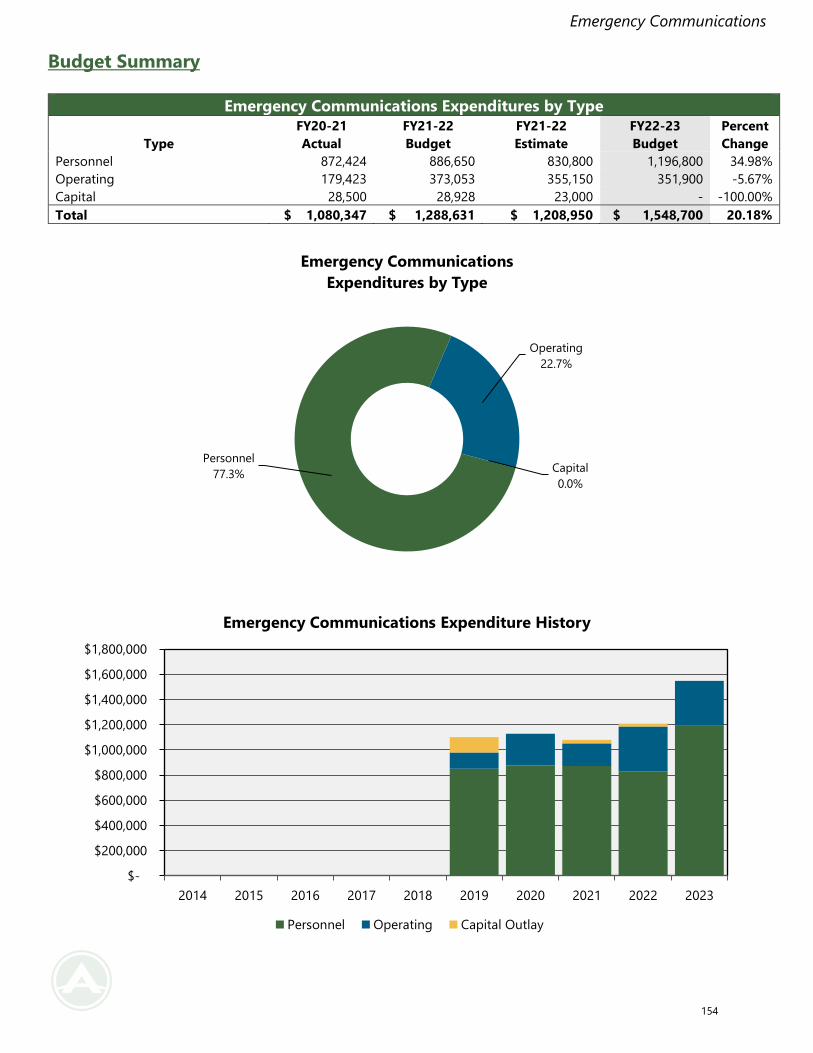
Emergency Communications
Budget Summary
Emergency Communications Expenditures by Type
Type
FY20-21
Actual
FY21-22
Budget
FY21-22
Estimate
FY22-23
Budget
Percent
Change
Personnel 872,424 886,650 830,800 1,196,800 34.98%
Operating 179,423 373,053 355,150 351,900 -5.67%
Capital 28,500 28,928 23,000 - -100.00%
Total $ 1,080,347 $ 1,288,631 $ 1,208,950 $ 1,548,700 20.18%
Personnel
77.3%
Operating
22.7%
Capital
0.0%
Emergency Communications
Expenditures by Type
$-
$200,000
$400,000
$600,000
$800,000
$1,000,000
$1,200,000
$1,400,000
$1,600,000
$1,800,000
2014 2015 2016 2017 2018 2019 2020 2021 2022 2023
Emergency Communications Expenditure History
Personnel Operating Capital Outlay
154
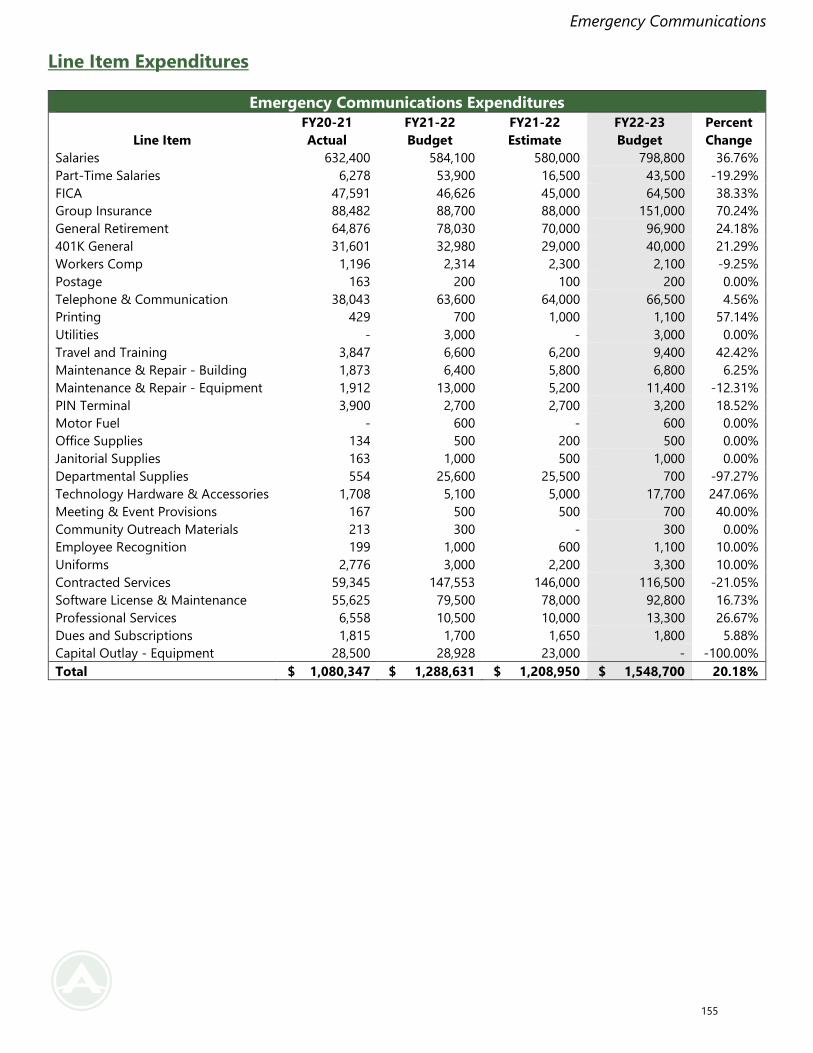
Emergency Communications
Line Item Expenditures
Emergency Communications Expenditures
Line Item
FY20-21
Actual
FY21-22
Budget
FY21-22
Estimate
FY22-23
Budget
Percent
Change
Salaries 632,400 584,100 580,000 798,800 36.76%
Part-Time Salaries 6,278 53,900 16,500 43,500 -19.29%
FICA 47,591 46,626 45,000 64,500 38.33%
Group Insurance 88,482 88,700 88,000 151,000 70.24%
General Retirement 64,876 78,030 70,000 96,900 24.18%
401K General 31,601 32,980 29,000 40,000 21.29%
Workers Comp 1,196 2,314 2,300 2,100 -9.25%
Postage 163 200 100 200 0.00%
Telephone & Communication 38,043 63,600 64,000 66,500 4.56%
Printing 429 700 1,000 1,100 57.14%
Utilities - 3,000 - 3,000 0.00%
Travel and Training 3,847 6,600 6,200 9,400 42.42%
Maintenance & Repair - Building 1,873 6,400 5,800 6,800 6.25%
Maintenance & Repair - Equipment 1,912 13,000 5,200 11,400 -12.31%
PIN Terminal 3,900 2,700 2,700 3,200 18.52%
Motor Fuel - 600 - 600 0.00%
Office Supplies 134 500 200 500 0.00%
Janitorial Supplies 163 1,000 500 1,000 0.00%
Departmental Supplies 554 25,600 25,500 700 -97.27%
Technology Hardware & Accessories 1,708 5,100 5,000 17,700 247.06%
Meeting & Event Provisions 167 500 500 700 40.00%
Community Outreach Materials 213 300 - 300 0.00%
Employee Recognition 199 1,000 600 1,100 10.00%
Uniforms 2,776 3,000 2,200 3,300 10.00%
Contracted Services 59,345 147,553 146,000 116,500 -21.05%
Software License & Maintenance 55,625 79,500 78,000 92,800 16.73%
Professional Services 6,558 10,500 10,000 13,300 26.67%
Dues and Subscriptions 1,815 1,700 1,650 1,800 5.88%
Capital Outlay - Equipment 28,500 28,928 23,000 - -100.00%
Total $ 1,080,347 $ 1,288,631 $ 1,208,950 $ 1,548,700 20.18%
155
Fire
FIRE
Reports to Assistant Town Manager
Description
The Apex Fire Department provides fire, emergency medical, rescue, domestic preparedness, hazardous materials mitigation,
community risk reduction, public education, and fire investigation services to the residents, businesses, and visitors of the
Town of Apex. To accomplish its mission, Apex Fire Department operates out of five stations strategically located throughout
the Town and unincorporated Wake County areas that fall under the responsibility of the department. The department
currently has four functional divisions, including operations, support services, fire prevention, and administration.
Recent Accomplishments
• Further developed partnership with the Town of Cary Fire Department and the Town of Morrisville Fire Department
resulting in improved levels of service being provided to each community.
• Completed the department’s first Community Risk Assessment/Standard of Coverage document, which gives a
thorough assessment of the dangers in our community and how the fire department has responded to those risks
in the past and generate enhanced responses in the future.
• Partnered with the Town of Apex Communications to boost the volume and quality of our community outreach
activities including the very popular “Hot Take” safety instruction videos.
Strategic Goal Activities
High Performing Government
• Continue to enhance the Fire department’s capabilities to respond to the increasing amount of emergency events.
Growth of the town (annexation of Chatham County, rising population, new buildings) has led to increased risks in
the community. Risks will continue to increase as the town expands further out and population continues to rise,
necessitating that the Fire department’s ability to respond increase accordingly.
• Support Fire department leaders, company officers and battalion chiefs, in a leadership capacity. Due to the rapid
growth of the Fire department, personnel have been placed in leadership positions with less experience and
leadership training. There is a need to support fire department personnel by making additional leadership training
resources available to the department’s staff.
156
Fire
A Welcoming Community
• Improve the physical and mental health wellness of Fire department staff. Recognizing the fact that cancer is the
leading cause of firefighter deaths, fatal heart attacks continue to be the largest cause of death while on-duty, and
death by suicide for fighters continues to grow at an alarming rate. Not only is this dangerous for fire fighters, poor
mental health and extended absences from work put additional strain on our available force, placing the
surrounding community at greater risk.
FY 2022-2023 Budget Highlights
• The Fire department budget increased 29.14 percent in FY22-23.
• The Fire budget accounts for 17.40 percent of the General Fund budget and is equivalent to $0.133 on the tax rate.
• The Town plans to spend $211.06 per capita for Fire in FY22-23.
• Major budget changes primarily correlate to bringing Public Safety Station 6 online and the operating costs
associated with it. Staffing the station contributes to increases in personnel costs and associated operating costs
(i.e. turnout gear) with the addition of three Battalion Chiefs, three Fire Lieutenants, three Fire Engineers, five
Firefighters, and a Deputy Fire Chief.
• The budget includes a significant increase in capital outlay equipment, of which 89 percent is the purchase of an
aerial apparatus.
157
Fire
Budget Summary
Fire Expenditures by Type
Type
FY20-21
Actual
FY21-22
Budget
FY21-22
Estimate
FY22-23
Budget
Percent
Change
Personnel 9,207,842 9,832,010 9,886,500 12,502,900 27.17%
Operating 1,100,144 1,506,076 1,342,400 1,671,000 10.95%
Capital 590,560 948,249 948,000 1,692,800 78.52%
Total $ 10,898,546 $ 12,286,335 $ 12,176,900 $ 15,866,700 29.14%
Personnel
78.8%
Operating
10.5%
Capital
10.7%
Fire Expenditures by Type
$-
$2,000,000
$4,000,000
$6,000,000
$8,000,000
$10,000,000
$12,000,000
$14,000,000
$16,000,000
$18,000,000
2014 2015 2016 2017 2018 2019 2020 2021 2022 2023
Fire Expenditure History
Personnel Operating Capital Outlay
158
Fire
Line Item Expenditures
Fire Expenditures
Line Item
FY20-21
Actual
FY21-22
Budget
FY21-22
Estimate
FY22-23
Budget
Percent
Change
Salaries 6,642,501 6,963,450 6,967,000 8,610,200 23.65%
Part-Time Salaries 8,616 129,000 17,000 20,800 -83.88%
FICA 476,957 486,517 510,900 647,200 33.03%
Group Insurance 945,202 1,005,700 978,000 1,449,400 44.12%
General Retirement 680,152 709,240 809,200 1,044,500 47.27%
401K General 331,903 311,538 347,600 430,600 38.22%
Workers Comp 122,512 226,565 256,800 300,200 32.50%
Postage 253 1,000 600 1,000 0.00%
Telephone & Communication 32,347 62,800 4,600 52,600 -16.24%
Printing 7,146 10,531 8,500 9,200 -12.64%
Utilities 62,925 70,000 62,000 60,000 -14.29%
Travel and Training 20,390 58,100 52,000 115,500 98.80%
Maintenance & Repair - Building 58,991 50,290 50,200 73,300 45.75%
Maintenance & Repair - Equipment 20,689 51,280 46,000 50,700 -1.13%
Maintenance & Repair - Vehicle 119,108 82,000 80,000 94,500 15.24%
Automotive Supplies 23,100 40,000 4,000 40,000 0.00%
Motor Fuel 45,832 60,000 66,500 76,800 28.00%
Office Supplies 752 3,500 2,400 3,500 0.00%
Janitorial Supplies 9,746 15,000 13,500 17,000 13.33%
Departmental Supplies 52,411 65,490 61,000 71,500 9.18%
Technology Hardware & Accessories 17,271 30,000 30,000 46,700 55.67%
Safety Supplies 254 2,500 2,000 2,800 12.00%
Medical Supplies 7,215 12,000 11,000 17,000 41.67%
Meeting & Event Provisions 3,853 11,400 6,800 12,600 10.53%
Community Outreach Materials 6,972 18,000 18,000 20,900 16.11%
Uniforms 47,964 78,416 78,000 91,500 16.69%
Contracted Services 111,927 176,098 156,800 166,000 -5.73%
Personal Protective Equipment 156,031 107,208 101,500 243,200 126.85%
Software License & Maintenance 69,783 77,367 76,000 87,200 12.71%
Professional Services 72,130 181,239 171,000 47,500 -73.79%
Emergency Equipment 51,946 126,411 126,000 138,100 9.25%
Wake County Hazmat 28,019 30,300 30,300 27,100 -10.56%
Dues and Subscriptions 8,224 13,900 12,000 15,900 14.39%
Insurance - General Liability 64,867 71,246 71,700 88,900 24.78%
Capital Outlay - Land 470,774 - - - -
Capital Outlay - Improvements 13,890 34,004 34,000 - -100.00%
Capital Outlay - Equipment 105,896 914,245 914,000 1,692,800 85.16%
Total $ 10,898,546 $ 12,286,335 $ 12,176,900 $ 15,866,700 29.14%
159
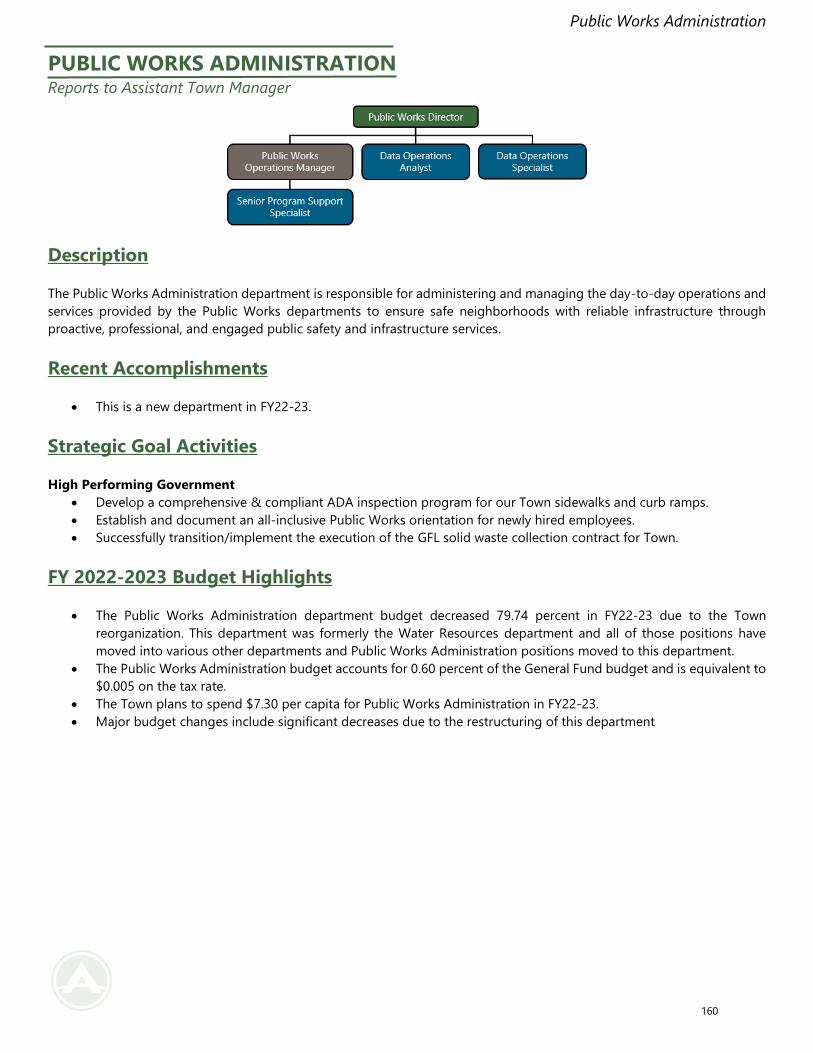
Public Works Administration
PUBLIC WORKS ADMINISTRATION Reports to Assistant Town Manager
Description
The Public Works Administration department is responsible for administering and managing the day-to-day operations and
services provided by the Public Works departments to ensure safe neighborhoods with reliable infrastructure through
proactive, professional, and engaged public safety and infrastructure services.
Recent Accomplishments
• This is a new department in FY22-23.
Strategic Goal Activities
High Performing Government
• Develop a comprehensive & compliant ADA inspection program for our Town sidewalks and curb ramps.
• Establish and document an all-inclusive Public Works orientation for newly hired employees.
• Successfully transition/implement the execution of the GFL solid waste collection contract for Town.
FY 2022-2023 Budget Highlights
• The Public Works Administration department budget decreased 79.74 percent in FY22-23 due to the Town
reorganization. This department was formerly the Water Resources department and all of those positions have
moved into various other departments and Public Works Administration positions moved to this department.
• The Public Works Administration budget accounts for 0.60 percent of the General Fund budget and is equivalent to
$0.005 on the tax rate.
• The Town plans to spend $7.30 per capita for Public Works Administration in FY22-23.
• Major budget changes include significant decreases due to the restructuring of this department
160
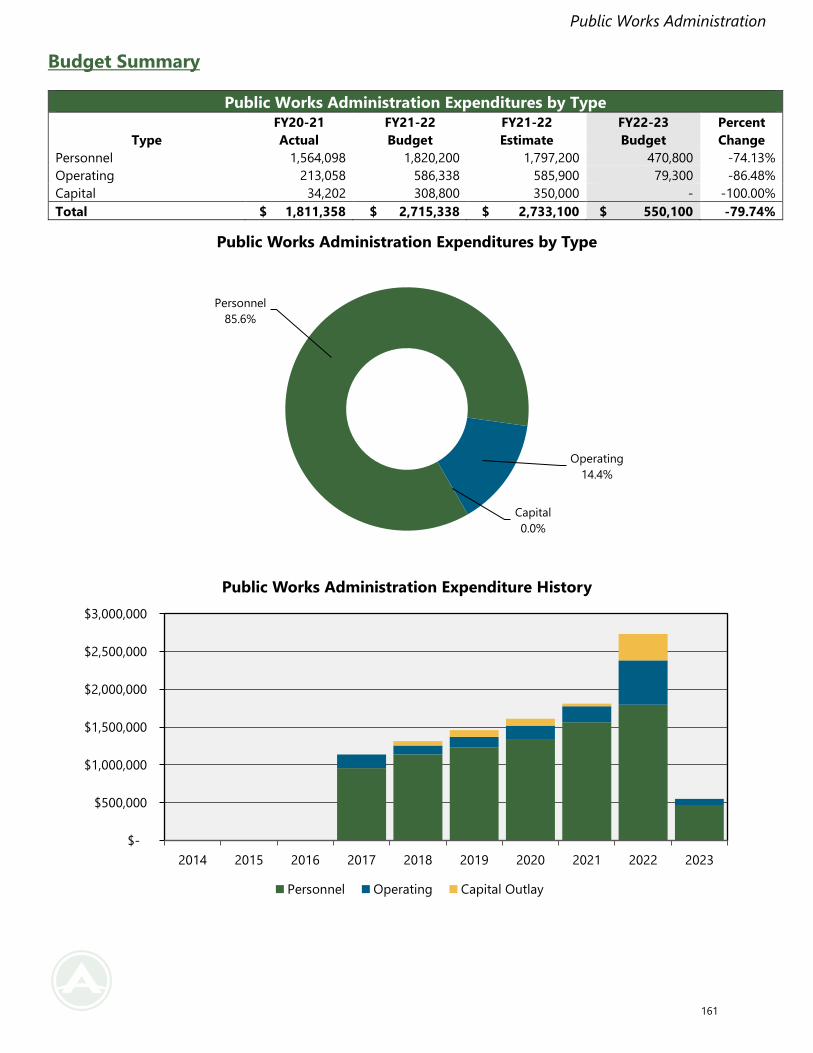
Public Works Administration
Budget Summary
Public Works Administration Expenditures by Type
Type
FY20-21
Actual
FY21-22
Budget
FY21-22
Estimate
FY22-23
Budget
Percent
Change
Personnel 1,564,098 1,820,200 1,797,200 470,800 -74.13%
Operating 213,058 586,338 585,900 79,300 -86.48%
Capital 34,202 308,800 350,000 - -100.00%
Total $ 1,811,358 $ 2,715,338 $ 2,733,100 $ 550,100 -79.74%
Personnel
85.6%
Operating
14.4%
Capital
0.0%
Public Works Administration Expenditures by Type
$-
$500,000
$1,000,000
$1,500,000
$2,000,000
$2,500,000
$3,000,000
2014 2015 2016 2017 2018 2019 2020 2021 2022 2023
Public Works Administration Expenditure History
Personnel Operating Capital Outlay
161
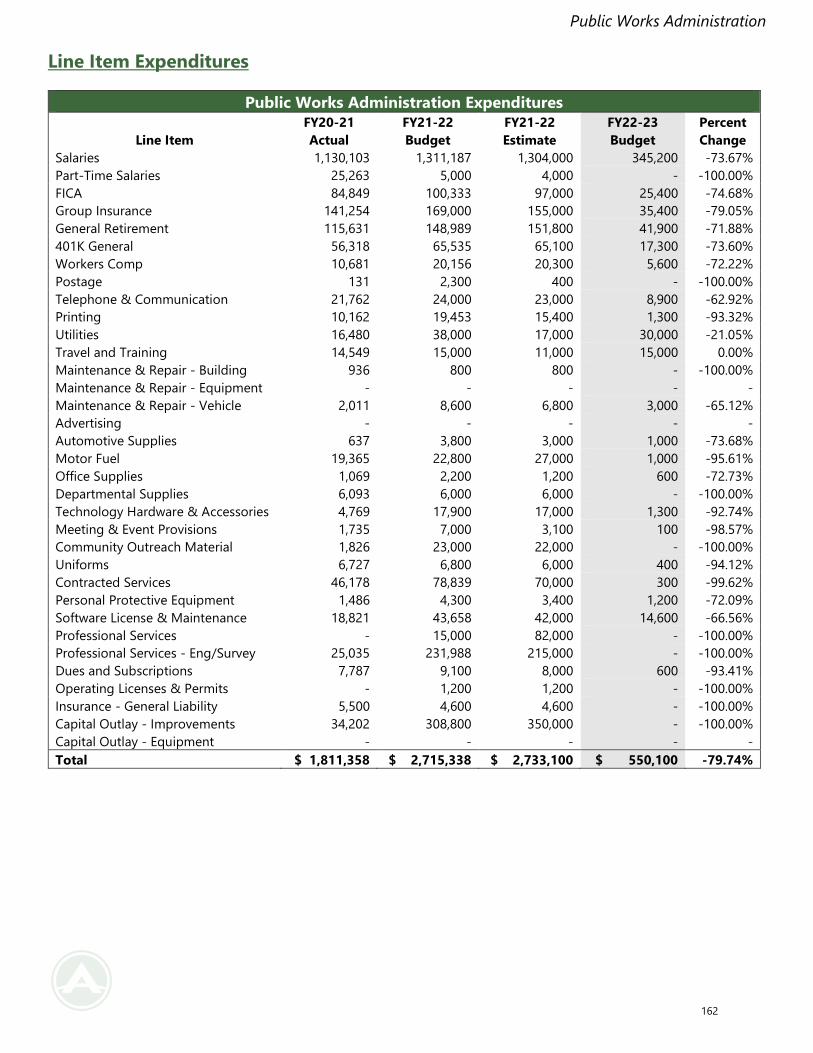
Public Works Administration
Line Item Expenditures
Public Works Administration Expenditures
Line Item
FY20-21
Actual
FY21-22
Budget
FY21-22
Estimate
FY22-23
Budget
Percent
Change
Salaries 1,130,103 1,311,187 1,304,000 345,200 -73.67%
Part-Time Salaries 25,263 5,000 4,000 - -100.00%
FICA 84,849 100,333 97,000 25,400 -74.68%
Group Insurance 141,254 169,000 155,000 35,400 -79.05%
General Retirement 115,631 148,989 151,800 41,900 -71.88%
401K General 56,318 65,535 65,100 17,300 -73.60%
Workers Comp 10,681 20,156 20,300 5,600 -72.22%
Postage 131 2,300 400 - -100.00%
Telephone & Communication 21,762 24,000 23,000 8,900 -62.92%
Printing 10,162 19,453 15,400 1,300 -93.32%
Utilities 16,480 38,000 17,000 30,000 -21.05%
Travel and Training 14,549 15,000 11,000 15,000 0.00%
Maintenance & Repair - Building 936 800 800 - -100.00%
Maintenance & Repair - Equipment - - - - -
Maintenance & Repair - Vehicle 2,011 8,600 6,800 3,000 -65.12%
Advertising - - - - -
Automotive Supplies 637 3,800 3,000 1,000 -73.68%
Motor Fuel 19,365 22,800 27,000 1,000 -95.61%
Office Supplies 1,069 2,200 1,200 600 -72.73%
Departmental Supplies 6,093 6,000 6,000 - -100.00%
Technology Hardware & Accessories 4,769 17,900 17,000 1,300 -92.74%
Meeting & Event Provisions 1,735 7,000 3,100 100 -98.57%
Community Outreach Material 1,826 23,000 22,000 - -100.00%
Uniforms 6,727 6,800 6,000 400 -94.12%
Contracted Services 46,178 78,839 70,000 300 -99.62%
Personal Protective Equipment 1,486 4,300 3,400 1,200 -72.09%
Software License & Maintenance 18,821 43,658 42,000 14,600 -66.56%
Professional Services - 15,000 82,000 - -100.00%
Professional Services - Eng/Survey 25,035 231,988 215,000 - -100.00%
Dues and Subscriptions 7,787 9,100 8,000 600 -93.41%
Operating Licenses & Permits - 1,200 1,200 - -100.00%
Insurance - General Liability 5,500 4,600 4,600 - -100.00%
Capital Outlay - Improvements 34,202 308,800 350,000 - -100.00%
Capital Outlay - Equipment - - - - -
Total $ 1,811,358 $ 2,715,338 $ 2,733,100 $ 550,100 -79.74%
162
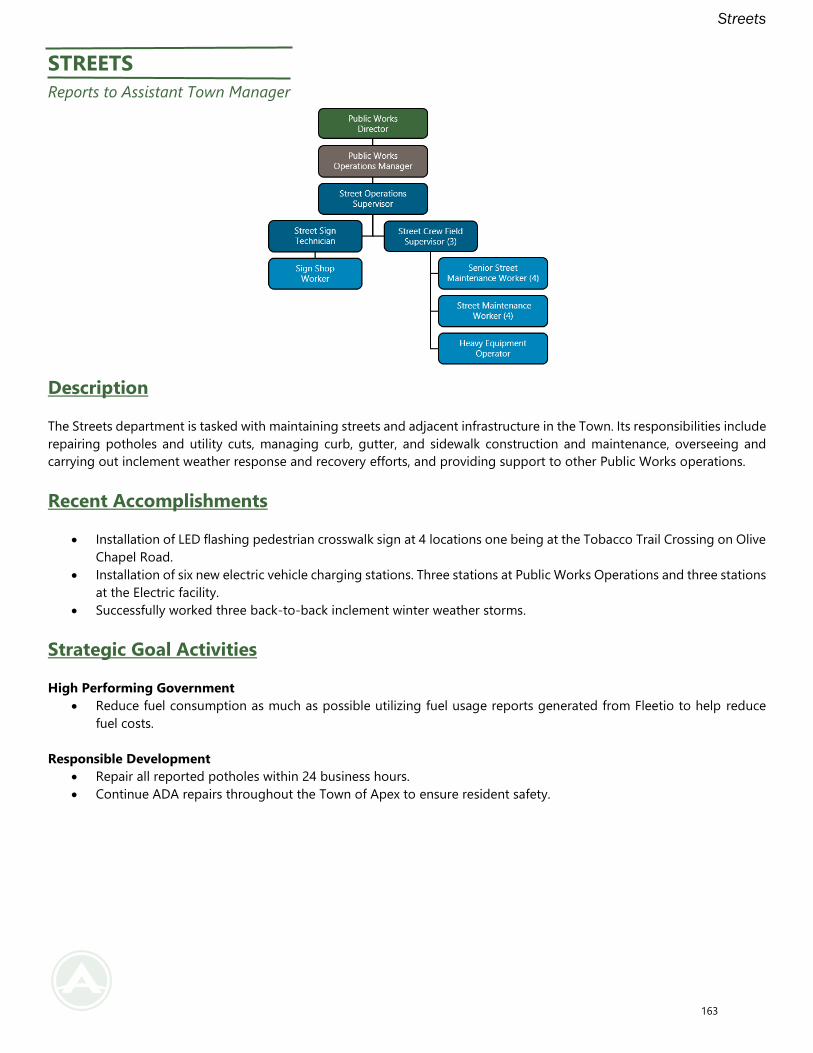
Streets
STREETS
Reports to Assistant Town Manager
Description
The Streets department is tasked with maintaining streets and adjacent infrastructure in the Town. Its responsibilities include
repairing potholes and utility cuts, managing curb, gutter, and sidewalk construction and maintenance, overseeing and
carrying out inclement weather response and recovery efforts, and providing support to other Public Works operations.
Recent Accomplishments
• Installation of LED flashing pedestrian crosswalk sign at 4 locations one being at the Tobacco Trail Crossing on Olive
Chapel Road.
• Installation of six new electric vehicle charging stations. Three stations at Public Works Operations and three stations
at the Electric facility.
• Successfully worked three back-to-back inclement winter weather storms.
Strategic Goal Activities
High Performing Government
• Reduce fuel consumption as much as possible utilizing fuel usage reports generated from Fleetio to help reduce
fuel costs.
Responsible Development
• Repair all reported potholes within 24 business hours.
• Continue ADA repairs throughout the Town of Apex to ensure resident safety.
163
Streets
FY 2022-2023 Budget Highlights
• The Streets department budget decreased 17.14 percent in FY22-23.
• The Streets budget accounts for 4.98 percent of the General Fund budget and is equivalent to $0.038 on the tax
rate.
• The Town plans to spend $60.45 per capita for Streets in FY22-23.
• There Streets budget decrease is the result of the distribution of costs for several Streets Maintenance team
members to the Stormwater Division due to outfalls and easements.
• The budget includes capital outlay equipment, including a replacement dump truck bed and one replacement
vehicle, and capital outlay improvements, including annual miscellaneous road and sidewalk projects, annual
pavement maintenance, and Evans Road sidewalk and groundwater fix.
164
Streets
Budget Summary
Streets Expenditures by Type
Type
FY20-21
Actual
FY21-22
Budget
FY21-22
Estimate
FY22-23
Budget
Percent
Change
Personnel 978,204 1,053,600 971,700 1,146,600 8.83%
Operating 1,818,873 2,619,618 2,497,000 2,714,400 3.62%
Capital 675,538 1,811,192 1,806,400 683,500 -62.26%
Total $ 3,472,615 $ 5,484,410 $ 5,275,100 $ 4,544,500 -17.14%
Personnel
25.2% Operating
59.7%
Capital
15.0%
Streets Expenditures by Type
$-
$1,000,000
$2,000,000
$3,000,000
$4,000,000
$5,000,000
$6,000,000
2014 2015 2016 2017 2018 2019 2020 2021 2022 2023
Streets Expenditure History
Personnel Operating Capital Outlay
165
Streets
Line Item Expenditures
Streets Expenditures
Line Item
FY20-21
Actual
FY21-22
Budget
FY21-22
Estimate
FY22-23
Budget
Percent
Change
Salaries 674,791 682,278 654,000 747,500 9.56%
FICA 45,436 55,900 50,100 57,200 2.33%
Group Insurance 131,841 143,300 117,000 161,400 12.63%
General Retirement 67,942 84,595 75,600 90,700 7.22%
401K General 34,884 36,562 34,000 37,400 2.29%
Workers Comp 23,311 50,965 41,000 52,400 2.82%
Postage - - - - -
Telephone & Communication 13,342 13,700 12,600 11,200 -18.25%
Printing 491 500 200 500 0.00%
Utilities 110 200 200 200 0.00%
Utilities-Street Lights 208,322 200,000 216,000 220,000 10.00%
Travel and Training 1,917 12,300 8,500 12,000 -2.44%
Maintenance & Repair - Building 243 6,000 2,000 3,000 -50.00%
Maintenance & Repair - Equipment 7,749 24,700 8,000 12,000 -51.42%
Maintenance & Repair - Vehicle 19,596 50,000 9,300 25,000 -50.00%
Rental - Equipment - 5,000 - 3,000 -40.00%
Advertising 1,010 1,000 200 500 -50.00%
Automotive Supplies 5,784 15,000 9,000 10,000 -33.33%
Motor Fuel 18,530 25,000 27,000 28,100 12.40%
Office Supplies 382 1,000 700 1,000 0.00%
Janitorial Supplies 78 200 200 200 0.00%
Departmental Supplies 44,309 28,235 24,800 19,400 -31.29%
Technology Hardware & Accessories 2,814 6,000 3,500 6,300 5.00%
Safety Supplies 660 2,700 1,200 400 -85.19%
Road Treatment - Salt 14,164 37,565 37,600 40,000 6.48%
Meeting & Event Provisions 1,003 2,700 2,500 2,200 -18.52%
Community Outreach Materials - 1,500 1,200 - -100.00%
Sign Shop Supplies 35,594 65,600 55,000 59,000 -10.06%
Construction Materials 32,611 60,000 28,000 41,500 -30.83%
Uniforms 5,152 7,500 4,200 7,500 0.00%
Railroad Crossing Maintenance 19,554 17,500 18,000 21,000 20.00%
Contracted Services 291,106 383,573 381,600 423,700 10.46%
Personal Protective Equipment 6,287 8,600 5,500 10,200 18.60%
Contracted Services (PB) 1,055,431 1,573,328 1,573,300 1,700,000 8.05%
Software License & Maintenance (5,898) 24,917 23,000 23,400 -6.09%
Professional Services - 12,000 11,500 - -100.00%
Dues and Subscriptions 534 600 600 600 0.00%
Insurance - General Liability 38,000 32,700 31,600 32,500 -0.61%
Capital Outlay - Land 63,416 - - - -
Capital Outlay - Improvements 591,687 1,236,465 1,236,400 595,000 -51.88%
Capital Outlay - Equipment 20,435 574,727 570,000 88,500 -84.60%
Total $ 3,472,615 $ 5,484,410 $ 5,275,100 $ 4,544,500 -17.14%
166
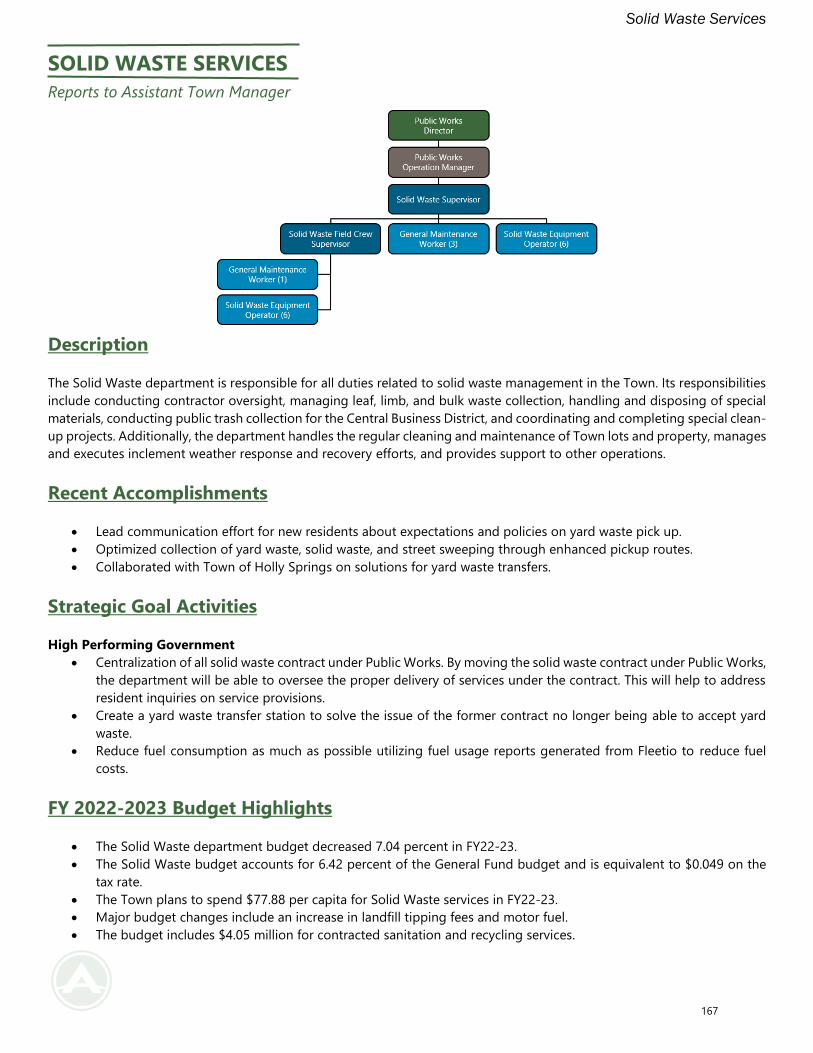
Solid Waste Services
SOLID WASTE SERVICES
Reports to Assistant Town Manager
Description
The Solid Waste department is responsible for all duties related to solid waste management in the Town. Its responsibilities
include conducting contractor oversight, managing leaf, limb, and bulk waste collection, handling and disposing of special
materials, conducting public trash collection for the Central Business District, and coordinating and completing special clean-
up projects. Additionally, the department handles the regular cleaning and maintenance of Town lots and property, manages
and executes inclement weather response and recovery efforts, and provides support to other operations.
Recent Accomplishments
• Lead communication effort for new residents about expectations and policies on yard waste pick up.
• Optimized collection of yard waste, solid waste, and street sweeping through enhanced pickup routes.
• Collaborated with Town of Holly Springs on solutions for yard waste transfers.
Strategic Goal Activities
High Performing Government
• Centralization of all solid waste contract under Public Works. By moving the solid waste contract under Public Works,
the department will be able to oversee the proper delivery of services under the contract. This will help to address
resident inquiries on service provisions.
• Create a yard waste transfer station to solve the issue of the former contract no longer being able to accept yard
waste.
• Reduce fuel consumption as much as possible utilizing fuel usage reports generated from Fleetio to reduce fuel
costs.
FY 2022-2023 Budget Highlights
• The Solid Waste department budget decreased 7.04 percent in FY22-23.
• The Solid Waste budget accounts for 6.42 percent of the General Fund budget and is equivalent to $0.049 on the
tax rate.
• The Town plans to spend $77.88 per capita for Solid Waste services in FY22-23.
• Major budget changes include an increase in landfill tipping fees and motor fuel.
• The budget includes $4.05 million for contracted sanitation and recycling services.
167
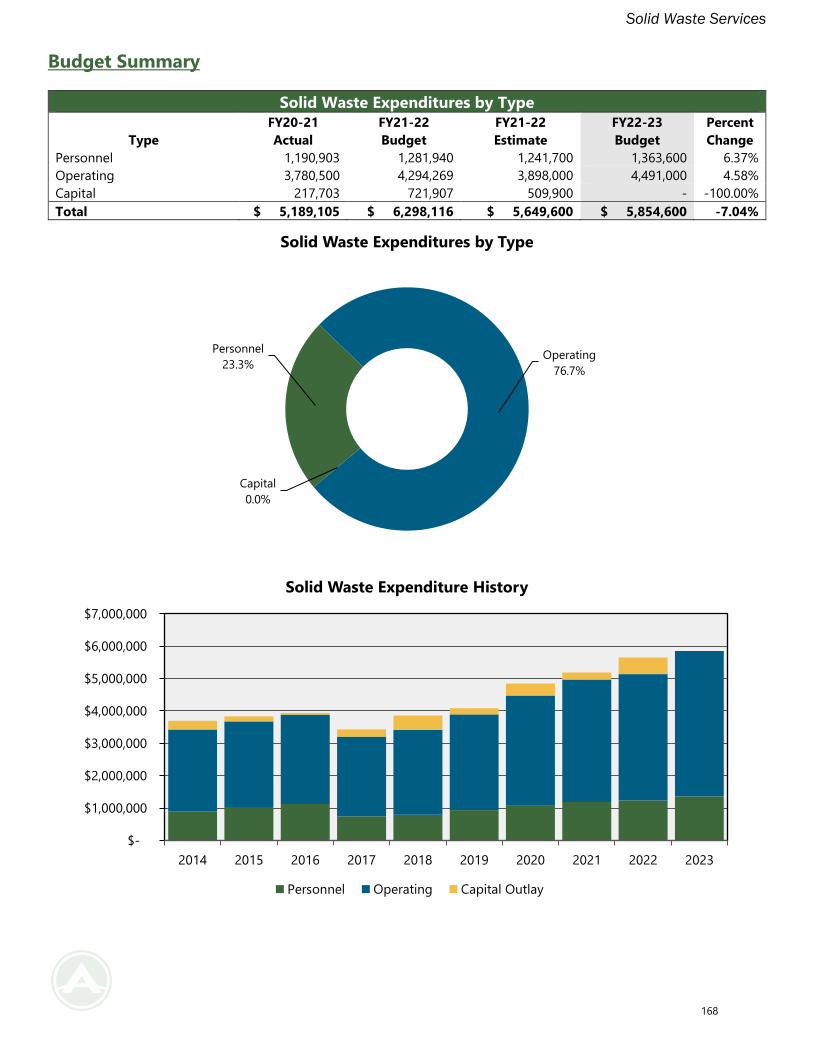
Solid Waste Services
Budget Summary
Solid Waste Expenditures by Type
Type
FY20-21
Actual
FY21-22
Budget
FY21-22
Estimate
FY22-23
Budget
Percent
Change
Personnel 1,190,903 1,281,940 1,241,700 1,363,600 6.37%
Operating 3,780,500 4,294,269 3,898,000 4,491,000 4.58%
Capital 217,703 721,907 509,900 - -100.00%
Total $ 5,189,105 $ 6,298,116 $ 5,649,600 $ 5,854,600 -7.04%
Personnel
23.3%Operating
76.7%
Capital
0.0%
Solid Waste Expenditures by Type
$-
$1,000,000
$2,000,000
$3,000,000
$4,000,000
$5,000,000
$6,000,000
$7,000,000
2014 2015 2016 2017 2018 2019 2020 2021 2022 2023
Solid Waste Expenditure History
Personnel Operating Capital Outlay
168
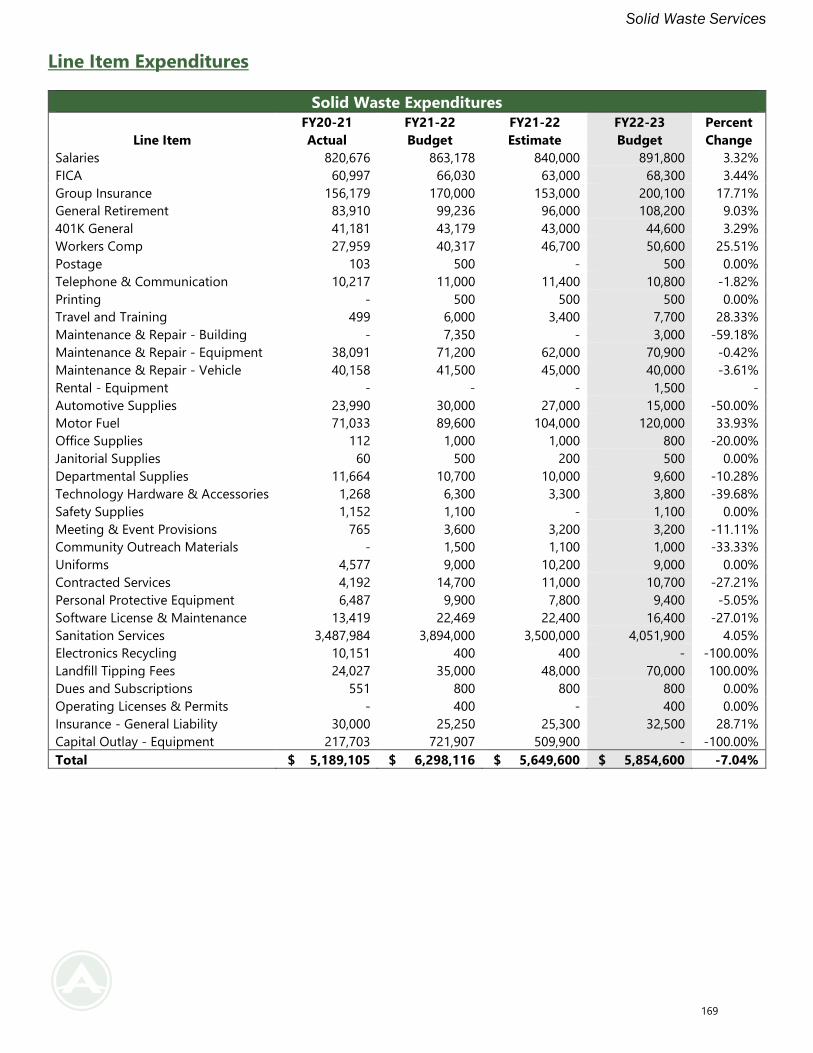
Solid Waste Services
Line Item Expenditures
Solid Waste Expenditures
Line Item
FY20-21
Actual
FY21-22
Budget
FY21-22
Estimate
FY22-23
Budget
Percent
Change
Salaries 820,676 863,178 840,000 891,800 3.32%
FICA 60,997 66,030 63,000 68,300 3.44%
Group Insurance 156,179 170,000 153,000 200,100 17.71%
General Retirement 83,910 99,236 96,000 108,200 9.03%
401K General 41,181 43,179 43,000 44,600 3.29%
Workers Comp 27,959 40,317 46,700 50,600 25.51%
Postage 103 500 - 500 0.00%
Telephone & Communication 10,217 11,000 11,400 10,800 -1.82%
Printing - 500 500 500 0.00%
Travel and Training 499 6,000 3,400 7,700 28.33%
Maintenance & Repair - Building - 7,350 - 3,000 -59.18%
Maintenance & Repair - Equipment 38,091 71,200 62,000 70,900 -0.42%
Maintenance & Repair - Vehicle 40,158 41,500 45,000 40,000 -3.61%
Rental - Equipment - - - 1,500 -
Automotive Supplies 23,990 30,000 27,000 15,000 -50.00%
Motor Fuel 71,033 89,600 104,000 120,000 33.93%
Office Supplies 112 1,000 1,000 800 -20.00%
Janitorial Supplies 60 500 200 500 0.00%
Departmental Supplies 11,664 10,700 10,000 9,600 -10.28%
Technology Hardware & Accessories 1,268 6,300 3,300 3,800 -39.68%
Safety Supplies 1,152 1,100 - 1,100 0.00%
Meeting & Event Provisions 765 3,600 3,200 3,200 -11.11%
Community Outreach Materials - 1,500 1,100 1,000 -33.33%
Uniforms 4,577 9,000 10,200 9,000 0.00%
Contracted Services 4,192 14,700 11,000 10,700 -27.21%
Personal Protective Equipment 6,487 9,900 7,800 9,400 -5.05%
Software License & Maintenance 13,419 22,469 22,400 16,400 -27.01%
Sanitation Services 3,487,984 3,894,000 3,500,000 4,051,900 4.05%
Electronics Recycling 10,151 400 400 - -100.00%
Landfill Tipping Fees 24,027 35,000 48,000 70,000 100.00%
Dues and Subscriptions 551 800 800 800 0.00%
Operating Licenses & Permits - 400 - 400 0.00%
Insurance - General Liability 30,000 25,250 25,300 32,500 28.71%
Capital Outlay - Equipment 217,703 721,907 509,900 - -100.00%
Total $ 5,189,105 $ 6,298,116 $ 5,649,600 $ 5,854,600 -7.04%
169
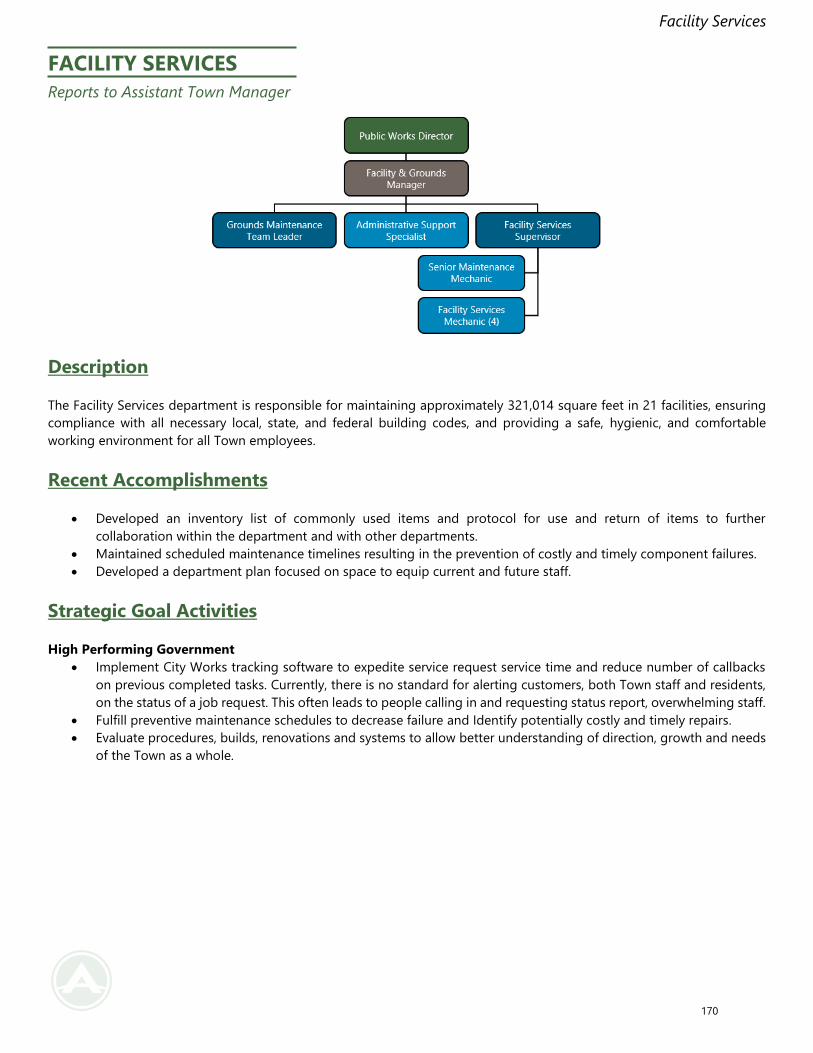
Facility Services
FACILITY SERVICES
Reports to Assistant Town Manager
Description
The Facility Services department is responsible for maintaining approximately 321,014 square feet in 21 facilities, ensuring
compliance with all necessary local, state, and federal building codes, and providing a safe, hygienic, and comfortable
working environment for all Town employees.
Recent Accomplishments
• Developed an inventory list of commonly used items and protocol for use and return of items to further
collaboration within the department and with other departments.
• Maintained scheduled maintenance timelines resulting in the prevention of costly and timely component failures.
• Developed a department plan focused on space to equip current and future staff.
Strategic Goal Activities
High Performing Government
• Implement City Works tracking software to expedite service request service time and reduce number of callbacks
on previous completed tasks. Currently, there is no standard for alerting customers, both Town staff and residents,
on the status of a job request. This often leads to people calling in and requesting status report, overwhelming staff.
• Fulfill preventive maintenance schedules to decrease failure and Identify potentially costly and timely repairs.
• Evaluate procedures, builds, renovations and systems to allow better understanding of direction, growth and needs
of the Town as a whole.
170
Facility Services
FY 2022-2023 Budget Highlights
• The Facility Services department budget decreased by 42.61 percent in FY22-23 primarily due to a decrease in capital
equipment and the reallocation of Depot maintenance costs to the Economic Development department.
• The Facility Services budget accounts for 1.57 percent of the General Fund budget and is equivalent to $0.012 on
the tax rate.
• The Town plans to spend $19.06 per capita for Facility Services in FY22-23.
• Major budget changes include the addition of two new positions, a Facilities Maintenance Mechanic, and an
Administrative Assistant, and the associated onboarding costs.
• The budget includes capital improvements for Town Hall boiler upgrades.
• The Facility Services budget decrease is due to the reassignment of the Grounds team to the Sewer Maintenance
Division to perform easement and right-of-way maintenance.
171
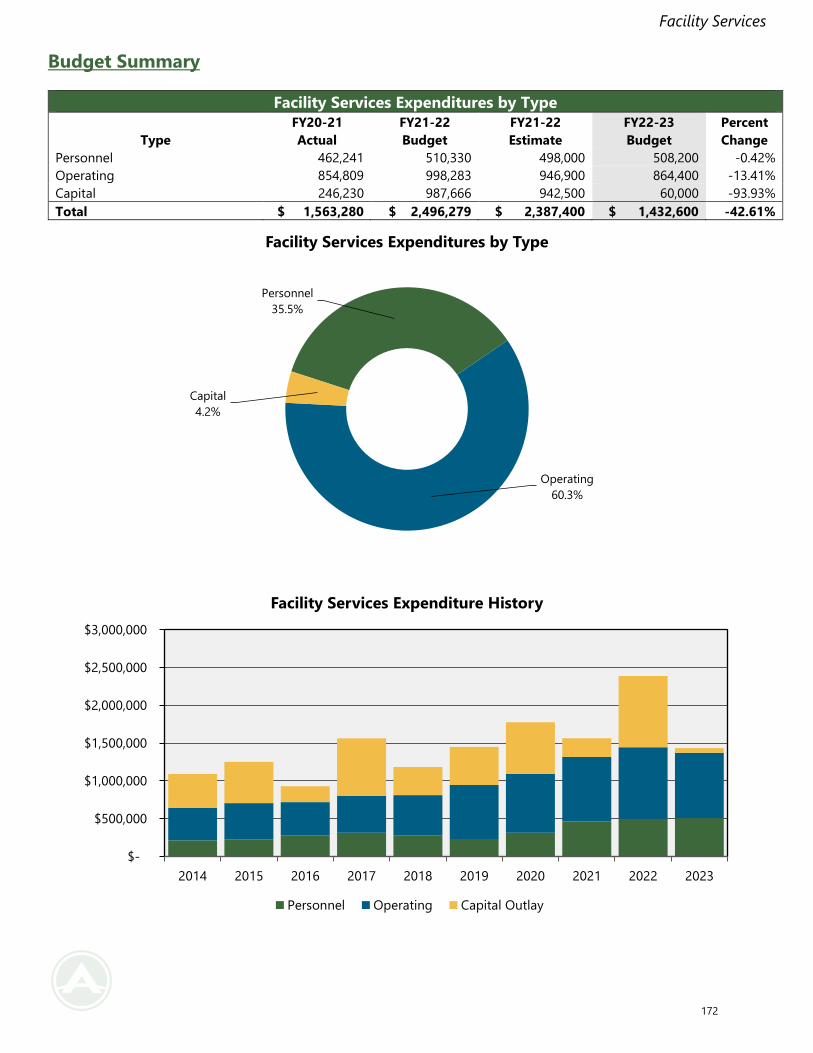
Facility Services
Budget Summary
Facility Services Expenditures by Type
Type
FY20-21
Actual
FY21-22
Budget
FY21-22
Estimate
FY22-23
Budget
Percent
Change
Personnel 462,241 510,330 498,000 508,200 -0.42%
Operating 854,809 998,283 946,900 864,400 -13.41%
Capital 246,230 987,666 942,500 60,000 -93.93%
Total $ 1,563,280 $ 2,496,279 $ 2,387,400 $ 1,432,600 -42.61%
Personnel
35.5%
Operating
60.3%
Capital
4.2%
Facility Services Expenditures by Type
$-
$500,000
$1,000,000
$1,500,000
$2,000,000
$2,500,000
$3,000,000
2014 2015 2016 2017 2018 2019 2020 2021 2022 2023
Facility Services Expenditure History
Personnel Operating Capital Outlay
172
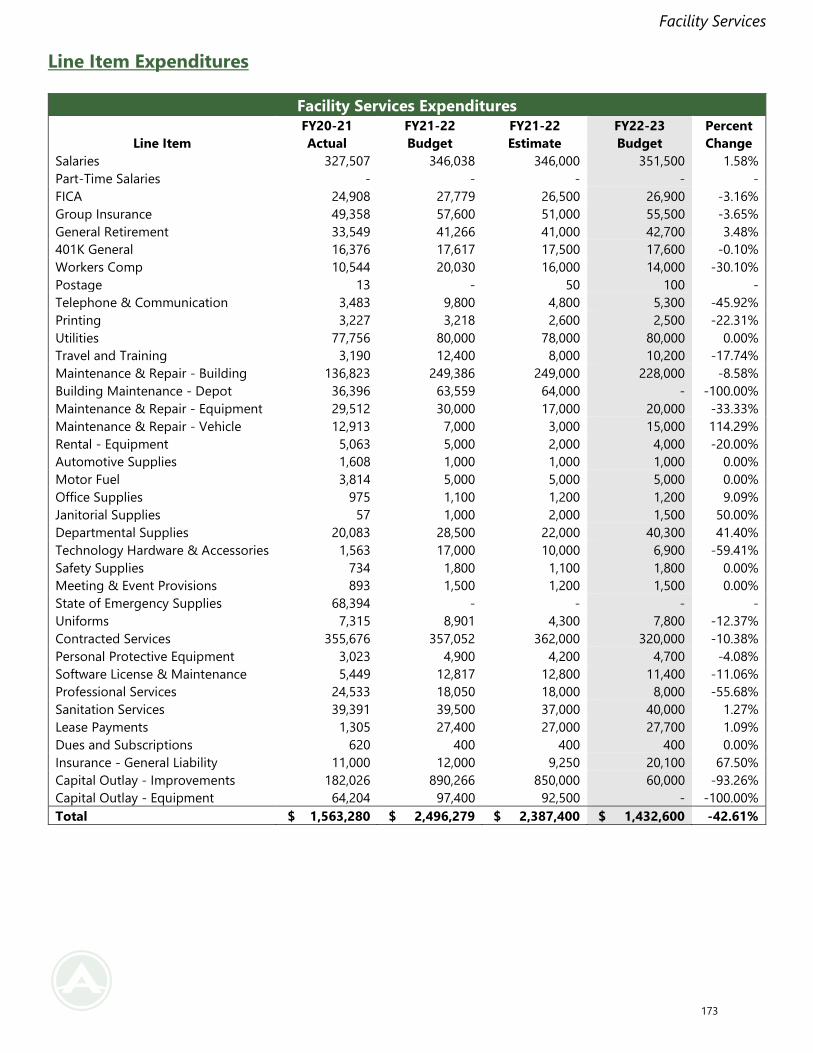
Facility Services
Line Item Expenditures
Facility Services Expenditures
Line Item
FY20-21
Actual
FY21-22
Budget
FY21-22
Estimate
FY22-23
Budget
Percent
Change
Salaries 327,507 346,038 346,000 351,500 1.58%
Part-Time Salaries - - - - -
FICA 24,908 27,779 26,500 26,900 -3.16%
Group Insurance 49,358 57,600 51,000 55,500 -3.65%
General Retirement 33,549 41,266 41,000 42,700 3.48%
401K General 16,376 17,617 17,500 17,600 -0.10%
Workers Comp 10,544 20,030 16,000 14,000 -30.10%
Postage 13 - 50 100 -
Telephone & Communication 3,483 9,800 4,800 5,300 -45.92%
Printing 3,227 3,218 2,600 2,500 -22.31%
Utilities 77,756 80,000 78,000 80,000 0.00%
Travel and Training 3,190 12,400 8,000 10,200 -17.74%
Maintenance & Repair - Building 136,823 249,386 249,000 228,000 -8.58%
Building Maintenance - Depot 36,396 63,559 64,000 - -100.00%
Maintenance & Repair - Equipment 29,512 30,000 17,000 20,000 -33.33%
Maintenance & Repair - Vehicle 12,913 7,000 3,000 15,000 114.29%
Rental - Equipment 5,063 5,000 2,000 4,000 -20.00%
Automotive Supplies 1,608 1,000 1,000 1,000 0.00%
Motor Fuel 3,814 5,000 5,000 5,000 0.00%
Office Supplies 975 1,100 1,200 1,200 9.09%
Janitorial Supplies 57 1,000 2,000 1,500 50.00%
Departmental Supplies 20,083 28,500 22,000 40,300 41.40%
Technology Hardware & Accessories 1,563 17,000 10,000 6,900 -59.41%
Safety Supplies 734 1,800 1,100 1,800 0.00%
Meeting & Event Provisions 893 1,500 1,200 1,500 0.00%
State of Emergency Supplies 68,394 - - - -
Uniforms 7,315 8,901 4,300 7,800 -12.37%
Contracted Services 355,676 357,052 362,000 320,000 -10.38%
Personal Protective Equipment 3,023 4,900 4,200 4,700 -4.08%
Software License & Maintenance 5,449 12,817 12,800 11,400 -11.06%
Professional Services 24,533 18,050 18,000 8,000 -55.68%
Sanitation Services 39,391 39,500 37,000 40,000 1.27%
Lease Payments 1,305 27,400 27,000 27,700 1.09%
Dues and Subscriptions 620 400 400 400 0.00%
Insurance - General Liability 11,000 12,000 9,250 20,100 67.50%
Capital Outlay - Improvements 182,026 890,266 850,000 60,000 -93.26%
Capital Outlay - Equipment 64,204 97,400 92,500 - -100.00%
Total $ 1,563,280 $ 2,496,279 $ 2,387,400 $ 1,432,600 -42.61%
173
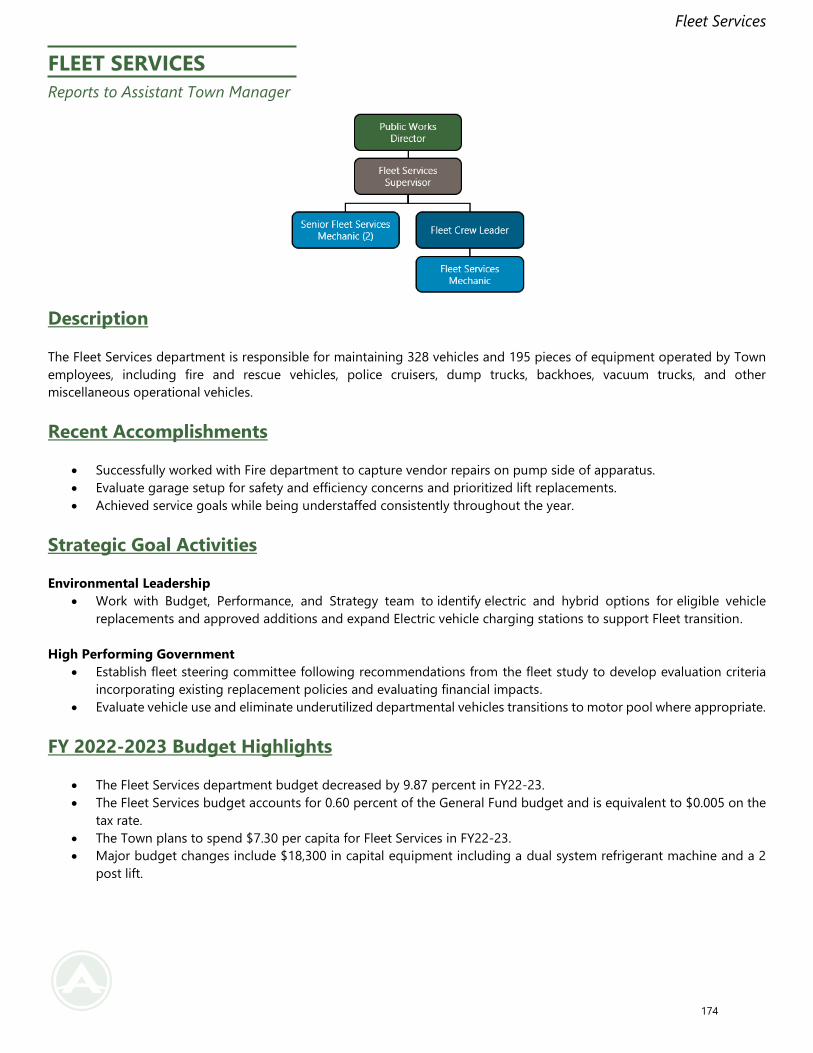
Fleet Services
FLEET SERVICES
Reports to Assistant Town Manager
Description
The Fleet Services department is responsible for maintaining 328 vehicles and 195 pieces of equipment operated by Town
employees, including fire and rescue vehicles, police cruisers, dump trucks, backhoes, vacuum trucks, and other
miscellaneous operational vehicles.
Recent Accomplishments
• Successfully worked with Fire department to capture vendor repairs on pump side of apparatus.
• Evaluate garage setup for safety and efficiency concerns and prioritized lift replacements.
• Achieved service goals while being understaffed consistently throughout the year.
Strategic Goal Activities
Environmental Leadership
• Work with Budget, Performance, and Strategy team to identify electric and hybrid options for eligible vehicle
replacements and approved additions and expand Electric vehicle charging stations to support Fleet transition.
High Performing Government
• Establish fleet steering committee following recommendations from the fleet study to develop evaluation criteria
incorporating existing replacement policies and evaluating financial impacts.
• Evaluate vehicle use and eliminate underutilized departmental vehicles transitions to motor pool where appropriate.
FY 2022-2023 Budget Highlights
• The Fleet Services department budget decreased by 9.87 percent in FY22-23.
• The Fleet Services budget accounts for 0.60 percent of the General Fund budget and is equivalent to $0.005 on the
tax rate.
• The Town plans to spend $7.30 per capita for Fleet Services in FY22-23.
• Major budget changes include $18,300 in capital equipment including a dual system refrigerant machine and a 2
post lift.
174
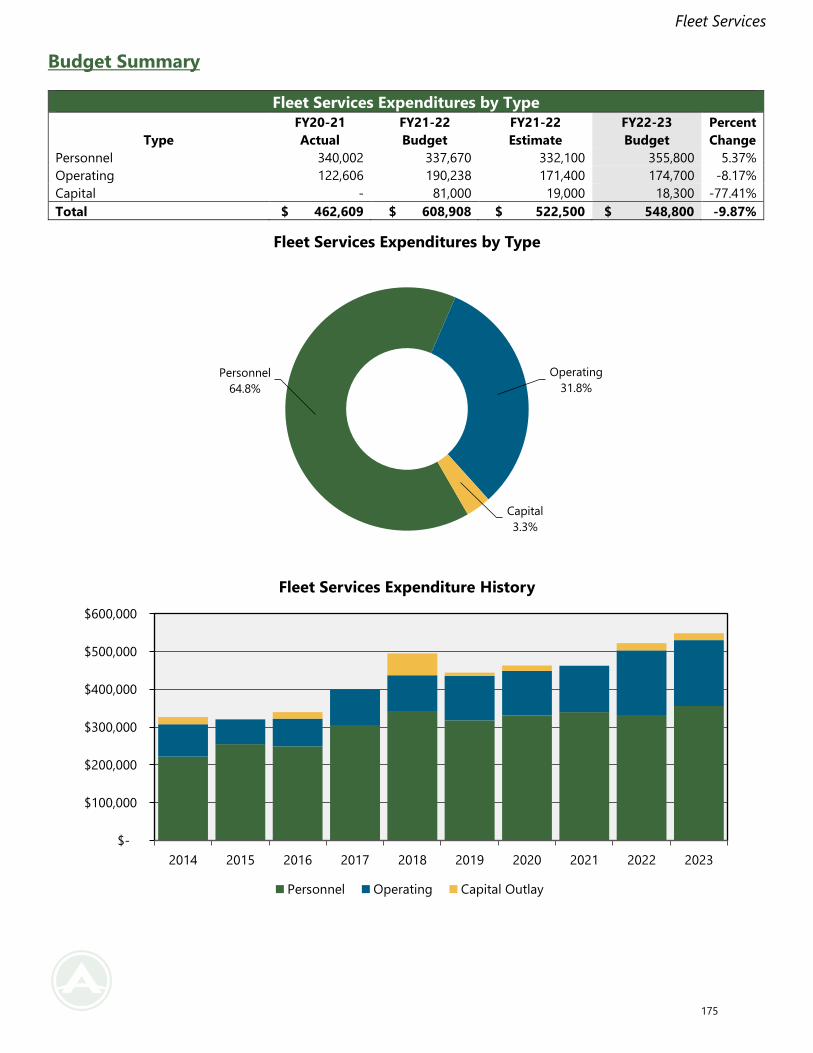
Fleet Services
Budget Summary
Fleet Services Expenditures by Type
Type
FY20-21
Actual
FY21-22
Budget
FY21-22
Estimate
FY22-23
Budget
Percent
Change
Personnel 340,002 337,670 332,100 355,800 5.37%
Operating 122,606 190,238 171,400 174,700 -8.17%
Capital - 81,000 19,000 18,300 -77.41%
Total $ 462,609 $ 608,908 $ 522,500 $ 548,800 -9.87%
Personnel
64.8%
Operating
31.8%
Capital
3.3%
Fleet Services Expenditures by Type
$-
$100,000
$200,000
$300,000
$400,000
$500,000
$600,000
2014 2015 2016 2017 2018 2019 2020 2021 2022 2023
Fleet Services Expenditure History
Personnel Operating Capital Outlay
175
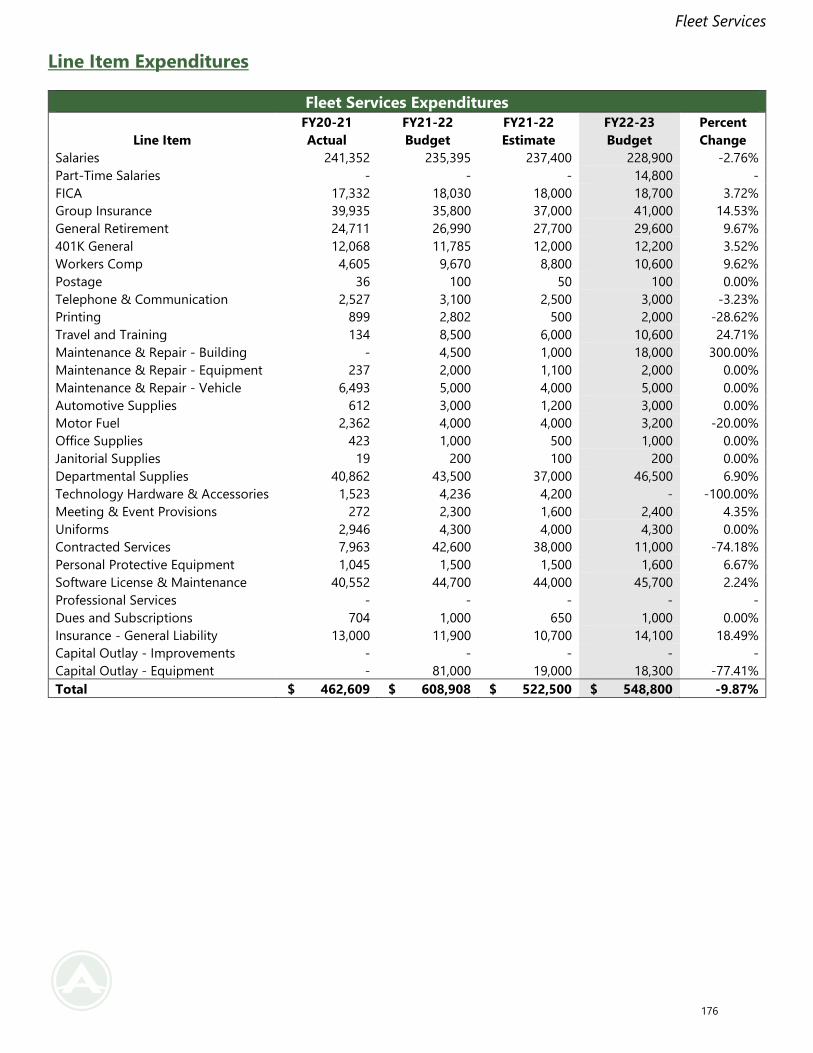
Fleet Services
Line Item Expenditures
Fleet Services Expenditures
Line Item
FY20-21
Actual
FY21-22
Budget
FY21-22
Estimate
FY22-23
Budget
Percent
Change
Salaries 241,352 235,395 237,400 228,900 -2.76%
Part-Time Salaries - - - 14,800 -
FICA 17,332 18,030 18,000 18,700 3.72%
Group Insurance 39,935 35,800 37,000 41,000 14.53%
General Retirement 24,711 26,990 27,700 29,600 9.67%
401K General 12,068 11,785 12,000 12,200 3.52%
Workers Comp 4,605 9,670 8,800 10,600 9.62%
Postage 36 100 50 100 0.00%
Telephone & Communication 2,527 3,100 2,500 3,000 -3.23%
Printing 899 2,802 500 2,000 -28.62%
Travel and Training 134 8,500 6,000 10,600 24.71%
Maintenance & Repair - Building - 4,500 1,000 18,000 300.00%
Maintenance & Repair - Equipment 237 2,000 1,100 2,000 0.00%
Maintenance & Repair - Vehicle 6,493 5,000 4,000 5,000 0.00%
Automotive Supplies 612 3,000 1,200 3,000 0.00%
Motor Fuel 2,362 4,000 4,000 3,200 -20.00%
Office Supplies 423 1,000 500 1,000 0.00%
Janitorial Supplies 19 200 100 200 0.00%
Departmental Supplies 40,862 43,500 37,000 46,500 6.90%
Technology Hardware & Accessories 1,523 4,236 4,200 - -100.00%
Meeting & Event Provisions 272 2,300 1,600 2,400 4.35%
Uniforms 2,946 4,300 4,000 4,300 0.00%
Contracted Services 7,963 42,600 38,000 11,000 -74.18%
Personal Protective Equipment 1,045 1,500 1,500 1,600 6.67%
Software License & Maintenance 40,552 44,700 44,000 45,700 2.24%
Professional Services - - - - -
Dues and Subscriptions 704 1,000 650 1,000 0.00%
Insurance - General Liability 13,000 11,900 10,700 14,100 18.49%
Capital Outlay - Improvements - - - - -
Capital Outlay - Equipment - 81,000 19,000 18,300 -77.41%
Total $ 462,609 $ 608,908 $ 522,500 $ 548,800 -9.87%
176
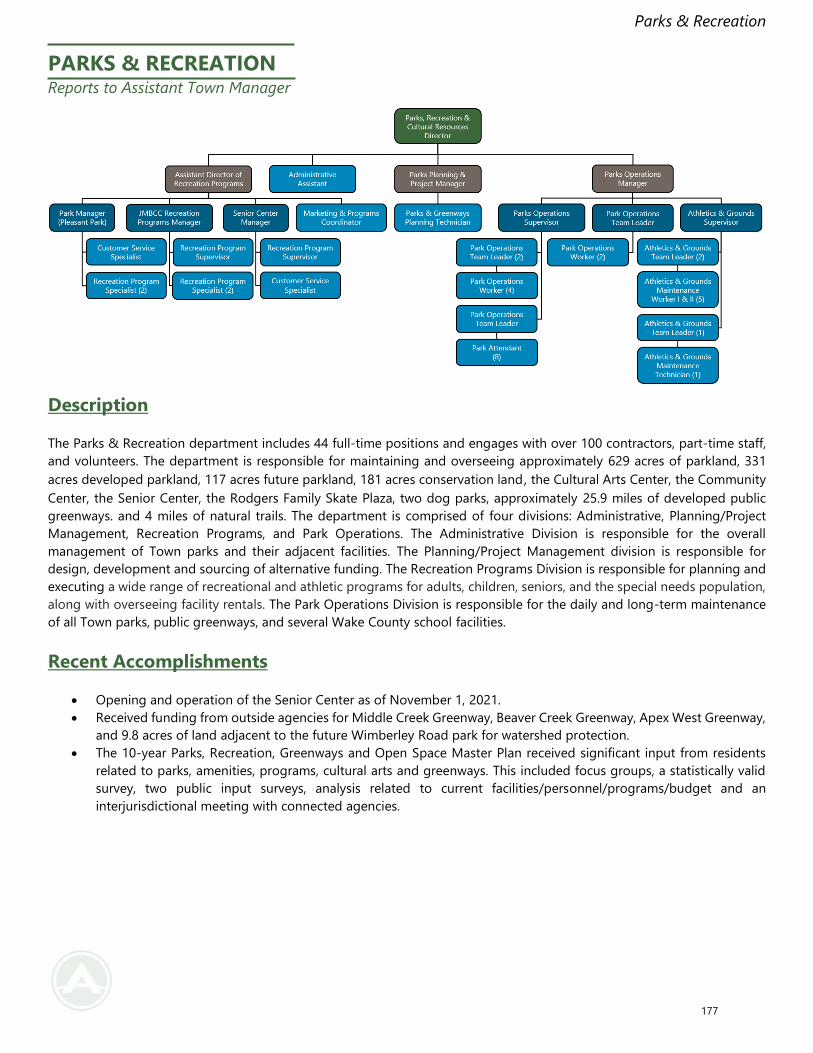
Parks & Recreation
PARKS & RECREATION Reports to Assistant Town Manager
Description
The Parks & Recreation department includes 44 full-time positions and engages with over 100 contractors, part-time staff,
and volunteers. The department is responsible for maintaining and overseeing approximately 629 acres of parkland, 331
acres developed parkland, 117 acres future parkland, 181 acres conservation land, the Cultural Arts Center, the Community
Center, the Senior Center, the Rodgers Family Skate Plaza, two dog parks, approximately 25.9 miles of developed public
greenways. and 4 miles of natural trails. The department is comprised of four divisions: Administrative, Planning/Project
Management, Recreation Programs, and Park Operations. The Administrative Division is responsible for the overall
management of Town parks and their adjacent facilities. The Planning/Project Management division is responsible for
design, development and sourcing of alternative funding. The Recreation Programs Division is responsible for planning and
executing a wide range of recreational and athletic programs for adults, children, seniors, and the special needs population,
along with overseeing facility rentals. The Park Operations Division is responsible for the daily and long-term maintenance
of all Town parks, public greenways, and several Wake County school facilities.
Recent Accomplishments
• Opening and operation of the Senior Center as of November 1, 2021.
• Received funding from outside agencies for Middle Creek Greenway, Beaver Creek Greenway, Apex West Greenway,
and 9.8 acres of land adjacent to the future Wimberley Road park for watershed protection.
• The 10-year Parks, Recreation, Greenways and Open Space Master Plan received significant input from residents
related to parks, amenities, programs, cultural arts and greenways. This included focus groups, a statistically valid
survey, two public input surveys, analysis related to current facilities/personnel/programs/budget and an
interjurisdictional meeting with connected agencies.
177
Parks & Recreation
Strategic Goal Activities
High Performing Government
• Provide clear communications to the public. Educate the community on park facilities, projects, programming and
special events, utilize staff resources to engage residents and increase participation in town programs.
A Welcoming Community
• Plan, develop, and maintain safe and inclusive parks, facilities, and greenways for all ages and abilities. Maintenance
of current and future facilities is always a high priority. Addressing some of the ADA recommendations related to
parks and greenways is part of a town-wide goal.
• Develop programs and offer special events that connect the community with diverse and inclusive recreation and
cultural offerings. Provide programs and partnerships that meet community health and wellness needs and desires.
New space available at the Senior Center and the John M. Brown Community Center have increased the number of
programs that can be offered. This is also in response to community input received from the PRGOS Master Plan.
FY 2022-2023 Budget Highlights
• The Parks & Recreation department budget increased 9.13 percent in FY22-23.
• The Parks & Recreation budget accounts for 7.94 percent of the General Fund budget and is equivalent to $0.061
on the tax rate.
• The Town plans to spend $96.34 per capita for Parks, Recreation in FY22-23.
• Increases in budget are primarily attributable to a full year of operating expenses and programming for the Senior
Center along with Phase 1 of Pleasant Park opening.
• Major budget changes include the addition of six full-time staff members including a Parks & Greenways Planning
Technician, a Senior Center Manager, an Assistant Director of Recreation Programs, two Park Attendants, and an
Athletics & Grounds Worker, and the associated onboarding costs.
• The budget includes capital improvements, including boiler replacements and ADA park renovations, and capital
equipment, including two replacement vehicles and one new vehicles associated with new personnel.
• Overall, the operating and capital expenditures for Parks & Recreation decreased due to the completion of outfitting
the Senior Center.
178
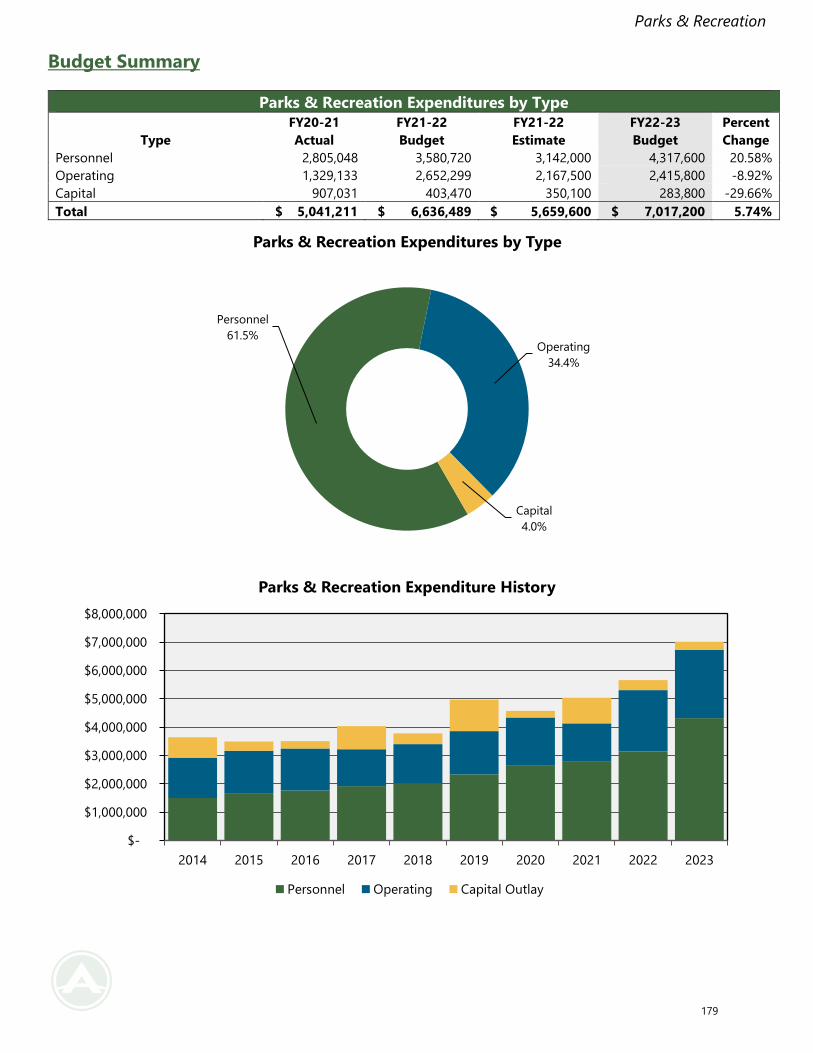
Parks & Recreation
Budget Summary
Parks & Recreation Expenditures by Type
Type
FY20-21
Actual
FY21-22
Budget
FY21-22
Estimate
FY22-23
Budget
Percent
Change
Personnel 2,805,048 3,580,720 3,142,000 4,317,600 20.58%
Operating 1,329,133 2,652,299 2,167,500 2,415,800 -8.92%
Capital 907,031 403,470 350,100 283,800 -29.66%
Total $ 5,041,211 $ 6,636,489 $ 5,659,600 $ 7,017,200 5.74%
Personnel
61.5%Operating
34.4%
Capital
4.0%
Parks & Recreation Expenditures by Type
$-
$1,000,000
$2,000,000
$3,000,000
$4,000,000
$5,000,000
$6,000,000
$7,000,000
$8,000,000
2014 2015 2016 2017 2018 2019 2020 2021 2022 2023
Parks & Recreation Expenditure History
Personnel Operating Capital Outlay
179
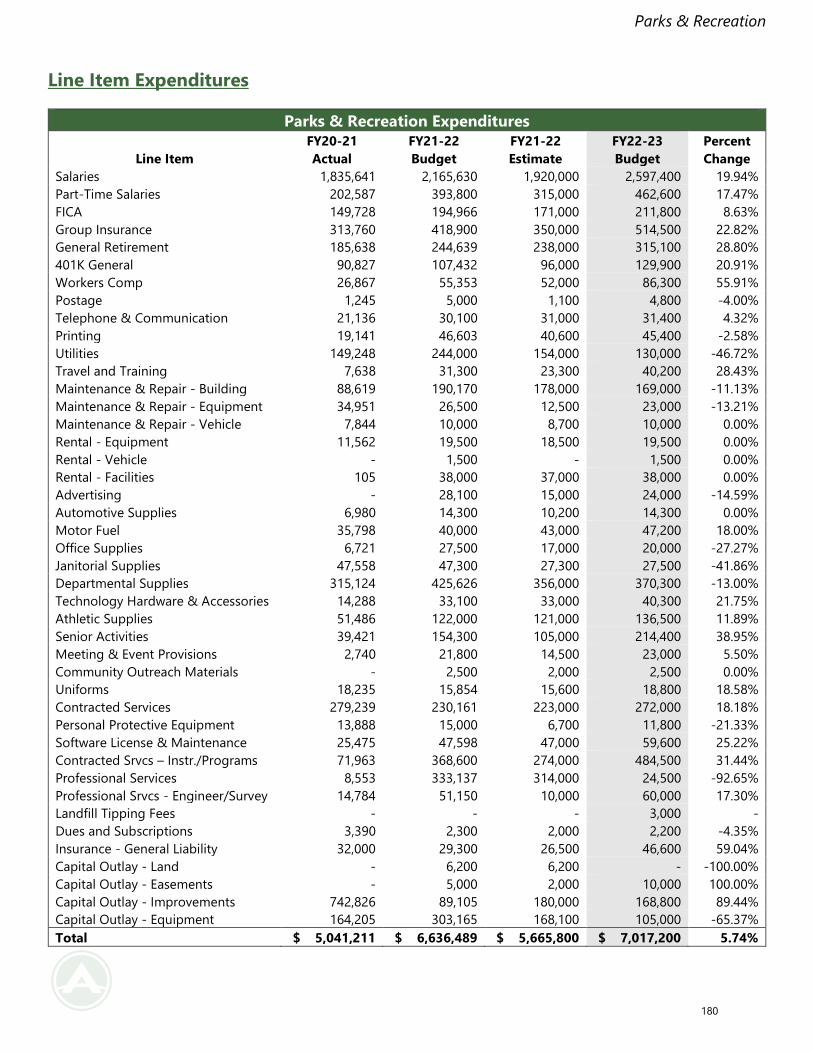
Parks & Recreation
Line Item Expenditures
Parks & Recreation Expenditures
Line Item
FY20-21
Actual
FY21-22
Budget
FY21-22
Estimate
FY22-23
Budget
Percent
Change
Salaries 1,835,641 2,165,630 1,920,000 2,597,400 19.94%
Part-Time Salaries 202,587 393,800 315,000 462,600 17.47%
FICA 149,728 194,966 171,000 211,800 8.63%
Group Insurance 313,760 418,900 350,000 514,500 22.82%
General Retirement 185,638 244,639 238,000 315,100 28.80%
401K General 90,827 107,432 96,000 129,900 20.91%
Workers Comp 26,867 55,353 52,000 86,300 55.91%
Postage 1,245 5,000 1,100 4,800 -4.00%
Telephone & Communication 21,136 30,100 31,000 31,400 4.32%
Printing 19,141 46,603 40,600 45,400 -2.58%
Utilities 149,248 244,000 154,000 130,000 -46.72%
Travel and Training 7,638 31,300 23,300 40,200 28.43%
Maintenance & Repair - Building 88,619 190,170 178,000 169,000 -11.13%
Maintenance & Repair - Equipment 34,951 26,500 12,500 23,000 -13.21%
Maintenance & Repair - Vehicle 7,844 10,000 8,700 10,000 0.00%
Rental - Equipment 11,562 19,500 18,500 19,500 0.00%
Rental - Vehicle - 1,500 - 1,500 0.00%
Rental - Facilities 105 38,000 37,000 38,000 0.00%
Advertising - 28,100 15,000 24,000 -14.59%
Automotive Supplies 6,980 14,300 10,200 14,300 0.00%
Motor Fuel 35,798 40,000 43,000 47,200 18.00%
Office Supplies 6,721 27,500 17,000 20,000 -27.27%
Janitorial Supplies 47,558 47,300 27,300 27,500 -41.86%
Departmental Supplies 315,124 425,626 356,000 370,300 -13.00%
Technology Hardware & Accessories 14,288 33,100 33,000 40,300 21.75%
Athletic Supplies 51,486 122,000 121,000 136,500 11.89%
Senior Activities 39,421 154,300 105,000 214,400 38.95%
Meeting & Event Provisions 2,740 21,800 14,500 23,000 5.50%
Community Outreach Materials - 2,500 2,000 2,500 0.00%
Uniforms 18,235 15,854 15,600 18,800 18.58%
Contracted Services 279,239 230,161 223,000 272,000 18.18%
Personal Protective Equipment 13,888 15,000 6,700 11,800 -21.33%
Software License & Maintenance 25,475 47,598 47,000 59,600 25.22%
Contracted Srvcs – Instr./Programs 71,963 368,600 274,000 484,500 31.44%
Professional Services 8,553 333,137 314,000 24,500 -92.65%
Professional Srvcs - Engineer/Survey 14,784 51,150 10,000 60,000 17.30%
Landfill Tipping Fees - - - 3,000 -
Dues and Subscriptions 3,390 2,300 2,000 2,200 -4.35%
Insurance - General Liability 32,000 29,300 26,500 46,600 59.04%
Capital Outlay - Land - 6,200 6,200 - -100.00%
Capital Outlay - Easements - 5,000 2,000 10,000 100.00%
Capital Outlay - Improvements 742,826 89,105 180,000 168,800 89.44%
Capital Outlay - Equipment 164,205 303,165 168,100 105,000 -65.37%
Total $ 5,041,211 $ 6,636,489 $ 5,665,800 $ 7,017,200 5.74%
180
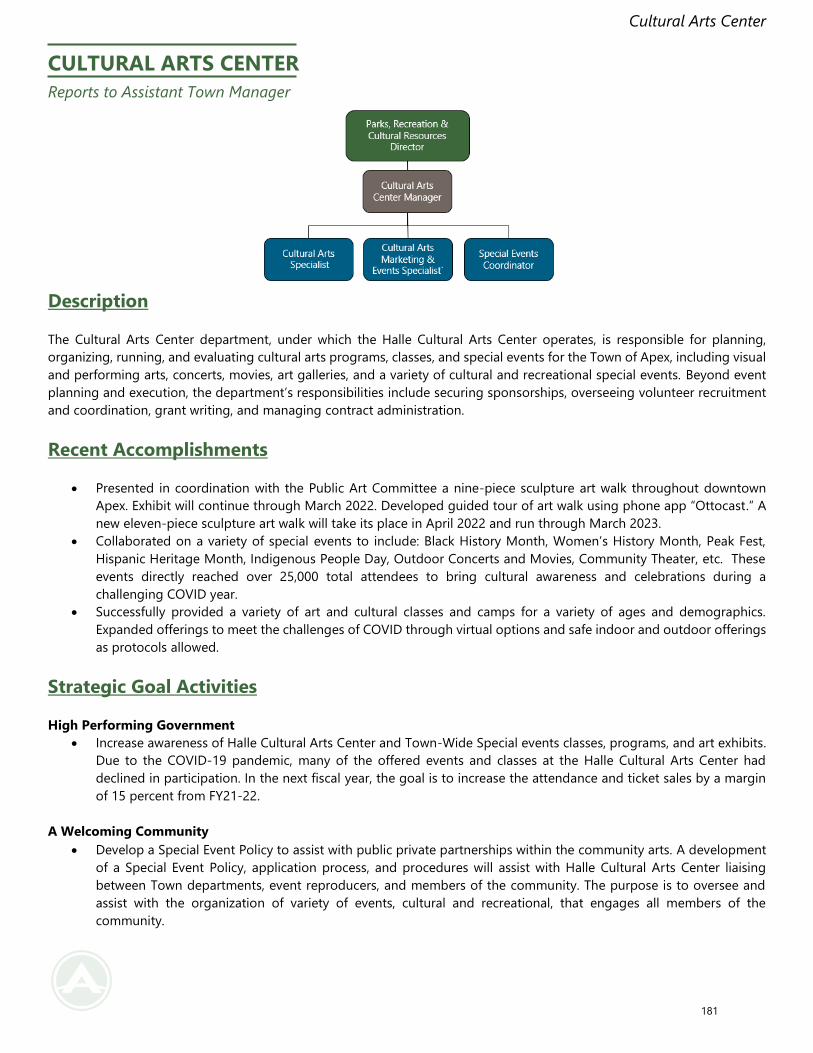
Cultural Arts Center
CULTURAL ARTS CENTER
Reports to Assistant Town Manager
Description
The Cultural Arts Center department, under which the Halle Cultural Arts Center operates, is responsible for planning,
organizing, running, and evaluating cultural arts programs, classes, and special events for the Town of Apex, including visual
and performing arts, concerts, movies, art galleries, and a variety of cultural and recreational special events. Beyond event
planning and execution, the department’s responsibilities include securing sponsorships, overseeing volunteer recruitment
and coordination, grant writing, and managing contract administration.
Recent Accomplishments
• Presented in coordination with the Public Art Committee a nine-piece sculpture art walk throughout downtown
Apex. Exhibit will continue through March 2022. Developed guided tour of art walk using phone app “Ottocast.” A
new eleven-piece sculpture art walk will take its place in April 2022 and run through March 2023.
• Collaborated on a variety of special events to include: Black History Month, Women’s History Month, Peak Fest,
Hispanic Heritage Month, Indigenous People Day, Outdoor Concerts and Movies, Community Theater, etc. These
events directly reached over 25,000 total attendees to bring cultural awareness and celebrations during a
challenging COVID year.
• Successfully provided a variety of art and cultural classes and camps for a variety of ages and demographics.
Expanded offerings to meet the challenges of COVID through virtual options and safe indoor and outdoor offerings
as protocols allowed.
Strategic Goal Activities
High Performing Government
• Increase awareness of Halle Cultural Arts Center and Town-Wide Special events classes, programs, and art exhibits.
Due to the COVID-19 pandemic, many of the offered events and classes at the Halle Cultural Arts Center had
declined in participation. In the next fiscal year, the goal is to increase the attendance and ticket sales by a margin
of 15 percent from FY21-22.
A Welcoming Community
• Develop a Special Event Policy to assist with public private partnerships within the community arts. A development
of a Special Event Policy, application process, and procedures will assist with Halle Cultural Arts Center liaising
between Town departments, event reproducers, and members of the community. The purpose is to oversee and
assist with the organization of variety of events, cultural and recreational, that engages all members of the
community.
181
Cultural Arts Center
Environmental Leadership
• Create awareness and enhance pollinator habitat through a Pollinator Habitat Recognition Program. Homeowners,
neighborhood HOAs, and businesses will be provided an opportunity to convert portions of landscapes to pollinator
friendly habitat with guidance and recognition provided through the Town’s Bee City Committee.
FY 2022-2023 Budget Highlights
• The Cultural Arts Center department budget increased 26.41 percent in FY22-23.
• The Cultural Arts Center budget accounts for 1.21 percent of the General Fund budget and is equivalent to $0.009
on the tax rate.
• The Town plans to spend $14.65 per capita for the Cultural Arts Center department in FY22-23.
• Major budget changes include the addition of one new position, a Special Events Coordinator, and the associated
onboarding cost as well as capital improvements, including rooftop HVAC replacement.
182
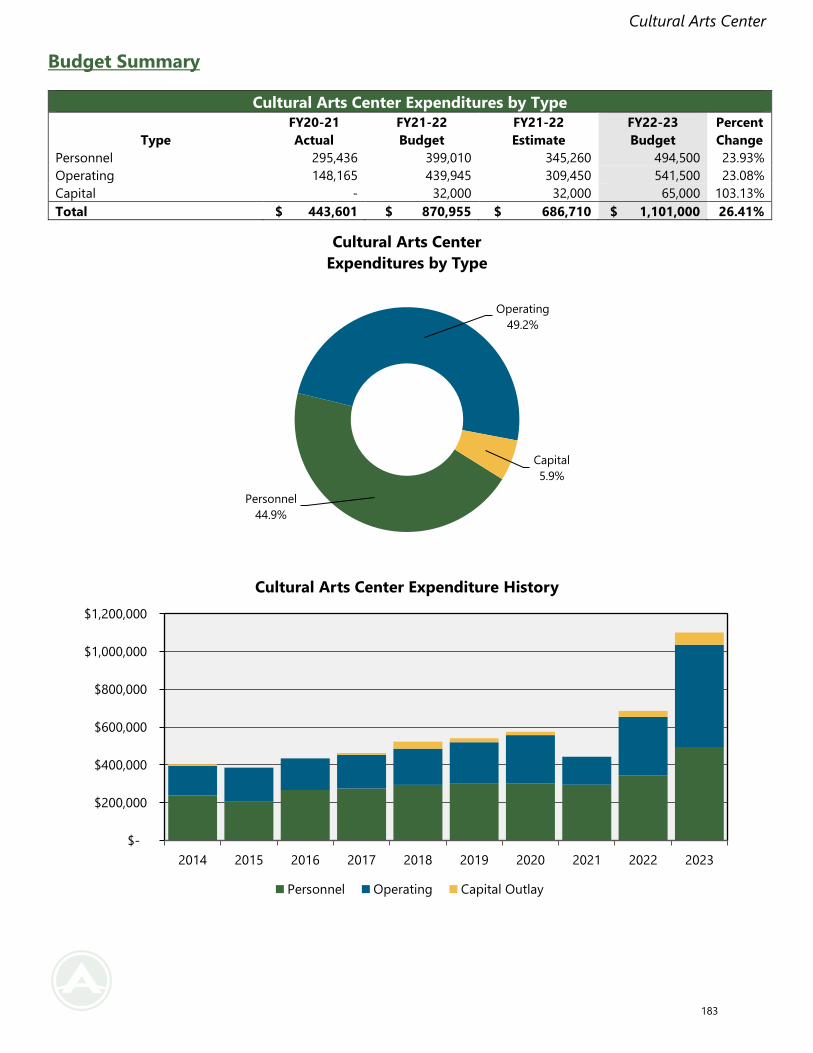
Cultural Arts Center
Budget Summary
Cultural Arts Center Expenditures by Type
Type
FY20-21
Actual
FY21-22
Budget
FY21-22
Estimate
FY22-23
Budget
Percent
Change
Personnel 295,436 399,010 345,260 494,500 23.93%
Operating 148,165 439,945 309,450 541,500 23.08%
Capital - 32,000 32,000 65,000 103.13%
Total $ 443,601 $ 870,955 $ 686,710 $ 1,101,000 26.41%
Personnel
44.9%
Operating
49.2%
Capital
5.9%
Cultural Arts Center
Expenditures by Type
$-
$200,000
$400,000
$600,000
$800,000
$1,000,000
$1,200,000
2014 2015 2016 2017 2018 2019 2020 2021 2022 2023
Cultural Arts Center Expenditure History
Personnel Operating Capital Outlay
183
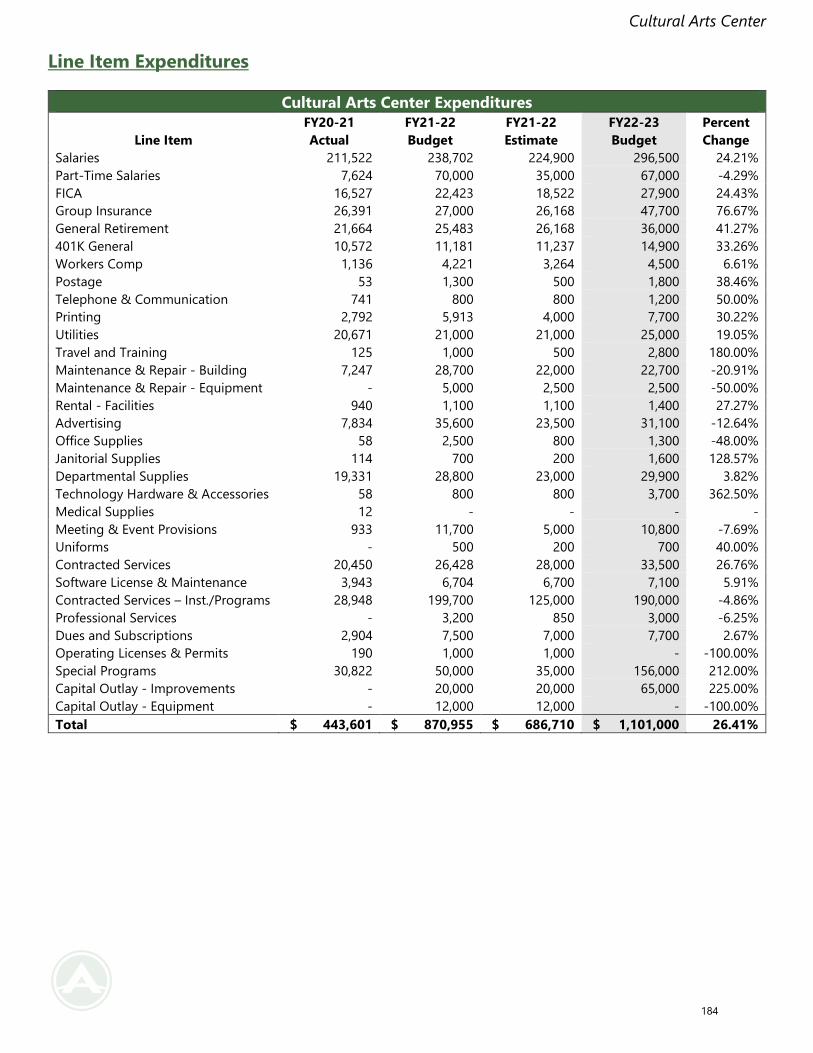
Cultural Arts Center
Line Item Expenditures
Cultural Arts Center Expenditures
Line Item
FY20-21
Actual
FY21-22
Budget
FY21-22
Estimate
FY22-23
Budget
Percent
Change
Salaries 211,522 238,702 224,900 296,500 24.21%
Part-Time Salaries 7,624 70,000 35,000 67,000 -4.29%
FICA 16,527 22,423 18,522 27,900 24.43%
Group Insurance 26,391 27,000 26,168 47,700 76.67%
General Retirement 21,664 25,483 26,168 36,000 41.27%
401K General 10,572 11,181 11,237 14,900 33.26%
Workers Comp 1,136 4,221 3,264 4,500 6.61%
Postage 53 1,300 500 1,800 38.46%
Telephone & Communication 741 800 800 1,200 50.00%
Printing 2,792 5,913 4,000 7,700 30.22%
Utilities 20,671 21,000 21,000 25,000 19.05%
Travel and Training 125 1,000 500 2,800 180.00%
Maintenance & Repair - Building 7,247 28,700 22,000 22,700 -20.91%
Maintenance & Repair - Equipment - 5,000 2,500 2,500 -50.00%
Rental - Facilities 940 1,100 1,100 1,400 27.27%
Advertising 7,834 35,600 23,500 31,100 -12.64%
Office Supplies 58 2,500 800 1,300 -48.00%
Janitorial Supplies 114 700 200 1,600 128.57%
Departmental Supplies 19,331 28,800 23,000 29,900 3.82%
Technology Hardware & Accessories 58 800 800 3,700 362.50%
Medical Supplies 12 - - - -
Meeting & Event Provisions 933 11,700 5,000 10,800 -7.69%
Uniforms - 500 200 700 40.00%
Contracted Services 20,450 26,428 28,000 33,500 26.76%
Software License & Maintenance 3,943 6,704 6,700 7,100 5.91%
Contracted Services – Inst./Programs 28,948 199,700 125,000 190,000 -4.86%
Professional Services - 3,200 850 3,000 -6.25%
Dues and Subscriptions 2,904 7,500 7,000 7,700 2.67%
Operating Licenses & Permits 190 1,000 1,000 - -100.00%
Special Programs 30,822 50,000 35,000 156,000 212.00%
Capital Outlay - Improvements - 20,000 20,000 65,000 225.00%
Capital Outlay - Equipment - 12,000 12,000 - -100.00%
Total $ 443,601 $ 870,955 $ 686,710 $ 1,101,000 26.41%
184
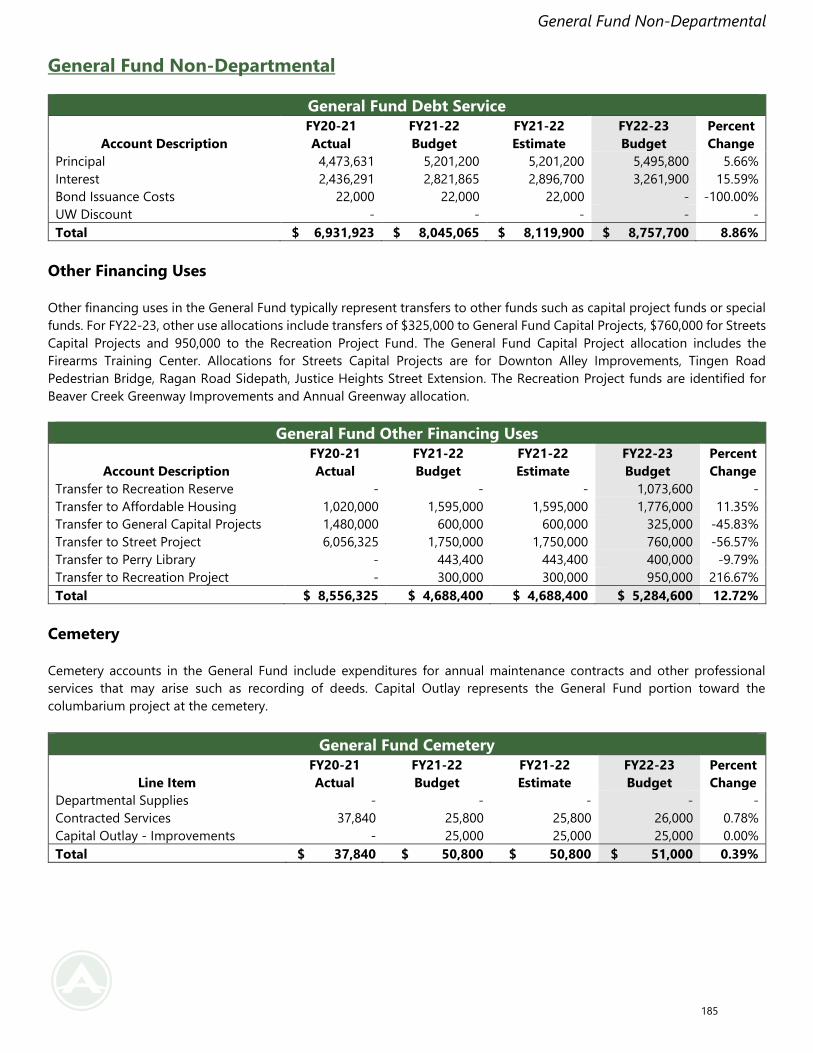
General Fund Non-Departmental
General Fund Non-Departmental
General Fund Debt Service
Account Description
FY20-21
Actual
FY21-22
Budget
FY21-22
Estimate
FY22-23
Budget
Percent
Change
Principal 4,473,631 5,201,200 5,201,200 5,495,800 5.66%
Interest 2,436,291 2,821,865 2,896,700 3,261,900 15.59%
Bond Issuance Costs 22,000 22,000 22,000 - -100.00%
UW Discount - - - - -
Total $ 6,931,923 $ 8,045,065 $ 8,119,900 $ 8,757,700 8.86%
Other Financing Uses
Other financing uses in the General Fund typically represent transfers to other funds such as capital project funds or special
funds. For FY22-23, other use allocations include transfers of $325,000 to General Fund Capital Projects, $760,000 for Streets
Capital Projects and 950,000 to the Recreation Project Fund. The General Fund Capital Project allocation includes the
Firearms Training Center. Allocations for Streets Capital Projects are for Downton Alley Improvements, Tingen Road
Pedestrian Bridge, Ragan Road Sidepath, Justice Heights Street Extension. The Recreation Project funds are identified for
Beaver Creek Greenway Improvements and Annual Greenway allocation.
General Fund Other Financing Uses
Account Description
FY20-21
Actual
FY21-22
Budget
FY21-22
Estimate
FY22-23
Budget
Percent
Change
Transfer to Recreation Reserve - - - 1,073,600 -
Transfer to Affordable Housing 1,020,000 1,595,000 1,595,000 1,776,000 11.35%
Transfer to General Capital Projects 1,480,000 600,000 600,000 325,000 -45.83%
Transfer to Street Project 6,056,325 1,750,000 1,750,000 760,000 -56.57%
Transfer to Perry Library - 443,400 443,400 400,000 -9.79%
Transfer to Recreation Project - 300,000 300,000 950,000 216.67%
Total $ 8,556,325 $ 4,688,400 $ 4,688,400 $ 5,284,600 12.72%
Cemetery
Cemetery accounts in the General Fund include expenditures for annual maintenance contracts and other professional
services that may arise such as recording of deeds. Capital Outlay represents the General Fund portion toward the
columbarium project at the cemetery.
General Fund Cemetery
Line Item
FY20-21
Actual
FY21-22
Budget
FY21-22
Estimate
FY22-23
Budget
Percent
Change
Departmental Supplies - - - - -
Contracted Services 37,840 25,800 25,800 26,000 0.78%
Capital Outlay - Improvements - 25,000 25,000 25,000 0.00%
Total $ 37,840 $ 50,800 $ 50,800 $ 51,000 0.39%
185
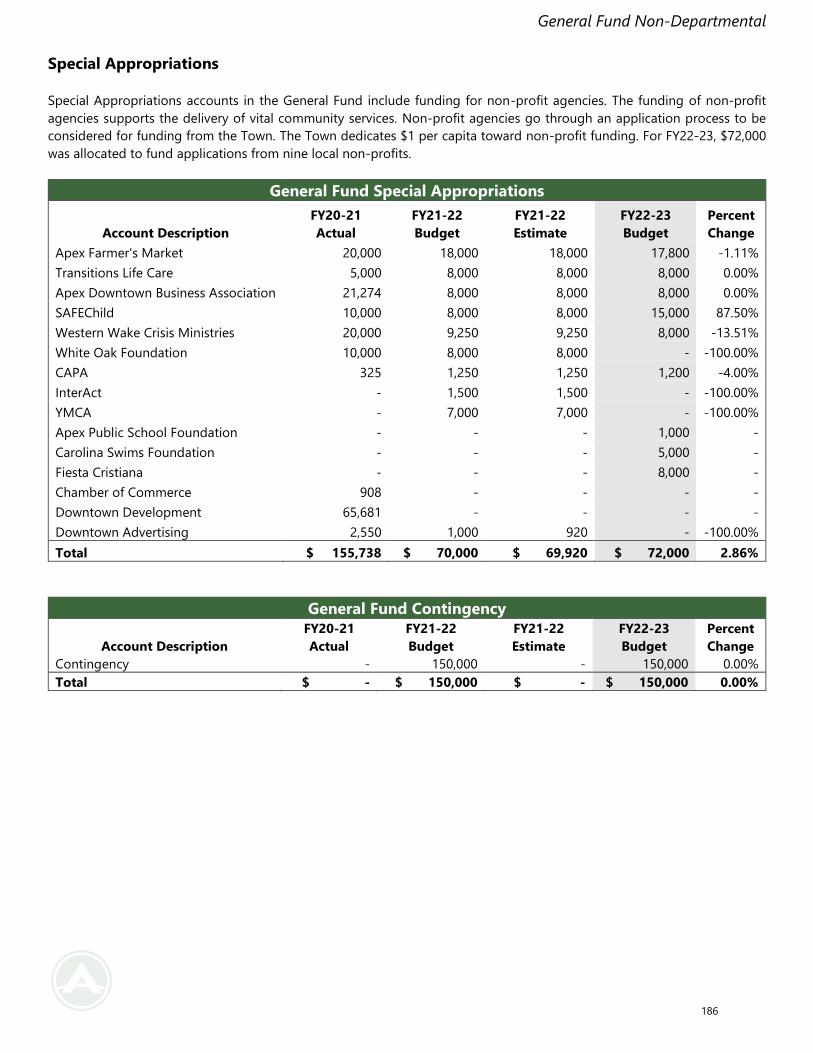
General Fund Non-Departmental
Special Appropriations
Special Appropriations accounts in the General Fund include funding for non-profit agencies. The funding of non-profit
agencies supports the delivery of vital community services. Non-profit agencies go through an application process to be
considered for funding from the Town. The Town dedicates $1 per capita toward non-profit funding. For FY22-23, $72,000
was allocated to fund applications from nine local non-profits.
General Fund Special Appropriations
Account Description
FY20-21
Actual
FY21-22
Budget
FY21-22
Estimate
FY22-23
Budget
Percent
Change
Apex Farmer's Market 20,000 18,000 18,000 17,800 -1.11%
Transitions Life Care 5,000 8,000 8,000 8,000 0.00%
Apex Downtown Business Association 21,274 8,000 8,000 8,000 0.00%
SAFEChild 10,000 8,000 8,000 15,000 87.50%
Western Wake Crisis Ministries 20,000 9,250 9,250 8,000 -13.51%
White Oak Foundation 10,000 8,000 8,000 - -100.00%
CAPA 325 1,250 1,250 1,200 -4.00%
InterAct - 1,500 1,500 - -100.00%
YMCA - 7,000 7,000 - -100.00%
Apex Public School Foundation - - - 1,000 -
Carolina Swims Foundation - - - 5,000 -
Fiesta Cristiana - - - 8,000 -
Chamber of Commerce 908 - - - -
Downtown Development 65,681 - - - -
Downtown Advertising 2,550 1,000 920 - -100.00%
Total $ 155,738 $ 70,000 $ 69,920 $ 72,000 2.86%
General Fund Contingency
Account Description
FY20-21
Actual
FY21-22
Budget
FY21-22
Estimate
FY22-23
Budget
Percent
Change
Contingency - 150,000 - 150,000 0.00%
Total $ - $ 150,000 $ - $ 150,000 0.00%
186
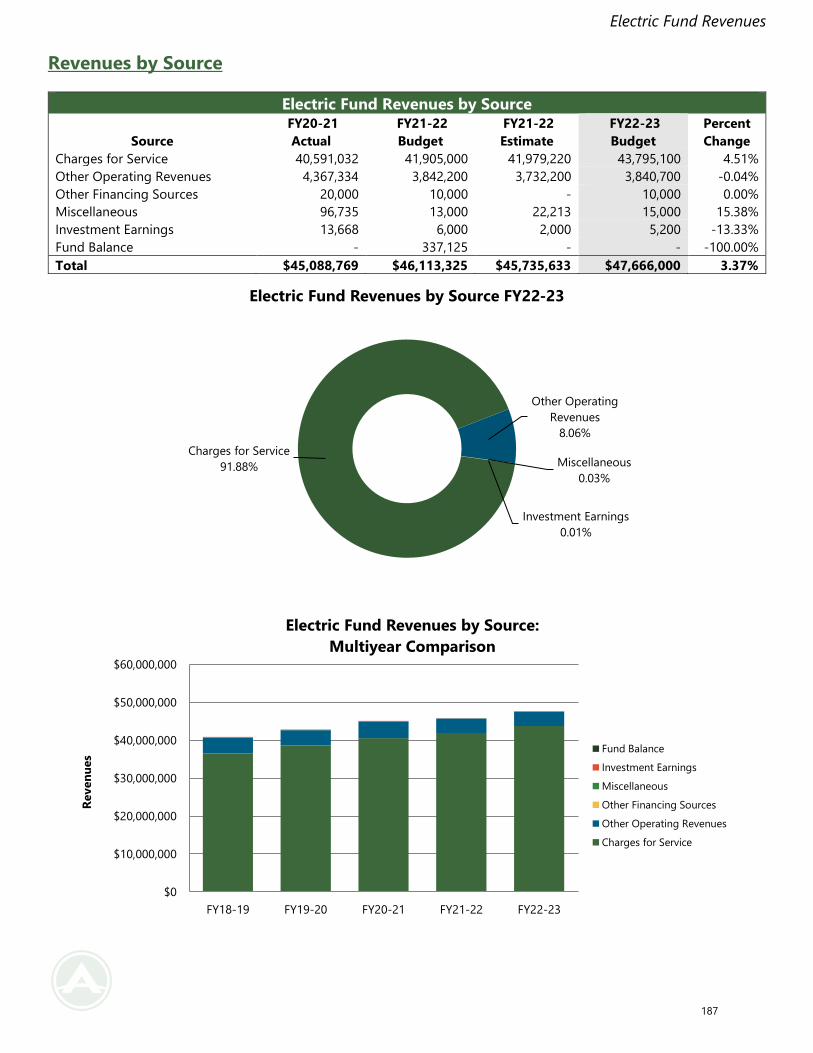
Electric Fund Revenues
Revenues by Source
Electric Fund Revenues by Source
Source
FY20-21
Actual
FY21-22
Budget
FY21-22
Estimate
FY22-23
Budget
Percent
Change
Charges for Service 40,591,032 41,905,000 41,979,220 43,795,100 4.51%
Other Operating Revenues 4,367,334 3,842,200 3,732,200 3,840,700 -0.04%
Other Financing Sources 20,000 10,000 - 10,000 0.00%
Miscellaneous 96,735 13,000 22,213 15,000 15.38%
Investment Earnings 13,668 6,000 2,000 5,200 -13.33%
Fund Balance - 337,125 - - -100.00%
Total $45,088,769 $46,113,325 $45,735,633 $47,666,000 3.37%
Charges for Service
91.88%
Other Operating
Revenues
8.06%
Miscellaneous
0.03%
Investment Earnings
0.01%
Electric Fund Revenues by Source FY22-23
$0
$10,000,000
$20,000,000
$30,000,000
$40,000,000
$50,000,000
$60,000,000
FY18-19 FY19-20 FY20-21 FY21-22 FY22-23
Reven
ues
Electric Fund Revenues by Source:
Multiyear Comparison
Fund Balance
Investment Earnings
Miscellaneous
Other Financing Sources
Other Operating Revenues
Charges for Service
187
Electric Fund Revenues
Source Descriptions
Charges for Service
Electric charges account for 91.88 percent of Electric Fund revenues. Electric consumption by citizens and other customers
generates these revenues. The Town has a residential base charge of $25.00 and a per kWh energy charge of $.0942. Electric
charges, along with penalties and reconnection fees account for $43.92 million in the FY22-23 Electric Fund budget.
Other Operating Revenues
The Town collects sales tax on utility charges and collects fees to offset the cost of system expansion and installing new
meters. These revenues account for $3.84 million in the FY22-23 Electric Fund budget.
Other Financing Sources
Other financing sources represent revenues received from sale of capital assets and transfers in from capital reserves. These
revenues account for $10,000 in the FY22-23 Electric Fund budget.
Investment Earnings
Investment earnings include the return earned on cash and investment balances. Interest is earned on the cash balances
invested with the North Carolina Capital Management Trust (NCCMT) and other allowable investments in various CD’s and
money market accounts. Investment earnings account for $5,200 in the FY22-23 Electric Fund budget.
Miscellaneous
Miscellaneous revenues in the Electric Fund include revenues that do not easily fit into other categories. Miscellaneous
revenues account for $15,000 in FY22-23.
Fund Balance Appropriated
Allocations from fund balance represent use of reserve funds. The Town typically uses reserves for specific capital projects,
onetime opportunities, or emergency operations. There are no fund balance appropriations in the FY22-23 Electric Fund
budget.
188
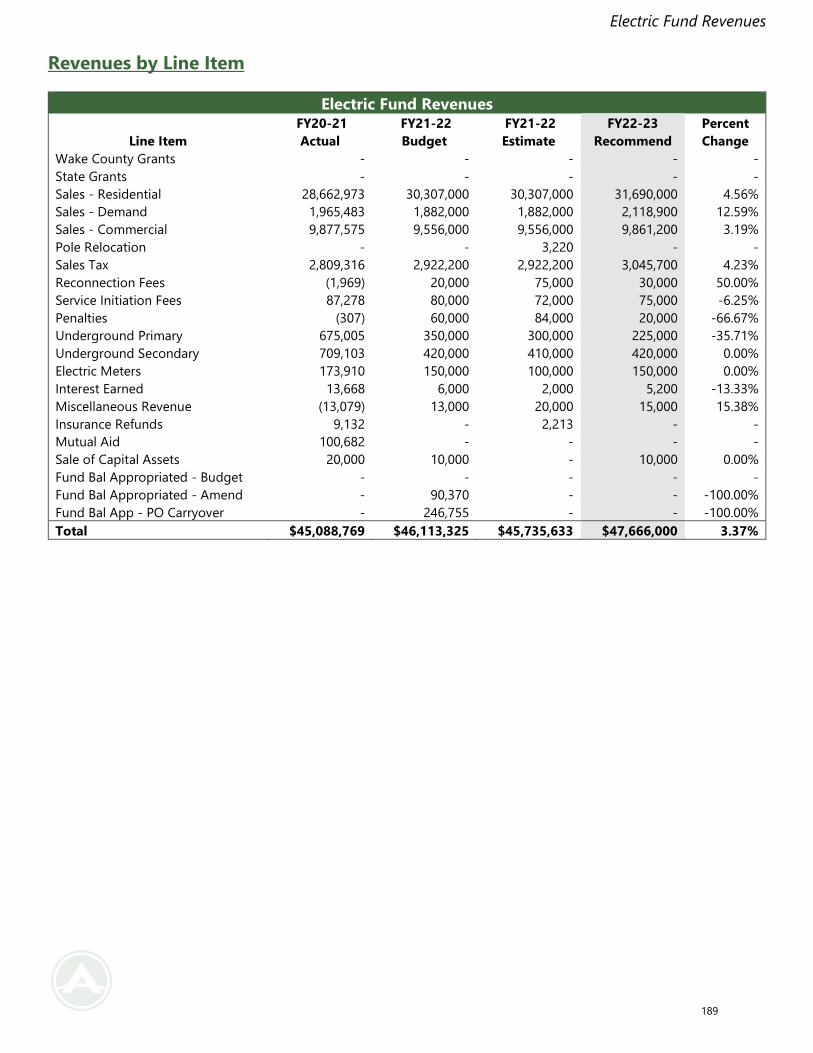
Electric Fund Revenues
Revenues by Line Item
Electric Fund Revenues
Line Item
FY20-21
Actual
FY21-22
Budget
FY21-22
Estimate
FY22-23
Recommend
Percent
Change
Wake County Grants - - - - -
State Grants - - - - -
Sales - Residential 28,662,973 30,307,000 30,307,000 31,690,000 4.56%
Sales - Demand 1,965,483 1,882,000 1,882,000 2,118,900 12.59%
Sales - Commercial 9,877,575 9,556,000 9,556,000 9,861,200 3.19%
Pole Relocation - - 3,220 - -
Sales Tax 2,809,316 2,922,200 2,922,200 3,045,700 4.23%
Reconnection Fees (1,969) 20,000 75,000 30,000 50.00%
Service Initiation Fees 87,278 80,000 72,000 75,000 -6.25%
Penalties (307) 60,000 84,000 20,000 -66.67%
Underground Primary 675,005 350,000 300,000 225,000 -35.71%
Underground Secondary 709,103 420,000 410,000 420,000 0.00%
Electric Meters 173,910 150,000 100,000 150,000 0.00%
Interest Earned 13,668 6,000 2,000 5,200 -13.33%
Miscellaneous Revenue (13,079) 13,000 20,000 15,000 15.38%
Insurance Refunds 9,132 - 2,213 - -
Mutual Aid 100,682 - - - -
Sale of Capital Assets 20,000 10,000 - 10,000 0.00%
Fund Bal Appropriated - Budget - - - - -
Fund Bal Appropriated - Amend - 90,370 - - -100.00%
Fund Bal App - PO Carryover - 246,755 - - -100.00%
Total $45,088,769 $46,113,325 $45,735,633 $47,666,000 3.37%
189
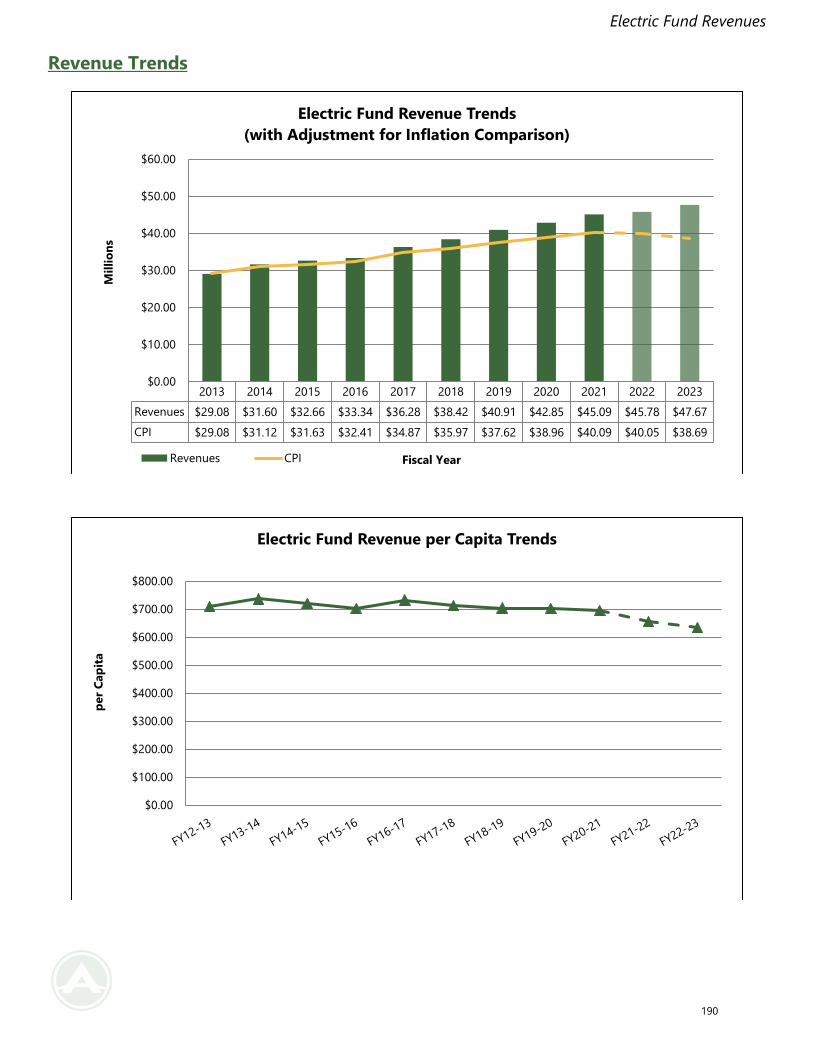
Electric Fund Revenues
Revenue Trends
2013 2014 2015 2016 2017 2018 2019 2020 2021 2022 2023
Revenues $29.08 $31.60 $32.66 $33.34 $36.28 $38.42 $40.91 $42.85 $45.09 $45.78 $47.67
CPI $29.08 $31.12 $31.63 $32.41 $34.87 $35.97 $37.62 $38.96 $40.09 $40.05 $38.69
$0.00
$10.00
$20.00
$30.00
$40.00
$50.00
$60.00
Mil
lio
ns
Fiscal Year
Electric Fund Revenue Trends
(with Adjustment for Inflation Comparison)
Revenues CPI
$0.00
$100.00
$200.00
$300.00
$400.00
$500.00
$600.00
$700.00
$800.00
per
Cap
ita
Electric Fund Revenue per Capita Trends
190
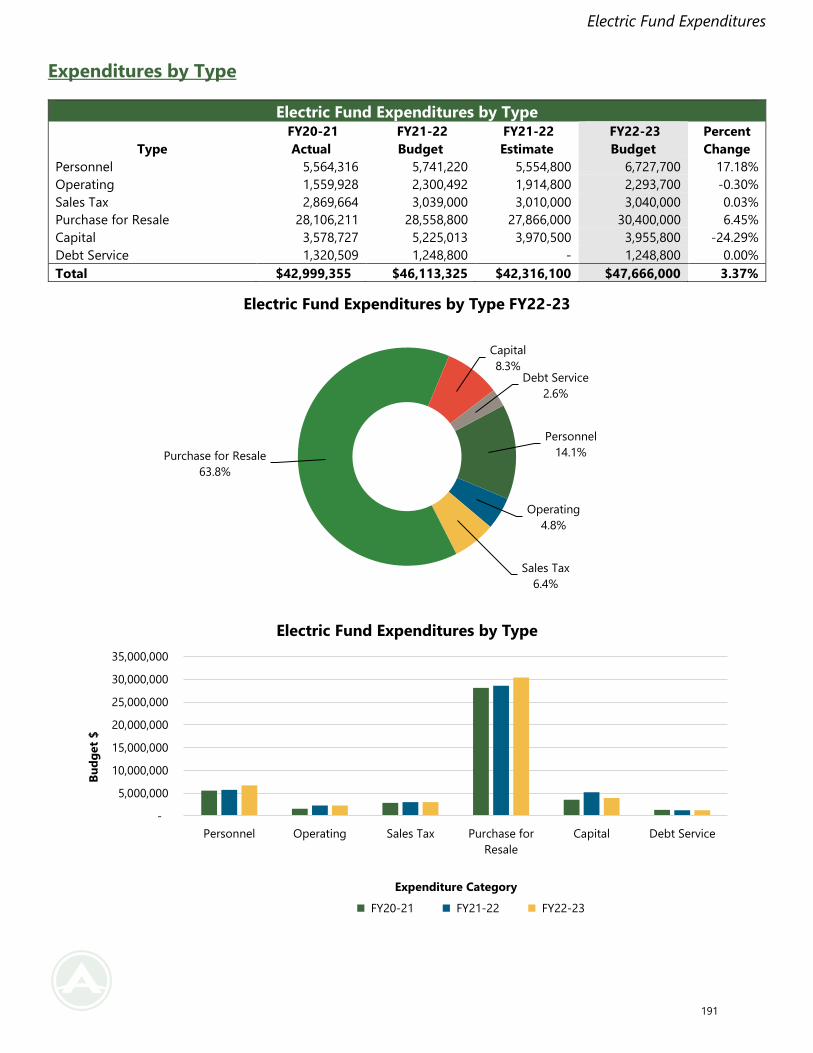
Electric Fund Expenditures
Expenditures by Type
Electric Fund Expenditures by Type
Type
FY20-21
Actual
FY21-22
Budget
FY21-22
Estimate
FY22-23
Budget
Percent
Change
Personnel 5,564,316 5,741,220 5,554,800 6,727,700 17.18%
Operating 1,559,928 2,300,492 1,914,800 2,293,700 -0.30%
Sales Tax 2,869,664 3,039,000 3,010,000 3,040,000 0.03%
Purchase for Resale 28,106,211 28,558,800 27,866,000 30,400,000 6.45%
Capital 3,578,727 5,225,013 3,970,500 3,955,800 -24.29%
Debt Service 1,320,509 1,248,800 - 1,248,800 0.00%
Total $42,999,355 $46,113,325 $42,316,100 $47,666,000 3.37%
Personnel
14.1%
Operating
4.8%
Sales Tax
6.4%
Purchase for Resale
63.8%
Capital
8.3%Debt Service
2.6%
Electric Fund Expenditures by Type FY22-23
-
5,000,000
10,000,000
15,000,000
20,000,000
25,000,000
30,000,000
35,000,000
Personnel Operating Sales Tax Purchase for
Resale
Capital Debt Service
Bu
dg
et
$
Expenditure Category
Electric Fund Expenditures by Type
FY20-21 FY21-22 FY22-23
191
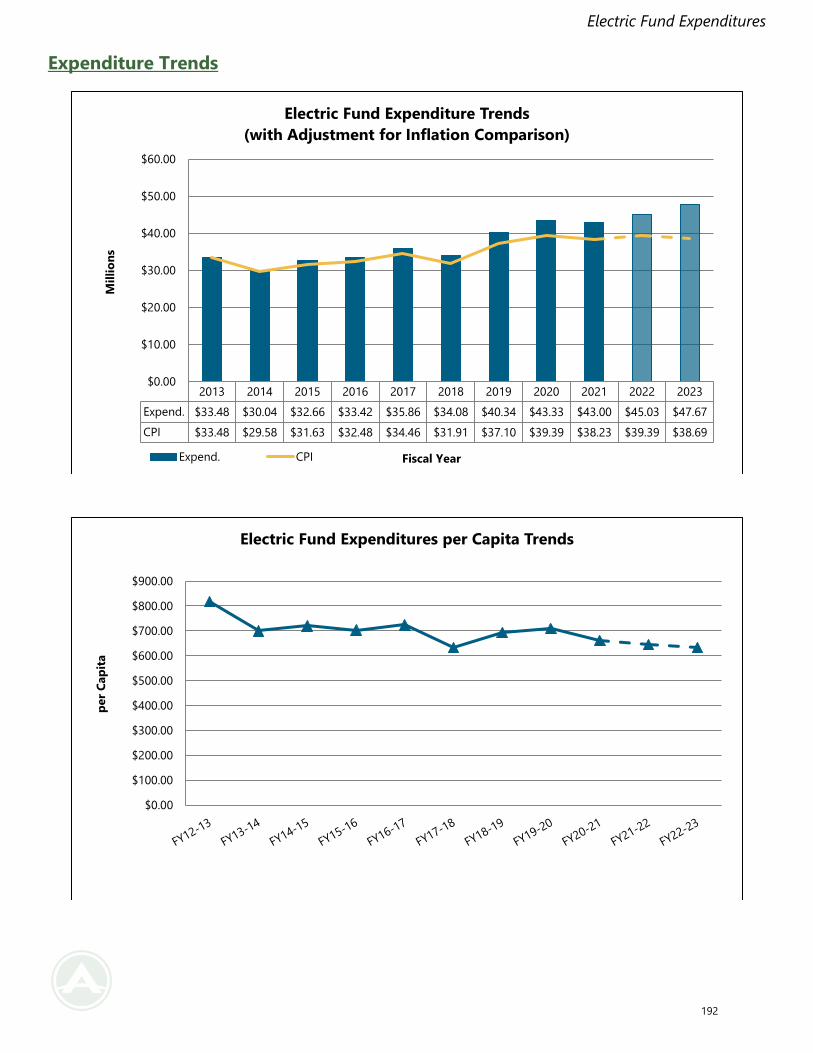
Electric Fund Expenditures
Expenditure Trends
2013 2014 2015 2016 2017 2018 2019 2020 2021 2022 2023
Expend. $33.48 $30.04 $32.66 $33.42 $35.86 $34.08 $40.34 $43.33 $43.00 $45.03 $47.67
CPI $33.48 $29.58 $31.63 $32.48 $34.46 $31.91 $37.10 $39.39 $38.23 $39.39 $38.69
$0.00
$10.00
$20.00
$30.00
$40.00
$50.00
$60.00
Mil
lio
ns
Fiscal Year
Electric Fund Expenditure Trends
(with Adjustment for Inflation Comparison)
Expend. CPI
$0.00
$100.00
$200.00
$300.00
$400.00
$500.00
$600.00
$700.00
$800.00
$900.00
per
Cap
ita
Electric Fund Expenditures per Capita Trends
192
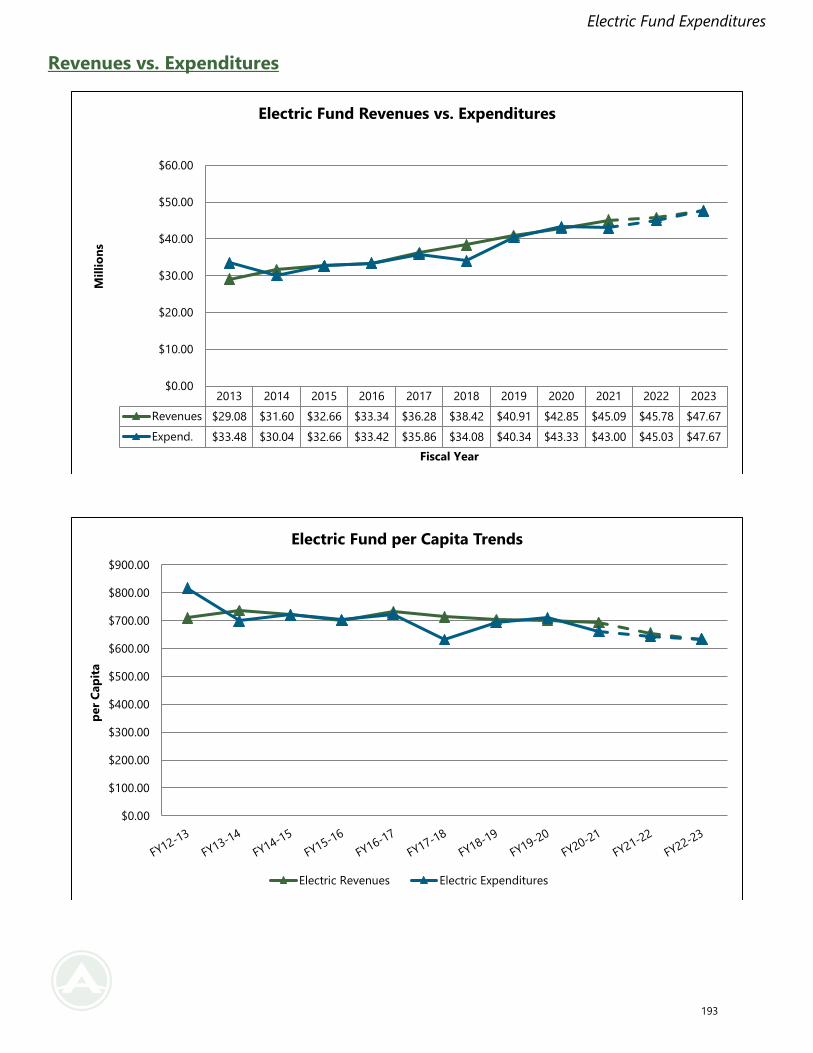
Electric Fund Expenditures
Revenues vs. Expenditures
2013 2014 2015 2016 2017 2018 2019 2020 2021 2022 2023
Revenues $29.08 $31.60 $32.66 $33.34 $36.28 $38.42 $40.91 $42.85 $45.09 $45.78 $47.67
Expend. $33.48 $30.04 $32.66 $33.42 $35.86 $34.08 $40.34 $43.33 $43.00 $45.03 $47.67
$0.00
$10.00
$20.00
$30.00
$40.00
$50.00
$60.00
Mil
lio
ns
Fiscal Year
Electric Fund Revenues vs. Expenditures
$0.00
$100.00
$200.00
$300.00
$400.00
$500.00
$600.00
$700.00
$800.00
$900.00
per
Cap
ita
Electric Fund per Capita Trends
Electric Revenues Electric Expenditures
193
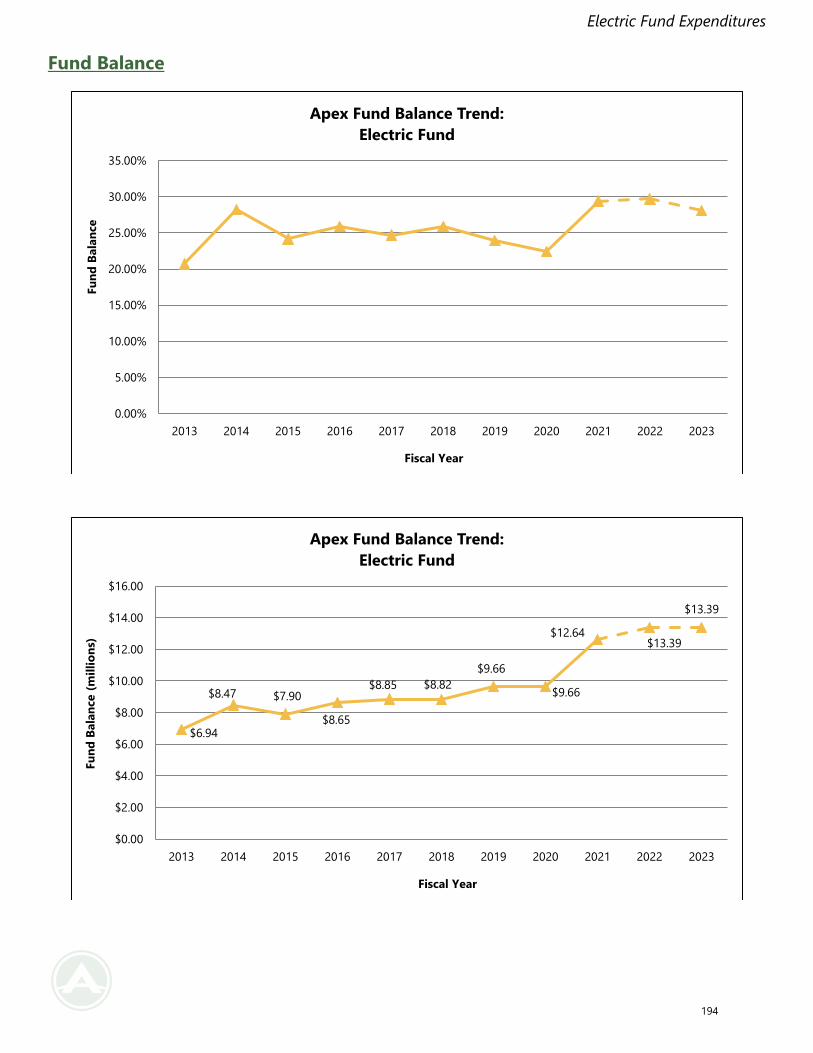
Electric Fund Expenditures
Fund Balance
0.00%
5.00%
10.00%
15.00%
20.00%
25.00%
30.00%
35.00%
2013 2014 2015 2016 2017 2018 2019 2020 2021 2022 2023
Fu
nd
Bala
nce
Fiscal Year
Apex Fund Balance Trend:
Electric Fund
$6.94
$8.47 $7.90
$8.65
$8.85 $8.82
$9.66
$9.66
$12.64$13.39
$13.39
$0.00
$2.00
$4.00
$6.00
$8.00
$10.00
$12.00
$14.00
$16.00
2013 2014 2015 2016 2017 2018 2019 2020 2021 2022 2023
Fu
nd
Bala
nce (
mil
lio
ns)
Fiscal Year
Apex Fund Balance Trend:
Electric Fund
194
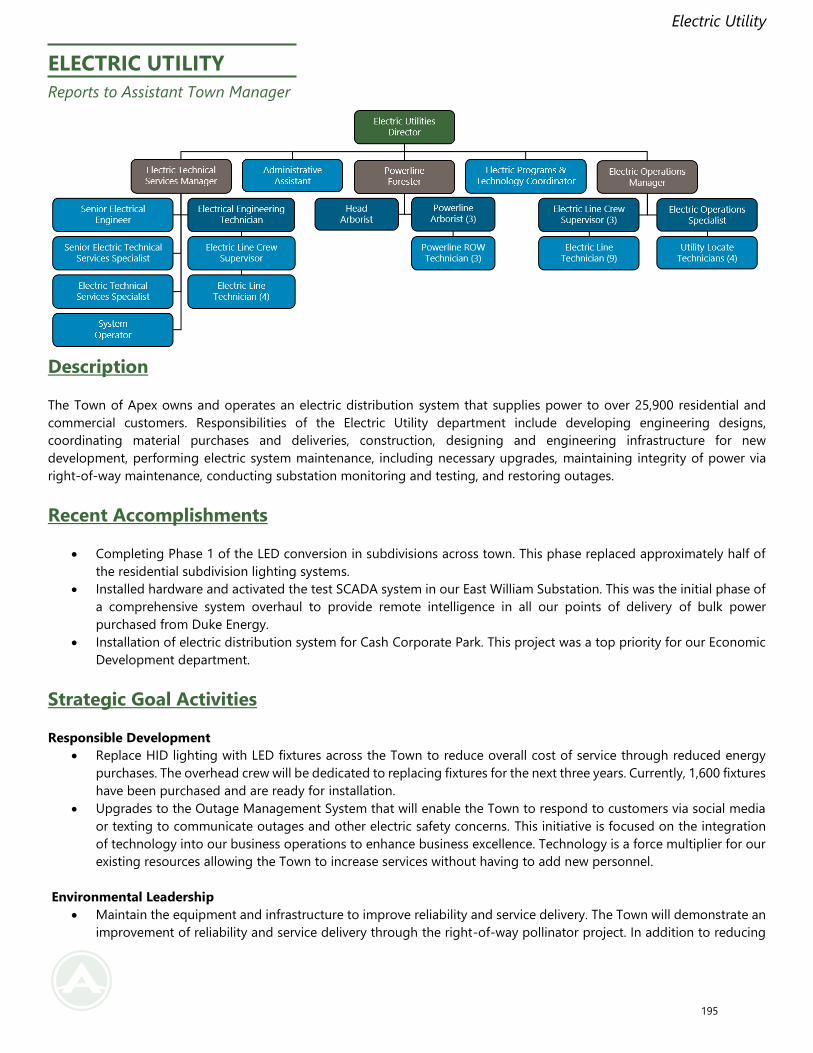
Electric Utility
ELECTRIC UTILITY
Reports to Assistant Town Manager
Description
The Town of Apex owns and operates an electric distribution system that supplies power to over 25,900 residential and
commercial customers. Responsibilities of the Electric Utility department include developing engineering designs,
coordinating material purchases and deliveries, construction, designing and engineering infrastructure for new
development, performing electric system maintenance, including necessary upgrades, maintaining integrity of power via
right-of-way maintenance, conducting substation monitoring and testing, and restoring outages.
Recent Accomplishments
• Completing Phase 1 of the LED conversion in subdivisions across town. This phase replaced approximately half of
the residential subdivision lighting systems.
• Installed hardware and activated the test SCADA system in our East William Substation. This was the initial phase of
a comprehensive system overhaul to provide remote intelligence in all our points of delivery of bulk power
purchased from Duke Energy.
• Installation of electric distribution system for Cash Corporate Park. This project was a top priority for our Economic
Development department.
Strategic Goal Activities
Responsible Development
• Replace HID lighting with LED fixtures across the Town to reduce overall cost of service through reduced energy
purchases. The overhead crew will be dedicated to replacing fixtures for the next three years. Currently, 1,600 fixtures
have been purchased and are ready for installation.
• Upgrades to the Outage Management System that will enable the Town to respond to customers via social media
or texting to communicate outages and other electric safety concerns. This initiative is focused on the integration
of technology into our business operations to enhance business excellence. Technology is a force multiplier for our
existing resources allowing the Town to increase services without having to add new personnel.
Environmental Leadership
• Maintain the equipment and infrastructure to improve reliability and service delivery. The Town will demonstrate an
improvement of reliability and service delivery through the right-of-way pollinator project. In addition to reducing
195
Electric Utility
our reliance on chemicals to inhibit growth, the Town will be promoting healthy species of pollinators in the rights-
of-way and maintain their health with the cultivation of honey bee hives.
FY 2022-2023 Budget Highlights
• The Electric Utility Fund budget as a whole increased by 3.37 percent in FY22-23. Within the fund, the Electric Utility
department budget increased by 3.91 percent in FY22-23.
• The Electric Utility budget is equivalent to $2,103.01 per utility account.
• The Town plans to spend $602.14 per capita for the Electric Utility in FY22-23.
• Major budget changes include the addition of two new staff members including an Arborist, a System Operator,
and the associated onboarding costs.
• The budget includes capital equipment including one vehicle replacement, one vehicle addition, a full feature
plotter, a ventrac replacement and a power rake attachment, and $2,500,000 in capital improvements for electric
system expansion.
196
Electric Utility
Budget Summary
Electric Fund Expenditures by Type
Type FY20-21 Actual FY21-22 Budget FY21-22 Estimate FY22-23 Budget
Percent
Change
Personnel $5,564,316 $5,741,220 $5,554,800 $6,727,700 17.18%
Operating $1,559,928 $2,300,492 $1,914,800 $2,293,700 -0.30%
Sales Tax $2,869,664 $3,039,000 $2,903,928 $3,040,000 0.03%
Purchase for Resale $28,106,211 $28,558,800 $28,442,000 $30,400,000 6.45%
Capital $3,578,727 $5,225,013 $4,970,500 $3,955,800 -24.29%
Debt Service $1,320,509 $1,248,800 $1,248,800 $1,248,800 0.00%
Total $42,999,355 $46,113,325 $45,034,828 $47,666,000 3.37%
Personnel
14.1%
Operating
4.8%
Sales Tax
6.4%
Purchase for Resale
63.8%
Capital
8.3%
Debt Service
2.6%
Electric Fund Expenditures by Type
$-
$10,000,000
$20,000,000
$30,000,000
$40,000,000
$50,000,000
$60,000,000
2014 2015 2016 2017 2018 2019 2020 2021 2022 2023
Electric Fund Expenditure History
Personnel Operating Sales Tax Purchase for Resale Capital Outlay Debt Service
197
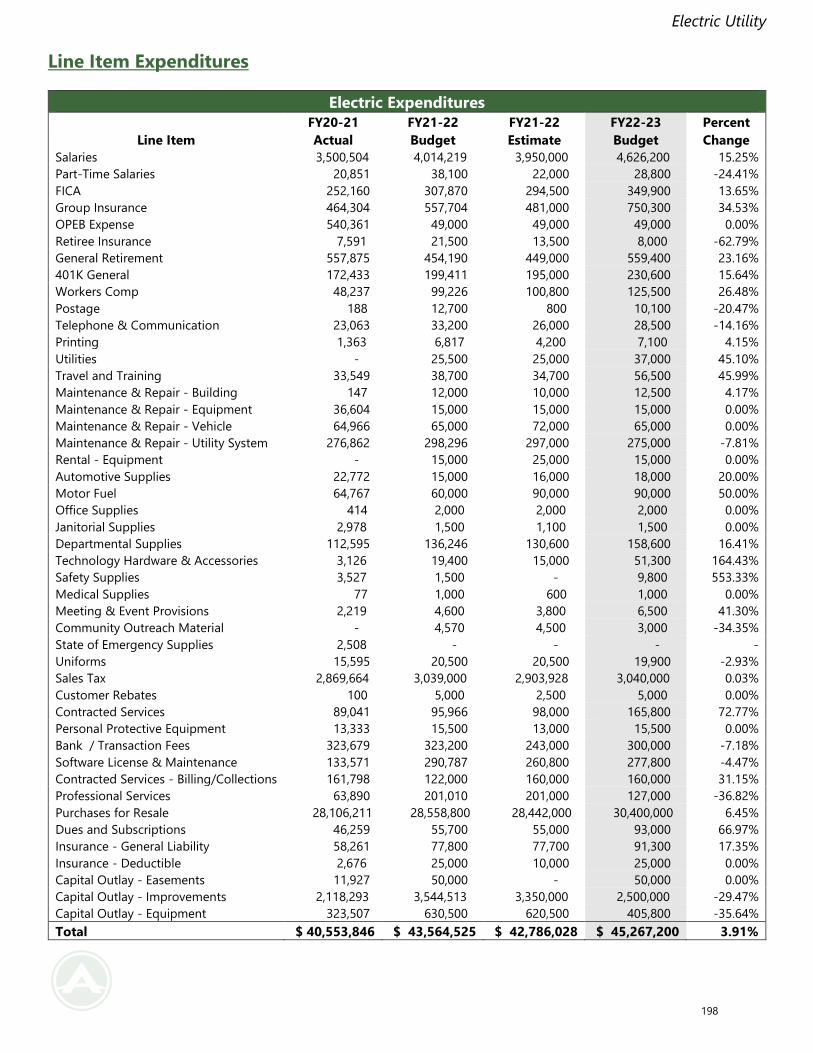
Electric Utility
Line Item Expenditures
Electric Expenditures
Line Item
FY20-21
Actual
FY21-22
Budget
FY21-22
Estimate
FY22-23
Budget
Percent
Change
Salaries 3,500,504 4,014,219 3,950,000 4,626,200 15.25%
Part-Time Salaries 20,851 38,100 22,000 28,800 -24.41%
FICA 252,160 307,870 294,500 349,900 13.65%
Group Insurance 464,304 557,704 481,000 750,300 34.53%
OPEB Expense 540,361 49,000 49,000 49,000 0.00%
Retiree Insurance 7,591 21,500 13,500 8,000 -62.79%
General Retirement 557,875 454,190 449,000 559,400 23.16%
401K General 172,433 199,411 195,000 230,600 15.64%
Workers Comp 48,237 99,226 100,800 125,500 26.48%
Postage 188 12,700 800 10,100 -20.47%
Telephone & Communication 23,063 33,200 26,000 28,500 -14.16%
Printing 1,363 6,817 4,200 7,100 4.15%
Utilities - 25,500 25,000 37,000 45.10%
Travel and Training 33,549 38,700 34,700 56,500 45.99%
Maintenance & Repair - Building 147 12,000 10,000 12,500 4.17%
Maintenance & Repair - Equipment 36,604 15,000 15,000 15,000 0.00%
Maintenance & Repair - Vehicle 64,966 65,000 72,000 65,000 0.00%
Maintenance & Repair - Utility System 276,862 298,296 297,000 275,000 -7.81%
Rental - Equipment - 15,000 25,000 15,000 0.00%
Automotive Supplies 22,772 15,000 16,000 18,000 20.00%
Motor Fuel 64,767 60,000 90,000 90,000 50.00%
Office Supplies 414 2,000 2,000 2,000 0.00%
Janitorial Supplies 2,978 1,500 1,100 1,500 0.00%
Departmental Supplies 112,595 136,246 130,600 158,600 16.41%
Technology Hardware & Accessories 3,126 19,400 15,000 51,300 164.43%
Safety Supplies 3,527 1,500 - 9,800 553.33%
Medical Supplies 77 1,000 600 1,000 0.00%
Meeting & Event Provisions 2,219 4,600 3,800 6,500 41.30%
Community Outreach Material - 4,570 4,500 3,000 -34.35%
State of Emergency Supplies 2,508 - - - -
Uniforms 15,595 20,500 20,500 19,900 -2.93%
Sales Tax 2,869,664 3,039,000 2,903,928 3,040,000 0.03%
Customer Rebates 100 5,000 2,500 5,000 0.00%
Contracted Services 89,041 95,966 98,000 165,800 72.77%
Personal Protective Equipment 13,333 15,500 13,000 15,500 0.00%
Bank / Transaction Fees 323,679 323,200 243,000 300,000 -7.18%
Software License & Maintenance 133,571 290,787 260,800 277,800 -4.47%
Contracted Services - Billing/Collections 161,798 122,000 160,000 160,000 31.15%
Professional Services 63,890 201,010 201,000 127,000 -36.82%
Purchases for Resale 28,106,211 28,558,800 28,442,000 30,400,000 6.45%
Dues and Subscriptions 46,259 55,700 55,000 93,000 66.97%
Insurance - General Liability 58,261 77,800 77,700 91,300 17.35%
Insurance - Deductible 2,676 25,000 10,000 25,000 0.00%
Capital Outlay - Easements 11,927 50,000 - 50,000 0.00%
Capital Outlay - Improvements 2,118,293 3,544,513 3,350,000 2,500,000 -29.47%
Capital Outlay - Equipment 323,507 630,500 620,500 405,800 -35.64%
Total $ 40,553,846 $ 43,564,525 $ 42,786,028 $ 45,267,200 3.91%
198
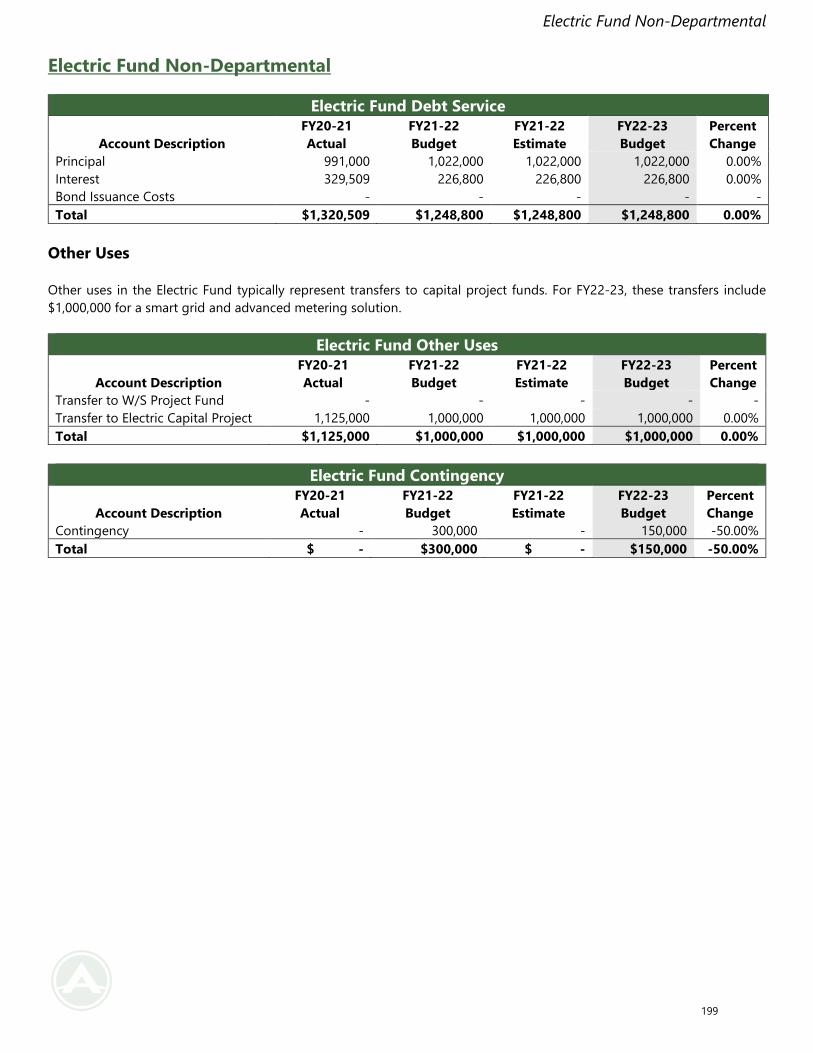
Electric Fund Non-Departmental
Electric Fund Non-Departmental
Electric Fund Debt Service
Account Description
FY20-21
Actual
FY21-22
Budget
FY21-22
Estimate
FY22-23
Budget
Percent
Change
Principal 991,000 1,022,000 1,022,000 1,022,000 0.00%
Interest 329,509 226,800 226,800 226,800 0.00%
Bond Issuance Costs - - - - -
Total $1,320,509 $1,248,800 $1,248,800 $1,248,800 0.00%
Other Uses
Other uses in the Electric Fund typically represent transfers to capital project funds. For FY22-23, these transfers include
$1,000,000 for a smart grid and advanced metering solution.
Electric Fund Other Uses
Account Description
FY20-21
Actual
FY21-22
Budget
FY21-22
Estimate
FY22-23
Budget
Percent
Change
Transfer to W/S Project Fund - - - - -
Transfer to Electric Capital Project 1,125,000 1,000,000 1,000,000 1,000,000 0.00%
Total $1,125,000 $1,000,000 $1,000,000 $1,000,000 0.00%
Electric Fund Contingency
Account Description
FY20-21
Actual
FY21-22
Budget
FY21-22
Estimate
FY22-23
Budget
Percent
Change
Contingency - 300,000 - 150,000 -50.00%
Total $ - $300,000 $ - $150,000 -50.00%
199
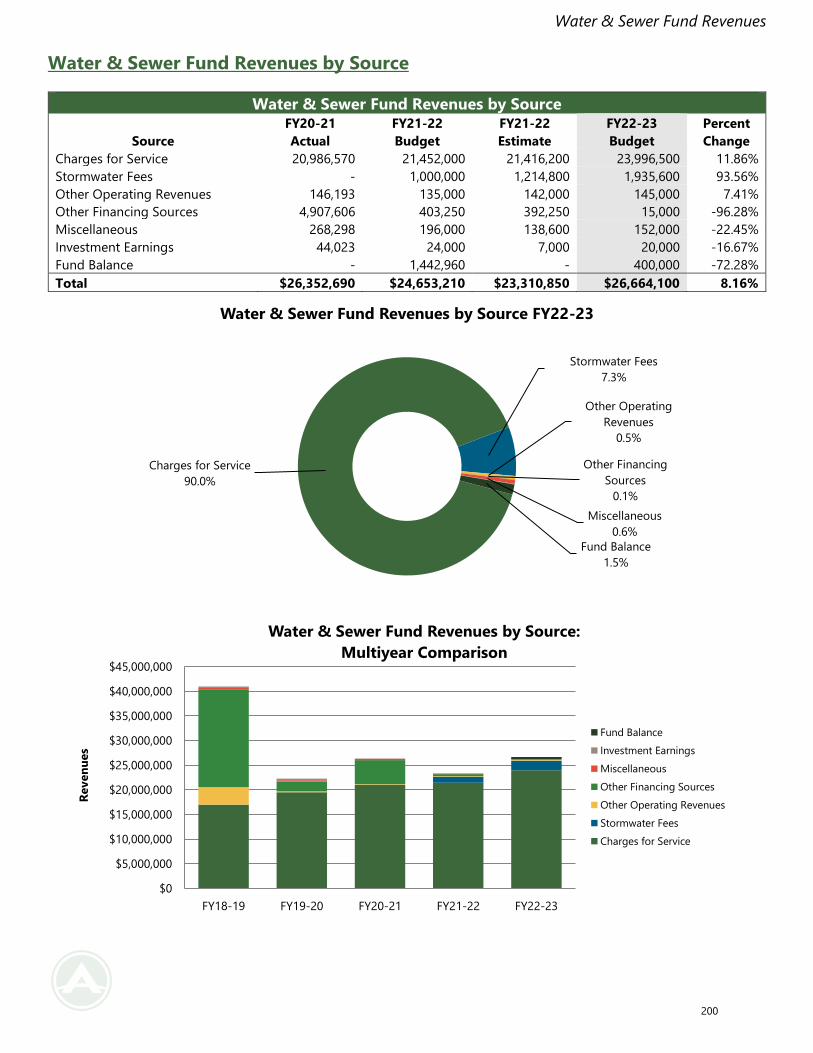
Water & Sewer Fund Revenues
Water & Sewer Fund Revenues by Source
Water & Sewer Fund Revenues by Source
Source
FY20-21
Actual
FY21-22
Budget
FY21-22
Estimate
FY22-23
Budget
Percent
Change
Charges for Service 20,986,570 21,452,000 21,416,200 23,996,500 11.86%
Stormwater Fees - 1,000,000 1,214,800 1,935,600 93.56%
Other Operating Revenues 146,193 135,000 142,000 145,000 7.41%
Other Financing Sources 4,907,606 403,250 392,250 15,000 -96.28%
Miscellaneous 268,298 196,000 138,600 152,000 -22.45%
Investment Earnings 44,023 24,000 7,000 20,000 -16.67%
Fund Balance - 1,442,960 - 400,000 -72.28%
Total $26,352,690 $24,653,210 $23,310,850 $26,664,100 8.16%
Charges for Service
90.0%
Stormwater Fees
7.3%
Other Operating
Revenues
0.5%
Other Financing
Sources
0.1%
Miscellaneous
0.6%
Fund Balance
1.5%
Water & Sewer Fund Revenues by Source FY22-23
$0
$5,000,000
$10,000,000
$15,000,000
$20,000,000
$25,000,000
$30,000,000
$35,000,000
$40,000,000
$45,000,000
FY18-19 FY19-20 FY20-21 FY21-22 FY22-23
Reven
ues
Water & Sewer Fund Revenues by Source:
Multiyear Comparison
Fund Balance
Investment Earnings
Miscellaneous
Other Financing Sources
Other Operating Revenues
Stormwater Fees
Charges for Service
200
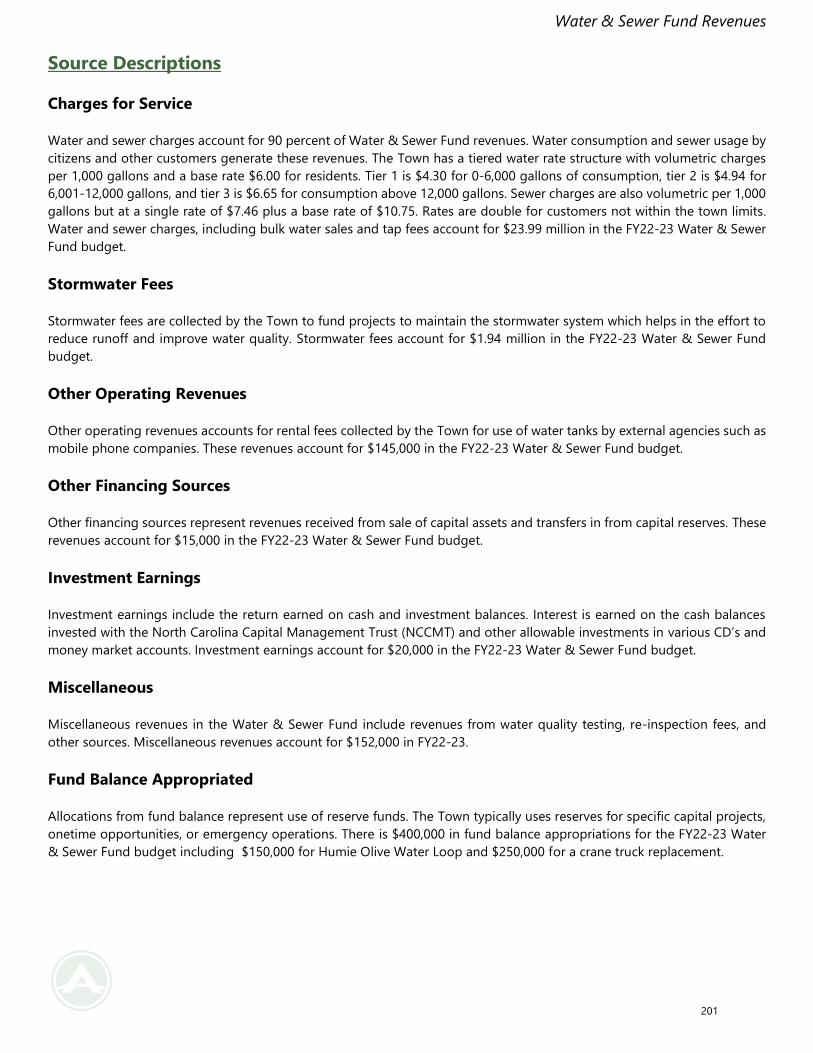
Water & Sewer Fund Revenues
Source Descriptions
Charges for Service
Water and sewer charges account for 90 percent of Water & Sewer Fund revenues. Water consumption and sewer usage by
citizens and other customers generate these revenues. The Town has a tiered water rate structure with volumetric charges
per 1,000 gallons and a base rate $6.00 for residents. Tier 1 is $4.30 for 0-6,000 gallons of consumption, tier 2 is $4.94 for
6,001-12,000 gallons, and tier 3 is $6.65 for consumption above 12,000 gallons. Sewer charges are also volumetric per 1,000
gallons but at a single rate of $7.46 plus a base rate of $10.75. Rates are double for customers not within the town limits.
Water and sewer charges, including bulk water sales and tap fees account for $23.99 million in the FY22-23 Water & Sewer
Fund budget.
Stormwater Fees
Stormwater fees are collected by the Town to fund projects to maintain the stormwater system which helps in the effort to
reduce runoff and improve water quality. Stormwater fees account for $1.94 million in the FY22-23 Water & Sewer Fund
budget.
Other Operating Revenues
Other operating revenues accounts for rental fees collected by the Town for use of water tanks by external agencies such as
mobile phone companies. These revenues account for $145,000 in the FY22-23 Water & Sewer Fund budget.
Other Financing Sources
Other financing sources represent revenues received from sale of capital assets and transfers in from capital reserves. These
revenues account for $15,000 in the FY22-23 Water & Sewer Fund budget.
Investment Earnings
Investment earnings include the return earned on cash and investment balances. Interest is earned on the cash balances
invested with the North Carolina Capital Management Trust (NCCMT) and other allowable investments in various CD’s and
money market accounts. Investment earnings account for $20,000 in the FY22-23 Water & Sewer Fund budget.
Miscellaneous
Miscellaneous revenues in the Water & Sewer Fund include revenues from water quality testing, re-inspection fees, and
other sources. Miscellaneous revenues account for $152,000 in FY22-23.
Fund Balance Appropriated
Allocations from fund balance represent use of reserve funds. The Town typically uses reserves for specific capital projects,
onetime opportunities, or emergency operations. There is $400,000 in fund balance appropriations for the FY22-23 Water
& Sewer Fund budget including $150,000 for Humie Olive Water Loop and $250,000 for a crane truck replacement.
201
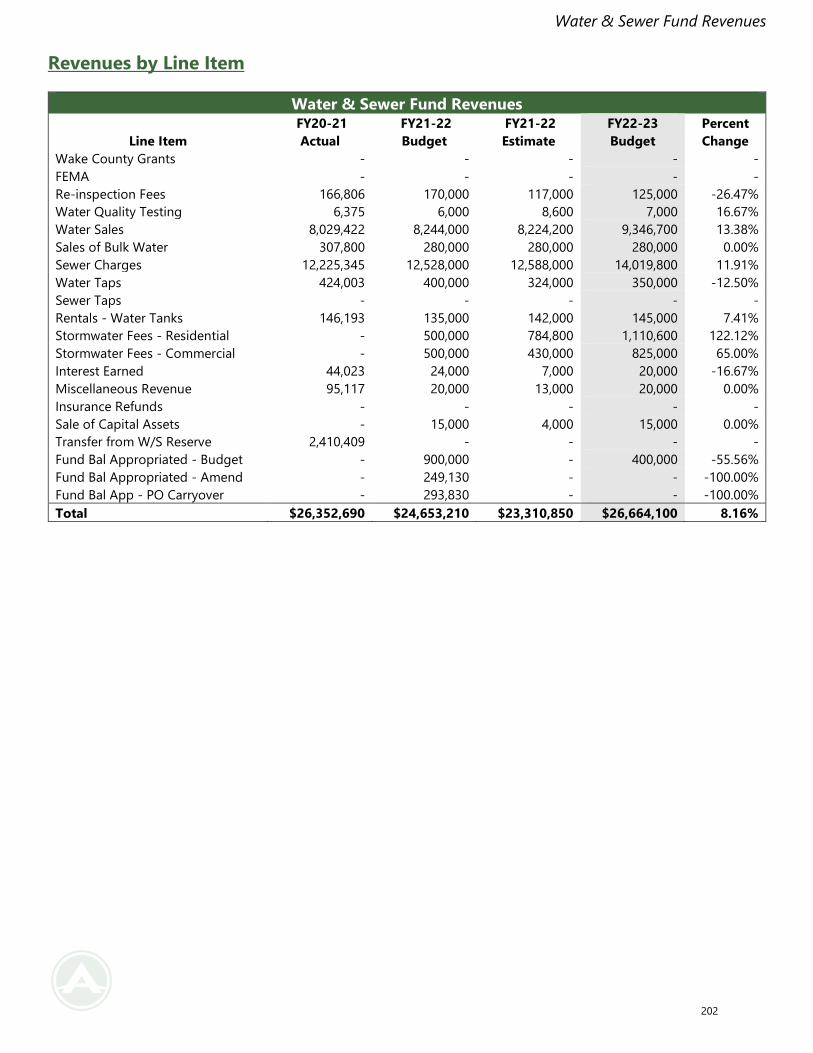
Water & Sewer Fund Revenues
Revenues by Line Item
Water & Sewer Fund Revenues
Line Item
FY20-21
Actual
FY21-22
Budget
FY21-22
Estimate
FY22-23
Budget
Percent
Change
Wake County Grants - - - - -
FEMA - - - - -
Re-inspection Fees 166,806 170,000 117,000 125,000 -26.47%
Water Quality Testing 6,375 6,000 8,600 7,000 16.67%
Water Sales 8,029,422 8,244,000 8,224,200 9,346,700 13.38%
Sales of Bulk Water 307,800 280,000 280,000 280,000 0.00%
Sewer Charges 12,225,345 12,528,000 12,588,000 14,019,800 11.91%
Water Taps 424,003 400,000 324,000 350,000 -12.50%
Sewer Taps - - - - -
Rentals - Water Tanks 146,193 135,000 142,000 145,000 7.41%
Stormwater Fees - Residential - 500,000 784,800 1,110,600 122.12%
Stormwater Fees - Commercial - 500,000 430,000 825,000 65.00%
Interest Earned 44,023 24,000 7,000 20,000 -16.67%
Miscellaneous Revenue 95,117 20,000 13,000 20,000 0.00%
Insurance Refunds - - - - -
Sale of Capital Assets - 15,000 4,000 15,000 0.00%
Transfer from W/S Reserve 2,410,409 - - - -
Fund Bal Appropriated - Budget - 900,000 - 400,000 -55.56%
Fund Bal Appropriated - Amend - 249,130 - - -100.00%
Fund Bal App - PO Carryover - 293,830 - - -100.00%
Total $26,352,690 $24,653,210 $23,310,850 $26,664,100 8.16%
202
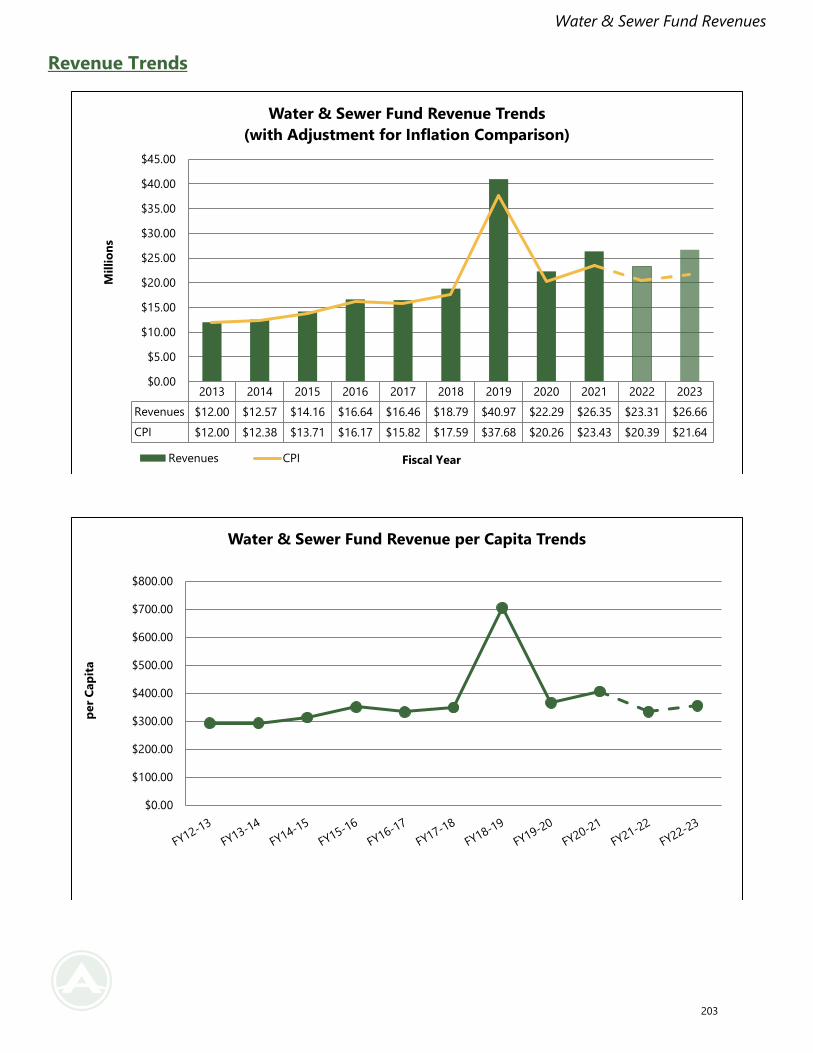
Water & Sewer Fund Revenues
Revenue Trends
2013 2014 2015 2016 2017 2018 2019 2020 2021 2022 2023
Revenues $12.00 $12.57 $14.16 $16.64 $16.46 $18.79 $40.97 $22.29 $26.35 $23.31 $26.66
CPI $12.00 $12.38 $13.71 $16.17 $15.82 $17.59 $37.68 $20.26 $23.43 $20.39 $21.64
$0.00
$5.00
$10.00
$15.00
$20.00
$25.00
$30.00
$35.00
$40.00
$45.00
Mil
lio
ns
Fiscal Year
Water & Sewer Fund Revenue Trends
(with Adjustment for Inflation Comparison)
Revenues CPI
$0.00
$100.00
$200.00
$300.00
$400.00
$500.00
$600.00
$700.00
$800.00
per
Cap
ita
Water & Sewer Fund Revenue per Capita Trends
203
Water & Sewer Fund Expenditures
Water & Sewer Fund Expenditures by Type
Water & Sewer Fund Expenditures by Type
Type
FY20-21
Actual
FY21-22
Budget
FY21-22
Estimate
FY22-23
Budget
Percent
Change
Personnel 6,834,655 7,153,880 6,603,200 9,269,700 29.58%
Operating 3,305,540 5,344,697 4,760,350 6,313,100 18.12%
Purchase for Resale 4,043,601 4,235,000 4,174,000 4,600,000 8.62%
Capital 5,543,969 4,198,533 3,977,008 2,728,900 -35.00%
Debt Service 4,268,690 3,721,100 3,721,100 3,752,400 0.84%
Total $23,996,455 $24,653,210 $23,235,658 $26,664,100 8.16%
Personnel
34.8%
Operating
23.7%
Purchase for Resale
17.3%
Capital
10.2%
Debt Service
14.1%
Water & Sewer Fund Expenditures by Type
FY22-23
204
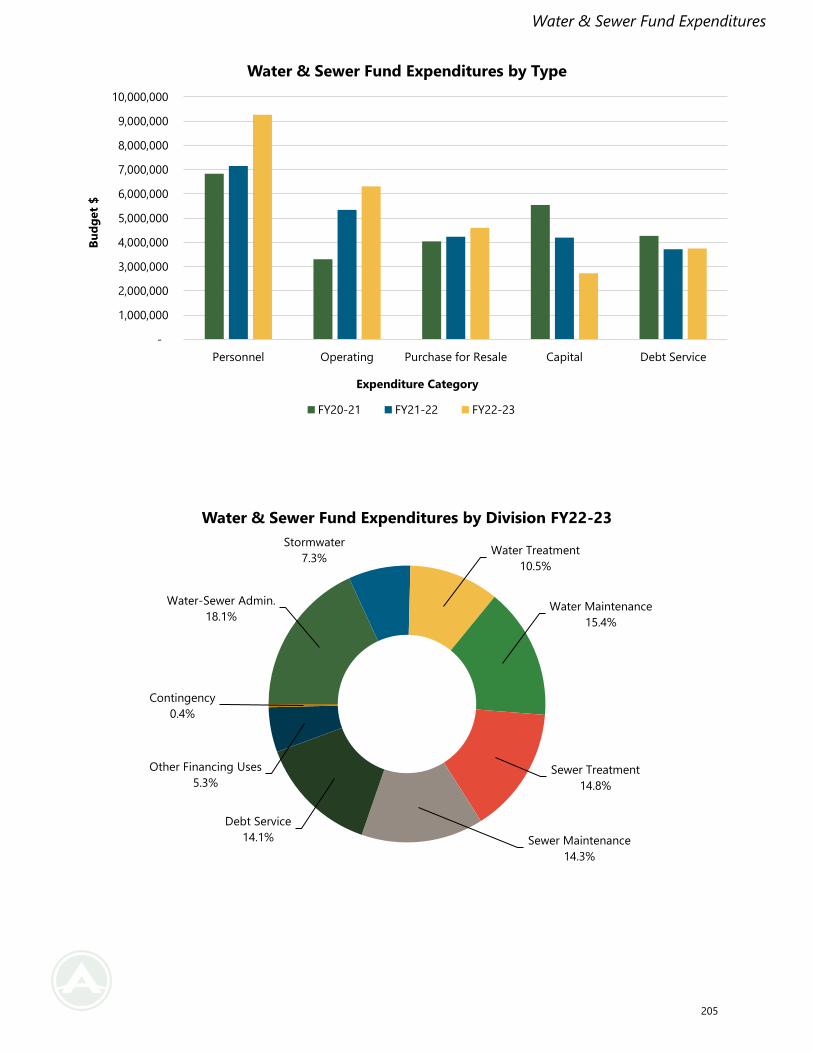
Water & Sewer Fund Expenditures
-
1,000,000
2,000,000
3,000,000
4,000,000
5,000,000
6,000,000
7,000,000
8,000,000
9,000,000
10,000,000
Personnel Operating Purchase for Resale Capital Debt Service
Bu
dg
et
$
Expenditure Category
Water & Sewer Fund Expenditures by Type
FY20-21 FY21-22 FY22-23
Water-Sewer Admin.
18.1%
Stormwater
7.3%Water Treatment
10.5%
Water Maintenance
15.4%
Sewer Treatment
14.8%
Sewer Maintenance
14.3%
Debt Service
14.1%
Other Financing Uses
5.3%
Contingency
0.4%
Water & Sewer Fund Expenditures by Division FY22-23
205
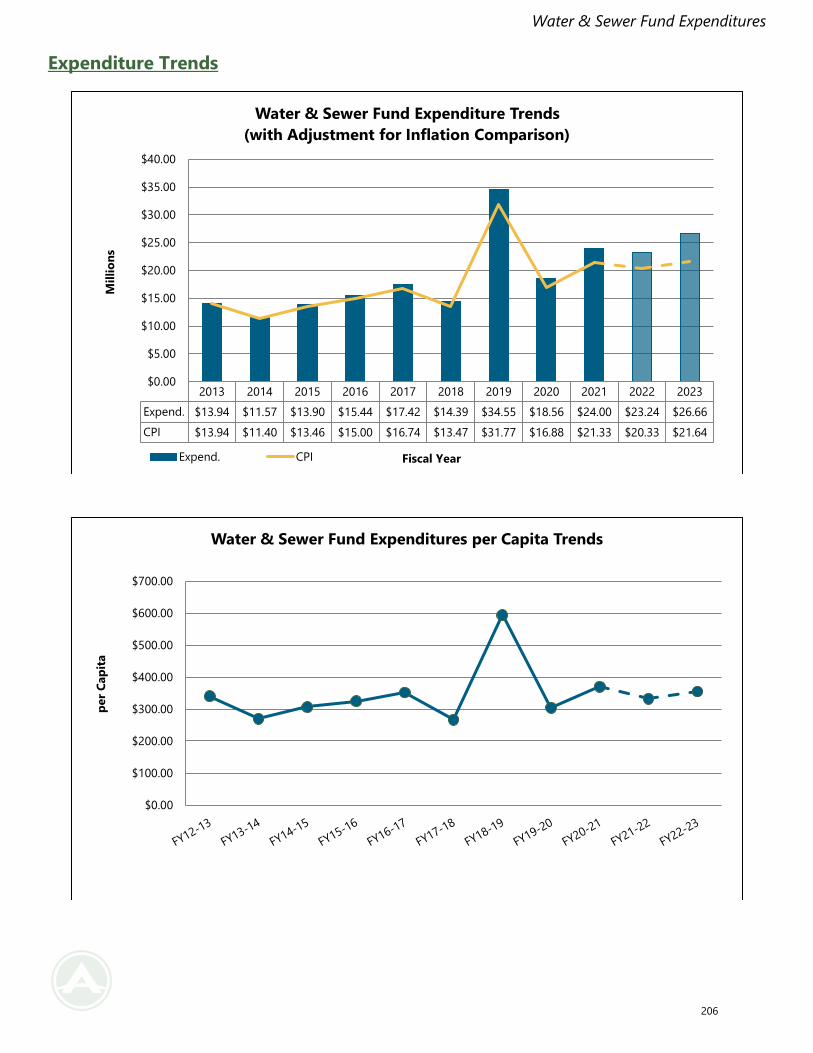
Water & Sewer Fund Expenditures
Expenditure Trends
2013 2014 2015 2016 2017 2018 2019 2020 2021 2022 2023
Expend. $13.94 $11.57 $13.90 $15.44 $17.42 $14.39 $34.55 $18.56 $24.00 $23.24 $26.66
CPI $13.94 $11.40 $13.46 $15.00 $16.74 $13.47 $31.77 $16.88 $21.33 $20.33 $21.64
$0.00
$5.00
$10.00
$15.00
$20.00
$25.00
$30.00
$35.00
$40.00
Mil
lio
ns
Fiscal Year
Water & Sewer Fund Expenditure Trends
(with Adjustment for Inflation Comparison)
Expend. CPI
$0.00
$100.00
$200.00
$300.00
$400.00
$500.00
$600.00
$700.00
per
Cap
ita
Water & Sewer Fund Expenditures per Capita Trends
206
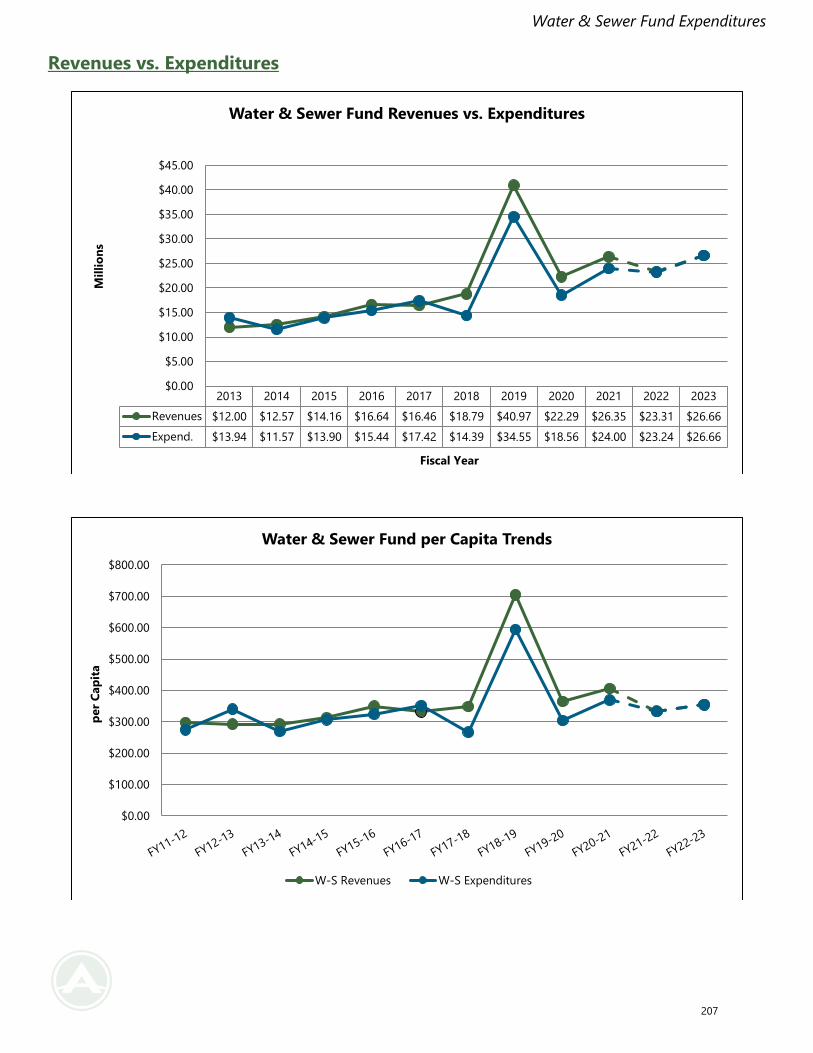
Water & Sewer Fund Expenditures
Revenues vs. Expenditures
2013 2014 2015 2016 2017 2018 2019 2020 2021 2022 2023
Revenues $12.00 $12.57 $14.16 $16.64 $16.46 $18.79 $40.97 $22.29 $26.35 $23.31 $26.66
Expend. $13.94 $11.57 $13.90 $15.44 $17.42 $14.39 $34.55 $18.56 $24.00 $23.24 $26.66
$0.00
$5.00
$10.00
$15.00
$20.00
$25.00
$30.00
$35.00
$40.00
$45.00
Mil
lio
ns
Fiscal Year
Water & Sewer Fund Revenues vs. Expenditures
$0.00
$100.00
$200.00
$300.00
$400.00
$500.00
$600.00
$700.00
$800.00
per
Cap
ita
Water & Sewer Fund per Capita Trends
W-S Revenues W-S Expenditures
207
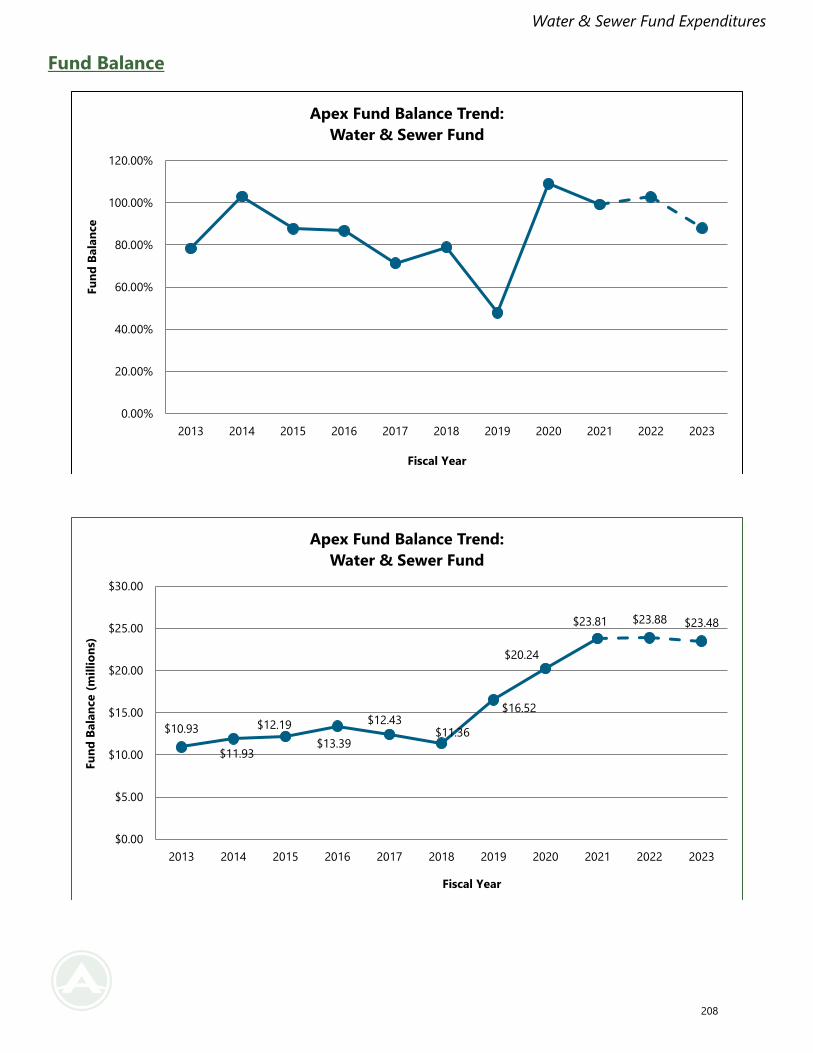
Water & Sewer Fund Expenditures
Fund Balance
0.00%
20.00%
40.00%
60.00%
80.00%
100.00%
120.00%
2013 2014 2015 2016 2017 2018 2019 2020 2021 2022 2023
Fu
nd
Bala
nce
Fiscal Year
Apex Fund Balance Trend:
Water & Sewer Fund
$10.93
$11.93
$12.19
$13.39
$12.43$11.36
$16.52
$20.24
$23.81 $23.88 $23.48
$0.00
$5.00
$10.00
$15.00
$20.00
$25.00
$30.00
2013 2014 2015 2016 2017 2018 2019 2020 2021 2022 2023
Fu
nd
Bala
nce (
mil
lio
ns)
Fiscal Year
Apex Fund Balance Trend:
Water & Sewer Fund
208
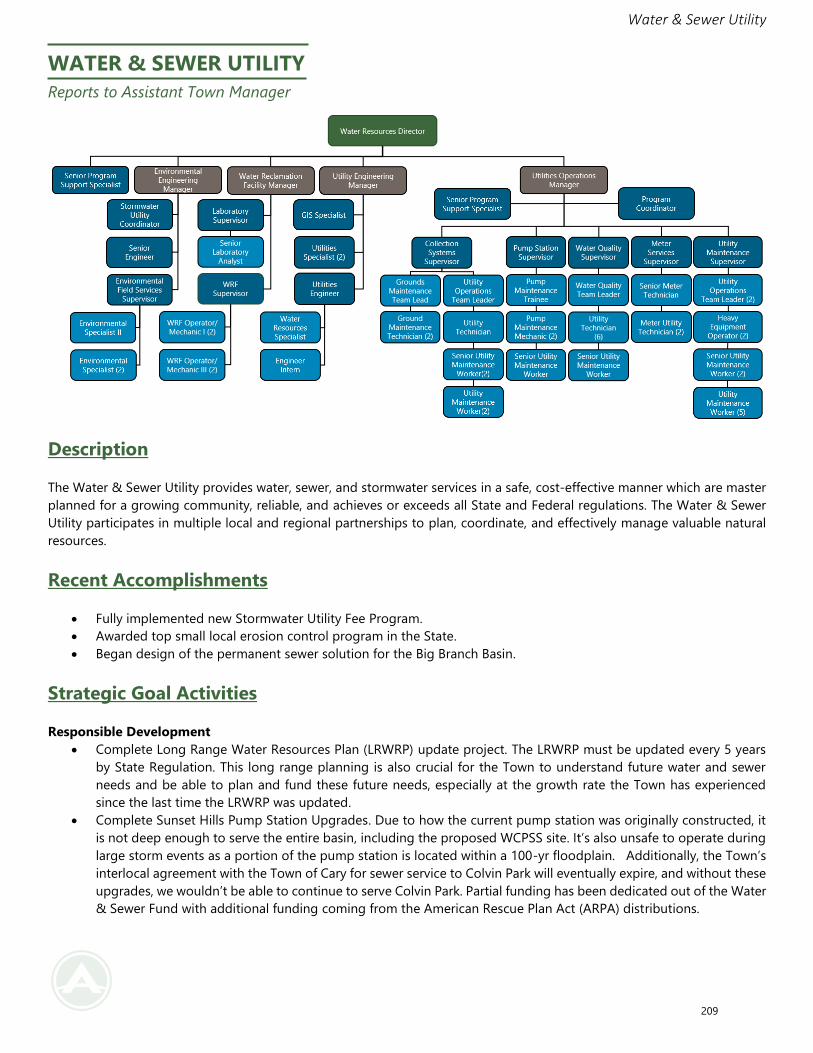
Water & Sewer Utility
WATER & SEWER UTILITY
Reports to Assistant Town Manager
Description
The Water & Sewer Utility provides water, sewer, and stormwater services in a safe, cost-effective manner which are master
planned for a growing community, reliable, and achieves or exceeds all State and Federal regulations. The Water & Sewer
Utility participates in multiple local and regional partnerships to plan, coordinate, and effectively manage valuable natural
resources.
Recent Accomplishments
• Fully implemented new Stormwater Utility Fee Program.
• Awarded top small local erosion control program in the State.
• Began design of the permanent sewer solution for the Big Branch Basin.
Strategic Goal Activities
Responsible Development
• Complete Long Range Water Resources Plan (LRWRP) update project. The LRWRP must be updated every 5 years
by State Regulation. This long range planning is also crucial for the Town to understand future water and sewer
needs and be able to plan and fund these future needs, especially at the growth rate the Town has experienced
since the last time the LRWRP was updated.
• Complete Sunset Hills Pump Station Upgrades. Due to how the current pump station was originally constructed, it
is not deep enough to serve the entire basin, including the proposed WCPSS site. It’s also unsafe to operate during
large storm events as a portion of the pump station is located within a 100-yr floodplain. Additionally, the Town’s
interlocal agreement with the Town of Cary for sewer service to Colvin Park will eventually expire, and without these
upgrades, we wouldn’t be able to continue to serve Colvin Park. Partial funding has been dedicated out of the Water
& Sewer Fund with additional funding coming from the American Rescue Plan Act (ARPA) distributions.
209

Water & Sewer Utility
Environmental Leadership
• Complete Apex Nature Park Stream Restoration Grant. The Town has already spent millions of dollars on sewer line
relocations due to stream encroachment. This stream has the potential to create the same problem and with the
disc golf course utilizing this area, it was a great opportunity to educate the public about streams, riparian buffers,
and floodplains, while also creating safe passage ways for retrieving discs that will not degrade the environment or
create water quality issues. Apex successfully applied for grant funding through North Carolina Land and Water
Fund.
210
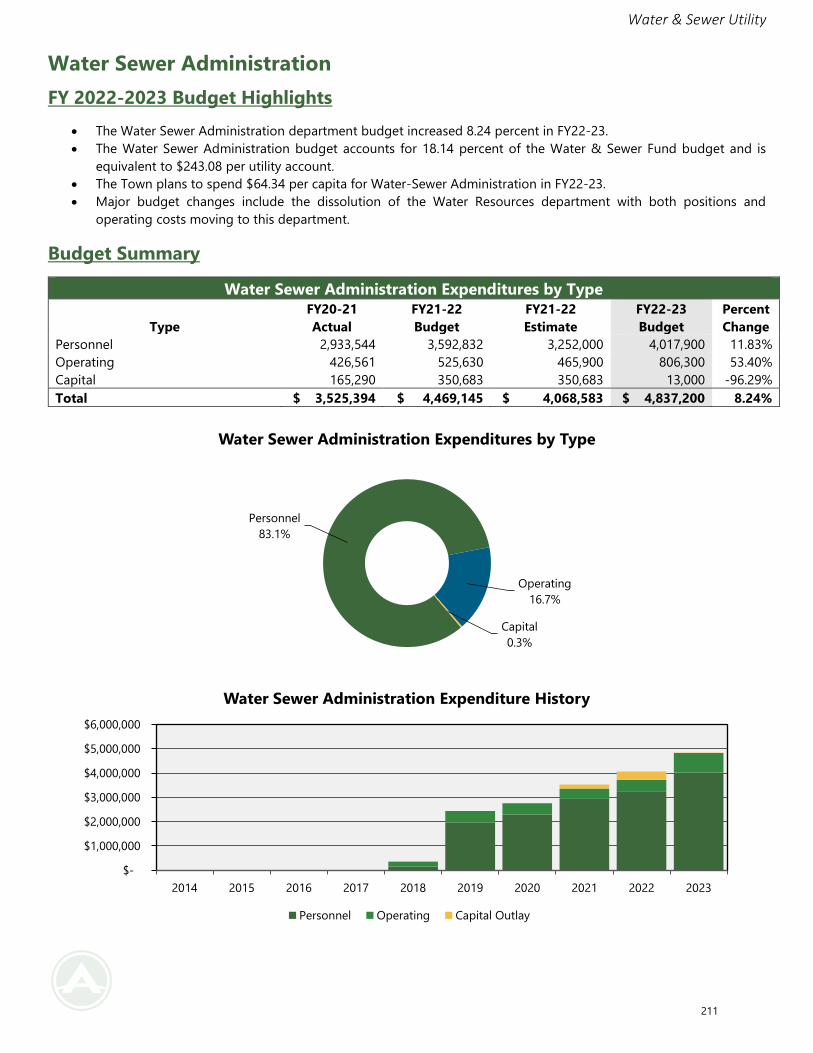
Water & Sewer Utility
Water Sewer Administration
FY 2022-2023 Budget Highlights
• The Water Sewer Administration department budget increased 8.24 percent in FY22-23.
• The Water Sewer Administration budget accounts for 18.14 percent of the Water & Sewer Fund budget and is
equivalent to $243.08 per utility account.
• The Town plans to spend $64.34 per capita for Water-Sewer Administration in FY22-23.
• Major budget changes include the dissolution of the Water Resources department with both positions and
operating costs moving to this department.
Budget Summary
Water Sewer Administration Expenditures by Type
Type
FY20-21
Actual
FY21-22
Budget
FY21-22
Estimate
FY22-23
Budget
Percent
Change
Personnel 2,933,544 3,592,832 3,252,000 4,017,900 11.83%
Operating 426,561 525,630 465,900 806,300 53.40%
Capital 165,290 350,683 350,683 13,000 -96.29%
Total $ 3,525,394 $ 4,469,145 $ 4,068,583 $ 4,837,200 8.24%
Personnel
83.1%
Operating
16.7%
Capital
0.3%
Water Sewer Administration Expenditures by Type
$-
$1,000,000
$2,000,000
$3,000,000
$4,000,000
$5,000,000
$6,000,000
2014 2015 2016 2017 2018 2019 2020 2021 2022 2023
Water Sewer Administration Expenditure History
Personnel Operating Capital Outlay
211
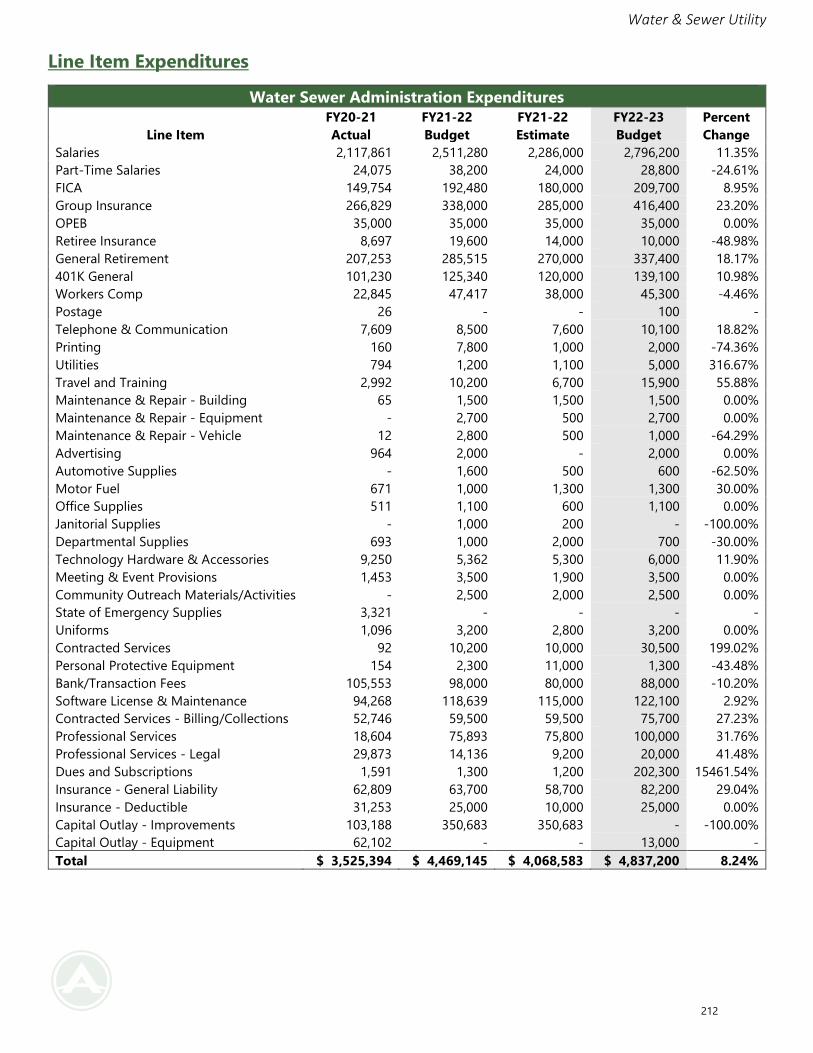
Water & Sewer Utility
Line Item Expenditures
Water Sewer Administration Expenditures
Line Item
FY20-21
Actual
FY21-22
Budget
FY21-22
Estimate
FY22-23
Budget
Percent
Change
Salaries 2,117,861 2,511,280 2,286,000 2,796,200 11.35%
Part-Time Salaries 24,075 38,200 24,000 28,800 -24.61%
FICA 149,754 192,480 180,000 209,700 8.95%
Group Insurance 266,829 338,000 285,000 416,400 23.20%
OPEB 35,000 35,000 35,000 35,000 0.00%
Retiree Insurance 8,697 19,600 14,000 10,000 -48.98%
General Retirement 207,253 285,515 270,000 337,400 18.17%
401K General 101,230 125,340 120,000 139,100 10.98%
Workers Comp 22,845 47,417 38,000 45,300 -4.46%
Postage 26 - - 100 -
Telephone & Communication 7,609 8,500 7,600 10,100 18.82%
Printing 160 7,800 1,000 2,000 -74.36%
Utilities 794 1,200 1,100 5,000 316.67%
Travel and Training 2,992 10,200 6,700 15,900 55.88%
Maintenance & Repair - Building 65 1,500 1,500 1,500 0.00%
Maintenance & Repair - Equipment - 2,700 500 2,700 0.00%
Maintenance & Repair - Vehicle 12 2,800 500 1,000 -64.29%
Advertising 964 2,000 - 2,000 0.00%
Automotive Supplies - 1,600 500 600 -62.50%
Motor Fuel 671 1,000 1,300 1,300 30.00%
Office Supplies 511 1,100 600 1,100 0.00%
Janitorial Supplies - 1,000 200 - -100.00%
Departmental Supplies 693 1,000 2,000 700 -30.00%
Technology Hardware & Accessories 9,250 5,362 5,300 6,000 11.90%
Meeting & Event Provisions 1,453 3,500 1,900 3,500 0.00%
Community Outreach Materials/Activities - 2,500 2,000 2,500 0.00%
State of Emergency Supplies 3,321 - - - -
Uniforms 1,096 3,200 2,800 3,200 0.00%
Contracted Services 92 10,200 10,000 30,500 199.02%
Personal Protective Equipment 154 2,300 11,000 1,300 -43.48%
Bank/Transaction Fees 105,553 98,000 80,000 88,000 -10.20%
Software License & Maintenance 94,268 118,639 115,000 122,100 2.92%
Contracted Services - Billing/Collections 52,746 59,500 59,500 75,700 27.23%
Professional Services 18,604 75,893 75,800 100,000 31.76%
Professional Services - Legal 29,873 14,136 9,200 20,000 41.48%
Dues and Subscriptions 1,591 1,300 1,200 202,300 15461.54%
Insurance - General Liability 62,809 63,700 58,700 82,200 29.04%
Insurance - Deductible 31,253 25,000 10,000 25,000 0.00%
Capital Outlay - Improvements 103,188 350,683 350,683 - -100.00%
Capital Outlay - Equipment 62,102 - - 13,000 -
Total $ 3,525,394 $ 4,469,145 $ 4,068,583 $ 4,837,200 8.24%
212
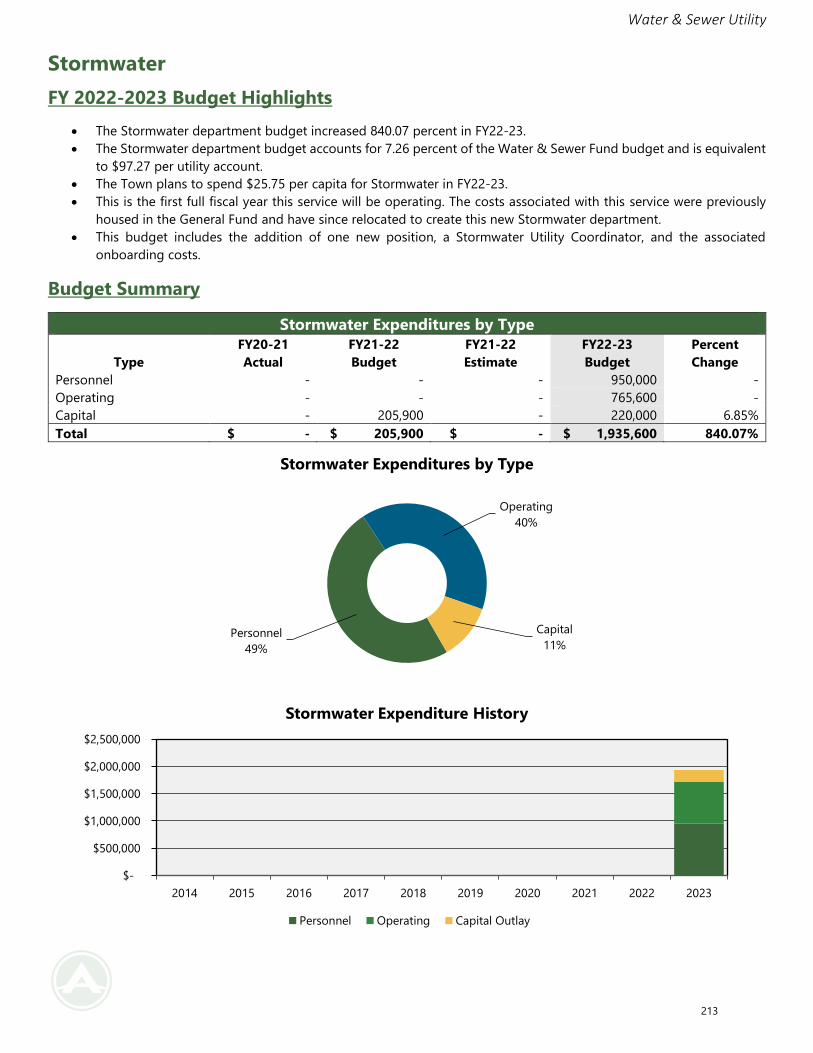
Water & Sewer Utility
Stormwater
FY 2022-2023 Budget Highlights
• The Stormwater department budget increased 840.07 percent in FY22-23.
• The Stormwater department budget accounts for 7.26 percent of the Water & Sewer Fund budget and is equivalent
to $97.27 per utility account.
• The Town plans to spend $25.75 per capita for Stormwater in FY22-23.
• This is the first full fiscal year this service will be operating. The costs associated with this service were previously
housed in the General Fund and have since relocated to create this new Stormwater department.
• This budget includes the addition of one new position, a Stormwater Utility Coordinator, and the associated
onboarding costs.
Budget Summary
Stormwater Expenditures by Type
Type
FY20-21
Actual
FY21-22
Budget
FY21-22
Estimate
FY22-23
Budget
Percent
Change
Personnel - - - 950,000 -
Operating - - - 765,600 -
Capital - 205,900 - 220,000 6.85%
Total $ - $ 205,900 $ - $ 1,935,600 840.07%
Personnel
49%
Operating
40%
Capital
11%
Stormwater Expenditures by Type
$-
$500,000
$1,000,000
$1,500,000
$2,000,000
$2,500,000
2014 2015 2016 2017 2018 2019 2020 2021 2022 2023
Stormwater Expenditure History
Personnel Operating Capital Outlay
213
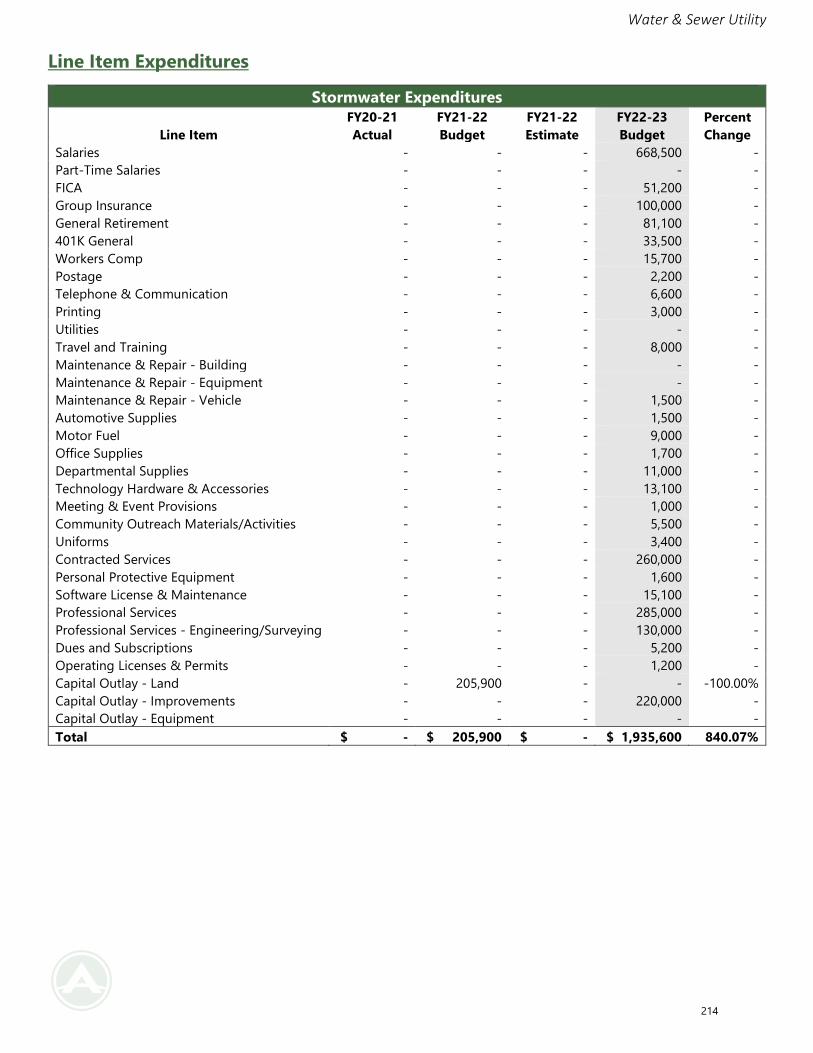
Water & Sewer Utility
Line Item Expenditures
Stormwater Expenditures
Line Item
FY20-21
Actual
FY21-22
Budget
FY21-22
Estimate
FY22-23
Budget
Percent
Change
Salaries - - - 668,500 -
Part-Time Salaries - - - - -
FICA - - - 51,200 -
Group Insurance - - - 100,000 -
General Retirement - - - 81,100 -
401K General - - - 33,500 -
Workers Comp - - - 15,700 -
Postage - - - 2,200 -
Telephone & Communication - - - 6,600 -
Printing - - - 3,000 -
Utilities - - - - -
Travel and Training - - - 8,000 -
Maintenance & Repair - Building - - - - -
Maintenance & Repair - Equipment - - - - -
Maintenance & Repair - Vehicle - - - 1,500 -
Automotive Supplies - - - 1,500 -
Motor Fuel - - - 9,000 -
Office Supplies - - - 1,700 -
Departmental Supplies - - - 11,000 -
Technology Hardware & Accessories - - - 13,100 -
Meeting & Event Provisions - - - 1,000 -
Community Outreach Materials/Activities - - - 5,500 -
Uniforms - - - 3,400 -
Contracted Services - - - 260,000 -
Personal Protective Equipment - - - 1,600 -
Software License & Maintenance - - - 15,100 -
Professional Services - - - 285,000 -
Professional Services - Engineering/Surveying - - - 130,000 -
Dues and Subscriptions - - - 5,200 -
Operating Licenses & Permits - - - 1,200 -
Capital Outlay - Land - 205,900 - - -100.00%
Capital Outlay - Improvements - - - 220,000 -
Capital Outlay - Equipment - - - - -
Total $ - $ 205,900 $ - $ 1,935,600 840.07%
214
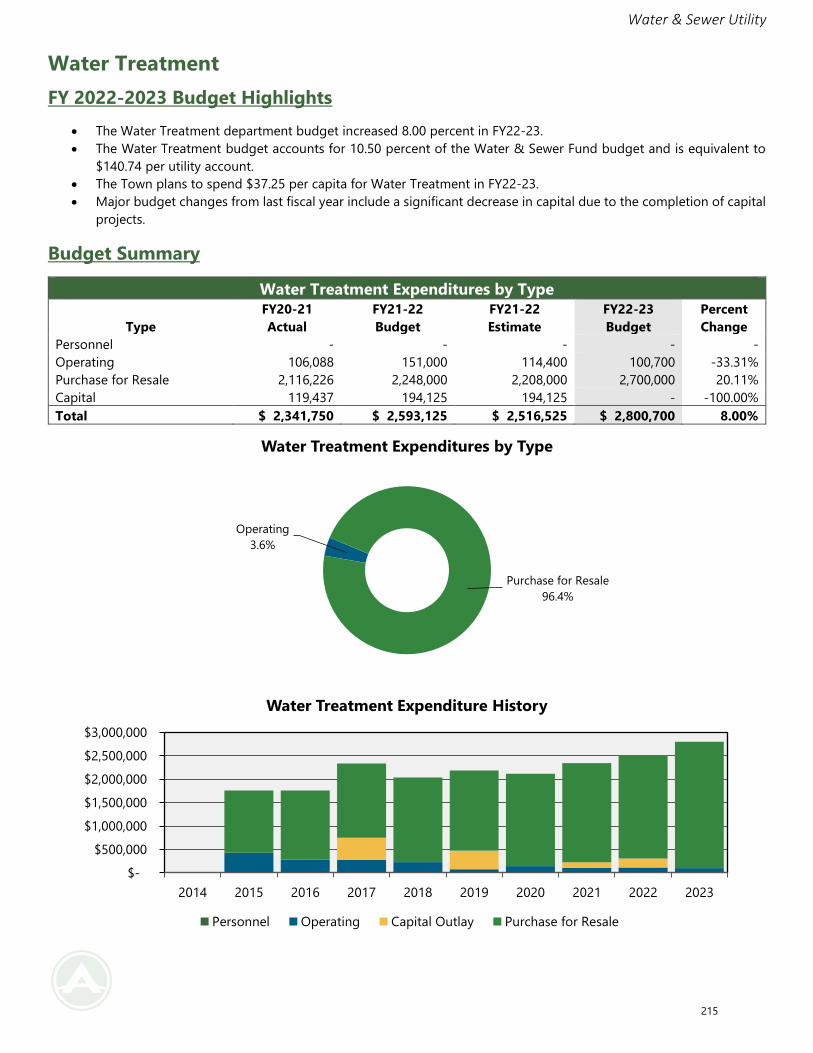
Water & Sewer Utility
Water Treatment
FY 2022-2023 Budget Highlights
• The Water Treatment department budget increased 8.00 percent in FY22-23.
• The Water Treatment budget accounts for 10.50 percent of the Water & Sewer Fund budget and is equivalent to
$140.74 per utility account.
• The Town plans to spend $37.25 per capita for Water Treatment in FY22-23.
• Major budget changes from last fiscal year include a significant decrease in capital due to the completion of capital
projects.
Budget Summary
Water Treatment Expenditures by Type
Type
FY20-21
Actual
FY21-22
Budget
FY21-22
Estimate
FY22-23
Budget
Percent
Change
Personnel - - - - -
Operating 106,088 151,000 114,400 100,700 -33.31%
Purchase for Resale 2,116,226 2,248,000 2,208,000 2,700,000 20.11%
Capital 119,437 194,125 194,125 - -100.00%
Total $ 2,341,750 $ 2,593,125 $ 2,516,525 $ 2,800,700 8.00%
Operating
3.6%
Purchase for Resale
96.4%
Water Treatment Expenditures by Type
$-
$500,000
$1,000,000
$1,500,000
$2,000,000
$2,500,000
$3,000,000
2014 2015 2016 2017 2018 2019 2020 2021 2022 2023
Water Treatment Expenditure History
Personnel Operating Capital Outlay Purchase for Resale
215
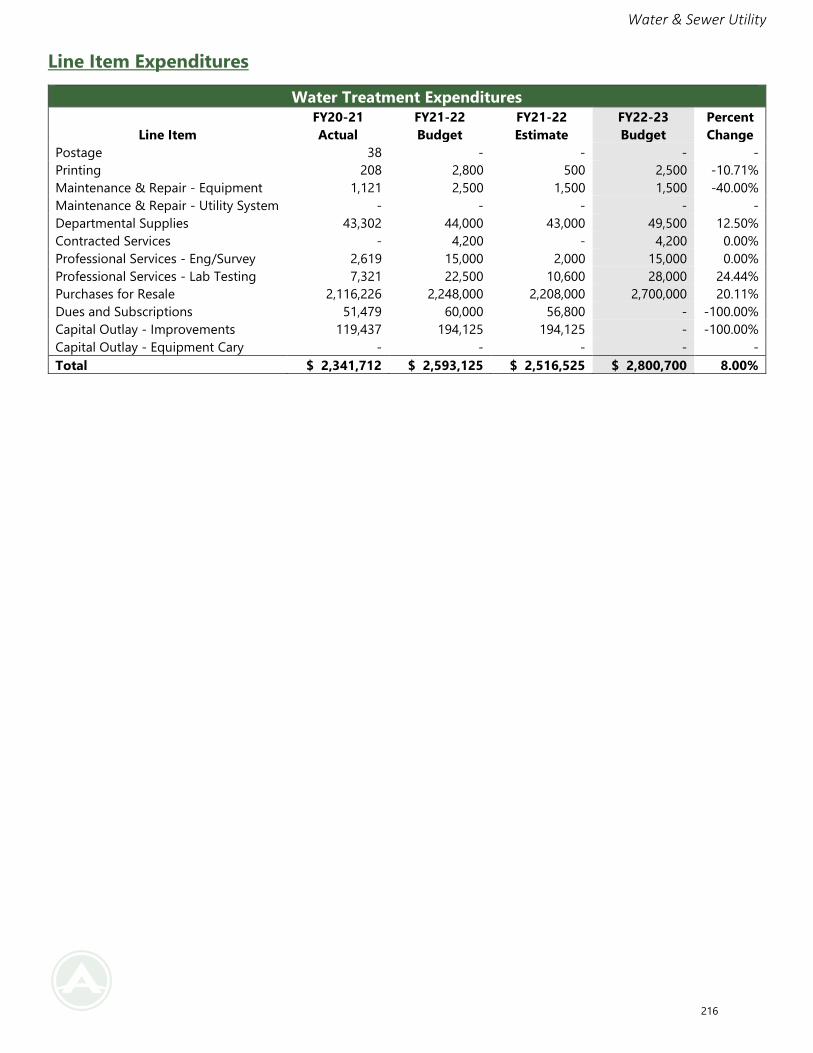
Water & Sewer Utility
Line Item Expenditures
Water Treatment Expenditures
Line Item
FY20-21
Actual
FY21-22
Budget
FY21-22
Estimate
FY22-23
Budget
Percent
Change
Postage 38 - - - -
Printing 208 2,800 500 2,500 -10.71%
Maintenance & Repair - Equipment 1,121 2,500 1,500 1,500 -40.00%
Maintenance & Repair - Utility System - - - - -
Departmental Supplies 43,302 44,000 43,000 49,500 12.50%
Contracted Services - 4,200 - 4,200 0.00%
Professional Services - Eng/Survey 2,619 15,000 2,000 15,000 0.00%
Professional Services - Lab Testing 7,321 22,500 10,600 28,000 24.44%
Purchases for Resale 2,116,226 2,248,000 2,208,000 2,700,000 20.11%
Dues and Subscriptions 51,479 60,000 56,800 - -100.00%
Capital Outlay - Improvements 119,437 194,125 194,125 - -100.00%
Capital Outlay - Equipment Cary - - - - -
Total $ 2,341,712 $ 2,593,125 $ 2,516,525 $ 2,800,700 8.00%
216
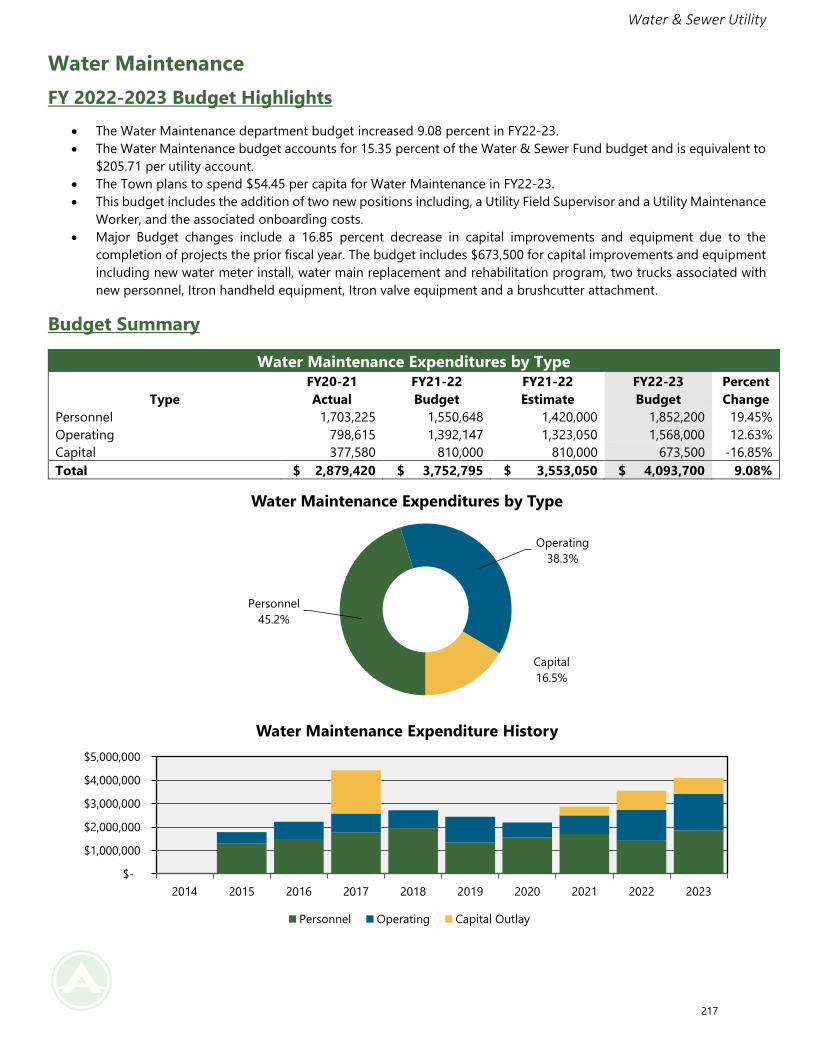
Water & Sewer Utility
Water Maintenance
FY 2022-2023 Budget Highlights
• The Water Maintenance department budget increased 9.08 percent in FY22-23.
• The Water Maintenance budget accounts for 15.35 percent of the Water & Sewer Fund budget and is equivalent to
$205.71 per utility account.
• The Town plans to spend $54.45 per capita for Water Maintenance in FY22-23.
• This budget includes the addition of two new positions including, a Utility Field Supervisor and a Utility Maintenance
Worker, and the associated onboarding costs.
• Major Budget changes include a 16.85 percent decrease in capital improvements and equipment due to the
completion of projects the prior fiscal year. The budget includes $673,500 for capital improvements and equipment
including new water meter install, water main replacement and rehabilitation program, two trucks associated with
new personnel, Itron handheld equipment, Itron valve equipment and a brushcutter attachment.
Budget Summary
Water Maintenance Expenditures by Type
Type
FY20-21
Actual
FY21-22
Budget
FY21-22
Estimate
FY22-23
Budget
Percent
Change
Personnel 1,703,225 1,550,648 1,420,000 1,852,200 19.45%
Operating 798,615 1,392,147 1,323,050 1,568,000 12.63%
Capital 377,580 810,000 810,000 673,500 -16.85%
Total $ 2,879,420 $ 3,752,795 $ 3,553,050 $ 4,093,700 9.08%
Personnel
45.2%
Operating
38.3%
Capital
16.5%
Water Maintenance Expenditures by Type
$-
$1,000,000
$2,000,000
$3,000,000
$4,000,000
$5,000,000
2014 2015 2016 2017 2018 2019 2020 2021 2022 2023
Water Maintenance Expenditure History
Personnel Operating Capital Outlay
217
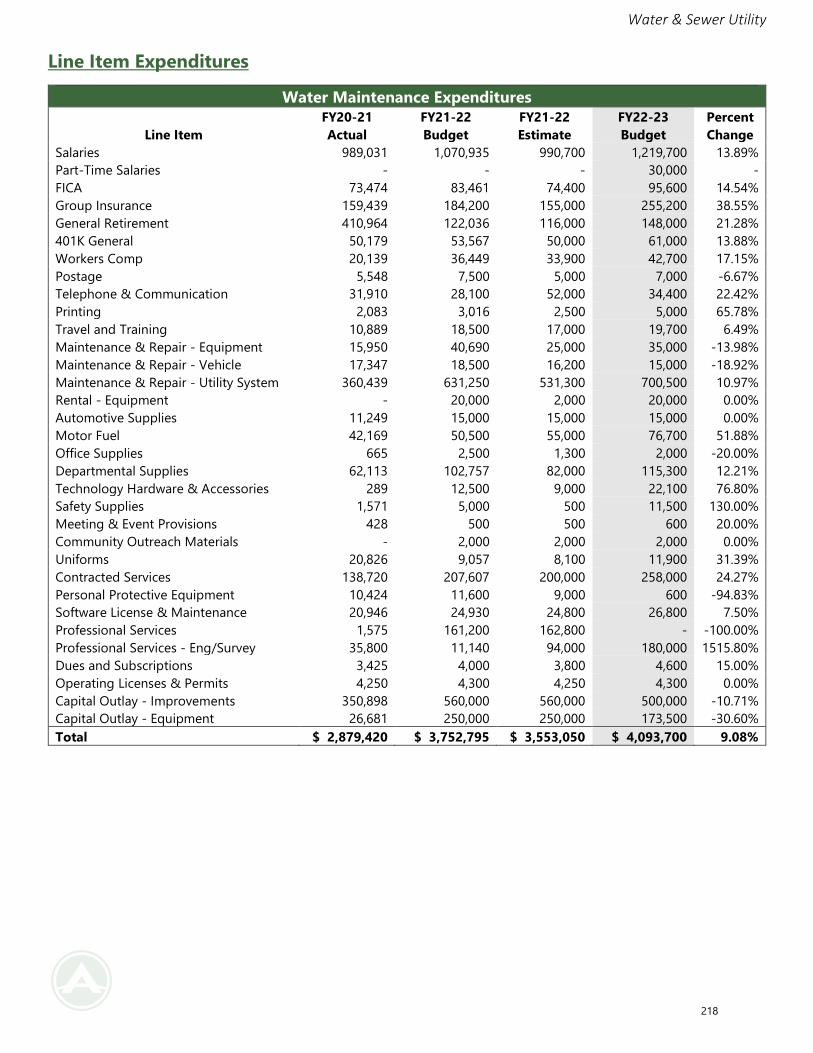
Water & Sewer Utility
Line Item Expenditures
Water Maintenance Expenditures
Line Item
FY20-21
Actual
FY21-22
Budget
FY21-22
Estimate
FY22-23
Budget
Percent
Change
Salaries 989,031 1,070,935 990,700 1,219,700 13.89%
Part-Time Salaries - - - 30,000 -
FICA 73,474 83,461 74,400 95,600 14.54%
Group Insurance 159,439 184,200 155,000 255,200 38.55%
General Retirement 410,964 122,036 116,000 148,000 21.28%
401K General 50,179 53,567 50,000 61,000 13.88%
Workers Comp 20,139 36,449 33,900 42,700 17.15%
Postage 5,548 7,500 5,000 7,000 -6.67%
Telephone & Communication 31,910 28,100 52,000 34,400 22.42%
Printing 2,083 3,016 2,500 5,000 65.78%
Travel and Training 10,889 18,500 17,000 19,700 6.49%
Maintenance & Repair - Equipment 15,950 40,690 25,000 35,000 -13.98%
Maintenance & Repair - Vehicle 17,347 18,500 16,200 15,000 -18.92%
Maintenance & Repair - Utility System 360,439 631,250 531,300 700,500 10.97%
Rental - Equipment - 20,000 2,000 20,000 0.00%
Automotive Supplies 11,249 15,000 15,000 15,000 0.00%
Motor Fuel 42,169 50,500 55,000 76,700 51.88%
Office Supplies 665 2,500 1,300 2,000 -20.00%
Departmental Supplies 62,113 102,757 82,000 115,300 12.21%
Technology Hardware & Accessories 289 12,500 9,000 22,100 76.80%
Safety Supplies 1,571 5,000 500 11,500 130.00%
Meeting & Event Provisions 428 500 500 600 20.00%
Community Outreach Materials - 2,000 2,000 2,000 0.00%
Uniforms 20,826 9,057 8,100 11,900 31.39%
Contracted Services 138,720 207,607 200,000 258,000 24.27%
Personal Protective Equipment 10,424 11,600 9,000 600 -94.83%
Software License & Maintenance 20,946 24,930 24,800 26,800 7.50%
Professional Services 1,575 161,200 162,800 - -100.00%
Professional Services - Eng/Survey 35,800 11,140 94,000 180,000 1515.80%
Dues and Subscriptions 3,425 4,000 3,800 4,600 15.00%
Operating Licenses & Permits 4,250 4,300 4,250 4,300 0.00%
Capital Outlay - Improvements 350,898 560,000 560,000 500,000 -10.71%
Capital Outlay - Equipment 26,681 250,000 250,000 173,500 -30.60%
Total $ 2,879,420 $ 3,752,795 $ 3,553,050 $ 4,093,700 9.08%
218
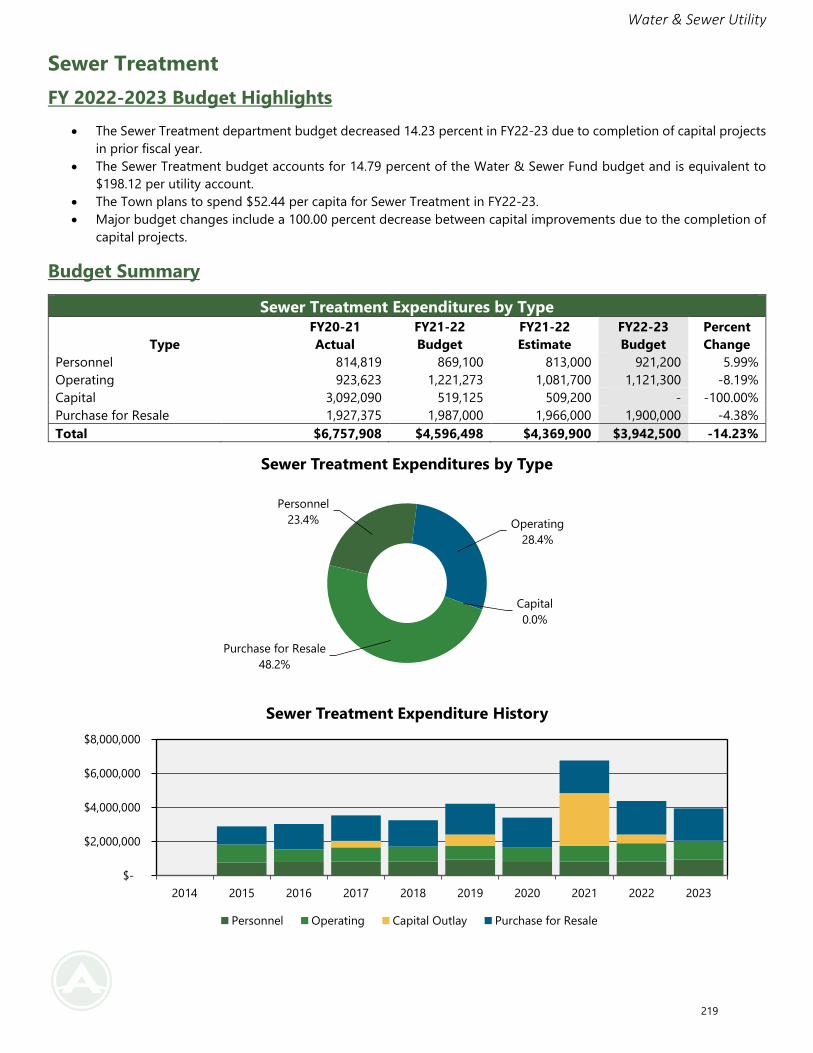
Water & Sewer Utility
Sewer Treatment
FY 2022-2023 Budget Highlights
• The Sewer Treatment department budget decreased 14.23 percent in FY22-23 due to completion of capital projects
in prior fiscal year.
• The Sewer Treatment budget accounts for 14.79 percent of the Water & Sewer Fund budget and is equivalent to
$198.12 per utility account.
• The Town plans to spend $52.44 per capita for Sewer Treatment in FY22-23.
• Major budget changes include a 100.00 percent decrease between capital improvements due to the completion of
capital projects.
Budget Summary
Sewer Treatment Expenditures by Type
Type
FY20-21
Actual
FY21-22
Budget
FY21-22
Estimate
FY22-23
Budget
Percent
Change
Personnel 814,819 869,100 813,000 921,200 5.99%
Operating 923,623 1,221,273 1,081,700 1,121,300 -8.19%
Capital 3,092,090 519,125 509,200 - -100.00%
Purchase for Resale 1,927,375 1,987,000 1,966,000 1,900,000 -4.38%
Total $6,757,908 $4,596,498 $4,369,900 $3,942,500 -14.23%
Personnel
23.4% Operating
28.4%
Capital
0.0%
Purchase for Resale
48.2%
Sewer Treatment Expenditures by Type
$-
$2,000,000
$4,000,000
$6,000,000
$8,000,000
2014 2015 2016 2017 2018 2019 2020 2021 2022 2023
Sewer Treatment Expenditure History
Personnel Operating Capital Outlay Purchase for Resale
219
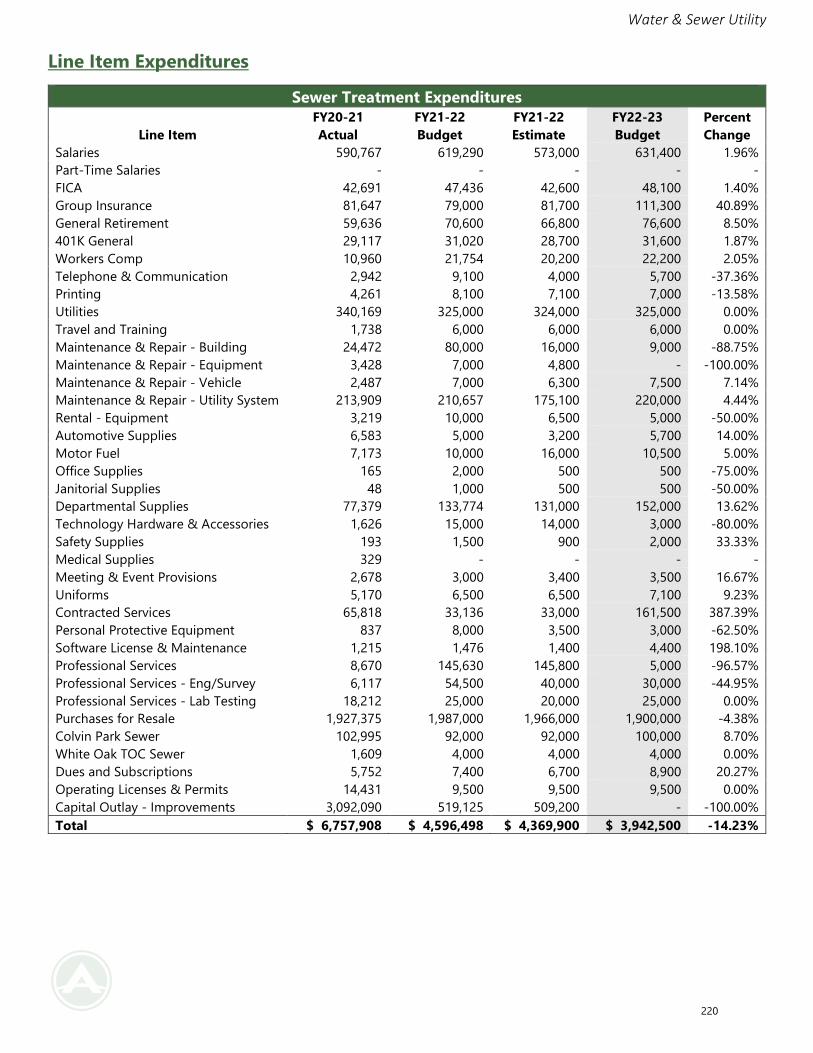
Water & Sewer Utility
Line Item Expenditures
Sewer Treatment Expenditures
Line Item
FY20-21
Actual
FY21-22
Budget
FY21-22
Estimate
FY22-23
Budget
Percent
Change
Salaries 590,767 619,290 573,000 631,400 1.96%
Part-Time Salaries - - - - -
FICA 42,691 47,436 42,600 48,100 1.40%
Group Insurance 81,647 79,000 81,700 111,300 40.89%
General Retirement 59,636 70,600 66,800 76,600 8.50%
401K General 29,117 31,020 28,700 31,600 1.87%
Workers Comp 10,960 21,754 20,200 22,200 2.05%
Telephone & Communication 2,942 9,100 4,000 5,700 -37.36%
Printing 4,261 8,100 7,100 7,000 -13.58%
Utilities 340,169 325,000 324,000 325,000 0.00%
Travel and Training 1,738 6,000 6,000 6,000 0.00%
Maintenance & Repair - Building 24,472 80,000 16,000 9,000 -88.75%
Maintenance & Repair - Equipment 3,428 7,000 4,800 - -100.00%
Maintenance & Repair - Vehicle 2,487 7,000 6,300 7,500 7.14%
Maintenance & Repair - Utility System 213,909 210,657 175,100 220,000 4.44%
Rental - Equipment 3,219 10,000 6,500 5,000 -50.00%
Automotive Supplies 6,583 5,000 3,200 5,700 14.00%
Motor Fuel 7,173 10,000 16,000 10,500 5.00%
Office Supplies 165 2,000 500 500 -75.00%
Janitorial Supplies 48 1,000 500 500 -50.00%
Departmental Supplies 77,379 133,774 131,000 152,000 13.62%
Technology Hardware & Accessories 1,626 15,000 14,000 3,000 -80.00%
Safety Supplies 193 1,500 900 2,000 33.33%
Medical Supplies 329 - - - -
Meeting & Event Provisions 2,678 3,000 3,400 3,500 16.67%
Uniforms 5,170 6,500 6,500 7,100 9.23%
Contracted Services 65,818 33,136 33,000 161,500 387.39%
Personal Protective Equipment 837 8,000 3,500 3,000 -62.50%
Software License & Maintenance 1,215 1,476 1,400 4,400 198.10%
Professional Services 8,670 145,630 145,800 5,000 -96.57%
Professional Services - Eng/Survey 6,117 54,500 40,000 30,000 -44.95%
Professional Services - Lab Testing 18,212 25,000 20,000 25,000 0.00%
Purchases for Resale 1,927,375 1,987,000 1,966,000 1,900,000 -4.38%
Colvin Park Sewer 102,995 92,000 92,000 100,000 8.70%
White Oak TOC Sewer 1,609 4,000 4,000 4,000 0.00%
Dues and Subscriptions 5,752 7,400 6,700 8,900 20.27%
Operating Licenses & Permits 14,431 9,500 9,500 9,500 0.00%
Capital Outlay - Improvements 3,092,090 519,125 509,200 - -100.00%
Total $ 6,757,908 $ 4,596,498 $ 4,369,900 $ 3,942,500 -14.23%
220
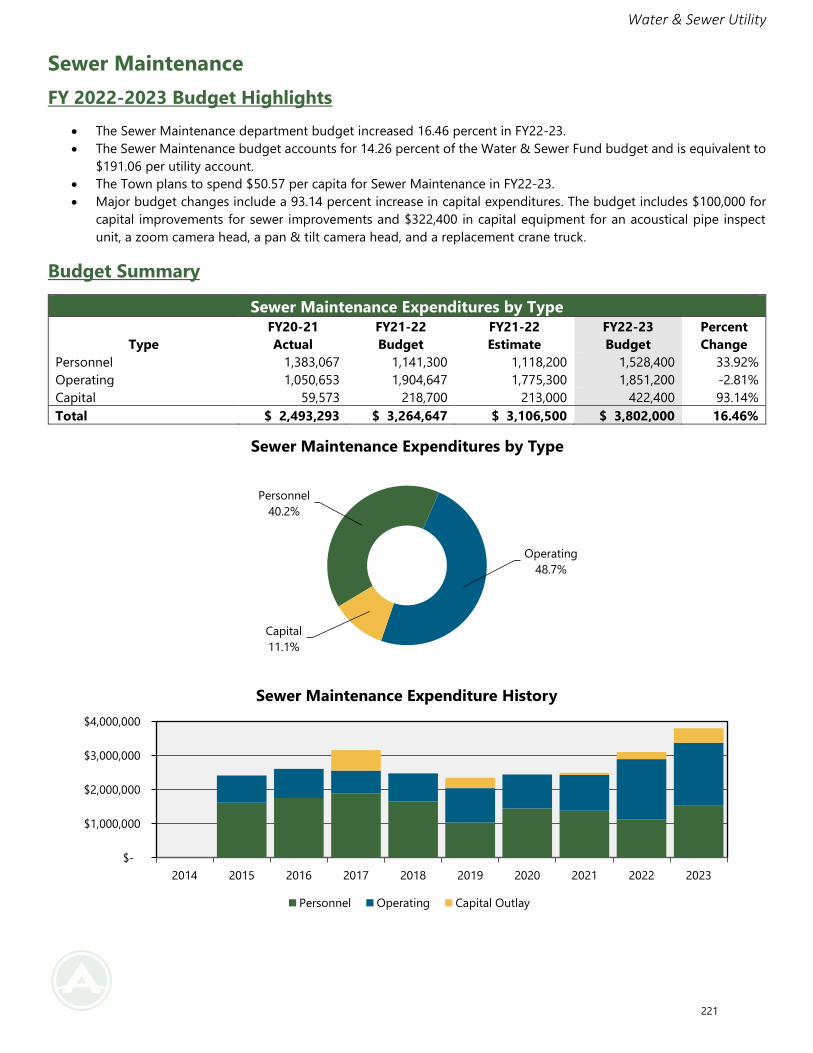
Water & Sewer Utility
Sewer Maintenance
FY 2022-2023 Budget Highlights
• The Sewer Maintenance department budget increased 16.46 percent in FY22-23.
• The Sewer Maintenance budget accounts for 14.26 percent of the Water & Sewer Fund budget and is equivalent to
$191.06 per utility account.
• The Town plans to spend $50.57 per capita for Sewer Maintenance in FY22-23.
• Major budget changes include a 93.14 percent increase in capital expenditures. The budget includes $100,000 for
capital improvements for sewer improvements and $322,400 in capital equipment for an acoustical pipe inspect
unit, a zoom camera head, a pan & tilt camera head, and a replacement crane truck.
Budget Summary
Sewer Maintenance Expenditures by Type
Type
FY20-21
Actual
FY21-22
Budget
FY21-22
Estimate
FY22-23
Budget
Percent
Change
Personnel 1,383,067 1,141,300 1,118,200 1,528,400 33.92%
Operating 1,050,653 1,904,647 1,775,300 1,851,200 -2.81%
Capital 59,573 218,700 213,000 422,400 93.14%
Total $ 2,493,293 $ 3,264,647 $ 3,106,500 $ 3,802,000 16.46%
Personnel
40.2%
Operating
48.7%
Capital
11.1%
Sewer Maintenance Expenditures by Type
$-
$1,000,000
$2,000,000
$3,000,000
$4,000,000
2014 2015 2016 2017 2018 2019 2020 2021 2022 2023
Sewer Maintenance Expenditure History
Personnel Operating Capital Outlay
221
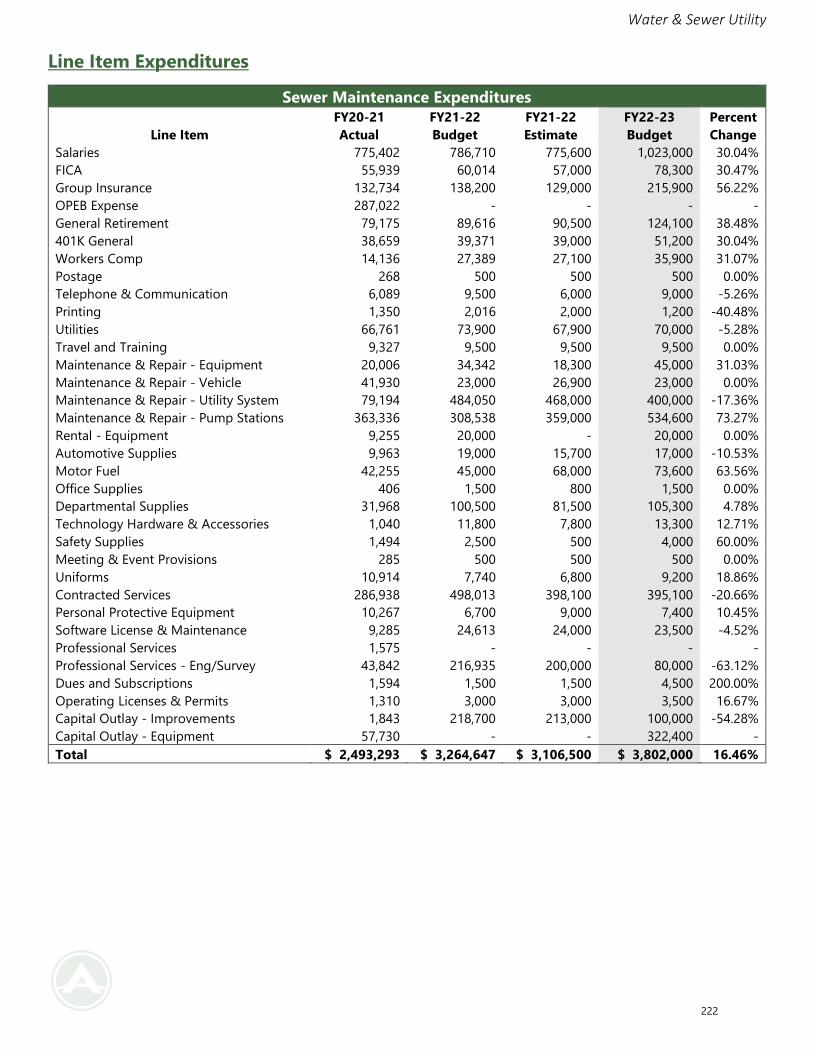
Water & Sewer Utility
Line Item Expenditures
Sewer Maintenance Expenditures
Line Item
FY20-21
Actual
FY21-22
Budget
FY21-22
Estimate
FY22-23
Budget
Percent
Change
Salaries 775,402 786,710 775,600 1,023,000 30.04%
FICA 55,939 60,014 57,000 78,300 30.47%
Group Insurance 132,734 138,200 129,000 215,900 56.22%
OPEB Expense 287,022 - - - -
General Retirement 79,175 89,616 90,500 124,100 38.48%
401K General 38,659 39,371 39,000 51,200 30.04%
Workers Comp 14,136 27,389 27,100 35,900 31.07%
Postage 268 500 500 500 0.00%
Telephone & Communication 6,089 9,500 6,000 9,000 -5.26%
Printing 1,350 2,016 2,000 1,200 -40.48%
Utilities 66,761 73,900 67,900 70,000 -5.28%
Travel and Training 9,327 9,500 9,500 9,500 0.00%
Maintenance & Repair - Equipment 20,006 34,342 18,300 45,000 31.03%
Maintenance & Repair - Vehicle 41,930 23,000 26,900 23,000 0.00%
Maintenance & Repair - Utility System 79,194 484,050 468,000 400,000 -17.36%
Maintenance & Repair - Pump Stations 363,336 308,538 359,000 534,600 73.27%
Rental - Equipment 9,255 20,000 - 20,000 0.00%
Automotive Supplies 9,963 19,000 15,700 17,000 -10.53%
Motor Fuel 42,255 45,000 68,000 73,600 63.56%
Office Supplies 406 1,500 800 1,500 0.00%
Departmental Supplies 31,968 100,500 81,500 105,300 4.78%
Technology Hardware & Accessories 1,040 11,800 7,800 13,300 12.71%
Safety Supplies 1,494 2,500 500 4,000 60.00%
Meeting & Event Provisions 285 500 500 500 0.00%
Uniforms 10,914 7,740 6,800 9,200 18.86%
Contracted Services 286,938 498,013 398,100 395,100 -20.66%
Personal Protective Equipment 10,267 6,700 9,000 7,400 10.45%
Software License & Maintenance 9,285 24,613 24,000 23,500 -4.52%
Professional Services 1,575 - - - -
Professional Services - Eng/Survey 43,842 216,935 200,000 80,000 -63.12%
Dues and Subscriptions 1,594 1,500 1,500 4,500 200.00%
Operating Licenses & Permits 1,310 3,000 3,000 3,500 16.67%
Capital Outlay - Improvements 1,843 218,700 213,000 100,000 -54.28%
Capital Outlay - Equipment 57,730 - - 322,400 -
Total $ 2,493,293 $ 3,264,647 $ 3,106,500 $ 3,802,000 16.46%
222
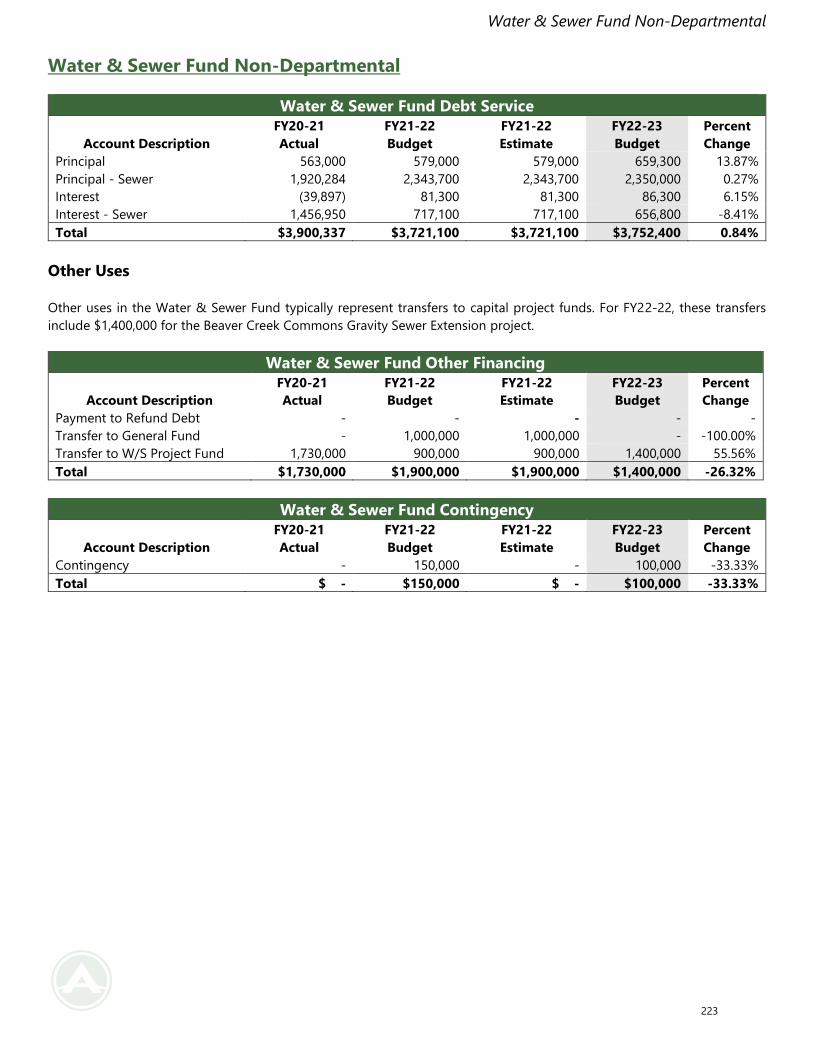
Water & Sewer Fund Non-Departmental
Water & Sewer Fund Non-Departmental
Water & Sewer Fund Debt Service
Account Description
FY20-21
Actual
FY21-22
Budget
FY21-22
Estimate
FY22-23
Budget
Percent
Change
Principal 563,000 579,000 579,000 659,300 13.87%
Principal - Sewer 1,920,284 2,343,700 2,343,700 2,350,000 0.27%
Interest (39,897) 81,300 81,300 86,300 6.15%
Interest - Sewer 1,456,950 717,100 717,100 656,800 -8.41%
Total $3,900,337 $3,721,100 $3,721,100 $3,752,400 0.84%
Other Uses
Other uses in the Water & Sewer Fund typically represent transfers to capital project funds. For FY22-22, these transfers
include $1,400,000 for the Beaver Creek Commons Gravity Sewer Extension project.
Water & Sewer Fund Other Financing
Account Description
FY20-21
Actual
FY21-22
Budget
FY21-22
Estimate
FY22-23
Budget
Percent
Change
Payment to Refund Debt - - - - -
Transfer to General Fund - 1,000,000 1,000,000 - -100.00%
Transfer to W/S Project Fund 1,730,000 900,000 900,000 1,400,000 55.56%
Total $1,730,000 $1,900,000 $1,900,000 $1,400,000 -26.32%
Water & Sewer Fund Contingency
Account Description
FY20-21
Actual
FY21-22
Budget
FY21-22
Estimate
FY22-23
Budget
Percent
Change
Contingency - 150,000 - 100,000 -33.33%
Total $ - $150,000 $ - $100,000 -33.33%
223
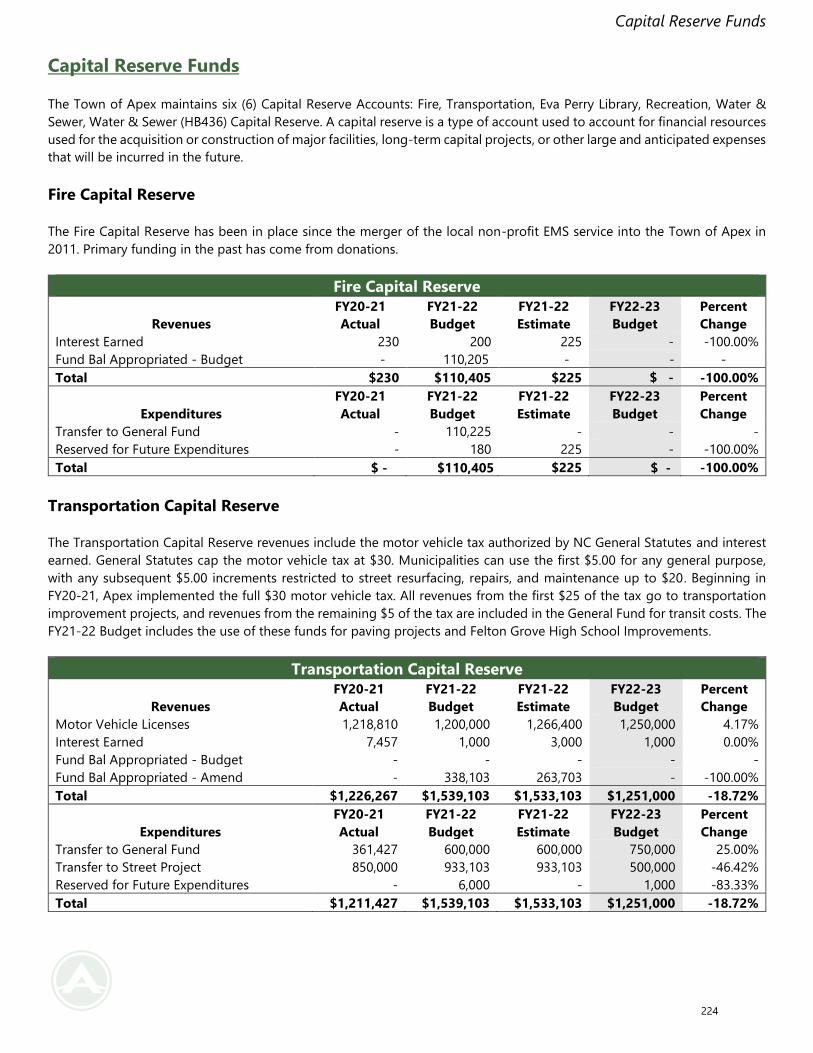
Capital Reserve Funds
Capital Reserve Funds
The Town of Apex maintains six (6) Capital Reserve Accounts: Fire, Transportation, Eva Perry Library, Recreation, Water &
Sewer, Water & Sewer (HB436) Capital Reserve. A capital reserve is a type of account used to account for financial resources
used for the acquisition or construction of major facilities, long-term capital projects, or other large and anticipated expenses
that will be incurred in the future.
Fire Capital Reserve
The Fire Capital Reserve has been in place since the merger of the local non-profit EMS service into the Town of Apex in
2011. Primary funding in the past has come from donations.
Fire Capital Reserve
Revenues
FY20-21
Actual
FY21-22
Budget
FY21-22
Estimate
FY22-23
Budget
Percent
Change
Interest Earned 230 200 225 - -100.00%
Fund Bal Appropriated - Budget - 110,205 - - -
Total $230 $110,405 $225 $ - -100.00%
Expenditures
FY20-21
Actual
FY21-22
Budget
FY21-22
Estimate
FY22-23
Budget
Percent
Change
Transfer to General Fund - 110,225 - - -
Reserved for Future Expenditures - 180 225 - -100.00%
Total $ - $110,405 $225 $ - -100.00%
Transportation Capital Reserve
The Transportation Capital Reserve revenues include the motor vehicle tax authorized by NC General Statutes and interest
earned. General Statutes cap the motor vehicle tax at $30. Municipalities can use the first $5.00 for any general purpose,
with any subsequent $5.00 increments restricted to street resurfacing, repairs, and maintenance up to $20. Beginning in
FY20-21, Apex implemented the full $30 motor vehicle tax. All revenues from the first $25 of the tax go to transportation
improvement projects, and revenues from the remaining $5 of the tax are included in the General Fund for transit costs. The
FY21-22 Budget includes the use of these funds for paving projects and Felton Grove High School Improvements.
Transportation Capital Reserve
Revenues
FY20-21
Actual
FY21-22
Budget
FY21-22
Estimate
FY22-23
Budget
Percent
Change
Motor Vehicle Licenses 1,218,810 1,200,000 1,266,400 1,250,000 4.17%
Interest Earned 7,457 1,000 3,000 1,000 0.00%
Fund Bal Appropriated - Budget - - - - -
Fund Bal Appropriated - Amend - 338,103 263,703 - -100.00%
Total $1,226,267 $1,539,103 $1,533,103 $1,251,000 -18.72%
Expenditures
FY20-21
Actual
FY21-22
Budget
FY21-22
Estimate
FY22-23
Budget
Percent
Change
Transfer to General Fund 361,427 600,000 600,000 750,000 25.00%
Transfer to Street Project 850,000 933,103 933,103 500,000 -46.42%
Reserved for Future Expenditures - 6,000 - 1,000 -83.33%
Total $1,211,427 $1,539,103 $1,533,103 $1,251,000 -18.72%
224
Capital Reserve Funds
Eva Perry Library Fund
The Eva Perry Library Fund is a special revenue fund used to account for resources set aside for future maintenance and
projects at Eva Perry Library. This fund’s sources of revenue include interest earned and transfers from the General Fund.
The Town currently owns the Eva Perry Memorial Library located at 2100 Shepherds Vineyard Drive in Apex and by interlocal
agreement with Wake County, is responsible for all major repairs and renovations to the facility. Wake County is responsible
for routine maintenance, upkeep, and operation of the facility. The FY22-23 Budget includes the use of these funds to replace
the roof at the facility.
Eva Perry Library Fund
Revenues
FY20-21
Actual
FY21-22
Budget
FY21-22
Estimate
FY22-23
Budget
Percent
Change
Interest Earned 254 100 100 - -100.00%
Fund Bal Appropriated - Budget - 443,400 443,400 400,000 -9.79%
Total $254 $443,500 $443,500 $400,000 -9.81%
Expenditures
FY20-21
Actual
FY21-22
Budget
FY21-22
Estimate
FY22-23
Budget
Percent
Change
Building Maintenance and Repair - 443,400 443,400 - -100.00%
Capital Outlay – Improvements - - - 400,000 -
Reserved for Future Expenditures - 100 - - -100.00%
Total - $443,500 $443,400 $400,000 -9.81%
Recreation Capital Reserve
The Recreation Capital Reserve accounts for development fees that are restricted for construction and improvements of
parks and recreation facilities. The primary source of revenue for this fund is Recreation Subdivision Fees. Existing Town
ordinances require either the dedication of open space for public recreation or the payment of a fee in lieu per unit. The
requirement regarding land dedication or fee in lieu is based on the Town’s adopted Parks, Recreation, Greenways, and
Open Space Master Plan.
Recreation Capital Reserve
Account Description
FY19-20
Actual
FY20-21
Budget
FY20-21
Estimate
FY21-22
Budget
Percent
Change
Subdivision Recreation Fees 2,011,476 1,000,000 2,515,000 1,500,000 50.00%
Interest Earned 5,821 1,000 800 1,000 0.00%
Transfer from General Fund - - - 1,073,600 -
Fund Bal Appropriated - Budget - - - - -
Fund Bal Appropriated - Amend - - - - -
Total $2,017,297 $1,001,000 $2,515,800 $2,574,600 157.20%
Expenditures
FY20-21
Actual
FY21-22
Budget
FY21-22
Estimate
FY22-23
Budget
Percent
Change
Transfer to General Fund 568,072 - - - -
Transfer to Recreation Project 3,768,300 - - - -
Reserved for Future Expenditures - 1,001,000 2,515,800 2,574,600 157.20%
Total $4,336,372 $1,001,000 $2,515,800 $2,574,600 157.20%
225
Capital Reserve Funds
Water & Sewer/Water & Sewer (HB436) Capital Reserves
The Water & Sewer Capital Reserve receives the bulk of revenues from developer payments of Capital Reimbursement Fees.
The purpose of Capital Reimbursement Fees is a one-time capital charge assessed against new development as a way to
provide for or cover a proportional share of the costs of capital facilities. These treatment facilities provide the system
capacity that each new development will demand when connected to the water and sewer systems. In 2017, The NC General
Assembly passed legislation regarding the collection of system development fees, or capital reimbursement fees. To make
a clear transition to the new collection method, the Town established a new capital reserve fund to account for capital
reimbursement fees. The HB436 tag references the bill passed by the General Assembly. Transfers to the Water-Sewer Capital
Project Fund are for expansion projects including extension of western transmission lines, Big Branch 2 Pump Station &
Force Main, and the Town’s commitment to its joint facilities with Cary.
Water-Sewer Capital Reserve
Revenues
FY20-21
Actual
FY21-22
Budget
FY21-22
Estimate
FY22-23
Budget
Percent
Change
Capital Reimbursement Fees - Residential 15,785 200 - - -100.00%
Capital Reimbursement Fees - Commercial 59,875 - - - -
Capacity Fees - Residential - - - - -
Capacity Fees - Commercial 118,500 - - - -
Interest Earned 43,279 14,000 13,500 12,200 -12.86%
Fund Bal Appropriated - Budget - 5,938,300 5,939,000 4,010,000 -32.47%
Fund Bal Appropriated - Amend - - - - -
Total $237,439 $5,952,500 $5,952,500 $4,022,200 -32.43%
Expenditures
FY20-21
Actual
FY21-22
Budget
FY21-22
Estimate
FY22-23
Budget
Percent
Change
Transfer to W/S Fund 2,410,409 - - - -
Transfer to W/S Project Fund - 5,952,500 5,952,500 4,022,200 -32.43%
Reserved for Future Expenditures - - - - -
Total $2,410,409 $5,952,500 $5,952,500 $4,022,200 -32.43%
Water-Sewer Capital Reserve (HB436)
Revenues
FY20-21
Actual
FY21-22
Budget
FY21-22
Estimate
FY22-23
Budget
Percent
Change
Capital Reimbursement Fees - Water 1,021,065 700,000 1,950,000 1,000,000 42.86%
Capital Reimbursement Fees - Sewer 1,829,753 1,400,000 3,326,000 1,500,000 7.14%
Interest Earned 7,264 3,500 2,500 - -100.00%
Fund Bal Appropriated - Budget - 388,250 - -
Fund Bal Appropriated - Amend - - 388,250 - -
Total $2,858,082 $2,491,750 $5,666,750 $2,500,000 0.33%
Expenditures
FY20-21
Actual
FY21-22
Budget
FY21-22
Estimate
FY22-23
Budget
Percent
Change
Transfer to W/S Fund 2,497,197 388,250 1,175,000 - -100.00%
Transfer to W/S Project Fund 3,753,000 1,175,000 - - -100.00%
Reserved for Future Expenditures - 928,500 4,491,750 2,500,000 169.25%
Total $6,250,197 $2,491,750 $5,666,750 $2,500,000 0.33%
226
Health & Dental Fund
The Town of Apex self-insures routine health and dental claims and uses this fund to centralize costs and allocate them to
various departments and funds based on the number of employees. The Health and Dental Fund operates as an Internal
Services Fund to account for providing services to other funds and departments of the town. This allows the Town to
centralize certain services and allocate them on a full cost reimbursement basis. In accordance with N.C.G.S. 159-13.1, the
Town adopts a financial plan with the budget ordinance for the Health and Dental Fund to provide health and dental
coverage to employees and certain retirees. Payments to the fund are included in the annual budgets of the other funds.
Revenues
Health & Dental Fund Revenues
Source
FY20-21
Actual
FY21-22
Budget
FY21-22
Estimate
FY22-23
Budget
Percent
Change
Health Premiums 4,451,264 5,320,743 5,360,780 5,673,259 6.63%
Spouse/Dependent Health 999,792 1,156,719 1,109,079 1,108,709 -4.15%
Retiree Contribution 74,549 32,967 26,000 33,343 1.14%
Dental Premiums 299,240 218,357 257,400 281,700 29.01%
Spouse/Dependent Dental 181,539 195,043 170,504 174,075 -10.75%
Vision Premiums 76,869 76,534 76,600 78,000 1.92%
Total 6,083,253 $7,000,363 $7,000,363 $7,349,086 4.98%
Expenditures
Health & Dental Fund Expenditures
Source
FY20-21
Actual
FY21-22
Budget
FY21-22
Estimate
FY22-23
Budget
Percent
Change
Health Claims 5,162,917 5,419,428 5,146,837 5,375,327 -0.81%
Dental Claims 393,797 391,800 429,692 455,792 16.33%
Admin Fees - Health 644,256 879,207 850,566 961,149 9.32%
Health Claims - Retirees - 21,600 21,280 21,280 -1.48%
Dental Claims - Retiree 266,184 176,094 433,084 404,899 129.93%
Medicare Premiums 82,410 - - - -
Admin Fees - Retiree 58,614 35,700 42,370 52,639 47.45%
Admin Fees - Vision 78,776 76,534 76,534 78,000 1.92%
Total $ 6,686,954 $ 7,000,363 $7,000,363 $7,349,086 4.98%
227
Other Funds
Other Funds
Other Funds
The Town of Apex maintains six “Other” or miscellaneous funds that include State & Federal Police Funds, Police & Fire
Donations, Affordable Housing Fund, and the Cemetery Fund.
State & Federal Police Funds
These two funds account for minor amounts of monies received through State and Federal funding opportunities and the
expenditure of such. These revenues typically include grants for specific supplies, materials, or equipment.
Police State Funds
Revenues
FY20-21
Actual
FY21-22
Budget
FY21-22
Estimate
FY22-23
Budget
Percent
Change
Interest Earned 97 100 105 100 0.00%
Police Revenues 3,904 1,500 9,000 1,500 0.00%
Total $4,000 $1,600 $9,105 $1,600 0.00%
Expenditures
FY20-21
Actual
FY21-22
Budget
FY21-22
Estimate
FY22-23
Budget
Percent
Change
Supplies and Materials - - - - -
Reserved for future Expenditures - 1,600 9,105 1,600 0.00%
Total $ - $1,600 $9,105 $1,600 0.00%
Police Federal Funds
Revenues
FY20-21
Actual
FY21-22
Budget
FY21-22
Estimate
FY22-23
Budget
Percent
Change
Interest Earned 55 100 100 100 0.00%
Police Revenues 465 500 - 500 0.00%
Asset Seizures - - - - -
Total $520 $600 $100 $600 0.00%
Expenditures
FY20-21
Actual
FY21-22
Budget
FY21-22
Estimate
FY22-23
Budget
Percent
Change
Supplies and Materials - 600 - 600 0.00%
Capital Outlay - Equipment - - - - -
Total $ - $600 $ - $600 0.00%
228
Other Funds
Police & Fire Donations Funds
These two funds account for donations given to the town for the express purpose of funding a specific initiative and
operation of the respective public safety department.
Police Donations
Revenues
FY20-21
Actual
FY21-22
Budget
FY21-22
Estimate
FY22-23
Budget
Percent
Change
Interest Earned 66 100 25 100 0.00%
Miscellaneous Revenue 100 - 2,525 - -
Police Contributions 12,020 7,500 17,428 5,000 -33.33%
Total $12,186 $7,600 $19,978 $5,100 -32.89%
Expenditures
FY20-21
Actual
FY21-22
Budget
FY21-22
Estimate
FY22-23
Budget
Percent
Change
Supplies and Materials 7,699 7,600 6,847 5,100 -32.89%
Total $7,699 $7,600 $6,847 $5,100 -32.89%
Fire Donations
Revenues
FY20-21
Actual
FY21-22
Budget
FY21-22
Estimate
FY22-23
Budget
Percent
Change
Interest Earned 39 100 175 100 0.00%
Fire Dept. Donations 1,550 1,000 - 1,000 0.00%
Total $1,589 $1,100 $175 $1,100 0.00%
Expenditures
FY20-21
Actual
FY21-22
Budget
FY21-22
Estimate
FY22-23
Budget
Percent
Change
Supplies and Materials - 1,100 175 1,100 0.00%
Capital Outlay - Equipment - - - - -
Total $ - $1,100 $175 $1,100 0.00%
Affordable Housing Fund
Town Council created this fund beginning in FY20-21. Town Council has dedicated revenue equivalent to one cent on the
tax rate to fund various affordable housing projects and initiatives.
Affordable Housing Fund
Revenues
FY20-21
Actual
FY21-22
Budget
FY21-22
Estimate
FY22-23
Budget
Percent
Change
Interest Earned 1,834 1,000 1,000 - -100.00%
Transfer from General Fund 1,020,000 1,595,000 1,595,000 1,776,000 11.35%
Total $1,021,834 $1,596,000 $1,596,000 $1,776,000 11.28%
Expenditures
FY20-21
Actual
FY21-22
Budget
FY21-22
Estimate
FY22-23
Budget
Percent
Change
Contracted Services 50,000 415,000 415,000 250,000 -39.76%
Affordable Housing Grant 2,280 165,000 165,000 171,700 4.06%
Affordable Housing Loan - 1,850,000 1,850,000 1,000,000 -45.95%
Reserved for Future Expenditures - 16,000 16,000 354,300 2114.38%
Total $52,280 $2,446,000 $2,446,000 $1,776,000 -27.39%
229
Other Funds
Cemetery Fund
The purpose of the Cemetery Fund is to account for funds related to the sale and maintenance of the town owned cemetery.
The sale of cemetery lots and earned interest on investments account for the revenues received in the fund. The cemetery
account reserves any excess revenues over expenditures for cemetery improvements and perpetual care of the property.
Cemetery Fund
Revenues
FY20-21
Actual
FY21-22
Budget
FY21-22
Estimate
FY22-23
Budget
Percent
Change
Sale of Cemetery Plots 1,200 - - - -
Interest Earned 1,114 1,000 500 1,000 0.00%
Fund Bal Appropriated - Budget - - - - -
Total $2,314 $1,000 $500 $1,000 0.00%
Expenditures
FY20-21
Actual
FY21-22
Budget
FY21-22
Estimate
FY22-23
Budget
Percent
Change
Transfer to General Capital Projects - - - - -
Reserved for Future Expenditures - 1,000 500 1,000 0.00%
Total $ - $1,000 $500 $1,000 0.00%
230

Supplemental Information
231
Department Hire Date Position Qty FY22-23 Personnel
Cost
Operating & Capital Costs
Total Costs Notes
10/1/2022 Deputy Town Manager 1 180,995 3,195 184,190 1/1/2023 Management Analyst 1 54,592 3,445 58,037 7/1/2022 Assistant Director HR 1 164,261 12,985 177,246 1/1/2023 Training & Development Coordinator 1 63,271 8,995 72,266 7/1/2022 Senior HR Analyst 1 103,892 8,995 112,887 Recruitment focus7/1/2022 Safety & Workers Comp Coordinator 1 104,772 3,445 108,217 7/1/2022 IT Analyst (Project Manager) 1 123,785 75 123,860 Contract to FTE7/1/2022 IT Technician (Public Safety) 1 104,772 195 104,967 LSE to FTE7/1/2022 IT Analyst (A/V & Broadcasting) 1 123,785 3,345 127,130 Contract to FTE7/1/2022 GIS Technician (Public Utilities) 1 104,772 5,195 109,967
Communications 10/1/2022 Digital Media Specialist 1 86,025 10,670 96,695 Budget 7/1/2022 Performance & Strategy Analyst 1 113,816 8,995 122,811
1/1/2023 Neighborhood Services Director 1 88,553 3,695 92,248 3/1/2023 Community Engagement Coordinator 1 36,394 3,445 39,839 7/1/2022 Housing Technician 1 104,772 10,715 115,487 NC LEAD fellow to FT7/1/2022 Housing Specialist 1 118,678 3,500 122,178
Planning 10/1/2022 Planner I 1 86,025 6,395 92,420 10/1/2022 Lieutenant/Watch Commander 2 220,341 189,198 409,539 7/1/2022 Evidence / Quartermaster Clerk 1 85,674 75 85,749 PT to FTE10/1/2022 Administrative Coordinator 1 55,281 12,195 67,476 PT7/1/2022 Captain - Special Operations 1 160,255 85,980 246,235 8/1/2022 Battalion Chief 3 386,890 145,063 531,953 Public Safety Station 68/1/2022 Fire Lieutenant 3 326,365 30,733 357,098 Public Safety Station 68/1/2022 Fire Engineer 3 300,254 30,733 330,987 Public Safety Station 67/1/2022 Firefighter 5 463,798 51,243 515,040 Public Safety Station 61/1/2023 Deputy Fire Chief 1 85,341 133,736 219,077 Jan. Start date
Town of Apex, North Carolina FY 2022 – 2023 Annual Budget
New Position Recommendations
Information Technology
Police
Fire
Administration
Human Resources
Community & Neighborhood
Connections
General Fund
232
Approved Position Requests
Department Hire Date Position Qty FY22-23 Personnel
Cost
Operating & Capital Costs
Total Costs Notes
Town of Apex, North Carolina FY 2022 – 2023 Annual Budget
New Position Recommendations
1/1/2023 Traffic Safety Engineer 1 67,388 12,095 79,483 7/1/2022 Transportation & Infrastructure Devpt. Director 1 177,105 3,695 180,800 10/1/2022 Administrative Support Specialist 1 65,925 3,445 69,370 7/1/2022 Acquisition Program Support Specialist 1 82,383 3,445 85,828 LSE to FTE7/1/2022 Capital Projects Inspector 1 113,815 42,100 155,915 7/1/2022 Administrative Support Specialist 1 82,383 15,164 97,547 LSE to FTE1/1/2023 Facilities Maintenance Technician 1 44,565 1,243 45,808 7/1/2022 Park and Greenways Planning Technician 1 82,383 1,075 83,458 PT to FTE10/1/2022 Senior Center Manager 1 81,887 7,195 89,082 10/1/2022 Park Attendant 1 55,064 1,470 56,534 10/1/2022 Park Attendant 1 55,064 1,470 56,534 1/1/2023 Assistant Director of Recreation Programs 1 76,706 12,245 88,951 7/1/2022 Athletics & Grounds Worker 1 76,276 39,570 115,846
Cultural Arts Center 7/1/2022 Special Events Coordinator 1 92,760 30,895 123,655
Fund Total 51 5,001,061 951,347 5,952,409
Stormwater 7/1/2022 Stormwater Utility Coordinator 1 109,183 3,795 112,978 7/1/2022 Utility Field Supervisor 1 113,815 52,210 166,025 7/1/2022 Utility Maintenance Worker 1 79,248 43,085 122,333
Fund Total 3 302,246 99,090 401,336
7/1/2022 System Operator (Solar) 1 129,146 16,595 145,741 7/1/2022 Head Arborist 1 129,146 4,220 133,366
Fund Total 2 258,293 20,815 279,108
Water Sewer Fund
Electric Utility
Parks & Recreation
Facility Services
Transportation & Infrastructure Development
Water Maintenance
Electric Fund
233
Approved Position Requests
Personnel Summary
FT PT FTE FT PT FTE FT PT FTEAdministration
Town Manager N/A 1 - 1 1 - 1 1 - 1 Deputy Town Manager N/A - - - 1 - 1 1 - 1 Assistant Town Manager N/A 2 - 2 2 - 2 2 - 2 Management Analyst 22 - - - - - - 1 - 1 Diversity, Equity & Inclusion Director N/A - - - 1 - 1 1 - 1 Diversity, Equity & Inclusion Officer 27 1 - 1 1 - 1 1 - 1 Town Clerk19 23 1 - 1 1 - 1 1 - 1 Deputy Town Clerk 19 1 - 1 1 - 1 1 - 1 Legislative Aide 22 - - - 1 - 1 1 - 1 Executive Assistant to Town Administration 22 - - - 1 - 1 1 - 1 Receptionist 14 - - - 1 - 1 1 - 1
Total 6 - 6 11 - 11 12 - 12 Legal Services
Town Attorney N/A 1 - 1 1 - 1 1 - 1 Deputy Town Attorney 31 1 - 1 1 - 1 1 - 1 Assistant Town Attorney 30 1 - 1 1 - 1 1 - 1 Paralegal 18 - 1 0.5625 1 - 1 1 - 1
Total 3 1 3.5625 4 - 4 4 - 4 Human Resources
Human Resources Director N/A 1 - 1 1 - 1 1 - 1 Assistant Human Resources Director 31 - - - 1 1 1 1 Human Resources Manager 27 1 - 1 1 - 1 1 - 1 Human Resources Analyst (Senior) 24 1 - 1 2 - 2 2 - 2 Human Resources Data & Systems Administrator 23 - - - 1 - 1 1 - 1 Human Resources Consultant₁₀ 21 1 - 1 2 - 2 2 - 2 Human Resources Coordinator (Covid/Safety) 19 - - - 1 1 1 1 Human Resources Technician 17 1 - 1 1 - 1 1 - 1 Safety & Workers Comp Coordinator 21 - - - - - - 1 - 1 Safety & Risk Manager 27 1 - 1 1 - 1 1 - 1
Total 6 - 6 11 - 11 12 - 12 Information Technology
Information Technology Director N/A 1 - 1 1 - 1 1 - 1 Information Technology Services Manager 29 1 - 1 1 - 1 1 - 1 Senior Information Technology Analyst 27 1 - 1 1 - 1 1 - 1 GIS Administrator₁ 25 1 - 1 1 - 1 1 - 1 Information Technology Analyst 25 3 - 3 5 - 5 7 - 7 Information Technology Specialist₁₁ 23 3 - 3 1 - 1 1 - 1 Information Technology Technician 21 3 - 3 3 - 3 5 - 5
Total 13 - 13 13 - 13 17 - 17 Finance
Finance Director N/A 1 - 1 1 - 1 1 - 1 Purchasing & Contracts Manager 24 1 - 1 1 - 1 1 - 1 Customer Service & Billing Manager 25 1 - 1 1 - 1 1 - 1 Accounting Manager₂ 25 1 - 1 1 - 1 1 - 1 Finance & Utility Accountant 23 1 - 1 1 - 1 1 - 1 Payroll Administrator 18 1 - 1 1 - 1 1 - 1 Utilities Customer Service Specialist 15 3 - 3 3 - 3 3 - 3 Senior Utilities Customer Service Specialist 17 5 - 5 5 - 5 5 - 5 Accounting Specialist 18 1 - 1 1 - 1 1 - 1 Accounts Payable Technician 15 1 - 1 1 - 1 1 - 1 Buyer 18 1 - 1 1 - 1 1 - 1 Inventory & Warehouse Specialist 14 2 - 2 2 - 2 2 - 2 Assistant Customer Service Manager 22 - - - 1 - 1 1 - 1
Total 19 - 19 20 - 20 20 - 20 Communications
Communications Manager 27 1 - 1 1 - 1 1 - 1 Communications Specialist 19 1 - 1 1 - 1 1 - 1 Community Engagement Specialist 22 - - - 1 - 1 1 - 1 Digital Media Specialist 22 - - - - - - 1 - 1
Total 2 - 2 3 - 3 4 - 4 Budget, Performance & Strategy
Director of Budget, Performance & Strategy N/A 1 - 1 1 - 1 1 - 1 Budget & Management Analyst/Specialist 24/21 2 - 2 2 - 2 2 - 2 Budget & Performance Manager 27 - - - - - - - - - Performance & Strategy Analyst 23 - - - - - - 1 - 1 Sustainability Program Coordinator 23 1 - 1 1 - 1 1 - 1 Sustainability Specialist 20 1 - 1 1 - 1 1 - 1
Total 5 - 5 5 - 5 6 - 6
FY 2022-2023FY 2021-2022General Government Salary Grade
FY 2020-2021
234
Personnel Summary
FT PT FTE FT PT FTE FT PT FTENeighborhood & Community Connections
Neighborhood and Community Connections Director N/A - - - 1 - 1 1 Community Engagement Coordinator 22 - - - 1 - 1 1 Housing Program Manager 26 1 - 1 1 - 1 1 Housing & Community Programs Technician 21 - - - 1 - 1 1 Housing Specialist 24 - - - - - - 1
Total 1 - 1 4 - 4 5
- 1- 1- 1- 1- 1- 5
Parks, Recreation & Cultural ResourcesParks, Recreation & Cultural Resources Director N/A 1 - 1 1 - 1 1 - 1 Assistant Director of Parks & Recreation 30 - - - - - - 1 - 1 Parks Planning & Project Manager 26 1 - 1 1 - 1 1 - 1 Parks & Greenways Planning Technician 15 - - - - 1 0.750 1 - 1 Recreation Program Manager 27 1 - 1 1 - 1 1 - 1 Recreation Program Supervisor 22 3 - 3 3 - 3 3 - 3 Recreation Program Specialist 20 1 - 1 1 - 1 1 - 1 Recreation Customer Service Supervisor 20 1 - 1 1 - 1 1 - 1 Recreation Customer Service Specialist 15 4 - 4 4 4 7 4 4 7 Marketing & Programs Coordinator 18 1 - 1 1 - 1 1 - 1 Parks Operations Manager 25 1 - 1 1 - 1 1 - 1 Park Manager 22 - - - 1 - 1 2 - 2 Parks Operations Supervisor 21 1 - 1 1 - 1 1 - 1 Parks Operations Team Leader 17 3 - 3 4 - 4 4 - 4 Parks Operations Worker/Specialist/Senior 13-16 4 - 4 6 - 6 6 - 6 Athletic & Grounds Supervisor 21 1 - 1 1 - 1 1 - 1 Athletic & Grounds Team Leader 17 3 - 3 3 - 3 3 - 3 Athletics & Grounds Worker/Technician 13-14 5 - 5 5 - 5 6 - 6 Parks Attendant 11 6 - 6 6 - 6 8 - 8 Cultural Arts Center Manager 25 1 - 1 1 - 1 1 - 1 Cultural Arts Specialist 21 1 - 1 1 - 1 1 - 1 Cultural Arts Marketing & Events Specialist 17 - - - 1 - 1 1 - 1 Special Events Coordinator 17 - - - 1 - 1 1 - 1
Total 39 - 39.000 45 5 48.750 51 4 54.000 94 1 95 116 5 120 131 4 134
FT PT FTE FT PT FTE FT PT FTEEconomic Development
Economic Development Director N/A 1 - 1 1 - 1 1 - 1 Downtown Development Coordinator 23 1 - 1 1 - 1 1 - 1 Program Support Specialist 15 1 - 1 2 - 2 2 - 2
Total 3 - 3 4 - 4 4 - 4 Planning
Planning Director N/A 1 - 1 1 - 1 1 - 1 Planning Manager 29 2 - 2 2 - 2 2 - 2 Planner/Planner II/Senior Planner 22-26 6 - 6 6 - 6 7 - 7 Zoning Compliance Supervisor 25 1 - 1 1 - 1 1 - 1 Zoning Compliance Officer (Senior, Landscaping) 21-24 4 - 4 4 - 4 4 - 4 GIS Analyst 23 1 - 1 1 - 1 1 - 1 GIS Technician 19 1 - 1 1 - 1 1 - 1 Planning Technician (Lead) 21 1 - 1 1 - 1 1 - 1 Planning Technician 20 2 - 2 2 - 2 2 - 2 GIS Specialist 21 1 - 1 1 - 1 1 - 1
Total 20 - 20 20 - 20 21 - 21 Transportation & Infrastructure Development
Transportation & Infrastructure Development Director N/A - - - 1 - 1 1 - 1 Utilities Acquisition Specialist₁ 25 1 - 1 1 - 1 1 - 1 Development Services Manager₁ 26 1 - 1 1 - 1 1 - 1 Development Specialist 22 - - - 1 - 1 1 - 1 Program Support Specialist₁ (Senior) 17 1 - 1 1 - 1 3 - 3 Capital Project Manager 29 1 - 1 1 - 1 1 - 1 Capital Projects Inspector 25 - - - 1 - 1 2 - 2 Infrastructure Inspections Supervisor 25 1 - 1 1 - 1 1 - 1 Infrastructure Inspector (Senior) 23-24 6 - 6 5 - 5 5 - 5 Transportation Engineering Manager 29 1 - 1 1 - 1 1 - 1 Traffic Engineering Manager 29 1 - 1 1 - 1 1 - 1 Professional Engineer 27 1 - 1 1 - 1 2 - 2 Transportation Engineering Projects Coordinator 24 1 - 1 1 - 1 1 - 1 Engineering & Surveying Technician 22 1 - 1 1 - 1 1 - 1
Total 16 - 16 18 - 18 22 - 22
FY 2022-2023FY 2021-2022Planning, Economic & Development Services
Salary Grade
Total General Government
FY 2020-2021
FY 2020-2021 FY 2021-2022 FY 2022-2023General Government (cont.) Salary Grade
235
Personnel Summary
FT PT FTE FT PT FTE FT PT FTEBuilding Inspections & Permits
Inspections & Permits Director N/A 1 - 1 1 - 1 1 - 1 Code Enforcement Supervisor 27 2 - 2 2 - 2 2 - 2 Code Enforcement Officer I, II, III 21-25 13 - 13 13 - 13 13 - 13 Plans & Permits Supervisor 27 1 - 1 1 - 1 1 - 1 Plans Examiner (Senior) 20-25 4 - 4 4 - 4 4 - 4 Permit Specialist 17 3 - 3 3 - 3 3 - 3
Total 24 - 24 24 - 24 24 - 24 65 - 65 68 - 68 71 - 73
FT PT FTE FT PT FTE FT PT FTEFire
Fire Chief N/A 1 - 1 1 - 1 1 - 1 Deputy Fire Chief 30 - - - - - - 1 - 1 Assistant Fire Chief 29 2 - 2 2 - 2 2 - 2 Fire Marshal 27 1 - 1 1 - 1 1 - 1 Deputy Fire Marshal 25 1 - 1 1 - 1 1 - 1 Fire Inspector 19 1 - 1 1 - 1 1 - 1 Fire Battalion Chief 27 3 - 3 6 - 6 6 - 6 Fire Training Coordinator 24 2 - 2 2 - 2 2 - 2 Fire Captain 24 3 - 3 3 - 3 3 - 3 Fire Lieutenant 23 18 - 18 21 - 21 21 - 21 Fire Engineer 21 21 - 21 24 - 24 24 - 24 Firefighter, Senior Firefighter 17-18 42 - 42 48 - 48 48 - 48 Fire Support Technician 17 1 - 1 1 - 1 1 - 1 Program Support Specialist 15 1 - 1 1 - 1 1 - 1 Systems & Performance Analyst 18 - - - 1 - 1 1 - 1 Administrative Logistics Coordinator₉ 18 1 - 1 1 - 1 1 - 1
Total 98 - 98 114 - 114 115 - 115 Police
Police Chief N/A 1 - 1 1 - 1 1 - 1 Deputy Police Chief 31 1 - 1 1 - 1 1 - 1 Police Captain 29 3 - 3 4 - 4 4 - 4 Police Lieutenant 27 3 - 3 3 - 3 5 - 5 Police Sergeant₆ 25 13 - 13 13 - 13 13 - 13 Records and Technology Manager 26 1 - 1 1 - 1 1 - 1 Police Accreditation Specialist 21 1 - 1 1 - 1 1 - 1 CAD/RMS Administrator 23 - - - 1 - 1 1 - 1 Police Corporal 23 7 - 7 7 - 7 7 - 7 Police Officers (PO I, PO II, Master PO, Senior PO) 19-22 68 - 68 68 - 68 68 - 68 Crime Analyst 20 1 - 1 1 - 1 1 - 1 Information Technology Technician 21 - - - - - - - - - Victim Advocate 21 1 - 1 1 - 1 1 - 1 Digital Forensic Technician 21 - - - 1 - 1 1 - 1 Police Crisis Counselor 20 - - - 1 - 1 1 - 1 Support Services Manager 29 - - - 1 - 1 1 - 1 Evidence Technician/Quartermaster 16 1 - 1 1 - 1 2 - 2 Administrative Coordinator₁₄ 18 1 - 1 1 - 1 1 1 1 Police Records Technician 16 3 - 3 3 - 3 3 - 3
Total 105 - 105.000 110 - 110.000 113 1 113.375 Emergency Communications
Communications Manager 26 1 - 1 1 - 1 1 - 1 Communications Shift Supervisor₇ 19 4 - 4 4 - 4 4 - 4 Telecommunicator (I, II, Senior) 16-18 8 - 8 8 - 8 8 - 8
Total 13 - 13 13 - 13 13 - 13 216 - 216.00 237 - 237.00 241 1 241.38
FT PT FTE FT PT FTE FT PT FTEFacility & Fleet Services
Facilities & Grounds Supervisor 25 1 - 1 1 - 1 1 - 1 Fleet Services Supervisor 22 1 - 1 1 - 1 1 - 1 Program Support Specialist 15 - - - - - - 1 - 1 Fleet Services Mechanic/ Sr. Mechanic 17-18 4 - 4 4 - 4 4 - 4 Facility Services Supervisor 23 1 - 1 1 - 1 1 - 1 Facility Maintenance Mechanic/ Sr. Mechanic 17 3 - 3 4 - 4 5 - 5 Grounds Maintenance Crew Field Supervisor17 17 1 - 1 1 - 1 1 - 1 Grounds Maintenance Technician17 13 3 - 3 3 - 3 3 - 3
Total 14 - 14 15 - 15 17 - 17
FY 2022-2023
FY 2022-2023
FY 2022-2023
FY 2021-2022
FY 2021-2022
FY 2021-2022
Public Safety Salary Grade
Total Planning, Economic & Development Services
FY 2020-2021
FY 2020-2021
FY 2020-2021Planning, Economic & Development Services (cont.)
Salary Grade
Total Public Safety
Salary GradePublic Works
236
Personnel Summary
FT PT FTE FT PT FTE FT PT FTEPublic Works Administration
Public Works & Transportation Director₁ N/A 1 - 1 1 - 1 1 - 1 Public Works Operations Data Analyst 23 1 - 1 1 - 1 1 - 1 Senior Program Support Specialist 17 - - - - - - - - - Program Support Specialist18 15 1 - 1 1 - 1 1 - 1 Public Works Data Operations Specialist₁₃ 21 1 - 1 1 - 1 1 - 1
Total 5 - 5 5 - 5 5 - 5 Streets
Street Maintenance Worker (All Levels) 13-15 9 - 9 9 - 9 9 - 9 Street Maintenance Supervisor 23 1 - 1 1 - 1 1 - 1 Heavy Equipment Operator 17 2 - 2 2 - 2 2 - 2 Street Crew Field Supervisor 19 1 - 1 1 - 1 1 - 1 Street Signs Worker/Technician 15-16 2 - 2 2 - 2 2 - 2
Total 15 - 15 15 - 15 15 - 15 Solid Waste Services
Solid Waste Supervisor 22 1 - 1 1 - 1 1 - 1 Solid Waste Equipment Operator (I, Senior) 15-16 12 - 12 12 - 12 12 - 12 General Maintenance Worker (I,II) 11-12 5 - 5 5 - 5 5 - 5
Total 18 - 18 18 - 18 18 - 18 52 - 52 53 - 53 55 - 55
FT PT FTE FT PT FTE FT PT FTEElectric Utility
Electric Utilities Director N/A 1 - 1 1 - 1 1 - 1 Senior Electrical Projects Manager 30 - - - - - - - - - Electric Operations Supervisor 27 1 - 1 1 - 1 1 - 1 Electric Technical Services Manager 27 1 - 1 1 - 1 1 - 1 Senior Electrical Engineer 25 - - - 1 - 1 1 - 1 System Operator 26 - - - - - - 1 - 1 Electric Training & Safety Specialist 24 1 - 1 1 - 1 1 - 1 Electric Crew Field Supervisor 24 4 - 4 4 - 4 4 - 4 Electric Line Technician (I, II, or Senior) 17-20 15 - 15 15 - 15 15 - 15 Electric Technical Services Specialist (Senior) 20-22 2 - 2 2 - 2 2 - 2 Electric Engineering Technician 21 1 - 1 1 - 1 1 - 1 Arborist (Head) 26 - - - - - - 1 - 1 Powerline Arborist (Trainee) 22 2 - 2 2 - 2 2 - 2 Forester 21 - - - 1 - 1 1 - 1 Powerline Right-of-Way Technician 16 4 - 4 4 - 4 4 - 4 Program Support Specialist 15 - 1 0.750 1 - 1 1 - 1Utility Locate Technician 15 4 - 4 4 - 4 4 - 4 Electric Programs & Technology Coordinator 19 1 - 1 1 - 1 1 - 1
Total Electric Fund Total 37 1 37.750 40 - 40 42 - 42 Stormwater
Stormwater & Utility Engineering Manager₃ 31 - - - - - - - - - Engineer (Professional, Senior, Utility) 27-28 1 - 1 1 - 1 1 - 1 Environmental Engineering Manager16 31 1 - 1 1 - 1 1 - 1 Environmental Field Services Supervisor 26 1 - 1 1 - 1 1 - 1 Environmental Specialist 22 2 - 2 3 - 3 3 - 3 Stormwater Utility Coordinator 22 - - - - - - 1 - 1
Total 5 - 5 6 - 6 7 - 7 Water Sewer Administration (Water Resources)
Water Resources Director N/A 1 - 1 1 - 1 1 - 1 Assistant Public Works/Utilities Director - - - - - - - - - -Senior Program Support Specialist 17 1 - 1 1 - 1 1 - 1 Utility Locate Technician 15 - - - - - - - - - Utilities Operations Manager 29 1 - 1 1 - 1 1 - 1 Utilities Engineering Manager 30 1 - 1 1 - 1 1 - 1 Engineer (Professional, Senior, Intern) 25-28 2 - 2 2 - 2 2 - 2 Program Support Specialist 15 1 - 1 1 - 1 1 - 1 Water Resources Specialist₅ 25 1 - 1 1 - 1 1 - 1 Utilities Specialist₄ 25 2 2 2 2 2 2 GIS Specialist 21 1 - 1 1 - 1 1 - 1 Meter Services Supervisor₁₂ 19 1 - 1 1 - 1 1 - 1 Meter Technician (Senior)₁₂ 14/15 4 - 4 4 - 4 4 - 4
Total 16 - 16.000 16 - 16.000 16 - 16.000
FY 2022-2023Salary Grade
FY 2021-2022
FY 2020-2021 FY 2021-2022
FY 2020-2021
Total Public Works
Public Utilities
Public Works (cont.) Salary Grade
FY 2022-2023
237
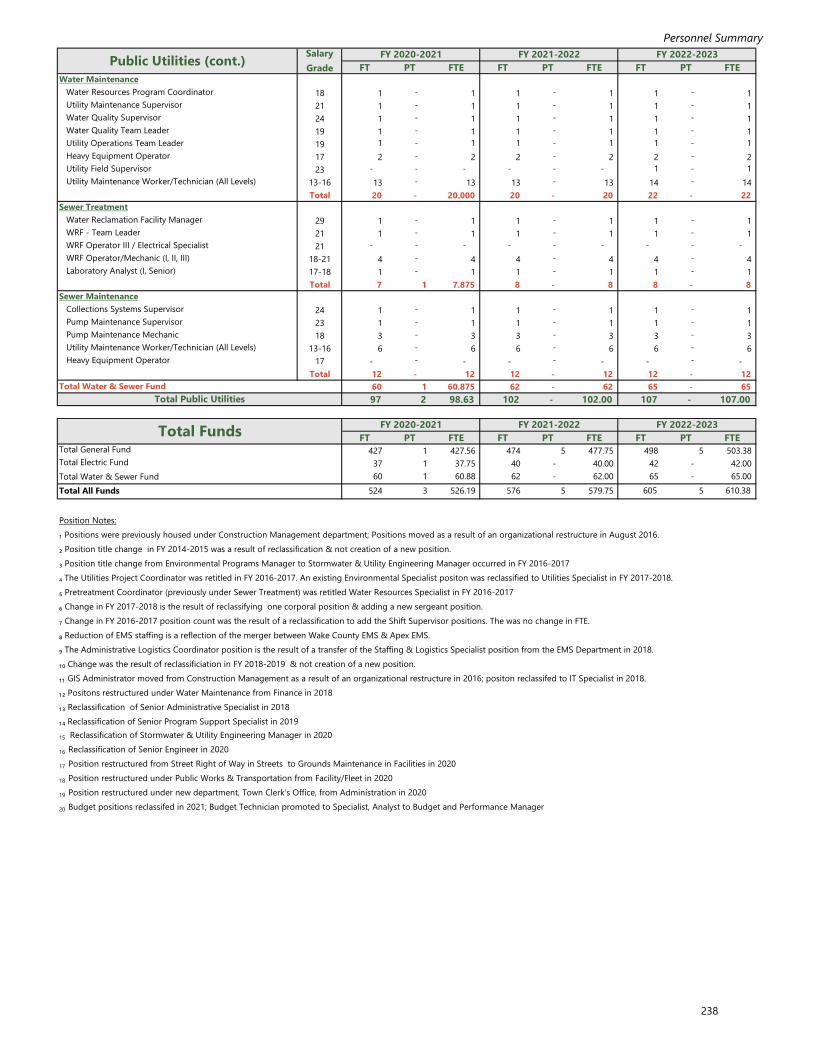
Personnel Summary
FT PT FTE FT PT FTE FT PT FTEWater Maintenance
Water Resources Program Coordinator 18 1 - 1 1 - 1 1 - 1 Utility Maintenance Supervisor 21 1 - 1 1 - 1 1 - 1 Water Quality Supervisor 24 1 - 1 1 - 1 1 - 1 Water Quality Team Leader 19 1 - 1 1 - 1 1 - 1 Utility Operations Team Leader 19 1 - 1 1 - 1 1 - 1 Heavy Equipment Operator 17 2 - 2 2 - 2 2 - 2 Utility Field Supervisor 23 - - - - - - 1 - 1 Utility Maintenance Worker/Technician (All Levels) 13-16 13 - 13 13 - 13 14 - 14
Total 20 - 20.000 20 - 20 22 - 22 Sewer Treatment
Water Reclamation Facility Manager 29 1 - 1 1 - 1 1 - 1 WRF - Team Leader 21 1 - 1 1 - 1 1 - 1 WRF Operator III / Electrical Specialist 21 - - - - - - - - - WRF Operator/Mechanic (I, II, III) 18-21 4 - 4 4 - 4 4 - 4 Laboratory Analyst (I, Senior) 17-18 1 - 1 1 - 1 1 - 1
Total 7 1 7.875 8 - 8 8 - 8 Sewer Maintenance
Collections Systems Supervisor 24 1 - 1 1 - 1 1 - 1 Pump Maintenance Supervisor 23 1 - 1 1 - 1 1 - 1 Pump Maintenance Mechanic 18 3 - 3 3 - 3 3 - 3 Utility Maintenance Worker/Technician (All Levels) 13-16 6 - 6 6 - 6 6 - 6 Heavy Equipment Operator 17 - - - - - - - - -
Total 12 - 12 12 - 12 12 - 12 60 1 60.875 62 - 62 65 - 65 97 2 98.63 102 - 102.00 107 - 107.00
FT PT FTE FT PT FTE FT PT FTE427 1 427.56 474 5 477.75 498 5 503.3837 1 37.75 40 - 40.00 42 - 42.00 60 1 60.88 62 - 62.00 65 - 65.00
524 3 526.19 576 5 579.75 605 5 610.38
Position Notes:₁ Positions were previously housed under Construction Management department; Positions moved as a result of an organizational restructure in August 2016.₂ Position title change in FY 2014-2015 was a result of reclassification & not creation of a new position.₃ Position title change from Environmental Programs Manager to Stormwater & Utility Engineering Manager occurred in FY 2016-2017₄ The Utilities Project Coordinator was retitled in FY 2016-2017. An existing Environmental Specialist positon was reclassified to Utilities Specialist in FY 2017-2018.₅ Pretreatment Coordinator (previously under Sewer Treatment) was retitled Water Resources Specialist in FY 2016-2017₆ Change in FY 2017-2018 is the result of reclassifying one corporal position & adding a new sergeant position.₇ Change in FY 2016-2017 position count was the result of a reclassification to add the Shift Supervisor positions. The was no change in FTE.₈ Reduction of EMS staffing is a reflection of the merger between Wake County EMS & Apex EMS.₉ The Administrative Logistics Coordinator position is the result of a transfer of the Staffing & Logistics Specialist position from the EMS Department in 2018.₁₀ Change was the result of reclassificiation in FY 2018-2019 & not creation of a new position.₁₁ GIS Administrator moved from Construction Management as a result of an organizational restructure in 2016; positon reclassifed to IT Specialist in 2018.₁₂ Positons restructured under Water Maintenance from Finance in 2018₁₃ Reclassification of Senior Administrative Specialist in 2018₁₄ Reclassification of Senior Program Support Specialist in 201915 Reclassification of Stormwater & Utility Engineering Manager in 2020
16 Reclassification of Senior Engineer in 2020
17 Position restructured from Street Right of Way in Streets to Grounds Maintenance in Facilities in 2020
18 Position restructured under Public Works & Transportation from Facility/Fleet in 2020
19 Position restructured under new department, Town Clerk's Office, from Administration in 2020
20 Budget positions reclassifed in 2021; Budget Technician promoted to Specialist, Analyst to Budget and Performance Manager
Total All FundsTotal Water & Sewer FundTotal Electric FundTotal General Fund
FY 2022-2023
FY 2022-2023FY 2021-2022
FY 2021-2022
Total Public Utilities
FY 2020-2021
FY 2020-2021
Total Funds
Total Water & Sewer Fund
Public Utilities (cont.) Salary Grade
238
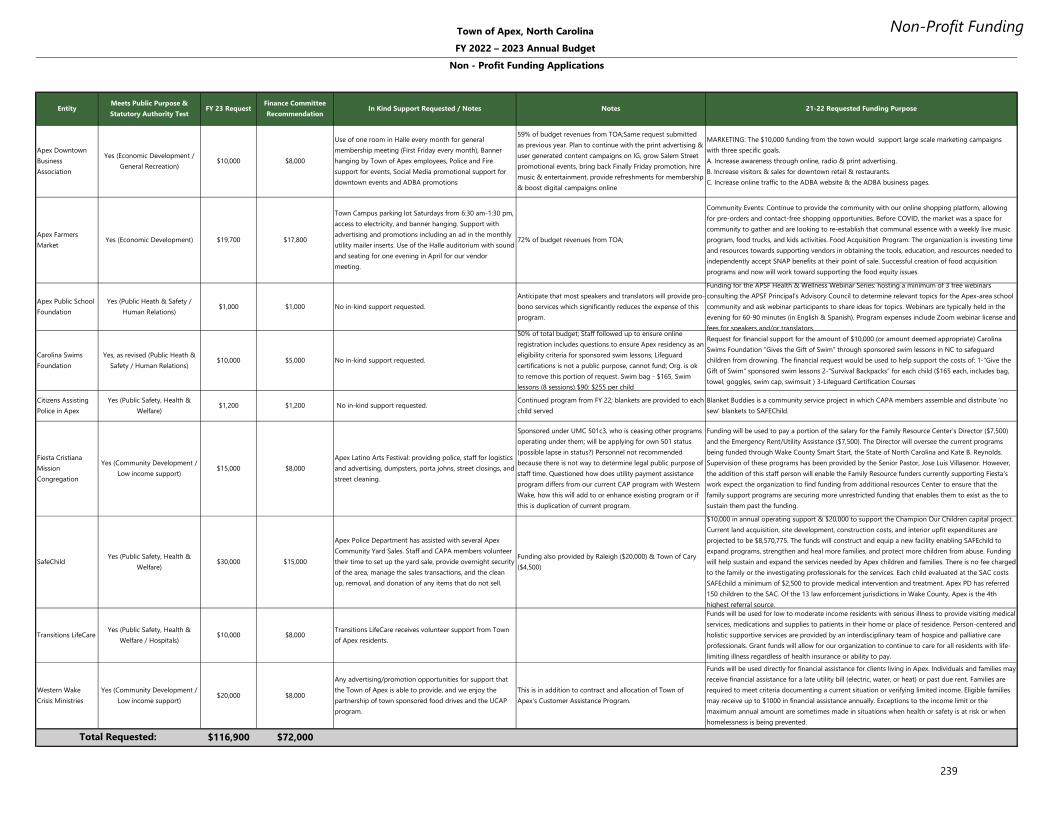
Entity Meets Public Purpose &Statutory Authority Test FY 23 Request Finance Committee
Recommendation In Kind Support Requested / Notes Notes 21-22 Requested Funding Purpose
Apex DowntownBusinessAssociation
Yes (Economic Development /General Recreation) $10,000 $8,000
Use of one room in Halle every month for generalmembership meeting (First Friday every month), Bannerhanging by Town of Apex employees, Police and Firesupport for events, Social Media promotional support fordowntown events and ADBA promotions
59% of budget revenues from TOA;Same request submittedas previous year. Plan to continue with the print advertising &user generated content campaigns on IG, grow Salem Streetpromotional events, bring back Finally Friday promotion, hiremusic & entertainment, provide refreshments for membership& boost digital campaigns online
MARKETING: The $10,000 funding from the town would support large scale marketing campaignswith three specific goals.A. Increase awareness through online, radio & print advertising.B. Increase visitors & sales for downtown retail & restaurants.C. Increase online traffic to the ADBA website & the ADBA business pages.
Apex FarmersMarket Yes (Economic Development) $19,700 $17,800
Town Campus parking lot Saturdays from 6:30 am-1:30 pm,access to electricity, and banner hanging. Support withadvertising and promotions including an ad in the monthlyutility mailer inserts. Use of the Halle auditorium with soundand seating for one evening in April for our vendormeeting.
72% of budget revenues from TOA;
Community Events: Continue to provide the community with our online shopping platform, allowingfor pre-orders and contact-free shopping opportunities. Before COVID, the market was a space forcommunity to gather and are looking to re-establish that communal essence with a weekly live musicprogram, food trucks, and kids activities. Food Acquisition Program: The organization is investing timeand resources towards supporting vendors in obtaining the tools, education, and resources needed toindependently accept SNAP benefits at their point of sale. Successful creation of food acquisitionprograms and now will work toward supporting the food equity issues.
Apex Public SchoolFoundation
Yes (Public Heath & Safety /Human Relations) $1,000 $1,000 No in-kind support requested.
Anticipate that most speakers and translators will provide pro-bono services which significantly reduces the expense of thisprogram.
Funding for the APSF Health & Wellness Webinar Series: hosting a minimum of 3 free webinarsconsulting the APSF Principal's Advisory Council to determine relevant topics for the Apex-area schoolcommunity and ask webinar participants to share ideas for topics. Webinars are typically held in theevening for 60-90 minutes (in English & Spanish). Program expenses include Zoom webinar license andfees for speakers and/or translators.
Carolina SwimsFoundation
Yes, as revised (Public Heath &Safety / Human Relations) $10,000 $5,000 No in-kind support requested.
50% of total budget; Staff followed up to ensure onlineregistration includes questions to ensure Apex residency as aneligibility criteria for sponsored swim lessons; Lifeguardcertifications is not a public purpose, cannot fund; Org. is okto remove this portion of request. Swim bag - $165, Swimlessons (8 sessions) $90: $255 per child
Request for financial support for the amount of $10,000 (or amount deemed appropriate) CarolinaSwims Foundation “Gives the Gift of Swim” through sponsored swim lessons in NC to safeguardchildren from drowning. The financial request would be used to help support the costs of: 1-“Give theGift of Swim” sponsored swim lessons 2-“Survival Backpacks” for each child ($165 each, includes bag,towel, goggles, swim cap, swimsuit ) 3-Lifeguard Certification Courses
Citizens AssistingPolice in Apex
Yes (Public Safety, Health &Welfare) $1,200 $1,200 No in-kind support requested. Continued program from FY 22; blankets are provided to each
child servedBlanket Buddies is a community service project in which CAPA members assemble and distribute 'nosew' blankets to SAFEChild.
Fiesta CristianaMissionCongregation
Yes (Community Development /Low income support) $15,000 $8,000
Apex Latino Arts Festival: providing police, staff for logisticsand advertising, dumpsters, porta johns, street closings, andstreet cleaning.
Sponsored under UMC 501c3, who is ceasing other programsoperating under them; will be applying for own 501 status(possible lapse in status?) Personnel not recommendedbecause there is not way to determine legal public purpose ofstaff time. Questioned how does utility payment assistanceprogram differs from our current CAP program with WesternWake, how this will add to or enhance existing program or ifthis is duplication of current program.
Funding will be used to pay a portion of the salary for the Family Resource Center’s Director ($7,500)and the Emergency Rent/Utility Assistance ($7,500). The Director will oversee the current programsbeing funded through Wake County Smart Start, the State of North Carolina and Kate B. Reynolds.Supervision of these programs has been provided by the Senior Pastor, Jose Luis Villasenor. However,the addition of this staff person will enable the Family Resource funders currently supporting Fiesta’swork expect the organization to find funding from additional resources Center to ensure that thefamily support programs are securing more unrestricted funding that enables them to exist as the tosustain them past the funding.
SafeChild Yes (Public Safety, Health &Welfare) $30,000 $15,000
Apex Police Department has assisted with several ApexCommunity Yard Sales. Staff and CAPA members volunteertheir time to set up the yard sale, provide overnight securityof the area, manage the sales transactions, and the cleanup, removal, and donation of any items that do not sell.
Funding also provided by Raleigh ($20,000) & Town of Cary($4,500)
$10,000 in annual operating support & $20,000 to support the Champion Our Children capital project.Current land acquisition, site development, construction costs, and interior upfit expenditures areprojected to be $8,570,775. The funds will construct and equip a new facility enabling SAFEchild toexpand programs, strengthen and heal more families, and protect more children from abuse. Fundingwill help sustain and expand the services needed by Apex children and families. There is no fee chargedto the family or the investigating professionals for the services. Each child evaluated at the SAC costsSAFEchild a minimum of $2,500 to provide medical intervention and treatment. Apex PD has referred150 children to the SAC. Of the 13 law enforcement jurisdictions in Wake County, Apex is the 4thhighest referral source.
Transitions LifeCare Yes (Public Safety, Health &Welfare / Hospitals) $10,000 $8,000 Transitions LifeCare receives volunteer support from Town
of Apex residents.
Funds will be used for low to moderate income residents with serious illness to provide visiting medicalservices, medications and supplies to patients in their home or place of residence. Person-centered andholistic supportive services are provided by an interdisciplinary team of hospice and palliative careprofessionals. Grant funds will allow for our organization to continue to care for all residents with life-limiting illness regardless of health insurance or ability to pay.
Western WakeCrisis Ministries
Yes (Community Development /Low income support) $20,000 $8,000
Any advertising/promotion opportunities for support thatthe Town of Apex is able to provide, and we enjoy thepartnership of town sponsored food drives and the UCAPprogram.
This is in addition to contract and allocation of Town ofApex's Customer Assistance Program.
Funds will be used directly for financial assistance for clients living in Apex. Individuals and families mayreceive financial assistance for a late utility bill (electric, water, or heat) or past due rent. Families arerequired to meet criteria documenting a current situation or verifying limited income. Eligible familiesmay receive up to $1000 in financial assistance annually. Exceptions to the income limit or themaximum annual amount are sometimes made in situations when health or safety is at risk or whenhomelessness is being prevented.
$116,900 $72,000
Town of Apex, North CarolinaFY 2022 – 2023 Annual Budget
Non - Profit Funding Applications
Total Requested:
239
Non-Profit Funding

Glossary
240
Glossary
Glossary
Accrual Basis of Accounting (or Full Accrual): Accounting method for proprietary funds that recognizes revenues in the
accounting period in which they are earned and become measurable. Expenses are recognized in the period incurred, if
measurable.
Ad Valorem Tax: A tax levied in proportion to the value of property.
Amortization: Paying the principal amount of a debt issue through periodic payments. Amortization payments include
interest and any payment on principal.
Annual Comprehensive Financial Report (ACFR): A complete set of financial statements presented in conformity with
generally accepted accounting principles (GAAP) and audited in accordance with generally accepted auditing standards by
a firm of licensed certified public accountants.
Appropriation: Authorization granted by Town Council to obligate and expend resources for purposes specified in the
budget document.
Assessed Valuation: The value of real estate or personal property as determined by tax assessors and used as a basis for
levying taxes.
Assigned Fund Balance: Monies over the year that remain unspent after all budgeted expenditures have been made, but
which are intended to be used by the Town for specific purposes but do not meet the criteria to be classified as restricted
or committed.
Authorized Bond: Bonds that have been legally approved but may or may not have been sold.
Audit: An independent evaluation of the accuracy of the Town’s financial statements, financial practices, and internal
controls designed to ensure compliance with generally accepted accounting principles. Audits are conducted annually in
accordance with state law.
Balanced Budget: Budget in which planned expenditures equal anticipated revenues. North Carolina state law requires
municipalities to adopt a balanced operating budget.
Base Budget: Those resources necessary to meet an established and existing service level.
Basis of Accounting: Accounting method that determines when revenues, expenditures, expenses, and transfers (and the
related assets and liabilities) are recognized in accounts and reported in financial statements. The two bases of governmental
accounting include accrual (or full accrual) and modified accrual.
Benchmarking: The process of identifying best practices of “best in class” performers that can be adopted or adapted to
improve performance.
Bond: A written promise to pay a specific amount of money with interest within a specific time, usually long-term. An
obligation issued by the Town as a method of borrowing large amounts of resources for capital projects; bonds are issued
for fixed terms and have fixed interest rates.
Bonds Authorized and Unissued: Bonds that have been legally authorized but not issued, which can be issued and sold
by the Town Council following public meetings and approval from the Local Government Commission.
241
Glossary
Bonded Debt: The portion of indebtedness represented by outstanding bonds.
Bond Rating: A grade indicating a governmental unit’s investment qualities. Generally, the higher the bond rating, the less
risk investors assume resulting in a more favorable interest rate and lower cost of financing capital projects for the
governmental unit.
Bond Referendum: is a voting process that gives voters the power to decide if a municipality should be authorized to
raise funds through the sale of bonds.
Budget: A plan for the coordination of resources and expenditures. The budget document outlines the Town’s financial plan
for a fiscal year indicating how the Town intends to allocate resources to support goals, objectives, and desired service levels.
Budget Amendment: A legal procedure used by town staff and Town Council to revise a budget appropriation.
Budget Calendar: The schedule of key dates that town departments follow in the preparation, adoption, and administration
of the budget.
Budget Message: A written overview of the proposed budget from the Town Manager to the Mayor and Town Council and
the public that discusses the major budget items, changes from the current and previous fiscal years, and the Town’s financial
condition.
Budget Ordinance: The official enactment by Town Council to establish legal authority for Town officials to obligate and
expend resources.
Budgetary Control: The control or management of a governmental unit in accordance with an approved budget for the
purpose of keeping expenditures within the limitations of available appropriations and available revenues.
Capital Assets: Tangible property that is not easily converted into cash and is usually held for a long period, such as property,
machinery, vehicles, equipment, etc.
Capital Improvement Plan (CIP): A multi-year plan for the construction or acquisition of major capital items. The plan
usually outlines spending needs, the financing source or sources expected, and the impact of the CIP on future annual
operating budgets.
Capital Outlay: Expenditure expected to have a useful life greater than one year or a total value of $5,000 or more resulting
in the acquisition of or addition to a fixed asset.
Capital Project: A capital improvement that usually requires a major initial investment, and a significant and continuing
financial commitment in the form of operating costs.
Capital Project Fund: A fund used to account for the acquisition and construction of major capital facilities, infrastructure,
or improvements.
Capital Reserve: An account used to indicate that a portion of a fund’s balance is restricted for a specific capital purpose
and is not available for general appropriation.
Capital Reserve Fund: permits the district to set aside money for future construction projects and major purchases.
Cash Accounting: An accounting method where receipts are recorded during the period they are received, and the expenses
in the period in which they are actually paid.
242
Glossary
Cash Management: The management of cash necessary to pay for governmental services while investing temporary cash
excesses in order to earn interest revenue. Cash management refers to the activities of forecasting the inflows and outflows
of cash, mobilizing cash to improve its availability for investment, and establishing and maintaining banking relationships.
Committed Fund Balance: Monies over the year that remain unspent after all budgeted expenditures have been made, but
which can be used only for the specific purposes determined by a formal action of the Mayor and Town Council.
Consumer Price Index (CPI): is a measure of the average change over time in prices of certain goods. It is a way to measure
inflation.
Contingency: A budgetary reserve set aside for emergencies or unforeseen expenditures not otherwise budgeted.
Debt Limit: The maximum amount of outstanding gross or net debt permitted by law.
Debt Service: The portion of the budget pertaining to payment of principal and interest requirements on outstanding debts.
Deficit: The amount by which expenditures exceed revenues during an accounting period.
Department: An organizational unit of the Town responsible for overall management of a major governmental function.
Depreciation: The process of estimating and recording the lost usefulness, expired useful life, or diminution of service from
a fixed asset that cannot or will not be restored by repair and must be replaced. The cost of the fixed asset’s lost usefulness
is the depreciation or the cost to the reserve to replace the item at the end of its useful life.
Disbursement: Payment for goods and services in cash or by check.
Effectiveness Measure: A performance measure identifying outcome quality.
Efficiency Measure: A performance measure identifying inputs used per unit of output, or unit costs.
Encumbrance: A financial commitment of appropriated funds for services, contracts, or goods that have not yet been
delivered by a specified time, usually the end of the fiscal year.
Enterprise Fund: A fund that accounts for a governmental activity supported primarily with user fees or charges and
operated using business principles. Apex has two Enterprise Funds- Electric and Water and Sewer.
Estimated Revenue: The amount of projected revenue to be collected during the fiscal year.
Expenditures: The measurement focus of governmental fund accounting identifying financial resources expended.
Expenses: The measurement focus of proprietary fund accounting identifying costs expired. Expenses reflect the cost of
goods or services used.
FICA: Social Security Tax paid by the Town for each permanent and temporary employee.
Fiduciary Funds: Funds used to separate, control, and track financial resources in which the government oversees as a third
party, or on behalf of, another public entity. The four fiduciary fund types include: 1) Agency Fund, 2) Pension Trust, 3)
Expendable Trust, and 4) Non-Expendable Trust.
243
Glossary
Fiscal Policy: The financial plan embracing the general goals and acceptable procedures for managing the Town’s financial
resources.
Fiscal Year (FY): The time designating the beginning and the ending period for recording financial transactions. In North
Carolina, a municipal government fiscal year begins July 1 and ends June 30.
Fixed Asset: A long-term tangible piece of property that is not expected to be consumed or converted into cash any sooner
than at least one years’ time.
Fringe Benefits: A collection of various benefits provided by an employer, which are exempt from taxation as long as certain
conditions are met.
Full Cost Accounting: Type of accounting concerned with accumulating both direct and indirect costs for financial reporting
and decision-making purposes.
Full-time Equivalent (FTE): An FTE converts the hours worked by a position into a percentage of a full year’s number of
hours. Generally, one FTE equals 2080 hours per year per permanent position.
Full-time Employee: A Town employee hired to work forty (40) hours per week on a continuing basis who is eligible to
participate in the Town’s health, dental and life insurance, and retirement programs.
Function: A group of related programs crossing organizational (departmental) boundaries and aimed at accomplishing a
similar broad goal or major service such as public safety, environmental protection, cultural activities, etc.
Fund: A fiscal and accounting entity that has a self-balancing set of accounts recording cash and other financial resources,
as well as related liabilities and residual equity. These are segregated to carry on specific activities or objectives in accordance
with special regulations, restrictions, or limitations as established by State and Federal governments.
Fund Balance: The amount of assets in excess of the liabilities or appropriations for expenditures also known as surplus
funds. North Carolina General Statutes require general fund balance reserves of at least 8 percent of General Fund
expenditures at the end of the fiscal year. The Town Council has adopted a policy to set this at 25 percent.
Fund Balance, Unassigned: That portion of the fund balance that is not legally segregated for a specific future use; available
for appropriation at any time by the Town Council in the event of a natural or financial emergency.
GASB 34: The acronym used for Governmental Accounting Standards Board Statement #34: “Basic Financial Statements-
Management’s Discussion and Analysis – For State and Local Governments.”
Generally Accepted Accounting Principles (GAAP): Uniform minimum standards and guidelines for financial accounting
and reporting. GAAP encompasses the conventions, rules, and procedures necessary to define accepted accounting
practices.
General Fund: A governmental fund used to account for financial resources of the Town, except those required to be
accounted for in another fund. Revenues to support the General Fund are derived from sources such as property tax, sales
tax, franchise fees, and service fees. This fund usually includes most of the basic operation services, such as fire and police
protection, finance, public works, general administration, planning, and recreation.
General Ledger: A file that contains a listing of the various accounts necessary to reflect the financial position of the
government.
244
Glossary
General Obligation Bonds (GO Bonds): Bonds issued by a government that are backed by the full faith and credit of its
taxing authority.
Goal: A statement of broad direction, purpose, or intent based on the needs of the community. A goal is general and
timeless.
Governmental Funds: Funds used to separate, control, and track financial resources of general government operations. The
four governmental fund types include 1) General Fund, 2) Special Revenue Funds, 3) Capital Projects Funds, and 4) Debt
Service Funds.
Grant: A contribution by a government or other organization to support a particular function.
Inter-fund Transfers: Amounts transferred from one fund to another.
Intergovernmental Revenues: Revenues from other governments (State, Federal or local) that can be in the form of grants,
shared revenues, or entitlements.
Internal Service Fund: This fund is used to account for the financing of goods or services provided by one department or
agency to other departments or agencies of the governmental unit, on a cost reimbursement, or cost allocation, basis.
Inventory: A detailed listing of property currently held by the government.
Investment Earnings: Revenue earned on investments with a third party.
Lease/Installment-Purchase Financing: A method of purchasing equipment in which payments are spread over time. The
purchased equipment serves as collateral.
Limited Service Employee (LSE): An employee appointed to a position for which either the average work week required
by the Town over the course of a year is less than 20 hours, or continuous employment required by the Town is less than
1000 hours per year.
Line Item: A budgetary account representing a specific object of expenditure.
Local Government Budget and Fiscal Control Act (LGBFCA): This act governs all financial activities of local governments
within the State of North Carolina.
Local Government Commission (LGC): A division of the North Carolina Department of State Treasurer, the LGC is
responsible for the approval, sale, and delivery of substantially all North Carolina local government bonds and notes as well
as monitoring certain fiscal and accounting standards prescribed for units of local government by the Local Government
Budget and Fiscal Control Act.
Long Term Debt: Debt with a maturity of more than one year after the date of issuance.
Maturities: The dates on which the principal or stated values of investments or debt obligations become due and/or may
be reclaimed.
Mission: A broad statement outlining a department’s purpose for existing.
Modified Accrual Basis of Accounting: Accounting method for governmental funds that recognizes revenues in the
accounting period in which they become available and measurable. Expenditures are recognized in the period the fund
245
Glossary
liability is incurred, if measurable, except for unmatured interest on (and principal of) general long-term debt, which should
be recognized when due.
North Carolina General Assembly (NCGA): The legislative body of the State’s government.
North Carolina General Statutes (NCGS): Laws governing the State of North Carolina.
Objective: A simply stated, readily measurable statement of aim or expected accomplishment within the fiscal year. An
objective should imply a specific standard of performance for a given program.
Occupational Safety and Health Act (OSHA): Regulations passed by the US Department of Occupational Safety and Health
Administration to assure safe and healthful working conditions for working men and women by authorizing enforcement of
the standards developed under the Act.
Operating Budget: A financial plan for the provision of direct services and support functions.
Operating Expenses: The portion of the budget pertaining to the daily operations that provide basic governmental services.
The operating budget contains appropriations for such expenditures as supplies, utilities, and materials.
Ordinance: a piece of legislation enacted by a municipal authority.
Part-time Employee: For budget purposes, a Town employee hired to work for less than forty (40) hours per week for an
indefinite period; part-time employees may be eligible to participate in the Town’s health, dental and life insurance and
retirement programs, depending on the number of hours worked.
Pay-As-You-Go (or Pay-Go): Financial policy of a government unit that finances capital outlays from current revenues
rather than from borrowing.
Peer Group: Other municipalities with similar characteristics, such as population, services provided, and tax base used for
comparison of financial condition and performance.
Performance-based Budget: A budget wherein expenditures, planning, and management decisions are based primarily
upon measurable performance of activities.
Performance Indicator: A performance indicator is a measurement designed to determine whether a service objective has
been met. It measures the effectiveness of achieving an objective.
Performance Measurement: The regular collection of quantifiable information regarding the results of service delivery.
Personal Property: Movable property classified within two categories- tangible and intangible. “Tangible” or touchable
property includes items of visible and movable property not permanently affixed to real property. “Intangible” or non-
touchable property includes stocks, bonds, notes, cash, bank deposits, accounts receivable, patents, trademarks, copyrights,
and similar assets.
Personnel Services: Salaries and wages paid to employees for fulltime, part-time, and temporary work including overtime
and similar compensation.
Policy: A definite course or method of action in light of given conditions to guide and determine present and future
decisions.
246
Glossary
Powell Bill Funds: Funding from state-shared gasoline taxes that are restricted for use on maintenance of local streets and
roads.
Productivity Measure: A performance measure combining efficiency and effectiveness measures into a single factor.
Program: An organized set of related work activities that are directed toward accomplishing a common goal.
Property Taxes: Taxes levied on both real and personal property according to the property’s valuation and tax rate.
Proprietary Funds: Funds used to separate, control, and track financial resources of business-type activities carried out by
a government. The two proprietary fund types include: 1) Enterprise Funds and 2) Internal Service Fund.
Real Property: Land, buildings, and items permanently affixed to land or buildings.
Reclassification: Change in a position title and/or the associated pay range based on changes in the job skills required for
a given position.
Reserve: An account designated for a portion of the fund balance that is to be used for a specific purpose.
Resources: Assets that can be used to fund expenditures such as property taxes, user fees, beginning fund balance, or
working capital.
Restricted Fund Balance: Monies over the year that remain unspent after all budgeted expenditures have been made, but
which can be spent only for the specific purposes stipulated by statutes, external resource providers, or through enabling
legislation.
Restricted Intergovernmental Revenues: Grants, entitlements, and shared revenues that are recorded in the appropriate
fund and classified by both source and function for which the revenues are to be spent.
Retained Earnings: Amounts shown as retained earnings represent accumulated earnings of proprietary funds after all
budgeted business expenses have been made.
Revaluation: The process of revaluing a jurisdiction’s real property in order to adjust the tax value to the market value. By
North Carolina law, a revaluation must be conducted at a minimum of every eight years.
Revenue: Funds the Town receives as income including tax payments, fees from specific services, receipts from other
governments, fines, grants, shared revenues, and interest income.
Revenue Bonds: Bonds issued by a government that are backed by a specific revenue source such as water and sewer fees.
Revenue-Neutral Rate: The tax rate that is estimated to produce revenue for the next fiscal year equal to the revenue that
would have been produced for the next fiscal year by the current tax rate if no reappraisal had occurred. The revenue-neutral
rate is calculated as follows: 1) Determine a rate that would produce revenues equal to those produced for the current fiscal
year, 2) Increase the rate by a growth factor equal to the average annual percentage increase in the tax base due to
improvements since the last general reappraisal, and 3) Adjust the rate to account for an annexation, de-annexation, merger,
or similar events.
Sales and Use Tax: Taxes based on the consumption of goods and services that the state collects for local governments
and distributes based upon set formulas.
247
Glossary
Special Assessment: A compulsory levy made against certain properties to defray part of the cost of a specific improvement
or service, which are deemed primarily to benefit those properties.
Special Revenue Fund: A fund used to account for the revenues from specific sources that are to be used for legally
specified expenditures.
Surplus: The amount by which revenues exceed expenditures.
Tax Base: The assessed valuation of all taxable real and personal property within the Town’s corporate limits.
Tax Levy: The resultant product when the tax rate per one-hundred dollars valuation is multiplied by the total taxable
valuation, or tax base.
Taxes: Compulsory charges levied by a government for financing services performed for the common benefit of the people.
This term does not include specific charges made against particular persons or property for current or permanent benefit,
such as special assessments or to user charges for enterprise type services.
Transfer: Movement of cash or other resources between funds.
Unassigned Fund Balance/Retained Earnings: The portion of a fund’s unspent monies, or reserves that are not restricted
for a specific purpose and are available for general appropriation.
Unencumbered Balance: The amount of an appropriation that is neither expended nor encumbered. It is essentially the
amount of money still available for expenditures.
User Fee/Charge: The payment for direct receipt of a service by the party benefiting from the service. These charges may
or may not be designed to recover the full cost associated with providing the service or facility.
Workload Measure/ Indicators: A performance measure identifying how much or how many products or services were
produced.
248
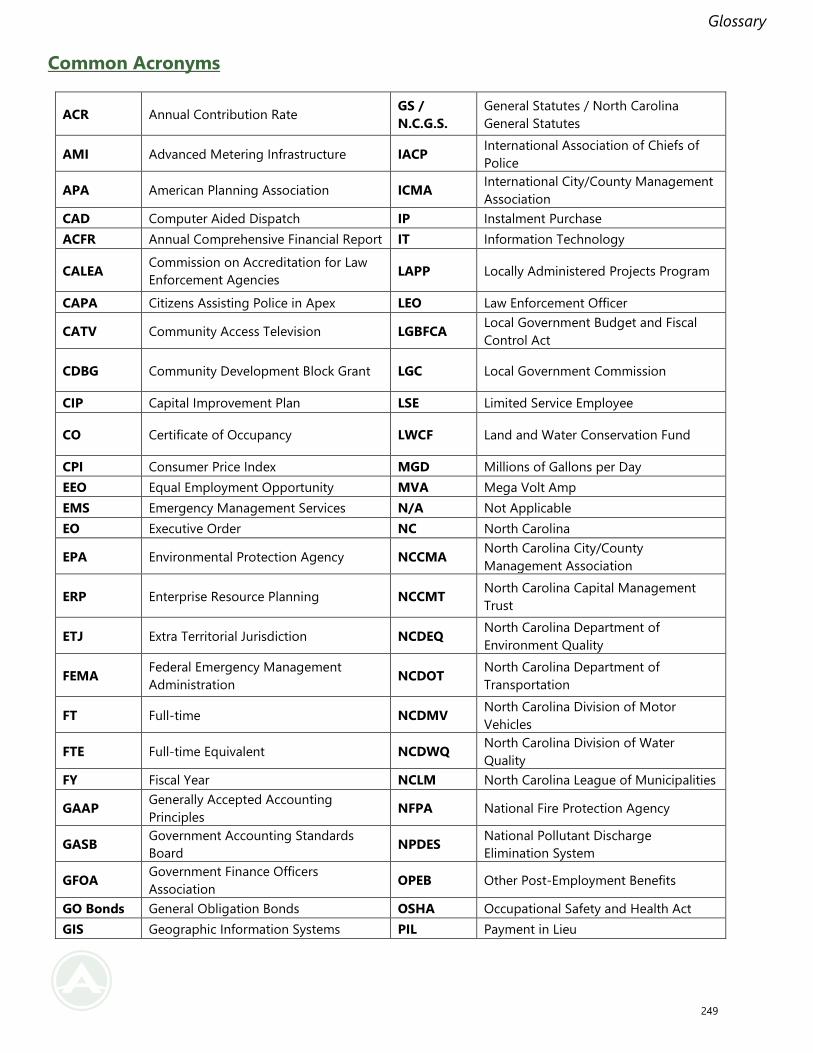
Glossary
Common Acronyms
ACR Annual Contribution Rate GS /
N.C.G.S.
General Statutes / North Carolina
General Statutes
AMI Advanced Metering Infrastructure IACP International Association of Chiefs of
Police
APA American Planning Association ICMA International City/County Management
Association
CAD Computer Aided Dispatch IP Instalment Purchase
ACFR Annual Comprehensive Financial Report IT Information Technology
CALEA Commission on Accreditation for Law
Enforcement Agencies LAPP Locally Administered Projects Program
CAPA Citizens Assisting Police in Apex LEO Law Enforcement Officer
CATV Community Access Television LGBFCA Local Government Budget and Fiscal
Control Act
CDBG Community Development Block Grant LGC Local Government Commission
CIP Capital Improvement Plan LSE Limited Service Employee
CO Certificate of Occupancy LWCF Land and Water Conservation Fund
CPI Consumer Price Index MGD Millions of Gallons per Day
EEO Equal Employment Opportunity MVA Mega Volt Amp
EMS Emergency Management Services N/A Not Applicable
EO Executive Order NC North Carolina
EPA Environmental Protection Agency NCCMA North Carolina City/County
Management Association
ERP Enterprise Resource Planning NCCMT North Carolina Capital Management
Trust
ETJ Extra Territorial Jurisdiction NCDEQ North Carolina Department of
Environment Quality
FEMA Federal Emergency Management
Administration NCDOT
North Carolina Department of
Transportation
FT Full-time NCDMV North Carolina Division of Motor
Vehicles
FTE Full-time Equivalent NCDWQ North Carolina Division of Water
Quality
FY Fiscal Year NCLM North Carolina League of Municipalities
GAAP Generally Accepted Accounting
Principles NFPA National Fire Protection Agency
GASB Government Accounting Standards
Board NPDES
National Pollutant Discharge
Elimination System
GFOA Government Finance Officers
Association OPEB Other Post-Employment Benefits
GO Bonds General Obligation Bonds OSHA Occupational Safety and Health Act
GIS Geographic Information Systems PIL Payment in Lieu
249
Glossary
PIO Public Information Officer TIA Traffic Impact Analysis
PO Purchase Order TIF Tax Increment Financing
PT Part-time TIP Transportation Improvement Program
RCA Resources Conservation Act TP Transportation Plan
RFP Request for Proposals UDO Unified Development Ordinance
SCADA Supervisory Control and Data
Acquisition WWRWRF
Western Wake Regional Water
Reclamation Facility
SCM Stormwater Control Measure
250
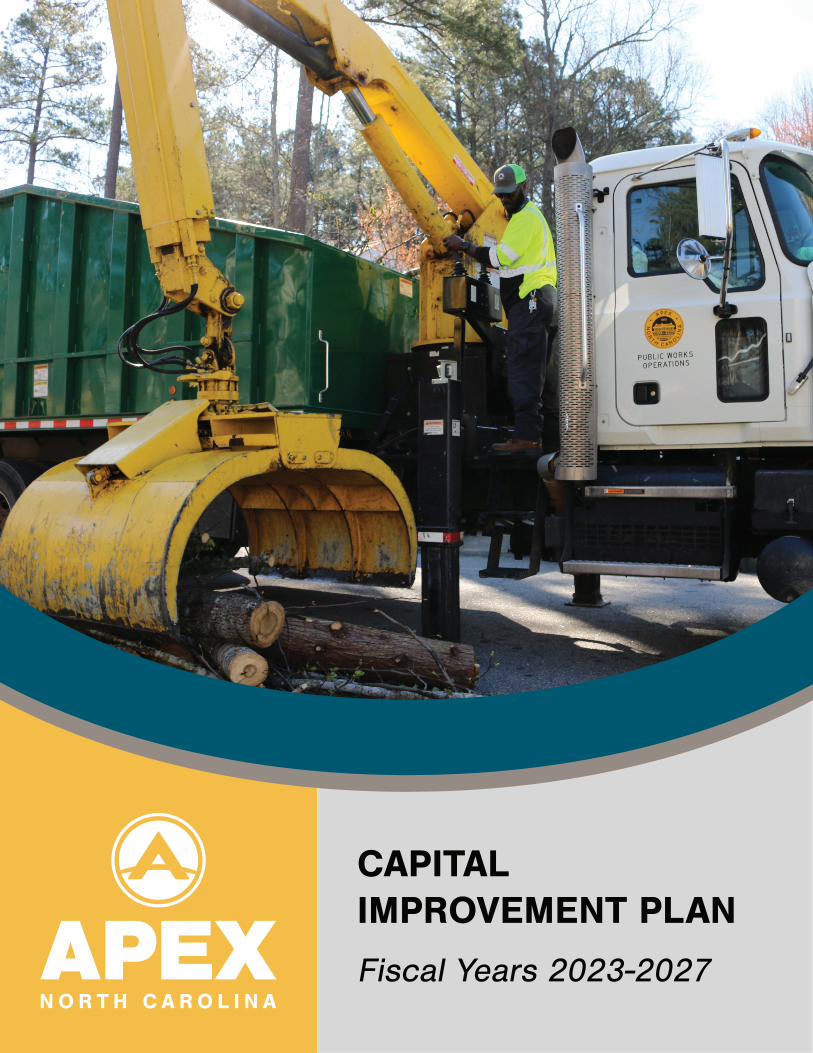
CAPITAL IMPROVEMENT PLAN
Fiscal Years 2023-2027
Table of Contents
Section 1: Overview of the Capital Improvement Plan…………………………………………………………....1
Relationship to the Annual Operating Budget .................................................................................................... 1
CIP Structure ...................................................................................................................................................................... 2
Capital Improvement Funding .................................................................................................................................... 2
The CIP Process ................................................................................................................................................................ 3
Resident Budget Priorities Survey ............................................................................................................................. 5
CIP Practices ....................................................................................................................................................................... 9
Planning By Fund ............................................................................................................................................................. 9
Section 2: General Fund ........................................................................................................................................... 10
Transportation Element Projects ............................................................................................................................. 11
Parks, Recreation, & Cultural Resources Element Projects ........................................................................... 17
Public Safety Element Projects ................................................................................................................................. 21
Public Facilities Element Projects............................................................................................................................. 24
Public Works & Environmental Services Element Projects………………........……………………....……………28
General Fund Summary ............................................................................................................................................... 31
Section 3: CIP Financial Impact Analysis on General Fund .................................................................... 33
Projections and Estimates .......................................................................................................................................... 33
Debt Ratios ....................................................................................................................................................................... 33
Tax Rate Analysis............................................................................................................................................................ 36
Section 4: Electric Utility .......................................................................................................................................... 38
Electric Utility Element Projects ................................................................................................................................ 39
Electric Fund Summary ................................................................................................................................................ 41
Section 5: Water & Sewer Utility ........................................................................................................................ 42
Water & Sewer Element Projects............................................................................................................................. 43
Water & Sewer Fund Summary ................................................................................................................................ 47
Section 6: Project Funding Detail ....................................................................................................................... 48
1
Section 1: Overview of the Capital Improvement Plan
The Capital Improvement Plan (CIP) is the planning mechanism by which the Town Council allocates limited financial
resources to implement long-term goals as defined in the Town’s Strategic Plan, Advance Apex: The 2045 Transportation
Plan, the Downtown Master Plan, the Parks and Recreation Master Plan, and other similar planning documents. The purpose
of the CIP is to forecast and match projected revenues and major capital needs over a five-year period. Capital planning is
an important management tool that strengthens the linkage between community infrastructure needs and the financial
capacity of the town.
The CIP is a multi-year plan for major capital expenditures such as the acquisition of land, construction or significant
renovation of public facilities (i.e. buildings/parks), construction of new transportation infrastructure (i.e. roads, sidewalks,
multi-use paths), expansion or significant renovation of water, wastewater, electric, or stormwater infrastructure, capital
equipment to support operations, or any combination of the above. Projects eligible for inclusion in the CIP are those with
an asset value of greater than $100,000 and a useful life of greater than three years.
When identifying new projects, staff looks to the long-term priorities and direction set by Town Council and submits formal
requests through the CIP process. A formal request includes a description of the project, an explanation of how the project
implements an established goal, the estimated cost of the project, and an estimate of the recurring costs associated with a
completed project (i.e. additional staff, additional utilities, etc.). The formal request also includes an analysis of alternative
solutions, if any, and a statement on the effect on services and/or programs if the project is not funded.
Once adopted by the Town Council, the CIP becomes a statement of town policy regarding the need, priority, timing, and
funding of future capital projects. The Capital Improvement Plan is simply that – a plan. As such, projects and funding
mechanisms are subject to change based on new or shifting service needs, special financing opportunities, emergency needs,
or other directives or priorities established by the Town Council. Future needs and financial constraints may result in changes
in priority over the five-year period; and because priorities can change, projects included in outward planning years are not
guaranteed for funding. The CIP represents the best judgment of Town Administration and Town Council at the time the
Plan is adopted. Priorities established in the CIP subsequently guide decisions made by Town Administration and the various
boards and commissions appointed by Town Council.
The Town of Apex CIP achieves five major objectives as a component of the town’s budget and financial planning process:
1. Helps the town rationally and intelligently plan for the repair, replacement, and acquisition of capital items that are
necessary in providing high-quality services to the residents of Apex.
2. Assists in fiscal planning by forecasting capital demands together with future revenues and expenditures.
3. Ensures better coordination, evaluation, and planning of projects to serve the community and its needs.
4. Serves, together with the annual budget and other financial plans, as a guide to decision-making for the Town
Council, Town Manager, and staff.
5. Serves as a systematic and comprehensive analysis of capital needs, increasing the probability of making rational
budgetary judgments since improvements are identified, prioritized, and matched to the projected fiscal resources
of the town.
Relationship to the Annual Operating Budget
Some CIP projects are funded through annual operating funds, such as the General Fund, Electric Fund, and the Water and
Sewer Fund. In these cases, the CIP and the Annual Operating Budget are directly linked as CIP projects become authorized
through the adoption of the Annual Operating Budget. Projects funded through debt financing also impact the operating
budget through ongoing debt service expense. Finally, some completed CIP projects will directly impact the operating
budget as they will require ongoing expenses for staff and other operating costs.
2
CIP Structure
The CIP is organized into seven functional categories, called “elements,” in order to group projects with similar items.
1. Transportation Element: funds the construction of new roadways, improvements to existing roadways, sidewalks,
bicycle and pedestrian facilities, transit projects, and railroad crossing improvements. Implementation of Advance
Apex: The 2045 Transportation Plan, Bike Apex, and the Downtown Master Plan and Parking Study are funded in this
element.
2. Parks, Recreation, and Cultural Resources Element: funds the acquisition of land for new park and greenway
facilities, the construction of park and recreation amenities, and major maintenance of current facilities.
Implementation of the Parks and Recreation Master Plan is funded in this element.
3. Public Safety Element: funds the acquisition of capital equipment to support the operations of the three public safety
departments in the town (Fire, Police, and Emergency Communications). Public safety facilities are considered in the
public facilities element.
4. Public Facilities Element: funds the construction and major maintenance of general government and public safety
facilities and infrastructure. This element also funds improvements to communications and technology infrastructure.
5. Public Works & Environmental Services Element: funds projects designed to manage and mitigate the effects of
stormwater runoff, manage the collection and disposal of solid waste, and maintain streets. These projects include
structural improvements, Stormwater Control Measure (SCM) construction, and the major maintenance of this
infrastructure. They also include equipment needed to manage solid waste collection and maintain town streets.
6. Electric Utility Element: funds the construction, maintenance, and improvement of electric distribution infrastructure.
These projects include substation additions and upgrades, distribution line extensions, major maintenance of
infrastructure, and the equipment necessary to maintain the system.
7. Water & Sewer Utility Element: funds the construction and improvement of water and sewer infrastructure. These
projects include main additions and replacements, water/wastewater treatment plant renovations/expansions, filter
rehabilitation, pump station additions, major maintenance of infrastructure, and the equipment necessary to maintain
the system.
Capital Improvement Funding
The sources of funding used to execute the Plan are as important as the capital projects contained in the Plan. Capital
Improvements for the Town of Apex are funded using a variety of sources that are broadly categorized as cash or debt
financing.
Cash, or pay-as-you-go (paygo), funds come from sources such as tax revenue, development related fees (recreation,
transportation, and capacity fees), program fees, State revenue, and interest earnings. Some of these sources, such as State
revenue from the Powell Bill, town recreation fees, and certain others, may only be spent to meet certain needs. Other
revenue sources come with no restriction on the needs they may be used to address. Major funding sources for the CIP are
described below:
General Fund: General Fund revenue, such as ad valorem taxes, sales taxes, utility taxes, and other similar revenues are
used to fund town operations and may be used to fund capital projects such as facility improvements, transportation
system improvements, and other similar projects. Compared to other sources, General Fund resources are a flexible
revenue source without restrictions on their use.
Enterprise Funds: Enterprise funds, such as the water/sewer fund and the electric fund, collect user fees as part of their
operations, then invest a portion of that revenue into capital projects. The town uses these funds only for corresponding
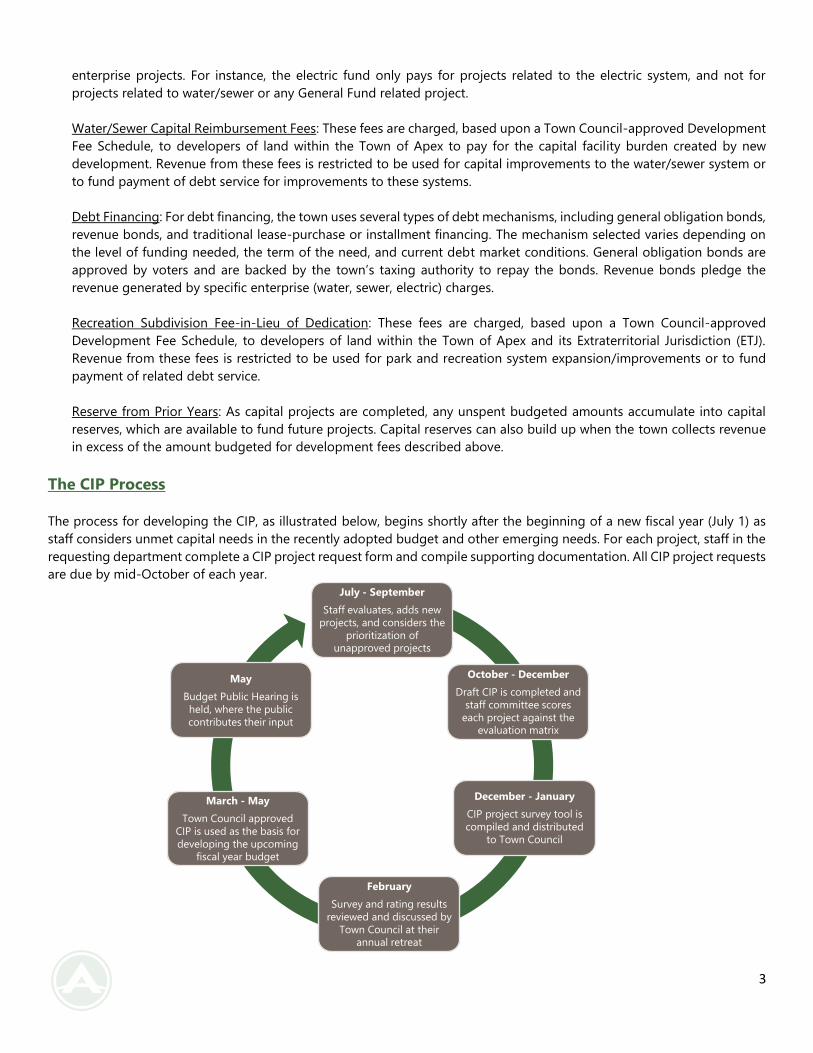
3
enterprise projects. For instance, the electric fund only pays for projects related to the electric system, and not for
projects related to water/sewer or any General Fund related project.
Water/Sewer Capital Reimbursement Fees: These fees are charged, based upon a Town Council-approved Development
Fee Schedule, to developers of land within the Town of Apex to pay for the capital facility burden created by new
development. Revenue from these fees is restricted to be used for capital improvements to the water/sewer system or
to fund payment of debt service for improvements to these systems.
Debt Financing: For debt financing, the town uses several types of debt mechanisms, including general obligation bonds,
revenue bonds, and traditional lease-purchase or installment financing. The mechanism selected varies depending on
the level of funding needed, the term of the need, and current debt market conditions. General obligation bonds are
approved by voters and are backed by the town’s taxing authority to repay the bonds. Revenue bonds pledge the
revenue generated by specific enterprise (water, sewer, electric) charges.
Recreation Subdivision Fee-in-Lieu of Dedication: These fees are charged, based upon a Town Council-approved
Development Fee Schedule, to developers of land within the Town of Apex and its Extraterritorial Jurisdiction (ETJ).
Revenue from these fees is restricted to be used for park and recreation system expansion/improvements or to fund
payment of related debt service.
Reserve from Prior Years: As capital projects are completed, any unspent budgeted amounts accumulate into capital
reserves, which are available to fund future projects. Capital reserves can also build up when the town collects revenue
in excess of the amount budgeted for development fees described above.
The CIP Process
The process for developing the CIP, as illustrated below, begins shortly after the beginning of a new fiscal year (July 1) as
staff considers unmet capital needs in the recently adopted budget and other emerging needs. For each project, staff in the
requesting department complete a CIP project request form and compile supporting documentation. All CIP project requests
are due by mid-October of each year.
July - September
Staff evaluates, adds new
projects, and considers the
prioritization of
unapproved projects
October - December
Draft CIP is completed and
staff committee scores
each project against the
evaluation matrix
December - January
CIP project survey tool is
compiled and distributed
to Town Council
February
Survey and rating results
reviewed and discussed by
Town Council at their
annual retreat
March - May
Town Council approved
CIP is used as the basis for
developing the upcoming
fiscal year budget
May
Budget Public Hearing is
held, where the public
contributes their input
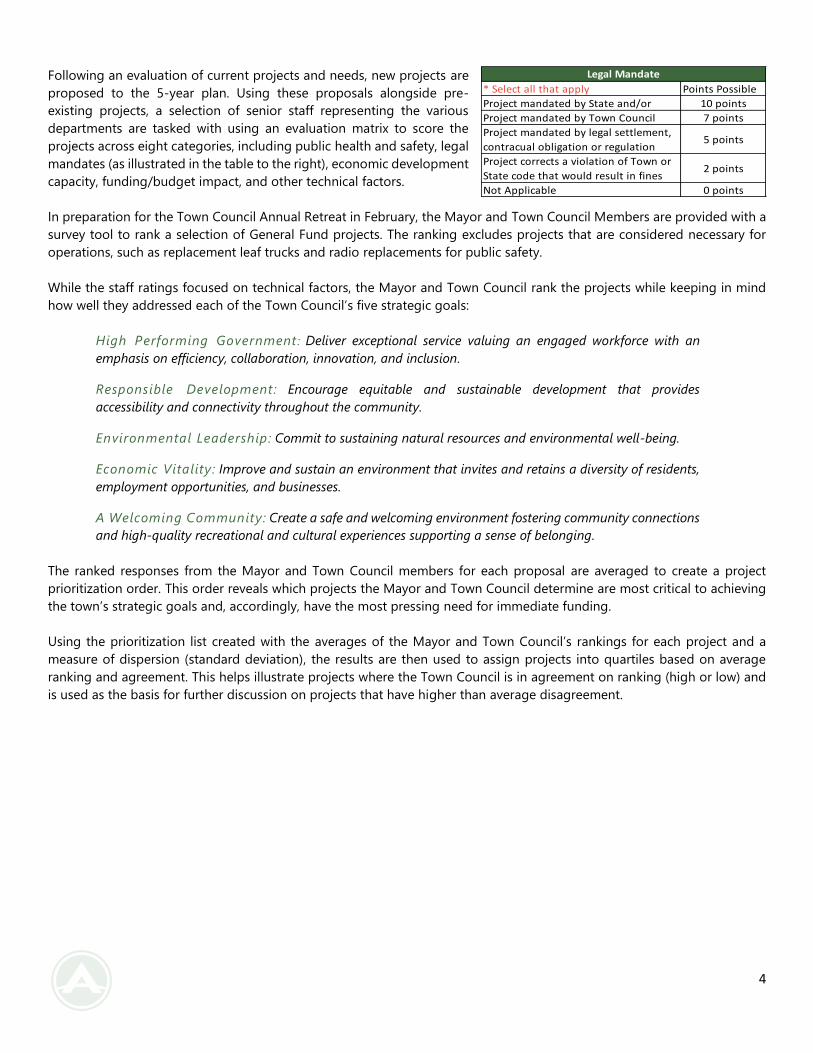
4
Following an evaluation of current projects and needs, new projects are
proposed to the 5-year plan. Using these proposals alongside pre-
existing projects, a selection of senior staff representing the various
departments are tasked with using an evaluation matrix to score the
projects across eight categories, including public health and safety, legal
mandates (as illustrated in the table to the right), economic development
capacity, funding/budget impact, and other technical factors.
In preparation for the Town Council Annual Retreat in February, the Mayor and Town Council Members are provided with a
survey tool to rank a selection of General Fund projects. The ranking excludes projects that are considered necessary for
operations, such as replacement leaf trucks and radio replacements for public safety.
While the staff ratings focused on technical factors, the Mayor and Town Council rank the projects while keeping in mind
how well they addressed each of the Town Council’s five strategic goals:
High Performing Government : Deliver exceptional service valuing an engaged workforce with an
emphasis on efficiency, collaboration, innovation, and inclusion.
Responsible Development : Encourage equitable and sustainable development that provides
accessibility and connectivity throughout the community.
Environmental Leadership: Commit to sustaining natural resources and environmental well-being.
Economic Vitality : Improve and sustain an environment that invites and retains a diversity of residents,
employment opportunities, and businesses.
A Welcoming Community: Create a safe and welcoming environment fostering community connections
and high-quality recreational and cultural experiences supporting a sense of belonging.
The ranked responses from the Mayor and Town Council members for each proposal are averaged to create a project
prioritization order. This order reveals which projects the Mayor and Town Council determine are most critical to achieving
the town’s strategic goals and, accordingly, have the most pressing need for immediate funding.
Using the prioritization list created with the averages of the Mayor and Town Council’s rankings for each project and a
measure of dispersion (standard deviation), the results are then used to assign projects into quartiles based on average
ranking and agreement. This helps illustrate projects where the Town Council is in agreement on ranking (high or low) and
is used as the basis for further discussion on projects that have higher than average disagreement.
* Select all that apply Points Possible
Project mandated by State and/or 10 points
Project mandated by Town Council 7 points
Project mandated by legal settlement,
contracual obligation or regulation5 points
Project corrects a violation of Town or
State code that would result in fines2 points
Not Applicable 0 points
Legal Mandate
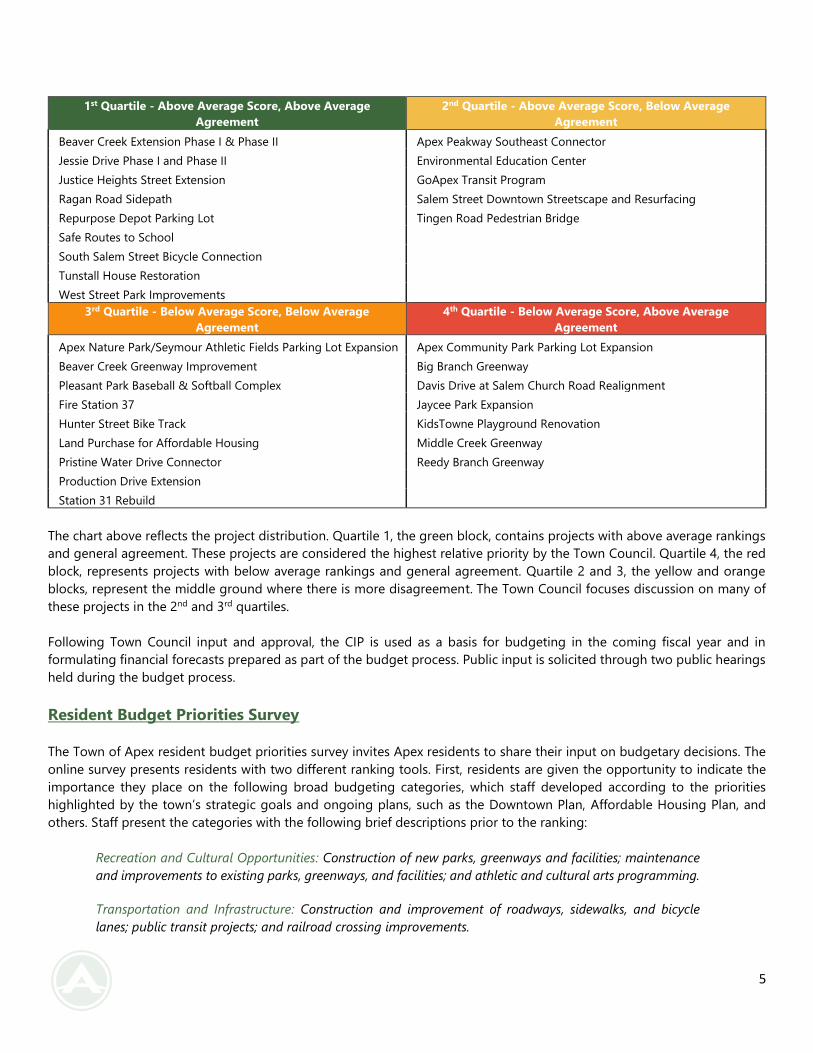
5
1st Quartile - Above Average Score, Above Average
Agreement
2nd Quartile - Above Average Score, Below Average
Agreement
Beaver Creek Extension Phase I & Phase II Apex Peakway Southeast Connector
Jessie Drive Phase I and Phase II Environmental Education Center
Justice Heights Street Extension GoApex Transit Program
Ragan Road Sidepath Salem Street Downtown Streetscape and Resurfacing
Repurpose Depot Parking Lot Tingen Road Pedestrian Bridge
Safe Routes to School
South Salem Street Bicycle Connection
Tunstall House Restoration
West Street Park Improvements
3rd Quartile - Below Average Score, Below Average
Agreement
4th Quartile - Below Average Score, Above Average
Agreement
Apex Nature Park/Seymour Athletic Fields Parking Lot Expansion Apex Community Park Parking Lot Expansion
Beaver Creek Greenway Improvement Big Branch Greenway
Pleasant Park Baseball & Softball Complex Davis Drive at Salem Church Road Realignment
Fire Station 37 Jaycee Park Expansion
Hunter Street Bike Track KidsTowne Playground Renovation
Land Purchase for Affordable Housing Middle Creek Greenway
Pristine Water Drive Connector Reedy Branch Greenway
Production Drive Extension
Station 31 Rebuild
The chart above reflects the project distribution. Quartile 1, the green block, contains projects with above average rankings
and general agreement. These projects are considered the highest relative priority by the Town Council. Quartile 4, the red
block, represents projects with below average rankings and general agreement. Quartile 2 and 3, the yellow and orange
blocks, represent the middle ground where there is more disagreement. The Town Council focuses discussion on many of
these projects in the 2nd and 3rd quartiles.
Following Town Council input and approval, the CIP is used as a basis for budgeting in the coming fiscal year and in
formulating financial forecasts prepared as part of the budget process. Public input is solicited through two public hearings
held during the budget process.
Resident Budget Priorities Survey
The Town of Apex resident budget priorities survey invites Apex residents to share their input on budgetary decisions. The
online survey presents residents with two different ranking tools. First, residents are given the opportunity to indicate the
importance they place on the following broad budgeting categories, which staff developed according to the priorities
highlighted by the town’s strategic goals and ongoing plans, such as the Downtown Plan, Affordable Housing Plan, and
others. Staff present the categories with the following brief descriptions prior to the ranking:
Recreation and Cultural Opportunities: Construction of new parks, greenways and facilities; maintenance
and improvements to existing parks, greenways, and facilities; and athletic and cultural arts programming.
Transportation and Infrastructure: Construction and improvement of roadways, sidewalks, and bicycle
lanes; public transit projects; and railroad crossing improvements.
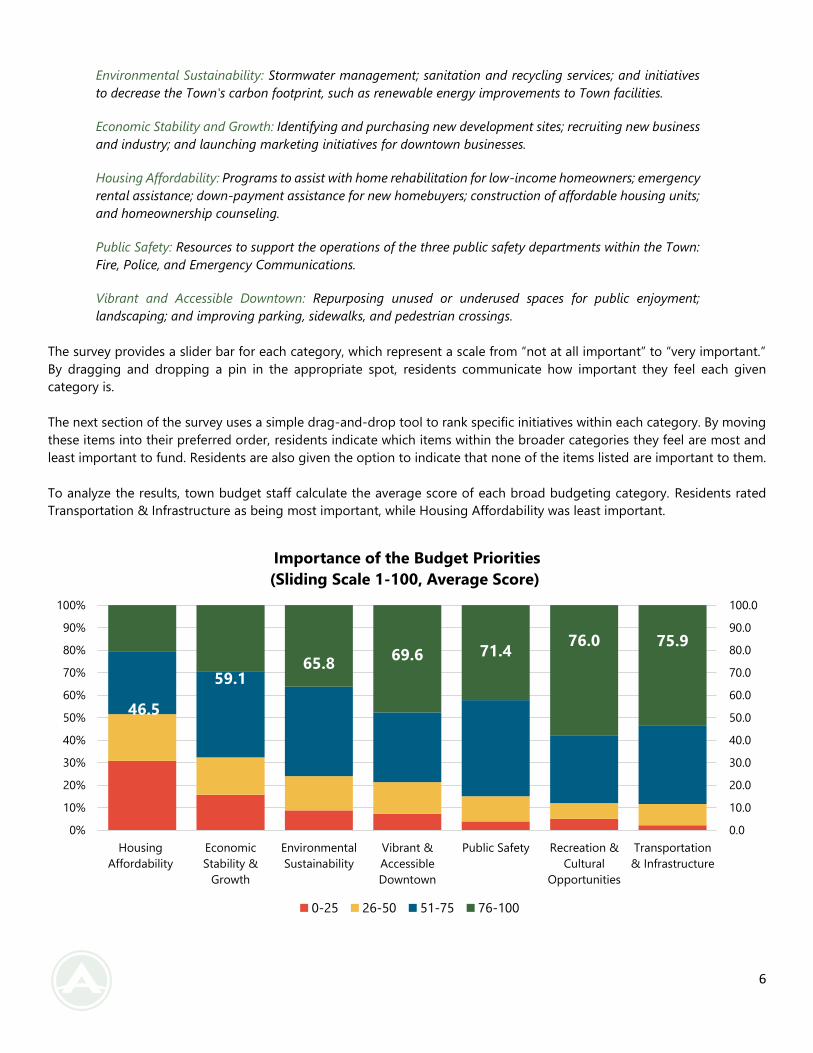
6
Environmental Sustainability: Stormwater management; sanitation and recycling services; and initiatives
to decrease the Town's carbon footprint, such as renewable energy improvements to Town facilities.
Economic Stability and Growth: Identifying and purchasing new development sites; recruiting new business
and industry; and launching marketing initiatives for downtown businesses.
Housing Affordability: Programs to assist with home rehabilitation for low-income homeowners; emergency
rental assistance; down-payment assistance for new homebuyers; construction of affordable housing units;
and homeownership counseling.
Public Safety: Resources to support the operations of the three public safety departments within the Town:
Fire, Police, and Emergency Communications.
Vibrant and Accessible Downtown: Repurposing unused or underused spaces for public enjoyment;
landscaping; and improving parking, sidewalks, and pedestrian crossings.
The survey provides a slider bar for each category, which represent a scale from “not at all important” to “very important.”
By dragging and dropping a pin in the appropriate spot, residents communicate how important they feel each given
category is.
The next section of the survey uses a simple drag-and-drop tool to rank specific initiatives within each category. By moving
these items into their preferred order, residents indicate which items within the broader categories they feel are most and
least important to fund. Residents are also given the option to indicate that none of the items listed are important to them.
To analyze the results, town budget staff calculate the average score of each broad budgeting category. Residents rated
Transportation & Infrastructure as being most important, while Housing Affordability was least important.
46.5
59.165.8
69.6 71.476.0 75.9
0.0
10.0
20.0
30.0
40.0
50.0
60.0
70.0
80.0
90.0
100.0
0%
10%
20%
30%
40%
50%
60%
70%
80%
90%
100%
Housing
Affordability
Economic
Stability &
Growth
Environmental
Sustainability
Vibrant &
Accessible
Downtown
Public Safety Recreation &
Cultural
Opportunities
Transportation
& Infrastructure
Importance of the Budget Priorities
(Sliding Scale 1-100, Average Score)
0-25 26-50 51-75 76-100
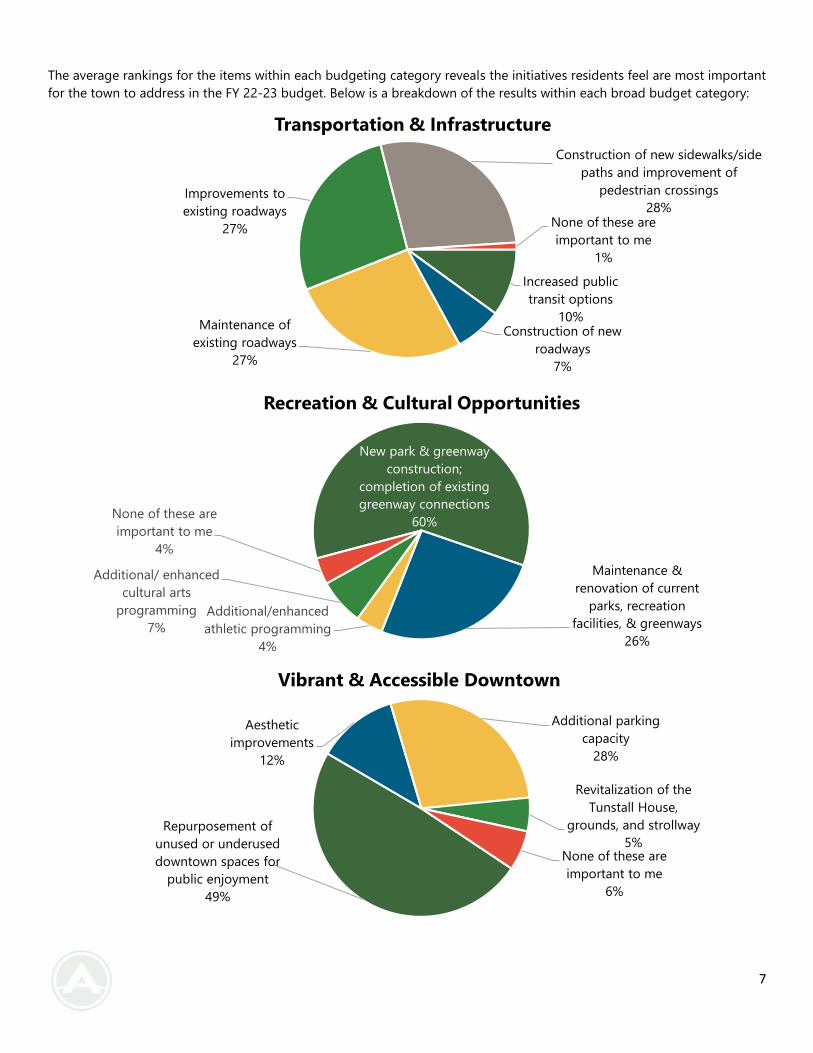
7
The average rankings for the items within each budgeting category reveals the initiatives residents feel are most important
for the town to address in the FY 22-23 budget. Below is a breakdown of the results within each broad budget category:
Increased public
transit options
10%Construction of new
roadways
7%
Maintenance of
existing roadways
27%
Improvements to
existing roadways
27%
Construction of new sidewalks/side
paths and improvement of
pedestrian crossings
28%None of these are
important to me
1%
Transportation & Infrastructure
New park & greenway
construction;
completion of existing
greenway connections
60%
Maintenance &
renovation of current
parks, recreation
facilities, & greenways
26%
Additional/enhanced
athletic programming
4%
Additional/ enhanced
cultural arts
programming
7%
None of these are
important to me
4%
Recreation & Cultural Opportunities
Repurposement of
unused or underused
downtown spaces for
public enjoyment
49%
Aesthetic
improvements
12%
Additional parking
capacity
28%
Revitalization of the
Tunstall House,
grounds, and strollway
5%None of these are
important to me
6%
Vibrant & Accessible Downtown
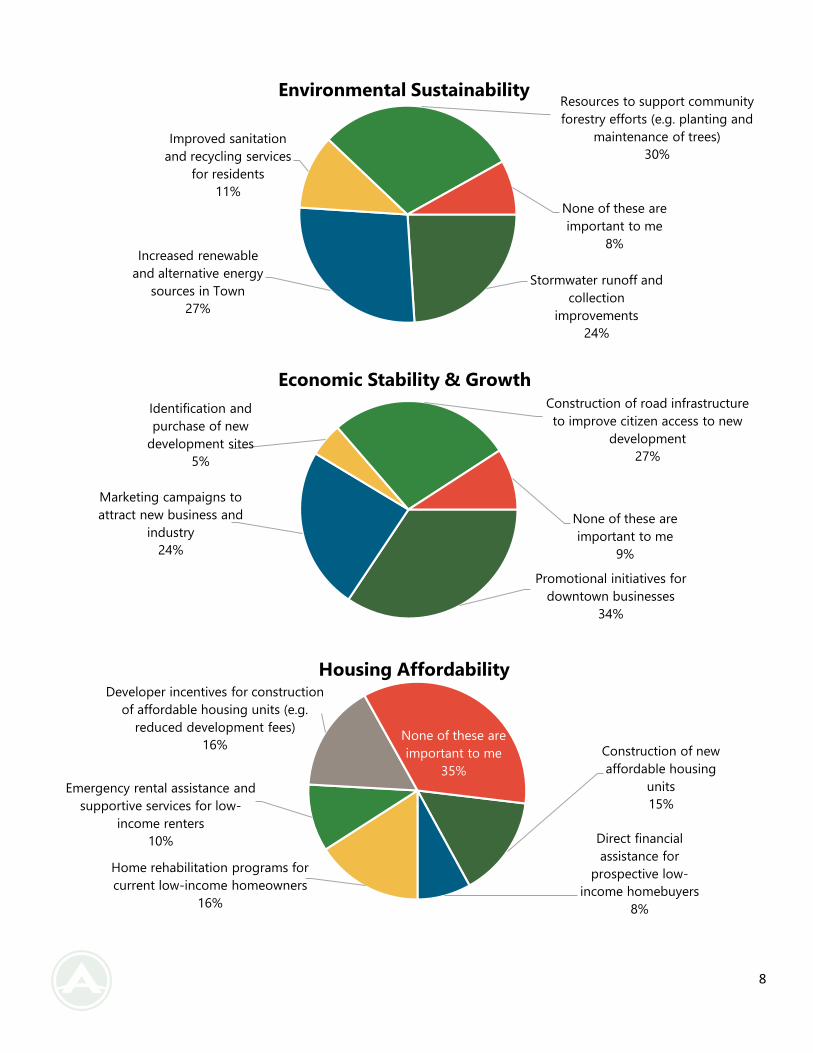
8
Stormwater runoff and
collection
improvements
24%
Increased renewable
and alternative energy
sources in Town
27%
Improved sanitation
and recycling services
for residents
11%
Resources to support community
forestry efforts (e.g. planting and
maintenance of trees)
30%
None of these are
important to me
8%
Environmental Sustainability
Promotional initiatives for
downtown businesses
34%
Marketing campaigns to
attract new business and
industry
24%
Identification and
purchase of new
development sites
5%
Construction of road infrastructure
to improve citizen access to new
development
27%
None of these are
important to me
9%
Economic Stability & Growth
Construction of new
affordable housing
units
15%
Direct financial
assistance for
prospective low-
income homebuyers
8%
Home rehabilitation programs for
current low-income homeowners
16%
Emergency rental assistance and
supportive services for low-
income renters
10%
Developer incentives for construction
of affordable housing units (e.g.
reduced development fees)
16%None of these are
important to me
35%
Housing Affordability
9
The town’s goal in creating the resident budget priorities survey was to gain input from a larger number of residents than it
typically reaches during its two annual budget hearings. With 413 survey responses, the town was able to successfully gain
a fuller picture of what is important to Apex residents. This knowledge will help the Mayor and Town Council ensure town
actions are well aligned with resident needs in the coming fiscal year.
CIP Practices
Long-Range Cost Estimates: Using the upcoming fiscal year as the base, staff will apply cost escalators to better estimate
future construction costs. Staff applies the escalator to new construction and significant building rehabilitations. In some
elements, such as public utilities and transportation, staff applies other escalators developed for those specific service areas.
Closing Projects: Projects are closed when the approved scope of work is complete. Staff reviews project statuses periodically
to identify projects that are finished and can be closed. If the budget for a completed project is not fully expended, generally,
the budget is closed and the remaining balance accumulates in the fund balance. The accumulated fund balance is available
to pay for future projects.
Horizon Issues: The proposed CIP funds the town’s highly prioritized needs. Staff reviews and analyzes the business cases
supporting these projects and considers them ready to move forward. In many situations, however, the town has identified
a future need, but has not yet completed a detailed analysis, considered options, or designed a specific facility. These projects
include facilities, capital maintenance, and business systems that will be needed in the future, often beyond the CIP’s five-
year timeframe.
Planning By Fund
The following sections represent a description of the projects submitted, by element, for the five-year planning timeframe
under consideration. Each element begins with a brief description of what types of projects are funded and includes a tabular
summary of all projects considered and the proposed revenue source to fund the projects in each year. At the end of each
section, there is a summary table showing the total cost of the projects in each year and the total of each revenue source.
More details regarding the cost of borrowing is provided in each summary section. The reference to “Local Revenue” in the
revenue portion of the tables is indicative of the need for current year funding for some projects/purchases in each year.
This could include appropriation of reserve funds from one or more of the major funds: General, Water & Sewer, and Electric.
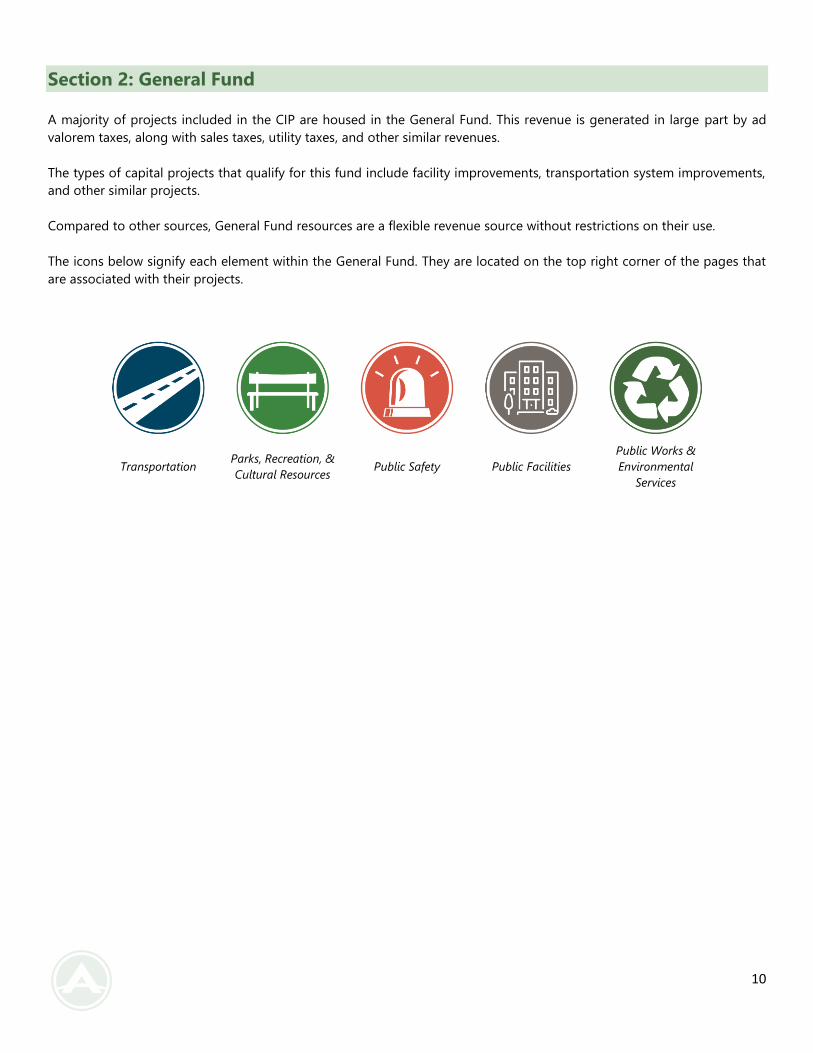
10
Section 2: General Fund
A majority of projects included in the CIP are housed in the General Fund. This revenue is generated in large part by ad
valorem taxes, along with sales taxes, utility taxes, and other similar revenues.
The types of capital projects that qualify for this fund include facility improvements, transportation system improvements,
and other similar projects.
Compared to other sources, General Fund resources are a flexible revenue source without restrictions on their use.
The icons below signify each element within the General Fund. They are located on the top right corner of the pages that
are associated with their projects.
Transportation Parks, Recreation, &
Cultural Resources Public Safety Public Facilities
Public Works &
Environmental
Services
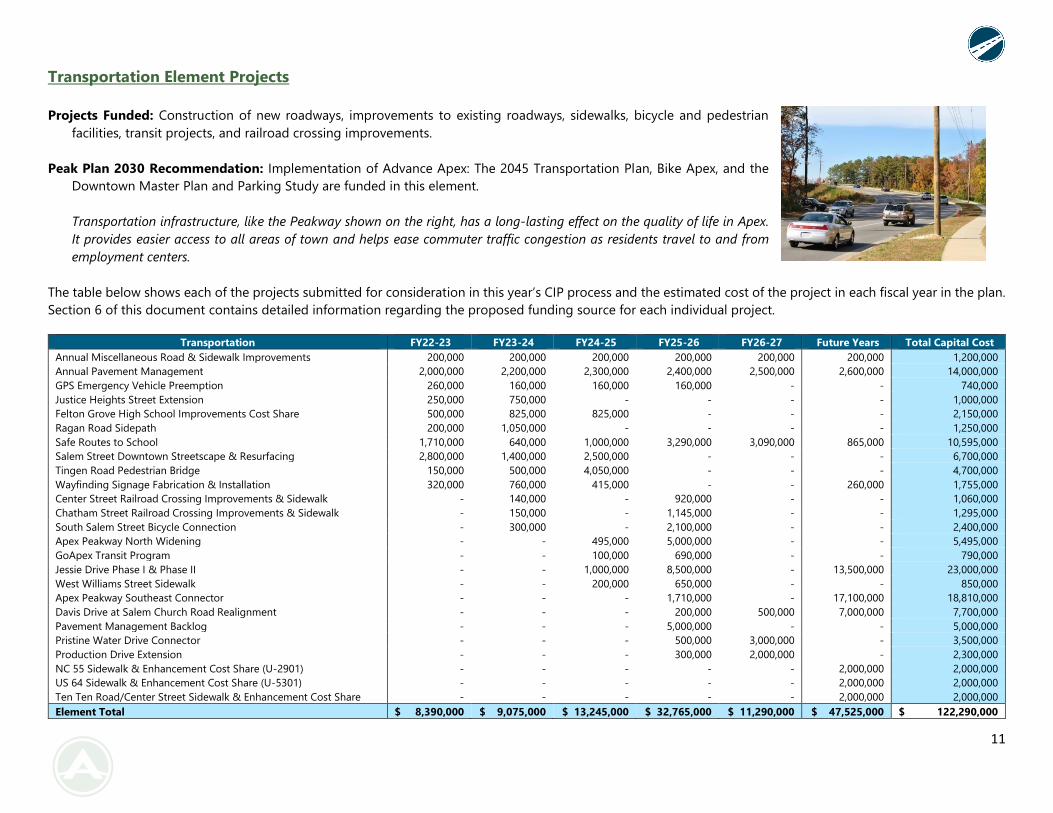
11
Transportation Element Projects
Projects Funded: Construction of new roadways, improvements to existing roadways, sidewalks, bicycle and pedestrian
facilities, transit projects, and railroad crossing improvements.
Peak Plan 2030 Recommendation: Implementation of Advance Apex: The 2045 Transportation Plan, Bike Apex, and the
Downtown Master Plan and Parking Study are funded in this element.
Transportation infrastructure, like the Peakway shown on the right, has a long-lasting effect on the quality of life in Apex.
It provides easier access to all areas of town and helps ease commuter traffic congestion as residents travel to and from
employment centers.
The table below shows each of the projects submitted for consideration in this year’s CIP process and the estimated cost of the project in each fiscal year in the plan.
Section 6 of this document contains detailed information regarding the proposed funding source for each individual project.
Transportation FY22-23 FY23-24 FY24-25 FY25-26 FY26-27 Future Years Total Capital Cost
Annual Miscellaneous Road & Sidewalk Improvements 200,000 200,000 200,000 200,000 200,000 200,000 1,200,000
Annual Pavement Management 2,000,000 2,200,000 2,300,000 2,400,000 2,500,000 2,600,000 14,000,000
GPS Emergency Vehicle Preemption 260,000 160,000 160,000 160,000 - - 740,000
Justice Heights Street Extension 250,000 750,000 - - - - 1,000,000
Felton Grove High School Improvements Cost Share 500,000 825,000 825,000 - - - 2,150,000
Ragan Road Sidepath 200,000 1,050,000 - - - - 1,250,000
Safe Routes to School 1,710,000 640,000 1,000,000 3,290,000 3,090,000 865,000 10,595,000
Salem Street Downtown Streetscape & Resurfacing 2,800,000 1,400,000 2,500,000 - - - 6,700,000
Tingen Road Pedestrian Bridge 150,000 500,000 4,050,000 - - - 4,700,000
Wayfinding Signage Fabrication & Installation 320,000 760,000 415,000 - - 260,000 1,755,000
Center Street Railroad Crossing Improvements & Sidewalk - 140,000 - 920,000 - - 1,060,000
Chatham Street Railroad Crossing Improvements & Sidewalk - 150,000 - 1,145,000 - - 1,295,000
South Salem Street Bicycle Connection - 300,000 - 2,100,000 - - 2,400,000
Apex Peakway North Widening - - 495,000 5,000,000 - - 5,495,000
GoApex Transit Program - - 100,000 690,000 - - 790,000
Jessie Drive Phase I & Phase II - - 1,000,000 8,500,000 - 13,500,000 23,000,000
West Williams Street Sidewalk - - 200,000 650,000 - - 850,000
Apex Peakway Southeast Connector - - - 1,710,000 - 17,100,000 18,810,000
Davis Drive at Salem Church Road Realignment - - - 200,000 500,000 7,000,000 7,700,000
Pavement Management Backlog - - - 5,000,000 - - 5,000,000
Pristine Water Drive Connector - - - 500,000 3,000,000 - 3,500,000
Production Drive Extension - - - 300,000 2,000,000 - 2,300,000
NC 55 Sidewalk & Enhancement Cost Share (U-2901) - - - - - 2,000,000 2,000,000
US 64 Sidewalk & Enhancement Cost Share (U-5301) - - - - - 2,000,000 2,000,000
Ten Ten Road/Center Street Sidewalk & Enhancement Cost Share - - - - - 2,000,000 2,000,000
Element Total $ 8,390,000 $ 9,075,000 $ 13,245,000 $ 32,765,000 $ 11,290,000 $ 47,525,000 $ 122,290,000
12
Continuous Projects
Annual Miscellaneous Road & Sidewalk Improvements $200,000 Annually
This ongoing program addresses various deficiencies throughout Apex on the municipal street system with accessible ramps
and crosswalks, sidewalk maintenance and completion of short gaps in sidewalks, traffic control and warning device
upgrades, and other related requests to provide a safe and accessible transportation system for all users. Without this
program, we delay and bundle small projects while seeking a funding source, in some cases for a year or more.
Annual Pavement Management $2,000,000+ Annually
The town is responsible for maintaining 150 miles of municipal streets, with the annual resurfacing contract providing for
most of the pavement maintenance needs. Street mileage is growing annually with ongoing development. A recent survey
of our streets reveals that we have deferred maintenance that needs to be addressed. This ongoing program focuses on
deficiencies in pavement condition throughout Apex, addressing issues such as potholes, alligator cracking, and rutting in
order to provide a safe and reliable transportation system. The Powell Bill program provides an annual funding allocation
from the state, based on public centerline miles of road accepted and maintained by the town. However, current and future
resurfacing costs continue to exceed Powell Bill allocations, requiring additional General Fund revenues to be allocated.
FY 2022-23
GPS Emergency Vehicle Preemption $740,000 Four-year Total
In the first year, this project includes installing GPS preempt in 10 traffic signals and outfitting all fire vehicles with GPS
preempt capability. Emergency vehicle preemption is designed to give emergency response vehicles a green light on their
approach to a signalized intersection while providing a red light to conflicting approaches. Future years include adding GPS
preemption at 10 signals/year, prioritizing major corridors (including NC 55, Salem Street, Center Street/Ten Ten Road, and
Apex Peakway), and various signals adjacent to those major corridors. Without this system, time-saving benefits of having
preemption for multiple directions of traffic flow along major routes would not be realized. Existing infrared preemption is
only available for certain directions at four signals town wide and Apex Fire Department no longer has infrared emitters.
Justice Heights Street Extension $1,000,000 Two-year Total
This project includes extending Justice Heights Street from its existing stub west of South Salem Street to intersect Apex
Peakway and adds sidewalk on the north side of the street. The project would provide improved local connectivity for traffic
flow south of NC 55 and pedestrian connectivity between Salem Street and Apex Peakway through the Justice Heights
neighborhood. If the project is not funded, there will continue to be a gap in the transportation network between Salem
Street and Apex Peakway for this local area.
Felton Grove High School Improvements Cost Share $2,150,000 Three-year Total
This project will contribute funds toward intersection improvements as part of the construction of proposed Felton Grove
High School (2025 anticipated opening) that would not otherwise be constructed if they are beyond the required
improvements for Wake County Public School System (WCPSS). Without this project, there would be potential capacity and
safety issues at multiple access points to the school. Funding is being prioritized ahead of construction in order to enter into
an agreement with the school. Payment will be expected in 2025.
13
Ragan Road Sidepath $1,250,000Two-year Total
This project includes creating a connection from the Ragan Road sidepath to the American Tobacco Trail. Currently, residents
surrounding Ragan Road have been using the sidepath along Ragan Road to the terminus and then walking along Ragan
Road and cutting through a private property to access the southern end of the American Tobacco Trail.
Safe Routes to School $10,595,000 Six-year Total
The project will improve and add to existing Town infrastructure related to pedestrian and bicycle traffic to/from school.
This five-phase project includes adding sidewalks, pedestrian facilities, and safe crosswalks in the areas surrounding Apex
Elementary School, Apex Middle School, Apex Friendship Schools, Laurel Park Elementary, Baucom Elementary, Olive Chapel
Elementary, Scotts Ridge Elementary, Salem Schools, and Thales Academy Elementary School. These phases were identified
through an analysis of safe routes to school needs. Without the project there will continue to be gaps in the sidewalk network
and other deficiencies in the transportation system that make walking and biking to school difficult.
Salem Street Downtown Streetscape & Resurfacing $6,700,000 Three-year Total
This project includes: (1) Saunders Parking Lot expansion with Smart Parking, (2) Improvements to Commerce, Seaboard,
and The Peak Alley, and (3) the curbless permeable-paver Salem Streetscape with 10 on-street spaces and street trees, plus
Saunders Street gathering space, based on the schematic designs approved by Town Council in 2021. Improving these
spaces was identified as a "Top 10" priority in the plan. This project includes resurfacing Salem Street from Hunter Street to
NC 55, the addition of marked on street parking north of Center Street by shifting the road center line, and the removal of
on street parking between Saunders Street and Chatham Street in order to widen sidewalk and provide planting beds,
landscaping, and pedestrian amenities. If the project is not funded, the pavement will continue to degrade and the vision of
Salem Street shown in the Downtown Plan, of improving the walking and driving experience to promote accessibility and
downtown growth as a focal point for the community, will not be realized.
Tingen Road Pedestrian Bridge $4,700,000 Three-year Total
This project is for the construction of a pedestrian bridge over the railroad crossing of Tingen Road. This at-grade railroad
crossing will be closed as part of the Apex Peakway Southwest Connector project per the agreement with CSX. Construction
of the pedestrian bridge will provide a space for members of the community to safely cross the railroad tracks on Tingen
Road to access downtown Apex, multi-family residential developments, multiple churches, and Apex Elementary School. If
it is not completed, the railroad crossing will become a barrier to the pedestrian network within the Town Center. A feasibility
study will determine more accurate scope and cost with public involvement.
Wayfinding Signage Fabrication & Installation $1,755,000 Four-year Total
This project includes fabrication and installation of Wayfinding signage throughout town. Sign types include parking
directional, vehicular directional, pedestrian directional, destination identification, and gateway signage. This project was
identified as part of the Downtown Plan & Parking Study and is an extension of the Community Branding Study. If it is not
completed, the town will not meet the objective of the Wayfinding Signage Program to provide consistent and attractive
information to help residents and visitors discover and navigate to key destinations in town.
14
FY 2023-24
Center Street Railroad Crossing Improvements & Sidewalk $1,060,000 Two-year Total
This project includes improvement of the road-crossing surface with the addition of concrete panels and addition of sidewalk
across CSX railroad tracks, as well as four quadrant gates and associated railroad equipment upgrades. Current review of
statewide prioritization shows this may score well enough to allow for 70 percent state funding. Without it, the sidewalk will
continue to stop short of the tracks on each side, forcing pedestrians onto the roadway, and the crossing surface will
continue to compromise ride comfort. An additional benefit is the potential to create a quiet zone at this crossing. This
project also includes sidewalk along the north side of Center St from N Salem St to N Hughes St.
Chatham Street Railroad Crossing Improvements & Sidewalk $1,295,000 Two-year Total
This project includes addition of sidewalk across CSX railroad tracks, as well as 4-quad gates and associated RR equipment
upgrades. Current review of statewide prioritization shows this may score well enough to allow for 70 percent state funding.
Without it, sidewalk will continue to stop short of the tracks on each side, forcing pedestrians onto the roadway, and the
quiet zone will not be able to move forward. This project also includes sidewalk along East Chatham Street from South
Mason Street to the cul-de-sac. This sidewalk segment is a high-priority Safe Routes to School Project and is combined with
the railroad crossing improvements for construction efficiencies and to complete pedestrian connectivity along the corridor.
South Salem Street Bicycle Connection $2,400,000 (Pleasant Park to Apex Peakway) Two-year Total
This project will add bike lanes along S Salem Street from Pleasant Park to Hunter Street. This project was identified as the
second highest priority in Bike Apex: The Comprehensive Bicycle Plan. If it is not completed, the town will not meet the
objective of prioritizing bicycle improvements along a designated bicycle route and major thoroughfare.
FY 2024-25
GoApex Transit Program $790,000 Two-year Total
This project represents funds for improvements to GoApex Route 1 and expansion of the local public transportation services
to offer a second route, GoApex Route 2. The first local transit route, GoApex Route 1, began operating in 2021. It is
anticipated that, after several years of operating, ridership will be quantified and priority locations for shelters and other
enhancements on GoApex Route 1 will be identified.
Jessie Drive Phase I & Phase II $23,000,000 Three-year Total
This project would connect Jessie Drive to NC 55, providing a major thoroughfare between Ten Ten Road and NC 55 south
of US 1. The road would serve development of adjacent land, including industrial and commercial areas, and relieve some
of the congestion along Ten Ten Road near the US 1 interchange. In the event of major closures or delays on NC 55 or Ten
Ten Road, it would provide an east-west detour. Without it, adjacent development would be responsible for building sections
of Jessie Drive, but it is unlikely that the entire route from NC 55 to Ten Ten Road would be completed. In the interim,
development will burden existing connections, which are either already congested or offer less capacity.
West Williams Street Sidewalk $850,000 Two-year Total
This project would complete gaps in the sidewalk in front of Beaver Creek Commons shopping center, crossing the US 64
eastbound off ramp, connecting across the bridge over US 64, and extending to the intersection at Vision Drive. Current
review of statewide prioritization shows this may score well enough to allow for 70 percent state funding. Signalized
15
crosswalks would be installed at the existing traffic signals on both ends of this project. Without it, pedestrians will continue
traveling along the shoulder of the road and both ends of this project will lack accessible ramps and crosswalks.
FY 2025-26
Apex Peakway Southeast Connector $18,810,000(NC 55 to Center Street) Two-year Total
The proposed project would complete the final gap in the Apex Peakway, completing a full loop around downtown Apex.
The construction of Apex Peakway was identified as a high priority in Apex. It will become increasingly important given
anticipated delays to NCDOT's widening of the NC 55 corridor between US 1 and Olive Chapel Road. The completed Apex
Peakway loop will provide a needed alternative to the NC 55 corridor through Apex. Without completing this project, there
will not be an intuitive relief valve for NC 55, nor will there be an alternative designed to handle the anticipated volume of
traffic. This request is consistent with the Apex Peakway Southeast Connector Feasibility Study, completed in June 2018.
Davis Drive at Salem Church Road Realignment $7,700,000 Three-year Total
This project would realign Davis Drive to improve the horizontal curvature as well as add turn lanes and extend Salem Church
Road. The intersection would be shifted west, away from the CSX RR freight line, allowing for vehicle stacking beyond the
tracks and the installation of a traffic signal and gate arms. Without this project, it is possible that Salem Church Road will
eventually be converted to right in-right out, and/or safety concerns will persist for the following issues: no left turn on Davis
Drive backing up traffic southbound, no space for a traffic signal or gate arms to warn of an approaching train, and limited
visibility around the curve on Davis Drive.
Pavement Management Backlog $5,000,000
This project is designed to catch up on our backlog of streets in need of rehabilitation over a two-year period. This
supplements the ongoing program that manages roadway infrastructure conditions throughout Apex on the municipal
street system by optimizing strategies for maintaining pavements in serviceable condition at the lowest cost, providing a
safe and reliable transportation system. Without it, we would continue to lag behind on street maintenance needs, the
overall condition of streets would degrade, and maintenance costs over time would increase substantially.
Pristine Water Drive Connector $3,500,000 (Pristine Water Drive to Lufkin Road) Two-year Total
This project would extend a connector street from Burma Drive to Lufkin Road. Construct 700 feet of minor connector street
west to Pristine Water Drive, upgrade 1,300 feet of Pristine Water Drive (west and northwest) to a public street, and upgrade
1,000 feet of an existing concrete private driveway to a public street connecting Pristine Water Drive to Lufkin Road to serve
existing municipal and private industrial uses, as well as add a second point of access to the Cash Corporate Center for
economic development. Without this connectivity, the town would not be able to meet the needs of prospective major
employers seeking access in accordance with the Transportation Plan, and thus, it would be difficult to attract such
businesses to Apex at this time.
Production Drive Extension $2,300,000 Two-year Total
This project would extend Production Drive south for approximately 3,000 feet to the future extension of Jessie Drive. In
conjunction with Jessie Drive, this would provide improved connectivity for economic development areas, including the
town's certified site, as well as an alternative route to avoid Ten Ten Road for residential development south of Jessie Drive.
In the interim, development will continue to depend on existing Jessie Drive and Smith Road/Stephenson Road, as well as
residential streets with no convenient alternatives to Ten Ten Road.
16
Horizon
NC 55 Sidewalk & Enhancement Cost Share (U-2901) $2,000,000
Transportation Improvement Program (TIP) project U-2901 will widen NC 55 from US 1 to Olive Chapel Road. This project
will provide the enhancements the town requests, which include pedestrian facilities (sidewalk and path), aesthetic
treatments at new CSX Bridge, and median enhancement and landscaping. As part of TIP U-2901, NCDOT will replace
existing pedestrian facilities, but not complete gaps where there are no existing facilities without the town sharing a portion
of the costs. Similarly, NCDOT will not provide an enhanced streetscape unless the town shares a portion of the costs.
US 64 Sidewalk & Enhancement Cost Share (U-5301) $2,000,000
This project will convert the intersections of US 64 at Lake Pine Drive and US 64 at Laura Duncan Road to an interchange,
and convert US 64 from Laura Duncan Road to US 1 to a superstreet. This project will provide funding for enhancements
the town requests as part of the widening project. Enhancements are likely to include protected pedestrian facilities,
including sidewalk, multi-use path, and crossings. NCDOT will replace existing pedestrian facilities, but will not complete
gaps where there are no existing facilities unless the town shares a portion of the costs.
Ten Ten Road/Center Street Sidewalk & Enhancement Cost Share $2,000,000
This project will provide enhancements the town requests as part of the NCDOT widening project (Ten Ten Road from Apex
Peakway to Kildaire Farm Road in the Town of Cary). Enhancements include pedestrian facilities (sidewalk and multi-use
path), median treatments, and landscaping. As part of the state’s TIP U-5825, NCDOT will replace existing pedestrian
facilities, but will not complete gaps where there are no existing facilities unless the town shares a portion of the costs.
Similarly, NCDOT will not provide an enhanced streetscape unless the town shares a portion of the costs.
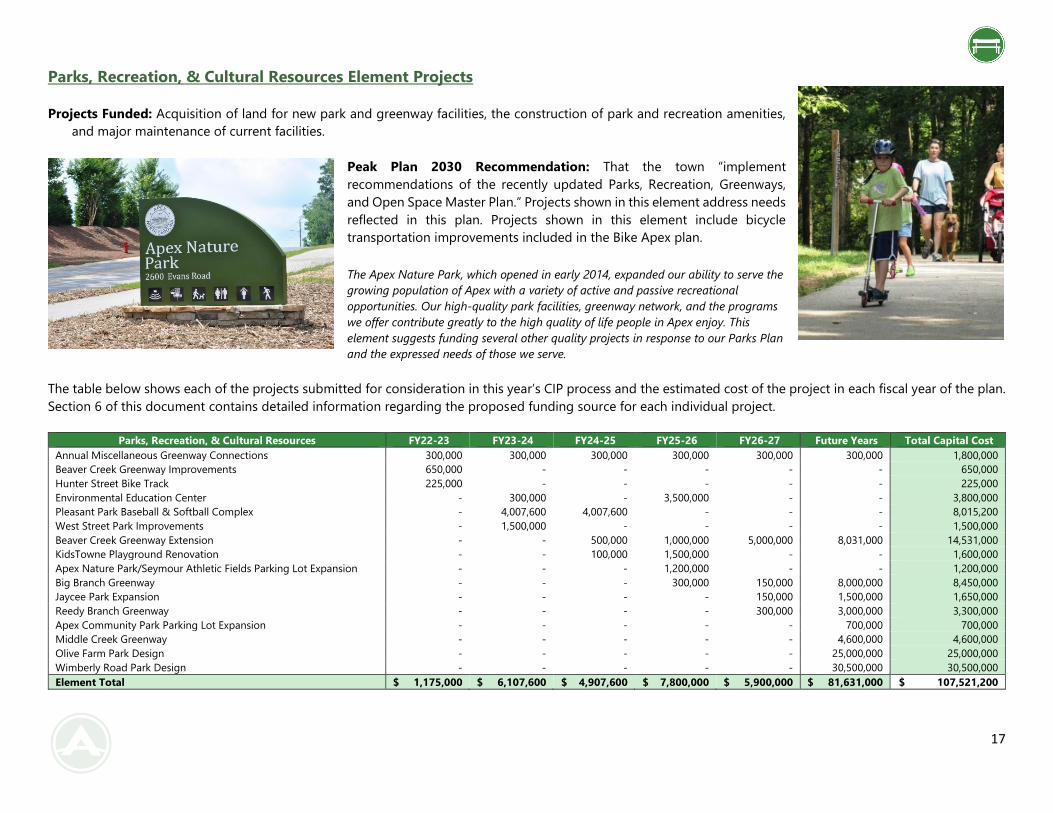
17
Parks, Recreation, & Cultural Resources Element Projects
Projects Funded: Acquisition of land for new park and greenway facilities, the construction of park and recreation amenities,
and major maintenance of current facilities.
Peak Plan 2030 Recommendation: That the town “implement
recommendations of the recently updated Parks, Recreation, Greenways,
and Open Space Master Plan.” Projects shown in this element address needs
reflected in this plan. Projects shown in this element include bicycle
transportation improvements included in the Bike Apex plan.
The Apex Nature Park, which opened in early 2014, expanded our ability to serve the
growing population of Apex with a variety of active and passive recreational
opportunities. Our high-quality park facilities, greenway network, and the programs
we offer contribute greatly to the high quality of life people in Apex enjoy. This
element suggests funding several other quality projects in response to our Parks Plan
and the expressed needs of those we serve.
The table below shows each of the projects submitted for consideration in this year’s CIP process and the estimated cost of the project in each fiscal year of the plan.
Section 6 of this document contains detailed information regarding the proposed funding source for each individual project.
Parks, Recreation, & Cultural Resources FY22-23 FY23-24 FY24-25 FY25-26 FY26-27 Future Years Total Capital Cost
Annual Miscellaneous Greenway Connections 300,000 300,000 300,000 300,000 300,000 300,000 1,800,000
Beaver Creek Greenway Improvements 650,000 - - - - - 650,000
Hunter Street Bike Track 225,000 - - - - - 225,000
Environmental Education Center - 300,000 - 3,500,000 - - 3,800,000
Pleasant Park Baseball & Softball Complex - 4,007,600 4,007,600 - - - 8,015,200
West Street Park Improvements - 1,500,000 - - - - 1,500,000
Beaver Creek Greenway Extension - - 500,000 1,000,000 5,000,000 8,031,000 14,531,000
KidsTowne Playground Renovation - - 100,000 1,500,000 - - 1,600,000
Apex Nature Park/Seymour Athletic Fields Parking Lot Expansion - - - 1,200,000 - - 1,200,000
Big Branch Greenway - - - 300,000 150,000 8,000,000 8,450,000
Jaycee Park Expansion - - - - 150,000 1,500,000 1,650,000
Reedy Branch Greenway - - - - 300,000 3,000,000 3,300,000
Apex Community Park Parking Lot Expansion - - - - - 700,000 700,000
Middle Creek Greenway - - - - - 4,600,000 4,600,000
Olive Farm Park Design - - - - - 25,000,000 25,000,000
Wimberly Road Park Design - - - - - 30,500,000 30,500,000
Element Total $ 1,175,000 $ 6,107,600 $ 4,907,600 $ 7,800,000 $ 5,900,000 $ 81,631,000 $ 107,521,200
18
Continuous Projects
Annual Miscellaneous Greenway Connections $300,000 Annually
This ongoing program would allow for the study and prioritization of proposed connections of existing greenways. As
requests for connections continue to increase each year, without funding for this program, we would lack the resources to
properly identify the viability of the proposed connections.
FY 2022-23
Beaver Creek Greenway Improvements $650,000
This project will relocate, replace, and rebuild a section of greenway that is flooding/holding standing water on Beaver Creek
Greenway. Improvements include repair of shoulder and trail surface from Jaycee Park to Kelly Road Park as identified in
engineered analysis inventory. This study prioritized maintenance and repair for safety and user experience. Installation of
boardwalk near Kelvington Court to address flooding in wetland area.
Hunter Street Bike Track $225,000
This project includes the construction of a bike track on recently acquired vacant land, at the north end of the park. Bike
track to consist of natural surfaces with obstacles, mounds, and other features to allow for off road biking challenges, similar
to mountain biking facilities but in circular track route. No additional parking will be added. An accessible route will link to
the new facility.
FY 2023-24
Environmental Education Center $3,800,000 Two-year Total
The Nature and Environmental Education facility was part of the initial Master Plan for the Nature Park site that was part of
a 2004 bond package. The intent is to utilize this facility as a headquarters for the operation of the park and to provide
someone on-site to program and oversee the park. Additionally, it would be a place where environmental and nature exhibits
can be seen as part of the town's effort to educate and support environmental initiatives such as conservation and good
stewardship. It is envisioned that a large portion of the potential programming for this facility would be achieved through
town initiatives and by developing collaborative relationships with area schools and universities.
Pleasant Park Baseball & Softball Complex $8,015,200Two-year Total
This is the baseball/softball complex designed as part of the Pleasant Park master plan. There are 4 fields of ranging sizes,
fieldhouse with restrooms, office, meeting, and concession spaces, a maintenance storage building, concourse with seating,
2 signature fields with stadium type seating, 4 batting cages, and support facilities.
West Street Park Improvements $1,500,000
This project includes the renovation of West Street park with installation of sanitary sewer for restroom/shelter, accessible
route through park, expanded and lighted basketball court, and other improvements; requested as part of the Master
planning for West Street Park, developed through community input.
19
FY 2024-25
Beaver Creek Greenway Extension $14,531,000 Four-year Total
This project includes the extension of greenway from Nature Park to Arcadia West and Buckhorn Preserve as well as an
extension from Jaycee Park under Highway 55.
KidsTowne Playground Renovation $1,600,000Two-year Total
This community-built wood playground is now 21 years old and while the routine maintenance and replacement of
components is ongoing, the life of the structure is limited. This project would undertake the demolition of existing
equipment and replace with new.
FY 2025-26
Apex Nature Park/Seymour Athletic Fields Parking Lot Expansion $1,200,000
With the conversion of the Seymour Athletic Fields to synthetic turf and the current volume of use, there is a need for
expanded parking to keep patrons from parking on Evans Road. This proposal would add approximately 50 parking spaces
to town-owned property on the other side of Evans Road and install an at-grade pedestrian crossing into the Nature Park.
Big Branch Greenway $8,450,000 Three-year Total
This project will complete greenway along corridor from James Street, South to US 1 providing links to proposed transit
routes and serving as a connection to existing neighborhoods.
FY 2026-27
Jaycee Park Expansion $1,650,000 Two-year Total
The expansion of Jaycee Park, adjacent to the Apex Peakway, adds new amenities that include an open play field, shelter,
playground, and additional parking, which will serve multiple neighborhoods within walking distance of the park. This will
also connect to the Beaver Creek Greenway and existing Jaycee Park amenities.
Reedy Branch Greenway $3,300,000 (Abbington-Kelly Road West to Goliath Lane) Two-year Total
This project will complete a greenway gap between the sidepath along Kelly Road (connects to Kelly Road Park Olive Chapel
Elementary School, commercial/office) and the sidepath along Beaver Creek Commons Drive to commercial/retail and
transit.
Horizon
Apex Community Park Parking Lot Expansion $700,000
This project would reconfigure the existing parking area and add approximately 30 spaces to service greenway, shelters,
fitness course, tennis courts, playgrounds, basketball courts, and special events.
20
Middle Creek Greenway $4,600,000 (Gladstone North to Center Street)
This extension of Middle Creek Greenway runs through the Pinnacle Park project connecting from Gladstone in the Proposed
Horton Park Subdivision, crossing Jesse Drive, through the Cash Corporate site, to Lufkin Road Middle School terminating
at Center Street/SR1010.
Olive Farm Park Design $25,000,000
The town acquired approximately 22 acres of land for a future park in Southwest Apex in August of 2017. The 2022 Master
Plan update will include a conceptual plan with recommended facilities to meet community needs. Early responses from
public input indicate the possibility of a recreation center, open play space, active and passive recreation with significant
environmental components.
Wimberly Road Park Design $30,500,000
In September of 2017, the town purchased approximately 30 acres of land with the intention of developing a regional park
in the northwest quadrant of Apex. The 2022 Master Plan update will include a conceptual plan with recommended facilities
to meet community needs. The Wimberly Road parkland is significant in its location near the White Oak Creek watershed
area, access to the American Tobacco Trail, and East Coast Greenway. Preliminary project needs per public input include
indoor recreation space (gymnasium/classrooms), passive open space, community gardens, and environmental education
and conservation opportunities.
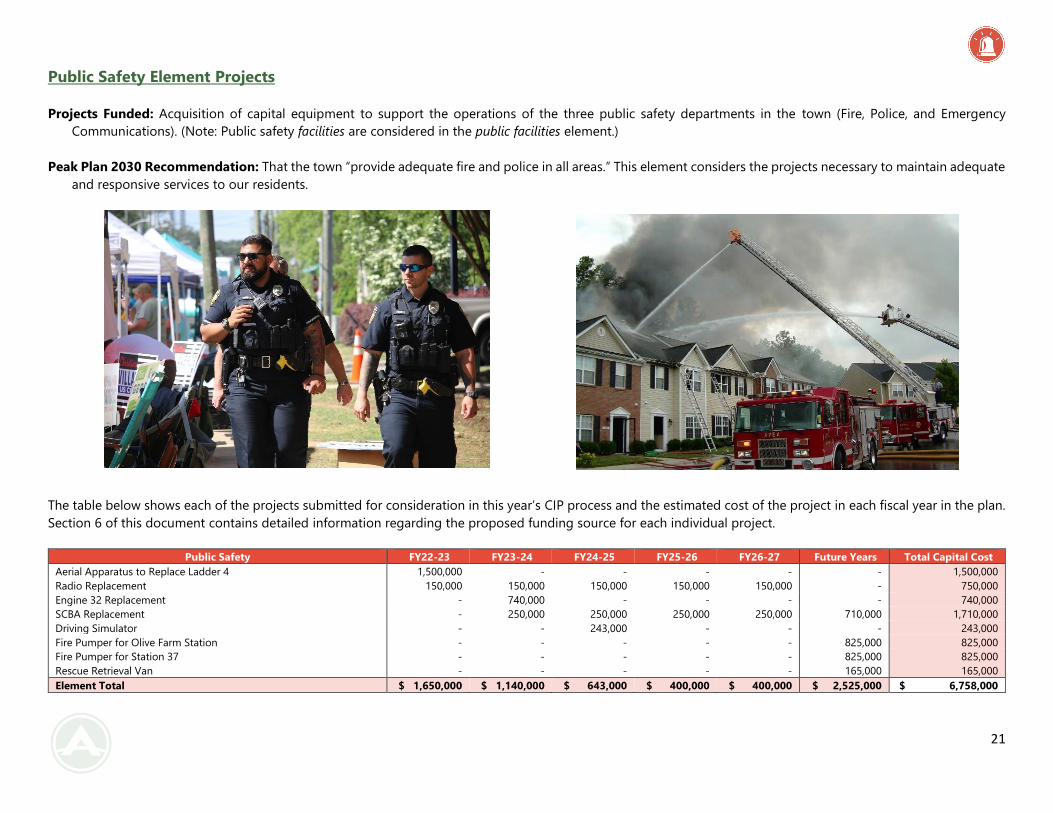
21
Public Safety Element Projects
Projects Funded: Acquisition of capital equipment to support the operations of the three public safety departments in the town (Fire, Police, and Emergency
Communications). (Note: Public safety facilities are considered in the public facilities element.)
Peak Plan 2030 Recommendation: That the town “provide adequate fire and police in all areas.” This element considers the projects necessary to maintain adequate
and responsive services to our residents.
The table below shows each of the projects submitted for consideration in this year’s CIP process and the estimated cost of the project in each fiscal year in the plan.
Section 6 of this document contains detailed information regarding the proposed funding source for each individual project.
Public Safety FY22-23 FY23-24 FY24-25 FY25-26 FY26-27 Future Years Total Capital Cost
Aerial Apparatus to Replace Ladder 4 1,500,000 - - - - - 1,500,000
Radio Replacement 150,000 150,000 150,000 150,000 150,000 - 750,000
Engine 32 Replacement - 740,000 - - - - 740,000
SCBA Replacement - 250,000 250,000 250,000 250,000 710,000 1,710,000
Driving Simulator - - 243,000 - - - 243,000
Fire Pumper for Olive Farm Station - - - - - 825,000 825,000
Fire Pumper for Station 37 - - - - - 825,000 825,000
Rescue Retrieval Van - - - - - 165,000 165,000
Element Total $ 1,650,000 $ 1,140,000 $ 643,000 $ 400,000 $ 400,000 $ 2,525,000 $ 6,758,000
22
FY 2022-23
Aerial Apparatus to Replace Ladder 34 $1,500,000
This project is for an aerial platform apparatus to replace Ladder 34, which is a 2006 model. At this point, Ladder 34 will have
reached its expected 15-year service life. The intent is to use this apparatus in reserve, replacing the quint reserve from
Station 3, which will aid our Public Protection Classification. Not funding this request will require the department to continue
to run an aerial apparatus that will have approximately 90,000 miles when this replacement is requested. Aerial apparatuses
are expensive to operate and the maintenance cost associated with this truck will increase over time.
Radio Replacement $750,000 Five-year Total
This project will replace the fire department's mobile and portable radios. Many departments replace their portable radios
every 5 years in order to ensure reliable and consistent communications due to keeping up with current technology. The
fire department completed a radio replacement project in 2016 so it is important to plan for replacement of all mobile and
portable radios throughout the department.
FY 2023-24
Engine 32 Replacement $740,000
This will replace Engine 32, a 2011 model rescue pumper that currently has 94,000 miles. While the town typically attempts
to get 15 years out of front-line service from a pumper, this truck's dual purpose has caused it to build up mileage at a faster
rate. Therefore, a replacement pumper is being requested in order to ensure that our front-line response fleet remains at a
level necessary to provide the highest level of service to our community. Not funding this request will require the department
to continue to operate this truck until such time as it is replaced.
Self-Contained Breathing Apparatus Replacement $1,710,000 Five-year Total
This request is for a total replacement of the self‐contained breathing apparatus (SCBAs). With the continuing evolution of
NFPA standards that recognize technological advancements, the current SCBAs will no longer meet the most current edition
of NFPA 1981 Standard on Open‐Circuit Self‐Contained Breathing Apparatus for Emergency Services within the next 5‐7
years. The projected cost of this request includes a full complement of SCBA equipment include the airpack itself, air bottles,
Bluetooth options, and a remote monitoring system.
FY 2024-25
Driving Simulator $243,000
The town currently has extremely limited access to a quality driving simulator. Funding this project would be beneficial to
staff members in every department and directly enhance our ability to improve employee safety. A modern driving simulator
is extremely realistic and can simulate nearly every piece of equipment present within a town vehicle. Trainers can program
real life scenarios for staff to encounter during the simulation and integrate a number of challenges into the course.
Horizon
Fire Pumper for Olive Farm Station $825,000
This fire pumper will be needed for the fire station slated to be built in the area of Olive Farm Road and Humie Olive Road.
This new station was proven to be needed through a third-party station distribution assessment by Envirosafe. If not funded
and the station is constructed, the station will be forced to open with a reserve apparatus with well over 100,000 miles. The
cost of this project includes equipment needed in order to fully outfit the truck.
23
Fire Pumper for Station 37 $825,000
This fire pumper will be needed for the fire station 37 in order to provide service to Apex’s western areas, including
annexations into Chatham County.
Rescue Retrieval Van $165,000
This vehicle has a "normal" van exterior appearance and will not attract undue attention while still providing protection to
occupants in critical incidents. This vehicle provides the department with the capability to rescue persons in the event of
active gunfire and provide officers ballistic protection in critical incidents involving gunfire and/or explosives. The armored
transit van would primarily serve in the role of hostage recovery & rescue transport. This addition will increase officer and
resident safety.
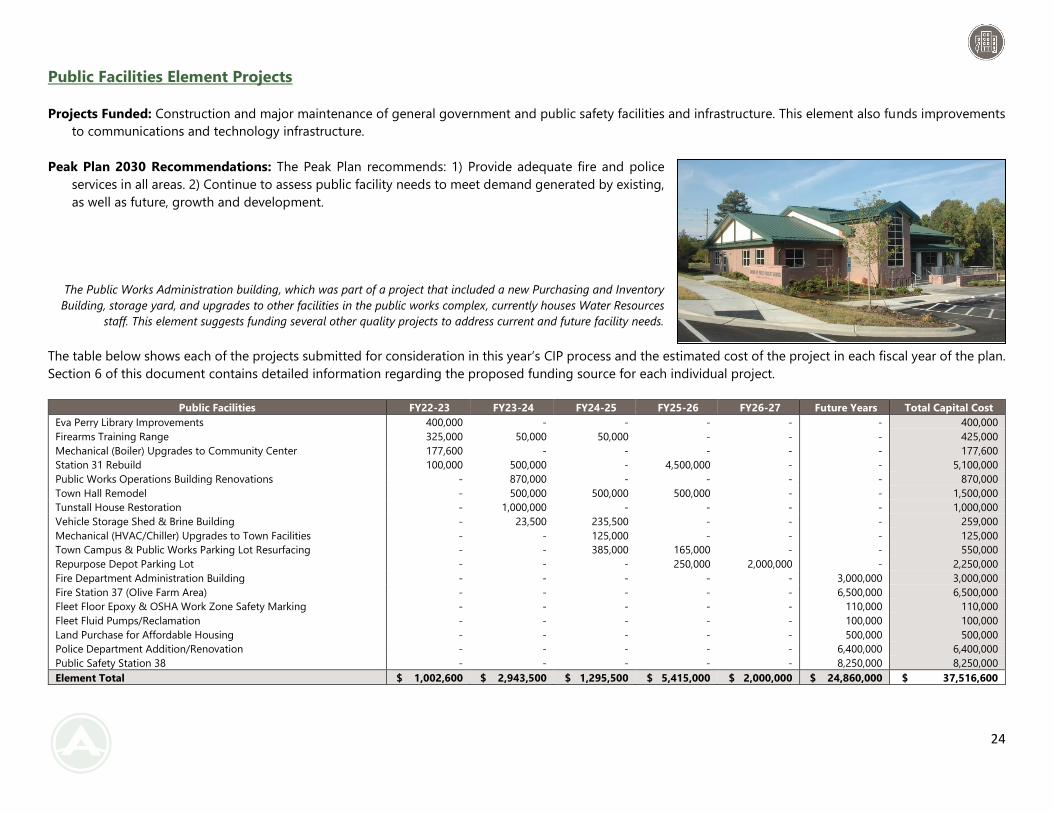
24
Public Facilities Element Projects
Projects Funded: Construction and major maintenance of general government and public safety facilities and infrastructure. This element also funds improvements
to communications and technology infrastructure.
Peak Plan 2030 Recommendations: The Peak Plan recommends: 1) Provide adequate fire and police
services in all areas. 2) Continue to assess public facility needs to meet demand generated by existing,
as well as future, growth and development.
The Public Works Administration building, which was part of a project that included a new Purchasing and Inventory
Building, storage yard, and upgrades to other facilities in the public works complex, currently houses Water Resources
staff. This element suggests funding several other quality projects to address current and future facility needs.
The table below shows each of the projects submitted for consideration in this year’s CIP process and the estimated cost of the project in each fiscal year of the plan.
Section 6 of this document contains detailed information regarding the proposed funding source for each individual project.
Public Facilities FY22-23 FY23-24 FY24-25 FY25-26 FY26-27 Future Years Total Capital Cost
Eva Perry Library Improvements 400,000 - - - - - 400,000
Firearms Training Range 325,000 50,000 50,000 - - - 425,000
Mechanical (Boiler) Upgrades to Community Center 177,600 - - - - - 177,600
Station 31 Rebuild 100,000 500,000 - 4,500,000 - - 5,100,000
Public Works Operations Building Renovations - 870,000 - - - - 870,000
Town Hall Remodel - 500,000 500,000 500,000 - - 1,500,000
Tunstall House Restoration - 1,000,000 - - - - 1,000,000
Vehicle Storage Shed & Brine Building - 23,500 235,500 - - - 259,000
Mechanical (HVAC/Chiller) Upgrades to Town Facilities - - 125,000 - - - 125,000
Town Campus & Public Works Parking Lot Resurfacing - - 385,000 165,000 - - 550,000
Repurpose Depot Parking Lot - - - 250,000 2,000,000 - 2,250,000
Fire Department Administration Building - - - - - 3,000,000 3,000,000
Fire Station 37 (Olive Farm Area) - - - - - 6,500,000 6,500,000
Fleet Floor Epoxy & OSHA Work Zone Safety Marking - - - - - 110,000 110,000
Fleet Fluid Pumps/Reclamation - - - - - 100,000 100,000
Land Purchase for Affordable Housing - - - - - 500,000 500,000
Police Department Addition/Renovation - - - - - 6,400,000 6,400,000
Public Safety Station 38 - - - - - 8,250,000 8,250,000
Element Total $ 1,002,600 $ 2,943,500 $ 1,295,500 $ 5,415,000 $ 2,000,000 $ 24,860,000 $ 37,516,600
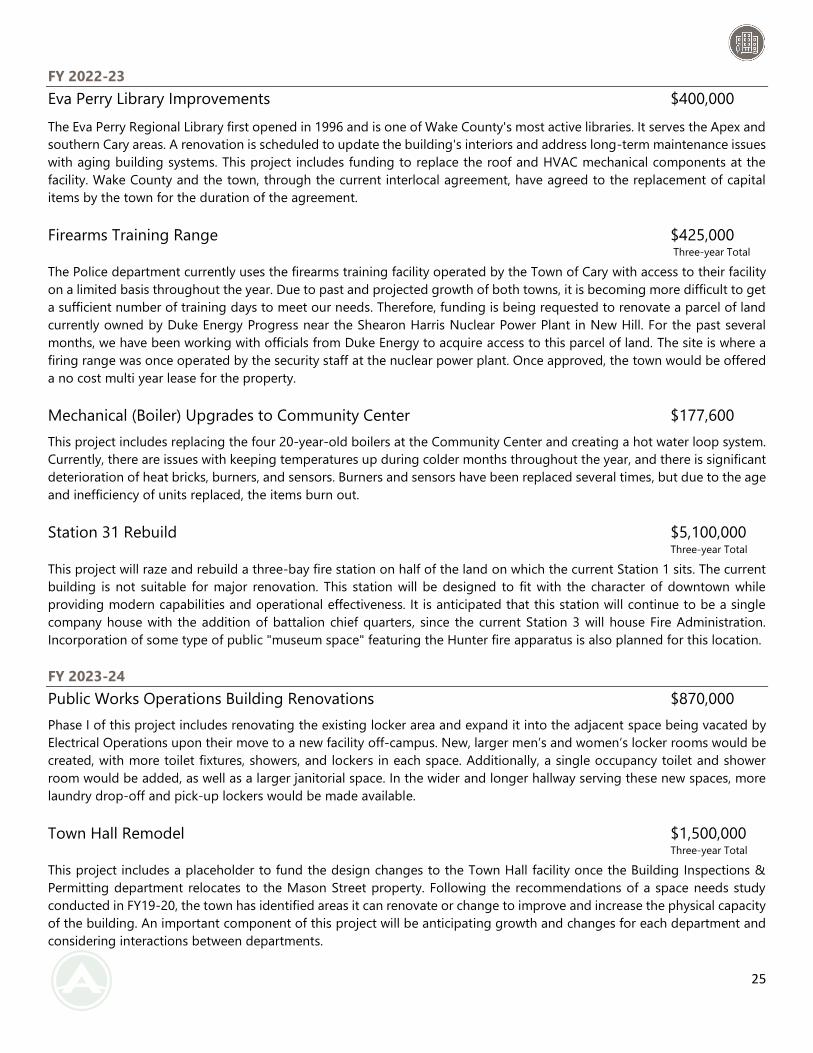
25
FY 2022-23
Eva Perry Library Improvements $400,000
The Eva Perry Regional Library first opened in 1996 and is one of Wake County's most active libraries. It serves the Apex and
southern Cary areas. A renovation is scheduled to update the building's interiors and address long-term maintenance issues
with aging building systems. This project includes funding to replace the roof and HVAC mechanical components at the
facility. Wake County and the town, through the current interlocal agreement, have agreed to the replacement of capital
items by the town for the duration of the agreement.
Firearms Training Range $425,000 Three-year Total
The Police department currently uses the firearms training facility operated by the Town of Cary with access to their facility
on a limited basis throughout the year. Due to past and projected growth of both towns, it is becoming more difficult to get
a sufficient number of training days to meet our needs. Therefore, funding is being requested to renovate a parcel of land
currently owned by Duke Energy Progress near the Shearon Harris Nuclear Power Plant in New Hill. For the past several
months, we have been working with officials from Duke Energy to acquire access to this parcel of land. The site is where a
firing range was once operated by the security staff at the nuclear power plant. Once approved, the town would be offered
a no cost multi year lease for the property.
Mechanical (Boiler) Upgrades to Community Center $177,600
This project includes replacing the four 20-year-old boilers at the Community Center and creating a hot water loop system.
Currently, there are issues with keeping temperatures up during colder months throughout the year, and there is significant
deterioration of heat bricks, burners, and sensors. Burners and sensors have been replaced several times, but due to the age
and inefficiency of units replaced, the items burn out.
Station 31 Rebuild $5,100,000 Three-year Total
This project will raze and rebuild a three-bay fire station on half of the land on which the current Station 1 sits. The current
building is not suitable for major renovation. This station will be designed to fit with the character of downtown while
providing modern capabilities and operational effectiveness. It is anticipated that this station will continue to be a single
company house with the addition of battalion chief quarters, since the current Station 3 will house Fire Administration.
Incorporation of some type of public "museum space" featuring the Hunter fire apparatus is also planned for this location.
FY 2023-24
Public Works Operations Building Renovations $870,000
Phase I of this project includes renovating the existing locker area and expand it into the adjacent space being vacated by
Electrical Operations upon their move to a new facility off-campus. New, larger men’s and women’s locker rooms would be
created, with more toilet fixtures, showers, and lockers in each space. Additionally, a single occupancy toilet and shower
room would be added, as well as a larger janitorial space. In the wider and longer hallway serving these new spaces, more
laundry drop-off and pick-up lockers would be made available.
Town Hall Remodel $1,500,000 Three-year Total
This project includes a placeholder to fund the design changes to the Town Hall facility once the Building Inspections &
Permitting department relocates to the Mason Street property. Following the recommendations of a space needs study
conducted in FY19-20, the town has identified areas it can renovate or change to improve and increase the physical capacity
of the building. An important component of this project will be anticipating growth and changes for each department and
considering interactions between departments.
26
Tunstall House Restoration $1,000,000
Restoration of the existing Tunstall House would not only be a prescriptive plan to save the current structure, but also
provide long term use as well as mediate deterioration to the existing structure. This project contemplates the historic
restoration of the house and contributing outbuildings. The house is suffering from deferred maintenance and currently
serves no purpose. In the past, the house has been looked at for public purpose, but the restoration/renovation costs have
been prohibitive. The first phase would include testing for lead and asbestos and determining preventive steps to stop
further deterioration until the renovation occurs in the following year.
Vehicle Storage Shed & Brine Building $259,000 Two-year Total
This project is for the construction of a vehicle storage shed & brine building at the Public Works Operation Yard. The
storage shed and brine building will provide shelter for vehicles and equipment not currently protected from inclement
weather.
FY 2024-25
Mechanical (HVAC/Chiller) Upgrades to Town Facilities $125,000
This project includes the replacement of old inefficient R22A HVAC/chiller units to R410 in Town Facilities due to R22
refrigerant being phased out with limited to no replacements available. Where replacements can be found, it is extremely
expensive and timely to replace/repair.
Town Campus & Public Works Parking Lot Resurfacing $550,000Two-year Total
This project is for the reconstruction of the Town Campus and Public Works Operations parking lots to include asphalt
pavement and remarking.
FY 2025-26
Repurpose Depot Parking Lot $2,250,000 Two-year Total
The conversion of the Depot parking lot to the premier space to gather downtown was identified as a "Top 10" priority
project in the Downtown Plan. The details of the final design will include a durable curbless environment with a balance of
sun and shaded areas, along with lighting and movable, interactive furnishings. Conceptual plans include space for the
Farmer's Market, a splash pad area, an ice-skating rink, and plenty of seating and space to host a variety of activities.
Horizon
Fire Department Administration Building $3,000,000
As the Fire department grows, the need for additional administrative office and conference room space is increasing
exponentially. This project will construct a fire administrative building that is capable of housing fire administration, logistics,
training, and the fire marshal's office. This building will also contain conference space, planning rooms, and secure storage
for departmental supplies and a warehouse space on the land behind Station 33.
Fire Station 37 $6,500,000 (Olive Farm Area)
Fire Station 37 has been identified by a third party as being needed in order to meet the informally adopted fire department
coverage standard of at least 90 percent of our coverage area being within a five-minute travel time from all stations. This
station's concept will mirror the Wimberly Road Station without the police elements.
27
Fleet Floor Epoxy & OSHA Work Zone Safety Marking $110,000
The fleet bay areas are faded and oil stained. Currently, there are no proper delineation/work zone markings on them causing
a greater potential to work place injuries such as but not limited to; slipping and tripping hazards. There are no proper
indications of personal protective equipment, safety data sheets, spill kit, or work zone safety signs.
Fleet Fluid Pumps/Reclamation $100,000
This project includes the relocating of motor oil, hydraulic, coolant, and reclamation reservoir. Currently, the vehicle and
equipment fluids are located in a small room with limited size drums, which increases the number of times vendors have to
come out to refill or remove used fluids. Dumping old/used fluids is hazardous, based upon current practices, in which the
mechanic hand pours/pumps old fluids into an open drum. This project will relocate to a larger area to allow larger tanks of
new fluids and several reclamation tanks hooked up to pneumatic pumps that would safely and efficiently remove used
fluids. On several occasions, the "oil room" where fluids are kept has experienced spills and overflow due to an increase in
services provided by our fleet mechanics.
Land Purchase for Affordable Housing $500,000
This project will provide funding for the purchase of land for future development of affordable housing.
Police Department Addition/Renovation $6,400,000
With the growth of the community and Police department, the town is experiencing space limitations at the main police
facility. This project includes plans to add space for operations, administrative functions, and the Communications Center.
The conceptual plan adds two stories of office space above the current administrative parking lot (east side) over a secured
police parking lot. The first level above that would align with the existing second story of the building and would be finished
into office space for administrative functions. The second level would be unfinished shell space to allow for future growth.
The existing administrative office space would be renovated to allow for a doubling in size of the existing Communications
Center and the addition of related office and work space.
Public Safety Station 38 $8,250,000
Public Safety Station 38 will be needed if the Town of Apex begins to annex into Chatham County down US 64 or 751. This
area is quite a distance from any current or planned fire station and we will not be able to meet our coverage standard
without the addition of a new fire station, personnel, and apparatus. Not funding this request will leave this area without
equitable public safety coverage.
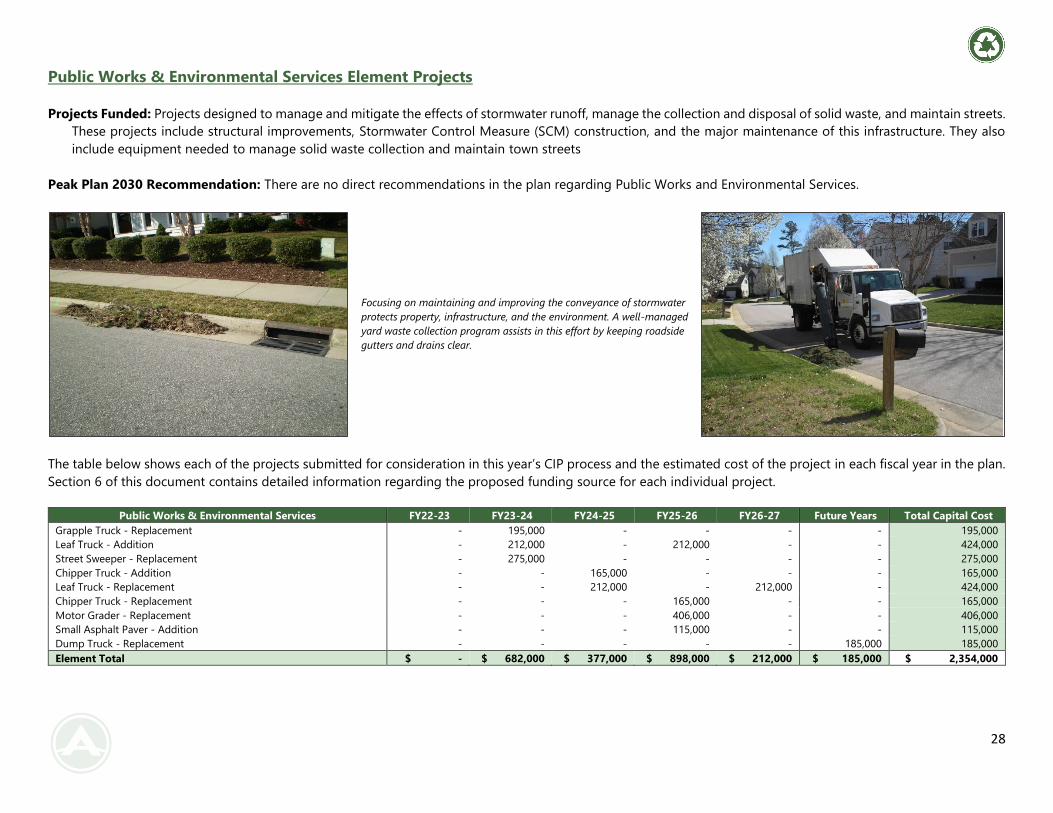
28
Public Works & Environmental Services Element Projects
Projects Funded: Projects designed to manage and mitigate the effects of stormwater runoff, manage the collection and disposal of solid waste, and maintain streets.
These projects include structural improvements, Stormwater Control Measure (SCM) construction, and the major maintenance of this infrastructure. They also
include equipment needed to manage solid waste collection and maintain town streets
Peak Plan 2030 Recommendation: There are no direct recommendations in the plan regarding Public Works and Environmental Services.
Focusing on maintaining and improving the conveyance of stormwater
protects property, infrastructure, and the environment. A well-managed
yard waste collection program assists in this effort by keeping roadside
gutters and drains clear.
The table below shows each of the projects submitted for consideration in this year’s CIP process and the estimated cost of the project in each fiscal year in the plan.
Section 6 of this document contains detailed information regarding the proposed funding source for each individual project.
Public Works & Environmental Services FY22-23 FY23-24 FY24-25 FY25-26 FY26-27 Future Years Total Capital Cost
Grapple Truck - Replacement - 195,000 - - - - 195,000
Leaf Truck - Addition - 212,000 - 212,000 - - 424,000
Street Sweeper - Replacement - 275,000 - - - - 275,000
Chipper Truck - Addition - - 165,000 - - - 165,000
Leaf Truck - Replacement - - 212,000 - 212,000 - 424,000
Chipper Truck - Replacement - - - 165,000 - - 165,000
Motor Grader - Replacement - - - 406,000 - - 406,000
Small Asphalt Paver - Addition - - - 115,000 - - 115,000
Dump Truck - Replacement - - - - - 185,000 185,000
Element Total $ - $ 682,000 $ 377,000 $ 898,000 $ 212,000 $ 185,000 $ 2,354,000
29
FY 2023-24
Grapple Truck – Replacement $195,000
There are currently two grapple trucks in the fleet to support the town's yard waste program by providing large limb and
tree stump removal service. Only one of the grapple trucks is used on a daily basis with a second truck serving as a backup.
This second truck is also used to support the bulk item pickup program; collecting oversized items that cannot be lifted by
hand. This project will replace a truck (Unit #210) that will be over 9 years old with over 94,000 miles.
Leaf Truck – Addition $212,000
The addition of another leaf truck will be necessary to meet the expanding service area resulting from residential growth.
An additional employee will be necessary to operate the equipment to continue to provide weekly service.
Street Sweeper – Replacement $275,000
This project will replace a street sweeper (Unit #96) that will be over 22 years old at the time of replacement. There is
currently one street sweeper in the Streets department fleet used to clean streets for special events. This truck will be used
to clean town streets after spills, provide routine maintenance, and clean up after parades and festivals.
FY 2024-25
Chipper Truck – Addition $165,000
This project will be an addition of a Chipper Truck, which will be a required addition to the future growth of the department
and additional responsibilities of the department. The department will not be able to maintain production due to lack of
equipment within the town.
Leaf Truck – Replacement $212,000
This project will replace a leaf truck (Unit #108) in the town’s current fleet that will be 8 years old at the time of replacement.
FY 2025-26
Chipper Truck – Replacement $165,000
This truck replacement is necessary to maintain our current level of service to the town. Not adequately maintaining the
fleet of the town would mean the current level of service would have to be decreased in order to accommodate the higher
population. The replacement is needed due to the aging of an existing chipper truck/chipper combo (Unit #225), which will
be 10 years old at the time of replacement.
Leaf Truck – Addition $212,000
The addition of another leaf truck will be necessary to meet the expanding service area resulting from residential growth.
An additional employee will be necessary to operate the equipment to continue to provide weekly service.
Motor Grader – Replacement $406,000
This project will replace a grader (Unit #5506) that is over 53 years old with over 120,000 miles. A motor grader is necessary
to spread materials, maintain ditches, and maintain gravel roads and parking lots. This vehicle will also be utilized for snow
and ice control operations.
Small Asphalt Paver - Addition $115,000
This paver is to expand our capabilities to pave when utility cuts might occur or for greenway trail repairs. Funding this Paver
would prevent the town from having to contract out these small projects at a higher cost.
30
FY 2026-27
Leaf Truck – Replacement $212,000
This project will replace a leaf truck (Unit #121) in the town’s current fleet that will be 8 years old at time of replacement
Horizon
Dump Truck – Replacement $185,000
This project will replace a dump truck (Unit #62) in the town’s fleet that will be 18 years old at time of replacement.
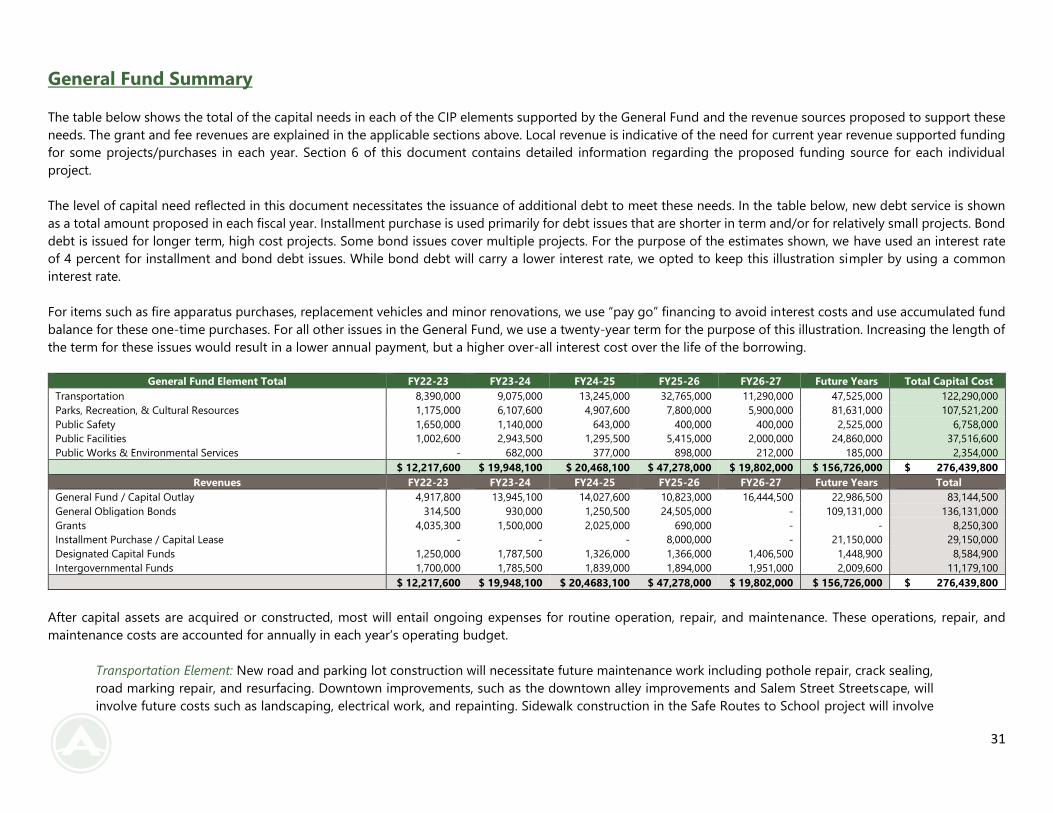
31
General Fund Summary
The table below shows the total of the capital needs in each of the CIP elements supported by the General Fund and the revenue sources proposed to support these
needs. The grant and fee revenues are explained in the applicable sections above. Local revenue is indicative of the need for current year revenue supported funding
for some projects/purchases in each year. Section 6 of this document contains detailed information regarding the proposed funding source for each individual
project.
The level of capital need reflected in this document necessitates the issuance of additional debt to meet these needs. In the table below, new debt service is shown
as a total amount proposed in each fiscal year. Installment purchase is used primarily for debt issues that are shorter in term and/or for relatively small projects. Bond
debt is issued for longer term, high cost projects. Some bond issues cover multiple projects. For the purpose of the estimates shown, we have used an interest rate
of 4 percent for installment and bond debt issues. While bond debt will carry a lower interest rate, we opted to keep this illustration simpler by using a common
interest rate.
For items such as fire apparatus purchases, replacement vehicles and minor renovations, we use “pay go” financing to avoid interest costs and use accumulated fund
balance for these one-time purchases. For all other issues in the General Fund, we use a twenty-year term for the purpose of this illustration. Increasing the length of
the term for these issues would result in a lower annual payment, but a higher over-all interest cost over the life of the borrowing.
General Fund Element Total FY22-23 FY23-24 FY24-25 FY25-26 FY26-27 Future Years Total Capital Cost
Transportation 8,390,000 9,075,000 13,245,000 32,765,000 11,290,000 47,525,000 122,290,000
Parks, Recreation, & Cultural Resources 1,175,000 6,107,600 4,907,600 7,800,000 5,900,000 81,631,000 107,521,200
Public Safety 1,650,000 1,140,000 643,000 400,000 400,000 2,525,000 6,758,000
Public Facilities 1,002,600 2,943,500 1,295,500 5,415,000 2,000,000 24,860,000 37,516,600
Public Works & Environmental Services - 682,000 377,000 898,000 212,000 185,000 2,354,000
$ 12,217,600 $ 19,948,100 $ 20,468,100 $ 47,278,000 $ 19,802,000 $ 156,726,000 $ 276,439,800
Revenues FY22-23 FY23-24 FY24-25 FY25-26 FY26-27 Future Years Total
General Fund / Capital Outlay 4,917,800 13,945,100 14,027,600 10,823,000 16,444,500 22,986,500 83,144,500
General Obligation Bonds 314,500 930,000 1,250,500 24,505,000 - 109,131,000 136,131,000
Grants 4,035,300 1,500,000 2,025,000 690,000 - - 8,250,300
Installment Purchase / Capital Lease - - - 8,000,000 - 21,150,000 29,150,000
Designated Capital Funds 1,250,000 1,787,500 1,326,000 1,366,000 1,406,500 1,448,900 8,584,900
Intergovernmental Funds 1,700,000 1,785,500 1,839,000 1,894,000 1,951,000 2,009,600 11,179,100
$ 12,217,600 $ 19,948,100 $ 20,4683,100 $ 47,278,000 $ 19,802,000 $ 156,726,000 $ 276,439,800
After capital assets are acquired or constructed, most will entail ongoing expenses for routine operation, repair, and maintenance. These operations, repair, and
maintenance costs are accounted for annually in each year’s operating budget.
Transportation Element: New road and parking lot construction will necessitate future maintenance work including pothole repair, crack sealing,
road marking repair, and resurfacing. Downtown improvements, such as the downtown alley improvements and Salem Street Streetscape, will
involve future costs such as landscaping, electrical work, and repainting. Sidewalk construction in the Safe Routes to School project will involve
32
regular pavement repair, repainting crosswalk markings, and performing maintenance work on crosswalk signals. Lastly, the GoApex Transit
Program will involve future costs including wages for operating personnel and routine vehicle maintenance and repair work.
Parks, Recreation, & Cultural Arts Element: New greenway connections will necessitate future maintenance work including brush clearing, sign
and bench replacement, and trail reconstruction. Once constructed and operational, the Environmental Education Center will necessitate ongoing
costs such as staff wages, educational materials, and regular cleaning and building maintenance. Parking lot expansions will involve future costs
including sweeping and asphalt treatment. New park construction will necessitate regular annual costs such as landscaping, irrigation system
maintenance, restroom and public facility cleaning, and wages for park maintenance and programming staff.
Public Safety Element: The replacement aerial apparatus, replacement fire engines, and new rescue retrieval van will incur regular costs such as
the purchase of fuel, wages for operating personnel, and repair and maintenance. Once acquired, the driving simulator will necessitate annual
repair and maintenance costs
Public Facilities Element: New public safety and fire stations will incur future costs including staff wages, building cleaning and maintenance, and
utility services. After renovations are complete, the Eva Perry Library will incur costs for routine maintenance and repairs of its new roof and
HVAC unit. The repurposing of the downtown Depot parking lot will involve regular costs including street sweeping, landscaping, furniture and
lighting replacement, and programming. HVAC, chiller, and boiler upgrades to town administrative buildings will necessitate routine maintenance
and repair costs as their useful lives progress.
Public Works & Environmental Element: New and replacement vehicles and equipment such as chipper trucks, leaf trucks, dump trucks, and
asphalt pavers will incur regular maintenance and repair costs over the course of their useful lives.
33
Section 3: CIP Financial Impact Analysis on General Fund
A key element of the CIP is the financial impact analysis that discusses the effects of capital spending on the town’s operation
costs, debt capacity, and other important debt ratios. It is important to understand how capital spending affects these
indicators because the Local Government Commission (LGC) and bond rating agencies use them to evaluate the town’s
financial condition and to issue ratings. Apex currently has a bond rating of AAA with Standard & Poor's Corporation and
Aaa with Moody's Investors Service. These ratings represent strong financial standing and are the highest possible ratings
attainable.
Projections and Estimates
Proper financial planning requires projections and estimates for expenditures, revenues, and other financial indicators.
Expenditure and revenue estimates require forecasts for changes in population, assessed property value, and other factors
such as changes in the economy. The CIP projections represent an eight percent growth factor for operations expenditures
throughout the five-year scope. This growth factor is representative of the town’s three-year rolling average for personnel
and operating expenditure increases. The town has been the beneficiary of sustained growth in property values with a three-
year rolling average of 8.43 percent not including revaluation years. Wake County will perform a revaluation in 2024 that
will affect the assessed value and revenue neutral tax rate for Apex. The CIP includes an adjustment in FY24-25 for a potential
revenue neutral rate in response to the revaluation. Apart from gains in property tax revenues and sales tax revenues,
estimates indicate growth in other revenues, not including grants, fund transfers, or use of fund balance, to be on par with
the increases in expenditures. The CIP includes a revenue growth rate of eight percent beyond FY22-23. For projects subject
to financing in FY22-23, the debt model includes interest rates of 4.0 percent. For future years, a half percent has been added
to the interest rate per year beginning in FY23-24. That rate may vary depending on the size of the project and length of
term. Financing recommendations in this CIP include use of general obligation (GO) bonds and installment financing in the
General Fund and revenue bonds in enterprise funds.
Debt Ratios
The large costs associated with capital projects may require financing, which results in debt obligation for the town. The LGC
and bond rating agencies assess the town’s ability to incur and repay debt through various debt capacity ratios and
indicators. In the General Fund, the town evaluates net debt as a percentage of total assessed value of taxable property, the
aggregate ten-year principal payout ratio, and the ratio of debt service expenditures as a percent of total fund expenditures.
Net debt per assessed valuation is an important indicator because it takes into account the town’s largest revenue
source and greatest means for repaying debt. This is a measure of debt capacity as well as debt burden. This ratio divides
the town’s net debt by its total assessed value, where net debt is defined as all tax-supported debt. town policy states that
its net debt per assessed valuation should not exceed 2.5 percent. Apex’s expected debt-to-assessed valuation ratio for
FY22-23 is .84 percent. The ratio for FY22-23 represents the expected high point within the proposed CIP. Even with
upcoming projects that will require additional debt financing, the growth in assessed value will outpace that modest increase
in net debt, resulting in a lower ratio. The .84 percent is well below the town’s maximum and the legal limit set forth by
N.C.G.S. 159-55, which limits net debt to eight percent or less of a local government’s total property valuation. Apex’s legal
debt limit, based on the July 1, 2022 audited valuation is $829,020,168. The CIP includes a maximum debt obligation of
$117,211,552 in FY25-26.
The 10-year payout ratio measures the amount of principal being retired in the next 10 years. As an indicator, it
determines if debt is back-loaded, which can cause concern for long-term financial stability. Apex has a policy that
establishes a minimum 10-year payout ratio of 55 percent. The CIP includes issuance of previously authorized bonds as well
as new bond debt and installment purchase financing. The new debt brings the payout ratio to 72.47 percent in FY22-23.
The lowest ratio of 63.91 in FY25-26 remains above the town’s minimum.
34
Debt service as a percentage of total expenditures measures annual debt service payments of non-self-
supporting projects as a portion of the Town’s General Fund expenditures. Debt service payments can become a large
portion of a town’s budget and should be monitored to ensure acceptable levels. Too much debt service may indicate
excessive debt and fiscal strain. Bond rating agencies consider a net debt service percentage between 15 and 20 percent to
be high. A ratio below 5 percent indicates capacity for significant new debt. The town’s policy is to maintain a net debt
service ratio of less than 12 percent. For FY22-23, the General Fund debt service ratio is 10 percent, which represents the
highest ratio for the proposed CIP. Without significant changes to the CIP, the debt service ratio will remain below 12 percent
for the length of the current CIP. Keeping this ratio below 12 percent provides the town with opportunities to finance more
projects.
Pay-as-go financing can help keep key debt ratios in acceptable range by eliminating new debt obligations and
annual debt service payments. The proposed CIP indicates differences from year to year in pay-as-go financing over the
five-year period. This is due to the significant costs associated with some larger projects such as roads or a new fire station.
If debt ratios begin to approach unacceptable ranges, delaying projects or using pay-as-go financing should be considered
to keep the town in good financial standing and reduce fiscal strain.
Other factors bond rating agencies consider when assessing a town’s financial condition may include the community’s
wealth, tax base, sources of revenues, and the overall economy.
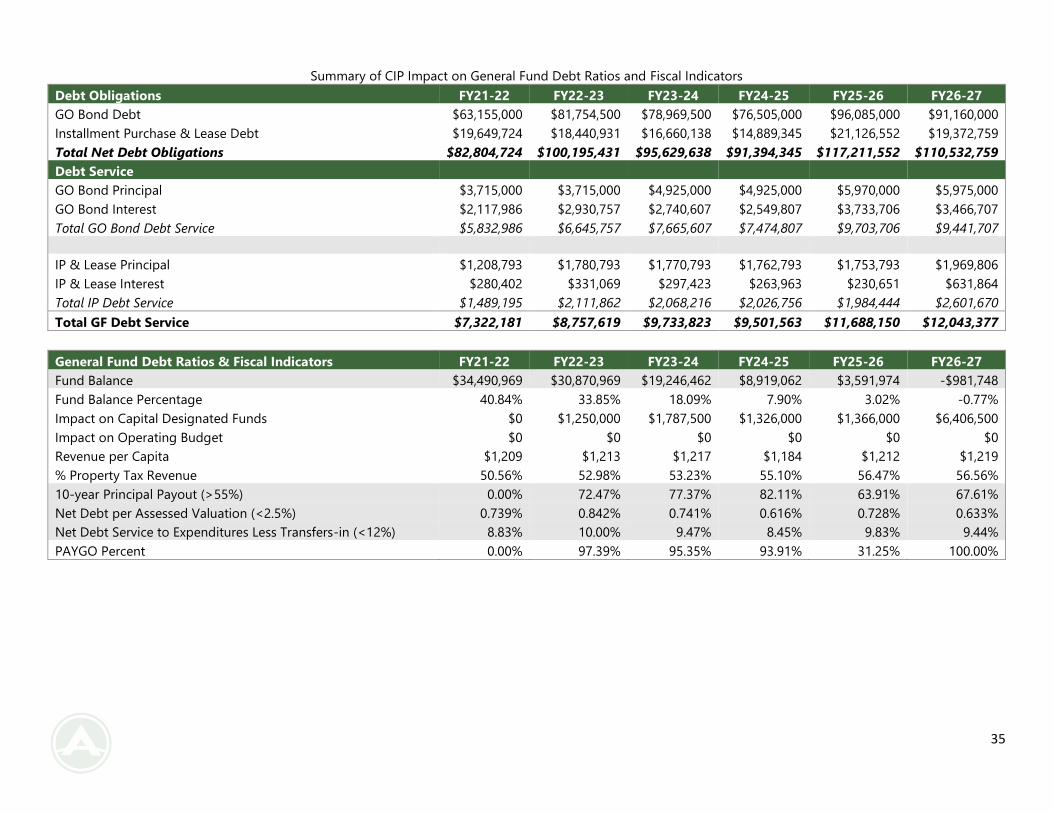
35
Summary of CIP Impact on General Fund Debt Ratios and Fiscal Indicators
Debt Obligations FY21-22 FY22-23 FY23-24 FY24-25 FY25-26 FY26-27
GO Bond Debt $63,155,000 $81,754,500 $78,969,500 $76,505,000 $96,085,000 $91,160,000
Installment Purchase & Lease Debt $19,649,724 $18,440,931 $16,660,138 $14,889,345 $21,126,552 $19,372,759
Total Net Debt Obligations $82,804,724 $100,195,431 $95,629,638 $91,394,345 $117,211,552 $110,532,759
Debt Service
GO Bond Principal $3,715,000 $3,715,000 $4,925,000 $4,925,000 $5,970,000 $5,975,000
GO Bond Interest $2,117,986 $2,930,757 $2,740,607 $2,549,807 $3,733,706 $3,466,707
Total GO Bond Debt Service $5,832,986 $6,645,757 $7,665,607 $7,474,807 $9,703,706 $9,441,707
IP & Lease Principal $1,208,793 $1,780,793 $1,770,793 $1,762,793 $1,753,793 $1,969,806
IP & Lease Interest $280,402 $331,069 $297,423 $263,963 $230,651 $631,864
Total IP Debt Service $1,489,195 $2,111,862 $2,068,216 $2,026,756 $1,984,444 $2,601,670
Total GF Debt Service $7,322,181 $8,757,619 $9,733,823 $9,501,563 $11,688,150 $12,043,377
General Fund Debt Ratios & Fiscal Indicators FY21-22 FY22-23 FY23-24 FY24-25 FY25-26 FY26-27
Fund Balance $34,490,969 $30,870,969 $19,246,462 $8,919,062 $3,591,974 -$981,748
Fund Balance Percentage 40.84% 33.85% 18.09% 7.90% 3.02% -0.77%
Impact on Capital Designated Funds $0 $1,250,000 $1,787,500 $1,326,000 $1,366,000 $6,406,500
Impact on Operating Budget $0 $0 $0 $0 $0 $0
Revenue per Capita $1,209 $1,213 $1,217 $1,184 $1,212 $1,219
% Property Tax Revenue 50.56% 52.98% 53.23% 55.10% 56.47% 56.56%
10-year Principal Payout (>55%) 0.00% 72.47% 77.37% 82.11% 63.91% 67.61%
Net Debt per Assessed Valuation (<2.5%) 0.739% 0.842% 0.741% 0.616% 0.728% 0.633%
Net Debt Service to Expenditures Less Transfers-in (<12%) 8.83% 10.00% 9.47% 8.45% 9.83% 9.44%
PAYGO Percent 0.00% 97.39% 95.35% 93.91% 31.25% 100.00%
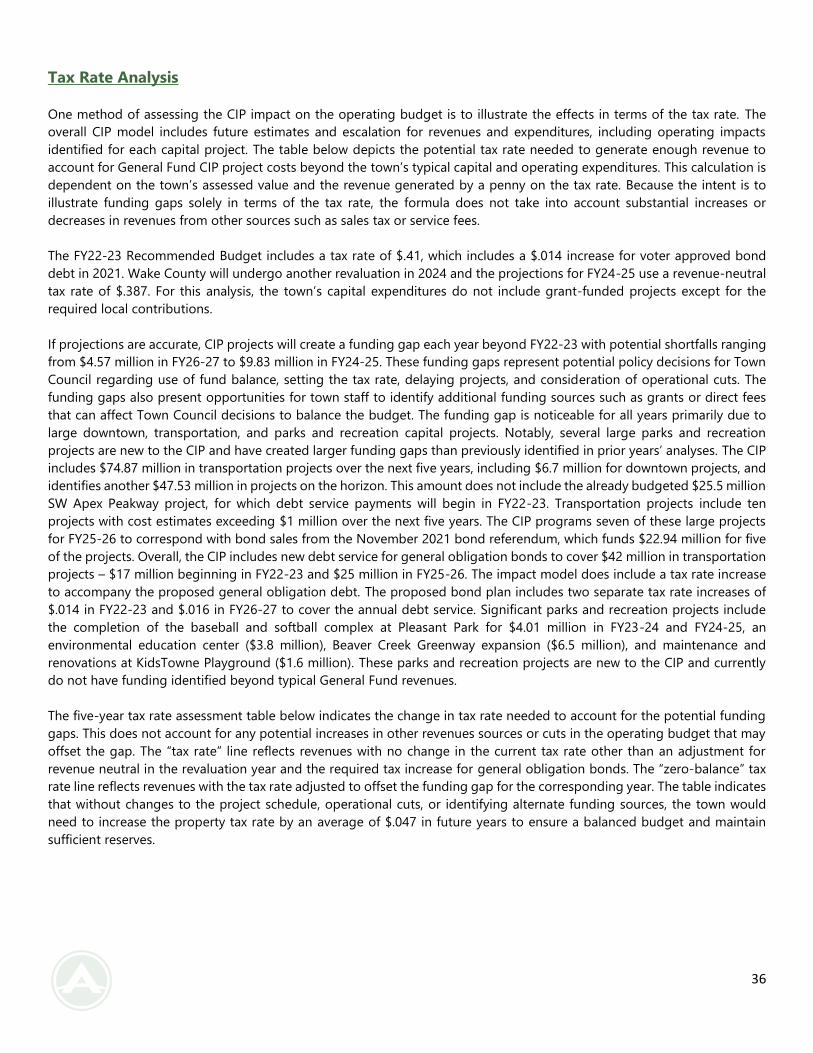
36
Tax Rate Analysis
One method of assessing the CIP impact on the operating budget is to illustrate the effects in terms of the tax rate. The
overall CIP model includes future estimates and escalation for revenues and expenditures, including operating impacts
identified for each capital project. The table below depicts the potential tax rate needed to generate enough revenue to
account for General Fund CIP project costs beyond the town’s typical capital and operating expenditures. This calculation is
dependent on the town’s assessed value and the revenue generated by a penny on the tax rate. Because the intent is to
illustrate funding gaps solely in terms of the tax rate, the formula does not take into account substantial increases or
decreases in revenues from other sources such as sales tax or service fees.
The FY22-23 Recommended Budget includes a tax rate of $.41, which includes a $.014 increase for voter approved bond
debt in 2021. Wake County will undergo another revaluation in 2024 and the projections for FY24-25 use a revenue-neutral
tax rate of $.387. For this analysis, the town’s capital expenditures do not include grant-funded projects except for the
required local contributions.
If projections are accurate, CIP projects will create a funding gap each year beyond FY22-23 with potential shortfalls ranging
from $4.57 million in FY26-27 to $9.83 million in FY24-25. These funding gaps represent potential policy decisions for Town
Council regarding use of fund balance, setting the tax rate, delaying projects, and consideration of operational cuts. The
funding gaps also present opportunities for town staff to identify additional funding sources such as grants or direct fees
that can affect Town Council decisions to balance the budget. The funding gap is noticeable for all years primarily due to
large downtown, transportation, and parks and recreation capital projects. Notably, several large parks and recreation
projects are new to the CIP and have created larger funding gaps than previously identified in prior years’ analyses. The CIP
includes $74.87 million in transportation projects over the next five years, including $6.7 million for downtown projects, and
identifies another $47.53 million in projects on the horizon. This amount does not include the already budgeted $25.5 million
SW Apex Peakway project, for which debt service payments will begin in FY22-23. Transportation projects include ten
projects with cost estimates exceeding $1 million over the next five years. The CIP programs seven of these large projects
for FY25-26 to correspond with bond sales from the November 2021 bond referendum, which funds $22.94 million for five
of the projects. Overall, the CIP includes new debt service for general obligation bonds to cover $42 million in transportation
projects – $17 million beginning in FY22-23 and $25 million in FY25-26. The impact model does include a tax rate increase
to accompany the proposed general obligation debt. The proposed bond plan includes two separate tax rate increases of
$.014 in FY22-23 and $.016 in FY26-27 to cover the annual debt service. Significant parks and recreation projects include
the completion of the baseball and softball complex at Pleasant Park for $4.01 million in FY23-24 and FY24-25, an
environmental education center ($3.8 million), Beaver Creek Greenway expansion ($6.5 million), and maintenance and
renovations at KidsTowne Playground ($1.6 million). These parks and recreation projects are new to the CIP and currently
do not have funding identified beyond typical General Fund revenues.
The five-year tax rate assessment table below indicates the change in tax rate needed to account for the potential funding
gaps. This does not account for any potential increases in other revenues sources or cuts in the operating budget that may
offset the gap. The “tax rate” line reflects revenues with no change in the current tax rate other than an adjustment for
revenue neutral in the revaluation year and the required tax increase for general obligation bonds. The “zero-balance” tax
rate line reflects revenues with the tax rate adjusted to offset the funding gap for the corresponding year. The table indicates
that without changes to the project schedule, operational cuts, or identifying alternate funding sources, the town would
need to increase the property tax rate by an average of $.047 in future years to ensure a balanced budget and maintain
sufficient reserves.
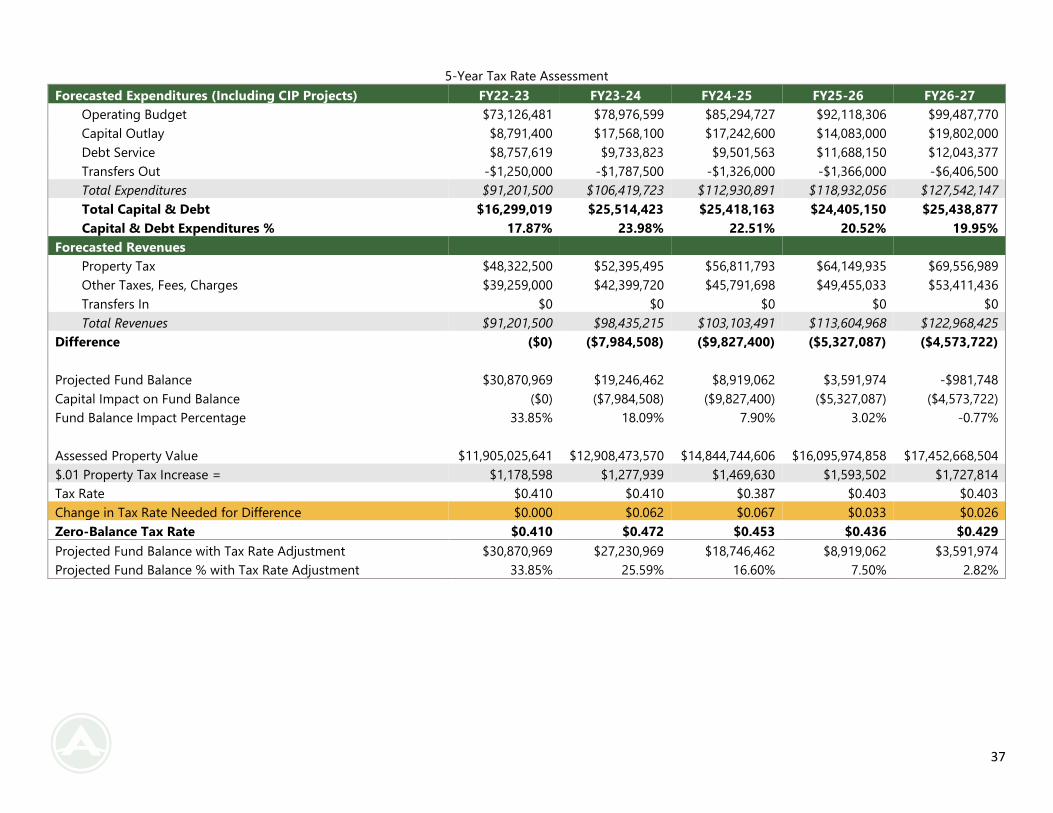
37
5-Year Tax Rate Assessment
Forecasted Expenditures (Including CIP Projects) FY22-23 FY23-24 FY24-25 FY25-26 FY26-27
Operating Budget $73,126,481 $78,976,599 $85,294,727 $92,118,306 $99,487,770
Capital Outlay $8,791,400 $17,568,100 $17,242,600 $14,083,000 $19,802,000
Debt Service $8,757,619 $9,733,823 $9,501,563 $11,688,150 $12,043,377
Transfers Out -$1,250,000 -$1,787,500 -$1,326,000 -$1,366,000 -$6,406,500
Total Expenditures $91,201,500 $106,419,723 $112,930,891 $118,932,056 $127,542,147
Total Capital & Debt $16,299,019 $25,514,423 $25,418,163 $24,405,150 $25,438,877
Capital & Debt Expenditures % 17.87% 23.98% 22.51% 20.52% 19.95%
Forecasted Revenues
Property Tax $48,322,500 $52,395,495 $56,811,793 $64,149,935 $69,556,989
Other Taxes, Fees, Charges $39,259,000 $42,399,720 $45,791,698 $49,455,033 $53,411,436
Transfers In $0 $0 $0 $0 $0
Total Revenues $91,201,500 $98,435,215 $103,103,491 $113,604,968 $122,968,425
Difference ($0) ($7,984,508) ($9,827,400) ($5,327,087) ($4,573,722)
Projected Fund Balance $30,870,969 $19,246,462 $8,919,062 $3,591,974 -$981,748
Capital Impact on Fund Balance ($0) ($7,984,508) ($9,827,400) ($5,327,087) ($4,573,722)
Fund Balance Impact Percentage 33.85% 18.09% 7.90% 3.02% -0.77%
Assessed Property Value $11,905,025,641 $12,908,473,570 $14,844,744,606 $16,095,974,858 $17,452,668,504
$.01 Property Tax Increase = $1,178,598 $1,277,939 $1,469,630 $1,593,502 $1,727,814
Tax Rate $0.410 $0.410 $0.387 $0.403 $0.403
Change in Tax Rate Needed for Difference $0.000 $0.062 $0.067 $0.033 $0.026
Zero-Balance Tax Rate $0.410 $0.472 $0.453 $0.436 $0.429
Projected Fund Balance with Tax Rate Adjustment $30,870,969 $27,230,969 $18,746,462 $8,919,062 $3,591,974
Projected Fund Balance % with Tax Rate Adjustment 33.85% 25.59% 16.60% 7.50% 2.82%
38
Section 4: Electric Utility
The projects funded through the Electric Utility element pull from the Electric Enterprise Fund. This fund pays only for projects
related to the electric system and not for projects related to the Water/Sewer Fund or the General Fund.
The types of capital projects that qualify for this fund include construction, maintenance, and improvement of electric
distribution infrastructure. These projects include substation additions and upgrades, distribution line extensions, major
maintenance of infrastructure, and the equipment necessary to maintain the system.
The icon below signifies the electric utility element, and is located on the top right corner of the pages that are associated
with these projects.
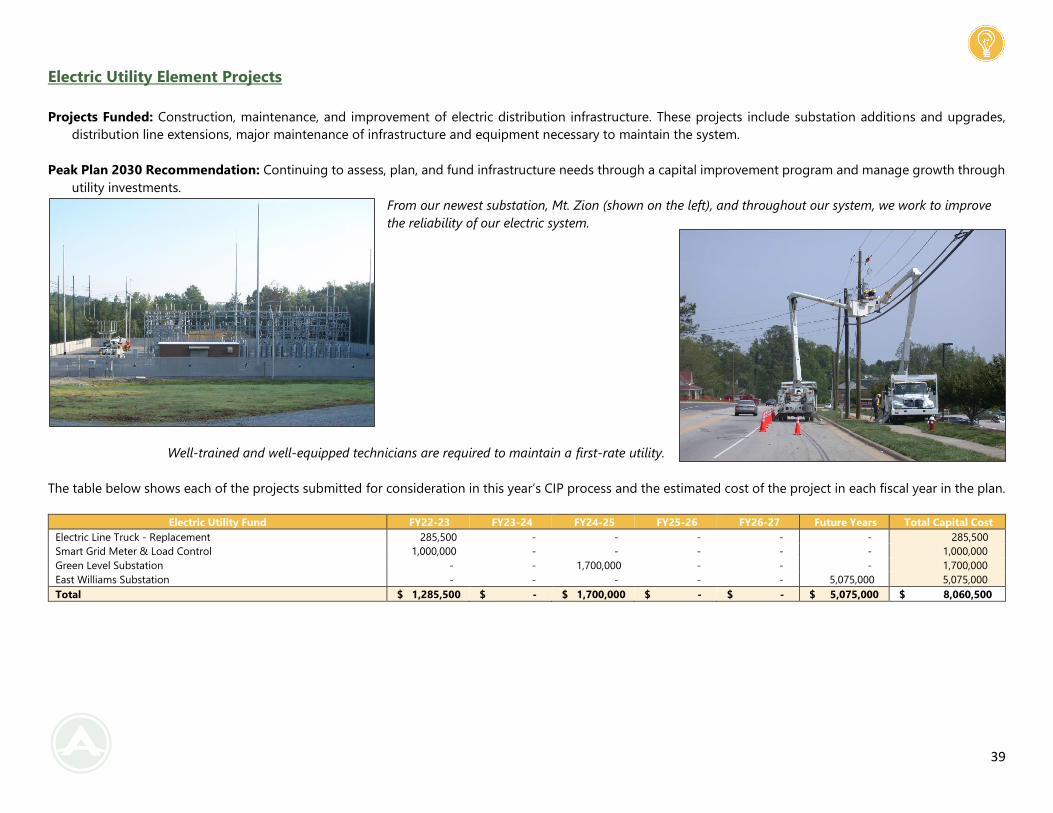
39
Electric Utility Element Projects
Projects Funded: Construction, maintenance, and improvement of electric distribution infrastructure. These projects include substation additions and upgrades,
distribution line extensions, major maintenance of infrastructure and equipment necessary to maintain the system.
Peak Plan 2030 Recommendation: Continuing to assess, plan, and fund infrastructure needs through a capital improvement program and manage growth through
utility investments.
From our newest substation, Mt. Zion (shown on the left), and throughout our system, we work to improve
the reliability of our electric system.
Well-trained and well-equipped technicians are required to maintain a first-rate utility.
The table below shows each of the projects submitted for consideration in this year’s CIP process and the estimated cost of the project in each fiscal year in the plan.
Electric Utility Fund FY22-23 FY23-24 FY24-25 FY25-26 FY26-27 Future Years Total Capital Cost
Electric Line Truck - Replacement 285,500 - - - - - 285,500
Smart Grid Meter & Load Control 1,000,000 - - - - - 1,000,000
Green Level Substation - - 1,700,000 - - - 1,700,000
East Williams Substation - - - - - 5,075,000 5,075,000
Total $ 1,285,500 $ - $ 1,700,000 $ - $ - $ 5,075,000 $ 8,060,500
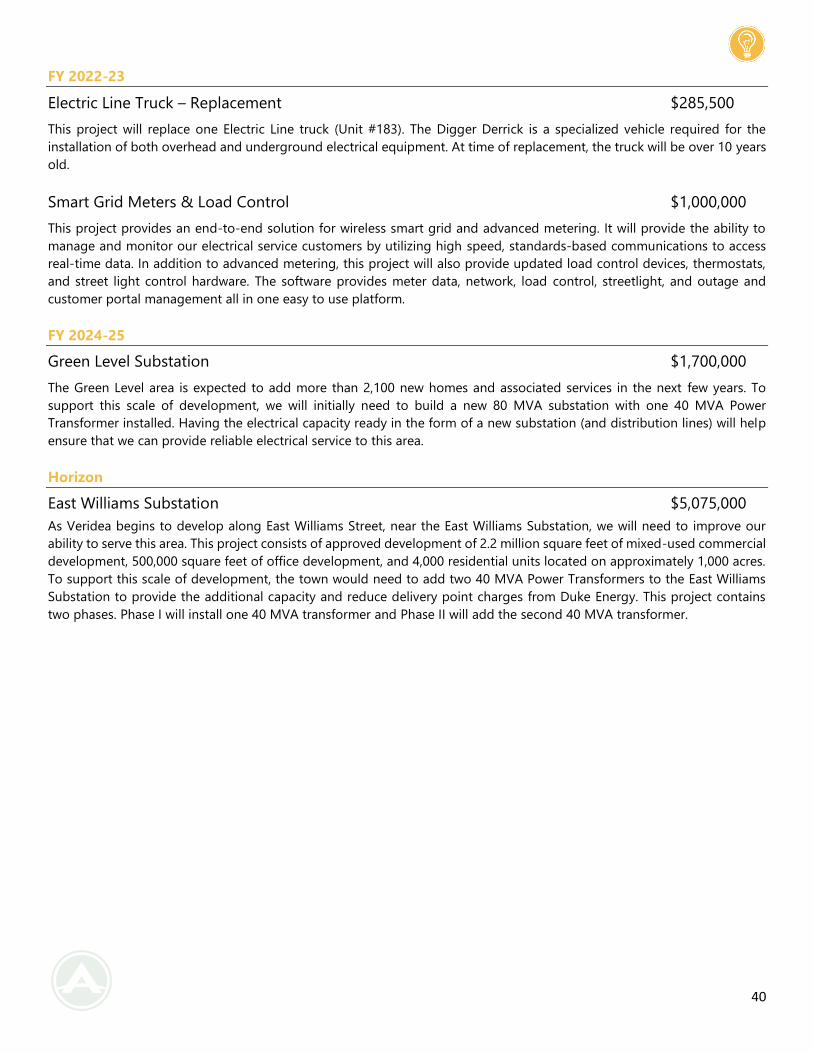
40
FY 2022-23
Electric Line Truck – Replacement $285,500
This project will replace one Electric Line truck (Unit #183). The Digger Derrick is a specialized vehicle required for the
installation of both overhead and underground electrical equipment. At time of replacement, the truck will be over 10 years
old.
Smart Grid Meters & Load Control $1,000,000
This project provides an end-to-end solution for wireless smart grid and advanced metering. It will provide the ability to
manage and monitor our electrical service customers by utilizing high speed, standards-based communications to access
real-time data. In addition to advanced metering, this project will also provide updated load control devices, thermostats,
and street light control hardware. The software provides meter data, network, load control, streetlight, and outage and
customer portal management all in one easy to use platform.
FY 2024-25
Green Level Substation $1,700,000
The Green Level area is expected to add more than 2,100 new homes and associated services in the next few years. To
support this scale of development, we will initially need to build a new 80 MVA substation with one 40 MVA Power
Transformer installed. Having the electrical capacity ready in the form of a new substation (and distribution lines) will help
ensure that we can provide reliable electrical service to this area.
Horizon
East Williams Substation $5,075,000
As Veridea begins to develop along East Williams Street, near the East Williams Substation, we will need to improve our
ability to serve this area. This project consists of approved development of 2.2 million square feet of mixed-used commercial
development, 500,000 square feet of office development, and 4,000 residential units located on approximately 1,000 acres.
To support this scale of development, the town would need to add two 40 MVA Power Transformers to the East Williams
Substation to provide the additional capacity and reduce delivery point charges from Duke Energy. This project contains
two phases. Phase I will install one 40 MVA transformer and Phase II will add the second 40 MVA transformer.
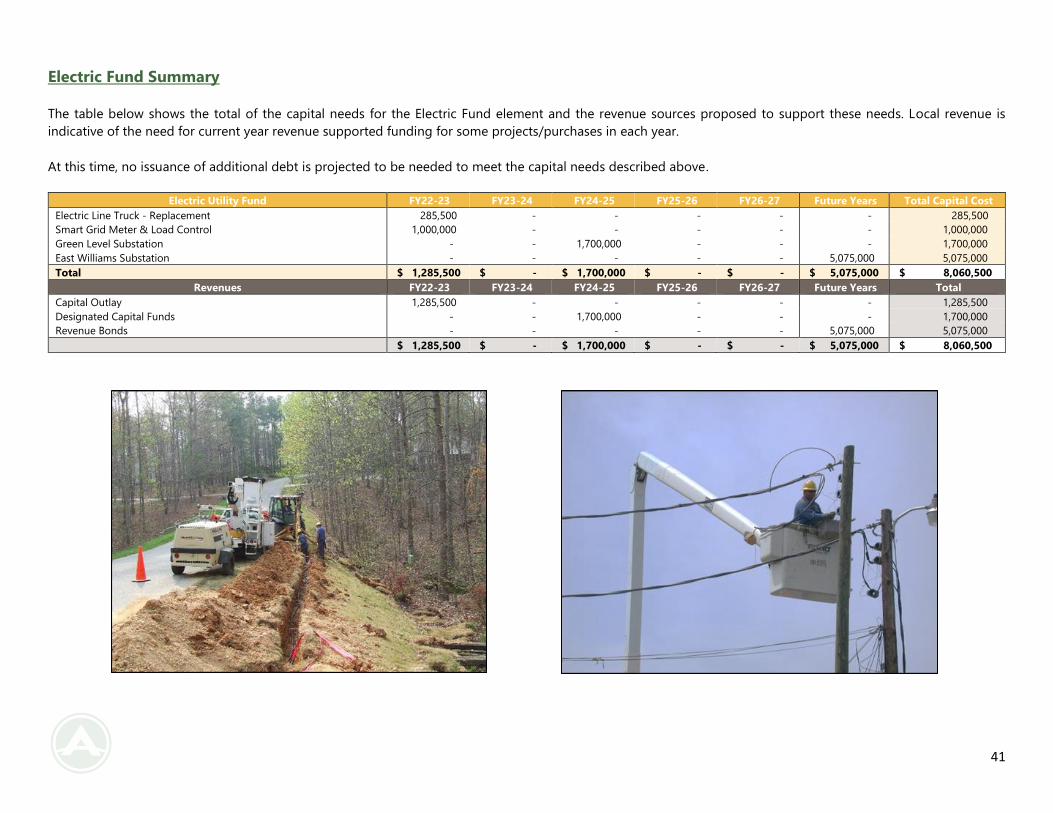
41
Electric Fund Summary
The table below shows the total of the capital needs for the Electric Fund element and the revenue sources proposed to support these needs. Local revenue is
indicative of the need for current year revenue supported funding for some projects/purchases in each year.
At this time, no issuance of additional debt is projected to be needed to meet the capital needs described above.
Electric Utility Fund FY22-23 FY23-24 FY24-25 FY25-26 FY26-27 Future Years Total Capital Cost
Electric Line Truck - Replacement 285,500 - - - - - 285,500
Smart Grid Meter & Load Control 1,000,000 - - - - - 1,000,000
Green Level Substation - - 1,700,000 - - - 1,700,000
East Williams Substation - - - - - 5,075,000 5,075,000
Total $ 1,285,500 $ - $ 1,700,000 $ - $ - $ 5,075,000 $ 8,060,500
Revenues FY22-23 FY23-24 FY24-25 FY25-26 FY26-27 Future Years Total
Capital Outlay 1,285,500 - - - - - 1,285,500
Designated Capital Funds - - 1,700,000 - - - 1,700,000
Revenue Bonds - - - - - 5,075,000 5,075,000
$ 1,285,500 $ - $ 1,700,000 $ - $ - $ 5,075,000 $ 8,060,500
42
Section 5: Water & Sewer Utility
Projects assigned to the Water and Sewer Utility element are funded through the Water and Sewer Enterprise Fund. This
fund only pays for projects related to the water and sewer system, and not for projects related to the electric fund, or any
General Fund related project.
The types of capital projects that qualify for this fund include the construction and improvement of water and sewer
infrastructure. These projects include main additions and replacements, water/wastewater treatment plant
renovations/expansions, filter rehabilitation, pump station additions, major maintenance of infrastructure, and the
equipment necessary to maintain the system.
The icon below signifies the Water and Sewer Utility element, and is located on the top right corner of the pages that are
associated with these projects.
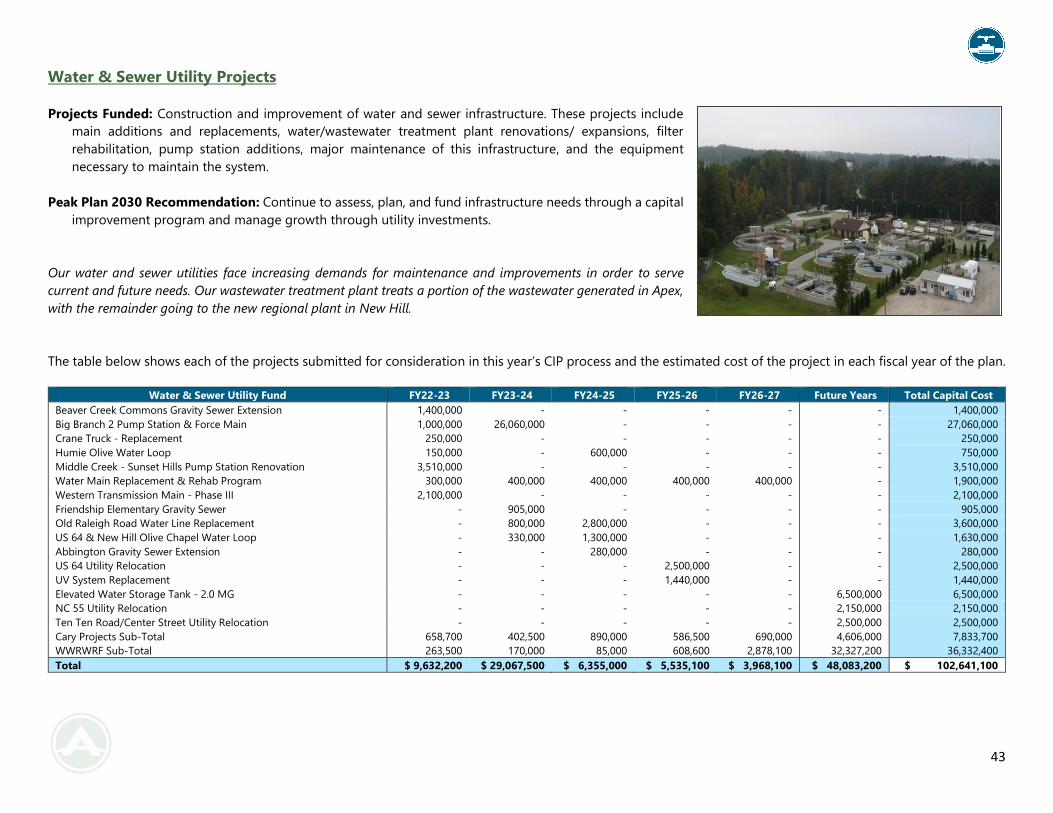
43
Water & Sewer Utility Projects
Projects Funded: Construction and improvement of water and sewer infrastructure. These projects include
main additions and replacements, water/wastewater treatment plant renovations/ expansions, filter
rehabilitation, pump station additions, major maintenance of this infrastructure, and the equipment
necessary to maintain the system.
Peak Plan 2030 Recommendation: Continue to assess, plan, and fund infrastructure needs through a capital
improvement program and manage growth through utility investments.
Our water and sewer utilities face increasing demands for maintenance and improvements in order to serve
current and future needs. Our wastewater treatment plant treats a portion of the wastewater generated in Apex,
with the remainder going to the new regional plant in New Hill.
The table below shows each of the projects submitted for consideration in this year’s CIP process and the estimated cost of the project in each fiscal year of the plan.
Water & Sewer Utility Fund FY22-23 FY23-24 FY24-25 FY25-26 FY26-27 Future Years Total Capital Cost
Beaver Creek Commons Gravity Sewer Extension 1,400,000 - - - - - 1,400,000
Big Branch 2 Pump Station & Force Main 1,000,000 26,060,000 - - - - 27,060,000
Crane Truck - Replacement 250,000 - - - - - 250,000
Humie Olive Water Loop 150,000 - 600,000 - - - 750,000
Middle Creek - Sunset Hills Pump Station Renovation 3,510,000 - - - - - 3,510,000
Water Main Replacement & Rehab Program 300,000 400,000 400,000 400,000 400,000 - 1,900,000
Western Transmission Main - Phase III 2,100,000 - - - - - 2,100,000
Friendship Elementary Gravity Sewer - 905,000 - - - - 905,000
Old Raleigh Road Water Line Replacement - 800,000 2,800,000 - - - 3,600,000
US 64 & New Hill Olive Chapel Water Loop - 330,000 1,300,000 - - - 1,630,000
Abbington Gravity Sewer Extension - - 280,000 - - - 280,000
US 64 Utility Relocation - - - 2,500,000 - - 2,500,000
UV System Replacement - - - 1,440,000 - - 1,440,000
Elevated Water Storage Tank - 2.0 MG - - - - - 6,500,000 6,500,000
NC 55 Utility Relocation - - - - - 2,150,000 2,150,000
Ten Ten Road/Center Street Utility Relocation - - - - - 2,500,000 2,500,000
Cary Projects Sub-Total 658,700 402,500 890,000 586,500 690,000 4,606,000 7,833,700
WWRWRF Sub-Total 263,500 170,000 85,000 608,600 2,878,100 32,327,200 36,332,400
Total $ 9,632,200 $ 29,067,500 $ 6,355,000 $ 5,535,100 $ 3,968,100 $ 48,083,200 $ 102,641,100
44
FY 2022-23
Beaver Creek Commons Gravity Sewer Extension $1,400,000
Recent development projects near Kelly Road have upgraded and extended gravity sewer from the Abbington Subdivision
to I-540. Currently, there is a gap between I-540 and the Beaver Creek Crossings Pump Station. The land between is part of
a large lot subdivision (Chapel Ridge) with little potential for redevelopment. This project would involve decommissioning
the Beaver Creek Crossings Pump Station and constructing approximately 2,100 feet of 12-inch gravity sewer line and
manholes to complete the system. Not funding this project will require continued maintenance of the pump station. Project
also includes looping a dead-end 12-inch water main along Beaver Creek Commons Drive from Beaver Creek to Kelly Road.
If not constructed, redundancy and improved transmission to town's elevated tanks will not be realized. Increased flushing
of water may be required in the dead-end 12-inch water line to maintain water quality.
Big Branch 2 Pump Station & Force Main $27,060,000 Two-year total
This project includes construction of Big Branch Pump Station (capacity of 3 million gallons per day) and approximately six
miles of 30-inch force main that will discharge at the Western Wake Regional WRF. This infrastructure is needed to serve
the Big Branch Basin, which is generally located in the triangle between I-540, US 1, and NC 55.
Crane Truck - Replacement $250,000
This project will replace one Crane Truck (Unit #84). The crane truck is used regularly in order to perform sensitive repairs
and has been out of service for most of the past year due to the age of the equipment and the inability to replace outdated
and obsolete parts. Currently, outside contractors are required to make the necessary repairs while this truck is out of
commission which is both costly and timely. At time of replacement, the truck will be over 22 years old.
Humie Olive Water Loop $750,000 Two-year total
This project will add approx. 7,000 linear feet of 12-inch water main along Humie Olive and New Hill Olive Chapel Road to
complete a full 12-inch loop in this area. This loop will provide better water quality and fire protection capabilities to this
section of the service area.
Middle Creek - Sunset Hills Pump Station Renovation $3,510,000
This project includes the renovation of the existing Middle Creek - Sunset Hills Pump Station, installing a new deeper wetwell
that will allow the pump station to serve the area to the northeast including the future school site. Pumps will be updated
to carry the additional area and to meet the new pumping characteristics to the new Middle Creek Regional Pump Station.
If this work is not completed, the area to the northeast will have to have its own separate pump station, which is not in the
town's best long-term interest.
Water Main Replacement & Rehab Program $1,900,000 Five-year total
This project includes the gradual replacement of small diameter (<10-inch), extremely old cast iron and AC water lines. These
water lines are 60+ years old and likely tuberculated such that their capacities are greatly reduced. Replacing these lines
will improve reliability and available fire flow in the water system.
Western Transmission Main – Phase III $2,100,000 (Apex BBQ to Peakway)
Phase III of the Western Transmission Main Project will be the final phase of this project. The project includes the following
sections: 900 feet of 20-inch waterline on Salem Street from Apex BBQ Road to the Peakway, and 3,000 feet of 20-inch
waterline on Old US 1 from West Village to Holland Road. The primary purpose of Phase III work is to provide adequate
water flow at a manageable pressure to the entire water system as western portions of Apex, south of Olive Chapel Road,
45
develop and demand grows. This work will also ensure that adequate flow and proper velocities are maintained in the other
areas of Apex as growing demand to the west pulls water in that direction.
FY 2023-24
Friendship Elementary Gravity Sewer $905,000
Due to recent sewer extensions along Little Beaver Creek, the existing pump station located that the Friendship HS/ES site
needs to be taken offline. In order to do so, approximately 2,400 linear feet of 12-inch gravity sewer is needed to extend
from the Friendship Elementary School site to the Little Beaver Creek outfall. Not funding this project will required continued
maintenance of the pump station. Being able to abandon this pump station will reduce the amount of funding needed for
maintenance and eventual upgrades as well as reduce the noise and odors that come from the site.
Old Raleigh Road Water Line Replacement $3,600,000 Two-year Total
The 10-inch water main in Old Raleigh Road was installed in the early 1960s and is now surpassing the designed 50-year life
expectancy. Of additional concern are the improvements to Old Raleigh Road that have taken place over the years,
subjecting this pipe to increasing vibration and stress from vehicle traffic. Research shows that expansive clay soil, which is
found in Apex, contributes to pipe failure, particularly in the smaller diameters like the existing 10-inch line. While we do
have redundancy, a pipe failure along this line would require an inordinate number of other valves and loops to be closed.
US 64 & New Hill Olive Chapel Water Loop $1,630,000 Two-year Total
This project includes water line extension along US 64, starting at the Legacy Development and routed west to New Hill
Olive Chapel Road, connecting to the existing 12-inch water line from Deer Creek. This project includes approximately 6,000
linear feet of 12-inch waterline. This project is critical to provide a redundant feed to Deer Creek along with looping the
waterline to remove the dead end at Deer Creek and dead end along US 64, thereby improving water quality and eliminating
the need to flush the system in those areas.
FY 2024-25
Abbington Gravity Sewer Extension $280,000
Due to constant overtime and emergency maintenance at this station, approximately 2,400 LF of gravity sewer is needed to
connect the sewer flowing into the Abbington Pump Station to the outfall along Reedy Branch. Not funding this project will
require continued maintenance of the pump station. Being able to abandon this pump station will reduce the amount of
funding needed for maintenance and eventual upgrades as well as reduce the noise and odors that come from the site.
FY 2025-26
US 64 Utility Relocation $2,500,000
This project includes extending a 12-inch water line down Laura Duncan Road, under US 64, and tie-in to the existing 12-
inch water line that runs parallel with US 64. In addition, utility relocations are needed to accommodate US 64 improvements.
Existing town utilities within the corridor include 8-inch, 10-inch, and 12-inch water lines, 14-inch force main and 8-10-inch
gravity sewers. If the 12-inch water line is not extended across US 64, the town will have flow issues in this area and continue
to have to flush because of the dead-end lines. These lines are flushed routinely to keep up the proper disinfectant levels
for water quality purposes.
UV System Replacement $1,440,000
The core components of a UV system consist of UV lamps, lamp drivers, and electronic circuit boards. As we all know, new
electronic components generally replace older technology every few years. Like mobile phones, tablets, and computers, for
46
example. We often see them become outdated in two or three years. Similarly, though perhaps not as quickly, a UV system’s
electronic lamp drivers and circuit boards (used for a UV intensity sensor) also have limited useful life expectancies. Not only
that, but as components age, they may become more difficult to replace and keep in stock. Not to mention the cost increases
associated with hard to get parts. There has been significant innovation in UV technology since our TrojanUV4000 was
designed and installed (1998). Newer lamp and driver technologies combined with smart reactor design work together to
reduce the amount of energy needed to achieve disinfection compared to older UV systems. So yes, power savings can
alone justify a UV system replacement. But it’s not the only one. There have also been advances in cleaning systems,
monitoring and controls as well as reductions in maintenance, thanks to reduced lamp counts needed. Can do more for less.
The TrojanUVSigna may be selected to replace the TrojanUV4000 in order to take advantage of the high-efficiency low-
pressure high-output (LPHO) lamp technology, which reduces both electrical consumption and power costs. We will have
the ability to operate the existing TrojanUV4000 system while installing the new UV system.
Horizon
Elevated Water Storage Tank – 2.0 MG $6,500,000
This project includes construction of a 2.0 million-gallon elevated storage tank to meet storage tank to meet storage
requirements as demands grow.
NC 55 Utility Relocation $2,150,000
This project includes utility relocations to accommodate NC Department of Transportation’s (NCDOT) widening of NC
Highway 55. The town has existing water and sewer utilities within the right-of-way, including 12-inch and 6-inch water lines,
fire hydrants, valves, water service lines, 8-inch gravity sewer lines, manholes, and water and sewer service laterals that will
be in conflict with NCDOT's proposed road widening. Utilities in conflict have to be relocated to prevent disruption of utility
service to customers within the construction corridor. This project also includes an extension of 12-inch line down NC 55
under the railroad trestle to create new loop in distribution system.
Ten Ten Road/Center Street Utility Relocation $2,500,000
This project includes utility relocations to accommodate NC Department of Transportation’s widening of Ten Ten
Road/Center Street to Kildaire Farm Road. The town has existing water and sewer utilities within the right-of-way, including
12-inch and 16-inch water lines, fire hydrants, valves, water service lines, and 6-inch and 8-inch force mains that will be in
conflict with NCDOT's proposed road widening. Utilities in conflict have to be relocated to prevent disruption of utility
service to customers within the construction corridor.
47
Water & Sewer Fund Summary
The table below shows the total of the capital needs for the Water and Sewer Fund element and the revenue sources proposed to
support these needs. Local revenue is indicative of the need for current year revenue supported funding for some projects/
purchases in each year.
At this time, no issuance of additional debt is projected to be needed to meet the capital needs described above.
Water & Sewer Utility Fund FY22-23 FY23-24 FY24-25 FY25-26 FY26-27 Future Years Total Capital Cost
Beaver Creek Commons Gravity Sewer Extension 1,400,000 - - - - - 1,400,000
Big Branch 2 Pump Station & Force Main 1,000,000 26,060,000 - - - - 27,060,000
Crane Truck - Replacement 250,000 - - - - - 250,000
Humie Olive Water Loop 150,000 - 600,000 - - - 750,000
Middle Creek - Sunset Hills Pump Station Renovation 3,510,000 - - - - - 3,510,000
Water Main Replacement & Rehab Program 300,000 400,000 400,000 400,000 400,000 - 1,900,000
Western Transmission Main - Phase III 2,100,000 - - - - - 2,100,000
Friendship Elementary Gravity Sewer - 905,000 - - - - 905,000
Old Raleigh Road Water Line Replacement - 800,000 2,800,000 - - - 3,600,000
US 64 & New Hill Olive Chapel Water Loop - 330,000 1,300,000 - - - 1,630,000
Abbington Gravity Sewer Extension - - 280,000 - - - 280,000
US 64 Utility Relocation - - - 2,500,000 - - 2,500,000
UV System Replacement - - - 1,440,000 - - 1,440,000
Elevated Water Storage Tank - 2.0 MG - - - - - 6,500,000 6,500,000
NC 55 Utility Relocation - - - - - 2,150,000 2,150,000
Ten Ten Road/Center Street Utility Relocation - - - - - 2,500,000 2,500,000
Cary Projects Sub-Total 658,700 402,500 890,000 586,500 690,000 4,606,000 7,833,700
WWRWRF Sub-Total 263,500 170,000 85,000 608,600 2,878,100 32,327,200 36,332,400
Total $ 9,632,200 $ 29,067,500 $ 6,355,000 $ 5,535,100 $ 3,968,100 $ 48,083,200 $ 102,641,100
Revenues FY22-23 FY23-24 FY24-25 FY25-26 FY26-27 Future Years Total
Capital Outlay 2,100,000 2,435,000 5,380,000 4,340,000 400,000 4,650,000 19,405,000
Designated Capital Funds 4,022,200 10,632,500 975,000 1,195,100 3,568,100 12,433,200 35,226,100
Grants 3,510,000 3,510,000
Revenue Bonds - 16,000,000 - - - 31,000,000 47,000,000
$ 9,632,200 $ 29,067,500 $ 6,355,000 $ 5,535,100 $ 3,968,100 $ 48,083,200 $ 102,641,100

48
Section 6: Project Funding Detail
The following pages contain project funding details.
49
Transportation Project Cost FY22-23 FY23-24 FY24-25 FY25-26 FY26-27 Future Total
Annual Miscellaneous Road & Sidewalk Improvements 200,000 200,000 200,000 200,000 200,000 200,000 1,200,000
- Intergovernmental Funds 200,000 - - - - - 200,000
- General Fund / Capital Outlay - 200,000 200,000 200,000 200,000 - 800,000
- To Be Determined - - - - - 200,000 200,000
Annual Pavement Management 2,000,000 2,200,000 2,300,000 2,400,000 2,500,000 2,600,000 14,000,000
- Intergovernmental Funds (Powell Bill Revenues) 1,250,000 735,500 1,839,000 1,894,000 1,951,000 2,009,600 9,679,100
- Designated Capital Funds 750,000 1,287,500 461,000 506,000 549,000 - 3,553,500
- General Fund / Capital Outlay - 177,000 - - - - 177,000
- To Be Determined - - - - - 590,400 590,400
GPS Emergency Vehicle Preemption 260,000 160,000 160,000 160,000 - - 740,000
- Designated Capital Funds - - 60,000 - - - 60,000
- General Fund / Capital Outlay 260,000 160,000 100,000 160,000 - - 680,000
Justice Heights Street Extension 250,000 750,000 - - - - 1,000,000
- Intergovernmental Funds 250,000 - - - - - 250,000
- General Fund / Capital Outlay - 750,000 - - - - 750,000
Felton Grove High School Improvements Cost Share 500,000 825,000 825,000 - - - 2,150,000
- Designated Capital Funds 500,000 - - - - - 500,000
- General Fund / Capital Outlay - 825,000 825,000 - - - 1,650,000
Ragan Road Sidepath 200,000 1,050,000 - - - - 1,250,000
- General Fund / Capital Outlay 200,000 - - - - - 200,000
- Intergovernmental Funds - 1,050,000 - - - - 1,050,000
Safe Routes to School 1,710,000 640,000 1,000,000 3,290,000 3,090,000 865,000 10,595,000
- General Obligation Bonds 314,500 640,000 755,500 3,290,000 - - 5,000,000
- Grants 1,395,500 - - - - - 1,395,500
- General Fund / Capital Outlay - - 244,500 - 3,090,000 - 3,334,500
- To Be Determined - - - - - 865,000 865,000
Salem Street Downtown Streetscape & Resurfacing 2,800,000 1,400,000 2,500,000 - - - 6,700,000
- Grants 2,640,000 - - - - - 2,640,000
- General Fund / Capital Outlay 160,000 1,400,000 2,500,000 - - - 4,060,000
Tingen Road Pedestrian Bridge 150,000 500,000 4,050,000 - - - 4,700,000
- General Fund / Capital Outlay 150,000 500,000 2,025,000 - - - 2,675,000
- Grants - - 2,025,000 - - - 2,025,000
- To Be Determined - - - - - - -
Wayfinding Signage Fabrication & Installation 320,000 760,000 415,000 - - - 1,495,000
- General Fund / Capital Outlay 320,000 760,000 415,000 - - - 1,495,000
Center Street Railroad Crossing Improvements & Sidewalk - 140,000 - 920,000 - - 1,060,000
- General Obligation Bonds - 140,000 - 920,000 - - 1,060,000
Chatham Street Railroad Crossing Improvements & Sidewalk - 150,000 - 1,145,000 - - 1,295,000
- General Obligation Bonds - 150,000 - 1,145,000 - - 1,295,000
50
Transportation ContinuedProject Cost FY22-23 FY23-24 FY24-25 FY25-26 FY26-27 Future Total
South Salem Street Bicycle Connection - 300,000 - 2,100,000 - - 2,400,000
- General Fund / Capital Outlay - 300,000 - 2,100,000 - - 2,400,000
Apex Peakway North Widening - - 495,000 5,000,000 - - 5,495,000
- General Obligation Bonds - - 495,000 5,000,000 - - 5,495,000
GoApex Transit Program - - 100,000 690,000 - - 790,000
- General Fund / Capital Outlay - - 100,000 - - - 100,000
- Grants - - - 690,000 - - 690,000
Jessie Drive Phase I & Phase II - - 1,000,000 8,500,000 - 13,500,000 23,000,000
- Designated Capital Funds - - 865,000 - - - 865,000
- General Obligation Bonds - - - 8,500,000 - - 8,500,000
- General Fund / Capital Outlay - - 135,000 - - - 135,000
- To Be Determined - - - - - 13,500,000 13,500,000
West Williams Street Sidewalk - - 200,000 650,000 - - 850,000
- General Fund / Capital Outlay - - 200,000 - - - 200,000
- General Obligation Bonds - - 650,000 - - 650,000
Apex Peakway Southeast Connector - - - 1,710,000 - 17,100,000 18,810,000
- General Fund / Capital Outlay - - - 1,710,000 - - 1,710,000
- To Be Determined - - - - - 17,100,000 17,100,000
Davis Drive at Salem Church Road Realignment - - - 200,000 500,000 7,000,000 7,700,000
- General Fund / Capital Outlay - - - 200,000 500,000 - 700,000
- To Be Determined - - - - - 7,000,000 7,000,000
Pavement Management Backlog - - - 5,000,000 - - 5,000,000
- General Obligation Bonds - - - 5,000,000 - - 5,000,000
Pristine Water Drive Connector - - - 500,000 3,000,000 - 3,500,000
- Designated Capital Funds - - - 500,000 - - 500,000
- General Fund / Capital Outlay - - - - 3,000,000 - 3,000,000
Production Drive Extension - - - 300,000 2,000,000 - 2,300,000
- Designated Capital Funds - - - 300,000 857,500 - 1,157,500
- General Fund / Capital Outlay - - - 1,142,500 - 1,142,500
NC 55 Sidewalk & Enhancement Cost Share (U-2901) - - - - - 2,000,000 2,000,000
- To Be Determined - - - - - 2,000,000 2,000,000
US 64 Sidewalk & Enhancement Cost Share (U-5301) - - - - - 2,000,000 2,000,000
- To Be Determined - - - - - 2,000,000 2,000,000
Ten Ten Road/Center Street Sidewalk & Enhancement Cost
Share (U-5825) - - - - - 2,000,000 2,000,000
- To Be Determined - - - - - 2,000,000 2,000,000
51
Parks, Recreation, & Cultural Resources Project Cost FY22-23 FY23-24 FY24-25 FY25-26 FY26-27 Future Total
Annual Miscellaneous Greenway Connections 300,000 300,000 300,000 300,000 300,000 300,000 1,800,000
- General Fund / Capital Outlay 300,000 300,000 300,000 300,000 300,000 300,000 1,800,000
Beaver Creek Greenway Improvements 650,000 - - - - - 650,000
- General Fund / Capital Outlay 650,000 - - - - - 650,000
Hunter Street Bike Track 225,000 - - - - - 225,000
- General Fund / Capital Outlay 225,000 - - - - - 225,000
Environmental Education Center - 300,000 - 3,500,000 - - 3,800,000
- General Fund / Capital Outlay - 300,000 - - - - 300,000
- Installment Purchase / Capital Lease - - - 3,500,000 - - 3,500,000
Pleasant Park Baseball & Softball Complex - 4,007,600 4,007,600 - - - 8,015,200
- General Fund / Capital Outlay - 4,007,600 4,007,600 - - - 8,015,200
West Street Park Improvements - 1,500,000 - - - - 1,500,000
- Grants - 1,500,000 - - - - 1,500,000
Beaver Creek Greenway Extension - - 500,000 1,000,000 5,000,000 8,031,000 14,531,000
- General Fund / Capital Outlay 500,000 1,000,000 5,000,000 - 6,500,000
- General Obligation Bond - - - - - 8,031,000 8,031,000
KidsTowne Playground Renovation - - 100,000 1,500,000 - - 1,600,000
- General Fund / Capital Outlay - - 100,000 1,500,000 - - 1,600,000
Apex Nature Park/Seymour Athletic Fields
Parking Lot Expansion - - - 1,200,000 - - 1,200,000
- General Fund / Capital Outlay - - - 1,200,000 - - 1,200,000
Big Branch Greenway - - - 300,000 150,000 8,000,000 8,450,000
- General Fund / Capital Outlay - - - 300,000 150,000 - 450,000
- General Obligation Bond - - - - - 8,000,000 8,000,000
Jaycee Park Expansion - - - - 150,000 1,500,000 1,650,000
- General Fund / Capital Outlay - - - - 150,000 1,500,000 1,650,000
Reedy Branch Greenway - - - - 300,000 3,000,000 3,300,000
- General Fund / Capital Outlay - - - - 300,000 3,000,000 3,300,000
Apex Community Park Parking Lot Expansion - - - - - 700,000 700,000
- General Fund / Capital Outlay - - - - - 700,000 700,000
Middle Creek Greenway - - - - - 4,600,000 4,600,000
- Installment Purchase / Capital Lease - - - - - 4,600,000 4,600,000
Olive Farm Park Design - - - - - 25,000,000 25,000,000
- General Obligation Bond - - - - - 25,000,000 25,000,000
Wimberly Road Park Design - - - - - 30,500,000 30,500,000
- General Obligation Bond - - - - - 30,500,000 30,500,000
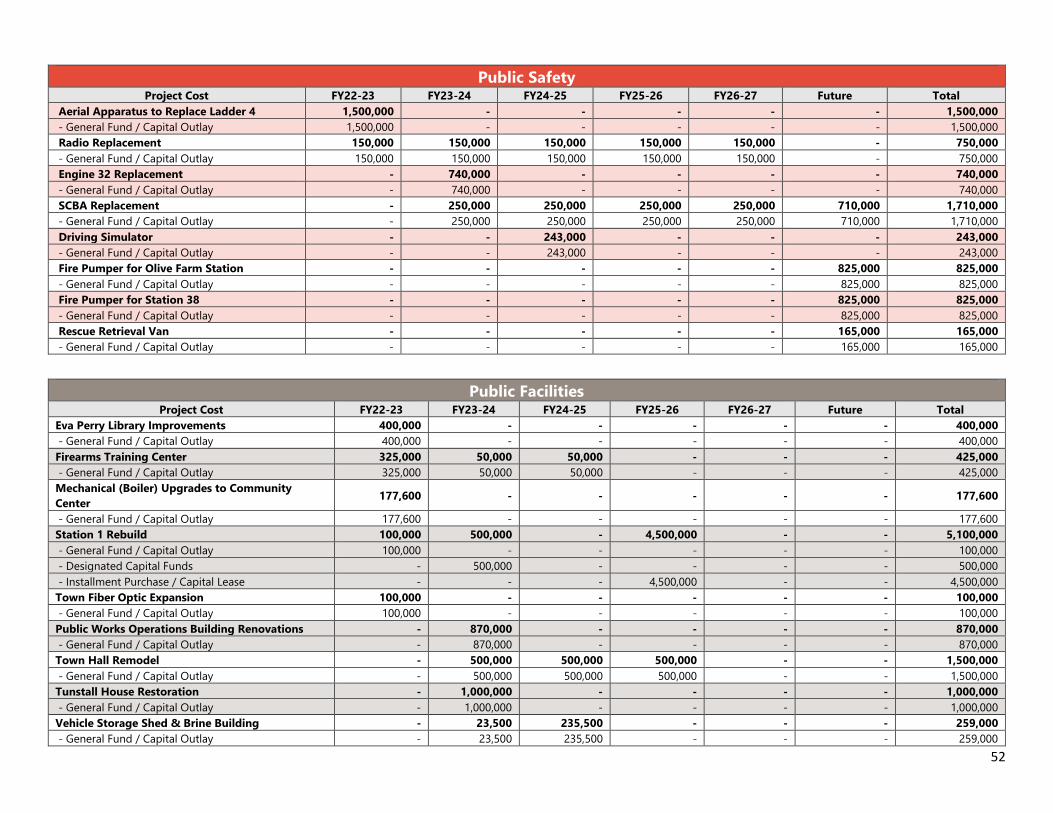
52
Public Safety Project Cost FY22-23 FY23-24 FY24-25 FY25-26 FY26-27 Future Total
Aerial Apparatus to Replace Ladder 4 1,500,000 - - - - - 1,500,000
- General Fund / Capital Outlay 1,500,000 - - - - - 1,500,000
Radio Replacement 150,000 150,000 150,000 150,000 150,000 - 750,000
- General Fund / Capital Outlay 150,000 150,000 150,000 150,000 150,000 - 750,000
Engine 32 Replacement - 740,000 - - - - 740,000
- General Fund / Capital Outlay - 740,000 - - - - 740,000
SCBA Replacement - 250,000 250,000 250,000 250,000 710,000 1,710,000
- General Fund / Capital Outlay - 250,000 250,000 250,000 250,000 710,000 1,710,000
Driving Simulator - - 243,000 - - - 243,000
- General Fund / Capital Outlay - - 243,000 - - - 243,000
Fire Pumper for Olive Farm Station - - - - - 825,000 825,000
- General Fund / Capital Outlay - - - - - 825,000 825,000
Fire Pumper for Station 38 - - - - - 825,000 825,000
- General Fund / Capital Outlay - - - - - 825,000 825,000
Rescue Retrieval Van - - - - - 165,000 165,000
- General Fund / Capital Outlay - - - - - 165,000 165,000
Public Facilities Project Cost FY22-23 FY23-24 FY24-25 FY25-26 FY26-27 Future Total
Eva Perry Library Improvements 400,000 - - - - - 400,000
- General Fund / Capital Outlay 400,000 - - - - - 400,000
Firearms Training Center 325,000 50,000 50,000 - - - 425,000
- General Fund / Capital Outlay 325,000 50,000 50,000 - - - 425,000
Mechanical (Boiler) Upgrades to Community
Center 177,600 - - - - - 177,600
- General Fund / Capital Outlay 177,600 - - - - - 177,600
Station 1 Rebuild 100,000 500,000 - 4,500,000 - - 5,100,000
- General Fund / Capital Outlay 100,000 - - - - - 100,000
- Designated Capital Funds - 500,000 - - - - 500,000
- Installment Purchase / Capital Lease - - - 4,500,000 - - 4,500,000
Town Fiber Optic Expansion 100,000 - - - - - 100,000
- General Fund / Capital Outlay 100,000 - - - - - 100,000
Public Works Operations Building Renovations - 870,000 - - - - 870,000
- General Fund / Capital Outlay - 870,000 - - - - 870,000
Town Hall Remodel - 500,000 500,000 500,000 - - 1,500,000
- General Fund / Capital Outlay - 500,000 500,000 500,000 - - 1,500,000
Tunstall House Restoration - 1,000,000 - - - - 1,000,000
- General Fund / Capital Outlay - 1,000,000 - - - - 1,000,000
Vehicle Storage Shed & Brine Building - 23,500 235,500 - - - 259,000
- General Fund / Capital Outlay - 23,500 235,500 - - - 259,000
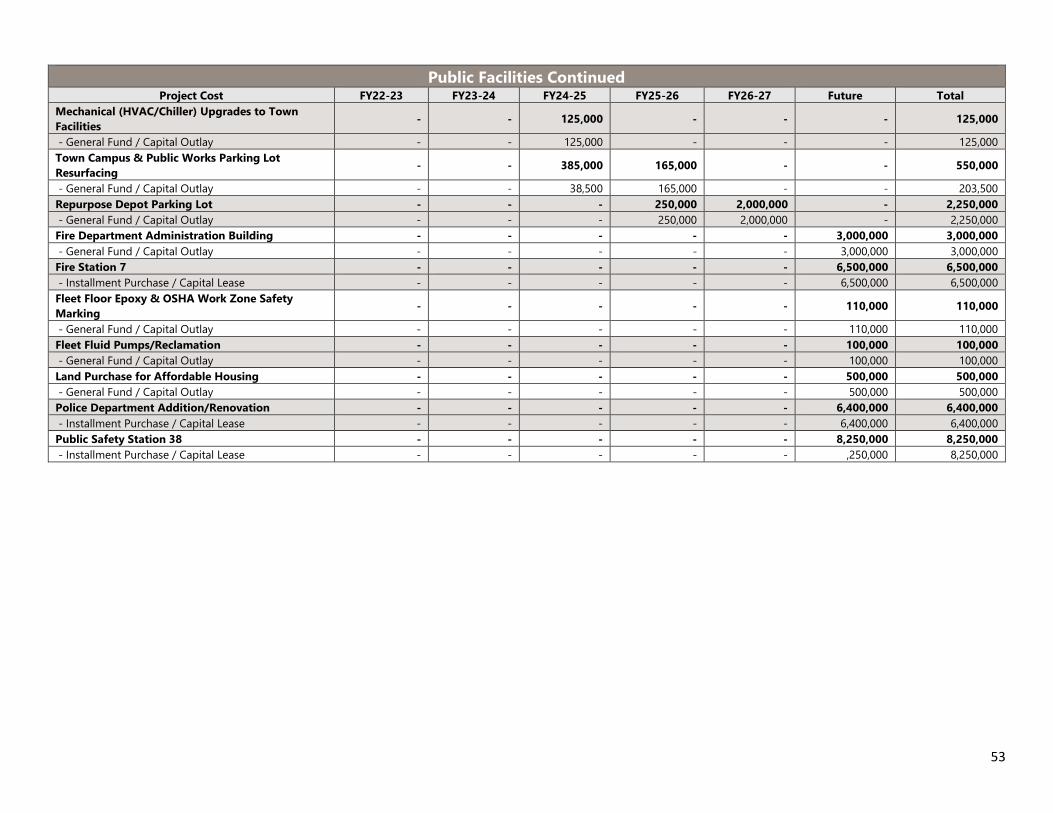
53
Public Facilities ContinuedProject Cost FY22-23 FY23-24 FY24-25 FY25-26 FY26-27 Future Total
Mechanical (HVAC/Chiller) Upgrades to Town
Facilities - - 125,000 - - - 125,000
- General Fund / Capital Outlay - - 125,000 - - - 125,000
Town Campus & Public Works Parking Lot
Resurfacing - - 385,000 165,000 - - 550,000
- General Fund / Capital Outlay - - 38,500 165,000 - - 203,500
Repurpose Depot Parking Lot - - - 250,000 2,000,000 - 2,250,000
- General Fund / Capital Outlay - - - 250,000 2,000,000 - 2,250,000
Fire Department Administration Building - - - - - 3,000,000 3,000,000
- General Fund / Capital Outlay - - - - - 3,000,000 3,000,000
Fire Station 7 - - - - - 6,500,000 6,500,000
- Installment Purchase / Capital Lease - - - - - 6,500,000 6,500,000
Fleet Floor Epoxy & OSHA Work Zone Safety
Marking - - - - - 110,000 110,000
- General Fund / Capital Outlay - - - - - 110,000 110,000
Fleet Fluid Pumps/Reclamation - - - - - 100,000 100,000
- General Fund / Capital Outlay - - - - - 100,000 100,000
Land Purchase for Affordable Housing - - - - - 500,000 500,000
- General Fund / Capital Outlay - - - - - 500,000 500,000
Police Department Addition/Renovation - - - - - 6,400,000 6,400,000
- Installment Purchase / Capital Lease - - - - - 6,400,000 6,400,000
Public Safety Station 38 - - - - - 8,250,000 8,250,000
- Installment Purchase / Capital Lease - - - - - ,250,000 8,250,000
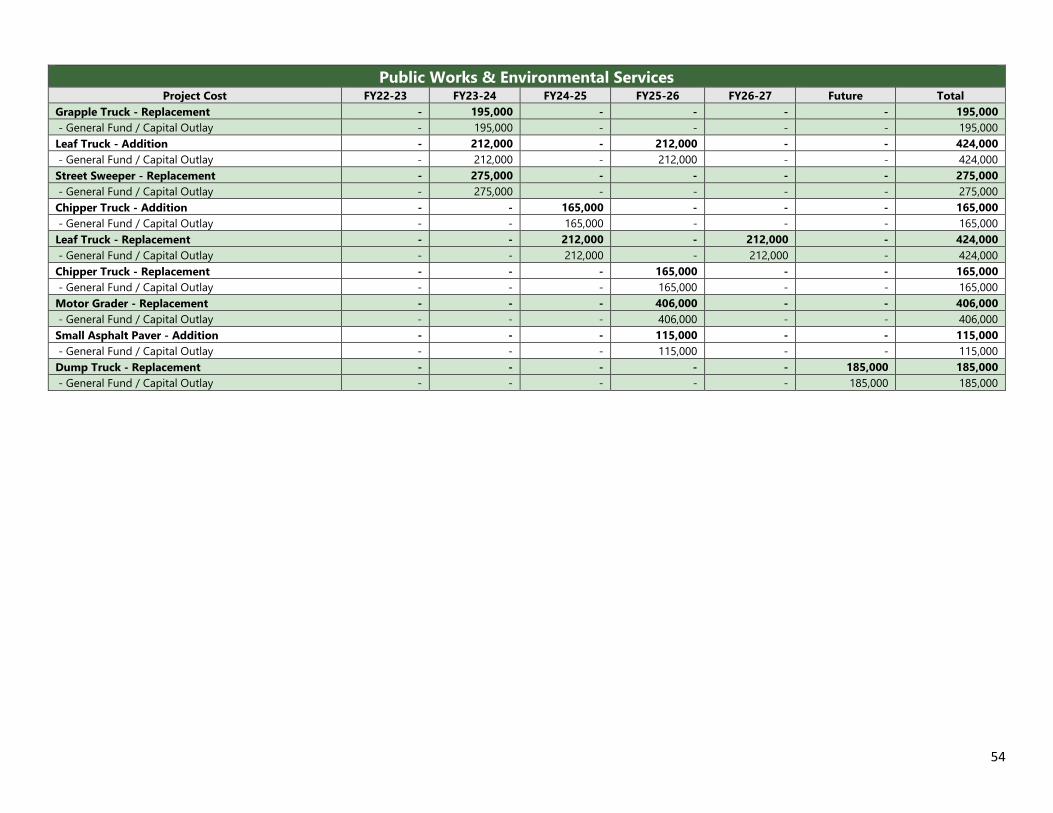
54
Public Works & Environmental Services Project Cost FY22-23 FY23-24 FY24-25 FY25-26 FY26-27 Future Total
Grapple Truck - Replacement - 195,000 - - - - 195,000
- General Fund / Capital Outlay - 195,000 - - - - 195,000
Leaf Truck - Addition - 212,000 - 212,000 - - 424,000
- General Fund / Capital Outlay - 212,000 - 212,000 - - 424,000
Street Sweeper - Replacement - 275,000 - - - - 275,000
- General Fund / Capital Outlay - 275,000 - - - - 275,000
Chipper Truck - Addition - - 165,000 - - - 165,000
- General Fund / Capital Outlay - - 165,000 - - - 165,000
Leaf Truck - Replacement - - 212,000 - 212,000 - 424,000
- General Fund / Capital Outlay - - 212,000 - 212,000 - 424,000
Chipper Truck - Replacement - - - 165,000 - - 165,000
- General Fund / Capital Outlay - - - 165,000 - - 165,000
Motor Grader - Replacement - - - 406,000 - - 406,000
- General Fund / Capital Outlay - - - 406,000 - - 406,000
Small Asphalt Paver - Addition - - - 115,000 - - 115,000
- General Fund / Capital Outlay - - - 115,000 - - 115,000
Dump Truck - Replacement - - - - - 185,000 185,000
- General Fund / Capital Outlay - - - - - 185,000 185,000
Related Documents