UGPTI Publication No. 233 November 2010 ANNUAL NORTH DAKOTA ELEVATOR MARKETING REPORT, 2009-10 Kimberly Vachal Associate Research Fellow Laurel Benson Research Project Specialist Upper Great Plains Transportation Institute North Dakota State University Fargo, North Dakota in cooperation with North Dakota Wheat Commission North Dakota Public Service Commission and Special thanks to the North Dakota Elevator Industry who provide these data monthly.

Annual North Dakota Elevator Marketing Report, 2009-10 (DP-233)
Mar 27, 2016
The objective of this report is to provide a benchmark for elevator managers in assessing performance, and supply a source for recognizing trends in the characteristics of North Dakota elevators.
Welcome message from author
This document is posted to help you gain knowledge. Please leave a comment to let me know what you think about it! Share it to your friends and learn new things together.
Transcript

UGPTI Publication No. 233
November 2010
ANNUAL NORTH DAKOTA ELEVATOR
MARKETING REPORT, 2009-10
Kimberly Vachal Associate Research Fellow
Laurel Benson
Research Project Specialist
Upper Great Plains Transportation Institute North Dakota State University
Fargo, North Dakota
in cooperation with
North Dakota Wheat Commission
North Dakota Public Service Commission
and
Special thanks to the North Dakota Elevator Industry who provide these data monthly.

North Dakota State University does not discriminate on the basis of age, color, disability, gender identity, marital status, national origin, public assistance status, sex, sexual orientation, status as a U.S. veteran, race or religion. Direct inquiries to the Vice President for Equity, Diversity and Global Outreach, 205 Old Main, (701)231-7708.

i
TABLE OF CONTENTS
North Dakota Elevator Marketing Statistics ................................................................................................. iii
Overview ......................................................................................................................................... iii
Source of Data ................................................................................................................................. iii
Scope of Report ............................................................................................................................... iii
Organization of the Report .............................................................................................................. iii
Definition of Elevator Summary Variables .................................................................................................. iv
North Dakota Elevators ................................................................................................................................. 1
Elevator Categories .......................................................................................................................... 1
Storage Capacity .............................................................................................................................. 1
Grain Handled .................................................................................................................................. 1
Storage and Total Grain Shipments for North Dakota Elevators ................................................................... 2
Concentration Ratios for North Dakota's 5, 10, 25, 50, 100, and 150 Largest Volume Elevators ................. 2
North Dakota Multi and Unit Car Loading Facilities .................................................................................... 3
Elevators in Each CRD ................................................................................................................................. 4
Turnover Ratios for Each Elevator Category ................................................................................................. 5
Modal Shipments of Grains and Oilseeds for Each Elevator Category ....................................................... 5
ND Elevator Shipments, Storage, and Turnover Ratios for Each CRD ......................................................... 6
Modal Share of Grain and Oilseed Shipments from Each CRD .................................................................... 7
Destinations for Grain and Oilseed Shipments Originating from North Dakota Elevators............................ 9
All Grains and Oilseeds ................................................................................................................. 11
HRS Wheat .................................................................................................................................... 17
Durum ............................................................................................................................................ 23
Barley ............................................................................................................................................. 29
Sunflowers ..................................................................................................................................... 33
Canola ............................................................................................................................................ 37
Soybeans ........................................................................................................................................ 41
Corn ............................................................................................................................................... 45
Dry Edible Beans ........................................................................................................................... 49
Dry Edible Peas .............................................................................................................................. 53

ii
Mode for Grain and Oilseed Shipments Originating from North Dakota Elevators .................................... 57
All Grains and Oilseeds ................................................................................................................ 58
HRS Wheat .................................................................................................................................... 60
Durum ............................................................................................................................................ 62
Barley ............................................................................................................................................. 64
Sunflowers ..................................................................................................................................... 65
Canola ............................................................................................................................................ 66
Soybeans ........................................................................................................................................ 67
Corn ............................................................................................................................................... 68
Dry Edible Beans ........................................................................................................................... 69
Dry Edible Peas .............................................................................................................................. 70

iii
Overview
The Annual North Dakota Elevator Marketing Report for 2009-10 was prepared by Kimberly Vachal and Laurel Benson,
Upper Great Plains Transportation Institute. The authors gratefully acknowledge the assistance of the North Dakota
Wheat Commission and the North Dakota Public Service Commission in compiling this report.
The objective of this report is to provide a benchmark for elevator managers in assessing performance, and supply a
source for recognizing trends in the characteristics of North Dakota elevators. This report and the statistics mailed to
individual elevators are presented as a source of information for elevator managers and those interested in the North
Dakota grain industry. Continuation of the report as an annual project will be considered based on public response.
Source of Data
The distribution and shipment data in this report was developed from the Public Service Commission reports that require
elevators to report monthly movements of grains and oilseeds by truck and rail. The storage capacities reported to the
ND PSC were used to calculate the turnover ratios.
Scope of Report
Data are tabulated according to elevator type to provide general information on characteristics that describe commodity
flows or provide a benchmark for elevators.
$ Turnover: Equal to the ratio of volume of grain handled to the storage capacity available.
$ Destination: Duluth-Superior, MN/WI, PNW, Midland-Southwest, North Dakota, and
miscellaneous markets.
$ Origin: Nine crop reporting districts.
$ Mode: Truck or rail.
$ Elevator Size: Elevators are stratified into four groups based on the number of cars an elevator
can load without railroad switching services (1) Single Car (1 to 24 cars), (2)
Multiple Car (25 to 49 cars), (3) Unit Train (50 to 99 cars), (4) No Rail, and (5)
100-car (100 cars or more).
$ Time: Crop year, from July 2009 to June 2010.
$ Commodity: Hard red spring wheat, durum, barley, sunflowers, soybeans, canola, corn, dry
edible beans, and dry edible peas.
Organization of the Report
Five groups of data will be presented in this report: (1) individual elevator performance (e.g. turnover) and distribution
information (due to confidentiality agreements, each elevator receives individual data on only its own activities),
(2) storage capacity, volume handled, and turnover ratios by elevator size and for each crop reporting district, (3) elevator
distribution and modal choice for the state, (4) destination information for each of the state's nine crop reporting districts
and each of the commodities, (5) modal selection for each of the crop reporting districts and for each commodity
marketed. Elevator managers will be able to compare their performance to that of similar elevators (e.g. size and
location).

iv
Definition of Elevator Summary Variables
Storage: Bushels of storage as reported by the elevator to the ND PSC.
Turnover Ratio: Ratio of grain and oilseed shipments to available storage capacity.
Elevator Size: No Rail Elevator: Elevator with no rail service
Single Car Elevator: Elevator with track space for 1 to 24 cars
Multi Car Elevator: Elevator with track space for 25 to 49 cars
Unit Train Elevator: Elevator with track space for 50 to 99 cars
100-Car Elevator: Elevator with track space for 100 cars or more
Information used in the reports was based on railroad and ND PSC data. Track space refers to
the number of cars that can be loaded without railroad switching assistance.
Mode for Grain & Oilseed
Shipments by Rail:
Single Car Shipments: Car orders purchased under rates for 1 to 24 cars
25 to 49 Car Shipments: Car orders purchased under rates for 25 to 49 cars
50 Car Shipments: Car orders purchased under rates for 50 or more cars
Information used in reports was based on the monthly grain and oilseed movement and storage
reports that elevators submit to the ND PSC.
Destinations for Grain
and Oilseed Shipments:
Destinations for grain and oilseed shipments, reported by the elevators in the monthly reports,
are not final destinations for shipments. The destinations reported for rail shipments are the
Waybill destinations. The destinations for truck shipments are reported as they are specified on
the billing statement.
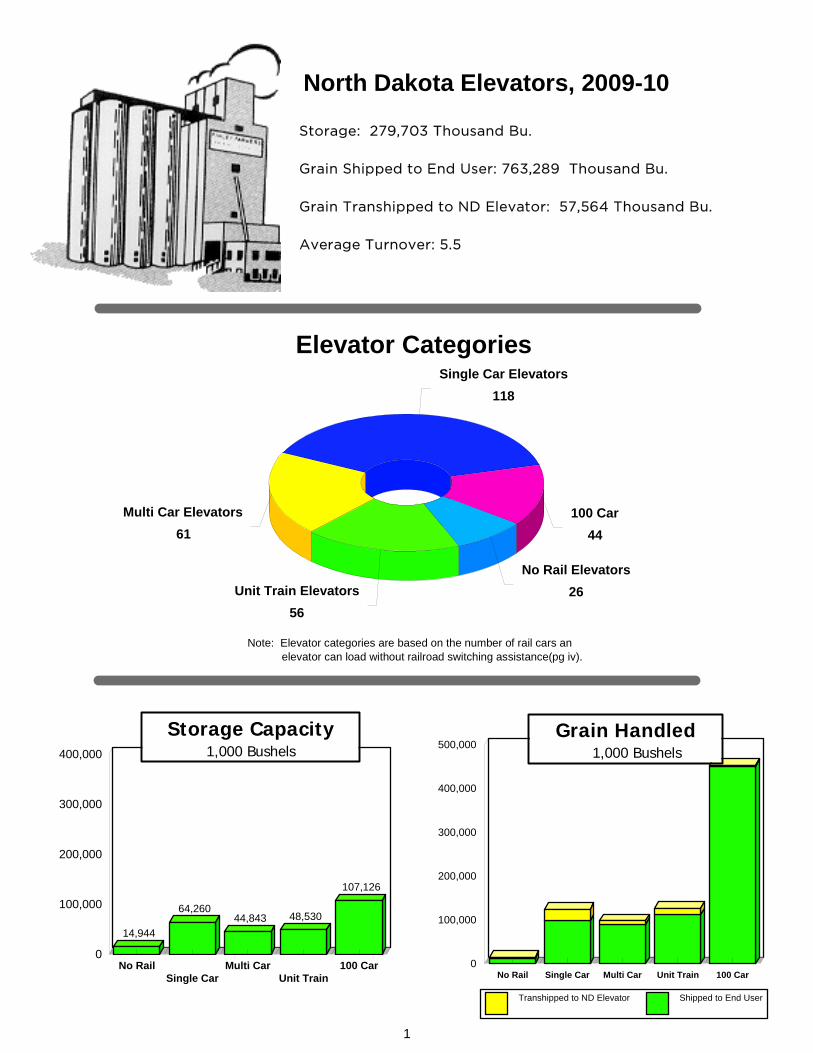
North Dakota Elevators, 2009-10
Storage: 279,703 Thousand Bu.
Grain Shipped to End User: 763,289 Thousand Bu.
Grain Transhipped to ND Elevator: 57,564 Thousand Bu.
Average Turnover: 5.5
Elevator Categories
Note: Elevator categories are based on the number of rail cars an elevator can load without railroad switching assistance(pg iv).
14,944
64,26044,843 48,530
107,126
No Rail Single Car
Multi CarUnit Train
100 Car0
100,000
200,000
300,000
400,000
Storage Capacity1,000 Bushels
No Rail Single Car Multi Car Unit Train 100 Car0
100,000
200,000
300,000
400,000
500,000
Transhipped to ND Elevator Shipped to End User
Grain Handled 1,000 Bushels
Single Car Elevators
118
Multi Car Elevators
61
Unit Train Elevators
56
No Rail Elevators
26
100 Car
44
1

1994-95 1997-98 2000-01 2003-04 2006-07 2009-10
100,000
200,000
300,000
400,000
500,000
600,000
700,000
800,0001,
000
Bu
shel
s
Storage and Total Grain Shipmentsfor North Dakota Elevators
Concentration Ratios for North Dakota's 5, 10, 25, 50, 100, and 150 Largest Volume Elevators
1994-95 1997-98 2000-01 2003-04 2006-07 2009-100%
20%
40%
60%
80%
100%
Per
cen
t o
f T
ota
l Bu
shel
s
Top 5
Top 10
Top 25
Top 50
Top 100
Top 150
Shipments
Storage
2

No
rth
Dak
ota
Mu
ltic
ar, U
nit
, & S
hu
ttle
Trai
n C
ar L
oad
ing
Sta
tio
ns
, 200
7
3

Elevators in Each CRD, 2009-10
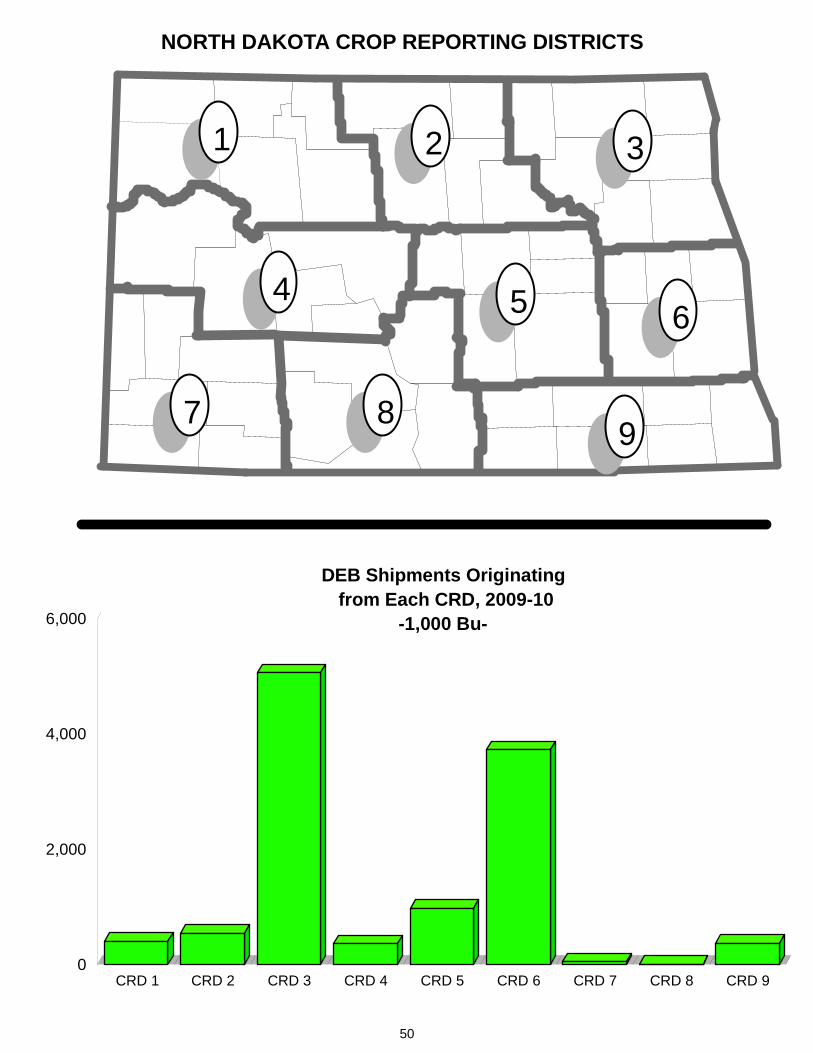
NORTH DAKOTA CROP REPORTING DISTRICTS
21 3
654
987
CRD 1 CRD 2 CRD 3 CRD 4 CRD 5 CRD 6 CRD 7 CRD 8 CRD 90
20
40
60
80
100
100 Car Unit Train Elevators Multi Car Elevators Single Car Elevators No Rail
4
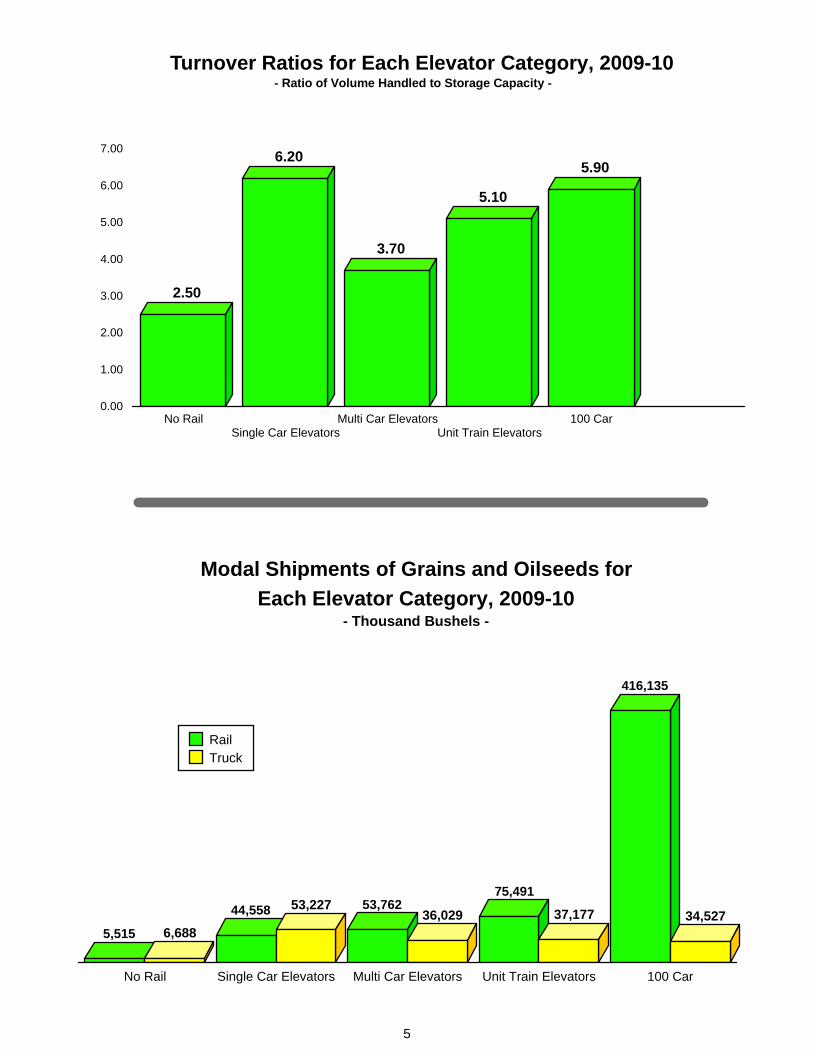
2.50
6.20
3.70
5.10
5.90
No RailSingle Car Elevators
Multi Car ElevatorsUnit Train Elevators
100 Car0.00
1.00
2.00
3.00
4.00
5.00
6.00
7.00
Turnover Ratios for Each Elevator Category, 2009-10 - Ratio of Volume Handled to Storage Capacity -
5,515 6,688
44,558 53,227 53,76236,029
75,491
37,177
416,135
34,527
No Rail Single Car Elevators Multi Car Elevators Unit Train Elevators 100 Car
RailTruck
Modal Shipments of Grains and Oilseeds for
Each Elevator Category, 2009-10- Thousand Bushels -
5

5.906.40
5.90 5.90
3.40
6.20
8.60
7.80
3.40
CRD 1 CRD 2 CRD 3 CRD 4 CRD 5 CRD 6 CRD 7 CRD 8 CRD 9
Average Turnover of Shipments to Storagefor Each CRD, 2009-10
-Weighted by grain shipments-
ND Elevator Storage, Shipments, and Turnover Ratios for Each CRD, 2009-10
CRD
#
Elev
Storage
Capacity Total
Transhippeda Total
Shipmentsb
Average Turnover
1 27 22,697,400 1,271,036 96,306,149 5.9
2 25 14,584,000 5,864,921 54,520,805 6.4
3 81 54,334,888 17,481,158 144,186,290 5.9
4 12 8,327,000 3,311,719 38,435,236 5.9
5 36 39,138,600 7,407,328 81,037,682 3.4
6 54 67,069,111 16,148,181 140,149,407 6.2
7 16 10,718,000 347,680 50,062,274 8.6
8 12 4,245,000 622,187 18,410,588 7.8
9 42 58,606,770 5,110,109 10,181,063 3.4
All 305 279,720,769 57,564,319 633,289,494 5.9
aBushels transhipped to other ND elevators. bBushels shipped to processors, and various export points.
6

Modal Share of Grain and Oilseed Shipmentsfrom Each CRD, 2009-10
94%
6%
74%
26%
71%
29%
70%
30%
73%
27%
74%
26%
95%
5%
66%
34%
81%
19%
Rail Truck
Rail
78%
Truck
22%
Rail/Truck Share of Grain and Oilseed Shipments from ND, 2009-10
7

8

Destinations for Grain and Oilseed Shipments Originating from
North Dakota Elevators
9

10

All Grains and Oilseeds
11
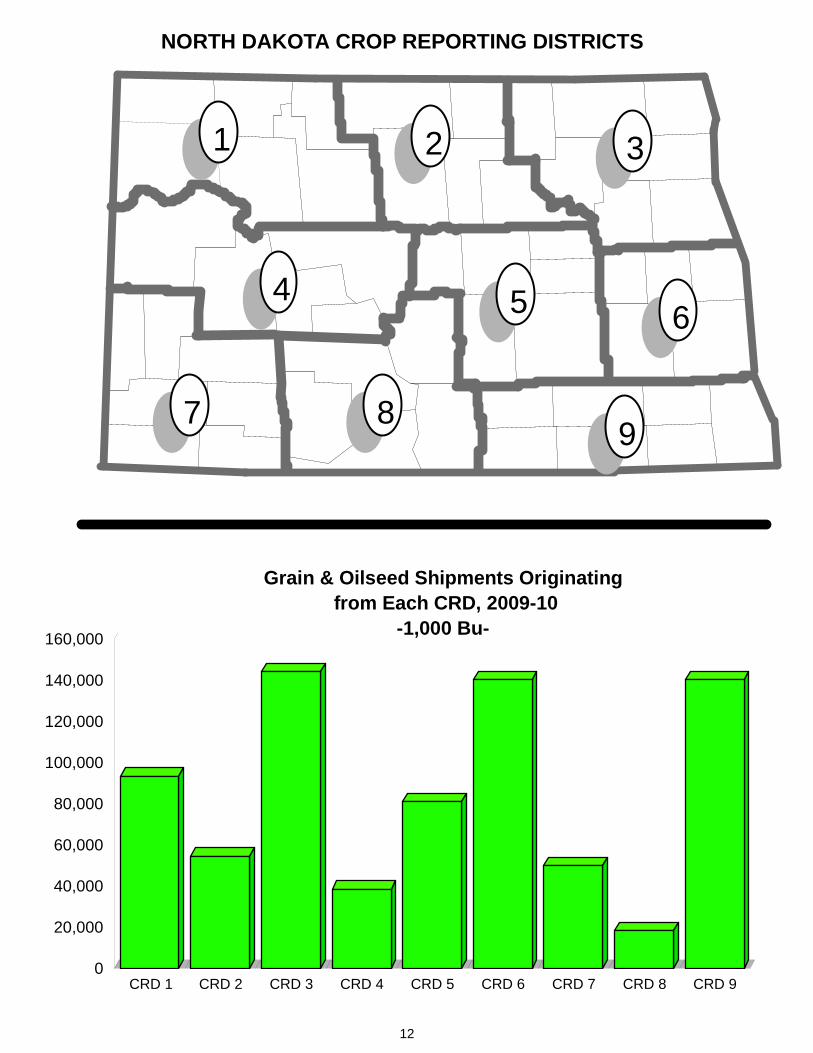
CRD 1 CRD 2 CRD 3 CRD 4 CRD 5 CRD 6 CRD 7 CRD 8 CRD 90
20,000
40,000
60,000
80,000
100,000
120,000
140,000
160,000
NORTH DAKOTA CROP REPORTING DISTRICTS
21 3
654
987
Grain & Oilseed Shipments Originating from Each CRD, 2009-10
-1,000 Bu-
12

Other32%
PNW19%
ND18%
MN/WI17%
Midland/SW8%
Dul-Sup5%
MN/WI28%
Midland/SW11%
PNW9%
ND25%
Other26%
PNW29%
Other24%
MN/WI20% Midland/SW
15%
Dul-Sup9%
ND3%
MN/W61%
ND22%
Midland/SW13%
Other3% Dul-Sup
1%
Dul-Sup4%
MN/WI21%
Midland/SW8%
PNW26%
ND20%
Other20%
Dul-Sup15%
MN/WI23%
Midland/SW15%
PNW19% ND
14%
Other15%
All North Dakota
Crop Reporting District2009-10
Destinations for Grain & Oilseed Shipments
Other32%ND
26%
MN/WI23%
PNW10%
Midland/SW5%
Dul-Sup3%
Dul-Sup2%
MN/WI25%
Midland/SW4%
PNW23%
ND22%
Other24% Dul-Sup
2%
MN/WI17%
Midland/SW9%
PNW45%
ND20%
Other8%
PNW35%
ND29%
MN/WI17%
Other15%
Midland/SW3%
13
2003-04 2004-05 2005-06 2006-07 2007-08 2008-09 2009-10
0%
10%
20%
30%
40%
DuluthMinn-St. Paul
MidlandPNW
ND Other
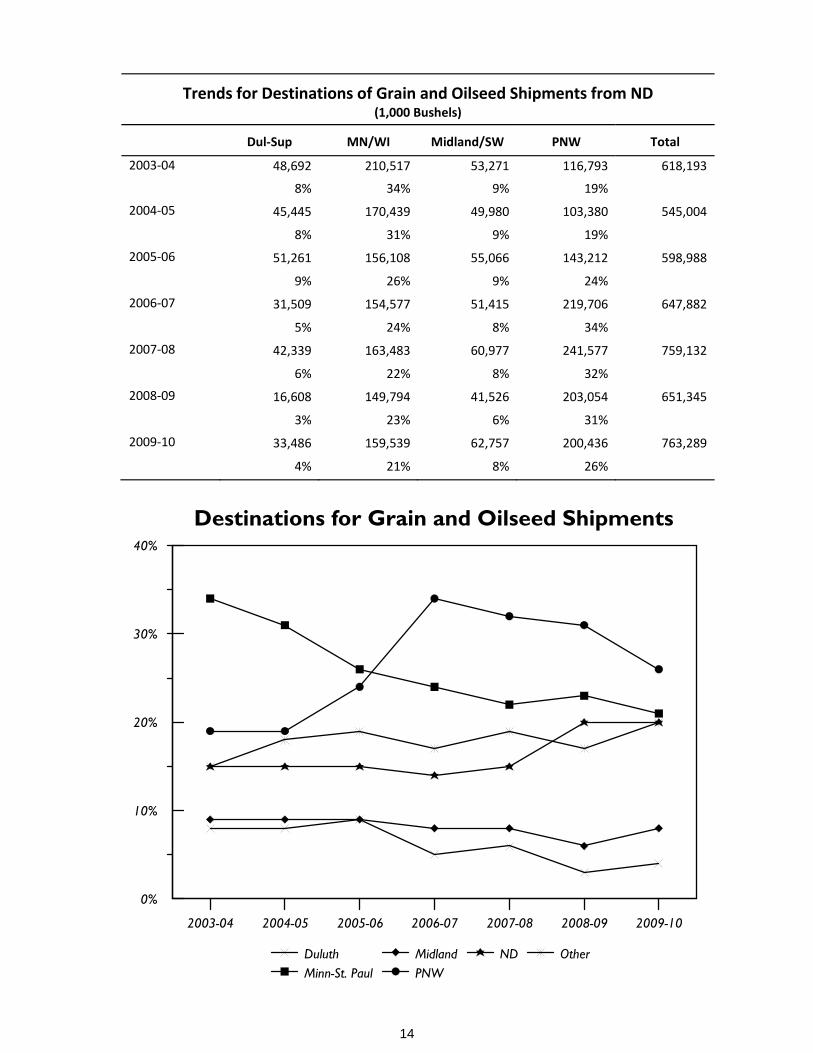
Destinations for Grain and Oilseed Shipments
Trends for Destinations of Grain and Oilseed Shipments from ND
(1,000 Bushels)
Dul‐Sup
MN/WI Midland/SW PNW
Total
2003‐04 48,692 210,517 53,271 116,793 618,193
8% 34% 9% 19%
2004‐05 45,445 170,439 49,980 103,380 545,004
8% 31% 9% 19%
2005‐06 51,261 156,108 55,066 143,212 598,988
9% 26% 9% 24%
2006‐07 31,509 154,577 51,415 219,706 647,882
5% 24% 8% 34%
2007‐08 42,339 163,483 60,977 241,577 759,132
6% 22% 8% 32%
2008‐09 16,608 149,794 41,526 203,054 651,345
3% 23% 6% 31%
2009‐10 33,486 159,539 62,757 200,436 763,289
4% 21% 8% 26%
14

Destinations for Grain and Oilseed Shipments from ND CRD's(1,000 Bushels)
Duluth MN/WI Midland PNW ND Other Total Duluth MN/WI Midland PNW ND Other Total
2003‐04 8% 25% 21% 20% 17% 9% 77,316 2003‐04 11% 29% 9% 20% 24% 7% 53,113
2004‐05 6% 21% 19% 24% 16% 15% 75,036 2004‐05 12% 27% 11% 18% 2% 14% 45,969
2005‐06 15% 31% 16% 13% 15% 12% 91,549 2005‐06 11% 25% 7% 20% 20% 19% 49,161
2006‐07 10% 19% 19% 25% 17% 11% 83,666 2006‐07 4% 41% 9% 17% 20% 12% 51,067
2007‐08 16% 20% 10% 24% 14% 13% 96,419 2007‐08 6% 30% 7% 19% 21% 20% 56,003
2008‐09 6% 25% 17% 19% 21% 11% 70,041 2008‐09 4% 23% 6% 16% 30% 20% 43,796
2009‐10 15% 23% 15% 19% 14% 15% 93,306 2009‐10 3% 23% 5% 10% 26% 32% 54,521
Duluth MN/WI Midland PNW ND Other Total Duluth MN/WI Midland PNW ND Other Total
2003‐04 9% 36% 6% 7% 17% 24% 126,613 2003‐04 3% 60% 7% 3% 15% 12% 20,327
2004‐05 13% 32% 7% 7% 20% 24% 102,546 2004‐05 2% 62% 10% 2% 14% 12% 22,360
2005‐06 9% 25% 11% 9% 19% 31% 106,106 2005‐06 9% 40% 8% 0% 14% 29% 25,222
2006‐07 5% 25% 7% 12% 19% 34% 125,328 2006‐07 4% 32% 17% 6% 22% 20% 23,210
2007‐08 5% 24% 7% 18% 17% 32% 155,866 2007‐08 3% 25% 14% 5% 30% 24% 32,427
2008‐09 2% 26% 5% 17% 18% 32% 138,404 2008‐09 2% 22% 9% 8% 36% 24% 24,489
2009‐10 5% 17% 8% 19% 18% 31% 144,186 2009‐10 0% 28% 11% 9% 25% 26% 38,435
Duluth MN/WI Midland PNW ND Other Total Duluth MN/WI Midland PNW ND Other Total
2003‐04 8% 34% 5% 13% 19% 21% 61,479 2003‐04 10% 28% 9% 33% 10% 8% 143,523
2004‐05 13% 38% 9% 12% 16% 12% 60,076 2004‐05 7% 33% 6% 26% 15% 12% 85,371
2005‐06 9% 25% 11% 9% 19% 31% 106,106 2005‐06 9% 40% 8% 0% 14% 29% 25,222
2006‐07 7% 30% 8% 23% 18% 16% 63,161 2006‐07 3% 19% 5% 62% 7% 4% 146,456
2007‐08 3% 29% 4% 27% 19% 18% 83,564 2007‐08 4% 16% 5% 55% 11% 9% 149,859
2008‐09 3% 27% 7% 22% 22% 19% 69,168 2008‐09 2% 18% 5% 53% 15% 6% 142,770
2009‐10 2% 25% 4% 23% 22% 24% 81,038 2009‐10 2% 17% 9% 45% 20% 8% 140,149
Duluth MN/WI Midland PNW ND Other Total Duluth MN/WI Midland PNW ND Other Total
2003‐04 6% 51% 11% 20% 2% 9% 33,341 2003‐04 2% 72% 7% 0% 16% 2% 15,487
2004‐05 11% 23% 17% 35% 6% 8% 35,681 2004‐05 5% 72% 13% 1% 8% 1% 14,515
2005‐06 9% 25% 11% 9% 19% 31% 106,106 2005‐06 9% 40% 8% 0% 14% 29% 25,222
2006‐07 12% 21% 11% 30% 2% 24% 30,616 2006‐07 1% 78% 5% 1% 12% 3% 7,075
2007‐08 14% 18% 22% 33% 2% 12% 42,556 2007‐08 1% 65% 8% 1% 21% 4% 14,765
2008‐09 18% 38% 10% 4% 4% 25% 13,651 2008‐09 0% 56% 12% 0% 31% 0% 7,443
2009‐10 9% 20% 15% 29% 3% 24% 50,062 2009‐10 1% 62% 13% 0% 22% 3% 18,411
Duluth MN/WI Midland PNW ND Other Total
2003‐04 2% 33% 2% 21% 14% 27% 86,994
2004‐05 2% 25% 2% 26% 12% 33% 103,451
2005‐06 9% 25% 11% 9% 19% 31% 106,106
2006‐07 1% 18% 2% 50% 11% 19% 117,304
2007‐08 1% 14% 4% 47% 15% 20% 127,674
2008‐09 0% 19% 2% 46% 21% 12% 141,583
2009‐10 0% 17% 3% 35% 29% 15% 140,181
CRD 3
CRD 5
CRD 7
CRD 9
CRD 4
CRD 6
CRD 8
15

16

HRS Wheat
17
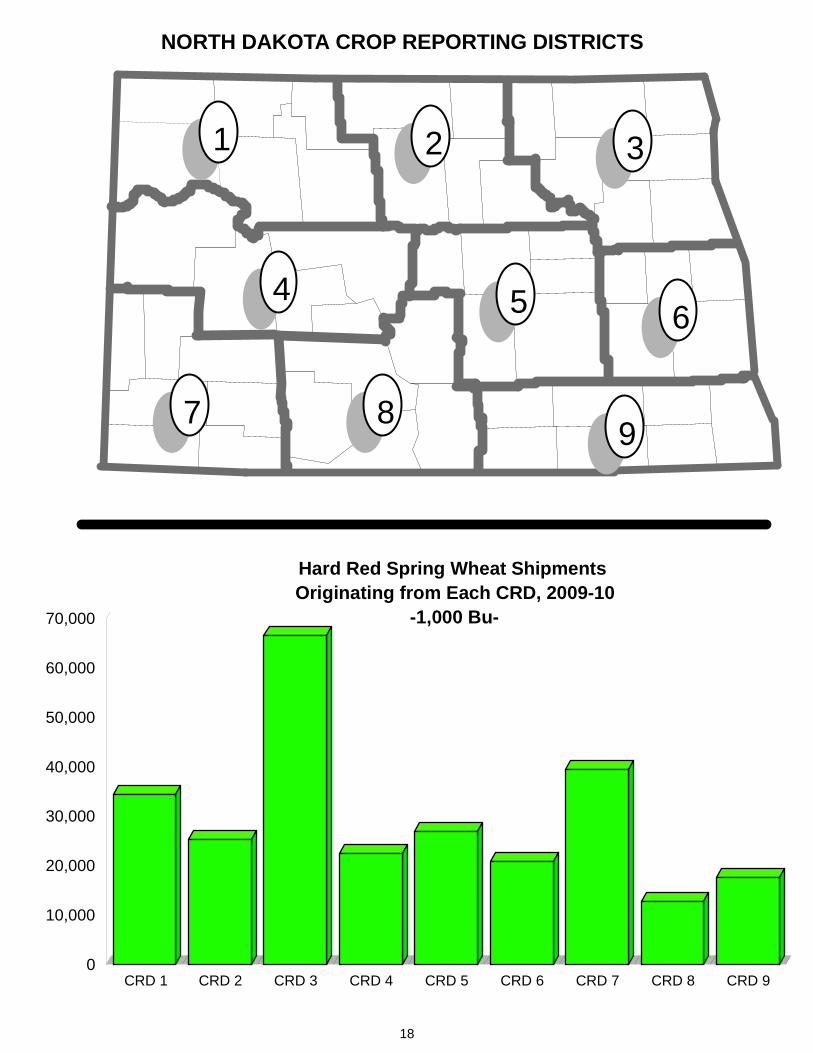
CRD 1 CRD 2 CRD 3 CRD 4 CRD 5 CRD 6 CRD 7 CRD 8 CRD 90
10,000
20,000
30,000
40,000
50,000
60,000
70,000
NORTH DAKOTA CROP REPORTING DISTRICTS
21 3
654
987
Hard Red Spring Wheat Shipments Originating from Each CRD, 2009-10
-1,000 Bu-
18

Crop Reporting District
Dul-Su10%
MN/WI24%
Midland/SW8%
PNW13%
ND15%
Other31%
MN/WI29%
Midland/SW11%
PNW13%
ND10%
Other38% Dul-Sup
7%MN/WI48%
Midland/SW7%
PNW5%
ND7%
Other27%
PNW32%
MN/WI23%
Midland/SW16%
Dul-Sup12%
Other11%
ND6%
Dul-Su8%
MN/WI17%
Midland/SW15%
PNW33%
ND2%
Other25%
Dul-Sup1%
MN/WI84%
1%
ND2%
Other3%
Dul-Sup1%
MN/WI65%
Midland/SW4%
PNW3%
ND2%
Other25%
Dul-Sup6%
MN/WI32%
Midland/SW10%
PNW18%
ND7%
Other27%
PNW36%
MN/WI29%
Other16%
Midland/SW10%
ND6%
Dul-Sup4%
All North Dakota
2009-10Destinations for Hard Red Spring Wheat Shipments
Other49%
MN/WI25%
PNW9%
Midland/SW7%
Dul-Sup7%
ND3%
19

2003-04 2004-05 2005-06 2006-07 2007-08 2008-09 2009-10
0%
10%
20%
30%
40%
50%
DuluthMN/WI
MidlandPNW
ND Other
Destinations for Hard Red Spring Wheat Shipments
Trends for Destinations of Hard Red Spring Wheat Shipments from ND
(1,000 Bushels)
Dul‐Sup
MN/WI Midland/SW PNW
Total
2003‐04
25,000
103,746 24,017 39,511
243,408
10%
43% 10% 16%
2004‐05
31,369
95,259 23,462 47,226
253,110
12%
38% 9% 19%
2005‐06
27,038
77,230 27,482 38,732
232,312
12%
33% 12% 17%
2006‐07
13,960
76,126 24,410 57,905
172,401
6%
33% 11% 25%
2007‐08
20,640
88,719 30,756 56,645
196,760
8%
34% 12% 21%
2008‐09
11,312
77,674 14,448 33,829
192,735
6%
40% 7% 18%
2009‐10
17,269
85,204 25,518 47,571
266,271
6%
32% 10% 18%
20

Destinations for Hard Red Spring Wheat Shipments from ND CRD's(1,000 Bushels)
Duluth MN/WI Midland PNW ND Other Total Duluth MN/WI Midland PNW ND Other Total
2003‐04 1% 12% 2% 76% 6% 3% 17,820 2003‐04 23% 13% 16% 37% 3% 7% 20,998
2004‐05 0% 9% 2% 73% 5% 11% 21,945 2004‐05 20% 17% 15% 27% 3% 17% 23,765
2005‐06 4% 33% 4% 44% 10% 4% 20,892 2005‐06 17% 22% 10% 22% 3% 26% 24,767
2006‐07 0% 13% 7% 69% 7% 2% 24,971 2006‐07 5% 42% 15% 23% 2% 14% 24,889
2007‐08 1% 18% 4% 62% 4% 10% 27,135 2007‐08 10% 34% 13% 21% 3% 19% 28,203
2008‐09 1% 31% 8% 50% 6% 4% 19,164 2008‐09 5% 29% 12% 28% 3% 23% 18,905
2009‐10 4% 29% 10% 36% 6% 16% 34,472 2009‐10 7% 25% 7% 9% 3% 49% 25,272
Duluth MN/WI Midland PNW ND Other Total Duluth MN/WI Midland PNW ND Other Total
2003‐04 10% 46% 5% 4% 15% 20% 70,521 2003‐04 3% 72% 6% 6% 5% 8% 9,017
2004‐05 17% 38% 5% 5% 15% 20% 67,782 2004‐05 4% 68% 8% 2% 8% 9% 11,786
2005‐06 11% 32% 10% 9% 12% 26% 62,748 2005‐06 9% 34% 5% 0% 5% 46% 13,511
2006‐07 7% 36% 7% 10% 15% 26% 66,731 2006‐07 7% 28% 25% 6% 8% 26% 12,321
2007‐08 9% 36% 9% 10% 12% 24% 75,259 2007‐08 5% 28% 19% 7% 6% 35% 18,021
2008‐09 5% 38% 3% 9% 12% 33% 65,227 2008‐09 3% 30% 7% 14% 9% 36% 12,186
2009‐10 10% 24% 8% 13% 15% 31% 66,503 2009‐10 0% 29% 11% 13% 10% 38% 22,381
Duluth MN/WI Midland PNW ND Other Total Duluth MN/WI Midland PNW ND Other Total
2003‐04 8% 50% 7% 10% 4% 21% 24,206 2003‐04 21% 25% 25% 16% 1% 12% 38,292
2004‐05 17% 48% 15% 8% 2% 11% 30,261 2004‐05 15% 34% 11% 21% 2% 17% 28,650
2005‐06 27% 36% 21% 1% 9% 7% 24,392 2005‐06 10% 13% 18% 48% 4% 6% 25,117
2006‐07 11% 43% 14% 7% 4% 20% 24,161 2006‐07 6% 21% 14% 55% 3% 0% 28,960
2007‐08 7% 55% 7% 5% 10% 16% 28,867 2007‐08 15% 16% 11% 37% 6% 15% 26,023
2008‐09 9% 53% 9% 3% 6% 19% 22,552 2008‐09 10% 23% 16% 42% 4% 5% 22,884
2009‐10 7% 48% 7% 5% 7% 27% 26,899 2009‐10 12% 23% 16% 32% 6% 11% 20,945
Duluth MN/WI Midland PNW ND Other Total Duluth MN/WI Midland PNW ND Other Total
2003‐04 5% 48% 12% 25% 1% 10% 24,874 2003‐04 3% 87% 6% 1% 2% 1% 12,047
2004‐05 11% 14% 18% 46% 3% 8% 27,393 2004‐05 6% 79% 12% 1% 1% 1% 12,522
2005‐06 13% 29% 10% 18% 0% 30% 27,312 2005‐06 0% 81% 13% 1% 1% 4% 11,666
2006‐07 7% 13% 12% 39% 0% 29% 22,790 2006‐07 1% 90% 5% 1% 1% 3% 5,737
2007‐08 10% 12% 26% 40% 0% 12% 32,956 2007‐08 1% 84% 8% 1% 5% 2% 10,983
2008‐09 24% 41% 8% 4% 1% 22% 9,734 2008‐09 0% 84% 10% 0% 7% 0% 4,423
2009‐10 8% 17% 15% 33% 2% 25% 39,404 2009‐10 1% 84% 9% 1% 2% 3% 12,809
Duluth MN/WI Midland PNW ND Other Total
2003‐04 5% 61% 5% 0% 6% 23% 25,632
2004‐05 5% 60% 3% 0% 4% 27% 29,007
2005‐06 7% 49% 15% 3% 3% 23% 21,907
2006‐07 6% 33% 11% 25% 7% 18% 18,719
2007‐08 5% 57% 12% 2% 2% 22% 16,018
2008‐09 0% 70% 4% 5% 1% 19% 17,659
2009‐10 1% 64% 4% 3% 2% 25% 17,586
CRD 1 CRD 2
CRD 8
CRD 3 CRD 4
CRD 9
CRD 5 CRD 6
CRD 7
21

22

Durum
23

CRD 1 CRD 2 CRD 3 CRD 4 CRD 5 CRD 6 CRD 7 CRD 8 CRD 90
5,000
10,000
15,000
20,000
25,000
30,000
35,000
NORTH DAKOTA CROP REPORTING DISTRICTS
21 3
654
987
Durum Shipments Originating from Each CRD, 2009-10
-1,000 Bu-
24

Dul-Su2%
MN/WI53%
ND13% Other
32%
Dul-Su4%
MN/WI51%
Midland/SW23%
PNW1%
ND20%
Other1%
Other43%
MN/WI24%
Dul-Sup16% ND
11%
Midland/SW6%
Dul-Sup16%
MN/WI44%
Midland/SW16%
PNW3%
ND2%
Other19%
ND85%
Other15%
Dul-Sup32%
MN/WI29%
Midland/SW16% PNW
3%
ND11%
Other10%
Dul-Sup39%
MN/WI23%
Midland/SW16%
ND11%
Other8%
PNW3%
All North Dakota
Crop Reporting District2009-10
Destinations for Durum Shipments
Dul-Sup18%
MN/WI39%
Midland/SW1%
ND41%
Other2%
MN/WI84%
ND16%
25
2003-04 2004-05 2005-06 2006-07 2007-08 2008-09 2009-10
0%
10%
20%
30%
40%
50%
DuluthMN/WI
MidlandPNW
ND Other
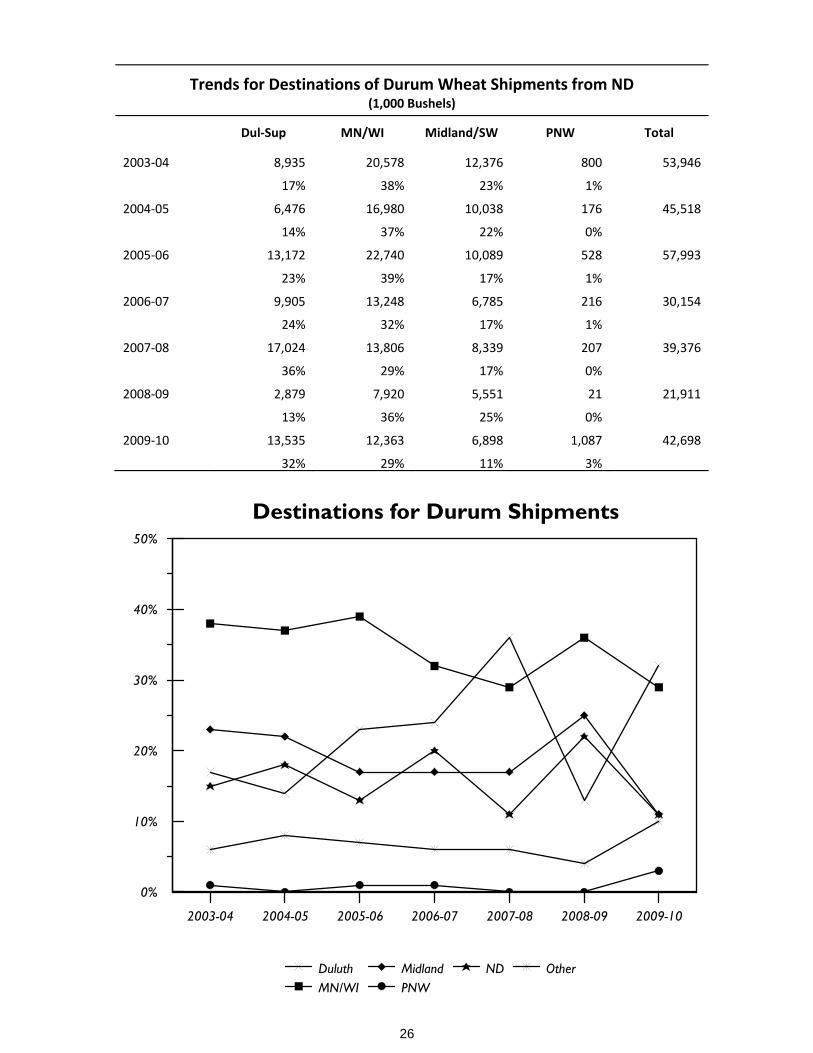
Destinations for Durum Shipments
Trends for Destinations of Durum Wheat Shipments from ND (1,000 Bushels)
Dul‐Sup
MN/WI Midland/SW PNW
Total
2003‐04
8,935
20,578 12,376 800
53,946
17%
38% 23% 1%
2004‐05
6,476
16,980 10,038 176
45,518
14%
37% 22% 0%
2005‐06
13,172
22,740 10,089 528
57,993
23%
39% 17% 1%
2006‐07
9,905
13,248 6,785 216
30,154
24%
32% 17% 1%
2007‐08
17,024
13,806 8,339 207
39,376
36%
29% 17% 0%
2008‐09
2,879
7,920 5,551 21
21,911
13%
36% 25% 0%
2009‐10
13,535
12,363 6,898 1,087
42,698
32%
29% 11% 3%
26

Destinations for Durum Shipments from ND CRD's(1,000 Bushels)
Duluth MN/WI Midland PNW ND Other Total Duluth MN/WI Midland PNW ND Other Total
2003‐04 18% 24% 32% 1% 19% 5% 31,759 2003‐04 37% 45% 0% 0% 17% 0% 2,478
2004‐05 15% 25% 27% 0% 25% 7% 26,849 2004‐05 27% 23% 14% 0% 12% 24% 1,864
2005‐06 24% 33% 21% 1% 13% 7% 38,091 2005‐06 37% 20% 6% 0% 24% 13% 2,120
2006‐07 27% 22% 22% 0% 24% 6% 25,451 2006‐07 25% 48% 8% 1% 19% 0% 1,729
2007‐08 40% 23% 20% 0% 11% 5% 33,798 2007‐08 5% 35% 0% 0% 25% 33% 1,404
2008‐09 16% 34% 26% 0% 21% 3% 16,797 2008‐09 1% 28% 4% 0% 66% 1% 584
2009‐10 39% 23% 16% 3% 11% 8% 30,675 2009‐10 18% 39% 1% 0% 41% 2% 1,116
Duluth MN/WI Midland PNW ND Other Total Duluth MN/WI Midland PNW ND Other Total
2003‐04 15% 50% 15% 0% 8% 12% 4,187 2003‐04 7% 63% 16% 0% 10% 4% 5,305
2004‐05 42% 31% 3% 0% 12% 11% 1,818 2004‐05 0% 63% 27% 0% 6% 4% 5,088
2005‐06 42% 13% 1% 0% 27% 18% 1,877 2005‐06 6% 57% 21% 0% 13% 4% 5,776
2006‐07 33% 13% 4% 2% 27% 21% 1,556 2006‐07 0% 53% 14% 2% 27% 3% 4,119
2007‐08 16% 17% 0% 0% 20% 46% 887 2007‐08 2% 42% 24% 0% 32% 0% 3,450
2008‐09 1% 13% 65% 0% 14% 7% 508 2008‐09 0% 41% 26% 0% 33% 0% 1,620
2009‐10 2% 53% 0% 0% 13% 32% 145 2009‐10 4% 51% 23% 1% 20% 1% 3,406
Duluth MN/WI Midland PNW ND Other Total Duluth MN/WI Midland PNW ND Other Total
2003‐04 10% 54% 9% 0% 12% 15% 2,390 2003‐04 21% 18% 0% 0% 62% 0% 272
2004‐05 5% 52% 10% 0% 10% 24% 1,388 2004‐05 18% 79% 0% 0% 3% 0% 453
2005‐06 6% 62% 8% 0% 14% 10% 1,635 2005‐06 20% 80% 0% 0% 0% 0% 144
2006‐07 8% 64% 2% 0% 24% 2% 1,156 2006‐07 8% 41% 0% 0% 51% 0% 31
2007‐08 29% 47% 4% 0% 10% 11% 1,215 2007‐08 2% 71% 0% 0% 2% 25% 138
2008‐09 3% 47% 0% 0% 24% 25% 440 2008‐09 0% 0% 0% 0% 0% 0% 0
2009‐10 16% 24% 6% 0% 11% 43% 683 2009‐10 0% 0% 0% 0% 85% 15% 56
Duluth MN/WI Midland PNW ND Other Total Duluth MN/WI Midland PNW ND Other Total
2003‐04 13% 68% 8% 5% 1% 5% 7,099 2003‐04 0% 92% 3% 0% 5% 0% 185
2004‐05 12% 60% 14% 1% 9% 4% 7,544 2004‐05 0% 64% 1% 0% 35% 0% 199
2005‐06 23% 59% 5% 2% 6% 4% 8,128 2005‐06 0% 98% 0% 0% 0% 2% 132
2006‐07 32% 52% 7% 1% 1% 7% 6,445 2006‐07 0% 96% 0% 0% 4% 0% 68
2007‐08 41% 44% 9% 1% 0% 4% 6,567 2007‐08 0% 100% 0% 0% 0% 0% 85
2008‐09 11% 51% 24% 1% 4% 11% 1,781 2008‐09 0% 70% 0% 0% 30% 0% 56
2009‐10 16% 44% 16% 3% 2% 19% 6,564 2009‐10 0% 84% 0% 0% 16% 0% 53
Duluth MN/WI Midland PNW ND Other Total
2003‐04 2% 68% 2% 0% 11% 16% 271
2004‐05 2% 64% 0% 0% 2% 33% 314
2005‐06 7% 93% 0% 0% 0% 0% 89
2006‐07 0% 94% 0% 0% 5% 1% 293
2007‐08 0% 100% 0% 0% 0% 0% 356
2008‐09 0% 96% 0% 0% 11% 0% 124
2009‐10 0% 0% 0% 0% 0% 0% 0
CRD 1 CRD 2
CRD 7 CRD 8
CRD 9
CRD 3 CRD 4
CRD 5 CRD 6
27

28
Barley
29

CRD 1 CRD 2 CRD 3 CRD 4 CRD 5 CRD 6 CRD 7 CRD 8 CRD 90
2,000
4,000
6,000
8,000
10,000
12,000
14,000
NORTH DAKOTA CROP REPORTING DISTRICTS
21 3
654
987
Barley Shipments Originating from Each CRD, 2009-10
-1,000 Bu-
30

MN/WI51%
ND21%
Other16%
PNW6%Midland/SW
4%Dul-Sup
2%
MN/WI8%
Midland/SW3%
ND4%
Other15%
MN/WI25%
Midland/SW1%
ND65%
Other9%
Other68%
Midland/SW19%
ND6%
PNW4%
MN/WI3%
ND59%
N/WI35%
Dul-Sup6%
MN/WI86%
Midland/SW3%ND7%
Other4%
Dul-Sup1%
MN/WI42%
Midland/SW7%
PNW2%
ND35%
Other13%
Dul-Su3%
MN/WI26%
Midland/SW15%
PNW6%
ND34%
Other17%
All North Dakota
Crop Reporting District2009-10
Destinations for Barley Shipments
MN/WI42%
ND42%
Other12%
Midland/SW2%
PNW1%
MN/WI56%
Midland/SW11%
ND23%
Other10%
31

2003-04 2004-05 2005-06 2006-07 2007-08 2008-09 2009-10
0%
10%
20%
30%
40%
50%
60%
DuluthMN/WI
MidlandPNW
ND Other
Destinations for Barley Shipments
Trends for Destinations of Barley Shipments from ND (1,000 Bushels)
Dul‐Sup
MN/WI Midland/SW PNW
Total
2003‐04
3,773
44,546 4,657 3,029
80,768
5%
55% 6% 4%
2004‐05
1,024
30,250 5,431 3,674
64,569
2%
47% 8% 6%
2005‐06
1,504
25,510 4,051 4,114
54,745
3%
47% 7% 8%
2006‐07
2,940
28,981 4,673 2,215
38,809
6%
56% 9% 4%
2007‐08
3,164
29,421 3,227 6,606
42,418
5%
42% 5% 10%
2008‐09
1,891
22,855 2,974 1,681
57,230
3%
40% 5% 3%
2009‐10
464
21,464 3,549 1,001
50,579
1%
42% 7% 2%
32

Sunflowers
33

CRD 1 CRD 2 CRD 3 CRD 4 CRD 5 CRD 6 CRD 7 CRD 8 CRD 90
500
1,000
1,500
2,000
2,500
NORTH DAKOTA CROP REPORTING DISTRICTS
21 3
654
987
Sunflower Shipments Originating from Each CRD, 2009-10
-1,000 cwt-
34

ND83%
MN/WI14% Other
3%MN/WI34%
ND52%
Other14%
ND54%
MN/WI35%
Other9%
PNW1%Midland/SW
1%
ND82%
Other9%
PNW7%
MN/WI2%
Dul-Sup1%
MN/WI9%
ND90%
ND72%
MN/WI19%
Other8%
Midland/SW1%
Dul-Su2%
MN/WI8%
ND8%
Other12%
All North Dakota
Crop Reporting District2009-10
Destinations for Sunflower Shipments
ND93%
Midland/SW5%
MN/WI2%
ND84%
MN/WI11%
Other5%
ND88%
Other12%
35

2003-04 2004-05 2005-06 2006-07 2007-08 2008-09 2009-10
0%
20%
40%
60%
80%
DuluthMN/WI
MidlandPNW
ND Other
Destinations for Sunflower Shipments
Trends for Destinations of Sunflower Shipments from ND (1,000 cwt)
Dul‐Sup MN/WI Midland/SW PNW
Total
2003‐04
9 2,770 279 100
10,873
0% 25% 3% 1%
2004‐05
3 1,527 114 48
5,452
0% 28% 2% 1%
2005‐06
0 1,281 82 61
6,395
0% 20% 1% 1%
2006‐07
0 1,302 81 37
1,420
0% 17% 1% 1%
2007‐08
0 929 87 54
1,070
0% 13% 1% 1%
2008‐09
1 865 63 62
6,949
0% 12% 1% 1%
2009‐10
21 1,571 58 20
8,208
0% 19% 1% 0%
36

Canola
37

CRD 1 CRD 2 CRD 3 CRD 4 CRD 5 CRD 6 CRD 7 CRD 8 CRD 90
1,000
2,000
3,000
4,000
5,000
6,000
NORTH DAKOTA CROP REPORTING DISTRICTS
21 3
654
987
Canola Shipments Originating from Each CRD, 2009-10
-1,000 cwt-
38

Dul-Su5%
MN/WI13%ND
50%
Other32%
ND98%
PNW1%
Other1%
ND100%
Dul-Sup6%
MN/WI10%
Midland/SW1%
ND65%
Other18%
ND63%
Dul-Sup19%
MN/WI14%
Other3% Midland/SW
1%
All North Dakota
Crop Reporting District2009-10
Destinations for Canola Shipments
ND92%
MN/WI4%
Midland/SW2%
Other2%
ND100%
ND99%
Other1%
ND100%
39

2003-04 2004-05 2005-06 2006-07 2007-08 2008-09 2009-10
0%
20%
40%
60%
80%
DuluthMN/WI
MidlandPNW
ND Other
Destinations for Canola Shipments
Trends for Destinations of Canola Shipments from ND (1,000 cwt)
Dul‐Sup
MN/WI Midland/SW PNW
Total
2003‐04
5
749 0 24
9,038
0%
8% 0% 0%
2004‐05
4
278 136 0
6,753
0%
4% 2% 0%
2005‐06
1
404 95 21
8,033
0%
5% 1% 0%
2006‐07
1
639 5 19
664
0%
8% 0% 0%
2007‐08
0
397 0 44
441
0%
4% 0% 0%
2008‐09
174
962 0 61
8,516
3%
11% 0% 1%
2009‐10
623
1,049 60 4
10,532
6%
10% 1% 0%
40

Soybeans
41

CRD 1 CRD 2 CRD 3 CRD 4 CRD 5 CRD 6 CRD 7 CRD 8 CRD 90
10,000
20,000
30,000
40,000
50,000
NORTH DAKOTA CROP REPORTING DISTRICTS
21 3
654
987
Soybean Shipments Originating from Each CRD, 2009-10
-1,000 Bu-
42

PNW61%
Other26%
MN/WI7%
ND5%
Midland/SW1%
MN/WI25%
ND25%
Other50%
PNW73%
Other14%
MN/WI6%
ND5%
Midland/SW2% MN/WI
9%
Midland/SW3%
PNW83%
ND5%
Midland/SW92%
ND8%
MN/WI12%
Midland/SW4%
PNW70%
ND8%
Other6%
MN/WI9%
Midland/SW3%
PNW73%
ND6%
Other9%
All North Dakota
Crop Reporting District2009-10
Destinations for Soybeans Shipments
PNW88%
ND11%
Other1%
PNW80%
Other13%
MN/WI6%
ND1%
43
2003-04 2004-05 2005-06 2006-07 2007-08 2008-09 2009-10
0%
10%
20%
30%
40%
50%
60%
70%
80%
DuluthMN/WI
MidlandPNW
ND Other
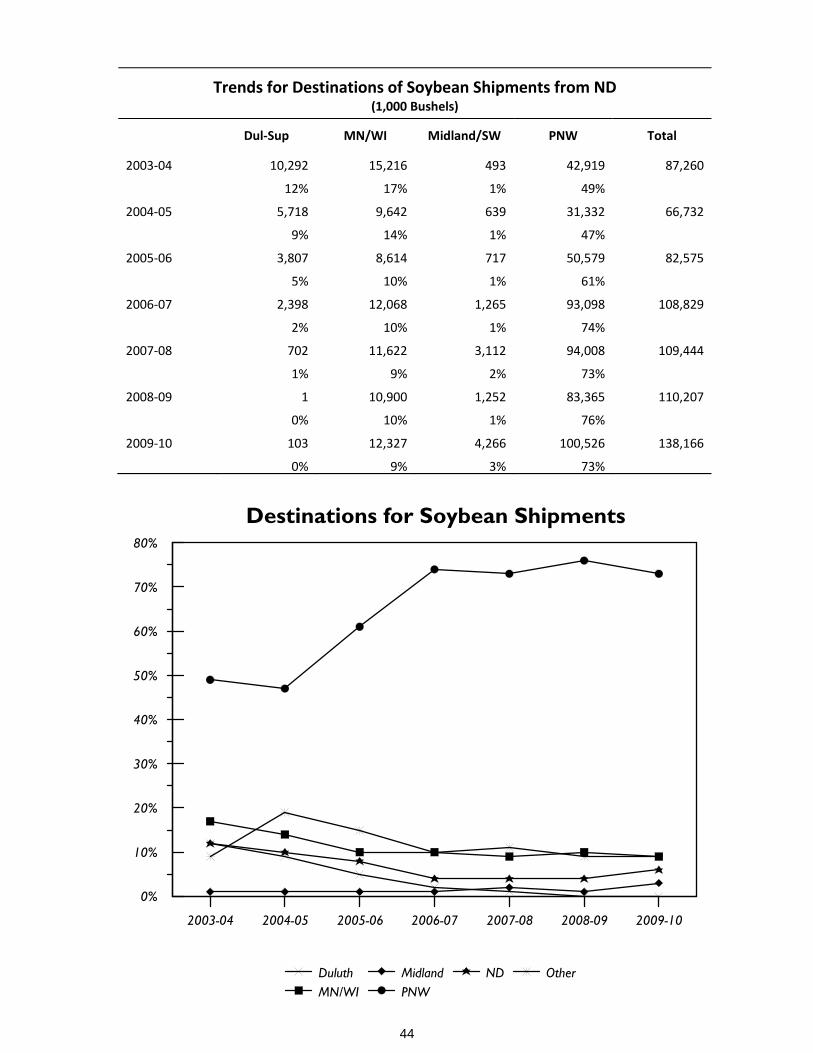
Destinations for Soybean Shipments
Trends for Destinations of Soybean Shipments from ND (1,000 Bushels)
Dul‐Sup
MN/WI Midland/SW PNW
Total
2003‐04
10,292
15,216 493 42,919
87,260
12%
17% 1% 49%
2004‐05
5,718
9,642 639 31,332
66,732
9%
14% 1% 47%
2005‐06
3,807
8,614 717 50,579
82,575
5%
10% 1% 61%
2006‐07
2,398
12,068 1,265 93,098
108,829
2%
10% 1% 74%
2007‐08
702
11,622 3,112 94,008
109,444
1%
9% 2% 73%
2008‐09
1
10,900 1,252 83,365
110,207
0%
10% 1% 76%
2009‐10
103
12,327 4,266 100,526
138,166
0%
9% 3% 73%
44

Corn
45

CRD 1 CRD 2 CRD 3 CRD 4 CRD 5 CRD 6 CRD 7 CRD 8 CRD 90
20,000
40,000
60,000
80,000
100,000
NORTH DAKOTA CROP REPORTING DISTRICTS
21 3
654
987
Corn Shipments Originating from Each CRD, 2009-10
-1,000 Bu-
46

ND43%
Other37%
PNW9%
MN/WI7%
Midland/SW4%
Midland/SW59%
ND34%
MN/WI7%
MN/WI6%
Midland/SW1%
PNW28%
ND46%
Other18%
MN/WI8%
Midland/SW3%
PNW26%
ND42% Other
22%
ND45%
MN/WI43%
Other12%
All North Dakota
Crop Reporting District2009-10
Destinations for Corn Shipments
ND38%
PNW34%
MN/WI13%
Other11%
Midland/SW4%
ND1%
PNW9%
Other64%
ND27%
Midland/SW5%
PNW3%
MN/WI1%
Other48%
ND30%
PNW16%
Dul-Sup3%
MN/WI2%
Midland/SW1%
Midland/SW67%
NW3%
ND10%
47

2003-04 2004-05 2005-06 2006-07 2007-08 2008-09 2009-10
0%
20%
40%
60%
80%
DuluthMN/WI
MidlandPNW
ND Other
Destinations for Corn Shipments
Trends for Destinations of Corn Shipments from ND (1,000 Bushels)
Dul‐Sup
MN/WI Midland/SW PNW
Total
2003‐04
8
7,312 1,399 29,642
73,981
0%
10% 2% 40%
2004‐05
0
4,192 493 20,452
56,821
0%
7% 1% 36%
2005‐06
0
5,358 1,726 47,921
94,619
0%
6% 2% 51%
2006‐07
114
8,910 1,646 63,365
74,035
0%
7% 1% 52%
2007‐08
72
9,257 1,724 78,985
90,038
0%
5% 1% 45%
2008‐09
1
19,852 2,906 80,482
189,900
0%
10% 2% 42%
2009‐10
514
12,652 4,812 43,002
167,327
0%
8% 3% 26%
48

Dry Edible Beans (DEB)
49
CRD 1 CRD 2 CRD 3 CRD 4 CRD 5 CRD 6 CRD 7 CRD 8 CRD 90
2,000
4,000
6,000
NORTH DAKOTA CROP REPORTING DISTRICTS
21 3
654
987
DEB Shipments Originating from Each CRD, 2009-10
-1,000 Bu-
50

Other69%
Midland/SW20%
ND11%
MN/WI5%
Midland/SW18%
Other77%
MN/WI10%
Midland/SW44%
PNW8%
ND5% Other
33%
Other96%
PNW2%
Midland/SW1%
MN/WI1%
All North Dakota
Crop Reporting District2009-10
Destinations for DEB Shipments
Midland/SW59%
PNW22%
Other13%
MN/WI6%
Midland/SW40%
ND31%
MN/WI18%
Other11%
PNW1%
Midland/SW50%ther
49%
MN/WI1%
Midland/SW43%
Other33%
MN/WI15%
ND7%
PNW1%
MN/WI73%
Other14%
Midland/SW8%
ND5%
Dul-Sup100%
51

Trends for Destinations of DEB Shipments from ND (1,000 cwt)
Dul‐Sup MN/WI Midland/SW PNW
Total
2008‐09
0 1,437 3,437 192
9,583
0% 15% 36% 2%
2009‐10
6 1,145 5,023 893
11,462
0% 10% 44% 8%
2008-09 2009-10
0%
20%
40%
60%
80%
DuluthMN/WI
MidlandPNW
ND Other
Destinations for DEB Shipments
52

Dry Edible Peas (DEPeas)
53

CRD 1 CRD 2 CRD 3 CRD 4 CRD 5 CRD 6 CRD 7 CRD 8 CRD 90
1,000
2,000
3,000
4,000
5,000
NORTH DAKOTA CROP REPORTING DISTRICTS
21 3
654
987
DEPeas Shipments Originating from Each CRD, 2009-10
-1,000 Bu-
54

MN/WI68%
Other32%
MN/WI21%
Midland/SW22%
Other57%
MN/WI14%
Midland/SW26%
PNW30%
ND2%
Other28%
PNW53%Other
32%
Midland/SW9%
MN/WI5% ND
1%
All North Dakota
Crop Reporting District2009-10
Destinations for DEPeas Shipments
Othe52%Midland/SW
36%
PNW8%
MN/WI4%
Other33%
MN/WI29%
Midland/SW18%
PNW13%
ND6%
Other92%
ND8%
PNW44%
MN/WI28%
Other27%
Midland/SW1%
Midland/SW80%
MN/WI14%
Other5% ND
1%
Midland/SW77%
ND23%
55
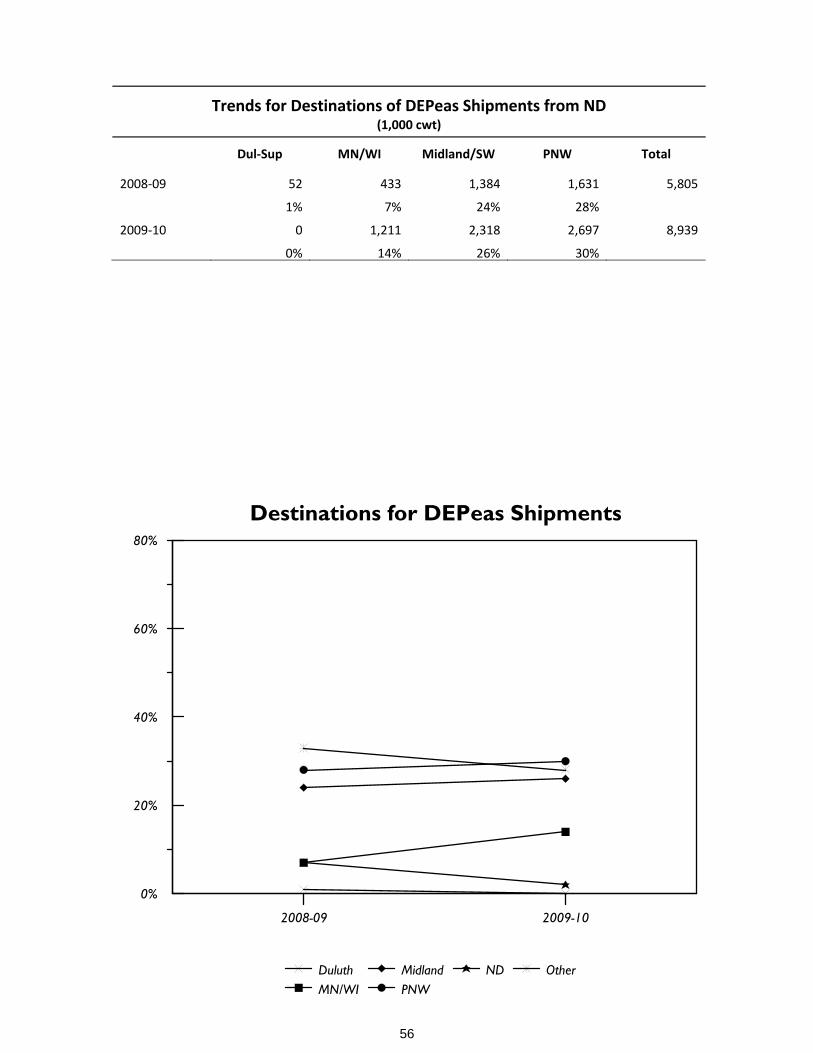
Trends for Destinations of DEPeas Shipments from ND (1,000 cwt)
Dul‐Sup
MN/WI Midland/SW PNW
Total
2008‐09
52
433 1,384 1,631
5,805
1%
7% 24% 28%
2009‐10
0
1,211 2,318 2,697
8,939
0%
14% 26% 30%
2008-09 2009-10
0%
20%
40%
60%
80%
DuluthMN/WI
MidlandPNW
ND Other
Destinations for DEPeas Shipments
56

Mode for Grain and OilseedShipments Originating from
North Dakota Elevators
57

2003-04 2004-05 2005-06 2006-07 2007-08 2008-09 2009-10
0%
10%
20%
30%
40%
50%
60%
Single Car Multi Car Unit Train Truck
Mode for Grain and Oilseed Shipments from ND
Mode for Grain and Oilseed Shipments from ND (1,000 Bushels)
Single Car
Multi Car Unit Train Truck
Total
2003‐04
90,457
114,113 265,330 148,293
618,193
15%
18% 43% 24%
2004‐05
84,122
91,432 254,069 115,381
545,004
15%
17% 47% 21%
2005‐06
96,964
86,196 301,386 114,952
598,988
16%
14% 50% 19%
2006‐07
100,044
68,189 368,069 111,579
647,882
15%
17% 47% 21%
2007‐08
101,011
78,669 444,088 135,365
759,133
13%
10% 58% 18%
2008‐09
99,457
68,628 339,751 143,510
651,345
15%
11% 52% 22%
2009‐10
119,824
81,377 394,260 167,829
763,289
15%
11% 52% 22%
58
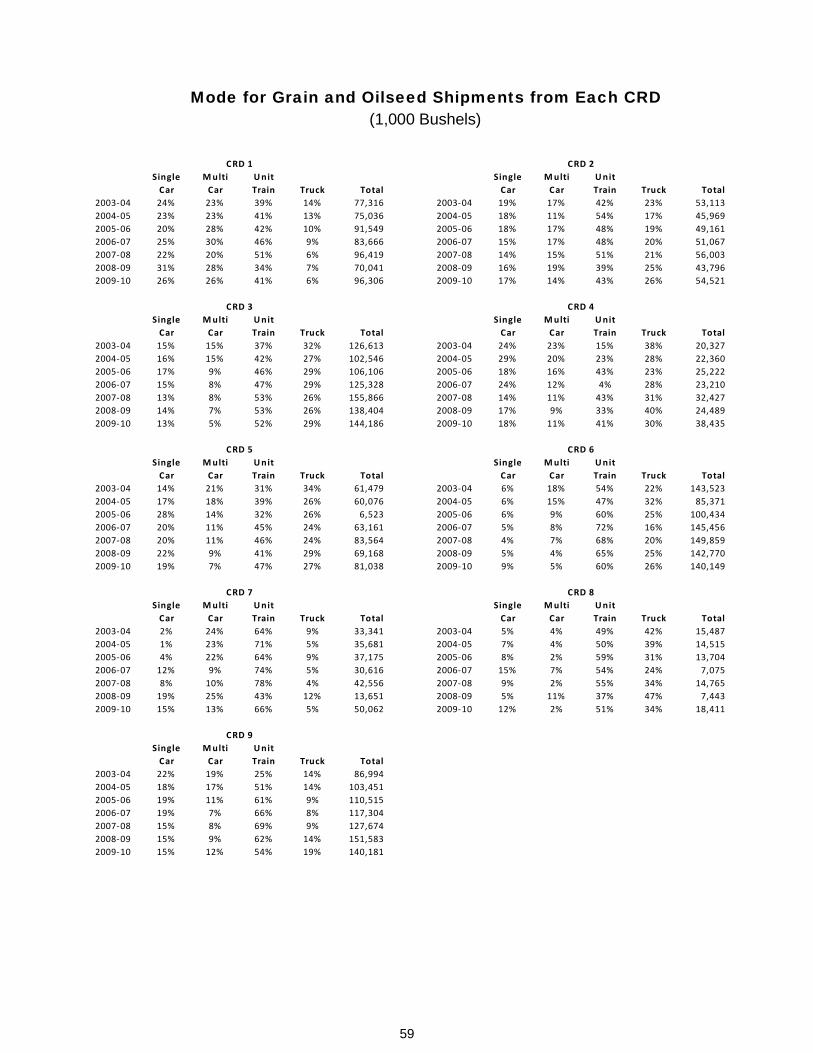
Mode for Grain and Oilseed Shipments from Each CRD(1,000 Bushels)
Single Multi Unit Single Multi Unit
Car Car Train Truck Total Car Car Train Truck Total
2003‐04 24% 23% 39% 14% 77,316 2003‐04 19% 17% 42% 23% 53,113
2004‐05 23% 23% 41% 13% 75,036 2004‐05 18% 11% 54% 17% 45,969
2005‐06 20% 28% 42% 10% 91,549 2005‐06 18% 17% 48% 19% 49,161
2006‐07 25% 30% 46% 9% 83,666 2006‐07 15% 17% 48% 20% 51,067
2007‐08 22% 20% 51% 6% 96,419 2007‐08 14% 15% 51% 21% 56,003
2008‐09 31% 28% 34% 7% 70,041 2008‐09 16% 19% 39% 25% 43,796
2009‐10 26% 26% 41% 6% 96,306 2009‐10 17% 14% 43% 26% 54,521
Single Multi Unit Single Multi Unit
Car Car Train Truck Total Car Car Train Truck Total
2003‐04 15% 15% 37% 32% 126,613 2003‐04 24% 23% 15% 38% 20,327
2004‐05 16% 15% 42% 27% 102,546 2004‐05 29% 20% 23% 28% 22,360
2005‐06 17% 9% 46% 29% 106,106 2005‐06 18% 16% 43% 23% 25,222
2006‐07 15% 8% 47% 29% 125,328 2006‐07 24% 12% 4% 28% 23,210
2007‐08 13% 8% 53% 26% 155,866 2007‐08 14% 11% 43% 31% 32,427
2008‐09 14% 7% 53% 26% 138,404 2008‐09 17% 9% 33% 40% 24,489
2009‐10 13% 5% 52% 29% 144,186 2009‐10 18% 11% 41% 30% 38,435
Single Multi Unit Single Multi Unit
Car Car Train Truck Total Car Car Train Truck Total
2003‐04 14% 21% 31% 34% 61,479 2003‐04 6% 18% 54% 22% 143,523
2004‐05 17% 18% 39% 26% 60,076 2004‐05 6% 15% 47% 32% 85,371
2005‐06 28% 14% 32% 26% 6,523 2005‐06 6% 9% 60% 25% 100,434
2006‐07 20% 11% 45% 24% 63,161 2006‐07 5% 8% 72% 16% 145,456
2007‐08 20% 11% 46% 24% 83,564 2007‐08 4% 7% 68% 20% 149,859
2008‐09 22% 9% 41% 29% 69,168 2008‐09 5% 4% 65% 25% 142,770
2009‐10 19% 7% 47% 27% 81,038 2009‐10 9% 5% 60% 26% 140,149
Single Multi Unit Single Multi Unit
Car Car Train Truck Total Car Car Train Truck Total
2003‐04 2% 24% 64% 9% 33,341 2003‐04 5% 4% 49% 42% 15,487
2004‐05 1% 23% 71% 5% 35,681 2004‐05 7% 4% 50% 39% 14,515
2005‐06 4% 22% 64% 9% 37,175 2005‐06 8% 2% 59% 31% 13,704
2006‐07 12% 9% 74% 5% 30,616 2006‐07 15% 7% 54% 24% 7,075
2007‐08 8% 10% 78% 4% 42,556 2007‐08 9% 2% 55% 34% 14,765
2008‐09 19% 25% 43% 12% 13,651 2008‐09 5% 11% 37% 47% 7,443
2009‐10 15% 13% 66% 5% 50,062 2009‐10 12% 2% 51% 34% 18,411
Single Multi Unit
Car Car Train Truck Total
2003‐04 22% 19% 25% 14% 86,994
2004‐05 18% 17% 51% 14% 103,451
2005‐06 19% 11% 61% 9% 110,515
2006‐07 19% 7% 66% 8% 117,304
2007‐08 15% 8% 69% 9% 127,674
2008‐09 15% 9% 62% 14% 151,583
2009‐10 15% 12% 54% 19% 140,181
CRD 1 CRD 2
CRD 7 CRD 8
CRD 9
CRD 3 CRD 4
CRD 5 CRD 6
59

2003-04 2004-05 2005-06 2006-07 2007-08 2008-09 2009-10
0%
10%
20%
30%
40%
50%
60%
70%
80%
Single Car Multi Car Unit Train Truck
Mode for Hard Red Spring Wheat Shipments from ND
Mode for Hard Red Spring Wheat Shipments from ND (1,000 Bushels)
Single Car
Multi Car Unit Train Truck
Total
2003‐04 20,966 50,019 136,461 35,962 243,408
9% 21% 56% 15%
2004‐05 27,974 45,513 151,461 28,161 253,110
11% 18% 60% 11%
2005‐06 29,884 35,570 143,289 23,568 232,312
13% 15% 62% 10%
2006‐07 27,546 26,582 155,781 19,372 229,280
12% 12% 68% 8%
2007‐08 25,892 29,743 188,294 19,535 263,464
10% 11% 71% 7%
2008‐09 27,200 26,965 124,137 14,433 192,735
14% 14% 64% 7%
2009‐10 35,211 27,456 184,039 19,564 266,271
13% 10% 69% 7%
60
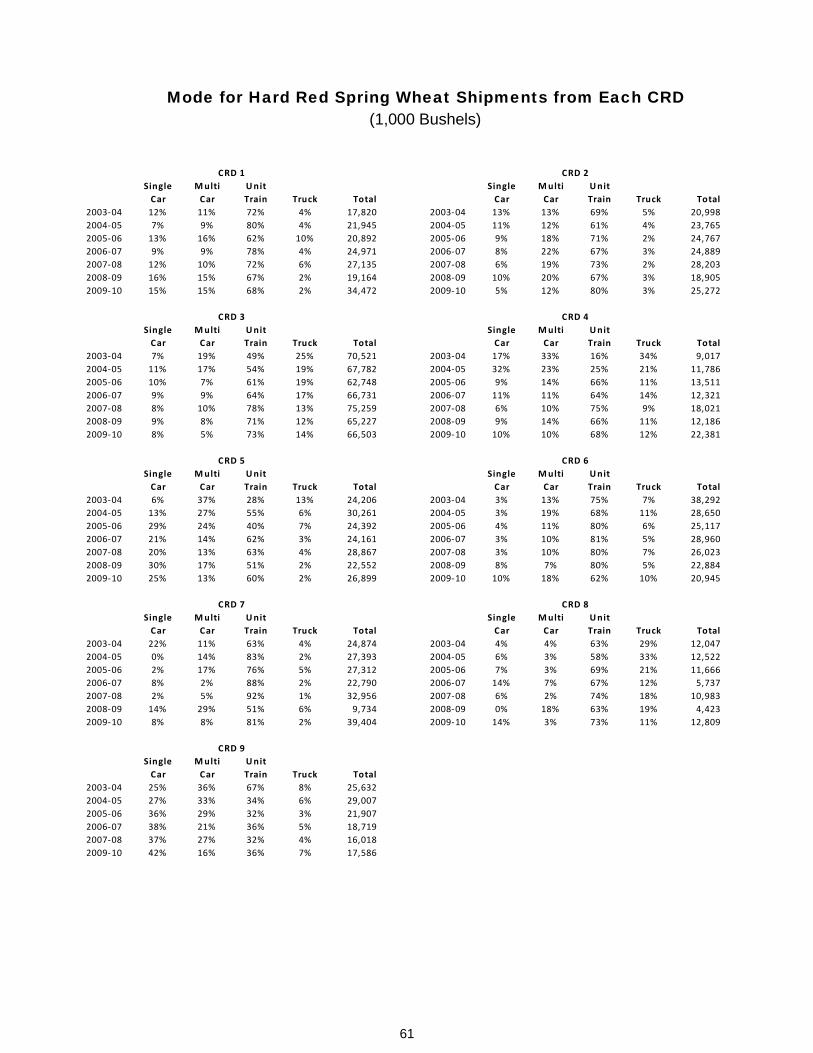
Mode for Hard Red Spring Wheat Shipments from Each CRD(1,000 Bushels)
Single Multi Unit Single Multi Unit
Car Car Train Truck Total Car Car Train Truck Total
2003‐04 12% 11% 72% 4% 17,820 2003‐04 13% 13% 69% 5% 20,998
2004‐05 7% 9% 80% 4% 21,945 2004‐05 11% 12% 61% 4% 23,765
2005‐06 13% 16% 62% 10% 20,892 2005‐06 9% 18% 71% 2% 24,767
2006‐07 9% 9% 78% 4% 24,971 2006‐07 8% 22% 67% 3% 24,889
2007‐08 12% 10% 72% 6% 27,135 2007‐08 6% 19% 73% 2% 28,203
2008‐09 16% 15% 67% 2% 19,164 2008‐09 10% 20% 67% 3% 18,905
2009‐10 15% 15% 68% 2% 34,472 2009‐10 5% 12% 80% 3% 25,272
Single Multi Unit Single Multi Unit
Car Car Train Truck Total Car Car Train Truck Total
2003‐04 7% 19% 49% 25% 70,521 2003‐04 17% 33% 16% 34% 9,017
2004‐05 11% 17% 54% 19% 67,782 2004‐05 32% 23% 25% 21% 11,786
2005‐06 10% 7% 61% 19% 62,748 2005‐06 9% 14% 66% 11% 13,511
2006‐07 9% 9% 64% 17% 66,731 2006‐07 11% 11% 64% 14% 12,321
2007‐08 8% 10% 78% 13% 75,259 2007‐08 6% 10% 75% 9% 18,021
2008‐09 9% 8% 71% 12% 65,227 2008‐09 9% 14% 66% 11% 12,186
2009‐10 8% 5% 73% 14% 66,503 2009‐10 10% 10% 68% 12% 22,381
Single Multi Unit Single Multi Unit
Car Car Train Truck Total Car Car Train Truck Total
2003‐04 6% 37% 28% 13% 24,206 2003‐04 3% 13% 75% 7% 38,292
2004‐05 13% 27% 55% 6% 30,261 2004‐05 3% 19% 68% 11% 28,650
2005‐06 29% 24% 40% 7% 24,392 2005‐06 4% 11% 80% 6% 25,117
2006‐07 21% 14% 62% 3% 24,161 2006‐07 3% 10% 81% 5% 28,960
2007‐08 20% 13% 63% 4% 28,867 2007‐08 3% 10% 80% 7% 26,023
2008‐09 30% 17% 51% 2% 22,552 2008‐09 8% 7% 80% 5% 22,884
2009‐10 25% 13% 60% 2% 26,899 2009‐10 10% 18% 62% 10% 20,945
Single Multi Unit Single Multi Unit
Car Car Train Truck Total Car Car Train Truck Total
2003‐04 22% 11% 63% 4% 24,874 2003‐04 4% 4% 63% 29% 12,047
2004‐05 0% 14% 83% 2% 27,393 2004‐05 6% 3% 58% 33% 12,522
2005‐06 2% 17% 76% 5% 27,312 2005‐06 7% 3% 69% 21% 11,666
2006‐07 8% 2% 88% 2% 22,790 2006‐07 14% 7% 67% 12% 5,737
2007‐08 2% 5% 92% 1% 32,956 2007‐08 6% 2% 74% 18% 10,983
2008‐09 14% 29% 51% 6% 9,734 2008‐09 0% 18% 63% 19% 4,423
2009‐10 8% 8% 81% 2% 39,404 2009‐10 14% 3% 73% 11% 12,809
Single Multi Unit
Car Car Train Truck Total
2003‐04 25% 36% 67% 8% 25,632
2004‐05 27% 33% 34% 6% 29,007
2005‐06 36% 29% 32% 3% 21,907
2006‐07 38% 21% 36% 5% 18,719
2007‐08 37% 27% 32% 4% 16,018
2009‐10 42% 16% 36% 7% 17,586
CRD 1 CRD 2
CRD 7 CRD 8
CRD 9
CRD 3 CRD 4
CRD 5 CRD 6
61

2003-04 2004-05 2005-06 2006-07 2007-08 2008-09 2009-10
0%
10%
20%
30%
40%
50%
60%
Single Car Multi Car Unit Train Truck
Mode for Durum Shipments from ND
Mode for Durum Shipments from ND
(1,000 Bushels)
Single Car Multi Car Unit Train Truck
Total
2003‐04 9,498 15,023 20,426 8,999 53,946
18% 28% 38% 17%
2004‐05 7,195 16,750 14,552 7,020 45,518
16% 37% 32% 15%
2005‐06 7,281 19,973 22,882 7,857 57,993
13% 34% 39% 14%
2006‐07 8,604 11,087 14,748 6,412 40,850
21% 27% 36% 16%
2007‐08 7,996 11,596 24,795 3,513 47,900
14% 24% 52% 7%
2008‐09 6,574 6,607 5,579 3,151 21,911
30% 30% 25% 14%
2009‐10 9,943 12,462 17,076 3,218 42,698
23% 29% 40% 8%
62

Mode for Durum Shipments from Each CRD(1,000 Bushels)
Single Multi Unit Single Multi Unit
Car Car Train Truck Total Car Car Train Truck Total
2003‐04 13% 27% 47% 11% 31,759 2003‐04 26% 28% 8% 56% 2,478
2004‐05 15% 36% 37% 12% 26,849 2004‐05 42% 34% 1% 23% 1,864
2005‐06 9% 36% 47% 8% 38,091 2005‐06 39% 25% 3% 32% 2,120
2006‐07 18% 27% 45% 10% 25,451 2006‐07 36% 42% 1% 20% 1,729
2007‐08 13% 22% 62% 3% 33,798 2007‐08 23% 32% 18% 27% 1,404
2008‐09 29% 32% 33% 7% 16,797 2008‐09 25% 8% 0% 67% 584
2009‐10 20% 26% 50% 3% 30,675 2009‐10 13% 44% 0% 43% 1,116
Single Multi Unit Single Multi Unit
Car Car Train Truck Total Car Car Train Truck Total
2003‐04 43% 20% 37% 33% 4,187 2003‐04 19% 26% 30% 25% 5,305
2004‐05 31% 25% 0% 43% 1,818 2004‐05 11% 20% 43% 27% 5,088
2005‐06 30% 21% 15% 34% 1,877 2005‐06 14% 29% 29% 28% 5,776
2006‐07 65% 6% 0% 29% 1,556 2006‐07 16% 24% 16% 44% 4,119
2007‐08 55% 13% 11% 21% 887 2007‐08 27% 24% 15% 34% 3,450
2008‐09 68% 18% 0% 14% 508 2008‐09 15% 27% 7% 51% 1,620
2009‐10 77% 1% 3% 20% 145 2009‐10 26% 30% 11% 33% 3,406
Single Multi Unit Single Multi Unit
Car Car Train Truck Total Car Car Train Truck Total
2003‐04 41% 22% 0% 37% 2,390 2003‐04 41% 0% 0% 59% 272
2004‐05 63% 0% 0% 37% 1,388 2004‐05 27% 66% 0% 7% 453
2005‐06 64% 0% 0% 36% 1,635 2005‐06 0% 67% 0% 33% 144
2006‐07 34% 0% 0% 66% 1,156 2006‐07 0% 0% 0% 100% 31
2007‐08 55% 18% 0% 26% 1,215 2007‐08 0% 70% 0% 30% 138
2008‐09 48% 0% 0% 52% 440 2008‐09 0% 0% 0% 0% 0
2009‐10 57% 0% 25% 18% 683 2009‐10 14% 0% 0% 86% 56
Single Multi Unit Single Multi Unit
Car Car Train Truck Total Car Car Train Truck Total
2003‐04 1% 42% 49% 1% 7,099 2003‐04 0% 0% 0% 100% 185
2004‐05 1% 61% 31% 1% 7,544 2004‐05 10% 0% 0% 90% 199
2005‐06 6% 45% 37% 12% 8,128 2005‐06 0% 0% 0% 100% 132
2006‐07 18% 34% 41% 6% 6,445 2006‐07 0% 0% 0% 100% 68
2007‐08 16% 34% 46% 4% 6,567 2007‐08 12% 0% 0% 88% 85
2008‐09 35% 44% 16% 6% 6,564 2008‐09 49% 0% 0% 51% 53
Single Multi Unit
Car Car Train Truck Total
2003‐04 60% 0% 0% 40% 271
2004‐05 61% 30% 0% 10% 314
2005‐06 99% 0% 0% 1% 89
2006‐07 52% 42% 0% 6% 293
2007‐08 7% 93% 0% 0% 356
2008‐09 0% 77% 0% 23% 124
2009‐10 0% 0% 0% 0% 0
CRD 9
CRD 3 CRD 4
CRD 5 CRD 6
CRD 1 CRD 2
CRD 7 CRD 8
63

2003-04 2004-05 2005-06 2006-07 2007-08 2008-09 2009-10
0%
10%
20%
30%
40%
50%
Single Car Multi Car Unit Train Truck
Mode for Barley Shipments from ND
Mode for Barley Shipments from ND
(1,000 Bushels)
Single Car
Multi Car Unit Train Truck
Total
2003‐04 21,165 26,017 8,572 25,014 80,768
26% 32% 11% 31%
2004‐05 18,967 14,256 7,959 23,387 64,569
29% 22% 12% 36%
2005‐06 18,704 13,187 5,249 17,604 54,745
34% 24% 10% 32%
2006‐07 18,100 10,913 7,105 15,458 51,577
35% 21% 10% 32%
2007‐08 21,008 15,360 12,018 21,016 69,402
30% 22% 17% 30%
2008‐09 16,772 9,748 10,700 20,010 57,230
29% 17% 19% 35%
2009‐10 20,385 10,604 1,105 18,484 50,579
40% 21% 2% 37%
64

2003-04 2004-05 2005-06 2006-07 2007-08 2008-09 2009-10
0%
20%
40%
60%
80%
100%
Single Car Multi Car Unit Train Truck
Mode for Sunflower Shipments from ND
Mode for Sunflower Shipments from ND
(1,000 cwt)
Single Car Multi Car Unit Train Truck
Total
2003‐04 1,275 798 165 8,635 10,873
12% 7% 2% 79%
2004‐05 341 0 0 5,111 5,452
6% 0% 0% 94%
2005‐06 481 261 2 5,651 6,395
7% 4% 0% 88%
2006‐07 880 205 0 6,356 7,440
12% 3% 0% 85%
2007‐08 792 161 0 6,234 7,187
11% 2% 0% 87%
2008‐09 686 551 2 5,711 6,949
10% 8% 0% 82%
2009‐10 326 28 13 7,841 8,208
4% 0% 0% 96%
65
2003-04 2004-05 2005-06 2006-07 2007-08 2008-09 2009-10
0%
20%
40%
60%
80%
100%
Single Car Multi Car Unit Train Truck
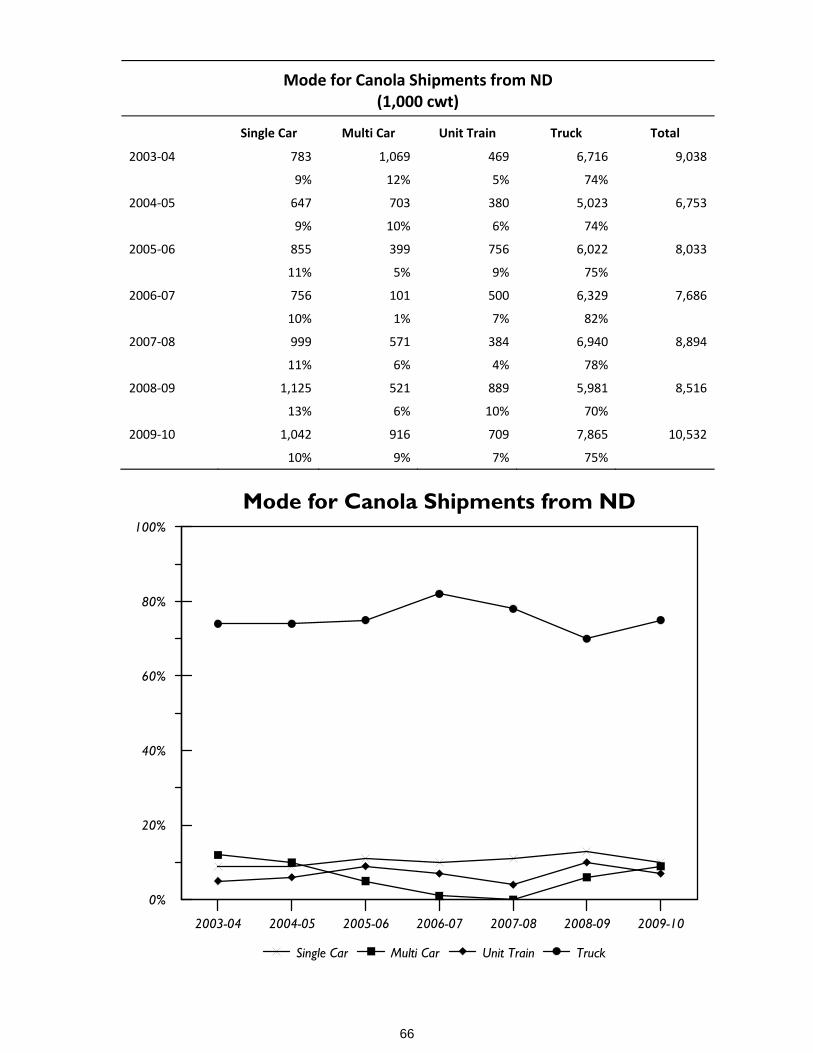
Mode for Canola Shipments from ND
Mode for Canola Shipments from ND
(1,000 cwt)
Single Car
Multi Car Unit Train Truck
Total
2003‐04 783 1,069 469 6,716 9,038
9% 12% 5% 74%
2004‐05 647 703 380 5,023 6,753
9% 10% 6% 74%
2005‐06 855 399 756 6,022 8,033
11% 5% 9% 75%
2006‐07 756 101 500 6,329 7,686
10% 1% 7% 82%
2007‐08 999 571 384 6,940 8,894
11% 6% 4% 78%
2008‐09 1,125 521 889 5,981 8,516
13% 6% 10% 70%
2009‐10 1,042 916 709 7,865 10,532
10% 9% 7% 75%
66

2003-04 2004-05 2005-06 2006-07 2007-08 2008-09 2009-10
0%
20%
40%
60%
80%
100%
Single Car Multi Car Unit Train Truck
Mode for Soybean Shipments from ND
Mode for Soybean Shipments from ND
(1,000 Bushels)
Single Car Multi Car Unit Train Truck
Total
2003‐04 6,169 8,907 59,646 12,539 87,260
7% 10% 68% 14%
2004‐05 4,234 7,735 44,726 10,037 66,732
6% 12% 67% 15%
2005‐06 5,390 5,893 63,033 8,260 82,575
7% 7% 76% 10%
2006‐07 3,981 6,809 107,447 8,001 126,238
3% 5% 85% 6%
2007‐08 4,998 7,019 109,875 6,945 128,837
4% 5% 85% 5%
2008‐09 4,844 5,668 91,821 7,873 110,207
4% 5% 83% 7%
2009‐10 5,725 6,504 115,266 10,671 138,166
4% 5% 83% 8%
67

2003-04 2004-05 2005-06 2006-07 2007-08 2008-09 2009-10
0%
10%
20%
30%
40%
50%
60%
70%
Single Car Multi Car Unit Train Truck
Mode for Corn Shipments from ND
Mode for Corn Shipments from ND
(1,000 Bushels)
Single Car Multi Car Unit Train Truck
Total
2003‐04 10,145 6,421 38,065 19,350 73,981
14% 9% 51% 26%
2004‐05 6,020 3,159 33,188 14,453 56,821
11% 6% 58% 25%
2005‐06 9,666 3,371 60,486 21,095 94,619
10% 4% 64% 22%
2006‐07 14,256 7,530 76,090 24,284 122,159
12% 6% 62% 22%
2007‐08 15,825 8,457 103,646 46,131 174,059
9% 5% 60% 27%
2008‐09 18,142 9,525 105,683 56,549 189,900
10% 5% 56% 30%
2009‐10 17,547 12,578 74,790 62,412 167,327
10% 8% 45% 37%
68

Mode for DEB Shipments from ND
(1,000 cwt)
Single Car
Multi Car Unit Train Truck
Total
2008‐09 5,896 287 0 3,400 9,583
62% 3% 0% 35%
2009‐10 7,566 613 0 3,284 11,462
66% 5% 0% 29%
2008-09 2009-10
0%
10%
20%
30%
40%
50%
60%
70%
Single Car Multi Car Unit Train Truck
Mode for Corn Shipments from ND
69

Mode for DEPeas Shipments from ND
(1,000 cwt)
Single Car Multi Car Unit Train Truck
Total
2008‐09 4,392 652 29 732 5,805
76% 11% 0% 13%
2009‐10 5,423 2,104 287 1,124 8,939
61% 24% 3% 13%
2008-09 2009-10
0%
10%
20%
30%
40%
50%
60%
70%
80%
Single Car Multi Car Unit Train Truck
Mode for DEPeas Shipments from ND
70
Related Documents