Annual Legislative Report on Market Conditions Calendar year 2020 Texas Department of Insurance PO Box 12030 | Austin, Texas 78711-2030 800-578-4677 | tdi.texas.gov

Welcome message from author
This document is posted to help you gain knowledge. Please leave a comment to let me know what you think about it! Share it to your friends and learn new things together.
Transcript
Annual Legislative Report
on Market Conditions
Calendar year 2020
Texas Department of Insurance PO Box 12030 | Austin, Texas 78711-2030
800-578-4677 | tdi.texas.gov

First Printing 3/31/2021
Publication ID: TDIALR0321
This document is available online at www.tdi.texas.gov/reports
Table of Contents
Introduction …………………………………………………………………………………………………………………………………………………………….1
Terms
Number of policies written ……………………………………………………………………………………………………………….2
Premiums on policies written ……………………………………………………………………………………………………2
Direct premiums written …………………………………………………………………………………………………………………2
Direct losses paid …………………………………………………………………………………………………………………….2
Loss ratio …………………………………………………………………………………………………………………………………………………….2
Earned to incurred loss ratio ……………………………………………………………………………………………………………………2
Number of groups ………………………………………………………………………………………………………………………………..2
Market share ………………………………………………………………………………………………………………………………………..2
Underwriting profit or loss ………………………………………………………………………………………………………………………….2
Rate filing exhibits …………………………………………………………………………………………………………………………………………….2
Lines of Insurance - Definitions
Products and completed operations insurance (product liability) ………………………………………………………..3
General liability ……………………………………………………………………………………………………………………………………..3
Commercial fire and allied lines ……………………………………………………………………………………………………………………3
Residential fire and allied lines …………………………………………………………………………………………………………………3
Commercial multiple peril …………………………………………………………………………………………………………………………3
Private passenger auto ………………………………………………………………………………………………………………………………3
Commercial auto ……………………………………………………………………………………………………………………………………………3
Homeowners multiple peril ………………………………………………………………………………………………………………………3
Workers’ compensation ………………………………………………………………………………………………………………………….3
Boiler and machinery …………………………………………………………………………………………………………………………………4
Inland marine ……………………………………………………………………………………………………………………………………………4
Surety …………………………………………………………………………………………………………………................................................4
Commercial crime ……………………………………………………………………………………………………………………………………..4
Commercial glass ………………………………………………………………………………………………………………………………………..4
Medical professional liability ……………………………………………………………………………………………………………………..4
Miscellaneous professional liability …………………………………………………………………………………………………………..4
Summary of Year
Totals for year ending December 2020 ………………………………………………………………………………………………….5
Number of groups/companies writing policies per year ……………………………………………………………………6
Table of Contents
Lines of Insurance - Data
Product liability …………………………………………………………………………………………………………………………………………..7
General liability ………………………………………………………………………………………………………………………………………….9
Commercial fire and allied lines …………………………………………………………………………………………………………………11
Residential fire and allied lines ………………………………………………………………………………………………………………13
Commercial multiple peril …………………………………………………………………………………………………………………………..15
Private passenger auto (all coverages) …………………………………………………………………………………………………..17
Private passenger auto (voluntary liability) ……………………………………………………………………………………………19
Private passenger auto (assigned risk) ………………………………………………………………………………………………………21
Private passenger auto (physical damage) ………………………………………………………………………………………………..23
Commercial auto (all coverages) …………………………………………………………………………………………………………….25
Commercial auto (voluntary liability) ………………………………………………………………………………………………………27
Commercial auto (assigned risk) ………………………………………………………………………………………………………………..29
Commercial auto (physical damage) …………………………………………………………………………………………………………..31
Homeowners multiple peril …………………………………………………………………………………………………………………………33
Workers’ compensation (all markets) ………………………………………………………………………………………………………35
Workers’ compensation (voluntary market) ……………………………………………………………………………………………37
Workers’ compensation (residual market) ……………………………………………………………………………………………..39
Workers’ compensation (deductible plans) ………………………………………………………………………………………………41
Boiler and machinery ……………………………………………………………………………………………………………………………………43
Inland marine ……………………………………………………………………………………………………………………………………………..45
Surety …………………………………………………………………………………………………………………………………………………………47
Commercial crime ……………………………………………………………………………………………………………………………………….49
Commercial glass ………………………………………………………………………………………………………………………………………..51
Medical professional liability ………………………………………………………………………………………………………………………53
Miscellaneous professional liability …………………………………………………………………………………………………………55
Complaint Data
All lines complaint data …………………………………………………………………………………………………………………………..57
Private passenger auto listed by percent of complaints per policy ……………………………………………………..58
Homeowners listed by percent of complaints per policy ………………………………………………………………………59
Rate Filing Exhibit
Homeowners …………………………………………………………………………………………………………………………………………….60
Private passenger auto ……………………………………………………………………………………………………………………………..78
1
Introduction
Why did we do this report?
Texas Insurance Code Section 2251.008 requires the commissioner to annually report information about insurance company market shares, profits and losses, loss ratios, complaints, and the rates filed during the year to the governor, lieutenant governor, speaker of the House, the Legislature, and the public. This report fulfills that requirement.
• General liability• Commercial fire and allied lines• Residential fire and allied lines• Product liability• Commercial multiple peril• Private passenger auto• Commercial auto• Homeowners multiple peril• Workers’ compensation• Boiler and machinery• Inland marine• Surety• Commercial crime• Commercial glass• Medical professional liability• Miscellaneous professional liability
This report includes information on the following lines of insurance:
The Annual Legislative Report on Market Conditions shows market share based on the most recent year as well as the percent change from the year before.
Because of a change in law, TDI started collecting information about underwriting profits or losses and rate filings in 2007 (Insurance Code Section 2251.008). This report contains the underwriting profit or loss information for all lines of business and the rate filing information for private passenger automobile and homeowners lines of business. Because of the cyclical nature of the underwriting profit or loss information, this report should not be used to determine the reasonableness of rates used by a given company.
Because of another change in law, in 2016 TDI began collecting data and issuing this report each calendar year instead of each calendar quarter (Insurance Code Section 2251.008).
2
Terms
Number of policies written: The number of new and renewal policies issued in Texas during the year. The policies were adjusted to an annual basis. For example, a six-month policy was reported as 0.5 policies.
Premiums on policies written: This report captures the Texas portion of direct premiums written in the designated year without adjustments for cancellations or endorsements, so it may not match the written premiums figures in the statutory Annual Statement.
Direct premiums written: Written premium is the Texas portion of the statutory Annual Statement report of written premiums in the designated year.
Direct losses paid: Direct losses paid represents payments made during the year regardless of when the policy was written or when the accident occurred. Loss adjustment expenses (LAE) are not included.
Loss ratio: Unless otherwise specified, this ratio is developed by dividing direct losses paid during the year by direct premiums written during the year.
Earned to incurred loss ratio: This loss ratio is developed by dividing direct incurred losses by earned premiums. Both figures come from the statutory Annual Statement. LAE are not included.
Number of groups: Companies that are owned or controlled by one entity are considered a group. Unaffiliated companies are those that are not associated with any other insurance company. The number of groups referred to in this report is the number of groups plus the number of unaffiliated companies.
Market share: This figure represents an insurer’s market share (expressed as a percentage) of the industry total for premiums written for the most recent calendar year.
Underwriting profit or loss: The underwriting profit or loss is calculated as the direct premiums earned less direct losses incurred, less loss adjustment expenses incurred, less other underwriting expenses incurred, and less dividends paid to policyholders. The underwriting profit or loss is exactly as the company reported and has not been reconciled to any financial reports.
Rate filing exhibits: The number of rate filings and rate filing summary information is reported by the company and has not been reconciled to actual rate filings that were received by TDI. Rate reductions are indicated by negative numbers in parentheses. Rate filing information is only reported if there was a change in a given "period," so there may be occurrences where a 12, 24, or 36 month period is not displayed.
3
Lines of Insurance
Products and completed operations insurance or product liability: This insurance provides coverage for a manufacturer or contractor for claims after a manufactured product has been sold, or a claim results from an operation which the manufacturer has completed. Products liability also includes coverage for a contractor’s or manufacturer's liability for injuries or property damage suffered as the result of the contractor or manufacturer completing an operation. General liability: This insurance provides coverage for an insured when negligent acts or omissions result in bodily injury or property damage on the premises of a business or when someone is injured in the general operation of a business. Commercial fire and allied lines: This insurance has two coverages - standard fire policy and extended coverage endorsements for businesses. A standard fire policy insures commercial properties against fire and lightning. The extended coverage endorsement covers numerous direct and indirect risks such as windstorm, hail, explosions, smoke damage, vandalism, and water damage. Residential fire and allied lines: This insurance provides insurance coverage for personal, family, or household purposes. Commercial multiple peril: This insurance generally provides coverage for businesses in four areas: property, liability, crime, and boiler and machinery. Private passenger auto: This insurance provides coverage for liability, personal injury protection, uninsured motorist, and physical damage for personal vehicles. Commercial auto: This insurance provides coverage for liability, personal injury protection, uninsured motorist, and physical damage for vehicles owned or used by a business. Homeowners multiple peril: This insurance provides coverage against the insured’s property being destroyed or damaged by various perils. It also provides coverage for the insured's liability exposure. Workers’ compensation: This insurance provides coverage with four types of benefits (medical care, death, disability, and rehabilitation) for employee job-related injuries or diseases without regard to fault. Boiler and machinery: This insurance provides protection against the sudden and accidental breakdown or explosion of boilers, machinery, and electrical equipment. Coverage is provided for damage to the equipment, damage to the property of others, and expediting expenses. Coverage can be extended to cover losses resulting from the interruption of business. Inland marine: This insurance provides coverage for property that may be in transit, held by a bailee at a fixed location, or movable goods that are often at different locations (for example, off-road construction equipment), or scheduled property (for example, homeowners personal property floater) including items such as live animals, property with antique or collector’s value, and so on. These lines also include instrumentalities of transportation and communication, such as bridges, tunnels, piers, wharves, docks, pipelines, power and phone lines, and radio and television towers. This does not include motor vehicles licensed for use on public roads.
4
Lines of Insurance
Surety: This insurance coverage is a three-party agreement where the insurer agrees to pay a second party (the obligee) or make complete an obligation in response to the default, act, or omissions of a third party (the principal or obligor).
Commercial crime: This insurance provides coverage against loss of property caused by burglary, theft, or employee dishonesty. This may include losses inside or outside the premises, losses from counterfeit paper currency, and depositors forgery.
Commercial glass: This insurance provides coverage on commercial plate glass, lettering, frames, and ornamentation.
Medical professional liability: This insurance provides coverage against losses due to claims for damages alleging malpractice by physicians, surgeons, hospitals, or other health care providers in their professions.
Miscellaneous professional liability: This insurance provides coverage for professional practitioners that will defend suits filed against them for malpractice or errors and omissions. It will also pay any damages, subject to policy limits. To comply with applicable statutes, the following have been excluded from miscellaneous professional liability: architects, beauticians/barbers, lawyers, medical laboratory personnel, psychologists, real estate agents, surveyors, and X-ray lab personnel.
5
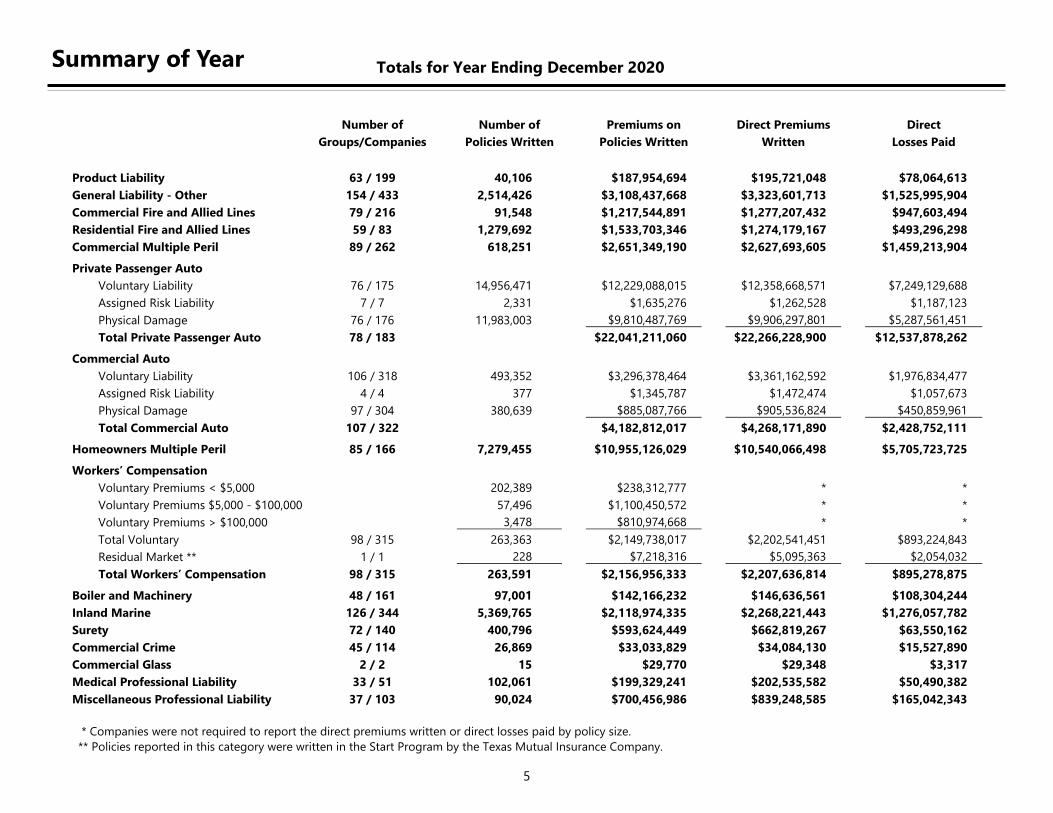
Summary of Year Totals for Year Ending December 2020
* Companies were not required to report the direct premiums written or direct losses paid by policy size.
** Policies reported in this category were written in the Start Program by the Texas Mutual Insurance Company.
Number of Number of Premiums on Direct Premiums Direct
Groups/Companies Policies Written Policies Written Written Losses Paid
Product Liability 63 / 199 40,106 $187,954,694 $195,721,048 $78,064,613
General Liability - Other 154 / 433 2,514,426 $3,108,437,668 $3,323,601,713 $1,525,995,904
Commercial Fire and Allied Lines 79 / 216 91,548 $1,217,544,891 $1,277,207,432 $947,603,494
Residential Fire and Allied Lines 59 / 83 1,279,692 $1,533,703,346 $1,274,179,167 $493,296,298
Commercial Multiple Peril 89 / 262 618,251 $2,651,349,190 $2,627,693,605 $1,459,213,904
Private Passenger Auto
Voluntary Liability 76 / 175 14,956,471 $12,229,088,015 $12,358,668,571 $7,249,129,688
Assigned Risk Liability 7 / 7 2,331 $1,635,276 $1,262,528 $1,187,123
Physical Damage 76 / 176 11,983,003 $9,810,487,769 $9,906,297,801 $5,287,561,451
Total Private Passenger Auto 78 / 183 $22,041,211,060 $22,266,228,900 $12,537,878,262
Commercial Auto
Voluntary Liability 106 / 318 493,352 $3,296,378,464 $3,361,162,592 $1,976,834,477
Assigned Risk Liability 4 / 4 377 $1,345,787 $1,472,474 $1,057,673
Physical Damage 97 / 304 380,639 $885,087,766 $905,536,824 $450,859,961
Total Commercial Auto 107 / 322 $4,182,812,017 $4,268,171,890 $2,428,752,111
Homeowners Multiple Peril 85 / 166 7,279,455 $10,955,126,029 $10,540,066,498 $5,705,723,725
Workers’ Compensation
Voluntary Premiums < $5,000 202,389 $238,312,777 * *
Voluntary Premiums $5,000 - $100,000 57,496 $1,100,450,572 * *
Voluntary Premiums > $100,000 3,478 $810,974,668 * *
Total Voluntary 98 / 315 263,363 $2,149,738,017 $2,202,541,451 $893,224,843
Residual Market ** 1 / 1 228 $7,218,316 $5,095,363 $2,054,032
Total Workers’ Compensation 98 / 315 263,591 $2,156,956,333 $2,207,636,814 $895,278,875
Boiler and Machinery 48 / 161 97,001 $142,166,232 $146,636,561 $108,304,244
Inland Marine 126 / 344 5,369,765 $2,118,974,335 $2,268,221,443 $1,276,057,782
Surety 72 / 140 400,796 $593,624,449 $662,819,267 $63,550,162
Commercial Crime 45 / 114 26,869 $33,033,829 $34,084,130 $15,527,890
Commercial Glass 2 / 2 15 $29,770 $29,348 $3,317
Medical Professional Liability 33 / 51 102,061 $199,329,241 $202,535,582 $50,490,382
Miscellaneous Professional Liability 37 / 103 90,024 $700,456,986 $839,248,585 $165,042,343
6
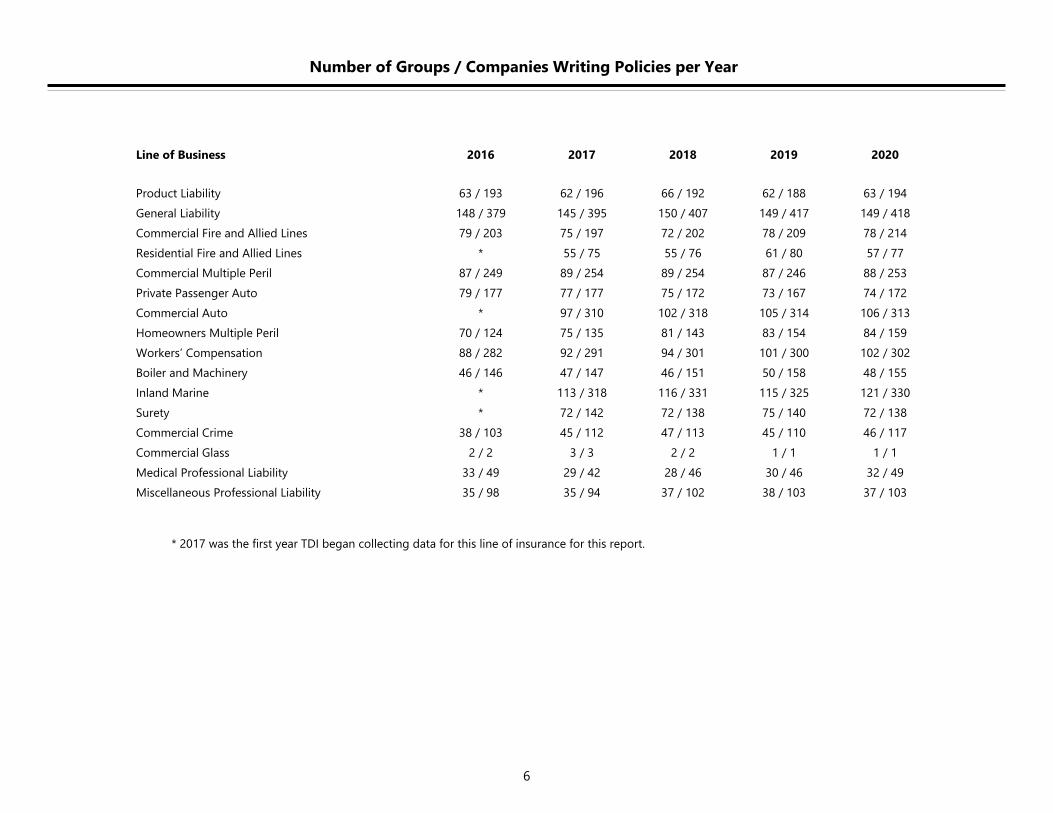
Number of Groups / Companies Writing Policies per Year
* 2017 was the first year TDI began collecting data for this line of insurance for this report.
Line of Business 2016 2017 2018 2019 2020
Product Liability 63 / 193 62 / 196 66 / 192 62 / 188 63 / 194
General Liability 148 / 379 145 / 395 150 / 407 149 / 417 149 / 418
Commercial Fire and Allied Lines 79 / 203 75 / 197 72 / 202 78 / 209 78 / 214
Residential Fire and Allied Lines * 55 / 75 55 / 76 61 / 80 57 / 77
Commercial Multiple Peril 87 / 249 89 / 254 89 / 254 87 / 246 88 / 253
Private Passenger Auto 79 / 177 77 / 177 75 / 172 73 / 167 74 / 172
Commercial Auto * 97 / 310 102 / 318 105 / 314 106 / 313
Homeowners Multiple Peril 70 / 124 75 / 135 81 / 143 83 / 154 84 / 159
Workers’ Compensation 88 / 282 92 / 291 94 / 301 101 / 300 102 / 302
Boiler and Machinery 46 / 146 47 / 147 46 / 151 50 / 158 48 / 155
Inland Marine * 113 / 318 116 / 331 115 / 325 121 / 330
Surety * 72 / 142 72 / 138 75 / 140 72 / 138
Commercial Crime 38 / 103 45 / 112 47 / 113 45 / 110 46 / 117
Commercial Glass 2 / 2 3 / 3 2 / 2 1 / 1 1 / 1
Medical Professional Liability 33 / 49 29 / 42 28 / 46 30 / 46 32 / 49
Miscellaneous Professional Liability 35 / 98 35 / 94 37 / 102 38 / 103 37 / 103
7
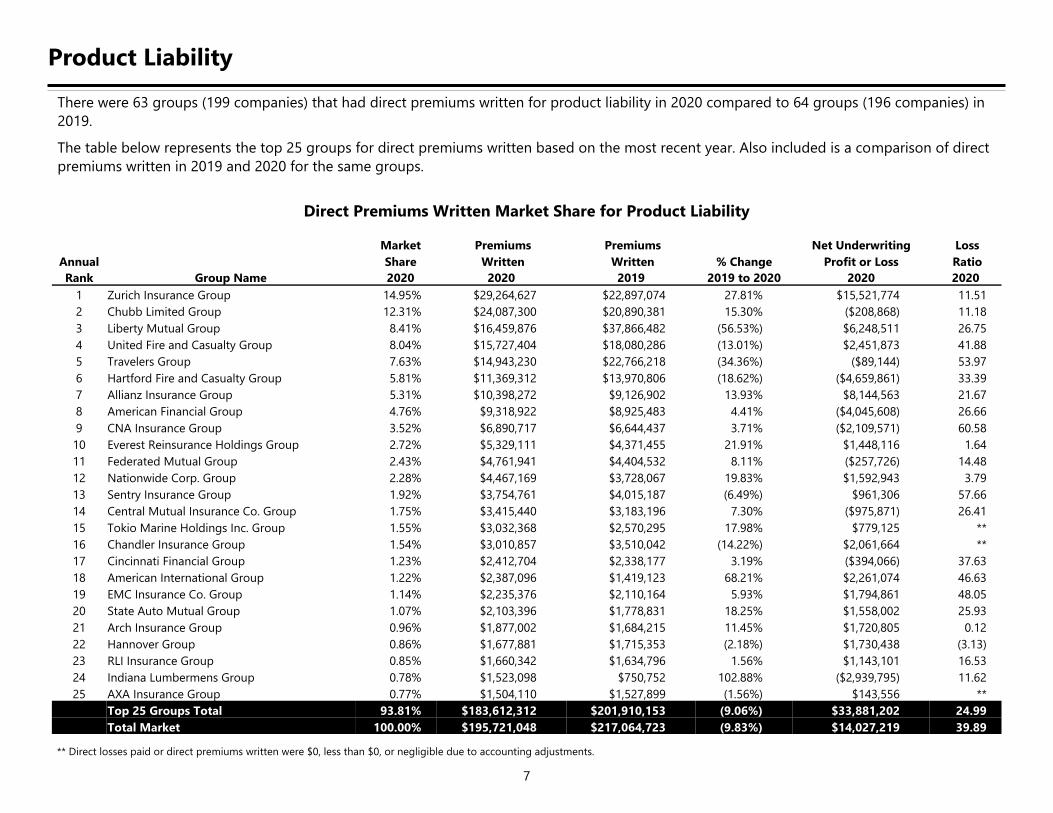
Product Liability
There were 63 groups (199 companies) that had direct premiums written for product liability in 2020 compared to 64 groups (196 companies) in
2019.
The table below represents the top 25 groups for direct premiums written based on the most recent year. Also included is a comparison of direct
premiums written in 2019 and 2020 for the same groups.
Direct Premiums Written Market Share for Product Liability
** Direct losses paid or direct premiums written were $0, less than $0, or negligible due to accounting adjustments.
Market Premiums Premiums Net Underwriting Loss
Annual Share Written Written % Change Profit or Loss Ratio
Rank Group Name 2020 2020 2019 2019 to 2020 2020 2020
1 Zurich Insurance Group 14.95% $29,264,627 $22,897,074 27.81% $15,521,774 11.51
2 Chubb Limited Group 12.31% $24,087,300 $20,890,381 15.30% ($208,868) 11.18
3 Liberty Mutual Group 8.41% $16,459,876 $37,866,482 (56.53%) $6,248,511 26.75
4 United Fire and Casualty Group 8.04% $15,727,404 $18,080,286 (13.01%) $2,451,873 41.88
5 Travelers Group 7.63% $14,943,230 $22,766,218 (34.36%) ($89,144) 53.97
6 Hartford Fire and Casualty Group 5.81% $11,369,312 $13,970,806 (18.62%) ($4,659,861) 33.39
7 Allianz Insurance Group 5.31% $10,398,272 $9,126,902 13.93% $8,144,563 21.67
8 American Financial Group 4.76% $9,318,922 $8,925,483 4.41% ($4,045,608) 26.66
9 CNA Insurance Group 3.52% $6,890,717 $6,644,437 3.71% ($2,109,571) 60.58
10 Everest Reinsurance Holdings Group 2.72% $5,329,111 $4,371,455 21.91% $1,448,116 1.64
11 Federated Mutual Group 2.43% $4,761,941 $4,404,532 8.11% ($257,726) 14.48
12 Nationwide Corp. Group 2.28% $4,467,169 $3,728,067 19.83% $1,592,943 3.79
13 Sentry Insurance Group 1.92% $3,754,761 $4,015,187 (6.49%) $961,306 57.66
14 Central Mutual Insurance Co. Group 1.75% $3,415,440 $3,183,196 7.30% ($975,871) 26.41
15 Tokio Marine Holdings Inc. Group 1.55% $3,032,368 $2,570,295 17.98% $779,125 **
16 Chandler Insurance Group 1.54% $3,010,857 $3,510,042 (14.22%) $2,061,664 **
17 Cincinnati Financial Group 1.23% $2,412,704 $2,338,177 3.19% ($394,066) 37.63
18 American International Group 1.22% $2,387,096 $1,419,123 68.21% $2,261,074 46.63
19 EMC Insurance Co. Group 1.14% $2,235,376 $2,110,164 5.93% $1,794,861 48.05
20 State Auto Mutual Group 1.07% $2,103,396 $1,778,831 18.25% $1,558,002 25.93
21 Arch Insurance Group 0.96% $1,877,002 $1,684,215 11.45% $1,720,805 0.12
22 Hannover Group 0.86% $1,677,881 $1,715,353 (2.18%) $1,730,438 (3.13)
23 RLI Insurance Group 0.85% $1,660,342 $1,634,796 1.56% $1,143,101 16.53
24 Indiana Lumbermens Group 0.78% $1,523,098 $750,752 102.88% ($2,939,795) 11.62
25 AXA Insurance Group 0.77% $1,504,110 $1,527,899 (1.56%) $143,556 **
Top 25 Groups Total 93.81% $183,612,312 $201,910,153 (9.06%) $33,881,202 24.99
Total Market 100.00% $195,721,048 $217,064,723 (9.83%) $14,027,219 39.89
8
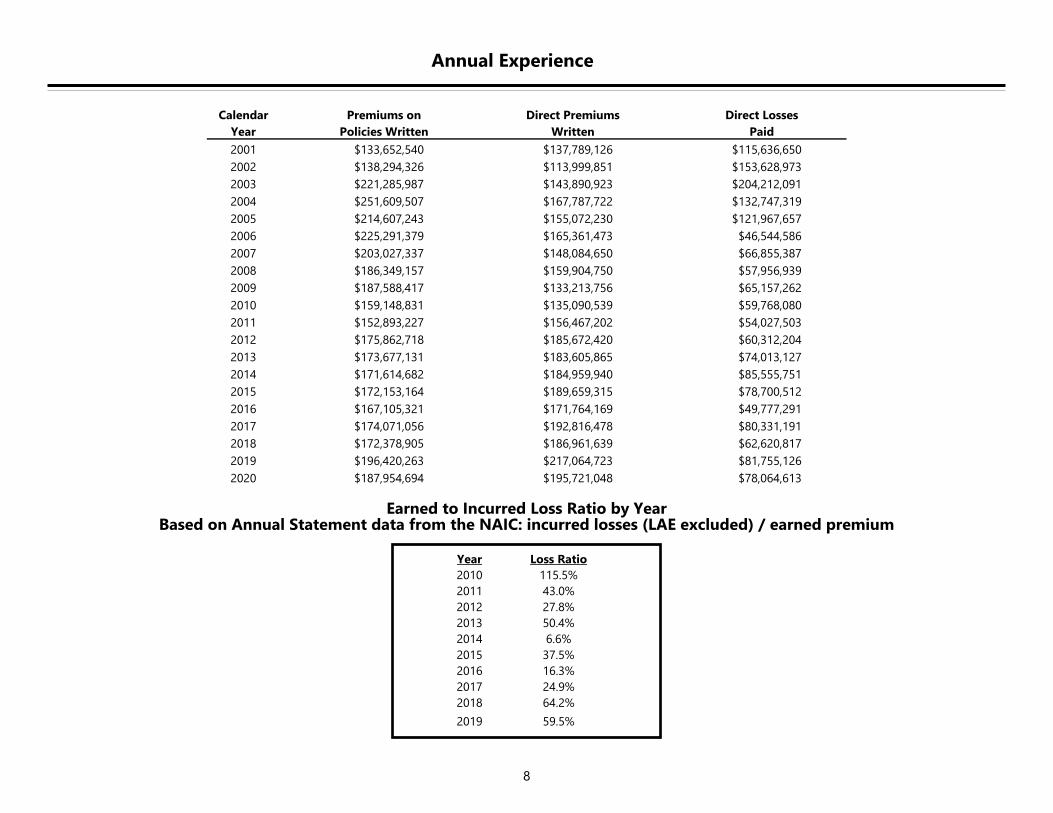
Annual Experience
Earned to Incurred Loss Ratio by Year Based on Annual Statement data from the NAIC: incurred losses (LAE excluded) / earned premium
Year Loss Ratio
2010 115.5%
2011 43.0%
2012 27.8%
2013 50.4%
2014 6.6%
2015 37.5%
2016 16.3%
2017 24.9%
2018 64.2%
2019 59.5%
Calendar Premiums on Direct Premiums Direct Losses
Year Policies Written Written Paid
2001 $133,652,540 $137,789,126 $115,636,650
2002 $138,294,326 $113,999,851 $153,628,973
2003 $221,285,987 $143,890,923 $204,212,091
2004 $251,609,507 $167,787,722 $132,747,319
2005 $214,607,243 $155,072,230 $121,967,657
2006 $225,291,379 $165,361,473 $46,544,586
2007 $203,027,337 $148,084,650 $66,855,387
2008 $186,349,157 $159,904,750 $57,956,939
2009 $187,588,417 $133,213,756 $65,157,262
2010 $159,148,831 $135,090,539 $59,768,080
2011 $152,893,227 $156,467,202 $54,027,503
2012 $175,862,718 $185,672,420 $60,312,204
2013 $173,677,131 $183,605,865 $74,013,127
2014 $171,614,682 $184,959,940 $85,555,751
2015 $172,153,164 $189,659,315 $78,700,512
2016 $167,105,321 $171,764,169 $49,777,291
2017 $174,071,056 $192,816,478 $80,331,191
2018 $172,378,905 $186,961,639 $62,620,817
2019 $196,420,263 $217,064,723 $81,755,126
2020 $187,954,694 $195,721,048 $78,064,613
9
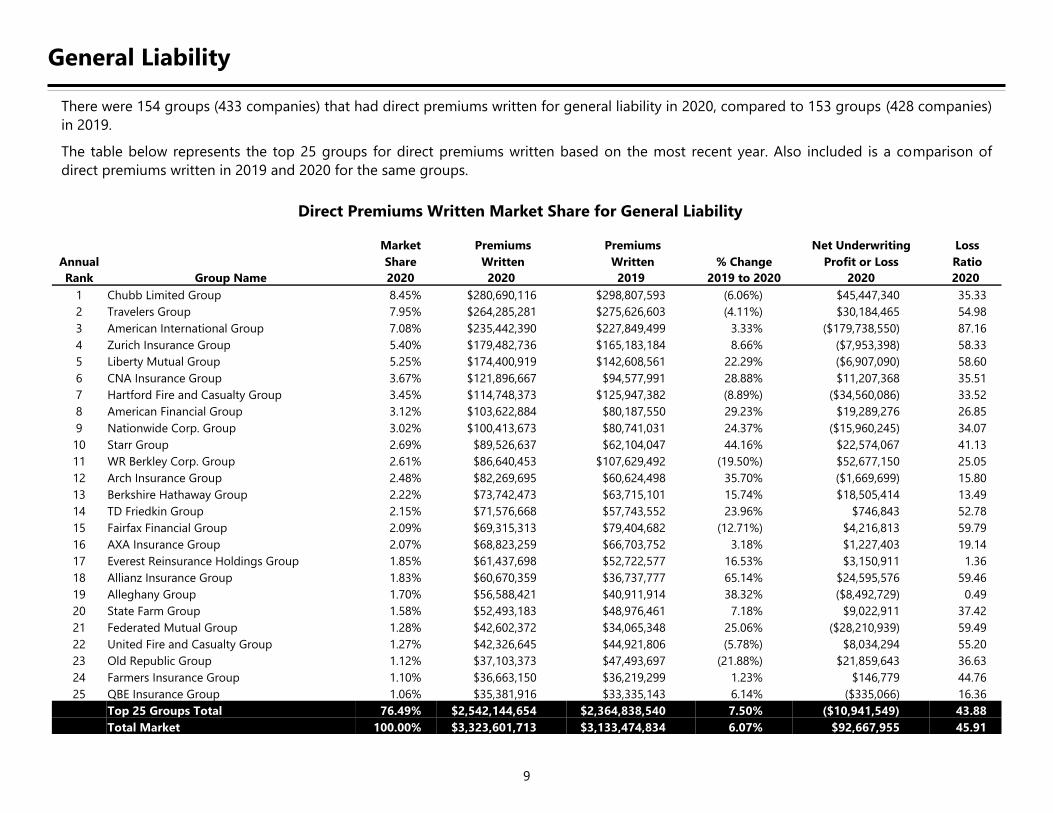
There were 154 groups (433 companies) that had direct premiums written for general liability in 2020, compared to 153 groups (428 companies)
in 2019.
The table below represents the top 25 groups for direct premiums written based on the most recent year. Also included is a comparison of
direct premiums written in 2019 and 2020 for the same groups.
General Liability
Direct Premiums Written Market Share for General Liability
Market Premiums Premiums Net Underwriting Loss
Annual Share Written Written % Change Profit or Loss Ratio
Rank Group Name 2020 2020 2019 2019 to 2020 2020 2020
1 Chubb Limited Group 8.45% $280,690,116 $298,807,593 (6.06%) $45,447,340 35.33
2 Travelers Group 7.95% $264,285,281 $275,626,603 (4.11%) $30,184,465 54.98
3 American International Group 7.08% $235,442,390 $227,849,499 3.33% ($179,738,550) 87.16
4 Zurich Insurance Group 5.40% $179,482,736 $165,183,184 8.66% ($7,953,398) 58.33
5 Liberty Mutual Group 5.25% $174,400,919 $142,608,561 22.29% ($6,907,090) 58.60
6 CNA Insurance Group 3.67% $121,896,667 $94,577,991 28.88% $11,207,368 35.51
7 Hartford Fire and Casualty Group 3.45% $114,748,373 $125,947,382 (8.89%) ($34,560,086) 33.52
8 American Financial Group 3.12% $103,622,884 $80,187,550 29.23% $19,289,276 26.85
9 Nationwide Corp. Group 3.02% $100,413,673 $80,741,031 24.37% ($15,960,245) 34.07
10 Starr Group 2.69% $89,526,637 $62,104,047 44.16% $22,574,067 41.13
11 WR Berkley Corp. Group 2.61% $86,640,453 $107,629,492 (19.50%) $52,677,150 25.05
12 Arch Insurance Group 2.48% $82,269,695 $60,624,498 35.70% ($1,669,699) 15.80
13 Berkshire Hathaway Group 2.22% $73,742,473 $63,715,101 15.74% $18,505,414 13.49
14 TD Friedkin Group 2.15% $71,576,668 $57,743,552 23.96% $746,843 52.78
15 Fairfax Financial Group 2.09% $69,315,313 $79,404,682 (12.71%) $4,216,813 59.79
16 AXA Insurance Group 2.07% $68,823,259 $66,703,752 3.18% $1,227,403 19.14
17 Everest Reinsurance Holdings Group 1.85% $61,437,698 $52,722,577 16.53% $3,150,911 1.36
18 Allianz Insurance Group 1.83% $60,670,359 $36,737,777 65.14% $24,595,576 59.46
19 Alleghany Group 1.70% $56,588,421 $40,911,914 38.32% ($8,492,729) 0.49
20 State Farm Group 1.58% $52,493,183 $48,976,461 7.18% $9,022,911 37.42
21 Federated Mutual Group 1.28% $42,602,372 $34,065,348 25.06% ($28,210,939) 59.49
22 United Fire and Casualty Group 1.27% $42,326,645 $44,921,806 (5.78%) $8,034,294 55.20
23 Old Republic Group 1.12% $37,103,373 $47,493,697 (21.88%) $21,859,643 36.63
24 Farmers Insurance Group 1.10% $36,663,150 $36,219,299 1.23% $146,779 44.76
25 QBE Insurance Group 1.06% $35,381,916 $33,335,143 6.14% ($335,066) 16.36
Top 25 Groups Total 76.49% $2,542,144,654 $2,364,838,540 7.50% ($10,941,549) 43.88
Total Market 100.00% $3,323,601,713 $3,133,474,834 6.07% $92,667,955 45.91
10
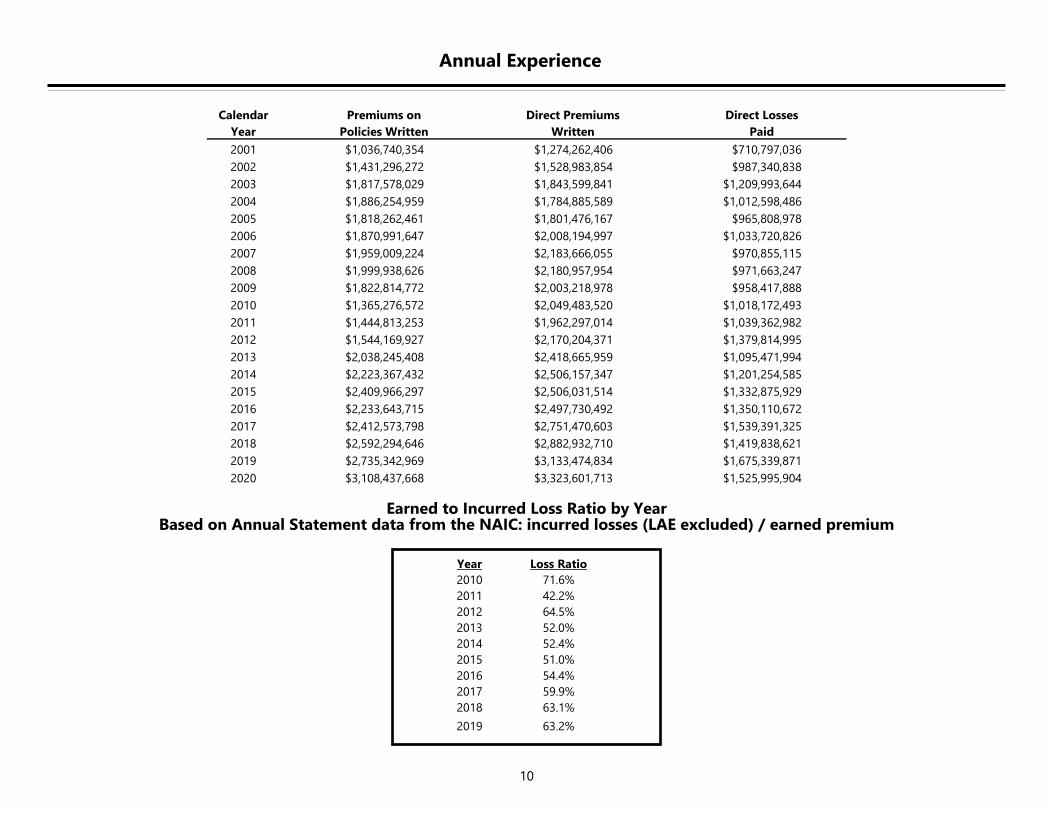
Annual Experience
Earned to Incurred Loss Ratio by Year Based on Annual Statement data from the NAIC: incurred losses (LAE excluded) / earned premium
Year Loss Ratio
2010 71.6%
2011 42.2%
2012 64.5%
2013 52.0%
2014 52.4%
2015 51.0%
2016 54.4%
2017 59.9%
2018 63.1%
2019 63.2%
Calendar Premiums on Direct Premiums Direct Losses
Year Policies Written Written Paid
2001 $1,036,740,354 $1,274,262,406 $710,797,036
2002 $1,431,296,272 $1,528,983,854 $987,340,838
2003 $1,817,578,029 $1,843,599,841 $1,209,993,644
2004 $1,886,254,959 $1,784,885,589 $1,012,598,486
2005 $1,818,262,461 $1,801,476,167 $965,808,978
2006 $1,870,991,647 $2,008,194,997 $1,033,720,826
2007 $1,959,009,224 $2,183,666,055 $970,855,115
2008 $1,999,938,626 $2,180,957,954 $971,663,247
2009 $1,822,814,772 $2,003,218,978 $958,417,888
2010 $1,365,276,572 $2,049,483,520 $1,018,172,493
2011 $1,444,813,253 $1,962,297,014 $1,039,362,982
2012 $1,544,169,927 $2,170,204,371 $1,379,814,995
2013 $2,038,245,408 $2,418,665,959 $1,095,471,994
2014 $2,223,367,432 $2,506,157,347 $1,201,254,585
2015 $2,409,966,297 $2,506,031,514 $1,332,875,929
2016 $2,233,643,715 $2,497,730,492 $1,350,110,672
2017 $2,412,573,798 $2,751,470,603 $1,539,391,325
2018 $2,592,294,646 $2,882,932,710 $1,419,838,621
2019 $2,735,342,969 $3,133,474,834 $1,675,339,871
2020 $3,108,437,668 $3,323,601,713 $1,525,995,904

11
Commercial Fire and Allied Lines
There were 79 groups (216 companies) that had direct premiums written for commercial fire and allied lines in 2020, compared to 78 groups
(215 companies) in 2019.
The table below represents the top 25 groups for direct premiums written based on the most recent year. Also included is a comparison of
direct premiums written in 2019 and 2020 for the same groups.
Direct Premiums Written Market Share for Commercial Fire and Allied Lines
Market Premiums Premiums Net Underwriting Loss
Annual Share Written Written % Change Profit or Loss Ratio
Rank Group Name 2020 2020 2019 2019 to 2020 2020 2020
1 FM Global Group 17.80% $227,283,477 $188,140,418 20.81% $163,901,394 80.13
2 Zurich Insurance Group 14.05% $179,446,425 $141,373,533 26.93% ($21,958,071) 95.68
3 Travelers Group 8.60% $109,808,611 $97,658,997 12.44% $25,224,617 53.99
4 Allianz Insurance Group 5.62% $71,781,756 $72,924,103 (1.57%) $46,457,383 35.28
5 Texas Windstorm Insurance Association 4.72% $60,236,965 $59,019,354 2.06% $17,027,104 40.36
6 Liberty Mutual Group 3.69% $47,104,901 $51,142,857 (7.90%) $32,721,726 89.92
7 CNA Insurance Group 3.42% $43,664,024 $39,102,522 11.67% ($8,929,048) 101.69
8 Swiss Re Group 3.36% $42,884,225 $33,985,548 26.18% $26,626,064 34.01
9 AXA Insurance Group 3.25% $41,525,781 $44,192,777 (6.03%) ($3,668,109) 160.57
10 Hannover Group 2.87% $36,615,646 $33,969,043 7.79% $3,453,468 90.57
11 United Fire and Casualty Group 2.51% $32,072,709 $31,936,912 0.43% ($2,976,027) 91.84
12 Sentry Insurance Group 2.19% $27,938,856 $26,351,900 6.02% $15,799,344 44.19
13 Palomar Holdings Group 2.08% $26,545,372 $15,596,538 70.20% $2,159,742 32.88
14 American International Group 2.03% $25,868,627 $22,355,387 15.72% $2,766,118 173.80
15 Federated Mutual Group 1.97% $25,133,591 $21,025,869 19.54% ($1,470,948) 57.97
16 Alleghany Group 1.91% $24,417,523 $25,540,652 (4.40%) $15,104,941 50.58
17 NKSJ Holdings Inc. Group 1.67% $21,361,149 $9,357,971 128.27% $10,457,588 66.03
18 The Hanover Insurance Group 1.50% $19,121,406 $17,655,449 8.30% $1,187,592 27.33
19 Chubb Limited Group 1.39% $17,777,080 $10,489,343 69.48% ($35,032,964) 275.50
20 EMC Insurance Co. Group 1.17% $14,880,467 $14,386,913 3.43% $3,766,200 84.96
21 IAT Reinsurance Company Group 1.09% $13,895,633 $13,175,966 5.46% $10,571,104 18.73
22 Texas Farm Bureau Mutual Group 0.95% $12,137,776 $11,616,863 4.48% $1,634,393 68.77
23 Nationwide Corp. Group 0.94% $12,053,145 $11,307,767 6.59% $1,282,716 37.08
24 American Risk Insurance Company, Inc. 0.92% $11,720,020 $8,484,045 38.14% ($77,735) 23.41
25 State Auto Mutual Group 0.90% $11,474,731 $9,747,363 17.72% $2,468,511 78.49
Top 25 Groups Total 90.57% $1,156,749,896 $1,010,538,090 14.47% $308,497,103 77.32
Total Market 100.00% $1,277,207,432 $1,104,814,860 15.60% $331,835,210 74.19
12
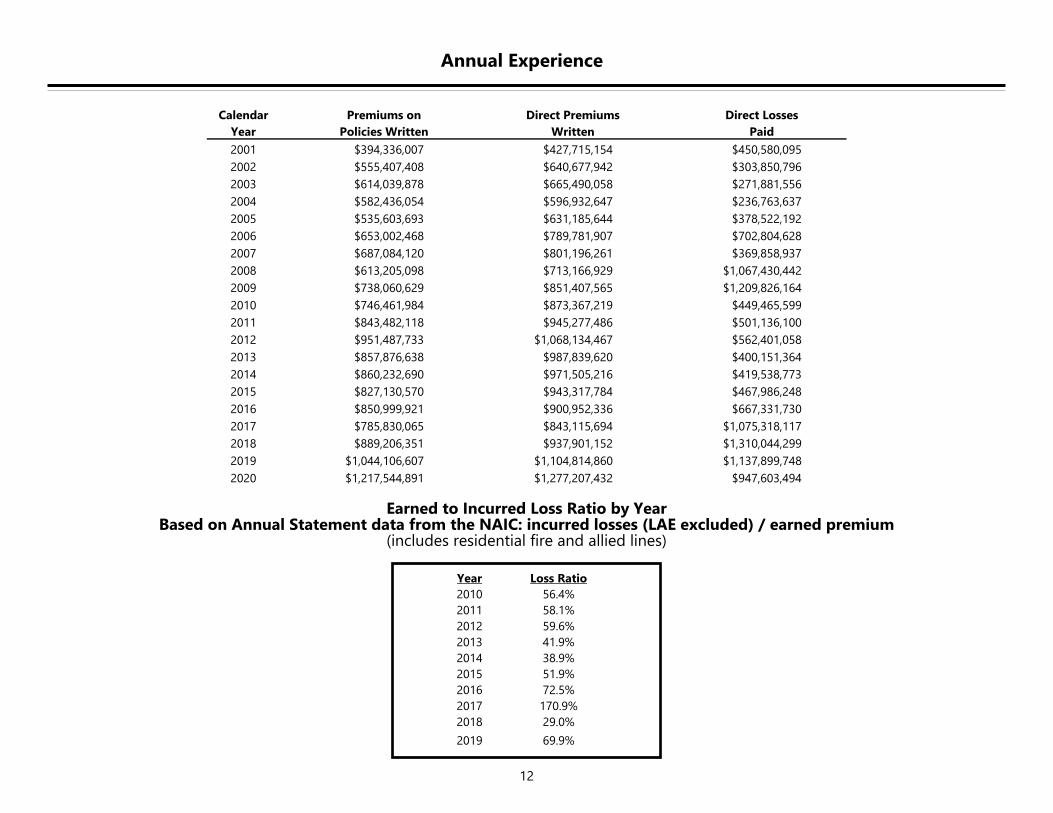
Annual Experience
Earned to Incurred Loss Ratio by Year Based on Annual Statement data from the NAIC: incurred losses (LAE excluded) / earned premium
(includes residential fire and allied lines)
Year Loss Ratio
2010 56.4%
2011 58.1%
2012 59.6%
2013 41.9%
2014 38.9%
2015 51.9%
2016 72.5%
2017 170.9%
2018 29.0%
2019 69.9%
Calendar Premiums on Direct Premiums Direct Losses
Year Policies Written Written Paid
2001 $394,336,007 $427,715,154 $450,580,095
2002 $555,407,408 $640,677,942 $303,850,796
2003 $614,039,878 $665,490,058 $271,881,556
2004 $582,436,054 $596,932,647 $236,763,637
2005 $535,603,693 $631,185,644 $378,522,192
2006 $653,002,468 $789,781,907 $702,804,628
2007 $687,084,120 $801,196,261 $369,858,937
2008 $613,205,098 $713,166,929 $1,067,430,442
2009 $738,060,629 $851,407,565 $1,209,826,164
2010 $746,461,984 $873,367,219 $449,465,599
2011 $843,482,118 $945,277,486 $501,136,100
2012 $951,487,733 $1,068,134,467 $562,401,058
2013 $857,876,638 $987,839,620 $400,151,364
2014 $860,232,690 $971,505,216 $419,538,773
2015 $827,130,570 $943,317,784 $467,986,248
2016 $850,999,921 $900,952,336 $667,331,730
2017 $785,830,065 $843,115,694 $1,075,318,117
2018 $889,206,351 $937,901,152 $1,310,044,299
2019 $1,044,106,607 $1,104,814,860 $1,137,899,748
2020 $1,217,544,891 $1,277,207,432 $947,603,494
13
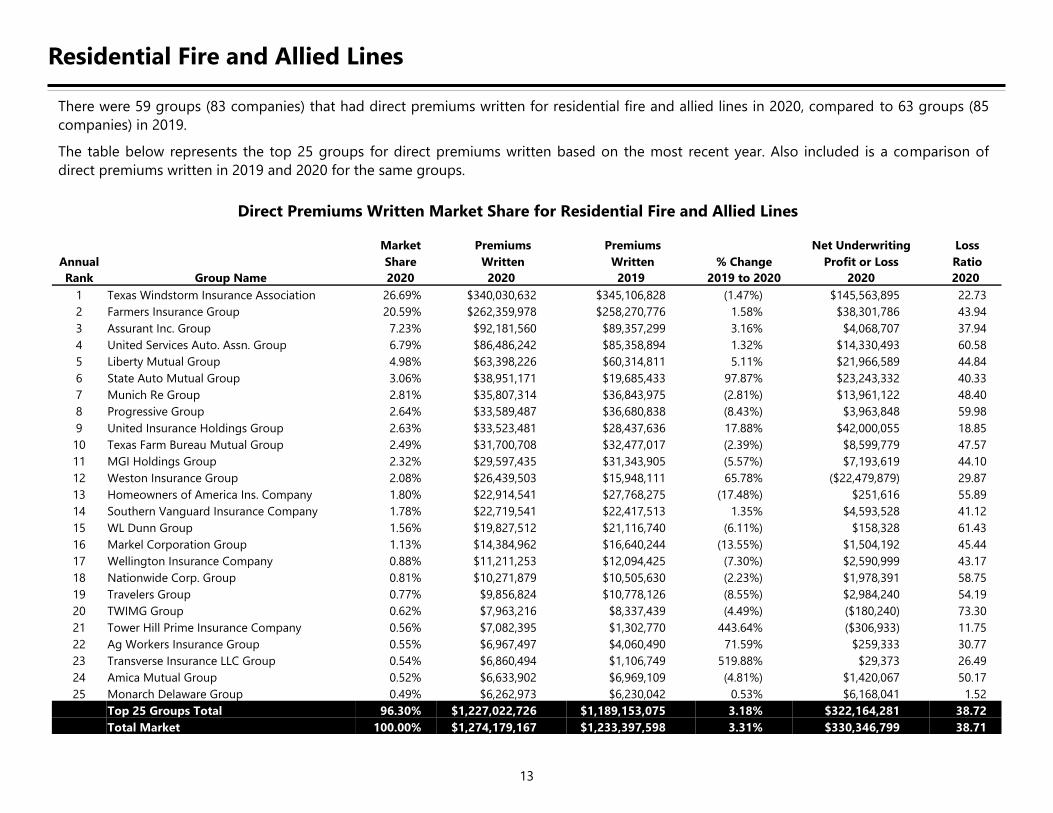
Residential Fire and Allied Lines
There were 59 groups (83 companies) that had direct premiums written for residential fire and allied lines in 2020, compared to 63 groups (85
companies) in 2019.
The table below represents the top 25 groups for direct premiums written based on the most recent year. Also included is a comparison of
direct premiums written in 2019 and 2020 for the same groups.
Direct Premiums Written Market Share for Residential Fire and Allied Lines
Market Premiums Premiums Net Underwriting Loss
Annual Share Written Written % Change Profit or Loss Ratio
Rank Group Name 2020 2020 2019 2019 to 2020 2020 2020
1 Texas Windstorm Insurance Association 26.69% $340,030,632 $345,106,828 (1.47%) $145,563,895 22.73
2 Farmers Insurance Group 20.59% $262,359,978 $258,270,776 1.58% $38,301,786 43.94
3 Assurant Inc. Group 7.23% $92,181,560 $89,357,299 3.16% $4,068,707 37.94
4 United Services Auto. Assn. Group 6.79% $86,486,242 $85,358,894 1.32% $14,330,493 60.58
5 Liberty Mutual Group 4.98% $63,398,226 $60,314,811 5.11% $21,966,589 44.84
6 State Auto Mutual Group 3.06% $38,951,171 $19,685,433 97.87% $23,243,332 40.33
7 Munich Re Group 2.81% $35,807,314 $36,843,975 (2.81%) $13,961,122 48.40
8 Progressive Group 2.64% $33,589,487 $36,680,838 (8.43%) $3,963,848 59.98
9 United Insurance Holdings Group 2.63% $33,523,481 $28,437,636 17.88% $42,000,055 18.85
10 Texas Farm Bureau Mutual Group 2.49% $31,700,708 $32,477,017 (2.39%) $8,599,779 47.57
11 MGI Holdings Group 2.32% $29,597,435 $31,343,905 (5.57%) $7,193,619 44.10
12 Weston Insurance Group 2.08% $26,439,503 $15,948,111 65.78% ($22,479,879) 29.87
13 Homeowners of America Ins. Company 1.80% $22,914,541 $27,768,275 (17.48%) $251,616 55.89
14 Southern Vanguard Insurance Company 1.78% $22,719,541 $22,417,513 1.35% $4,593,528 41.12
15 WL Dunn Group 1.56% $19,827,512 $21,116,740 (6.11%) $158,328 61.43
16 Markel Corporation Group 1.13% $14,384,962 $16,640,244 (13.55%) $1,504,192 45.44
17 Wellington Insurance Company 0.88% $11,211,253 $12,094,425 (7.30%) $2,590,999 43.17
18 Nationwide Corp. Group 0.81% $10,271,879 $10,505,630 (2.23%) $1,978,391 58.75
19 Travelers Group 0.77% $9,856,824 $10,778,126 (8.55%) $2,984,240 54.19
20 TWIMG Group 0.62% $7,963,216 $8,337,439 (4.49%) ($180,240) 73.30
21 Tower Hill Prime Insurance Company 0.56% $7,082,395 $1,302,770 443.64% ($306,933) 11.75
22 Ag Workers Insurance Group 0.55% $6,967,497 $4,060,490 71.59% $259,333 30.77
23 Transverse Insurance LLC Group 0.54% $6,860,494 $1,106,749 519.88% $29,373 26.49
24 Amica Mutual Group 0.52% $6,633,902 $6,969,109 (4.81%) $1,420,067 50.17
25 Monarch Delaware Group 0.49% $6,262,973 $6,230,042 0.53% $6,168,041 1.52
Top 25 Groups Total 96.30% $1,227,022,726 $1,189,153,075 3.18% $322,164,281 38.72
Total Market 100.00% $1,274,179,167 $1,233,397,598 3.31% $330,346,799 38.71
14
Annual Experience
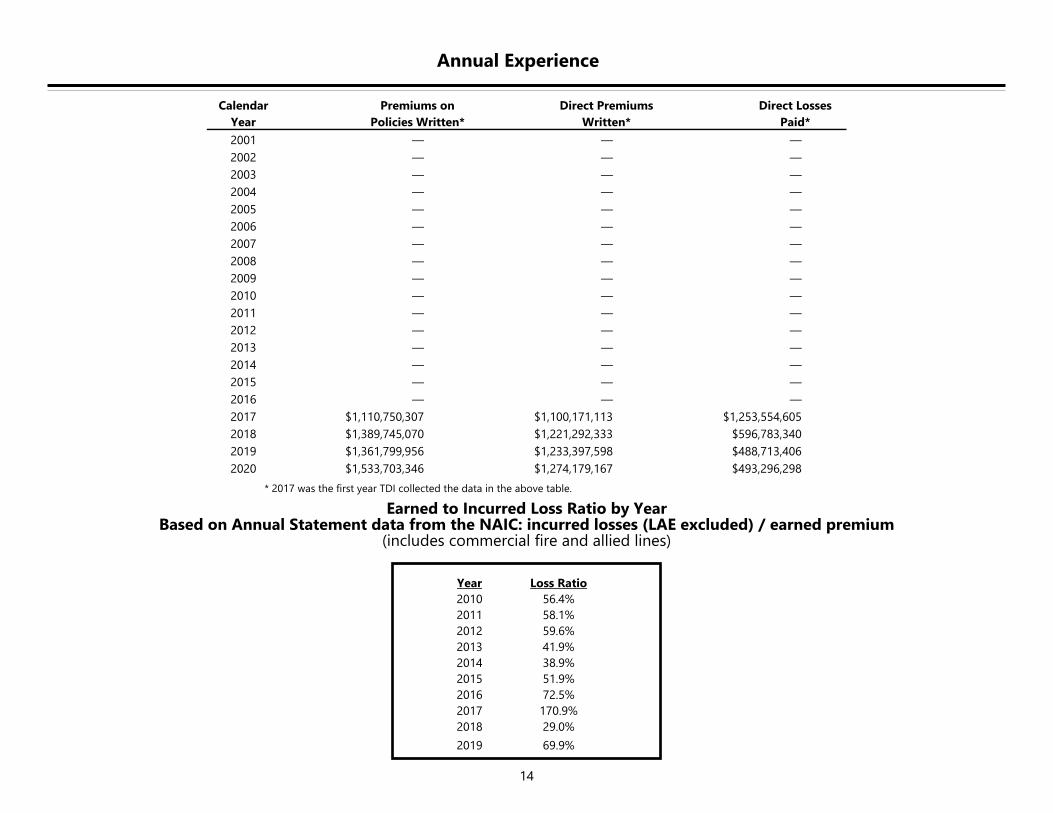
Earned to Incurred Loss Ratio by Year Based on Annual Statement data from the NAIC: incurred losses (LAE excluded) / earned premium
(includes commercial fire and allied lines)
* 2017 was the first year TDI collected the data in the above table.
Year Loss Ratio
2010 56.4%
2011 58.1%
2012 59.6%
2013 41.9%
2014 38.9%
2015 51.9%
2016 72.5%
2017 170.9%
2018 29.0%
2019 69.9%
Calendar Premiums on Direct Premiums Direct Losses
Year Policies Written* Written* Paid*
2001 — — —
2002 — — —
2003 — — —
2004 — — —
2005 — — —
2006 — — —
2007 — — —
2008 — — —
2009 — — —
2010 — — —
2011 — — —
2012 — — —
2013 — — —
2014 — — —
2015 — — —
2016 — — —
2017 $1,110,750,307 $1,100,171,113 $1,253,554,605
2018 $1,389,745,070 $1,221,292,333 $596,783,340
2019 $1,361,799,956 $1,233,397,598 $488,713,406
2020 $1,533,703,346 $1,274,179,167 $493,296,298
15
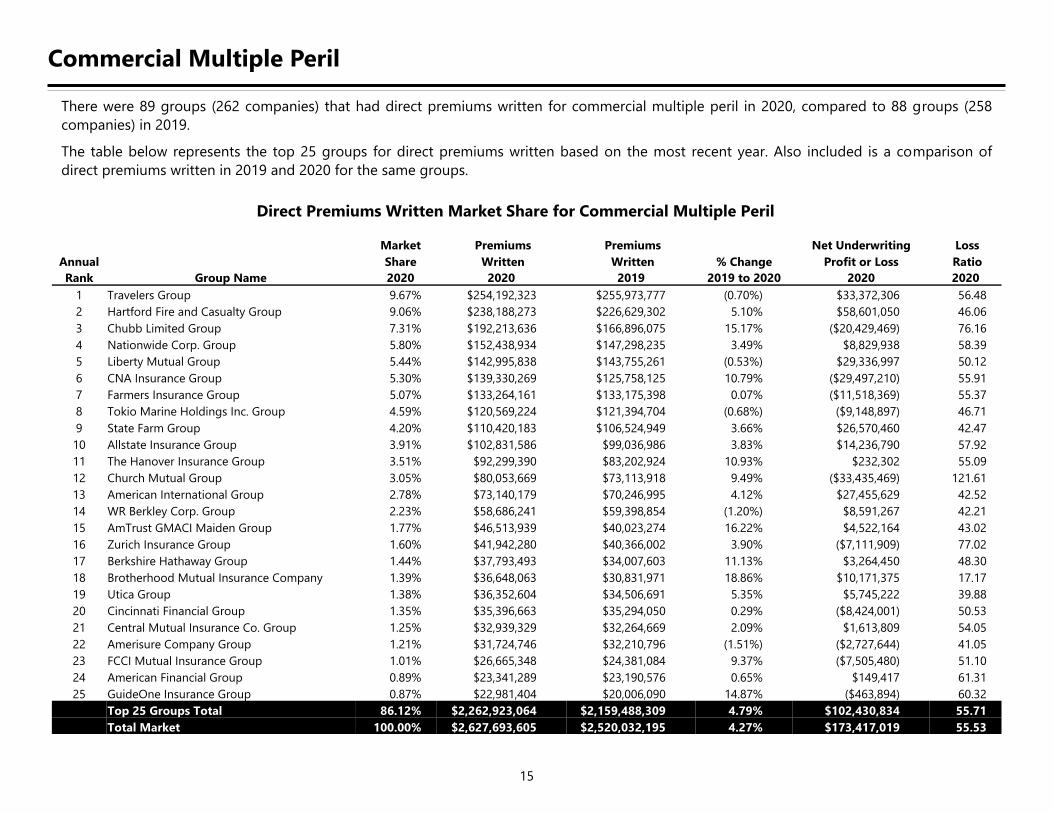
Commercial Multiple Peril
There were 89 groups (262 companies) that had direct premiums written for commercial multiple peril in 2020, compared to 88 groups (258
companies) in 2019.
The table below represents the top 25 groups for direct premiums written based on the most recent year. Also included is a comparison of
direct premiums written in 2019 and 2020 for the same groups.
Direct Premiums Written Market Share for Commercial Multiple Peril
Market Premiums Premiums Net Underwriting Loss
Annual Share Written Written % Change Profit or Loss Ratio
Rank Group Name 2020 2020 2019 2019 to 2020 2020 2020
1 Travelers Group 9.67% $254,192,323 $255,973,777 (0.70%) $33,372,306 56.48
2 Hartford Fire and Casualty Group 9.06% $238,188,273 $226,629,302 5.10% $58,601,050 46.06
3 Chubb Limited Group 7.31% $192,213,636 $166,896,075 15.17% ($20,429,469) 76.16
4 Nationwide Corp. Group 5.80% $152,438,934 $147,298,235 3.49% $8,829,938 58.39
5 Liberty Mutual Group 5.44% $142,995,838 $143,755,261 (0.53%) $29,336,997 50.12
6 CNA Insurance Group 5.30% $139,330,269 $125,758,125 10.79% ($29,497,210) 55.91
7 Farmers Insurance Group 5.07% $133,264,161 $133,175,398 0.07% ($11,518,369) 55.37
8 Tokio Marine Holdings Inc. Group 4.59% $120,569,224 $121,394,704 (0.68%) ($9,148,897) 46.71
9 State Farm Group 4.20% $110,420,183 $106,524,949 3.66% $26,570,460 42.47
10 Allstate Insurance Group 3.91% $102,831,586 $99,036,986 3.83% $14,236,790 57.92
11 The Hanover Insurance Group 3.51% $92,299,390 $83,202,924 10.93% $232,302 55.09
12 Church Mutual Group 3.05% $80,053,669 $73,113,918 9.49% ($33,435,469) 121.61
13 American International Group 2.78% $73,140,179 $70,246,995 4.12% $27,455,629 42.52
14 WR Berkley Corp. Group 2.23% $58,686,241 $59,398,854 (1.20%) $8,591,267 42.21
15 AmTrust GMACI Maiden Group 1.77% $46,513,939 $40,023,274 16.22% $4,522,164 43.02
16 Zurich Insurance Group 1.60% $41,942,280 $40,366,002 3.90% ($7,111,909) 77.02
17 Berkshire Hathaway Group 1.44% $37,793,493 $34,007,603 11.13% $3,264,450 48.30
18 Brotherhood Mutual Insurance Company 1.39% $36,648,063 $30,831,971 18.86% $10,171,375 17.17
19 Utica Group 1.38% $36,352,604 $34,506,691 5.35% $5,745,222 39.88
20 Cincinnati Financial Group 1.35% $35,396,663 $35,294,050 0.29% ($8,424,001) 50.53
21 Central Mutual Insurance Co. Group 1.25% $32,939,329 $32,264,669 2.09% $1,613,809 54.05
22 Amerisure Company Group 1.21% $31,724,746 $32,210,796 (1.51%) ($2,727,644) 41.05
23 FCCI Mutual Insurance Group 1.01% $26,665,348 $24,381,084 9.37% ($7,505,480) 51.10
24 American Financial Group 0.89% $23,341,289 $23,190,576 0.65% $149,417 61.31
25 GuideOne Insurance Group 0.87% $22,981,404 $20,006,090 14.87% ($463,894) 60.32
Top 25 Groups Total 86.12% $2,262,923,064 $2,159,488,309 4.79% $102,430,834 55.71
Total Market 100.00% $2,627,693,605 $2,520,032,195 4.27% $173,417,019 55.53
16
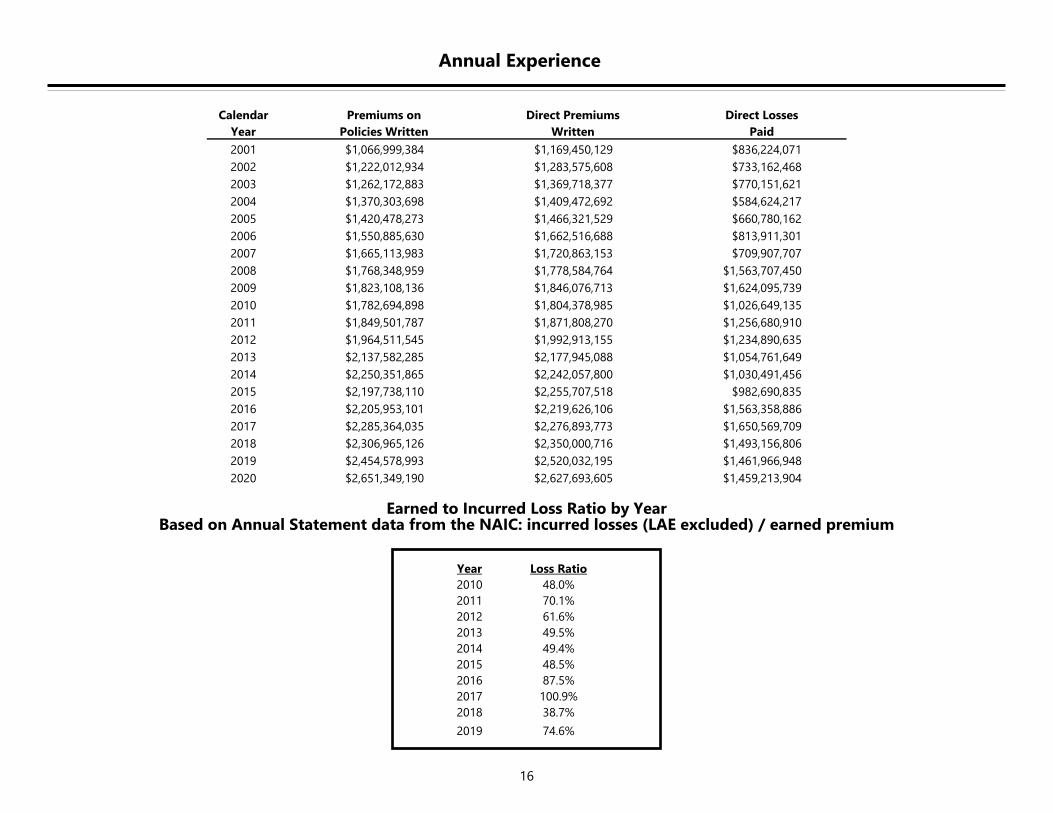
Annual Experience
Earned to Incurred Loss Ratio by Year Based on Annual Statement data from the NAIC: incurred losses (LAE excluded) / earned premium
Year Loss Ratio
2010 48.0%
2011 70.1%
2012 61.6%
2013 49.5%
2014 49.4%
2015 48.5%
2016 87.5%
2017 100.9%
2018 38.7%
2019 74.6%
Calendar Premiums on Direct Premiums Direct Losses
Year Policies Written Written Paid
2001 $1,066,999,384 $1,169,450,129 $836,224,071
2002 $1,222,012,934 $1,283,575,608 $733,162,468
2003 $1,262,172,883 $1,369,718,377 $770,151,621
2004 $1,370,303,698 $1,409,472,692 $584,624,217
2005 $1,420,478,273 $1,466,321,529 $660,780,162
2006 $1,550,885,630 $1,662,516,688 $813,911,301
2007 $1,665,113,983 $1,720,863,153 $709,907,707
2008 $1,768,348,959 $1,778,584,764 $1,563,707,450
2009 $1,823,108,136 $1,846,076,713 $1,624,095,739
2010 $1,782,694,898 $1,804,378,985 $1,026,649,135
2011 $1,849,501,787 $1,871,808,270 $1,256,680,910
2012 $1,964,511,545 $1,992,913,155 $1,234,890,635
2013 $2,137,582,285 $2,177,945,088 $1,054,761,649
2014 $2,250,351,865 $2,242,057,800 $1,030,491,456
2015 $2,197,738,110 $2,255,707,518 $982,690,835
2016 $2,205,953,101 $2,219,626,106 $1,563,358,886
2017 $2,285,364,035 $2,276,893,773 $1,650,569,709
2018 $2,306,965,126 $2,350,000,716 $1,493,156,806
2019 $2,454,578,993 $2,520,032,195 $1,461,966,948
2020 $2,651,349,190 $2,627,693,605 $1,459,213,904
17
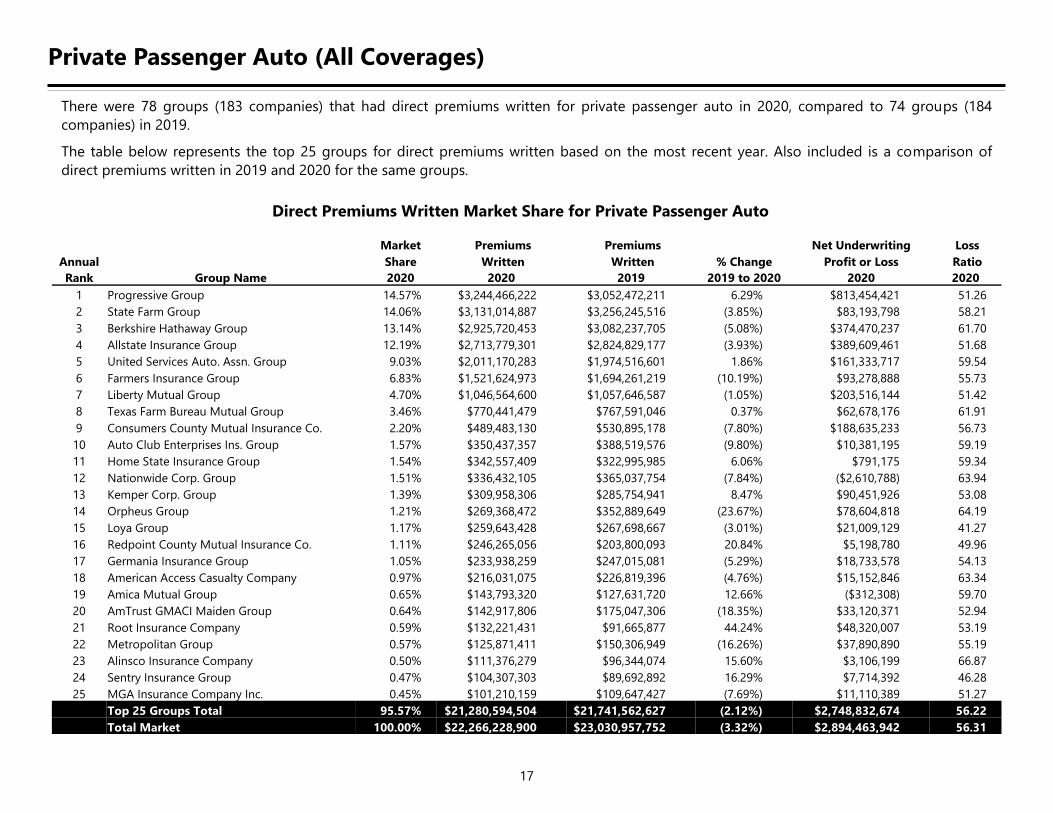
Private Passenger Auto (All Coverages)
There were 78 groups (183 companies) that had direct premiums written for private passenger auto in 2020, compared to 74 groups (184
companies) in 2019.
The table below represents the top 25 groups for direct premiums written based on the most recent year. Also included is a comparison of
direct premiums written in 2019 and 2020 for the same groups.
Direct Premiums Written Market Share for Private Passenger Auto
Market Premiums Premiums Net Underwriting Loss
Annual Share Written Written % Change Profit or Loss Ratio
Rank Group Name 2020 2020 2019 2019 to 2020 2020 2020
1 Progressive Group 14.57% $3,244,466,222 $3,052,472,211 6.29% $813,454,421 51.26
2 State Farm Group 14.06% $3,131,014,887 $3,256,245,516 (3.85%) $83,193,798 58.21
3 Berkshire Hathaway Group 13.14% $2,925,720,453 $3,082,237,705 (5.08%) $374,470,237 61.70
4 Allstate Insurance Group 12.19% $2,713,779,301 $2,824,829,177 (3.93%) $389,609,461 51.68
5 United Services Auto. Assn. Group 9.03% $2,011,170,283 $1,974,516,601 1.86% $161,333,717 59.54
6 Farmers Insurance Group 6.83% $1,521,624,973 $1,694,261,219 (10.19%) $93,278,888 55.73
7 Liberty Mutual Group 4.70% $1,046,564,600 $1,057,646,587 (1.05%) $203,516,144 51.42
8 Texas Farm Bureau Mutual Group 3.46% $770,441,479 $767,591,046 0.37% $62,678,176 61.91
9 Consumers County Mutual Insurance Co. 2.20% $489,483,130 $530,895,178 (7.80%) $188,635,233 56.73
10 Auto Club Enterprises Ins. Group 1.57% $350,437,357 $388,519,576 (9.80%) $10,381,195 59.19
11 Home State Insurance Group 1.54% $342,557,409 $322,995,985 6.06% $791,175 59.34
12 Nationwide Corp. Group 1.51% $336,432,105 $365,037,754 (7.84%) ($2,610,788) 63.94
13 Kemper Corp. Group 1.39% $309,958,306 $285,754,941 8.47% $90,451,926 53.08
14 Orpheus Group 1.21% $269,368,472 $352,889,649 (23.67%) $78,604,818 64.19
15 Loya Group 1.17% $259,643,428 $267,698,667 (3.01%) $21,009,129 41.27
16 Redpoint County Mutual Insurance Co. 1.11% $246,265,056 $203,800,093 20.84% $5,198,780 49.96
17 Germania Insurance Group 1.05% $233,938,259 $247,015,081 (5.29%) $18,733,578 54.13
18 American Access Casualty Company 0.97% $216,031,075 $226,819,396 (4.76%) $15,152,846 63.34
19 Amica Mutual Group 0.65% $143,793,320 $127,631,720 12.66% ($312,308) 59.70
20 AmTrust GMACI Maiden Group 0.64% $142,917,806 $175,047,306 (18.35%) $33,120,371 52.94
21 Root Insurance Company 0.59% $132,221,431 $91,665,877 44.24% $48,320,007 53.19
22 Metropolitan Group 0.57% $125,871,411 $150,306,949 (16.26%) $37,890,890 55.19
23 Alinsco Insurance Company 0.50% $111,376,279 $96,344,074 15.60% $3,106,199 66.87
24 Sentry Insurance Group 0.47% $104,307,303 $89,692,892 16.29% $7,714,392 46.28
25 MGA Insurance Company Inc. 0.45% $101,210,159 $109,647,427 (7.69%) $11,110,389 51.27
Top 25 Groups Total 95.57% $21,280,594,504 $21,741,562,627 (2.12%) $2,748,832,674 56.22
Total Market 100.00% $22,266,228,900 $23,030,957,752 (3.32%) $2,894,463,942 56.31
18
Annual Experience
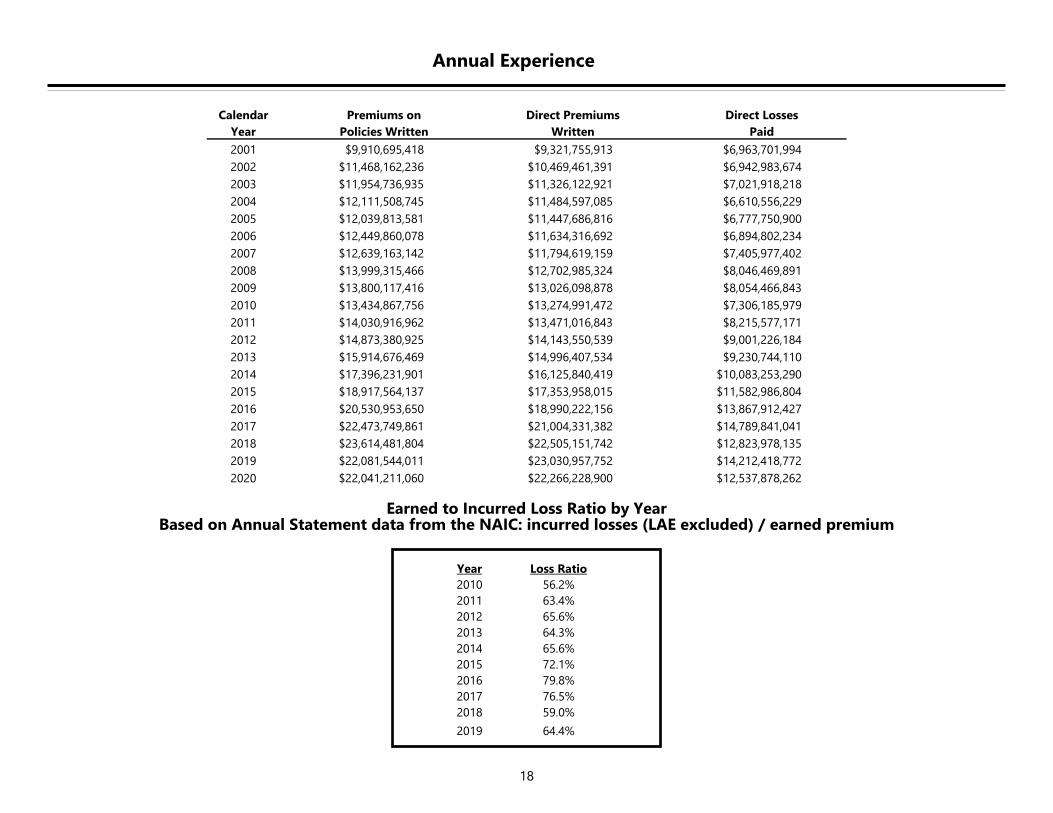
Earned to Incurred Loss Ratio by Year Based on Annual Statement data from the NAIC: incurred losses (LAE excluded) / earned premium
Year Loss Ratio
2010 56.2%
2011 63.4%
2012 65.6%
2013 64.3%
2014 65.6%
2015 72.1%
2016 79.8%
2017 76.5%
2018 59.0%
2019 64.4%
Calendar Premiums on Direct Premiums Direct Losses
Year Policies Written Written Paid
2001 $9,910,695,418 $9,321,755,913 $6,963,701,994
2002 $11,468,162,236 $10,469,461,391 $6,942,983,674
2003 $11,954,736,935 $11,326,122,921 $7,021,918,218
2004 $12,111,508,745 $11,484,597,085 $6,610,556,229
2005 $12,039,813,581 $11,447,686,816 $6,777,750,900
2006 $12,449,860,078 $11,634,316,692 $6,894,802,234
2007 $12,639,163,142 $11,794,619,159 $7,405,977,402
2008 $13,999,315,466 $12,702,985,324 $8,046,469,891
2009 $13,800,117,416 $13,026,098,878 $8,054,466,843
2010 $13,434,867,756 $13,274,991,472 $7,306,185,979
2011 $14,030,916,962 $13,471,016,843 $8,215,577,171
2012 $14,873,380,925 $14,143,550,539 $9,001,226,184
2013 $15,914,676,469 $14,996,407,534 $9,230,744,110
2014 $17,396,231,901 $16,125,840,419 $10,083,253,290
2015 $18,917,564,137 $17,353,958,015 $11,582,986,804
2016 $20,530,953,650 $18,990,222,156 $13,867,912,427
2017 $22,473,749,861 $21,004,331,382 $14,789,841,041
2018 $23,614,481,804 $22,505,151,742 $12,823,978,135
2019 $22,081,544,011 $23,030,957,752 $14,212,418,772
2020 $22,041,211,060 $22,266,228,900 $12,537,878,262
19
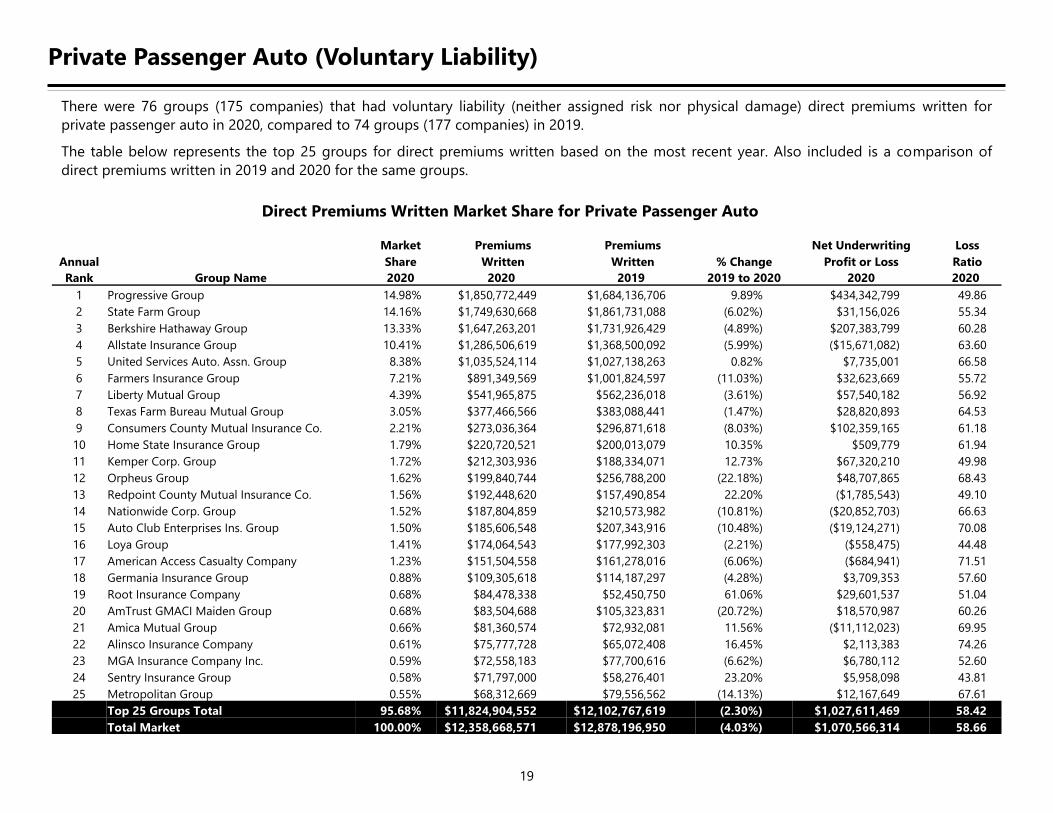
Private Passenger Auto (Voluntary Liability)
There were 76 groups (175 companies) that had voluntary liability (neither assigned risk nor physical damage) direct premiums written for
private passenger auto in 2020, compared to 74 groups (177 companies) in 2019.
The table below represents the top 25 groups for direct premiums written based on the most recent year. Also included is a comparison of
direct premiums written in 2019 and 2020 for the same groups.
Direct Premiums Written Market Share for Private Passenger Auto
Market Premiums Premiums Net Underwriting Loss
Annual Share Written Written % Change Profit or Loss Ratio
Rank Group Name 2020 2020 2019 2019 to 2020 2020 2020
1 Progressive Group 14.98% $1,850,772,449 $1,684,136,706 9.89% $434,342,799 49.86
2 State Farm Group 14.16% $1,749,630,668 $1,861,731,088 (6.02%) $31,156,026 55.34
3 Berkshire Hathaway Group 13.33% $1,647,263,201 $1,731,926,429 (4.89%) $207,383,799 60.28
4 Allstate Insurance Group 10.41% $1,286,506,619 $1,368,500,092 (5.99%) ($15,671,082) 63.60
5 United Services Auto. Assn. Group 8.38% $1,035,524,114 $1,027,138,263 0.82% $7,735,001 66.58
6 Farmers Insurance Group 7.21% $891,349,569 $1,001,824,597 (11.03%) $32,623,669 55.72
7 Liberty Mutual Group 4.39% $541,965,875 $562,236,018 (3.61%) $57,540,182 56.92
8 Texas Farm Bureau Mutual Group 3.05% $377,466,566 $383,088,441 (1.47%) $28,820,893 64.53
9 Consumers County Mutual Insurance Co. 2.21% $273,036,364 $296,871,618 (8.03%) $102,359,165 61.18
10 Home State Insurance Group 1.79% $220,720,521 $200,013,079 10.35% $509,779 61.94
11 Kemper Corp. Group 1.72% $212,303,936 $188,334,071 12.73% $67,320,210 49.98
12 Orpheus Group 1.62% $199,840,744 $256,788,200 (22.18%) $48,707,865 68.43
13 Redpoint County Mutual Insurance Co. 1.56% $192,448,620 $157,490,854 22.20% ($1,785,543) 49.10
14 Nationwide Corp. Group 1.52% $187,804,859 $210,573,982 (10.81%) ($20,852,703) 66.63
15 Auto Club Enterprises Ins. Group 1.50% $185,606,548 $207,343,916 (10.48%) ($19,124,271) 70.08
16 Loya Group 1.41% $174,064,543 $177,992,303 (2.21%) ($558,475) 44.48
17 American Access Casualty Company 1.23% $151,504,558 $161,278,016 (6.06%) ($684,941) 71.51
18 Germania Insurance Group 0.88% $109,305,618 $114,187,297 (4.28%) $3,709,353 57.60
19 Root Insurance Company 0.68% $84,478,338 $52,450,750 61.06% $29,601,537 51.04
20 AmTrust GMACI Maiden Group 0.68% $83,504,688 $105,323,831 (20.72%) $18,570,987 60.26
21 Amica Mutual Group 0.66% $81,360,574 $72,932,081 11.56% ($11,112,023) 69.95
22 Alinsco Insurance Company 0.61% $75,777,728 $65,072,408 16.45% $2,113,383 74.26
23 MGA Insurance Company Inc. 0.59% $72,558,183 $77,700,616 (6.62%) $6,780,112 52.60
24 Sentry Insurance Group 0.58% $71,797,000 $58,276,401 23.20% $5,958,098 43.81
25 Metropolitan Group 0.55% $68,312,669 $79,556,562 (14.13%) $12,167,649 67.61
Top 25 Groups Total 95.68% $11,824,904,552 $12,102,767,619 (2.30%) $1,027,611,469 58.42
Total Market 100.00% $12,358,668,571 $12,878,196,950 (4.03%) $1,070,566,314 58.66
20
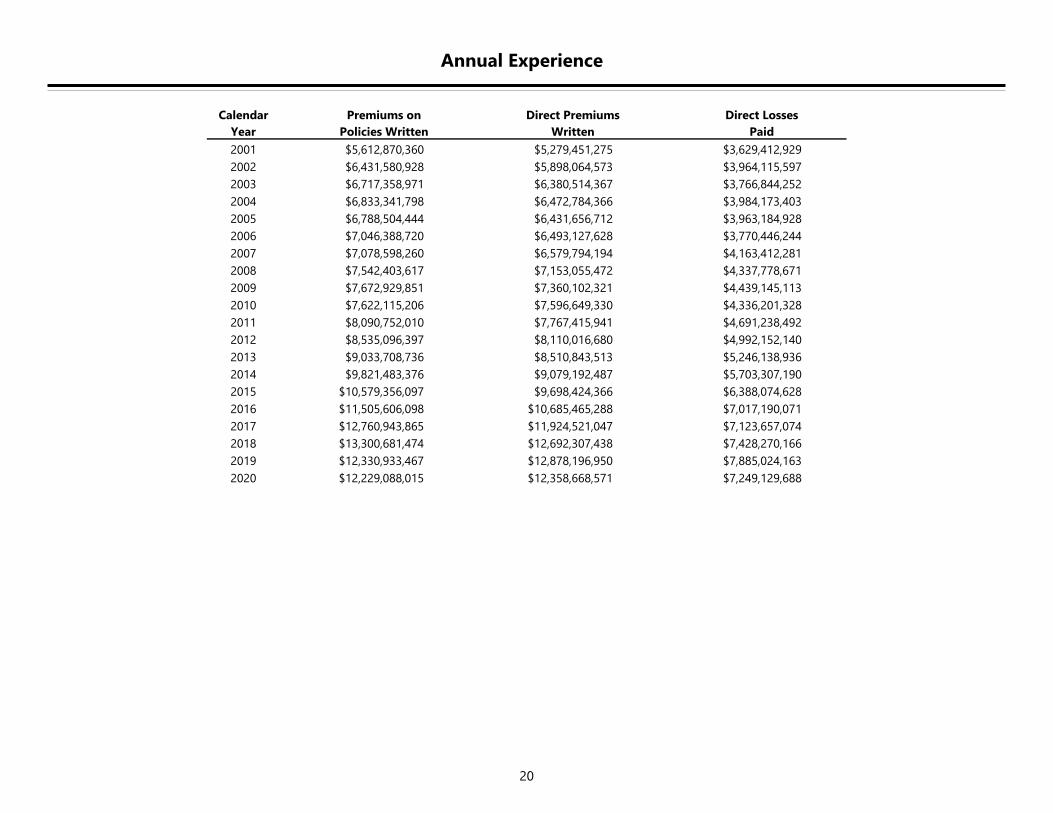
Annual Experience
Calendar Premiums on Direct Premiums Direct Losses
Year Policies Written Written Paid
2001 $5,612,870,360 $5,279,451,275 $3,629,412,929
2002 $6,431,580,928 $5,898,064,573 $3,964,115,597
2003 $6,717,358,971 $6,380,514,367 $3,766,844,252
2004 $6,833,341,798 $6,472,784,366 $3,984,173,403
2005 $6,788,504,444 $6,431,656,712 $3,963,184,928
2006 $7,046,388,720 $6,493,127,628 $3,770,446,244
2007 $7,078,598,260 $6,579,794,194 $4,163,412,281
2008 $7,542,403,617 $7,153,055,472 $4,337,778,671
2009 $7,672,929,851 $7,360,102,321 $4,439,145,113
2010 $7,622,115,206 $7,596,649,330 $4,336,201,328
2011 $8,090,752,010 $7,767,415,941 $4,691,238,492
2012 $8,535,096,397 $8,110,016,680 $4,992,152,140
2013 $9,033,708,736 $8,510,843,513 $5,246,138,936
2014 $9,821,483,376 $9,079,192,487 $5,703,307,190
2015 $10,579,356,097 $9,698,424,366 $6,388,074,628
2016 $11,505,606,098 $10,685,465,288 $7,017,190,071
2017 $12,760,943,865 $11,924,521,047 $7,123,657,074
2018 $13,300,681,474 $12,692,307,438 $7,428,270,166
2019 $12,330,933,467 $12,878,196,950 $7,885,024,163
2020 $12,229,088,015 $12,358,668,571 $7,249,129,688
21
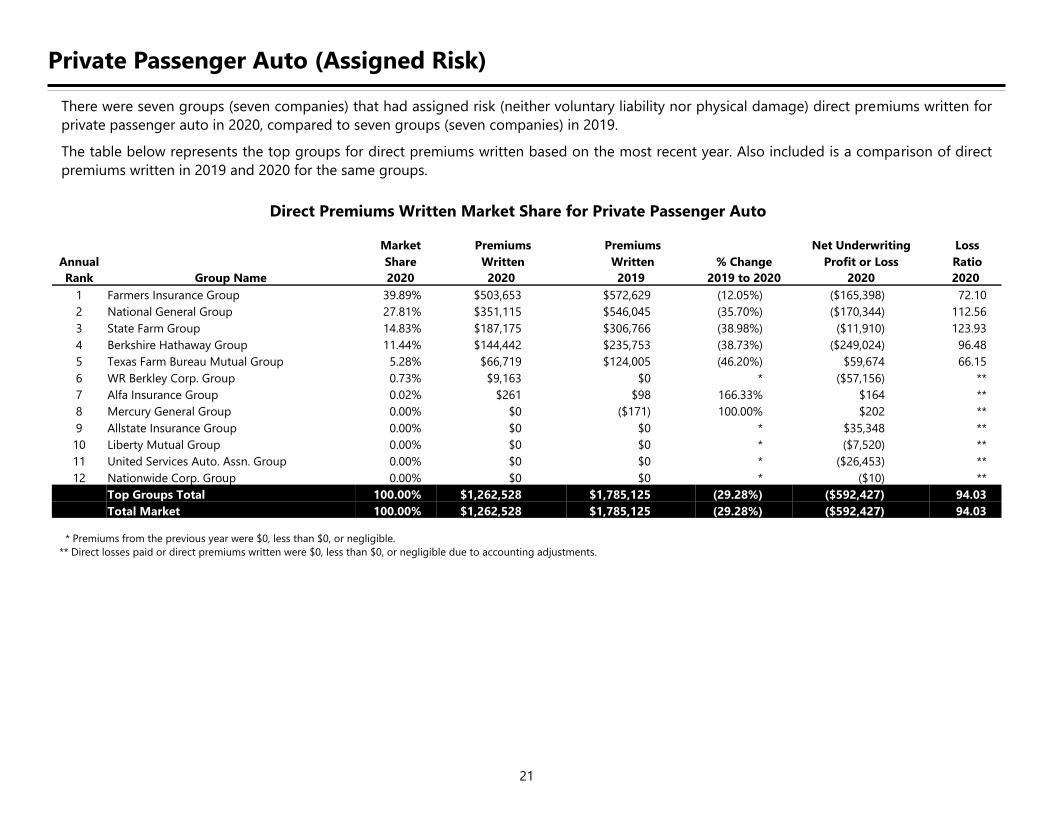
Private Passenger Auto (Assigned Risk)
There were seven groups (seven companies) that had assigned risk (neither voluntary liability nor physical damage) direct premiums written for
private passenger auto in 2020, compared to seven groups (seven companies) in 2019.
The table below represents the top groups for direct premiums written based on the most recent year. Also included is a comparison of direct
premiums written in 2019 and 2020 for the same groups.
Direct Premiums Written Market Share for Private Passenger Auto
* Premiums from the previous year were $0, less than $0, or negligible.
** Direct losses paid or direct premiums written were $0, less than $0, or negligible due to accounting adjustments.
Market Premiums Premiums Net Underwriting Loss
Annual Share Written Written % Change Profit or Loss Ratio
Rank Group Name 2020 2020 2019 2019 to 2020 2020 2020
1 Farmers Insurance Group 39.89% $503,653 $572,629 (12.05%) ($165,398) 72.10
2 National General Group 27.81% $351,115 $546,045 (35.70%) ($170,344) 112.56
3 State Farm Group 14.83% $187,175 $306,766 (38.98%) ($11,910) 123.93
4 Berkshire Hathaway Group 11.44% $144,442 $235,753 (38.73%) ($249,024) 96.48
5 Texas Farm Bureau Mutual Group 5.28% $66,719 $124,005 (46.20%) $59,674 66.15
6 WR Berkley Corp. Group 0.73% $9,163 $0 * ($57,156) **
7 Alfa Insurance Group 0.02% $261 $98 166.33% $164 **
8 Mercury General Group 0.00% $0 ($171) 100.00% $202 **
9 Allstate Insurance Group 0.00% $0 $0 * $35,348 **
10 Liberty Mutual Group 0.00% $0 $0 * ($7,520) **
11 United Services Auto. Assn. Group 0.00% $0 $0 * ($26,453) **
12 Nationwide Corp. Group 0.00% $0 $0 * ($10) **
Top Groups Total 100.00% $1,262,528 $1,785,125 (29.28%) ($592,427) 94.03
Total Market 100.00% $1,262,528 $1,785,125 (29.28%) ($592,427) 94.03
22
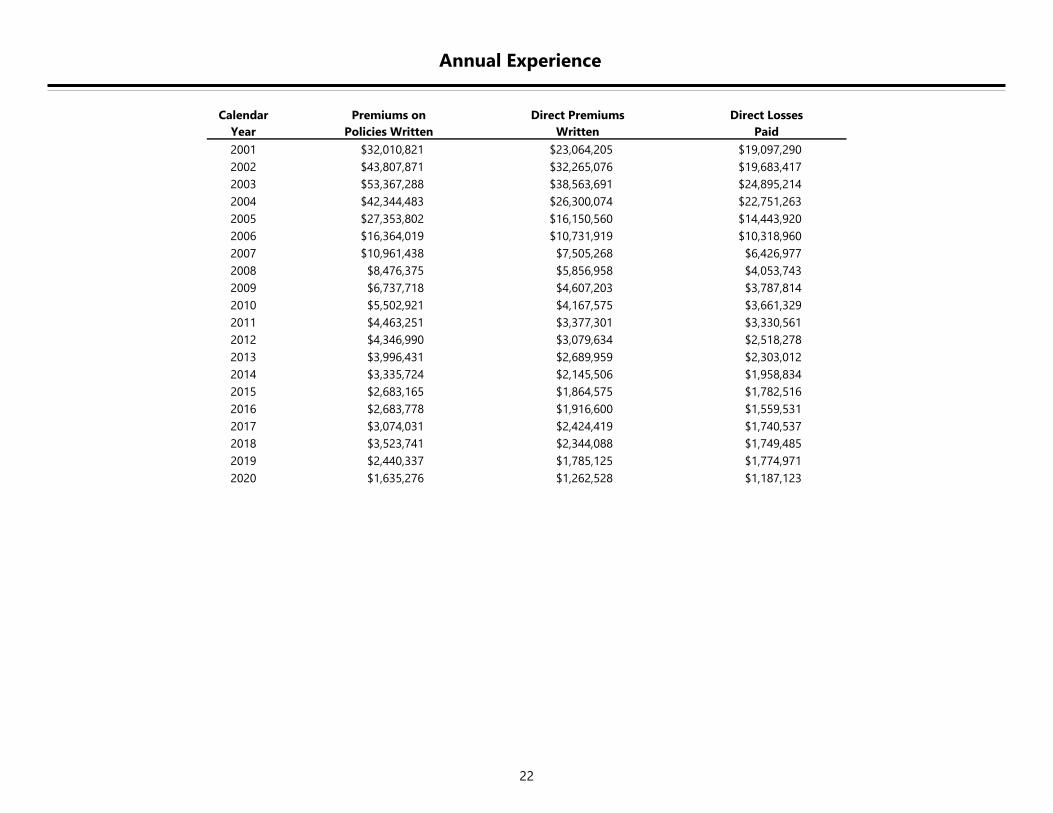
Annual Experience
Calendar Premiums on Direct Premiums Direct Losses
Year Policies Written Written Paid
2001 $32,010,821 $23,064,205 $19,097,290
2002 $43,807,871 $32,265,076 $19,683,417
2003 $53,367,288 $38,563,691 $24,895,214
2004 $42,344,483 $26,300,074 $22,751,263
2005 $27,353,802 $16,150,560 $14,443,920
2006 $16,364,019 $10,731,919 $10,318,960
2007 $10,961,438 $7,505,268 $6,426,977
2008 $8,476,375 $5,856,958 $4,053,743
2009 $6,737,718 $4,607,203 $3,787,814
2010 $5,502,921 $4,167,575 $3,661,329
2011 $4,463,251 $3,377,301 $3,330,561
2012 $4,346,990 $3,079,634 $2,518,278
2013 $3,996,431 $2,689,959 $2,303,012
2014 $3,335,724 $2,145,506 $1,958,834
2015 $2,683,165 $1,864,575 $1,782,516
2016 $2,683,778 $1,916,600 $1,559,531
2017 $3,074,031 $2,424,419 $1,740,537
2018 $3,523,741 $2,344,088 $1,749,485
2019 $2,440,337 $1,785,125 $1,774,971
2020 $1,635,276 $1,262,528 $1,187,123
23
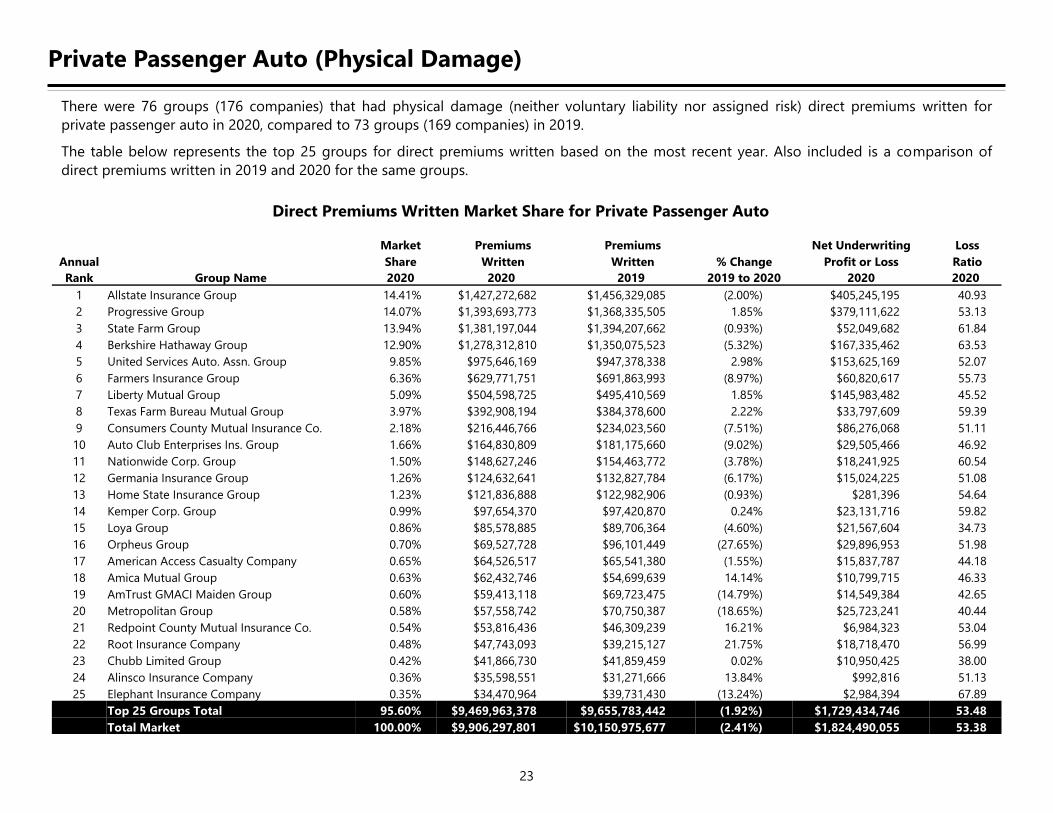
Private Passenger Auto (Physical Damage)
There were 76 groups (176 companies) that had physical damage (neither voluntary liability nor assigned risk) direct premiums written for
private passenger auto in 2020, compared to 73 groups (169 companies) in 2019.
The table below represents the top 25 groups for direct premiums written based on the most recent year. Also included is a comparison of
direct premiums written in 2019 and 2020 for the same groups.
Direct Premiums Written Market Share for Private Passenger Auto
Market Premiums Premiums Net Underwriting Loss
Annual Share Written Written % Change Profit or Loss Ratio
Rank Group Name 2020 2020 2019 2019 to 2020 2020 2020
1 Allstate Insurance Group 14.41% $1,427,272,682 $1,456,329,085 (2.00%) $405,245,195 40.93
2 Progressive Group 14.07% $1,393,693,773 $1,368,335,505 1.85% $379,111,622 53.13
3 State Farm Group 13.94% $1,381,197,044 $1,394,207,662 (0.93%) $52,049,682 61.84
4 Berkshire Hathaway Group 12.90% $1,278,312,810 $1,350,075,523 (5.32%) $167,335,462 63.53
5 United Services Auto. Assn. Group 9.85% $975,646,169 $947,378,338 2.98% $153,625,169 52.07
6 Farmers Insurance Group 6.36% $629,771,751 $691,863,993 (8.97%) $60,820,617 55.73
7 Liberty Mutual Group 5.09% $504,598,725 $495,410,569 1.85% $145,983,482 45.52
8 Texas Farm Bureau Mutual Group 3.97% $392,908,194 $384,378,600 2.22% $33,797,609 59.39
9 Consumers County Mutual Insurance Co. 2.18% $216,446,766 $234,023,560 (7.51%) $86,276,068 51.11
10 Auto Club Enterprises Ins. Group 1.66% $164,830,809 $181,175,660 (9.02%) $29,505,466 46.92
11 Nationwide Corp. Group 1.50% $148,627,246 $154,463,772 (3.78%) $18,241,925 60.54
12 Germania Insurance Group 1.26% $124,632,641 $132,827,784 (6.17%) $15,024,225 51.08
13 Home State Insurance Group 1.23% $121,836,888 $122,982,906 (0.93%) $281,396 54.64
14 Kemper Corp. Group 0.99% $97,654,370 $97,420,870 0.24% $23,131,716 59.82
15 Loya Group 0.86% $85,578,885 $89,706,364 (4.60%) $21,567,604 34.73
16 Orpheus Group 0.70% $69,527,728 $96,101,449 (27.65%) $29,896,953 51.98
17 American Access Casualty Company 0.65% $64,526,517 $65,541,380 (1.55%) $15,837,787 44.18
18 Amica Mutual Group 0.63% $62,432,746 $54,699,639 14.14% $10,799,715 46.33
19 AmTrust GMACI Maiden Group 0.60% $59,413,118 $69,723,475 (14.79%) $14,549,384 42.65
20 Metropolitan Group 0.58% $57,558,742 $70,750,387 (18.65%) $25,723,241 40.44
21 Redpoint County Mutual Insurance Co. 0.54% $53,816,436 $46,309,239 16.21% $6,984,323 53.04
22 Root Insurance Company 0.48% $47,743,093 $39,215,127 21.75% $18,718,470 56.99
23 Chubb Limited Group 0.42% $41,866,730 $41,859,459 0.02% $10,950,425 38.00
24 Alinsco Insurance Company 0.36% $35,598,551 $31,271,666 13.84% $992,816 51.13
25 Elephant Insurance Company 0.35% $34,470,964 $39,731,430 (13.24%) $2,984,394 67.89
Top 25 Groups Total 95.60% $9,469,963,378 $9,655,783,442 (1.92%) $1,729,434,746 53.48
Total Market 100.00% $9,906,297,801 $10,150,975,677 (2.41%) $1,824,490,055 53.38
24
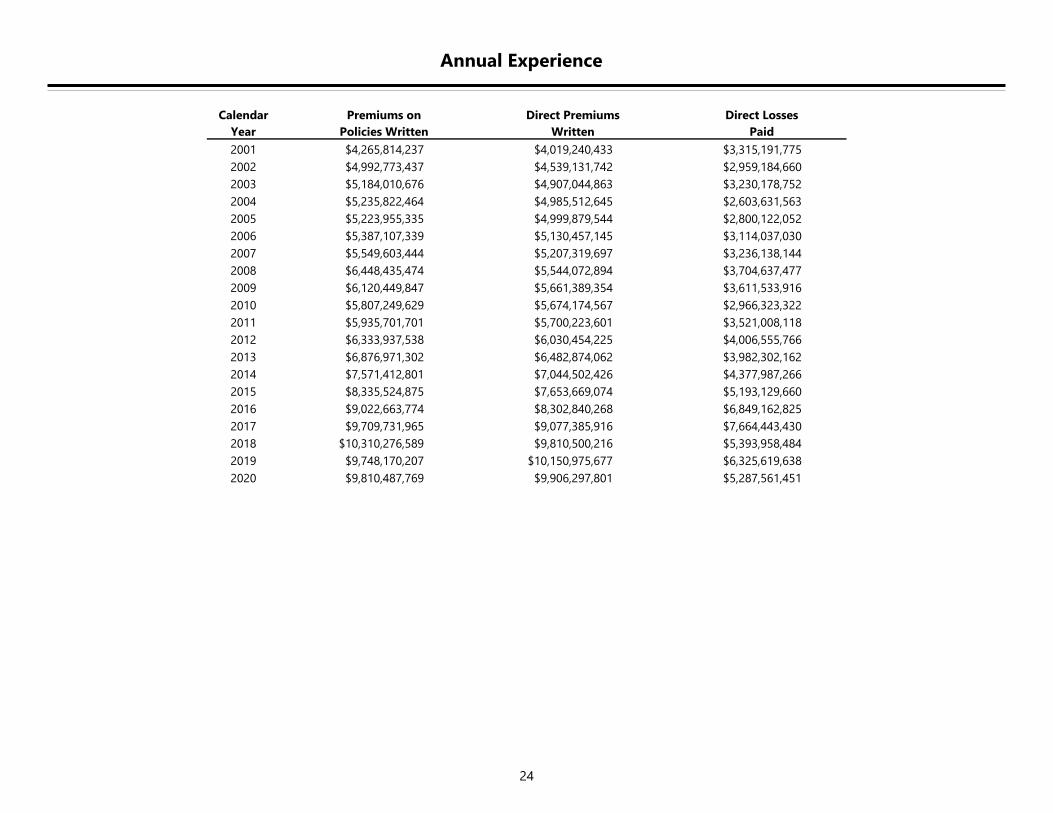
Annual Experience
Calendar Premiums on Direct Premiums Direct Losses
Year Policies Written Written Paid
2001 $4,265,814,237 $4,019,240,433 $3,315,191,775
2002 $4,992,773,437 $4,539,131,742 $2,959,184,660
2003 $5,184,010,676 $4,907,044,863 $3,230,178,752
2004 $5,235,822,464 $4,985,512,645 $2,603,631,563
2005 $5,223,955,335 $4,999,879,544 $2,800,122,052
2006 $5,387,107,339 $5,130,457,145 $3,114,037,030
2007 $5,549,603,444 $5,207,319,697 $3,236,138,144
2008 $6,448,435,474 $5,544,072,894 $3,704,637,477
2009 $6,120,449,847 $5,661,389,354 $3,611,533,916
2010 $5,807,249,629 $5,674,174,567 $2,966,323,322
2011 $5,935,701,701 $5,700,223,601 $3,521,008,118
2012 $6,333,937,538 $6,030,454,225 $4,006,555,766
2013 $6,876,971,302 $6,482,874,062 $3,982,302,162
2014 $7,571,412,801 $7,044,502,426 $4,377,987,266
2015 $8,335,524,875 $7,653,669,074 $5,193,129,660
2016 $9,022,663,774 $8,302,840,268 $6,849,162,825
2017 $9,709,731,965 $9,077,385,916 $7,664,443,430
2018 $10,310,276,589 $9,810,500,216 $5,393,958,484
2019 $9,748,170,207 $10,150,975,677 $6,325,619,638
2020 $9,810,487,769 $9,906,297,801 $5,287,561,451
25
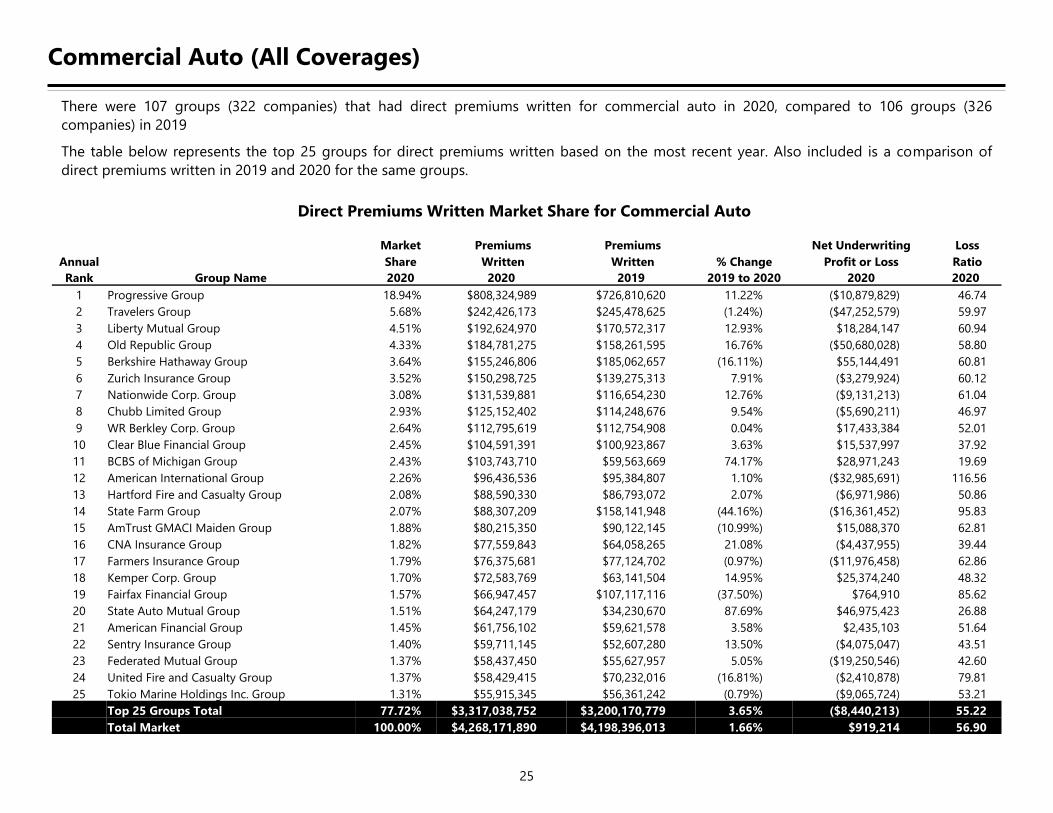
Commercial Auto (All Coverages)
There were 107 groups (322 companies) that had direct premiums written for commercial auto in 2020, compared to 106 groups (326
companies) in 2019
The table below represents the top 25 groups for direct premiums written based on the most recent year. Also included is a comparison of
direct premiums written in 2019 and 2020 for the same groups.
Direct Premiums Written Market Share for Commercial Auto
Market Premiums Premiums Net Underwriting Loss
Annual Share Written Written % Change Profit or Loss Ratio
Rank Group Name 2020 2020 2019 2019 to 2020 2020 2020
1 Progressive Group 18.94% $808,324,989 $726,810,620 11.22% ($10,879,829) 46.74
2 Travelers Group 5.68% $242,426,173 $245,478,625 (1.24%) ($47,252,579) 59.97
3 Liberty Mutual Group 4.51% $192,624,970 $170,572,317 12.93% $18,284,147 60.94
4 Old Republic Group 4.33% $184,781,275 $158,261,595 16.76% ($50,680,028) 58.80
5 Berkshire Hathaway Group 3.64% $155,246,806 $185,062,657 (16.11%) $55,144,491 60.81
6 Zurich Insurance Group 3.52% $150,298,725 $139,275,313 7.91% ($3,279,924) 60.12
7 Nationwide Corp. Group 3.08% $131,539,881 $116,654,230 12.76% ($9,131,213) 61.04
8 Chubb Limited Group 2.93% $125,152,402 $114,248,676 9.54% ($5,690,211) 46.97
9 WR Berkley Corp. Group 2.64% $112,795,619 $112,754,908 0.04% $17,433,384 52.01
10 Clear Blue Financial Group 2.45% $104,591,391 $100,923,867 3.63% $15,537,997 37.92
11 BCBS of Michigan Group 2.43% $103,743,710 $59,563,669 74.17% $28,971,243 19.69
12 American International Group 2.26% $96,436,536 $95,384,807 1.10% ($32,985,691) 116.56
13 Hartford Fire and Casualty Group 2.08% $88,590,330 $86,793,072 2.07% ($6,971,986) 50.86
14 State Farm Group 2.07% $88,307,209 $158,141,948 (44.16%) ($16,361,452) 95.83
15 AmTrust GMACI Maiden Group 1.88% $80,215,350 $90,122,145 (10.99%) $15,088,370 62.81
16 CNA Insurance Group 1.82% $77,559,843 $64,058,265 21.08% ($4,437,955) 39.44
17 Farmers Insurance Group 1.79% $76,375,681 $77,124,702 (0.97%) ($11,976,458) 62.86
18 Kemper Corp. Group 1.70% $72,583,769 $63,141,504 14.95% $25,374,240 48.32
19 Fairfax Financial Group 1.57% $66,947,457 $107,117,116 (37.50%) $764,910 85.62
20 State Auto Mutual Group 1.51% $64,247,179 $34,230,670 87.69% $46,975,423 26.88
21 American Financial Group 1.45% $61,756,102 $59,621,578 3.58% $2,435,103 51.64
22 Sentry Insurance Group 1.40% $59,711,145 $52,607,280 13.50% ($4,075,047) 43.51
23 Federated Mutual Group 1.37% $58,437,450 $55,627,957 5.05% ($19,250,546) 42.60
24 United Fire and Casualty Group 1.37% $58,429,415 $70,232,016 (16.81%) ($2,410,878) 79.81
25 Tokio Marine Holdings Inc. Group 1.31% $55,915,345 $56,361,242 (0.79%) ($9,065,724) 53.21
Top 25 Groups Total 77.72% $3,317,038,752 $3,200,170,779 3.65% ($8,440,213) 55.22
Total Market 100.00% $4,268,171,890 $4,198,396,013 1.66% $919,214 56.90

26
Annual Experience
Earned to Incurred Loss Ratio by Year Based on Annual Statement data from the NAIC: incurred losses (LAE excluded) / earned premium
* 2017 was the first year TDI collected the data in the above table.
Year Loss Ratio
2010 56.6%
2011 58.4%
2012 68.9%
2013 65.7%
2014 66.2%
2015 70.7%
2016 77.6%
2017 82.2%
2018 72.4%
2019 78.7%
Calendar Premiums on Direct Premiums Direct Losses
Year Policies Written* Written* Paid*
2001 — — —
2002 — — —
2003 — — —
2004 — — —
2005 — — —
2006 — — —
2007 — — —
2008 — — —
2009 — — —
2010 — — —
2011 — — —
2012 — — —
2013 — — —
2014 — — —
2015 — — —
2016 — — —
2017 $3,117,380,913 $3,245,433,983 $2,100,495,005
2018 $3,670,383,705 $3,780,087,615 $2,278,115,160
2019 $4,005,706,790 $4,198,396,013 $2,837,193,942
2020 $4,182,812,017 $4,268,171,890 $2,428,752,111
27
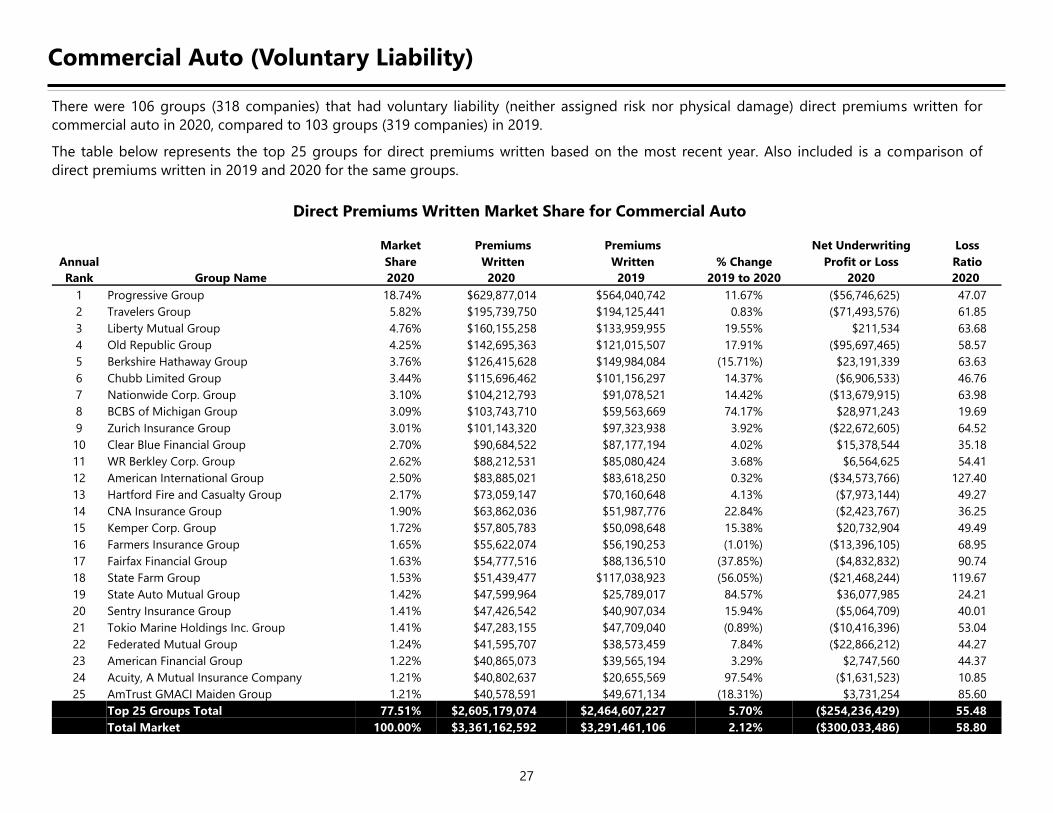
Commercial Auto (Voluntary Liability)
There were 106 groups (318 companies) that had voluntary liability (neither assigned risk nor physical damage) direct premiums written for
commercial auto in 2020, compared to 103 groups (319 companies) in 2019.
The table below represents the top 25 groups for direct premiums written based on the most recent year. Also included is a comparison of
direct premiums written in 2019 and 2020 for the same groups.
Direct Premiums Written Market Share for Commercial Auto
Market Premiums Premiums Net Underwriting Loss
Annual Share Written Written % Change Profit or Loss Ratio
Rank Group Name 2020 2020 2019 2019 to 2020 2020 2020
1 Progressive Group 18.74% $629,877,014 $564,040,742 11.67% ($56,746,625) 47.07
2 Travelers Group 5.82% $195,739,750 $194,125,441 0.83% ($71,493,576) 61.85
3 Liberty Mutual Group 4.76% $160,155,258 $133,959,955 19.55% $211,534 63.68
4 Old Republic Group 4.25% $142,695,363 $121,015,507 17.91% ($95,697,465) 58.57
5 Berkshire Hathaway Group 3.76% $126,415,628 $149,984,084 (15.71%) $23,191,339 63.63
6 Chubb Limited Group 3.44% $115,696,462 $101,156,297 14.37% ($6,906,533) 46.76
7 Nationwide Corp. Group 3.10% $104,212,793 $91,078,521 14.42% ($13,679,915) 63.98
8 BCBS of Michigan Group 3.09% $103,743,710 $59,563,669 74.17% $28,971,243 19.69
9 Zurich Insurance Group 3.01% $101,143,320 $97,323,938 3.92% ($22,672,605) 64.52
10 Clear Blue Financial Group 2.70% $90,684,522 $87,177,194 4.02% $15,378,544 35.18
11 WR Berkley Corp. Group 2.62% $88,212,531 $85,080,424 3.68% $6,564,625 54.41
12 American International Group 2.50% $83,885,021 $83,618,250 0.32% ($34,573,766) 127.40
13 Hartford Fire and Casualty Group 2.17% $73,059,147 $70,160,648 4.13% ($7,973,144) 49.27
14 CNA Insurance Group 1.90% $63,862,036 $51,987,776 22.84% ($2,423,767) 36.25
15 Kemper Corp. Group 1.72% $57,805,783 $50,098,648 15.38% $20,732,904 49.49
16 Farmers Insurance Group 1.65% $55,622,074 $56,190,253 (1.01%) ($13,396,105) 68.95
17 Fairfax Financial Group 1.63% $54,777,516 $88,136,510 (37.85%) ($4,832,832) 90.74
18 State Farm Group 1.53% $51,439,477 $117,038,923 (56.05%) ($21,468,244) 119.67
19 State Auto Mutual Group 1.42% $47,599,964 $25,789,017 84.57% $36,077,985 24.21
20 Sentry Insurance Group 1.41% $47,426,542 $40,907,034 15.94% ($5,064,709) 40.01
21 Tokio Marine Holdings Inc. Group 1.41% $47,283,155 $47,709,040 (0.89%) ($10,416,396) 53.04
22 Federated Mutual Group 1.24% $41,595,707 $38,573,459 7.84% ($22,866,212) 44.27
23 American Financial Group 1.22% $40,865,073 $39,565,194 3.29% $2,747,560 44.37
24 Acuity, A Mutual Insurance Company 1.21% $40,802,637 $20,655,569 97.54% ($1,631,523) 10.85
25 AmTrust GMACI Maiden Group 1.21% $40,578,591 $49,671,134 (18.31%) $3,731,254 85.60
Top 25 Groups Total 77.51% $2,605,179,074 $2,464,607,227 5.70% ($254,236,429) 55.48
Total Market 100.00% $3,361,162,592 $3,291,461,106 2.12% ($300,033,486) 58.80
28
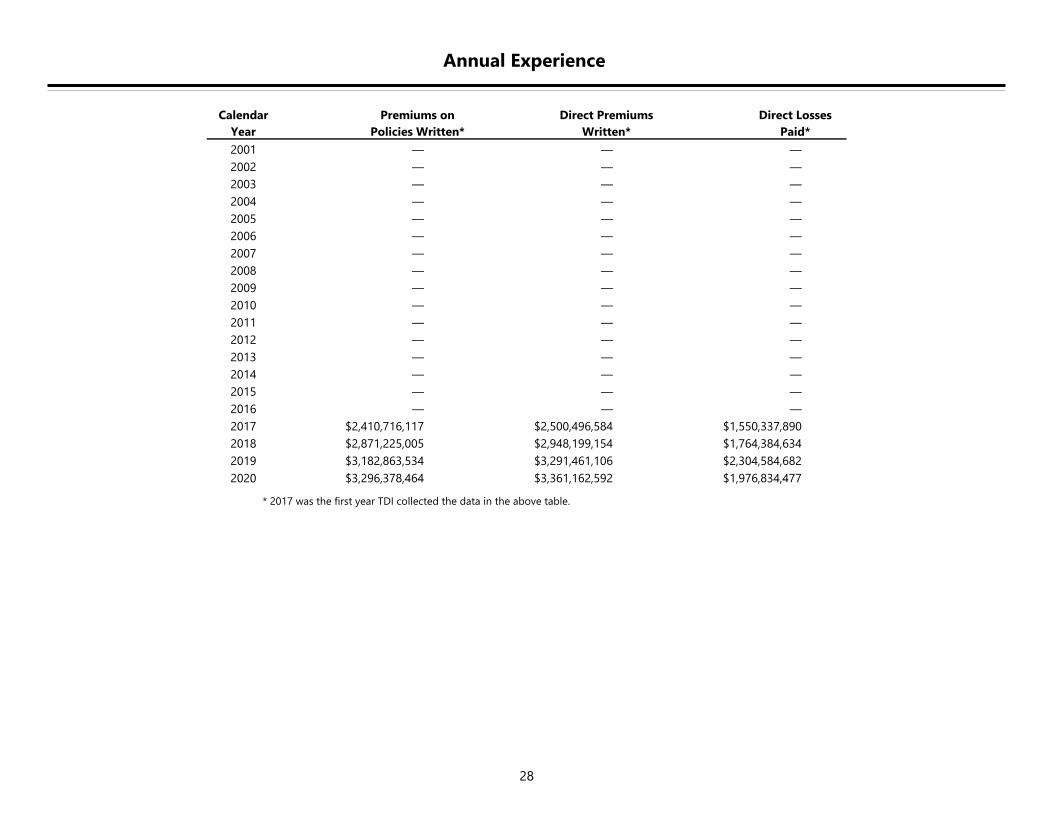
Annual Experience
* 2017 was the first year TDI collected the data in the above table.
Calendar Premiums on Direct Premiums Direct Losses
Year Policies Written* Written* Paid*
2001 — — —
2002 — — —
2003 — — —
2004 — — —
2005 — — —
2006 — — —
2007 — — —
2008 — — —
2009 — — —
2010 — — —
2011 — — —
2012 — — —
2013 — — —
2014 — — —
2015 — — —
2016 — — —
2017 $2,410,716,117 $2,500,496,584 $1,550,337,890
2018 $2,871,225,005 $2,948,199,154 $1,764,384,634
2019 $3,182,863,534 $3,291,461,106 $2,304,584,682
2020 $3,296,378,464 $3,361,162,592 $1,976,834,477
29
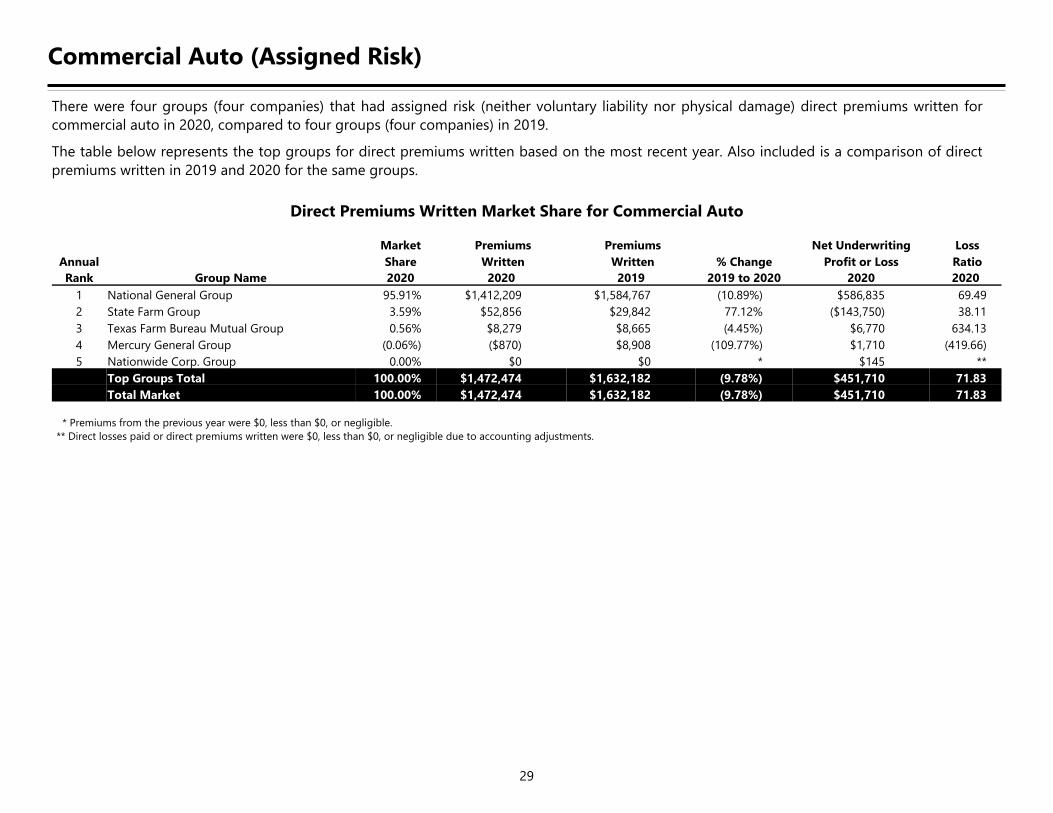
Commercial Auto (Assigned Risk)
There were four groups (four companies) that had assigned risk (neither voluntary liability nor physical damage) direct premiums written for
commercial auto in 2020, compared to four groups (four companies) in 2019.
The table below represents the top groups for direct premiums written based on the most recent year. Also included is a comparison of direct
premiums written in 2019 and 2020 for the same groups.
Direct Premiums Written Market Share for Commercial Auto
* Premiums from the previous year were $0, less than $0, or negligible.
** Direct losses paid or direct premiums written were $0, less than $0, or negligible due to accounting adjustments.
Market Premiums Premiums Net Underwriting Loss
Annual Share Written Written % Change Profit or Loss Ratio
Rank Group Name 2020 2020 2019 2019 to 2020 2020 2020
1 National General Group 95.91% $1,412,209 $1,584,767 (10.89%) $586,835 69.49
2 State Farm Group 3.59% $52,856 $29,842 77.12% ($143,750) 38.11
3 Texas Farm Bureau Mutual Group 0.56% $8,279 $8,665 (4.45%) $6,770 634.13
4 Mercury General Group (0.06%) ($870) $8,908 (109.77%) $1,710 (419.66)
5 Nationwide Corp. Group 0.00% $0 $0 * $145 **
Top Groups Total 100.00% $1,472,474 $1,632,182 (9.78%) $451,710 71.83
Total Market 100.00% $1,472,474 $1,632,182 (9.78%) $451,710 71.83
30
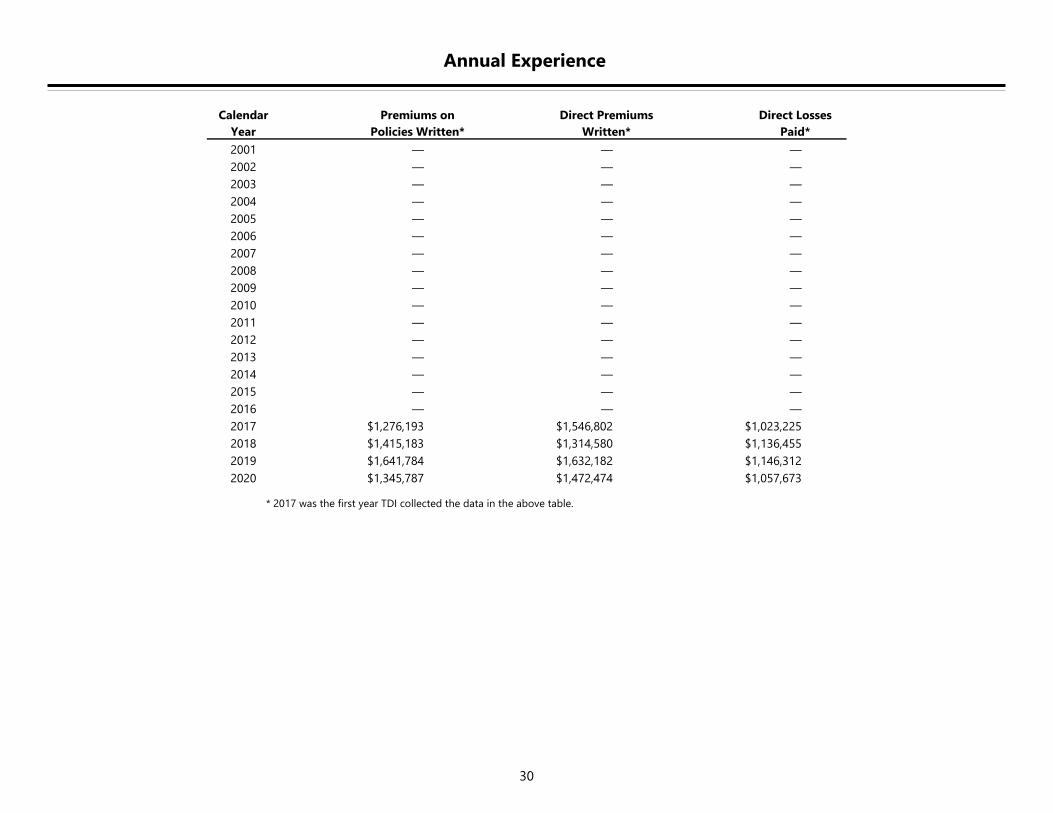
Annual Experience
* 2017 was the first year TDI collected the data in the above table.
Calendar Premiums on Direct Premiums Direct Losses
Year Policies Written* Written* Paid*
2001 — — —
2002 — — —
2003 — — —
2004 — — —
2005 — — —
2006 — — —
2007 — — —
2008 — — —
2009 — — —
2010 — — —
2011 — — —
2012 — — —
2013 — — —
2014 — — —
2015 — — —
2016 — — —
2017 $1,276,193 $1,546,802 $1,023,225
2018 $1,415,183 $1,314,580 $1,136,455
2019 $1,641,784 $1,632,182 $1,146,312
2020 $1,345,787 $1,472,474 $1,057,673
31
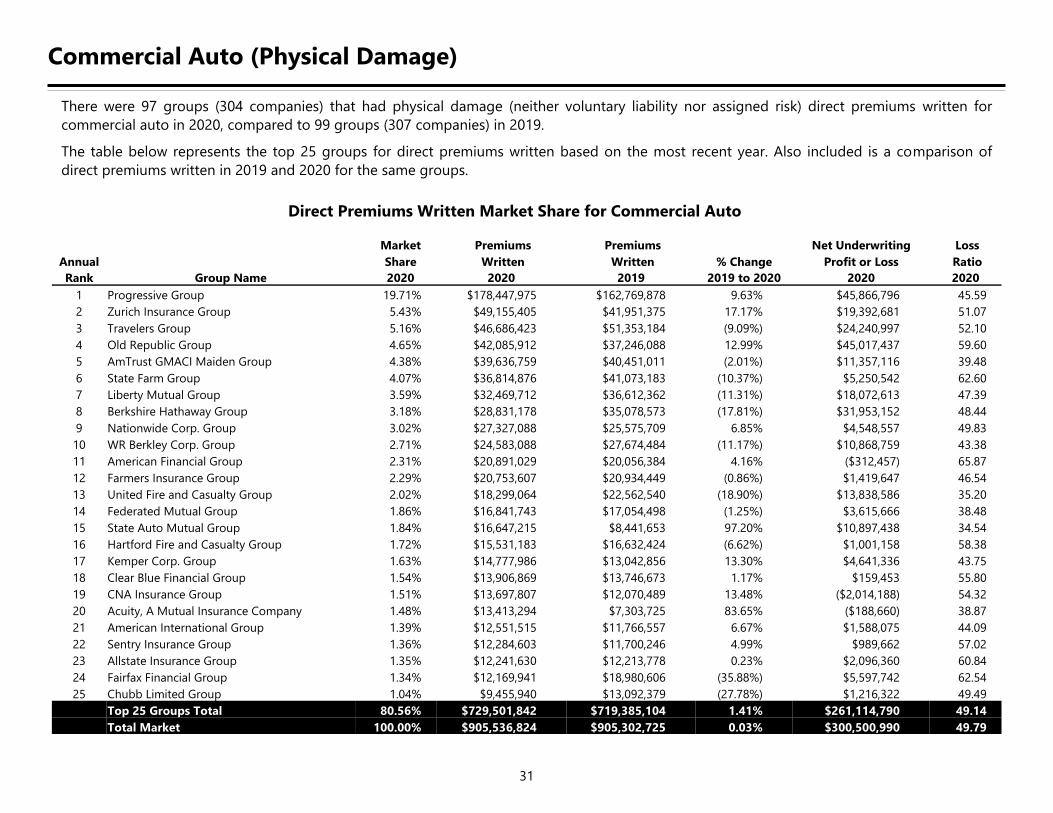
Commercial Auto (Physical Damage)
There were 97 groups (304 companies) that had physical damage (neither voluntary liability nor assigned risk) direct premiums written for
commercial auto in 2020, compared to 99 groups (307 companies) in 2019.
The table below represents the top 25 groups for direct premiums written based on the most recent year. Also included is a comparison of
direct premiums written in 2019 and 2020 for the same groups.
Direct Premiums Written Market Share for Commercial Auto
Market Premiums Premiums Net Underwriting Loss
Annual Share Written Written % Change Profit or Loss Ratio
Rank Group Name 2020 2020 2019 2019 to 2020 2020 2020
1 Progressive Group 19.71% $178,447,975 $162,769,878 9.63% $45,866,796 45.59
2 Zurich Insurance Group 5.43% $49,155,405 $41,951,375 17.17% $19,392,681 51.07
3 Travelers Group 5.16% $46,686,423 $51,353,184 (9.09%) $24,240,997 52.10
4 Old Republic Group 4.65% $42,085,912 $37,246,088 12.99% $45,017,437 59.60
5 AmTrust GMACI Maiden Group 4.38% $39,636,759 $40,451,011 (2.01%) $11,357,116 39.48
6 State Farm Group 4.07% $36,814,876 $41,073,183 (10.37%) $5,250,542 62.60
7 Liberty Mutual Group 3.59% $32,469,712 $36,612,362 (11.31%) $18,072,613 47.39
8 Berkshire Hathaway Group 3.18% $28,831,178 $35,078,573 (17.81%) $31,953,152 48.44
9 Nationwide Corp. Group 3.02% $27,327,088 $25,575,709 6.85% $4,548,557 49.83
10 WR Berkley Corp. Group 2.71% $24,583,088 $27,674,484 (11.17%) $10,868,759 43.38
11 American Financial Group 2.31% $20,891,029 $20,056,384 4.16% ($312,457) 65.87
12 Farmers Insurance Group 2.29% $20,753,607 $20,934,449 (0.86%) $1,419,647 46.54
13 United Fire and Casualty Group 2.02% $18,299,064 $22,562,540 (18.90%) $13,838,586 35.20
14 Federated Mutual Group 1.86% $16,841,743 $17,054,498 (1.25%) $3,615,666 38.48
15 State Auto Mutual Group 1.84% $16,647,215 $8,441,653 97.20% $10,897,438 34.54
16 Hartford Fire and Casualty Group 1.72% $15,531,183 $16,632,424 (6.62%) $1,001,158 58.38
17 Kemper Corp. Group 1.63% $14,777,986 $13,042,856 13.30% $4,641,336 43.75
18 Clear Blue Financial Group 1.54% $13,906,869 $13,746,673 1.17% $159,453 55.80
19 CNA Insurance Group 1.51% $13,697,807 $12,070,489 13.48% ($2,014,188) 54.32
20 Acuity, A Mutual Insurance Company 1.48% $13,413,294 $7,303,725 83.65% ($188,660) 38.87
21 American International Group 1.39% $12,551,515 $11,766,557 6.67% $1,588,075 44.09
22 Sentry Insurance Group 1.36% $12,284,603 $11,700,246 4.99% $989,662 57.02
23 Allstate Insurance Group 1.35% $12,241,630 $12,213,778 0.23% $2,096,360 60.84
24 Fairfax Financial Group 1.34% $12,169,941 $18,980,606 (35.88%) $5,597,742 62.54
25 Chubb Limited Group 1.04% $9,455,940 $13,092,379 (27.78%) $1,216,322 49.49
Top 25 Groups Total 80.56% $729,501,842 $719,385,104 1.41% $261,114,790 49.14
Total Market 100.00% $905,536,824 $905,302,725 0.03% $300,500,990 49.79
32
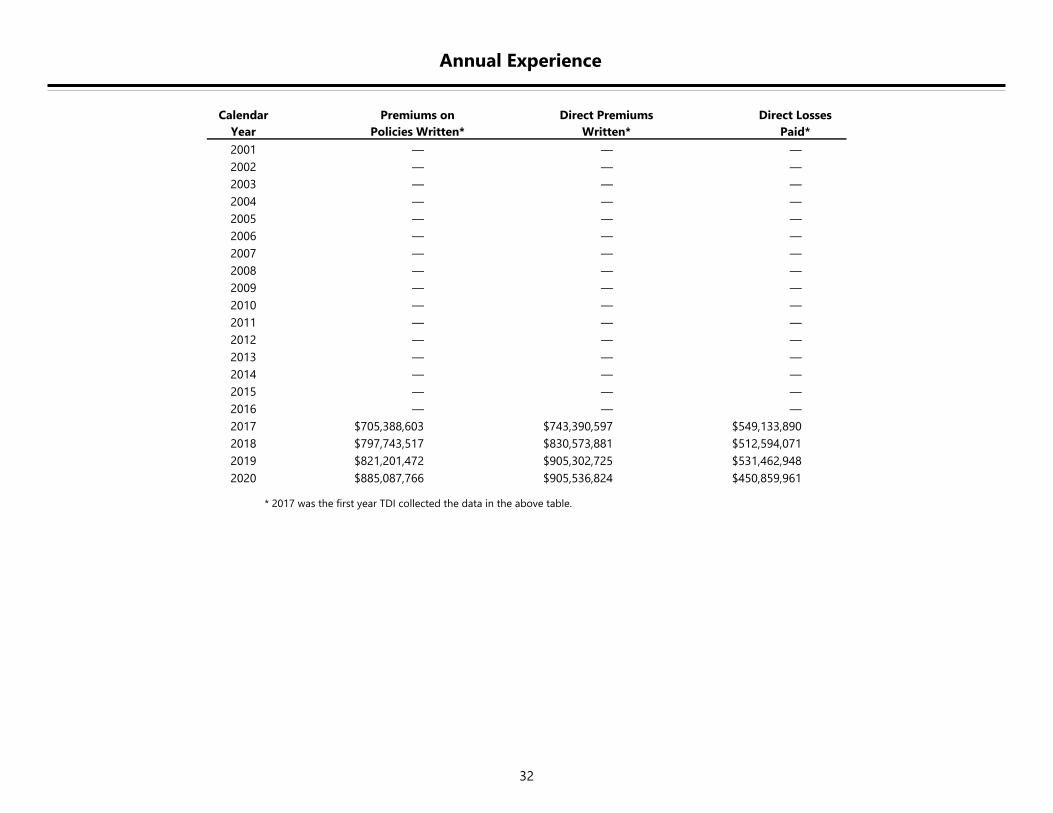
Annual Experience
* 2017 was the first year TDI collected the data in the above table.
Calendar Premiums on Direct Premiums Direct Losses
Year Policies Written* Written* Paid*
2001 — — —
2002 — — —
2003 — — —
2004 — — —
2005 — — —
2006 — — —
2007 — — —
2008 — — —
2009 — — —
2010 — — —
2011 — — —
2012 — — —
2013 — — —
2014 — — —
2015 — — —
2016 — — —
2017 $705,388,603 $743,390,597 $549,133,890
2018 $797,743,517 $830,573,881 $512,594,071
2019 $821,201,472 $905,302,725 $531,462,948
2020 $885,087,766 $905,536,824 $450,859,961
33
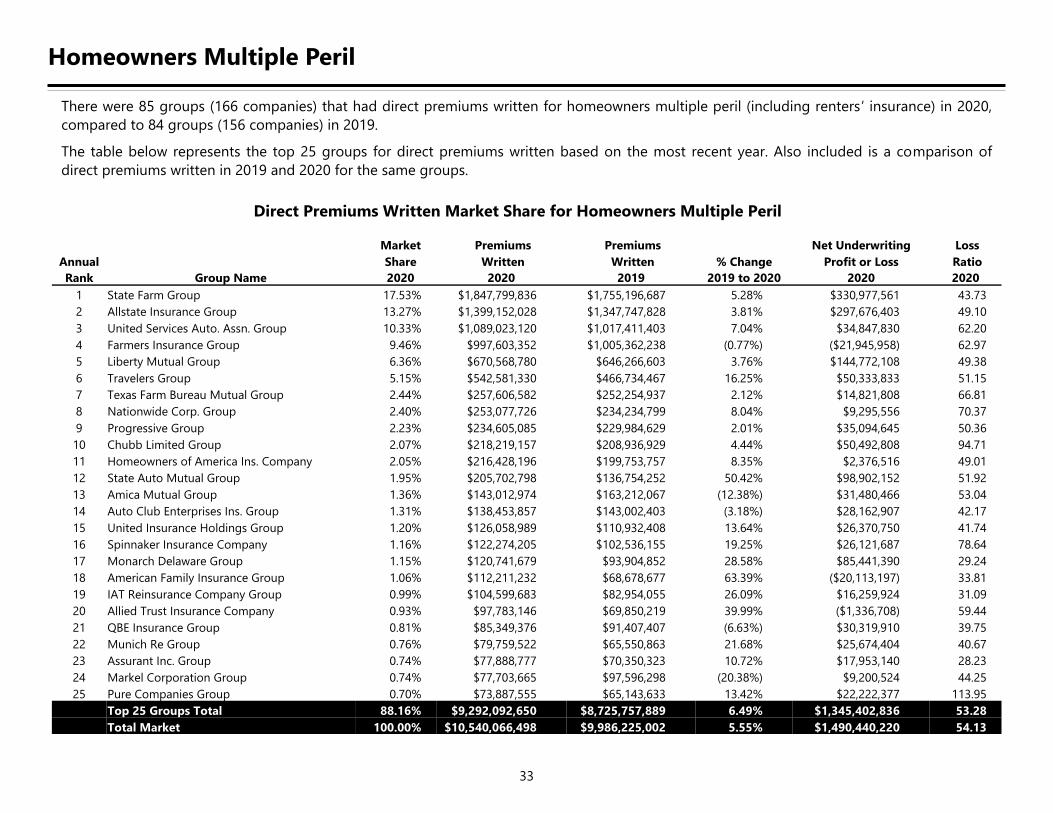
Homeowners Multiple Peril
There were 85 groups (166 companies) that had direct premiums written for homeowners multiple peril (including renters’ insurance) in 2020,
compared to 84 groups (156 companies) in 2019.
The table below represents the top 25 groups for direct premiums written based on the most recent year. Also included is a comparison of
direct premiums written in 2019 and 2020 for the same groups.
Direct Premiums Written Market Share for Homeowners Multiple Peril
Market Premiums Premiums Net Underwriting Loss
Annual Share Written Written % Change Profit or Loss Ratio
Rank Group Name 2020 2020 2019 2019 to 2020 2020 2020
1 State Farm Group 17.53% $1,847,799,836 $1,755,196,687 5.28% $330,977,561 43.73
2 Allstate Insurance Group 13.27% $1,399,152,028 $1,347,747,828 3.81% $297,676,403 49.10
3 United Services Auto. Assn. Group 10.33% $1,089,023,120 $1,017,411,403 7.04% $34,847,830 62.20
4 Farmers Insurance Group 9.46% $997,603,352 $1,005,362,238 (0.77%) ($21,945,958) 62.97
5 Liberty Mutual Group 6.36% $670,568,780 $646,266,603 3.76% $144,772,108 49.38
6 Travelers Group 5.15% $542,581,330 $466,734,467 16.25% $50,333,833 51.15
7 Texas Farm Bureau Mutual Group 2.44% $257,606,582 $252,254,937 2.12% $14,821,808 66.81
8 Nationwide Corp. Group 2.40% $253,077,726 $234,234,799 8.04% $9,295,556 70.37
9 Progressive Group 2.23% $234,605,085 $229,984,629 2.01% $35,094,645 50.36
10 Chubb Limited Group 2.07% $218,219,157 $208,936,929 4.44% $50,492,808 94.71
11 Homeowners of America Ins. Company 2.05% $216,428,196 $199,753,757 8.35% $2,376,516 49.01
12 State Auto Mutual Group 1.95% $205,702,798 $136,754,252 50.42% $98,902,152 51.92
13 Amica Mutual Group 1.36% $143,012,974 $163,212,067 (12.38%) $31,480,466 53.04
14 Auto Club Enterprises Ins. Group 1.31% $138,453,857 $143,002,403 (3.18%) $28,162,907 42.17
15 United Insurance Holdings Group 1.20% $126,058,989 $110,932,408 13.64% $26,370,750 41.74
16 Spinnaker Insurance Company 1.16% $122,274,205 $102,536,155 19.25% $26,121,687 78.64
17 Monarch Delaware Group 1.15% $120,741,679 $93,904,852 28.58% $85,441,390 29.24
18 American Family Insurance Group 1.06% $112,211,232 $68,678,677 63.39% ($20,113,197) 33.81
19 IAT Reinsurance Company Group 0.99% $104,599,683 $82,954,055 26.09% $16,259,924 31.09
20 Allied Trust Insurance Company 0.93% $97,783,146 $69,850,219 39.99% ($1,336,708) 59.44
21 QBE Insurance Group 0.81% $85,349,376 $91,407,407 (6.63%) $30,319,910 39.75
22 Munich Re Group 0.76% $79,759,522 $65,550,863 21.68% $25,674,404 40.67
23 Assurant Inc. Group 0.74% $77,888,777 $70,350,323 10.72% $17,953,140 28.23
24 Markel Corporation Group 0.74% $77,703,665 $97,596,298 (20.38%) $9,200,524 44.25
25 Pure Companies Group 0.70% $73,887,555 $65,143,633 13.42% $22,222,377 113.95
Top 25 Groups Total 88.16% $9,292,092,650 $8,725,757,889 6.49% $1,345,402,836 53.28
Total Market 100.00% $10,540,066,498 $9,986,225,002 5.55% $1,490,440,220 54.13
34
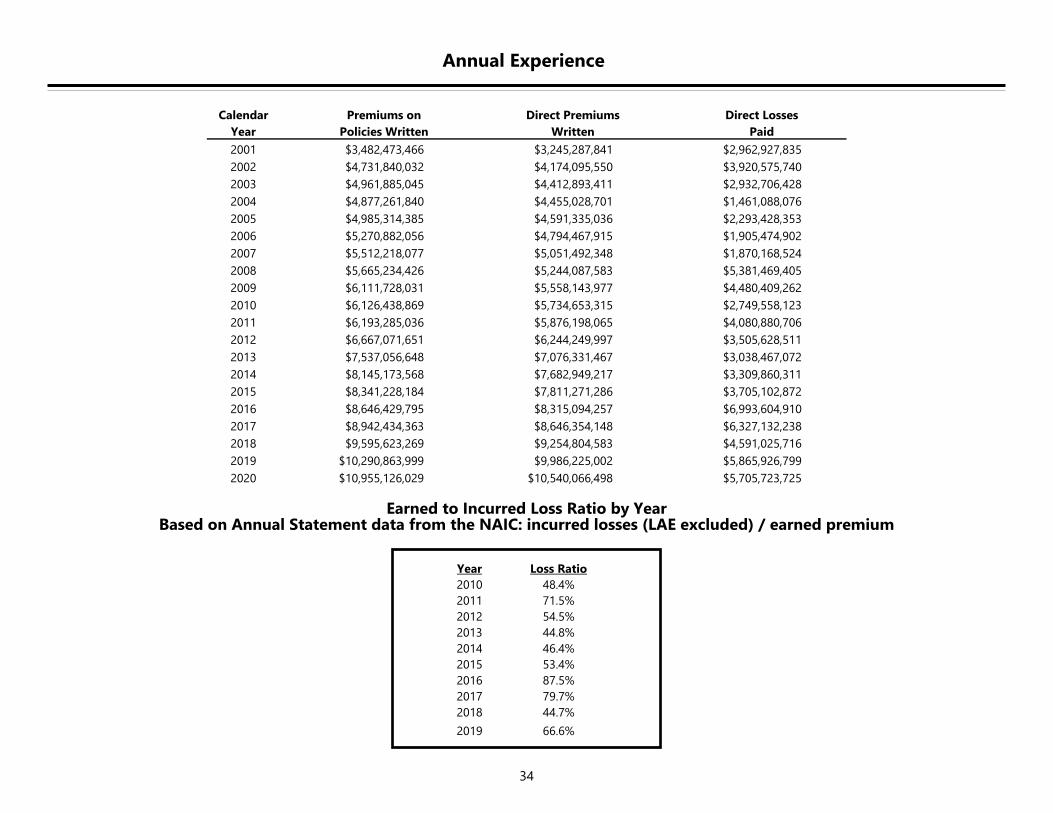
Annual Experience
Earned to Incurred Loss Ratio by Year Based on Annual Statement data from the NAIC: incurred losses (LAE excluded) / earned premium
Year Loss Ratio
2010 48.4%
2011 71.5%
2012 54.5%
2013 44.8%
2014 46.4%
2015 53.4%
2016 87.5%
2017 79.7%
2018 44.7%
2019 66.6%
Calendar Premiums on Direct Premiums Direct Losses
Year Policies Written Written Paid
2001 $3,482,473,466 $3,245,287,841 $2,962,927,835
2002 $4,731,840,032 $4,174,095,550 $3,920,575,740
2003 $4,961,885,045 $4,412,893,411 $2,932,706,428
2004 $4,877,261,840 $4,455,028,701 $1,461,088,076
2005 $4,985,314,385 $4,591,335,036 $2,293,428,353
2006 $5,270,882,056 $4,794,467,915 $1,905,474,902
2007 $5,512,218,077 $5,051,492,348 $1,870,168,524
2008 $5,665,234,426 $5,244,087,583 $5,381,469,405
2009 $6,111,728,031 $5,558,143,977 $4,480,409,262
2010 $6,126,438,869 $5,734,653,315 $2,749,558,123
2011 $6,193,285,036 $5,876,198,065 $4,080,880,706
2012 $6,667,071,651 $6,244,249,997 $3,505,628,511
2013 $7,537,056,648 $7,076,331,467 $3,038,467,072
2014 $8,145,173,568 $7,682,949,217 $3,309,860,311
2015 $8,341,228,184 $7,811,271,286 $3,705,102,872
2016 $8,646,429,795 $8,315,094,257 $6,993,604,910
2017 $8,942,434,363 $8,646,354,148 $6,327,132,238
2018 $9,595,623,269 $9,254,804,583 $4,591,025,716
2019 $10,290,863,999 $9,986,225,002 $5,865,926,799
2020 $10,955,126,029 $10,540,066,498 $5,705,723,725
35
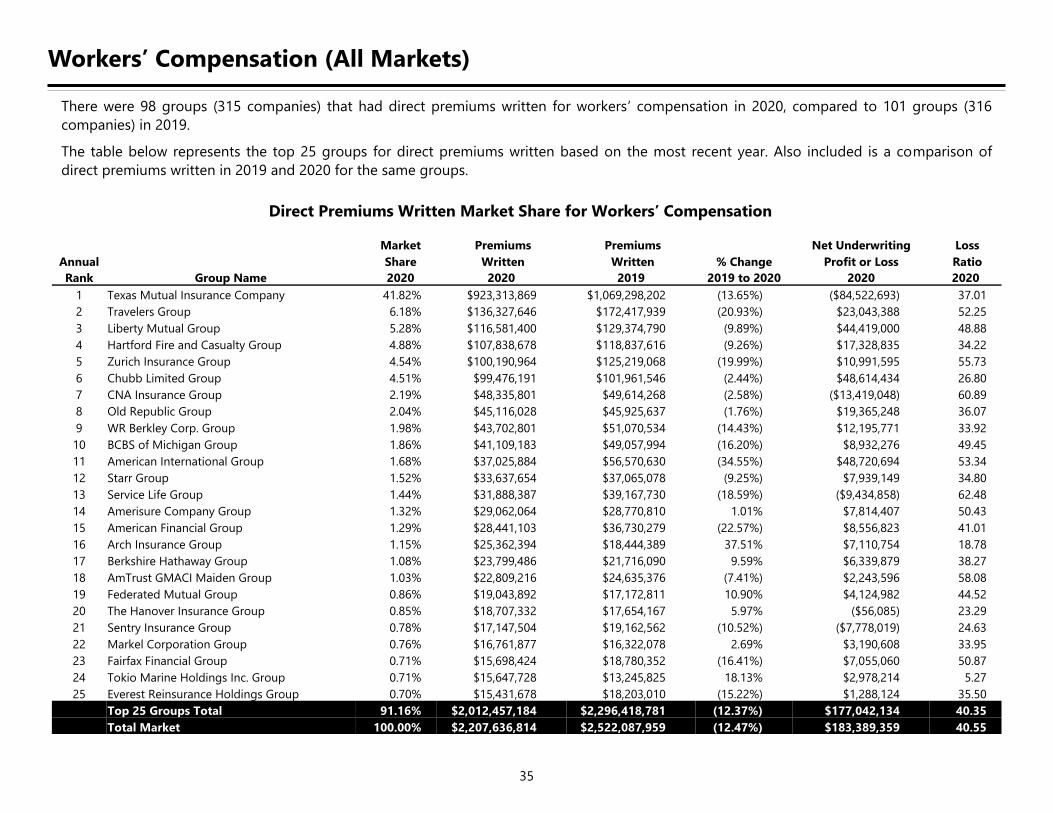
Workers’ Compensation (All Markets)
There were 98 groups (315 companies) that had direct premiums written for workers’ compensation in 2020, compared to 101 groups (316
companies) in 2019.
The table below represents the top 25 groups for direct premiums written based on the most recent year. Also included is a comparison of
direct premiums written in 2019 and 2020 for the same groups.
Direct Premiums Written Market Share for Workers’ Compensation
Market Premiums Premiums Net Underwriting Loss
Annual Share Written Written % Change Profit or Loss Ratio
Rank Group Name 2020 2020 2019 2019 to 2020 2020 2020
1 Texas Mutual Insurance Company 41.82% $923,313,869 $1,069,298,202 (13.65%) ($84,522,693) 37.01
2 Travelers Group 6.18% $136,327,646 $172,417,939 (20.93%) $23,043,388 52.25
3 Liberty Mutual Group 5.28% $116,581,400 $129,374,790 (9.89%) $44,419,000 48.88
4 Hartford Fire and Casualty Group 4.88% $107,838,678 $118,837,616 (9.26%) $17,328,835 34.22
5 Zurich Insurance Group 4.54% $100,190,964 $125,219,068 (19.99%) $10,991,595 55.73
6 Chubb Limited Group 4.51% $99,476,191 $101,961,546 (2.44%) $48,614,434 26.80
7 CNA Insurance Group 2.19% $48,335,801 $49,614,268 (2.58%) ($13,419,048) 60.89
8 Old Republic Group 2.04% $45,116,028 $45,925,637 (1.76%) $19,365,248 36.07
9 WR Berkley Corp. Group 1.98% $43,702,801 $51,070,534 (14.43%) $12,195,771 33.92
10 BCBS of Michigan Group 1.86% $41,109,183 $49,057,994 (16.20%) $8,932,276 49.45
11 American International Group 1.68% $37,025,884 $56,570,630 (34.55%) $48,720,694 53.34
12 Starr Group 1.52% $33,637,654 $37,065,078 (9.25%) $7,939,149 34.80
13 Service Life Group 1.44% $31,888,387 $39,167,730 (18.59%) ($9,434,858) 62.48
14 Amerisure Company Group 1.32% $29,062,064 $28,770,810 1.01% $7,814,407 50.43
15 American Financial Group 1.29% $28,441,103 $36,730,279 (22.57%) $8,556,823 41.01
16 Arch Insurance Group 1.15% $25,362,394 $18,444,389 37.51% $7,110,754 18.78
17 Berkshire Hathaway Group 1.08% $23,799,486 $21,716,090 9.59% $6,339,879 38.27
18 AmTrust GMACI Maiden Group 1.03% $22,809,216 $24,635,376 (7.41%) $2,243,596 58.08
19 Federated Mutual Group 0.86% $19,043,892 $17,172,811 10.90% $4,124,982 44.52
20 The Hanover Insurance Group 0.85% $18,707,332 $17,654,167 5.97% ($56,085) 23.29
21 Sentry Insurance Group 0.78% $17,147,504 $19,162,562 (10.52%) ($7,778,019) 24.63
22 Markel Corporation Group 0.76% $16,761,877 $16,322,078 2.69% $3,190,608 33.95
23 Fairfax Financial Group 0.71% $15,698,424 $18,780,352 (16.41%) $7,055,060 50.87
24 Tokio Marine Holdings Inc. Group 0.71% $15,647,728 $13,245,825 18.13% $2,978,214 5.27
25 Everest Reinsurance Holdings Group 0.70% $15,431,678 $18,203,010 (15.22%) $1,288,124 35.50
Top 25 Groups Total 91.16% $2,012,457,184 $2,296,418,781 (12.37%) $177,042,134 40.35
Total Market 100.00% $2,207,636,814 $2,522,087,959 (12.47%) $183,389,359 40.55
36
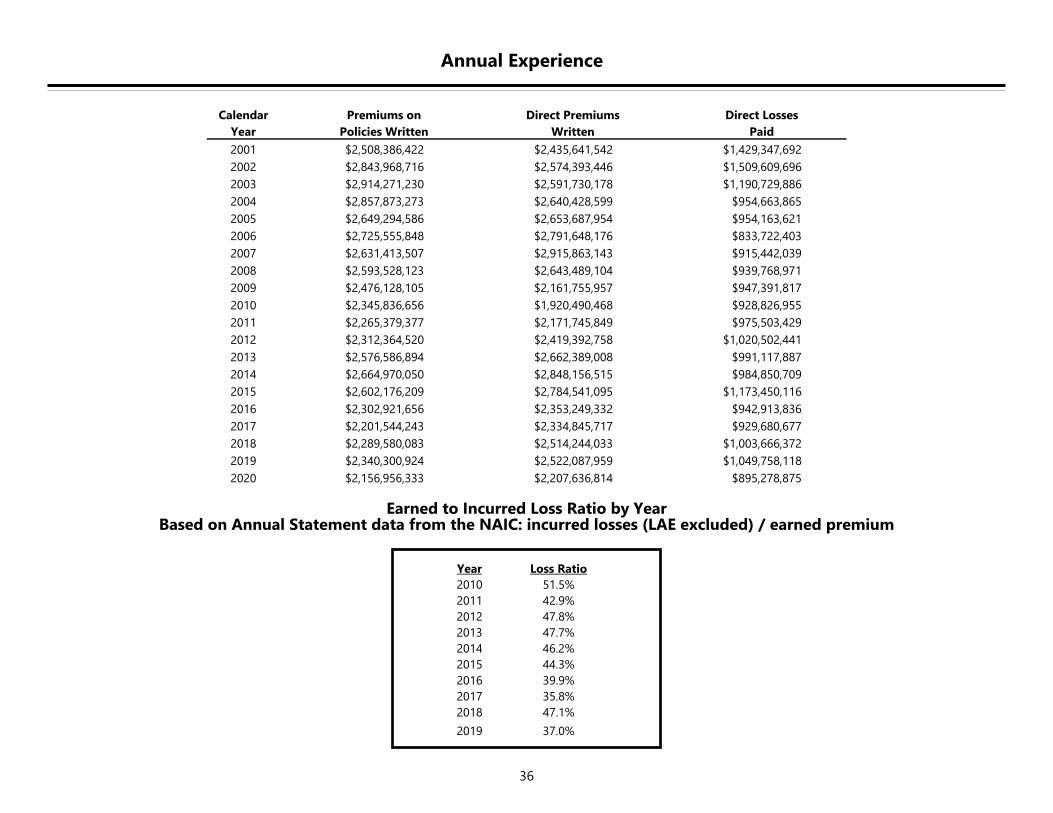
Annual Experience
Earned to Incurred Loss Ratio by Year Based on Annual Statement data from the NAIC: incurred losses (LAE excluded) / earned premium
Year Loss Ratio
2010 51.5%
2011 42.9%
2012 47.8%
2013 47.7%
2014 46.2%
2015 44.3%
2016 39.9%
2017 35.8%
2018 47.1%
2019 37.0%
Calendar Premiums on Direct Premiums Direct Losses
Year Policies Written Written Paid
2001 $2,508,386,422 $2,435,641,542 $1,429,347,692
2002 $2,843,968,716 $2,574,393,446 $1,509,609,696
2003 $2,914,271,230 $2,591,730,178 $1,190,729,886
2004 $2,857,873,273 $2,640,428,599 $954,663,865
2005 $2,649,294,586 $2,653,687,954 $954,163,621
2006 $2,725,555,848 $2,791,648,176 $833,722,403
2007 $2,631,413,507 $2,915,863,143 $915,442,039
2008 $2,593,528,123 $2,643,489,104 $939,768,971
2009 $2,476,128,105 $2,161,755,957 $947,391,817
2010 $2,345,836,656 $1,920,490,468 $928,826,955
2011 $2,265,379,377 $2,171,745,849 $975,503,429
2012 $2,312,364,520 $2,419,392,758 $1,020,502,441
2013 $2,576,586,894 $2,662,389,008 $991,117,887
2014 $2,664,970,050 $2,848,156,515 $984,850,709
2015 $2,602,176,209 $2,784,541,095 $1,173,450,116
2016 $2,302,921,656 $2,353,249,332 $942,913,836
2017 $2,201,544,243 $2,334,845,717 $929,680,677
2018 $2,289,580,083 $2,514,244,033 $1,003,666,372
2019 $2,340,300,924 $2,522,087,959 $1,049,758,118
2020 $2,156,956,333 $2,207,636,814 $895,278,875
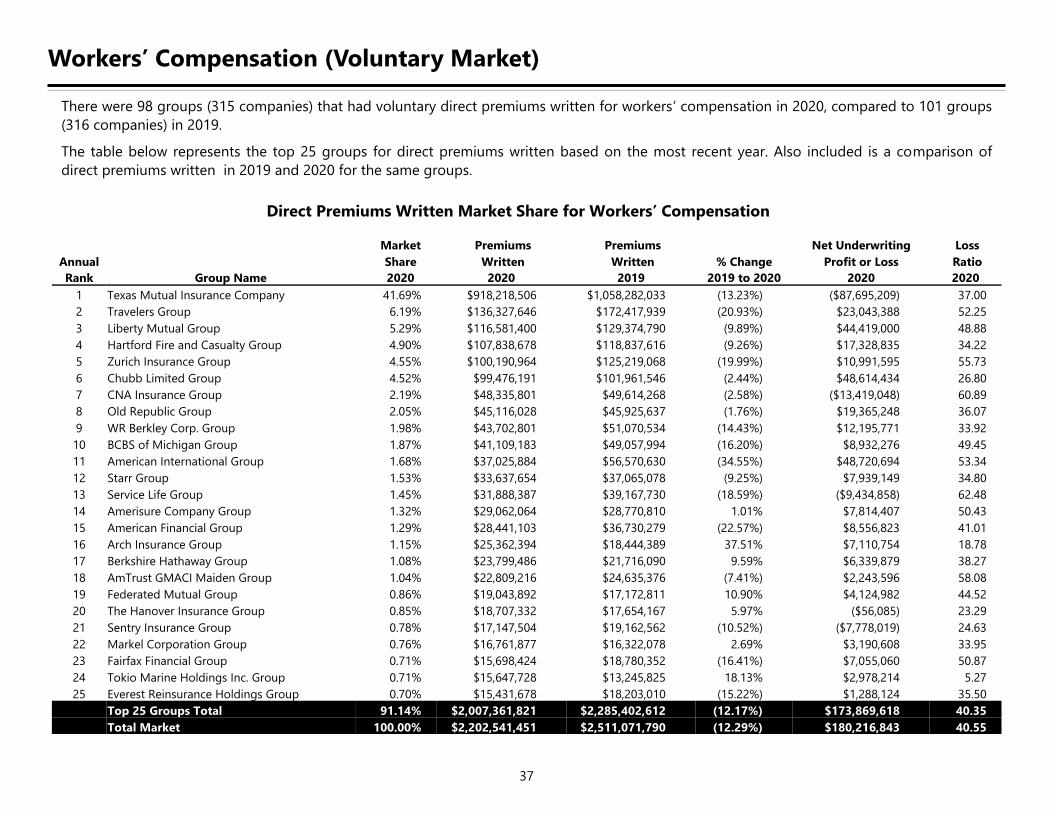
37
Workers’ Compensation (Voluntary Market)
There were 98 groups (315 companies) that had voluntary direct premiums written for workers’ compensation in 2020, compared to 101 groups
(316 companies) in 2019.
The table below represents the top 25 groups for direct premiums written based on the most recent year. Also included is a comparison of
direct premiums written in 2019 and 2020 for the same groups.
Direct Premiums Written Market Share for Workers’ Compensation
Market Premiums Premiums Net Underwriting Loss
Annual Share Written Written % Change Profit or Loss Ratio
Rank Group Name 2020 2020 2019 2019 to 2020 2020 2020
1 Texas Mutual Insurance Company 41.69% $918,218,506 $1,058,282,033 (13.23%) ($87,695,209) 37.00
2 Travelers Group 6.19% $136,327,646 $172,417,939 (20.93%) $23,043,388 52.25
3 Liberty Mutual Group 5.29% $116,581,400 $129,374,790 (9.89%) $44,419,000 48.88
4 Hartford Fire and Casualty Group 4.90% $107,838,678 $118,837,616 (9.26%) $17,328,835 34.22
5 Zurich Insurance Group 4.55% $100,190,964 $125,219,068 (19.99%) $10,991,595 55.73
6 Chubb Limited Group 4.52% $99,476,191 $101,961,546 (2.44%) $48,614,434 26.80
7 CNA Insurance Group 2.19% $48,335,801 $49,614,268 (2.58%) ($13,419,048) 60.89
8 Old Republic Group 2.05% $45,116,028 $45,925,637 (1.76%) $19,365,248 36.07
9 WR Berkley Corp. Group 1.98% $43,702,801 $51,070,534 (14.43%) $12,195,771 33.92
10 BCBS of Michigan Group 1.87% $41,109,183 $49,057,994 (16.20%) $8,932,276 49.45
11 American International Group 1.68% $37,025,884 $56,570,630 (34.55%) $48,720,694 53.34
12 Starr Group 1.53% $33,637,654 $37,065,078 (9.25%) $7,939,149 34.80
13 Service Life Group 1.45% $31,888,387 $39,167,730 (18.59%) ($9,434,858) 62.48
14 Amerisure Company Group 1.32% $29,062,064 $28,770,810 1.01% $7,814,407 50.43
15 American Financial Group 1.29% $28,441,103 $36,730,279 (22.57%) $8,556,823 41.01
16 Arch Insurance Group 1.15% $25,362,394 $18,444,389 37.51% $7,110,754 18.78
17 Berkshire Hathaway Group 1.08% $23,799,486 $21,716,090 9.59% $6,339,879 38.27
18 AmTrust GMACI Maiden Group 1.04% $22,809,216 $24,635,376 (7.41%) $2,243,596 58.08
19 Federated Mutual Group 0.86% $19,043,892 $17,172,811 10.90% $4,124,982 44.52
20 The Hanover Insurance Group 0.85% $18,707,332 $17,654,167 5.97% ($56,085) 23.29
21 Sentry Insurance Group 0.78% $17,147,504 $19,162,562 (10.52%) ($7,778,019) 24.63
22 Markel Corporation Group 0.76% $16,761,877 $16,322,078 2.69% $3,190,608 33.95
23 Fairfax Financial Group 0.71% $15,698,424 $18,780,352 (16.41%) $7,055,060 50.87
24 Tokio Marine Holdings Inc. Group 0.71% $15,647,728 $13,245,825 18.13% $2,978,214 5.27
25 Everest Reinsurance Holdings Group 0.70% $15,431,678 $18,203,010 (15.22%) $1,288,124 35.50
Top 25 Groups Total 91.14% $2,007,361,821 $2,285,402,612 (12.17%) $173,869,618 40.35
Total Market 100.00% $2,202,541,451 $2,511,071,790 (12.29%) $180,216,843 40.55
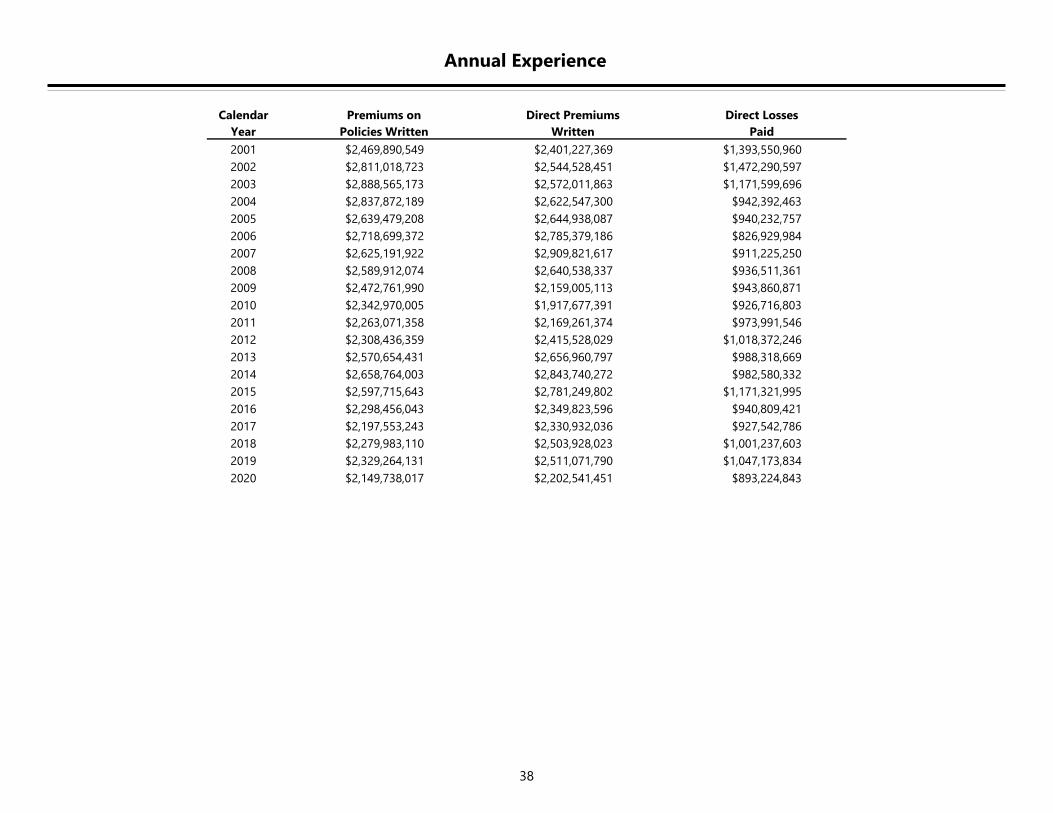
38
Annual Experience
Calendar Premiums on Direct Premiums Direct Losses
Year Policies Written Written Paid
2001 $2,469,890,549 $2,401,227,369 $1,393,550,960
2002 $2,811,018,723 $2,544,528,451 $1,472,290,597
2003 $2,888,565,173 $2,572,011,863 $1,171,599,696
2004 $2,837,872,189 $2,622,547,300 $942,392,463
2005 $2,639,479,208 $2,644,938,087 $940,232,757
2006 $2,718,699,372 $2,785,379,186 $826,929,984
2007 $2,625,191,922 $2,909,821,617 $911,225,250
2008 $2,589,912,074 $2,640,538,337 $936,511,361
2009 $2,472,761,990 $2,159,005,113 $943,860,871
2010 $2,342,970,005 $1,917,677,391 $926,716,803
2011 $2,263,071,358 $2,169,261,374 $973,991,546
2012 $2,308,436,359 $2,415,528,029 $1,018,372,246
2013 $2,570,654,431 $2,656,960,797 $988,318,669
2014 $2,658,764,003 $2,843,740,272 $982,580,332
2015 $2,597,715,643 $2,781,249,802 $1,171,321,995
2016 $2,298,456,043 $2,349,823,596 $940,809,421
2017 $2,197,553,243 $2,330,932,036 $927,542,786
2018 $2,279,983,110 $2,503,928,023 $1,001,237,603
2019 $2,329,264,131 $2,511,071,790 $1,047,173,834
2020 $2,149,738,017 $2,202,541,451 $893,224,843
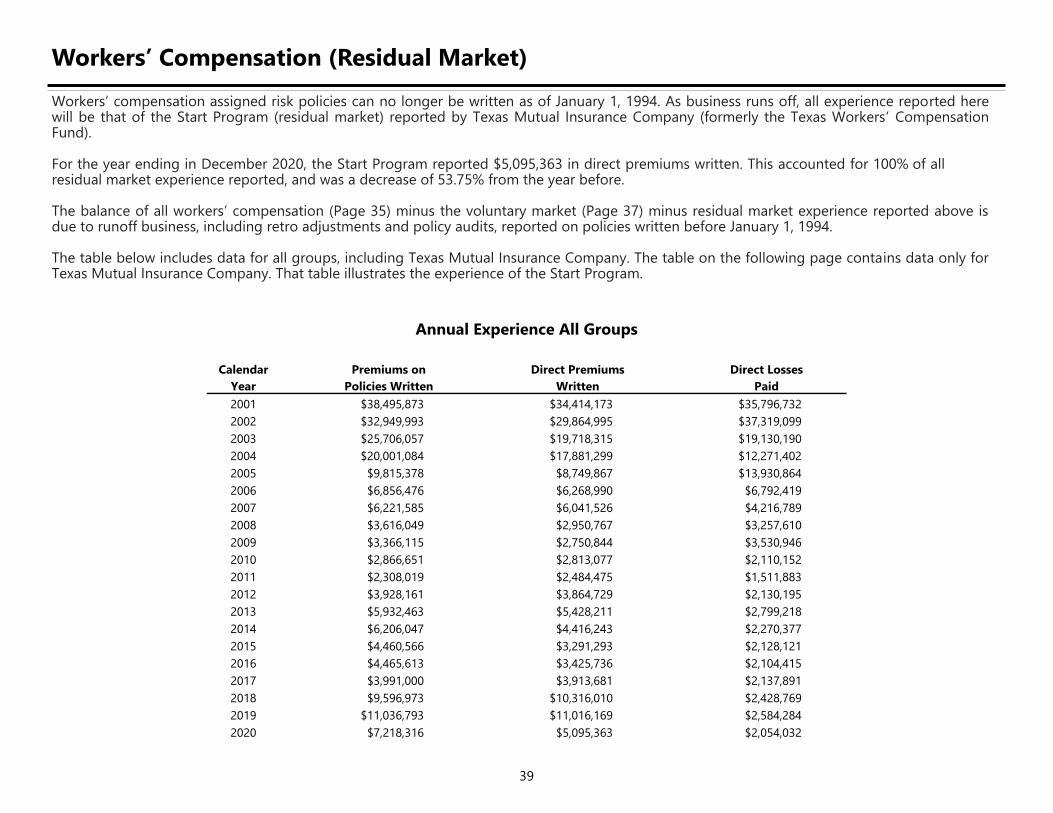
39
Workers’ Compensation (Residual Market)
Workers’ compensation assigned risk policies can no longer be written as of January 1, 1994. As business runs off, all experience reported here will be that of the Start Program (residual market) reported by Texas Mutual Insurance Company (formerly the Texas Workers’ Compensation Fund).
For the year ending in December 2020, the Start Program reported $5,095,363 in direct premiums written. This accounted for 100% of all residual market experience reported, and was a decrease of 53.75% from the year before.
The balance of all workers’ compensation (Page 35) minus the voluntary market (Page 37) minus residual market experience reported above is due to runoff business, including retro adjustments and policy audits, reported on policies written before January 1, 1994.
The table below includes data for all groups, including Texas Mutual Insurance Company. The table on the following page contains data only for Texas Mutual Insurance Company. That table illustrates the experience of the Start Program.
Annual Experience All Groups
Calendar Premiums on Direct Premiums Direct Losses
Year Policies Written Written Paid
2001 $38,495,873 $34,414,173 $35,796,732
2002 $32,949,993 $29,864,995 $37,319,099
2003 $25,706,057 $19,718,315 $19,130,190
2004 $20,001,084 $17,881,299 $12,271,402
2005 $9,815,378 $8,749,867 $13,930,864
2006 $6,856,476 $6,268,990 $6,792,419
2007 $6,221,585 $6,041,526 $4,216,789
2008 $3,616,049 $2,950,767 $3,257,610
2009 $3,366,115 $2,750,844 $3,530,946
2010 $2,866,651 $2,813,077 $2,110,152
2011 $2,308,019 $2,484,475 $1,511,883
2012 $3,928,161 $3,864,729 $2,130,195
2013 $5,932,463 $5,428,211 $2,799,218
2014 $6,206,047 $4,416,243 $2,270,377
2015 $4,460,566 $3,291,293 $2,128,121
2016 $4,465,613 $3,425,736 $2,104,415
2017 $3,991,000 $3,913,681 $2,137,891
2018 $9,596,973 $10,316,010 $2,428,769
2019 $11,036,793 $11,016,169 $2,584,284
2020 $7,218,316 $5,095,363 $2,054,032
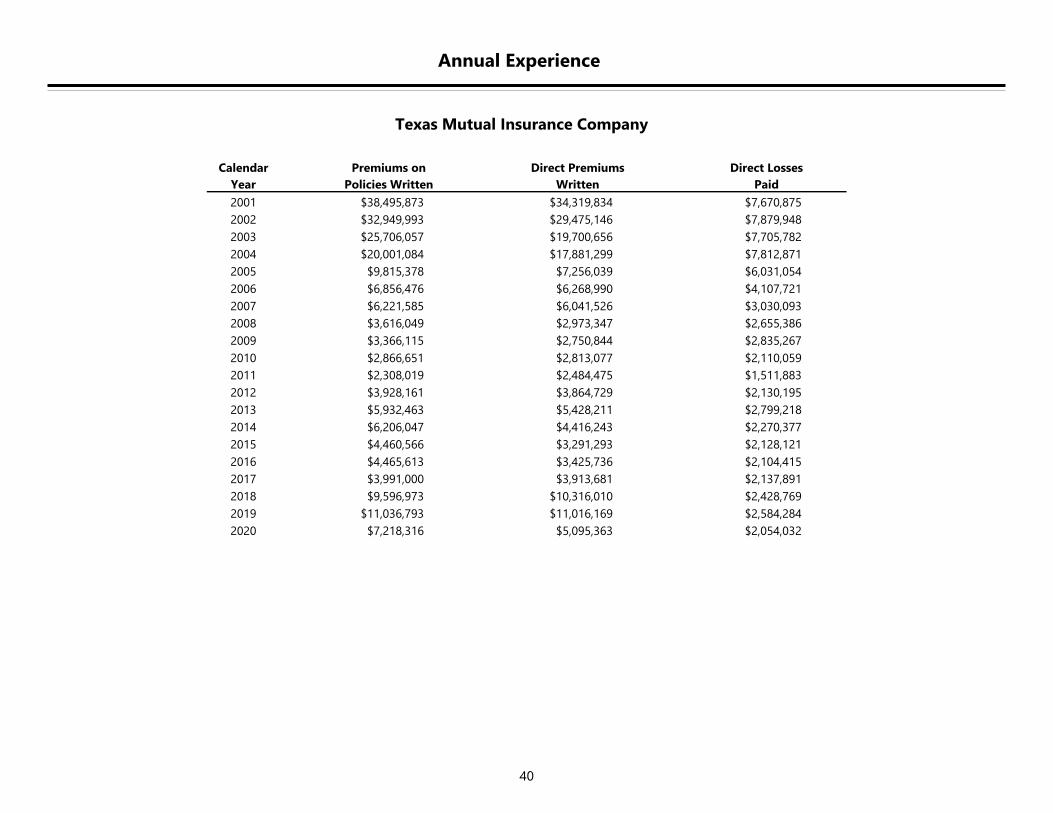
40
Annual Experience
Texas Mutual Insurance Company
Calendar Premiums on Direct Premiums Direct Losses
Year Policies Written Written Paid
2001 $38,495,873 $34,319,834 $7,670,875
2002 $32,949,993 $29,475,146 $7,879,948
2003 $25,706,057 $19,700,656 $7,705,782
2004 $20,001,084 $17,881,299 $7,812,871
2005 $9,815,378 $7,256,039 $6,031,054
2006 $6,856,476 $6,268,990 $4,107,721
2007 $6,221,585 $6,041,526 $3,030,093
2008 $3,616,049 $2,973,347 $2,655,386
2009 $3,366,115 $2,750,844 $2,835,267
2010 $2,866,651 $2,813,077 $2,110,059
2011 $2,308,019 $2,484,475 $1,511,883
2012 $3,928,161 $3,864,729 $2,130,195
2013 $5,932,463 $5,428,211 $2,799,218
2014 $6,206,047 $4,416,243 $2,270,377
2015 $4,460,566 $3,291,293 $2,128,121
2016 $4,465,613 $3,425,736 $2,104,415
2017 $3,991,000 $3,913,681 $2,137,891
2018 $9,596,973 $10,316,010 $2,428,769
2019 $11,036,793 $11,016,169 $2,584,284
2020 $7,218,316 $5,095,363 $2,054,032
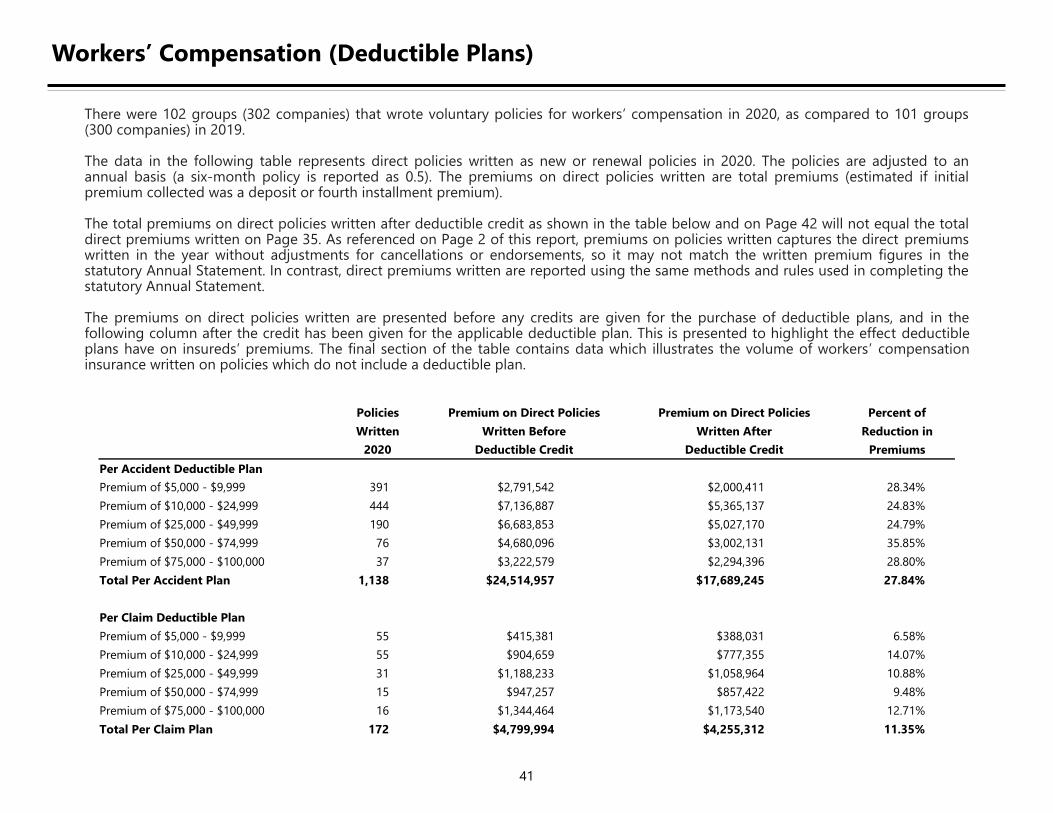
41
Workers’ Compensation (Deductible Plans)
There were 102 groups (302 companies) that wrote voluntary policies for workers’ compensation in 2020, as compared to 101 groups (300 companies) in 2019.
The data in the following table represents direct policies written as new or renewal policies in 2020. The policies are adjusted to an annual basis (a six-month policy is reported as 0.5). The premiums on direct policies written are total premiums (estimated if initial premium collected was a deposit or fourth installment premium).
The total premiums on direct policies written after deductible credit as shown in the table below and on Page 42 will not equal the total direct premiums written on Page 35. As referenced on Page 2 of this report, premiums on policies written captures the direct premiums written in the year without adjustments for cancellations or endorsements, so it may not match the written premium figures in the statutory Annual Statement. In contrast, direct premiums written are reported using the same methods and rules used in completing the statutory Annual Statement.
The premiums on direct policies written are presented before any credits are given for the purchase of deductible plans, and in the following column after the credit has been given for the applicable deductible plan. This is presented to highlight the effect deductible plans have on insureds’ premiums. The final section of the table contains data which illustrates the volume of workers’ compensation insurance written on policies which do not include a deductible plan.
Policies Premium on Direct Policies Premium on Direct Policies Percent of
Written Written Before Written After Reduction in
2020 Deductible Credit Deductible Credit Premiums
Per Accident Deductible Plan
Premium of $5,000 - $9,999 391 $2,791,542 $2,000,411 28.34%
Premium of $10,000 - $24,999 444 $7,136,887 $5,365,137 24.83%
Premium of $25,000 - $49,999 190 $6,683,853 $5,027,170 24.79%
Premium of $50,000 - $74,999 76 $4,680,096 $3,002,131 35.85%
Premium of $75,000 - $100,000 37 $3,222,579 $2,294,396 28.80%
Total Per Accident Plan 1,138 $24,514,957 $17,689,245 27.84%
Per Claim Deductible Plan
Premium of $5,000 - $9,999 55 $415,381 $388,031 6.58%
Premium of $10,000 - $24,999 55 $904,659 $777,355 14.07%
Premium of $25,000 - $49,999 31 $1,188,233 $1,058,964 10.88%
Premium of $50,000 - $74,999 15 $947,257 $857,422 9.48%
Premium of $75,000 - $100,000 16 $1,344,464 $1,173,540 12.71%
Total Per Claim Plan 172 $4,799,994 $4,255,312 11.35%
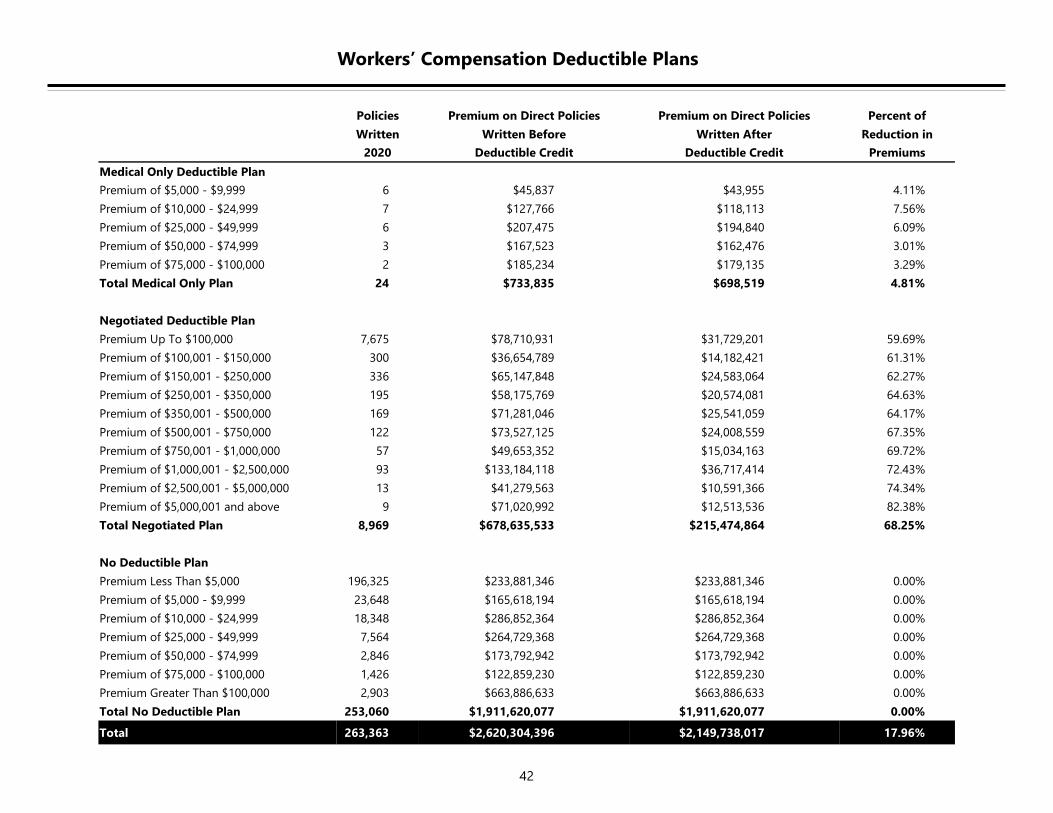
42
Workers’ Compensation Deductible Plans
Policies Premium on Direct Policies Premium on Direct Policies Percent of
Written Written Before Written After Reduction in
2020 Deductible Credit Deductible Credit Premiums
Medical Only Deductible Plan
Premium of $5,000 - $9,999 6 $45,837 $43,955 4.11%
Premium of $10,000 - $24,999 7 $127,766 $118,113 7.56%
Premium of $25,000 - $49,999 6 $207,475 $194,840 6.09%
Premium of $50,000 - $74,999 3 $167,523 $162,476 3.01%
Premium of $75,000 - $100,000 2 $185,234 $179,135 3.29%
Total Medical Only Plan 24 $733,835 $698,519 4.81%
Negotiated Deductible Plan
Premium Up To $100,000 7,675 $78,710,931 $31,729,201 59.69%
Premium of $100,001 - $150,000 300 $36,654,789 $14,182,421 61.31%
Premium of $150,001 - $250,000 336 $65,147,848 $24,583,064 62.27%
Premium of $250,001 - $350,000 195 $58,175,769 $20,574,081 64.63%
Premium of $350,001 - $500,000 169 $71,281,046 $25,541,059 64.17%
Premium of $500,001 - $750,000 122 $73,527,125 $24,008,559 67.35%
Premium of $750,001 - $1,000,000 57 $49,653,352 $15,034,163 69.72%
Premium of $1,000,001 - $2,500,000 93 $133,184,118 $36,717,414 72.43%
Premium of $2,500,001 - $5,000,000 13 $41,279,563 $10,591,366 74.34%
Premium of $5,000,001 and above 9 $71,020,992 $12,513,536 82.38%
Total Negotiated Plan 8,969 $678,635,533 $215,474,864 68.25%
No Deductible Plan
Premium Less Than $5,000 196,325 $233,881,346 $233,881,346 0.00%
Premium of $5,000 - $9,999 23,648 $165,618,194 $165,618,194 0.00%
Premium of $10,000 - $24,999 18,348 $286,852,364 $286,852,364 0.00%
Premium of $25,000 - $49,999 7,564 $264,729,368 $264,729,368 0.00%
Premium of $50,000 - $74,999 2,846 $173,792,942 $173,792,942 0.00%
Premium of $75,000 - $100,000 1,426 $122,859,230 $122,859,230 0.00%
Premium Greater Than $100,000 2,903 $663,886,633 $663,886,633 0.00%
Total No Deductible Plan 253,060 $1,911,620,077 $1,911,620,077 0.00%
Total 263,363 $2,620,304,396 $2,149,738,017 17.96%
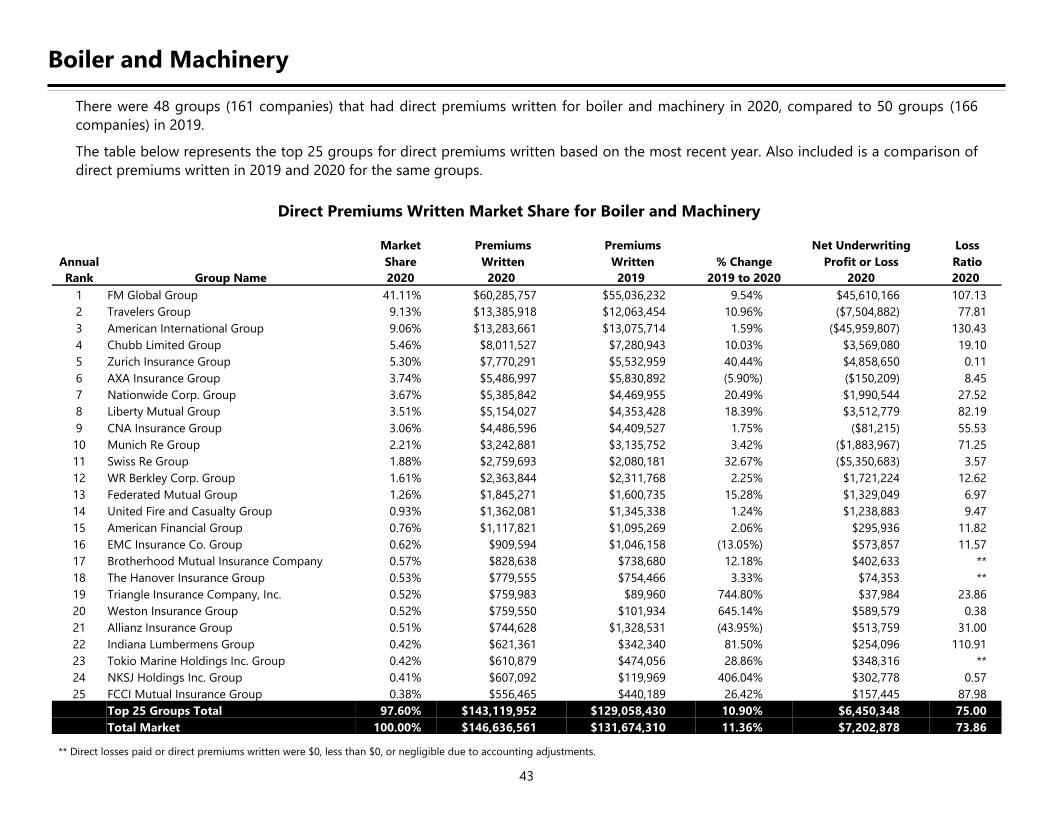
43
Boiler and Machinery
There were 48 groups (161 companies) that had direct premiums written for boiler and machinery in 2020, compared to 50 groups (166
companies) in 2019.
The table below represents the top 25 groups for direct premiums written based on the most recent year. Also included is a comparison of
direct premiums written in 2019 and 2020 for the same groups.
Direct Premiums Written Market Share for Boiler and Machinery
** Direct losses paid or direct premiums written were $0, less than $0, or negligible due to accounting adjustments.
Market Premiums Premiums Net Underwriting Loss
Annual Share Written Written % Change Profit or Loss Ratio
Rank Group Name 2020 2020 2019 2019 to 2020 2020 2020
1 FM Global Group 41.11% $60,285,757 $55,036,232 9.54% $45,610,166 107.13
2 Travelers Group 9.13% $13,385,918 $12,063,454 10.96% ($7,504,882) 77.81
3 American International Group 9.06% $13,283,661 $13,075,714 1.59% ($45,959,807) 130.43
4 Chubb Limited Group 5.46% $8,011,527 $7,280,943 10.03% $3,569,080 19.10
5 Zurich Insurance Group 5.30% $7,770,291 $5,532,959 40.44% $4,858,650 0.11
6 AXA Insurance Group 3.74% $5,486,997 $5,830,892 (5.90%) ($150,209) 8.45
7 Nationwide Corp. Group 3.67% $5,385,842 $4,469,955 20.49% $1,990,544 27.52
8 Liberty Mutual Group 3.51% $5,154,027 $4,353,428 18.39% $3,512,779 82.19
9 CNA Insurance Group 3.06% $4,486,596 $4,409,527 1.75% ($81,215) 55.53
10 Munich Re Group 2.21% $3,242,881 $3,135,752 3.42% ($1,883,967) 71.25
11 Swiss Re Group 1.88% $2,759,693 $2,080,181 32.67% ($5,350,683) 3.57
12 WR Berkley Corp. Group 1.61% $2,363,844 $2,311,768 2.25% $1,721,224 12.62
13 Federated Mutual Group 1.26% $1,845,271 $1,600,735 15.28% $1,329,049 6.97
14 United Fire and Casualty Group 0.93% $1,362,081 $1,345,338 1.24% $1,238,883 9.47
15 American Financial Group 0.76% $1,117,821 $1,095,269 2.06% $295,936 11.82
16 EMC Insurance Co. Group 0.62% $909,594 $1,046,158 (13.05%) $573,857 11.57
17 Brotherhood Mutual Insurance Company 0.57% $828,638 $738,680 12.18% $402,633 **
18 The Hanover Insurance Group 0.53% $779,555 $754,466 3.33% $74,353 **
19 Triangle Insurance Company, Inc. 0.52% $759,983 $89,960 744.80% $37,984 23.86
20 Weston Insurance Group 0.52% $759,550 $101,934 645.14% $589,579 0.38
21 Allianz Insurance Group 0.51% $744,628 $1,328,531 (43.95%) $513,759 31.00
22 Indiana Lumbermens Group 0.42% $621,361 $342,340 81.50% $254,096 110.91
23 Tokio Marine Holdings Inc. Group 0.42% $610,879 $474,056 28.86% $348,316 **
24 NKSJ Holdings Inc. Group 0.41% $607,092 $119,969 406.04% $302,778 0.57
25 FCCI Mutual Insurance Group 0.38% $556,465 $440,189 26.42% $157,445 87.98
Top 25 Groups Total 97.60% $143,119,952 $129,058,430 10.90% $6,450,348 75.00
Total Market 100.00% $146,636,561 $131,674,310 11.36% $7,202,878 73.86

44
Annual Experience
Earned to Incurred Loss Ratio by Year Based on Annual Statement data from the NAIC: incurred losses (LAE excluded) / earned premium
Year Loss Ratio
2010 29.3%
2011 74.8%
2012 28.1%
2013 44.4%
2014 105.9%
2015 31.0%
2016 30.2%
2017 22.8%
2018 61.2%
2019 22.5%
Calendar Premiums on Direct Premiums Direct Losses
Year Policies Written Written Paid
2001 $45,586,558 $52,847,266 $14,275,710
2002 $89,270,606 $82,169,669 $25,152,996
2003 $69,566,403 $76,157,276 $30,416,496
2004 $64,415,029 $66,458,271 $39,201,585
2005 $58,836,887 $70,847,664 $10,481,474
2006 $61,167,654 $79,070,900 $52,859,077
2007 $66,718,928 $90,961,373 $28,512,277
2008 $64,768,235 $79,611,270 $47,918,561
2009 $91,913,680 $110,225,873 $60,780,660
2010 $92,204,697 $105,671,240 $93,745,611
2011 $111,060,055 $126,618,509 $57,007,973
2012 $111,765,418 $135,817,280 $51,091,304
2013 $91,135,724 $104,270,965 $30,533,967
2014 $91,846,748 $106,142,647 $83,941,069
2015 $103,852,214 $122,493,438 $62,037,594
2016 $114,116,745 $119,094,028 $49,903,891
2017 $104,287,485 $113,739,979 $28,517,288
2018 $106,939,155 $118,568,993 $43,424,509
2019 $119,218,607 $131,674,310 $40,237,401
2020 $142,166,232 $146,636,561 $108,304,244
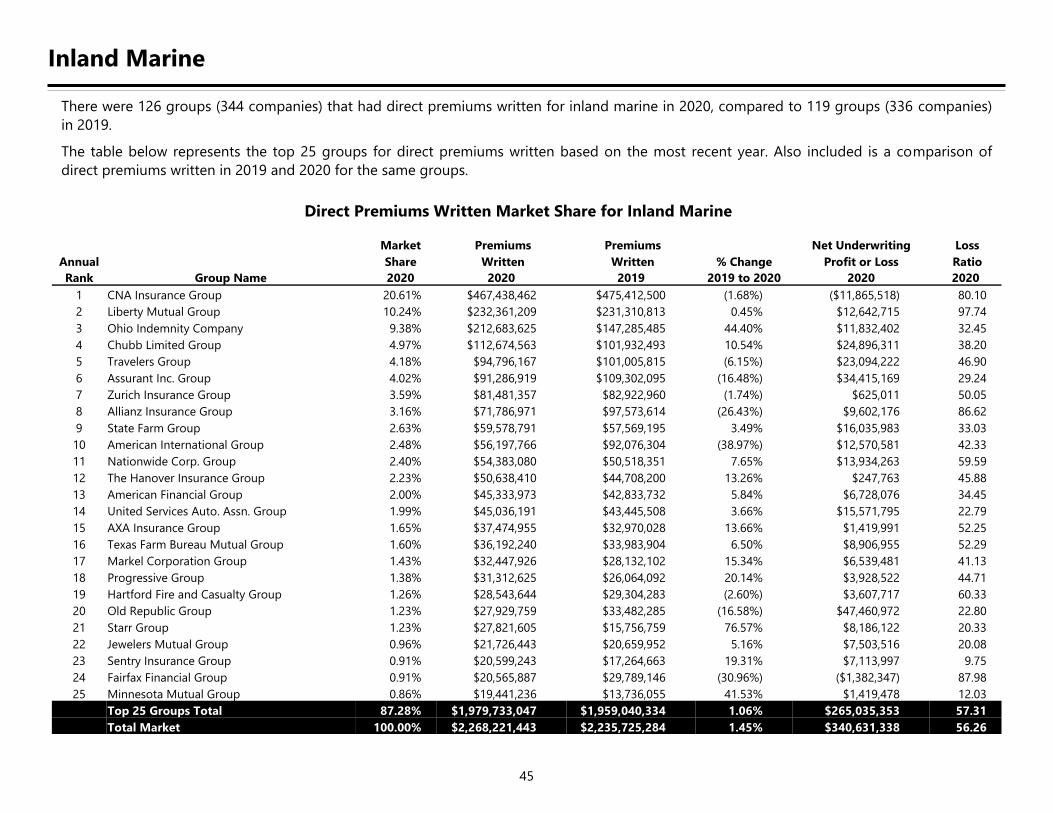
45
Inland Marine
There were 126 groups (344 companies) that had direct premiums written for inland marine in 2020, compared to 119 groups (336 companies)
in 2019.
The table below represents the top 25 groups for direct premiums written based on the most recent year. Also included is a comparison of
direct premiums written in 2019 and 2020 for the same groups.
Direct Premiums Written Market Share for Inland Marine
Market Premiums Premiums Net Underwriting Loss
Annual Share Written Written % Change Profit or Loss Ratio
Rank Group Name 2020 2020 2019 2019 to 2020 2020 2020
1 CNA Insurance Group 20.61% $467,438,462 $475,412,500 (1.68%) ($11,865,518) 80.10
2 Liberty Mutual Group 10.24% $232,361,209 $231,310,813 0.45% $12,642,715 97.74
3 Ohio Indemnity Company 9.38% $212,683,625 $147,285,485 44.40% $11,832,402 32.45
4 Chubb Limited Group 4.97% $112,674,563 $101,932,493 10.54% $24,896,311 38.20
5 Travelers Group 4.18% $94,796,167 $101,005,815 (6.15%) $23,094,222 46.90
6 Assurant Inc. Group 4.02% $91,286,919 $109,302,095 (16.48%) $34,415,169 29.24
7 Zurich Insurance Group 3.59% $81,481,357 $82,922,960 (1.74%) $625,011 50.05
8 Allianz Insurance Group 3.16% $71,786,971 $97,573,614 (26.43%) $9,602,176 86.62
9 State Farm Group 2.63% $59,578,791 $57,569,195 3.49% $16,035,983 33.03
10 American International Group 2.48% $56,197,766 $92,076,304 (38.97%) $12,570,581 42.33
11 Nationwide Corp. Group 2.40% $54,383,080 $50,518,351 7.65% $13,934,263 59.59
12 The Hanover Insurance Group 2.23% $50,638,410 $44,708,200 13.26% $247,763 45.88
13 American Financial Group 2.00% $45,333,973 $42,833,732 5.84% $6,728,076 34.45
14 United Services Auto. Assn. Group 1.99% $45,036,191 $43,445,508 3.66% $15,571,795 22.79
15 AXA Insurance Group 1.65% $37,474,955 $32,970,028 13.66% $1,419,991 52.25
16 Texas Farm Bureau Mutual Group 1.60% $36,192,240 $33,983,904 6.50% $8,906,955 52.29
17 Markel Corporation Group 1.43% $32,447,926 $28,132,102 15.34% $6,539,481 41.13
18 Progressive Group 1.38% $31,312,625 $26,064,092 20.14% $3,928,522 44.71
19 Hartford Fire and Casualty Group 1.26% $28,543,644 $29,304,283 (2.60%) $3,607,717 60.33
20 Old Republic Group 1.23% $27,929,759 $33,482,285 (16.58%) $47,460,972 22.80
21 Starr Group 1.23% $27,821,605 $15,756,759 76.57% $8,186,122 20.33
22 Jewelers Mutual Group 0.96% $21,726,443 $20,659,952 5.16% $7,503,516 20.08
23 Sentry Insurance Group 0.91% $20,599,243 $17,264,663 19.31% $7,113,997 9.75
24 Fairfax Financial Group 0.91% $20,565,887 $29,789,146 (30.96%) ($1,382,347) 87.98
25 Minnesota Mutual Group 0.86% $19,441,236 $13,736,055 41.53% $1,419,478 12.03
Top 25 Groups Total 87.28% $1,979,733,047 $1,959,040,334 1.06% $265,035,353 57.31
Total Market 100.00% $2,268,221,443 $2,235,725,284 1.45% $340,631,338 56.26
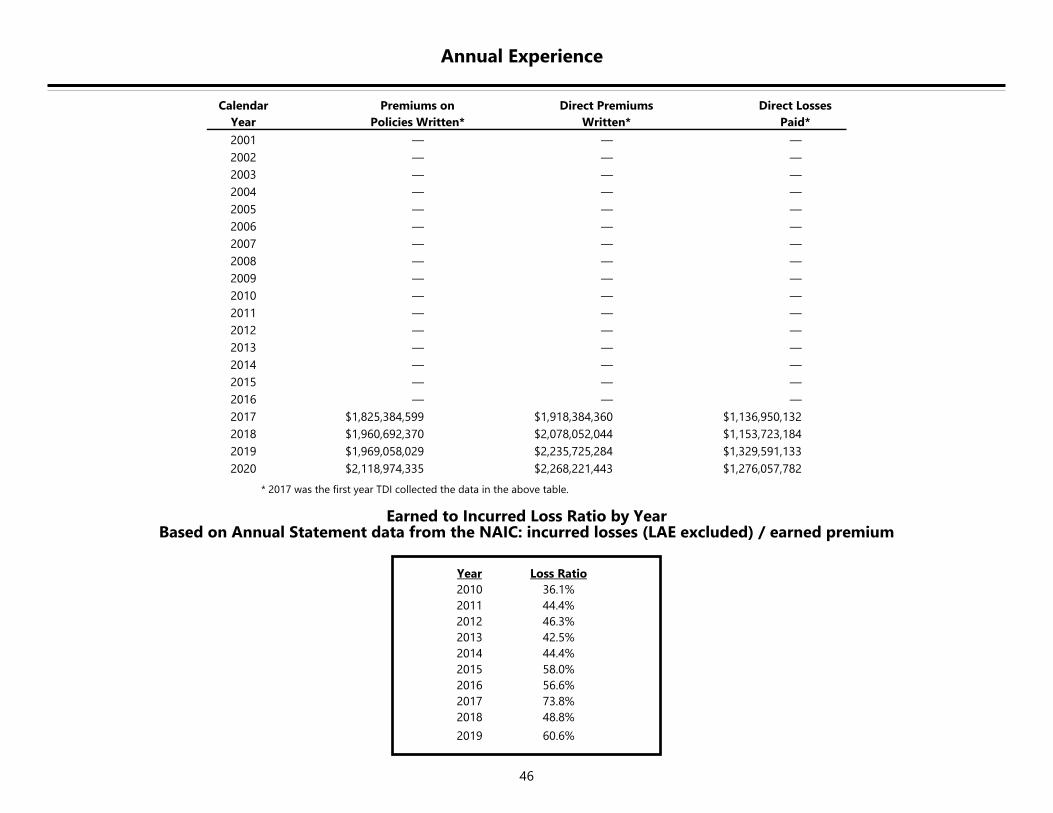
46
Annual Experience
Earned to Incurred Loss Ratio by Year Based on Annual Statement data from the NAIC: incurred losses (LAE excluded) / earned premium
* 2017 was the first year TDI collected the data in the above table.
Year Loss Ratio
2010 36.1%
2011 44.4%
2012 46.3%
2013 42.5%
2014 44.4%
2015 58.0%
2016 56.6%
2017 73.8%
2018 48.8%
2019 60.6%
Calendar Premiums on Direct Premiums Direct Losses
Year Policies Written* Written* Paid*
2001 — — —
2002 — — —
2003 — — —
2004 — — —
2005 — — —
2006 — — —
2007 — — —
2008 — — —
2009 — — —
2010 — — —
2011 — — —
2012 — — —
2013 — — —
2014 — — —
2015 — — —
2016 — — —
2017 $1,825,384,599 $1,918,384,360 $1,136,950,132
2018 $1,960,692,370 $2,078,052,044 $1,153,723,184
2019 $1,969,058,029 $2,235,725,284 $1,329,591,133
2020 $2,118,974,335 $2,268,221,443 $1,276,057,782
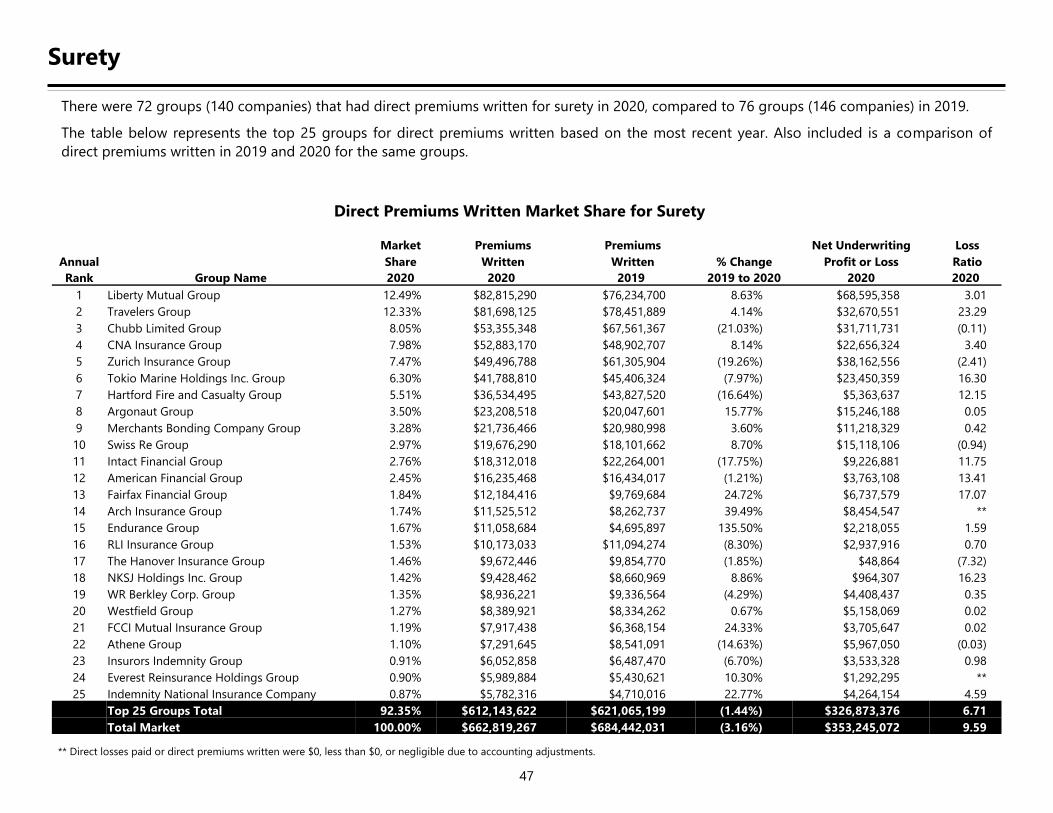
47
Surety
There were 72 groups (140 companies) that had direct premiums written for surety in 2020, compared to 76 groups (146 companies) in 2019.
The table below represents the top 25 groups for direct premiums written based on the most recent year. Also included is a comparison of
direct premiums written in 2019 and 2020 for the same groups.
Direct Premiums Written Market Share for Surety
** Direct losses paid or direct premiums written were $0, less than $0, or negligible due to accounting adjustments.
Market Premiums Premiums Net Underwriting Loss
Annual Share Written Written % Change Profit or Loss Ratio
Rank Group Name 2020 2020 2019 2019 to 2020 2020 2020
1 Liberty Mutual Group 12.49% $82,815,290 $76,234,700 8.63% $68,595,358 3.01
2 Travelers Group 12.33% $81,698,125 $78,451,889 4.14% $32,670,551 23.29
3 Chubb Limited Group 8.05% $53,355,348 $67,561,367 (21.03%) $31,711,731 (0.11)
4 CNA Insurance Group 7.98% $52,883,170 $48,902,707 8.14% $22,656,324 3.40
5 Zurich Insurance Group 7.47% $49,496,788 $61,305,904 (19.26%) $38,162,556 (2.41)
6 Tokio Marine Holdings Inc. Group 6.30% $41,788,810 $45,406,324 (7.97%) $23,450,359 16.30
7 Hartford Fire and Casualty Group 5.51% $36,534,495 $43,827,520 (16.64%) $5,363,637 12.15
8 Argonaut Group 3.50% $23,208,518 $20,047,601 15.77% $15,246,188 0.05
9 Merchants Bonding Company Group 3.28% $21,736,466 $20,980,998 3.60% $11,218,329 0.42
10 Swiss Re Group 2.97% $19,676,290 $18,101,662 8.70% $15,118,106 (0.94)
11 Intact Financial Group 2.76% $18,312,018 $22,264,001 (17.75%) $9,226,881 11.75
12 American Financial Group 2.45% $16,235,468 $16,434,017 (1.21%) $3,763,108 13.41
13 Fairfax Financial Group 1.84% $12,184,416 $9,769,684 24.72% $6,737,579 17.07
14 Arch Insurance Group 1.74% $11,525,512 $8,262,737 39.49% $8,454,547 **
15 Endurance Group 1.67% $11,058,684 $4,695,897 135.50% $2,218,055 1.59
16 RLI Insurance Group 1.53% $10,173,033 $11,094,274 (8.30%) $2,937,916 0.70
17 The Hanover Insurance Group 1.46% $9,672,446 $9,854,770 (1.85%) $48,864 (7.32)
18 NKSJ Holdings Inc. Group 1.42% $9,428,462 $8,660,969 8.86% $964,307 16.23
19 WR Berkley Corp. Group 1.35% $8,936,221 $9,336,564 (4.29%) $4,408,437 0.35
20 Westfield Group 1.27% $8,389,921 $8,334,262 0.67% $5,158,069 0.02
21 FCCI Mutual Insurance Group 1.19% $7,917,438 $6,368,154 24.33% $3,705,647 0.02
22 Athene Group 1.10% $7,291,645 $8,541,091 (14.63%) $5,967,050 (0.03)
23 Insurors Indemnity Group 0.91% $6,052,858 $6,487,470 (6.70%) $3,533,328 0.98
24 Everest Reinsurance Holdings Group 0.90% $5,989,884 $5,430,621 10.30% $1,292,295 **
25 Indemnity National Insurance Company 0.87% $5,782,316 $4,710,016 22.77% $4,264,154 4.59
Top 25 Groups Total 92.35% $612,143,622 $621,065,199 (1.44%) $326,873,376 6.71
Total Market 100.00% $662,819,267 $684,442,031 (3.16%) $353,245,072 9.59
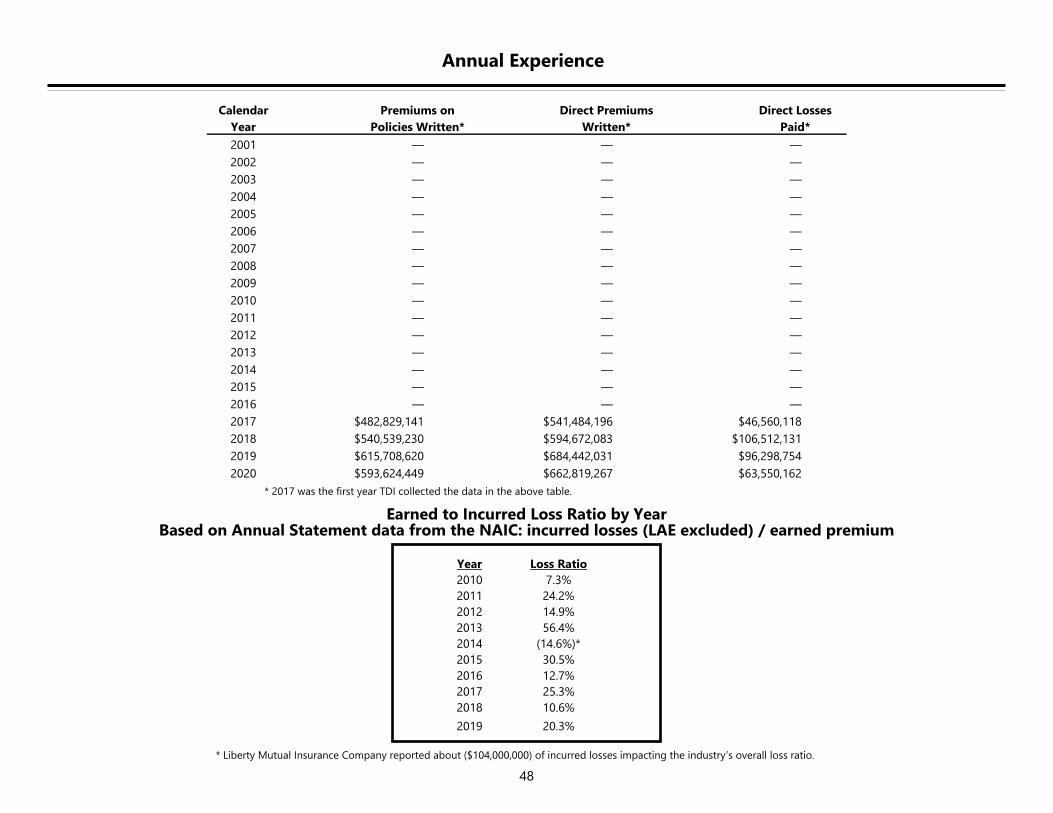
48
Annual Experience
Earned to Incurred Loss Ratio by Year Based on Annual Statement data from the NAIC: incurred losses (LAE excluded) / earned premium
* Liberty Mutual Insurance Company reported about ($104,000,000) of incurred losses impacting the industry’s overall loss ratio.
* 2017 was the first year TDI collected the data in the above table.
Year Loss Ratio
2010 7.3%
2011 24.2%
2012 14.9%
2013 56.4%
2014 (14.6%)*
2015 30.5%
2016 12.7%
2017 25.3%
2018 10.6%
2019 20.3%
Calendar Premiums on Direct Premiums Direct Losses
Year Policies Written* Written* Paid*
2001 — — —
2002 — — —
2003 — — —
2004 — — —
2005 — — —
2006 — — —
2007 — — —
2008 — — —
2009 — — —
2010 — — —
2011 — — —
2012 — — —
2013 — — —
2014 — — —
2015 — — —
2016 — — —
2017 $482,829,141 $541,484,196 $46,560,118
2018 $540,539,230 $594,672,083 $106,512,131
2019 $615,708,620 $684,442,031 $96,298,754
2020 $593,624,449 $662,819,267 $63,550,162

49
Commercial Crime
There were 45 groups (114 companies) that had direct premiums written for commercial crime in 2020, compared to 45 groups (120 companies)
in 2019.
The table below represents the top 25 groups for direct premiums written based on the most recent year. Also included is a comparison of
direct premiums written in 2019 and 2020 for the same groups.
Direct Premiums Written Market Share for Commercial Crime
** Direct losses paid or direct premiums written were $0, less than $0, or negligible due to accounting adjustments.
Market Premiums Premiums Net Underwriting Loss
Annual Share Written Written % Change Profit or Loss Ratio
Rank Group Name 2020 2020 2019 2019 to 2020 2020 2020
1 Travelers Group 22.19% $7,564,379 $8,100,203 (6.61%) ($10,835,959) 84.45
2 Beazley Grp 10.65% $3,630,940 $2,947,868 23.17% $2,556,998 4.21
3 WR Berkley Corp. Group 9.77% $3,328,932 $2,888,383 15.25% ($3,692,493) 80.53
4 Hiscox Insurance Group 9.57% $3,261,202 $2,803,322 16.33% ($3,446,527) 111.08
5 Chubb Limited Group 7.30% $2,489,180 $2,536,670 (1.87%) $1,427,782 7.42
6 AXA Insurance Group 7.23% $2,465,122 $1,211,482 103.48% ($16,768) **
7 Tokio Marine Holdings Inc. Group 6.31% $2,151,594 $1,885,224 14.13% ($6,495,316) 3.37
8 AXIS Capital Group 4.86% $1,655,482 $1,407,517 17.62% $850,570 48.62
9 Zurich Insurance Group 3.35% $1,143,111 $1,258,203 (9.15%) $1,793,944 19.56
10 Hartford Fire and Casualty Group 3.04% $1,037,244 $904,129 14.72% $224,844 23.43
11 CNA Insurance Group 2.69% $918,410 $1,471,557 (37.59%) ($74,902) 54.96
12 The Hanover Insurance Group 2.44% $830,527 $785,630 5.71% $5,263 36.54
13 American International Group 2.38% $812,619 $1,195,856 (32.05%) $731,780 **
14 Everest Reinsurance Holdings Group 2.17% $738,393 $1,024,783 (27.95%) $82,492 4.13
15 Cincinnati Financial Group 1.43% $487,586 $381,337 27.86% $263,713 13.55
16 Intact Financial Group 0.79% $268,101 $179,184 49.62% $110,267 17.34
17 Fairfax Financial Group 0.67% $227,468 $277,260 (17.96%) $51,520 14.35
18 Nationwide Corp. Group 0.55% $189,048 $170,946 10.59% $141,853 (1.32)
19 James River Group 0.52% $177,439 $35,168 404.55% $107,068 2.75
20 Berkshire Hathaway Group 0.50% $170,789 $83,286 105.06% $90,489 **
21 United Fire and Casualty Group 0.42% $144,724 $156,060 (7.26%) $67,080 77.29
22 Federated Mutual Group 0.24% $81,728 $130,234 (37.25%) $65,620 19.57
23 Arch Insurance Group 0.13% $45,406 $41,667 8.97% $36,343 **
24 Federated Rural Electric Ins. Exchange 0.11% $37,290 $30,630 21.74% $30,387 **
25 IAT Reinsurance Company Group 0.10% $35,442 $207,715 (82.94%) $34,120 **
Top 25 Groups Total 99.44% $33,892,156 $32,114,314 5.54% ($15,889,832) 45.70
Total Market 100.00% $34,084,130 $32,285,977 5.57% ($15,886,928) 45.56
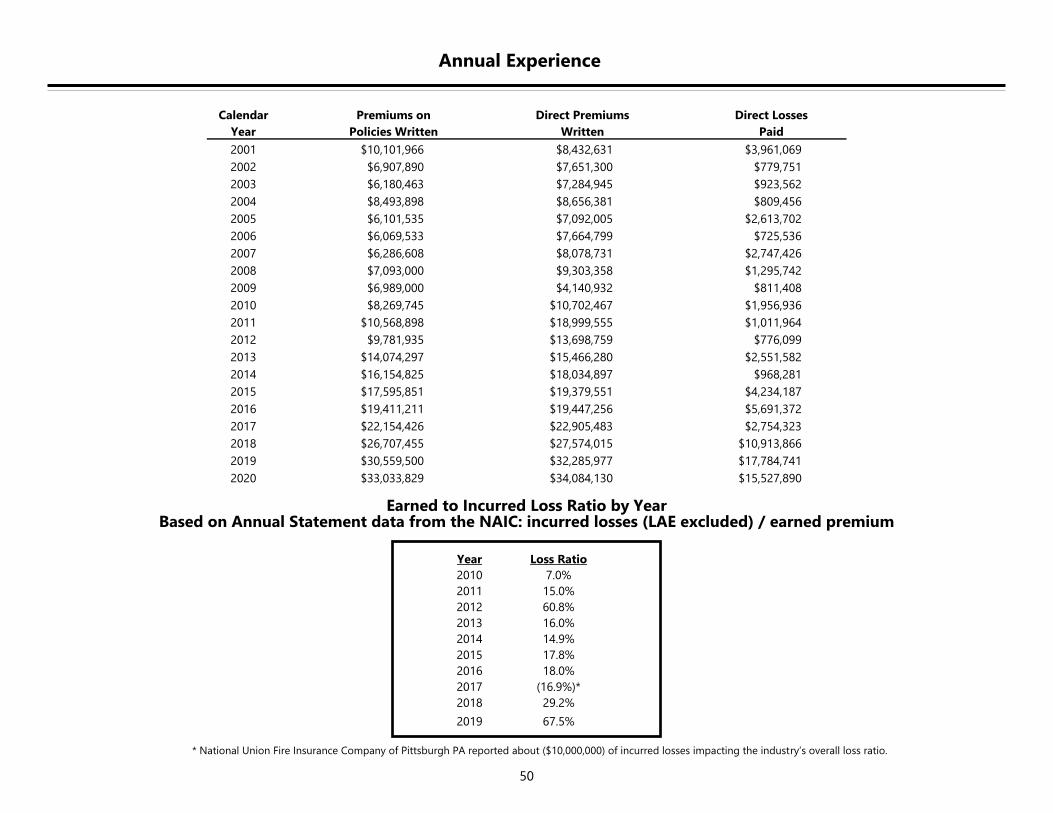
50
Annual Experience
Earned to Incurred Loss Ratio by Year Based on Annual Statement data from the NAIC: incurred losses (LAE excluded) / earned premium
* National Union Fire Insurance Company of Pittsburgh PA reported about ($10,000,000) of incurred losses impacting the industry’s overall loss ratio.
Year Loss Ratio
2010 7.0%
2011 15.0%
2012 60.8%
2013 16.0%
2014 14.9%
2015 17.8%
2016 18.0%
2017 (16.9%)*
2018 29.2%
2019 67.5%
Calendar Premiums on Direct Premiums Direct Losses
Year Policies Written Written Paid
2001 $10,101,966 $8,432,631 $3,961,069
2002 $6,907,890 $7,651,300 $779,751
2003 $6,180,463 $7,284,945 $923,562
2004 $8,493,898 $8,656,381 $809,456
2005 $6,101,535 $7,092,005 $2,613,702
2006 $6,069,533 $7,664,799 $725,536
2007 $6,286,608 $8,078,731 $2,747,426
2008 $7,093,000 $9,303,358 $1,295,742
2009 $6,989,000 $4,140,932 $811,408
2010 $8,269,745 $10,702,467 $1,956,936
2011 $10,568,898 $18,999,555 $1,011,964
2012 $9,781,935 $13,698,759 $776,099
2013 $14,074,297 $15,466,280 $2,551,582
2014 $16,154,825 $18,034,897 $968,281
2015 $17,595,851 $19,379,551 $4,234,187
2016 $19,411,211 $19,447,256 $5,691,372
2017 $22,154,426 $22,905,483 $2,754,323
2018 $26,707,455 $27,574,015 $10,913,866
2019 $30,559,500 $32,285,977 $17,784,741
2020 $33,033,829 $34,084,130 $15,527,890
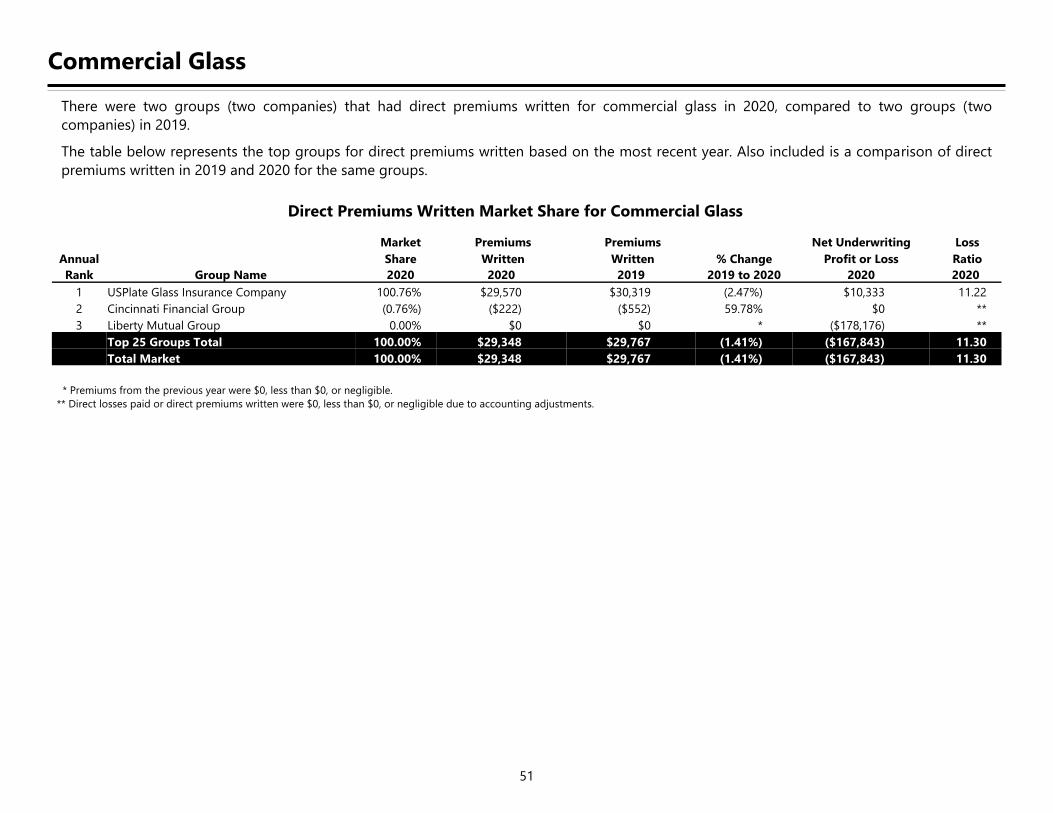
51
Commercial Glass
There were two groups (two companies) that had direct premiums written for commercial glass in 2020, compared to two groups (two
companies) in 2019.
The table below represents the top groups for direct premiums written based on the most recent year. Also included is a comparison of direct
premiums written in 2019 and 2020 for the same groups.
Direct Premiums Written Market Share for Commercial Glass
* Premiums from the previous year were $0, less than $0, or negligible.
** Direct losses paid or direct premiums written were $0, less than $0, or negligible due to accounting adjustments.
Market Premiums Premiums Net Underwriting Loss
Annual Share Written Written % Change Profit or Loss Ratio
Rank Group Name 2020 2020 2019 2019 to 2020 2020 2020
1 USPlate Glass Insurance Company 100.76% $29,570 $30,319 (2.47%) $10,333 11.22
2 Cincinnati Financial Group (0.76%) ($222) ($552) 59.78% $0 **
3 Liberty Mutual Group 0.00% $0 $0 * ($178,176) **
Top 25 Groups Total 100.00% $29,348 $29,767 (1.41%) ($167,843) 11.30
Total Market 100.00% $29,348 $29,767 (1.41%) ($167,843) 11.30
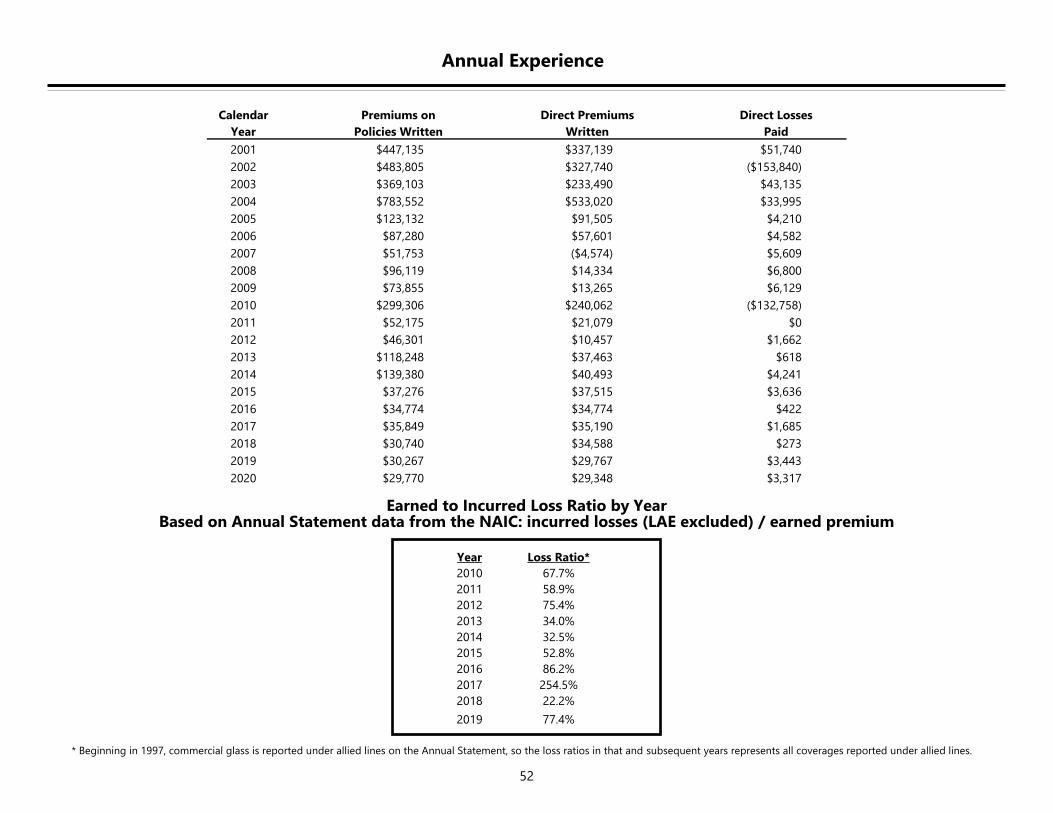
52
Annual Experience
Earned to Incurred Loss Ratio by Year Based on Annual Statement data from the NAIC: incurred losses (LAE excluded) / earned premium
* Beginning in 1997, commercial glass is reported under allied lines on the Annual Statement, so the loss ratios in that and subsequent years represents all coverages reported under allied lines.
Year Loss Ratio*
2010 67.7%
2011 58.9%
2012 75.4%
2013 34.0%
2014 32.5%
2015 52.8%
2016 86.2%
2017 254.5%
2018 22.2%
2019 77.4%
Calendar Premiums on Direct Premiums Direct Losses
Year Policies Written Written Paid
2001 $447,135 $337,139 $51,740
2002 $483,805 $327,740 ($153,840)
2003 $369,103 $233,490 $43,135
2004 $783,552 $533,020 $33,995
2005 $123,132 $91,505 $4,210
2006 $87,280 $57,601 $4,582
2007 $51,753 ($4,574) $5,609
2008 $96,119 $14,334 $6,800
2009 $73,855 $13,265 $6,129
2010 $299,306 $240,062 ($132,758)
2011 $52,175 $21,079 $0
2012 $46,301 $10,457 $1,662
2013 $118,248 $37,463 $618
2014 $139,380 $40,493 $4,241
2015 $37,276 $37,515 $3,636
2016 $34,774 $34,774 $422
2017 $35,849 $35,190 $1,685
2018 $30,740 $34,588 $273
2019 $30,267 $29,767 $3,443
2020 $29,770 $29,348 $3,317

53
Medical Professional Liability
There were 33 groups (51 companies) that had direct premiums written for medical professional liability in 2020, compared to 30 groups (47
companies) in 2019.
The table below represents the top 25 groups for direct premiums written based on the most recent year. Also included is a comparison of
direct premiums written in 2019 and 2020 for the same groups.
Direct Premiums Written Market Share for Medical Professional Liability
** Direct losses paid or direct premiums written were $0, less than $0, or negligible due to accounting adjustments.
Market Premiums Premiums Net Underwriting Loss
Annual Share Written Written % Change Profit or Loss Ratio
Rank Group Name 2020 2020 2019 2019 to 2020 2020 2020
1 Berkshire Hathaway Group 24.18% $48,973,978 $49,740,125 (1.54%) $32,993,306 19.82
2 Doctors Company Group 18.67% $37,816,156 $35,271,642 7.21% $9,662,757 32.24
3 ProAssurance Corp. Group 11.32% $22,927,055 $24,536,914 (6.56%) ($4,382,164) 51.89
4 CNA Insurance Group 7.80% $15,800,882 $15,567,709 1.50% $3,763,056 9.56
5 Norcal Group 7.75% $15,706,050 $17,252,340 (8.96%) $3,176,484 31.55
6 Coverys Group 4.53% $9,184,418 $4,191,031 119.14% $2,992,192 6.64
7 Health Care Indemnity Inc. 4.24% $8,583,227 $7,870,213 9.06% ($1,606,451) **
8 Texas Medical Liability Trust Group 3.20% $6,477,657 $6,266,154 3.38% $2,489,413 4.10
9 NCMIC Group 2.81% $5,698,363 $5,831,158 (2.28%) ($707,192) 2.74
10 National Group 2.75% $5,563,620 $3,576,377 55.57% $971,259 0.64
11 Church Mutual Group 1.84% $3,726,281 $1,807,786 106.12% ($425,923) 3.76
12 Liberty Mutual Group 1.76% $3,563,153 $3,219,821 10.66% $1,786,355 5.61
13 Texas Hospital Insurance Exchange 1.55% $3,130,759 $2,947,292 6.22% $1,953,795 5.53
14 MAG Mutual Insurance Group 1.53% $3,099,506 $1,201,832 157.90% $3,411,070 **
15 Pharmacists Mutual Group 1.13% $2,285,795 $2,110,067 8.33% $4,035,068 293.79
16 Chubb Limited Group 0.92% $1,867,264 $1,692,079 10.35% $1,038,303 16.24
17 Alleghany Group 0.73% $1,483,317 $1,487,311 (0.27%) $1,304,951 **
18 Fairfax Financial Group 0.68% $1,375,451 $1,314,588 4.63% $281,375 **
19 WR Berkley Corp. Group 0.45% $908,330 $785,362 15.66% $25,778 4.71
20 Athene Group 0.42% $846,318 $560,262 51.06% $405,501 15.43
21 American International Group 0.39% $784,816 $831,893 (5.66%) $1,016,174 53.55
22 ISMIE Group 0.37% $749,757 $122,343 512.83% ($152,656) **
23 Medmal Direct Insurance Company 0.29% $593,620 $444,731 33.48% ($175,829) 33.52
24 The Hanover Insurance Group 0.29% $591,918 $669,981 (11.65%) $684 12.33
25 Cincinnati Financial Group 0.14% $278,623 $253,309 9.99% $387,153 59.82
Top 25 Groups Total 99.74% $202,016,314 $189,552,320 6.58% $64,244,459 24.70
Total Market 100.00% $202,535,582 $190,586,314 6.27% $62,677,389 24.93
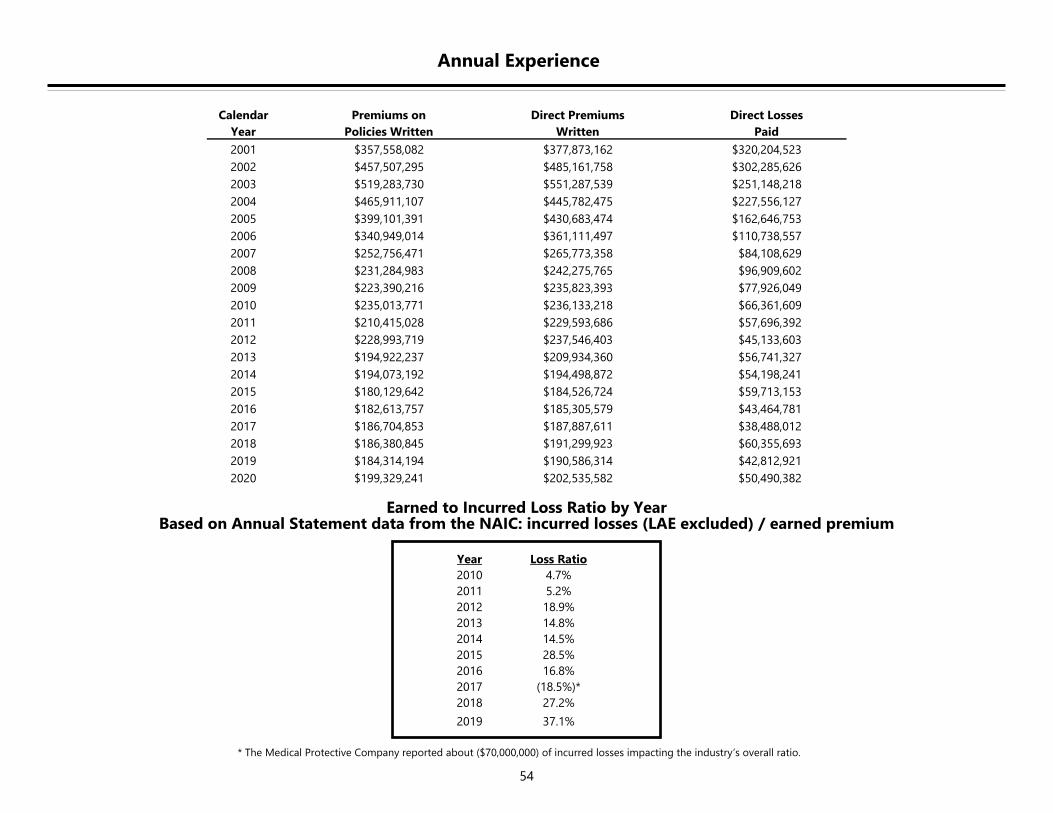
54
Annual Experience
Earned to Incurred Loss Ratio by Year Based on Annual Statement data from the NAIC: incurred losses (LAE excluded) / earned premium
* The Medical Protective Company reported about ($70,000,000) of incurred losses impacting the industry’s overall ratio.
Year Loss Ratio
2010 4.7%
2011 5.2%
2012 18.9%
2013 14.8%
2014 14.5%
2015 28.5%
2016 16.8%
2017 (18.5%)*
2018 27.2%
2019 37.1%
Calendar Premiums on Direct Premiums Direct Losses
Year Policies Written Written Paid
2001 $357,558,082 $377,873,162 $320,204,523
2002 $457,507,295 $485,161,758 $302,285,626
2003 $519,283,730 $551,287,539 $251,148,218
2004 $465,911,107 $445,782,475 $227,556,127
2005 $399,101,391 $430,683,474 $162,646,753
2006 $340,949,014 $361,111,497 $110,738,557
2007 $252,756,471 $265,773,358 $84,108,629
2008 $231,284,983 $242,275,765 $96,909,602
2009 $223,390,216 $235,823,393 $77,926,049
2010 $235,013,771 $236,133,218 $66,361,609
2011 $210,415,028 $229,593,686 $57,696,392
2012 $228,993,719 $237,546,403 $45,133,603
2013 $194,922,237 $209,934,360 $56,741,327
2014 $194,073,192 $194,498,872 $54,198,241
2015 $180,129,642 $184,526,724 $59,713,153
2016 $182,613,757 $185,305,579 $43,464,781
2017 $186,704,853 $187,887,611 $38,488,012
2018 $186,380,845 $191,299,923 $60,355,693
2019 $184,314,194 $190,586,314 $42,812,921
2020 $199,329,241 $202,535,582 $50,490,382
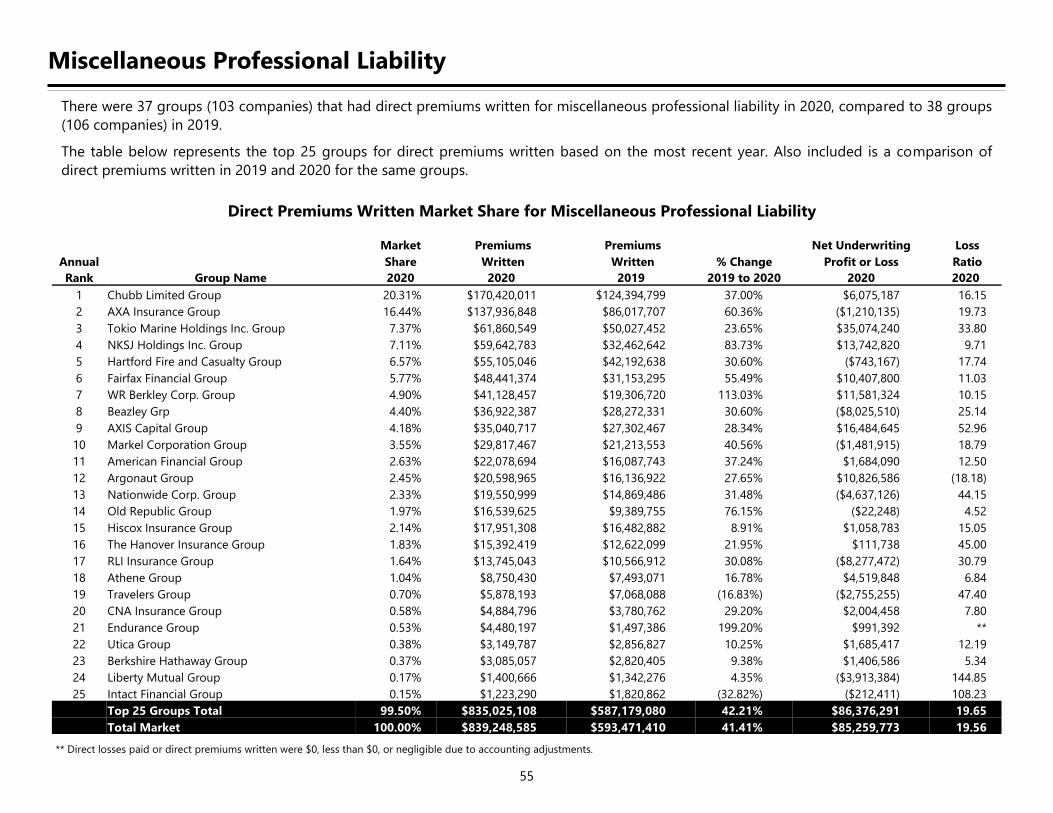
55
Miscellaneous Professional Liability
There were 37 groups (103 companies) that had direct premiums written for miscellaneous professional liability in 2020, compared to 38 groups
(106 companies) in 2019.
The table below represents the top 25 groups for direct premiums written based on the most recent year. Also included is a comparison of
direct premiums written in 2019 and 2020 for the same groups.
Direct Premiums Written Market Share for Miscellaneous Professional Liability
** Direct losses paid or direct premiums written were $0, less than $0, or negligible due to accounting adjustments.
Market Premiums Premiums Net Underwriting Loss
Annual Share Written Written % Change Profit or Loss Ratio
Rank Group Name 2020 2020 2019 2019 to 2020 2020 2020
1 Chubb Limited Group 20.31% $170,420,011 $124,394,799 37.00% $6,075,187 16.15
2 AXA Insurance Group 16.44% $137,936,848 $86,017,707 60.36% ($1,210,135) 19.73
3 Tokio Marine Holdings Inc. Group 7.37% $61,860,549 $50,027,452 23.65% $35,074,240 33.80
4 NKSJ Holdings Inc. Group 7.11% $59,642,783 $32,462,642 83.73% $13,742,820 9.71
5 Hartford Fire and Casualty Group 6.57% $55,105,046 $42,192,638 30.60% ($743,167) 17.74
6 Fairfax Financial Group 5.77% $48,441,374 $31,153,295 55.49% $10,407,800 11.03
7 WR Berkley Corp. Group 4.90% $41,128,457 $19,306,720 113.03% $11,581,324 10.15
8 Beazley Grp 4.40% $36,922,387 $28,272,331 30.60% ($8,025,510) 25.14
9 AXIS Capital Group 4.18% $35,040,717 $27,302,467 28.34% $16,484,645 52.96
10 Markel Corporation Group 3.55% $29,817,467 $21,213,553 40.56% ($1,481,915) 18.79
11 American Financial Group 2.63% $22,078,694 $16,087,743 37.24% $1,684,090 12.50
12 Argonaut Group 2.45% $20,598,965 $16,136,922 27.65% $10,826,586 (18.18)
13 Nationwide Corp. Group 2.33% $19,550,999 $14,869,486 31.48% ($4,637,126) 44.15
14 Old Republic Group 1.97% $16,539,625 $9,389,755 76.15% ($22,248) 4.52
15 Hiscox Insurance Group 2.14% $17,951,308 $16,482,882 8.91% $1,058,783 15.05
16 The Hanover Insurance Group 1.83% $15,392,419 $12,622,099 21.95% $111,738 45.00
17 RLI Insurance Group 1.64% $13,745,043 $10,566,912 30.08% ($8,277,472) 30.79
18 Athene Group 1.04% $8,750,430 $7,493,071 16.78% $4,519,848 6.84
19 Travelers Group 0.70% $5,878,193 $7,068,088 (16.83%) ($2,755,255) 47.40
20 CNA Insurance Group 0.58% $4,884,796 $3,780,762 29.20% $2,004,458 7.80
21 Endurance Group 0.53% $4,480,197 $1,497,386 199.20% $991,392 **
22 Utica Group 0.38% $3,149,787 $2,856,827 10.25% $1,685,417 12.19
23 Berkshire Hathaway Group 0.37% $3,085,057 $2,820,405 9.38% $1,406,586 5.34
24 Liberty Mutual Group 0.17% $1,400,666 $1,342,276 4.35% ($3,913,384) 144.85
25 Intact Financial Group 0.15% $1,223,290 $1,820,862 (32.82%) ($212,411) 108.23
Top 25 Groups Total 99.50% $835,025,108 $587,179,080 42.21% $86,376,291 19.65
Total Market 100.00% $839,248,585 $593,471,410 41.41% $85,259,773 19.56
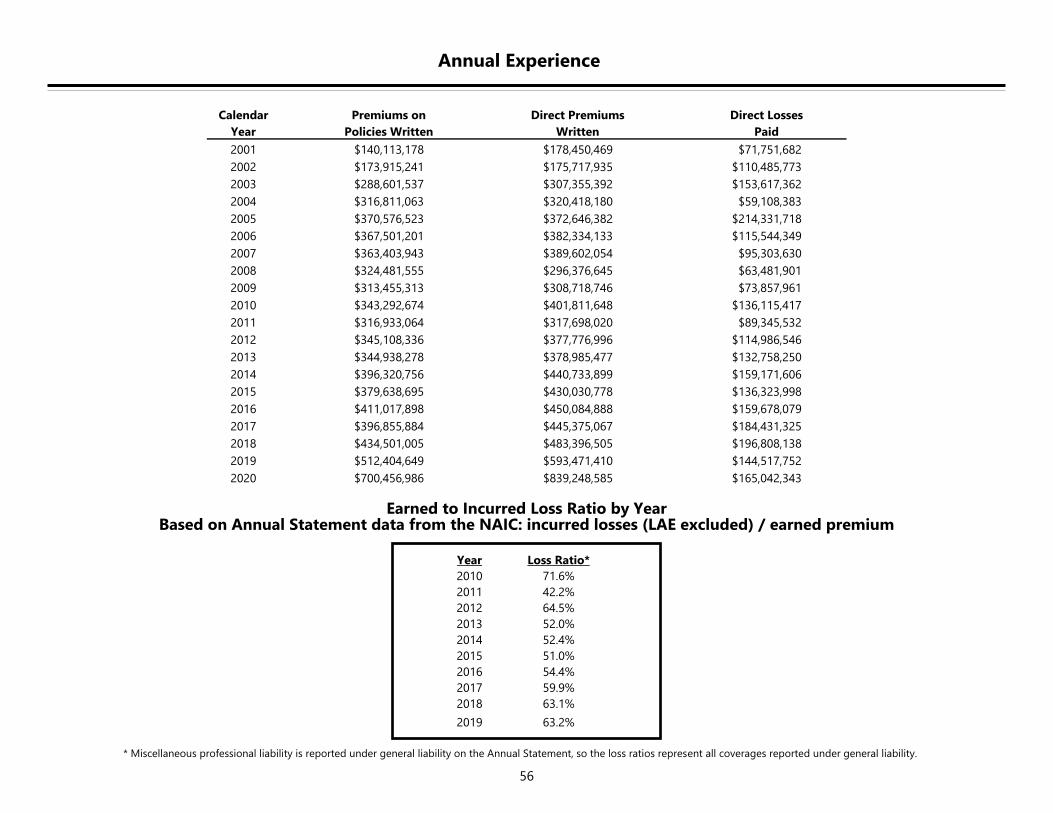
56
Annual Experience
Earned to Incurred Loss Ratio by Year Based on Annual Statement data from the NAIC: incurred losses (LAE excluded) / earned premium
* Miscellaneous professional liability is reported under general liability on the Annual Statement, so the loss ratios represent all coverages reported under general liability.
Year Loss Ratio*
2010 71.6%
2011 42.2%
2012 64.5%
2013 52.0%
2014 52.4%
2015 51.0%
2016 54.4%
2017 59.9%
2018 63.1%
2019 63.2%
Calendar Premiums on Direct Premiums Direct Losses
Year Policies Written Written Paid
2001 $140,113,178 $178,450,469 $71,751,682
2002 $173,915,241 $175,717,935 $110,485,773
2003 $288,601,537 $307,355,392 $153,617,362
2004 $316,811,063 $320,418,180 $59,108,383
2005 $370,576,523 $372,646,382 $214,331,718
2006 $367,501,201 $382,334,133 $115,544,349
2007 $363,403,943 $389,602,054 $95,303,630
2008 $324,481,555 $296,376,645 $63,481,901
2009 $313,455,313 $308,718,746 $73,857,961
2010 $343,292,674 $401,811,648 $136,115,417
2011 $316,933,064 $317,698,020 $89,345,532
2012 $345,108,336 $377,776,996 $114,986,546
2013 $344,938,278 $378,985,477 $132,758,250
2014 $396,320,756 $440,733,899 $159,171,606
2015 $379,638,695 $430,030,778 $136,323,998
2016 $411,017,898 $450,084,888 $159,678,079
2017 $396,855,884 $445,375,067 $184,431,325
2018 $434,501,005 $483,396,505 $196,808,138
2019 $512,404,649 $593,471,410 $144,517,752
2020 $700,456,986 $839,248,585 $165,042,343
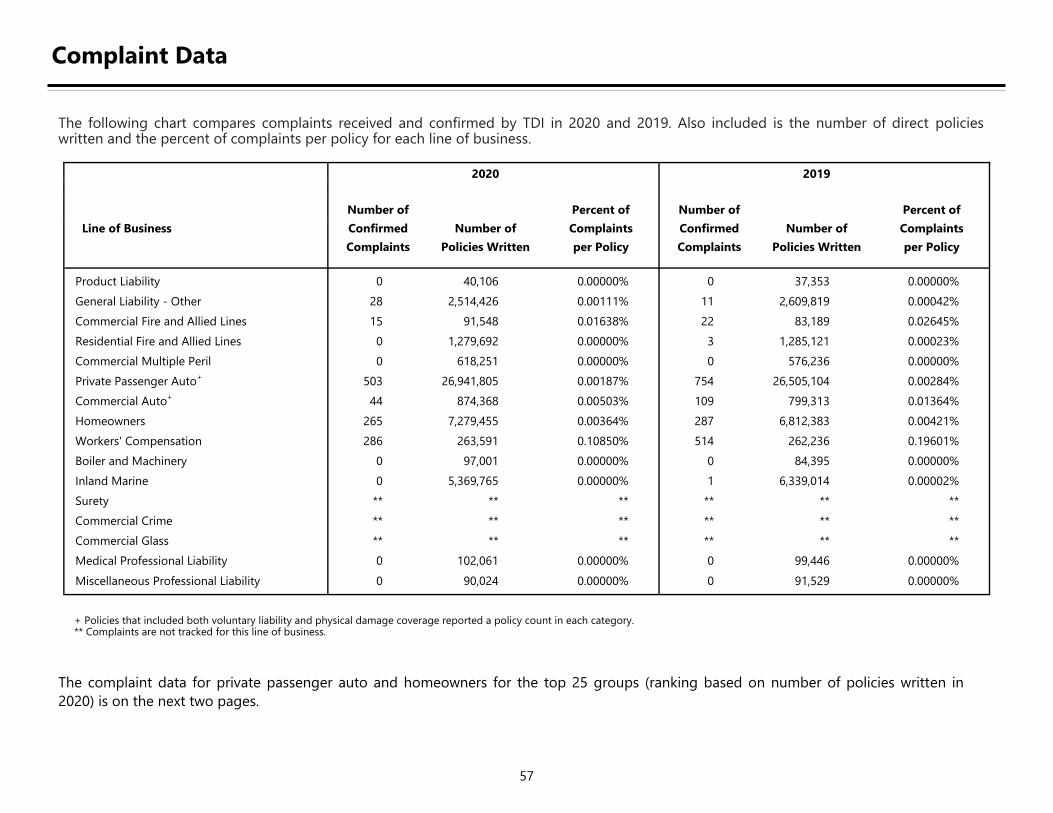
57
Complaint Data
The following chart compares complaints received and confirmed by TDI in 2020 and 2019. Also included is the number of direct policies written and the percent of complaints per policy for each line of business.
+ Policies that included both voluntary liability and physical damage coverage reported a policy count in each category. ** Complaints are not tracked for this line of business.
The complaint data for private passenger auto and homeowners for the top 25 groups (ranking based on number of policies written in
2020) is on the next two pages.
2020 2019
Number of Percent of Number of Percent of
Line of Business Confirmed Number of Complaints Confirmed Number of Complaints
Complaints Policies Written per Policy Complaints Policies Written per Policy
Product Liability 0 40,106 0.00000% 0 37,353 0.00000%
General Liability - Other 28 2,514,426 0.00111% 11 2,609,819 0.00042%
Commercial Fire and Allied Lines 15 91,548 0.01638% 22 83,189 0.02645%
Residential Fire and Allied Lines 0 1,279,692 0.00000% 3 1,285,121 0.00023%
Commercial Multiple Peril 0 618,251 0.00000% 0 576,236 0.00000%
Private Passenger Auto+
503 26,941,805 0.00187% 754 26,505,104 0.00284%
Commercial Auto+
44 874,368 0.00503% 109 799,313 0.01364%
Homeowners 265 7,279,455 0.00364% 287 6,812,383 0.00421%
Workers' Compensation 286 263,591 0.10850% 514 262,236 0.19601%
Boiler and Machinery 0 97,001 0.00000% 0 84,395 0.00000%
Inland Marine 0 5,369,765 0.00000% 1 6,339,014 0.00002%
Surety ** ** ** ** ** **
Commercial Crime ** ** ** ** ** **
Commercial Glass ** ** ** ** ** **
Medical Professional Liability 0 102,061 0.00000% 0 99,446 0.00000%
Miscellaneous Professional Liability 0 90,024 0.00000% 0 91,529 0.00000%
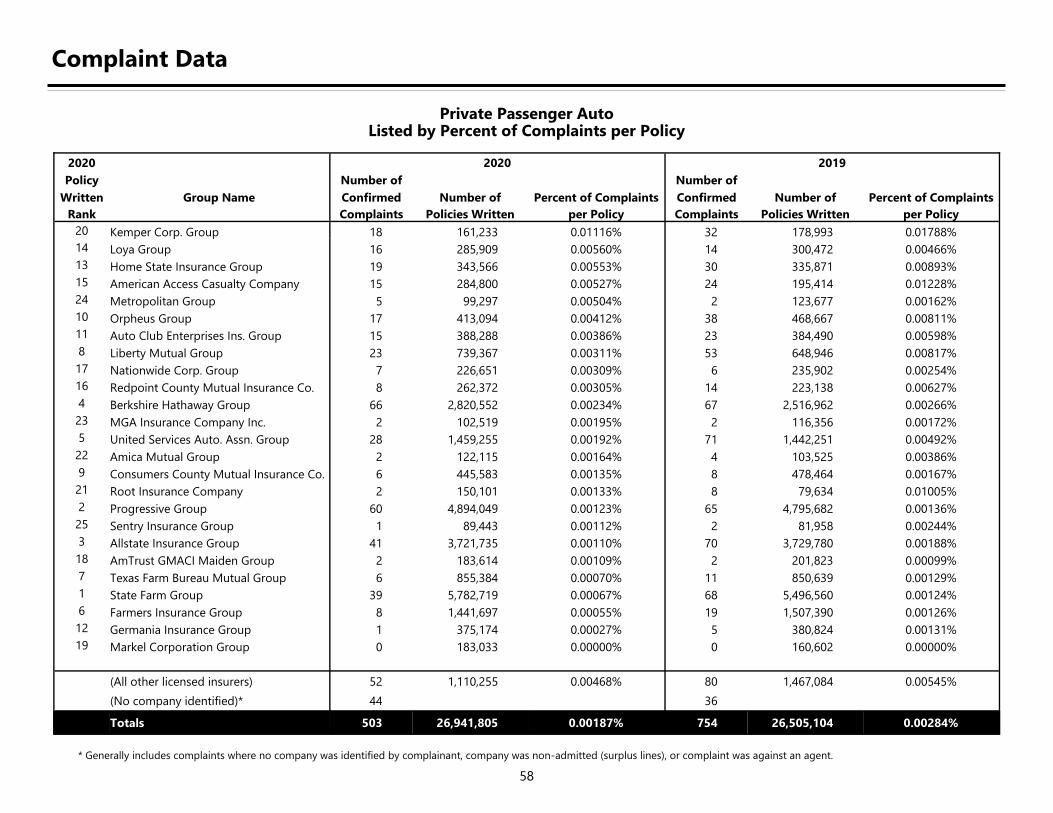
58
Complaint Data
Private Passenger Auto Listed by Percent of Complaints per Policy
* Generally includes complaints where no company was identified by complainant, company was non-admitted (surplus lines), or complaint was against an agent.
2020 2020 2019
Policy Number of Number of
Written Group Name Confirmed Number of Percent of Complaints Confirmed Number of Percent of Complaints
Rank Complaints Policies Written per Policy Complaints Policies Written per Policy
20 Kemper Corp. Group 18 161,233 0.01116% 32 178,993 0.01788%
14 Loya Group 16 285,909 0.00560% 14 300,472 0.00466%
13 Home State Insurance Group 19 343,566 0.00553% 30 335,871 0.00893%
15 American Access Casualty Company 15 284,800 0.00527% 24 195,414 0.01228%
24 Metropolitan Group 5 99,297 0.00504% 2 123,677 0.00162%
10 Orpheus Group 17 413,094 0.00412% 38 468,667 0.00811%
11 Auto Club Enterprises Ins. Group 15 388,288 0.00386% 23 384,490 0.00598%
8 Liberty Mutual Group 23 739,367 0.00311% 53 648,946 0.00817%
17 Nationwide Corp. Group 7 226,651 0.00309% 6 235,902 0.00254%
16 Redpoint County Mutual Insurance Co. 8 262,372 0.00305% 14 223,138 0.00627%
4 Berkshire Hathaway Group 66 2,820,552 0.00234% 67 2,516,962 0.00266%
23 MGA Insurance Company Inc. 2 102,519 0.00195% 2 116,356 0.00172%
5 United Services Auto. Assn. Group 28 1,459,255 0.00192% 71 1,442,251 0.00492%
22 Amica Mutual Group 2 122,115 0.00164% 4 103,525 0.00386%
9 Consumers County Mutual Insurance Co. 6 445,583 0.00135% 8 478,464 0.00167%
21 Root Insurance Company 2 150,101 0.00133% 8 79,634 0.01005%
2 Progressive Group 60 4,894,049 0.00123% 65 4,795,682 0.00136%
25 Sentry Insurance Group 1 89,443 0.00112% 2 81,958 0.00244%
3 Allstate Insurance Group 41 3,721,735 0.00110% 70 3,729,780 0.00188%
18 AmTrust GMACI Maiden Group 2 183,614 0.00109% 2 201,823 0.00099%
7 Texas Farm Bureau Mutual Group 6 855,384 0.00070% 11 850,639 0.00129%
1 State Farm Group 39 5,782,719 0.00067% 68 5,496,560 0.00124%
6 Farmers Insurance Group 8 1,441,697 0.00055% 19 1,507,390 0.00126%
12 Germania Insurance Group 1 375,174 0.00027% 5 380,824 0.00131%
19 Markel Corporation Group 0 183,033 0.00000% 0 160,602 0.00000%
(All other licensed insurers) 52 1,110,255 0.00468% 80 1,467,084 0.00545%
(No company identified)* 44 36
Totals 503 26,941,805 0.00187% 754 26,505,104 0.00284%
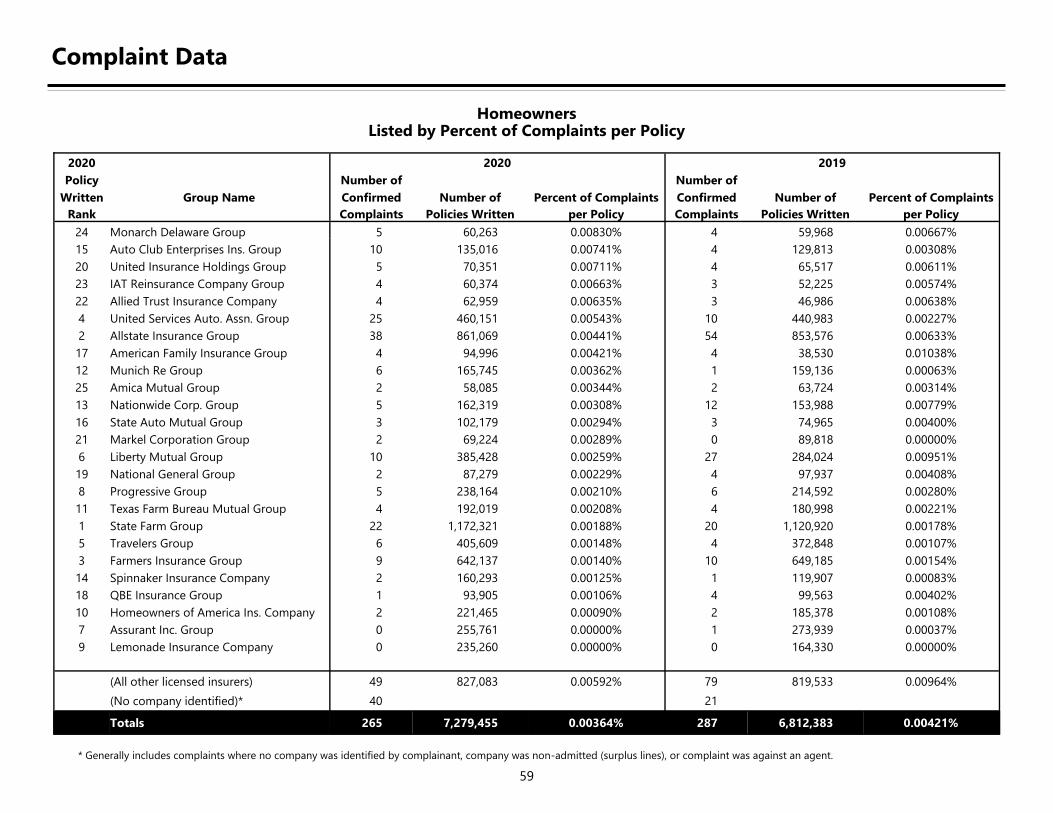
59
Complaint Data
Homeowners Listed by Percent of Complaints per Policy
* Generally includes complaints where no company was identified by complainant, company was non-admitted (surplus lines), or complaint was against an agent.
2020 2020 2019
Policy Number of Number of
Written Group Name Confirmed Number of Percent of Complaints Confirmed Number of Percent of Complaints
Rank Complaints Policies Written per Policy Complaints Policies Written per Policy
24 Monarch Delaware Group 5 60,263 0.00830% 4 59,968 0.00667%
15 Auto Club Enterprises Ins. Group 10 135,016 0.00741% 4 129,813 0.00308%
20 United Insurance Holdings Group 5 70,351 0.00711% 4 65,517 0.00611%
23 IAT Reinsurance Company Group 4 60,374 0.00663% 3 52,225 0.00574%
22 Allied Trust Insurance Company 4 62,959 0.00635% 3 46,986 0.00638%
4 United Services Auto. Assn. Group 25 460,151 0.00543% 10 440,983 0.00227%
2 Allstate Insurance Group 38 861,069 0.00441% 54 853,576 0.00633%
17 American Family Insurance Group 4 94,996 0.00421% 4 38,530 0.01038%
12 Munich Re Group 6 165,745 0.00362% 1 159,136 0.00063%
25 Amica Mutual Group 2 58,085 0.00344% 2 63,724 0.00314%
13 Nationwide Corp. Group 5 162,319 0.00308% 12 153,988 0.00779%
16 State Auto Mutual Group 3 102,179 0.00294% 3 74,965 0.00400%
21 Markel Corporation Group 2 69,224 0.00289% 0 89,818 0.00000%
6 Liberty Mutual Group 10 385,428 0.00259% 27 284,024 0.00951%
19 National General Group 2 87,279 0.00229% 4 97,937 0.00408%
8 Progressive Group 5 238,164 0.00210% 6 214,592 0.00280%
11 Texas Farm Bureau Mutual Group 4 192,019 0.00208% 4 180,998 0.00221%
1 State Farm Group 22 1,172,321 0.00188% 20 1,120,920 0.00178%
5 Travelers Group 6 405,609 0.00148% 4 372,848 0.00107%
3 Farmers Insurance Group 9 642,137 0.00140% 10 649,185 0.00154%
14 Spinnaker Insurance Company 2 160,293 0.00125% 1 119,907 0.00083%
18 QBE Insurance Group 1 93,905 0.00106% 4 99,563 0.00402%
10 Homeowners of America Ins. Company 2 221,465 0.00090% 2 185,378 0.00108%
7 Assurant Inc. Group 0 255,761 0.00000% 1 273,939 0.00037%
9 Lemonade Insurance Company 0 235,260 0.00000% 0 164,330 0.00000%
(All other licensed insurers) 49 827,083 0.00592% 79 819,533 0.00964%
(No company identified)* 40 21
Totals 265 7,279,455 0.00364% 287 6,812,383 0.00421%
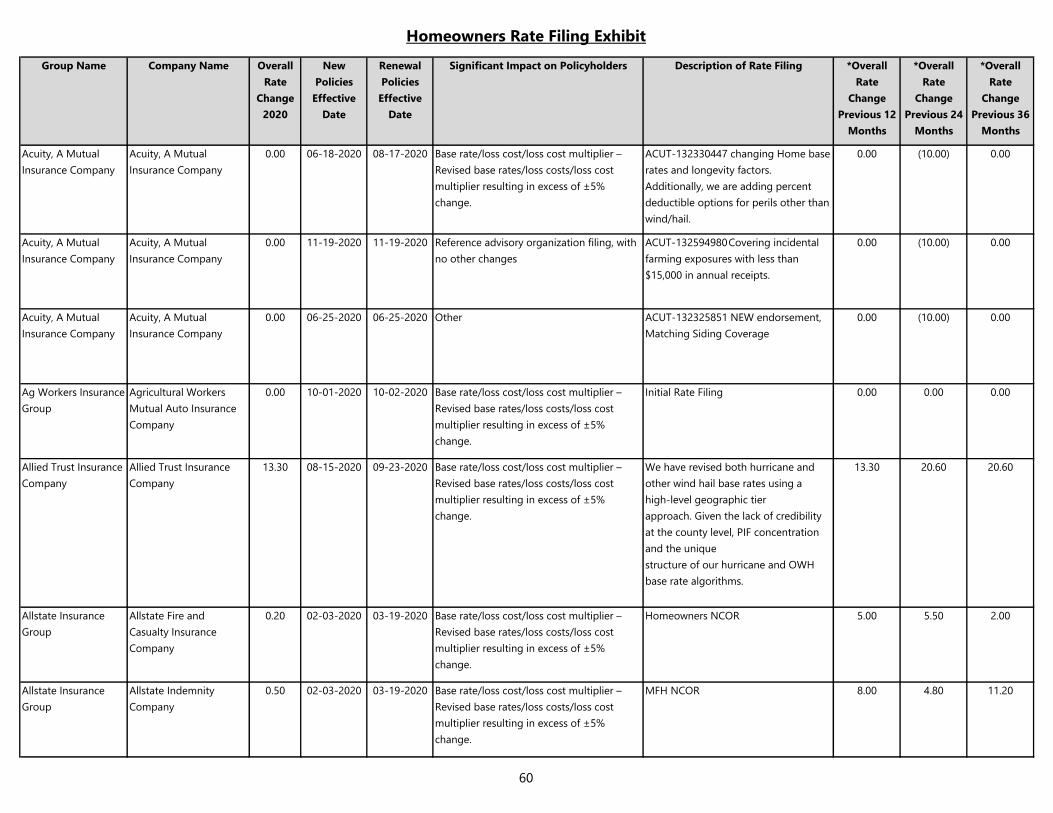
Homeowners Rate Filing Exhibit
Group Name Company Name Overall
Rate
Change
2020
New
Policies
Effective
Date
Renewal
Policies
Effective
Date
Significant Impact on Policyholders Description of Rate Filing *Overall
Rate
Change
Previous 12
Months
*Overall
Rate
Change
Previous 24
Months
*Overall
Rate
Change
Previous 36
Months
Acuity, A Mutual
Insurance Company
Acuity, A Mutual
Insurance Company
0.00 06-18-2020 08-17-2020 Base rate/loss cost/loss cost multiplier –
Revised base rates/loss costs/loss cost
multiplier resulting in excess of ±5%
change.
ACUT-132330447 changing Home base
rates and longevity factors.
Additionally, we are adding percent
deductible options for perils other than
wind/hail.
0.00 (10.00) 0.00
Acuity, A Mutual
Insurance Company
Acuity, A Mutual
Insurance Company
0.00 11-19-2020 11-19-2020 Reference advisory organization filing, with
no other changes
ACUT-132594980 Covering incidental
farming exposures with less than
$15,000 in annual receipts.
0.00 (10.00) 0.00
Acuity, A Mutual
Insurance Company
Acuity, A Mutual
Insurance Company
0.00 06-25-2020 06-25-2020 Other ACUT-132325851 NEW endorsement,
Matching Siding Coverage
0.00 (10.00) 0.00
Ag Workers Insurance
Group
Agricultural Workers
Mutual Auto Insurance
Company
0.00 10-01-2020 10-02-2020 Base rate/loss cost/loss cost multiplier –
Revised base rates/loss costs/loss cost
multiplier resulting in excess of ±5%
change.
Initial Rate Filing 0.00 0.00 0.00
Allied Trust Insurance
Company
Allied Trust Insurance
Company
13.30 08-15-2020 09-23-2020 Base rate/loss cost/loss cost multiplier –
Revised base rates/loss costs/loss cost
multiplier resulting in excess of ±5%
change.
We have revised both hurricane and
other wind hail base rates using a
high‐level geographic tier
approach. Given the lack of credibility
at the county level, PIF concentration
and the unique
structure of our hurricane and OWH
base rate algorithms.
13.30 20.60 20.60
Allstate Insurance
Group
Allstate Fire and
Casualty Insurance
Company
0.20 02-03-2020 03-19-2020 Base rate/loss cost/loss cost multiplier –
Revised base rates/loss costs/loss cost
multiplier resulting in excess of ±5%
change.
Homeowners NCOR 5.00 5.50 2.00
Allstate Insurance
Group
Allstate Indemnity
Company
0.50 02-03-2020 03-19-2020 Base rate/loss cost/loss cost multiplier –
Revised base rates/loss costs/loss cost
multiplier resulting in excess of ±5%
change.
MFH NCOR 8.00 4.80 11.20
60
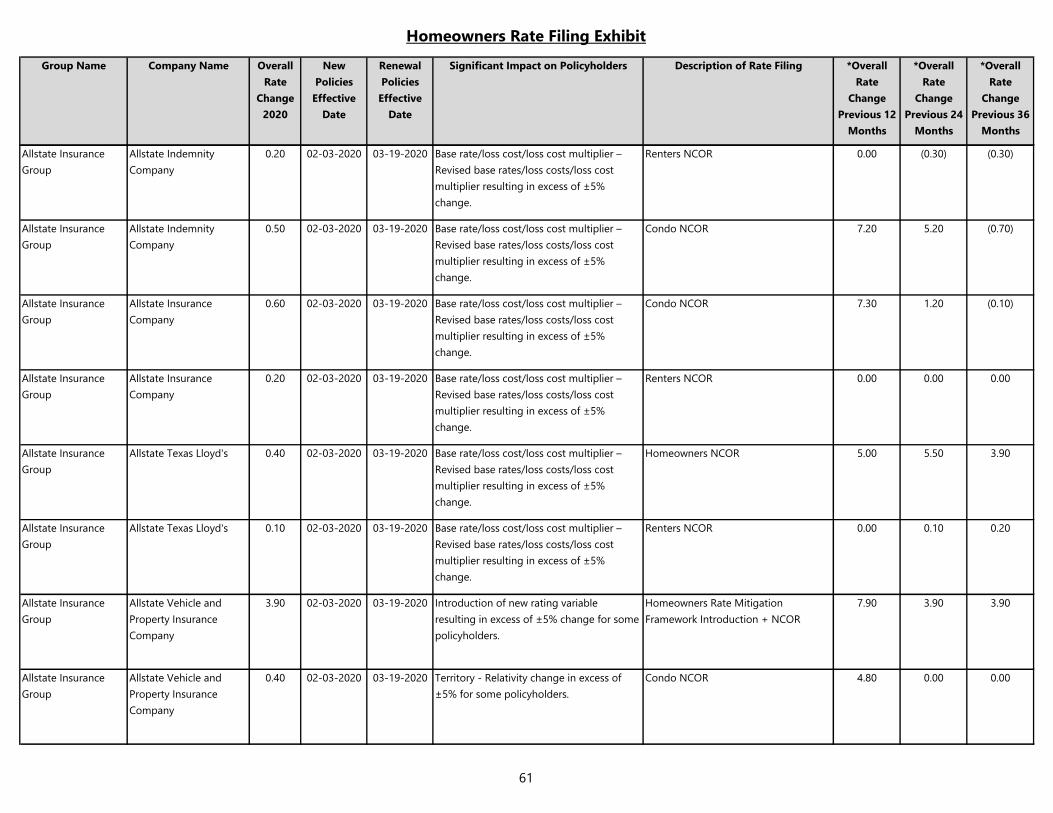
Homeowners Rate Filing Exhibit
Group Name Company Name Overall
Rate
Change
2020
New
Policies
Effective
Date
Renewal
Policies
Effective
Date
Significant Impact on Policyholders Description of Rate Filing *Overall
Rate
Change
Previous 12
Months
*Overall
Rate
Change
Previous 24
Months
*Overall
Rate
Change
Previous 36
Months
Allstate Insurance
Group
Allstate Indemnity
Company
0.20 02-03-2020 03-19-2020 Base rate/loss cost/loss cost multiplier –
Revised base rates/loss costs/loss cost
multiplier resulting in excess of ±5%
change.
Renters NCOR 0.00 (0.30) (0.30)
Allstate Insurance
Group
Allstate Indemnity
Company
0.50 02-03-2020 03-19-2020 Base rate/loss cost/loss cost multiplier –
Revised base rates/loss costs/loss cost
multiplier resulting in excess of ±5%
change.
Condo NCOR 7.20 5.20 (0.70)
Allstate Insurance
Group
Allstate Insurance
Company
0.60 02-03-2020 03-19-2020 Base rate/loss cost/loss cost multiplier –
Revised base rates/loss costs/loss cost
multiplier resulting in excess of ±5%
change.
Condo NCOR 7.30 1.20 (0.10)
Allstate Insurance
Group
Allstate Insurance
Company
0.20 02-03-2020 03-19-2020 Base rate/loss cost/loss cost multiplier –
Revised base rates/loss costs/loss cost
multiplier resulting in excess of ±5%
change.
Renters NCOR 0.00 0.00 0.00
Allstate Insurance
Group
Allstate Texas Lloyd's 0.40 02-03-2020 03-19-2020 Base rate/loss cost/loss cost multiplier –
Revised base rates/loss costs/loss cost
multiplier resulting in excess of ±5%
change.
Homeowners NCOR 5.00 5.50 3.90
Allstate Insurance
Group
Allstate Texas Lloyd's 0.10 02-03-2020 03-19-2020 Base rate/loss cost/loss cost multiplier –
Revised base rates/loss costs/loss cost
multiplier resulting in excess of ±5%
change.
Renters NCOR 0.00 0.10 0.20
Allstate Insurance
Group
Allstate Vehicle and
Property Insurance
Company
3.90 02-03-2020 03-19-2020 Introduction of new rating variable
resulting in excess of ±5% change for some
policyholders.
Homeowners Rate Mitigation
Framework Introduction + NCOR
7.90 3.90 3.90
Allstate Insurance
Group
Allstate Vehicle and
Property Insurance
Company
0.40 02-03-2020 03-19-2020 Territory - Relativity change in excess of
±5% for some policyholders.
Condo NCOR 4.80 0.00 0.00
61
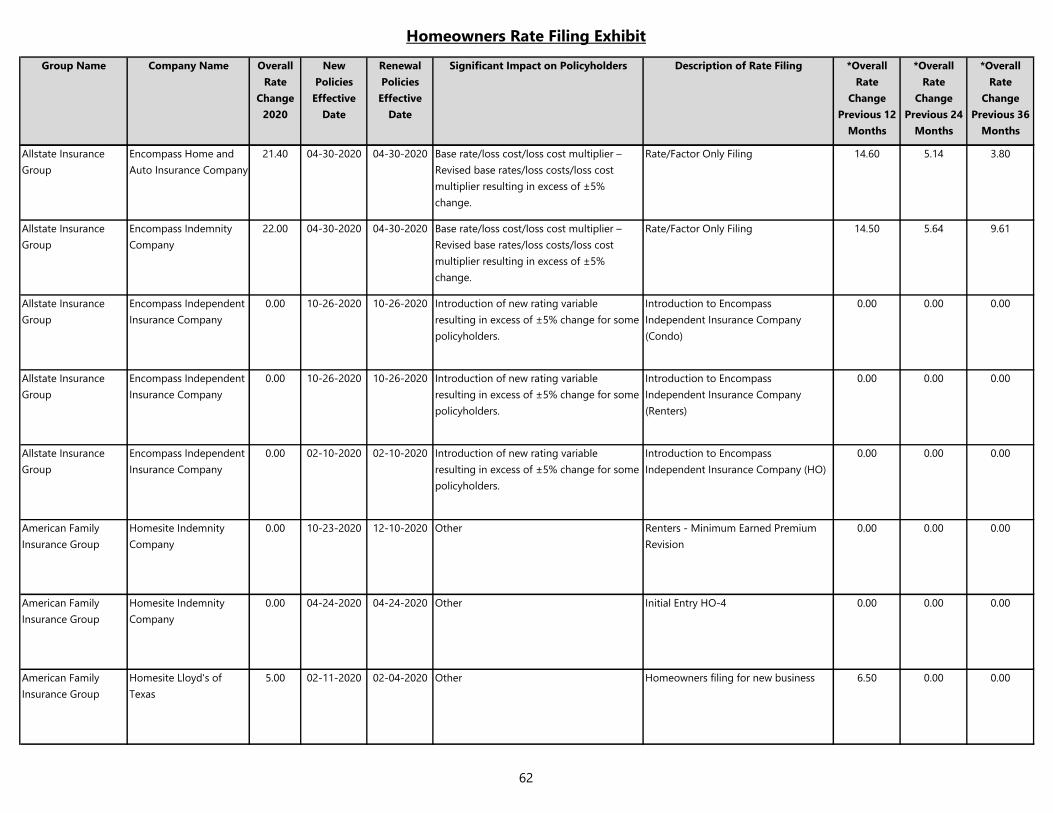
Homeowners Rate Filing Exhibit
Group Name Company Name Overall
Rate
Change
2020
New
Policies
Effective
Date
Renewal
Policies
Effective
Date
Significant Impact on Policyholders Description of Rate Filing *Overall
Rate
Change
Previous 12
Months
*Overall
Rate
Change
Previous 24
Months
*Overall
Rate
Change
Previous 36
Months
Allstate Insurance
Group
Encompass Home and
Auto Insurance Company
21.40 04-30-2020 04-30-2020 Base rate/loss cost/loss cost multiplier –
Revised base rates/loss costs/loss cost
multiplier resulting in excess of ±5%
change.
Rate/Factor Only Filing 14.60 5.14 3.80
Allstate Insurance
Group
Encompass Indemnity
Company
22.00 04-30-2020 04-30-2020 Base rate/loss cost/loss cost multiplier –
Revised base rates/loss costs/loss cost
multiplier resulting in excess of ±5%
change.
Rate/Factor Only Filing 14.50 5.64 9.61
Allstate Insurance
Group
Encompass Independent
Insurance Company
0.00 10-26-2020 10-26-2020 Introduction of new rating variable
resulting in excess of ±5% change for some
policyholders.
Introduction to Encompass
Independent Insurance Company
(Condo)
0.00 0.00 0.00
Allstate Insurance
Group
Encompass Independent
Insurance Company
0.00 10-26-2020 10-26-2020 Introduction of new rating variable
resulting in excess of ±5% change for some
policyholders.
Introduction to Encompass
Independent Insurance Company
(Renters)
0.00 0.00 0.00
Allstate Insurance
Group
Encompass Independent
Insurance Company
0.00 02-10-2020 02-10-2020 Introduction of new rating variable
resulting in excess of ±5% change for some
policyholders.
Introduction to Encompass
Independent Insurance Company (HO)
0.00 0.00 0.00
American Family
Insurance Group
Homesite Indemnity
Company
0.00 10-23-2020 12-10-2020 Other Renters - Minimum Earned Premium
Revision
0.00 0.00 0.00
American Family
Insurance Group
Homesite Indemnity
Company
0.00 04-24-2020 04-24-2020 Other Initial Entry HO-4 0.00 0.00 0.00
American Family
Insurance Group
Homesite Lloyd's of
Texas
5.00 02-11-2020 02-04-2020 Other Homeowners filing for new business 6.50 0.00 0.00
62
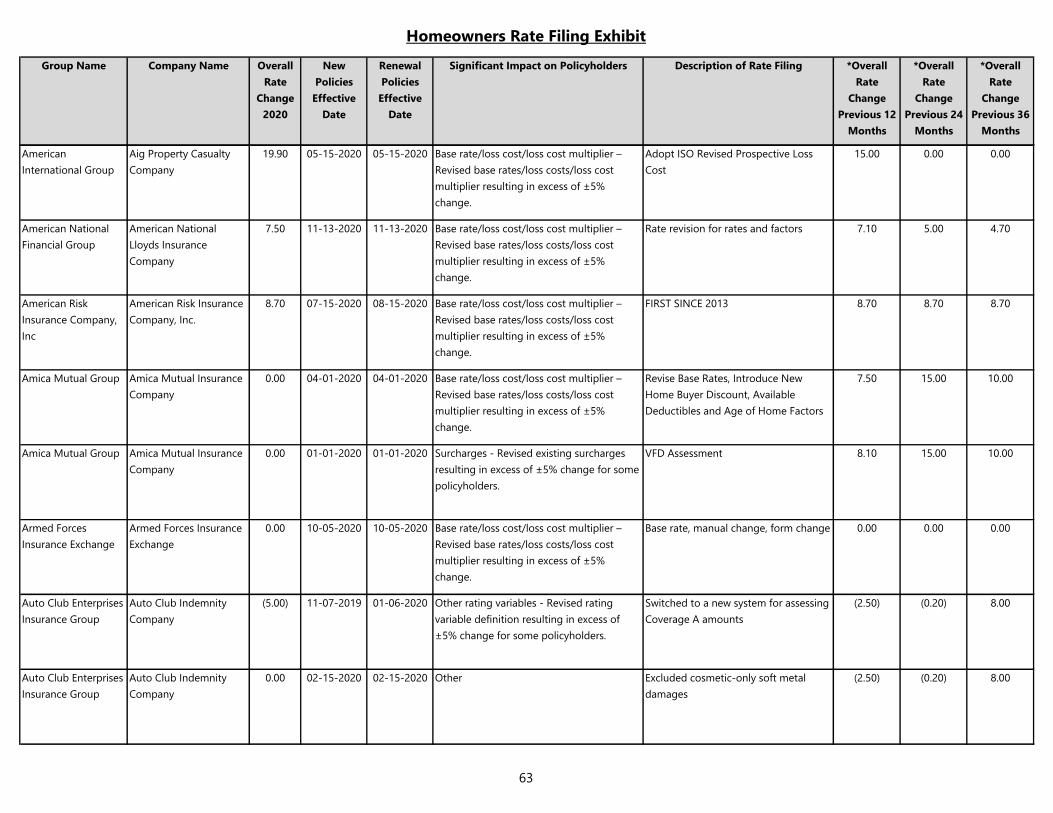
Homeowners Rate Filing Exhibit
Group Name Company Name Overall
Rate
Change
2020
New
Policies
Effective
Date
Renewal
Policies
Effective
Date
Significant Impact on Policyholders Description of Rate Filing *Overall
Rate
Change
Previous 12
Months
*Overall
Rate
Change
Previous 24
Months
*Overall
Rate
Change
Previous 36
Months
American
International Group
Aig Property Casualty
Company
19.90 05-15-2020 05-15-2020 Base rate/loss cost/loss cost multiplier –
Revised base rates/loss costs/loss cost
multiplier resulting in excess of ±5%
change.
Adopt ISO Revised Prospective Loss
Cost
15.00 0.00 0.00
American National
Financial Group
American National
Lloyds Insurance
Company
7.50 11-13-2020 11-13-2020 Base rate/loss cost/loss cost multiplier –
Revised base rates/loss costs/loss cost
multiplier resulting in excess of ±5%
change.
Rate revision for rates and factors 7.10 5.00 4.70
American Risk
Insurance Company,
Inc
American Risk Insurance
Company, Inc.
8.70 07-15-2020 08-15-2020 Base rate/loss cost/loss cost multiplier –
Revised base rates/loss costs/loss cost
multiplier resulting in excess of ±5%
change.
FIRST SINCE 2013 8.70 8.70 8.70
Amica Mutual Group Amica Mutual Insurance
Company
0.00 04-01-2020 04-01-2020 Base rate/loss cost/loss cost multiplier –
Revised base rates/loss costs/loss cost
multiplier resulting in excess of ±5%
change.
Revise Base Rates, Introduce New
Home Buyer Discount, Available
Deductibles and Age of Home Factors
7.50 15.00 10.00
Amica Mutual Group Amica Mutual Insurance
Company
0.00 01-01-2020 01-01-2020 Surcharges - Revised existing surcharges
resulting in excess of ±5% change for some
policyholders.
VFD Assessment 8.10 15.00 10.00
Armed Forces
Insurance Exchange
Armed Forces Insurance
Exchange
0.00 10-05-2020 10-05-2020 Base rate/loss cost/loss cost multiplier –
Revised base rates/loss costs/loss cost
multiplier resulting in excess of ±5%
change.
Base rate, manual change, form change 0.00 0.00 0.00
Auto Club Enterprises
Insurance Group
Auto Club Indemnity
Company
(5.00) 11-07-2019 01-06-2020 Other rating variables - Revised rating
variable definition resulting in excess of
±5% change for some policyholders.
Switched to a new system for assessing
Coverage A amounts
(2.50) (0.20) 8.00
Auto Club Enterprises
Insurance Group
Auto Club Indemnity
Company
0.00 02-15-2020 02-15-2020 Other Excluded cosmetic-only soft metal
damages
(2.50) (0.20) 8.00
63
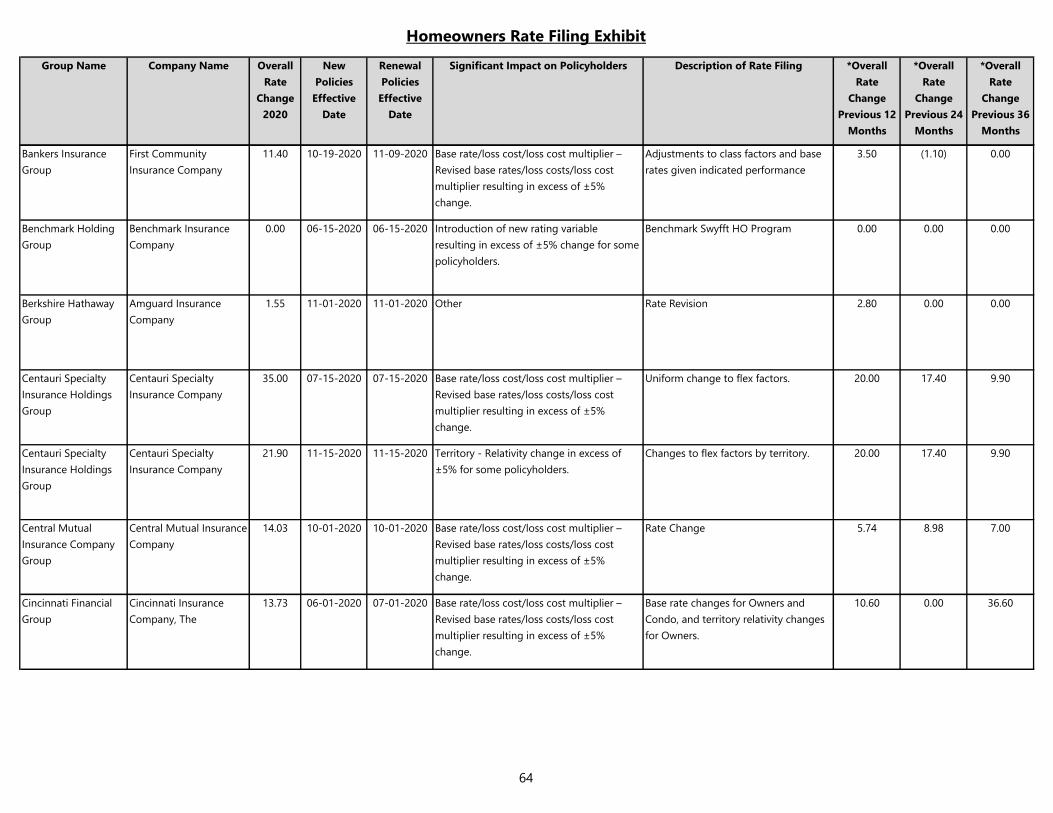
Homeowners Rate Filing Exhibit
Group Name Company Name Overall
Rate
Change
2020
New
Policies
Effective
Date
Renewal
Policies
Effective
Date
Significant Impact on Policyholders Description of Rate Filing *Overall
Rate
Change
Previous 12
Months
*Overall
Rate
Change
Previous 24
Months
*Overall
Rate
Change
Previous 36
Months
Bankers Insurance
Group
First Community
Insurance Company
11.40 10-19-2020 11-09-2020 Base rate/loss cost/loss cost multiplier –
Revised base rates/loss costs/loss cost
multiplier resulting in excess of ±5%
change.
Adjustments to class factors and base
rates given indicated performance
3.50 (1.10) 0.00
Benchmark Holding
Group
Benchmark Insurance
Company
0.00 06-15-2020 06-15-2020 Introduction of new rating variable
resulting in excess of ±5% change for some
policyholders.
Benchmark Swyfft HO Program 0.00 0.00 0.00
Berkshire Hathaway
Group
Amguard Insurance
Company
1.55 11-01-2020 11-01-2020 Other Rate Revision 2.80 0.00 0.00
Centauri Specialty
Insurance Holdings
Group
Centauri Specialty
Insurance Company
35.00 07-15-2020 07-15-2020 Base rate/loss cost/loss cost multiplier –
Revised base rates/loss costs/loss cost
multiplier resulting in excess of ±5%
change.
Uniform change to flex factors. 20.00 17.40 9.90
Centauri Specialty
Insurance Holdings
Group
Centauri Specialty
Insurance Company
21.90 11-15-2020 11-15-2020 Territory - Relativity change in excess of
±5% for some policyholders.
Changes to flex factors by territory. 20.00 17.40 9.90
Central Mutual
Insurance Company
Group
Central Mutual Insurance
Company
14.03 10-01-2020 10-01-2020 Base rate/loss cost/loss cost multiplier –
Revised base rates/loss costs/loss cost
multiplier resulting in excess of ±5%
change.
Rate Change 5.74 8.98 7.00
Cincinnati Financial
Group
Cincinnati Insurance
Company, The
13.73 06-01-2020 07-01-2020 Base rate/loss cost/loss cost multiplier –
Revised base rates/loss costs/loss cost
multiplier resulting in excess of ±5%
change.
Base rate changes for Owners and
Condo, and territory relativity changes
for Owners.
10.60 0.00 36.60
64
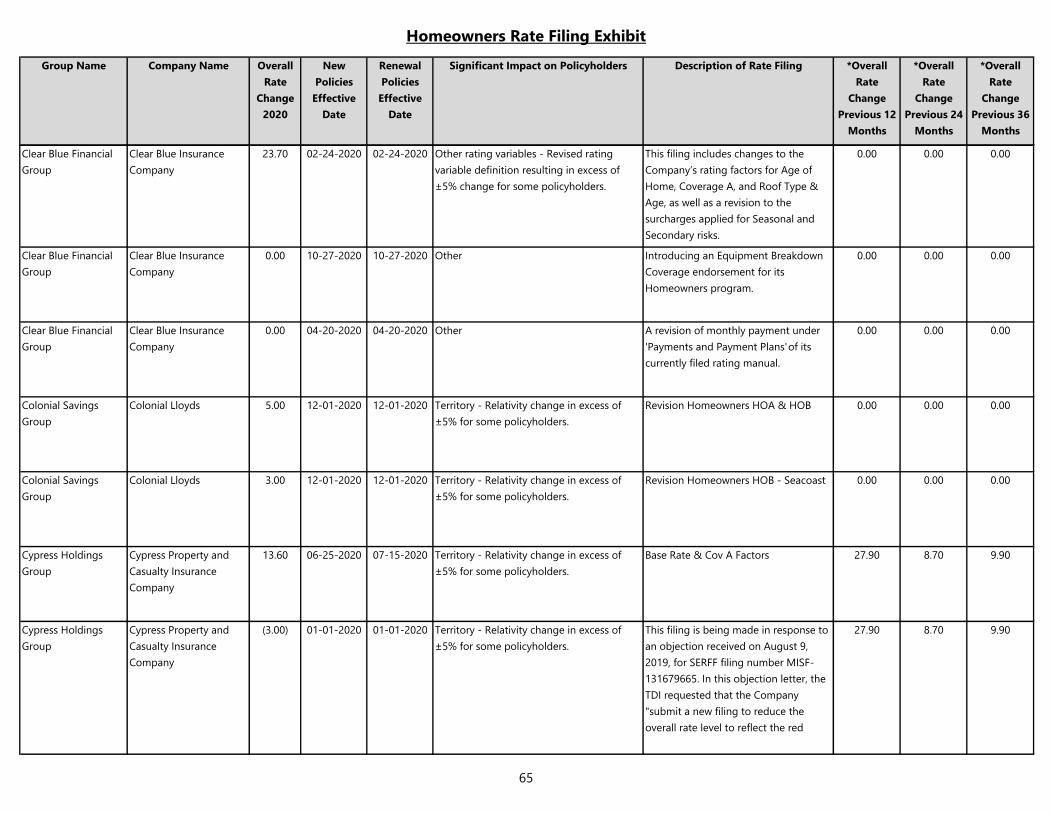
Homeowners Rate Filing Exhibit
Group Name Company Name Overall
Rate
Change
2020
New
Policies
Effective
Date
Renewal
Policies
Effective
Date
Significant Impact on Policyholders Description of Rate Filing *Overall
Rate
Change
Previous 12
Months
*Overall
Rate
Change
Previous 24
Months
*Overall
Rate
Change
Previous 36
Months
Clear Blue Financial
Group
Clear Blue Insurance
Company
23.70 02-24-2020 02-24-2020 Other rating variables - Revised rating
variable definition resulting in excess of
±5% change for some policyholders.
This filing includes changes to the
Company’s rating factors for Age of
Home, Coverage A, and Roof Type &
Age, as well as a revision to the
surcharges applied for Seasonal and
Secondary risks.
0.00 0.00 0.00
Clear Blue Financial
Group
Clear Blue Insurance
Company
0.00 10-27-2020 10-27-2020 Other Introducing an Equipment Breakdown
Coverage endorsement for its
Homeowners program.
0.00 0.00 0.00
Clear Blue Financial
Group
Clear Blue Insurance
Company
0.00 04-20-2020 04-20-2020 Other A revision of monthly payment under
'Payments and Payment Plans' of its
currently filed rating manual.
0.00 0.00 0.00
Colonial Savings
Group
Colonial Lloyds 5.00 12-01-2020 12-01-2020 Territory - Relativity change in excess of
±5% for some policyholders.
Revision Homeowners HOA & HOB 0.00 0.00 0.00
Colonial Savings
Group
Colonial Lloyds 3.00 12-01-2020 12-01-2020 Territory - Relativity change in excess of
±5% for some policyholders.
Revision Homeowners HOB - Seacoast 0.00 0.00 0.00
Cypress Holdings
Group
Cypress Property and
Casualty Insurance
Company
13.60 06-25-2020 07-15-2020 Territory - Relativity change in excess of
±5% for some policyholders.
Base Rate & Cov A Factors 27.90 8.70 9.90
Cypress Holdings
Group
Cypress Property and
Casualty Insurance
Company
(3.00) 01-01-2020 01-01-2020 Territory - Relativity change in excess of
±5% for some policyholders.
This filing is being made in response to
an objection received on August 9,
2019, for SERFF filing number MISF-
131679665. In this objection letter, the
TDI requested that the Company
"submit a new filing to reduce the
overall rate level to reflect the red
27.90 8.70 9.90
65
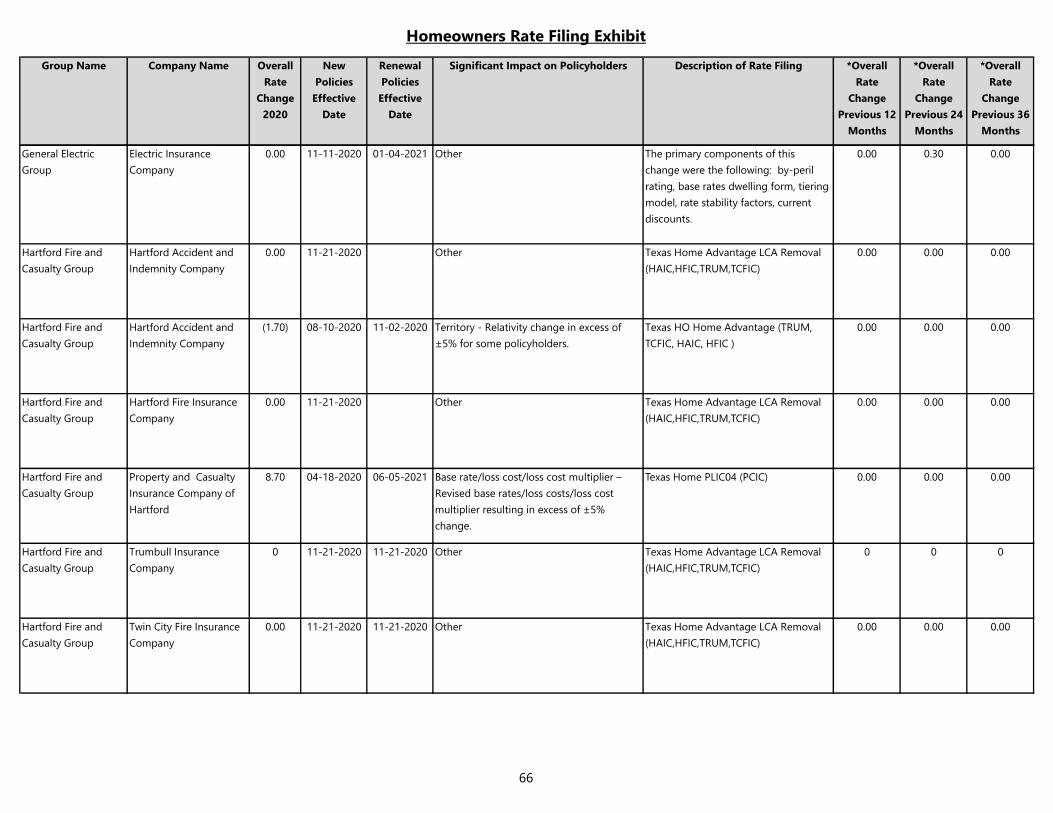
Homeowners Rate Filing Exhibit
Group Name Company Name Overall
Rate
Change
2020
New
Policies
Effective
Date
Renewal
Policies
Effective
Date
Significant Impact on Policyholders Description of Rate Filing *Overall
Rate
Change
Previous 12
Months
*Overall
Rate
Change
Previous 24
Months
*Overall
Rate
Change
Previous 36
Months
General Electric
Group
Electric Insurance
Company
0.00 11-11-2020 01-04-2021 Other The primary components of this
change were the following: by-peril
rating, base rates dwelling form, tiering
model, rate stability factors, current
discounts.
0.00 0.30 0.00
Hartford Fire and
Casualty Group
Hartford Accident and
Indemnity Company
0.00 11-21-2020 Other Texas Home Advantage LCA Removal
(HAIC,HFIC,TRUM,TCFIC)
0.00 0.00 0.00
Hartford Fire and
Casualty Group
Hartford Accident and
Indemnity Company
(1.70) 08-10-2020 11-02-2020 Territory - Relativity change in excess of
±5% for some policyholders.
Texas HO Home Advantage (TRUM,
TCFIC, HAIC, HFIC )
0.00 0.00 0.00
Hartford Fire and
Casualty Group
Hartford Fire Insurance
Company
0.00 11-21-2020 Other Texas Home Advantage LCA Removal
(HAIC,HFIC,TRUM,TCFIC)
0.00 0.00 0.00
Hartford Fire and
Casualty Group
Property and Casualty
Insurance Company of
Hartford
8.70 04-18-2020 06-05-2021 Base rate/loss cost/loss cost multiplier –
Revised base rates/loss costs/loss cost
multiplier resulting in excess of ±5%
change.
Texas Home PLIC04 (PCIC) 0.00 0.00 0.00
Hartford Fire and
Casualty Group
Trumbull Insurance
Company
0 11-21-2020 11-21-2020 Other Texas Home Advantage LCA Removal
(HAIC,HFIC,TRUM,TCFIC)
0 0 0
Hartford Fire and
Casualty Group
Twin City Fire Insurance
Company
0.00 11-21-2020 11-21-2020 Other Texas Home Advantage LCA Removal
(HAIC,HFIC,TRUM,TCFIC)
0.00 0.00 0.00
66
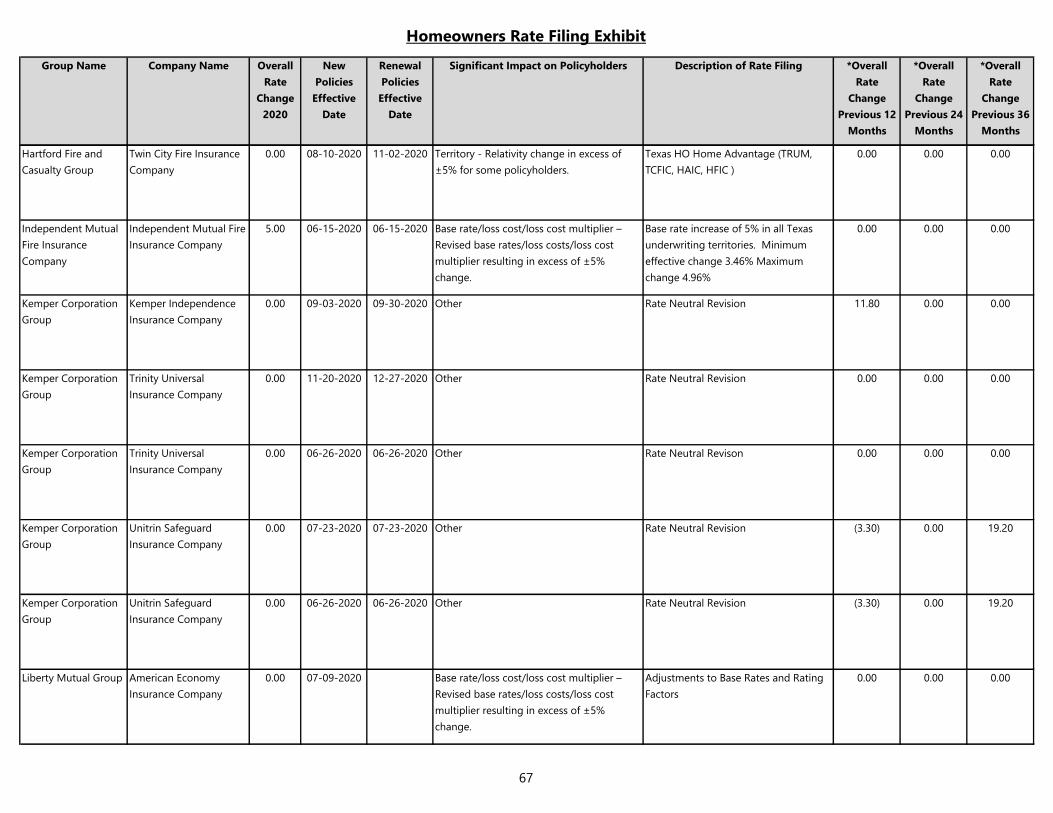
Homeowners Rate Filing Exhibit
Group Name Company Name Overall
Rate
Change
2020
New
Policies
Effective
Date
Renewal
Policies
Effective
Date
Significant Impact on Policyholders Description of Rate Filing *Overall
Rate
Change
Previous 12
Months
*Overall
Rate
Change
Previous 24
Months
*Overall
Rate
Change
Previous 36
Months
Hartford Fire and
Casualty Group
Twin City Fire Insurance
Company
0.00 08-10-2020 11-02-2020 Territory - Relativity change in excess of
±5% for some policyholders.
Texas HO Home Advantage (TRUM,
TCFIC, HAIC, HFIC )
0.00 0.00 0.00
Independent Mutual
Fire Insurance
Company
Independent Mutual Fire
Insurance Company
5.00 06-15-2020 06-15-2020 Base rate/loss cost/loss cost multiplier –
Revised base rates/loss costs/loss cost
multiplier resulting in excess of ±5%
change.
Base rate increase of 5% in all Texas
underwriting territories. Minimum
effective change 3.46% Maximum
change 4.96%
0.00 0.00 0.00
Kemper Corporation
Group
Kemper Independence
Insurance Company
0.00 09-03-2020 09-30-2020 Other Rate Neutral Revision 11.80 0.00 0.00
Kemper Corporation
Group
Trinity Universal
Insurance Company
0.00 11-20-2020 12-27-2020 Other Rate Neutral Revision 0.00 0.00 0.00
Kemper Corporation
Group
Trinity Universal
Insurance Company
0.00 06-26-2020 06-26-2020 Other Rate Neutral Revison 0.00 0.00 0.00
Kemper Corporation
Group
Unitrin Safeguard
Insurance Company
0.00 07-23-2020 07-23-2020 Other Rate Neutral Revision (3.30) 0.00 19.20
Kemper Corporation
Group
Unitrin Safeguard
Insurance Company
0.00 06-26-2020 06-26-2020 Other Rate Neutral Revision (3.30) 0.00 19.20
Liberty Mutual Group American Economy
Insurance Company
0.00 07-09-2020 Base rate/loss cost/loss cost multiplier –
Revised base rates/loss costs/loss cost
multiplier resulting in excess of ±5%
change.
Adjustments to Base Rates and Rating
Factors
0.00 0.00 0.00
67
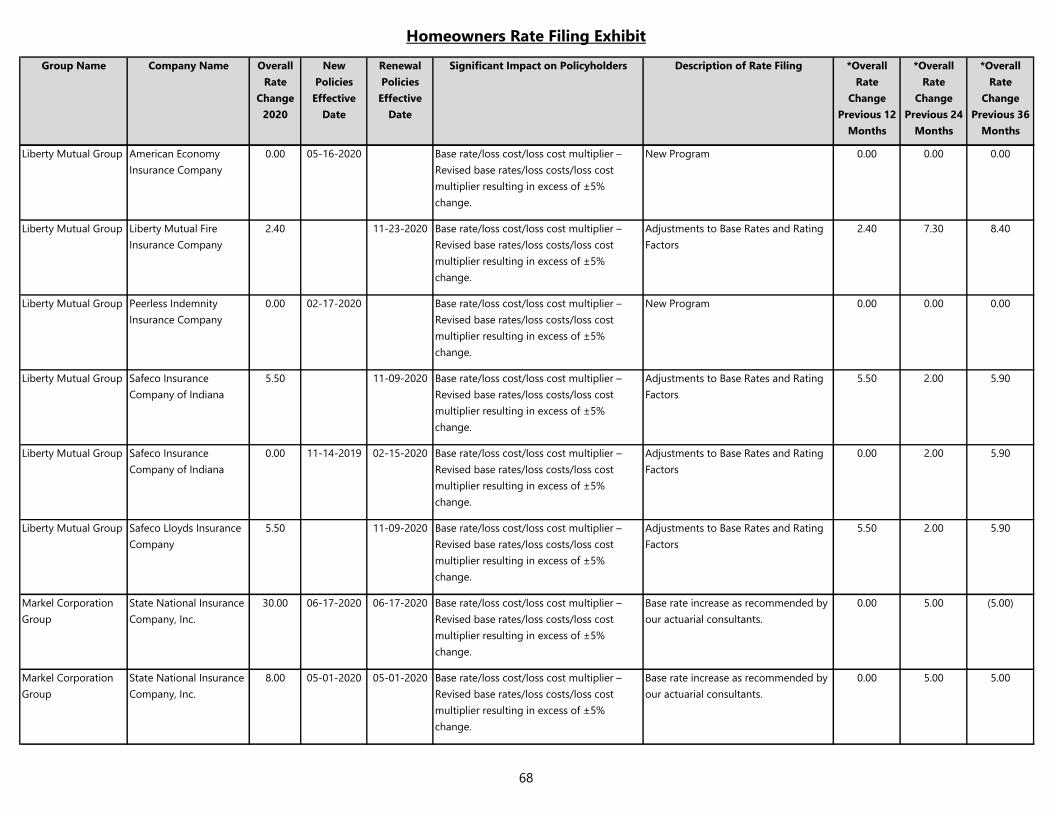
Homeowners Rate Filing Exhibit
Group Name Company Name Overall
Rate
Change
2020
New
Policies
Effective
Date
Renewal
Policies
Effective
Date
Significant Impact on Policyholders Description of Rate Filing *Overall
Rate
Change
Previous 12
Months
*Overall
Rate
Change
Previous 24
Months
*Overall
Rate
Change
Previous 36
Months
Liberty Mutual Group American Economy
Insurance Company
0.00 05-16-2020 Base rate/loss cost/loss cost multiplier –
Revised base rates/loss costs/loss cost
multiplier resulting in excess of ±5%
change.
New Program 0.00 0.00 0.00
Liberty Mutual Group Liberty Mutual Fire
Insurance Company
2.40 11-23-2020 Base rate/loss cost/loss cost multiplier –
Revised base rates/loss costs/loss cost
multiplier resulting in excess of ±5%
change.
Adjustments to Base Rates and Rating
Factors
2.40 7.30 8.40
Liberty Mutual Group Peerless Indemnity
Insurance Company
0.00 02-17-2020 Base rate/loss cost/loss cost multiplier –
Revised base rates/loss costs/loss cost
multiplier resulting in excess of ±5%
change.
New Program 0.00 0.00 0.00
Liberty Mutual Group Safeco Insurance
Company of Indiana
5.50 11-09-2020 Base rate/loss cost/loss cost multiplier –
Revised base rates/loss costs/loss cost
multiplier resulting in excess of ±5%
change.
Adjustments to Base Rates and Rating
Factors
5.50 2.00 5.90
Liberty Mutual Group Safeco Insurance
Company of Indiana
0.00 11-14-2019 02-15-2020 Base rate/loss cost/loss cost multiplier –
Revised base rates/loss costs/loss cost
multiplier resulting in excess of ±5%
change.
Adjustments to Base Rates and Rating
Factors
0.00 2.00 5.90
Liberty Mutual Group Safeco Lloyds Insurance
Company
5.50 11-09-2020 Base rate/loss cost/loss cost multiplier –
Revised base rates/loss costs/loss cost
multiplier resulting in excess of ±5%
change.
Adjustments to Base Rates and Rating
Factors
5.50 2.00 5.90
Markel Corporation
Group
State National Insurance
Company, Inc.
30.00 06-17-2020 06-17-2020 Base rate/loss cost/loss cost multiplier –
Revised base rates/loss costs/loss cost
multiplier resulting in excess of ±5%
change.
Base rate increase as recommended by
our actuarial consultants.
0.00 5.00 (5.00)
Markel Corporation
Group
State National Insurance
Company, Inc.
8.00 05-01-2020 05-01-2020 Base rate/loss cost/loss cost multiplier –
Revised base rates/loss costs/loss cost
multiplier resulting in excess of ±5%
change.
Base rate increase as recommended by
our actuarial consultants.
0.00 5.00 5.00
68
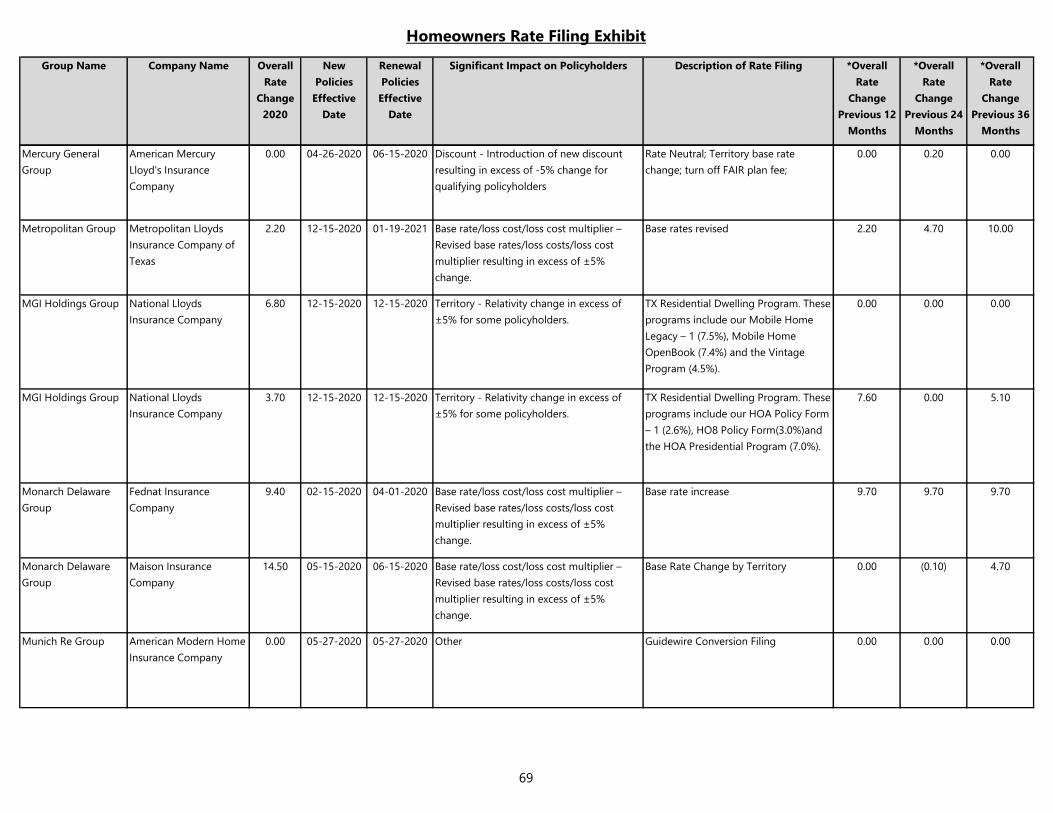
Homeowners Rate Filing Exhibit
Group Name Company Name Overall
Rate
Change
2020
New
Policies
Effective
Date
Renewal
Policies
Effective
Date
Significant Impact on Policyholders Description of Rate Filing *Overall
Rate
Change
Previous 12
Months
*Overall
Rate
Change
Previous 24
Months
*Overall
Rate
Change
Previous 36
Months
Mercury General
Group
American Mercury
Lloyd's Insurance
Company
0.00 04-26-2020 06-15-2020 Discount - Introduction of new discount
resulting in excess of -5% change for
qualifying policyholders
Rate Neutral; Territory base rate
change; turn off FAIR plan fee;
0.00 0.20 0.00
Metropolitan Group Metropolitan Lloyds
Insurance Company of
Texas
2.20 12-15-2020 01-19-2021 Base rate/loss cost/loss cost multiplier –
Revised base rates/loss costs/loss cost
multiplier resulting in excess of ±5%
change.
Base rates revised 2.20 4.70 10.00
MGI Holdings Group National Lloyds
Insurance Company
6.80 12-15-2020 12-15-2020 Territory - Relativity change in excess of
±5% for some policyholders.
TX Residential Dwelling Program. These
programs include our Mobile Home
Legacy – 1 (7.5%), Mobile Home
OpenBook (7.4%) and the Vintage
Program (4.5%).
0.00 0.00 0.00
MGI Holdings Group National Lloyds
Insurance Company
3.70 12-15-2020 12-15-2020 Territory - Relativity change in excess of
±5% for some policyholders.
TX Residential Dwelling Program. These
programs include our HOA Policy Form
– 1 (2.6%), HO8 Policy Form(3.0%)and
the HOA Presidential Program (7.0%).
7.60 0.00 5.10
Monarch Delaware
Group
Fednat Insurance
Company
9.40 02-15-2020 04-01-2020 Base rate/loss cost/loss cost multiplier –
Revised base rates/loss costs/loss cost
multiplier resulting in excess of ±5%
change.
Base rate increase 9.70 9.70 9.70
Monarch Delaware
Group
Maison Insurance
Company
14.50 05-15-2020 06-15-2020 Base rate/loss cost/loss cost multiplier –
Revised base rates/loss costs/loss cost
multiplier resulting in excess of ±5%
change.
Base Rate Change by Territory 0.00 (0.10) 4.70
Munich Re Group American Modern Home
Insurance Company
0.00 05-27-2020 05-27-2020 Other Guidewire Conversion Filing 0.00 0.00 0.00
69
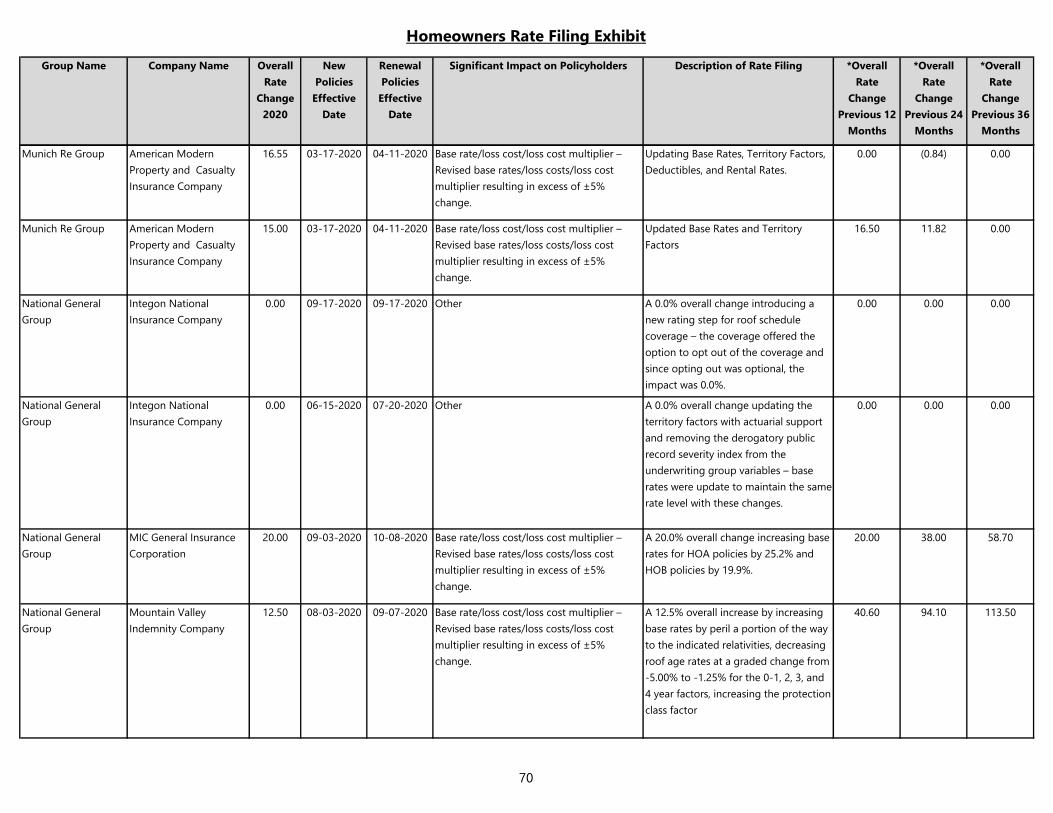
Homeowners Rate Filing Exhibit
Group Name Company Name Overall
Rate
Change
2020
New
Policies
Effective
Date
Renewal
Policies
Effective
Date
Significant Impact on Policyholders Description of Rate Filing *Overall
Rate
Change
Previous 12
Months
*Overall
Rate
Change
Previous 24
Months
*Overall
Rate
Change
Previous 36
Months
Munich Re Group American Modern
Property and Casualty
Insurance Company
16.55 03-17-2020 04-11-2020 Base rate/loss cost/loss cost multiplier –
Revised base rates/loss costs/loss cost
multiplier resulting in excess of ±5%
change.
Updating Base Rates, Territory Factors,
Deductibles, and Rental Rates.
0.00 (0.84) 0.00
Munich Re Group American Modern
Property and Casualty
Insurance Company
15.00 03-17-2020 04-11-2020 Base rate/loss cost/loss cost multiplier –
Revised base rates/loss costs/loss cost
multiplier resulting in excess of ±5%
change.
Updated Base Rates and Territory
Factors
16.50 11.82 0.00
National General
Group
Integon National
Insurance Company
0.00 09-17-2020 09-17-2020 Other A 0.0% overall change introducing a
new rating step for roof schedule
coverage – the coverage offered the
option to opt out of the coverage and
since opting out was optional, the
impact was 0.0%.
0.00 0.00 0.00
National General
Group
Integon National
Insurance Company
0.00 06-15-2020 07-20-2020 Other A 0.0% overall change updating the
territory factors with actuarial support
and removing the derogatory public
record severity index from the
underwriting group variables – base
rates were update to maintain the same
rate level with these changes.
0.00 0.00 0.00
National General
Group
MIC General Insurance
Corporation
20.00 09-03-2020 10-08-2020 Base rate/loss cost/loss cost multiplier –
Revised base rates/loss costs/loss cost
multiplier resulting in excess of ±5%
change.
A 20.0% overall change increasing base
rates for HOA policies by 25.2% and
HOB policies by 19.9%.
20.00 38.00 58.70
National General
Group
Mountain Valley
Indemnity Company
12.50 08-03-2020 09-07-2020 Base rate/loss cost/loss cost multiplier –
Revised base rates/loss costs/loss cost
multiplier resulting in excess of ±5%
change.
A 12.5% overall increase by increasing
base rates by peril a portion of the way
to the indicated relativities, decreasing
roof age rates at a graded change from
-5.00% to -1.25% for the 0-1, 2, 3, and
4 year factors, increasing the protection
class factor
40.60 94.10 113.50
70
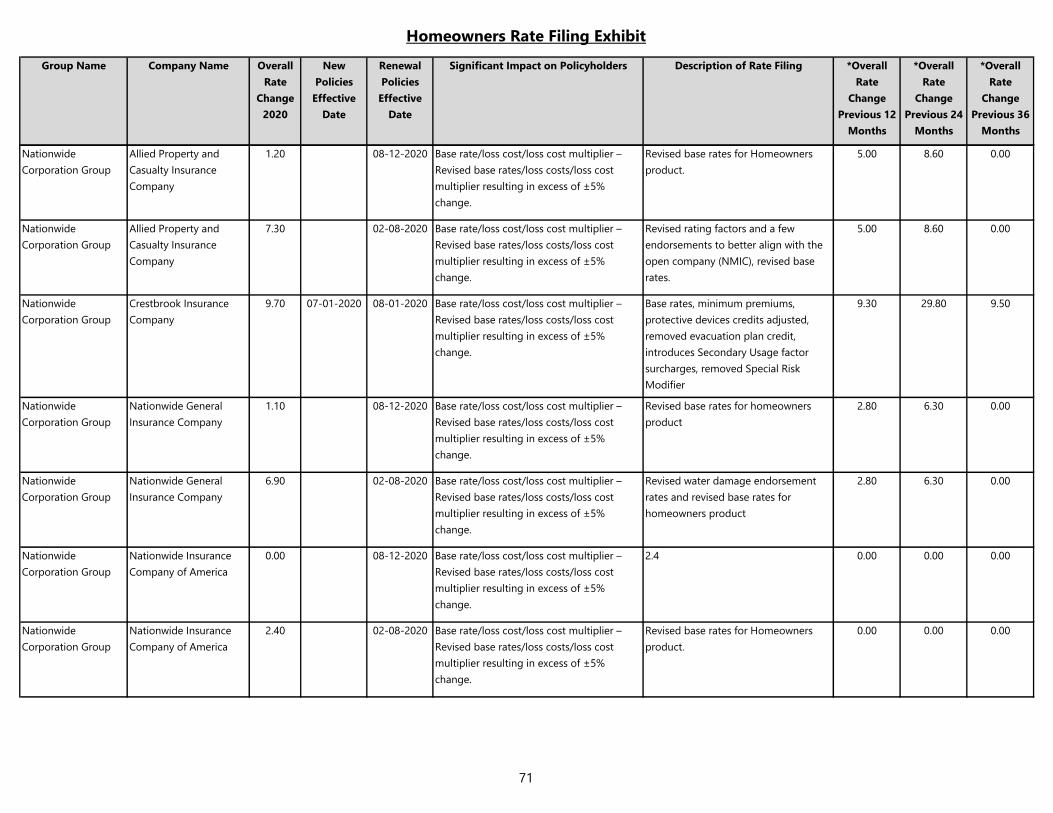
Homeowners Rate Filing Exhibit
Group Name Company Name Overall
Rate
Change
2020
New
Policies
Effective
Date
Renewal
Policies
Effective
Date
Significant Impact on Policyholders Description of Rate Filing *Overall
Rate
Change
Previous 12
Months
*Overall
Rate
Change
Previous 24
Months
*Overall
Rate
Change
Previous 36
Months
Nationwide
Corporation Group
Allied Property and
Casualty Insurance
Company
1.20 08-12-2020 Base rate/loss cost/loss cost multiplier –
Revised base rates/loss costs/loss cost
multiplier resulting in excess of ±5%
change.
Revised base rates for Homeowners
product.
5.00 8.60 0.00
Nationwide
Corporation Group
Allied Property and
Casualty Insurance
Company
7.30 02-08-2020 Base rate/loss cost/loss cost multiplier –
Revised base rates/loss costs/loss cost
multiplier resulting in excess of ±5%
change.
Revised rating factors and a few
endorsements to better align with the
open company (NMIC), revised base
rates.
5.00 8.60 0.00
Nationwide
Corporation Group
Crestbrook Insurance
Company
9.70 07-01-2020 08-01-2020 Base rate/loss cost/loss cost multiplier –
Revised base rates/loss costs/loss cost
multiplier resulting in excess of ±5%
change.
Base rates, minimum premiums,
protective devices credits adjusted,
removed evacuation plan credit,
introduces Secondary Usage factor
surcharges, removed Special Risk
Modifier
9.30 29.80 9.50
Nationwide
Corporation Group
Nationwide General
Insurance Company
1.10 08-12-2020 Base rate/loss cost/loss cost multiplier –
Revised base rates/loss costs/loss cost
multiplier resulting in excess of ±5%
change.
Revised base rates for homeowners
product
2.80 6.30 0.00
Nationwide
Corporation Group
Nationwide General
Insurance Company
6.90 02-08-2020 Base rate/loss cost/loss cost multiplier –
Revised base rates/loss costs/loss cost
multiplier resulting in excess of ±5%
change.
Revised water damage endorsement
rates and revised base rates for
homeowners product
2.80 6.30 0.00
Nationwide
Corporation Group
Nationwide Insurance
Company of America
0.00 08-12-2020 Base rate/loss cost/loss cost multiplier –
Revised base rates/loss costs/loss cost
multiplier resulting in excess of ±5%
change.
2.4 0.00 0.00 0.00
Nationwide
Corporation Group
Nationwide Insurance
Company of America
2.40 02-08-2020 Base rate/loss cost/loss cost multiplier –
Revised base rates/loss costs/loss cost
multiplier resulting in excess of ±5%
change.
Revised base rates for Homeowners
product.
0.00 0.00 0.00
71
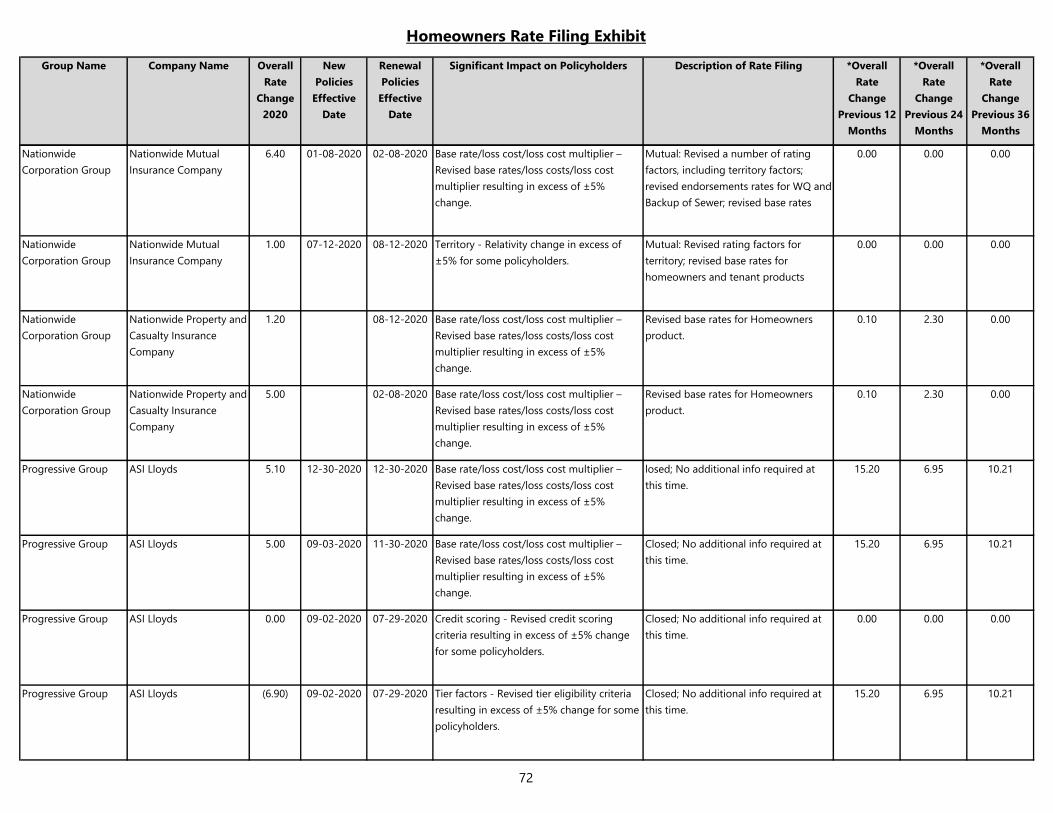
Homeowners Rate Filing Exhibit
Group Name Company Name Overall
Rate
Change
2020
New
Policies
Effective
Date
Renewal
Policies
Effective
Date
Significant Impact on Policyholders Description of Rate Filing *Overall
Rate
Change
Previous 12
Months
*Overall
Rate
Change
Previous 24
Months
*Overall
Rate
Change
Previous 36
Months
Nationwide
Corporation Group
Nationwide Mutual
Insurance Company
6.40 01-08-2020 02-08-2020 Base rate/loss cost/loss cost multiplier –
Revised base rates/loss costs/loss cost
multiplier resulting in excess of ±5%
change.
Mutual: Revised a number of rating
factors, including territory factors;
revised endorsements rates for WQ and
Backup of Sewer; revised base rates
0.00 0.00 0.00
Nationwide
Corporation Group
Nationwide Mutual
Insurance Company
1.00 07-12-2020 08-12-2020 Territory - Relativity change in excess of
±5% for some policyholders.
Mutual: Revised rating factors for
territory; revised base rates for
homeowners and tenant products
0.00 0.00 0.00
Nationwide
Corporation Group
Nationwide Property and
Casualty Insurance
Company
1.20 08-12-2020 Base rate/loss cost/loss cost multiplier –
Revised base rates/loss costs/loss cost
multiplier resulting in excess of ±5%
change.
Revised base rates for Homeowners
product.
0.10 2.30 0.00
Nationwide
Corporation Group
Nationwide Property and
Casualty Insurance
Company
5.00 02-08-2020 Base rate/loss cost/loss cost multiplier –
Revised base rates/loss costs/loss cost
multiplier resulting in excess of ±5%
change.
Revised base rates for Homeowners
product.
0.10 2.30 0.00
Progressive Group ASI Lloyds 5.10 12-30-2020 12-30-2020 Base rate/loss cost/loss cost multiplier –
Revised base rates/loss costs/loss cost
multiplier resulting in excess of ±5%
change.
losed; No additional info required at
this time.
15.20 6.95 10.21
Progressive Group ASI Lloyds 5.00 09-03-2020 11-30-2020 Base rate/loss cost/loss cost multiplier –
Revised base rates/loss costs/loss cost
multiplier resulting in excess of ±5%
change.
Closed; No additional info required at
this time.
15.20 6.95 10.21
Progressive Group ASI Lloyds 0.00 09-02-2020 07-29-2020 Credit scoring - Revised credit scoring
criteria resulting in excess of ±5% change
for some policyholders.
Closed; No additional info required at
this time.
0.00 0.00 0.00
Progressive Group ASI Lloyds (6.90) 09-02-2020 07-29-2020 Tier factors - Revised tier eligibility criteria
resulting in excess of ±5% change for some
policyholders.
Closed; No additional info required at
this time.
15.20 6.95 10.21
72
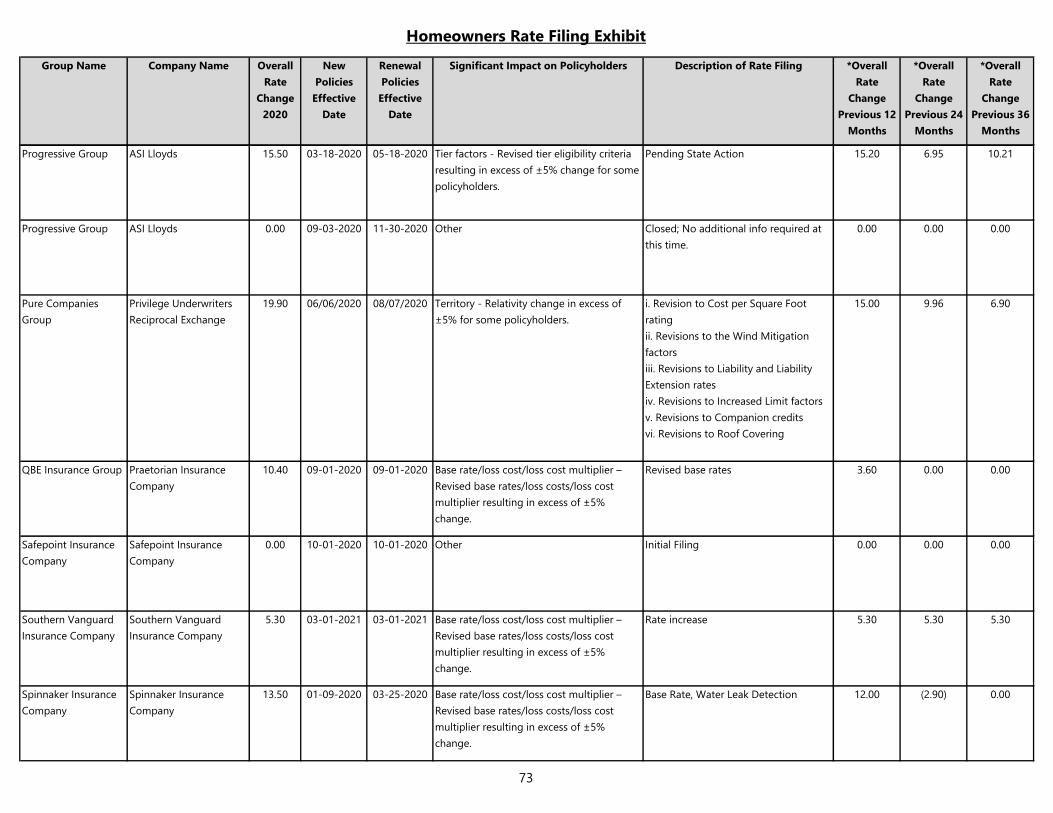
Homeowners Rate Filing Exhibit
Group Name Company Name Overall
Rate
Change
2020
New
Policies
Effective
Date
Renewal
Policies
Effective
Date
Significant Impact on Policyholders Description of Rate Filing *Overall
Rate
Change
Previous 12
Months
*Overall
Rate
Change
Previous 24
Months
*Overall
Rate
Change
Previous 36
Months
Progressive Group ASI Lloyds 15.50 03-18-2020 05-18-2020 Tier factors - Revised tier eligibility criteria
resulting in excess of ±5% change for some
policyholders.
Pending State Action 15.20 6.95 10.21
Progressive Group ASI Lloyds 0.00 09-03-2020 11-30-2020 Other Closed; No additional info required at
this time.
0.00 0.00 0.00
Pure Companies
Group
Privilege Underwriters
Reciprocal Exchange
19.90 06/06/2020 08/07/2020 Territory - Relativity change in excess of
±5% for some policyholders.
i. Revision to Cost per Square Foot
rating
ii. Revisions to the Wind Mitigation
factors
iii. Revisions to Liability and Liability
Extension rates
iv. Revisions to Increased Limit factors
v. Revisions to Companion credits
vi. Revisions to Roof Covering
15.00 9.96 6.90
QBE Insurance Group Praetorian Insurance
Company
10.40 09-01-2020 09-01-2020 Base rate/loss cost/loss cost multiplier –
Revised base rates/loss costs/loss cost
multiplier resulting in excess of ±5%
change.
Revised base rates 3.60 0.00 0.00
Safepoint Insurance
Company
Safepoint Insurance
Company
0.00 10-01-2020 10-01-2020 Other Initial Filing 0.00 0.00 0.00
Southern Vanguard
Insurance Company
Southern Vanguard
Insurance Company
5.30 03-01-2021 03-01-2021 Base rate/loss cost/loss cost multiplier –
Revised base rates/loss costs/loss cost
multiplier resulting in excess of ±5%
change.
Rate increase 5.30 5.30 5.30
Spinnaker Insurance
Company
Spinnaker Insurance
Company
13.50 01-09-2020 03-25-2020 Base rate/loss cost/loss cost multiplier –
Revised base rates/loss costs/loss cost
multiplier resulting in excess of ±5%
change.
Base Rate, Water Leak Detection 12.00 (2.90) 0.00
73
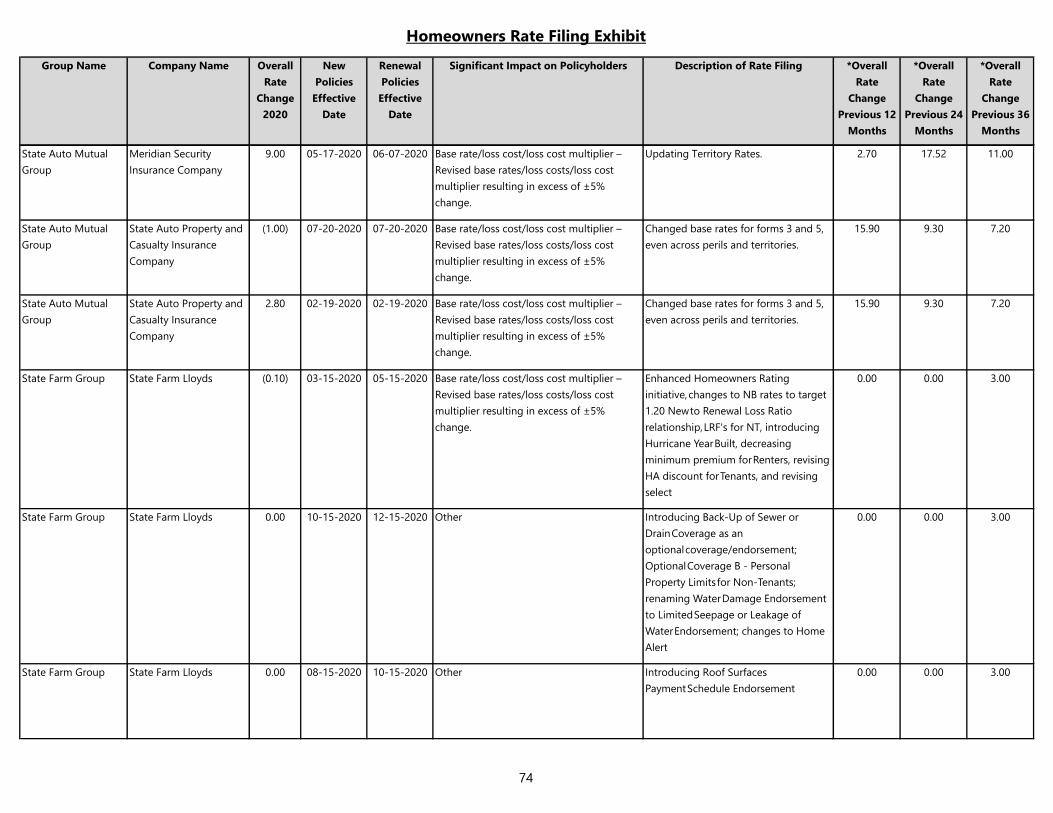
Homeowners Rate Filing Exhibit
Group Name Company Name Overall
Rate
Change
2020
New
Policies
Effective
Date
Renewal
Policies
Effective
Date
Significant Impact on Policyholders Description of Rate Filing *Overall
Rate
Change
Previous 12
Months
*Overall
Rate
Change
Previous 24
Months
*Overall
Rate
Change
Previous 36
Months
State Auto Mutual
Group
Meridian Security
Insurance Company
9.00 05-17-2020 06-07-2020 Base rate/loss cost/loss cost multiplier –
Revised base rates/loss costs/loss cost
multiplier resulting in excess of ±5%
change.
Updating Territory Rates. 2.70 17.52 11.00
State Auto Mutual
Group
State Auto Property and
Casualty Insurance
Company
(1.00) 07-20-2020 07-20-2020 Base rate/loss cost/loss cost multiplier –
Revised base rates/loss costs/loss cost
multiplier resulting in excess of ±5%
change.
Changed base rates for forms 3 and 5,
even across perils and territories.
15.90 9.30 7.20
State Auto Mutual
Group
State Auto Property and
Casualty Insurance
Company
2.80 02-19-2020 02-19-2020 Base rate/loss cost/loss cost multiplier –
Revised base rates/loss costs/loss cost
multiplier resulting in excess of ±5%
change.
Changed base rates for forms 3 and 5,
even across perils and territories.
15.90 9.30 7.20
State Farm Group State Farm Lloyds (0.10) 03-15-2020 05-15-2020 Base rate/loss cost/loss cost multiplier –
Revised base rates/loss costs/loss cost
multiplier resulting in excess of ±5%
change.
Enhanced Homeowners Rating
initiative, changes to NB rates to target
1.20 New to Renewal Loss Ratio
relationship, LRF's for NT, introducing
Hurricane Year Built, decreasing
minimum premium for Renters, revising
HA discount for Tenants, and revising
select
0.00 0.00 3.00
State Farm Group State Farm Lloyds 0.00 10-15-2020 12-15-2020 Other Introducing Back-Up of Sewer or
Drain Coverage as an
optional coverage/endorsement;
Optional Coverage B - Personal
Property Limits for Non-Tenants;
renaming Water Damage Endorsement
to Limited Seepage or Leakage of
Water Endorsement; changes to Home
Alert
0.00 0.00 3.00
State Farm Group State Farm Lloyds 0.00 08-15-2020 10-15-2020 Other Introducing Roof Surfaces
Payment Schedule Endorsement
0.00 0.00 3.00
74
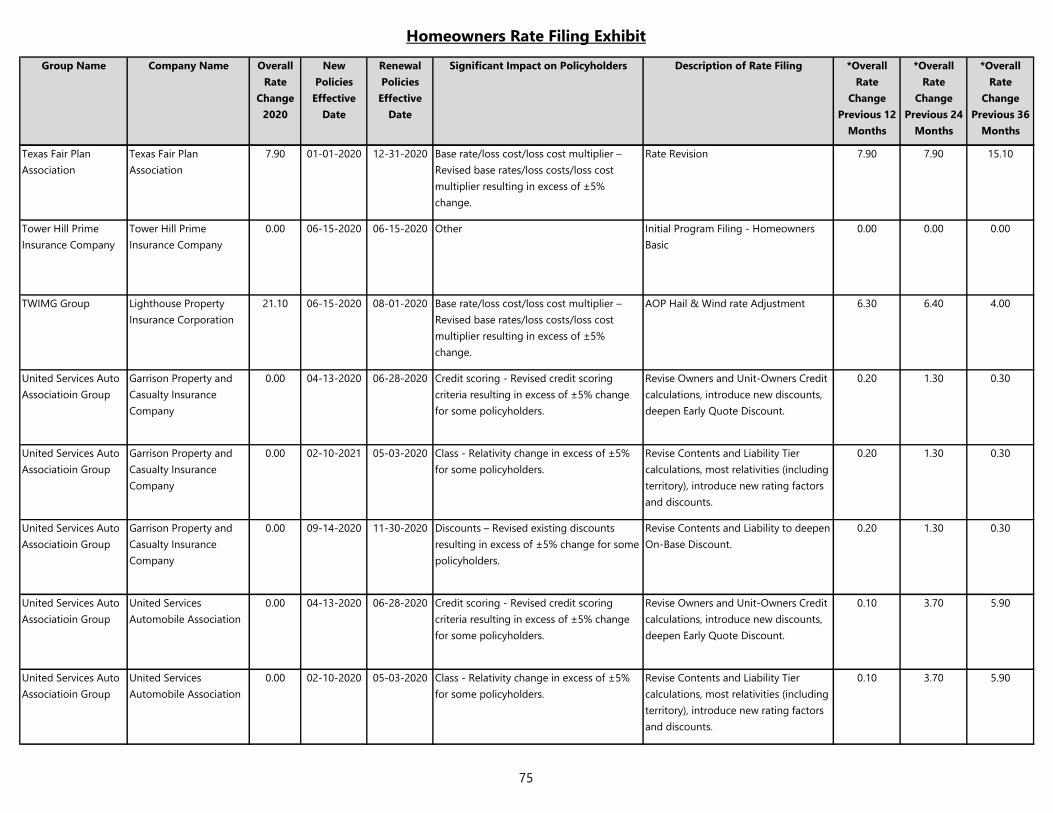
Homeowners Rate Filing Exhibit
Group Name Company Name Overall
Rate
Change
2020
New
Policies
Effective
Date
Renewal
Policies
Effective
Date
Significant Impact on Policyholders Description of Rate Filing *Overall
Rate
Change
Previous 12
Months
*Overall
Rate
Change
Previous 24
Months
*Overall
Rate
Change
Previous 36
Months
Texas Fair Plan
Association
Texas Fair Plan
Association
7.90 01-01-2020 12-31-2020 Base rate/loss cost/loss cost multiplier –
Revised base rates/loss costs/loss cost
multiplier resulting in excess of ±5%
change.
Rate Revision 7.90 7.90 15.10
Tower Hill Prime
Insurance Company
Tower Hill Prime
Insurance Company
0.00 06-15-2020 06-15-2020 Other Initial Program Filing - Homeowners
Basic
0.00 0.00 0.00
TWIMG Group Lighthouse Property
Insurance Corporation
21.10 06-15-2020 08-01-2020 Base rate/loss cost/loss cost multiplier –
Revised base rates/loss costs/loss cost
multiplier resulting in excess of ±5%
change.
AOP Hail & Wind rate Adjustment 6.30 6.40 4.00
United Services Auto
Associatioin Group
Garrison Property and
Casualty Insurance
Company
0.00 04-13-2020 06-28-2020 Credit scoring - Revised credit scoring
criteria resulting in excess of ±5% change
for some policyholders.
Revise Owners and Unit-Owners Credit
calculations, introduce new discounts,
deepen Early Quote Discount.
0.20 1.30 0.30
United Services Auto
Associatioin Group
Garrison Property and
Casualty Insurance
Company
0.00 02-10-2021 05-03-2020 Class - Relativity change in excess of ±5%
for some policyholders.
Revise Contents and Liability Tier
calculations, most relativities (including
territory), introduce new rating factors
and discounts.
0.20 1.30 0.30
United Services Auto
Associatioin Group
Garrison Property and
Casualty Insurance
Company
0.00 09-14-2020 11-30-2020 Discounts – Revised existing discounts
resulting in excess of ±5% change for some
policyholders.
Revise Contents and Liability to deepen
On-Base Discount.
0.20 1.30 0.30
United Services Auto
Associatioin Group
United Services
Automobile Association
0.00 04-13-2020 06-28-2020 Credit scoring - Revised credit scoring
criteria resulting in excess of ±5% change
for some policyholders.
Revise Owners and Unit-Owners Credit
calculations, introduce new discounts,
deepen Early Quote Discount.
0.10 3.70 5.90
United Services Auto
Associatioin Group
United Services
Automobile Association
0.00 02-10-2020 05-03-2020 Class - Relativity change in excess of ±5%
for some policyholders.
Revise Contents and Liability Tier
calculations, most relativities (including
territory), introduce new rating factors
and discounts.
0.10 3.70 5.90
75
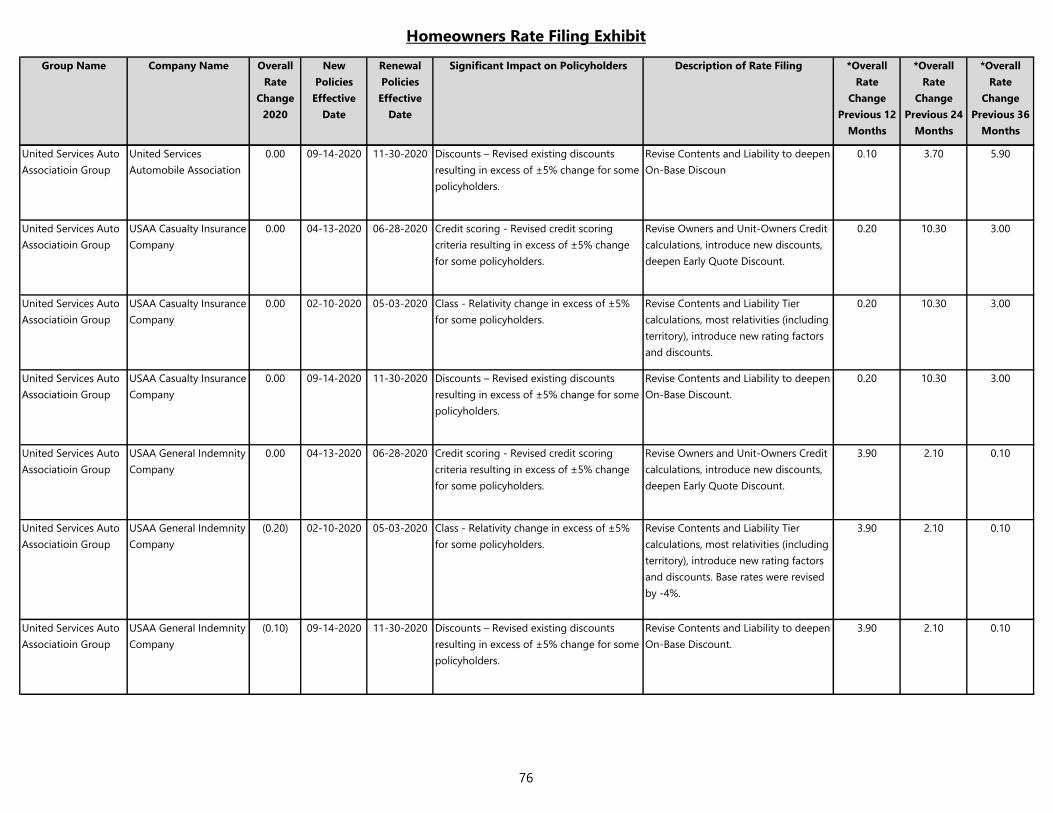
Homeowners Rate Filing Exhibit
Group Name Company Name Overall
Rate
Change
2020
New
Policies
Effective
Date
Renewal
Policies
Effective
Date
Significant Impact on Policyholders Description of Rate Filing *Overall
Rate
Change
Previous 12
Months
*Overall
Rate
Change
Previous 24
Months
*Overall
Rate
Change
Previous 36
Months
United Services Auto
Associatioin Group
United Services
Automobile Association
0.00 09-14-2020 11-30-2020 Discounts – Revised existing discounts
resulting in excess of ±5% change for some
policyholders.
Revise Contents and Liability to deepen
On-Base Discoun
0.10 3.70 5.90
United Services Auto
Associatioin Group
USAA Casualty Insurance
Company
0.00 04-13-2020 06-28-2020 Credit scoring - Revised credit scoring
criteria resulting in excess of ±5% change
for some policyholders.
Revise Owners and Unit-Owners Credit
calculations, introduce new discounts,
deepen Early Quote Discount.
0.20 10.30 3.00
United Services Auto
Associatioin Group
USAA Casualty Insurance
Company
0.00 02-10-2020 05-03-2020 Class - Relativity change in excess of ±5%
for some policyholders.
Revise Contents and Liability Tier
calculations, most relativities (including
territory), introduce new rating factors
and discounts.
0.20 10.30 3.00
United Services Auto
Associatioin Group
USAA Casualty Insurance
Company
0.00 09-14-2020 11-30-2020 Discounts – Revised existing discounts
resulting in excess of ±5% change for some
policyholders.
Revise Contents and Liability to deepen
On-Base Discount.
0.20 10.30 3.00
United Services Auto
Associatioin Group
USAA General Indemnity
Company
0.00 04-13-2020 06-28-2020 Credit scoring - Revised credit scoring
criteria resulting in excess of ±5% change
for some policyholders.
Revise Owners and Unit-Owners Credit
calculations, introduce new discounts,
deepen Early Quote Discount.
3.90 2.10 0.10
United Services Auto
Associatioin Group
USAA General Indemnity
Company
(0.20) 02-10-2020 05-03-2020 Class - Relativity change in excess of ±5%
for some policyholders.
Revise Contents and Liability Tier
calculations, most relativities (including
territory), introduce new rating factors
and discounts. Base rates were revised
by -4%.
3.90 2.10 0.10
United Services Auto
Associatioin Group
USAA General Indemnity
Company
(0.10) 09-14-2020 11-30-2020 Discounts – Revised existing discounts
resulting in excess of ±5% change for some
policyholders.
Revise Contents and Liability to deepen
On-Base Discount.
3.90 2.10 0.10
76
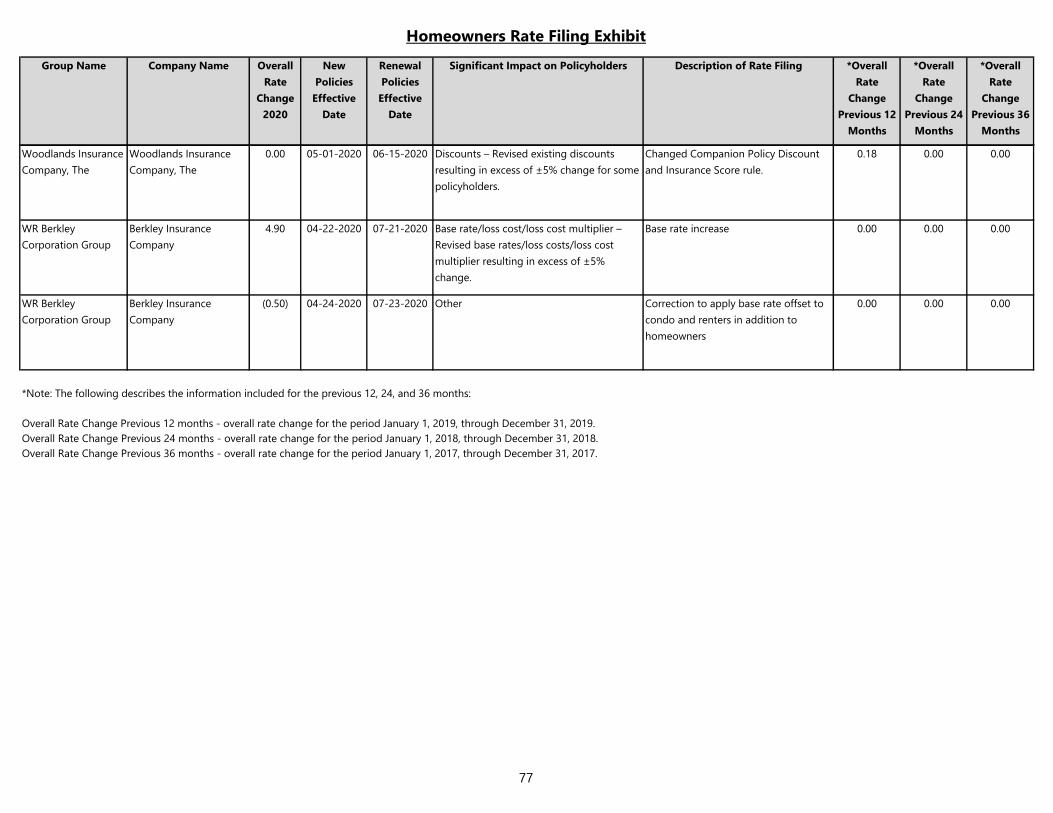
Homeowners Rate Filing Exhibit
Group Name Company Name Overall
Rate
Change
2020
New
Policies
Effective
Date
Renewal
Policies
Effective
Date
Significant Impact on Policyholders Description of Rate Filing *Overall
Rate
Change
Previous 12
Months
*Overall
Rate
Change
Previous 24
Months
*Overall
Rate
Change
Previous 36
Months
Woodlands Insurance
Company, The
Woodlands Insurance
Company, The
0.00 05-01-2020 06-15-2020 Discounts – Revised existing discounts
resulting in excess of ±5% change for some
policyholders.
Changed Companion Policy Discount
and Insurance Score rule.
0.18 0.00 0.00
WR Berkley
Corporation Group
Berkley Insurance
Company
4.90 04-22-2020 07-21-2020 Base rate/loss cost/loss cost multiplier –
Revised base rates/loss costs/loss cost
multiplier resulting in excess of ±5%
change.
Base rate increase 0.00 0.00 0.00
WR Berkley
Corporation Group
Berkley Insurance
Company
(0.50) 04-24-2020 07-23-2020 Other Correction to apply base rate offset to
condo and renters in addition to
homeowners
0.00 0.00 0.00
*Note: The following describes the information included for the previous 12, 24, and 36 months:
Overall Rate Change Previous 12 months - overall rate change for the period January 1, 2019, through December 31, 2019. Overall Rate Change Previous 24 months - overall rate change for the period January 1, 2018, through December 31, 2018. Overall Rate Change Previous 36 months - overall rate change for the period January 1, 2017, through December 31, 2017.
77
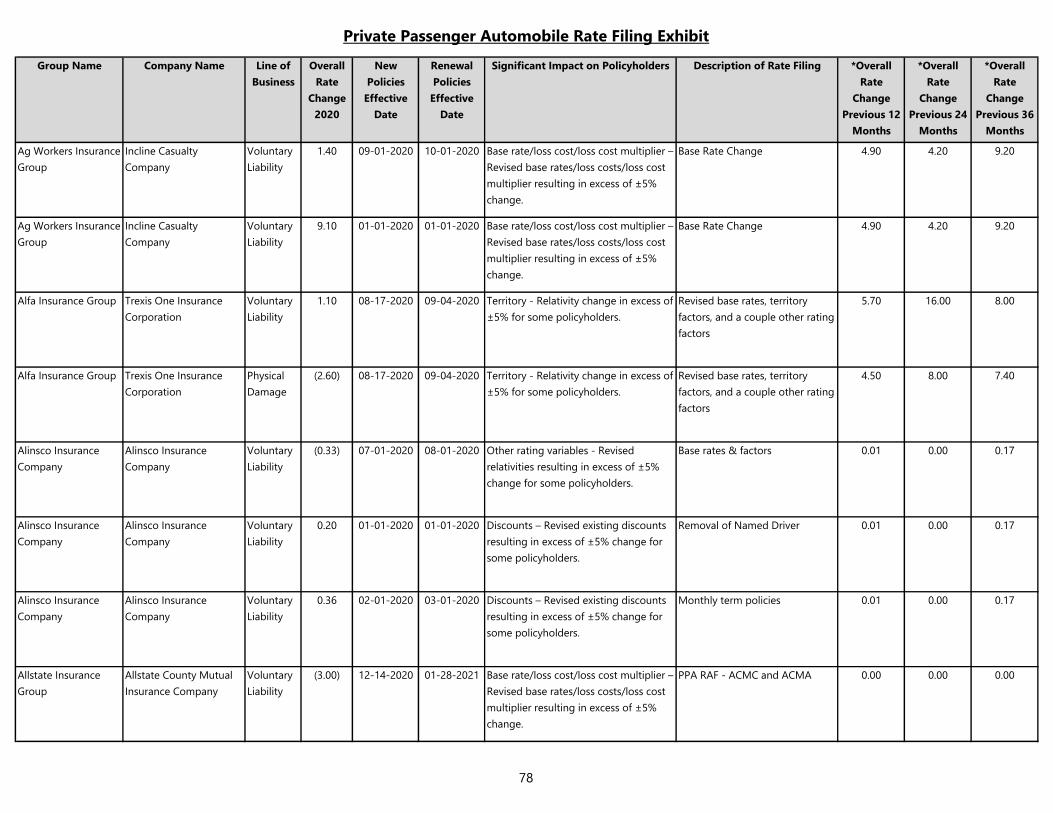
Private Passenger Automobile Rate Filing Exhibit
Group Name Company Name Line of
Business
Overall
Rate
Change
2020
New
Policies
Effective
Date
Renewal
Policies
Effective
Date
Significant Impact on Policyholders Description of Rate Filing *Overall
Rate
Change
Previous 12
Months
*Overall
Rate
Change
Previous 24
Months
*Overall
Rate
Change
Previous 36
Months
Ag Workers Insurance
Group
Incline Casualty
Company
Voluntary
Liability
1.40 09-01-2020 10-01-2020 Base rate/loss cost/loss cost multiplier –
Revised base rates/loss costs/loss cost
multiplier resulting in excess of ±5%
change.
Base Rate Change 4.90 4.20 9.20
Ag Workers Insurance
Group
Incline Casualty
Company
Voluntary
Liability
9.10 01-01-2020 01-01-2020 Base rate/loss cost/loss cost multiplier –
Revised base rates/loss costs/loss cost
multiplier resulting in excess of ±5%
change.
Base Rate Change 4.90 4.20 9.20
Alfa Insurance Group Trexis One Insurance
Corporation
Voluntary
Liability
1.10 08-17-2020 09-04-2020 Territory - Relativity change in excess of
±5% for some policyholders.
Revised base rates, territory
factors, and a couple other rating
factors
5.70 16.00 8.00
Alfa Insurance Group Trexis One Insurance
Corporation
Physical
Damage
(2.60) 08-17-2020 09-04-2020 Territory - Relativity change in excess of
±5% for some policyholders.
Revised base rates, territory
factors, and a couple other rating
factors
4.50 8.00 7.40
Alinsco Insurance
Company
Alinsco Insurance
Company
Voluntary
Liability
(0.33) 07-01-2020 08-01-2020 Other rating variables - Revised
relativities resulting in excess of ±5%
change for some policyholders.
Base rates & factors 0.01 0.00 0.17
Alinsco Insurance
Company
Alinsco Insurance
Company
Voluntary
Liability
0.20 01-01-2020 01-01-2020 Discounts – Revised existing discounts
resulting in excess of ±5% change for
some policyholders.
Removal of Named Driver 0.01 0.00 0.17
Alinsco Insurance
Company
Alinsco Insurance
Company
Voluntary
Liability
0.36 02-01-2020 03-01-2020 Discounts – Revised existing discounts
resulting in excess of ±5% change for
some policyholders.
Monthly term policies 0.01 0.00 0.17
Allstate Insurance
Group
Allstate County Mutual
Insurance Company
Voluntary
Liability
(3.00) 12-14-2020 01-28-2021 Base rate/loss cost/loss cost multiplier –
Revised base rates/loss costs/loss cost
multiplier resulting in excess of ±5%
change.
PPA RAF - ACMC and ACMA 0.00 0.00 0.00
78
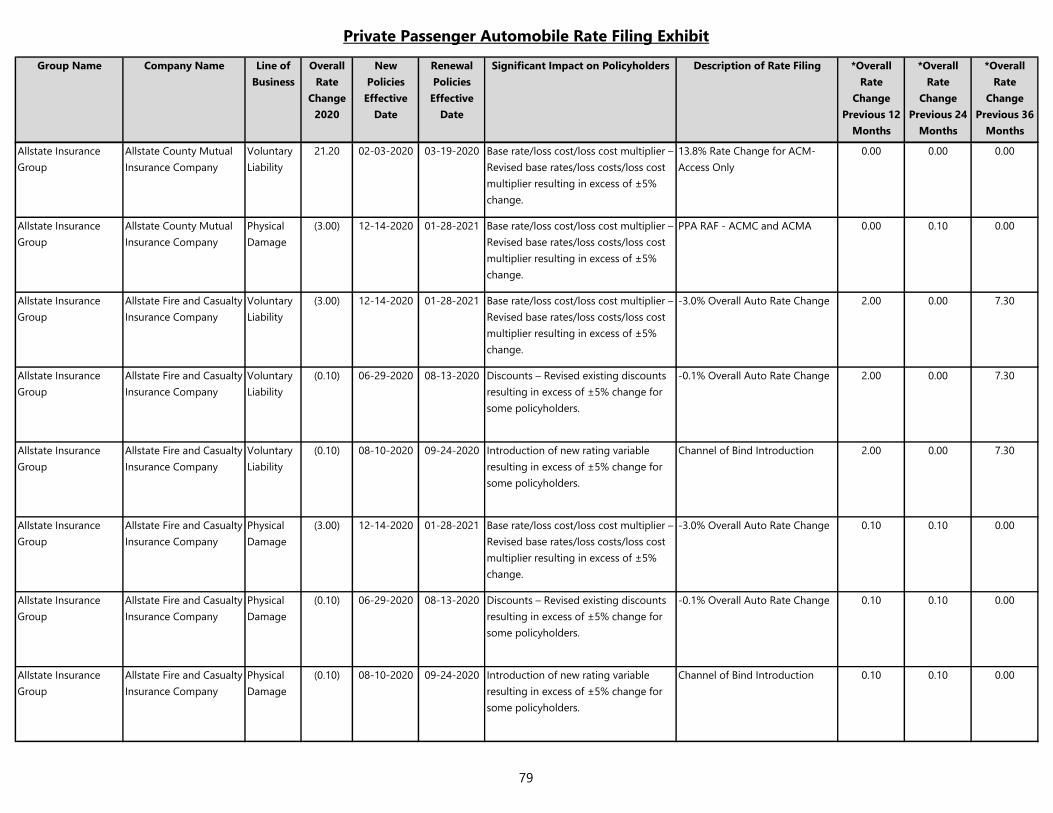
Private Passenger Automobile Rate Filing Exhibit
Group Name Company Name Line of
Business
Overall
Rate
Change
2020
New
Policies
Effective
Date
Renewal
Policies
Effective
Date
Significant Impact on Policyholders Description of Rate Filing *Overall
Rate
Change
Previous 12
Months
*Overall
Rate
Change
Previous 24
Months
*Overall
Rate
Change
Previous 36
Months
Allstate Insurance
Group
Allstate County Mutual
Insurance Company
Voluntary
Liability
21.20 02-03-2020 03-19-2020 Base rate/loss cost/loss cost multiplier –
Revised base rates/loss costs/loss cost
multiplier resulting in excess of ±5%
change.
13.8% Rate Change for ACM-
Access Only
0.00 0.00 0.00
Allstate Insurance
Group
Allstate County Mutual
Insurance Company
Physical
Damage
(3.00) 12-14-2020 01-28-2021 Base rate/loss cost/loss cost multiplier –
Revised base rates/loss costs/loss cost
multiplier resulting in excess of ±5%
change.
PPA RAF - ACMC and ACMA 0.00 0.10 0.00
Allstate Insurance
Group
Allstate Fire and Casualty
Insurance Company
Voluntary
Liability
(3.00) 12-14-2020 01-28-2021 Base rate/loss cost/loss cost multiplier –
Revised base rates/loss costs/loss cost
multiplier resulting in excess of ±5%
change.
-3.0% Overall Auto Rate Change 2.00 0.00 7.30
Allstate Insurance
Group
Allstate Fire and Casualty
Insurance Company
Voluntary
Liability
(0.10) 06-29-2020 08-13-2020 Discounts – Revised existing discounts
resulting in excess of ±5% change for
some policyholders.
-0.1% Overall Auto Rate Change 2.00 0.00 7.30
Allstate Insurance
Group
Allstate Fire and Casualty
Insurance Company
Voluntary
Liability
(0.10) 08-10-2020 09-24-2020 Introduction of new rating variable
resulting in excess of ±5% change for
some policyholders.
Channel of Bind Introduction 2.00 0.00 7.30
Allstate Insurance
Group
Allstate Fire and Casualty
Insurance Company
Physical
Damage
(3.00) 12-14-2020 01-28-2021 Base rate/loss cost/loss cost multiplier –
Revised base rates/loss costs/loss cost
multiplier resulting in excess of ±5%
change.
-3.0% Overall Auto Rate Change 0.10 0.10 0.00
Allstate Insurance
Group
Allstate Fire and Casualty
Insurance Company
Physical
Damage
(0.10) 06-29-2020 08-13-2020 Discounts – Revised existing discounts
resulting in excess of ±5% change for
some policyholders.
-0.1% Overall Auto Rate Change 0.10 0.10 0.00
Allstate Insurance
Group
Allstate Fire and Casualty
Insurance Company
Physical
Damage
(0.10) 08-10-2020 09-24-2020 Introduction of new rating variable
resulting in excess of ±5% change for
some policyholders.
Channel of Bind Introduction 0.10 0.10 0.00
79
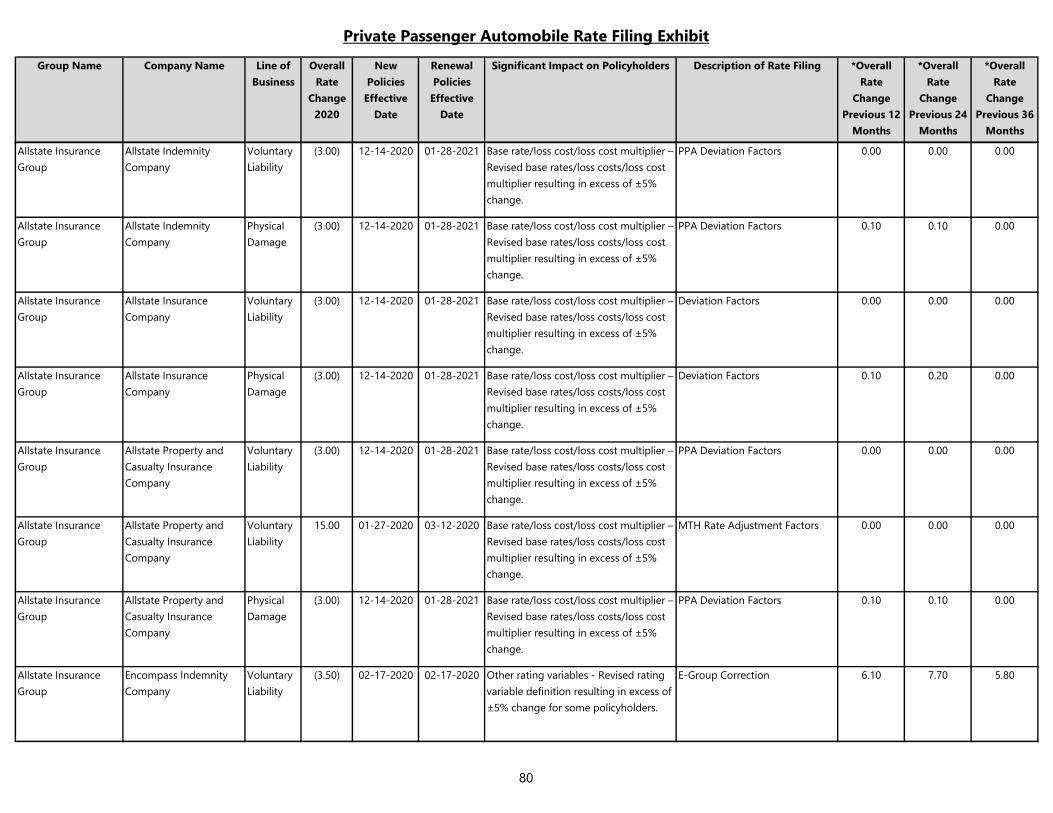
Private Passenger Automobile Rate Filing Exhibit
Group Name Company Name Line of
Business
Overall
Rate
Change
2020
New
Policies
Effective
Date
Renewal
Policies
Effective
Date
Significant Impact on Policyholders Description of Rate Filing *Overall
Rate
Change
Previous 12
Months
*Overall
Rate
Change
Previous 24
Months
*Overall
Rate
Change
Previous 36
Months
Allstate Insurance
Group
Allstate Indemnity
Company
Voluntary
Liability
(3.00) 12-14-2020 01-28-2021 Base rate/loss cost/loss cost multiplier –
Revised base rates/loss costs/loss cost
multiplier resulting in excess of ±5%
change.
PPA Deviation Factors 0.00 0.00 0.00
Allstate Insurance
Group
Allstate Indemnity
Company
Physical
Damage
(3.00) 12-14-2020 01-28-2021 Base rate/loss cost/loss cost multiplier –
Revised base rates/loss costs/loss cost
multiplier resulting in excess of ±5%
change.
PPA Deviation Factors 0.10 0.10 0.00
Allstate Insurance
Group
Allstate Insurance
Company
Voluntary
Liability
(3.00) 12-14-2020 01-28-2021 Base rate/loss cost/loss cost multiplier –
Revised base rates/loss costs/loss cost
multiplier resulting in excess of ±5%
change.
Deviation Factors 0.00 0.00 0.00
Allstate Insurance
Group
Allstate Insurance
Company
Physical
Damage
(3.00) 12-14-2020 01-28-2021 Base rate/loss cost/loss cost multiplier –
Revised base rates/loss costs/loss cost
multiplier resulting in excess of ±5%
change.
Deviation Factors 0.10 0.20 0.00
Allstate Insurance
Group
Allstate Property and
Casualty Insurance
Company
Voluntary
Liability
(3.00) 12-14-2020 01-28-2021 Base rate/loss cost/loss cost multiplier –
Revised base rates/loss costs/loss cost
multiplier resulting in excess of ±5%
change.
PPA Deviation Factors 0.00 0.00 0.00
Allstate Insurance
Group
Allstate Property and
Casualty Insurance
Company
Voluntary
Liability
15.00 01-27-2020 03-12-2020 Base rate/loss cost/loss cost multiplier –
Revised base rates/loss costs/loss cost
multiplier resulting in excess of ±5%
change.
MTH Rate Adjustment Factors 0.00 0.00 0.00
Allstate Insurance
Group
Allstate Property and
Casualty Insurance
Company
Physical
Damage
(3.00) 12-14-2020 01-28-2021 Base rate/loss cost/loss cost multiplier –
Revised base rates/loss costs/loss cost
multiplier resulting in excess of ±5%
change.
PPA Deviation Factors 0.10 0.10 0.00
Allstate Insurance
Group
Encompass Indemnity
Company
Voluntary
Liability
(3.50) 02-17-2020 02-17-2020 Other rating variables - Revised rating
variable definition resulting in excess of
±5% change for some policyholders.
E-Group Correction 6.10 7.70 5.80
80
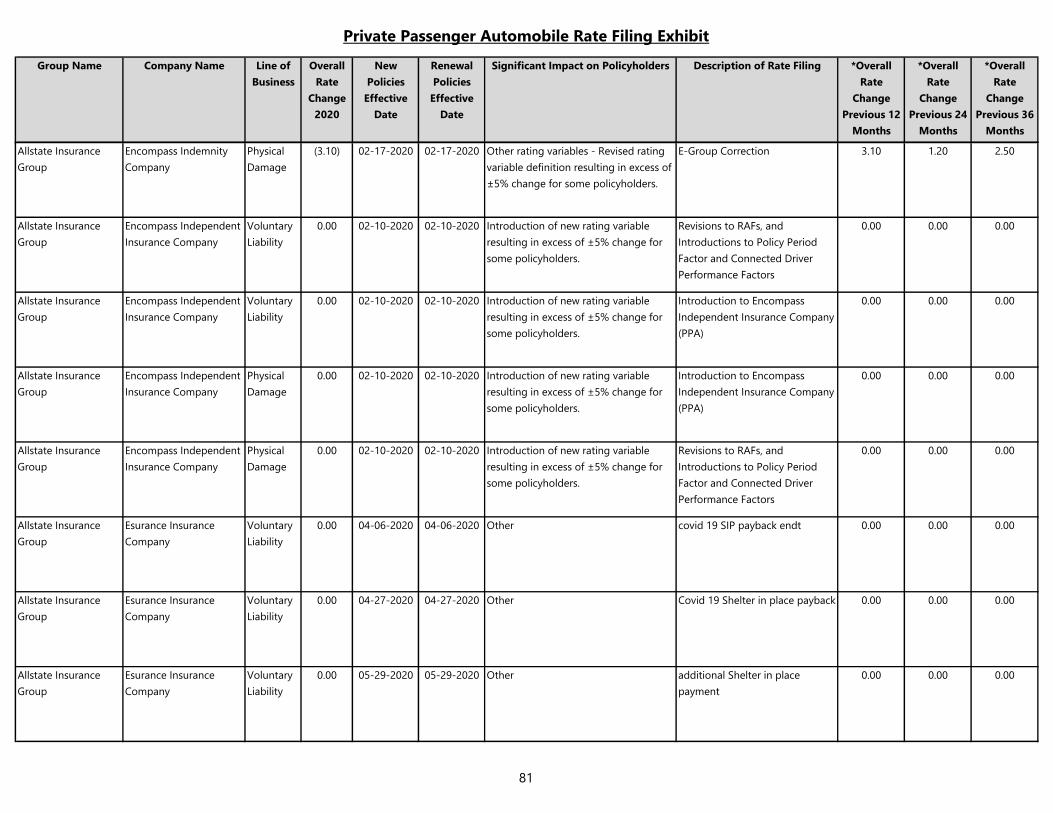
Private Passenger Automobile Rate Filing Exhibit
Group Name Company Name Line of
Business
Overall
Rate
Change
2020
New
Policies
Effective
Date
Renewal
Policies
Effective
Date
Significant Impact on Policyholders Description of Rate Filing *Overall
Rate
Change
Previous 12
Months
*Overall
Rate
Change
Previous 24
Months
*Overall
Rate
Change
Previous 36
Months
Allstate Insurance
Group
Encompass Indemnity
Company
Physical
Damage
(3.10) 02-17-2020 02-17-2020 Other rating variables - Revised rating
variable definition resulting in excess of
±5% change for some policyholders.
E-Group Correction 3.10 1.20 2.50
Allstate Insurance
Group
Encompass Independent
Insurance Company
Voluntary
Liability
0.00 02-10-2020 02-10-2020 Introduction of new rating variable
resulting in excess of ±5% change for
some policyholders.
Revisions to RAFs, and
Introductions to Policy Period
Factor and Connected Driver
Performance Factors
0.00 0.00 0.00
Allstate Insurance
Group
Encompass Independent
Insurance Company
Voluntary
Liability
0.00 02-10-2020 02-10-2020 Introduction of new rating variable
resulting in excess of ±5% change for
some policyholders.
Introduction to Encompass
Independent Insurance Company
(PPA)
0.00 0.00 0.00
Allstate Insurance
Group
Encompass Independent
Insurance Company
Physical
Damage
0.00 02-10-2020 02-10-2020 Introduction of new rating variable
resulting in excess of ±5% change for
some policyholders.
Introduction to Encompass
Independent Insurance Company
(PPA)
0.00 0.00 0.00
Allstate Insurance
Group
Encompass Independent
Insurance Company
Physical
Damage
0.00 02-10-2020 02-10-2020 Introduction of new rating variable
resulting in excess of ±5% change for
some policyholders.
Revisions to RAFs, and
Introductions to Policy Period
Factor and Connected Driver
Performance Factors
0.00 0.00 0.00
Allstate Insurance
Group
Esurance Insurance
Company
Voluntary
Liability
0.00 04-06-2020 04-06-2020 Other covid 19 SIP payback endt 0.00 0.00 0.00
Allstate Insurance
Group
Esurance Insurance
Company
Voluntary
Liability
0.00 04-27-2020 04-27-2020 Other Covid 19 Shelter in place payback 0.00 0.00 0.00
Allstate Insurance
Group
Esurance Insurance
Company
Voluntary
Liability
0.00 05-29-2020 05-29-2020 Other additional Shelter in place
payment
0.00 0.00 0.00
81
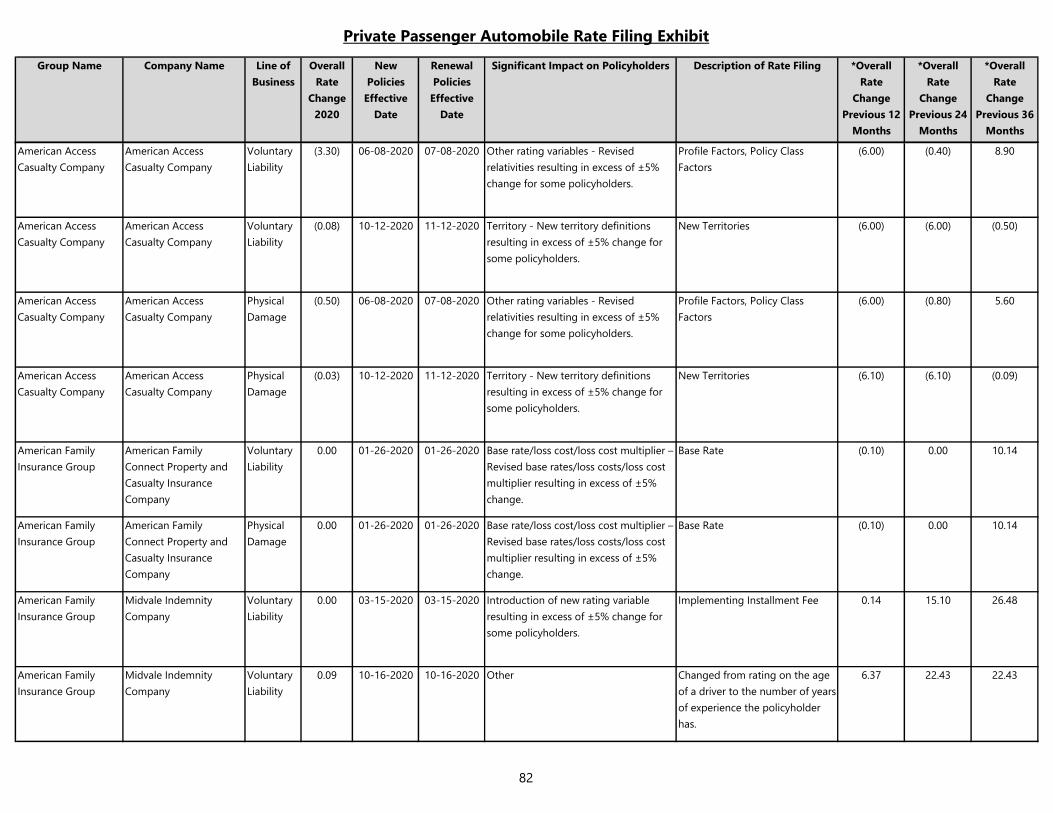
Private Passenger Automobile Rate Filing Exhibit
Group Name Company Name Line of
Business
Overall
Rate
Change
2020
New
Policies
Effective
Date
Renewal
Policies
Effective
Date
Significant Impact on Policyholders Description of Rate Filing *Overall
Rate
Change
Previous 12
Months
*Overall
Rate
Change
Previous 24
Months
*Overall
Rate
Change
Previous 36
Months
American Access
Casualty Company
American Access
Casualty Company
Voluntary
Liability
(3.30) 06-08-2020 07-08-2020 Other rating variables - Revised
relativities resulting in excess of ±5%
change for some policyholders.
Profile Factors, Policy Class
Factors
(6.00) (0.40) 8.90
American Access
Casualty Company
American Access
Casualty Company
Voluntary
Liability
(0.08) 10-12-2020 11-12-2020 Territory - New territory definitions
resulting in excess of ±5% change for
some policyholders.
New Territories (6.00) (6.00) (0.50)
American Access
Casualty Company
American Access
Casualty Company
Physical
Damage
(0.50) 06-08-2020 07-08-2020 Other rating variables - Revised
relativities resulting in excess of ±5%
change for some policyholders.
Profile Factors, Policy Class
Factors
(6.00) (0.80) 5.60
American Access
Casualty Company
American Access
Casualty Company
Physical
Damage
(0.03) 10-12-2020 11-12-2020 Territory - New territory definitions
resulting in excess of ±5% change for
some policyholders.
New Territories (6.10) (6.10) (0.09)
American Family
Insurance Group
American Family
Connect Property and
Casualty Insurance
Company
Voluntary
Liability
0.00 01-26-2020 01-26-2020 Base rate/loss cost/loss cost multiplier –
Revised base rates/loss costs/loss cost
multiplier resulting in excess of ±5%
change.
Base Rate (0.10) 0.00 10.14
American Family
Insurance Group
American Family
Connect Property and
Casualty Insurance
Company
Physical
Damage
0.00 01-26-2020 01-26-2020 Base rate/loss cost/loss cost multiplier –
Revised base rates/loss costs/loss cost
multiplier resulting in excess of ±5%
change.
Base Rate (0.10) 0.00 10.14
American Family
Insurance Group
Midvale Indemnity
Company
Voluntary
Liability
0.00 03-15-2020 03-15-2020 Introduction of new rating variable
resulting in excess of ±5% change for
some policyholders.
Implementing Installment Fee 0.14 15.10 26.48
American Family
Insurance Group
Midvale Indemnity
Company
Voluntary
Liability
0.09 10-16-2020 10-16-2020 Other Changed from rating on the age
of a driver to the number of years
of experience the policyholder
has.
6.37 22.43 22.43
82
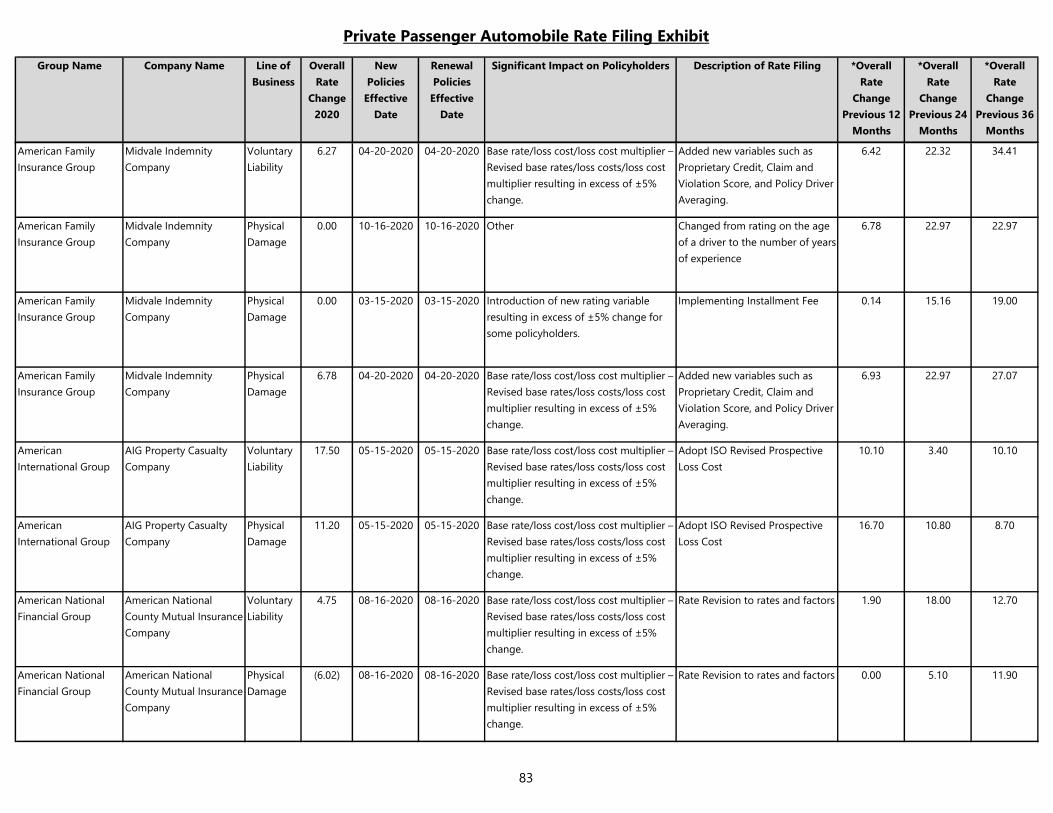
Private Passenger Automobile Rate Filing Exhibit
Group Name Company Name Line of
Business
Overall
Rate
Change
2020
New
Policies
Effective
Date
Renewal
Policies
Effective
Date
Significant Impact on Policyholders Description of Rate Filing *Overall
Rate
Change
Previous 12
Months
*Overall
Rate
Change
Previous 24
Months
*Overall
Rate
Change
Previous 36
Months
American Family
Insurance Group
Midvale Indemnity
Company
Voluntary
Liability
6.27 04-20-2020 04-20-2020 Base rate/loss cost/loss cost multiplier –
Revised base rates/loss costs/loss cost
multiplier resulting in excess of ±5%
change.
Added new variables such as
Proprietary Credit, Claim and
Violation Score, and Policy Driver
Averaging.
6.42 22.32 34.41
American Family
Insurance Group
Midvale Indemnity
Company
Physical
Damage
0.00 10-16-2020 10-16-2020 Other Changed from rating on the age
of a driver to the number of years
of experience
6.78 22.97 22.97
American Family
Insurance Group
Midvale Indemnity
Company
Physical
Damage
0.00 03-15-2020 03-15-2020 Introduction of new rating variable
resulting in excess of ±5% change for
some policyholders.
Implementing Installment Fee 0.14 15.16 19.00
American Family
Insurance Group
Midvale Indemnity
Company
Physical
Damage
6.78 04-20-2020 04-20-2020 Base rate/loss cost/loss cost multiplier –
Revised base rates/loss costs/loss cost
multiplier resulting in excess of ±5%
change.
Added new variables such as
Proprietary Credit, Claim and
Violation Score, and Policy Driver
Averaging.
6.93 22.97 27.07
American
International Group
AIG Property Casualty
Company
Voluntary
Liability
17.50 05-15-2020 05-15-2020 Base rate/loss cost/loss cost multiplier –
Revised base rates/loss costs/loss cost
multiplier resulting in excess of ±5%
change.
Adopt ISO Revised Prospective
Loss Cost
10.10 3.40 10.10
American
International Group
AIG Property Casualty
Company
Physical
Damage
11.20 05-15-2020 05-15-2020 Base rate/loss cost/loss cost multiplier –
Revised base rates/loss costs/loss cost
multiplier resulting in excess of ±5%
change.
Adopt ISO Revised Prospective
Loss Cost
16.70 10.80 8.70
American National
Financial Group
American National
County Mutual Insurance
Company
Voluntary
Liability
4.75 08-16-2020 08-16-2020 Base rate/loss cost/loss cost multiplier –
Revised base rates/loss costs/loss cost
multiplier resulting in excess of ±5%
change.
Rate Revision to rates and factors 1.90 18.00 12.70
American National
Financial Group
American National
County Mutual Insurance
Company
Physical
Damage
(6.02) 08-16-2020 08-16-2020 Base rate/loss cost/loss cost multiplier –
Revised base rates/loss costs/loss cost
multiplier resulting in excess of ±5%
change.
Rate Revision to rates and factors 0.00 5.10 11.90
83
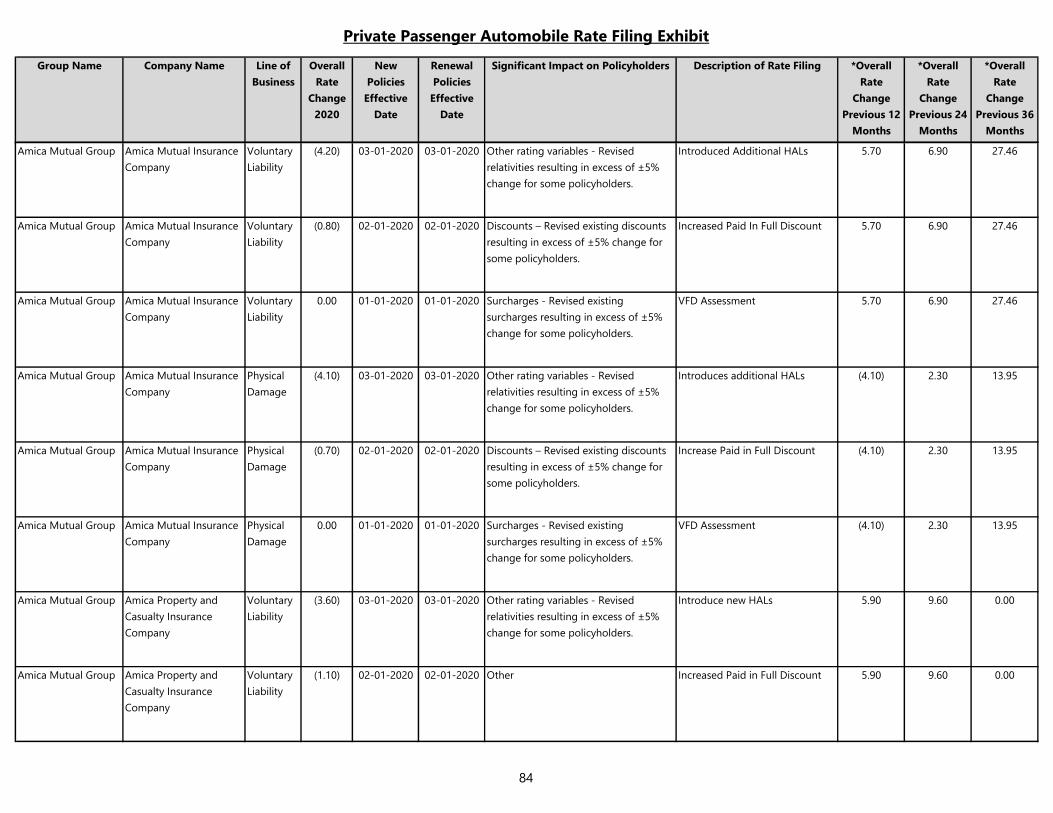
Private Passenger Automobile Rate Filing Exhibit
Group Name Company Name Line of
Business
Overall
Rate
Change
2020
New
Policies
Effective
Date
Renewal
Policies
Effective
Date
Significant Impact on Policyholders Description of Rate Filing *Overall
Rate
Change
Previous 12
Months
*Overall
Rate
Change
Previous 24
Months
*Overall
Rate
Change
Previous 36
Months
Amica Mutual Group Amica Mutual Insurance
Company
Voluntary
Liability
(4.20) 03-01-2020 03-01-2020 Other rating variables - Revised
relativities resulting in excess of ±5%
change for some policyholders.
Introduced Additional HALs 5.70 6.90 27.46
Amica Mutual Group Amica Mutual Insurance
Company
Voluntary
Liability
(0.80) 02-01-2020 02-01-2020 Discounts – Revised existing discounts
resulting in excess of ±5% change for
some policyholders.
Increased Paid In Full Discount 5.70 6.90 27.46
Amica Mutual Group Amica Mutual Insurance
Company
Voluntary
Liability
0.00 01-01-2020 01-01-2020 Surcharges - Revised existing
surcharges resulting in excess of ±5%
change for some policyholders.
VFD Assessment 5.70 6.90 27.46
Amica Mutual Group Amica Mutual Insurance
Company
Physical
Damage
(4.10) 03-01-2020 03-01-2020 Other rating variables - Revised
relativities resulting in excess of ±5%
change for some policyholders.
Introduces additional HALs (4.10) 2.30 13.95
Amica Mutual Group Amica Mutual Insurance
Company
Physical
Damage
(0.70) 02-01-2020 02-01-2020 Discounts – Revised existing discounts
resulting in excess of ±5% change for
some policyholders.
Increase Paid in Full Discount (4.10) 2.30 13.95
Amica Mutual Group Amica Mutual Insurance
Company
Physical
Damage
0.00 01-01-2020 01-01-2020 Surcharges - Revised existing
surcharges resulting in excess of ±5%
change for some policyholders.
VFD Assessment (4.10) 2.30 13.95
Amica Mutual Group Amica Property and
Casualty Insurance
Company
Voluntary
Liability
(3.60) 03-01-2020 03-01-2020 Other rating variables - Revised
relativities resulting in excess of ±5%
change for some policyholders.
Introduce new HALs 5.90 9.60 0.00
Amica Mutual Group Amica Property and
Casualty Insurance
Company
Voluntary
Liability
(1.10) 02-01-2020 02-01-2020 Other Increased Paid in Full Discount 5.90 9.60 0.00
84
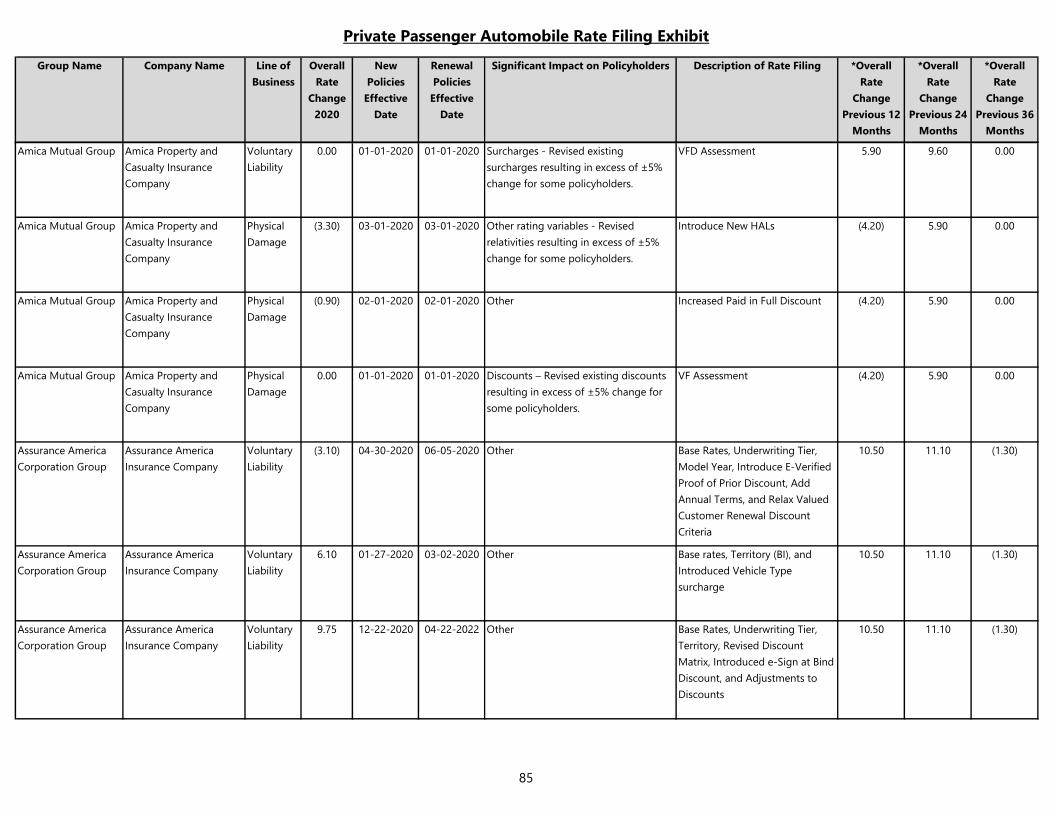
Private Passenger Automobile Rate Filing Exhibit
Group Name Company Name Line of
Business
Overall
Rate
Change
2020
New
Policies
Effective
Date
Renewal
Policies
Effective
Date
Significant Impact on Policyholders Description of Rate Filing *Overall
Rate
Change
Previous 12
Months
*Overall
Rate
Change
Previous 24
Months
*Overall
Rate
Change
Previous 36
Months
Amica Mutual Group Amica Property and
Casualty Insurance
Company
Voluntary
Liability
0.00 01-01-2020 01-01-2020 Surcharges - Revised existing
surcharges resulting in excess of ±5%
change for some policyholders.
VFD Assessment 5.90 9.60 0.00
Amica Mutual Group Amica Property and
Casualty Insurance
Company
Physical
Damage
(3.30) 03-01-2020 03-01-2020 Other rating variables - Revised
relativities resulting in excess of ±5%
change for some policyholders.
Introduce New HALs (4.20) 5.90 0.00
Amica Mutual Group Amica Property and
Casualty Insurance
Company
Physical
Damage
(0.90) 02-01-2020 02-01-2020 Other Increased Paid in Full Discount (4.20) 5.90 0.00
Amica Mutual Group Amica Property and
Casualty Insurance
Company
Physical
Damage
0.00 01-01-2020 01-01-2020 Discounts – Revised existing discounts
resulting in excess of ±5% change for
some policyholders.
VF Assessment (4.20) 5.90 0.00
Assurance America
Corporation Group
Assurance America
Insurance Company
Voluntary
Liability
(3.10) 04-30-2020 06-05-2020 Other Base Rates, Underwriting Tier,
Model Year, Introduce E-Verified
Proof of Prior Discount, Add
Annual Terms, and Relax Valued
Customer Renewal Discount
Criteria
10.50 11.10 (1.30)
Assurance America
Corporation Group
Assurance America
Insurance Company
Voluntary
Liability
6.10 01-27-2020 03-02-2020 Other Base rates, Territory (BI), and
Introduced Vehicle Type
surcharge
10.50 11.10 (1.30)
Assurance America
Corporation Group
Assurance America
Insurance Company
Voluntary
Liability
9.75 12-22-2020 04-22-2022 Other Base Rates, Underwriting Tier,
Territory, Revised Discount
Matrix, Introduced e-Sign at Bind
Discount, and Adjustments to
Discounts
10.50 11.10 (1.30)
85
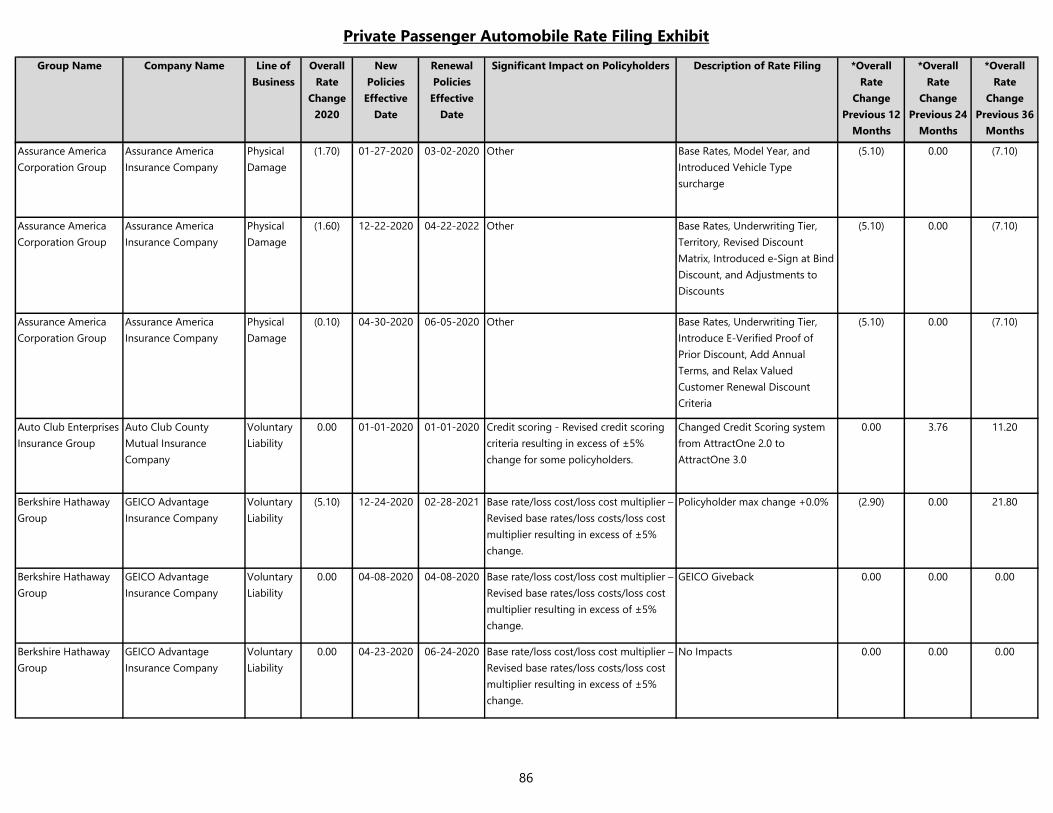
Private Passenger Automobile Rate Filing Exhibit
Group Name Company Name Line of
Business
Overall
Rate
Change
2020
New
Policies
Effective
Date
Renewal
Policies
Effective
Date
Significant Impact on Policyholders Description of Rate Filing *Overall
Rate
Change
Previous 12
Months
*Overall
Rate
Change
Previous 24
Months
*Overall
Rate
Change
Previous 36
Months
Assurance America
Corporation Group
Assurance America
Insurance Company
Physical
Damage
(1.70) 01-27-2020 03-02-2020 Other Base Rates, Model Year, and
Introduced Vehicle Type
surcharge
(5.10) 0.00 (7.10)
Assurance America
Corporation Group
Assurance America
Insurance Company
Physical
Damage
(1.60) 12-22-2020 04-22-2022 Other Base Rates, Underwriting Tier,
Territory, Revised Discount
Matrix, Introduced e-Sign at Bind
Discount, and Adjustments to
Discounts
(5.10) 0.00 (7.10)
Assurance America
Corporation Group
Assurance America
Insurance Company
Physical
Damage
(0.10) 04-30-2020 06-05-2020 Other Base Rates, Underwriting Tier,
Introduce E-Verified Proof of
Prior Discount, Add Annual
Terms, and Relax Valued
Customer Renewal Discount
Criteria
(5.10) 0.00 (7.10)
Auto Club Enterprises
Insurance Group
Auto Club County
Mutual Insurance
Company
Voluntary
Liability
0.00 01-01-2020 01-01-2020 Credit scoring - Revised credit scoring
criteria resulting in excess of ±5%
change for some policyholders.
Changed Credit Scoring system
from AttractOne 2.0 to
AttractOne 3.0
0.00 3.76 11.20
Berkshire Hathaway
Group
GEICO Advantage
Insurance Company
Voluntary
Liability
(5.10) 12-24-2020 02-28-2021 Base rate/loss cost/loss cost multiplier –
Revised base rates/loss costs/loss cost
multiplier resulting in excess of ±5%
change.
Policyholder max change +0.0% (2.90) 0.00 21.80
Berkshire Hathaway
Group
GEICO Advantage
Insurance Company
Voluntary
Liability
0.00 04-08-2020 04-08-2020 Base rate/loss cost/loss cost multiplier –
Revised base rates/loss costs/loss cost
multiplier resulting in excess of ±5%
change.
GEICO Giveback 0.00 0.00 0.00
Berkshire Hathaway
Group
GEICO Advantage
Insurance Company
Voluntary
Liability
0.00 04-23-2020 06-24-2020 Base rate/loss cost/loss cost multiplier –
Revised base rates/loss costs/loss cost
multiplier resulting in excess of ±5%
change.
No Impacts 0.00 0.00 0.00
86

Private Passenger Automobile Rate Filing Exhibit
Group Name Company Name Line of
Business
Overall
Rate
Change
2020
New
Policies
Effective
Date
Renewal
Policies
Effective
Date
Significant Impact on Policyholders Description of Rate Filing *Overall
Rate
Change
Previous 12
Months
*Overall
Rate
Change
Previous 24
Months
*Overall
Rate
Change
Previous 36
Months
Berkshire Hathaway
Group
GEICO Advantage
Insurance Company
Voluntary
Liability
2.60 02-18-2020 04-04-2020 Base rate/loss cost/loss cost multiplier –
Revised base rates/loss costs/loss cost
multiplier resulting in excess of ±5%
change.
Policyholder max change +56.9% (2.90) 0.00 21.80
Berkshire Hathaway
Group
GEICO Choice Insurance
Company
Voluntary
Liability
(5.40) 12-24-2020 02-28-2021 Base rate/loss cost/loss cost multiplier –
Revised base rates/loss costs/loss cost
multiplier resulting in excess of ±5%
change.
Policyholder max change +0.0% (2.70) 0.00 18.40
Berkshire Hathaway
Group
GEICO Choice Insurance
Company
Voluntary
Liability
0.00 04-08-2020 04-08-2020 Base rate/loss cost/loss cost multiplier –
Revised base rates/loss costs/loss cost
multiplier resulting in excess of ±5%
change.
GEICO Giveback 0.00 0.00 0.00
Berkshire Hathaway
Group
GEICO Choice Insurance
Company
Voluntary
Liability
0.00 04-23-2020 06-24-2020 Base rate/loss cost/loss cost multiplier –
Revised base rates/loss costs/loss cost
multiplier resulting in excess of ±5%
change.
No impacts 0.00 0.00 0.00
Berkshire Hathaway
Group
GEICO Choice Insurance
Company
Voluntary
Liability
2.20 02-18-2020 04-04-2020 Base rate/loss cost/loss cost multiplier –
Revised base rates/loss costs/loss cost
multiplier resulting in excess of ±5%
change.
Policyholder max change +55.4% (2.70) 0.00 18.40
Berkshire Hathaway
Group
GEICO County Mutual
Insurance Company
Voluntary
Liability
(5.10) 12-24-2020 02-28-2021 Base rate/loss cost/loss cost multiplier –
Revised base rates/loss costs/loss cost
multiplier resulting in excess of ±5%
change.
Policyholder max change +0.0% (2.70) 0.00 18.90
Berkshire Hathaway
Group
GEICO County Mutual
Insurance Company
Voluntary
Liability
0.00 12-17-2020 02-21-2021 Base rate/loss cost/loss cost multiplier –
Revised base rates/loss costs/loss cost
multiplier resulting in excess of ±5%
change.
Policyholder max change +0.0% 0.00 0.00 0.00
Berkshire Hathaway
Group
GEICO County Mutual
Insurance Company
Voluntary
Liability
0.00 04-08-2020 04-08-2020 Base rate/loss cost/loss cost multiplier –
Revised base rates/loss costs/loss cost
multiplier resulting in excess of ±5%
change.
GEICO Giveback 0.00 0.00 0.00
87
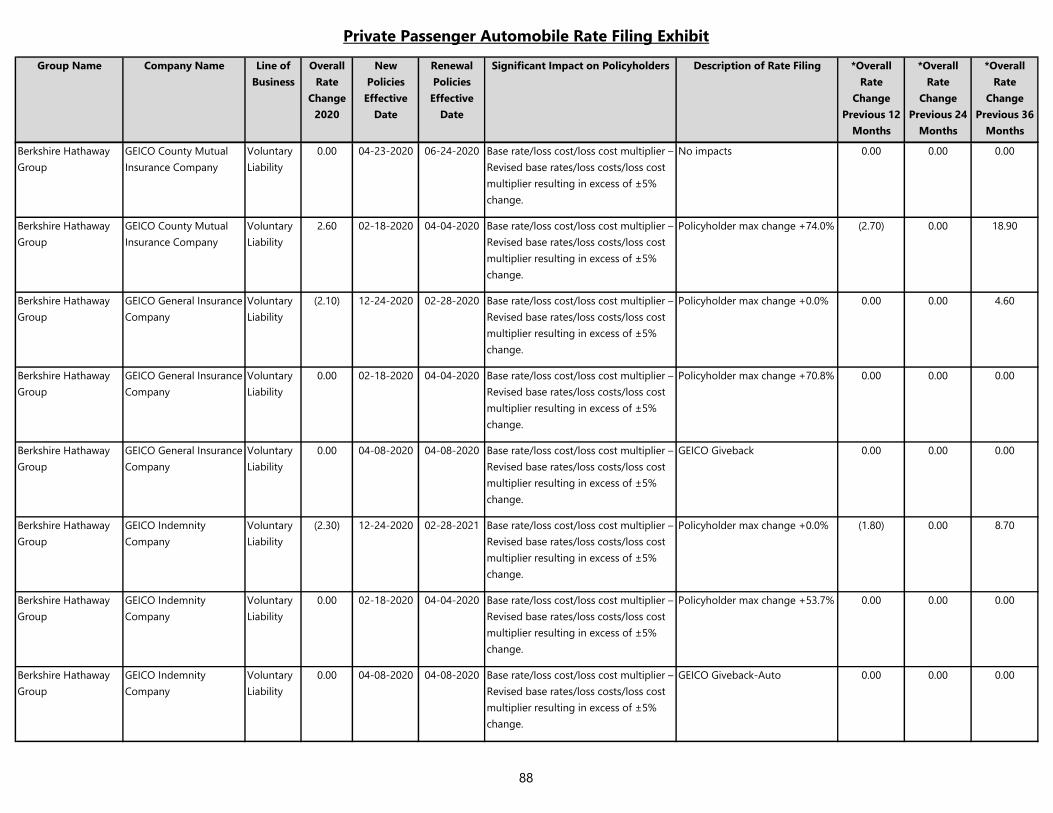
Private Passenger Automobile Rate Filing Exhibit
Group Name Company Name Line of
Business
Overall
Rate
Change
2020
New
Policies
Effective
Date
Renewal
Policies
Effective
Date
Significant Impact on Policyholders Description of Rate Filing *Overall
Rate
Change
Previous 12
Months
*Overall
Rate
Change
Previous 24
Months
*Overall
Rate
Change
Previous 36
Months
Berkshire Hathaway
Group
GEICO County Mutual
Insurance Company
Voluntary
Liability
0.00 04-23-2020 06-24-2020 Base rate/loss cost/loss cost multiplier –
Revised base rates/loss costs/loss cost
multiplier resulting in excess of ±5%
change.
No impacts 0.00 0.00 0.00
Berkshire Hathaway
Group
GEICO County Mutual
Insurance Company
Voluntary
Liability
2.60 02-18-2020 04-04-2020 Base rate/loss cost/loss cost multiplier –
Revised base rates/loss costs/loss cost
multiplier resulting in excess of ±5%
change.
Policyholder max change +74.0% (2.70) 0.00 18.90
Berkshire Hathaway
Group
GEICO General Insurance
Company
Voluntary
Liability
(2.10) 12-24-2020 02-28-2020 Base rate/loss cost/loss cost multiplier –
Revised base rates/loss costs/loss cost
multiplier resulting in excess of ±5%
change.
Policyholder max change +0.0% 0.00 0.00 4.60
Berkshire Hathaway
Group
GEICO General Insurance
Company
Voluntary
Liability
0.00 02-18-2020 04-04-2020 Base rate/loss cost/loss cost multiplier –
Revised base rates/loss costs/loss cost
multiplier resulting in excess of ±5%
change.
Policyholder max change +70.8% 0.00 0.00 0.00
Berkshire Hathaway
Group
GEICO General Insurance
Company
Voluntary
Liability
0.00 04-08-2020 04-08-2020 Base rate/loss cost/loss cost multiplier –
Revised base rates/loss costs/loss cost
multiplier resulting in excess of ±5%
change.
GEICO Giveback 0.00 0.00 0.00
Berkshire Hathaway
Group
GEICO Indemnity
Company
Voluntary
Liability
(2.30) 12-24-2020 02-28-2021 Base rate/loss cost/loss cost multiplier –
Revised base rates/loss costs/loss cost
multiplier resulting in excess of ±5%
change.
Policyholder max change +0.0% (1.80) 0.00 8.70
Berkshire Hathaway
Group
GEICO Indemnity
Company
Voluntary
Liability
0.00 02-18-2020 04-04-2020 Base rate/loss cost/loss cost multiplier –
Revised base rates/loss costs/loss cost
multiplier resulting in excess of ±5%
change.
Policyholder max change +53.7% 0.00 0.00 0.00
Berkshire Hathaway
Group
GEICO Indemnity
Company
Voluntary
Liability
0.00 04-08-2020 04-08-2020 Base rate/loss cost/loss cost multiplier –
Revised base rates/loss costs/loss cost
multiplier resulting in excess of ±5%
change.
GEICO Giveback-Auto 0.00 0.00 0.00
88
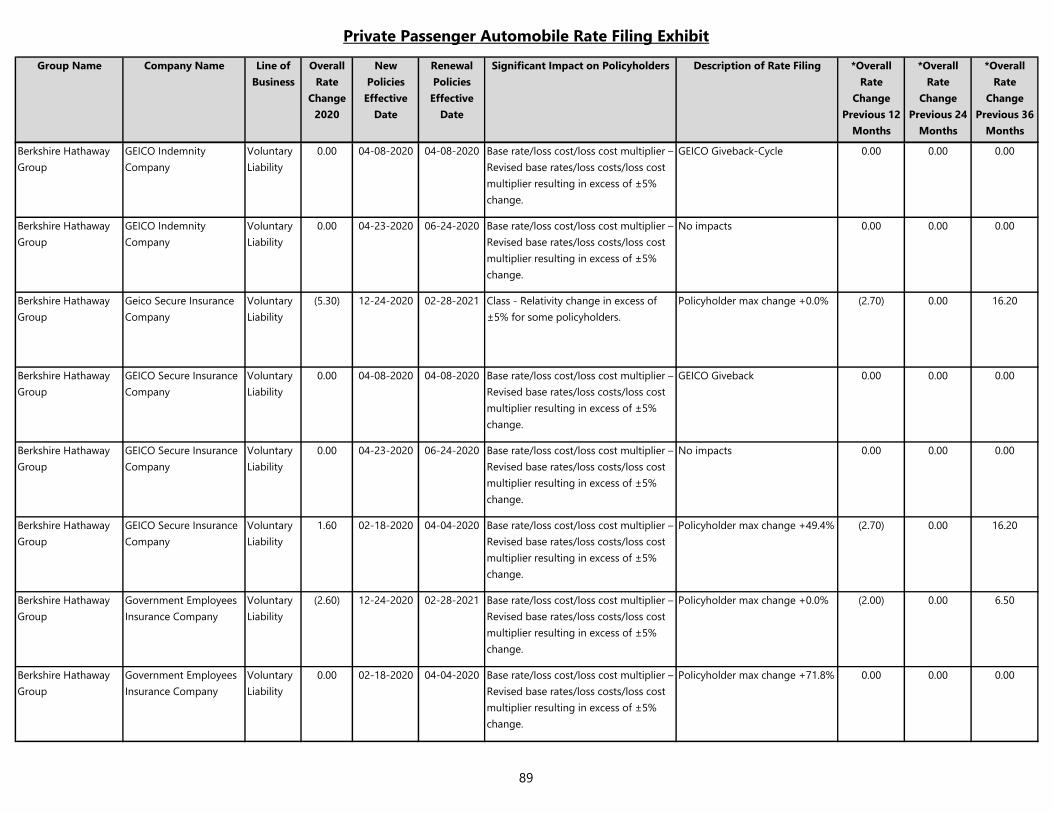
Private Passenger Automobile Rate Filing Exhibit
Group Name Company Name Line of
Business
Overall
Rate
Change
2020
New
Policies
Effective
Date
Renewal
Policies
Effective
Date
Significant Impact on Policyholders Description of Rate Filing *Overall
Rate
Change
Previous 12
Months
*Overall
Rate
Change
Previous 24
Months
*Overall
Rate
Change
Previous 36
Months
Berkshire Hathaway
Group
GEICO Indemnity
Company
Voluntary
Liability
0.00 04-08-2020 04-08-2020 Base rate/loss cost/loss cost multiplier –
Revised base rates/loss costs/loss cost
multiplier resulting in excess of ±5%
change.
GEICO Giveback-Cycle 0.00 0.00 0.00
Berkshire Hathaway
Group
GEICO Indemnity
Company
Voluntary
Liability
0.00 04-23-2020 06-24-2020 Base rate/loss cost/loss cost multiplier –
Revised base rates/loss costs/loss cost
multiplier resulting in excess of ±5%
change.
No impacts 0.00 0.00 0.00
Berkshire Hathaway
Group
Geico Secure Insurance
Company
Voluntary
Liability
(5.30) 12-24-2020 02-28-2021 Class - Relativity change in excess of
±5% for some policyholders.
Policyholder max change +0.0% (2.70) 0.00 16.20
Berkshire Hathaway
Group
GEICO Secure Insurance
Company
Voluntary
Liability
0.00 04-08-2020 04-08-2020 Base rate/loss cost/loss cost multiplier –
Revised base rates/loss costs/loss cost
multiplier resulting in excess of ±5%
change.
GEICO Giveback 0.00 0.00 0.00
Berkshire Hathaway
Group
GEICO Secure Insurance
Company
Voluntary
Liability
0.00 04-23-2020 06-24-2020 Base rate/loss cost/loss cost multiplier –
Revised base rates/loss costs/loss cost
multiplier resulting in excess of ±5%
change.
No impacts 0.00 0.00 0.00
Berkshire Hathaway
Group
GEICO Secure Insurance
Company
Voluntary
Liability
1.60 02-18-2020 04-04-2020 Base rate/loss cost/loss cost multiplier –
Revised base rates/loss costs/loss cost
multiplier resulting in excess of ±5%
change.
Policyholder max change +49.4% (2.70) 0.00 16.20
Berkshire Hathaway
Group
Government Employees
Insurance Company
Voluntary
Liability
(2.60) 12-24-2020 02-28-2021 Base rate/loss cost/loss cost multiplier –
Revised base rates/loss costs/loss cost
multiplier resulting in excess of ±5%
change.
Policyholder max change +0.0% (2.00) 0.00 6.50
Berkshire Hathaway
Group
Government Employees
Insurance Company
Voluntary
Liability
0.00 02-18-2020 04-04-2020 Base rate/loss cost/loss cost multiplier –
Revised base rates/loss costs/loss cost
multiplier resulting in excess of ±5%
change.
Policyholder max change +71.8% 0.00 0.00 0.00
89
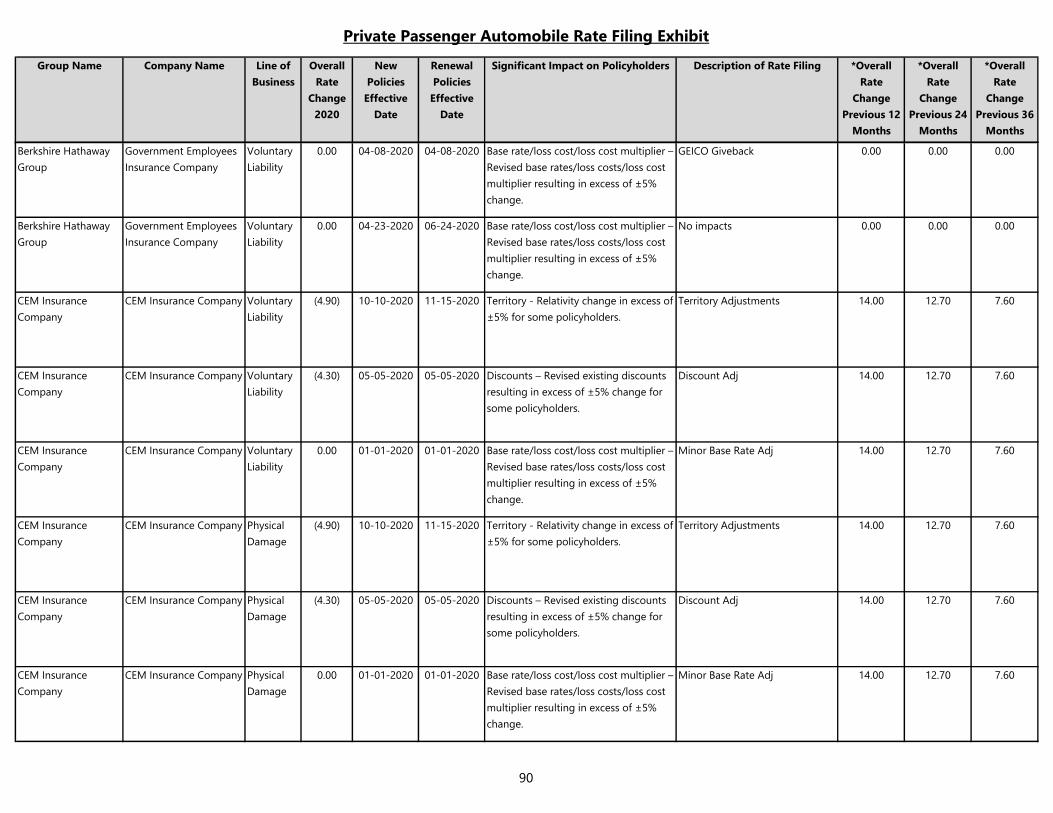
Private Passenger Automobile Rate Filing Exhibit
Group Name Company Name Line of
Business
Overall
Rate
Change
2020
New
Policies
Effective
Date
Renewal
Policies
Effective
Date
Significant Impact on Policyholders Description of Rate Filing *Overall
Rate
Change
Previous 12
Months
*Overall
Rate
Change
Previous 24
Months
*Overall
Rate
Change
Previous 36
Months
Berkshire Hathaway
Group
Government Employees
Insurance Company
Voluntary
Liability
0.00 04-08-2020 04-08-2020 Base rate/loss cost/loss cost multiplier –
Revised base rates/loss costs/loss cost
multiplier resulting in excess of ±5%
change.
GEICO Giveback 0.00 0.00 0.00
Berkshire Hathaway
Group
Government Employees
Insurance Company
Voluntary
Liability
0.00 04-23-2020 06-24-2020 Base rate/loss cost/loss cost multiplier –
Revised base rates/loss costs/loss cost
multiplier resulting in excess of ±5%
change.
No impacts 0.00 0.00 0.00
CEM Insurance
Company
CEM Insurance Company Voluntary
Liability
(4.90) 10-10-2020 11-15-2020 Territory - Relativity change in excess of
±5% for some policyholders.
Territory Adjustments 14.00 12.70 7.60
CEM Insurance
Company
CEM Insurance Company Voluntary
Liability
(4.30) 05-05-2020 05-05-2020 Discounts – Revised existing discounts
resulting in excess of ±5% change for
some policyholders.
Discount Adj 14.00 12.70 7.60
CEM Insurance
Company
CEM Insurance Company Voluntary
Liability
0.00 01-01-2020 01-01-2020 Base rate/loss cost/loss cost multiplier –
Revised base rates/loss costs/loss cost
multiplier resulting in excess of ±5%
change.
Minor Base Rate Adj 14.00 12.70 7.60
CEM Insurance
Company
CEM Insurance Company Physical
Damage
(4.90) 10-10-2020 11-15-2020 Territory - Relativity change in excess of
±5% for some policyholders.
Territory Adjustments 14.00 12.70 7.60
CEM Insurance
Company
CEM Insurance Company Physical
Damage
(4.30) 05-05-2020 05-05-2020 Discounts – Revised existing discounts
resulting in excess of ±5% change for
some policyholders.
Discount Adj 14.00 12.70 7.60
CEM Insurance
Company
CEM Insurance Company Physical
Damage
0.00 01-01-2020 01-01-2020 Base rate/loss cost/loss cost multiplier –
Revised base rates/loss costs/loss cost
multiplier resulting in excess of ±5%
change.
Minor Base Rate Adj 14.00 12.70 7.60
90
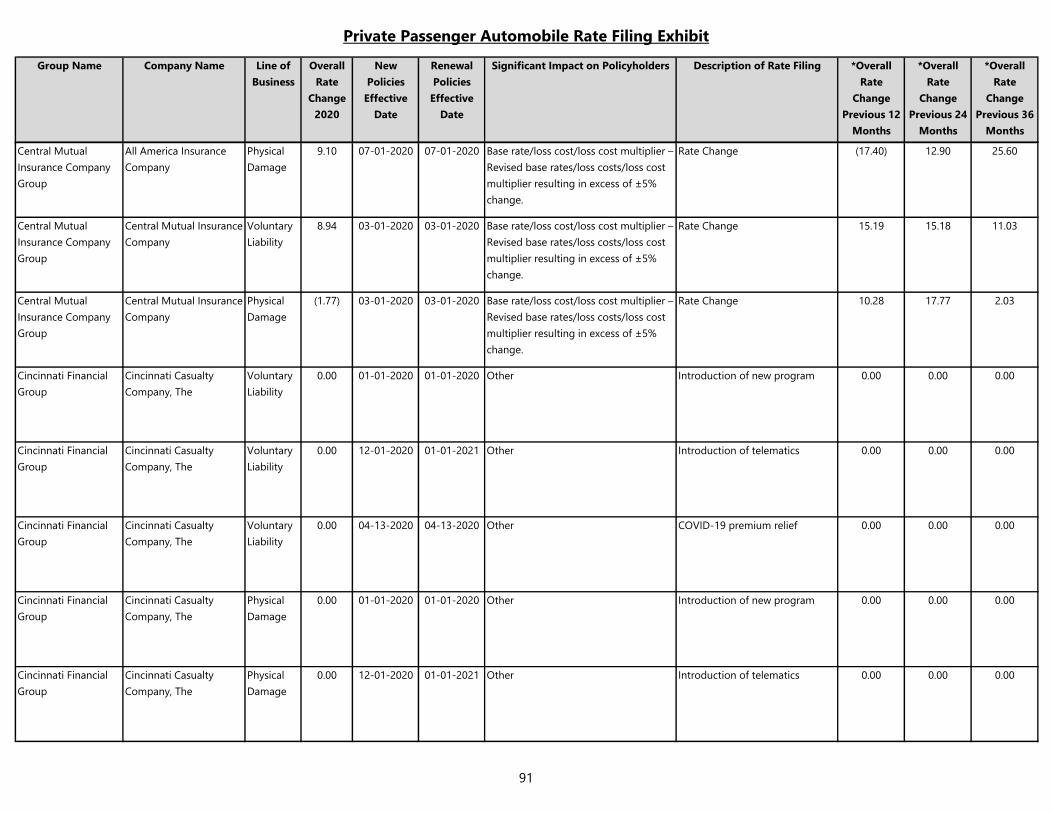
Private Passenger Automobile Rate Filing Exhibit
Group Name Company Name Line of
Business
Overall
Rate
Change
2020
New
Policies
Effective
Date
Renewal
Policies
Effective
Date
Significant Impact on Policyholders Description of Rate Filing *Overall
Rate
Change
Previous 12
Months
*Overall
Rate
Change
Previous 24
Months
*Overall
Rate
Change
Previous 36
Months
Central Mutual
Insurance Company
Group
All America Insurance
Company
Physical
Damage
9.10 07-01-2020 07-01-2020 Base rate/loss cost/loss cost multiplier –
Revised base rates/loss costs/loss cost
multiplier resulting in excess of ±5%
change.
Rate Change (17.40) 12.90 25.60
Central Mutual
Insurance Company
Group
Central Mutual Insurance
Company
Voluntary
Liability
8.94 03-01-2020 03-01-2020 Base rate/loss cost/loss cost multiplier –
Revised base rates/loss costs/loss cost
multiplier resulting in excess of ±5%
change.
Rate Change 15.19 15.18 11.03
Central Mutual
Insurance Company
Group
Central Mutual Insurance
Company
Physical
Damage
(1.77) 03-01-2020 03-01-2020 Base rate/loss cost/loss cost multiplier –
Revised base rates/loss costs/loss cost
multiplier resulting in excess of ±5%
change.
Rate Change 10.28 17.77 2.03
Cincinnati Financial
Group
Cincinnati Casualty
Company, The
Voluntary
Liability
0.00 01-01-2020 01-01-2020 Other Introduction of new program 0.00 0.00 0.00
Cincinnati Financial
Group
Cincinnati Casualty
Company, The
Voluntary
Liability
0.00 12-01-2020 01-01-2021 Other Introduction of telematics 0.00 0.00 0.00
Cincinnati Financial
Group
Cincinnati Casualty
Company, The
Voluntary
Liability
0.00 04-13-2020 04-13-2020 Other COVID-19 premium relief 0.00 0.00 0.00
Cincinnati Financial
Group
Cincinnati Casualty
Company, The
Physical
Damage
0.00 01-01-2020 01-01-2020 Other Introduction of new program 0.00 0.00 0.00
Cincinnati Financial
Group
Cincinnati Casualty
Company, The
Physical
Damage
0.00 12-01-2020 01-01-2021 Other Introduction of telematics 0.00 0.00 0.00
91
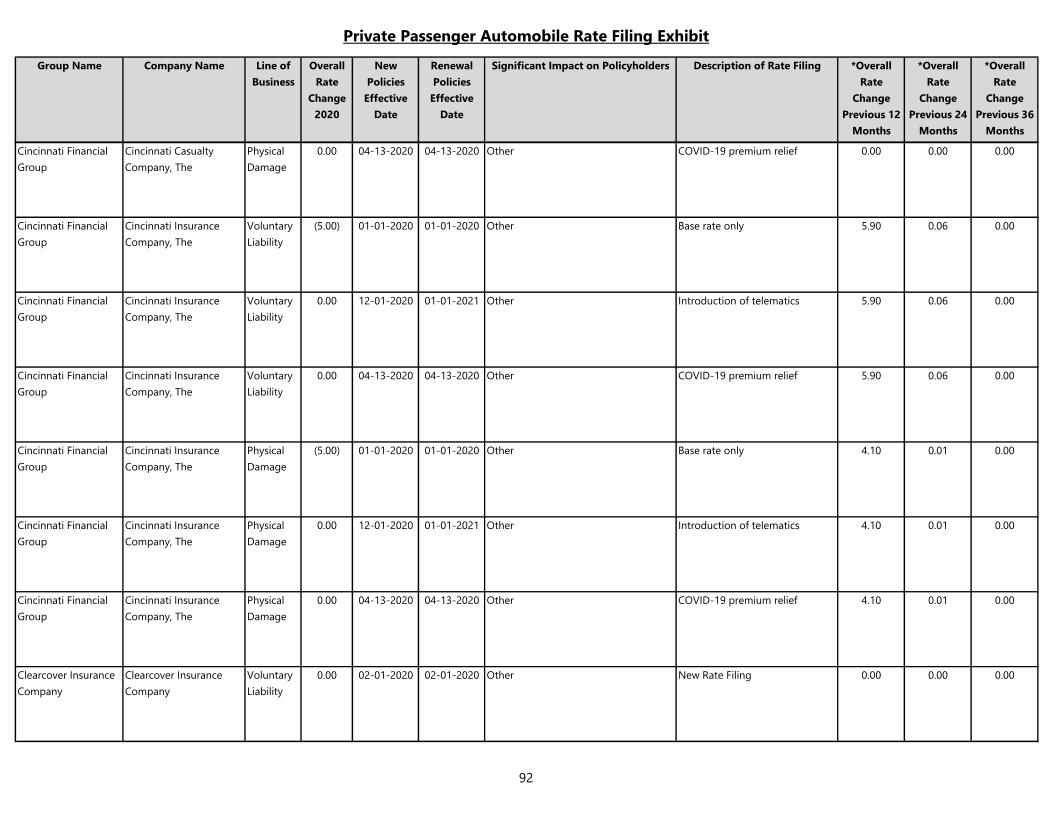
Private Passenger Automobile Rate Filing Exhibit
Group Name Company Name Line of
Business
Overall
Rate
Change
2020
New
Policies
Effective
Date
Renewal
Policies
Effective
Date
Significant Impact on Policyholders Description of Rate Filing *Overall
Rate
Change
Previous 12
Months
*Overall
Rate
Change
Previous 24
Months
*Overall
Rate
Change
Previous 36
Months
Cincinnati Financial
Group
Cincinnati Casualty
Company, The
Physical
Damage
0.00 04-13-2020 04-13-2020 Other COVID-19 premium relief 0.00 0.00 0.00
Cincinnati Financial
Group
Cincinnati Insurance
Company, The
Voluntary
Liability
(5.00) 01-01-2020 01-01-2020 Other Base rate only 5.90 0.06 0.00
Cincinnati Financial
Group
Cincinnati Insurance
Company, The
Voluntary
Liability
0.00 12-01-2020 01-01-2021 Other Introduction of telematics 5.90 0.06 0.00
Cincinnati Financial
Group
Cincinnati Insurance
Company, The
Voluntary
Liability
0.00 04-13-2020 04-13-2020 Other COVID-19 premium relief 5.90 0.06 0.00
Cincinnati Financial
Group
Cincinnati Insurance
Company, The
Physical
Damage
(5.00) 01-01-2020 01-01-2020 Other Base rate only 4.10 0.01 0.00
Cincinnati Financial
Group
Cincinnati Insurance
Company, The
Physical
Damage
0.00 12-01-2020 01-01-2021 Other Introduction of telematics 4.10 0.01 0.00
Cincinnati Financial
Group
Cincinnati Insurance
Company, The
Physical
Damage
0.00 04-13-2020 04-13-2020 Other COVID-19 premium relief 4.10 0.01 0.00
Clearcover Insurance
Company
Clearcover Insurance
Company
Voluntary
Liability
0.00 02-01-2020 02-01-2020 Other New Rate Filing 0.00 0.00 0.00
92
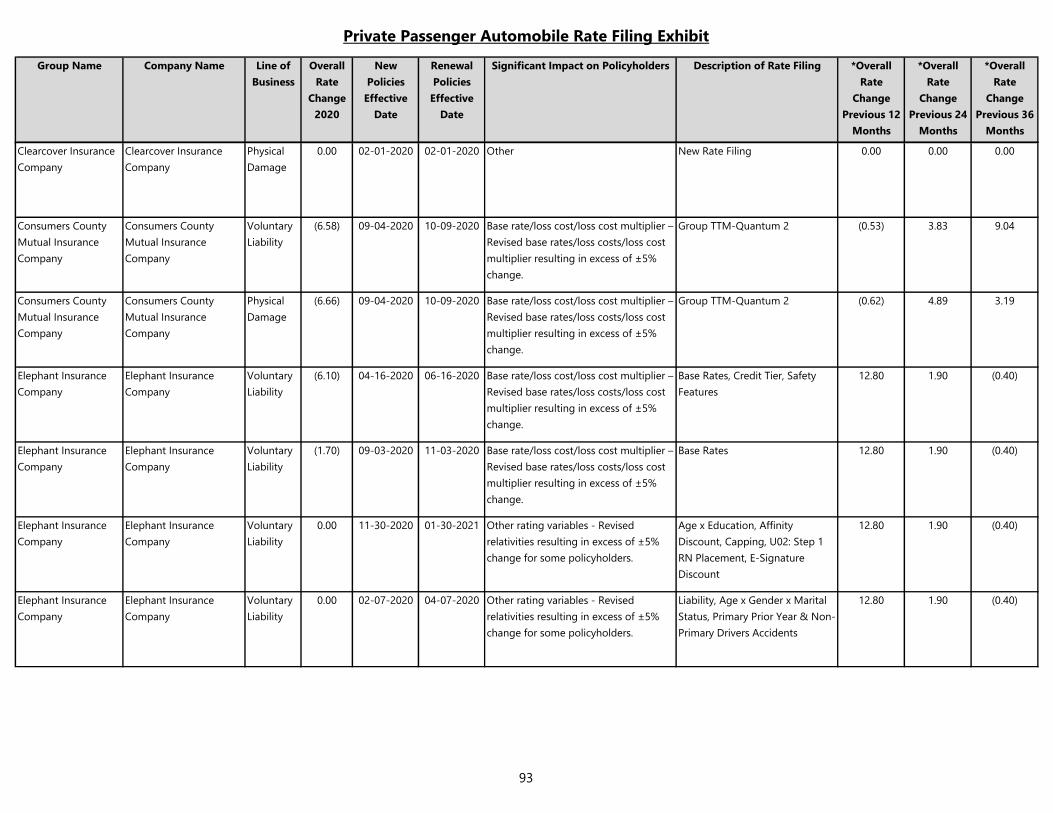
Private Passenger Automobile Rate Filing Exhibit
Group Name Company Name Line of
Business
Overall
Rate
Change
2020
New
Policies
Effective
Date
Renewal
Policies
Effective
Date
Significant Impact on Policyholders Description of Rate Filing *Overall
Rate
Change
Previous 12
Months
*Overall
Rate
Change
Previous 24
Months
*Overall
Rate
Change
Previous 36
Months
Clearcover Insurance
Company
Clearcover Insurance
Company
Physical
Damage
0.00 02-01-2020 02-01-2020 Other New Rate Filing 0.00 0.00 0.00
Consumers County
Mutual Insurance
Company
Consumers County
Mutual Insurance
Company
Voluntary
Liability
(6.58) 09-04-2020 10-09-2020 Base rate/loss cost/loss cost multiplier –
Revised base rates/loss costs/loss cost
multiplier resulting in excess of ±5%
change.
Group TTM-Quantum 2 (0.53) 3.83 9.04
Consumers County
Mutual Insurance
Company
Consumers County
Mutual Insurance
Company
Physical
Damage
(6.66) 09-04-2020 10-09-2020 Base rate/loss cost/loss cost multiplier –
Revised base rates/loss costs/loss cost
multiplier resulting in excess of ±5%
change.
Group TTM-Quantum 2 (0.62) 4.89 3.19
Elephant Insurance
Company
Elephant Insurance
Company
Voluntary
Liability
(6.10) 04-16-2020 06-16-2020 Base rate/loss cost/loss cost multiplier –
Revised base rates/loss costs/loss cost
multiplier resulting in excess of ±5%
change.
Base Rates, Credit Tier, Safety
Features
12.80 1.90 (0.40)
Elephant Insurance
Company
Elephant Insurance
Company
Voluntary
Liability
(1.70) 09-03-2020 11-03-2020 Base rate/loss cost/loss cost multiplier –
Revised base rates/loss costs/loss cost
multiplier resulting in excess of ±5%
change.
Base Rates 12.80 1.90 (0.40)
Elephant Insurance
Company
Elephant Insurance
Company
Voluntary
Liability
0.00 11-30-2020 01-30-2021 Other rating variables - Revised
relativities resulting in excess of ±5%
change for some policyholders.
Age x Education, Affinity
Discount, Capping, U02: Step 1
RN Placement, E-Signature
Discount
12.80 1.90 (0.40)
Elephant Insurance
Company
Elephant Insurance
Company
Voluntary
Liability
0.00 02-07-2020 04-07-2020 Other rating variables - Revised
relativities resulting in excess of ±5%
change for some policyholders.
Liability, Age x Gender x Marital
Status, Primary Prior Year & Non-
Primary Drivers Accidents
12.80 1.90 (0.40)
93
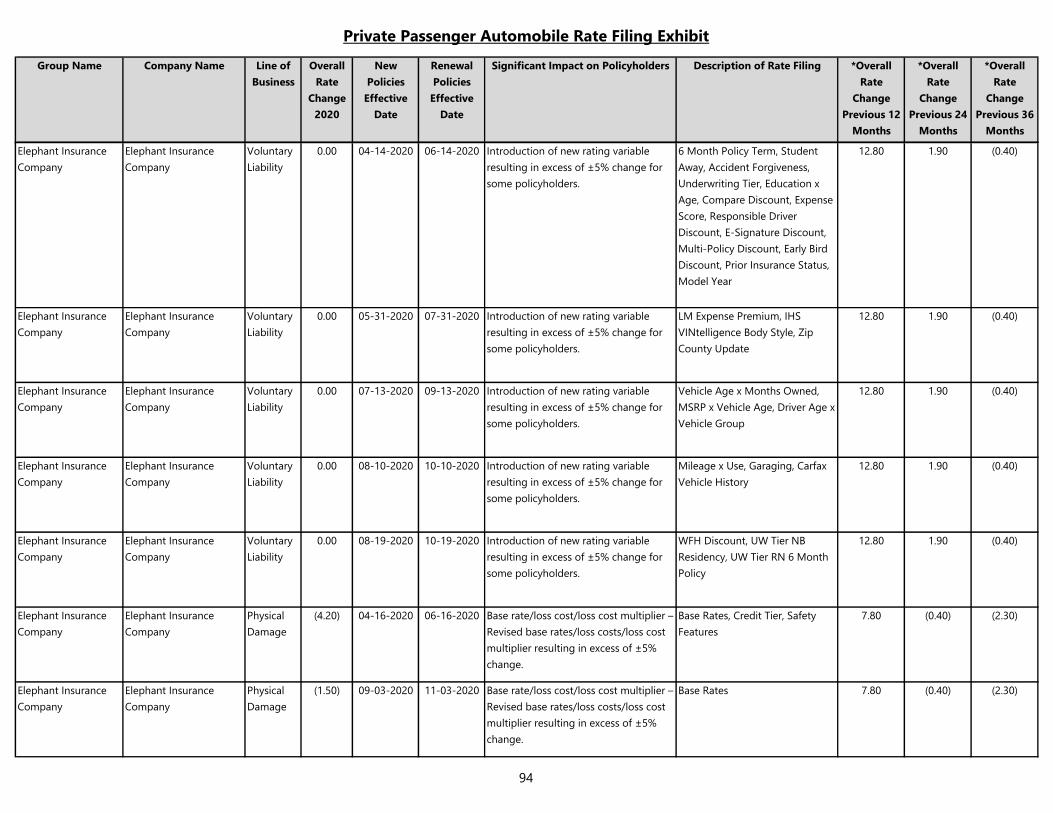
Private Passenger Automobile Rate Filing Exhibit
Group Name Company Name Line of
Business
Overall
Rate
Change
2020
New
Policies
Effective
Date
Renewal
Policies
Effective
Date
Significant Impact on Policyholders Description of Rate Filing *Overall
Rate
Change
Previous 12
Months
*Overall
Rate
Change
Previous 24
Months
*Overall
Rate
Change
Previous 36
Months
Elephant Insurance
Company
Elephant Insurance
Company
Voluntary
Liability
0.00 04-14-2020 06-14-2020 Introduction of new rating variable
resulting in excess of ±5% change for
some policyholders.
6 Month Policy Term, Student
Away, Accident Forgiveness,
Underwriting Tier, Education x
Age, Compare Discount, Expense
Score, Responsible Driver
Discount, E-Signature Discount,
Multi-Policy Discount, Early Bird
Discount, Prior Insurance Status,
Model Year
12.80 1.90 (0.40)
Elephant Insurance
Company
Elephant Insurance
Company
Voluntary
Liability
0.00 05-31-2020 07-31-2020 Introduction of new rating variable
resulting in excess of ±5% change for
some policyholders.
LM Expense Premium, IHS
VINtelligence Body Style, Zip
County Update
12.80 1.90 (0.40)
Elephant Insurance
Company
Elephant Insurance
Company
Voluntary
Liability
0.00 07-13-2020 09-13-2020 Introduction of new rating variable
resulting in excess of ±5% change for
some policyholders.
Vehicle Age x Months Owned,
MSRP x Vehicle Age, Driver Age x
Vehicle Group
12.80 1.90 (0.40)
Elephant Insurance
Company
Elephant Insurance
Company
Voluntary
Liability
0.00 08-10-2020 10-10-2020 Introduction of new rating variable
resulting in excess of ±5% change for
some policyholders.
Mileage x Use, Garaging, Carfax
Vehicle History
12.80 1.90 (0.40)
Elephant Insurance
Company
Elephant Insurance
Company
Voluntary
Liability
0.00 08-19-2020 10-19-2020 Introduction of new rating variable
resulting in excess of ±5% change for
some policyholders.
WFH Discount, UW Tier NB
Residency, UW Tier RN 6 Month
Policy
12.80 1.90 (0.40)
Elephant Insurance
Company
Elephant Insurance
Company
Physical
Damage
(4.20) 04-16-2020 06-16-2020 Base rate/loss cost/loss cost multiplier –
Revised base rates/loss costs/loss cost
multiplier resulting in excess of ±5%
change.
Base Rates, Credit Tier, Safety
Features
7.80 (0.40) (2.30)
Elephant Insurance
Company
Elephant Insurance
Company
Physical
Damage
(1.50) 09-03-2020 11-03-2020 Base rate/loss cost/loss cost multiplier –
Revised base rates/loss costs/loss cost
multiplier resulting in excess of ±5%
change.
Base Rates 7.80 (0.40) (2.30)
94
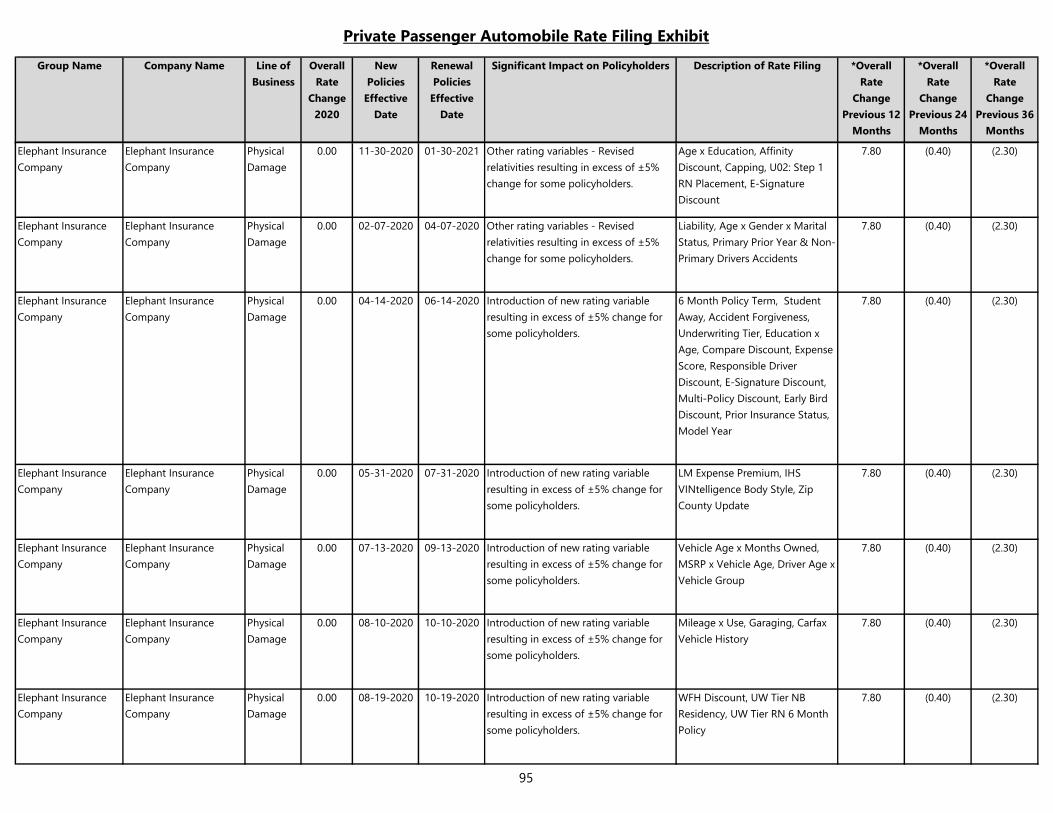
Private Passenger Automobile Rate Filing Exhibit
Group Name Company Name Line of
Business
Overall
Rate
Change
2020
New
Policies
Effective
Date
Renewal
Policies
Effective
Date
Significant Impact on Policyholders Description of Rate Filing *Overall
Rate
Change
Previous 12
Months
*Overall
Rate
Change
Previous 24
Months
*Overall
Rate
Change
Previous 36
Months
Elephant Insurance
Company
Elephant Insurance
Company
Physical
Damage
0.00 11-30-2020 01-30-2021 Other rating variables - Revised
relativities resulting in excess of ±5%
change for some policyholders.
Age x Education, Affinity
Discount, Capping, U02: Step 1
RN Placement, E-Signature
Discount
7.80 (0.40) (2.30)
Elephant Insurance
Company
Elephant Insurance
Company
Physical
Damage
0.00 02-07-2020 04-07-2020 Other rating variables - Revised
relativities resulting in excess of ±5%
change for some policyholders.
Liability, Age x Gender x Marital
Status, Primary Prior Year & Non-
Primary Drivers Accidents
7.80 (0.40) (2.30)
Elephant Insurance
Company
Elephant Insurance
Company
Physical
Damage
0.00 04-14-2020 06-14-2020 Introduction of new rating variable
resulting in excess of ±5% change for
some policyholders.
6 Month Policy Term, Student
Away, Accident Forgiveness,
Underwriting Tier, Education x
Age, Compare Discount, Expense
Score, Responsible Driver
Discount, E-Signature Discount,
Multi-Policy Discount, Early Bird
Discount, Prior Insurance Status,
Model Year
7.80 (0.40) (2.30)
Elephant Insurance
Company
Elephant Insurance
Company
Physical
Damage
0.00 05-31-2020 07-31-2020 Introduction of new rating variable
resulting in excess of ±5% change for
some policyholders.
LM Expense Premium, IHS
VINtelligence Body Style, Zip
County Update
7.80 (0.40) (2.30)
Elephant Insurance
Company
Elephant Insurance
Company
Physical
Damage
0.00 07-13-2020 09-13-2020 Introduction of new rating variable
resulting in excess of ±5% change for
some policyholders.
Vehicle Age x Months Owned,
MSRP x Vehicle Age, Driver Age x
Vehicle Group
7.80 (0.40) (2.30)
Elephant Insurance
Company
Elephant Insurance
Company
Physical
Damage
0.00 08-10-2020 10-10-2020 Introduction of new rating variable
resulting in excess of ±5% change for
some policyholders.
Mileage x Use, Garaging, Carfax
Vehicle History
7.80 (0.40) (2.30)
Elephant Insurance
Company
Elephant Insurance
Company
Physical
Damage
0.00 08-19-2020 10-19-2020 Introduction of new rating variable
resulting in excess of ±5% change for
some policyholders.
WFH Discount, UW Tier NB
Residency, UW Tier RN 6 Month
Policy
7.80 (0.40) (2.30)
95
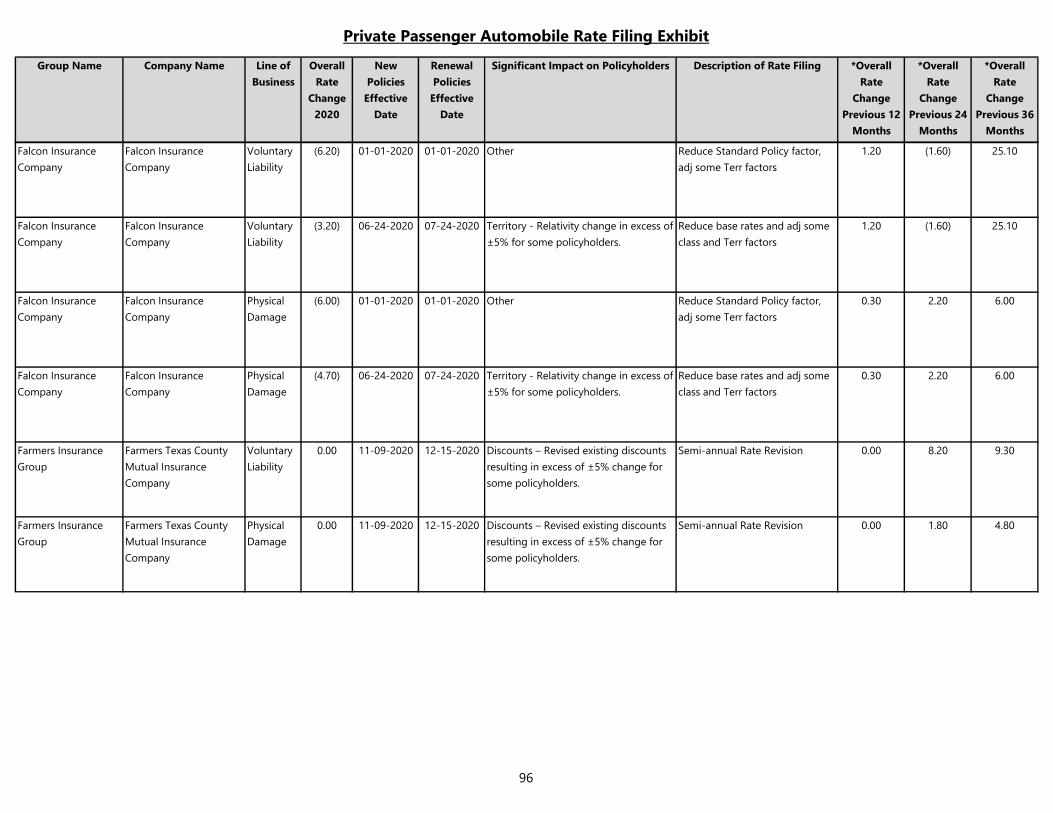
Private Passenger Automobile Rate Filing Exhibit
Group Name Company Name Line of
Business
Overall
Rate
Change
2020
New
Policies
Effective
Date
Renewal
Policies
Effective
Date
Significant Impact on Policyholders Description of Rate Filing *Overall
Rate
Change
Previous 12
Months
*Overall
Rate
Change
Previous 24
Months
*Overall
Rate
Change
Previous 36
Months
Falcon Insurance
Company
Falcon Insurance
Company
Voluntary
Liability
(6.20) 01-01-2020 01-01-2020 Other Reduce Standard Policy factor,
adj some Terr factors
1.20 (1.60) 25.10
Falcon Insurance
Company
Falcon Insurance
Company
Voluntary
Liability
(3.20) 06-24-2020 07-24-2020 Territory - Relativity change in excess of
±5% for some policyholders.
Reduce base rates and adj some
class and Terr factors
1.20 (1.60) 25.10
Falcon Insurance
Company
Falcon Insurance
Company
Physical
Damage
(6.00) 01-01-2020 01-01-2020 Other Reduce Standard Policy factor,
adj some Terr factors
0.30 2.20 6.00
Falcon Insurance
Company
Falcon Insurance
Company
Physical
Damage
(4.70) 06-24-2020 07-24-2020 Territory - Relativity change in excess of
±5% for some policyholders.
Reduce base rates and adj some
class and Terr factors
0.30 2.20 6.00
Farmers Insurance
Group
Farmers Texas County
Mutual Insurance
Company
Voluntary
Liability
0.00 11-09-2020 12-15-2020 Discounts – Revised existing discounts
resulting in excess of ±5% change for
some policyholders.
Semi-annual Rate Revision 0.00 8.20 9.30
Farmers Insurance
Group
Farmers Texas County
Mutual Insurance
Company
Physical
Damage
0.00 11-09-2020 12-15-2020 Discounts – Revised existing discounts
resulting in excess of ±5% change for
some policyholders.
Semi-annual Rate Revision 0.00 1.80 4.80
96
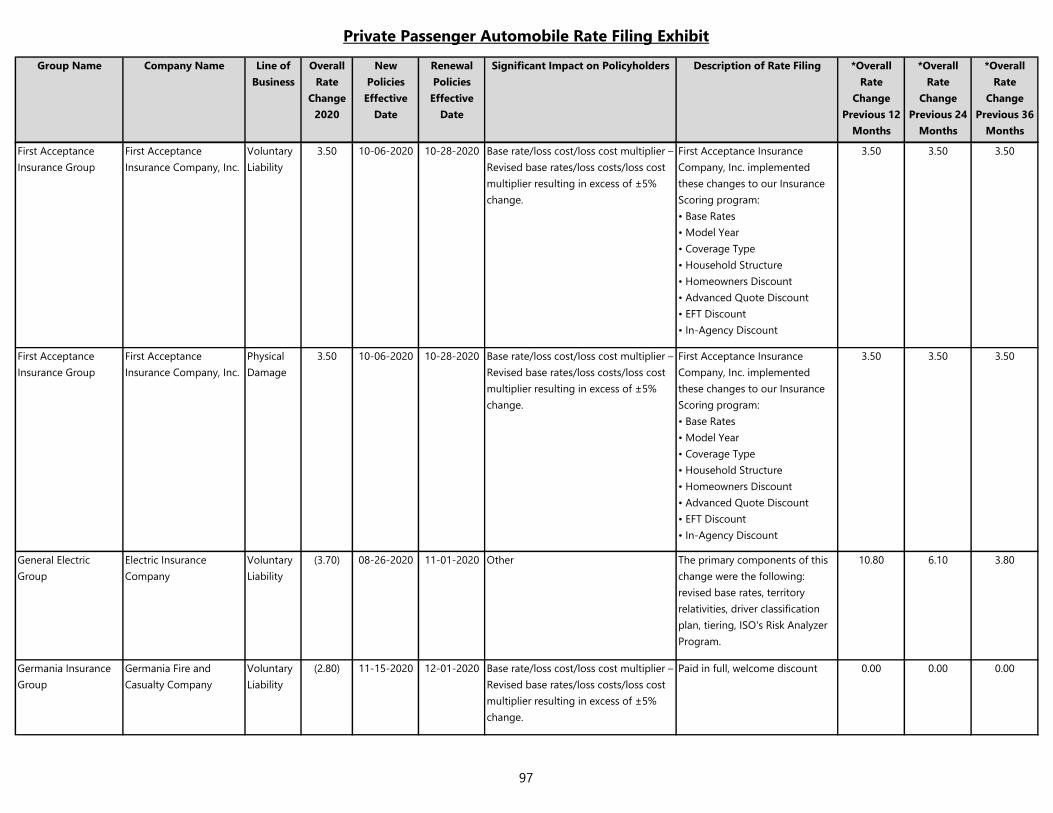
Private Passenger Automobile Rate Filing Exhibit
Group Name Company Name Line of
Business
Overall
Rate
Change
2020
New
Policies
Effective
Date
Renewal
Policies
Effective
Date
Significant Impact on Policyholders Description of Rate Filing *Overall
Rate
Change
Previous 12
Months
*Overall
Rate
Change
Previous 24
Months
*Overall
Rate
Change
Previous 36
Months
First Acceptance
Insurance Group
First Acceptance
Insurance Company, Inc.
Voluntary
Liability
3.50 10-06-2020 10-28-2020 Base rate/loss cost/loss cost multiplier –
Revised base rates/loss costs/loss cost
multiplier resulting in excess of ±5%
change.
First Acceptance Insurance
Company, Inc. implemented
these changes to our Insurance
Scoring program:
• Base Rates
• Model Year
• Coverage Type
• Household Structure
• Homeowners Discount
• Advanced Quote Discount
• EFT Discount
• In-Agency Discount
3.50 3.50 3.50
First Acceptance
Insurance Group
First Acceptance
Insurance Company, Inc.
Physical
Damage
3.50 10-06-2020 10-28-2020 Base rate/loss cost/loss cost multiplier –
Revised base rates/loss costs/loss cost
multiplier resulting in excess of ±5%
change.
First Acceptance Insurance
Company, Inc. implemented
these changes to our Insurance
Scoring program:
• Base Rates
• Model Year
• Coverage Type
• Household Structure
• Homeowners Discount
• Advanced Quote Discount
• EFT Discount
• In-Agency Discount
3.50 3.50 3.50
General Electric
Group
Electric Insurance
Company
Voluntary
Liability
(3.70) 08-26-2020 11-01-2020 Other The primary components of this
change were the following:
revised base rates, territory
relativities, driver classification
plan, tiering, ISO's Risk Analyzer
Program.
10.80 6.10 3.80
Germania Insurance
Group
Germania Fire and
Casualty Company
Voluntary
Liability
(2.80) 11-15-2020 12-01-2020 Base rate/loss cost/loss cost multiplier –
Revised base rates/loss costs/loss cost
multiplier resulting in excess of ±5%
change.
Paid in full, welcome discount 0.00 0.00 0.00
97
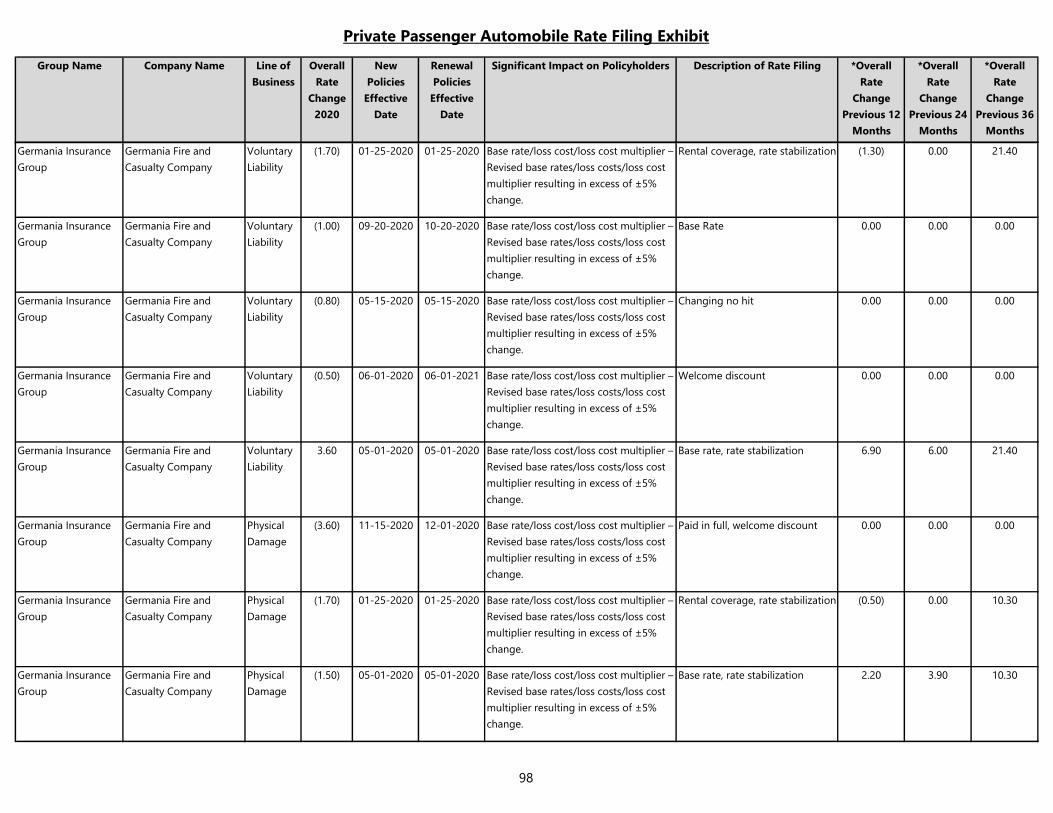
Private Passenger Automobile Rate Filing Exhibit
Group Name Company Name Line of
Business
Overall
Rate
Change
2020
New
Policies
Effective
Date
Renewal
Policies
Effective
Date
Significant Impact on Policyholders Description of Rate Filing *Overall
Rate
Change
Previous 12
Months
*Overall
Rate
Change
Previous 24
Months
*Overall
Rate
Change
Previous 36
Months
Germania Insurance
Group
Germania Fire and
Casualty Company
Voluntary
Liability
(1.70) 01-25-2020 01-25-2020 Base rate/loss cost/loss cost multiplier –
Revised base rates/loss costs/loss cost
multiplier resulting in excess of ±5%
change.
Rental coverage, rate stabilization (1.30) 0.00 21.40
Germania Insurance
Group
Germania Fire and
Casualty Company
Voluntary
Liability
(1.00) 09-20-2020 10-20-2020 Base rate/loss cost/loss cost multiplier –
Revised base rates/loss costs/loss cost
multiplier resulting in excess of ±5%
change.
Base Rate 0.00 0.00 0.00
Germania Insurance
Group
Germania Fire and
Casualty Company
Voluntary
Liability
(0.80) 05-15-2020 05-15-2020 Base rate/loss cost/loss cost multiplier –
Revised base rates/loss costs/loss cost
multiplier resulting in excess of ±5%
change.
Changing no hit 0.00 0.00 0.00
Germania Insurance
Group
Germania Fire and
Casualty Company
Voluntary
Liability
(0.50) 06-01-2020 06-01-2021 Base rate/loss cost/loss cost multiplier –
Revised base rates/loss costs/loss cost
multiplier resulting in excess of ±5%
change.
Welcome discount 0.00 0.00 0.00
Germania Insurance
Group
Germania Fire and
Casualty Company
Voluntary
Liability
3.60 05-01-2020 05-01-2020 Base rate/loss cost/loss cost multiplier –
Revised base rates/loss costs/loss cost
multiplier resulting in excess of ±5%
change.
Base rate, rate stabilization 6.90 6.00 21.40
Germania Insurance
Group
Germania Fire and
Casualty Company
Physical
Damage
(3.60) 11-15-2020 12-01-2020 Base rate/loss cost/loss cost multiplier –
Revised base rates/loss costs/loss cost
multiplier resulting in excess of ±5%
change.
Paid in full, welcome discount 0.00 0.00 0.00
Germania Insurance
Group
Germania Fire and
Casualty Company
Physical
Damage
(1.70) 01-25-2020 01-25-2020 Base rate/loss cost/loss cost multiplier –
Revised base rates/loss costs/loss cost
multiplier resulting in excess of ±5%
change.
Rental coverage, rate stabilization (0.50) 0.00 10.30
Germania Insurance
Group
Germania Fire and
Casualty Company
Physical
Damage
(1.50) 05-01-2020 05-01-2020 Base rate/loss cost/loss cost multiplier –
Revised base rates/loss costs/loss cost
multiplier resulting in excess of ±5%
change.
Base rate, rate stabilization 2.20 3.90 10.30
98
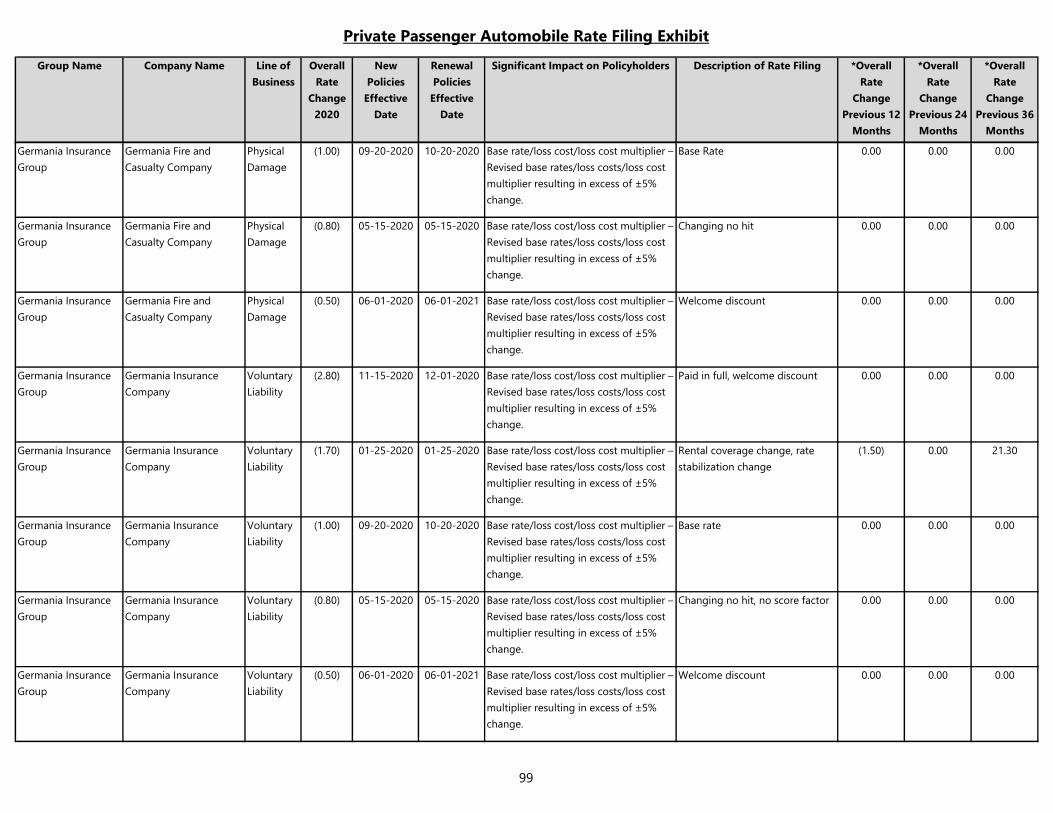
Private Passenger Automobile Rate Filing Exhibit
Group Name Company Name Line of
Business
Overall
Rate
Change
2020
New
Policies
Effective
Date
Renewal
Policies
Effective
Date
Significant Impact on Policyholders Description of Rate Filing *Overall
Rate
Change
Previous 12
Months
*Overall
Rate
Change
Previous 24
Months
*Overall
Rate
Change
Previous 36
Months
Germania Insurance
Group
Germania Fire and
Casualty Company
Physical
Damage
(1.00) 09-20-2020 10-20-2020 Base rate/loss cost/loss cost multiplier –
Revised base rates/loss costs/loss cost
multiplier resulting in excess of ±5%
change.
Base Rate 0.00 0.00 0.00
Germania Insurance
Group
Germania Fire and
Casualty Company
Physical
Damage
(0.80) 05-15-2020 05-15-2020 Base rate/loss cost/loss cost multiplier –
Revised base rates/loss costs/loss cost
multiplier resulting in excess of ±5%
change.
Changing no hit 0.00 0.00 0.00
Germania Insurance
Group
Germania Fire and
Casualty Company
Physical
Damage
(0.50) 06-01-2020 06-01-2021 Base rate/loss cost/loss cost multiplier –
Revised base rates/loss costs/loss cost
multiplier resulting in excess of ±5%
change.
Welcome discount 0.00 0.00 0.00
Germania Insurance
Group
Germania Insurance
Company
Voluntary
Liability
(2.80) 11-15-2020 12-01-2020 Base rate/loss cost/loss cost multiplier –
Revised base rates/loss costs/loss cost
multiplier resulting in excess of ±5%
change.
Paid in full, welcome discount 0.00 0.00 0.00
Germania Insurance
Group
Germania Insurance
Company
Voluntary
Liability
(1.70) 01-25-2020 01-25-2020 Base rate/loss cost/loss cost multiplier –
Revised base rates/loss costs/loss cost
multiplier resulting in excess of ±5%
change.
Rental coverage change, rate
stabilization change
(1.50) 0.00 21.30
Germania Insurance
Group
Germania Insurance
Company
Voluntary
Liability
(1.00) 09-20-2020 10-20-2020 Base rate/loss cost/loss cost multiplier –
Revised base rates/loss costs/loss cost
multiplier resulting in excess of ±5%
change.
Base rate 0.00 0.00 0.00
Germania Insurance
Group
Germania Insurance
Company
Voluntary
Liability
(0.80) 05-15-2020 05-15-2020 Base rate/loss cost/loss cost multiplier –
Revised base rates/loss costs/loss cost
multiplier resulting in excess of ±5%
change.
Changing no hit, no score factor 0.00 0.00 0.00
Germania Insurance
Group
Germania Insurance
Company
Voluntary
Liability
(0.50) 06-01-2020 06-01-2021 Base rate/loss cost/loss cost multiplier –
Revised base rates/loss costs/loss cost
multiplier resulting in excess of ±5%
change.
Welcome discount 0.00 0.00 0.00
99
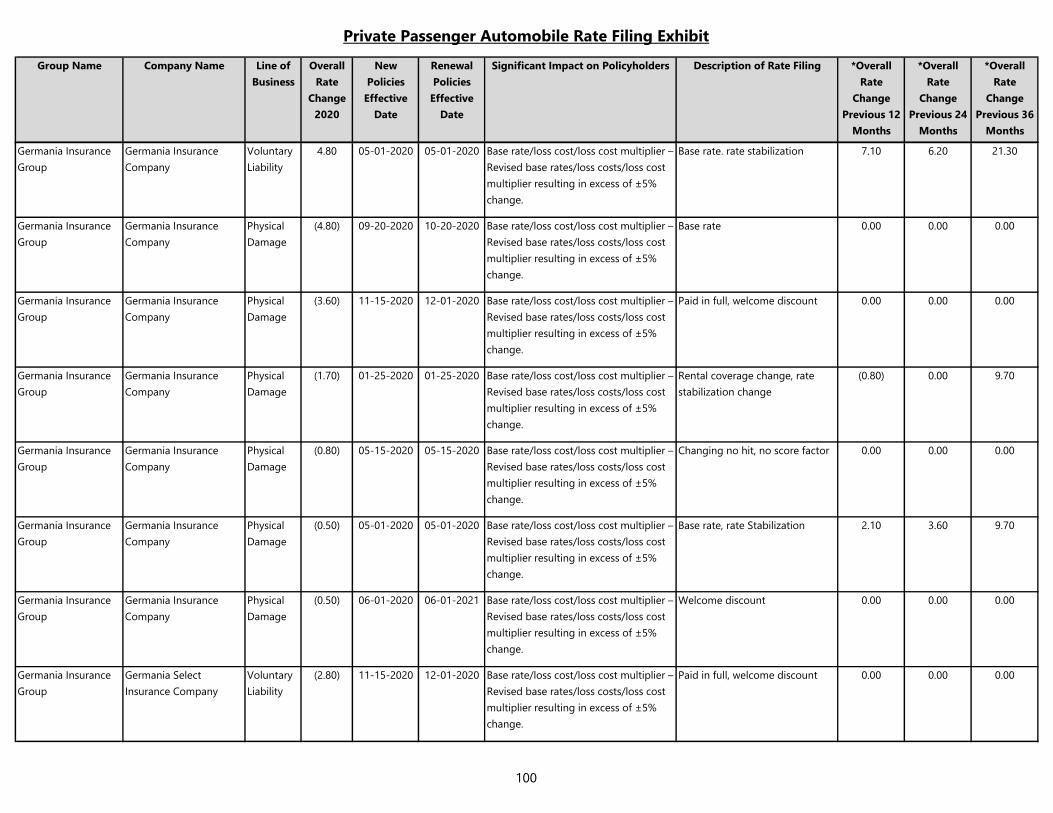
Private Passenger Automobile Rate Filing Exhibit
Group Name Company Name Line of
Business
Overall
Rate
Change
2020
New
Policies
Effective
Date
Renewal
Policies
Effective
Date
Significant Impact on Policyholders Description of Rate Filing *Overall
Rate
Change
Previous 12
Months
*Overall
Rate
Change
Previous 24
Months
*Overall
Rate
Change
Previous 36
Months
Germania Insurance
Group
Germania Insurance
Company
Voluntary
Liability
4.80 05-01-2020 05-01-2020 Base rate/loss cost/loss cost multiplier –
Revised base rates/loss costs/loss cost
multiplier resulting in excess of ±5%
change.
Base rate. rate stabilization 7.10 6.20 21.30
Germania Insurance
Group
Germania Insurance
Company
Physical
Damage
(4.80) 09-20-2020 10-20-2020 Base rate/loss cost/loss cost multiplier –
Revised base rates/loss costs/loss cost
multiplier resulting in excess of ±5%
change.
Base rate 0.00 0.00 0.00
Germania Insurance
Group
Germania Insurance
Company
Physical
Damage
(3.60) 11-15-2020 12-01-2020 Base rate/loss cost/loss cost multiplier –
Revised base rates/loss costs/loss cost
multiplier resulting in excess of ±5%
change.
Paid in full, welcome discount 0.00 0.00 0.00
Germania Insurance
Group
Germania Insurance
Company
Physical
Damage
(1.70) 01-25-2020 01-25-2020 Base rate/loss cost/loss cost multiplier –
Revised base rates/loss costs/loss cost
multiplier resulting in excess of ±5%
change.
Rental coverage change, rate
stabilization change
(0.80) 0.00 9.70
Germania Insurance
Group
Germania Insurance
Company
Physical
Damage
(0.80) 05-15-2020 05-15-2020 Base rate/loss cost/loss cost multiplier –
Revised base rates/loss costs/loss cost
multiplier resulting in excess of ±5%
change.
Changing no hit, no score factor 0.00 0.00 0.00
Germania Insurance
Group
Germania Insurance
Company
Physical
Damage
(0.50) 05-01-2020 05-01-2020 Base rate/loss cost/loss cost multiplier –
Revised base rates/loss costs/loss cost
multiplier resulting in excess of ±5%
change.
Base rate, rate Stabilization 2.10 3.60 9.70
Germania Insurance
Group
Germania Insurance
Company
Physical
Damage
(0.50) 06-01-2020 06-01-2021 Base rate/loss cost/loss cost multiplier –
Revised base rates/loss costs/loss cost
multiplier resulting in excess of ±5%
change.
Welcome discount 0.00 0.00 0.00
Germania Insurance
Group
Germania Select
Insurance Company
Voluntary
Liability
(2.80) 11-15-2020 12-01-2020 Base rate/loss cost/loss cost multiplier –
Revised base rates/loss costs/loss cost
multiplier resulting in excess of ±5%
change.
Paid in full, welcome discount 0.00 0.00 0.00
100
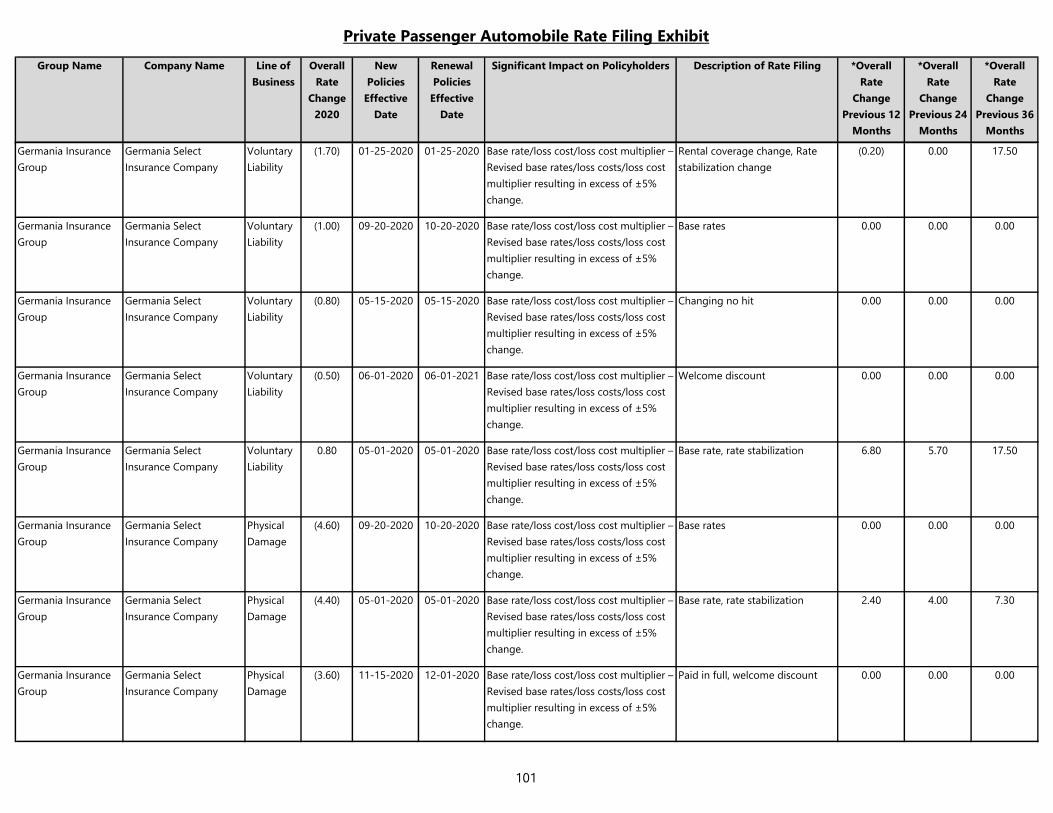
Private Passenger Automobile Rate Filing Exhibit
Group Name Company Name Line of
Business
Overall
Rate
Change
2020
New
Policies
Effective
Date
Renewal
Policies
Effective
Date
Significant Impact on Policyholders Description of Rate Filing *Overall
Rate
Change
Previous 12
Months
*Overall
Rate
Change
Previous 24
Months
*Overall
Rate
Change
Previous 36
Months
Germania Insurance
Group
Germania Select
Insurance Company
Voluntary
Liability
(1.70) 01-25-2020 01-25-2020 Base rate/loss cost/loss cost multiplier –
Revised base rates/loss costs/loss cost
multiplier resulting in excess of ±5%
change.
Rental coverage change, Rate
stabilization change
(0.20) 0.00 17.50
Germania Insurance
Group
Germania Select
Insurance Company
Voluntary
Liability
(1.00) 09-20-2020 10-20-2020 Base rate/loss cost/loss cost multiplier –
Revised base rates/loss costs/loss cost
multiplier resulting in excess of ±5%
change.
Base rates 0.00 0.00 0.00
Germania Insurance
Group
Germania Select
Insurance Company
Voluntary
Liability
(0.80) 05-15-2020 05-15-2020 Base rate/loss cost/loss cost multiplier –
Revised base rates/loss costs/loss cost
multiplier resulting in excess of ±5%
change.
Changing no hit 0.00 0.00 0.00
Germania Insurance
Group
Germania Select
Insurance Company
Voluntary
Liability
(0.50) 06-01-2020 06-01-2021 Base rate/loss cost/loss cost multiplier –
Revised base rates/loss costs/loss cost
multiplier resulting in excess of ±5%
change.
Welcome discount 0.00 0.00 0.00
Germania Insurance
Group
Germania Select
Insurance Company
Voluntary
Liability
0.80 05-01-2020 05-01-2020 Base rate/loss cost/loss cost multiplier –
Revised base rates/loss costs/loss cost
multiplier resulting in excess of ±5%
change.
Base rate, rate stabilization 6.80 5.70 17.50
Germania Insurance
Group
Germania Select
Insurance Company
Physical
Damage
(4.60) 09-20-2020 10-20-2020 Base rate/loss cost/loss cost multiplier –
Revised base rates/loss costs/loss cost
multiplier resulting in excess of ±5%
change.
Base rates 0.00 0.00 0.00
Germania Insurance
Group
Germania Select
Insurance Company
Physical
Damage
(4.40) 05-01-2020 05-01-2020 Base rate/loss cost/loss cost multiplier –
Revised base rates/loss costs/loss cost
multiplier resulting in excess of ±5%
change.
Base rate, rate stabilization 2.40 4.00 7.30
Germania Insurance
Group
Germania Select
Insurance Company
Physical
Damage
(3.60) 11-15-2020 12-01-2020 Base rate/loss cost/loss cost multiplier –
Revised base rates/loss costs/loss cost
multiplier resulting in excess of ±5%
change.
Paid in full, welcome discount 0.00 0.00 0.00
101
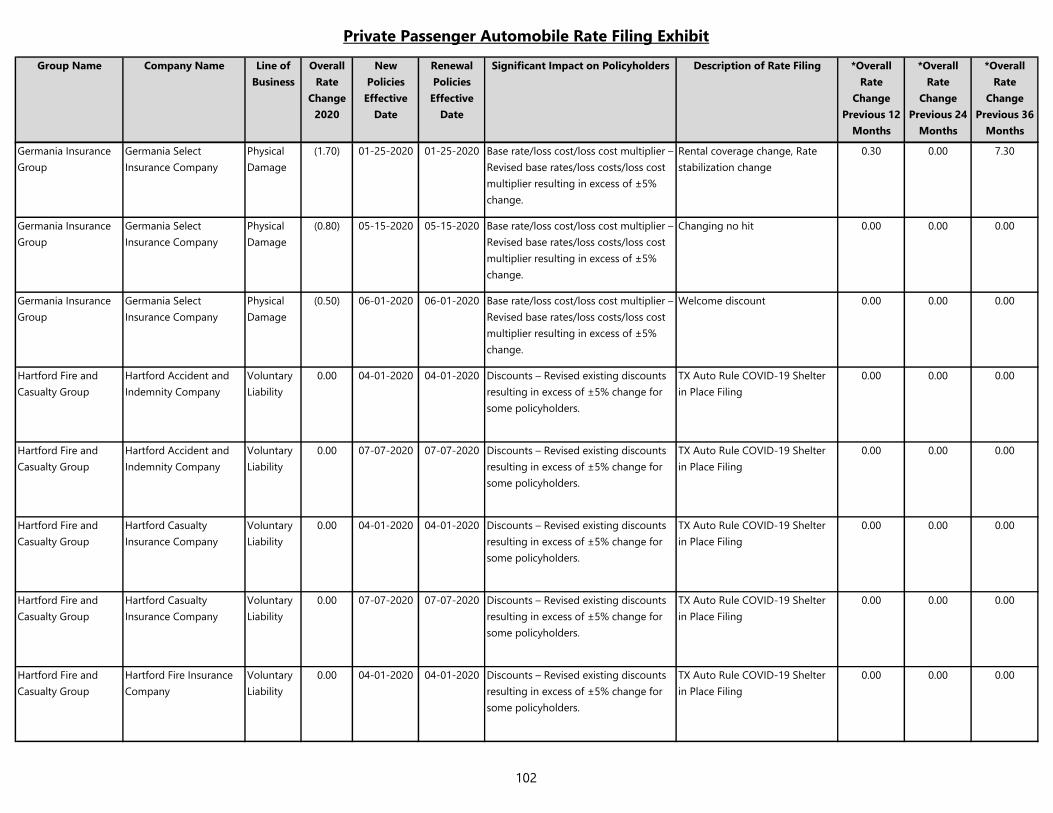
Private Passenger Automobile Rate Filing Exhibit
Group Name Company Name Line of
Business
Overall
Rate
Change
2020
New
Policies
Effective
Date
Renewal
Policies
Effective
Date
Significant Impact on Policyholders Description of Rate Filing *Overall
Rate
Change
Previous 12
Months
*Overall
Rate
Change
Previous 24
Months
*Overall
Rate
Change
Previous 36
Months
Germania Insurance
Group
Germania Select
Insurance Company
Physical
Damage
(1.70) 01-25-2020 01-25-2020 Base rate/loss cost/loss cost multiplier –
Revised base rates/loss costs/loss cost
multiplier resulting in excess of ±5%
change.
Rental coverage change, Rate
stabilization change
0.30 0.00 7.30
Germania Insurance
Group
Germania Select
Insurance Company
Physical
Damage
(0.80) 05-15-2020 05-15-2020 Base rate/loss cost/loss cost multiplier –
Revised base rates/loss costs/loss cost
multiplier resulting in excess of ±5%
change.
Changing no hit 0.00 0.00 0.00
Germania Insurance
Group
Germania Select
Insurance Company
Physical
Damage
(0.50) 06-01-2020 06-01-2020 Base rate/loss cost/loss cost multiplier –
Revised base rates/loss costs/loss cost
multiplier resulting in excess of ±5%
change.
Welcome discount 0.00 0.00 0.00
Hartford Fire and
Casualty Group
Hartford Accident and
Indemnity Company
Voluntary
Liability
0.00 04-01-2020 04-01-2020 Discounts – Revised existing discounts
resulting in excess of ±5% change for
some policyholders.
TX Auto Rule COVID-19 Shelter
in Place Filing
0.00 0.00 0.00
Hartford Fire and
Casualty Group
Hartford Accident and
Indemnity Company
Voluntary
Liability
0.00 07-07-2020 07-07-2020 Discounts – Revised existing discounts
resulting in excess of ±5% change for
some policyholders.
TX Auto Rule COVID-19 Shelter
in Place Filing
0.00 0.00 0.00
Hartford Fire and
Casualty Group
Hartford Casualty
Insurance Company
Voluntary
Liability
0.00 04-01-2020 04-01-2020 Discounts – Revised existing discounts
resulting in excess of ±5% change for
some policyholders.
TX Auto Rule COVID-19 Shelter
in Place Filing
0.00 0.00 0.00
Hartford Fire and
Casualty Group
Hartford Casualty
Insurance Company
Voluntary
Liability
0.00 07-07-2020 07-07-2020 Discounts – Revised existing discounts
resulting in excess of ±5% change for
some policyholders.
TX Auto Rule COVID-19 Shelter
in Place Filing
0.00 0.00 0.00
Hartford Fire and
Casualty Group
Hartford Fire Insurance
Company
Voluntary
Liability
0.00 04-01-2020 04-01-2020 Discounts – Revised existing discounts
resulting in excess of ±5% change for
some policyholders.
TX Auto Rule COVID-19 Shelter
in Place Filing
0.00 0.00 0.00
102
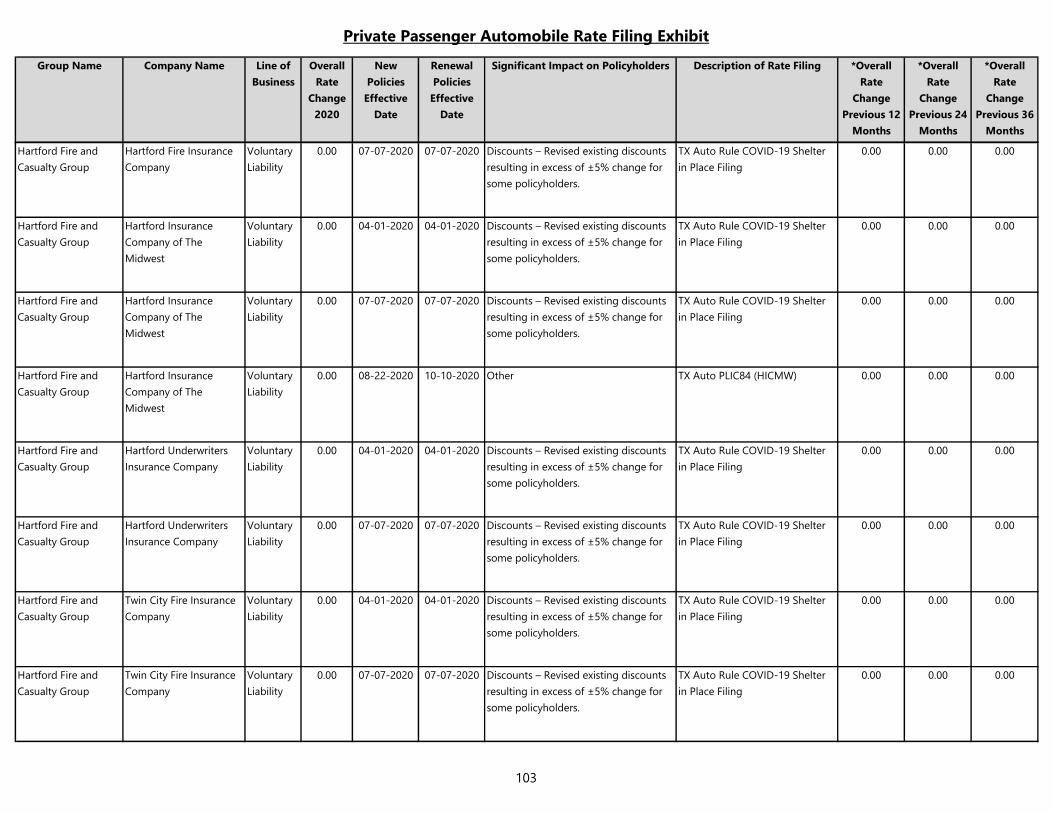
Private Passenger Automobile Rate Filing Exhibit
Group Name Company Name Line of
Business
Overall
Rate
Change
2020
New
Policies
Effective
Date
Renewal
Policies
Effective
Date
Significant Impact on Policyholders Description of Rate Filing *Overall
Rate
Change
Previous 12
Months
*Overall
Rate
Change
Previous 24
Months
*Overall
Rate
Change
Previous 36
Months
Hartford Fire and
Casualty Group
Hartford Fire Insurance
Company
Voluntary
Liability
0.00 07-07-2020 07-07-2020 Discounts – Revised existing discounts
resulting in excess of ±5% change for
some policyholders.
TX Auto Rule COVID-19 Shelter
in Place Filing
0.00 0.00 0.00
Hartford Fire and
Casualty Group
Hartford Insurance
Company of The
Midwest
Voluntary
Liability
0.00 04-01-2020 04-01-2020 Discounts – Revised existing discounts
resulting in excess of ±5% change for
some policyholders.
TX Auto Rule COVID-19 Shelter
in Place Filing
0.00 0.00 0.00
Hartford Fire and
Casualty Group
Hartford Insurance
Company of The
Midwest
Voluntary
Liability
0.00 07-07-2020 07-07-2020 Discounts – Revised existing discounts
resulting in excess of ±5% change for
some policyholders.
TX Auto Rule COVID-19 Shelter
in Place Filing
0.00 0.00 0.00
Hartford Fire and
Casualty Group
Hartford Insurance
Company of The
Midwest
Voluntary
Liability
0.00 08-22-2020 10-10-2020 Other TX Auto PLIC84 (HICMW) 0.00 0.00 0.00
Hartford Fire and
Casualty Group
Hartford Underwriters
Insurance Company
Voluntary
Liability
0.00 04-01-2020 04-01-2020 Discounts – Revised existing discounts
resulting in excess of ±5% change for
some policyholders.
TX Auto Rule COVID-19 Shelter
in Place Filing
0.00 0.00 0.00
Hartford Fire and
Casualty Group
Hartford Underwriters
Insurance Company
Voluntary
Liability
0.00 07-07-2020 07-07-2020 Discounts – Revised existing discounts
resulting in excess of ±5% change for
some policyholders.
TX Auto Rule COVID-19 Shelter
in Place Filing
0.00 0.00 0.00
Hartford Fire and
Casualty Group
Twin City Fire Insurance
Company
Voluntary
Liability
0.00 04-01-2020 04-01-2020 Discounts – Revised existing discounts
resulting in excess of ±5% change for
some policyholders.
TX Auto Rule COVID-19 Shelter
in Place Filing
0.00 0.00 0.00
Hartford Fire and
Casualty Group
Twin City Fire Insurance
Company
Voluntary
Liability
0.00 07-07-2020 07-07-2020 Discounts – Revised existing discounts
resulting in excess of ±5% change for
some policyholders.
TX Auto Rule COVID-19 Shelter
in Place Filing
0.00 0.00 0.00
103
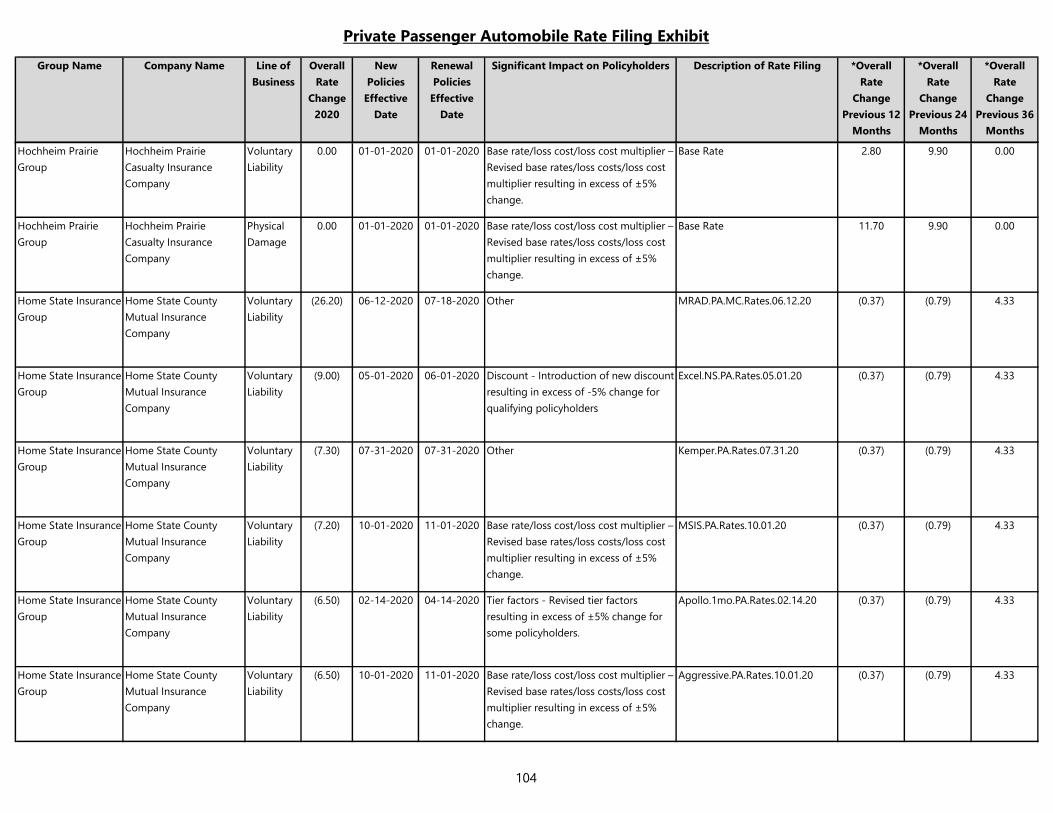
Private Passenger Automobile Rate Filing Exhibit
Group Name Company Name Line of
Business
Overall
Rate
Change
2020
New
Policies
Effective
Date
Renewal
Policies
Effective
Date
Significant Impact on Policyholders Description of Rate Filing *Overall
Rate
Change
Previous 12
Months
*Overall
Rate
Change
Previous 24
Months
*Overall
Rate
Change
Previous 36
Months
Hochheim Prairie
Group
Hochheim Prairie
Casualty Insurance
Company
Voluntary
Liability
0.00 01-01-2020 01-01-2020 Base rate/loss cost/loss cost multiplier –
Revised base rates/loss costs/loss cost
multiplier resulting in excess of ±5%
change.
Base Rate 2.80 9.90 0.00
Hochheim Prairie
Group
Hochheim Prairie
Casualty Insurance
Company
Physical
Damage
0.00 01-01-2020 01-01-2020 Base rate/loss cost/loss cost multiplier –
Revised base rates/loss costs/loss cost
multiplier resulting in excess of ±5%
change.
Base Rate 11.70 9.90 0.00
Home State Insurance
Group
Home State County
Mutual Insurance
Company
Voluntary
Liability
(26.20) 06-12-2020 07-18-2020 Other MRAD.PA.MC.Rates.06.12.20 (0.37) (0.79) 4.33
Home State Insurance
Group
Home State County
Mutual Insurance
Company
Voluntary
Liability
(9.00) 05-01-2020 06-01-2020 Discount - Introduction of new discount
resulting in excess of -5% change for
qualifying policyholders
Excel.NS.PA.Rates.05.01.20 (0.37) (0.79) 4.33
Home State Insurance
Group
Home State County
Mutual Insurance
Company
Voluntary
Liability
(7.30) 07-31-2020 07-31-2020 Other Kemper.PA.Rates.07.31.20 (0.37) (0.79) 4.33
Home State Insurance
Group
Home State County
Mutual Insurance
Company
Voluntary
Liability
(7.20) 10-01-2020 11-01-2020 Base rate/loss cost/loss cost multiplier –
Revised base rates/loss costs/loss cost
multiplier resulting in excess of ±5%
change.
MSIS.PA.Rates.10.01.20 (0.37) (0.79) 4.33
Home State Insurance
Group
Home State County
Mutual Insurance
Company
Voluntary
Liability
(6.50) 02-14-2020 04-14-2020 Tier factors - Revised tier factors
resulting in excess of ±5% change for
some policyholders.
Apollo.1mo.PA.Rates.02.14.20 (0.37) (0.79) 4.33
Home State Insurance
Group
Home State County
Mutual Insurance
Company
Voluntary
Liability
(6.50) 10-01-2020 11-01-2020 Base rate/loss cost/loss cost multiplier –
Revised base rates/loss costs/loss cost
multiplier resulting in excess of ±5%
change.
Aggressive.PA.Rates.10.01.20 (0.37) (0.79) 4.33
104
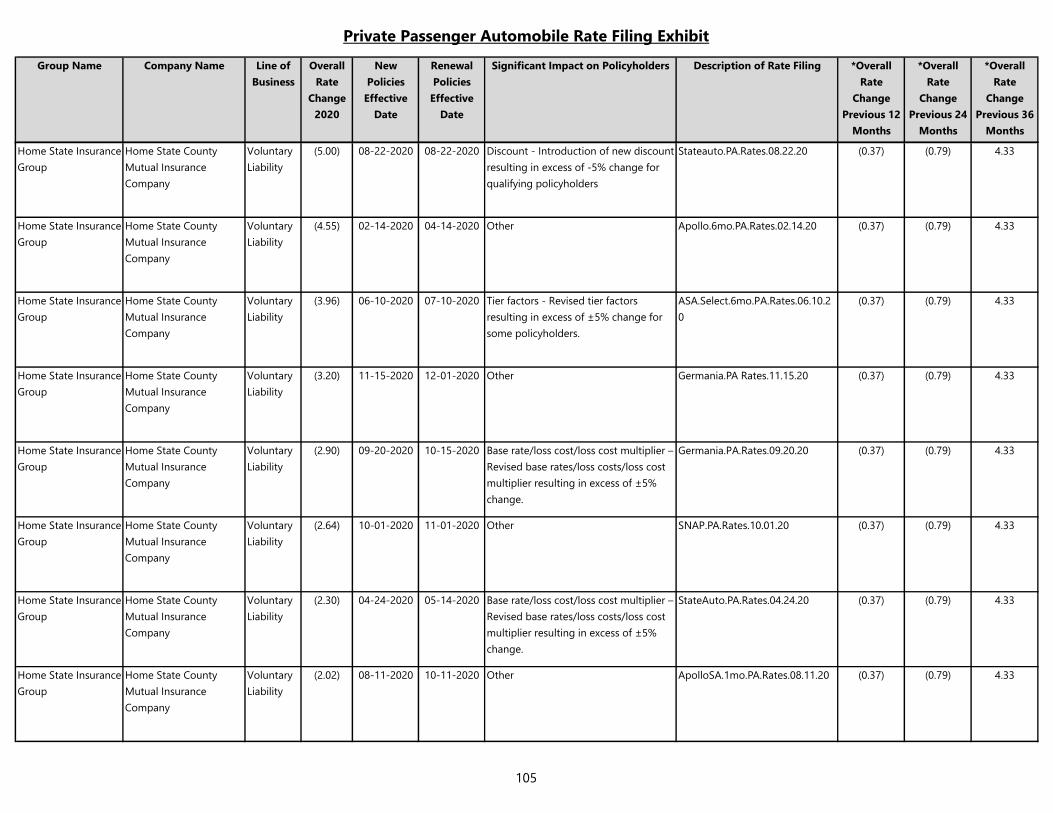
Private Passenger Automobile Rate Filing Exhibit
Group Name Company Name Line of
Business
Overall
Rate
Change
2020
New
Policies
Effective
Date
Renewal
Policies
Effective
Date
Significant Impact on Policyholders Description of Rate Filing *Overall
Rate
Change
Previous 12
Months
*Overall
Rate
Change
Previous 24
Months
*Overall
Rate
Change
Previous 36
Months
Home State Insurance
Group
Home State County
Mutual Insurance
Company
Voluntary
Liability
(5.00) 08-22-2020 08-22-2020 Discount - Introduction of new discount
resulting in excess of -5% change for
qualifying policyholders
Stateauto.PA.Rates.08.22.20 (0.37) (0.79) 4.33
Home State Insurance
Group
Home State County
Mutual Insurance
Company
Voluntary
Liability
(4.55) 02-14-2020 04-14-2020 Other Apollo.6mo.PA.Rates.02.14.20 (0.37) (0.79) 4.33
Home State Insurance
Group
Home State County
Mutual Insurance
Company
Voluntary
Liability
(3.96) 06-10-2020 07-10-2020 Tier factors - Revised tier factors
resulting in excess of ±5% change for
some policyholders.
ASA.Select.6mo.PA.Rates.06.10.2
0
(0.37) (0.79) 4.33
Home State Insurance
Group
Home State County
Mutual Insurance
Company
Voluntary
Liability
(3.20) 11-15-2020 12-01-2020 Other Germania.PA Rates.11.15.20 (0.37) (0.79) 4.33
Home State Insurance
Group
Home State County
Mutual Insurance
Company
Voluntary
Liability
(2.90) 09-20-2020 10-15-2020 Base rate/loss cost/loss cost multiplier –
Revised base rates/loss costs/loss cost
multiplier resulting in excess of ±5%
change.
Germania.PA.Rates.09.20.20 (0.37) (0.79) 4.33
Home State Insurance
Group
Home State County
Mutual Insurance
Company
Voluntary
Liability
(2.64) 10-01-2020 11-01-2020 Other SNAP.PA.Rates.10.01.20 (0.37) (0.79) 4.33
Home State Insurance
Group
Home State County
Mutual Insurance
Company
Voluntary
Liability
(2.30) 04-24-2020 05-14-2020 Base rate/loss cost/loss cost multiplier –
Revised base rates/loss costs/loss cost
multiplier resulting in excess of ±5%
change.
StateAuto.PA.Rates.04.24.20 (0.37) (0.79) 4.33
Home State Insurance
Group
Home State County
Mutual Insurance
Company
Voluntary
Liability
(2.02) 08-11-2020 10-11-2020 Other ApolloSA.1mo.PA.Rates.08.11.20 (0.37) (0.79) 4.33
105
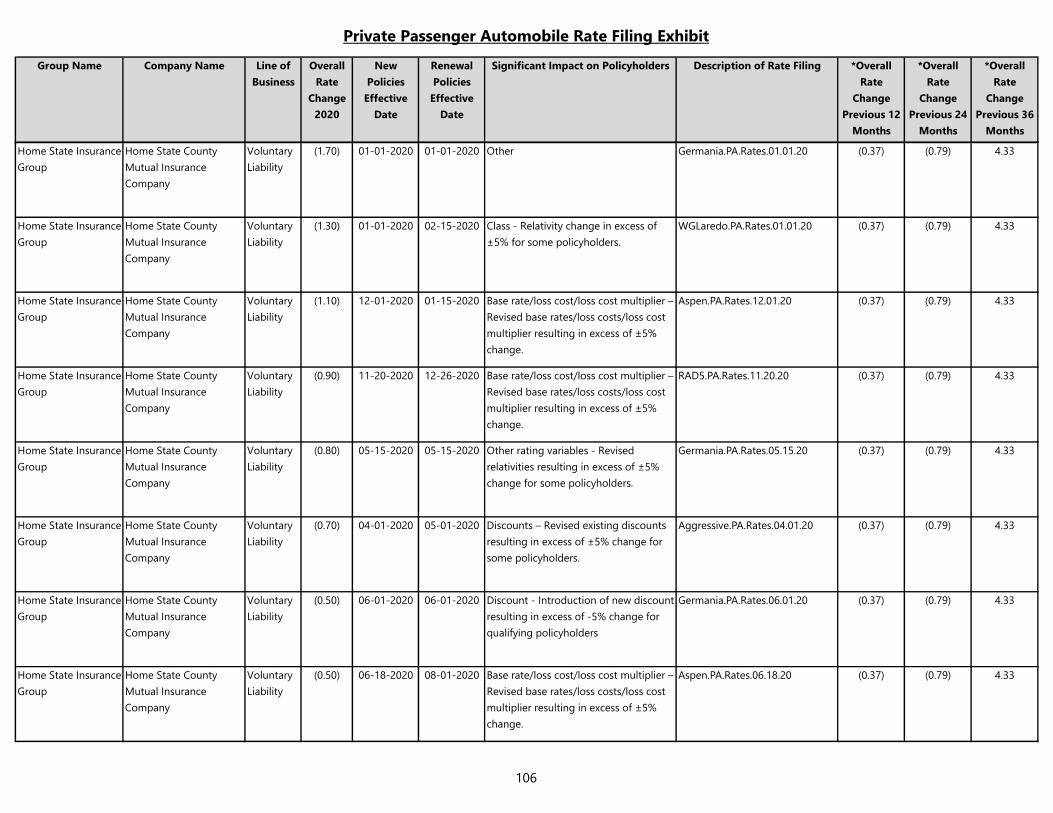
Private Passenger Automobile Rate Filing Exhibit
Group Name Company Name Line of
Business
Overall
Rate
Change
2020
New
Policies
Effective
Date
Renewal
Policies
Effective
Date
Significant Impact on Policyholders Description of Rate Filing *Overall
Rate
Change
Previous 12
Months
*Overall
Rate
Change
Previous 24
Months
*Overall
Rate
Change
Previous 36
Months
Home State Insurance
Group
Home State County
Mutual Insurance
Company
Voluntary
Liability
(1.70) 01-01-2020 01-01-2020 Other Germania.PA.Rates.01.01.20 (0.37) (0.79) 4.33
Home State Insurance
Group
Home State County
Mutual Insurance
Company
Voluntary
Liability
(1.30) 01-01-2020 02-15-2020 Class - Relativity change in excess of
±5% for some policyholders.
WGLaredo.PA.Rates.01.01.20 (0.37) (0.79) 4.33
Home State Insurance
Group
Home State County
Mutual Insurance
Company
Voluntary
Liability
(1.10) 12-01-2020 01-15-2020 Base rate/loss cost/loss cost multiplier –
Revised base rates/loss costs/loss cost
multiplier resulting in excess of ±5%
change.
Aspen.PA.Rates.12.01.20 (0.37) (0.79) 4.33
Home State Insurance
Group
Home State County
Mutual Insurance
Company
Voluntary
Liability
(0.90) 11-20-2020 12-26-2020 Base rate/loss cost/loss cost multiplier –
Revised base rates/loss costs/loss cost
multiplier resulting in excess of ±5%
change.
RAD5.PA.Rates.11.20.20 (0.37) (0.79) 4.33
Home State Insurance
Group
Home State County
Mutual Insurance
Company
Voluntary
Liability
(0.80) 05-15-2020 05-15-2020 Other rating variables - Revised
relativities resulting in excess of ±5%
change for some policyholders.
Germania.PA.Rates.05.15.20 (0.37) (0.79) 4.33
Home State Insurance
Group
Home State County
Mutual Insurance
Company
Voluntary
Liability
(0.70) 04-01-2020 05-01-2020 Discounts – Revised existing discounts
resulting in excess of ±5% change for
some policyholders.
Aggressive.PA.Rates.04.01.20 (0.37) (0.79) 4.33
Home State Insurance
Group
Home State County
Mutual Insurance
Company
Voluntary
Liability
(0.50) 06-01-2020 06-01-2020 Discount - Introduction of new discount
resulting in excess of -5% change for
qualifying policyholders
Germania.PA.Rates.06.01.20 (0.37) (0.79) 4.33
Home State Insurance
Group
Home State County
Mutual Insurance
Company
Voluntary
Liability
(0.50) 06-18-2020 08-01-2020 Base rate/loss cost/loss cost multiplier –
Revised base rates/loss costs/loss cost
multiplier resulting in excess of ±5%
change.
Aspen.PA.Rates.06.18.20 (0.37) (0.79) 4.33
106
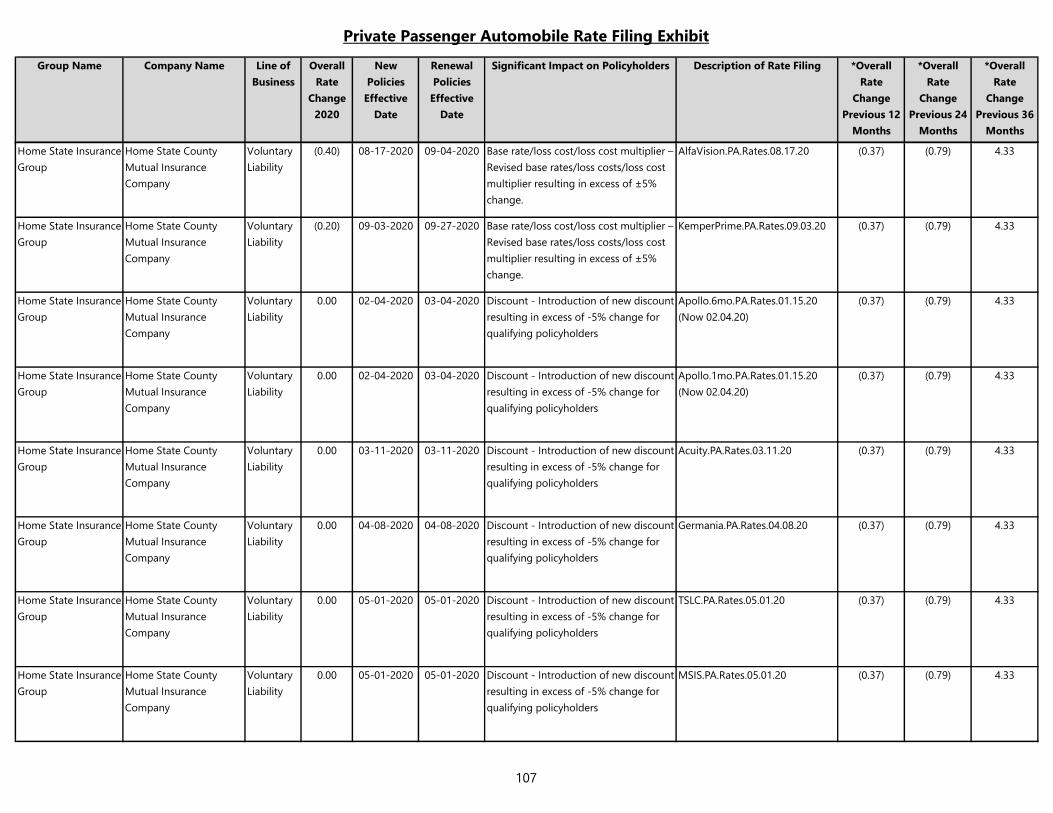
Private Passenger Automobile Rate Filing Exhibit
Group Name Company Name Line of
Business
Overall
Rate
Change
2020
New
Policies
Effective
Date
Renewal
Policies
Effective
Date
Significant Impact on Policyholders Description of Rate Filing *Overall
Rate
Change
Previous 12
Months
*Overall
Rate
Change
Previous 24
Months
*Overall
Rate
Change
Previous 36
Months
Home State Insurance
Group
Home State County
Mutual Insurance
Company
Voluntary
Liability
(0.40) 08-17-2020 09-04-2020 Base rate/loss cost/loss cost multiplier –
Revised base rates/loss costs/loss cost
multiplier resulting in excess of ±5%
change.
AlfaVision.PA.Rates.08.17.20 (0.37) (0.79) 4.33
Home State Insurance
Group
Home State County
Mutual Insurance
Company
Voluntary
Liability
(0.20) 09-03-2020 09-27-2020 Base rate/loss cost/loss cost multiplier –
Revised base rates/loss costs/loss cost
multiplier resulting in excess of ±5%
change.
KemperPrime.PA.Rates.09.03.20 (0.37) (0.79) 4.33
Home State Insurance
Group
Home State County
Mutual Insurance
Company
Voluntary
Liability
0.00 02-04-2020 03-04-2020 Discount - Introduction of new discount
resulting in excess of -5% change for
qualifying policyholders
Apollo.6mo.PA.Rates.01.15.20
(Now 02.04.20)
(0.37) (0.79) 4.33
Home State Insurance
Group
Home State County
Mutual Insurance
Company
Voluntary
Liability
0.00 02-04-2020 03-04-2020 Discount - Introduction of new discount
resulting in excess of -5% change for
qualifying policyholders
Apollo.1mo.PA.Rates.01.15.20
(Now 02.04.20)
(0.37) (0.79) 4.33
Home State Insurance
Group
Home State County
Mutual Insurance
Company
Voluntary
Liability
0.00 03-11-2020 03-11-2020 Discount - Introduction of new discount
resulting in excess of -5% change for
qualifying policyholders
Acuity.PA.Rates.03.11.20 (0.37) (0.79) 4.33
Home State Insurance
Group
Home State County
Mutual Insurance
Company
Voluntary
Liability
0.00 04-08-2020 04-08-2020 Discount - Introduction of new discount
resulting in excess of -5% change for
qualifying policyholders
Germania.PA.Rates.04.08.20 (0.37) (0.79) 4.33
Home State Insurance
Group
Home State County
Mutual Insurance
Company
Voluntary
Liability
0.00 05-01-2020 05-01-2020 Discount - Introduction of new discount
resulting in excess of -5% change for
qualifying policyholders
TSLC.PA.Rates.05.01.20 (0.37) (0.79) 4.33
Home State Insurance
Group
Home State County
Mutual Insurance
Company
Voluntary
Liability
0.00 05-01-2020 05-01-2020 Discount - Introduction of new discount
resulting in excess of -5% change for
qualifying policyholders
MSIS.PA.Rates.05.01.20 (0.37) (0.79) 4.33
107
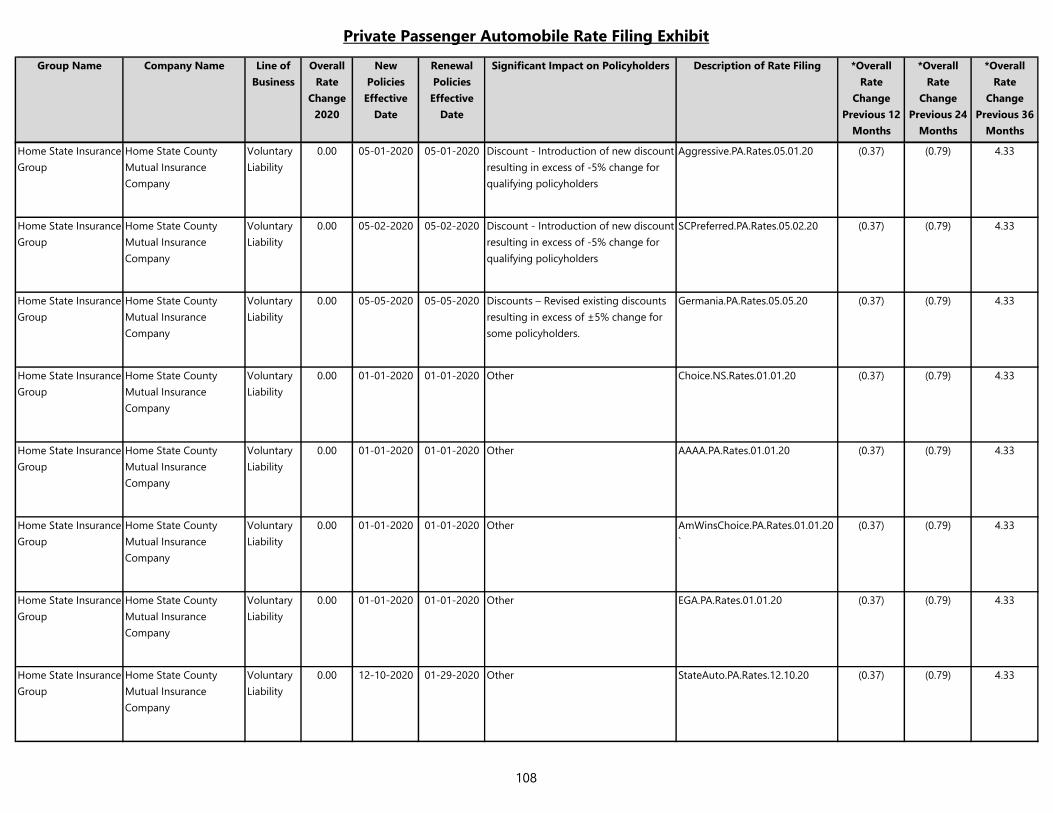
Private Passenger Automobile Rate Filing Exhibit
Group Name Company Name Line of
Business
Overall
Rate
Change
2020
New
Policies
Effective
Date
Renewal
Policies
Effective
Date
Significant Impact on Policyholders Description of Rate Filing *Overall
Rate
Change
Previous 12
Months
*Overall
Rate
Change
Previous 24
Months
*Overall
Rate
Change
Previous 36
Months
Home State Insurance
Group
Home State County
Mutual Insurance
Company
Voluntary
Liability
0.00 05-01-2020 05-01-2020 Discount - Introduction of new discount
resulting in excess of -5% change for
qualifying policyholders
Aggressive.PA.Rates.05.01.20 (0.37) (0.79) 4.33
Home State Insurance
Group
Home State County
Mutual Insurance
Company
Voluntary
Liability
0.00 05-02-2020 05-02-2020 Discount - Introduction of new discount
resulting in excess of -5% change for
qualifying policyholders
SCPreferred.PA.Rates.05.02.20 (0.37) (0.79) 4.33
Home State Insurance
Group
Home State County
Mutual Insurance
Company
Voluntary
Liability
0.00 05-05-2020 05-05-2020 Discounts – Revised existing discounts
resulting in excess of ±5% change for
some policyholders.
Germania.PA.Rates.05.05.20 (0.37) (0.79) 4.33
Home State Insurance
Group
Home State County
Mutual Insurance
Company
Voluntary
Liability
0.00 01-01-2020 01-01-2020 Other Choice.NS.Rates.01.01.20 (0.37) (0.79) 4.33
Home State Insurance
Group
Home State County
Mutual Insurance
Company
Voluntary
Liability
0.00 01-01-2020 01-01-2020 Other AAAA.PA.Rates.01.01.20 (0.37) (0.79) 4.33
Home State Insurance
Group
Home State County
Mutual Insurance
Company
Voluntary
Liability
0.00 01-01-2020 01-01-2020 Other AmWinsChoice.PA.Rates.01.01.20
`
(0.37) (0.79) 4.33
Home State Insurance
Group
Home State County
Mutual Insurance
Company
Voluntary
Liability
0.00 01-01-2020 01-01-2020 Other EGA.PA.Rates.01.01.20 (0.37) (0.79) 4.33
Home State Insurance
Group
Home State County
Mutual Insurance
Company
Voluntary
Liability
0.00 12-10-2020 01-29-2020 Other StateAuto.PA.Rates.12.10.20 (0.37) (0.79) 4.33
108
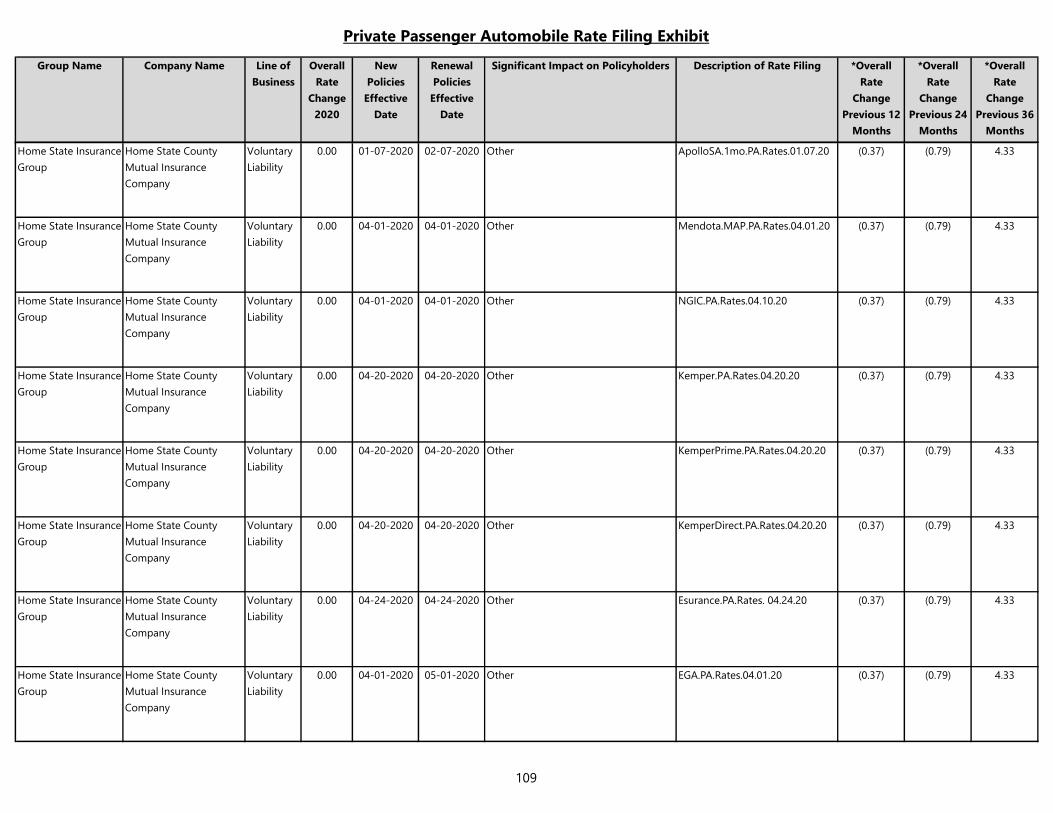
Private Passenger Automobile Rate Filing Exhibit
Group Name Company Name Line of
Business
Overall
Rate
Change
2020
New
Policies
Effective
Date
Renewal
Policies
Effective
Date
Significant Impact on Policyholders Description of Rate Filing *Overall
Rate
Change
Previous 12
Months
*Overall
Rate
Change
Previous 24
Months
*Overall
Rate
Change
Previous 36
Months
Home State Insurance
Group
Home State County
Mutual Insurance
Company
Voluntary
Liability
0.00 01-07-2020 02-07-2020 Other ApolloSA.1mo.PA.Rates.01.07.20 (0.37) (0.79) 4.33
Home State Insurance
Group
Home State County
Mutual Insurance
Company
Voluntary
Liability
0.00 04-01-2020 04-01-2020 Other Mendota.MAP.PA.Rates.04.01.20 (0.37) (0.79) 4.33
Home State Insurance
Group
Home State County
Mutual Insurance
Company
Voluntary
Liability
0.00 04-01-2020 04-01-2020 Other NGIC.PA.Rates.04.10.20 (0.37) (0.79) 4.33
Home State Insurance
Group
Home State County
Mutual Insurance
Company
Voluntary
Liability
0.00 04-20-2020 04-20-2020 Other Kemper.PA.Rates.04.20.20 (0.37) (0.79) 4.33
Home State Insurance
Group
Home State County
Mutual Insurance
Company
Voluntary
Liability
0.00 04-20-2020 04-20-2020 Other KemperPrime.PA.Rates.04.20.20 (0.37) (0.79) 4.33
Home State Insurance
Group
Home State County
Mutual Insurance
Company
Voluntary
Liability
0.00 04-20-2020 04-20-2020 Other KemperDirect.PA.Rates.04.20.20 (0.37) (0.79) 4.33
Home State Insurance
Group
Home State County
Mutual Insurance
Company
Voluntary
Liability
0.00 04-24-2020 04-24-2020 Other Esurance.PA.Rates. 04.24.20 (0.37) (0.79) 4.33
Home State Insurance
Group
Home State County
Mutual Insurance
Company
Voluntary
Liability
0.00 04-01-2020 05-01-2020 Other EGA.PA.Rates.04.01.20 (0.37) (0.79) 4.33
109
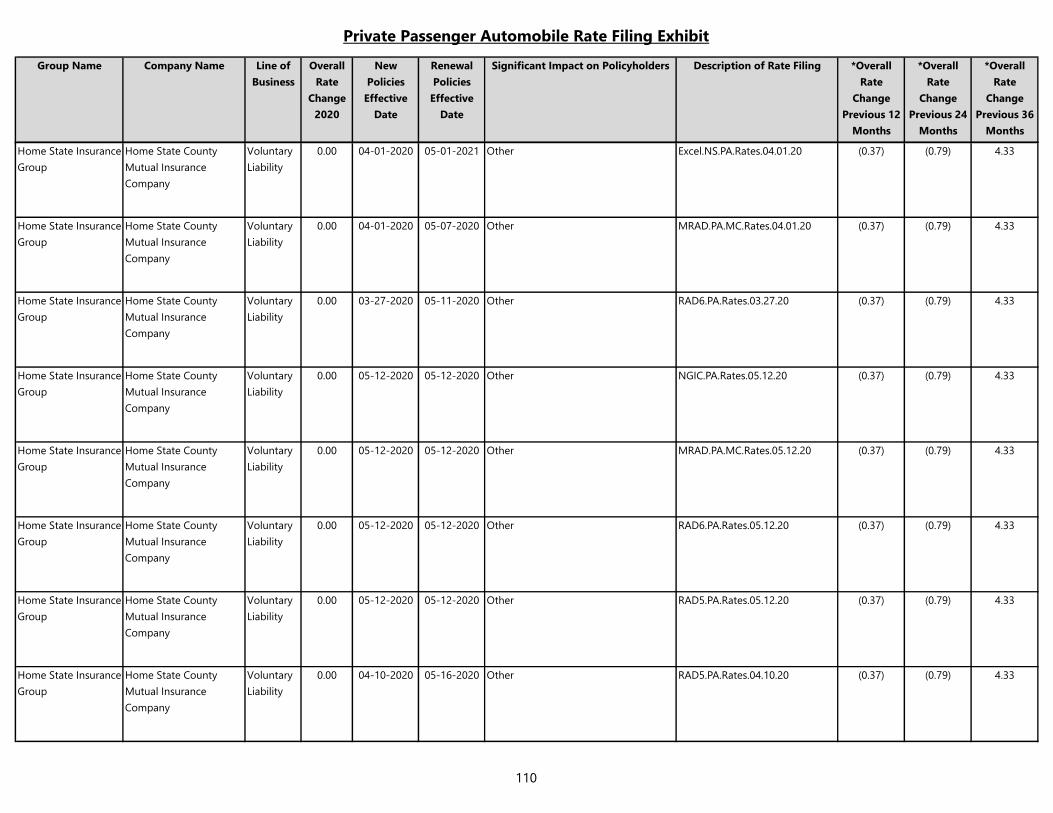
Private Passenger Automobile Rate Filing Exhibit
Group Name Company Name Line of
Business
Overall
Rate
Change
2020
New
Policies
Effective
Date
Renewal
Policies
Effective
Date
Significant Impact on Policyholders Description of Rate Filing *Overall
Rate
Change
Previous 12
Months
*Overall
Rate
Change
Previous 24
Months
*Overall
Rate
Change
Previous 36
Months
Home State Insurance
Group
Home State County
Mutual Insurance
Company
Voluntary
Liability
0.00 04-01-2020 05-01-2021 Other Excel.NS.PA.Rates.04.01.20 (0.37) (0.79) 4.33
Home State Insurance
Group
Home State County
Mutual Insurance
Company
Voluntary
Liability
0.00 04-01-2020 05-07-2020 Other MRAD.PA.MC.Rates.04.01.20 (0.37) (0.79) 4.33
Home State Insurance
Group
Home State County
Mutual Insurance
Company
Voluntary
Liability
0.00 03-27-2020 05-11-2020 Other RAD6.PA.Rates.03.27.20 (0.37) (0.79) 4.33
Home State Insurance
Group
Home State County
Mutual Insurance
Company
Voluntary
Liability
0.00 05-12-2020 05-12-2020 Other NGIC.PA.Rates.05.12.20 (0.37) (0.79) 4.33
Home State Insurance
Group
Home State County
Mutual Insurance
Company
Voluntary
Liability
0.00 05-12-2020 05-12-2020 Other MRAD.PA.MC.Rates.05.12.20 (0.37) (0.79) 4.33
Home State Insurance
Group
Home State County
Mutual Insurance
Company
Voluntary
Liability
0.00 05-12-2020 05-12-2020 Other RAD6.PA.Rates.05.12.20 (0.37) (0.79) 4.33
Home State Insurance
Group
Home State County
Mutual Insurance
Company
Voluntary
Liability
0.00 05-12-2020 05-12-2020 Other RAD5.PA.Rates.05.12.20 (0.37) (0.79) 4.33
Home State Insurance
Group
Home State County
Mutual Insurance
Company
Voluntary
Liability
0.00 04-10-2020 05-16-2020 Other RAD5.PA.Rates.04.10.20 (0.37) (0.79) 4.33
110
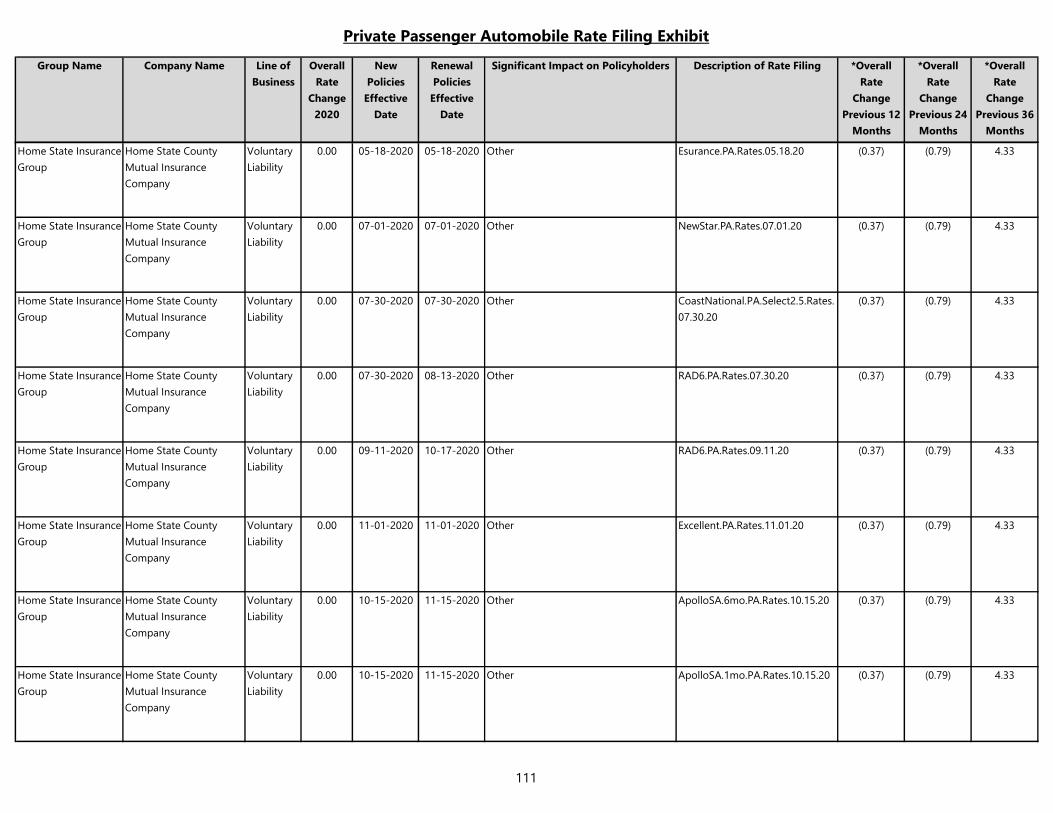
Private Passenger Automobile Rate Filing Exhibit
Group Name Company Name Line of
Business
Overall
Rate
Change
2020
New
Policies
Effective
Date
Renewal
Policies
Effective
Date
Significant Impact on Policyholders Description of Rate Filing *Overall
Rate
Change
Previous 12
Months
*Overall
Rate
Change
Previous 24
Months
*Overall
Rate
Change
Previous 36
Months
Home State Insurance
Group
Home State County
Mutual Insurance
Company
Voluntary
Liability
0.00 05-18-2020 05-18-2020 Other Esurance.PA.Rates.05.18.20 (0.37) (0.79) 4.33
Home State Insurance
Group
Home State County
Mutual Insurance
Company
Voluntary
Liability
0.00 07-01-2020 07-01-2020 Other NewStar.PA.Rates.07.01.20 (0.37) (0.79) 4.33
Home State Insurance
Group
Home State County
Mutual Insurance
Company
Voluntary
Liability
0.00 07-30-2020 07-30-2020 Other CoastNational.PA.Select2.5.Rates.
07.30.20
(0.37) (0.79) 4.33
Home State Insurance
Group
Home State County
Mutual Insurance
Company
Voluntary
Liability
0.00 07-30-2020 08-13-2020 Other RAD6.PA.Rates.07.30.20 (0.37) (0.79) 4.33
Home State Insurance
Group
Home State County
Mutual Insurance
Company
Voluntary
Liability
0.00 09-11-2020 10-17-2020 Other RAD6.PA.Rates.09.11.20 (0.37) (0.79) 4.33
Home State Insurance
Group
Home State County
Mutual Insurance
Company
Voluntary
Liability
0.00 11-01-2020 11-01-2020 Other Excellent.PA.Rates.11.01.20 (0.37) (0.79) 4.33
Home State Insurance
Group
Home State County
Mutual Insurance
Company
Voluntary
Liability
0.00 10-15-2020 11-15-2020 Other ApolloSA.6mo.PA.Rates.10.15.20 (0.37) (0.79) 4.33
Home State Insurance
Group
Home State County
Mutual Insurance
Company
Voluntary
Liability
0.00 10-15-2020 11-15-2020 Other ApolloSA.1mo.PA.Rates.10.15.20 (0.37) (0.79) 4.33
111
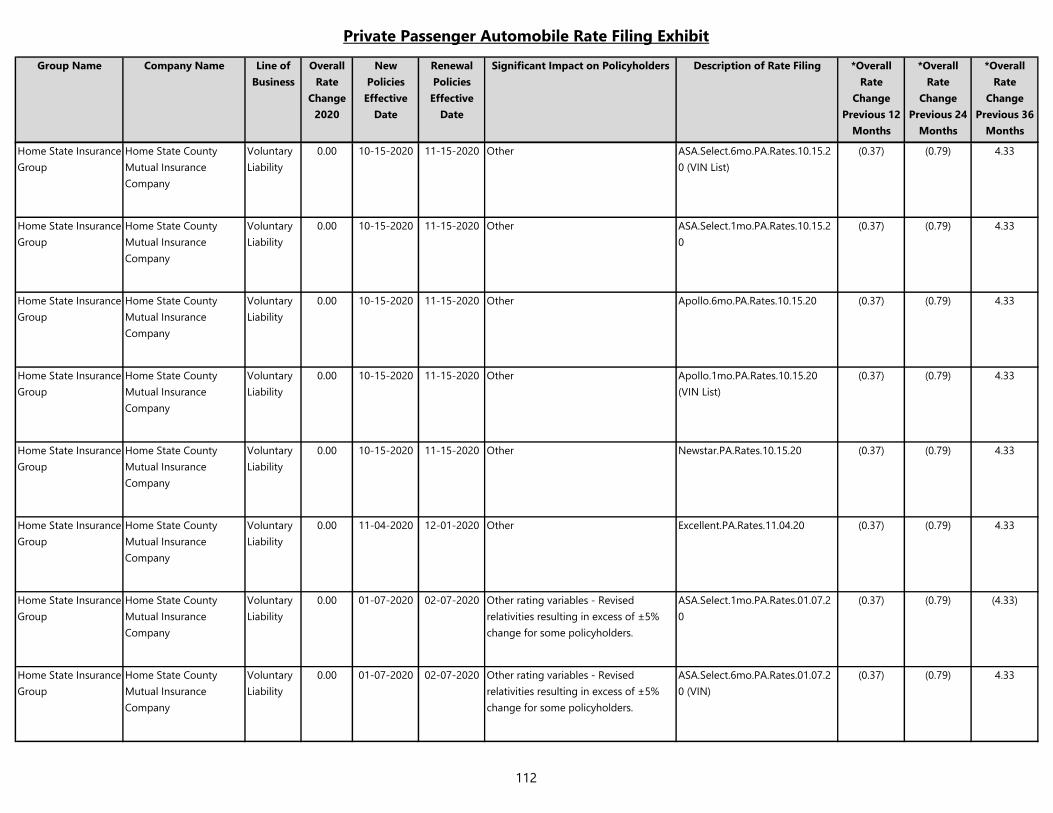
Private Passenger Automobile Rate Filing Exhibit
Group Name Company Name Line of
Business
Overall
Rate
Change
2020
New
Policies
Effective
Date
Renewal
Policies
Effective
Date
Significant Impact on Policyholders Description of Rate Filing *Overall
Rate
Change
Previous 12
Months
*Overall
Rate
Change
Previous 24
Months
*Overall
Rate
Change
Previous 36
Months
Home State Insurance
Group
Home State County
Mutual Insurance
Company
Voluntary
Liability
0.00 10-15-2020 11-15-2020 Other ASA.Select.6mo.PA.Rates.10.15.2
0 (VIN List)
(0.37) (0.79) 4.33
Home State Insurance
Group
Home State County
Mutual Insurance
Company
Voluntary
Liability
0.00 10-15-2020 11-15-2020 Other ASA.Select.1mo.PA.Rates.10.15.2
0
(0.37) (0.79) 4.33
Home State Insurance
Group
Home State County
Mutual Insurance
Company
Voluntary
Liability
0.00 10-15-2020 11-15-2020 Other Apollo.6mo.PA.Rates.10.15.20 (0.37) (0.79) 4.33
Home State Insurance
Group
Home State County
Mutual Insurance
Company
Voluntary
Liability
0.00 10-15-2020 11-15-2020 Other Apollo.1mo.PA.Rates.10.15.20
(VIN List)
(0.37) (0.79) 4.33
Home State Insurance
Group
Home State County
Mutual Insurance
Company
Voluntary
Liability
0.00 10-15-2020 11-15-2020 Other Newstar.PA.Rates.10.15.20 (0.37) (0.79) 4.33
Home State Insurance
Group
Home State County
Mutual Insurance
Company
Voluntary
Liability
0.00 11-04-2020 12-01-2020 Other Excellent.PA.Rates.11.04.20 (0.37) (0.79) 4.33
Home State Insurance
Group
Home State County
Mutual Insurance
Company
Voluntary
Liability
0.00 01-07-2020 02-07-2020 Other rating variables - Revised
relativities resulting in excess of ±5%
change for some policyholders.
ASA.Select.1mo.PA.Rates.01.07.2
0
(0.37) (0.79) (4.33)
Home State Insurance
Group
Home State County
Mutual Insurance
Company
Voluntary
Liability
0.00 01-07-2020 02-07-2020 Other rating variables - Revised
relativities resulting in excess of ±5%
change for some policyholders.
ASA.Select.6mo.PA.Rates.01.07.2
0 (VIN)
(0.37) (0.79) 4.33
112
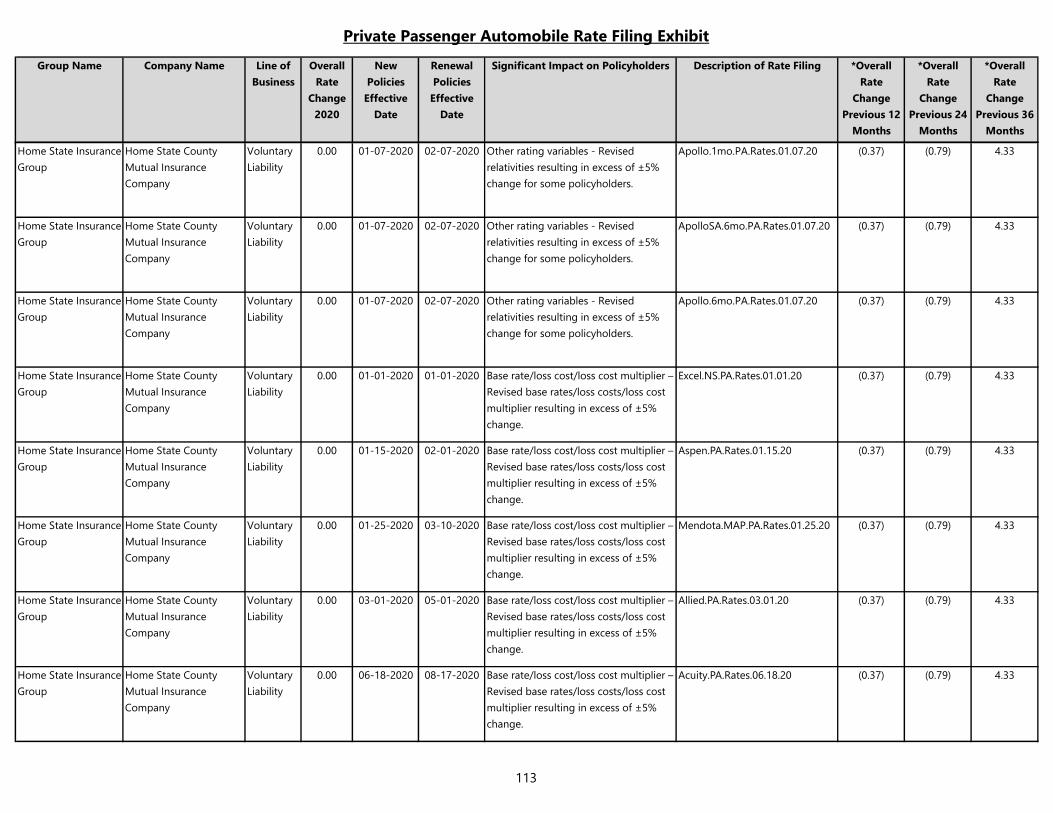
Private Passenger Automobile Rate Filing Exhibit
Group Name Company Name Line of
Business
Overall
Rate
Change
2020
New
Policies
Effective
Date
Renewal
Policies
Effective
Date
Significant Impact on Policyholders Description of Rate Filing *Overall
Rate
Change
Previous 12
Months
*Overall
Rate
Change
Previous 24
Months
*Overall
Rate
Change
Previous 36
Months
Home State Insurance
Group
Home State County
Mutual Insurance
Company
Voluntary
Liability
0.00 01-07-2020 02-07-2020 Other rating variables - Revised
relativities resulting in excess of ±5%
change for some policyholders.
Apollo.1mo.PA.Rates.01.07.20 (0.37) (0.79) 4.33
Home State Insurance
Group
Home State County
Mutual Insurance
Company
Voluntary
Liability
0.00 01-07-2020 02-07-2020 Other rating variables - Revised
relativities resulting in excess of ±5%
change for some policyholders.
ApolloSA.6mo.PA.Rates.01.07.20 (0.37) (0.79) 4.33
Home State Insurance
Group
Home State County
Mutual Insurance
Company
Voluntary
Liability
0.00 01-07-2020 02-07-2020 Other rating variables - Revised
relativities resulting in excess of ±5%
change for some policyholders.
Apollo.6mo.PA.Rates.01.07.20 (0.37) (0.79) 4.33
Home State Insurance
Group
Home State County
Mutual Insurance
Company
Voluntary
Liability
0.00 01-01-2020 01-01-2020 Base rate/loss cost/loss cost multiplier –
Revised base rates/loss costs/loss cost
multiplier resulting in excess of ±5%
change.
Excel.NS.PA.Rates.01.01.20 (0.37) (0.79) 4.33
Home State Insurance
Group
Home State County
Mutual Insurance
Company
Voluntary
Liability
0.00 01-15-2020 02-01-2020 Base rate/loss cost/loss cost multiplier –
Revised base rates/loss costs/loss cost
multiplier resulting in excess of ±5%
change.
Aspen.PA.Rates.01.15.20 (0.37) (0.79) 4.33
Home State Insurance
Group
Home State County
Mutual Insurance
Company
Voluntary
Liability
0.00 01-25-2020 03-10-2020 Base rate/loss cost/loss cost multiplier –
Revised base rates/loss costs/loss cost
multiplier resulting in excess of ±5%
change.
Mendota.MAP.PA.Rates.01.25.20 (0.37) (0.79) 4.33
Home State Insurance
Group
Home State County
Mutual Insurance
Company
Voluntary
Liability
0.00 03-01-2020 05-01-2020 Base rate/loss cost/loss cost multiplier –
Revised base rates/loss costs/loss cost
multiplier resulting in excess of ±5%
change.
Allied.PA.Rates.03.01.20 (0.37) (0.79) 4.33
Home State Insurance
Group
Home State County
Mutual Insurance
Company
Voluntary
Liability
0.00 06-18-2020 08-17-2020 Base rate/loss cost/loss cost multiplier –
Revised base rates/loss costs/loss cost
multiplier resulting in excess of ±5%
change.
Acuity.PA.Rates.06.18.20 (0.37) (0.79) 4.33
113
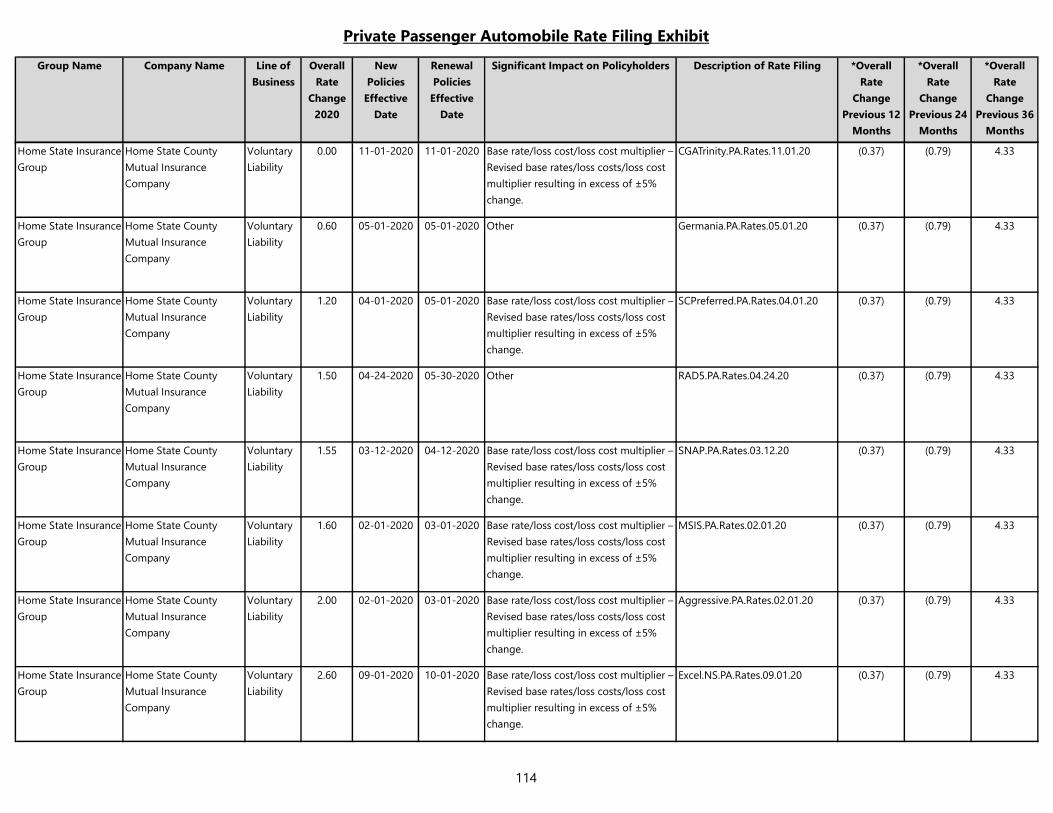
Private Passenger Automobile Rate Filing Exhibit
Group Name Company Name Line of
Business
Overall
Rate
Change
2020
New
Policies
Effective
Date
Renewal
Policies
Effective
Date
Significant Impact on Policyholders Description of Rate Filing *Overall
Rate
Change
Previous 12
Months
*Overall
Rate
Change
Previous 24
Months
*Overall
Rate
Change
Previous 36
Months
Home State Insurance
Group
Home State County
Mutual Insurance
Company
Voluntary
Liability
0.00 11-01-2020 11-01-2020 Base rate/loss cost/loss cost multiplier –
Revised base rates/loss costs/loss cost
multiplier resulting in excess of ±5%
change.
CGATrinity.PA.Rates.11.01.20 (0.37) (0.79) 4.33
Home State Insurance
Group
Home State County
Mutual Insurance
Company
Voluntary
Liability
0.60 05-01-2020 05-01-2020 Other Germania.PA.Rates.05.01.20 (0.37) (0.79) 4.33
Home State Insurance
Group
Home State County
Mutual Insurance
Company
Voluntary
Liability
1.20 04-01-2020 05-01-2020 Base rate/loss cost/loss cost multiplier –
Revised base rates/loss costs/loss cost
multiplier resulting in excess of ±5%
change.
SCPreferred.PA.Rates.04.01.20 (0.37) (0.79) 4.33
Home State Insurance
Group
Home State County
Mutual Insurance
Company
Voluntary
Liability
1.50 04-24-2020 05-30-2020 Other RAD5.PA.Rates.04.24.20 (0.37) (0.79) 4.33
Home State Insurance
Group
Home State County
Mutual Insurance
Company
Voluntary
Liability
1.55 03-12-2020 04-12-2020 Base rate/loss cost/loss cost multiplier –
Revised base rates/loss costs/loss cost
multiplier resulting in excess of ±5%
change.
SNAP.PA.Rates.03.12.20 (0.37) (0.79) 4.33
Home State Insurance
Group
Home State County
Mutual Insurance
Company
Voluntary
Liability
1.60 02-01-2020 03-01-2020 Base rate/loss cost/loss cost multiplier –
Revised base rates/loss costs/loss cost
multiplier resulting in excess of ±5%
change.
MSIS.PA.Rates.02.01.20 (0.37) (0.79) 4.33
Home State Insurance
Group
Home State County
Mutual Insurance
Company
Voluntary
Liability
2.00 02-01-2020 03-01-2020 Base rate/loss cost/loss cost multiplier –
Revised base rates/loss costs/loss cost
multiplier resulting in excess of ±5%
change.
Aggressive.PA.Rates.02.01.20 (0.37) (0.79) 4.33
Home State Insurance
Group
Home State County
Mutual Insurance
Company
Voluntary
Liability
2.60 09-01-2020 10-01-2020 Base rate/loss cost/loss cost multiplier –
Revised base rates/loss costs/loss cost
multiplier resulting in excess of ±5%
change.
Excel.NS.PA.Rates.09.01.20 (0.37) (0.79) 4.33
114
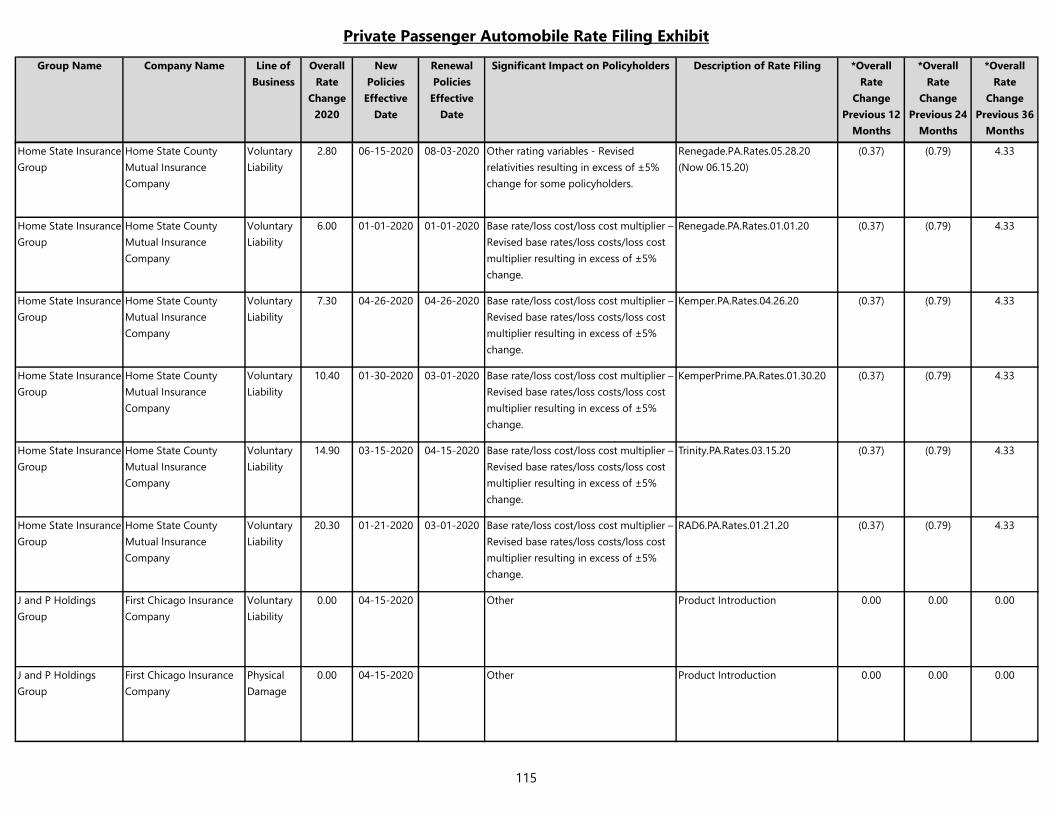
Private Passenger Automobile Rate Filing Exhibit
Group Name Company Name Line of
Business
Overall
Rate
Change
2020
New
Policies
Effective
Date
Renewal
Policies
Effective
Date
Significant Impact on Policyholders Description of Rate Filing *Overall
Rate
Change
Previous 12
Months
*Overall
Rate
Change
Previous 24
Months
*Overall
Rate
Change
Previous 36
Months
Home State Insurance
Group
Home State County
Mutual Insurance
Company
Voluntary
Liability
2.80 06-15-2020 08-03-2020 Other rating variables - Revised
relativities resulting in excess of ±5%
change for some policyholders.
Renegade.PA.Rates.05.28.20
(Now 06.15.20)
(0.37) (0.79) 4.33
Home State Insurance
Group
Home State County
Mutual Insurance
Company
Voluntary
Liability
6.00 01-01-2020 01-01-2020 Base rate/loss cost/loss cost multiplier –
Revised base rates/loss costs/loss cost
multiplier resulting in excess of ±5%
change.
Renegade.PA.Rates.01.01.20 (0.37) (0.79) 4.33
Home State Insurance
Group
Home State County
Mutual Insurance
Company
Voluntary
Liability
7.30 04-26-2020 04-26-2020 Base rate/loss cost/loss cost multiplier –
Revised base rates/loss costs/loss cost
multiplier resulting in excess of ±5%
change.
Kemper.PA.Rates.04.26.20 (0.37) (0.79) 4.33
Home State Insurance
Group
Home State County
Mutual Insurance
Company
Voluntary
Liability
10.40 01-30-2020 03-01-2020 Base rate/loss cost/loss cost multiplier –
Revised base rates/loss costs/loss cost
multiplier resulting in excess of ±5%
change.
KemperPrime.PA.Rates.01.30.20 (0.37) (0.79) 4.33
Home State Insurance
Group
Home State County
Mutual Insurance
Company
Voluntary
Liability
14.90 03-15-2020 04-15-2020 Base rate/loss cost/loss cost multiplier –
Revised base rates/loss costs/loss cost
multiplier resulting in excess of ±5%
change.
Trinity.PA.Rates.03.15.20 (0.37) (0.79) 4.33
Home State Insurance
Group
Home State County
Mutual Insurance
Company
Voluntary
Liability
20.30 01-21-2020 03-01-2020 Base rate/loss cost/loss cost multiplier –
Revised base rates/loss costs/loss cost
multiplier resulting in excess of ±5%
change.
RAD6.PA.Rates.01.21.20 (0.37) (0.79) 4.33
J and P Holdings
Group
First Chicago Insurance
Company
Voluntary
Liability
0.00 04-15-2020 Other Product Introduction 0.00 0.00 0.00
J and P Holdings
Group
First Chicago Insurance
Company
Physical
Damage
0.00 04-15-2020 Other Product Introduction 0.00 0.00 0.00
115
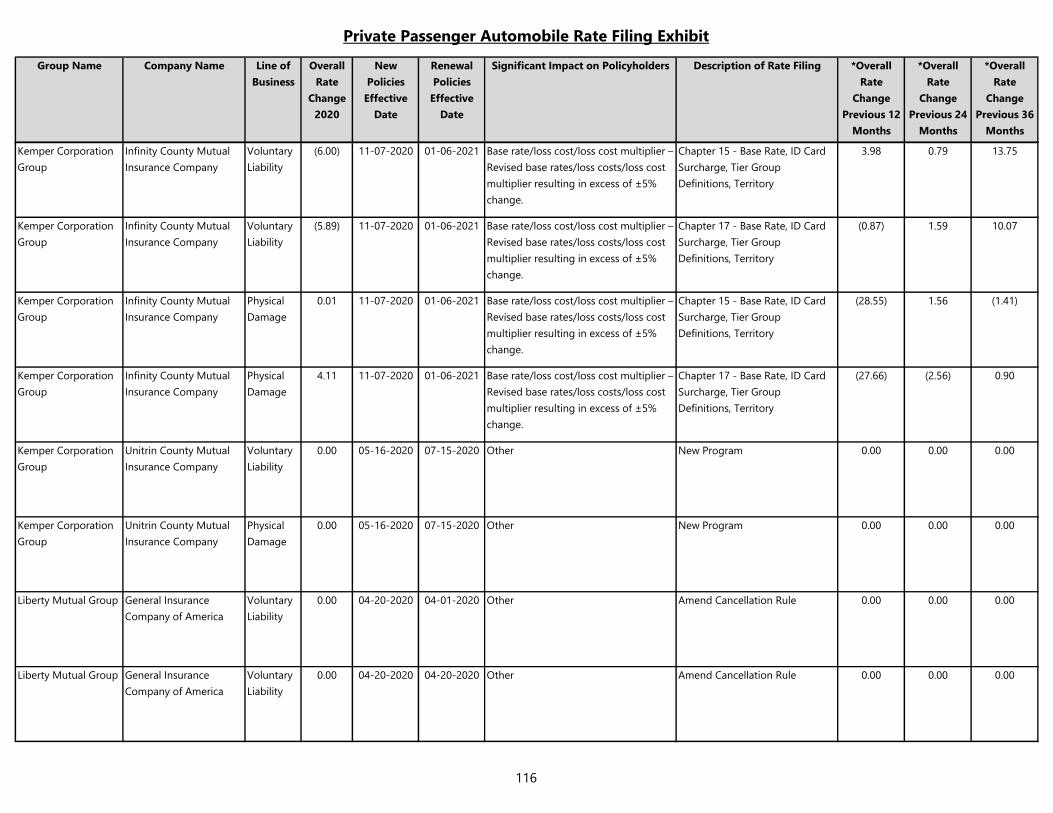
Private Passenger Automobile Rate Filing Exhibit
Group Name Company Name Line of
Business
Overall
Rate
Change
2020
New
Policies
Effective
Date
Renewal
Policies
Effective
Date
Significant Impact on Policyholders Description of Rate Filing *Overall
Rate
Change
Previous 12
Months
*Overall
Rate
Change
Previous 24
Months
*Overall
Rate
Change
Previous 36
Months
Kemper Corporation
Group
Infinity County Mutual
Insurance Company
Voluntary
Liability
(6.00) 11-07-2020 01-06-2021 Base rate/loss cost/loss cost multiplier –
Revised base rates/loss costs/loss cost
multiplier resulting in excess of ±5%
change.
Chapter 15 - Base Rate, ID Card
Surcharge, Tier Group
Definitions, Territory
3.98 0.79 13.75
Kemper Corporation
Group
Infinity County Mutual
Insurance Company
Voluntary
Liability
(5.89) 11-07-2020 01-06-2021 Base rate/loss cost/loss cost multiplier –
Revised base rates/loss costs/loss cost
multiplier resulting in excess of ±5%
change.
Chapter 17 - Base Rate, ID Card
Surcharge, Tier Group
Definitions, Territory
(0.87) 1.59 10.07
Kemper Corporation
Group
Infinity County Mutual
Insurance Company
Physical
Damage
0.01 11-07-2020 01-06-2021 Base rate/loss cost/loss cost multiplier –
Revised base rates/loss costs/loss cost
multiplier resulting in excess of ±5%
change.
Chapter 15 - Base Rate, ID Card
Surcharge, Tier Group
Definitions, Territory
(28.55) 1.56 (1.41)
Kemper Corporation
Group
Infinity County Mutual
Insurance Company
Physical
Damage
4.11 11-07-2020 01-06-2021 Base rate/loss cost/loss cost multiplier –
Revised base rates/loss costs/loss cost
multiplier resulting in excess of ±5%
change.
Chapter 17 - Base Rate, ID Card
Surcharge, Tier Group
Definitions, Territory
(27.66) (2.56) 0.90
Kemper Corporation
Group
Unitrin County Mutual
Insurance Company
Voluntary
Liability
0.00 05-16-2020 07-15-2020 Other New Program 0.00 0.00 0.00
Kemper Corporation
Group
Unitrin County Mutual
Insurance Company
Physical
Damage
0.00 05-16-2020 07-15-2020 Other New Program 0.00 0.00 0.00
Liberty Mutual Group General Insurance
Company of America
Voluntary
Liability
0.00 04-20-2020 04-01-2020 Other Amend Cancellation Rule 0.00 0.00 0.00
Liberty Mutual Group General Insurance
Company of America
Voluntary
Liability
0.00 04-20-2020 04-20-2020 Other Amend Cancellation Rule 0.00 0.00 0.00
116
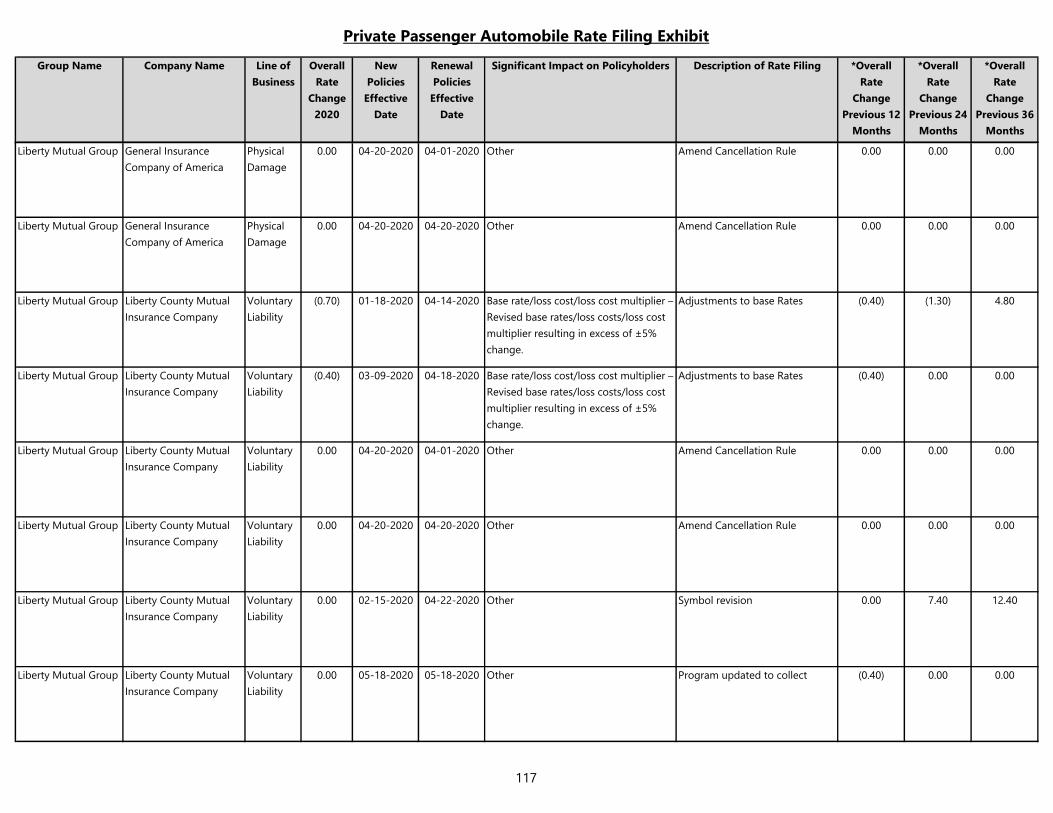
Private Passenger Automobile Rate Filing Exhibit
Group Name Company Name Line of
Business
Overall
Rate
Change
2020
New
Policies
Effective
Date
Renewal
Policies
Effective
Date
Significant Impact on Policyholders Description of Rate Filing *Overall
Rate
Change
Previous 12
Months
*Overall
Rate
Change
Previous 24
Months
*Overall
Rate
Change
Previous 36
Months
Liberty Mutual Group General Insurance
Company of America
Physical
Damage
0.00 04-20-2020 04-01-2020 Other Amend Cancellation Rule 0.00 0.00 0.00
Liberty Mutual Group General Insurance
Company of America
Physical
Damage
0.00 04-20-2020 04-20-2020 Other Amend Cancellation Rule 0.00 0.00 0.00
Liberty Mutual Group Liberty County Mutual
Insurance Company
Voluntary
Liability
(0.70) 01-18-2020 04-14-2020 Base rate/loss cost/loss cost multiplier –
Revised base rates/loss costs/loss cost
multiplier resulting in excess of ±5%
change.
Adjustments to base Rates (0.40) (1.30) 4.80
Liberty Mutual Group Liberty County Mutual
Insurance Company
Voluntary
Liability
(0.40) 03-09-2020 04-18-2020 Base rate/loss cost/loss cost multiplier –
Revised base rates/loss costs/loss cost
multiplier resulting in excess of ±5%
change.
Adjustments to base Rates (0.40) 0.00 0.00
Liberty Mutual Group Liberty County Mutual
Insurance Company
Voluntary
Liability
0.00 04-20-2020 04-01-2020 Other Amend Cancellation Rule 0.00 0.00 0.00
Liberty Mutual Group Liberty County Mutual
Insurance Company
Voluntary
Liability
0.00 04-20-2020 04-20-2020 Other Amend Cancellation Rule 0.00 0.00 0.00
Liberty Mutual Group Liberty County Mutual
Insurance Company
Voluntary
Liability
0.00 02-15-2020 04-22-2020 Other Symbol revision 0.00 7.40 12.40
Liberty Mutual Group Liberty County Mutual
Insurance Company
Voluntary
Liability
0.00 05-18-2020 05-18-2020 Other Program updated to collect (0.40) 0.00 0.00
117
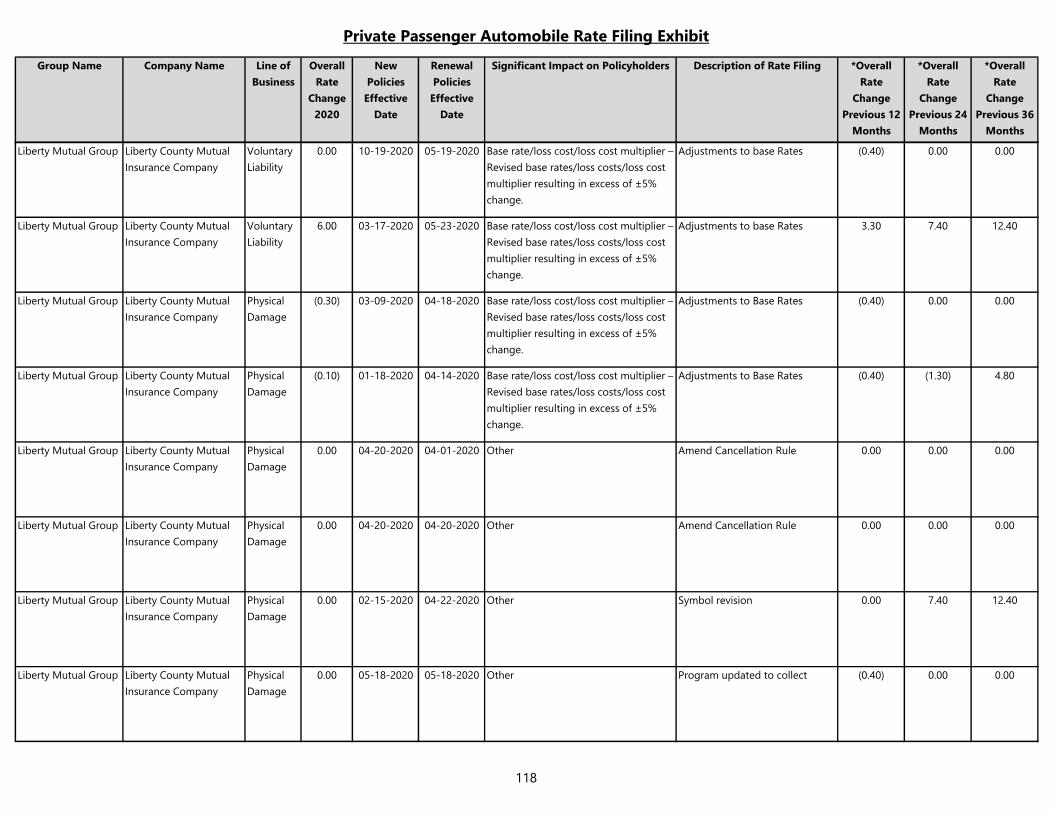
Private Passenger Automobile Rate Filing Exhibit
Group Name Company Name Line of
Business
Overall
Rate
Change
2020
New
Policies
Effective
Date
Renewal
Policies
Effective
Date
Significant Impact on Policyholders Description of Rate Filing *Overall
Rate
Change
Previous 12
Months
*Overall
Rate
Change
Previous 24
Months
*Overall
Rate
Change
Previous 36
Months
Liberty Mutual Group Liberty County Mutual
Insurance Company
Voluntary
Liability
0.00 10-19-2020 05-19-2020 Base rate/loss cost/loss cost multiplier –
Revised base rates/loss costs/loss cost
multiplier resulting in excess of ±5%
change.
Adjustments to base Rates (0.40) 0.00 0.00
Liberty Mutual Group Liberty County Mutual
Insurance Company
Voluntary
Liability
6.00 03-17-2020 05-23-2020 Base rate/loss cost/loss cost multiplier –
Revised base rates/loss costs/loss cost
multiplier resulting in excess of ±5%
change.
Adjustments to base Rates 3.30 7.40 12.40
Liberty Mutual Group Liberty County Mutual
Insurance Company
Physical
Damage
(0.30) 03-09-2020 04-18-2020 Base rate/loss cost/loss cost multiplier –
Revised base rates/loss costs/loss cost
multiplier resulting in excess of ±5%
change.
Adjustments to Base Rates (0.40) 0.00 0.00
Liberty Mutual Group Liberty County Mutual
Insurance Company
Physical
Damage
(0.10) 01-18-2020 04-14-2020 Base rate/loss cost/loss cost multiplier –
Revised base rates/loss costs/loss cost
multiplier resulting in excess of ±5%
change.
Adjustments to Base Rates (0.40) (1.30) 4.80
Liberty Mutual Group Liberty County Mutual
Insurance Company
Physical
Damage
0.00 04-20-2020 04-01-2020 Other Amend Cancellation Rule 0.00 0.00 0.00
Liberty Mutual Group Liberty County Mutual
Insurance Company
Physical
Damage
0.00 04-20-2020 04-20-2020 Other Amend Cancellation Rule 0.00 0.00 0.00
Liberty Mutual Group Liberty County Mutual
Insurance Company
Physical
Damage
0.00 02-15-2020 04-22-2020 Other Symbol revision 0.00 7.40 12.40
Liberty Mutual Group Liberty County Mutual
Insurance Company
Physical
Damage
0.00 05-18-2020 05-18-2020 Other Program updated to collect (0.40) 0.00 0.00
118
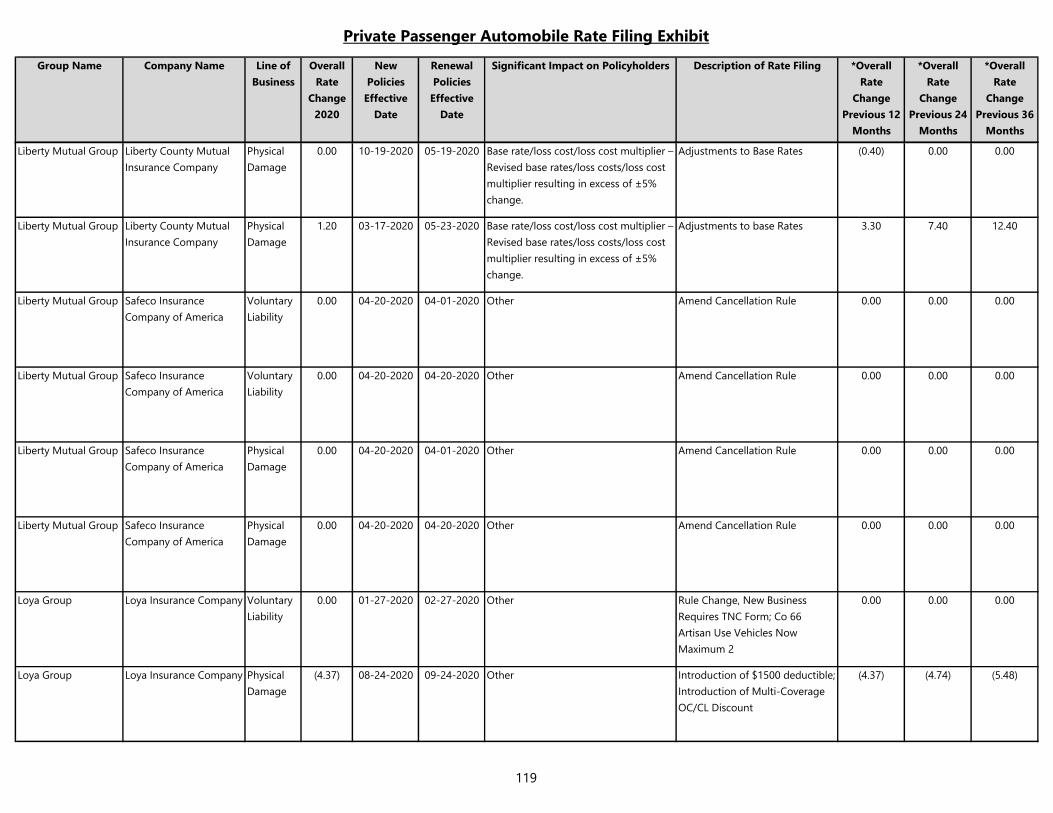
Private Passenger Automobile Rate Filing Exhibit
Group Name Company Name Line of
Business
Overall
Rate
Change
2020
New
Policies
Effective
Date
Renewal
Policies
Effective
Date
Significant Impact on Policyholders Description of Rate Filing *Overall
Rate
Change
Previous 12
Months
*Overall
Rate
Change
Previous 24
Months
*Overall
Rate
Change
Previous 36
Months
Liberty Mutual Group Liberty County Mutual
Insurance Company
Physical
Damage
0.00 10-19-2020 05-19-2020 Base rate/loss cost/loss cost multiplier –
Revised base rates/loss costs/loss cost
multiplier resulting in excess of ±5%
change.
Adjustments to Base Rates (0.40) 0.00 0.00
Liberty Mutual Group Liberty County Mutual
Insurance Company
Physical
Damage
1.20 03-17-2020 05-23-2020 Base rate/loss cost/loss cost multiplier –
Revised base rates/loss costs/loss cost
multiplier resulting in excess of ±5%
change.
Adjustments to base Rates 3.30 7.40 12.40
Liberty Mutual Group Safeco Insurance
Company of America
Voluntary
Liability
0.00 04-20-2020 04-01-2020 Other Amend Cancellation Rule 0.00 0.00 0.00
Liberty Mutual Group Safeco Insurance
Company of America
Voluntary
Liability
0.00 04-20-2020 04-20-2020 Other Amend Cancellation Rule 0.00 0.00 0.00
Liberty Mutual Group Safeco Insurance
Company of America
Physical
Damage
0.00 04-20-2020 04-01-2020 Other Amend Cancellation Rule 0.00 0.00 0.00
Liberty Mutual Group Safeco Insurance
Company of America
Physical
Damage
0.00 04-20-2020 04-20-2020 Other Amend Cancellation Rule 0.00 0.00 0.00
Loya Group Loya Insurance Company Voluntary
Liability
0.00 01-27-2020 02-27-2020 Other Rule Change, New Business
Requires TNC Form; Co 66
Artisan Use Vehicles Now
Maximum 2
0.00 0.00 0.00
Loya Group Loya Insurance Company Physical
Damage
(4.37) 08-24-2020 09-24-2020 Other Introduction of $1500 deductible;
Introduction of Multi-Coverage
OC/CL Discount
(4.37) (4.74) (5.48)
119
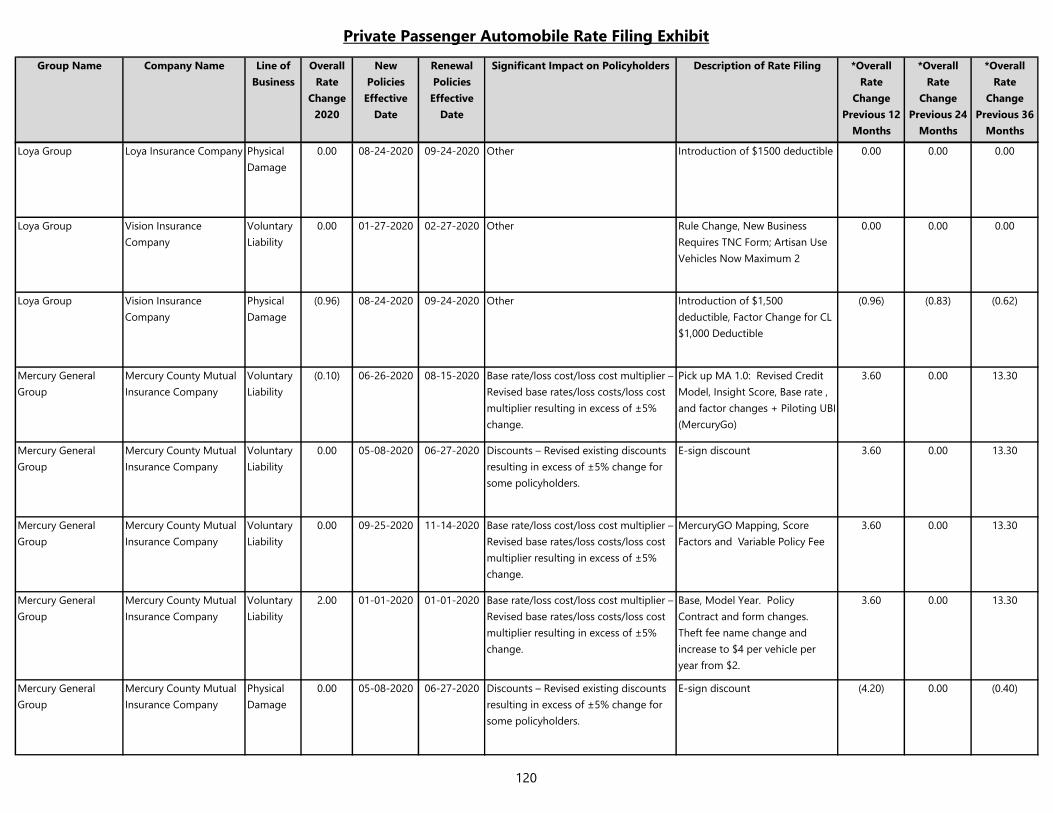
Private Passenger Automobile Rate Filing Exhibit
Group Name Company Name Line of
Business
Overall
Rate
Change
2020
New
Policies
Effective
Date
Renewal
Policies
Effective
Date
Significant Impact on Policyholders Description of Rate Filing *Overall
Rate
Change
Previous 12
Months
*Overall
Rate
Change
Previous 24
Months
*Overall
Rate
Change
Previous 36
Months
Loya Group Loya Insurance Company Physical
Damage
0.00 08-24-2020 09-24-2020 Other Introduction of $1500 deductible 0.00 0.00 0.00
Loya Group Vision Insurance
Company
Voluntary
Liability
0.00 01-27-2020 02-27-2020 Other Rule Change, New Business
Requires TNC Form; Artisan Use
Vehicles Now Maximum 2
0.00 0.00 0.00
Loya Group Vision Insurance
Company
Physical
Damage
(0.96) 08-24-2020 09-24-2020 Other Introduction of $1,500
deductible, Factor Change for CL
$1,000 Deductible
(0.96) (0.83) (0.62)
Mercury General
Group
Mercury County Mutual
Insurance Company
Voluntary
Liability
(0.10) 06-26-2020 08-15-2020 Base rate/loss cost/loss cost multiplier –
Revised base rates/loss costs/loss cost
multiplier resulting in excess of ±5%
change.
Pick up MA 1.0: Revised Credit
Model, Insight Score, Base rate ,
and factor changes + Piloting UBI
(MercuryGo)
3.60 0.00 13.30
Mercury General
Group
Mercury County Mutual
Insurance Company
Voluntary
Liability
0.00 05-08-2020 06-27-2020 Discounts – Revised existing discounts
resulting in excess of ±5% change for
some policyholders.
E-sign discount 3.60 0.00 13.30
Mercury General
Group
Mercury County Mutual
Insurance Company
Voluntary
Liability
0.00 09-25-2020 11-14-2020 Base rate/loss cost/loss cost multiplier –
Revised base rates/loss costs/loss cost
multiplier resulting in excess of ±5%
change.
MercuryGO Mapping, Score
Factors and Variable Policy Fee
3.60 0.00 13.30
Mercury General
Group
Mercury County Mutual
Insurance Company
Voluntary
Liability
2.00 01-01-2020 01-01-2020 Base rate/loss cost/loss cost multiplier –
Revised base rates/loss costs/loss cost
multiplier resulting in excess of ±5%
change.
Base, Model Year. Policy
Contract and form changes.
Theft fee name change and
increase to $4 per vehicle per
year from $2.
3.60 0.00 13.30
Mercury General
Group
Mercury County Mutual
Insurance Company
Physical
Damage
0.00 05-08-2020 06-27-2020 Discounts – Revised existing discounts
resulting in excess of ±5% change for
some policyholders.
E-sign discount (4.20) 0.00 (0.40)
120
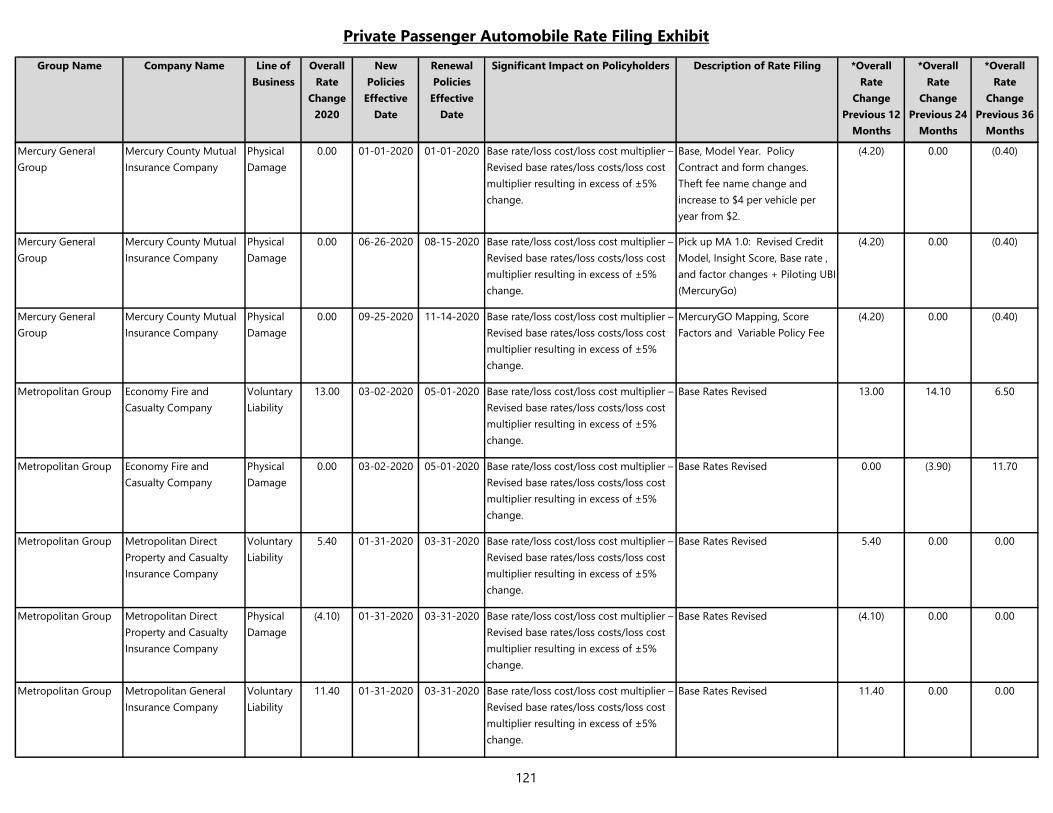
Private Passenger Automobile Rate Filing Exhibit
Group Name Company Name Line of
Business
Overall
Rate
Change
2020
New
Policies
Effective
Date
Renewal
Policies
Effective
Date
Significant Impact on Policyholders Description of Rate Filing *Overall
Rate
Change
Previous 12
Months
*Overall
Rate
Change
Previous 24
Months
*Overall
Rate
Change
Previous 36
Months
Mercury General
Group
Mercury County Mutual
Insurance Company
Physical
Damage
0.00 01-01-2020 01-01-2020 Base rate/loss cost/loss cost multiplier –
Revised base rates/loss costs/loss cost
multiplier resulting in excess of ±5%
change.
Base, Model Year. Policy
Contract and form changes.
Theft fee name change and
increase to $4 per vehicle per
year from $2.
(4.20) 0.00 (0.40)
Mercury General
Group
Mercury County Mutual
Insurance Company
Physical
Damage
0.00 06-26-2020 08-15-2020 Base rate/loss cost/loss cost multiplier –
Revised base rates/loss costs/loss cost
multiplier resulting in excess of ±5%
change.
Pick up MA 1.0: Revised Credit
Model, Insight Score, Base rate ,
and factor changes + Piloting UBI
(MercuryGo)
(4.20) 0.00 (0.40)
Mercury General
Group
Mercury County Mutual
Insurance Company
Physical
Damage
0.00 09-25-2020 11-14-2020 Base rate/loss cost/loss cost multiplier –
Revised base rates/loss costs/loss cost
multiplier resulting in excess of ±5%
change.
MercuryGO Mapping, Score
Factors and Variable Policy Fee
(4.20) 0.00 (0.40)
Metropolitan Group Economy Fire and
Casualty Company
Voluntary
Liability
13.00 03-02-2020 05-01-2020 Base rate/loss cost/loss cost multiplier –
Revised base rates/loss costs/loss cost
multiplier resulting in excess of ±5%
change.
Base Rates Revised 13.00 14.10 6.50
Metropolitan Group Economy Fire and
Casualty Company
Physical
Damage
0.00 03-02-2020 05-01-2020 Base rate/loss cost/loss cost multiplier –
Revised base rates/loss costs/loss cost
multiplier resulting in excess of ±5%
change.
Base Rates Revised 0.00 (3.90) 11.70
Metropolitan Group Metropolitan Direct
Property and Casualty
Insurance Company
Voluntary
Liability
5.40 01-31-2020 03-31-2020 Base rate/loss cost/loss cost multiplier –
Revised base rates/loss costs/loss cost
multiplier resulting in excess of ±5%
change.
Base Rates Revised 5.40 0.00 0.00
Metropolitan Group Metropolitan Direct
Property and Casualty
Insurance Company
Physical
Damage
(4.10) 01-31-2020 03-31-2020 Base rate/loss cost/loss cost multiplier –
Revised base rates/loss costs/loss cost
multiplier resulting in excess of ±5%
change.
Base Rates Revised (4.10) 0.00 0.00
Metropolitan Group Metropolitan General
Insurance Company
Voluntary
Liability
11.40 01-31-2020 03-31-2020 Base rate/loss cost/loss cost multiplier –
Revised base rates/loss costs/loss cost
multiplier resulting in excess of ±5%
change.
Base Rates Revised 11.40 0.00 0.00
121
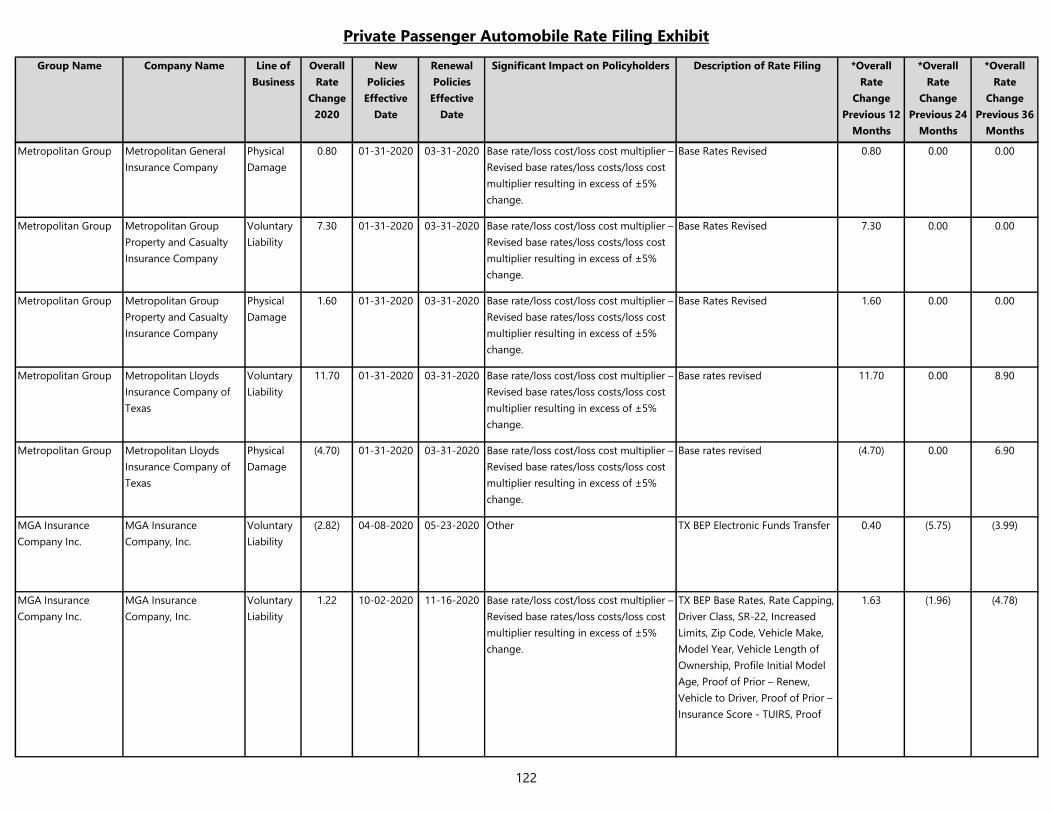
Private Passenger Automobile Rate Filing Exhibit
Group Name Company Name Line of
Business
Overall
Rate
Change
2020
New
Policies
Effective
Date
Renewal
Policies
Effective
Date
Significant Impact on Policyholders Description of Rate Filing *Overall
Rate
Change
Previous 12
Months
*Overall
Rate
Change
Previous 24
Months
*Overall
Rate
Change
Previous 36
Months
Metropolitan Group Metropolitan General
Insurance Company
Physical
Damage
0.80 01-31-2020 03-31-2020 Base rate/loss cost/loss cost multiplier –
Revised base rates/loss costs/loss cost
multiplier resulting in excess of ±5%
change.
Base Rates Revised 0.80 0.00 0.00
Metropolitan Group Metropolitan Group
Property and Casualty
Insurance Company
Voluntary
Liability
7.30 01-31-2020 03-31-2020 Base rate/loss cost/loss cost multiplier –
Revised base rates/loss costs/loss cost
multiplier resulting in excess of ±5%
change.
Base Rates Revised 7.30 0.00 0.00
Metropolitan Group Metropolitan Group
Property and Casualty
Insurance Company
Physical
Damage
1.60 01-31-2020 03-31-2020 Base rate/loss cost/loss cost multiplier –
Revised base rates/loss costs/loss cost
multiplier resulting in excess of ±5%
change.
Base Rates Revised 1.60 0.00 0.00
Metropolitan Group Metropolitan Lloyds
Insurance Company of
Texas
Voluntary
Liability
11.70 01-31-2020 03-31-2020 Base rate/loss cost/loss cost multiplier –
Revised base rates/loss costs/loss cost
multiplier resulting in excess of ±5%
change.
Base rates revised 11.70 0.00 8.90
Metropolitan Group Metropolitan Lloyds
Insurance Company of
Texas
Physical
Damage
(4.70) 01-31-2020 03-31-2020 Base rate/loss cost/loss cost multiplier –
Revised base rates/loss costs/loss cost
multiplier resulting in excess of ±5%
change.
Base rates revised (4.70) 0.00 6.90
MGA Insurance
Company Inc.
MGA Insurance
Company, Inc.
Voluntary
Liability
(2.82) 04-08-2020 05-23-2020 Other TX BEP Electronic Funds Transfer 0.40 (5.75) (3.99)
MGA Insurance
Company Inc.
MGA Insurance
Company, Inc.
Voluntary
Liability
1.22 10-02-2020 11-16-2020 Base rate/loss cost/loss cost multiplier –
Revised base rates/loss costs/loss cost
multiplier resulting in excess of ±5%
change.
TX BEP Base Rates, Rate Capping,
Driver Class, SR-22, Increased
Limits, Zip Code, Vehicle Make,
Model Year, Vehicle Length of
Ownership, Profile Initial Model
Age, Proof of Prior – Renew,
Vehicle to Driver, Proof of Prior –
Insurance Score - TUIRS, Proof
1.63 (1.96) (4.78)
122
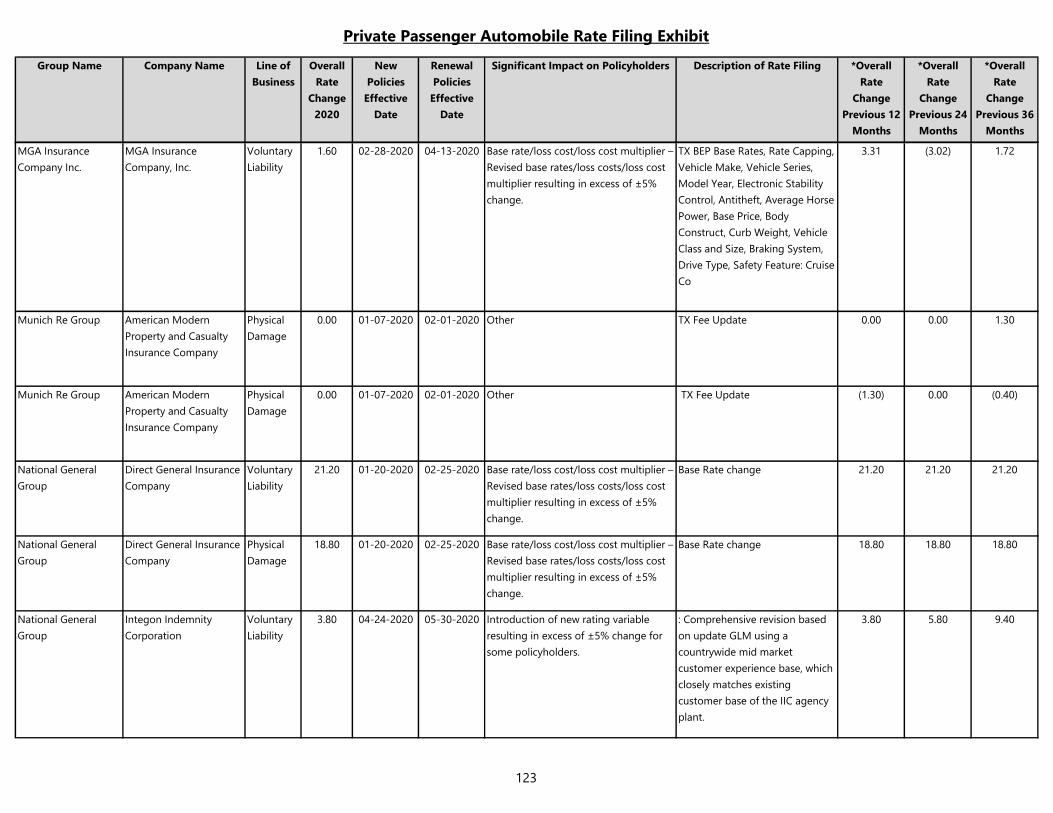
Private Passenger Automobile Rate Filing Exhibit
Group Name Company Name Line of
Business
Overall
Rate
Change
2020
New
Policies
Effective
Date
Renewal
Policies
Effective
Date
Significant Impact on Policyholders Description of Rate Filing *Overall
Rate
Change
Previous 12
Months
*Overall
Rate
Change
Previous 24
Months
*Overall
Rate
Change
Previous 36
Months
MGA Insurance
Company Inc.
MGA Insurance
Company, Inc.
Voluntary
Liability
1.60 02-28-2020 04-13-2020 Base rate/loss cost/loss cost multiplier –
Revised base rates/loss costs/loss cost
multiplier resulting in excess of ±5%
change.
TX BEP Base Rates, Rate Capping,
Vehicle Make, Vehicle Series,
Model Year, Electronic Stability
Control, Antitheft, Average Horse
Power, Base Price, Body
Construct, Curb Weight, Vehicle
Class and Size, Braking System,
Drive Type, Safety Feature: Cruise
Co
3.31 (3.02) 1.72
Munich Re Group American Modern
Property and Casualty
Insurance Company
Physical
Damage
0.00 01-07-2020 02-01-2020 Other TX Fee Update 0.00 0.00 1.30
Munich Re Group American Modern
Property and Casualty
Insurance Company
Physical
Damage
0.00 01-07-2020 02-01-2020 Other TX Fee Update (1.30) 0.00 (0.40)
National General
Group
Direct General Insurance
Company
Voluntary
Liability
21.20 01-20-2020 02-25-2020 Base rate/loss cost/loss cost multiplier –
Revised base rates/loss costs/loss cost
multiplier resulting in excess of ±5%
change.
Base Rate change 21.20 21.20 21.20
National General
Group
Direct General Insurance
Company
Physical
Damage
18.80 01-20-2020 02-25-2020 Base rate/loss cost/loss cost multiplier –
Revised base rates/loss costs/loss cost
multiplier resulting in excess of ±5%
change.
Base Rate change 18.80 18.80 18.80
National General
Group
Integon Indemnity
Corporation
Voluntary
Liability
3.80 04-24-2020 05-30-2020 Introduction of new rating variable
resulting in excess of ±5% change for
some policyholders.
: Comprehensive revision based
on update GLM using a
countrywide mid market
customer experience base, which
closely matches existing
customer base of the IIC agency
plant.
3.80 5.80 9.40
123
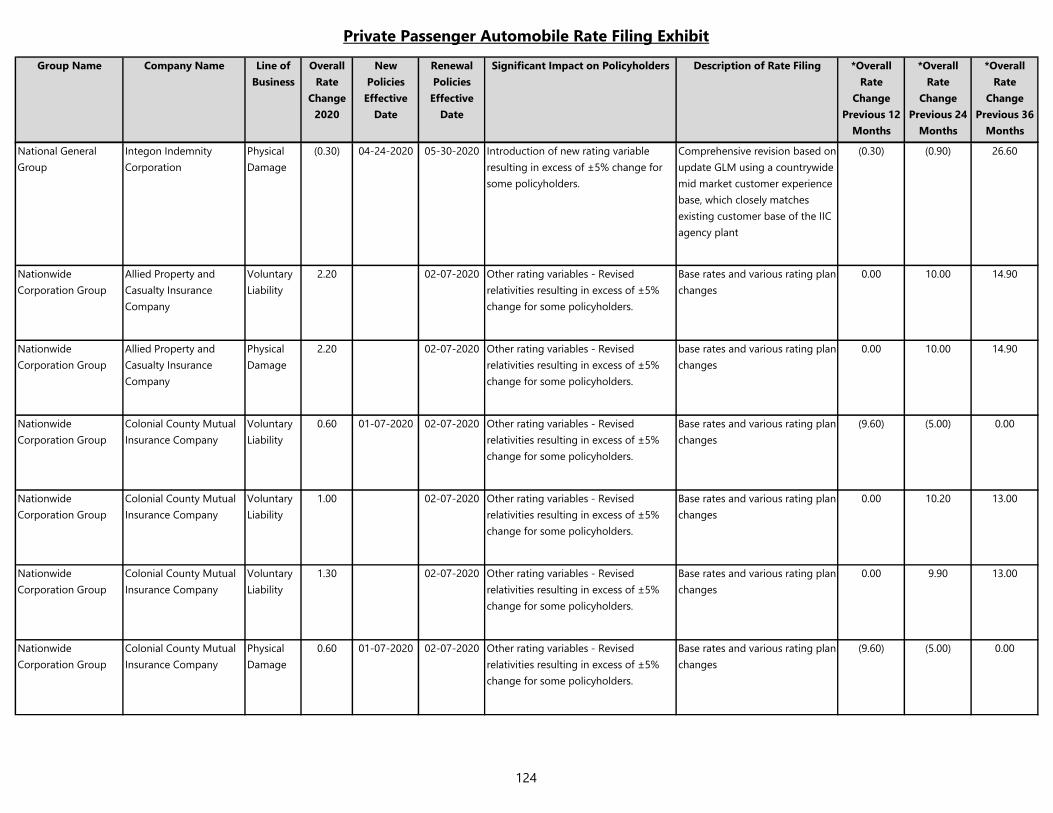
Private Passenger Automobile Rate Filing Exhibit
Group Name Company Name Line of
Business
Overall
Rate
Change
2020
New
Policies
Effective
Date
Renewal
Policies
Effective
Date
Significant Impact on Policyholders Description of Rate Filing *Overall
Rate
Change
Previous 12
Months
*Overall
Rate
Change
Previous 24
Months
*Overall
Rate
Change
Previous 36
Months
National General
Group
Integon Indemnity
Corporation
Physical
Damage
(0.30) 04-24-2020 05-30-2020 Introduction of new rating variable
resulting in excess of ±5% change for
some policyholders.
Comprehensive revision based on
update GLM using a countrywide
mid market customer experience
base, which closely matches
existing customer base of the IIC
agency plant
(0.30) (0.90) 26.60
Nationwide
Corporation Group
Allied Property and
Casualty Insurance
Company
Voluntary
Liability
2.20 02-07-2020 Other rating variables - Revised
relativities resulting in excess of ±5%
change for some policyholders.
Base rates and various rating plan
changes
0.00 10.00 14.90
Nationwide
Corporation Group
Allied Property and
Casualty Insurance
Company
Physical
Damage
2.20 02-07-2020 Other rating variables - Revised
relativities resulting in excess of ±5%
change for some policyholders.
base rates and various rating plan
changes
0.00 10.00 14.90
Nationwide
Corporation Group
Colonial County Mutual
Insurance Company
Voluntary
Liability
0.60 01-07-2020 02-07-2020 Other rating variables - Revised
relativities resulting in excess of ±5%
change for some policyholders.
Base rates and various rating plan
changes
(9.60) (5.00) 0.00
Nationwide
Corporation Group
Colonial County Mutual
Insurance Company
Voluntary
Liability
1.00 02-07-2020 Other rating variables - Revised
relativities resulting in excess of ±5%
change for some policyholders.
Base rates and various rating plan
changes
0.00 10.20 13.00
Nationwide
Corporation Group
Colonial County Mutual
Insurance Company
Voluntary
Liability
1.30 02-07-2020 Other rating variables - Revised
relativities resulting in excess of ±5%
change for some policyholders.
Base rates and various rating plan
changes
0.00 9.90 13.00
Nationwide
Corporation Group
Colonial County Mutual
Insurance Company
Physical
Damage
0.60 01-07-2020 02-07-2020 Other rating variables - Revised
relativities resulting in excess of ±5%
change for some policyholders.
Base rates and various rating plan
changes
(9.60) (5.00) 0.00
124
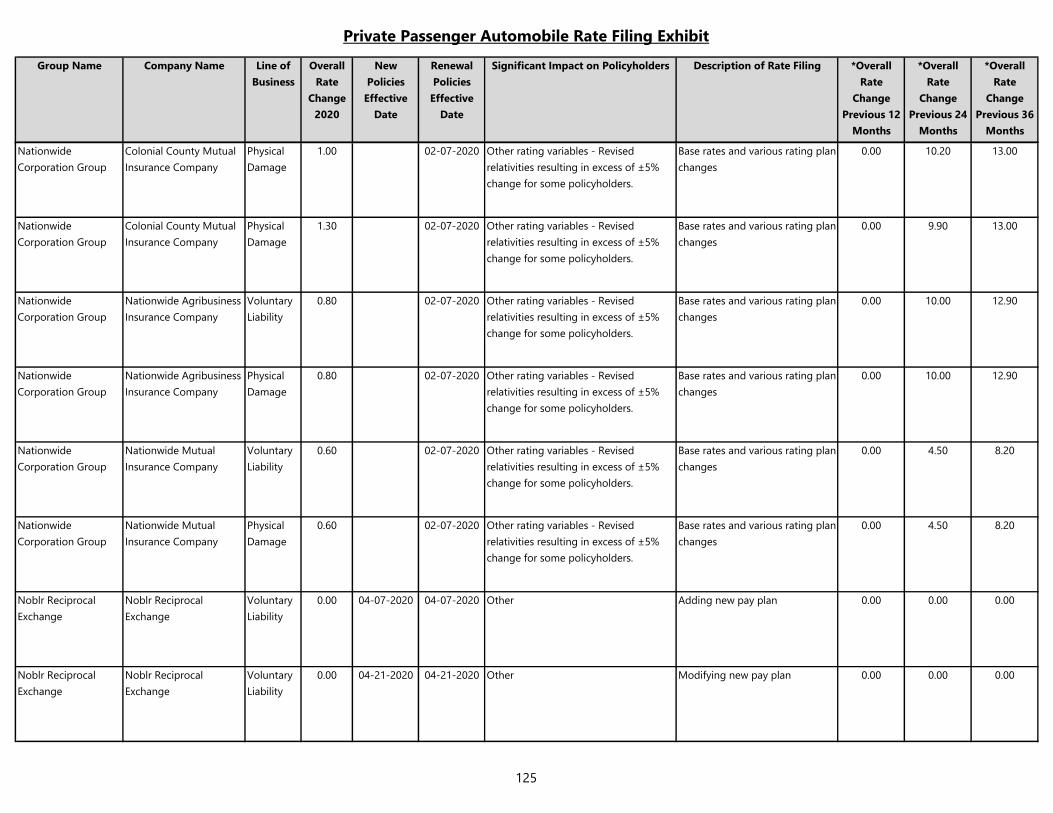
Private Passenger Automobile Rate Filing Exhibit
Group Name Company Name Line of
Business
Overall
Rate
Change
2020
New
Policies
Effective
Date
Renewal
Policies
Effective
Date
Significant Impact on Policyholders Description of Rate Filing *Overall
Rate
Change
Previous 12
Months
*Overall
Rate
Change
Previous 24
Months
*Overall
Rate
Change
Previous 36
Months
Nationwide
Corporation Group
Colonial County Mutual
Insurance Company
Physical
Damage
1.00 02-07-2020 Other rating variables - Revised
relativities resulting in excess of ±5%
change for some policyholders.
Base rates and various rating plan
changes
0.00 10.20 13.00
Nationwide
Corporation Group
Colonial County Mutual
Insurance Company
Physical
Damage
1.30 02-07-2020 Other rating variables - Revised
relativities resulting in excess of ±5%
change for some policyholders.
Base rates and various rating plan
changes
0.00 9.90 13.00
Nationwide
Corporation Group
Nationwide Agribusiness
Insurance Company
Voluntary
Liability
0.80 02-07-2020 Other rating variables - Revised
relativities resulting in excess of ±5%
change for some policyholders.
Base rates and various rating plan
changes
0.00 10.00 12.90
Nationwide
Corporation Group
Nationwide Agribusiness
Insurance Company
Physical
Damage
0.80 02-07-2020 Other rating variables - Revised
relativities resulting in excess of ±5%
change for some policyholders.
Base rates and various rating plan
changes
0.00 10.00 12.90
Nationwide
Corporation Group
Nationwide Mutual
Insurance Company
Voluntary
Liability
0.60 02-07-2020 Other rating variables - Revised
relativities resulting in excess of ±5%
change for some policyholders.
Base rates and various rating plan
changes
0.00 4.50 8.20
Nationwide
Corporation Group
Nationwide Mutual
Insurance Company
Physical
Damage
0.60 02-07-2020 Other rating variables - Revised
relativities resulting in excess of ±5%
change for some policyholders.
Base rates and various rating plan
changes
0.00 4.50 8.20
Noblr Reciprocal
Exchange
Noblr Reciprocal
Exchange
Voluntary
Liability
0.00 04-07-2020 04-07-2020 Other Adding new pay plan 0.00 0.00 0.00
Noblr Reciprocal
Exchange
Noblr Reciprocal
Exchange
Voluntary
Liability
0.00 04-21-2020 04-21-2020 Other Modifying new pay plan 0.00 0.00 0.00
125
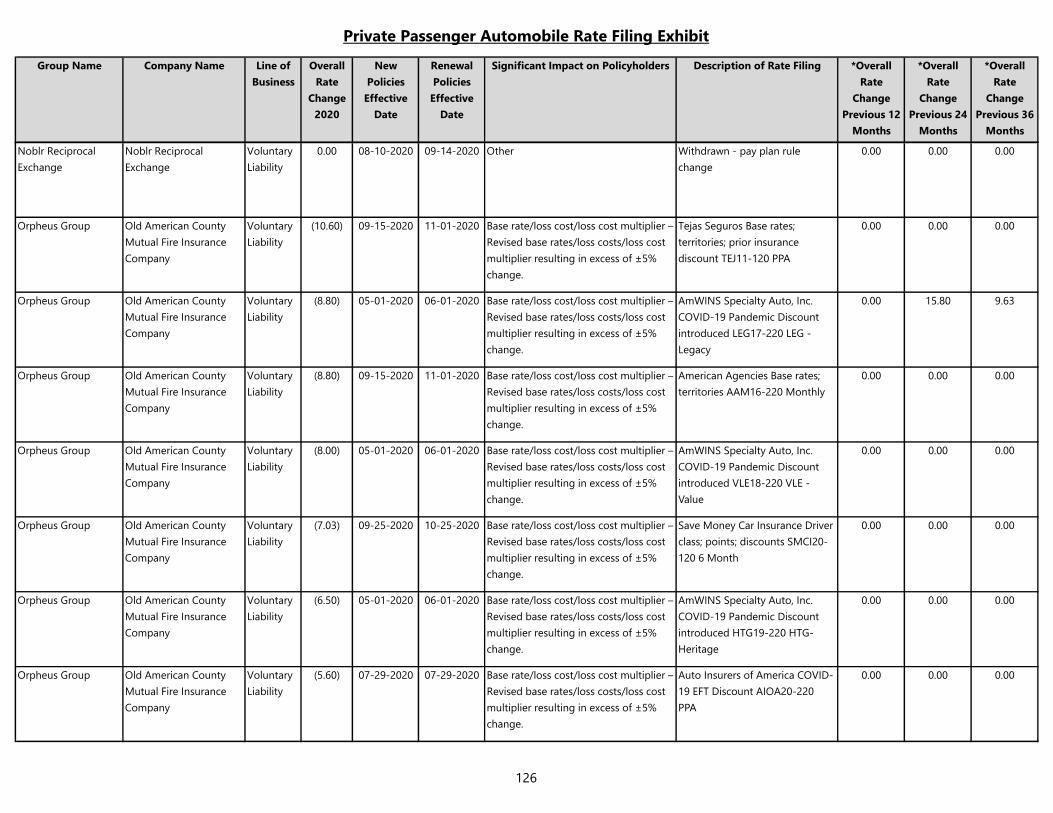
Private Passenger Automobile Rate Filing Exhibit
Group Name Company Name Line of
Business
Overall
Rate
Change
2020
New
Policies
Effective
Date
Renewal
Policies
Effective
Date
Significant Impact on Policyholders Description of Rate Filing *Overall
Rate
Change
Previous 12
Months
*Overall
Rate
Change
Previous 24
Months
*Overall
Rate
Change
Previous 36
Months
Noblr Reciprocal
Exchange
Noblr Reciprocal
Exchange
Voluntary
Liability
0.00 08-10-2020 09-14-2020 Other Withdrawn - pay plan rule
change
0.00 0.00 0.00
Orpheus Group Old American County
Mutual Fire Insurance
Company
Voluntary
Liability
(10.60) 09-15-2020 11-01-2020 Base rate/loss cost/loss cost multiplier –
Revised base rates/loss costs/loss cost
multiplier resulting in excess of ±5%
change.
Tejas Seguros Base rates;
territories; prior insurance
discount TEJ11-120 PPA
0.00 0.00 0.00
Orpheus Group Old American County
Mutual Fire Insurance
Company
Voluntary
Liability
(8.80) 05-01-2020 06-01-2020 Base rate/loss cost/loss cost multiplier –
Revised base rates/loss costs/loss cost
multiplier resulting in excess of ±5%
change.
AmWINS Specialty Auto, Inc.
COVID-19 Pandemic Discount
introduced LEG17-220 LEG -
Legacy
0.00 15.80 9.63
Orpheus Group Old American County
Mutual Fire Insurance
Company
Voluntary
Liability
(8.80) 09-15-2020 11-01-2020 Base rate/loss cost/loss cost multiplier –
Revised base rates/loss costs/loss cost
multiplier resulting in excess of ±5%
change.
American Agencies Base rates;
territories AAM16-220 Monthly
0.00 0.00 0.00
Orpheus Group Old American County
Mutual Fire Insurance
Company
Voluntary
Liability
(8.00) 05-01-2020 06-01-2020 Base rate/loss cost/loss cost multiplier –
Revised base rates/loss costs/loss cost
multiplier resulting in excess of ±5%
change.
AmWINS Specialty Auto, Inc.
COVID-19 Pandemic Discount
introduced VLE18-220 VLE -
Value
0.00 0.00 0.00
Orpheus Group Old American County
Mutual Fire Insurance
Company
Voluntary
Liability
(7.03) 09-25-2020 10-25-2020 Base rate/loss cost/loss cost multiplier –
Revised base rates/loss costs/loss cost
multiplier resulting in excess of ±5%
change.
Save Money Car Insurance Driver
class; points; discounts SMCI20-
120 6 Month
0.00 0.00 0.00
Orpheus Group Old American County
Mutual Fire Insurance
Company
Voluntary
Liability
(6.50) 05-01-2020 06-01-2020 Base rate/loss cost/loss cost multiplier –
Revised base rates/loss costs/loss cost
multiplier resulting in excess of ±5%
change.
AmWINS Specialty Auto, Inc.
COVID-19 Pandemic Discount
introduced HTG19-220 HTG-
Heritage
0.00 0.00 0.00
Orpheus Group Old American County
Mutual Fire Insurance
Company
Voluntary
Liability
(5.60) 07-29-2020 07-29-2020 Base rate/loss cost/loss cost multiplier –
Revised base rates/loss costs/loss cost
multiplier resulting in excess of ±5%
change.
Auto Insurers of America COVID-
19 EFT Discount AIOA20-220
PPA
0.00 0.00 0.00
126
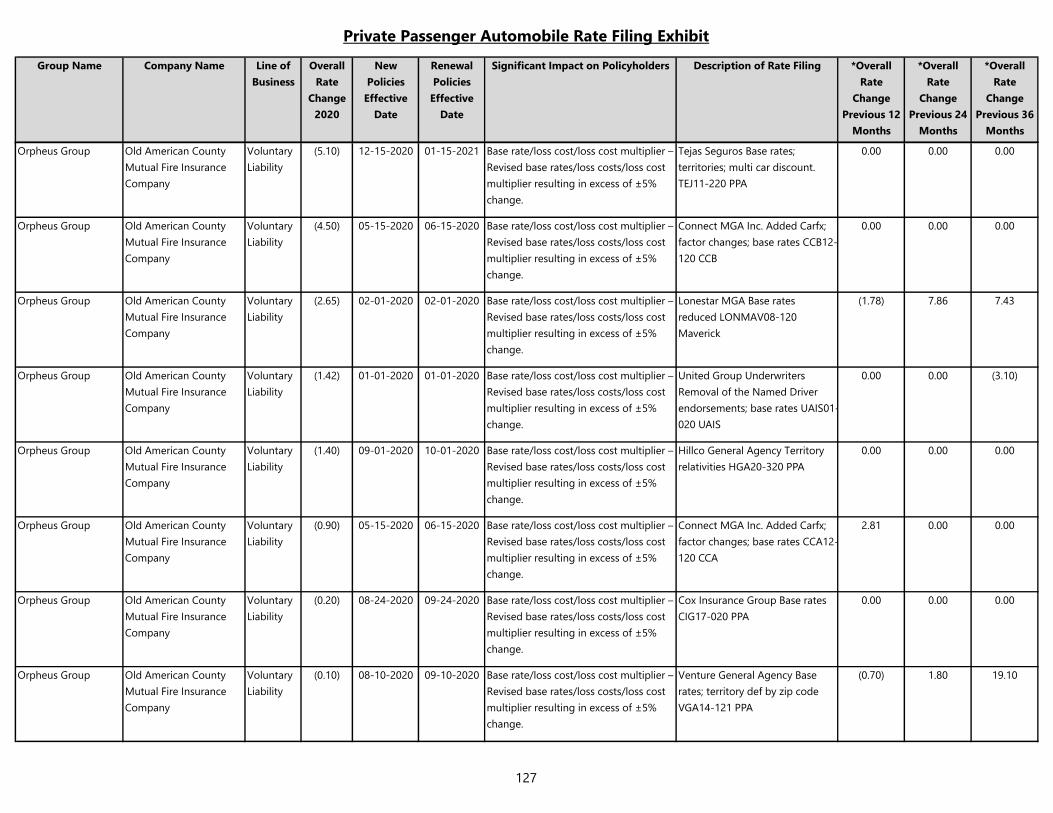
Private Passenger Automobile Rate Filing Exhibit
Group Name Company Name Line of
Business
Overall
Rate
Change
2020
New
Policies
Effective
Date
Renewal
Policies
Effective
Date
Significant Impact on Policyholders Description of Rate Filing *Overall
Rate
Change
Previous 12
Months
*Overall
Rate
Change
Previous 24
Months
*Overall
Rate
Change
Previous 36
Months
Orpheus Group Old American County
Mutual Fire Insurance
Company
Voluntary
Liability
(5.10) 12-15-2020 01-15-2021 Base rate/loss cost/loss cost multiplier –
Revised base rates/loss costs/loss cost
multiplier resulting in excess of ±5%
change.
Tejas Seguros Base rates;
territories; multi car discount.
TEJ11-220 PPA
0.00 0.00 0.00
Orpheus Group Old American County
Mutual Fire Insurance
Company
Voluntary
Liability
(4.50) 05-15-2020 06-15-2020 Base rate/loss cost/loss cost multiplier –
Revised base rates/loss costs/loss cost
multiplier resulting in excess of ±5%
change.
Connect MGA Inc. Added Carfx;
factor changes; base rates CCB12-
120 CCB
0.00 0.00 0.00
Orpheus Group Old American County
Mutual Fire Insurance
Company
Voluntary
Liability
(2.65) 02-01-2020 02-01-2020 Base rate/loss cost/loss cost multiplier –
Revised base rates/loss costs/loss cost
multiplier resulting in excess of ±5%
change.
Lonestar MGA Base rates
reduced LONMAV08-120
Maverick
(1.78) 7.86 7.43
Orpheus Group Old American County
Mutual Fire Insurance
Company
Voluntary
Liability
(1.42) 01-01-2020 01-01-2020 Base rate/loss cost/loss cost multiplier –
Revised base rates/loss costs/loss cost
multiplier resulting in excess of ±5%
change.
United Group Underwriters
Removal of the Named Driver
endorsements; base rates UAIS01-
020 UAIS
0.00 0.00 (3.10)
Orpheus Group Old American County
Mutual Fire Insurance
Company
Voluntary
Liability
(1.40) 09-01-2020 10-01-2020 Base rate/loss cost/loss cost multiplier –
Revised base rates/loss costs/loss cost
multiplier resulting in excess of ±5%
change.
Hillco General Agency Territory
relativities HGA20-320 PPA
0.00 0.00 0.00
Orpheus Group Old American County
Mutual Fire Insurance
Company
Voluntary
Liability
(0.90) 05-15-2020 06-15-2020 Base rate/loss cost/loss cost multiplier –
Revised base rates/loss costs/loss cost
multiplier resulting in excess of ±5%
change.
Connect MGA Inc. Added Carfx;
factor changes; base rates CCA12-
120 CCA
2.81 0.00 0.00
Orpheus Group Old American County
Mutual Fire Insurance
Company
Voluntary
Liability
(0.20) 08-24-2020 09-24-2020 Base rate/loss cost/loss cost multiplier –
Revised base rates/loss costs/loss cost
multiplier resulting in excess of ±5%
change.
Cox Insurance Group Base rates
CIG17-020 PPA
0.00 0.00 0.00
Orpheus Group Old American County
Mutual Fire Insurance
Company
Voluntary
Liability
(0.10) 08-10-2020 09-10-2020 Base rate/loss cost/loss cost multiplier –
Revised base rates/loss costs/loss cost
multiplier resulting in excess of ±5%
change.
Venture General Agency Base
rates; territory def by zip code
VGA14-121 PPA
(0.70) 1.80 19.10
127
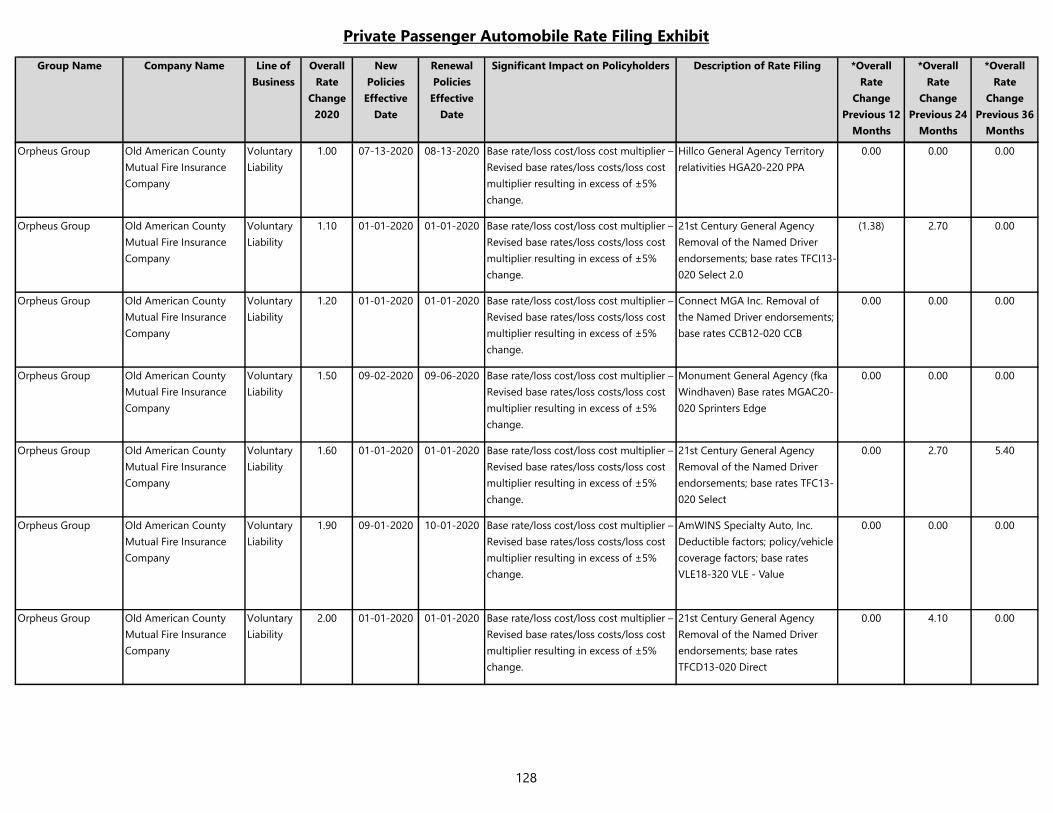
Private Passenger Automobile Rate Filing Exhibit
Group Name Company Name Line of
Business
Overall
Rate
Change
2020
New
Policies
Effective
Date
Renewal
Policies
Effective
Date
Significant Impact on Policyholders Description of Rate Filing *Overall
Rate
Change
Previous 12
Months
*Overall
Rate
Change
Previous 24
Months
*Overall
Rate
Change
Previous 36
Months
Orpheus Group Old American County
Mutual Fire Insurance
Company
Voluntary
Liability
1.00 07-13-2020 08-13-2020 Base rate/loss cost/loss cost multiplier –
Revised base rates/loss costs/loss cost
multiplier resulting in excess of ±5%
change.
Hillco General Agency Territory
relativities HGA20-220 PPA
0.00 0.00 0.00
Orpheus Group Old American County
Mutual Fire Insurance
Company
Voluntary
Liability
1.10 01-01-2020 01-01-2020 Base rate/loss cost/loss cost multiplier –
Revised base rates/loss costs/loss cost
multiplier resulting in excess of ±5%
change.
21st Century General Agency
Removal of the Named Driver
endorsements; base rates TFCI13-
020 Select 2.0
(1.38) 2.70 0.00
Orpheus Group Old American County
Mutual Fire Insurance
Company
Voluntary
Liability
1.20 01-01-2020 01-01-2020 Base rate/loss cost/loss cost multiplier –
Revised base rates/loss costs/loss cost
multiplier resulting in excess of ±5%
change.
Connect MGA Inc. Removal of
the Named Driver endorsements;
base rates CCB12-020 CCB
0.00 0.00 0.00
Orpheus Group Old American County
Mutual Fire Insurance
Company
Voluntary
Liability
1.50 09-02-2020 09-06-2020 Base rate/loss cost/loss cost multiplier –
Revised base rates/loss costs/loss cost
multiplier resulting in excess of ±5%
change.
Monument General Agency (fka
Windhaven) Base rates MGAC20-
020 Sprinters Edge
0.00 0.00 0.00
Orpheus Group Old American County
Mutual Fire Insurance
Company
Voluntary
Liability
1.60 01-01-2020 01-01-2020 Base rate/loss cost/loss cost multiplier –
Revised base rates/loss costs/loss cost
multiplier resulting in excess of ±5%
change.
21st Century General Agency
Removal of the Named Driver
endorsements; base rates TFC13-
020 Select
0.00 2.70 5.40
Orpheus Group Old American County
Mutual Fire Insurance
Company
Voluntary
Liability
1.90 09-01-2020 10-01-2020 Base rate/loss cost/loss cost multiplier –
Revised base rates/loss costs/loss cost
multiplier resulting in excess of ±5%
change.
AmWINS Specialty Auto, Inc.
Deductible factors; policy/vehicle
coverage factors; base rates
VLE18-320 VLE - Value
0.00 0.00 0.00
Orpheus Group Old American County
Mutual Fire Insurance
Company
Voluntary
Liability
2.00 01-01-2020 01-01-2020 Base rate/loss cost/loss cost multiplier –
Revised base rates/loss costs/loss cost
multiplier resulting in excess of ±5%
change.
21st Century General Agency
Removal of the Named Driver
endorsements; base rates
TFCD13-020 Direct
0.00 4.10 0.00
128
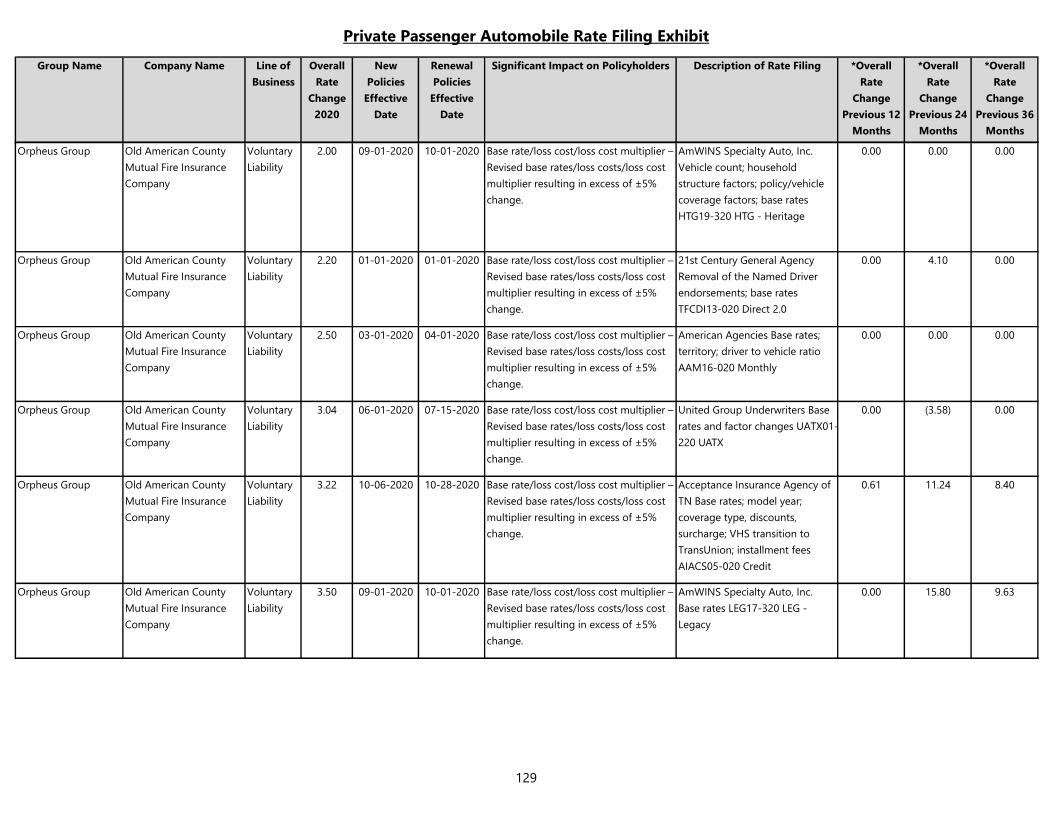
Private Passenger Automobile Rate Filing Exhibit
Group Name Company Name Line of
Business
Overall
Rate
Change
2020
New
Policies
Effective
Date
Renewal
Policies
Effective
Date
Significant Impact on Policyholders Description of Rate Filing *Overall
Rate
Change
Previous 12
Months
*Overall
Rate
Change
Previous 24
Months
*Overall
Rate
Change
Previous 36
Months
Orpheus Group Old American County
Mutual Fire Insurance
Company
Voluntary
Liability
2.00 09-01-2020 10-01-2020 Base rate/loss cost/loss cost multiplier –
Revised base rates/loss costs/loss cost
multiplier resulting in excess of ±5%
change.
AmWINS Specialty Auto, Inc.
Vehicle count; household
structure factors; policy/vehicle
coverage factors; base rates
HTG19-320 HTG - Heritage
0.00 0.00 0.00
Orpheus Group Old American County
Mutual Fire Insurance
Company
Voluntary
Liability
2.20 01-01-2020 01-01-2020 Base rate/loss cost/loss cost multiplier –
Revised base rates/loss costs/loss cost
multiplier resulting in excess of ±5%
change.
21st Century General Agency
Removal of the Named Driver
endorsements; base rates
TFCDI13-020 Direct 2.0
0.00 4.10 0.00
Orpheus Group Old American County
Mutual Fire Insurance
Company
Voluntary
Liability
2.50 03-01-2020 04-01-2020 Base rate/loss cost/loss cost multiplier –
Revised base rates/loss costs/loss cost
multiplier resulting in excess of ±5%
change.
American Agencies Base rates;
territory; driver to vehicle ratio
AAM16-020 Monthly
0.00 0.00 0.00
Orpheus Group Old American County
Mutual Fire Insurance
Company
Voluntary
Liability
3.04 06-01-2020 07-15-2020 Base rate/loss cost/loss cost multiplier –
Revised base rates/loss costs/loss cost
multiplier resulting in excess of ±5%
change.
United Group Underwriters Base
rates and factor changes UATX01-
220 UATX
0.00 (3.58) 0.00
Orpheus Group Old American County
Mutual Fire Insurance
Company
Voluntary
Liability
3.22 10-06-2020 10-28-2020 Base rate/loss cost/loss cost multiplier –
Revised base rates/loss costs/loss cost
multiplier resulting in excess of ±5%
change.
Acceptance Insurance Agency of
TN Base rates; model year;
coverage type, discounts,
surcharge; VHS transition to
TransUnion; installment fees
AIACS05-020 Credit
0.61 11.24 8.40
Orpheus Group Old American County
Mutual Fire Insurance
Company
Voluntary
Liability
3.50 09-01-2020 10-01-2020 Base rate/loss cost/loss cost multiplier –
Revised base rates/loss costs/loss cost
multiplier resulting in excess of ±5%
change.
AmWINS Specialty Auto, Inc.
Base rates LEG17-320 LEG -
Legacy
0.00 15.80 9.63
129
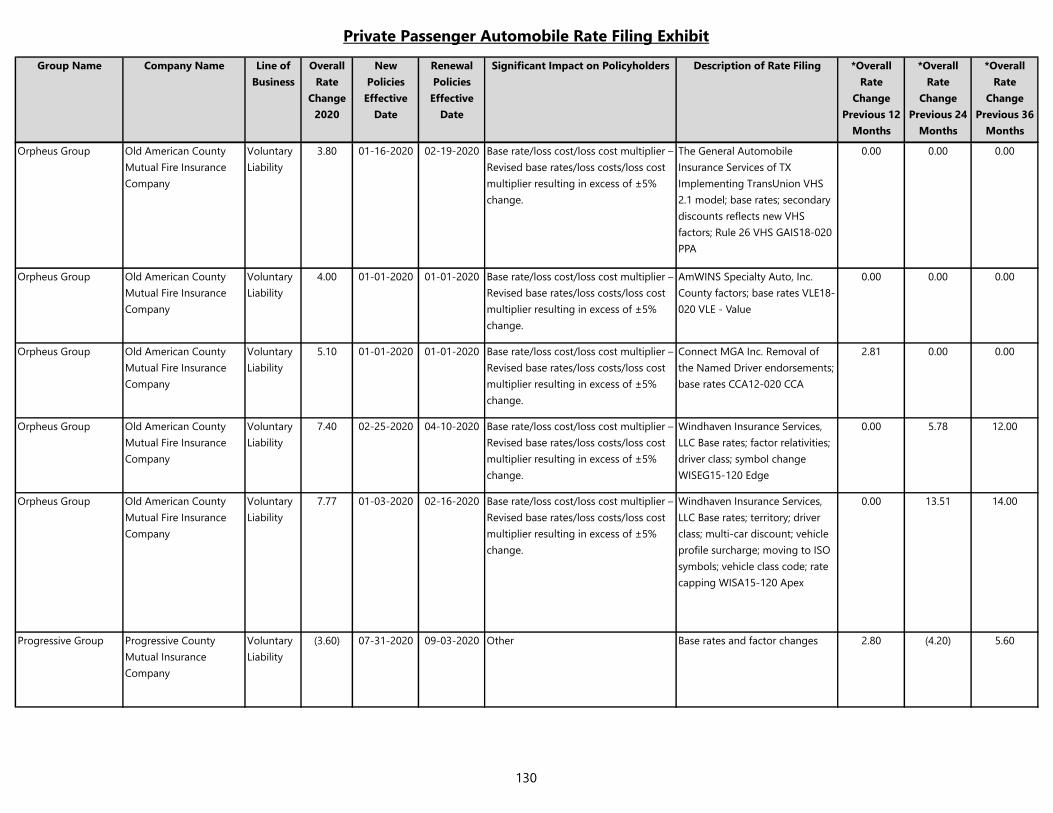
Private Passenger Automobile Rate Filing Exhibit
Group Name Company Name Line of
Business
Overall
Rate
Change
2020
New
Policies
Effective
Date
Renewal
Policies
Effective
Date
Significant Impact on Policyholders Description of Rate Filing *Overall
Rate
Change
Previous 12
Months
*Overall
Rate
Change
Previous 24
Months
*Overall
Rate
Change
Previous 36
Months
Orpheus Group Old American County
Mutual Fire Insurance
Company
Voluntary
Liability
3.80 01-16-2020 02-19-2020 Base rate/loss cost/loss cost multiplier –
Revised base rates/loss costs/loss cost
multiplier resulting in excess of ±5%
change.
The General Automobile
Insurance Services of TX
Implementing TransUnion VHS
2.1 model; base rates; secondary
discounts reflects new VHS
factors; Rule 26 VHS GAIS18-020
PPA
0.00 0.00 0.00
Orpheus Group Old American County
Mutual Fire Insurance
Company
Voluntary
Liability
4.00 01-01-2020 01-01-2020 Base rate/loss cost/loss cost multiplier –
Revised base rates/loss costs/loss cost
multiplier resulting in excess of ±5%
change.
AmWINS Specialty Auto, Inc.
County factors; base rates VLE18-
020 VLE - Value
0.00 0.00 0.00
Orpheus Group Old American County
Mutual Fire Insurance
Company
Voluntary
Liability
5.10 01-01-2020 01-01-2020 Base rate/loss cost/loss cost multiplier –
Revised base rates/loss costs/loss cost
multiplier resulting in excess of ±5%
change.
Connect MGA Inc. Removal of
the Named Driver endorsements;
base rates CCA12-020 CCA
2.81 0.00 0.00
Orpheus Group Old American County
Mutual Fire Insurance
Company
Voluntary
Liability
7.40 02-25-2020 04-10-2020 Base rate/loss cost/loss cost multiplier –
Revised base rates/loss costs/loss cost
multiplier resulting in excess of ±5%
change.
Windhaven Insurance Services,
LLC Base rates; factor relativities;
driver class; symbol change
WISEG15-120 Edge
0.00 5.78 12.00
Orpheus Group Old American County
Mutual Fire Insurance
Company
Voluntary
Liability
7.77 01-03-2020 02-16-2020 Base rate/loss cost/loss cost multiplier –
Revised base rates/loss costs/loss cost
multiplier resulting in excess of ±5%
change.
Windhaven Insurance Services,
LLC Base rates; territory; driver
class; multi-car discount; vehicle
profile surcharge; moving to ISO
symbols; vehicle class code; rate
capping WISA15-120 Apex
0.00 13.51 14.00
Progressive Group Progressive County
Mutual Insurance
Company
Voluntary
Liability
(3.60) 07-31-2020 09-03-2020 Other Base rates and factor changes 2.80 (4.20) 5.60
130
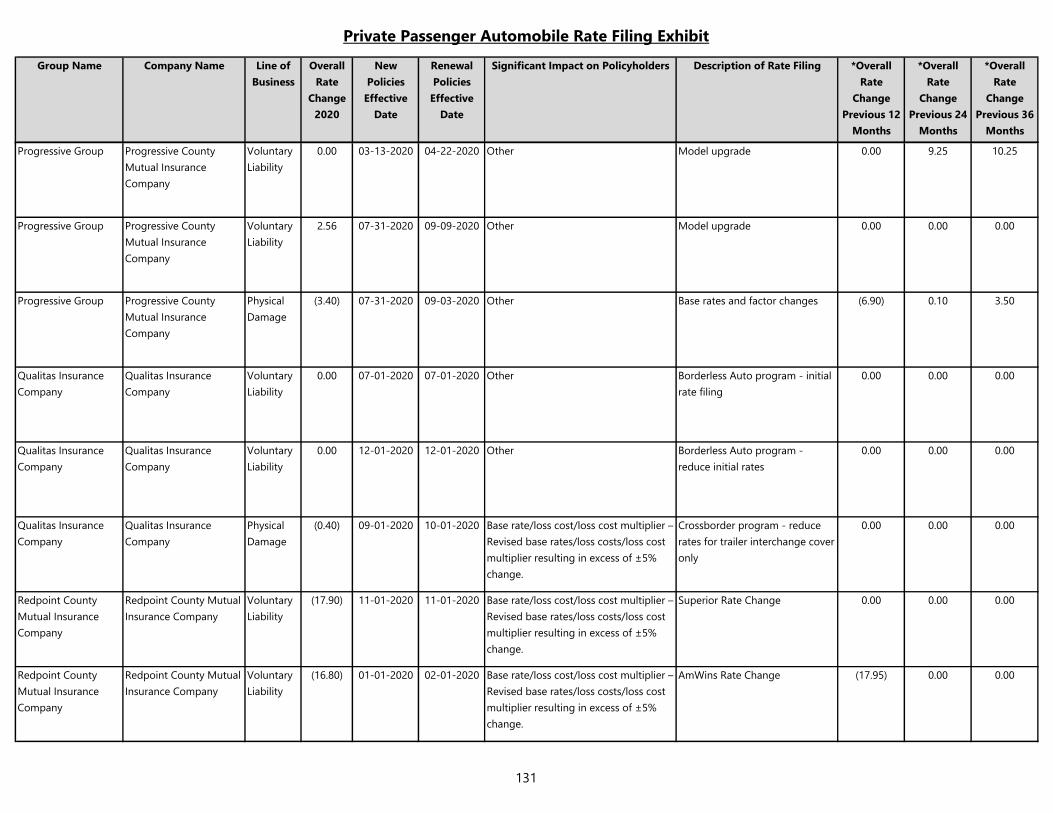
Private Passenger Automobile Rate Filing Exhibit
Group Name Company Name Line of
Business
Overall
Rate
Change
2020
New
Policies
Effective
Date
Renewal
Policies
Effective
Date
Significant Impact on Policyholders Description of Rate Filing *Overall
Rate
Change
Previous 12
Months
*Overall
Rate
Change
Previous 24
Months
*Overall
Rate
Change
Previous 36
Months
Progressive Group Progressive County
Mutual Insurance
Company
Voluntary
Liability
0.00 03-13-2020 04-22-2020 Other Model upgrade 0.00 9.25 10.25
Progressive Group Progressive County
Mutual Insurance
Company
Voluntary
Liability
2.56 07-31-2020 09-09-2020 Other Model upgrade 0.00 0.00 0.00
Progressive Group Progressive County
Mutual Insurance
Company
Physical
Damage
(3.40) 07-31-2020 09-03-2020 Other Base rates and factor changes (6.90) 0.10 3.50
Qualitas Insurance
Company
Qualitas Insurance
Company
Voluntary
Liability
0.00 07-01-2020 07-01-2020 Other Borderless Auto program - initial
rate filing
0.00 0.00 0.00
Qualitas Insurance
Company
Qualitas Insurance
Company
Voluntary
Liability
0.00 12-01-2020 12-01-2020 Other Borderless Auto program -
reduce initial rates
0.00 0.00 0.00
Qualitas Insurance
Company
Qualitas Insurance
Company
Physical
Damage
(0.40) 09-01-2020 10-01-2020 Base rate/loss cost/loss cost multiplier –
Revised base rates/loss costs/loss cost
multiplier resulting in excess of ±5%
change.
Crossborder program - reduce
rates for trailer interchange cover
only
0.00 0.00 0.00
Redpoint County
Mutual Insurance
Company
Redpoint County Mutual
Insurance Company
Voluntary
Liability
(17.90) 11-01-2020 11-01-2020 Base rate/loss cost/loss cost multiplier –
Revised base rates/loss costs/loss cost
multiplier resulting in excess of ±5%
change.
Superior Rate Change 0.00 0.00 0.00
Redpoint County
Mutual Insurance
Company
Redpoint County Mutual
Insurance Company
Voluntary
Liability
(16.80) 01-01-2020 02-01-2020 Base rate/loss cost/loss cost multiplier –
Revised base rates/loss costs/loss cost
multiplier resulting in excess of ±5%
change.
AmWins Rate Change (17.95) 0.00 0.00
131
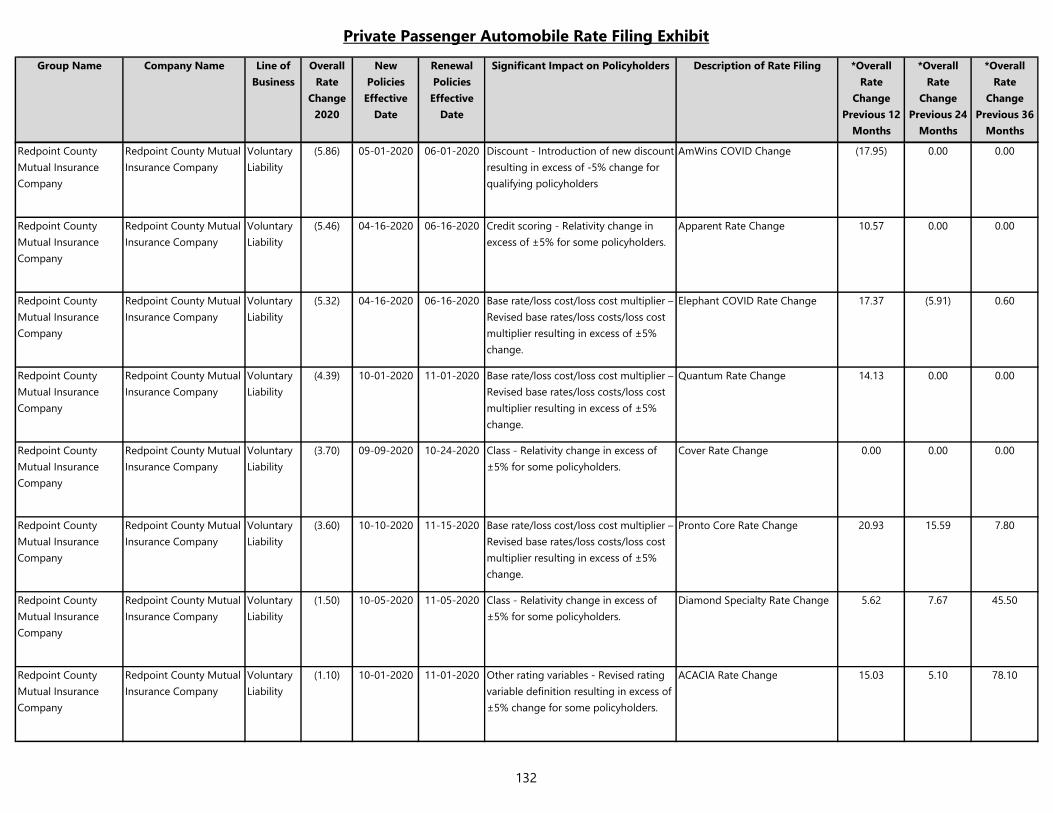
Private Passenger Automobile Rate Filing Exhibit
Group Name Company Name Line of
Business
Overall
Rate
Change
2020
New
Policies
Effective
Date
Renewal
Policies
Effective
Date
Significant Impact on Policyholders Description of Rate Filing *Overall
Rate
Change
Previous 12
Months
*Overall
Rate
Change
Previous 24
Months
*Overall
Rate
Change
Previous 36
Months
Redpoint County
Mutual Insurance
Company
Redpoint County Mutual
Insurance Company
Voluntary
Liability
(5.86) 05-01-2020 06-01-2020 Discount - Introduction of new discount
resulting in excess of -5% change for
qualifying policyholders
AmWins COVID Change (17.95) 0.00 0.00
Redpoint County
Mutual Insurance
Company
Redpoint County Mutual
Insurance Company
Voluntary
Liability
(5.46) 04-16-2020 06-16-2020 Credit scoring - Relativity change in
excess of ±5% for some policyholders.
Apparent Rate Change 10.57 0.00 0.00
Redpoint County
Mutual Insurance
Company
Redpoint County Mutual
Insurance Company
Voluntary
Liability
(5.32) 04-16-2020 06-16-2020 Base rate/loss cost/loss cost multiplier –
Revised base rates/loss costs/loss cost
multiplier resulting in excess of ±5%
change.
Elephant COVID Rate Change 17.37 (5.91) 0.60
Redpoint County
Mutual Insurance
Company
Redpoint County Mutual
Insurance Company
Voluntary
Liability
(4.39) 10-01-2020 11-01-2020 Base rate/loss cost/loss cost multiplier –
Revised base rates/loss costs/loss cost
multiplier resulting in excess of ±5%
change.
Quantum Rate Change 14.13 0.00 0.00
Redpoint County
Mutual Insurance
Company
Redpoint County Mutual
Insurance Company
Voluntary
Liability
(3.70) 09-09-2020 10-24-2020 Class - Relativity change in excess of
±5% for some policyholders.
Cover Rate Change 0.00 0.00 0.00
Redpoint County
Mutual Insurance
Company
Redpoint County Mutual
Insurance Company
Voluntary
Liability
(3.60) 10-10-2020 11-15-2020 Base rate/loss cost/loss cost multiplier –
Revised base rates/loss costs/loss cost
multiplier resulting in excess of ±5%
change.
Pronto Core Rate Change 20.93 15.59 7.80
Redpoint County
Mutual Insurance
Company
Redpoint County Mutual
Insurance Company
Voluntary
Liability
(1.50) 10-05-2020 11-05-2020 Class - Relativity change in excess of
±5% for some policyholders.
Diamond Specialty Rate Change 5.62 7.67 45.50
Redpoint County
Mutual Insurance
Company
Redpoint County Mutual
Insurance Company
Voluntary
Liability
(1.10) 10-01-2020 11-01-2020 Other rating variables - Revised rating
variable definition resulting in excess of
±5% change for some policyholders.
ACACIA Rate Change 15.03 5.10 78.10
132
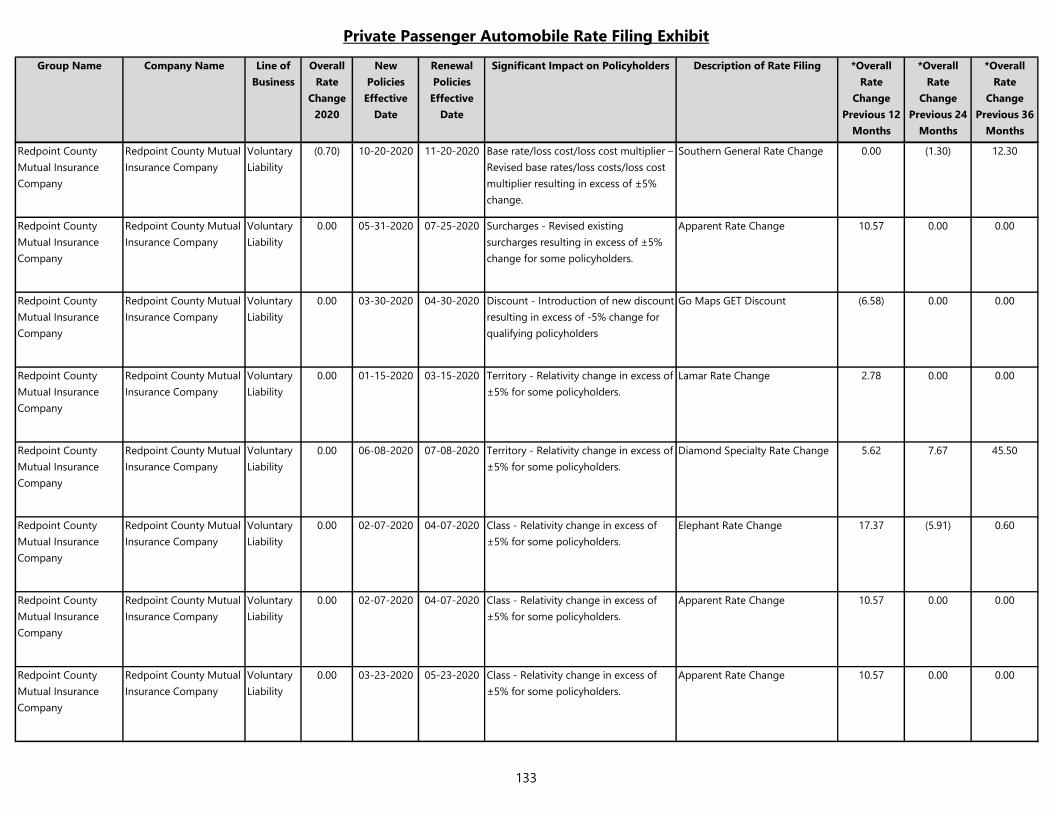
Private Passenger Automobile Rate Filing Exhibit
Group Name Company Name Line of
Business
Overall
Rate
Change
2020
New
Policies
Effective
Date
Renewal
Policies
Effective
Date
Significant Impact on Policyholders Description of Rate Filing *Overall
Rate
Change
Previous 12
Months
*Overall
Rate
Change
Previous 24
Months
*Overall
Rate
Change
Previous 36
Months
Redpoint County
Mutual Insurance
Company
Redpoint County Mutual
Insurance Company
Voluntary
Liability
(0.70) 10-20-2020 11-20-2020 Base rate/loss cost/loss cost multiplier –
Revised base rates/loss costs/loss cost
multiplier resulting in excess of ±5%
change.
Southern General Rate Change 0.00 (1.30) 12.30
Redpoint County
Mutual Insurance
Company
Redpoint County Mutual
Insurance Company
Voluntary
Liability
0.00 05-31-2020 07-25-2020 Surcharges - Revised existing
surcharges resulting in excess of ±5%
change for some policyholders.
Apparent Rate Change 10.57 0.00 0.00
Redpoint County
Mutual Insurance
Company
Redpoint County Mutual
Insurance Company
Voluntary
Liability
0.00 03-30-2020 04-30-2020 Discount - Introduction of new discount
resulting in excess of -5% change for
qualifying policyholders
Go Maps GET Discount (6.58) 0.00 0.00
Redpoint County
Mutual Insurance
Company
Redpoint County Mutual
Insurance Company
Voluntary
Liability
0.00 01-15-2020 03-15-2020 Territory - Relativity change in excess of
±5% for some policyholders.
Lamar Rate Change 2.78 0.00 0.00
Redpoint County
Mutual Insurance
Company
Redpoint County Mutual
Insurance Company
Voluntary
Liability
0.00 06-08-2020 07-08-2020 Territory - Relativity change in excess of
±5% for some policyholders.
Diamond Specialty Rate Change 5.62 7.67 45.50
Redpoint County
Mutual Insurance
Company
Redpoint County Mutual
Insurance Company
Voluntary
Liability
0.00 02-07-2020 04-07-2020 Class - Relativity change in excess of
±5% for some policyholders.
Elephant Rate Change 17.37 (5.91) 0.60
Redpoint County
Mutual Insurance
Company
Redpoint County Mutual
Insurance Company
Voluntary
Liability
0.00 02-07-2020 04-07-2020 Class - Relativity change in excess of
±5% for some policyholders.
Apparent Rate Change 10.57 0.00 0.00
Redpoint County
Mutual Insurance
Company
Redpoint County Mutual
Insurance Company
Voluntary
Liability
0.00 03-23-2020 05-23-2020 Class - Relativity change in excess of
±5% for some policyholders.
Apparent Rate Change 10.57 0.00 0.00
133

Private Passenger Automobile Rate Filing Exhibit
Group Name Company Name Line of
Business
Overall
Rate
Change
2020
New
Policies
Effective
Date
Renewal
Policies
Effective
Date
Significant Impact on Policyholders Description of Rate Filing *Overall
Rate
Change
Previous 12
Months
*Overall
Rate
Change
Previous 24
Months
*Overall
Rate
Change
Previous 36
Months
Redpoint County
Mutual Insurance
Company
Redpoint County Mutual
Insurance Company
Voluntary
Liability
0.00 02-27-2020 02-27-2020 Other Ready Initial Filing 0.00 0.00 0.00
Redpoint County
Mutual Insurance
Company
Redpoint County Mutual
Insurance Company
Voluntary
Liability
0.00 04-01-2020 05-01-2021 Other AmWins Rate Change (17.95) 0.00 0.00
Redpoint County
Mutual Insurance
Company
Redpoint County Mutual
Insurance Company
Voluntary
Liability
0.00 03-23-2020 05-23-2020 Other Elephant Rate Change 17.37 (5.91) 0.60
Redpoint County
Mutual Insurance
Company
Redpoint County Mutual
Insurance Company
Voluntary
Liability
0.00 07-20-2020 07-20-2020 Other Go Maps GET Discount Removal (6.58) 0.00 0.00
Redpoint County
Mutual Insurance
Company
Redpoint County Mutual
Insurance Company
Voluntary
Liability
0.00 08-03-2020 08-03-2020 Other Superior Initial Filing 0.00 0.00 0.00
Redpoint County
Mutual Insurance
Company
Redpoint County Mutual
Insurance Company
Voluntary
Liability
0.00 08-15-2020 08-15-2020 Other Constitution Initial Filing 0.00 0.00 0.00
Redpoint County
Mutual Insurance
Company
Redpoint County Mutual
Insurance Company
Voluntary
Liability
0.00 06-17-2020 08-17-2020 Other Apparent Rate Change 10.57 0.00 0.00
Redpoint County
Mutual Insurance
Company
Redpoint County Mutual
Insurance Company
Voluntary
Liability
0.00 08-01-2020 09-01-2020 Other ACACIA Rate Order Change 15.03 5.10 78.10
134
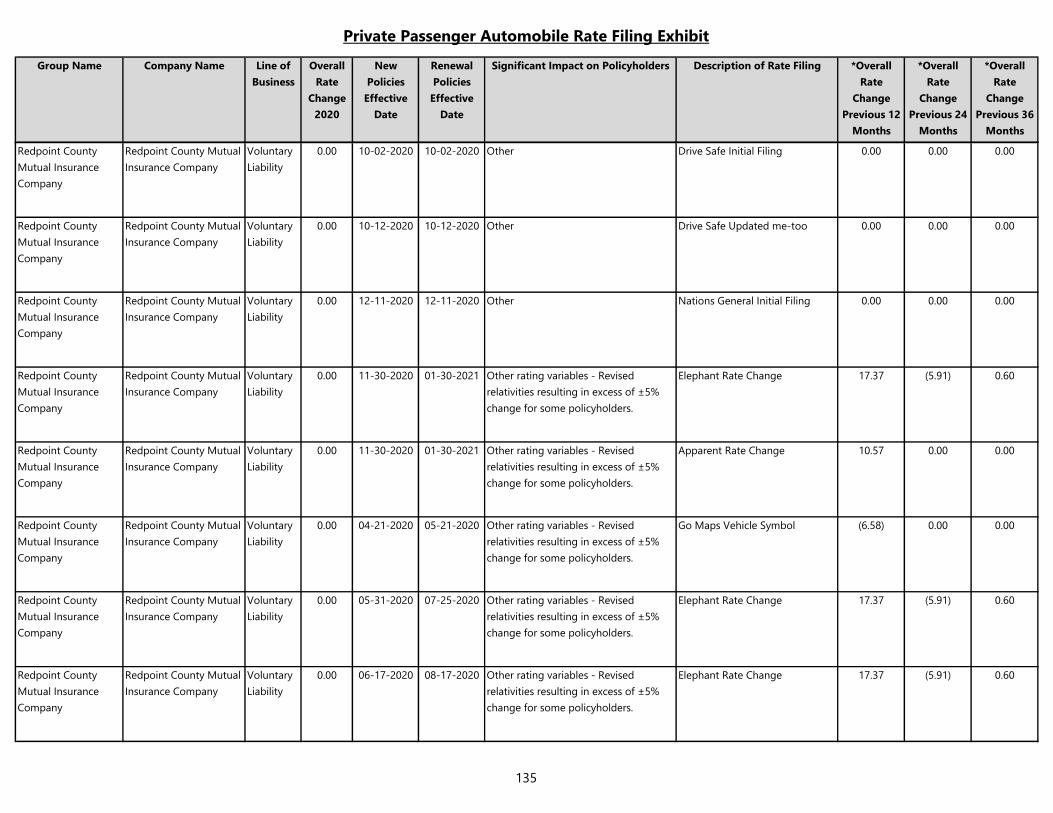
Private Passenger Automobile Rate Filing Exhibit
Group Name Company Name Line of
Business
Overall
Rate
Change
2020
New
Policies
Effective
Date
Renewal
Policies
Effective
Date
Significant Impact on Policyholders Description of Rate Filing *Overall
Rate
Change
Previous 12
Months
*Overall
Rate
Change
Previous 24
Months
*Overall
Rate
Change
Previous 36
Months
Redpoint County
Mutual Insurance
Company
Redpoint County Mutual
Insurance Company
Voluntary
Liability
0.00 10-02-2020 10-02-2020 Other Drive Safe Initial Filing 0.00 0.00 0.00
Redpoint County
Mutual Insurance
Company
Redpoint County Mutual
Insurance Company
Voluntary
Liability
0.00 10-12-2020 10-12-2020 Other Drive Safe Updated me-too 0.00 0.00 0.00
Redpoint County
Mutual Insurance
Company
Redpoint County Mutual
Insurance Company
Voluntary
Liability
0.00 12-11-2020 12-11-2020 Other Nations General Initial Filing 0.00 0.00 0.00
Redpoint County
Mutual Insurance
Company
Redpoint County Mutual
Insurance Company
Voluntary
Liability
0.00 11-30-2020 01-30-2021 Other rating variables - Revised
relativities resulting in excess of ±5%
change for some policyholders.
Elephant Rate Change 17.37 (5.91) 0.60
Redpoint County
Mutual Insurance
Company
Redpoint County Mutual
Insurance Company
Voluntary
Liability
0.00 11-30-2020 01-30-2021 Other rating variables - Revised
relativities resulting in excess of ±5%
change for some policyholders.
Apparent Rate Change 10.57 0.00 0.00
Redpoint County
Mutual Insurance
Company
Redpoint County Mutual
Insurance Company
Voluntary
Liability
0.00 04-21-2020 05-21-2020 Other rating variables - Revised
relativities resulting in excess of ±5%
change for some policyholders.
Go Maps Vehicle Symbol (6.58) 0.00 0.00
Redpoint County
Mutual Insurance
Company
Redpoint County Mutual
Insurance Company
Voluntary
Liability
0.00 05-31-2020 07-25-2020 Other rating variables - Revised
relativities resulting in excess of ±5%
change for some policyholders.
Elephant Rate Change 17.37 (5.91) 0.60
Redpoint County
Mutual Insurance
Company
Redpoint County Mutual
Insurance Company
Voluntary
Liability
0.00 06-17-2020 08-17-2020 Other rating variables - Revised
relativities resulting in excess of ±5%
change for some policyholders.
Elephant Rate Change 17.37 (5.91) 0.60
135
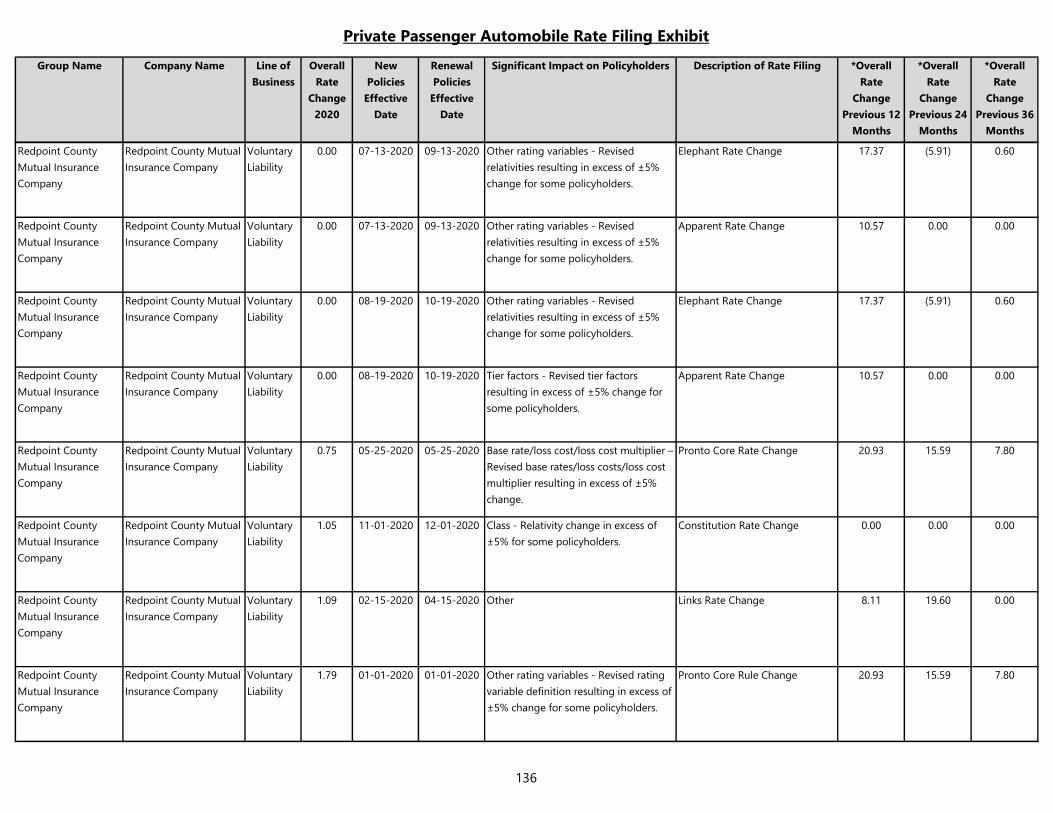
Private Passenger Automobile Rate Filing Exhibit
Group Name Company Name Line of
Business
Overall
Rate
Change
2020
New
Policies
Effective
Date
Renewal
Policies
Effective
Date
Significant Impact on Policyholders Description of Rate Filing *Overall
Rate
Change
Previous 12
Months
*Overall
Rate
Change
Previous 24
Months
*Overall
Rate
Change
Previous 36
Months
Redpoint County
Mutual Insurance
Company
Redpoint County Mutual
Insurance Company
Voluntary
Liability
0.00 07-13-2020 09-13-2020 Other rating variables - Revised
relativities resulting in excess of ±5%
change for some policyholders.
Elephant Rate Change 17.37 (5.91) 0.60
Redpoint County
Mutual Insurance
Company
Redpoint County Mutual
Insurance Company
Voluntary
Liability
0.00 07-13-2020 09-13-2020 Other rating variables - Revised
relativities resulting in excess of ±5%
change for some policyholders.
Apparent Rate Change 10.57 0.00 0.00
Redpoint County
Mutual Insurance
Company
Redpoint County Mutual
Insurance Company
Voluntary
Liability
0.00 08-19-2020 10-19-2020 Other rating variables - Revised
relativities resulting in excess of ±5%
change for some policyholders.
Elephant Rate Change 17.37 (5.91) 0.60
Redpoint County
Mutual Insurance
Company
Redpoint County Mutual
Insurance Company
Voluntary
Liability
0.00 08-19-2020 10-19-2020 Tier factors - Revised tier factors
resulting in excess of ±5% change for
some policyholders.
Apparent Rate Change 10.57 0.00 0.00
Redpoint County
Mutual Insurance
Company
Redpoint County Mutual
Insurance Company
Voluntary
Liability
0.75 05-25-2020 05-25-2020 Base rate/loss cost/loss cost multiplier –
Revised base rates/loss costs/loss cost
multiplier resulting in excess of ±5%
change.
Pronto Core Rate Change 20.93 15.59 7.80
Redpoint County
Mutual Insurance
Company
Redpoint County Mutual
Insurance Company
Voluntary
Liability
1.05 11-01-2020 12-01-2020 Class - Relativity change in excess of
±5% for some policyholders.
Constitution Rate Change 0.00 0.00 0.00
Redpoint County
Mutual Insurance
Company
Redpoint County Mutual
Insurance Company
Voluntary
Liability
1.09 02-15-2020 04-15-2020 Other Links Rate Change 8.11 19.60 0.00
Redpoint County
Mutual Insurance
Company
Redpoint County Mutual
Insurance Company
Voluntary
Liability
1.79 01-01-2020 01-01-2020 Other rating variables - Revised rating
variable definition resulting in excess of
±5% change for some policyholders.
Pronto Core Rule Change 20.93 15.59 7.80
136
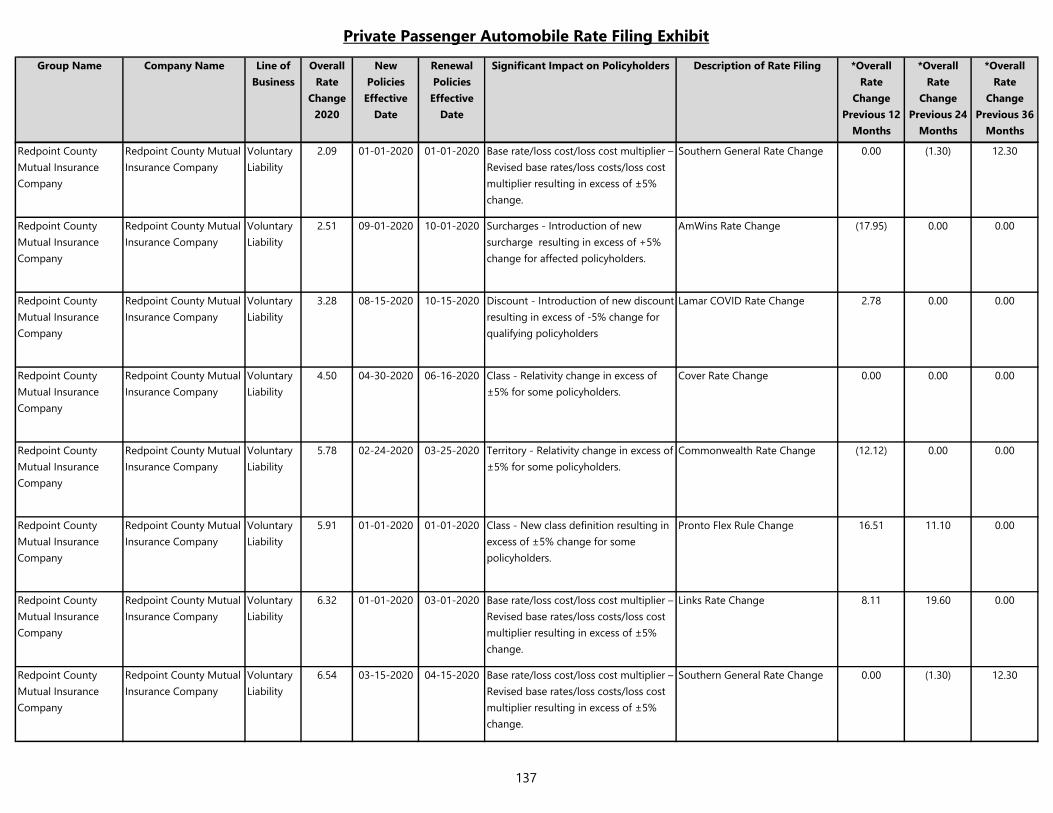
Private Passenger Automobile Rate Filing Exhibit
Group Name Company Name Line of
Business
Overall
Rate
Change
2020
New
Policies
Effective
Date
Renewal
Policies
Effective
Date
Significant Impact on Policyholders Description of Rate Filing *Overall
Rate
Change
Previous 12
Months
*Overall
Rate
Change
Previous 24
Months
*Overall
Rate
Change
Previous 36
Months
Redpoint County
Mutual Insurance
Company
Redpoint County Mutual
Insurance Company
Voluntary
Liability
2.09 01-01-2020 01-01-2020 Base rate/loss cost/loss cost multiplier –
Revised base rates/loss costs/loss cost
multiplier resulting in excess of ±5%
change.
Southern General Rate Change 0.00 (1.30) 12.30
Redpoint County
Mutual Insurance
Company
Redpoint County Mutual
Insurance Company
Voluntary
Liability
2.51 09-01-2020 10-01-2020 Surcharges - Introduction of new
surcharge resulting in excess of +5%
change for affected policyholders.
AmWins Rate Change (17.95) 0.00 0.00
Redpoint County
Mutual Insurance
Company
Redpoint County Mutual
Insurance Company
Voluntary
Liability
3.28 08-15-2020 10-15-2020 Discount - Introduction of new discount
resulting in excess of -5% change for
qualifying policyholders
Lamar COVID Rate Change 2.78 0.00 0.00
Redpoint County
Mutual Insurance
Company
Redpoint County Mutual
Insurance Company
Voluntary
Liability
4.50 04-30-2020 06-16-2020 Class - Relativity change in excess of
±5% for some policyholders.
Cover Rate Change 0.00 0.00 0.00
Redpoint County
Mutual Insurance
Company
Redpoint County Mutual
Insurance Company
Voluntary
Liability
5.78 02-24-2020 03-25-2020 Territory - Relativity change in excess of
±5% for some policyholders.
Commonwealth Rate Change (12.12) 0.00 0.00
Redpoint County
Mutual Insurance
Company
Redpoint County Mutual
Insurance Company
Voluntary
Liability
5.91 01-01-2020 01-01-2020 Class - New class definition resulting in
excess of ±5% change for some
policyholders.
Pronto Flex Rule Change 16.51 11.10 0.00
Redpoint County
Mutual Insurance
Company
Redpoint County Mutual
Insurance Company
Voluntary
Liability
6.32 01-01-2020 03-01-2020 Base rate/loss cost/loss cost multiplier –
Revised base rates/loss costs/loss cost
multiplier resulting in excess of ±5%
change.
Links Rate Change 8.11 19.60 0.00
Redpoint County
Mutual Insurance
Company
Redpoint County Mutual
Insurance Company
Voluntary
Liability
6.54 03-15-2020 04-15-2020 Base rate/loss cost/loss cost multiplier –
Revised base rates/loss costs/loss cost
multiplier resulting in excess of ±5%
change.
Southern General Rate Change 0.00 (1.30) 12.30
137

Private Passenger Automobile Rate Filing Exhibit
Group Name Company Name Line of
Business
Overall
Rate
Change
2020
New
Policies
Effective
Date
Renewal
Policies
Effective
Date
Significant Impact on Policyholders Description of Rate Filing *Overall
Rate
Change
Previous 12
Months
*Overall
Rate
Change
Previous 24
Months
*Overall
Rate
Change
Previous 36
Months
Redpoint County
Mutual Insurance
Company
Redpoint County Mutual
Insurance Company
Voluntary
Liability
11.79 02-01-2020 02-01-2020 Base rate/loss cost/loss cost multiplier –
Revised base rates/loss costs/loss cost
multiplier resulting in excess of ±5%
change.
Quantum Rate Change 14.13 0.00 0.00
Redpoint County
Mutual Insurance
Company
Redpoint County Mutual
Insurance Company
Physical
Damage
(17.90) 11-01-2020 11-01-2020 Base rate/loss cost/loss cost multiplier –
Revised base rates/loss costs/loss cost
multiplier resulting in excess of ±5%
change.
Superior Rate Change 0.00 0.00 0.00
Redpoint County
Mutual Insurance
Company
Redpoint County Mutual
Insurance Company
Physical
Damage
(16.80) 01-01-2020 02-01-2020 Base rate/loss cost/loss cost multiplier –
Revised base rates/loss costs/loss cost
multiplier resulting in excess of ±5%
change.
AmWins Rate Change (16.86) 0.00 0.00
Redpoint County
Mutual Insurance
Company
Redpoint County Mutual
Insurance Company
Physical
Damage
(9.78) 11-01-2020 12-01-2020 Class - Relativity change in excess of
±5% for some policyholders.
Constitution Rate Change 0.00 0.00 0.00
Redpoint County
Mutual Insurance
Company
Redpoint County Mutual
Insurance Company
Physical
Damage
(9.34) 10-05-2020 11-05-2020 Class - Relativity change in excess of
±5% for some policyholders.
Diamond Specialty Rate Change (2.88) 52.30 (9.00)
Redpoint County
Mutual Insurance
Company
Redpoint County Mutual
Insurance Company
Physical
Damage
(7.05) 10-01-2020 11-01-2020 Base rate/loss cost/loss cost multiplier –
Revised base rates/loss costs/loss cost
multiplier resulting in excess of ±5%
change.
Quantum Rate Change (6.08) 0.00 0.00
Redpoint County
Mutual Insurance
Company
Redpoint County Mutual
Insurance Company
Physical
Damage
(6.17) 05-25-2020 05-25-2020 Base rate/loss cost/loss cost multiplier –
Revised base rates/loss costs/loss cost
multiplier resulting in excess of ±5%
change.
Pronto Core Rate Change 0.77 (4.00) 4.10
Redpoint County
Mutual Insurance
Company
Redpoint County Mutual
Insurance Company
Physical
Damage
(4.79) 02-01-2020 02-01-2020 Base rate/loss cost/loss cost multiplier –
Revised base rates/loss costs/loss cost
multiplier resulting in excess of ±5%
change.
Quantum Rate Change (6.08) 0.00 0.00
138
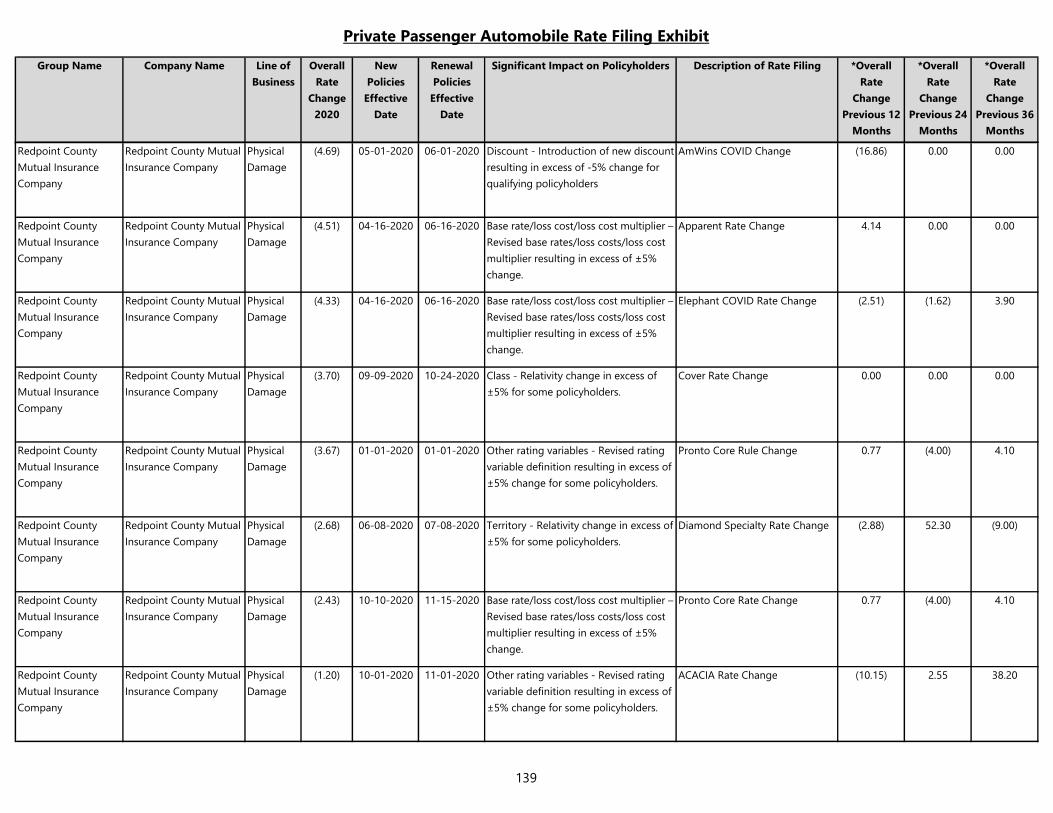
Private Passenger Automobile Rate Filing Exhibit
Group Name Company Name Line of
Business
Overall
Rate
Change
2020
New
Policies
Effective
Date
Renewal
Policies
Effective
Date
Significant Impact on Policyholders Description of Rate Filing *Overall
Rate
Change
Previous 12
Months
*Overall
Rate
Change
Previous 24
Months
*Overall
Rate
Change
Previous 36
Months
Redpoint County
Mutual Insurance
Company
Redpoint County Mutual
Insurance Company
Physical
Damage
(4.69) 05-01-2020 06-01-2020 Discount - Introduction of new discount
resulting in excess of -5% change for
qualifying policyholders
AmWins COVID Change (16.86) 0.00 0.00
Redpoint County
Mutual Insurance
Company
Redpoint County Mutual
Insurance Company
Physical
Damage
(4.51) 04-16-2020 06-16-2020 Base rate/loss cost/loss cost multiplier –
Revised base rates/loss costs/loss cost
multiplier resulting in excess of ±5%
change.
Apparent Rate Change 4.14 0.00 0.00
Redpoint County
Mutual Insurance
Company
Redpoint County Mutual
Insurance Company
Physical
Damage
(4.33) 04-16-2020 06-16-2020 Base rate/loss cost/loss cost multiplier –
Revised base rates/loss costs/loss cost
multiplier resulting in excess of ±5%
change.
Elephant COVID Rate Change (2.51) (1.62) 3.90
Redpoint County
Mutual Insurance
Company
Redpoint County Mutual
Insurance Company
Physical
Damage
(3.70) 09-09-2020 10-24-2020 Class - Relativity change in excess of
±5% for some policyholders.
Cover Rate Change 0.00 0.00 0.00
Redpoint County
Mutual Insurance
Company
Redpoint County Mutual
Insurance Company
Physical
Damage
(3.67) 01-01-2020 01-01-2020 Other rating variables - Revised rating
variable definition resulting in excess of
±5% change for some policyholders.
Pronto Core Rule Change 0.77 (4.00) 4.10
Redpoint County
Mutual Insurance
Company
Redpoint County Mutual
Insurance Company
Physical
Damage
(2.68) 06-08-2020 07-08-2020 Territory - Relativity change in excess of
±5% for some policyholders.
Diamond Specialty Rate Change (2.88) 52.30 (9.00)
Redpoint County
Mutual Insurance
Company
Redpoint County Mutual
Insurance Company
Physical
Damage
(2.43) 10-10-2020 11-15-2020 Base rate/loss cost/loss cost multiplier –
Revised base rates/loss costs/loss cost
multiplier resulting in excess of ±5%
change.
Pronto Core Rate Change 0.77 (4.00) 4.10
Redpoint County
Mutual Insurance
Company
Redpoint County Mutual
Insurance Company
Physical
Damage
(1.20) 10-01-2020 11-01-2020 Other rating variables - Revised rating
variable definition resulting in excess of
±5% change for some policyholders.
ACACIA Rate Change (10.15) 2.55 38.20
139
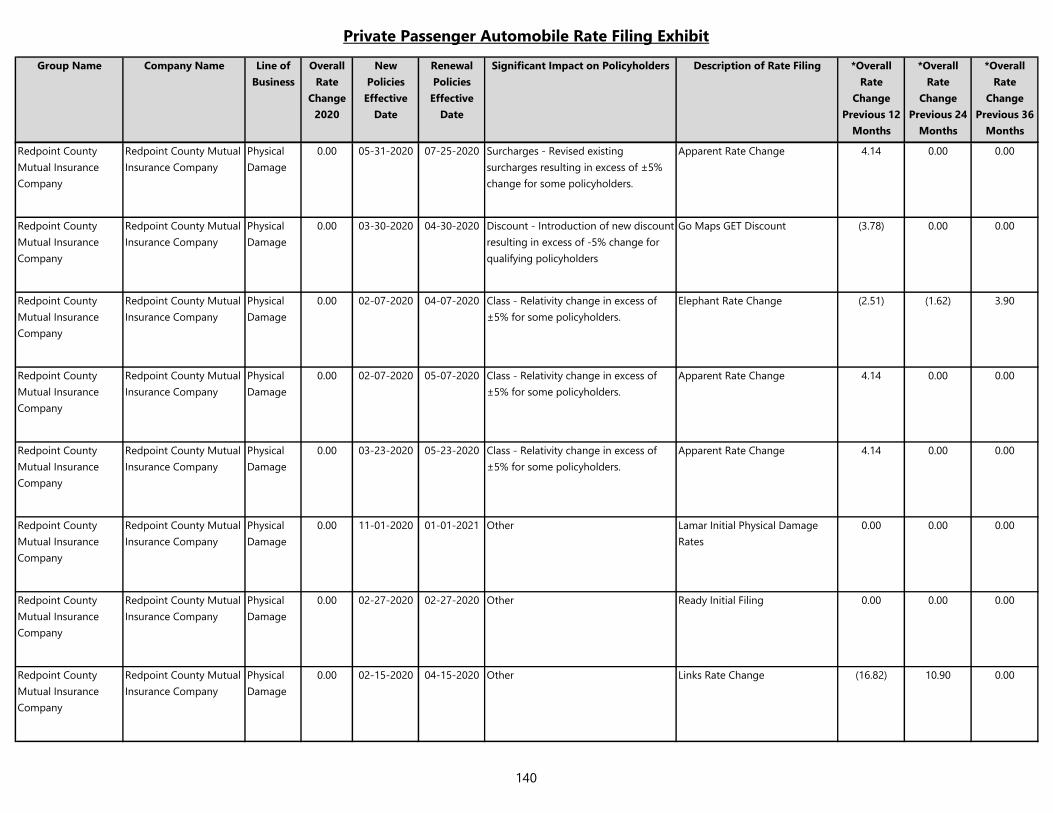
Private Passenger Automobile Rate Filing Exhibit
Group Name Company Name Line of
Business
Overall
Rate
Change
2020
New
Policies
Effective
Date
Renewal
Policies
Effective
Date
Significant Impact on Policyholders Description of Rate Filing *Overall
Rate
Change
Previous 12
Months
*Overall
Rate
Change
Previous 24
Months
*Overall
Rate
Change
Previous 36
Months
Redpoint County
Mutual Insurance
Company
Redpoint County Mutual
Insurance Company
Physical
Damage
0.00 05-31-2020 07-25-2020 Surcharges - Revised existing
surcharges resulting in excess of ±5%
change for some policyholders.
Apparent Rate Change 4.14 0.00 0.00
Redpoint County
Mutual Insurance
Company
Redpoint County Mutual
Insurance Company
Physical
Damage
0.00 03-30-2020 04-30-2020 Discount - Introduction of new discount
resulting in excess of -5% change for
qualifying policyholders
Go Maps GET Discount (3.78) 0.00 0.00
Redpoint County
Mutual Insurance
Company
Redpoint County Mutual
Insurance Company
Physical
Damage
0.00 02-07-2020 04-07-2020 Class - Relativity change in excess of
±5% for some policyholders.
Elephant Rate Change (2.51) (1.62) 3.90
Redpoint County
Mutual Insurance
Company
Redpoint County Mutual
Insurance Company
Physical
Damage
0.00 02-07-2020 05-07-2020 Class - Relativity change in excess of
±5% for some policyholders.
Apparent Rate Change 4.14 0.00 0.00
Redpoint County
Mutual Insurance
Company
Redpoint County Mutual
Insurance Company
Physical
Damage
0.00 03-23-2020 05-23-2020 Class - Relativity change in excess of
±5% for some policyholders.
Apparent Rate Change 4.14 0.00 0.00
Redpoint County
Mutual Insurance
Company
Redpoint County Mutual
Insurance Company
Physical
Damage
0.00 11-01-2020 01-01-2021 Other Lamar Initial Physical Damage
Rates
0.00 0.00 0.00
Redpoint County
Mutual Insurance
Company
Redpoint County Mutual
Insurance Company
Physical
Damage
0.00 02-27-2020 02-27-2020 Other Ready Initial Filing 0.00 0.00 0.00
Redpoint County
Mutual Insurance
Company
Redpoint County Mutual
Insurance Company
Physical
Damage
0.00 02-15-2020 04-15-2020 Other Links Rate Change (16.82) 10.90 0.00
140

Private Passenger Automobile Rate Filing Exhibit
Group Name Company Name Line of
Business
Overall
Rate
Change
2020
New
Policies
Effective
Date
Renewal
Policies
Effective
Date
Significant Impact on Policyholders Description of Rate Filing *Overall
Rate
Change
Previous 12
Months
*Overall
Rate
Change
Previous 24
Months
*Overall
Rate
Change
Previous 36
Months
Redpoint County
Mutual Insurance
Company
Redpoint County Mutual
Insurance Company
Physical
Damage
0.00 04-01-2020 05-01-2020 Other AmWins Rate Change (16.86) 0.00 0.00
Redpoint County
Mutual Insurance
Company
Redpoint County Mutual
Insurance Company
Physical
Damage
0.00 03-23-2020 05-23-2020 Other Elephant Rate Change (2.51) (1.62) 3.90
Redpoint County
Mutual Insurance
Company
Redpoint County Mutual
Insurance Company
Physical
Damage
0.00 07-20-2020 07-20-2020 Other Go Maps GET Discount Removal (3.78) 0.00 0.00
Redpoint County
Mutual Insurance
Company
Redpoint County Mutual
Insurance Company
Physical
Damage
0.00 08-03-2020 08-03-2020 Other Superior Initial Filing 0.00 0.00 0.00
Redpoint County
Mutual Insurance
Company
Redpoint County Mutual
Insurance Company
Physical
Damage
0.00 06-17-2020 08-17-2020 Other Apparent Rate Change 4.14 0.00 0.00
Redpoint County
Mutual Insurance
Company
Redpoint County Mutual
Insurance Company
Physical
Damage
0.00 08-01-2020 09-01-2020 Other ACACIA Rate Order Change (10.15) 2.55 38.20
Redpoint County
Mutual Insurance
Company
Redpoint County Mutual
Insurance Company
Physical
Damage
0.00 08-15-2020 09-15-2020 Other Constitution Initial Filing 0.00 0.00 0.00
Redpoint County
Mutual Insurance
Company
Redpoint County Mutual
Insurance Company
Physical
Damage
0.00 10-02-2020 10-02-2020 Other Drive Safe Initial Filing 0.00 0.00 0.00
141
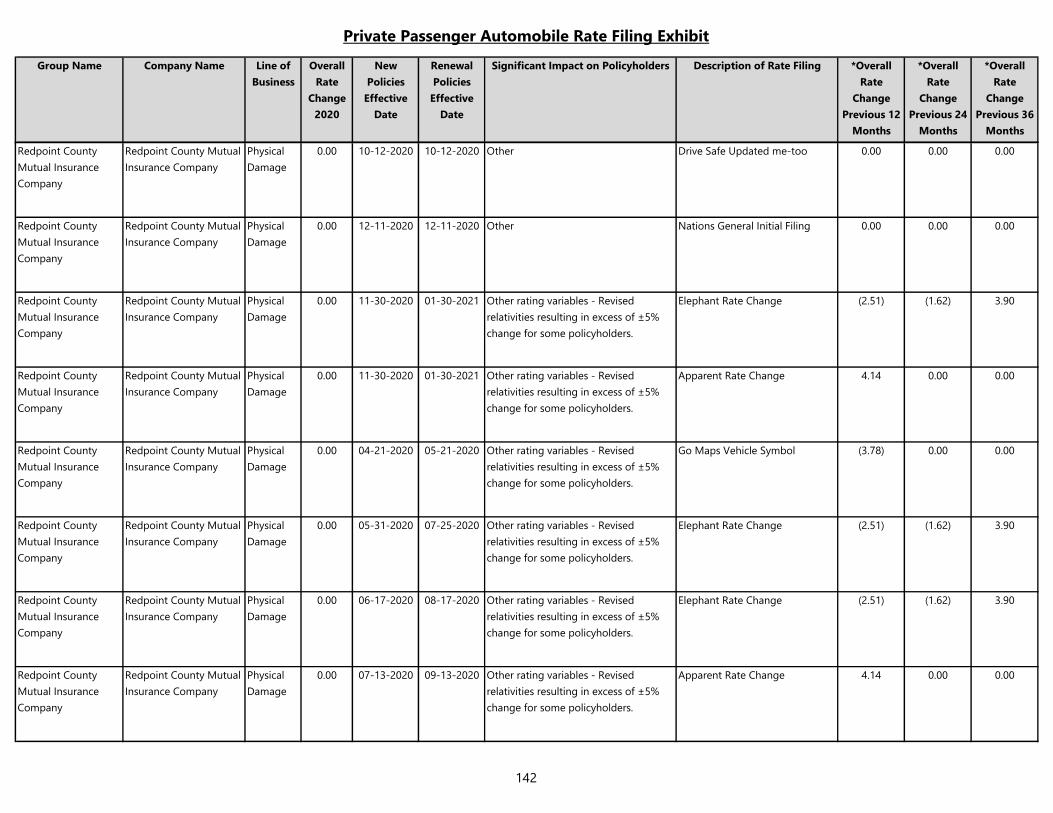
Private Passenger Automobile Rate Filing Exhibit
Group Name Company Name Line of
Business
Overall
Rate
Change
2020
New
Policies
Effective
Date
Renewal
Policies
Effective
Date
Significant Impact on Policyholders Description of Rate Filing *Overall
Rate
Change
Previous 12
Months
*Overall
Rate
Change
Previous 24
Months
*Overall
Rate
Change
Previous 36
Months
Redpoint County
Mutual Insurance
Company
Redpoint County Mutual
Insurance Company
Physical
Damage
0.00 10-12-2020 10-12-2020 Other Drive Safe Updated me-too 0.00 0.00 0.00
Redpoint County
Mutual Insurance
Company
Redpoint County Mutual
Insurance Company
Physical
Damage
0.00 12-11-2020 12-11-2020 Other Nations General Initial Filing 0.00 0.00 0.00
Redpoint County
Mutual Insurance
Company
Redpoint County Mutual
Insurance Company
Physical
Damage
0.00 11-30-2020 01-30-2021 Other rating variables - Revised
relativities resulting in excess of ±5%
change for some policyholders.
Elephant Rate Change (2.51) (1.62) 3.90
Redpoint County
Mutual Insurance
Company
Redpoint County Mutual
Insurance Company
Physical
Damage
0.00 11-30-2020 01-30-2021 Other rating variables - Revised
relativities resulting in excess of ±5%
change for some policyholders.
Apparent Rate Change 4.14 0.00 0.00
Redpoint County
Mutual Insurance
Company
Redpoint County Mutual
Insurance Company
Physical
Damage
0.00 04-21-2020 05-21-2020 Other rating variables - Revised
relativities resulting in excess of ±5%
change for some policyholders.
Go Maps Vehicle Symbol (3.78) 0.00 0.00
Redpoint County
Mutual Insurance
Company
Redpoint County Mutual
Insurance Company
Physical
Damage
0.00 05-31-2020 07-25-2020 Other rating variables - Revised
relativities resulting in excess of ±5%
change for some policyholders.
Elephant Rate Change (2.51) (1.62) 3.90
Redpoint County
Mutual Insurance
Company
Redpoint County Mutual
Insurance Company
Physical
Damage
0.00 06-17-2020 08-17-2020 Other rating variables - Revised
relativities resulting in excess of ±5%
change for some policyholders.
Elephant Rate Change (2.51) (1.62) 3.90
Redpoint County
Mutual Insurance
Company
Redpoint County Mutual
Insurance Company
Physical
Damage
0.00 07-13-2020 09-13-2020 Other rating variables - Revised
relativities resulting in excess of ±5%
change for some policyholders.
Apparent Rate Change 4.14 0.00 0.00
142
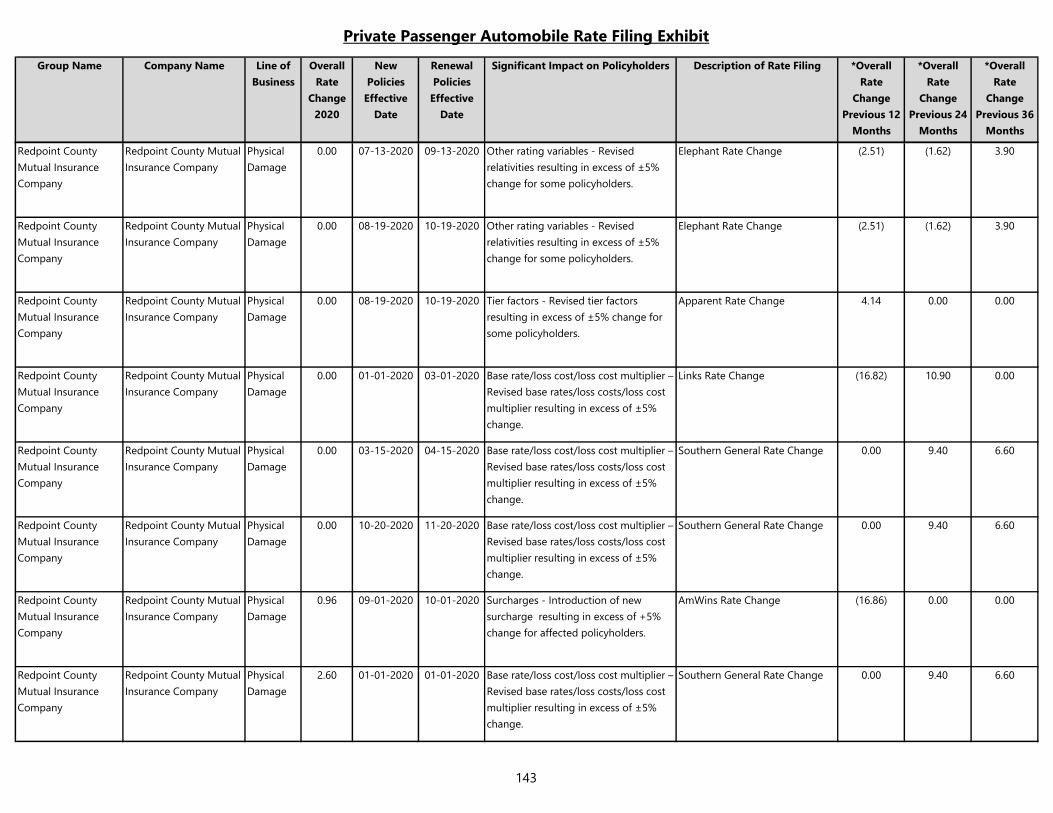
Private Passenger Automobile Rate Filing Exhibit
Group Name Company Name Line of
Business
Overall
Rate
Change
2020
New
Policies
Effective
Date
Renewal
Policies
Effective
Date
Significant Impact on Policyholders Description of Rate Filing *Overall
Rate
Change
Previous 12
Months
*Overall
Rate
Change
Previous 24
Months
*Overall
Rate
Change
Previous 36
Months
Redpoint County
Mutual Insurance
Company
Redpoint County Mutual
Insurance Company
Physical
Damage
0.00 07-13-2020 09-13-2020 Other rating variables - Revised
relativities resulting in excess of ±5%
change for some policyholders.
Elephant Rate Change (2.51) (1.62) 3.90
Redpoint County
Mutual Insurance
Company
Redpoint County Mutual
Insurance Company
Physical
Damage
0.00 08-19-2020 10-19-2020 Other rating variables - Revised
relativities resulting in excess of ±5%
change for some policyholders.
Elephant Rate Change (2.51) (1.62) 3.90
Redpoint County
Mutual Insurance
Company
Redpoint County Mutual
Insurance Company
Physical
Damage
0.00 08-19-2020 10-19-2020 Tier factors - Revised tier factors
resulting in excess of ±5% change for
some policyholders.
Apparent Rate Change 4.14 0.00 0.00
Redpoint County
Mutual Insurance
Company
Redpoint County Mutual
Insurance Company
Physical
Damage
0.00 01-01-2020 03-01-2020 Base rate/loss cost/loss cost multiplier –
Revised base rates/loss costs/loss cost
multiplier resulting in excess of ±5%
change.
Links Rate Change (16.82) 10.90 0.00
Redpoint County
Mutual Insurance
Company
Redpoint County Mutual
Insurance Company
Physical
Damage
0.00 03-15-2020 04-15-2020 Base rate/loss cost/loss cost multiplier –
Revised base rates/loss costs/loss cost
multiplier resulting in excess of ±5%
change.
Southern General Rate Change 0.00 9.40 6.60
Redpoint County
Mutual Insurance
Company
Redpoint County Mutual
Insurance Company
Physical
Damage
0.00 10-20-2020 11-20-2020 Base rate/loss cost/loss cost multiplier –
Revised base rates/loss costs/loss cost
multiplier resulting in excess of ±5%
change.
Southern General Rate Change 0.00 9.40 6.60
Redpoint County
Mutual Insurance
Company
Redpoint County Mutual
Insurance Company
Physical
Damage
0.96 09-01-2020 10-01-2020 Surcharges - Introduction of new
surcharge resulting in excess of +5%
change for affected policyholders.
AmWins Rate Change (16.86) 0.00 0.00
Redpoint County
Mutual Insurance
Company
Redpoint County Mutual
Insurance Company
Physical
Damage
2.60 01-01-2020 01-01-2020 Base rate/loss cost/loss cost multiplier –
Revised base rates/loss costs/loss cost
multiplier resulting in excess of ±5%
change.
Southern General Rate Change 0.00 9.40 6.60
143
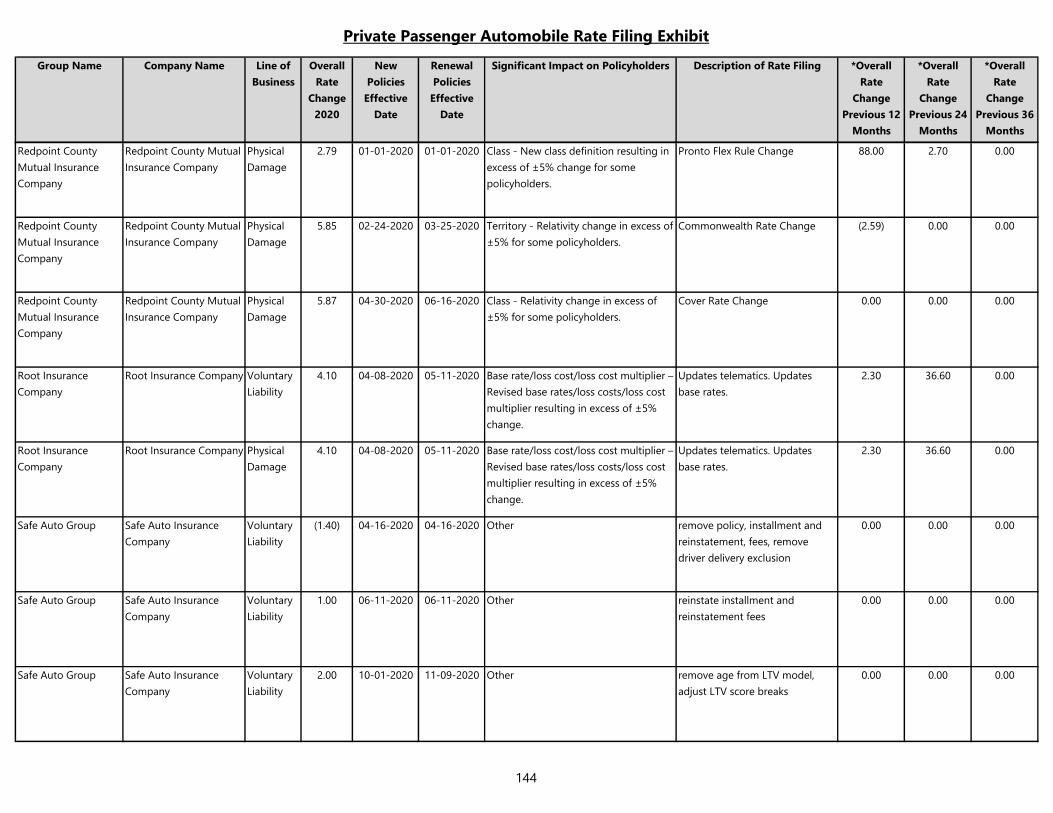
Private Passenger Automobile Rate Filing Exhibit
Group Name Company Name Line of
Business
Overall
Rate
Change
2020
New
Policies
Effective
Date
Renewal
Policies
Effective
Date
Significant Impact on Policyholders Description of Rate Filing *Overall
Rate
Change
Previous 12
Months
*Overall
Rate
Change
Previous 24
Months
*Overall
Rate
Change
Previous 36
Months
Redpoint County
Mutual Insurance
Company
Redpoint County Mutual
Insurance Company
Physical
Damage
2.79 01-01-2020 01-01-2020 Class - New class definition resulting in
excess of ±5% change for some
policyholders.
Pronto Flex Rule Change 88.00 2.70 0.00
Redpoint County
Mutual Insurance
Company
Redpoint County Mutual
Insurance Company
Physical
Damage
5.85 02-24-2020 03-25-2020 Territory - Relativity change in excess of
±5% for some policyholders.
Commonwealth Rate Change (2.59) 0.00 0.00
Redpoint County
Mutual Insurance
Company
Redpoint County Mutual
Insurance Company
Physical
Damage
5.87 04-30-2020 06-16-2020 Class - Relativity change in excess of
±5% for some policyholders.
Cover Rate Change 0.00 0.00 0.00
Root Insurance
Company
Root Insurance Company Voluntary
Liability
4.10 04-08-2020 05-11-2020 Base rate/loss cost/loss cost multiplier –
Revised base rates/loss costs/loss cost
multiplier resulting in excess of ±5%
change.
Updates telematics. Updates
base rates.
2.30 36.60 0.00
Root Insurance
Company
Root Insurance Company Physical
Damage
4.10 04-08-2020 05-11-2020 Base rate/loss cost/loss cost multiplier –
Revised base rates/loss costs/loss cost
multiplier resulting in excess of ±5%
change.
Updates telematics. Updates
base rates.
2.30 36.60 0.00
Safe Auto Group Safe Auto Insurance
Company
Voluntary
Liability
(1.40) 04-16-2020 04-16-2020 Other remove policy, installment and
reinstatement, fees, remove
driver delivery exclusion
0.00 0.00 0.00
Safe Auto Group Safe Auto Insurance
Company
Voluntary
Liability
1.00 06-11-2020 06-11-2020 Other reinstate installment and
reinstatement fees
0.00 0.00 0.00
Safe Auto Group Safe Auto Insurance
Company
Voluntary
Liability
2.00 10-01-2020 11-09-2020 Other remove age from LTV model,
adjust LTV score breaks
0.00 0.00 0.00
144
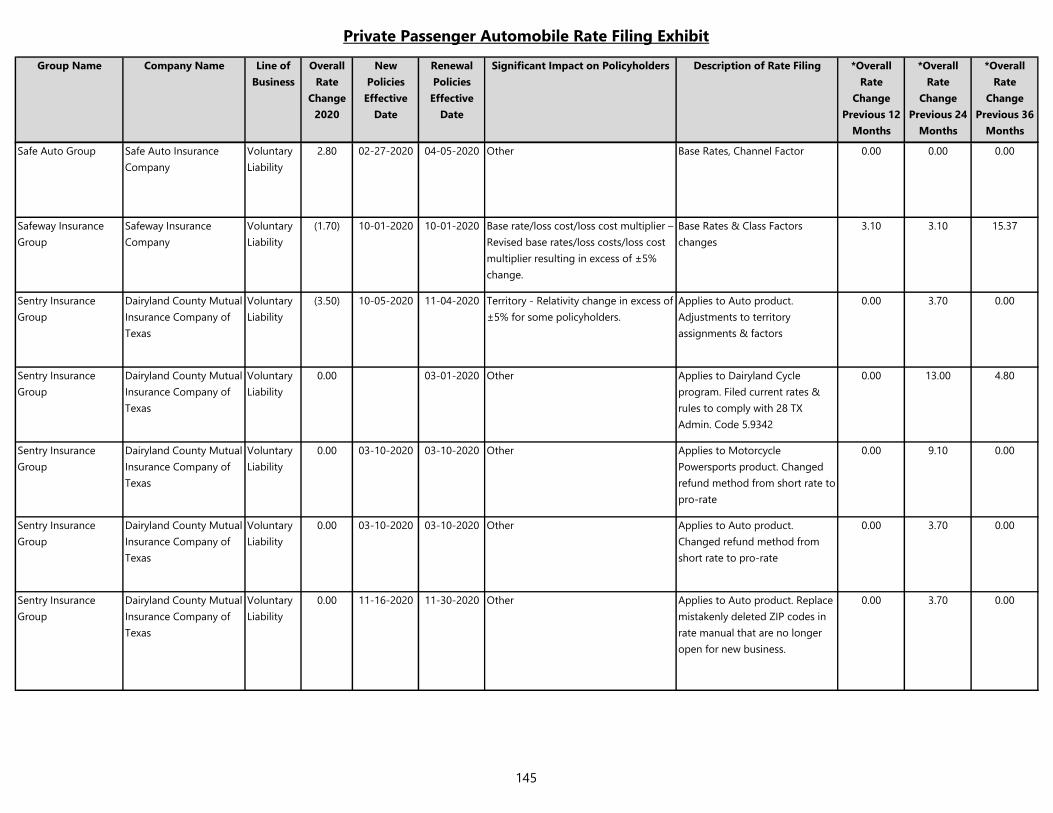
Private Passenger Automobile Rate Filing Exhibit
Group Name Company Name Line of
Business
Overall
Rate
Change
2020
New
Policies
Effective
Date
Renewal
Policies
Effective
Date
Significant Impact on Policyholders Description of Rate Filing *Overall
Rate
Change
Previous 12
Months
*Overall
Rate
Change
Previous 24
Months
*Overall
Rate
Change
Previous 36
Months
Safe Auto Group Safe Auto Insurance
Company
Voluntary
Liability
2.80 02-27-2020 04-05-2020 Other Base Rates, Channel Factor 0.00 0.00 0.00
Safeway Insurance
Group
Safeway Insurance
Company
Voluntary
Liability
(1.70) 10-01-2020 10-01-2020 Base rate/loss cost/loss cost multiplier –
Revised base rates/loss costs/loss cost
multiplier resulting in excess of ±5%
change.
Base Rates & Class Factors
changes
3.10 3.10 15.37
Sentry Insurance
Group
Dairyland County Mutual
Insurance Company of
Texas
Voluntary
Liability
(3.50) 10-05-2020 11-04-2020 Territory - Relativity change in excess of
±5% for some policyholders.
Applies to Auto product.
Adjustments to territory
assignments & factors
0.00 3.70 0.00
Sentry Insurance
Group
Dairyland County Mutual
Insurance Company of
Texas
Voluntary
Liability
0.00 03-01-2020 Other Applies to Dairyland Cycle
program. Filed current rates &
rules to comply with 28 TX
Admin. Code 5.9342
0.00 13.00 4.80
Sentry Insurance
Group
Dairyland County Mutual
Insurance Company of
Texas
Voluntary
Liability
0.00 03-10-2020 03-10-2020 Other Applies to Motorcycle
Powersports product. Changed
refund method from short rate to
pro-rate
0.00 9.10 0.00
Sentry Insurance
Group
Dairyland County Mutual
Insurance Company of
Texas
Voluntary
Liability
0.00 03-10-2020 03-10-2020 Other Applies to Auto product.
Changed refund method from
short rate to pro-rate
0.00 3.70 0.00
Sentry Insurance
Group
Dairyland County Mutual
Insurance Company of
Texas
Voluntary
Liability
0.00 11-16-2020 11-30-2020 Other Applies to Auto product. Replace
mistakenly deleted ZIP codes in
rate manual that are no longer
open for new business.
0.00 3.70 0.00
145
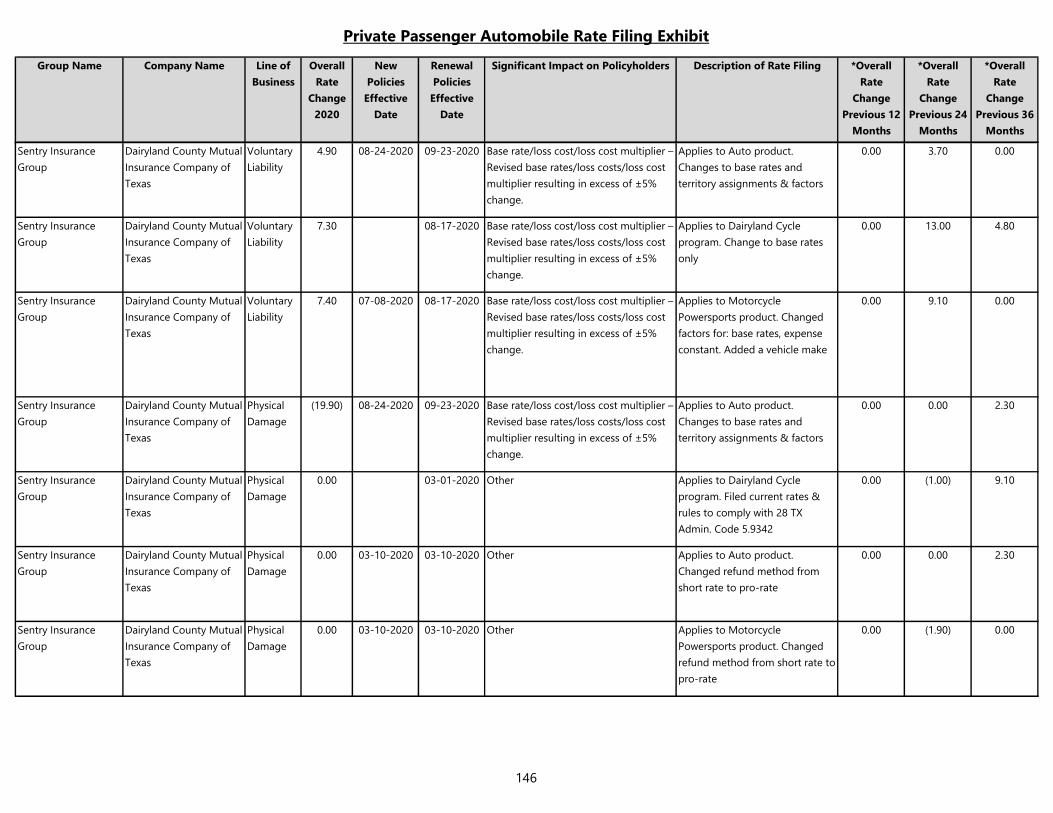
Private Passenger Automobile Rate Filing Exhibit
Group Name Company Name Line of
Business
Overall
Rate
Change
2020
New
Policies
Effective
Date
Renewal
Policies
Effective
Date
Significant Impact on Policyholders Description of Rate Filing *Overall
Rate
Change
Previous 12
Months
*Overall
Rate
Change
Previous 24
Months
*Overall
Rate
Change
Previous 36
Months
Sentry Insurance
Group
Dairyland County Mutual
Insurance Company of
Texas
Voluntary
Liability
4.90 08-24-2020 09-23-2020 Base rate/loss cost/loss cost multiplier –
Revised base rates/loss costs/loss cost
multiplier resulting in excess of ±5%
change.
Applies to Auto product.
Changes to base rates and
territory assignments & factors
0.00 3.70 0.00
Sentry Insurance
Group
Dairyland County Mutual
Insurance Company of
Texas
Voluntary
Liability
7.30 08-17-2020 Base rate/loss cost/loss cost multiplier –
Revised base rates/loss costs/loss cost
multiplier resulting in excess of ±5%
change.
Applies to Dairyland Cycle
program. Change to base rates
only
0.00 13.00 4.80
Sentry Insurance
Group
Dairyland County Mutual
Insurance Company of
Texas
Voluntary
Liability
7.40 07-08-2020 08-17-2020 Base rate/loss cost/loss cost multiplier –
Revised base rates/loss costs/loss cost
multiplier resulting in excess of ±5%
change.
Applies to Motorcycle
Powersports product. Changed
factors for: base rates, expense
constant. Added a vehicle make
0.00 9.10 0.00
Sentry Insurance
Group
Dairyland County Mutual
Insurance Company of
Texas
Physical
Damage
(19.90) 08-24-2020 09-23-2020 Base rate/loss cost/loss cost multiplier –
Revised base rates/loss costs/loss cost
multiplier resulting in excess of ±5%
change.
Applies to Auto product.
Changes to base rates and
territory assignments & factors
0.00 0.00 2.30
Sentry Insurance
Group
Dairyland County Mutual
Insurance Company of
Texas
Physical
Damage
0.00 03-01-2020 Other Applies to Dairyland Cycle
program. Filed current rates &
rules to comply with 28 TX
Admin. Code 5.9342
0.00 (1.00) 9.10
Sentry Insurance
Group
Dairyland County Mutual
Insurance Company of
Texas
Physical
Damage
0.00 03-10-2020 03-10-2020 Other Applies to Auto product.
Changed refund method from
short rate to pro-rate
0.00 0.00 2.30
Sentry Insurance
Group
Dairyland County Mutual
Insurance Company of
Texas
Physical
Damage
0.00 03-10-2020 03-10-2020 Other Applies to Motorcycle
Powersports product. Changed
refund method from short rate to
pro-rate
0.00 (1.90) 0.00
146
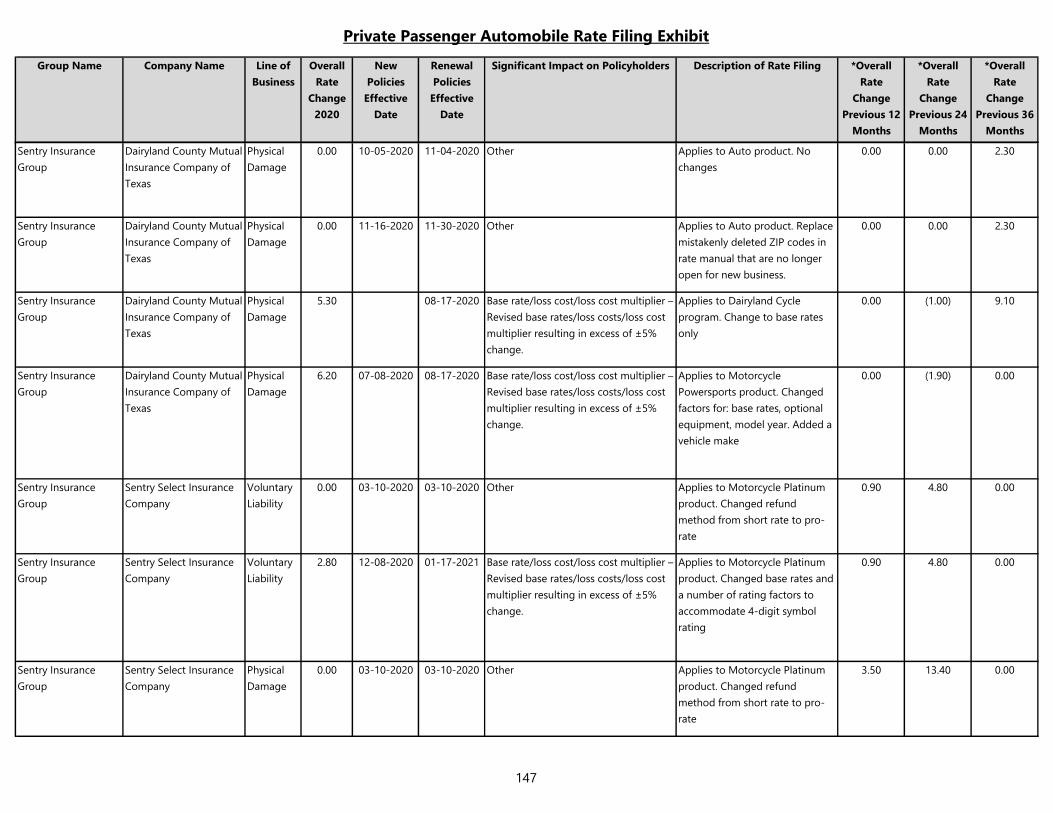
Private Passenger Automobile Rate Filing Exhibit
Group Name Company Name Line of
Business
Overall
Rate
Change
2020
New
Policies
Effective
Date
Renewal
Policies
Effective
Date
Significant Impact on Policyholders Description of Rate Filing *Overall
Rate
Change
Previous 12
Months
*Overall
Rate
Change
Previous 24
Months
*Overall
Rate
Change
Previous 36
Months
Sentry Insurance
Group
Dairyland County Mutual
Insurance Company of
Texas
Physical
Damage
0.00 10-05-2020 11-04-2020 Other Applies to Auto product. No
changes
0.00 0.00 2.30
Sentry Insurance
Group
Dairyland County Mutual
Insurance Company of
Texas
Physical
Damage
0.00 11-16-2020 11-30-2020 Other Applies to Auto product. Replace
mistakenly deleted ZIP codes in
rate manual that are no longer
open for new business.
0.00 0.00 2.30
Sentry Insurance
Group
Dairyland County Mutual
Insurance Company of
Texas
Physical
Damage
5.30 08-17-2020 Base rate/loss cost/loss cost multiplier –
Revised base rates/loss costs/loss cost
multiplier resulting in excess of ±5%
change.
Applies to Dairyland Cycle
program. Change to base rates
only
0.00 (1.00) 9.10
Sentry Insurance
Group
Dairyland County Mutual
Insurance Company of
Texas
Physical
Damage
6.20 07-08-2020 08-17-2020 Base rate/loss cost/loss cost multiplier –
Revised base rates/loss costs/loss cost
multiplier resulting in excess of ±5%
change.
Applies to Motorcycle
Powersports product. Changed
factors for: base rates, optional
equipment, model year. Added a
vehicle make
0.00 (1.90) 0.00
Sentry Insurance
Group
Sentry Select Insurance
Company
Voluntary
Liability
0.00 03-10-2020 03-10-2020 Other Applies to Motorcycle Platinum
product. Changed refund
method from short rate to pro-
rate
0.90 4.80 0.00
Sentry Insurance
Group
Sentry Select Insurance
Company
Voluntary
Liability
2.80 12-08-2020 01-17-2021 Base rate/loss cost/loss cost multiplier –
Revised base rates/loss costs/loss cost
multiplier resulting in excess of ±5%
change.
Applies to Motorcycle Platinum
product. Changed base rates and
a number of rating factors to
accommodate 4-digit symbol
rating
0.90 4.80 0.00
Sentry Insurance
Group
Sentry Select Insurance
Company
Physical
Damage
0.00 03-10-2020 03-10-2020 Other Applies to Motorcycle Platinum
product. Changed refund
method from short rate to pro-
rate
3.50 13.40 0.00
147
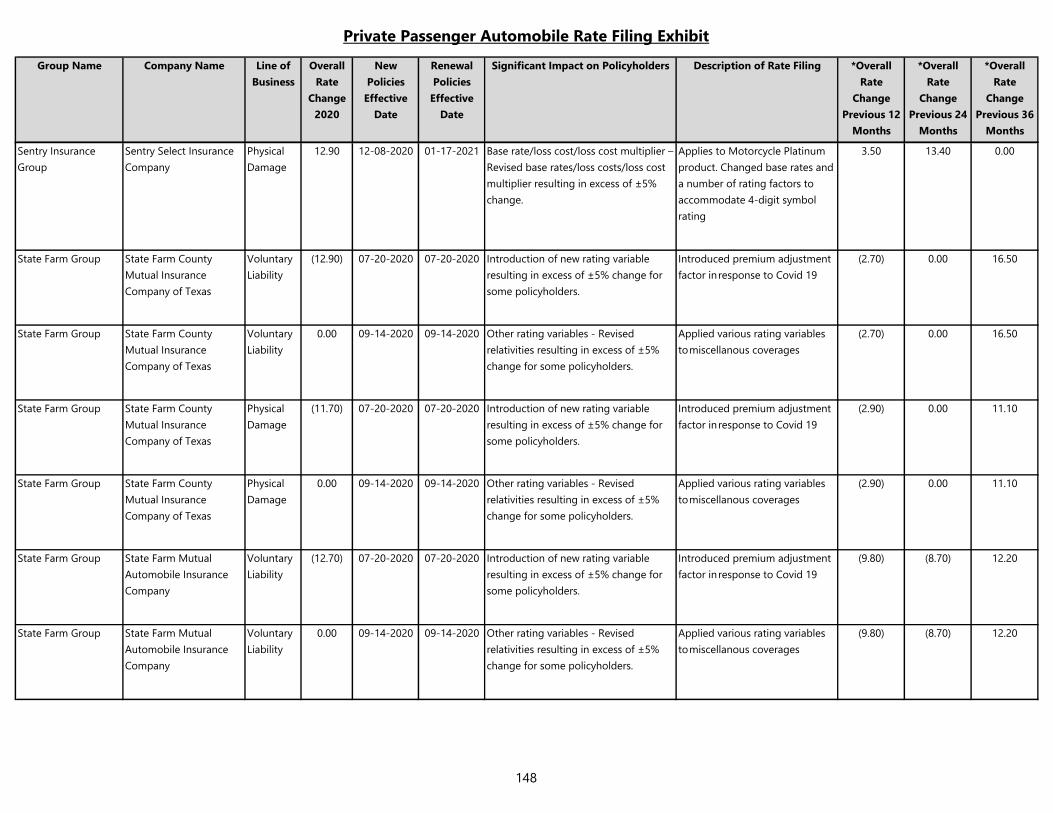
Private Passenger Automobile Rate Filing Exhibit
Group Name Company Name Line of
Business
Overall
Rate
Change
2020
New
Policies
Effective
Date
Renewal
Policies
Effective
Date
Significant Impact on Policyholders Description of Rate Filing *Overall
Rate
Change
Previous 12
Months
*Overall
Rate
Change
Previous 24
Months
*Overall
Rate
Change
Previous 36
Months
Sentry Insurance
Group
Sentry Select Insurance
Company
Physical
Damage
12.90 12-08-2020 01-17-2021 Base rate/loss cost/loss cost multiplier –
Revised base rates/loss costs/loss cost
multiplier resulting in excess of ±5%
change.
Applies to Motorcycle Platinum
product. Changed base rates and
a number of rating factors to
accommodate 4-digit symbol
rating
3.50 13.40 0.00
State Farm Group State Farm County
Mutual Insurance
Company of Texas
Voluntary
Liability
(12.90) 07-20-2020 07-20-2020 Introduction of new rating variable
resulting in excess of ±5% change for
some policyholders.
Introduced premium adjustment
factor in response to Covid 19
(2.70) 0.00 16.50
State Farm Group State Farm County
Mutual Insurance
Company of Texas
Voluntary
Liability
0.00 09-14-2020 09-14-2020 Other rating variables - Revised
relativities resulting in excess of ±5%
change for some policyholders.
Applied various rating variables
to miscellanous coverages
(2.70) 0.00 16.50
State Farm Group State Farm County
Mutual Insurance
Company of Texas
Physical
Damage
(11.70) 07-20-2020 07-20-2020 Introduction of new rating variable
resulting in excess of ±5% change for
some policyholders.
Introduced premium adjustment
factor in response to Covid 19
(2.90) 0.00 11.10
State Farm Group State Farm County
Mutual Insurance
Company of Texas
Physical
Damage
0.00 09-14-2020 09-14-2020 Other rating variables - Revised
relativities resulting in excess of ±5%
change for some policyholders.
Applied various rating variables
to miscellanous coverages
(2.90) 0.00 11.10
State Farm Group State Farm Mutual
Automobile Insurance
Company
Voluntary
Liability
(12.70) 07-20-2020 07-20-2020 Introduction of new rating variable
resulting in excess of ±5% change for
some policyholders.
Introduced premium adjustment
factor in response to Covid 19
(9.80) (8.70) 12.20
State Farm Group State Farm Mutual
Automobile Insurance
Company
Voluntary
Liability
0.00 09-14-2020 09-14-2020 Other rating variables - Revised
relativities resulting in excess of ±5%
change for some policyholders.
Applied various rating variables
to miscellanous coverages
(9.80) (8.70) 12.20
148
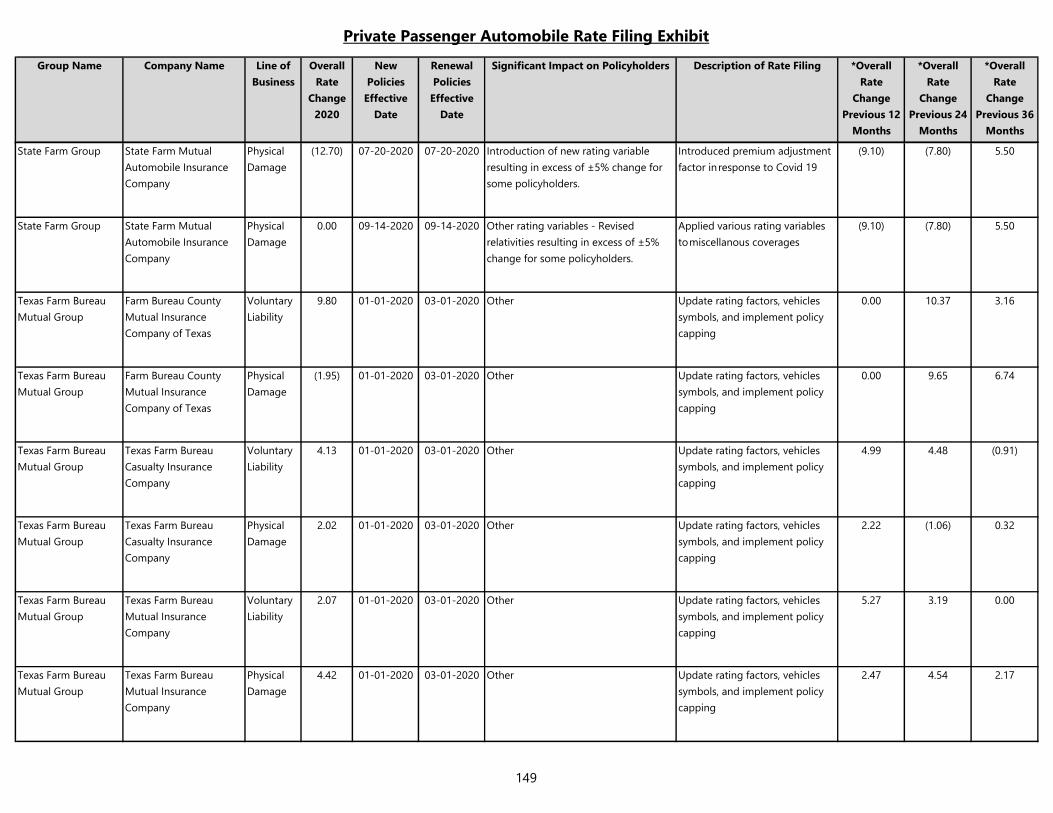
Private Passenger Automobile Rate Filing Exhibit
Group Name Company Name Line of
Business
Overall
Rate
Change
2020
New
Policies
Effective
Date
Renewal
Policies
Effective
Date
Significant Impact on Policyholders Description of Rate Filing *Overall
Rate
Change
Previous 12
Months
*Overall
Rate
Change
Previous 24
Months
*Overall
Rate
Change
Previous 36
Months
State Farm Group State Farm Mutual
Automobile Insurance
Company
Physical
Damage
(12.70) 07-20-2020 07-20-2020 Introduction of new rating variable
resulting in excess of ±5% change for
some policyholders.
Introduced premium adjustment
factor in response to Covid 19
(9.10) (7.80) 5.50
State Farm Group State Farm Mutual
Automobile Insurance
Company
Physical
Damage
0.00 09-14-2020 09-14-2020 Other rating variables - Revised
relativities resulting in excess of ±5%
change for some policyholders.
Applied various rating variables
to miscellanous coverages
(9.10) (7.80) 5.50
Texas Farm Bureau
Mutual Group
Farm Bureau County
Mutual Insurance
Company of Texas
Voluntary
Liability
9.80 01-01-2020 03-01-2020 Other Update rating factors, vehicles
symbols, and implement policy
capping
0.00 10.37 3.16
Texas Farm Bureau
Mutual Group
Farm Bureau County
Mutual Insurance
Company of Texas
Physical
Damage
(1.95) 01-01-2020 03-01-2020 Other Update rating factors, vehicles
symbols, and implement policy
capping
0.00 9.65 6.74
Texas Farm Bureau
Mutual Group
Texas Farm Bureau
Casualty Insurance
Company
Voluntary
Liability
4.13 01-01-2020 03-01-2020 Other Update rating factors, vehicles
symbols, and implement policy
capping
4.99 4.48 (0.91)
Texas Farm Bureau
Mutual Group
Texas Farm Bureau
Casualty Insurance
Company
Physical
Damage
2.02 01-01-2020 03-01-2020 Other Update rating factors, vehicles
symbols, and implement policy
capping
2.22 (1.06) 0.32
Texas Farm Bureau
Mutual Group
Texas Farm Bureau
Mutual Insurance
Company
Voluntary
Liability
2.07 01-01-2020 03-01-2020 Other Update rating factors, vehicles
symbols, and implement policy
capping
5.27 3.19 0.00
Texas Farm Bureau
Mutual Group
Texas Farm Bureau
Mutual Insurance
Company
Physical
Damage
4.42 01-01-2020 03-01-2020 Other Update rating factors, vehicles
symbols, and implement policy
capping
2.47 4.54 2.17
149
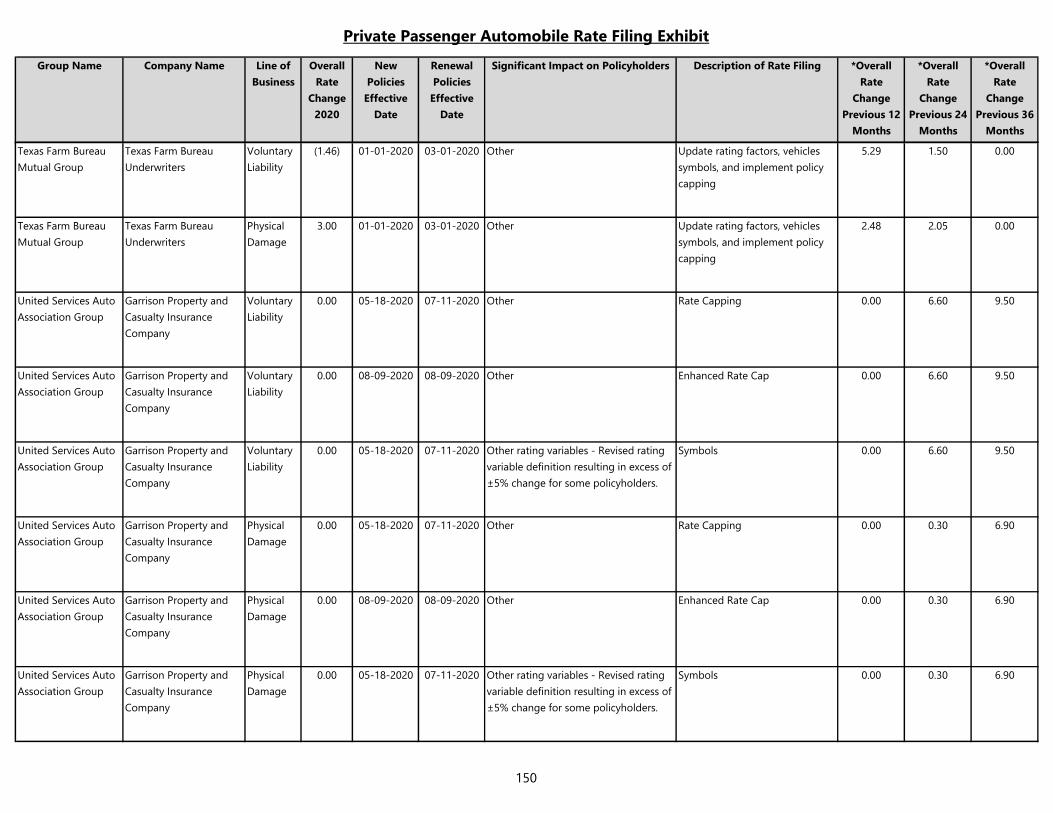
Private Passenger Automobile Rate Filing Exhibit
Group Name Company Name Line of
Business
Overall
Rate
Change
2020
New
Policies
Effective
Date
Renewal
Policies
Effective
Date
Significant Impact on Policyholders Description of Rate Filing *Overall
Rate
Change
Previous 12
Months
*Overall
Rate
Change
Previous 24
Months
*Overall
Rate
Change
Previous 36
Months
Texas Farm Bureau
Mutual Group
Texas Farm Bureau
Underwriters
Voluntary
Liability
(1.46) 01-01-2020 03-01-2020 Other Update rating factors, vehicles
symbols, and implement policy
capping
5.29 1.50 0.00
Texas Farm Bureau
Mutual Group
Texas Farm Bureau
Underwriters
Physical
Damage
3.00 01-01-2020 03-01-2020 Other Update rating factors, vehicles
symbols, and implement policy
capping
2.48 2.05 0.00
United Services Auto
Association Group
Garrison Property and
Casualty Insurance
Company
Voluntary
Liability
0.00 05-18-2020 07-11-2020 Other Rate Capping 0.00 6.60 9.50
United Services Auto
Association Group
Garrison Property and
Casualty Insurance
Company
Voluntary
Liability
0.00 08-09-2020 08-09-2020 Other Enhanced Rate Cap 0.00 6.60 9.50
United Services Auto
Association Group
Garrison Property and
Casualty Insurance
Company
Voluntary
Liability
0.00 05-18-2020 07-11-2020 Other rating variables - Revised rating
variable definition resulting in excess of
±5% change for some policyholders.
Symbols 0.00 6.60 9.50
United Services Auto
Association Group
Garrison Property and
Casualty Insurance
Company
Physical
Damage
0.00 05-18-2020 07-11-2020 Other Rate Capping 0.00 0.30 6.90
United Services Auto
Association Group
Garrison Property and
Casualty Insurance
Company
Physical
Damage
0.00 08-09-2020 08-09-2020 Other Enhanced Rate Cap 0.00 0.30 6.90
United Services Auto
Association Group
Garrison Property and
Casualty Insurance
Company
Physical
Damage
0.00 05-18-2020 07-11-2020 Other rating variables - Revised rating
variable definition resulting in excess of
±5% change for some policyholders.
Symbols 0.00 0.30 6.90
150
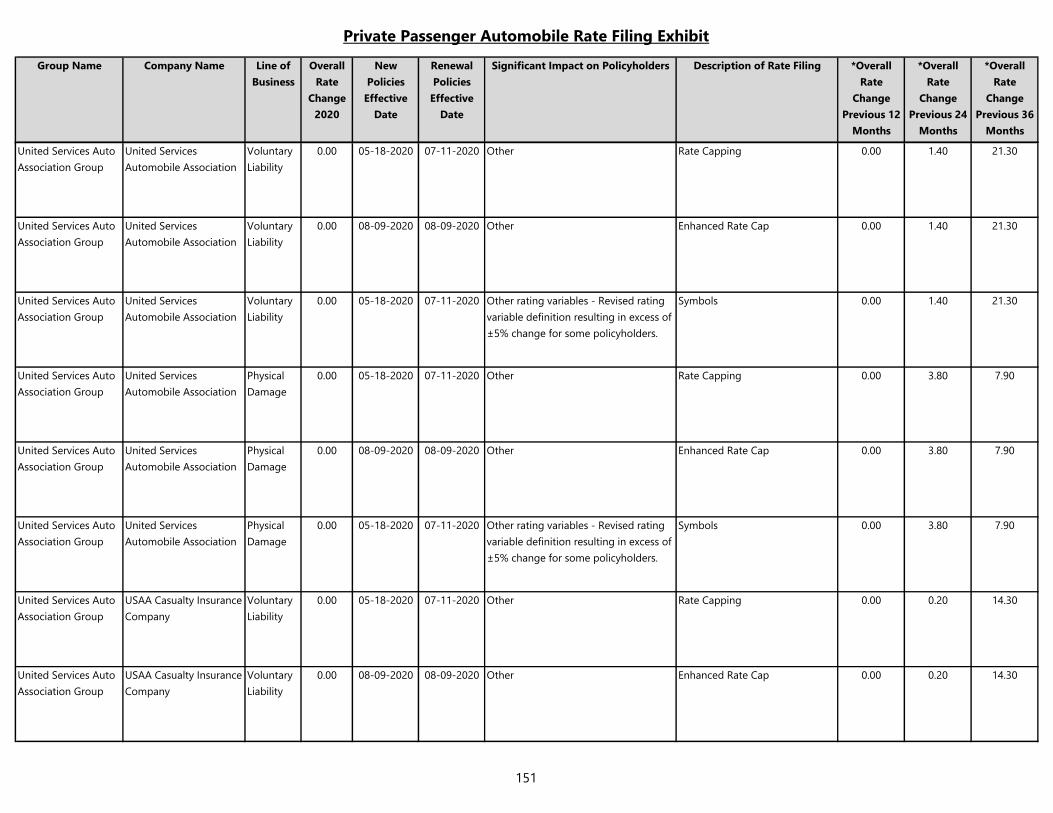
Private Passenger Automobile Rate Filing Exhibit
Group Name Company Name Line of
Business
Overall
Rate
Change
2020
New
Policies
Effective
Date
Renewal
Policies
Effective
Date
Significant Impact on Policyholders Description of Rate Filing *Overall
Rate
Change
Previous 12
Months
*Overall
Rate
Change
Previous 24
Months
*Overall
Rate
Change
Previous 36
Months
United Services Auto
Association Group
United Services
Automobile Association
Voluntary
Liability
0.00 05-18-2020 07-11-2020 Other Rate Capping 0.00 1.40 21.30
United Services Auto
Association Group
United Services
Automobile Association
Voluntary
Liability
0.00 08-09-2020 08-09-2020 Other Enhanced Rate Cap 0.00 1.40 21.30
United Services Auto
Association Group
United Services
Automobile Association
Voluntary
Liability
0.00 05-18-2020 07-11-2020 Other rating variables - Revised rating
variable definition resulting in excess of
±5% change for some policyholders.
Symbols 0.00 1.40 21.30
United Services Auto
Association Group
United Services
Automobile Association
Physical
Damage
0.00 05-18-2020 07-11-2020 Other Rate Capping 0.00 3.80 7.90
United Services Auto
Association Group
United Services
Automobile Association
Physical
Damage
0.00 08-09-2020 08-09-2020 Other Enhanced Rate Cap 0.00 3.80 7.90
United Services Auto
Association Group
United Services
Automobile Association
Physical
Damage
0.00 05-18-2020 07-11-2020 Other rating variables - Revised rating
variable definition resulting in excess of
±5% change for some policyholders.
Symbols 0.00 3.80 7.90
United Services Auto
Association Group
USAA Casualty Insurance
Company
Voluntary
Liability
0.00 05-18-2020 07-11-2020 Other Rate Capping 0.00 0.20 14.30
United Services Auto
Association Group
USAA Casualty Insurance
Company
Voluntary
Liability
0.00 08-09-2020 08-09-2020 Other Enhanced Rate Cap 0.00 0.20 14.30
151
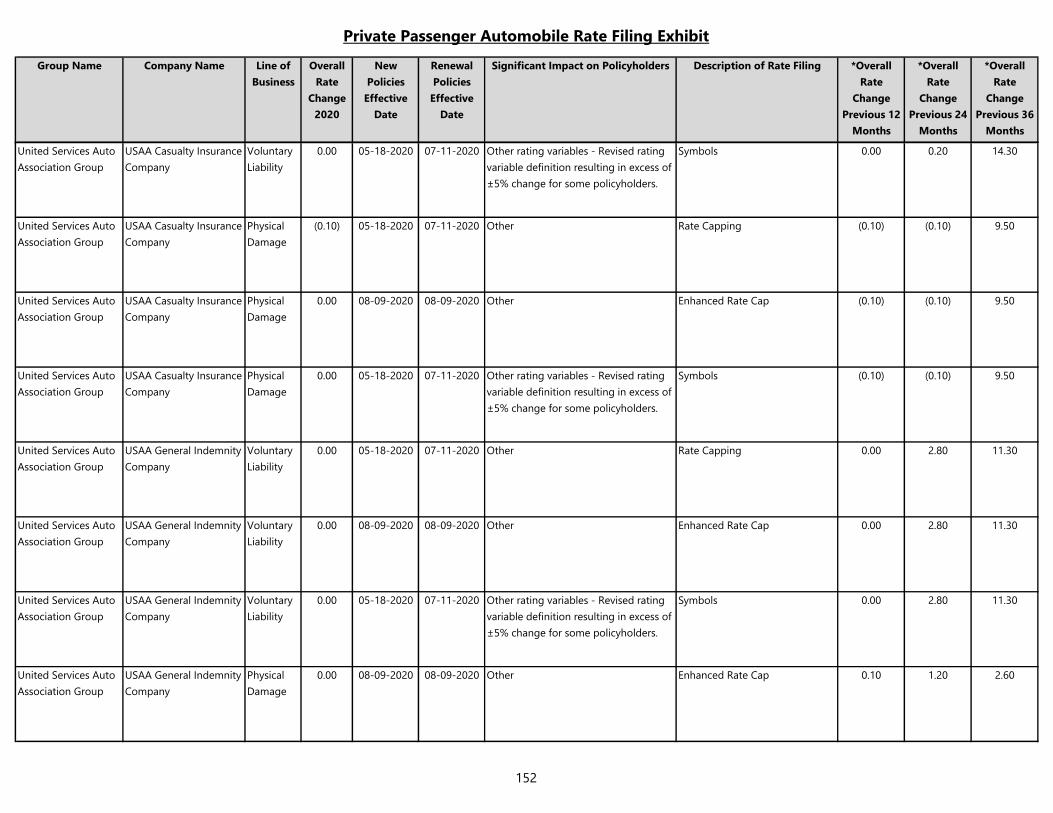
Private Passenger Automobile Rate Filing Exhibit
Group Name Company Name Line of
Business
Overall
Rate
Change
2020
New
Policies
Effective
Date
Renewal
Policies
Effective
Date
Significant Impact on Policyholders Description of Rate Filing *Overall
Rate
Change
Previous 12
Months
*Overall
Rate
Change
Previous 24
Months
*Overall
Rate
Change
Previous 36
Months
United Services Auto
Association Group
USAA Casualty Insurance
Company
Voluntary
Liability
0.00 05-18-2020 07-11-2020 Other rating variables - Revised rating
variable definition resulting in excess of
±5% change for some policyholders.
Symbols 0.00 0.20 14.30
United Services Auto
Association Group
USAA Casualty Insurance
Company
Physical
Damage
(0.10) 05-18-2020 07-11-2020 Other Rate Capping (0.10) (0.10) 9.50
United Services Auto
Association Group
USAA Casualty Insurance
Company
Physical
Damage
0.00 08-09-2020 08-09-2020 Other Enhanced Rate Cap (0.10) (0.10) 9.50
United Services Auto
Association Group
USAA Casualty Insurance
Company
Physical
Damage
0.00 05-18-2020 07-11-2020 Other rating variables - Revised rating
variable definition resulting in excess of
±5% change for some policyholders.
Symbols (0.10) (0.10) 9.50
United Services Auto
Association Group
USAA General Indemnity
Company
Voluntary
Liability
0.00 05-18-2020 07-11-2020 Other Rate Capping 0.00 2.80 11.30
United Services Auto
Association Group
USAA General Indemnity
Company
Voluntary
Liability
0.00 08-09-2020 08-09-2020 Other Enhanced Rate Cap 0.00 2.80 11.30
United Services Auto
Association Group
USAA General Indemnity
Company
Voluntary
Liability
0.00 05-18-2020 07-11-2020 Other rating variables - Revised rating
variable definition resulting in excess of
±5% change for some policyholders.
Symbols 0.00 2.80 11.30
United Services Auto
Association Group
USAA General Indemnity
Company
Physical
Damage
0.00 08-09-2020 08-09-2020 Other Enhanced Rate Cap 0.10 1.20 2.60
152
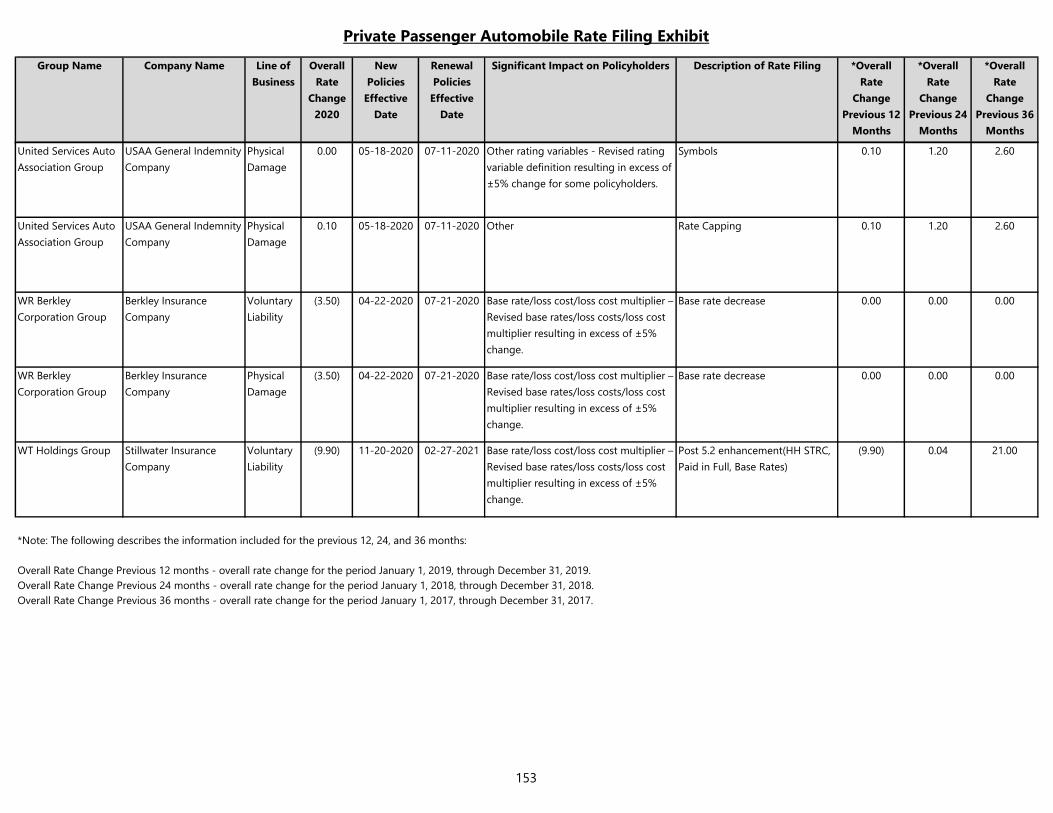
Private Passenger Automobile Rate Filing Exhibit
Group Name Company Name Line of
Business
Overall
Rate
Change
2020
New
Policies
Effective
Date
Renewal
Policies
Effective
Date
Significant Impact on Policyholders Description of Rate Filing *Overall
Rate
Change
Previous 12
Months
*Overall
Rate
Change
Previous 24
Months
*Overall
Rate
Change
Previous 36
Months
United Services Auto
Association Group
USAA General Indemnity
Company
Physical
Damage
0.00 05-18-2020 07-11-2020 Other rating variables - Revised rating
variable definition resulting in excess of
±5% change for some policyholders.
Symbols 0.10 1.20 2.60
United Services Auto
Association Group
USAA General Indemnity
Company
Physical
Damage
0.10 05-18-2020 07-11-2020 Other Rate Capping 0.10 1.20 2.60
WR Berkley
Corporation Group
Berkley Insurance
Company
Voluntary
Liability
(3.50) 04-22-2020 07-21-2020 Base rate/loss cost/loss cost multiplier –
Revised base rates/loss costs/loss cost
multiplier resulting in excess of ±5%
change.
Base rate decrease 0.00 0.00 0.00
WR Berkley
Corporation Group
Berkley Insurance
Company
Physical
Damage
(3.50) 04-22-2020 07-21-2020 Base rate/loss cost/loss cost multiplier –
Revised base rates/loss costs/loss cost
multiplier resulting in excess of ±5%
change.
Base rate decrease 0.00 0.00 0.00
WT Holdings Group Stillwater Insurance
Company
Voluntary
Liability
(9.90) 11-20-2020 02-27-2021 Base rate/loss cost/loss cost multiplier –
Revised base rates/loss costs/loss cost
multiplier resulting in excess of ±5%
change.
Post 5.2 enhancement(HH STRC,
Paid in Full, Base Rates)
(9.90) 0.04 21.00
*Note: The following describes the information included for the previous 12, 24, and 36 months:
Overall Rate Change Previous 12 months - overall rate change for the period January 1, 2019, through December 31, 2019. Overall Rate Change Previous 24 months - overall rate change for the period January 1, 2018, through December 31, 2018. Overall Rate Change Previous 36 months - overall rate change for the period January 1, 2017, through December 31, 2017.
153
Annual Legislative Report on Market Conditions
Texas Department of Insurance
Regulatory Policy Division
Publication ID: TDIALR0321
Related Documents