NACO National AIDS Control Organisation (NACO) Ministry of Health & Family Welfare New Delhi – 110 011 National Institute of Health & Family Welfare (NIHFW) Munirka, New Delhi – 110 067 Annual HIV Sentinel Surveillance Country Report 2006 vkjksX;e~ lq[klEink vkjksX;e~ lq[klEink

Welcome message from author
This document is posted to help you gain knowledge. Please leave a comment to let me know what you think about it! Share it to your friends and learn new things together.
Transcript

NACONational AIDS Control Organisation (NACO)Ministry of Health & Family WelfareNew Delhi – 110 011
National Institute of Health & Family Welfare (NIHFW)Munirka, New Delhi – 110 067
Annual HIV Sentinel Surveillance Country Report
2006
vkjksX;e~ lq[klEinkvkjksX;e~ lq[klEink


NACONational AIDS Control Organisation (NACO)
Ministry of Health & Family WelfareNew Delhi – 110 011
National Institute of Health & Family Welfare (NIHFW)Munirka, New Delhi – 110 067
Annual HIV Sentinel Surveillance Country Report
2006
Professor Deoki NandanDirector
Professor M. Bhattacharya Project Coordinator
vkjksX;e~ lq[klEinkvkjksX;e~ lq[klEink
© 2007 by the National Institute of Health and Family Welfare, New Delhi and National AIDS Control Organisation
Design, Layout and Printing by:New Concept Information Systems Pvt. Ltd.New Delhi - 110 076
For more information, please contact:Director/Project Coordinator(Annual Sentinel Surveillance for HIV Infection in India, 2006)National Institute of Health and Family Welfare (NIHFW)Munirka, New Delhi – 110067Phone: 011 – 26165959, 26714378, 26188485, 26107773
Joint Director, SurveillanceNational AIDS Control Organisation (NACO)9th Floor, Chanderlok Building36, Janpath, New Delhi – 110001Phone: 011-23325335

2006Annual Sentinel Surveillance Country Report iii
ForewordSince 1998, HIV sentinel surveillance has been conducted annually to track the HIV epidemic in the country. Generating high quality HIV surveillance data has been a top priority for the National AIDS Control Programme. Continuous efforts have been made to strengthen the surveillance system over the years. With the expansion of the sentinel sites from 703 sites in 2005 to 1,122 sites in 2006, we have richer data.
The good news is that HIV prevalence has begun to decline in the southern states where intensive prevention efforts have been in place for many years. There is evidence of decreasing HIV prevalence among sex workers and among young women attending antenatal clinics. However, despite the overall decline of HIV prevalence in the southern states, there are still many pockets of high HIV transmission. In the north-east, the dual HIV epidemic driven by unsafe sex and injecting drug use is highly concerning. Moreover, there are many new areas in the northern states where HIV is increasing, particularly among injecting drug users. Also, it is worrisome to note that several urban areas across the country are showing high HIV prevalence among men who have sex with men. These data indicate the need to sustain targeted prevention interventions in the southern and north-eastern states and to intensify the scale-up of similar prevention interventions in the northern states.
This report is the collective effort of many teams. I would like to congratulate and thank the staff of all sentinel sites, the Project Directors and the surveillance teams in the State AIDS Control Societies, and staff of the Regional Institutions who participated and contributed to this important activity. The efforts of the team at the National Institute of Health and Family Welfare who have provided continuing support in monitoring the sentinel surveillance activities since 1998 and in data management, analysis, and reporting writing is highly appreciated. I would also like to acknowledge the support of the World Health Organization, UNAIDS and other agencies in providing technical assistance in preparing the report.
The purpose of surveillance is action. I hope that all stakeholders will maximally use the information generated from sentinel surveillance for planning and implementing local responses to the epidemic.
Ms. K. Sujatha RaoAdditional Secretary and
Director GeneralNational AIDS Control Organisation
2006Annual Sentinel Surveillance Country Report iv
AcknowledgementsThe Institute is again thankful to Ms. Sujatha Rao, Special Secretary and DG, NACO for reposing faith and entrusting the responsibility to us.
The Institute and myself thank Dr. Jotna Sokhey, Additional Project Director for constant encouragement. Dr. Ajay Khera, Joint Director (Surveillance), NACO, deserves special thanks for his cooperation and valuable suggestions from time to time, to improve the quality of surveillance activities and reporting.
Dr. Renu Garg, Ms. Lea Hegg, WHO SEARO Offi ce, and Dr. Partha Haldar, WHO Country Offi ce are specially thanked for their untiring efforts towards preparation of this report.
We are very thankful to Dr. D. C. S. Reddy, WHO Consultant – Surveillance and Dr. Gurumurthy Rangaiyan, UNAIDS for their valuable advice.
Collection of quality data could not have been possible without the cooperation of the offi cers from the State AIDS Control Societies and the supervision by the teams from the Regional Institutes and by members of the Central Team. Many thanks to them.
This report could not have been made without constant guidance from Dr. Deoki Nandan, Director, NIHFW.
My sincere thanks are due to my team comprising of Dr. S. Gupta for help in supervision and monitoring, Mr. Subhash Chand, Dr. M. Baharuddin Shah and Dr. Ria Banerjee for data analysis, and to Ms. Vaishali, Ms. Vinod and Ms. Archana for their inputs in the successful completion of this report.
Professor M. BhattacharyaProject Coordinator
NIHFW
2006Annual Sentinel Surveillance Country Report v
Abbreviations and AcronymsAIDS Acquired Immunodefi ciency Syndrome
ANC Antenatal Clinic
ART Antiretroviral Therapy
BSS Behavioural Surveillance Survey
CSW Commercial Sex Worker
CHC Community Health Centre
CI Confi dence Interval
CMO Chief Medical Offi cer
FSW Female Sex Worker
HIV Human Immunodefi ciency Virus
HRG High Risk Group
IBBS Integrated Biological and Behavioural Surveys
ICTCs Integrated Counselling and Testing Centres
IDU Injecting Drug Users
MARP Most At Risk Populations
MCH Maternal and Child Health
MSM Men who have Sex with Men
MSW Male Sex Workers
NACO National AIDS Control Organisation
NIHFW National Institute of Health & Family Welfare
NGO Non-Governmental Organisation
PHC Primary Health Centre
PMTCT Prevention of Mother-to-Child Transmission
RI Regional Institute
SACS State AIDS Control Society
SEARO South East Asia Regional Offi ce (of WHO)
STD Sexually Transmitted Disease
TB Tuberculosis
TC Testing Centre
TI Targeted Intervention
VCT Voluntary Counselling and Testing
WHO World Health Organization

2006Annual Sentinel Surveillance Country Report vi
Contents
Foreword iii
Acknowledgements iv
Abbreviations and Acronyms v
List of Figures vii
List of Tables viii
Summary of Key Findings x
Recommendations xi
Introduction 1
Methodology 3
Results 5 HIV prevalence among populations at lower risk, All India 5 HIV prevalence among populations at higher risk, All India 8 Surveillance coverage by type of sentinel site 9 HIV epidemic in northeastern states 10 HIV epidemic in southern states 15 Newly emerging hotspots 20 Populations with high-risk behaviours 24 HIV prevalence by place of residence 28 HIV prevalence by type of sexually transmitted disease 29 HIV prevalence by demographic parameters 30
Limitations 32
Annexure I : Source Data for Tables & Figures 34
Annexure II : Sentinel Sites 42
Annexure III : Operational Issues & Recommendations 44
Annexure IV : State-specifi c Tables 46
2006Annual Sentinel Surveillance Country Report vii
List of Figures
Figure 1 : Number of antenatal sentinel sites, by location, India, 1998-2006 2Figure 2 : Number of sentinel sites in populations with high-risk behaviours,
India, 1998-2006 2Figure 3 : HIV seropositivity among antenatal clinic attendees, by district,
India, 2006 5Figure 4 : HIV seropositivity among antenatal clinic attendees at sentinel
sites located in urban areas, India, 2006 6Figure 5 : HIV seropositivity among antenatal clinic attendees at sentinel
sites located in peri-urban/rural areas, India, 2006 7Figure 6 : HIV seropositivity among patients with sexually transmitted
diseases, India, 2006 8Figure 7 : District-wise HIV seropositivity among antenatal attendees in
selected northeastern states, India, 2006 10Figure 8 : HIV prevalence among antenatal clinic attendees in Manipur and
Nagaland, India, 2003-2006 11Figure 9 : HIV prevalence among antenatal clinic attendees in selected
northeastern states† by age group, India, 2003-2006 11Figure 10 : HIV prevalence among antenatal clinic attendees, Tuensang
Civil Hospital clinic compared to Nagaland state average, India, 2003-2006 12
Figure 11 : HIV prevalence among antenatal clinic attendees in selected districts of Manipur compared to the state average, 2003-2006 12
Figure 12 : HIV prevalence among female sex workers in selected northeastern states, India, 2003-2006 13
Figure 13 : HIV prevalence among injecting drug users in selected northeastern states, India, 2002-2006 13
Figure 14 : HIV prevalence among injecting drug users in selected northeastern states, India, by age group, 2002-2006 14
Figure 15 : District-wise HIV seropositivity among antenatal clinic attendees in southern states, 2006 15
Figure 16 : HIV prevalence among antenatal attendees in selected southern states, India, 2003-2006 16
Figure 17 : HIV prevalence among antenatal clinic attendees in southern states, by age group, 2003-2006 16
Figure 18 : HIV prevalence among female sex workers in southern states (combined), India, 2003-2006 17
Figure 19 : HIV prevalence among female sex workers in southern states (combined) by age group, India, 2003-2006 17
Figure 20 : HIV prevalence among antenatal clinic attendees in selected districts of Tamil Nadu compared with the state average, 2003-2006 18
Figure 21 : HIV prevalence among antenatal clinic attendees in selected districts compared with the state average, Maharashtra, 2003-2006 18
Figure 22 : HIV prevalence among antenatal clinic attendees in selected districts of Andhra Pradesh compared with the state average, 2003-2006 19
Figure 23 : HIV prevalence among antenatal clinic attendees in selected districts of Karnataka compared with the state average, 2003-2006 19
Figure 24 : Emerging hotspots, by sentinel group and district, India, 2006 20

2006Annual Sentinel Surveillance Country Report viii
Figure 25 : HIV prevalence among antenatal clinic attendees in Orissa and Rajasthan (combined), by age group, India, 2003-2006 21
Figure 26 : HIV prevalence among female sex workers at selected sentinel sites, West Bengal, India, 2003-2006 21
Figure 27 : HIV prevalence among men who have sex with men (MSM) and injecting drug users (IDUs) in Chandigarh, India, 2004-2006 22
Figure 28 : HIV prevalence among populations with high-risk behaviours, Surat, Gujarat, India, 2003-2006 22
Figure 29 : HIV prevalence among migrants and antenatal clinic (ANC) attendees, Ganjam district, Orissa, India, 2003-2006 23
Figure 30 : HIV prevalence among female sex workers by state, India, 2006 24Figure 31 : HIV prevalence among injecting drug users, by state, India, 2006 25Figure 32 : HIV prevalence among men who have sex with men by sentinel
site, India, 2006 26Figure 33 : HIV prevalence among men who have sex with men at selected
sentinel sites, India, 2004-2006 27Figure 34 : HIV prevalence among antenatal clinic attendees, by place of
residence, India, 2006 28Figure 35 : HIV prevalence among antenatal clinic attendees in selected states
of India, by place of residence, 2006 28Figure 36 : HIV prevalence among patients with a sexually transmitted
infection, by type of sexually transmitted disease and by gender, India, 2006 29
Figure 37 : HIV prevalence among patients with a sexually transmitted disease (STD) by type of STD syndrome and by region, India, 2006 29
Figure 38 : HIV prevalence among antenatal clinic attendees by age group, India, 2006 30
Figure 39 : HIV prevalence among antenatal clinic attendees by literacy, India, 2006 30
Figure 40 : HIV prevalence among antenatal clinic attendees by occupation of
spouse, India, 2006 31
List of Tables
Table 1 : Number of surveillance sites by population group and state, India, 2006 9
Table 2 : HIV prevalence among antenatal clinic attendees in Manipur and Nagaland, India, 2003-2006 34
Table 3 : HIV prevalence among antenatal clinic attendees in selected northeastern states by age group, India, 2003-2006 34
Table 4 : HIV prevalence among antenatal clinic attendees, Tuensang Civil Hospital clinic compared with the Nagaland state average, India, 2003-2006 34
Table 5 : HIV prevalence among antenatal clinic attendees in selected districts of Manipur, India, 2003-2006 35
Table 6 : HIV prevalence among female sex workers in selected northeastern states, India, 2003-2006 35
Table 7 : HIV prevalence among injecting drug users in selected northeastern states, India, 2002-2006 35
2006Annual Sentinel Surveillance Country Report ix
Table 8 : HIV prevalence among injecting drug users in selected northeastern states, India, by age group, 2002-2006 35
Table 9 : HIV prevalence among antenatal clinic attendees in selected southern states, India, 2003-2006 36
Table 10 : HIV prevalence at antenatal clinic sites in southern states, by age group, 2003-2006 36
Table 11 : HIV prevalence among female sex workers in southern high prevalence states (combined), India, 2003-2006 36
Table 12 : HIV prevalence among female sex workers in southern high prevalence states (combined), by age group, India, 2003-2006 36
Table 13 : HIV prevalence among antenatal clinic attendees in selected districts of Tamil Nadu compared with the state average, 2003-2006 37
Table 14 : HIV prevalence among antenatal clinic attendees at selected districts compared with the state average, Maharashtra, 2002-2006 37
Table 15 : HIV prevalence among antenatal clinic attendees in selected districts of Andhra Pradesh compared with the state average, 2003-2006 37
Table 16 : HIV prevalence among antenatal clinic attendees in selected districts of Karnataka compared with the state average, 2003-2006 38
Table 17 : HIV prevalence among antenatal clinic attendees in Orissa and Rajasthan (combined), India, by age group, 2003-2006 38
Table 18 : HIV prevalence among female sex workers, West Bengal, India, 2003-2006 38
Table 19 : HIV prevalence among IDU and MSM sentinel groups in Chandigarh, India, 2004-2006 38
Table 20 : HIV prevalence among men who have sex with men at selected sentinel sites, India, 2004-2006 39
Table 21 : HIV prevalence among antenatal clinic attendees, by place of residence, India, 2006 39
Table 22 : HIV prevalence among antenatal clinic attendees in selected states of India, by place of residence, 2006 39
Table 23 : HIV prevalence among patients with a sexually transmitted infection, by type of sexually transmitted disease and gender, India, 2006 40
Table 24 : HIV prevalence among antenatal attendees by age group, India, 2006 40
Table 25 : HIV prevalence among antenatal clinic attendees by literacy, India, 2006 41
Table 26 : HIV prevalence among antenatal clinic attendees by occupation of spouse, India, 2006 41
2006Annual Sentinel Surveillance Country Report x
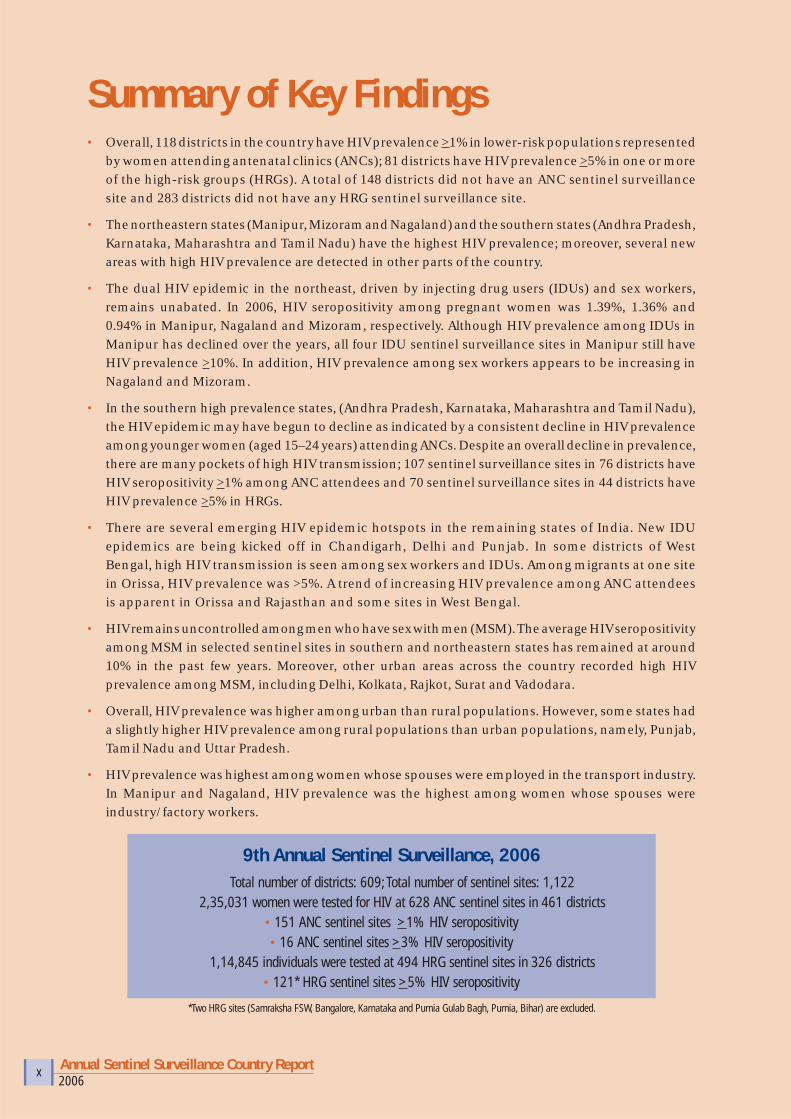
Summary of Key Findings • Overall, 118 districts in the country have HIV prevalence >1% in lower-risk populations represented
by women attending antenatal clinics (ANCs); 81 districts have HIV prevalence >5% in one or more of the high-risk groups (HRGs). A total of 148 districts did not have an ANC sentinel surveillance site and 283 districts did not have any HRG sentinel surveillance site.
• The northeastern states (Manipur, Mizoram and Nagaland) and the southern states (Andhra Pradesh, Karnataka, Maharashtra and Tamil Nadu) have the highest HIV prevalence; moreover, several new areas with high HIV prevalence are detected in other parts of the country.
• The dual HIV epidemic in the northeast, driven by injecting drug users (IDUs) and sex workers, remains unabated. In 2006, HIV seropositivity among pregnant women was 1.39%, 1.36% and 0.94% in Manipur, Nagaland and Mizoram, respectively. Although HIV prevalence among IDUs in Manipur has declined over the years, all four IDU sentinel surveillance sites in Manipur still have HIV prevalence >10%. In addition, HIV prevalence among sex workers appears to be increasing in Nagaland and Mizoram.
• In the southern high prevalence states, (Andhra Pradesh, Karnataka, Maharashtra and Tamil Nadu), the HIV epidemic may have begun to decline as indicated by a consistent decline in HIV prevalence among younger women (aged 15–24 years) attending ANCs. Despite an overall decline in prevalence, there are many pockets of high HIV transmission; 107 sentinel surveillance sites in 76 districts have HIV seropositivity >1% among ANC attendees and 70 sentinel surveillance sites in 44 districts have HIV prevalence >5% in HRGs.
• There are several emerging HIV epidemic hotspots in the remaining states of India. New IDU epidemics are being kicked off in Chandigarh, Delhi and Punjab. In some districts of West Bengal, high HIV transmission is seen among sex workers and IDUs. Among migrants at one site in Orissa, HIV prevalence was >5%. A trend of increasing HIV prevalence among ANC attendees is apparent in Orissa and Rajasthan and some sites in West Bengal.
• HIV remains uncontrolled among men who have sex with men (MSM). The average HIV seropositivity among MSM in selected sentinel sites in southern and northeastern states has remained at around 10% in the past few years. Moreover, other urban areas across the country recorded high HIV prevalence among MSM, including Delhi, Kolkata, Rajkot, Surat and Vadodara.
• Overall, HIV prevalence was higher among urban than rural populations. However, some states had a slightly higher HIV prevalence among rural populations than urban populations, namely, Punjab, Tamil Nadu and Uttar Pradesh.
• HIV prevalence was highest among women whose spouses were employed in the transport industry. In Manipur and Nagaland, HIV prevalence was the highest among women whose spouses were industry/factory workers.
9th Annual Sentinel Surveillance, 2006 Total number of districts: 609; Total number of sentinel sites: 1,122 2,35,031 women were tested for HIV at 628 ANC sentinel sites in 461 districts
• 151 ANC sentinel sites >1% HIV seropositivity• 16 ANC sentinel sites >3% HIV seropositivity
1,14,845 individuals were tested at 494 HRG sentinel sites in 326 districts• 121* HRG sentinel sites >5% HIV seropositivity
*Two HRG sites (Samraksha FSW, Bangalore, Karnataka and Purnia Gulab Bagh, Purnia, Bihar) are excluded.
2006Annual Sentinel Surveillance Country Report x

2006Annual Sentinel Surveillance Country Report xi
RecommendationsFor Programme• Strengthen behaviour change communication campaigns among mobile populations including
truckers, hotel staff, factory workers, migrants and labourers.
• Initiate intensive prevention interventions among injecting drug users (IDUs) in newly emerging high HIV transmission areas, such as Chandigarh, Delhi, Orissa, Punjab and West Bengal. Also, reinforce prevention interventions among IDUs in other areas where HIV among IDUs has remained persistently high.
• Increase the reach and effectiveness of prevention programmes for men who have sex with men (MSM) and transgendered populations.
• Increase the reach of HIV prevention, treatment and care activities in rural areas.
• Continue to sustain interventions for high-risk groups (HRGs) in the southern states and consider providing integrated counselling and testing services at the block level in districts with HIV prevalence above 1% among antenatal clinic (ANC) attendees.
For Surveillance• Increase surveillance sites for HRGs, namely IDUs, female sex workers, MSM, trangendered and
migrant populations particularly in those states where one or more high HIV transmission areas have already been detected. These include Bihar, Gujarat, Madhya Pradesh, Orissa and Uttar Pradesh.
• Involve non-governmental organisations (NGOs) in the planning and identifi cation of new sites for HRGs.
• Increase capacity of NGOs in surveillance activities.
• Use all sources of data, including that from behavioural surveillance surveys, voluntary counselling and testing (VCT) and prevention of mother to child transmission (PMTCT) programme, to identify potential locations for new sentinel sites.
• Identify additional sentinel sites in the same geographical area where adequate sample size is not attained, and combine multiple sites to form one composite site for that geographical area.
For Research• Undertake behavioural surveys among mobile populations and other HRGs, such as MSM and
transgendered population, to identify how the impact of prevention programmes can be maximised.
• Assess the utility of PMTCT data to measure trends in HIV infection among pregnant women. If there is a good correlation between trends in PMTCT data and trends in ANC sentinel surveillance data, then ANC sentinel sites may be phased out over a period of time.
• Similarly, undertake analysis to see if there is a correlation between VCT data and sexually transmitted diseases (STD) sentinel surveillance data. If there is a good correlation, some of the STD sites may be phased out over a period of time.
• Undertake appropriate operations research to determine HIV prevalence among populations who do not get included in the sentinel surveillance (e.g., women who deliver at home, women who attend private clinics, women in rural areas, HRGs who do not access targeted interventions sites). Understanding differences in HIV prevalence among populations that are not included in the sentinel surveillance and populations that are included in the sentinel surveillance, should lead to a better understanding of how the sentinel surveillance data could be interpreted.
2006Annual Sentinel Surveillance Country Report xi

2006Annual Sentinel Surveillance Country Report 1
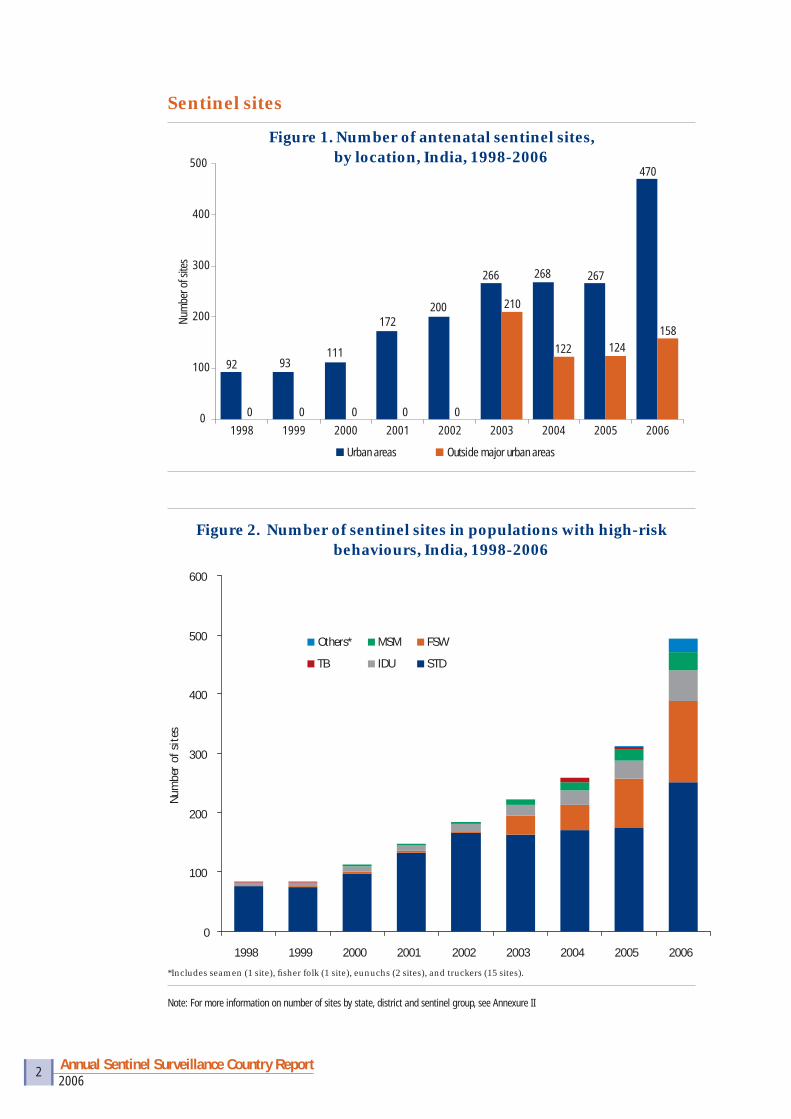
Surveillance for the human immunodefi ciency virus (HIV) in India began in 1985, even before the fi rst case of HIV infection was reported in May 1986 from Chennai, Tamil Nadu. In the past two decades, the HIV epidemic in India has continued to expand and by 2007, every state in the country has reported a case of HIV infection. Over the years, the surveillance system has also expanded to keep track of the epidemic. Until 1992, surveillance was undertaken in 62 surveillance sites and nine referral centres. In 1993–94, sentinel surveillance was initiated among antenatal attendees and patients with sexually transmitted diseases (STDs). The sentinel surveillance system was further strengthened in 1998 and since then systematic nationwide annual HIV sentinel surveillance (HSS) has been conducted among several population groups, including pregnant women, individuals attending STD clinics, female sex workers (FSWs), men who have sex with men (MSM), and injecting drug users (IDUs). The HSS has been expanded from 164 sites in 1998 to 703 sites in 2005 and 1,122 sites in 2006 (Figures 1 and 2).
In 2006, HSS was carried out in 628 antenatal clinic (ANC) sites, 251 STD clinic sites, 51 IDU sites, 31 MSM sites, 138 FSW sites, 6 migrants sites, 15 truckers sites, 1 eunuch site and 1 fi sher folk site. A total of 3,49,876 persons were tested for HIV from these population groups and included 2,35,031 female ANC attendees representing the lower risk population and 1,14,845 men and women in HRGs representing populations with high-risk behaviours.
The objectives of the HIV sentinel surveillance are to:
• Monitor trends in the prevalence of HIV infection over time.
• Assess the prevalence of HIV infection in different population subgroups and in different geographical areas.
• Provide information on changes or trends in distribution of infection by geographic and socio-demographic parameters.
• Identify groups or geographical areas for targeted intervention efforts (national, district, local).
• Provide data to assist with public health decision-making, including: � Advocacy � Targeting and prioritising prevention and care programmes � Monitoring and evaluating prevention and care programmes � Resource allocation and programme planning.
• Generate data for use in HIV estimates and projections.
• Guide scientifi c research.
Introduction
2006Annual Sentinel Surveillance Country Report 2
0 0 0 0 00
100
200
300
400
500
1998 1999 2000 2001 2002 2003 2004 2005 2006
Num
ber o
f site
s
Urban areas Outside major urban areas
92 93111
172200
266 268 267
470
158124122
210
Figure 2. Number of sentinel sites in populations with high-risk behaviours, India, 1998-2006
0
100
200
300
400
500
600
1998 1999 2000 2001 2002 2003 2004 2005 2006
Num
ber
of s
ites
Others*
TB
MSM
IDU
FSW
STD
*Includes seamen (1 site), fi sher folk (1 site), eunuchs (2 sites), and truckers (15 sites).
Note: For more information on number of sites by state, district and sentinel group, see Annexure II
Sentinel sites
Figure 1. Number of antenatal sentinel sites, by location, India, 1998-2006
2006Annual Sentinel Surveillance Country Report 3
Survey populations• Women attending ANCs were included as a proxy for the general population at
lower risk of HIV transmission.
• The HRG populations were represented by patients attending STD clinics, FSWs, MSM at drop-in centres, and IDUs at drug de-addiction centres. These clinics/centres constituted the designated sentinel sites.
• Other HRGs included truckers, eunuch, fi sher folk and migrants.
Sampling frame• All individuals attending the designated sentinel sites during the period of
surveillance — 1 September to 30 November 2006.
Sample size• ANC site: sample size was 400.
• HRG site: sample size was 250.
• STD sites: sample size was 250. To ensure adequate representation of women in the STD sample and to get a comparative indication of the HIV prevalence among females and males, the sample of 250 at the STD sites was completed from two sources: 150 patients from the STD clinic and 100 from the gynaecology clinic (except for Andhra Pradesh and Tamil Nadu, where all 250 patients were enrolled from the STD clinics only).
Sampling technique• Consecutive sampling was done at each designated sentinel site, i.e., every
person attending the clinic for the fi rst time during the survey period who met the inclusion criteria was sampled until the required sample size was achieved.
HIV testing• Unlinked anonymous testing.
• A two-test strategy was adopted (Elisa-Rapid test or Rapid-Rapid).
Data collection• Personal information was recorded for persons whose blood specimens
were collected for syphilis testing at the sentinel site(s). The information, except for unique individual identifi ers, was transcribed into a standardised surveillance format.
• The collected blood specimen was split into two parts. One part, which was preserved along with the individual identifi ers, was tested for syphilis and the result was communicated to the individual.
Methodology

2006Annual Sentinel Surveillance Country Report 4
• The second part, without personal identifi ers, was separately coded. (This code cannot be linked back to the individual.) This coded specimen was tested for HIV and syphilis.
• All formats along with the coded specimen were sent to the testing laboratories, from where, following testing, the results and the formats were further sent to the State AIDS Control Society (SACS).
• Data from all SACS were entered into a web-based software at the NIHFW web site.
• The compilation, analysis and interpretation of the data were done at NIHFW.
Quality control measures• Overall coordination, orientation training, supervision and monitoring of all
the data collection activities were done by the NIHFW.
• Five regional institutes (RIs) supervised the activities of the sentinel sites and HIV testing centres during the surveillance period in the states allotted to each RI.
2006Annual Sentinel Surveillance Country Report 5
Results
HIV prevalence among populations at lower risk, All India
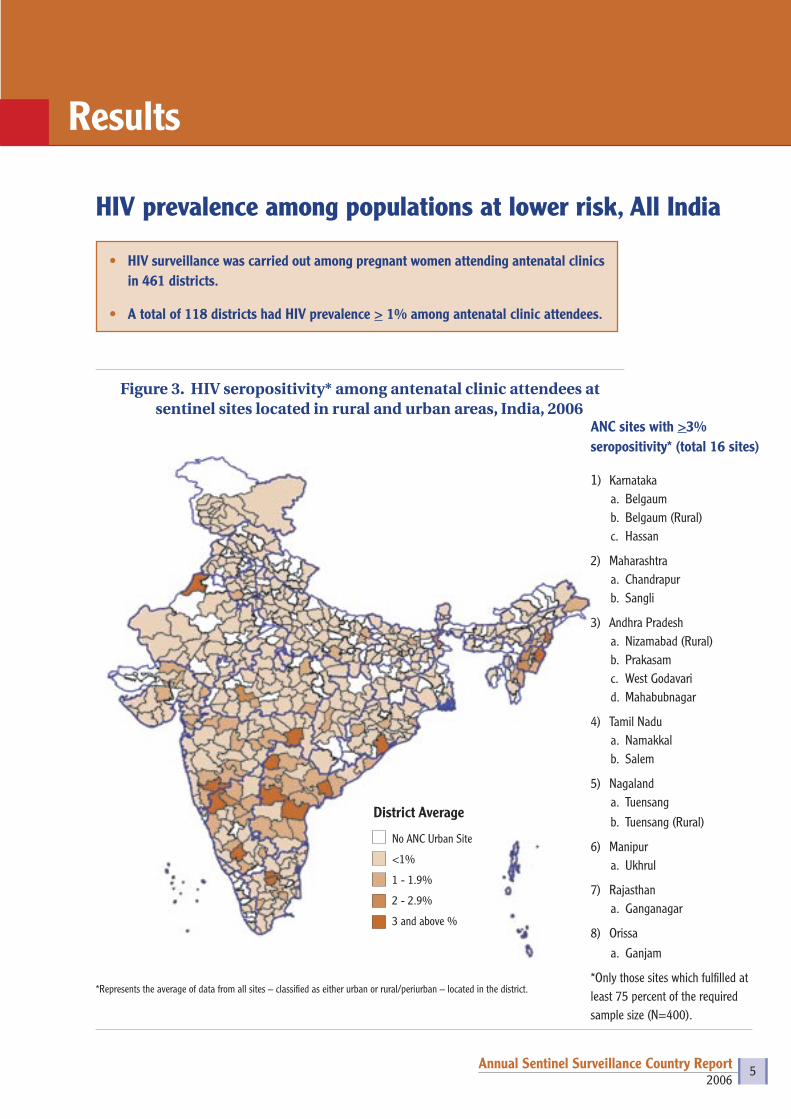
Figure 3. HIV seropositivity* among antenatal clinic attendees at sentinel sites located in rural and urban areas, India, 2006
*Represents the average of data from all sites – classified as either urban or rural/periurban – located in the district.
District Average
No ANC Urban Site
<1%
1 - 1.9%
2 - 2.9%
3 and above %
ANC sites with >3% seropositivity* (total 16 sites)
1) Karnatakaa. Belgaumb. Belgaum (Rural)c. Hassan
2) Maharashtraa. Chandrapurb. Sangli
3) Andhra Pradesha. Nizamabad (Rural)b. Prakasamc. West Godavarid. Mahabubnagar
4) Tamil Nadua. Namakkal b. Salem
5) Nagalanda. Tuensangb. Tuensang (Rural)
6) Manipura. Ukhrul
7) Rajasthana. Ganganagar
8) Orissaa. Ganjam
*Only those sites which fulfilled at least 75 percent of the required sample size (N=400).
• HIV surveillance was carried out among pregnant women attending antenatal clinics in 461 districts.
• A total of 118 districts had HIV prevalence > 1% among antenatal clinic attendees.

2006Annual Sentinel Surveillance Country Report 6
ANC sentinel sites located in urban areas
• Of a total of 470 urban ANC sentinel sites, 104 sites had HIV seropositivity > 1% and 13 sites had seropositivity > 3% (Figure 4).
• While majority of urban sites with HIV seropositivity >1% were in six states (Maharashtra, Tamil Nadu, Karnataka, Andhra Pradesh, Nagaland, and Manipur), a signifi cant number i.e., 24 sites were in other states.
Figure 4. HIV seropositivity among antenatal clinic attendees at sentinel sites located in urban areas, India, 2006
Sentinel Sites
No ANC Urban Site
<1%
1 - 1.9%
2 - 2.9%
3 and above %
ANC sites with >3% seropositivity*
1) Karnataka a. Belgaumb. Hassan
2) Andhra Pradesh a. Prakasam b. Mahabubnagarc. West Godavari
3) Tamil Nadua. Namakkal b. Salem
4) Maharashtraa. Sanglib. Chandrapur
5) Rajasthana. Ganganagar
6) Orissaa. Ganjam
7) Manipura. Ukhrul
8) Nagalanda. Tuensang
2006Annual Sentinel Surveillance Country Report 7
ANC sentinel sites in peri-urban/rural areas
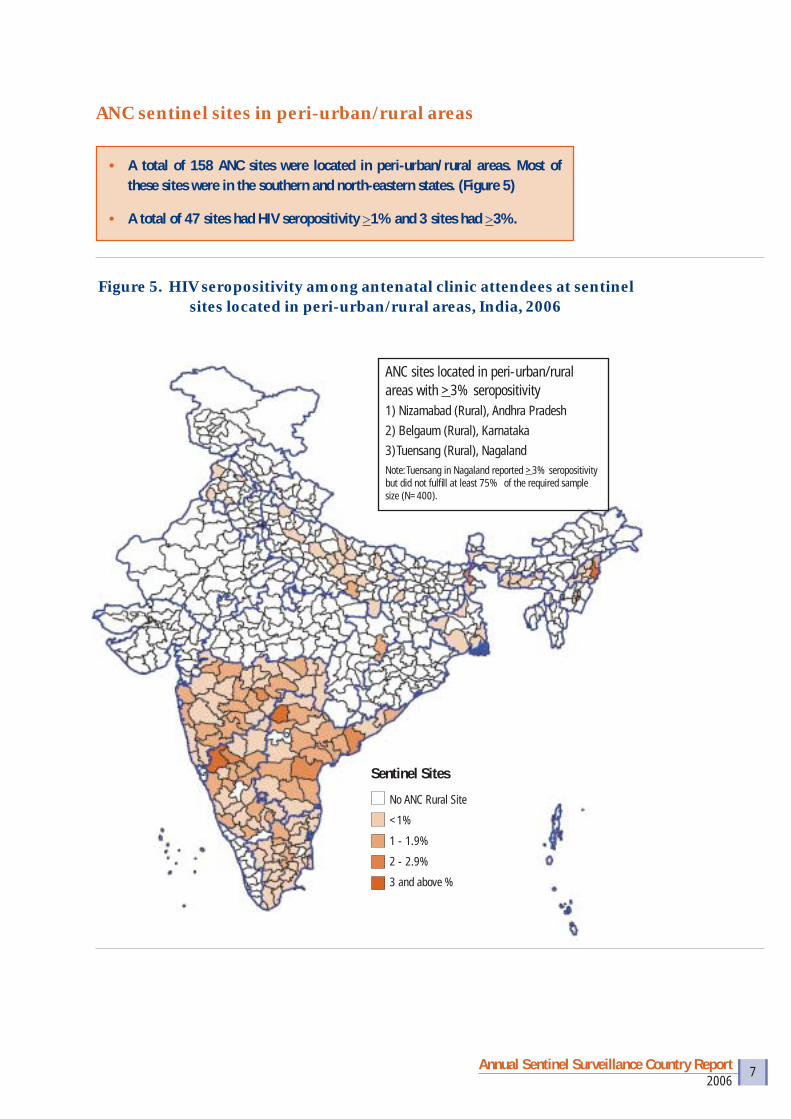
• A total of 158 ANC sites were located in peri-urban/rural areas. Most of these sites were in the southern and north-eastern states. (Figure 5)
• A total of 47 sites had HIV seropositivity >1% and 3 sites had >3%.
Figure 5. HIV seropositivity among antenatal clinic attendees at sentinel sites located in peri-urban/rural areas, India, 2006
ANC sites located in peri-urban/rural areas with >3% seropositivity1) Nizamabad (Rural), Andhra Pradesh2) Belgaum (Rural), Karnataka3) Tuensang (Rural), NagalandNote: Tuensang in Nagaland reported >3% seropositivity but did not fulfi ll at least 75% of the required sample size (N=400).
Sentinel Sites
No ANC Rural Site
<1%
1 - 1.9%
2 - 2.9%
3 and above %
2006Annual Sentinel Surveillance Country Report 8
HIV prevalence among populations at higher risk, All India
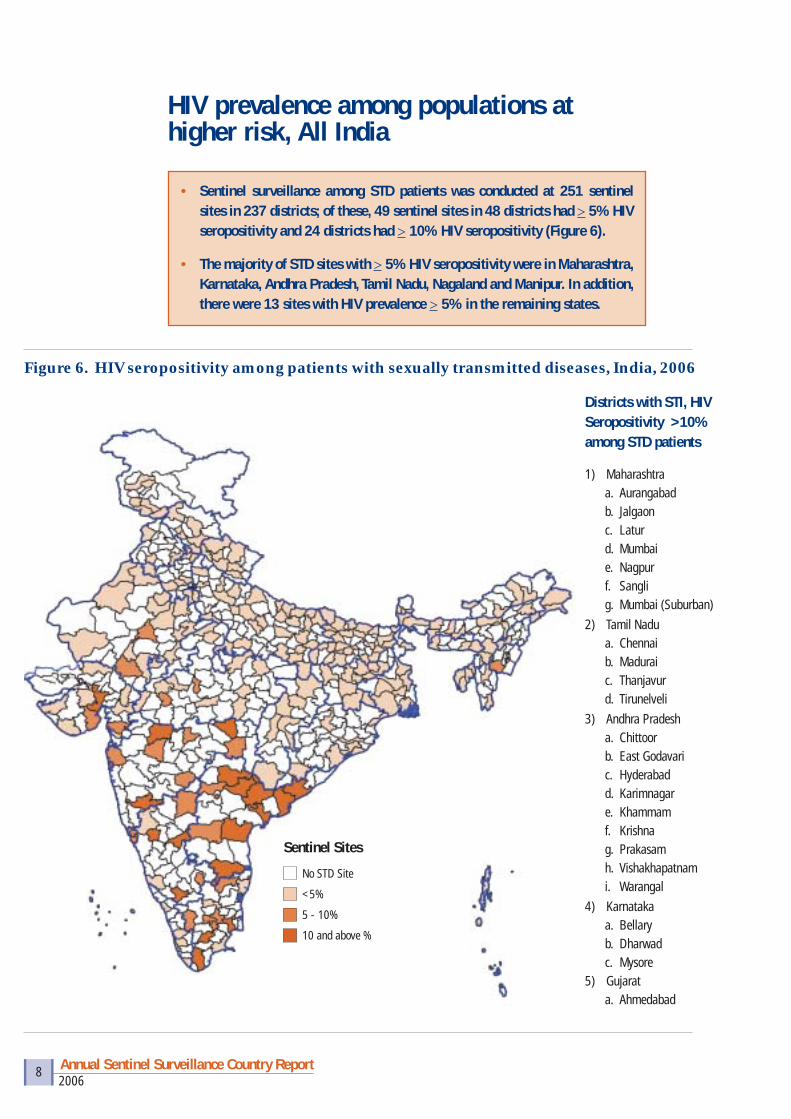
• Sentinel surveillance among STD patients was conducted at 251 sentinel sites in 237 districts; of these, 49 sentinel sites in 48 districts had > 5% HIV seropositivity and 24 districts had > 10% HIV seropositivity (Figure 6).
• The majority of STD sites with > 5% HIV seropositivity were in Maharashtra, Karnataka, Andhra Pradesh, Tamil Nadu, Nagaland and Manipur. In addition, there were 13 sites with HIV prevalence > 5% in the remaining states.
Figure 6. HIV seropositivity among patients with sexually transmitted diseases, India, 2006
Districts with STI, HIV Seropositivity >10% among STD patients
1) Maharashtra a. Aurangabadb. Jalgaon c. Laturd. Mumbai e. Nagpur f. Sanglig. Mumbai (Suburban)
2) Tamil Nadu a. Chennaib. Madurai c. Thanjavurd. Tirunelveli
3) Andhra Pradesh a. Chittoor b. East Godavari c. Hyderabad d. Karimnagare. Khammamf. Krishna g. Prakasamh. Vishakhapatnami. Warangal
4) Karnatakaa. Bellaryb. Dharwad c. Mysore
5) Gujarata. Ahmedabad
Sentinel Sites
No STD Site
<5%
5 - 10%
10 and above %

2006Annual Sentinel Surveillance Country Report 9
Surveillance coverage by type of sentinel site• Of 609 districts, ANC surveillance was conducted in 461 districts; of these
118 had HIV seropositivity >1%; in all, 148 districts did not have an ANC site (Table 1).
• Of 326 districts with HRG site, 81 had seropositivity >5%; in all, 283 districts did not have surveillance among high-risk groups (Table 1).
Table 1: Number of surveillance sites by population group and state, India, 2006
State Total no. of districts
No. of districts with ANC site
No. of districts with ANC
+vity >1%*
No. of districts with no ANC
site
No. of districts with HRG site
No. of districts in which HRG +vity >5%*
No. of districts with no HRG
site
A & N Islands 2 2 0 0 1 0 1Andhra Pradesh 23 23 19 0 12 12 11Arunachal Pradesh 16 5 1 11 7 0 9Assam 23 15 0 8 15 0 8Bihar 38 23 1 15 28 1 10Chandigarh 1 1 0 0 1 1 0Chhattisgarh 16 15 1 1 6 0 10Daman & Diu 2 2 0 0 0 0 2Dadra & Nagar Haveli 1 1 0 0 0 0 1Delhi 9 5 0 4 8 3 1Goa 2 1 0 1 2 2 0Gujarat 25 25 6 0 11 5 14Haryana 20 12 1 8 12 0 8Himachal Pradesh 12 8 0 4 6 0 6Jammu & Kashmir 14 14 0 0 6 0 8Jharkhand 22 12 0 10 11 0 11Karnataka 27 27 24 0 7 6 20Kerala 14 6 0 8 14 1 0Lakshadweep 1 1 0 0 1 0 0Madhya Pradesh 48 36 4 12 15 2 33Maharashtra 35 35 23 0 15 15 20Manipur 9 9 8 0 5 4 4Meghalaya 7 6 0 1 2 0 5Mizoram 8 3 2 5 7 2 1Nagaland 11 11 8 0 8 3 3Orissa 30 23 4 7 18 2 12Pondicherry 4 2 0 2 2 1 2Punjab 17 10 0 7 9 2 8Rajasthan 32 25 1 7 21 3 11Sikkim 4 2 0 2 2 0 2Tamil Nadu 30 30 10 0 18 11 12Tripura 4 1 0 3 4 0 0Uttar Pradesh 70 51 3 19 31 0 39Uttarakhand 13 7 0 6 7 0 6West Bengal 19 12 2 7 14 5 5Total 609 461 118 148 326 81 283
*Sites with less than N=100 sample size excluded from this category. Excluded ANC sites include Kausambi (UP) and Saharsa (Bihar). Excluded HRG sites include Purnia (FSW, Bihar) and Bangalore-Samraksha (FSW, Karnataka).

2006Annual Sentinel Surveillance Country Report 10
HIV epidemic in northeastern1 states
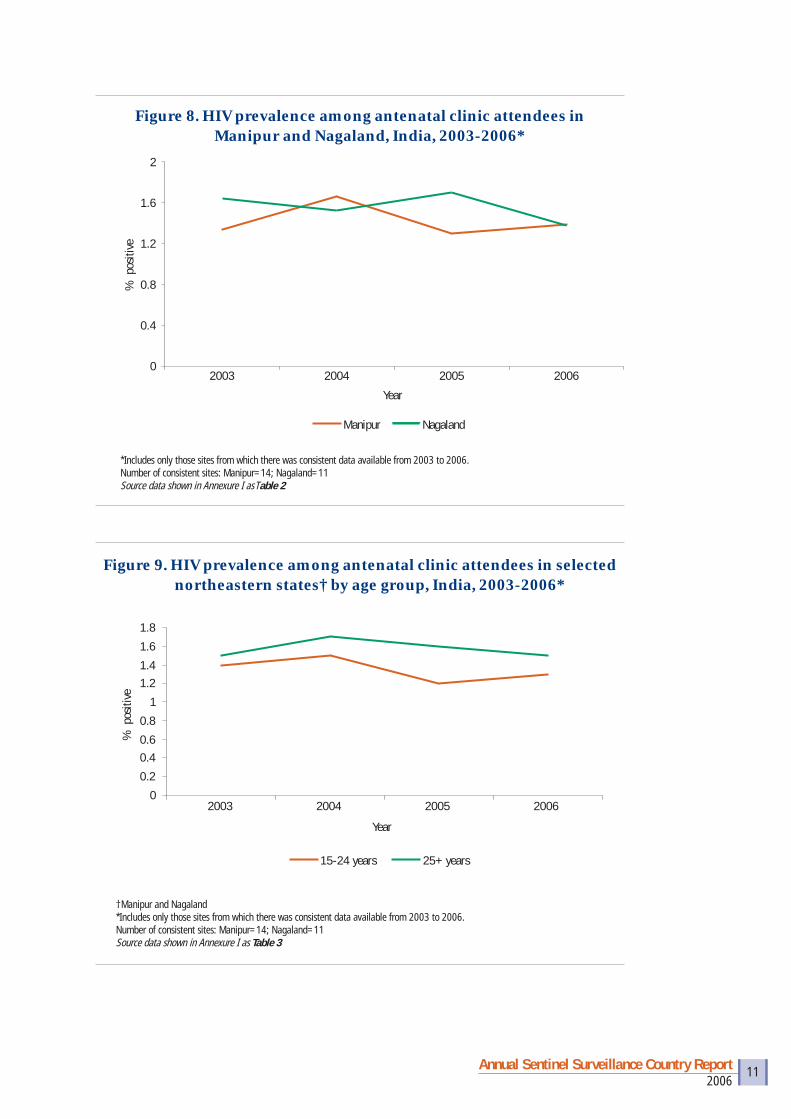
• HIV prevalence in the northeastern states remains high. Half the ANC sentinel sites (19/37) in Manipur, Nagaland and Mizoram had HIV seropositivity >1% (Figures 7,8,9).
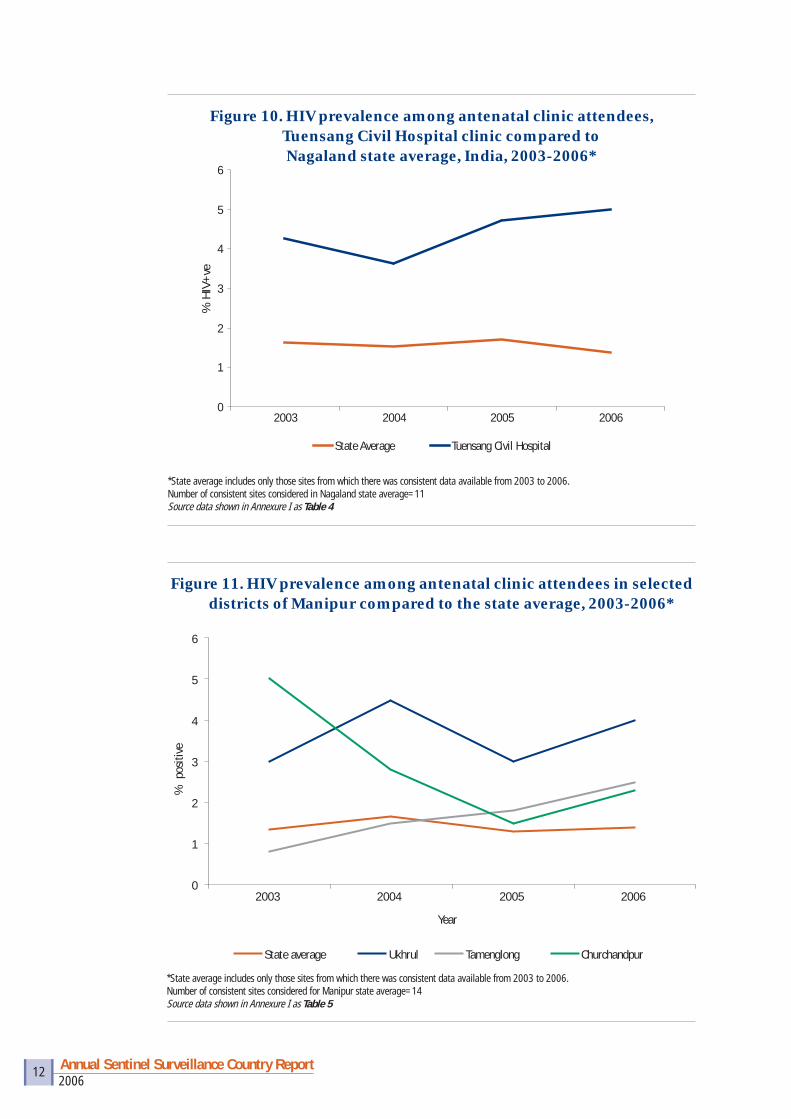
• Several districts in Manipur (Ukhrul, Churachandpur and Tamenglong) and in Nagaland (Tuensang) show high or increasing HIV seropositivity among antenatal clinic attendees (Figures 10, 11).
• Among sex workers, HIV prevalence is decreasing in Manipur but increasing in Nagaland (Figure 12).
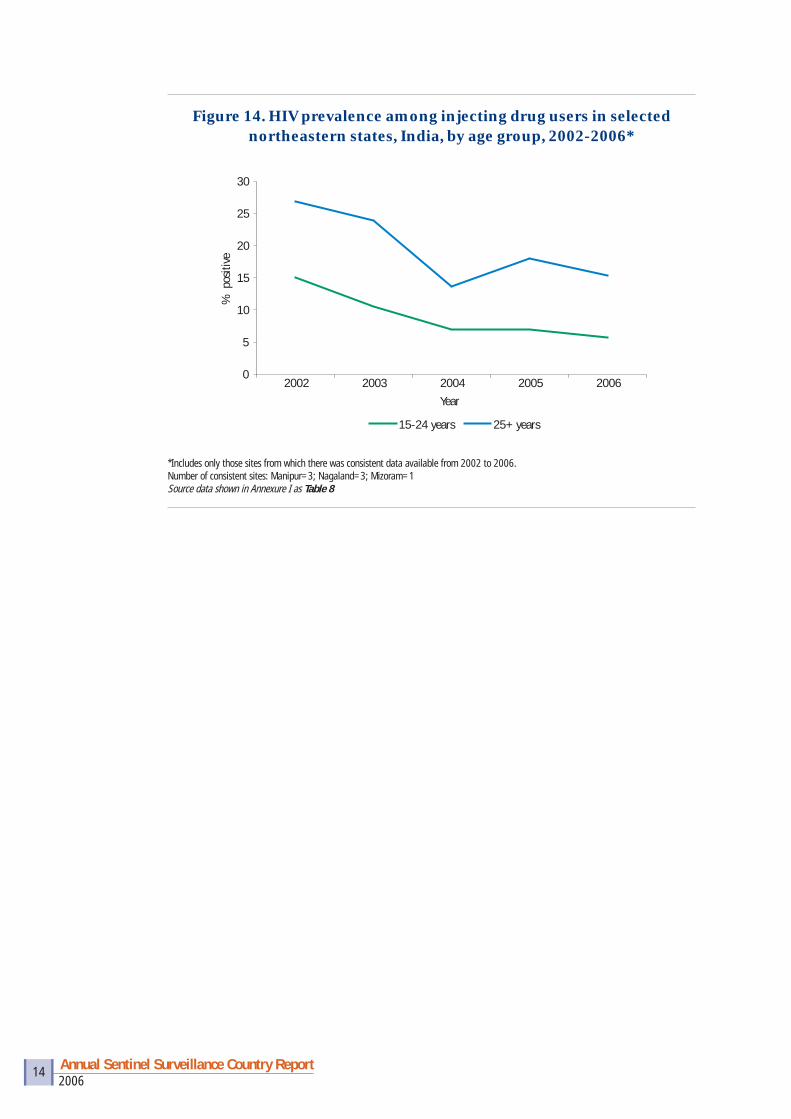
• Among injecting drug users, HIV prevalence has decreased signifi cantly in Manipur and Nagaland; the decrease is particularly noted in younger IDUs, suggesting a reduction in new infections among IDUs (Figures 13, 14).
Figure 7. District-wise HIV seropositivity among antenatal attendees in selected northeastern states, India, 2006
1 North-eastern states refer to Manipur, Mizoram and Nagaland
Nagaland
Manipur
Mizoram
Sentinel Sites No ANC Site <1% 1 - 1.9% 2 - 2.9% 3 and above %
2006Annual Sentinel Surveillance Country Report 11
Figure 8. HIV prevalence among antenatal clinic attendees in Manipur and Nagaland, India, 2003-2006*
0
0.4
0.8
1.2
1.6
2
2003 2004 2005 2006
Year
% p
ositi
ve
Manipur Nagaland
*Includes only those sites from which there was consistent data available from 2003 to 2006. Number of consistent sites: Manipur=14; Nagaland=11Source data shown in Annexure I as Table 2
Figure 9. HIV prevalence among antenatal clinic attendees in selected northeastern states† by age group, India, 2003-2006*
0
0.2
0.40.6
0.8
1
1.21.4
1.6
1.8
2003 2004 2005 2006
Year
% p
ositi
ve
15-24 years 25+ years
†Manipur and Nagaland*Includes only those sites from which there was consistent data available from 2003 to 2006. Number of consistent sites: Manipur=14; Nagaland=11Source data shown in Annexure I as Table 3
2006Annual Sentinel Surveillance Country Report 12
Figure 10. HIV prevalence among antenatal clinic attendees, Tuensang Civil Hospital clinic compared to Nagaland state average, India, 2003-2006*
0
1
2
3
4
5
6
2003 2004 2005 2006
% H
IV+
ve
State Average Tuensang Civil Hospital
*State average includes only those sites from which there was consistent data available from 2003 to 2006. Number of consistent sites considered in Nagaland state average=11Source data shown in Annexure I as Table 4
Figure 11. HIV prevalence among antenatal clinic attendees in selected districts of Manipur compared to the state average, 2003-2006*
0
1
2
3
4
5
6
2003 2004 2005 2006
Year
% p
ositi
ve
State average Ukhrul Tamenglong Churchandpur
*State average includes only those sites from which there was consistent data available from 2003 to 2006. Number of consistent sites considered for Manipur state average=14Source data shown in Annexure I as Table 5

2006Annual Sentinel Surveillance Country Report 13
Figure 12. HIV prevalence among female sex workers in selected northeastern states, India, 2003-2006*
0
2
4
6
8
10
12
14
16
18
2003 2004 2005 2006Year
% p
ositi
ve
Manipur Nagaland
*Includes only those sites from which there was consistent data available from 2003 to 2006.Number of consistent sites: Manipur=1; Nagaland=1Source data shown in Annexure I as Table 6
Figure 13. HIV prevalence among injecting drug users in selected northeastern states, India, 2002-2006*
0
5
10
15
20
25
30
35
40
45
2002 2003 2004 2005 2006
Year
% p
ositi
ve
Manipur Nagaland Mizoram
*Includes only those sites from which there was consistent data available from 2002 to 2006. Number of consistent sites: Manipur=3; Nagaland=3; Mizoram=1Source data shown in Annexure I as Table 7
2006Annual Sentinel Surveillance Country Report 14
Figure 14. HIV prevalence among injecting drug users in selected northeastern states, India, by age group, 2002-2006*
*Includes only those sites from which there was consistent data available from 2002 to 2006. Number of consistent sites: Manipur=3; Nagaland=3; Mizoram=1Source data shown in Annexure I as Table 8
0
5
10
15
20
25
30
2002 2003 2004 2005 2006Year
% p
ositi
ve
15-24 years 25+ years
2006Annual Sentinel Surveillance Country Report 15
HIV epidemic in southern states2
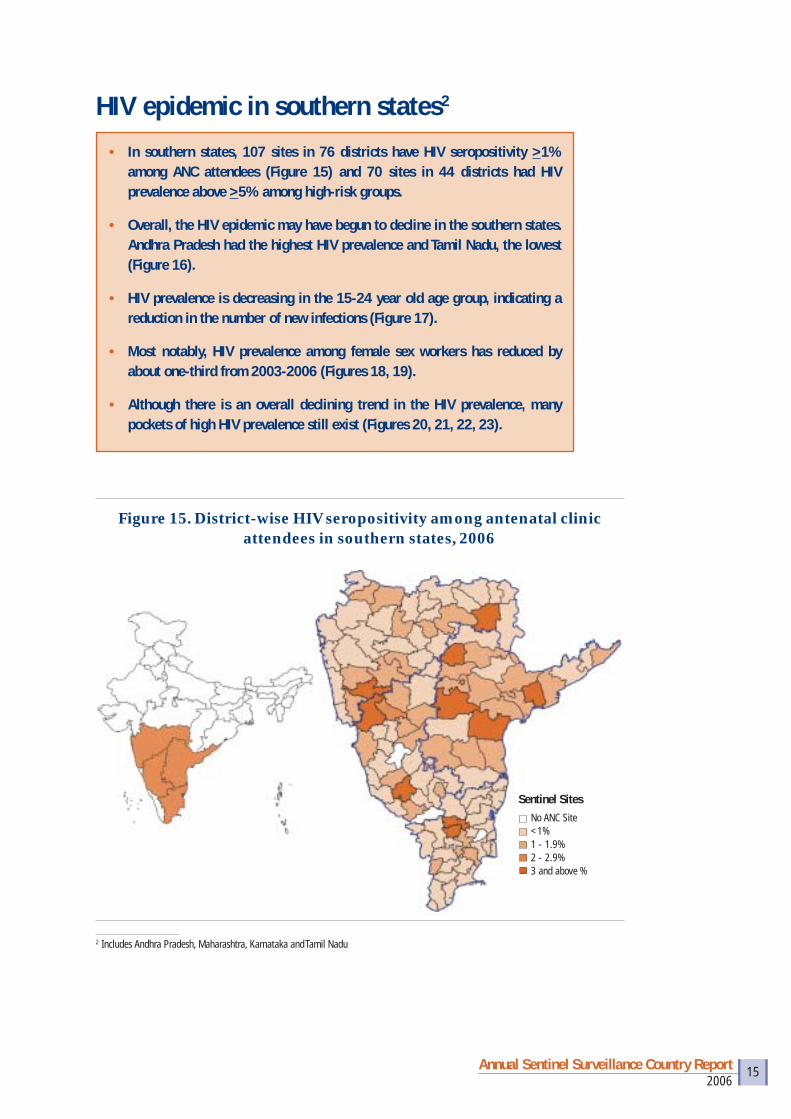
• In southern states, 107 sites in 76 districts have HIV seropositivity >1% among ANC attendees (Figure 15) and 70 sites in 44 districts had HIV prevalence above >5% among high-risk groups.
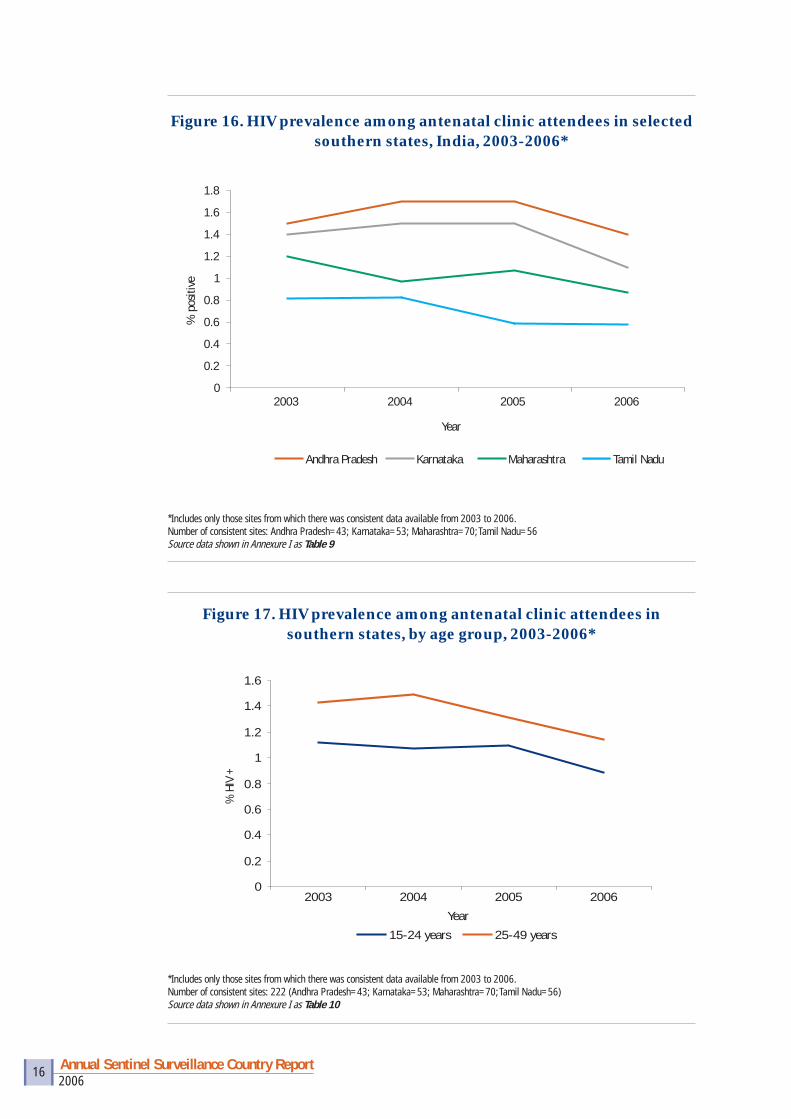
• Overall, the HIV epidemic may have begun to decline in the southern states. Andhra Pradesh had the highest HIV prevalence and Tamil Nadu, the lowest (Figure 16).
• HIV prevalence is decreasing in the 15-24 year old age group, indicating a reduction in the number of new infections (Figure 17).
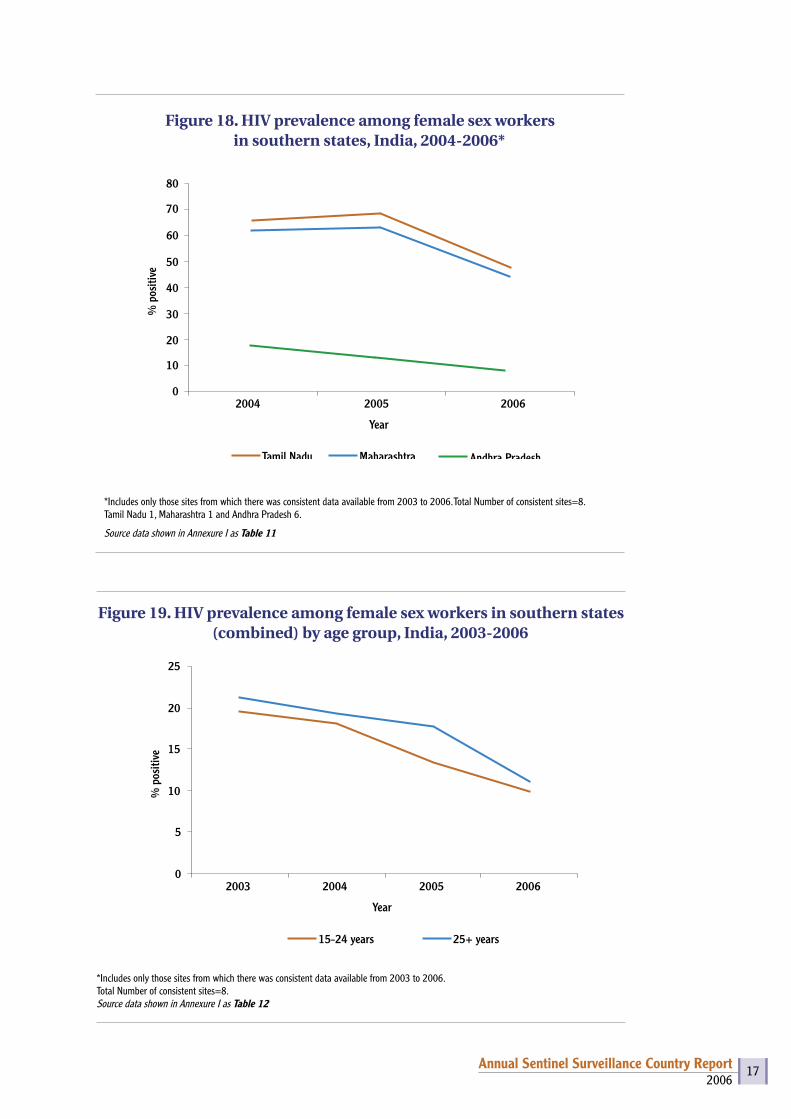
• Most notably, HIV prevalence among female sex workers has reduced by about one-third from 2003-2006 (Figures 18, 19).
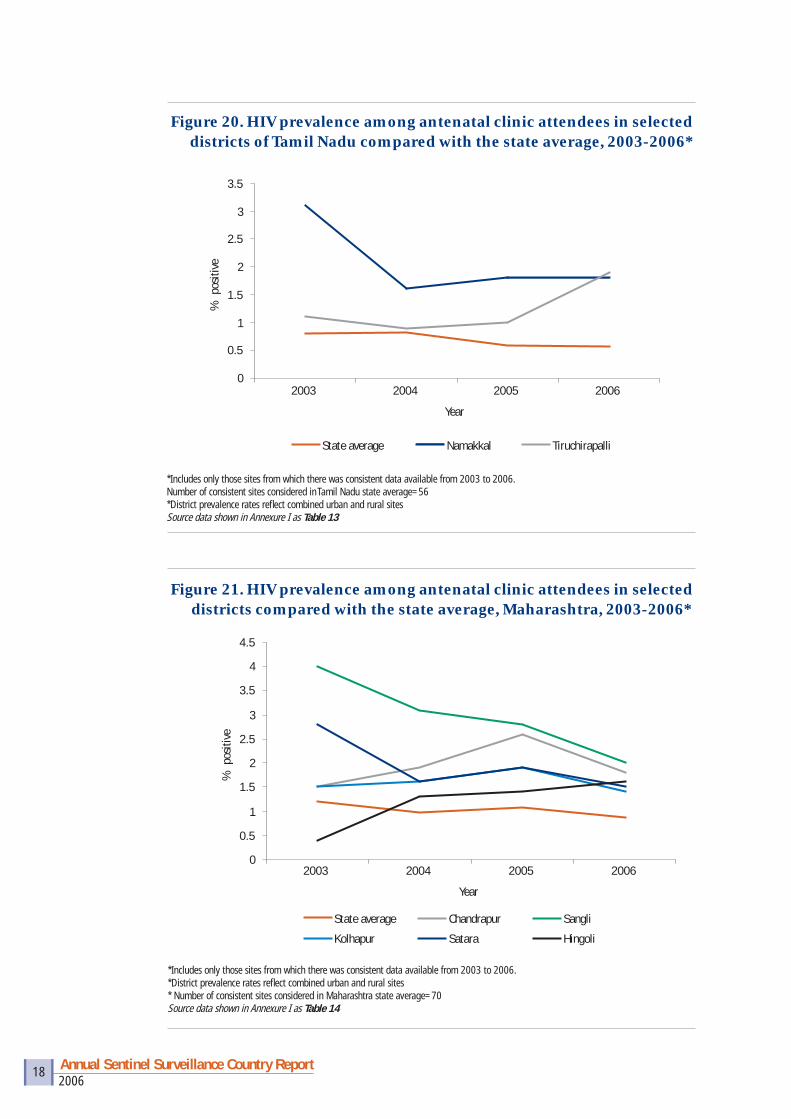
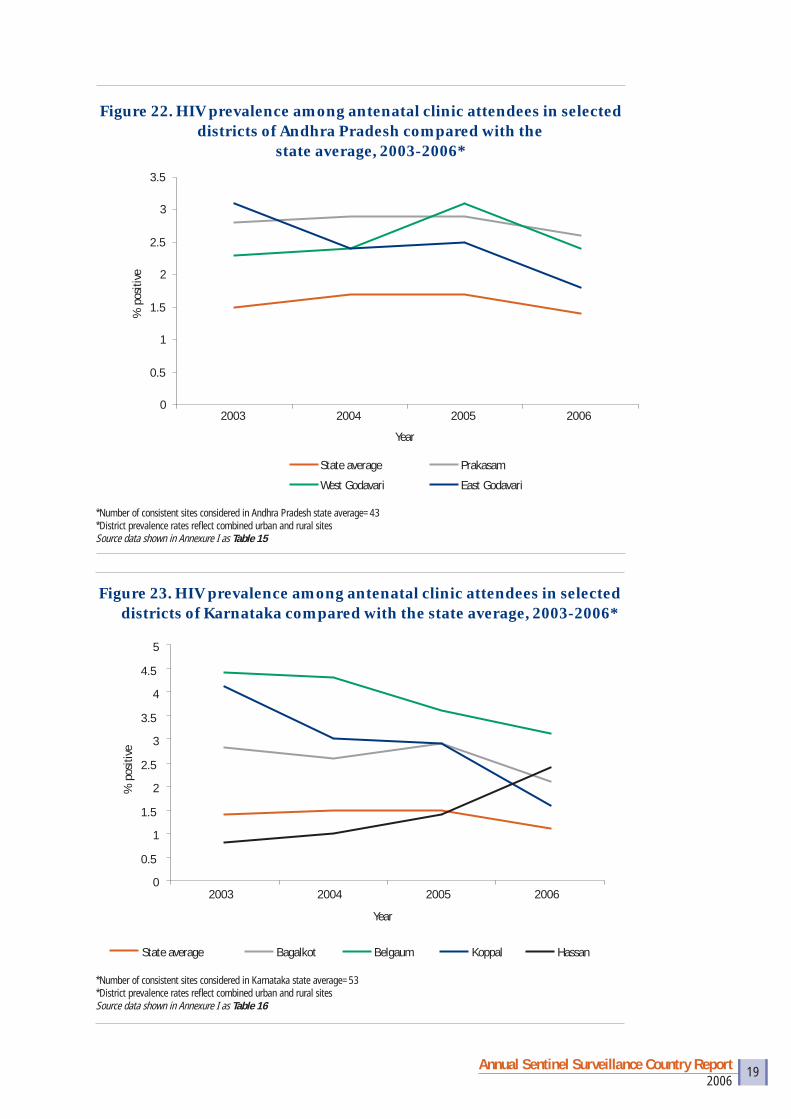
• Although there is an overall declining trend in the HIV prevalence, many pockets of high HIV prevalence still exist (Figures 20, 21, 22, 23).
2 Includes Andhra Pradesh, Maharashtra, Karnataka and Tamil Nadu
Figure 15. District-wise HIV seropositivity among antenatal clinic attendees in southern states, 2006
Sentinel Sites No ANC Site <1% 1 - 1.9% 2 - 2.9% 3 and above %
2006Annual Sentinel Surveillance Country Report 16
Figure 17. HIV prevalence among antenatal clinic attendees in southern states, by age group, 2003-2006*
*Includes only those sites from which there was consistent data available from 2003 to 2006. Number of consistent sites: 222 (Andhra Pradesh=43; Karnataka=53; Maharashtra=70; Tamil Nadu=56)Source data shown in Annexure I as Table 10
0
0.2
0.4
0.6
0.8
1
1.2
1.4
1.6
2003 2004 2005 2006
Year
% H
IV +
15-24 years 25-49 years
Figure 16. HIV prevalence among antenatal clinic attendees in selected southern states, India, 2003-2006*
*Includes only those sites from which there was consistent data available from 2003 to 2006. Number of consistent sites: Andhra Pradesh=43; Karnataka=53; Maharashtra=70; Tamil Nadu=56 Source data shown in Annexure I as Table 9
0
0.2
0.4
0.6
0.8
1
1.2
1.4
1.6
1.8
2003 2004 2005 2006
Year
% p
ositi
ve
Andhra Pradesh Karnataka Maharashtra Tamil Nadu
2006Annual Sentinel Surveillance Country Report 17
*Includes only those sites from which there was consistent data available from 2003 to 2006. Total Number of consistent sites=8. Tamil Nadu 1, Maharashtra 1 and Andhra Pradesh 6.
Source data shown in Annexure I as Table 11
Figure 18. HIV prevalence among female sex workers in southern states, India, 2004-2006*
0
10
20
30
40
50
2004 2005 2006
Year
% p
ositi
ve
Tamil Nadu Maharashtra
60
70
80
Andhra Pradesh
Figure 19. HIV prevalence among female sex workers in southern states (combined) by age group, India, 2003-2006
*Includes only those sites from which there was consistent data available from 2003 to 2006. Total Number of consistent sites=8.Source data shown in Annexure I as Table 12
0
5
10
15
20
25
2003 2004 2005 2006
Year
% p
ositi
ve
15-24 years 25+ years
2006Annual Sentinel Surveillance Country Report 18
Figure 21. HIV prevalence among antenatal clinic attendees in selected districts compared with the state average, Maharashtra, 2003-2006*
*Includes only those sites from which there was consistent data available from 2003 to 2006.*District prevalence rates refl ect combined urban and rural sites* Number of consistent sites considered in Maharashtra state average=70Source data shown in Annexure I as Table 14
0
0.5
1
1.5
2
2.5
3
3.5
4
4.5
2003 2004 2005 2006
Year
% p
ositi
ve
State average Chandrapur Sangli
Kolhapur Satara Hingoli
*Includes only those sites from which there was consistent data available from 2003 to 2006. Number of consistent sites considered in Tamil Nadu state average=56*District prevalence rates refl ect combined urban and rural sitesSource data shown in Annexure I as Table 13
Figure 20. HIV prevalence among antenatal clinic attendees in selected districts of Tamil Nadu compared with the state average, 2003-2006*
0
0.5
1
1.5
2
2.5
3
3.5
2003 2004 2005 2006
Year
% p
ositi
ve
State average Namakkal Tiruchirapalli
2006Annual Sentinel Surveillance Country Report 19
*Number of consistent sites considered in Andhra Pradesh state average=43*District prevalence rates refl ect combined urban and rural sitesSource data shown in Annexure I as Table 15
Figure 22. HIV prevalence among antenatal clinic attendees in selected districts of Andhra Pradesh compared with the
state average, 2003-2006*
0
0.5
1
1.5
2
2.5
3
3.5
2003 2004 2005 2006
Year
% p
ositi
ve
State average Prakasam
West Godavari East Godavari
Figure 23. HIV prevalence among antenatal clinic attendees in selected districts of Karnataka compared with the state average, 2003-2006*
*Number of consistent sites considered in Karnataka state average=53*District prevalence rates refl ect combined urban and rural sitesSource data shown in Annexure I as Table 16
0
0.5
1
1.5
2
2.5
3
3.5
4
4.5
5
2003 2004 2005 2006
Year
% p
ositi
ve
State average Bagalkot Belgaum Koppal Hassan
2006Annual Sentinel Surveillance Country Report 20
Figure 24. Emerging hotspots, by sentinel group and district, India, 2006
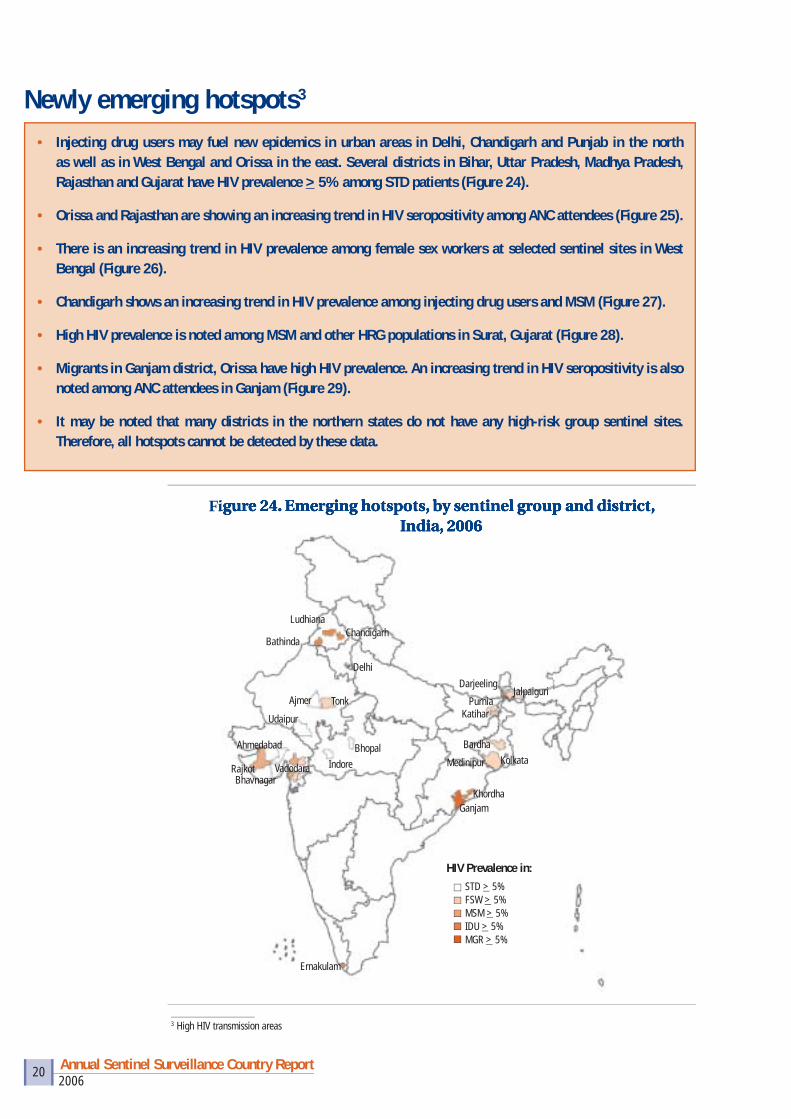
Newly emerging hotspots3
• Injecting drug users may fuel new epidemics in urban areas in Delhi, Chandigarh and Punjab in the north as well as in West Bengal and Orissa in the east. Several districts in Bihar, Uttar Pradesh, Madhya Pradesh, Rajasthan and Gujarat have HIV prevalence > 5% among STD patients (Figure 24).
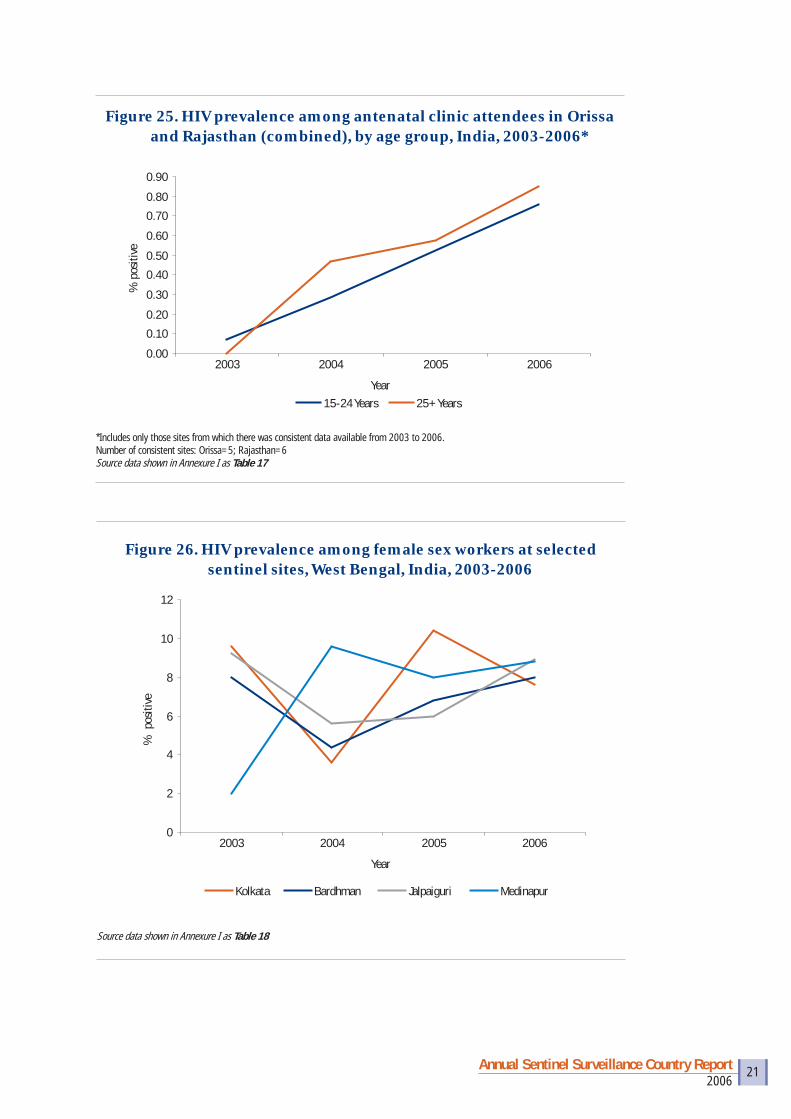
• Orissa and Rajasthan are showing an increasing trend in HIV seropositivity among ANC attendees (Figure 25).
• There is an increasing trend in HIV prevalence among female sex workers at selected sentinel sites in West Bengal (Figure 26).
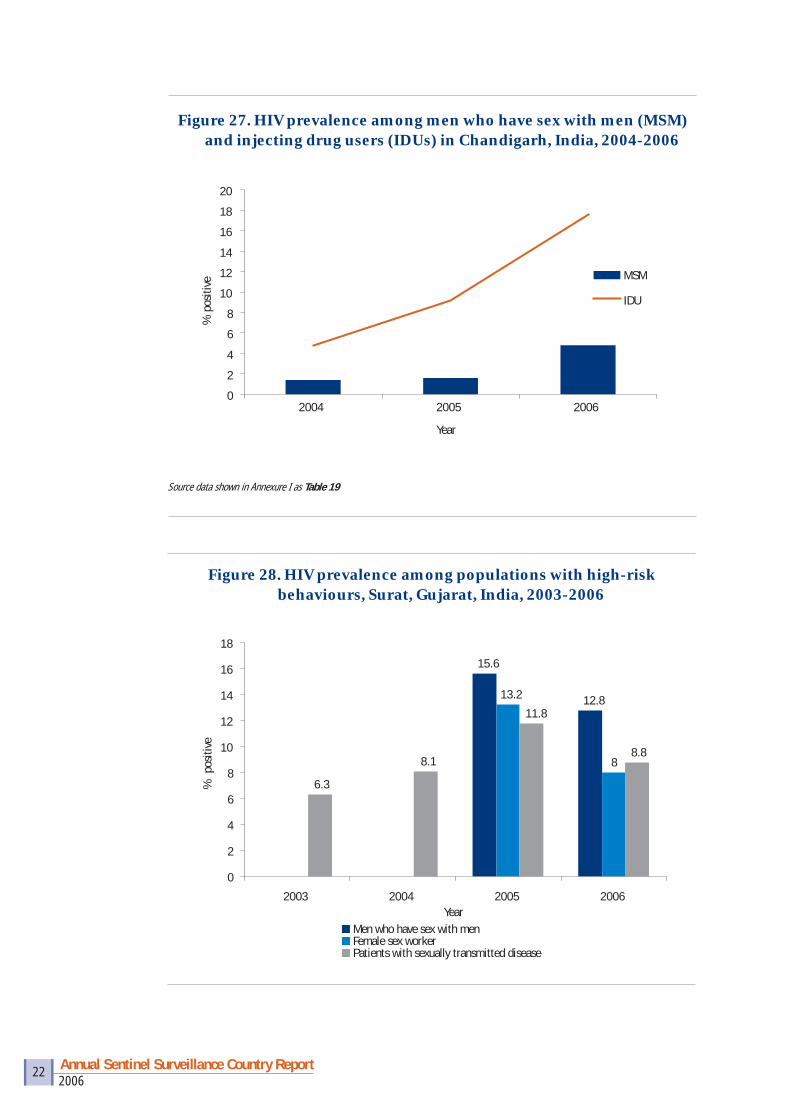
• Chandigarh shows an increasing trend in HIV prevalence among injecting drug users and MSM (Figure 27).
• High HIV prevalence is noted among MSM and other HRG populations in Surat, Gujarat (Figure 28).
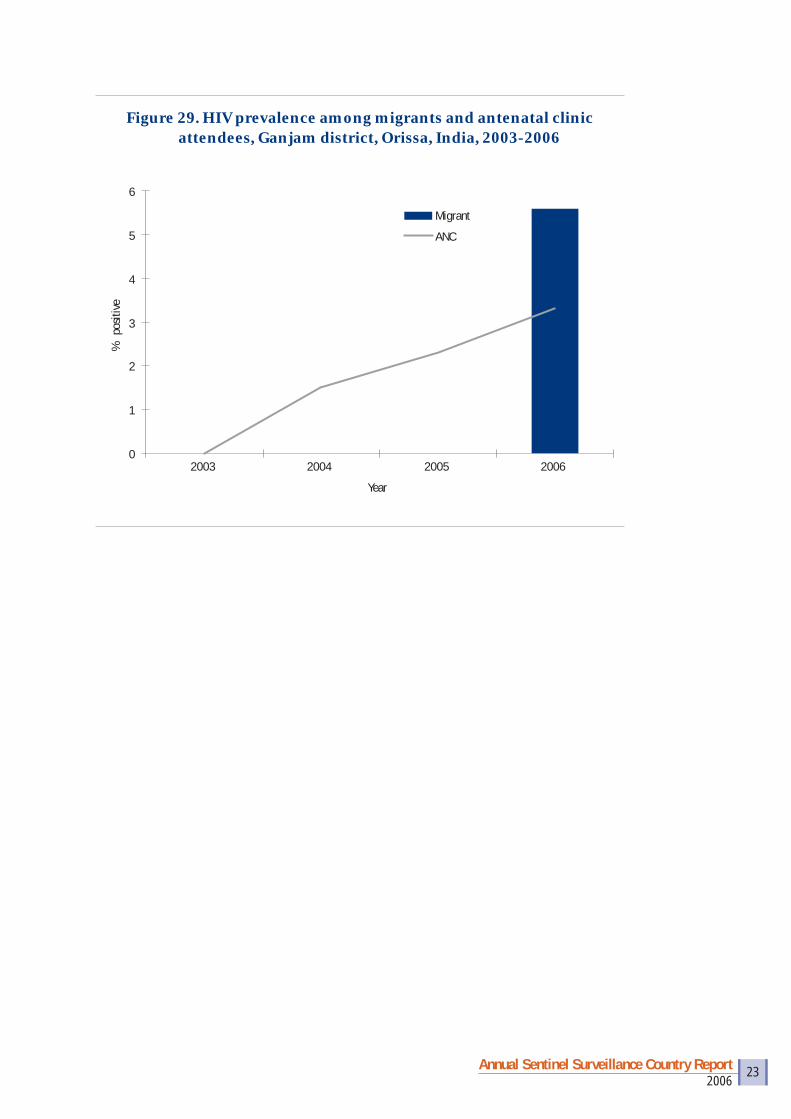
• Migrants in Ganjam district, Orissa have high HIV prevalence. An increasing trend in HIV seropositivity is also noted among ANC attendees in Ganjam (Figure 29).
• It may be noted that many districts in the northern states do not have any high-risk group sentinel sites. Therefore, all hotspots cannot be detected by these data.
3 High HIV transmission areas
HIV Prevalence in: STD > 5% FSW > 5% MSM > 5% IDU > 5% MGR > 5%
Ludhiana
BathindaChandigarh
Delhi
DarjeelingJalpaiguri
PurniaKatihar
BardhaKolkataMedinipur
GanjamKhordha
BhopalIndore
Ajmer Tonk
Udaipur
Vadodara
Ernakulam
Ahmedabad
RajkotBhavnagar
2006Annual Sentinel Surveillance Country Report 21
Figure 25. HIV prevalence among antenatal clinic attendees in Orissa and Rajasthan (combined), by age group, India, 2003-2006*
0.00
0.10
0.20
0.30
0.40
0.50
0.60
0.70
0.80
0.90
2003 2004 2005 2006
Year
% p
ositi
ve
15-24 Years 25+ Years
*Includes only those sites from which there was consistent data available from 2003 to 2006.Number of consistent sites: Orissa=5; Rajasthan=6Source data shown in Annexure I as Table 17
Figure 26. HIV prevalence among female sex workers at selected sentinel sites, West Bengal, India, 2003-2006
Source data shown in Annexure I as Table 18
0
2
4
6
8
10
12
2003 2004 2005 2006
Year
% p
ositi
ve
Kolkata Bardhman Jalpaiguri Medinapur
2006Annual Sentinel Surveillance Country Report 22
Figure 28. HIV prevalence among populations with high-risk behaviours, Surat, Gujarat, India, 2003-2006
15.6
12.813.2
8
6.3
8.1
11.8
8.8
0
2
4
6
8
10
12
14
16
18
2003 2004 2005 2006Year
% p
ositi
ve
Men who have sex with menFemale sex workerPatients with sexually transmitted disease
Source data shown in Annexure I as Table 19
Figure 27. HIV prevalence among men who have sex with men (MSM) and injecting drug users (IDUs) in Chandigarh, India, 2004-2006
0
2
4
6
8
10
12
14
16
18
20
2004 2005 2006
Year
% p
ositi
ve
MSM
IDU
2006Annual Sentinel Surveillance Country Report 23
Figure 29. HIV prevalence among migrants and antenatal clinic attendees, Ganjam district, Orissa, India, 2003-2006
0
1
2
3
4
5
6
2003 2004 2005 2006
Year
% p
ositi
ve
Migrant
ANC
2006Annual Sentinel Surveillance Country Report 24
Populations with high-risk behaviours
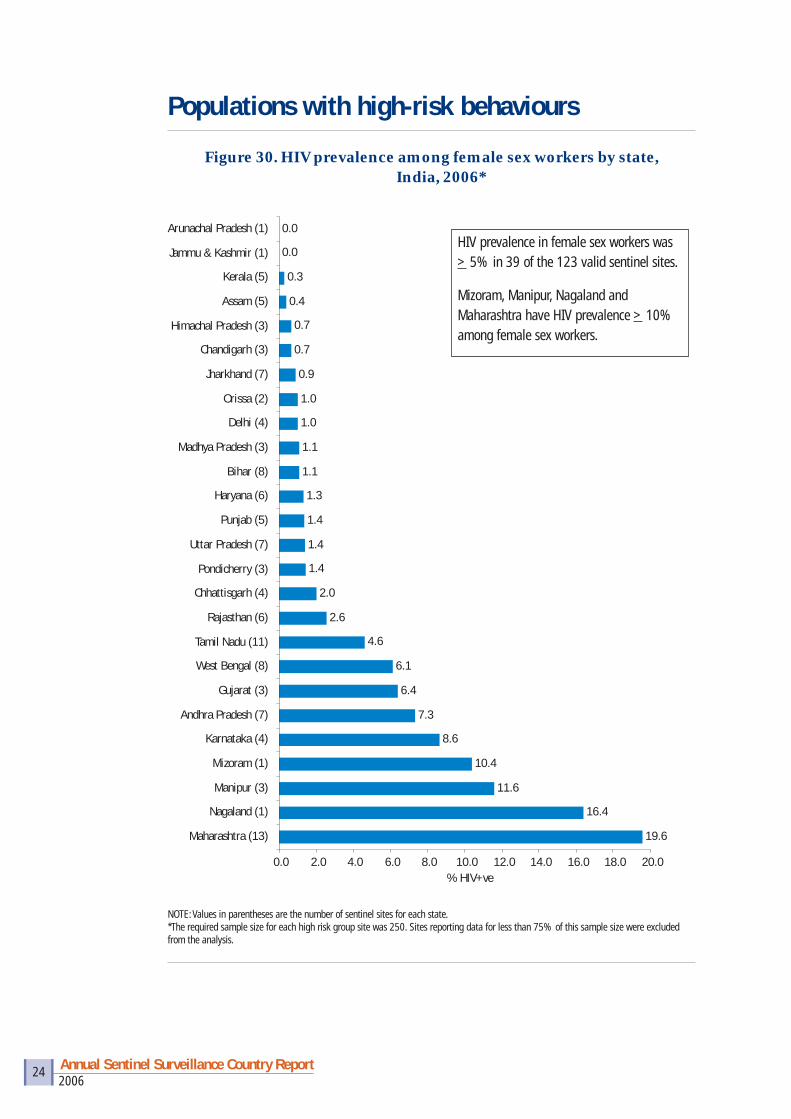
Figure 30. HIV prevalence among female sex workers by state, India, 2006*
19.6
16.4
11.6
10.4
8.6
7.3
6.4
6.1
4.6
2.6
2.0
1.4
1.4
1.4
1.3
1.1
1.1
1.0
1.0
0.9
0.7
0.7
0.4
0.3
0.0
0.0
0.0 2.0 4.0 6.0 8.0 10.0 12.0 14.0 16.0 18.0 20.0
Maharashtra (13)
Nagaland (1)
Manipur (3)
Mizoram (1)
Karnataka (4)
Andhra Pradesh (7)
Gujarat (3)
West Bengal (8)
Tamil Nadu (11)
Rajasthan (6)
Chhattisgarh (4)
Pondicherry (3)
Uttar Pradesh (7)
Punjab (5)
Haryana (6)
Bihar (8)
Madhya Pradesh (3)
Delhi (4)
Orissa (2)
Jharkhand (7)
Chandigarh (3)
Himachal Pradesh (3)
Assam (5)
Kerala (5)
Jammu & Kashmir (1)
Arunachal Pradesh (1)
% HIV+ve
HIV prevalence in female sex workers was > 5% in 39 of the 123 valid sentinel sites.
Mizoram, Manipur, Nagaland and Maharashtra have HIV prevalence > 10% among female sex workers.
NOTE: Values in parentheses are the number of sentinel sites for each state.*The required sample size for each high risk group site was 250. Sites reporting data for less than 75% of this sample size were excluded from the analysis.
2006Annual Sentinel Surveillance Country Report 25
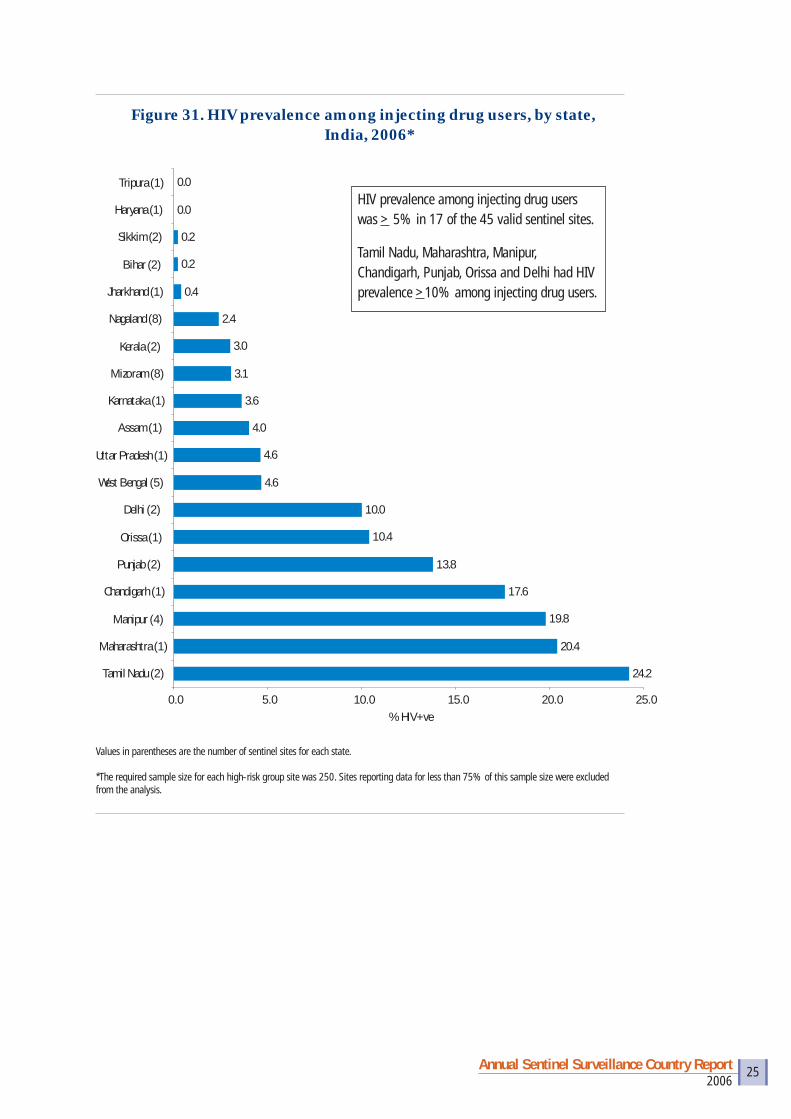
Figure 31. HIV prevalence among injecting drug users, by state, India, 2006*
24.2
20.4
19.8
17.6
13.8
10.4
10.0
4.6
4.6
4.0
3.6
3.1
3.0
2.4
0.4
0.2
0.2
0.0
0.0
0.0 5.0 10.0 15.0 20.0 25.0
Tamil Nadu (2)
Maharashtra (1)
Manipur (4)
Chandigarh (1)
Punjab (2)
Orissa (1)
Delhi (2)
West Bengal (5)
Uttar Pradesh (1)
Assam (1)
Karnataka (1)
Mizoram (8)
Kerala (2)
Nagaland (8)
Jharkhand (1)
Bihar (2)
Sikkim (2)
Haryana (1)
Tripura (1)
% HIV+ve
Values in parentheses are the number of sentinel sites for each state.
*The required sample size for each high-risk group site was 250. Sites reporting data for less than 75% of this sample size were excluded from the analysis.
HIV prevalence among injecting drug users was > 5% in 17 of the 45 valid sentinel sites.
Tamil Nadu, Maharashtra, Manipur, Chandigarh, Punjab, Orissa and Delhi had HIV prevalence >10% among injecting drug users.
2006Annual Sentinel Surveillance Country Report 26
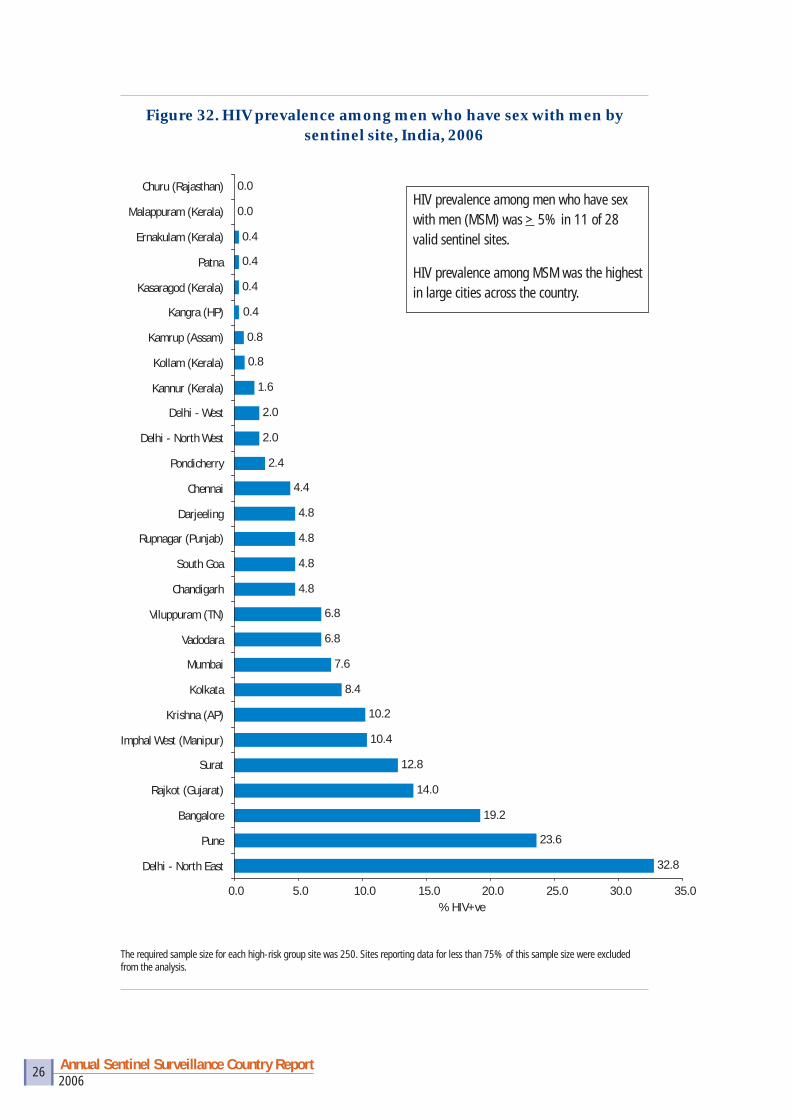
Figure 32. HIV prevalence among men who have sex with men by sentinel site, India, 2006
32.8
23.6
19.2
14.0
12.8
10.4
10.2
8.4
7.6
6.8
6.8
4.8
4.8
4.8
4.8
4.4
2.4
2.0
2.0
1.6
0.8
0.8
0.4
0.4
0.4
0.4
0.0
0.0
0.0 5.0 10.0 15.0 20.0 25.0 30.0 35.0
Delhi - North East
Pune
Bangalore
Rajkot (Gujarat)
Surat
Imphal West (Manipur)
Krishna (AP)
Kolkata
Mumbai
Vadodara
Viluppuram (TN)
Chandigarh
South Goa
Rupnagar (Punjab)
Darjeeling
Chennai
Pondicherry
Delhi - North West
Delhi - West
Kannur (Kerala)
Kollam (Kerala)
Kamrup (Assam)
Kangra (HP)
Kasaragod (Kerala)
Patna
Ernakulam (Kerala)
Malappuram (Kerala)
Churu (Rajasthan)
% HIV+ve
The required sample size for each high-risk group site was 250. Sites reporting data for less than 75% of this sample size were excluded from the analysis.
HIV prevalence among men who have sex with men (MSM) was > 5% in 11 of 28 valid sentinel sites.
HIV prevalence among MSM was the highest in large cities across the country.
2006Annual Sentinel Surveillance Country Report 27
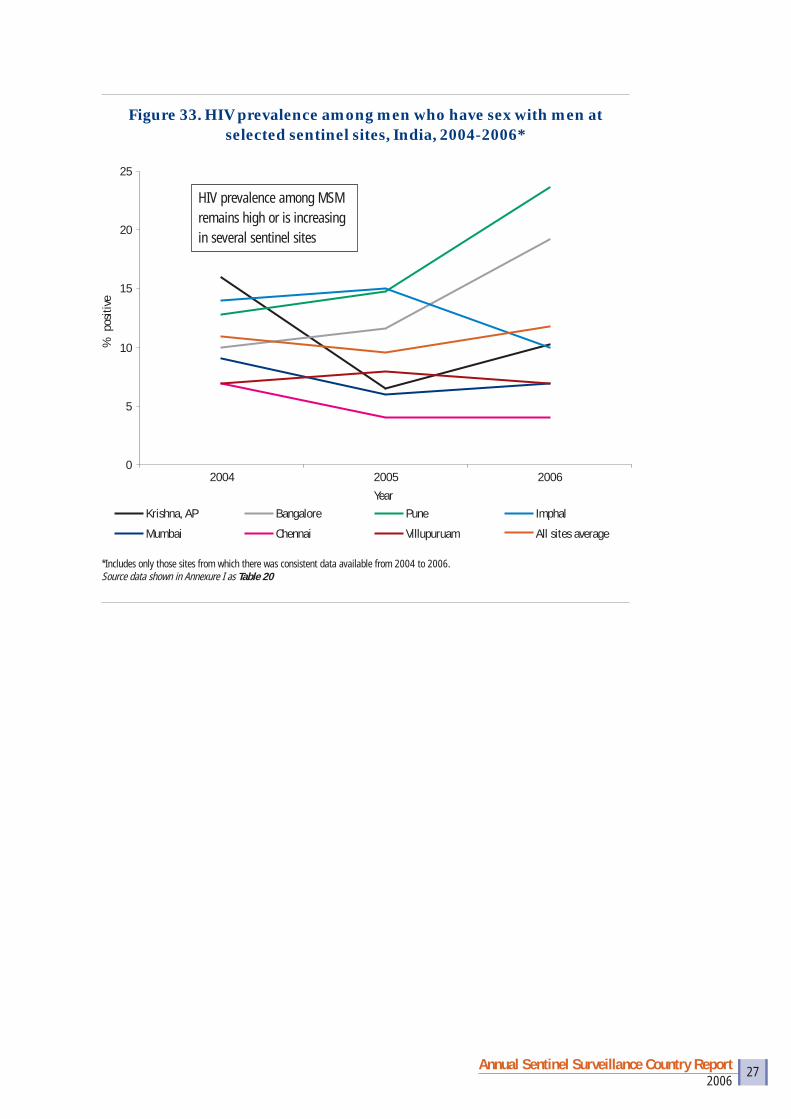
Figure 33. HIV prevalence among men who have sex with men at selected sentinel sites, India, 2004-2006*
0
5
10
15
20
25
2004 2005 2006
Year
% p
ositi
ve
Krishna, AP Bangalore Pune Imphal
Mumbai Chennai Villupuruam All sites average
HIV prevalence among MSM remains high or is increasing in several sentinel sites
*Includes only those sites from which there was consistent data available from 2004 to 2006.Source data shown in Annexure I as Table 20

2006Annual Sentinel Surveillance Country Report 28
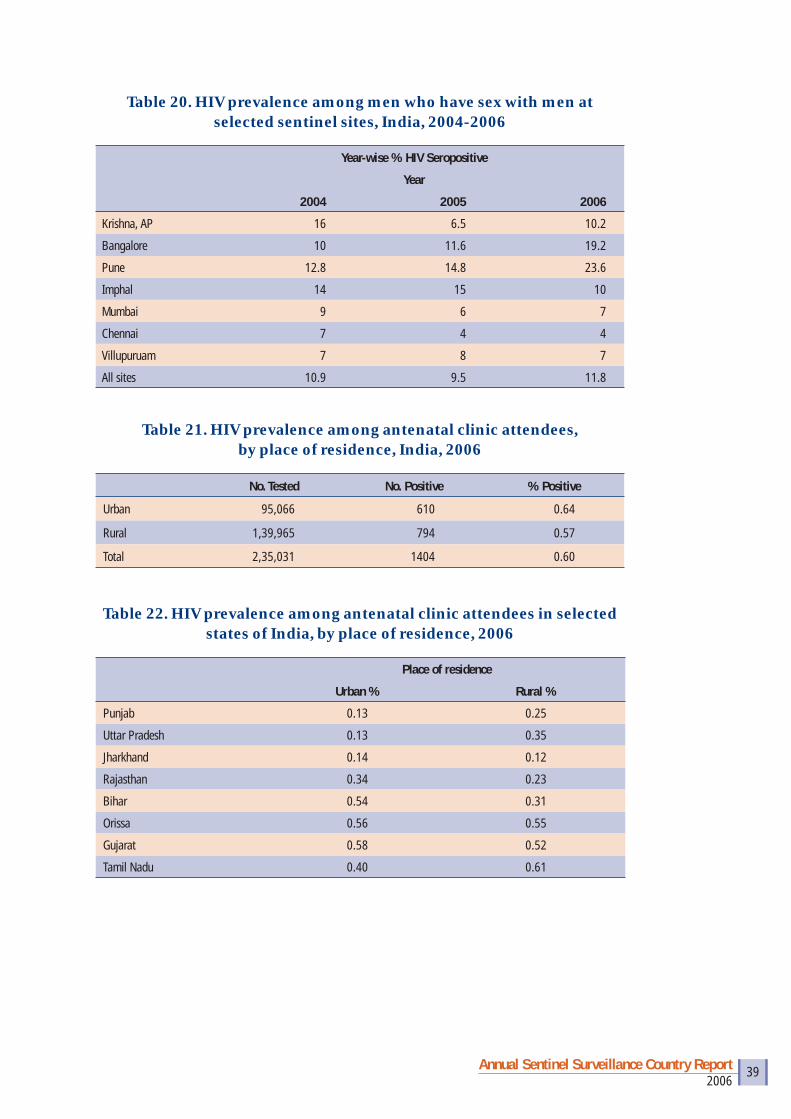
HIV prevalence by place of residence4
• HIV prevalence is slightly higher among urban than rural populations (Figure 34).
• Several states, however, have higher prevalence in rural populations (Uttar Pradesh, Tamil Nadu, Punjab) (Figure 35).
0.64
0.57
0.60
0.52
0.54
0.56
0.58
0.60
0.62
0.64
0.66
Urban Rural Total
% p
ositi
ve
Positive
Figure 34. HIV prevalence among antenatal clinic attendees, by place of residence, India, 2006
Figure 35. HIV prevalence among antenatal clinic attendees in selected states of India, by place of residence, 2006
0
0.1
0.2
0.3
0.4
0.5
0.6
0.7
Punjab UP Jharkhand Rajasthan Bihar Orissa Gujarat Tamil Nadu
% p
ositi
ve
Urban Rural
Source data shown in Annexure I as Table 22
4 Place of residence denotes the usual place where the woman resides (urban or rural) and not the place at which she is seeking antenatal care.
Source data shown in Annexure I as Table 21
2006Annual Sentinel Surveillance Country Report 29
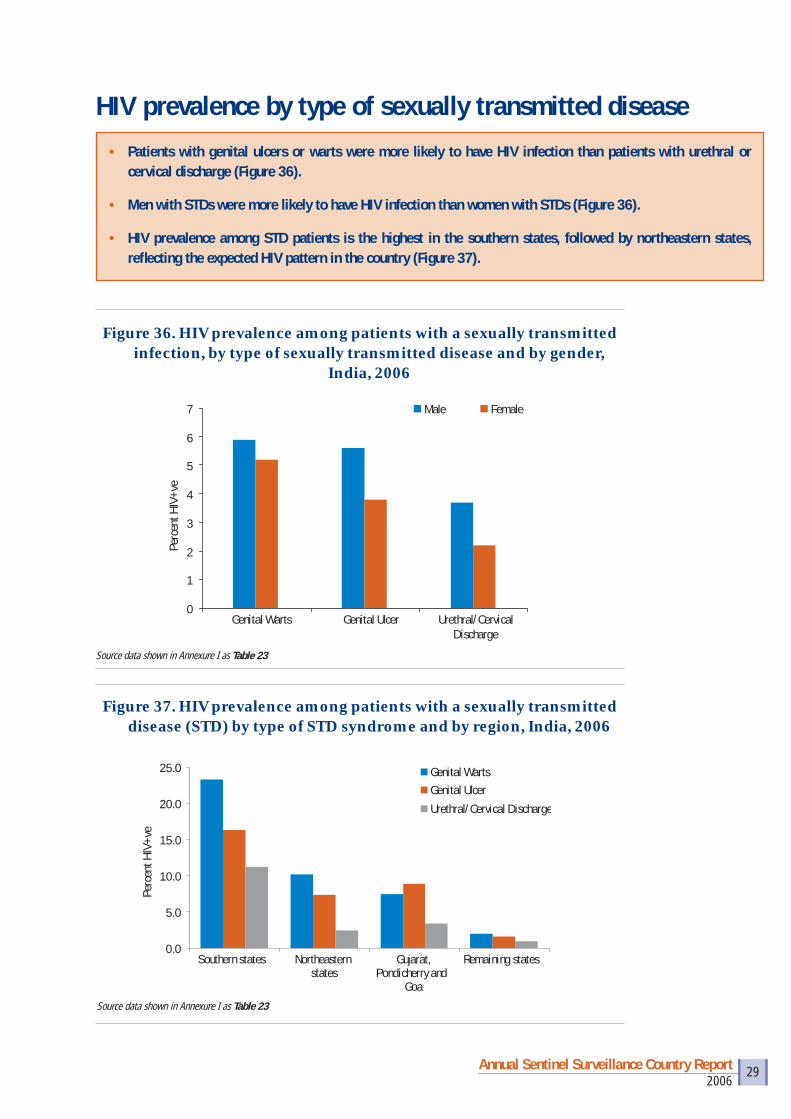
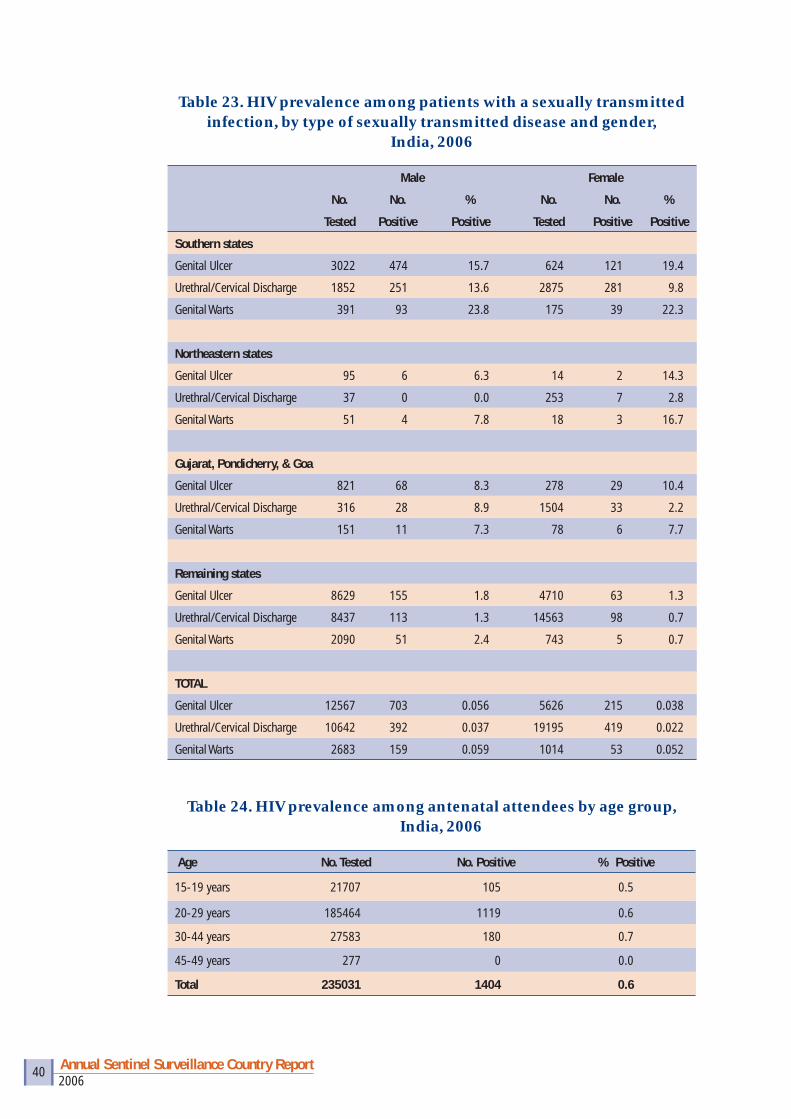
• Patients with genital ulcers or warts were more likely to have HIV infection than patients with urethral or cervical discharge (Figure 36).
• Men with STDs were more likely to have HIV infection than women with STDs (Figure 36).
• HIV prevalence among STD patients is the highest in the southern states, followed by northeastern states, refl ecting the expected HIV pattern in the country (Figure 37).
Figure 36. HIV prevalence among patients with a sexually transmitted infection, by type of sexually transmitted disease and by gender,
India, 2006
0
1
2
3
4
5
6
7
Genital Warts Genital Ulcer Urethral/CervicalDischarge
Perc
ent H
IV+v
e
Male Female
Source data shown in Annexure I as Table 23
Figure 37. HIV prevalence among patients with a sexually transmitted disease (STD) by type of STD syndrome and by region, India, 2006
0.0
5.0
10.0
15.0
20.0
25.0
Southern states Northeasternstates
Gujarat,Pondicherry and
Goa
Remaining states
Perc
ent H
IV+v
e
Genital WartsGenital Ulcer
Urethral/Cervical Discharge
Source data shown in Annexure I as Table 23
HIV prevalence by type of sexually transmitted disease
2006Annual Sentinel Surveillance Country Report 30
HIV prevalence by demographic parameters
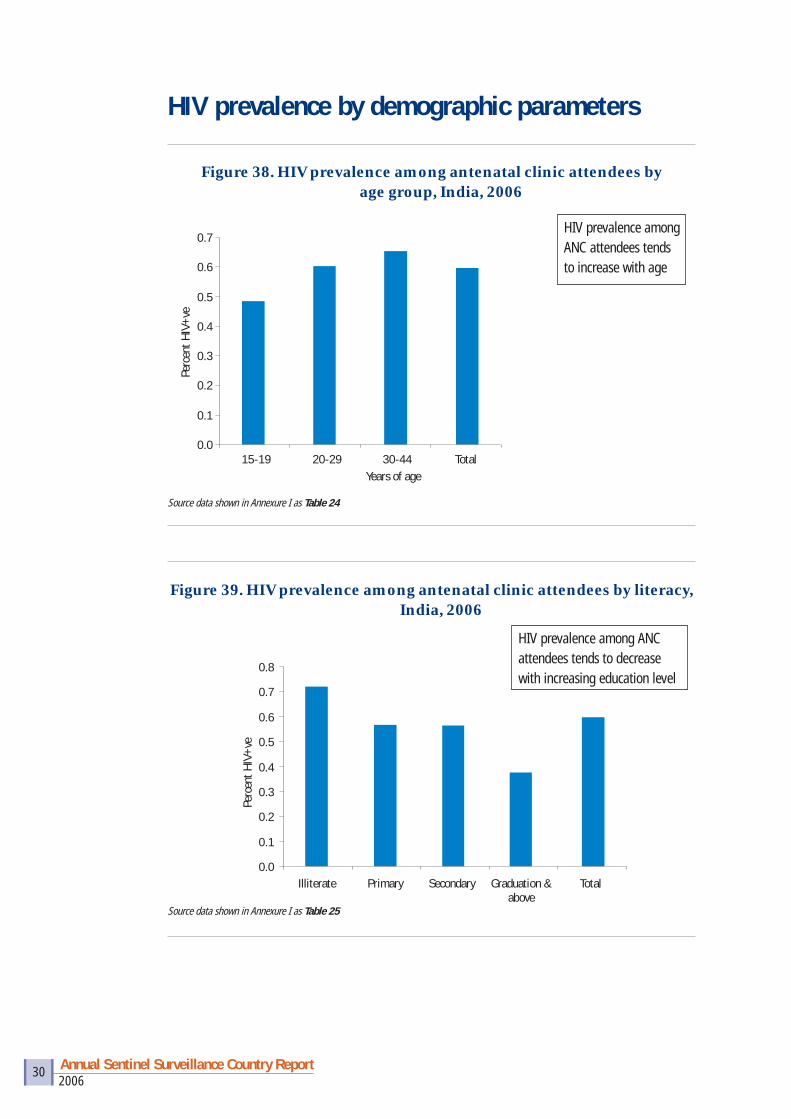
Figure 38. HIV prevalence among antenatal clinic attendees by age group, India, 2006
0.0
0.1
0.2
0.3
0.4
0.5
0.6
0.7
15-19 20-29 30-44 TotalYears of age
Perc
ent H
IV+v
e
HIV prevalence among ANC attendees tends to increase with age
Source data shown in Annexure I as Table 24
Figure 39. HIV prevalence among antenatal clinic attendees by literacy, India, 2006
0.0
0.1
0.2
0.3
0.4
0.5
0.6
0.7
0.8
Illiterate Primary Secondary Graduation &above
Total
Perc
ent H
IV+v
e
Source data shown in Annexure I as Table 25
HIV prevalence among ANC attendees tends to decrease with increasing education level
2006Annual Sentinel Surveillance Country Report 31
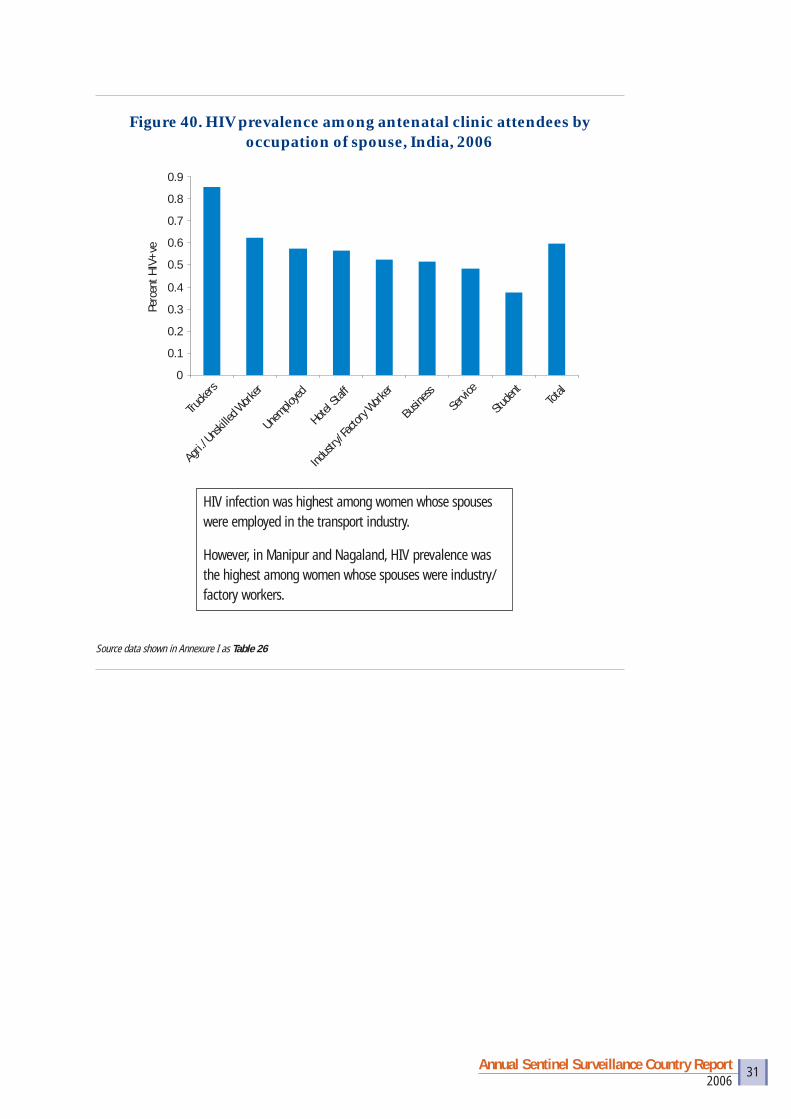
Figure 40. HIV prevalence among antenatal clinic attendees by occupation of spouse, India, 2006
0
0.1
0.2
0.3
0.4
0.5
0.6
0.7
0.8
0.9
Trucke
rs
Agri./U
nskille
d Work
er
Unemplo
yed
Hotel S
taff
Indust
ry/Fac
tory W
orker
Busine
ssSe
rvice
Stude
ntTot
al
Perc
ent H
IV+v
e
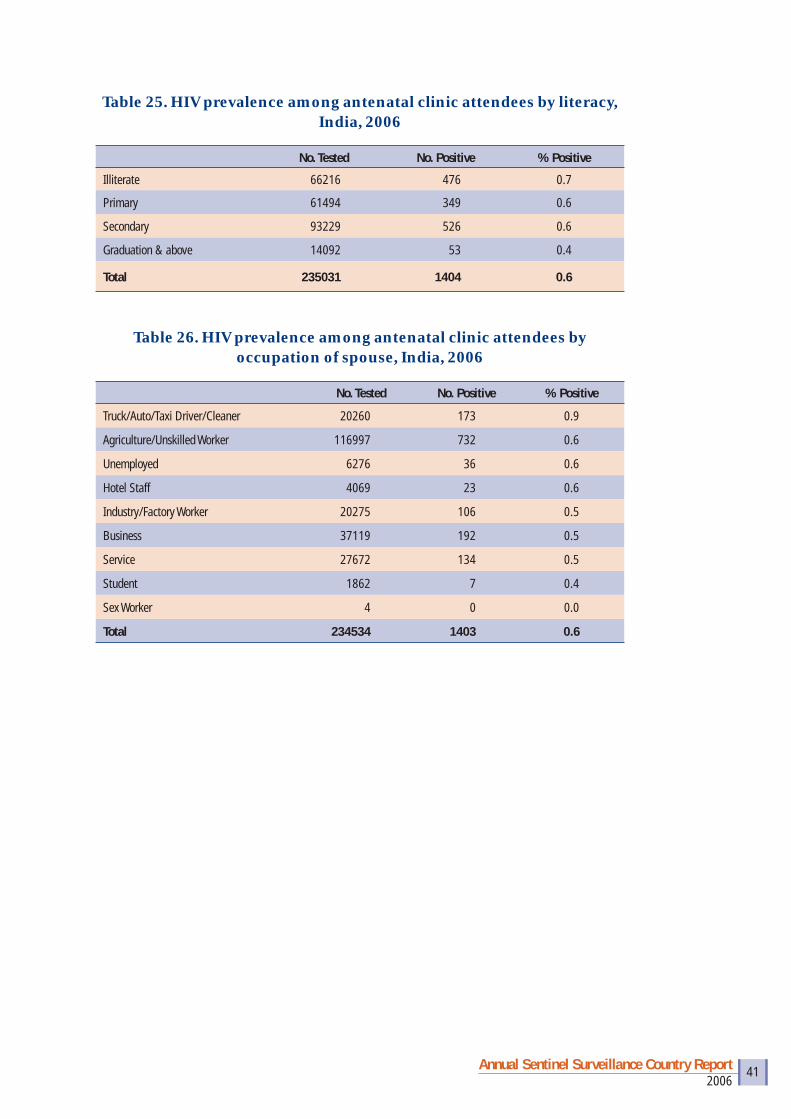
HIV infection was highest among women whose spouses were employed in the transport industry.
However, in Manipur and Nagaland, HIV prevalence was the highest among women whose spouses were industry/factory workers.
Source data shown in Annexure I as Table 26
2006Annual Sentinel Surveillance Country Report 32
Inadequate national coverage of populations with high-risk behaviours• Although the number of sentinel sites has increased more than 15-fold in the last
decade, HIV surveillance coverage is inadequate, particularly for populations with high-risk behaviours. Almost half the districts in the country do not have a sentinel site for one of the HRGs. Surveillance in HRGs is particularly important and relevant in states with low HIV prevalence. Because HIV is likely to be fi rst detected among populations with high-risk behaviours, expansion of ANC sites alone in the northern states is unlikely to detect new areas of high HIV transmission, because the increase in prevalence will take a very long time.
Under-representation of rural sites• Of the 628 ANC sites in the country, 158 are designated as rural sites. As these
rural sites are located mainly at Community Health Centres (CHCs) in small towns or large villages, they are not typical of a rural location and do not capture the large majority of women living in remote rural areas. Data collected from the current sentinel surveillance system is, therefore, likely to under-represent rural populations. Because HIV prevalence is usually higher in urban areas, under-representation of the rural areas may overestimate the overall HIV prevalence obtained by the sentinel surveillance system.
Non-representation of private clinics• All ANC and STD sentinel sites are located in government clinics. Thus, the
sentinel surveillance system is likely to miss a large majority of patients with an STD who seek care from private practitioners and women who deliver in private clinics. Data obtained from sentinel surveillance among ANC attendees is likely to overestimate HIV prevalence among all women in the community because: (1) women from a lower socio-economic status (who usually have higher HIV prevalence) are more likely to attend governmental facilities; (2) HIV-positive women may be disproportionately referred from private to governmental clinics.
Over-representation of tertiary level facilities• The majority of existing STD sentinel sites are located in tertiary-level teaching/
specialised/referral hospitals where patients with chronic or recurring STDs are likely to be referred. This can lead to an overestimation of HIV among STD patients.
Non-attendance of pregnant women at antenatal clinics• The proportion of women who attend ANC varies from state to state. In states
with lower ANC utilisation rates, sentinel surveillance is likely to miss a large number of women who deliver at home. Differences in socio-demographic
Limitations

2006Annual Sentinel Surveillance Country Report 33
characteristics between women who do not attend ANCs and those who do attend ANCs can bias the results of sentinel surveillance.
Under-representation of older women in antenatal clinics• Women attending ANCs are young and sexually active and may have a higher
HIV prevalence compared to women who are older and less likely to be pregnant. Thus, HIV prevalence is likely to be higher among ANC attendees than among women in the community.
Measuring trends in HIV among patients with STDs may be misleading• Patients who have an STD represent those who continue high-risk sexual
behaviours; therefore monitoring HIV trends among STD patients may be misleading.
Targeted intervention sites• Most of the sentinel sites for FSWs, MSM and IDUs are located within
NGOs who also provide prevention interventions. As a result of successful interventions, HIV prevalence among HRGs is likely to decline. Thus, a declining trend in HIV observed at HRG targeted intervention sites may represent successful interventions applicable only to the small set of HRG population who attend these sites, rather than a decline in HIV prevalence among the entire HRG population.
• As HRGs are highly stigmatised and engage in illegal activities, it is likely that HRGs who are most marginalised and vulnerable may not access the targeted intervention sites. On the other hand, it is equally possible that those HRGs who access targeted intervention sites are most visible (and potentially belong to the highest-risk groups). For these reasons, it is diffi cult to interpret whether HIV prevalence among HRGs attending targeted intervention sites underestimates or overestimates the true HIV prevalence among HRG populations.
Data analyses• Data presented in this report are based on univariate and bivariate analyses and
are not standardised for age and other socio-demographic variables. However, this is not likely to change the interpretation of trends presented in this report because there is little change in the socio-demographic characteristics of the participants over time.
2006Annual Sentinel Surveillance Country Report 34
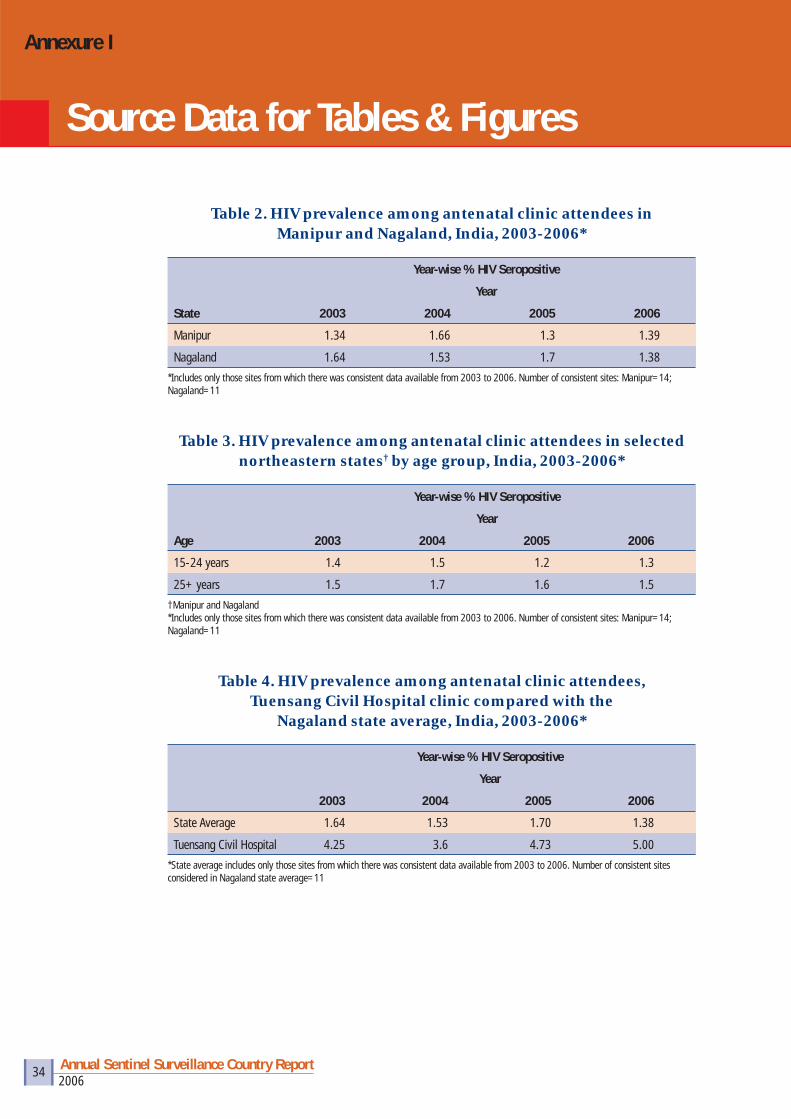
Table 2. HIV prevalence among antenatal clinic attendees in Manipur and Nagaland, India, 2003-2006*
State
Year-wise % HIV Seropositive
Year
2003 2004 2005 2006
Manipur 1.34 1.66 1.3 1.39
Nagaland 1.64 1.53 1.7 1.38
*Includes only those sites from which there was consistent data available from 2003 to 2006. Number of consistent sites: Manipur=14; Nagaland=11
Table 3. HIV prevalence among antenatal clinic attendees in selected northeastern states† by age group, India, 2003-2006*
Age
Year-wise % HIV Seropositive
Year
2003 2004 2005 2006
15-24 years 1.4 1.5 1.2 1.3
25+ years 1.5 1.7 1.6 1.5
†Manipur and Nagaland*Includes only those sites from which there was consistent data available from 2003 to 2006. Number of consistent sites: Manipur=14; Nagaland=11
Table 4. HIV prevalence among antenatal clinic attendees, Tuensang Civil Hospital clinic compared with the
Nagaland state average, India, 2003-2006*
Year-wise % HIV Seropositive
Year
2003 2004 2005 2006
State Average 1.64 1.53 1.70 1.38
Tuensang Civil Hospital 4.25 3.6 4.73 5.00
*State average includes only those sites from which there was consistent data available from 2003 to 2006. Number of consistent sites considered in Nagaland state average=11
Source Data for Tables & Figures
Annexure I

2006Annual Sentinel Surveillance Country Report 35
Table 5. HIV prevalence among antenatal clinic attendees in selected districts of Manipur, India, 2003-2006*
Year-wise % HIV Seropositive
Year
2003 2004 2005 2006
State average 1.34 1.66 1.3 1.39
Ukhrul 3 4.5 3 4
Tamenglong 0.8 1.5 1.8 2.5
Churachandpur 5 2.8 1.5 2.3
*State average includes only those sites from which there was consistent data available from 2003 to 2006. Number of consistent sites considered for Manipur state average=14
Table 6. HIV prevalence among female sex workers in selected northeastern states, India, 2003-2006*
State
Year-wise % HIV Seropositive
Year
2003 2004 2005 2006
Manipur 12.8 12.4 13.2 8.4
Nagaland 4.4 4.4 11 16.4
*Includes only those sites from which there was consistent data available from 2003 to 2006.Number of consistent sites: Manipur=1; Nagaland=1
Table 7. HIV prevalence among injecting drug users in selected northeastern states, India, 2002-2006*
State
Year-wise % HIV Seropositive
Year
2002 2003 2004 2005 2006
Manipur 39 24.5 18.27 20.93 20.67
Nagaland 9.6 14.7 4.59 7.07 2.94
Mizoram 1.6 8.8 6.8 8.4 9.6
*Includes only those sites from which there was consistent data available from 2002 to 2006. Number of consistent sites: Manipur=3; Nagaland=3; Mizoram=1
Table 8. HIV prevalence among injecting drug users in selected northeastern states, India, by age group, 2002-2006*
Age
Year-wise % HIV Seropositive
Year
2002 2003 2004 2005 2006
15-24 years 15.1 10.5 6.9 6.9 5.7
25+ years 26.8 23.9 13.6 17.9 15.4
*Includes only those sites from which there was consistent data available from 2002 to 2006. Number of consistent sites: Manipur=3; Nagaland=3; Mizoram=1
2006Annual Sentinel Surveillance Country Report 36
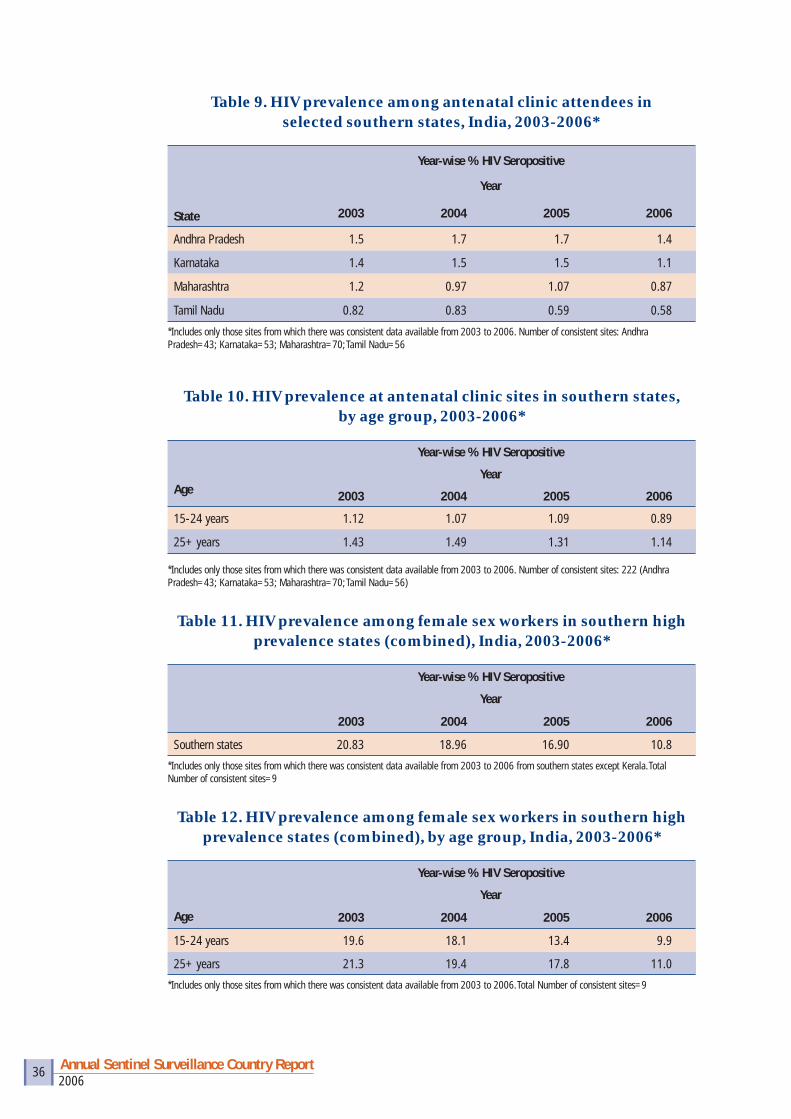
Table 9. HIV prevalence among antenatal clinic attendees in selected southern states, India, 2003-2006*
State
Year-wise % HIV Seropositive
Year
2003 2004 2005 2006
Andhra Pradesh 1.5 1.7 1.7 1.4
Karnataka 1.4 1.5 1.5 1.1
Maharashtra 1.2 0.97 1.07 0.87
Tamil Nadu 0.82 0.83 0.59 0.58
*Includes only those sites from which there was consistent data available from 2003 to 2006. Number of consistent sites: Andhra Pradesh=43; Karnataka=53; Maharashtra=70; Tamil Nadu=56
Table 10. HIV prevalence at antenatal clinic sites in southern states, by age group, 2003-2006*
Age
Year-wise % HIV Seropositive
Year
2003 2004 2005 2006
15-24 years 1.12 1.07 1.09 0.89
25+ years 1.43 1.49 1.31 1.14
*Includes only those sites from which there was consistent data available from 2003 to 2006. Number of consistent sites: 222 (Andhra Pradesh=43; Karnataka=53; Maharashtra=70; Tamil Nadu=56)
Table 11. HIV prevalence among female sex workers in southern high prevalence states (combined), India, 2003-2006*
Year-wise % HIV Seropositive
Year
2003 2004 2005 2006
Southern states 20.83 18.96 16.90 10.8
*Includes only those sites from which there was consistent data available from 2003 to 2006 from southern states except Kerala. Total Number of consistent sites=9
Table 12. HIV prevalence among female sex workers in southern high prevalence states (combined), by age group, India, 2003-2006*
Age
Year-wise % HIV Seropositive
Year
2003 2004 2005 2006
15-24 years 19.6 18.1 13.4 9.9
25+ years 21.3 19.4 17.8 11.0
*Includes only those sites from which there was consistent data available from 2003 to 2006. Total Number of consistent sites=9
2006Annual Sentinel Surveillance Country Report 37
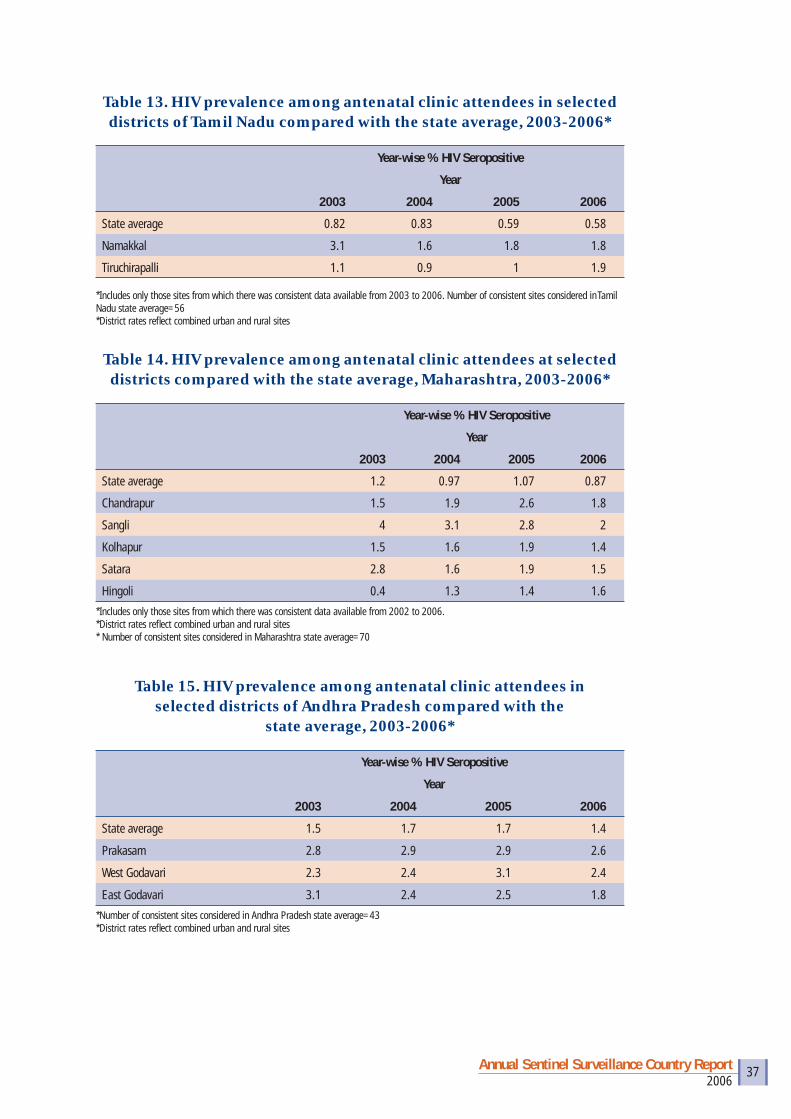
Table 13. HIV prevalence among antenatal clinic attendees in selected districts of Tamil Nadu compared with the state average, 2003-2006*
Year-wise % HIV Seropositive
Year
2003 2004 2005 2006
State average 0.82 0.83 0.59 0.58
Namakkal 3.1 1.6 1.8 1.8
Tiruchirapalli 1.1 0.9 1 1.9
*Includes only those sites from which there was consistent data available from 2003 to 2006. Number of consistent sites considered in Tamil Nadu state average=56*District rates refl ect combined urban and rural sites
Table 14. HIV prevalence among antenatal clinic attendees at selected districts compared with the state average, Maharashtra, 2003-2006*
Year-wise % HIV Seropositive
Year
2003 2004 2005 2006
State average 1.2 0.97 1.07 0.87
Chandrapur 1.5 1.9 2.6 1.8
Sangli 4 3.1 2.8 2
Kolhapur 1.5 1.6 1.9 1.4
Satara 2.8 1.6 1.9 1.5
Hingoli 0.4 1.3 1.4 1.6
*Includes only those sites from which there was consistent data available from 2002 to 2006.*District rates refl ect combined urban and rural sites* Number of consistent sites considered in Maharashtra state average=70
Table 15. HIV prevalence among antenatal clinic attendees in selected districts of Andhra Pradesh compared with the
state average, 2003-2006*
Year-wise % HIV Seropositive
Year
2003 2004 2005 2006
State average 1.5 1.7 1.7 1.4
Prakasam 2.8 2.9 2.9 2.6
West Godavari 2.3 2.4 3.1 2.4
East Godavari 3.1 2.4 2.5 1.8
*Number of consistent sites considered in Andhra Pradesh state average=43*District rates refl ect combined urban and rural sites
2006Annual Sentinel Surveillance Country Report 38
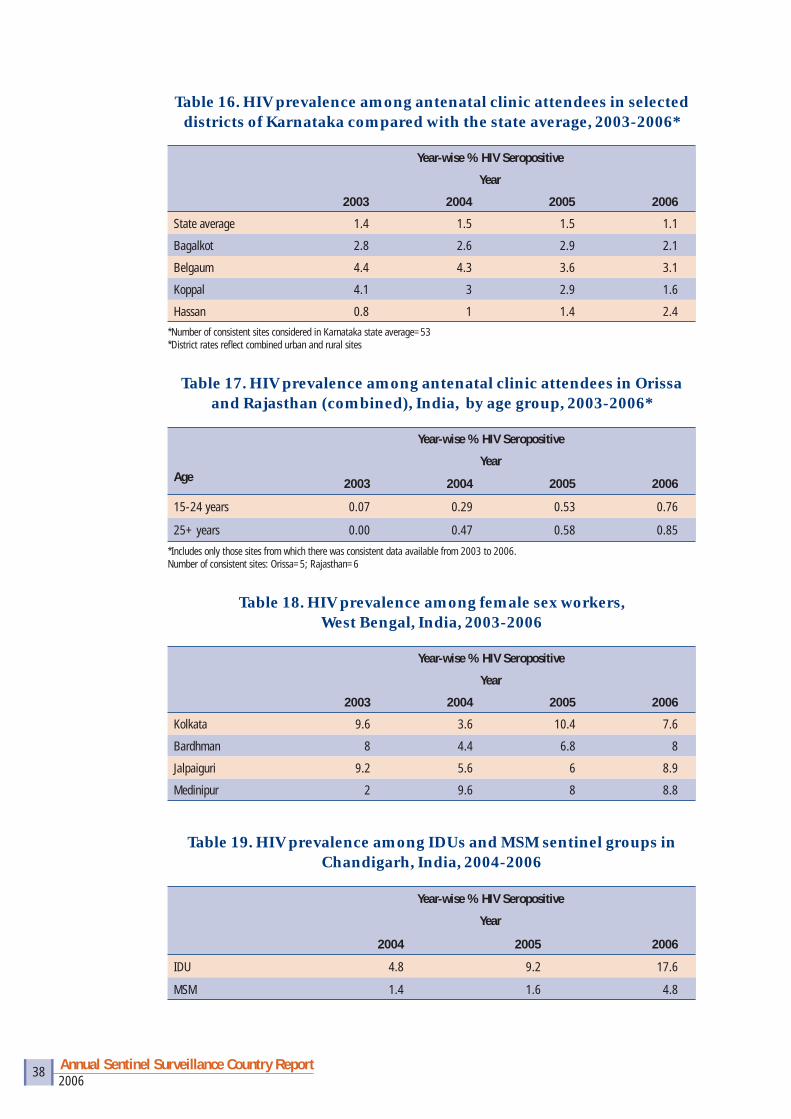
Table 16. HIV prevalence among antenatal clinic attendees in selected districts of Karnataka compared with the state average, 2003-2006*
Year-wise % HIV Seropositive
Year
2003 2004 2005 2006
State average 1.4 1.5 1.5 1.1
Bagalkot 2.8 2.6 2.9 2.1
Belgaum 4.4 4.3 3.6 3.1
Koppal 4.1 3 2.9 1.6
Hassan 0.8 1 1.4 2.4
*Number of consistent sites considered in Karnataka state average=53*District rates refl ect combined urban and rural sites
Table 17. HIV prevalence among antenatal clinic attendees in Orissa and Rajasthan (combined), India, by age group, 2003-2006*
Age
Year-wise % HIV Seropositive
Year
2003 2004 2005 2006
15-24 years 0.07 0.29 0.53 0.76
25+ years 0.00 0.47 0.58 0.85
*Includes only those sites from which there was consistent data available from 2003 to 2006.Number of consistent sites: Orissa=5; Rajasthan=6
Table 18. HIV prevalence among female sex workers, West Bengal, India, 2003-2006
Year-wise % HIV Seropositive
Year
2003 2004 2005 2006
Kolkata 9.6 3.6 10.4 7.6
Bardhman 8 4.4 6.8 8
Jalpaiguri 9.2 5.6 6 8.9
Medinipur 2 9.6 8 8.8
Table 19. HIV prevalence among IDUs and MSM sentinel groups in Chandigarh, India, 2004-2006
Year-wise % HIV Seropositive
Year
2004 2005 2006
IDU 4.8 9.2 17.6
MSM 1.4 1.6 4.8
2006Annual Sentinel Surveillance Country Report 39
Table 20. HIV prevalence among men who have sex with men at selected sentinel sites, India, 2004-2006
Year-wise % HIV Seropositive
Year
2004 2005 2006
Krishna, AP 16 6.5 10.2
Bangalore 10 11.6 19.2
Pune 12.8 14.8 23.6
Imphal 14 15 10
Mumbai 9 6 7
Chennai 7 4 4
Villupuruam 7 8 7
All sites 10.9 9.5 11.8
Table 21. HIV prevalence among antenatal clinic attendees, by place of residence, India, 2006
No. Tested No. Positive % Positive
Urban 95,066 610 0.64
Rural 1,39,965 794 0.57
Total 2,35,031 1404 0.60
Table 22. HIV prevalence among antenatal clinic attendees in selected states of India, by place of residence, 2006
Place of residence
Urban % Rural %
Punjab 0.13 0.25
Uttar Pradesh 0.13 0.35
Jharkhand 0.14 0.12
Rajasthan 0.34 0.23
Bihar 0.54 0.31
Orissa 0.56 0.55
Gujarat 0.58 0.52
Tamil Nadu 0.40 0.61
2006Annual Sentinel Surveillance Country Report 40
Table 23. HIV prevalence among patients with a sexually transmitted infection, by type of sexually transmitted disease and gender,
India, 2006
Male Female
No. No. % No. No. %
Tested Positive Positive Tested Positive Positive
Southern states
Genital Ulcer 3022 474 15.7 624 121 19.4
Urethral/Cervical Discharge 1852 251 13.6 2875 281 9.8
Genital Warts 391 93 23.8 175 39 22.3
Northeastern states
Genital Ulcer 95 6 6.3 14 2 14.3
Urethral/Cervical Discharge 37 0 0.0 253 7 2.8
Genital Warts 51 4 7.8 18 3 16.7
Gujarat, Pondicherry, & Goa
Genital Ulcer 821 68 8.3 278 29 10.4
Urethral/Cervical Discharge 316 28 8.9 1504 33 2.2
Genital Warts 151 11 7.3 78 6 7.7
Remaining states
Genital Ulcer 8629 155 1.8 4710 63 1.3
Urethral/Cervical Discharge 8437 113 1.3 14563 98 0.7
Genital Warts 2090 51 2.4 743 5 0.7
TOTAL
Genital Ulcer 12567 703 0.056 5626 215 0.038
Urethral/Cervical Discharge 10642 392 0.037 19195 419 0.022
Genital Warts 2683 159 0.059 1014 53 0.052
Table 24. HIV prevalence among antenatal attendees by age group, India, 2006
Age No. Tested No. Positive % Positive
15-19 years 21707 105 0.5
20-29 years 185464 1119 0.6
30-44 years 27583 180 0.7
45-49 years 277 0 0.0
Total 235031 1404 0.6
2006Annual Sentinel Surveillance Country Report 41
Table 25. HIV prevalence among antenatal clinic attendees by literacy, India, 2006
No. Tested No. Positive % Positive
Illiterate 66216 476 0.7
Primary 61494 349 0.6
Secondary 93229 526 0.6
Graduation & above 14092 53 0.4
Total 235031 1404 0.6
Table 26. HIV prevalence among antenatal clinic attendees by occupation of spouse, India, 2006
No. Tested No. Positive % Positive
Truck/Auto/Taxi Driver/Cleaner 20260 173 0.9
Agriculture/Unskilled Worker 116997 732 0.6
Unemployed 6276 36 0.6
Hotel Staff 4069 23 0.6
Industry/Factory Worker 20275 106 0.5
Business 37119 192 0.5
Service 27672 134 0.5
Student 1862 7 0.4
Sex Worker 4 0 0.0
Total 234534 1403 0.6

2006Annual Sentinel Surveillance Country Report 42
State-wise list of HIV Sentinel Surveillance sites, by group, 2006
State Name STD ANCANC Rural IDU FSW MSM MRG EUN TRK
Fisher Folk Total
A & N Islands 2 3 5
Andhra Pradesh 11 23 21 7 1 63
Arunachal Pradesh 7 5 1 1 14
Assam 9 15 2 11 1 38
Bihar 24 23 2 10 2 61
Chandigarh 2 1 1 3 1 8
Chhattisgarh 6 19 4 29
D & N Haveli 1 1
Daman & Diu 2 2
Delhi 5 5 2 6 3 21
Goa 2 2 1 5
Gujarat 10 25 3 3 41
Haryana 9 12 1 7 1 30
Himachal Pradesh 6 10 3 1 20
Jammu & Kashmir 7 16 1 1 25
Jharkhand 11 16 1 7 35
Karnataka 7 27 27 1 5 1 68
Kerala 5 6 3 5 5 1 25
Lakshadweep 1 2 3
Madhya Pradesh 13 36 3 52
Maharashtra 8 33 33 10 1 85
Manipur 2 10 4 4 3 1 24
Meghalaya 3 1 6 1 11
Mizoram 3 4 8 1 16
Mumbai 3 7 1 3 1 1 1 17
Nagaland 1 11 8 8 1 29
Orissa 7 23 1 2 5 6 1 45
Pondicherry 3 2 3 2 10
Punjab 3 6 5 2 5 1 3 25
Rajasthan 15 25 7 1 48
Sikkim 1 3 2 6
Tamil Nadu 11 35 29 2 11 2 90
Tripura 7 2 1 10
Uttar Pradesh 28 47 15 1 8 99
Uttarakhand 7 9 16
West Bengal 12 3 10 5 8 2 5 45
Total 251 470 158 51 138 31 6 1 15 1 1122
Sentinel Sites
Annexure II

2006Annual Sentinel Surveillance Country Report 43
HIV Sentinel Surveillance sites, by group, 1998-2006
Site type/year 1998 1999 2000 2001 2002 2003 2004 2005 2006
STD 76 75 98 133 166 163 171 175 251
ANC 92 93 111 172 200 266 268 267 470
IDU 5 6 10 10 13 18 24 30 51
MSM - - 3 3 3 9 15 18 31
FSW 1 1 2 2 2 32 42 83 138
ANC (Rural) - - - - - 210 122 124 158
TB 2 2 - - - - 7 4 -
Migrant - - - - - - - 1 6
Eunuchs - - - - - - - 1 1
Truckers - - - - - - - - 15
Fisher Folk - - - - - - - - 1
Others (Seamen) - - - - - 1 - - -
Total 176* (180)
177* (180)
224 (232)
320 384 699 649 703 1122
Note: Numbers in bracket show the total number of sites where surveillance was done.* Shows data available with NIHFW
2006Annual Sentinel Surveillance Country Report 44
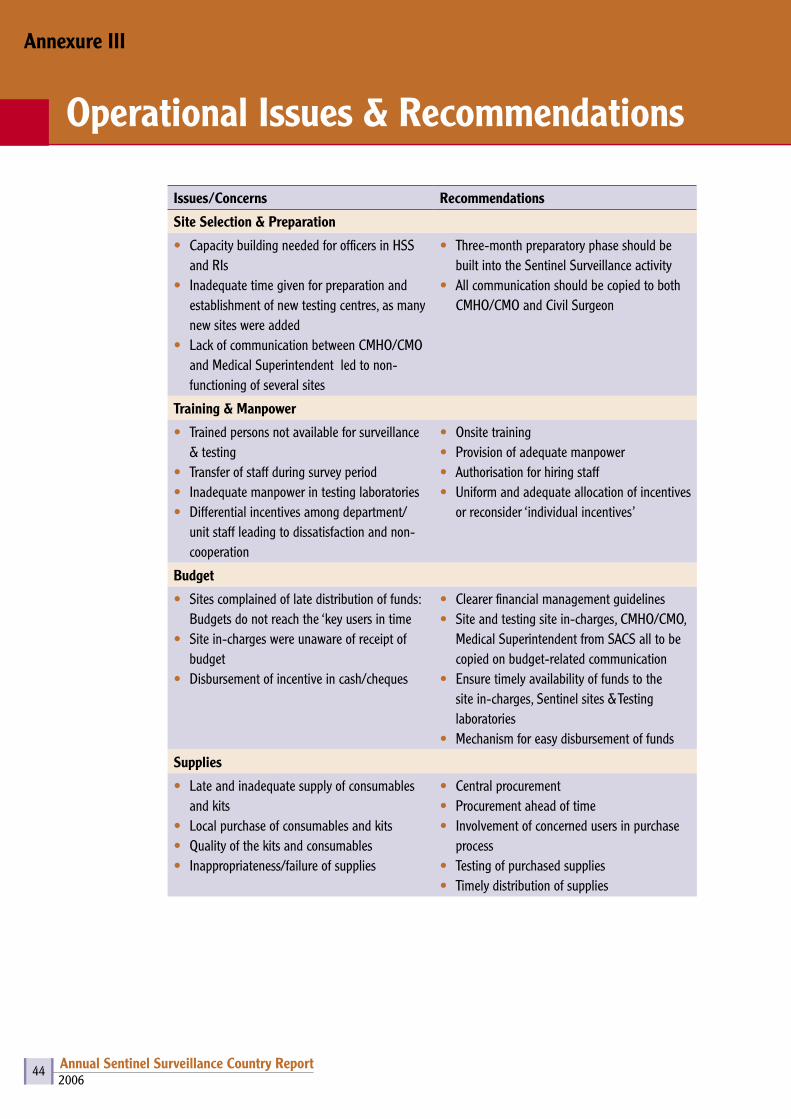
Issues/Concerns Recommendations
Site Selection & Preparation
• Capacity building needed for officers in HSS and RIs
• Inadequate time given for preparation and establishment of new testing centres, as many new sites were added
• Lack of communication between CMHO/CMO and Medical Superintendent led to non-functioning of several sites
• Three-month preparatory phase should be built into the Sentinel Surveillance activity
• All communication should be copied to both CMHO/CMO and Civil Surgeon
Training & Manpower
• Trained persons not available for surveillance & testing
• Transfer of staff during survey period• Inadequate manpower in testing laboratories• Differential incentives among department/
unit staff leading to dissatisfaction and non-cooperation
• Onsite training • Provision of adequate manpower• Authorisation for hiring staff• Uniform and adequate allocation of incentives
or reconsider ‘individual incentives’
Budget
• Sites complained of late distribution of funds: Budgets do not reach the ‘key users in time
• Site in-charges were unaware of receipt of budget
• Disbursement of incentive in cash/cheques
• Clearer financial management guidelines• Site and testing site in-charges, CMHO/CMO,
Medical Superintendent from SACS all to be copied on budget-related communication
• Ensure timely availability of funds to the site in-charges, Sentinel sites & Testing laboratories
• Mechanism for easy disbursement of funds
Supplies
• Late and inadequate supply of consumables and kits
• Local purchase of consumables and kits• Quality of the kits and consumables• Inappropriateness/failure of supplies
• Central procurement• Procurement ahead of time• Involvement of concerned users in purchase
process• Testing of purchased supplies• Timely distribution of supplies
Annexure III
Operational Issues & Recommendations
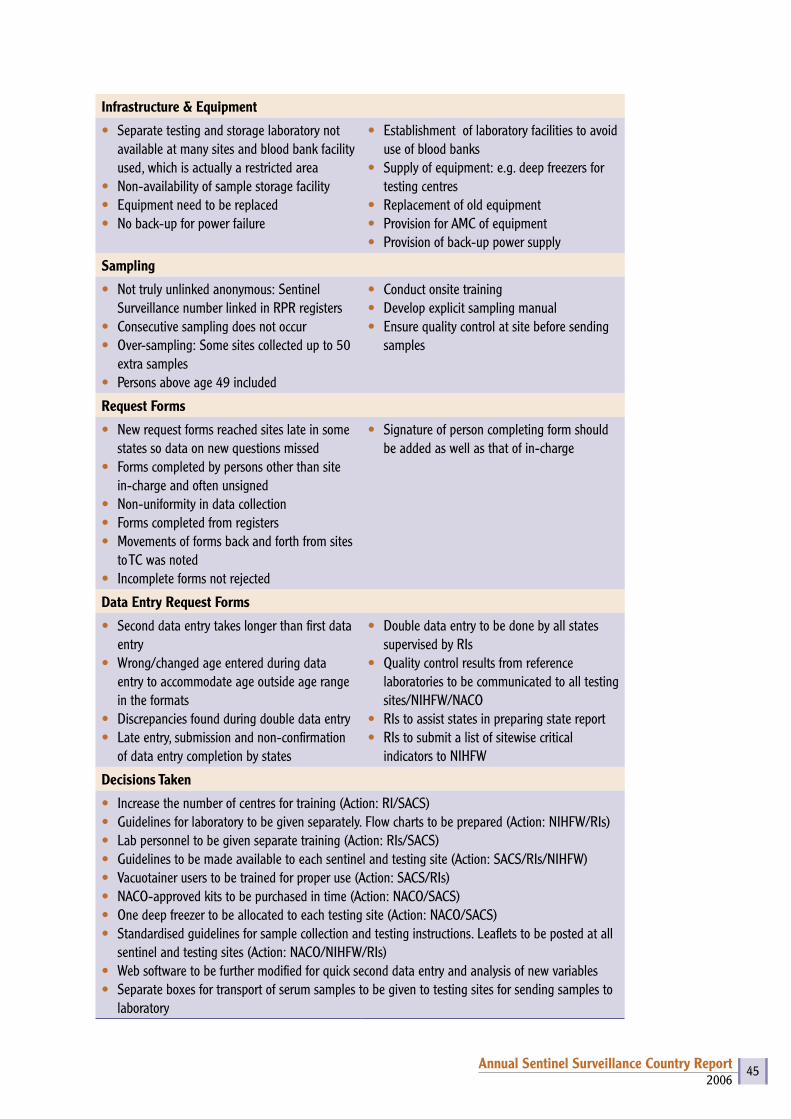
2006Annual Sentinel Surveillance Country Report 45
Infrastructure & Equipment
• Separate testing and storage laboratory not available at many sites and blood bank facility used, which is actually a restricted area
• Non-availability of sample storage facility• Equipment need to be replaced• No back-up for power failure
• Establishment of laboratory facilities to avoid use of blood banks
• Supply of equipment: e.g. deep freezers for testing centres
• Replacement of old equipment• Provision for AMC of equipment• Provision of back-up power supply
Sampling
• Not truly unlinked anonymous: Sentinel Surveillance number linked in RPR registers
• Consecutive sampling does not occur• Over-sampling: Some sites collected up to 50
extra samples• Persons above age 49 included
• Conduct onsite training• Develop explicit sampling manual• Ensure quality control at site before sending
samples
Request Forms
• New request forms reached sites late in some states so data on new questions missed
• Forms completed by persons other than site in-charge and often unsigned
• Non-uniformity in data collection• Forms completed from registers• Movements of forms back and forth from sites
to TC was noted• Incomplete forms not rejected
• Signature of person completing form should be added as well as that of in-charge
Data Entry Request Forms
• Second data entry takes longer than first data entry
• Wrong/changed age entered during data entry to accommodate age outside age range in the formats
• Discrepancies found during double data entry• Late entry, submission and non-confirmation
of data entry completion by states
• Double data entry to be done by all states supervised by RIs
• Quality control results from reference laboratories to be communicated to all testing sites/NIHFW/NACO
• RIs to assist states in preparing state report• RIs to submit a list of sitewise critical
indicators to NIHFW
Decisions Taken
• Increase the number of centres for training (Action: RI/SACS)• Guidelines for laboratory to be given separately. Flow charts to be prepared (Action: NIHFW/RIs)• Lab personnel to be given separate training (Action: RIs/SACS)• Guidelines to be made available to each sentinel and testing site (Action: SACS/RIs/NIHFW)• Vacuotainer users to be trained for proper use (Action: SACS/RIs) • NACO-approved kits to be purchased in time (Action: NACO/SACS)• One deep freezer to be allocated to each testing site (Action: NACO/SACS)• Standardised guidelines for sample collection and testing instructions. Leaflets to be posted at all
sentinel and testing sites (Action: NACO/NIHFW/RIs)• Web software to be further modified for quick second data entry and analysis of new variables• Separate boxes for transport of serum samples to be given to testing sites for sending samples to
laboratory
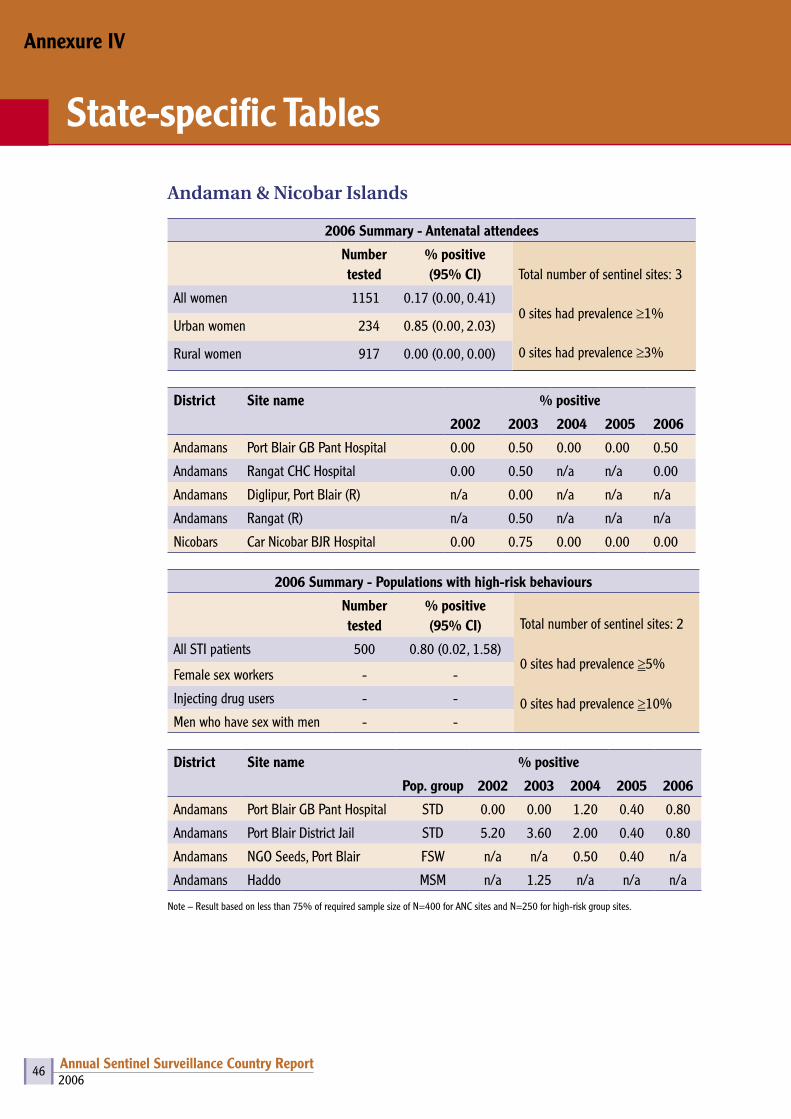
2006Annual Sentinel Surveillance Country Report 46
Andaman & Nicobar Islands
2006 Summary - Antenatal attendees
Number tested
% positive (95% CI) Total number of sentinel sites: 3
0 sites had prevalence ≥1%
0 sites had prevalence ≥3%
All women 1151 0.17 (0.00, 0.41)
Urban women 234 0.85 (0.00, 2.03)
Rural women 917 0.00 (0.00, 0.00)
District Site name % positive
2002 2003 2004 2005 2006
Andamans Port Blair GB Pant Hospital 0.00 0.50 0.00 0.00 0.50
Andamans Rangat CHC Hospital 0.00 0.50 n/a n/a 0.00
Andamans Diglipur, Port Blair (R) n/a 0.00 n/a n/a n/a
Andamans Rangat (R) n/a 0.50 n/a n/a n/a
Nicobars Car Nicobar BJR Hospital 0.00 0.75 0.00 0.00 0.00
2006 Summary - Populations with high-risk behaviours
Number tested
% positive(95% CI) Total number of sentinel sites: 2
0 sites had prevalence ≥5%
0 sites had prevalence ≥10%
All STI patients 500 0.80 (0.02, 1.58)
Female sex workers - -
Injecting drug users - -
Men who have sex with men - -
District Site name % positive
Pop. group 2002 2003 2004 2005 2006
Andamans Port Blair GB Pant Hospital STD 0.00 0.00 1.20 0.40 0.80
Andamans Port Blair District Jail STD 5.20 3.60 2.00 0.40 0.80
Andamans NGO Seeds, Port Blair FSW n/a n/a 0.50 0.40 n/a
Andamans Haddo MSM n/a 1.25 n/a n/a n/a
Note – Result based on less than 75% of required sample size of N=400 for ANC sites and N=250 for high-risk group sites.
Annexure IV
State-specific Tables

2006Annual Sentinel Surveillance Country Report 47
Andhra Pradesh
2006 Summary - Antenatal attendees
Number tested
% positive (95% CI) Total number of sentinel sites: 44
30 sites had prevalence ≥1%
4 sites had prevalence ≥3%
All women 17563 1.41 (1.23, 1.58)
Urban women 6287 1.54 (1.24, 1.85)
Rural women 11276 1.33 (1.12, 1.54)
District Site name % positive
2002 2003 2004 2005 2006
Adilabad Adilabad District Headquarters Hospital n/a 0.75 0.75 1.75 0.50
Adilabad Area Hospital, Mancherial (R) n/a 1.50 0.25 1.00 0.25
Anantapur Anantapur Medical College 1.25 1.25 1.75 1.75 2.25
Anantapur Area Hospital, Guntakal (R) n/a 0.75 1.25 1.00 0.50
Chittoor Chittoor District Headquarters Hospital 1.00 0.00 1.25 1.25 0.25
Chittoor Area Hospital, Srikalahasti (R) n/a 1.50 2.00 2.00 0.50
Cuddapah Cuddapah District Hospital n/a 2.50 2.75 0.75 1.50
Cuddapah Area Hospital, Rajampeta (R) n/a 1.25 1.25 0.50 1.75
Guntur Guntur Medical College 4.00 3.75 3.50 3.00 2.25
Guntur Area Hospital, Narsorapet (R) n/a 2.76 1.50 2.50 1.25
Hyderabad Hyderabad Gandhi Medical College 1.50 1.00 0.75 2.00 2.00
East Godavari Kakinada Rangaraya Medical College 2.99 2.50 3.00 2.75 1.25
East Godavari Area Hospital, Ramachandrapuram (R) n/a 3.75 1.75 2.25 2.25
Karimnagar Karimnagar District Hospital n/a 2.00 3.50 2.25 0.50
Karimnagar Area Hospital, Jagitial (R) n/a 2.01 1.50 0.57 1.50
Khammam Area Hospital, Kothagudem n/a 1.50 2.00 3.50 2.75
Khammam Area Hospital, Bhadrachalam (R) n/a n/a 2.00 2.25 1.01
Kurnool Kurnool Medical College 0.50 0.50 0.75 1.50 0.75
Kurnool Women & Child Hospital, Adoni (R) n/a 0.25 0.25 0.00 1.00
Krishna Machilipatnam District Hospital 2.25 1.75 2.25 2.00 1.75
Krishna Area Hospital, Nuzividu (R) n/a 1.00 1.50 1.50 1.27
Medak Sangareddy District Hospital n/a 0.50 1.00 2.00 2.00
Medak CHC, Narsapur (R) n/a 0.00* 0.50 0.72* 1.50
Mahabubnagar Mahabubnagar District Hospital 0.25 0.25 0.75 0.25 3.02
Mahabubnagar Area Hospital, Gadwal (R) n/a 0.50 0.75 0.25 0.75
Nalgonda Nalgonda District Hospital 1.75 1.50 2.25 2.75 2.00
Nalgonda Area Hospital, Bhongir (R) n/a 0.75 0.75 1.00 1.00
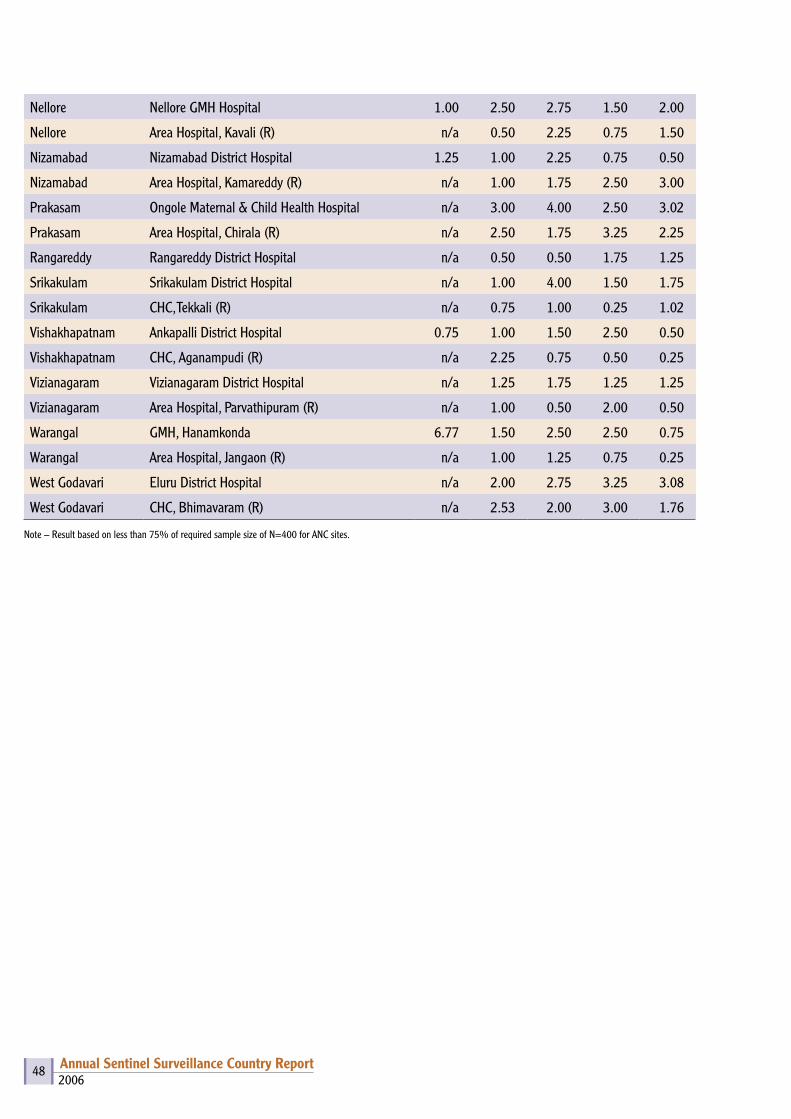
2006Annual Sentinel Surveillance Country Report 48
Nellore Nellore GMH Hospital 1.00 2.50 2.75 1.50 2.00
Nellore Area Hospital, Kavali (R) n/a 0.50 2.25 0.75 1.50
Nizamabad Nizamabad District Hospital 1.25 1.00 2.25 0.75 0.50
Nizamabad Area Hospital, Kamareddy (R) n/a 1.00 1.75 2.50 3.00
Prakasam Ongole Maternal & Child Health Hospital n/a 3.00 4.00 2.50 3.02
Prakasam Area Hospital, Chirala (R) n/a 2.50 1.75 3.25 2.25
Rangareddy Rangareddy District Hospital n/a 0.50 0.50 1.75 1.25
Srikakulam Srikakulam District Hospital n/a 1.00 4.00 1.50 1.75
Srikakulam CHC, Tekkali (R) n/a 0.75 1.00 0.25 1.02
Vishakhapatnam Ankapalli District Hospital 0.75 1.00 1.50 2.50 0.50
Vishakhapatnam CHC, Aganampudi (R) n/a 2.25 0.75 0.50 0.25
Vizianagaram Vizianagaram District Hospital n/a 1.25 1.75 1.25 1.25
Vizianagaram Area Hospital, Parvathipuram (R) n/a 1.00 0.50 2.00 0.50
Warangal GMH, Hanamkonda 6.77 1.50 2.50 2.50 0.75
Warangal Area Hospital, Jangaon (R) n/a 1.00 1.25 0.75 0.25
West Godavari Eluru District Hospital n/a 2.00 2.75 3.25 3.08
West Godavari CHC, Bhimavaram (R) n/a 2.53 2.00 3.00 1.76
Note – Result based on less than 75% of required sample size of N=400 for ANC sites.
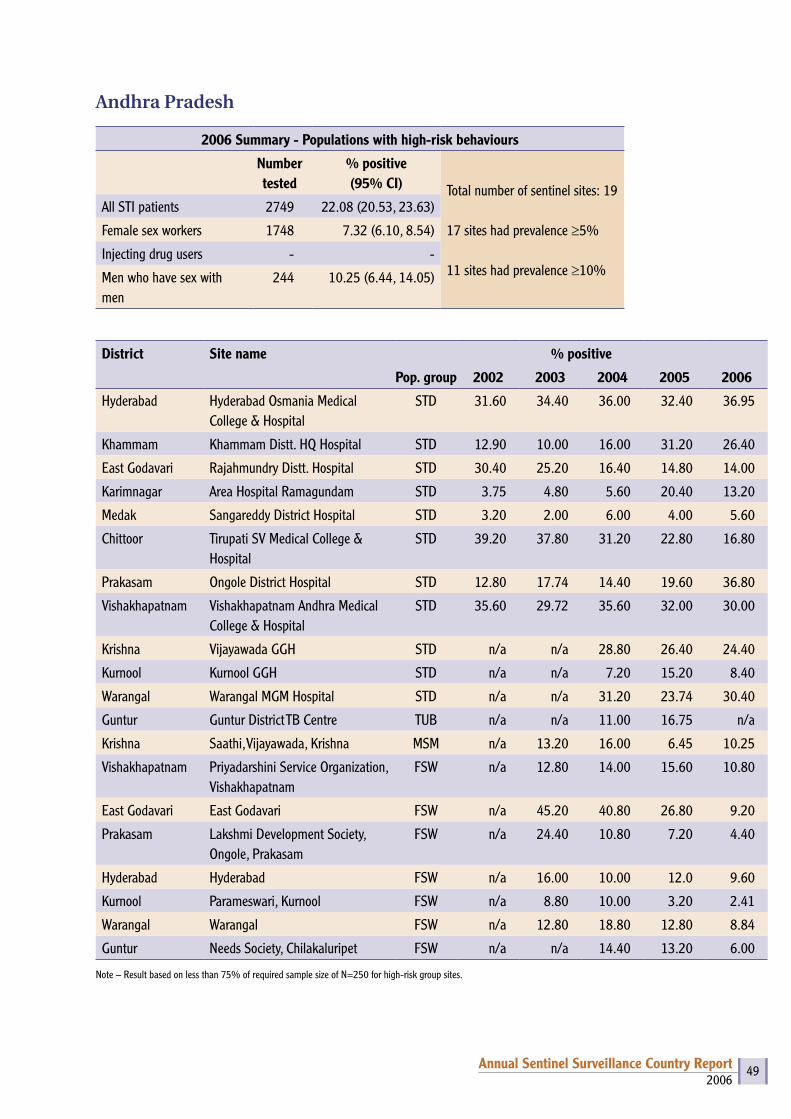
2006Annual Sentinel Surveillance Country Report 49
Andhra Pradesh
2006 Summary - Populations with high-risk behaviours
Number tested
% positive(95% CI) Total number of sentinel sites: 19
17 sites had prevalence ≥5%
11 sites had prevalence ≥10%
All STI patients 2749 22.08 (20.53, 23.63)
Female sex workers 1748 7.32 (6.10, 8.54)
Injecting drug users - -
Men who have sex with men
244 10.25 (6.44, 14.05)
District Site name % positive
Pop. group 2002 2003 2004 2005 2006
Hyderabad Hyderabad Osmania Medical College & Hospital
STD 31.60 34.40 36.00 32.40 36.95
Khammam Khammam Distt. HQ Hospital STD 12.90 10.00 16.00 31.20 26.40
East Godavari Rajahmundry Distt. Hospital STD 30.40 25.20 16.40 14.80 14.00
Karimnagar Area Hospital Ramagundam STD 3.75 4.80 5.60 20.40 13.20
Medak Sangareddy District Hospital STD 3.20 2.00 6.00 4.00 5.60
Chittoor Tirupati SV Medical College & Hospital
STD 39.20 37.80 31.20 22.80 16.80
Prakasam Ongole District Hospital STD 12.80 17.74 14.40 19.60 36.80
Vishakhapatnam Vishakhapatnam Andhra Medical College & Hospital
STD 35.60 29.72 35.60 32.00 30.00
Krishna Vijayawada GGH STD n/a n/a 28.80 26.40 24.40
Kurnool Kurnool GGH STD n/a n/a 7.20 15.20 8.40
Warangal Warangal MGM Hospital STD n/a n/a 31.20 23.74 30.40
Guntur Guntur District TB Centre TUB n/a n/a 11.00 16.75 n/a
Krishna Saathi, Vijayawada, Krishna MSM n/a 13.20 16.00 6.45 10.25
Vishakhapatnam Priyadarshini Service Organization, Vishakhapatnam
FSW n/a 12.80 14.00 15.60 10.80
East Godavari East Godavari FSW n/a 45.20 40.80 26.80 9.20
Prakasam Lakshmi Development Society, Ongole, Prakasam
FSW n/a 24.40 10.80 7.20 4.40
Hyderabad Hyderabad FSW n/a 16.00 10.00 12.0 9.60
Kurnool Parameswari, Kurnool FSW n/a 8.80 10.00 3.20 2.41
Warangal Warangal FSW n/a 12.80 18.80 12.80 8.84
Guntur Needs Society, Chilakaluripet FSW n/a n/a 14.40 13.20 6.00
Note – Result based on less than 75% of required sample size of N=250 for high-risk group sites.
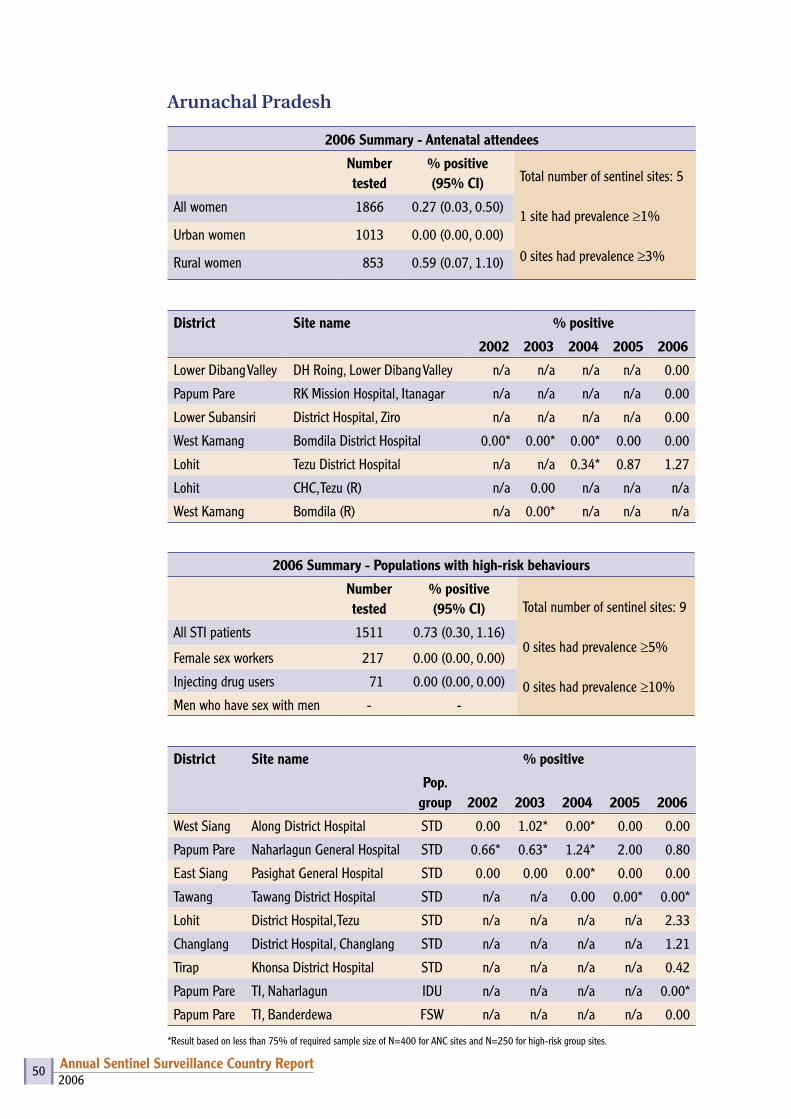
2006Annual Sentinel Surveillance Country Report 50
Arunachal Pradesh
2006 Summary - Antenatal attendees
Number tested
% positive (95% CI) Total number of sentinel sites: 5
1 site had prevalence ≥1%
0 sites had prevalence ≥3%
All women 1866 0.27 (0.03, 0.50)
Urban women 1013 0.00 (0.00, 0.00)
Rural women 853 0.59 (0.07, 1.10)
District Site name % positive
2002 2003 2004 2005 2006
Lower Dibang Valley DH Roing, Lower Dibang Valley n/a n/a n/a n/a 0.00
Papum Pare RK Mission Hospital, Itanagar n/a n/a n/a n/a 0.00
Lower Subansiri District Hospital, Ziro n/a n/a n/a n/a 0.00
West Kamang Bomdila District Hospital 0.00* 0.00* 0.00* 0.00 0.00
Lohit Tezu District Hospital n/a n/a 0.34* 0.87 1.27
Lohit CHC, Tezu (R) n/a 0.00 n/a n/a n/a
West Kamang Bomdila (R) n/a 0.00* n/a n/a n/a
2006 Summary - Populations with high-risk behaviours
Number tested
% positive(95% CI) Total number of sentinel sites: 9
0 sites had prevalence ≥5%
0 sites had prevalence ≥10%
All STI patients 1511 0.73 (0.30, 1.16)
Female sex workers 217 0.00 (0.00, 0.00)
Injecting drug users 71 0.00 (0.00, 0.00)
Men who have sex with men - -
District Site name % positive
Pop. group 2002 2003 2004 2005 2006
West Siang Along District Hospital STD 0.00 1.02* 0.00* 0.00 0.00
Papum Pare Naharlagun General Hospital STD 0.66* 0.63* 1.24* 2.00 0.80
East Siang Pasighat General Hospital STD 0.00 0.00 0.00* 0.00 0.00
Tawang Tawang District Hospital STD n/a n/a 0.00 0.00* 0.00*
Lohit District Hospital, Tezu STD n/a n/a n/a n/a 2.33
Changlang District Hospital, Changlang STD n/a n/a n/a n/a 1.21
Tirap Khonsa District Hospital STD n/a n/a n/a n/a 0.42
Papum Pare TI, Naharlagun IDU n/a n/a n/a n/a 0.00*
Papum Pare TI, Banderdewa FSW n/a n/a n/a n/a 0.00
*Result based on less than 75% of required sample size of N=400 for ANC sites and N=250 for high-risk group sites.
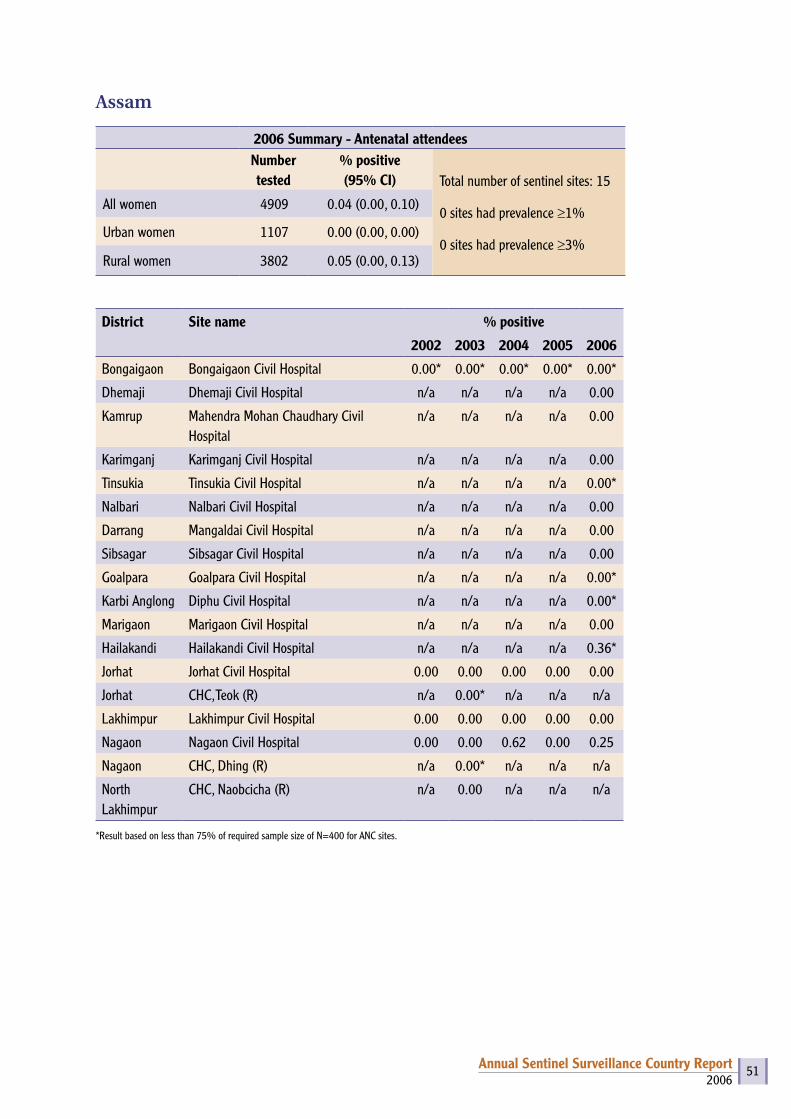
2006Annual Sentinel Surveillance Country Report 51
Assam
2006 Summary - Antenatal attendeesNumber tested
% positive (95% CI) Total number of sentinel sites: 15
0 sites had prevalence ≥1%
0 sites had prevalence ≥3%
All women 4909 0.04 (0.00, 0.10)
Urban women 1107 0.00 (0.00, 0.00)
Rural women 3802 0.05 (0.00, 0.13)
District Site name % positive
2002 2003 2004 2005 2006
Bongaigaon Bongaigaon Civil Hospital 0.00* 0.00* 0.00* 0.00* 0.00*
Dhemaji Dhemaji Civil Hospital n/a n/a n/a n/a 0.00
Kamrup Mahendra Mohan Chaudhary Civil Hospital
n/a n/a n/a n/a 0.00
Karimganj Karimganj Civil Hospital n/a n/a n/a n/a 0.00
Tinsukia Tinsukia Civil Hospital n/a n/a n/a n/a 0.00*
Nalbari Nalbari Civil Hospital n/a n/a n/a n/a 0.00
Darrang Mangaldai Civil Hospital n/a n/a n/a n/a 0.00
Sibsagar Sibsagar Civil Hospital n/a n/a n/a n/a 0.00
Goalpara Goalpara Civil Hospital n/a n/a n/a n/a 0.00*
Karbi Anglong Diphu Civil Hospital n/a n/a n/a n/a 0.00*
Marigaon Marigaon Civil Hospital n/a n/a n/a n/a 0.00
Hailakandi Hailakandi Civil Hospital n/a n/a n/a n/a 0.36*
Jorhat Jorhat Civil Hospital 0.00 0.00 0.00 0.00 0.00
Jorhat CHC, Teok (R) n/a 0.00* n/a n/a n/a
Lakhimpur Lakhimpur Civil Hospital 0.00 0.00 0.00 0.00 0.00
Nagaon Nagaon Civil Hospital 0.00 0.00 0.62 0.00 0.25
Nagaon CHC, Dhing (R) n/a 0.00* n/a n/a n/a
North Lakhimpur
CHC, Naobcicha (R) n/a 0.00 n/a n/a n/a
*Result based on less than 75% of required sample size of N=400 for ANC sites.
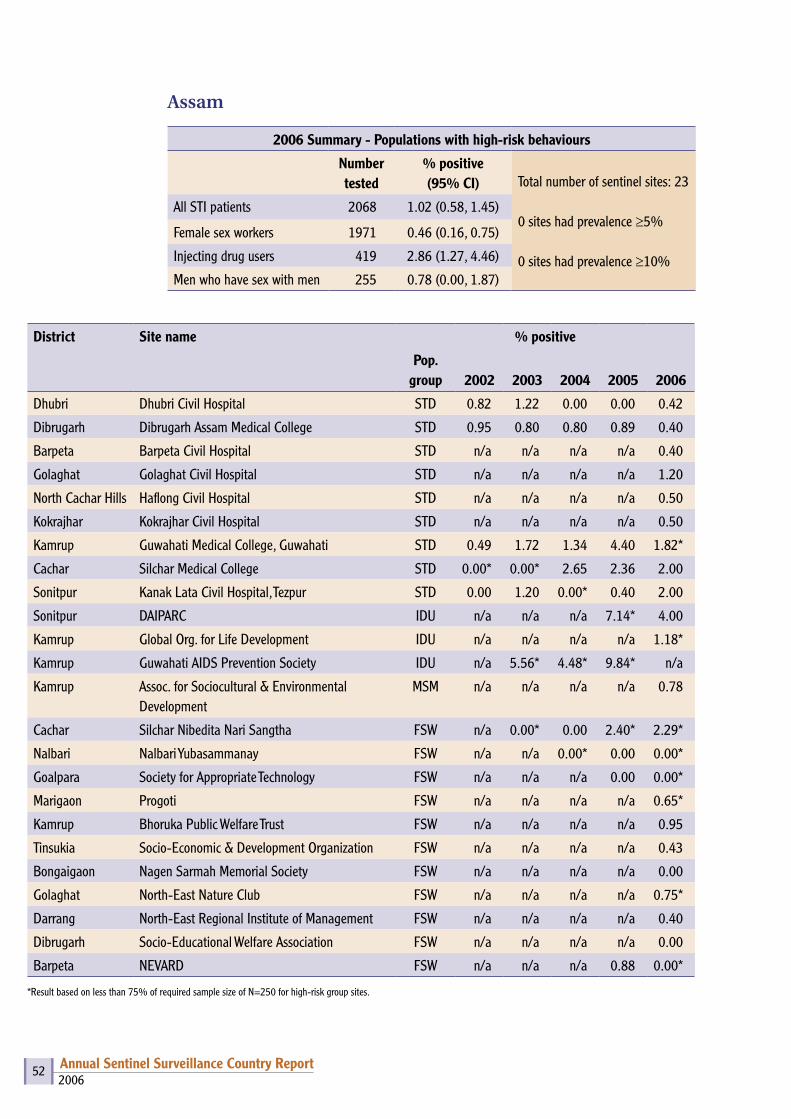
2006Annual Sentinel Surveillance Country Report 52
District Site name % positive
Pop. group 2002 2003 2004 2005 2006
Dhubri Dhubri Civil Hospital STD 0.82 1.22 0.00 0.00 0.42
Dibrugarh Dibrugarh Assam Medical College STD 0.95 0.80 0.80 0.89 0.40
Barpeta Barpeta Civil Hospital STD n/a n/a n/a n/a 0.40
Golaghat Golaghat Civil Hospital STD n/a n/a n/a n/a 1.20
North Cachar Hills Haflong Civil Hospital STD n/a n/a n/a n/a 0.50
Kokrajhar Kokrajhar Civil Hospital STD n/a n/a n/a n/a 0.50
Kamrup Guwahati Medical College, Guwahati STD 0.49 1.72 1.34 4.40 1.82*
Cachar Silchar Medical College STD 0.00* 0.00* 2.65 2.36 2.00
Sonitpur Kanak Lata Civil Hospital, Tezpur STD 0.00 1.20 0.00* 0.40 2.00
Sonitpur DAIPARC IDU n/a n/a n/a 7.14* 4.00
Kamrup Global Org. for Life Development IDU n/a n/a n/a n/a 1.18*
Kamrup Guwahati AIDS Prevention Society IDU n/a 5.56* 4.48* 9.84* n/a
Kamrup Assoc. for Sociocultural & Environmental Development
MSM n/a n/a n/a n/a 0.78
Cachar Silchar Nibedita Nari Sangtha FSW n/a 0.00* 0.00 2.40* 2.29*
Nalbari Nalbari Yubasammanay FSW n/a n/a 0.00* 0.00 0.00*
Goalpara Society for Appropriate Technology FSW n/a n/a n/a 0.00 0.00*
Marigaon Progoti FSW n/a n/a n/a n/a 0.65*
Kamrup Bhoruka Public Welfare Trust FSW n/a n/a n/a n/a 0.95
Tinsukia Socio-Economic & Development Organization FSW n/a n/a n/a n/a 0.43
Bongaigaon Nagen Sarmah Memorial Society FSW n/a n/a n/a n/a 0.00
Golaghat North-East Nature Club FSW n/a n/a n/a n/a 0.75*
Darrang North-East Regional Institute of Management FSW n/a n/a n/a n/a 0.40
Dibrugarh Socio-Educational Welfare Association FSW n/a n/a n/a n/a 0.00
Barpeta NEVARD FSW n/a n/a n/a 0.88 0.00*
*Result based on less than 75% of required sample size of N=250 for high-risk group sites.
Assam
2006 Summary - Populations with high-risk behaviours
Number tested
% positive(95% CI) Total number of sentinel sites: 23
0 sites had prevalence ≥5%
0 sites had prevalence ≥10%
All STI patients 2068 1.02 (0.58, 1.45)
Female sex workers 1971 0.46 (0.16, 0.75)
Injecting drug users 419 2.86 (1.27, 4.46)
Men who have sex with men 255 0.78 (0.00, 1.87)

2006Annual Sentinel Surveillance Country Report 53
Bihar
2006 Summary - Antenatal attendees
Number tested
% positive (95% CI) Total number of sentinel sites: 23
1 sites had prevalence ≥1%
0 sites had prevalence ≥3%
All women 8828 0.36 (0.24, 0.49)
Urban women 2031 0.54 (0.22, 0.86)
Rural women 6797 0.31 (0.18, 0.44)
District Site name % positive
2002 2003 2004 2005 2006
Araria Araria Sadar Hospital 0.25 0.00 0.00 1.75 0.00
Begusarai Begusarai Sadar Hospital 0.25 0.25 0.50 n/a 0.50
Bhagalpur Bhagalpur Jawahar Lal Nehru Medical College Hospital
0.25 0.00 0.25 0.50 0.25
Muzaffarpur Muzaffarpur Sri Krishna Medical College Hospital 0.00 0.00 0.00 0.00 0.00
Patna Patna Medical College Hospital 1.00 0.50 0.75 0.00 0.75
East Champaran Raxaul Duncan Hospital 0.00 0.00 0.00 0.00 0.50
Rohtas Rohtas Sadar Hospital/Sasaram Sadar Hospital n/a 0.00 0.00 0.00 0.50
Kishanganj Mata Gujri Memorial Medical College Hospital n/a n/a n/a n/a 0.00
Darbhanga Laheriasarai Darbhanga Medical College Hospital n/a n/a n/a n/a 0.25
Banka Banka Sadar Hospital n/a n/a n/a n/a 0.75
Saharsa Saharsa Sadar Hospital n/a n/a n/a n/a 1.14*
West Champaran Bettiah MJK Hospital n/a n/a n/a n/a 0.00
Samastipur Samastipur Sadar Hospital n/a n/a n/a n/a 0.75
Vaishali Hajipur Sadar Hospital n/a n/a n/a n/a 0.50
Aurangabad Aurangabad Sadar Hospital n/a n/a n/a n/a 0.50
Khagaria Khagaria Sadar Hospital n/a n/a n/a n/a 0.00
Sitamarhi Sitamarhi Sadar Hospital n/a n/a n/a n/a 0.50
Madhubani Madhubani Sadar Hospital n/a n/a n/a n/a 0.00
Shivhar Shivhar Sadar Hospital n/a n/a n/a n/a 0.00
Nalanda Bihar Sharif Sadar Hospital n/a n/a n/a n/a 0.25
Luckeesarai Luckeesarai Sadar Hospital n/a n/a n/a n/a 1.00
Nawada Nawada Sadar Hospital n/a n/a n/a n/a 0.25
Madhepura Madhepura Sadar Hospital n/a n/a n/a n/a 0.58
*Result based on less than 75% of required sample size of N=400 for ANC sites.

2006Annual Sentinel Surveillance Country Report 54
Bihar
2006 Summary-Populations with high-risk behaviours
Number tested
% positive(95% CI) Total number of sentinel sites: 38
1 sites had prevalence ≥5%
0 site had prevalence ≥10%
All STI patients 5635 1.05 (0.78, 1.31)
Female sex workers 2145 1.68 (1.13, 2.22)
Injecting drug users 500 0.20 (0.00, 0.60)
Men who have sex with men 337 0.30 (0.00, 0.88)
District Site name % positive
Pop. group 2002 2003 2004 2005 2006
Bhojpur Ara Sadar Hospital STD 0.00 0.00 0.00 0.40 0.50
Bhagalpur Bhagalpur Jawahar Lal Nehru Medical College Hospital
STD 0.00 0.40 0.40 0.00 0.00
Darbhanga Laheriasarai Darbhanga Medical College Hospital
STD 1.20 0.40 2.00 0.40 0.00
Banka Banka Sadar Hospital STD n/a n/a n/a n/a 0.40
Jamui Jamui Sadar Hospital STD n/a n/a n/a n/a 2.00
Madhubani Madhubani Sadar Hospital STD n/a n/a n/a n/a 0.00
Sitamarhi Sitamarhi Sadar Hospital STD n/a n/a n/a n/a 2.01
Siwan Siwan Sadar Hospital STD n/a n/a n/a n/a 4.76
Purnia Purnia Sadar Hospital STD n/a n/a n/a n/a 0.4
Kaimur (Bhabhua) Bhabhua Sadar Hospital STD n/a n/a n/a n/a 0.00
West Champaran Bettiah MJK Hospital STD n/a n/a n/a n/a 1.20
Supaul Supaul Sadar Hospital STD n/a n/a n/a n/a 0.40
Gopalganj Gopalganj Sadar Hospital STD n/a n/a n/a n/a 1.60
Jahanabad Jahanabad Sadar Hospital STD n/a n/a n/a n/a 1.20
Buxar Buxar Sadar Hospital STD n/a n/a n/a n/a 0.40
Nalanda Bihar Sharif Sadar Hospital STD n/a n/a n/a n/a 1.33*
Khagaria Khagaria Sadar Hospital STD n/a n/a n/a n/a 0.00
Gaya Gaya Anurag Narain Magadh Medical College Hospital
STD 2.00 0.40 2.80 0.00 0.40
Katihar Katihar Sadar Hospital STD 7.60 9.20 2.40 0.00 2.50
Muzaffarpur Muzaffarpur Sri Krishna Medical College Hospital
STD 0.8 0.00 0.4 0.00 0.4
Patna Patna Medical College Hospital STD 2.80 1.60 0.40 0.80 3.20
East Champaran Raxaul Duncan Hospital STD 2.80 7.20 2.13 3.07* 1.60
Kishanganj Sadar Hospital, Kishanganj STD n/a n/a n/a 0.00* 0.00

2006Annual Sentinel Surveillance Country Report 55
Saran Chhapra Sadar Hospital STD n/a n/a n/a n/a 0.00*
Patna Patna IDU n/a n/a n/a n/a 0.00
Kaimur Bhabhua IDU n/a n/a n/a n/a 0.40
Patna Patna MSM n/a 1.60 1.60 0.40 0.40
Saran Chhapra MSM n/a n/a n/a n/a 0.00*
Munger Munger Sharwan Bazar FSW n/a n/a 0.40 0.40 0.40
Muzaffarpur Muzaffarpur Chaturbhaj Asthan/Muzaffarpur Shri Krishna Medical College Hospital
FSW n/a 4.80 0.00 0.80 0.00
West Champaran Bettiah Naznin Chowk FSW n/a n/a n/a 0.00 1.00
Purnia Gulab Bagh, Purnia FSW n/a n/a n/a 27.27* 15.56*
Katihar Katihar Cooley, Para FSW n/a n/a n/a n/a 5.20
Gaya Gaya Chowk Bazar FSW n/a n/a n/a n/a 0.00*
Araria Forbesganj FSW n/a n/a n/a n/a 0.80
Begusarai Begusarai FSW n/a n/a n/a n/a 0.00
Madhubani Madhubani FSW n/a n/a n/a n/a 0.40
Rohtas Sasaram Beda FSW n/a n/a n/a n/a 1.20
*Result based on less than 75% of required sample size of N=250 for high-risk group sites.
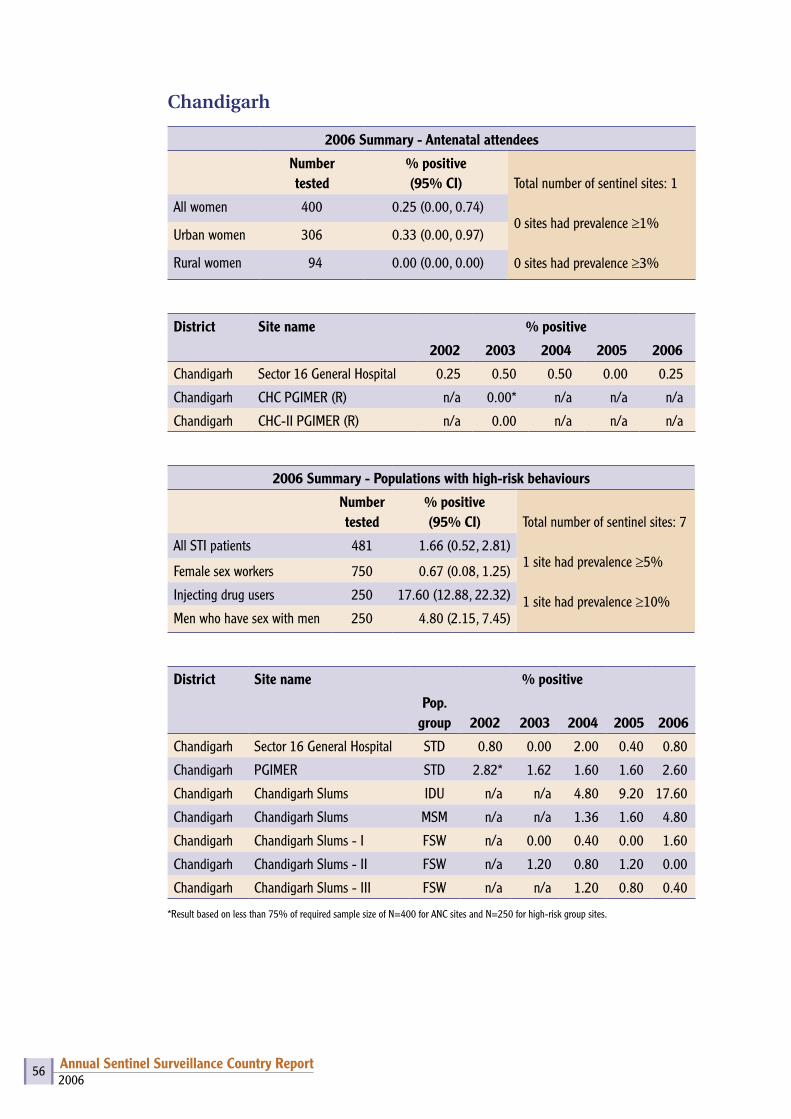
2006Annual Sentinel Surveillance Country Report 56
Chandigarh
2006 Summary - Antenatal attendees
Number tested
% positive (95% CI) Total number of sentinel sites: 1
0 sites had prevalence ≥1%
0 sites had prevalence ≥3%
All women 400 0.25 (0.00, 0.74)
Urban women 306 0.33 (0.00, 0.97)
Rural women 94 0.00 (0.00, 0.00)
District Site name % positive
2002 2003 2004 2005 2006
Chandigarh Sector 16 General Hospital 0.25 0.50 0.50 0.00 0.25
Chandigarh CHC PGIMER (R) n/a 0.00* n/a n/a n/a
Chandigarh CHC-II PGIMER (R) n/a 0.00 n/a n/a n/a
2006 Summary - Populations with high-risk behaviours
Number tested
% positive(95% CI) Total number of sentinel sites: 7
1 site had prevalence ≥5%
1 site had prevalence ≥10%
All STI patients 481 1.66 (0.52, 2.81)
Female sex workers 750 0.67 (0.08, 1.25)
Injecting drug users 250 17.60 (12.88, 22.32)
Men who have sex with men 250 4.80 (2.15, 7.45)
District Site name % positive
Pop. group 2002 2003 2004 2005 2006
Chandigarh Sector 16 General Hospital STD 0.80 0.00 2.00 0.40 0.80
Chandigarh PGIMER STD 2.82* 1.62 1.60 1.60 2.60
Chandigarh Chandigarh Slums IDU n/a n/a 4.80 9.20 17.60
Chandigarh Chandigarh Slums MSM n/a n/a 1.36 1.60 4.80
Chandigarh Chandigarh Slums - I FSW n/a 0.00 0.40 0.00 1.60
Chandigarh Chandigarh Slums - II FSW n/a 1.20 0.80 1.20 0.00
Chandigarh Chandigarh Slums - III FSW n/a n/a 1.20 0.80 0.40
*Result based on less than 75% of required sample size of N=400 for ANC sites and N=250 for high-risk group sites.
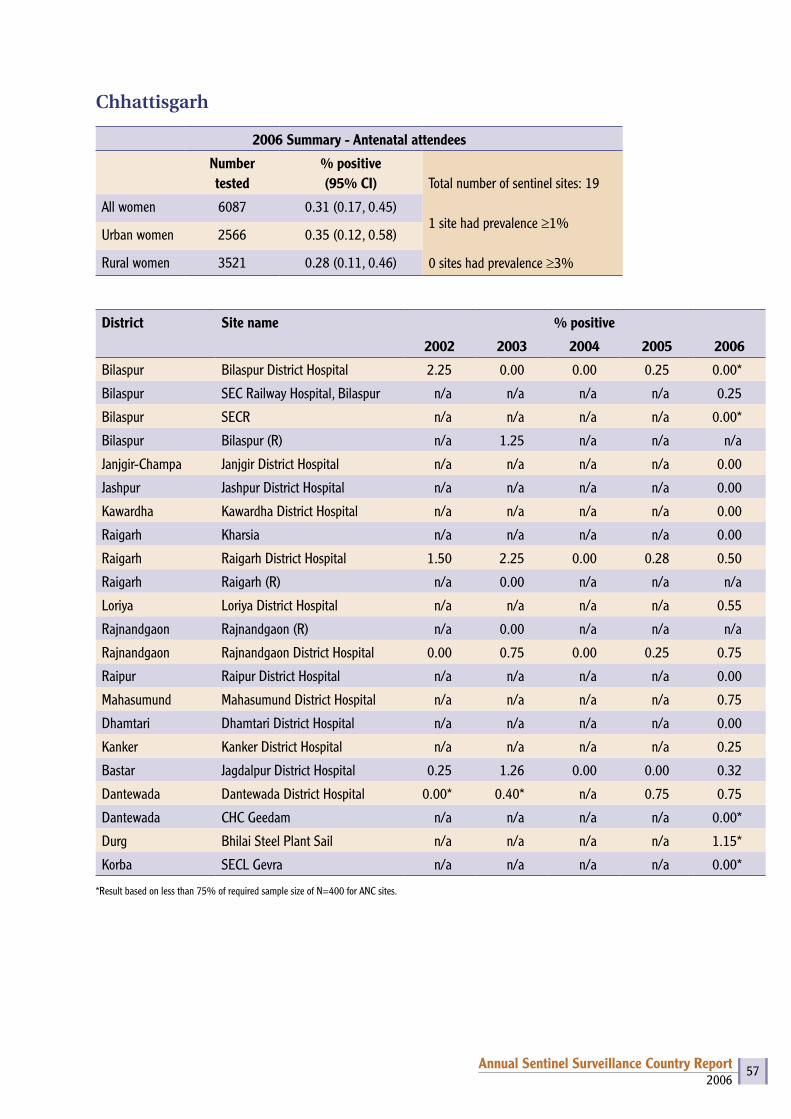
2006Annual Sentinel Surveillance Country Report 57
Chhattisgarh
2006 Summary - Antenatal attendees
Number tested
% positive (95% CI) Total number of sentinel sites: 19
1 site had prevalence ≥1%
0 sites had prevalence ≥3%
All women 6087 0.31 (0.17, 0.45)
Urban women 2566 0.35 (0.12, 0.58)
Rural women 3521 0.28 (0.11, 0.46)
District Site name % positive
2002 2003 2004 2005 2006
Bilaspur Bilaspur District Hospital 2.25 0.00 0.00 0.25 0.00*
Bilaspur SEC Railway Hospital, Bilaspur n/a n/a n/a n/a 0.25
Bilaspur SECR n/a n/a n/a n/a 0.00*
Bilaspur Bilaspur (R) n/a 1.25 n/a n/a n/a
Janjgir-Champa Janjgir District Hospital n/a n/a n/a n/a 0.00
Jashpur Jashpur District Hospital n/a n/a n/a n/a 0.00
Kawardha Kawardha District Hospital n/a n/a n/a n/a 0.00
Raigarh Kharsia n/a n/a n/a n/a 0.00
Raigarh Raigarh District Hospital 1.50 2.25 0.00 0.28 0.50
Raigarh Raigarh (R) n/a 0.00 n/a n/a n/a
Loriya Loriya District Hospital n/a n/a n/a n/a 0.55
Rajnandgaon Rajnandgaon (R) n/a 0.00 n/a n/a n/a
Rajnandgaon Rajnandgaon District Hospital 0.00 0.75 0.00 0.25 0.75
Raipur Raipur District Hospital n/a n/a n/a n/a 0.00
Mahasumund Mahasumund District Hospital n/a n/a n/a n/a 0.75
Dhamtari Dhamtari District Hospital n/a n/a n/a n/a 0.00
Kanker Kanker District Hospital n/a n/a n/a n/a 0.25
Bastar Jagdalpur District Hospital 0.25 1.26 0.00 0.00 0.32
Dantewada Dantewada District Hospital 0.00* 0.40* n/a 0.75 0.75
Dantewada CHC Geedam n/a n/a n/a n/a 0.00*
Durg Bhilai Steel Plant Sail n/a n/a n/a n/a 1.15*
Korba SECL Gevra n/a n/a n/a n/a 0.00*
*Result based on less than 75% of required sample size of N=400 for ANC sites.
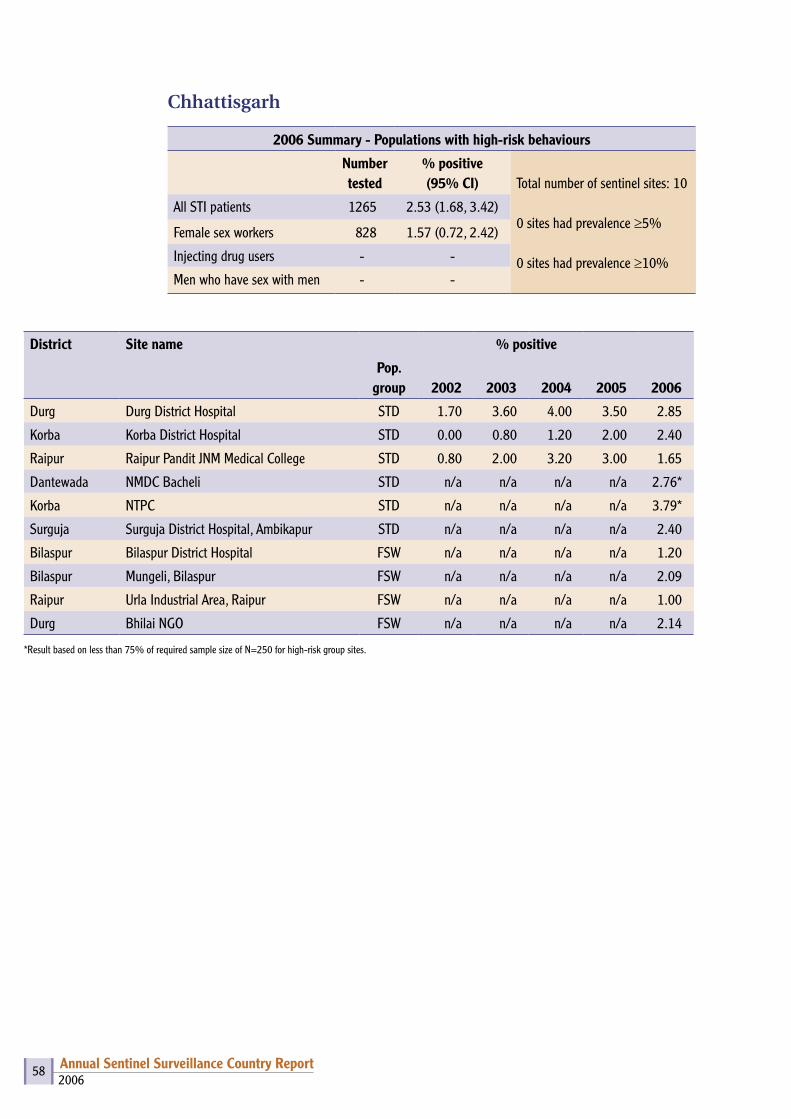
2006Annual Sentinel Surveillance Country Report 58
Chhattisgarh
2006 Summary - Populations with high-risk behaviours
Number tested
% positive(95% CI) Total number of sentinel sites: 10
0 sites had prevalence ≥5%
0 sites had prevalence ≥10%
All STI patients 1265 2.53 (1.68, 3.42)
Female sex workers 828 1.57 (0.72, 2.42)
Injecting drug users - -
Men who have sex with men - -
District Site name % positive
Pop. group 2002 2003 2004 2005 2006
Durg Durg District Hospital STD 1.70 3.60 4.00 3.50 2.85
Korba Korba District Hospital STD 0.00 0.80 1.20 2.00 2.40
Raipur Raipur Pandit JNM Medical College STD 0.80 2.00 3.20 3.00 1.65
Dantewada NMDC Bacheli STD n/a n/a n/a n/a 2.76*
Korba NTPC STD n/a n/a n/a n/a 3.79*
Surguja Surguja District Hospital, Ambikapur STD n/a n/a n/a n/a 2.40
Bilaspur Bilaspur District Hospital FSW n/a n/a n/a n/a 1.20
Bilaspur Mungeli, Bilaspur FSW n/a n/a n/a n/a 2.09
Raipur Urla Industrial Area, Raipur FSW n/a n/a n/a n/a 1.00
Durg Bhilai NGO FSW n/a n/a n/a n/a 2.14
*Result based on less than 75% of required sample size of N=250 for high-risk group sites.

2006Annual Sentinel Surveillance Country Report 59
Dadra & Nagar Haveli
2006 Summary - Antenatal attendees
Number tested
% positive (95% CI) Total number of sentinel sites: 1
0 sites had prevalence ≥1%
0 sites had prevalence≥3%
All women 400 0.00 (0.00, 0.00)
Urban women 165 0.00 (0.00, 0.00)
Rural women 235 0.00 (0.00, 0.00)
District Site name % positive
2002 2003 2004 2005 2006
Dadra & Nagar Haveli Silvassa Civil Hospital/ VB Civil Hospital
0.00 0.25 0.00 0.25 0.00
Dadra & Nagar Haveli Khanvel (R) n/a 0.00 n/a n/a n/a
Dadra & Nagar Haveli
2006 Summary - Populations with high-risk behaviours
Number tested
% positive(95% CI) Total number of sentinel sites: 0
0 sites had prevalence ≥5%
0 sites had prevalence ≥10%
All STI patients - -
Female sex workers - -
Injecting drug users - -
Men who have sex with men - -
District Site name % positive
Pop. group 2002 2003 2004 2005 2006
Dadra & Nagar Haveli
Areas of TI on Migrant
MRG n/a n/a n/a 0.00 n/a
Note – Result based on less than 75% of required sample size of N=400 for ANC sites and N=250 for high-risk group sites.

2006Annual Sentinel Surveillance Country Report 60
Daman & Diu
2006 Summary - Antenatal attendees
Number tested
% positive (95% CI) Total number of sentinel sites: 2
0 sites had prevalence ≥1%
0 sites had prevalence ≥3%
All women 800 0.00 (0.00, 0.00)
Urban women 192 0.00 (0.00, 0.00)
Rural women 608 0.00 (0.00, 0.00)
District Site name % positive
2002 2003 2004 2005 2006
Daman Daman Civil Hospital 0.25 0.25 0.50 0.25 0.00
Diu Diu Civil Hospital 0.25 0.46* 0.25 0.00 0.00
Daman Kachigam (R) n/a 0.41* n/a n/a n/a
Diu Vanakbar (R) n/a 0.00* n/a n/a n/a
*Result based on less than 75% of required sample size of N=400 for ANC sites.
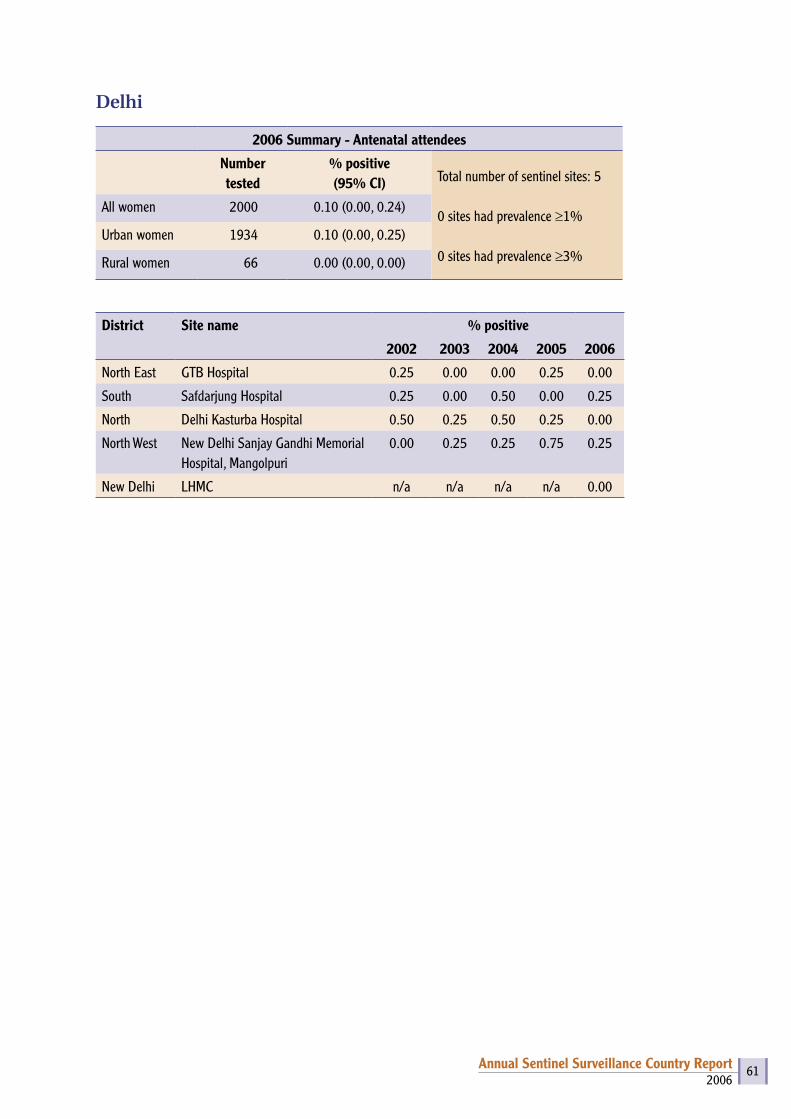
2006Annual Sentinel Surveillance Country Report 61
Delhi
2006 Summary - Antenatal attendees
Number tested
% positive (95% CI) Total number of sentinel sites: 5
0 sites had prevalence ≥1%
0 sites had prevalence ≥3%
All women 2000 0.10 (0.00, 0.24)
Urban women 1934 0.10 (0.00, 0.25)
Rural women 66 0.00 (0.00, 0.00)
District Site name % positive
2002 2003 2004 2005 2006
North East GTB Hospital 0.25 0.00 0.00 0.25 0.00
South Safdarjung Hospital 0.25 0.00 0.50 0.00 0.25
North Delhi Kasturba Hospital 0.50 0.25 0.50 0.25 0.00
North West New Delhi Sanjay Gandhi Memorial Hospital, Mangolpuri
0.00 0.25 0.25 0.75 0.25
New Delhi LHMC n/a n/a n/a n/a 0.00

2006Annual Sentinel Surveillance Country Report 62
Delhi
2006 Summary - Populations with high-risk behaviours
Number tested
% positive(95% CI) Total number of sentinel sites: 16
6 sites had prevalence ≥5%
3 sites had prevalence ≥10%
All STI patients 1250 4.08 (2.98, 5.18)
Female sex workers 1250 2.80 (1.89, 3.71)
Injecting drug users 500 10.00 (7.37, 12.63)
Men who have sex with men 750 12.27 (9.92, 14.61)
District Site name % positive
Pop. group 2002 2003 2004 2005 2006
South Safdarjung Hospital STD 0.80 2.40 4.80 3.20 2.00
North East GTB Hospital STD 2.87* 5.85* 7.50 10.00 6.40
Central LNJP Hospital STD 3.60 7.20 9.20 9.20 8.80
East ESI Hospital STD 7.30* 7.77 8.46 9.09* 2.00
West DDU STD n/a n/a n/a n/a 1.20
North Sharan IDU n/a n/a 17.60 22.80 18.80
South West SPYM IDU n/a n/a n/a n/a 1.20
South West New Delhi DDU Hospital IDU 7.23 14.40 n/a n/a n/a
North East Sahara MSM n/a 27.42* 6.67* 39.60 32.80
North West Aradhya MSM n/a n/a n/a n/a 2.00
West Akansha Samiti MSM n/a n/a n/a 1.20 2.00
North Shakti Vahini FSW n/a n/a 8.00 8.43* 14.00*
West MRYDO FSW n/a 1.61 1.20 1.20 0.80
North East Jagriti Yuva Manch FSW n/a n/a n/a 1.60 1.60
South West ALAMB FSW n/a n/a n/a n/a 0.40
North West GDS Society FSW n/a n/a n/a n/a 1.20
North IMDT FSW n/a n/a n/a n/a 7.33*
*Result based on less than 75% of required sample size of N=400 for ANC sites and N=250 for high-risk group sites.

2006Annual Sentinel Surveillance Country Report 63
Goa
2006 Summary - Antenatal attendees
Number tested
% positive (95% CI) Total number of sentinel sites: 2
0 sites had prevalence ≥1%
0 sites had prevalence ≥3%
All women 800 0.50 (0.01, 0.99)
Urban women 378 0.26 (0.00, 0.78)
Rural women 422 0.71 (0.00, 1.51)
District Site name % positive
2002 2003 2004 2005 2006
North Goa Mapusa Asilo Hospital 1.25 0.25 1.00 0.00 0.75
North Goa Ponda Community Health Centre 1.50 0.75 1.25 0.00 0.25
Churchore (R) n/a 1.12* n/a n/a n/a
North Goa Valpoi/P (R) n/a 0.00 n/a n/a n/a
Goa
2006 Summary - Populations with high-risk behaviours
Number tested
% positive(95% CI) Total number of sentinel sites: 3
2 sites had prevalence ≥5%
0 sites had prevalence ≥10%
All STI patients 442 8.60 (5.98, 11.21)
Female sex workers - -
Injecting drug users - -
Men who have sex with men 250 4.80 (2.15, 7.45)
District Site name % positive
Pop. group 2002 2003 2004 2005 2006
South Goa Margao Hospicio Hospital STD 11.36* 14.29 19.51* 11.05 8.40
North Goa Bambolim Goa Medical College STD n/a n/a 12.04* 16.45 8.85
North Goa Hospicio Hospital, Panaji STD 15.15* 15.18* n/a n/a n/a
South Goa Vasco The Humsafar Trust MSM n/a n/a 1.68* 4.90 4.80
South Goa Margao MSM n/a 9.09* n/a n/a n/a
South Goa Vasco D’Gama, Baina FSW n/a 30.15* n/a n/a n/a
*Result based on less than 75% of required sample size of N=400 for ANC sites and N=250 for high-risk group sites.
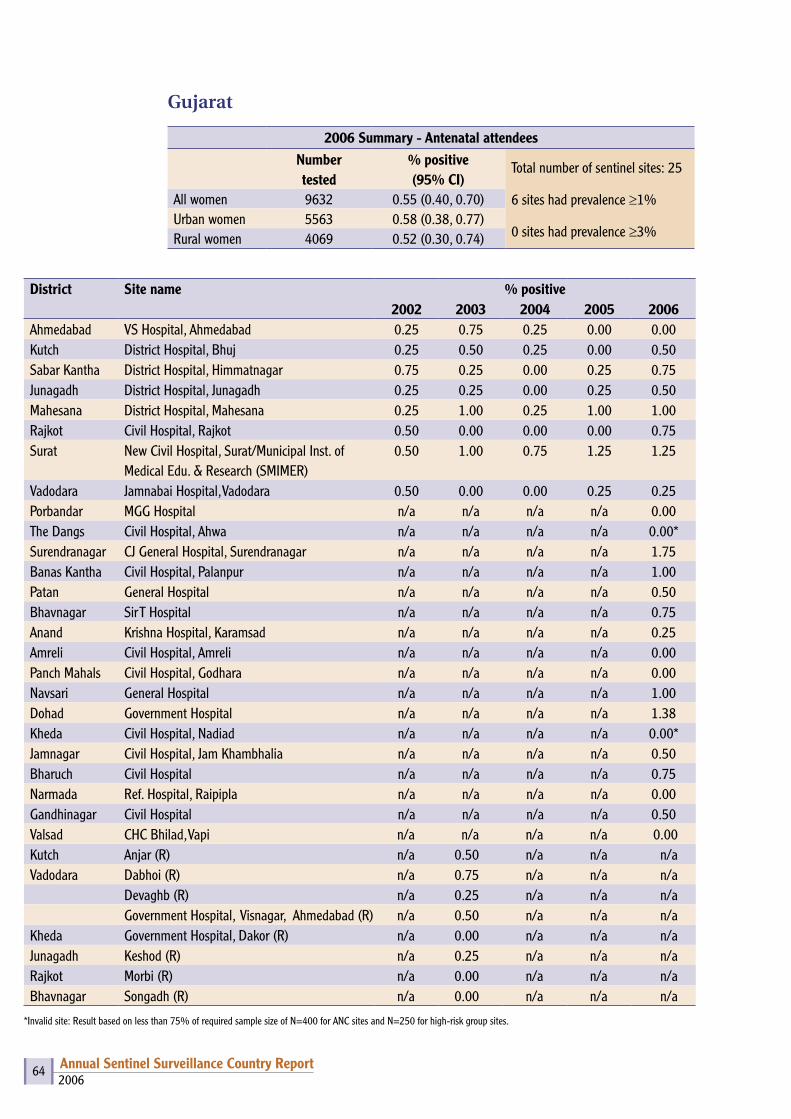
2006Annual Sentinel Surveillance Country Report 64
Gujarat
2006 Summary - Antenatal attendeesNumber tested
% positive (95% CI)
Total number of sentinel sites: 25
6 sites had prevalence ≥1%
0 sites had prevalence ≥3%
All women 9632 0.55 (0.40, 0.70)Urban women 5563 0.58 (0.38, 0.77)Rural women 4069 0.52 (0.30, 0.74)
District Site name % positive2002 2003 2004 2005 2006
Ahmedabad VS Hospital, Ahmedabad 0.25 0.75 0.25 0.00 0.00Kutch District Hospital, Bhuj 0.25 0.50 0.25 0.00 0.50Sabar Kantha District Hospital, Himmatnagar 0.75 0.25 0.00 0.25 0.75Junagadh District Hospital, Junagadh 0.25 0.25 0.00 0.25 0.50Mahesana District Hospital, Mahesana 0.25 1.00 0.25 1.00 1.00Rajkot Civil Hospital, Rajkot 0.50 0.00 0.00 0.00 0.75Surat New Civil Hospital, Surat/Municipal Inst. of
Medical Edu. & Research (SMIMER)0.50 1.00 0.75 1.25 1.25
Vadodara Jamnabai Hospital, Vadodara 0.50 0.00 0.00 0.25 0.25Porbandar MGG Hospital n/a n/a n/a n/a 0.00The Dangs Civil Hospital, Ahwa n/a n/a n/a n/a 0.00*Surendranagar CJ General Hospital, Surendranagar n/a n/a n/a n/a 1.75Banas Kantha Civil Hospital, Palanpur n/a n/a n/a n/a 1.00Patan General Hospital n/a n/a n/a n/a 0.50Bhavnagar Sir T Hospital n/a n/a n/a n/a 0.75Anand Krishna Hospital, Karamsad n/a n/a n/a n/a 0.25Amreli Civil Hospital, Amreli n/a n/a n/a n/a 0.00Panch Mahals Civil Hospital, Godhara n/a n/a n/a n/a 0.00Navsari General Hospital n/a n/a n/a n/a 1.00Dohad Government Hospital n/a n/a n/a n/a 1.38Kheda Civil Hospital, Nadiad n/a n/a n/a n/a 0.00*Jamnagar Civil Hospital, Jam Khambhalia n/a n/a n/a n/a 0.50Bharuch Civil Hospital n/a n/a n/a n/a 0.75Narmada Ref. Hospital, Raipipla n/a n/a n/a n/a 0.00Gandhinagar Civil Hospital n/a n/a n/a n/a 0.50Valsad CHC Bhilad, Vapi n/a n/a n/a n/a 0.00Kutch Anjar (R) n/a 0.50 n/a n/a n/aVadodara Dabhoi (R) n/a 0.75 n/a n/a n/a
Devaghb (R) n/a 0.25 n/a n/a n/aGovernment Hospital, Visnagar, Ahmedabad (R) n/a 0.50 n/a n/a n/a
Kheda Government Hospital, Dakor (R) n/a 0.00 n/a n/a n/aJunagadh Keshod (R) n/a 0.25 n/a n/a n/aRajkot Morbi (R) n/a 0.00 n/a n/a n/aBhavnagar Songadh (R) n/a 0.00 n/a n/a n/a
*Invalid site: Result based on less than 75% of required sample size of N=400 for ANC sites and N=250 for high-risk group sites.
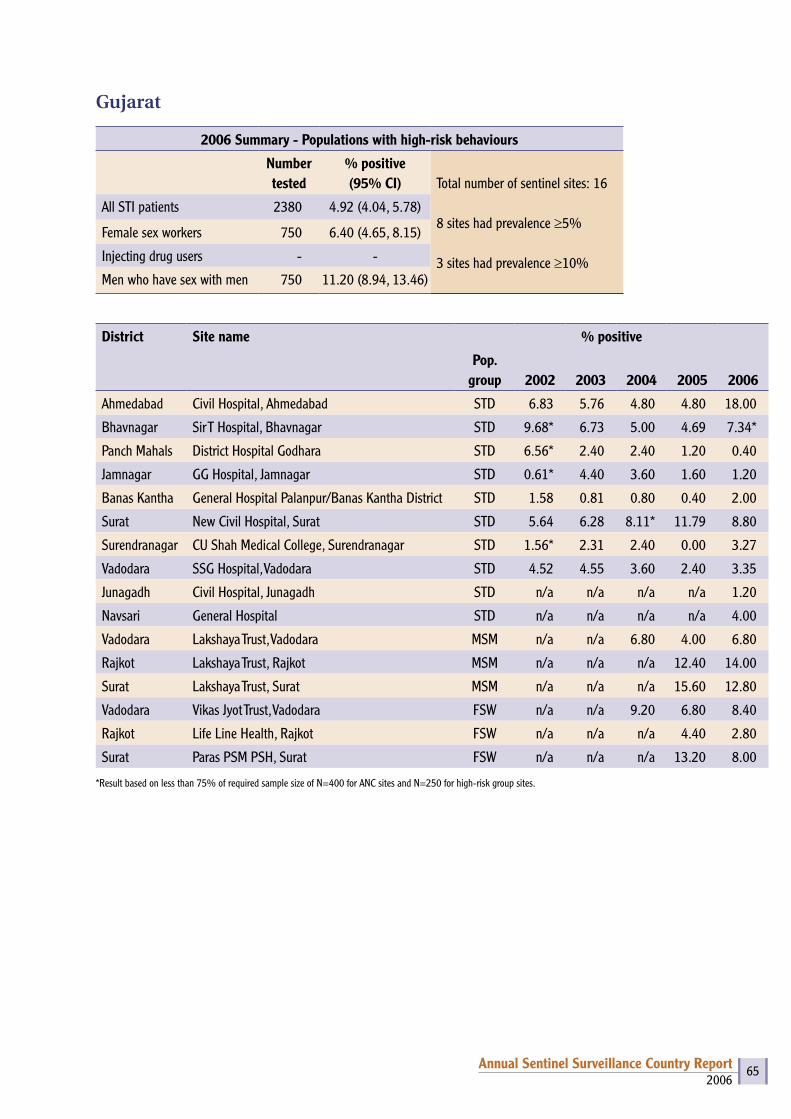
2006Annual Sentinel Surveillance Country Report 65
Gujarat
2006 Summary - Populations with high-risk behaviours
Number tested
% positive(95% CI) Total number of sentinel sites: 16
8 sites had prevalence ≥5%
3 sites had prevalence ≥10%
All STI patients 2380 4.92 (4.04, 5.78)
Female sex workers 750 6.40 (4.65, 8.15)
Injecting drug users - -
Men who have sex with men 750 11.20 (8.94, 13.46)
District Site name % positive
Pop. group 2002 2003 2004 2005 2006
Ahmedabad Civil Hospital, Ahmedabad STD 6.83 5.76 4.80 4.80 18.00
Bhavnagar Sir T Hospital, Bhavnagar STD 9.68* 6.73 5.00 4.69 7.34*
Panch Mahals District Hospital Godhara STD 6.56* 2.40 2.40 1.20 0.40
Jamnagar GG Hospital, Jamnagar STD 0.61* 4.40 3.60 1.60 1.20
Banas Kantha General Hospital Palanpur/Banas Kantha District STD 1.58 0.81 0.80 0.40 2.00
Surat New Civil Hospital, Surat STD 5.64 6.28 8.11* 11.79 8.80
Surendranagar CU Shah Medical College, Surendranagar STD 1.56* 2.31 2.40 0.00 3.27
Vadodara SSG Hospital, Vadodara STD 4.52 4.55 3.60 2.40 3.35
Junagadh Civil Hospital, Junagadh STD n/a n/a n/a n/a 1.20
Navsari General Hospital STD n/a n/a n/a n/a 4.00
Vadodara Lakshaya Trust, Vadodara MSM n/a n/a 6.80 4.00 6.80
Rajkot Lakshaya Trust, Rajkot MSM n/a n/a n/a 12.40 14.00
Surat Lakshaya Trust, Surat MSM n/a n/a n/a 15.60 12.80
Vadodara Vikas Jyot Trust, Vadodara FSW n/a n/a 9.20 6.80 8.40
Rajkot Life Line Health, Rajkot FSW n/a n/a n/a 4.40 2.80
Surat Paras PSM PSH, Surat FSW n/a n/a n/a 13.20 8.00
*Result based on less than 75% of required sample size of N=400 for ANC sites and N=250 for high-risk group sites.

2006Annual Sentinel Surveillance Country Report 66
Haryana
2006 Summary - Antenatal attendees
Number tested
% positive (95% CI)
Total number of sentinel sites: 12
1 site had prevalence ≥1%
0 sites had prevalence ≥3%
All women 4586 0.17 (0.05, 0.30)
Urban women 1775 0.00 (0.00, 0.00)
Rural women 2811 0.28 (0.09, 0.48)
District Site name % positive
2002 2003 2004 2005 2006
Faridabad Palwal General Hospital 0.75 0.50 0.00 0.00 0.00
Hisar Hisar General Hospital 0.00 0.26 0.00 0.00 0.25
Hisar CHC, Mangali (R) n/a 0.00* n/a n/a n/a
Jind Jind General Hospital 1.50 0.25 0.00 0.50 0.25
Jind CHC, Julana (R) n/a 0.67* n/a n/a n/a
Karnal Karnal General Hospital 0.00 0.50 0.00 0.25 0.00
Karnal CHC, Nilokheri (R) n/a 0.41* n/a n/a n/a
Panipat General Hospital, Panipat n/a n/a n/a n/a 0.00
Gurgaon CHC Nuh, Mewat n/a n/a n/a n/a 0.31
Fatehabad General Hospital, Fatehabad n/a n/a n/a n/a 0.25
Kaithal General Hospital, Kaithal n/a n/a n/a n/a 0.00
Jhajjar General Hospital, Jhajjar n/a n/a n/a n/a 0.26
Kurukshetra LNJP Hospital n/a n/a n/a n/a 0.00
Bhiwani CHC Tosham (R) n/a n/a n/a n/a 1.10*
Panchkula CHC Raipurani (R) n/a n/a n/a n/a 0.00
*Result based on less than 75% of required sample size of N=400 for ANC sites and N=250 for high-risk group sites.

2006Annual Sentinel Surveillance Country Report 67
Haryana
2006 Summary - Populations with high-risk behaviours
Number tested
% positive(95% CI) Total number of sentinel sites: 18
0 sites had prevalence ≥5%
0 sites had prevalence ≥10%
All STI patients 2148 1.21 (0.75, 1.67)
Female sex workers 1679 1.19 (0.67, 1.71)
Injecting drug users 273 0.00 (0.00, 0.00)
Men who have sex with men 175 0.00 (0.00, 0.00)
District Site name % positive
Pop. group
2002 2003 2004 2005 2006
Ambala Ambala General Hospital STD 2.56* 0.00 0.00 0.99 0.00
Bhiwani Bhiwani General Hospital STD 2.31* 2.37 2.08 1.60 3.21
Gurgaon Gurgaon General Hospital STD 0.40 0.40 4.88 1.71 0.41
Rohtak Rohtak Medical College Hospital STD 1.48 2.06 0.00* 1.30 3.01*
Sirsa Sirsa General Hospital STD 0.80 1.20 0.93 0.83 0.40
Sonipat Sonipat General Hospital STD n/a n/a n/a n/a 2.00
Yamunanagar Yamunanagar General Hospital STD n/a n/a n/a n/a 0.81
Panchkula General Hospital, Panchkula STD n/a n/a n/a n/a 1.20
Faridabad BK Hospital STD n/a n/a n/a n/a 0.41
Faridabad Faridabad (NGO) IDU n/a n/a n/a n/a 0.00
Panchkula Panchkula (NGO) MSM n/a n/a n/a n/a 0.00*
Yamunanagar FSW Site Yamunanagar FSW n/a n/a n/a 2.00 0.00
Jind Jind (NGO) FSW n/a n/a n/a n/a 0.40
Gurgaon Gurgaon (NGO) FSW n/a n/a n/a n/a 0.37
Rohtak Rohtak (NGO) FSW n/a n/a n/a n/a 4.76
Hisar Hisar (NGO) FSW n/a n/a n/a n/a 1.98
Rewari Rewari (NGO) FSW n/a n/a n/a n/a 0.41
Ambala Ambala (NGO) FSW n/a n/a n/a n/a 0.00*
*Result based on less than 75% of required sample size of N=400 for ANC sites and N=250 for high-risk group sites.

2006Annual Sentinel Surveillance Country Report 68
Himachal Pradesh
2006 Summary - Antenatal attendees
Number tested
% positive (95% CI)
Total number of sentinel sites: 10
0 sites had prevalence ≥1%
0 sites had prevalence ≥3%
All women 3527 0.06 (0.00, 0.14)
Urban women 364 0.00 (0.00, 0.00)
Rural women 3163 0.06 (0.00, 0.15)
District Site name % positive
2002 2003 2004 2005 2006
Hamirpur Hamirpur Zonal Hospital 0.75 1.00 0.50 0.75 0.00
Kangra Dharmshala Zonal Hospital 0.00 0.77 0.00 0.25 0.25
Kangra Palampur/Jawalamukhi (R) n/a 0.25 n/a n/a n/a
Kinnaur Kinnaur Zonal Hospital 0.00 0.00 0.00 0.00 0.00
Kinnaur Pooh (R) n/a 0.00* n/a n/a n/a
Mandi Mandi Zonal Hospital 0.00 0.00 0.25 0.00 0.00
Mandi Karsog/Jnagar (R) n/a 0.26 n/a n/a n/a
Solan Solan Zonal Hospital 0.00 0.00 0.00 0.00 0.25
Solan Arki/Nalagarh (R) n/a 0.50 n/a n/a n/a
Una Una Zonal Hospital 0.00 0.00 0.75 0.25 0.00
Una Haroli/Daulatpur Chowk (R) n/a 0.25 n/a n/a n/a
Lahaul & Spiti Kelong Zonal Hospital 0.00* 0.00* n/a n/a 0.00*
Lahaul & Spiti Udaipur Kaza (R) n/a 0.00* n/a n/a 0.00*
Hamirpur CHC Barsar (R) n/a 0.00 n/a n/a 0.00
Shimla Rampur (R) n/a n/a n/a n/a 0.00
*Result based on less than 75% of required sample size of N=400 for ANC sites and N=250 for high-risk group sites.

2006Annual Sentinel Surveillance Country Report 69
Himachal Pradesh
2006 Summary - Populations with high-risk behaviours
Number tested
% positive(95% CI) Total number of sentinel sites: 10
0 sites had prevalence ≥5%
0 sites had prevalence ≥10%
All STI patients 1303 0.84 (0.35, 1.34)
Female sex workers 757 0.66 (0.08, 1.24)
Injecting drug users - -
Men who have sex with men 225 0.44 (0.00, 1.31)
District Site name % positive
Pop. group 2002 2003 2004 2005 2006
Bilaspur Bilaspur Zonal Hospital STD 0.80 0.40 2.40 0.00 2.80
Chamba Chamba Zonal Hospital STD 0.00 0.00 0.00 0.40 0.40
Kullu Kullu Zonal Hospital STD 0.40 1.38 0.00 0.57* 0.00
Sirmaur Nahan Zonal Hospital STD 0.80 0.40 1.20 0.40 0.80
Shimla Shimla Zonal Hospital STD 0.00 0.83 0.00 0.00 0.00
Bilaspur ACC Hospital STD n/a n/a n/a n/a 1.89*
Kangra Friends Club, Damtal MSM n/a n/a n/a n/a 0.44
Shimla Shimla FSW n/a 0.00 0.80 0.00 1.20
Kullu (SAVE, Lyall Tribals, H&BC, Sudhar Sabha) FSW n/a n/a n/a n/a 0.00
Sirmaur Paonta (SERDHA, CARE, SWATI) FSW n/a n/a n/a n/a 0.80
*Result based on less than 75% of required sample size of N=400 for ANC sites and N=250 for high-risk group sites.
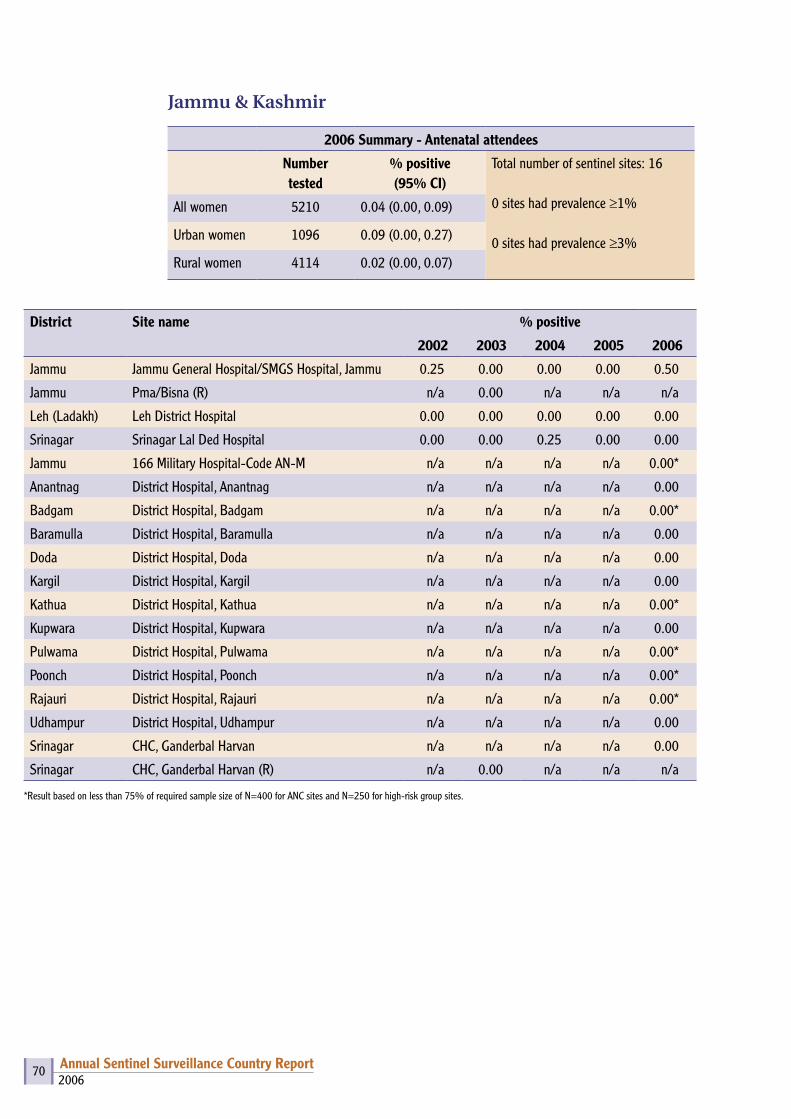
2006Annual Sentinel Surveillance Country Report 70
Jammu & Kashmir
2006 Summary - Antenatal attendees
Number tested
% positive (95% CI)
Total number of sentinel sites: 16
0 sites had prevalence ≥1%
0 sites had prevalence ≥3%
All women 5210 0.04 (0.00, 0.09)
Urban women 1096 0.09 (0.00, 0.27)
Rural women 4114 0.02 (0.00, 0.07)
District Site name % positive
2002 2003 2004 2005 2006
Jammu Jammu General Hospital/SMGS Hospital, Jammu 0.25 0.00 0.00 0.00 0.50
Jammu Pma/Bisna (R) n/a 0.00 n/a n/a n/a
Leh (Ladakh) Leh District Hospital 0.00 0.00 0.00 0.00 0.00
Srinagar Srinagar Lal Ded Hospital 0.00 0.00 0.25 0.00 0.00
Jammu 166 Military Hospital-Code AN-M n/a n/a n/a n/a 0.00*
Anantnag District Hospital, Anantnag n/a n/a n/a n/a 0.00
Badgam District Hospital, Badgam n/a n/a n/a n/a 0.00*
Baramulla District Hospital, Baramulla n/a n/a n/a n/a 0.00
Doda District Hospital, Doda n/a n/a n/a n/a 0.00
Kargil District Hospital, Kargil n/a n/a n/a n/a 0.00
Kathua District Hospital, Kathua n/a n/a n/a n/a 0.00*
Kupwara District Hospital, Kupwara n/a n/a n/a n/a 0.00
Pulwama District Hospital, Pulwama n/a n/a n/a n/a 0.00*
Poonch District Hospital, Poonch n/a n/a n/a n/a 0.00*
Rajauri District Hospital, Rajauri n/a n/a n/a n/a 0.00*
Udhampur District Hospital, Udhampur n/a n/a n/a n/a 0.00
Srinagar CHC, Ganderbal Harvan n/a n/a n/a n/a 0.00
Srinagar CHC, Ganderbal Harvan (R) n/a 0.00 n/a n/a n/a
*Result based on less than 75% of required sample size of N=400 for ANC sites and N=250 for high-risk group sites.
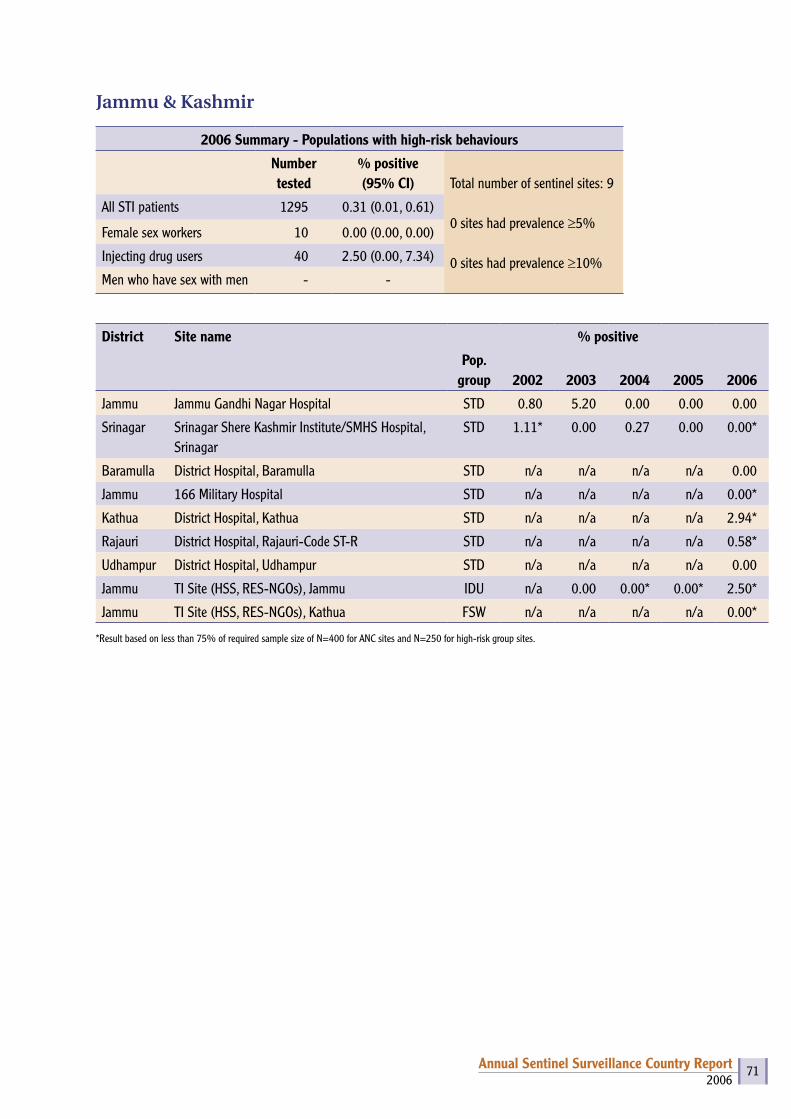
2006Annual Sentinel Surveillance Country Report 71
Jammu & Kashmir
2006 Summary - Populations with high-risk behaviours
Number tested
% positive(95% CI) Total number of sentinel sites: 9
0 sites had prevalence ≥5%
0 sites had prevalence ≥10%
All STI patients 1295 0.31 (0.01, 0.61)
Female sex workers 10 0.00 (0.00, 0.00)
Injecting drug users 40 2.50 (0.00, 7.34)
Men who have sex with men - -
District Site name % positive
Pop. group 2002 2003 2004 2005 2006
Jammu Jammu Gandhi Nagar Hospital STD 0.80 5.20 0.00 0.00 0.00
Srinagar Srinagar Shere Kashmir Institute/SMHS Hospital, Srinagar
STD 1.11* 0.00 0.27 0.00 0.00*
Baramulla District Hospital, Baramulla STD n/a n/a n/a n/a 0.00
Jammu 166 Military Hospital STD n/a n/a n/a n/a 0.00*
Kathua District Hospital, Kathua STD n/a n/a n/a n/a 2.94*
Rajauri District Hospital, Rajauri-Code ST-R STD n/a n/a n/a n/a 0.58*
Udhampur District Hospital, Udhampur STD n/a n/a n/a n/a 0.00
Jammu TI Site (HSS, RES-NGOs), Jammu IDU n/a 0.00 0.00* 0.00* 2.50*
Jammu TI Site (HSS, RES-NGOs), Kathua FSW n/a n/a n/a n/a 0.00*
*Result based on less than 75% of required sample size of N=400 for ANC sites and N=250 for high-risk group sites.
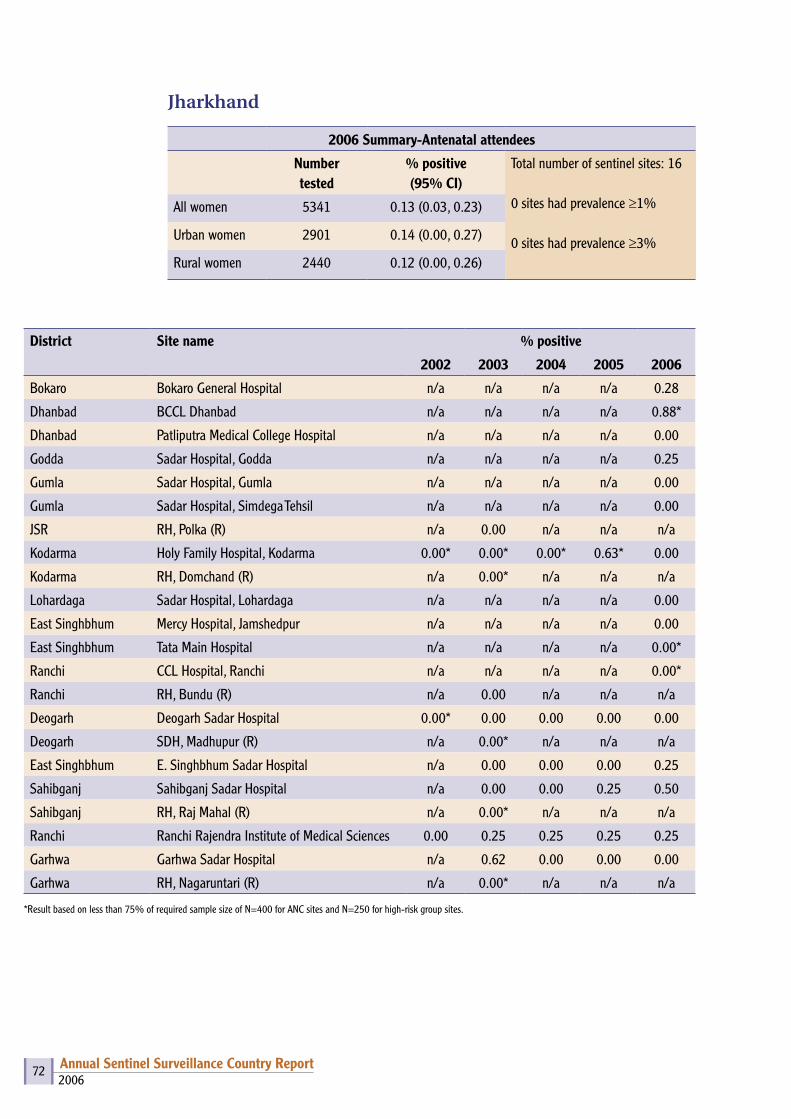
2006Annual Sentinel Surveillance Country Report 72
Jharkhand
2006 Summary-Antenatal attendees
Number tested
% positive (95% CI)
Total number of sentinel sites: 16
0 sites had prevalence ≥1%
0 sites had prevalence ≥3%
All women 5341 0.13 (0.03, 0.23)
Urban women 2901 0.14 (0.00, 0.27)
Rural women 2440 0.12 (0.00, 0.26)
District Site name % positive
2002 2003 2004 2005 2006
Bokaro Bokaro General Hospital n/a n/a n/a n/a 0.28
Dhanbad BCCL Dhanbad n/a n/a n/a n/a 0.88*
Dhanbad Patliputra Medical College Hospital n/a n/a n/a n/a 0.00
Godda Sadar Hospital, Godda n/a n/a n/a n/a 0.25
Gumla Sadar Hospital, Gumla n/a n/a n/a n/a 0.00
Gumla Sadar Hospital, Simdega Tehsil n/a n/a n/a n/a 0.00
JSR RH, Polka (R) n/a 0.00 n/a n/a n/a
Kodarma Holy Family Hospital, Kodarma 0.00* 0.00* 0.00* 0.63* 0.00
Kodarma RH, Domchand (R) n/a 0.00* n/a n/a n/a
Lohardaga Sadar Hospital, Lohardaga n/a n/a n/a n/a 0.00
East Singhbhum Mercy Hospital, Jamshedpur n/a n/a n/a n/a 0.00
East Singhbhum Tata Main Hospital n/a n/a n/a n/a 0.00*
Ranchi CCL Hospital, Ranchi n/a n/a n/a n/a 0.00*
Ranchi RH, Bundu (R) n/a 0.00 n/a n/a n/a
Deogarh Deogarh Sadar Hospital 0.00* 0.00 0.00 0.00 0.00
Deogarh SDH, Madhupur (R) n/a 0.00* n/a n/a n/a
East Singhbhum E. Singhbhum Sadar Hospital n/a 0.00 0.00 0.00 0.25
Sahibganj Sahibganj Sadar Hospital n/a 0.00 0.00 0.25 0.50
Sahibganj RH, Raj Mahal (R) n/a 0.00* n/a n/a n/a
Ranchi Ranchi Rajendra Institute of Medical Sciences 0.00 0.25 0.25 0.25 0.25
Garhwa Garhwa Sadar Hospital n/a 0.62 0.00 0.00 0.00
Garhwa RH, Nagaruntari (R) n/a 0.00* n/a n/a n/a
*Result based on less than 75% of required sample size of N=400 for ANC sites and N=250 for high-risk group sites.

2006Annual Sentinel Surveillance Country Report 73
Jharkhand
2006 Summary - Populations with high-risk behaviours
Number tested
% positive(95% CI) Total number of sentinel sites: 19
0 sites had prevalence ≥5%
0 sites had prevalence ≥10%
All STI patients 2372 0.63 (0.31, 0.95)
Female sex workers 1705 0.88 (0.44, 1.32)
Injecting drug users 250 0.40 (0.00, 1.18 )
Men who have sex with men - -
Site name % positive
Pop. group 2002 2003 2004 2005 2006
Bokaro General Hospital STD n/a n/a n/a n/a 0.80
Sadar Hospital, Deoghar STD n/a n/a n/a n/a 0.00
Sadar Hospital, Dumka STD n/a n/a n/a n/a 0.40
Sadar Hospital, Giridih STD n/a n/a n/a n/a 1.78*
Sadar Hospital, Chaibasa STD n/a n/a n/a n/a 3.13*
M.G. Memorial Medical College Hospital, Jamshedpur
STD n/a n/a n/a n/a 0.40
Sadar Hospital, Ranchi STD n/a n/a n/a n/a 0.00
Dhanbad Patliputra Medical College & Hospital STD 0.40 0.00 0.00 0.00 0.40
Palamu Sadar Hospital STD 0.00 0.00 0.00 0.00 0.00
Ranchi Rajendra Institute of Medical Sciences STD 0.00* 0.40 0.40 0.00 1.20
Hazaribagh Sadar Hospital STD n/a n/a n/a 0.00 1.00
Tata Steel Family Initiative Foundation IDU n/a n/a n/a n/a 0.40
Rupayani FSW n/a n/a n/a n/a 0.87
Helping Hand Foundation, Dhanbad FSW n/a n/a n/a n/a 0.40
Krishi Gram Vikas Kendra FSW n/a n/a n/a n/a 0.40
Birsa Seva Sansthan & KGVK Ranchi FSW n/a n/a 0.00 1.20 0.00
Gram Praudyogik Vikas Sansthan FSW n/a n/a n/a 1.20 2.00
TSFIF & Samarpan FSW n/a n/a n/a 0.00 1.20
Samarpan, Behragoda FSW n/a n/a n/a n/a 1.20
*Result based on less than 75% of required sample size of N=400 for ANC sites and N=250 for high-risk group sites.

2006Annual Sentinel Surveillance Country Report 74
Karnataka
2006 Summary - Antenatal attendees
Number tested
% positive (95% CI) Total number of sentinel sites: 54
32 sites had prevalence ≥1%
3 sites had prevalence ≥3%
All women 21628 1.12 (0.98, 1.26)
Urban women 7867 1.25 (1.00, 1.49)
Rural women 13761 1.05 (0.88, 1.22)
District Site name % positive
2002 2003 2004 2005 2006
Bagalkot Bagalkot District Hospital n/a 2.00 2.75 3.25 2.00
Bagalkot General Hospital, Jamkhandi (R) n/a 3.50 2.50 2.50 2.25
Bangalore Bangalore Vani Vilas Hospital 0.75 1.00 1.25 1.00 1.50
Bangalore General Hospital, KR Puram (R) n/a 1.50 0.00 0.00 1.25
Bangalore Rural General Hospital, Channapatna n/a 1.00 2.75 1.50 1.00
Bangalore Rural General Hospital, Kanakapura (R) n/a 2.75 2.25 0.25 0.00
Belgaum Belgaum District Hospital n/a 3.75 3.75 3.50 3.00
Belgaum General Hospital, Gokak (R) n/a 5.13 4.75 3.75 3.25
Bellary Bellary District Hospital 3.02 1.50 1.00 0.75 1.00
Bellary General Hospital, Hospet (R) n/a 1.75 1.25 1.00 1.75
Bidar Bidar District Hospital 0.25 1.25 0.75 0.50 1.00
Bidar General Hospital, Hummabad (R) n/a 1.54 1.00 1.25 0.75
Bijapur Bijapur District Hospital 5.25 2.50 2.00 4.25 1.75
Bijapur General Hospital, Indi (R) n/a 0.75 0.75 0.00 0.73
Chamrajnagar Chamrajnagar District Hospital 0.50 0.50 0.75 1.75 2.50
Chamrajnagar General Hospital, Kollegal (R) n/a 0.51 1.25 1.50 0.25
Chikmagalur Chikmagalur District Hospital n/a 0.25 0.50 1.25 2.25
Chikmagalur General Hospital, Mudigere (R) n/a 0.75 1.50 0.50 0.75
Chitradurga Chitradurga District Hospital n/a 0.50 0.75 0.75 0.50
Chitradurga General Hospital, Challekere (R) n/a 0.25 0.75 0.50 0.00
Dakshin Kannad Mangalore Women & Children Hospital n/a 1.25 2.50 0.25 0.25
Dakshin Kannad General Hospital, Bantwal (R) n/a 0.50 0.25 0.50 1.25
Davangere Davangere District Hospital 3.25 1.00 1.00 1.75 2.00
Davangere General Hospital, Channagiri (R) n/a 0.75 3.25 1.00 0.75
Dharwar Hubli KIMS 1.75 3.00 1.75 6.25 1.00
Dharwar General Hospital, Navalgund (R) n/a 3.00 4.00 7.25 0.75
Gadag Gadag District Hospital n/a 1.50 1.50 1.50 0.75

2006Annual Sentinel Surveillance Country Report 75
Gadag General Hospital, Laxmeswara (R) n/a 0.25 0.75 0.75 1.00
Gulbarga Gulbarga District Hospital n/a 1.25 2.00 2.00 1.75
Gulbarga General Hospital, Sedum (R) n/a 2.00 2.50 3.25 0.00
Hassan Hassan District Hospital 0.75 0.50 0.75 1.75 4.00
Hassan General Hospital, Sakaleshpur (R) n/a 1.00 1.25 1.00 0.75
Haveri Haveri District Hospital n/a 1.03 0.75 0.25 0.25
Haveri General Hospital, Ranibennur (R) n/a 1.75 0.50 0.50 1.00
Kodagu Madikeri District Hospital n/a 0.25 0.25 1.00 0.50
Kodagu General Hospital, Siddapur (R) n/a 0.25 1.25 0.50 0.50
Kolar Kolar District Hospital n/a 1.25 1.25 1.00 1.50
Kolar General Hospital, Chikkaballapura (R) n/a 0.75 0.25 0.50 0.00
Koppal Koppal District Hospital n/a 2.75 1.75 2.25 1.50
Koppal General Hospital, Gangavathi (R) n/a 5.51 4.25 3.50 1.75
Mandya Mandya District Hospital n/a 1.25 1.25 1.25 0.25
Mandya General Hospital, Malavalli (R) n/a 1.00 1.00 0.75 0.25
Mysore Mysore Cheluvamba Hospital/KR Hospital, Mysore
n/a 0.75 3.75 2.00 1.00
Mysore General Hospital, Hunsur (R) n/a 0.25 1.00 0.25 1.00
Raichur Raichur District Hospital 2.75 1.50 1.25 0.75 1.25
Raichur General Hospital, Sindhanur (R) n/a 1.75 1.00 2.50 1.50
Shimoga Shimoga District Hospital n/a 0.25 0.50 1.25 1.00
Shimoga General Hospital, Sagar (R) n/a 1.25 0.50 0.50 0.00
Tumkur Tumkur District Hospital n/a 1.25 1.25 0.75 0.50
Tumkur General Hospital, Tiptur (R) n/a 2.50 1.75 1.25 1.00
Udupi Udupi District Hospital 1.50 1.25 1.50 0.50 1.50
Udupi General Hospital, Kundapur (R) n/a 0.50 0.50 0.75 0.00
Uttar Kannad Karwar District Hospital n/a 1.75 1.25 0.00 1.50
Uttar Kannad General Hospital, Dandeli (R) n/a 0.25 1.50 1.50 1.20
*Result based on less than 75% of required sample size of N=400 for ANC sites and N=250 for high-risk group sites.
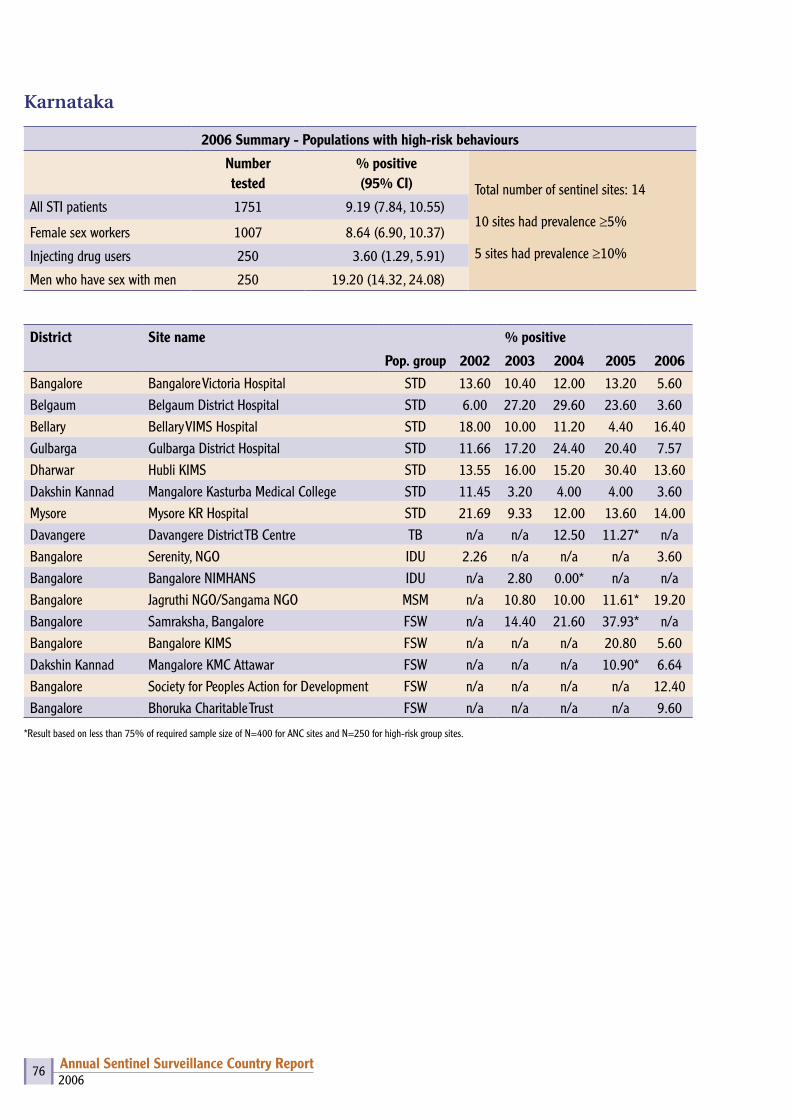
2006Annual Sentinel Surveillance Country Report 76
Karnataka
2006 Summary - Populations with high-risk behaviours
Number tested
% positive (95% CI) Total number of sentinel sites: 14
10 sites had prevalence ≥5%
5 sites had prevalence ≥10%
All STI patients 1751 9.19 (7.84, 10.55)
Female sex workers 1007 8.64 (6.90, 10.37)
Injecting drug users 250 3.60 (1.29, 5.91)
Men who have sex with men 250 19.20 (14.32, 24.08)
District Site name % positive
Pop. group 2002 2003 2004 2005 2006
Bangalore Bangalore Victoria Hospital STD 13.60 10.40 12.00 13.20 5.60Belgaum Belgaum District Hospital STD 6.00 27.20 29.60 23.60 3.60Bellary Bellary VIMS Hospital STD 18.00 10.00 11.20 4.40 16.40Gulbarga Gulbarga District Hospital STD 11.66 17.20 24.40 20.40 7.57Dharwar Hubli KIMS STD 13.55 16.00 15.20 30.40 13.60Dakshin Kannad Mangalore Kasturba Medical College STD 11.45 3.20 4.00 4.00 3.60Mysore Mysore KR Hospital STD 21.69 9.33 12.00 13.60 14.00Davangere Davangere District TB Centre TB n/a n/a 12.50 11.27* n/aBangalore Serenity, NGO IDU 2.26 n/a n/a n/a 3.60Bangalore Bangalore NIMHANS IDU n/a 2.80 0.00* n/a n/aBangalore Jagruthi NGO/Sangama NGO MSM n/a 10.80 10.00 11.61* 19.20Bangalore Samraksha, Bangalore FSW n/a 14.40 21.60 37.93* n/aBangalore Bangalore KIMS FSW n/a n/a n/a 20.80 5.60Dakshin Kannad Mangalore KMC Attawar FSW n/a n/a n/a 10.90* 6.64Bangalore Society for Peoples Action for Development FSW n/a n/a n/a n/a 12.40Bangalore Bhoruka Charitable Trust FSW n/a n/a n/a n/a 9.60
*Result based on less than 75% of required sample size of N=400 for ANC sites and N=250 for high-risk group sites.
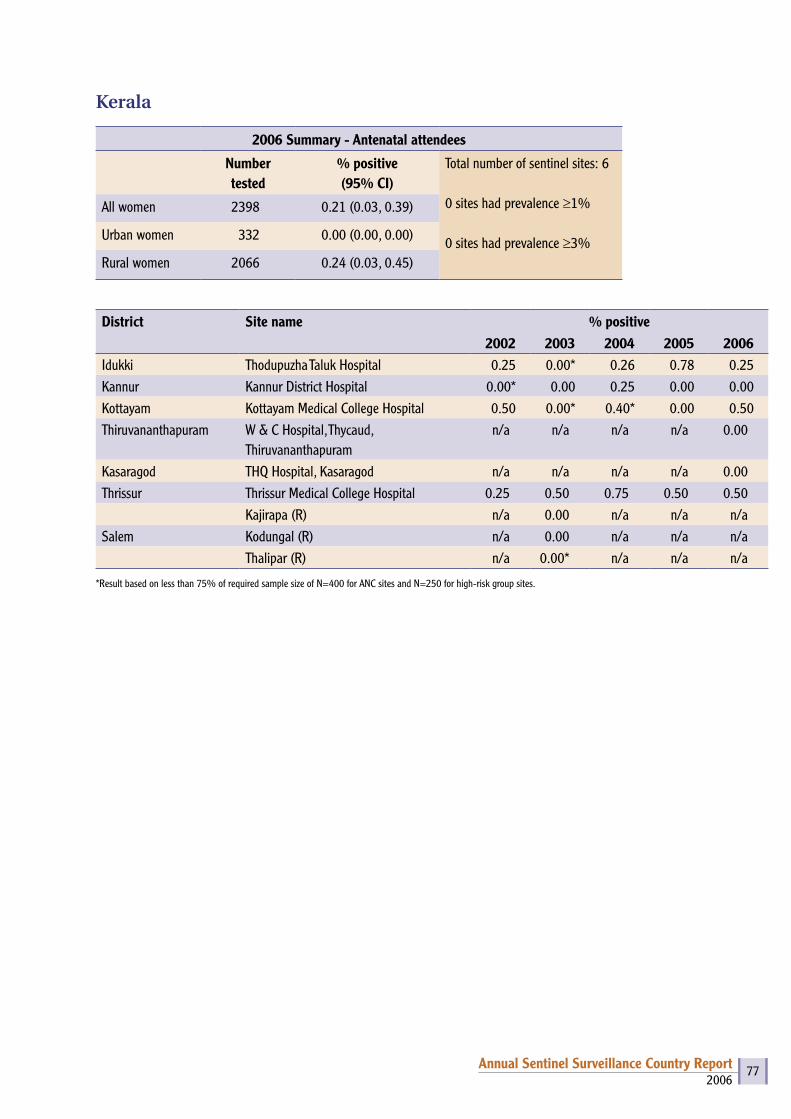
2006Annual Sentinel Surveillance Country Report 77
Kerala
2006 Summary - Antenatal attendees
Number tested
% positive (95% CI)
Total number of sentinel sites: 6
0 sites had prevalence ≥1%
0 sites had prevalence ≥3%
All women 2398 0.21 (0.03, 0.39)
Urban women 332 0.00 (0.00, 0.00)
Rural women 2066 0.24 (0.03, 0.45)
District Site name % positive2002 2003 2004 2005 2006
Idukki Thodupuzha Taluk Hospital 0.25 0.00* 0.26 0.78 0.25Kannur Kannur District Hospital 0.00* 0.00 0.25 0.00 0.00Kottayam Kottayam Medical College Hospital 0.50 0.00* 0.40* 0.00 0.50Thiruvananthapuram W & C Hospital, Thycaud,
Thiruvananthapuramn/a n/a n/a n/a 0.00
Kasaragod THQ Hospital, Kasaragod n/a n/a n/a n/a 0.00Thrissur Thrissur Medical College Hospital 0.25 0.50 0.75 0.50 0.50
Kajirapa (R) n/a 0.00 n/a n/a n/aSalem Kodungal (R) n/a 0.00 n/a n/a n/a
Thalipar (R) n/a 0.00* n/a n/a n/a
*Result based on less than 75% of required sample size of N=400 for ANC sites and N=250 for high-risk group sites.
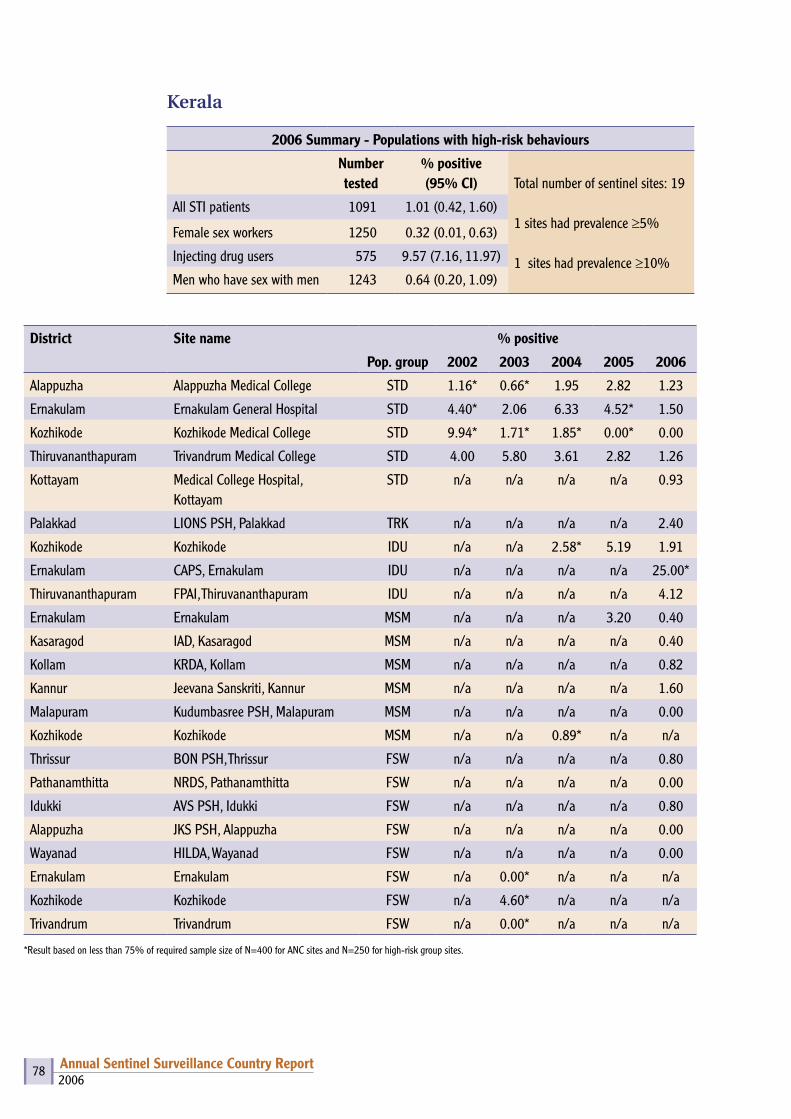
2006Annual Sentinel Surveillance Country Report 78
Kerala
2006 Summary - Populations with high-risk behaviours
Number tested
% positive(95% CI) Total number of sentinel sites: 19
1 sites had prevalence ≥5%
1 sites had prevalence ≥10%
All STI patients 1091 1.01 (0.42, 1.60)
Female sex workers 1250 0.32 (0.01, 0.63)
Injecting drug users 575 9.57 (7.16, 11.97)
Men who have sex with men 1243 0.64 (0.20, 1.09)
District Site name % positive
Pop. group 2002 2003 2004 2005 2006
Alappuzha Alappuzha Medical College STD 1.16* 0.66* 1.95 2.82 1.23
Ernakulam Ernakulam General Hospital STD 4.40* 2.06 6.33 4.52* 1.50
Kozhikode Kozhikode Medical College STD 9.94* 1.71* 1.85* 0.00* 0.00
Thiruvananthapuram Trivandrum Medical College STD 4.00 5.80 3.61 2.82 1.26
Kottayam Medical College Hospital, Kottayam
STD n/a n/a n/a n/a 0.93
Palakkad LIONS PSH, Palakkad TRK n/a n/a n/a n/a 2.40
Kozhikode Kozhikode IDU n/a n/a 2.58* 5.19 1.91
Ernakulam CAPS, Ernakulam IDU n/a n/a n/a n/a 25.00*
Thiruvananthapuram FPAI, Thiruvananthapuram IDU n/a n/a n/a n/a 4.12
Ernakulam Ernakulam MSM n/a n/a n/a 3.20 0.40
Kasaragod IAD, Kasaragod MSM n/a n/a n/a n/a 0.40
Kollam KRDA, Kollam MSM n/a n/a n/a n/a 0.82
Kannur Jeevana Sanskriti, Kannur MSM n/a n/a n/a n/a 1.60
Malapuram Kudumbasree PSH, Malapuram MSM n/a n/a n/a n/a 0.00
Kozhikode Kozhikode MSM n/a n/a 0.89* n/a n/a
Thrissur BON PSH, Thrissur FSW n/a n/a n/a n/a 0.80
Pathanamthitta NRDS, Pathanamthitta FSW n/a n/a n/a n/a 0.00
Idukki AVS PSH, Idukki FSW n/a n/a n/a n/a 0.80
Alappuzha JKS PSH, Alappuzha FSW n/a n/a n/a n/a 0.00
Wayanad HILDA, Wayanad FSW n/a n/a n/a n/a 0.00
Ernakulam Ernakulam FSW n/a 0.00* n/a n/a n/a
Kozhikode Kozhikode FSW n/a 4.60* n/a n/a n/a
Trivandrum Trivandrum FSW n/a 0.00* n/a n/a n/a
*Result based on less than 75% of required sample size of N=400 for ANC sites and N=250 for high-risk group sites.
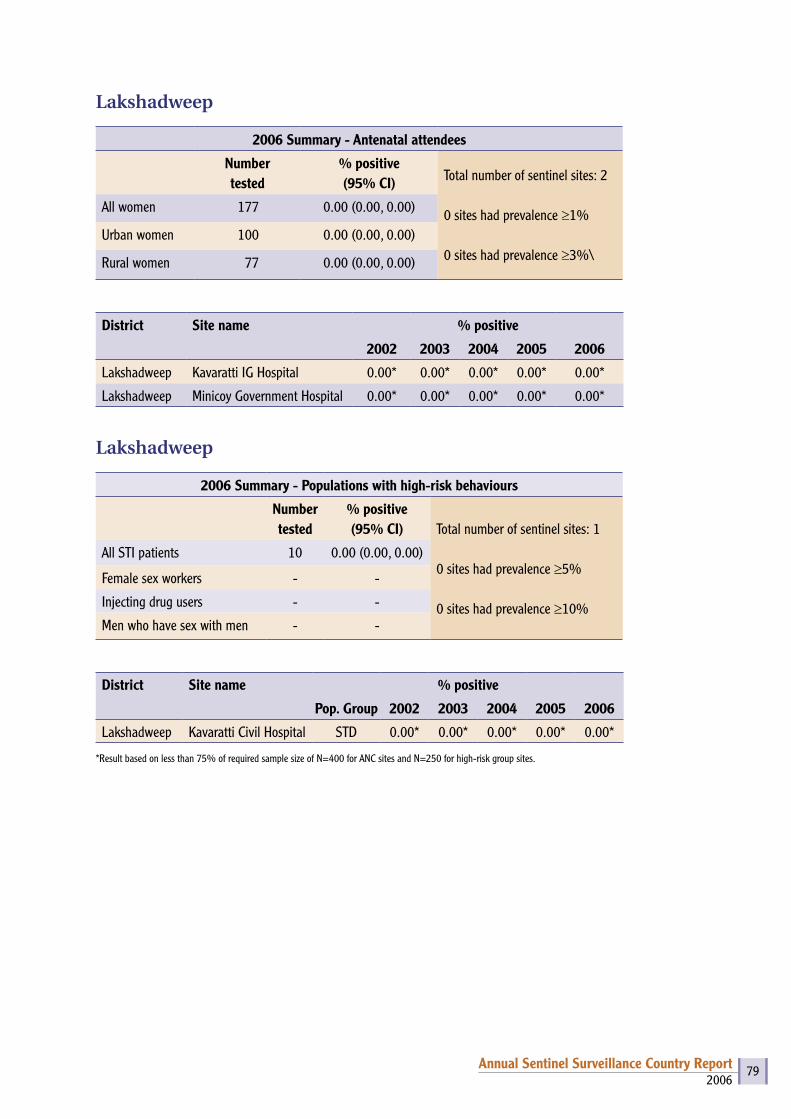
2006Annual Sentinel Surveillance Country Report 79
Lakshadweep
2006 Summary - Antenatal attendees
Number tested
% positive (95% CI) Total number of sentinel sites: 2
0 sites had prevalence ≥1%
0 sites had prevalence ≥3%\
All women 177 0.00 (0.00, 0.00)
Urban women 100 0.00 (0.00, 0.00)
Rural women 77 0.00 (0.00, 0.00)
District Site name % positive
2002 2003 2004 2005 2006
Lakshadweep Kavaratti IG Hospital 0.00* 0.00* 0.00* 0.00* 0.00*
Lakshadweep Minicoy Government Hospital 0.00* 0.00* 0.00* 0.00* 0.00*
Lakshadweep
2006 Summary - Populations with high-risk behaviours
Number tested
% positive(95% CI) Total number of sentinel sites: 1
0 sites had prevalence ≥5%
0 sites had prevalence ≥10%
All STI patients 10 0.00 (0.00, 0.00)
Female sex workers - -
Injecting drug users - -
Men who have sex with men - -
District Site name % positive
Pop. Group 2002 2003 2004 2005 2006
Lakshadweep Kavaratti Civil Hospital STD 0.00* 0.00* 0.00* 0.00* 0.00*
*Result based on less than 75% of required sample size of N=400 for ANC sites and N=250 for high-risk group sites.
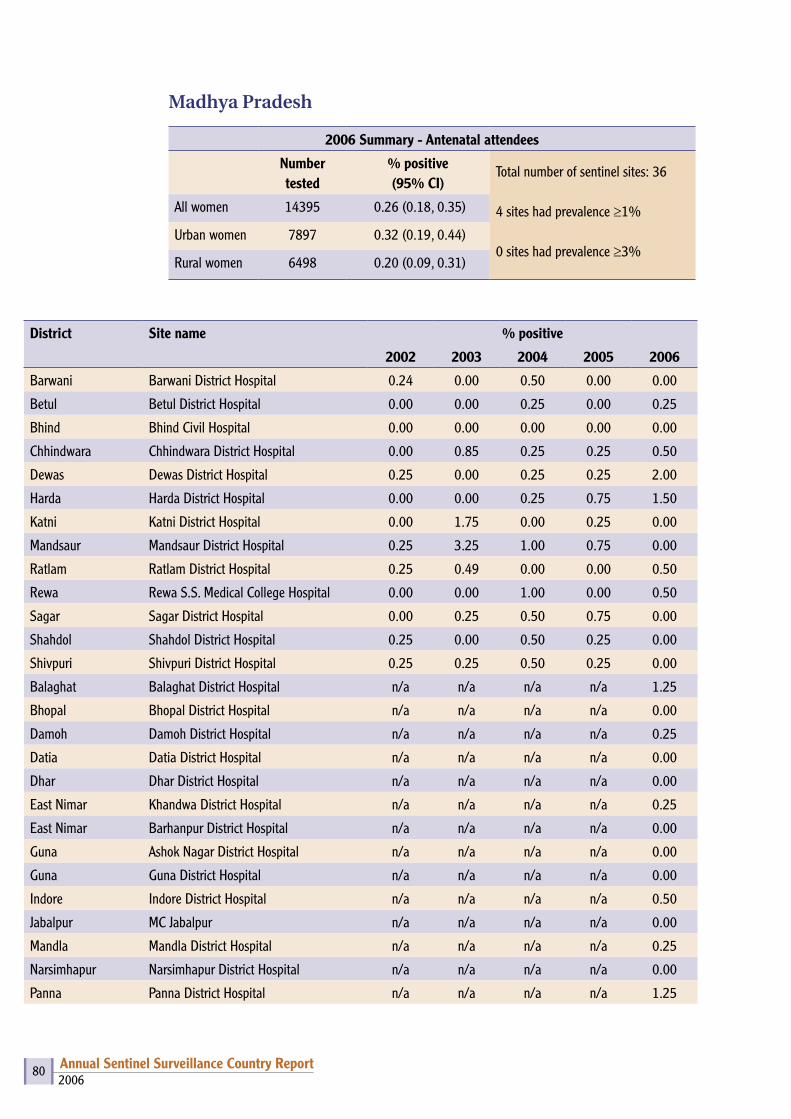
2006Annual Sentinel Surveillance Country Report 80
Madhya Pradesh
2006 Summary - Antenatal attendees
Number tested
% positive (95% CI)
Total number of sentinel sites: 36
4 sites had prevalence ≥1%
0 sites had prevalence ≥3%
All women 14395 0.26 (0.18, 0.35)
Urban women 7897 0.32 (0.19, 0.44)
Rural women 6498 0.20 (0.09, 0.31)
District Site name % positive
2002 2003 2004 2005 2006
Barwani Barwani District Hospital 0.24 0.00 0.50 0.00 0.00
Betul Betul District Hospital 0.00 0.00 0.25 0.00 0.25
Bhind Bhind Civil Hospital 0.00 0.00 0.00 0.00 0.00
Chhindwara Chhindwara District Hospital 0.00 0.85 0.25 0.25 0.50
Dewas Dewas District Hospital 0.25 0.00 0.25 0.25 2.00
Harda Harda District Hospital 0.00 0.00 0.25 0.75 1.50
Katni Katni District Hospital 0.00 1.75 0.00 0.25 0.00
Mandsaur Mandsaur District Hospital 0.25 3.25 1.00 0.75 0.00
Ratlam Ratlam District Hospital 0.25 0.49 0.00 0.00 0.50
Rewa Rewa S.S. Medical College Hospital 0.00 0.00 1.00 0.00 0.50
Sagar Sagar District Hospital 0.00 0.25 0.50 0.75 0.00
Shahdol Shahdol District Hospital 0.25 0.00 0.50 0.25 0.00
Shivpuri Shivpuri District Hospital 0.25 0.25 0.50 0.25 0.00
Balaghat Balaghat District Hospital n/a n/a n/a n/a 1.25
Bhopal Bhopal District Hospital n/a n/a n/a n/a 0.00
Damoh Damoh District Hospital n/a n/a n/a n/a 0.25
Datia Datia District Hospital n/a n/a n/a n/a 0.00
Dhar Dhar District Hospital n/a n/a n/a n/a 0.00
East Nimar Khandwa District Hospital n/a n/a n/a n/a 0.25
East Nimar Barhanpur District Hospital n/a n/a n/a n/a 0.00
Guna Ashok Nagar District Hospital n/a n/a n/a n/a 0.00
Guna Guna District Hospital n/a n/a n/a n/a 0.00
Indore Indore District Hospital n/a n/a n/a n/a 0.50
Jabalpur MC Jabalpur n/a n/a n/a n/a 0.00
Mandla Mandla District Hospital n/a n/a n/a n/a 0.25
Narsimhapur Narsimhapur District Hospital n/a n/a n/a n/a 0.00
Panna Panna District Hospital n/a n/a n/a n/a 1.25
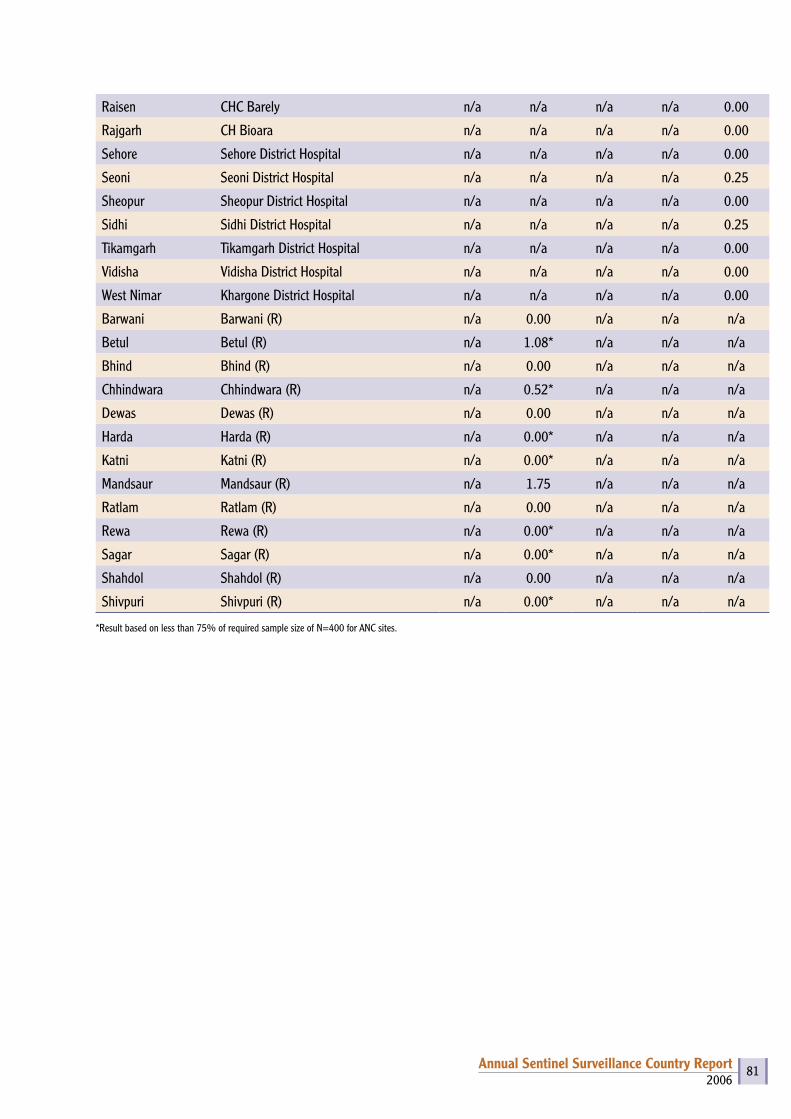
2006Annual Sentinel Surveillance Country Report 81
Raisen CHC Barely n/a n/a n/a n/a 0.00
Rajgarh CH Bioara n/a n/a n/a n/a 0.00
Sehore Sehore District Hospital n/a n/a n/a n/a 0.00
Seoni Seoni District Hospital n/a n/a n/a n/a 0.25
Sheopur Sheopur District Hospital n/a n/a n/a n/a 0.00
Sidhi Sidhi District Hospital n/a n/a n/a n/a 0.25
Tikamgarh Tikamgarh District Hospital n/a n/a n/a n/a 0.00
Vidisha Vidisha District Hospital n/a n/a n/a n/a 0.00
West Nimar Khargone District Hospital n/a n/a n/a n/a 0.00
Barwani Barwani (R) n/a 0.00 n/a n/a n/a
Betul Betul (R) n/a 1.08* n/a n/a n/a
Bhind Bhind (R) n/a 0.00 n/a n/a n/a
Chhindwara Chhindwara (R) n/a 0.52* n/a n/a n/a
Dewas Dewas (R) n/a 0.00 n/a n/a n/a
Harda Harda (R) n/a 0.00* n/a n/a n/a
Katni Katni (R) n/a 0.00* n/a n/a n/a
Mandsaur Mandsaur (R) n/a 1.75 n/a n/a n/a
Ratlam Ratlam (R) n/a 0.00 n/a n/a n/a
Rewa Rewa (R) n/a 0.00* n/a n/a n/a
Sagar Sagar (R) n/a 0.00* n/a n/a n/a
Shahdol Shahdol (R) n/a 0.00 n/a n/a n/a
Shivpuri Shivpuri (R) n/a 0.00* n/a n/a n/a
*Result based on less than 75% of required sample size of N=400 for ANC sites.
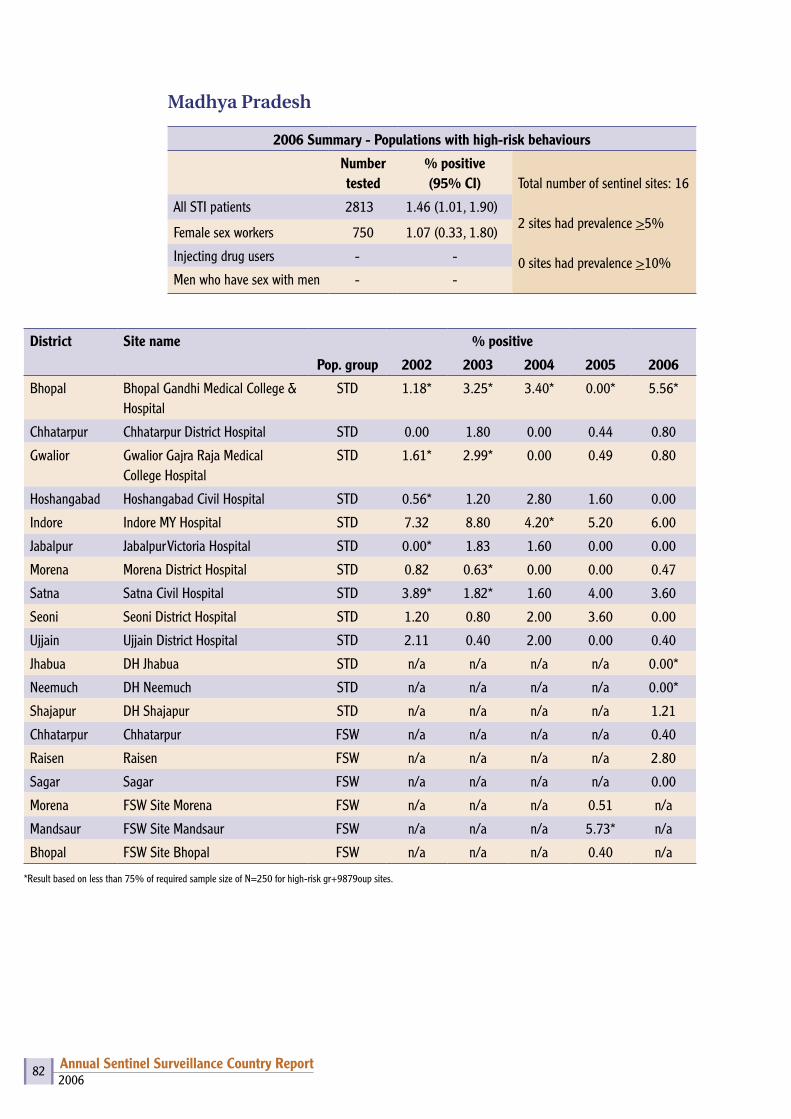
2006Annual Sentinel Surveillance Country Report 82
Madhya Pradesh
2006 Summary - Populations with high-risk behaviours
Number tested
% positive(95% CI) Total number of sentinel sites: 16
2 sites had prevalence >5%
0 sites had prevalence >10%
All STI patients 2813 1.46 (1.01, 1.90)
Female sex workers 750 1.07 (0.33, 1.80)
Injecting drug users - -
Men who have sex with men - -
District Site name % positive
Pop. group 2002 2003 2004 2005 2006
Bhopal Bhopal Gandhi Medical College & Hospital
STD 1.18* 3.25* 3.40* 0.00* 5.56*
Chhatarpur Chhatarpur District Hospital STD 0.00 1.80 0.00 0.44 0.80
Gwalior Gwalior Gajra Raja Medical College Hospital
STD 1.61* 2.99* 0.00 0.49 0.80
Hoshangabad Hoshangabad Civil Hospital STD 0.56* 1.20 2.80 1.60 0.00
Indore Indore MY Hospital STD 7.32 8.80 4.20* 5.20 6.00
Jabalpur Jabalpur Victoria Hospital STD 0.00* 1.83 1.60 0.00 0.00
Morena Morena District Hospital STD 0.82 0.63* 0.00 0.00 0.47
Satna Satna Civil Hospital STD 3.89* 1.82* 1.60 4.00 3.60
Seoni Seoni District Hospital STD 1.20 0.80 2.00 3.60 0.00
Ujjain Ujjain District Hospital STD 2.11 0.40 2.00 0.00 0.40
Jhabua DH Jhabua STD n/a n/a n/a n/a 0.00*
Neemuch DH Neemuch STD n/a n/a n/a n/a 0.00*
Shajapur DH Shajapur STD n/a n/a n/a n/a 1.21
Chhatarpur Chhatarpur FSW n/a n/a n/a n/a 0.40
Raisen Raisen FSW n/a n/a n/a n/a 2.80
Sagar Sagar FSW n/a n/a n/a n/a 0.00
Morena FSW Site Morena FSW n/a n/a n/a 0.51 n/a
Mandsaur FSW Site Mandsaur FSW n/a n/a n/a 5.73* n/a
Bhopal FSW Site Bhopal FSW n/a n/a n/a 0.40 n/a
*Result based on less than 75% of required sample size of N=250 for high-risk gr+9879oup sites.
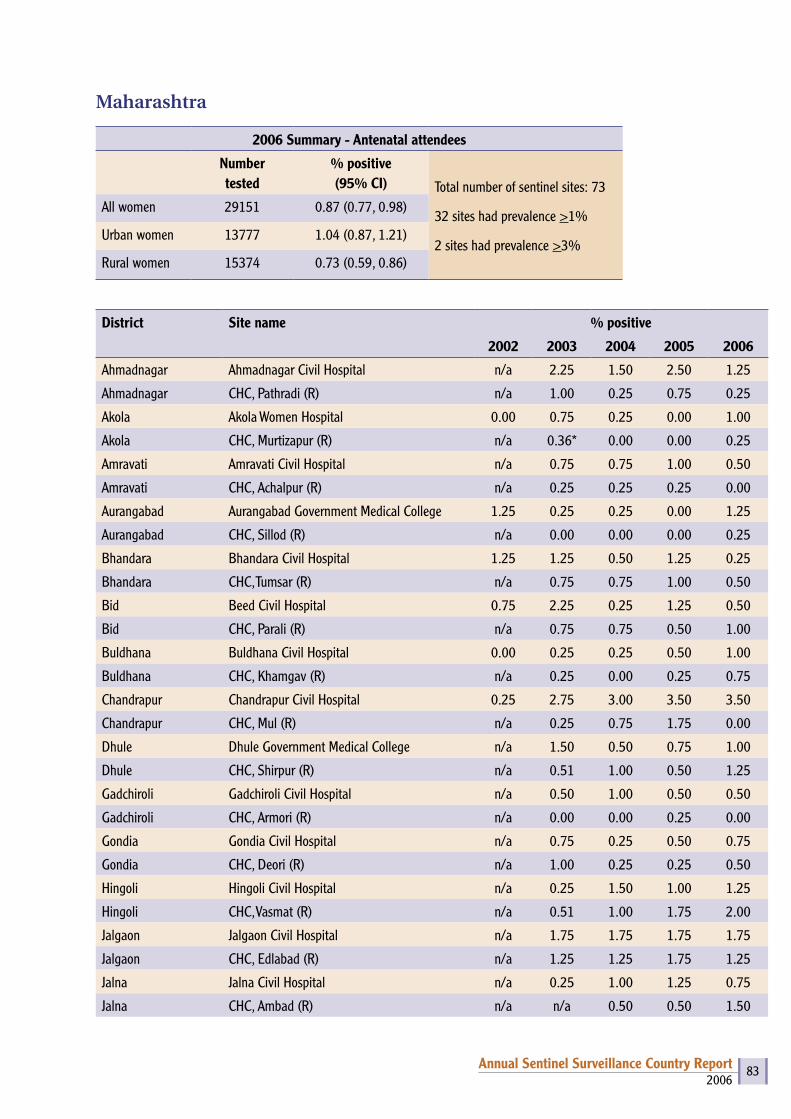
2006Annual Sentinel Surveillance Country Report 83
Maharashtra
2006 Summary - Antenatal attendees
Number tested
% positive (95% CI) Total number of sentinel sites: 73
32 sites had prevalence >1%
2 sites had prevalence >3%
All women 29151 0.87 (0.77, 0.98)
Urban women 13777 1.04 (0.87, 1.21)
Rural women 15374 0.73 (0.59, 0.86)
District Site name % positive
2002 2003 2004 2005 2006
Ahmadnagar Ahmadnagar Civil Hospital n/a 2.25 1.50 2.50 1.25
Ahmadnagar CHC, Pathradi (R) n/a 1.00 0.25 0.75 0.25
Akola Akola Women Hospital 0.00 0.75 0.25 0.00 1.00
Akola CHC, Murtizapur (R) n/a 0.36* 0.00 0.00 0.25
Amravati Amravati Civil Hospital n/a 0.75 0.75 1.00 0.50
Amravati CHC, Achalpur (R) n/a 0.25 0.25 0.25 0.00
Aurangabad Aurangabad Government Medical College 1.25 0.25 0.25 0.00 1.25
Aurangabad CHC, Sillod (R) n/a 0.00 0.00 0.00 0.25
Bhandara Bhandara Civil Hospital 1.25 1.25 0.50 1.25 0.25
Bhandara CHC, Tumsar (R) n/a 0.75 0.75 1.00 0.50
Bid Beed Civil Hospital 0.75 2.25 0.25 1.25 0.50
Bid CHC, Parali (R) n/a 0.75 0.75 0.50 1.00
Buldhana Buldhana Civil Hospital 0.00 0.25 0.25 0.50 1.00
Buldhana CHC, Khamgav (R) n/a 0.25 0.00 0.25 0.75
Chandrapur Chandrapur Civil Hospital 0.25 2.75 3.00 3.50 3.50
Chandrapur CHC, Mul (R) n/a 0.25 0.75 1.75 0.00
Dhule Dhule Government Medical College n/a 1.50 0.50 0.75 1.00
Dhule CHC, Shirpur (R) n/a 0.51 1.00 0.50 1.25
Gadchiroli Gadchiroli Civil Hospital n/a 0.50 1.00 0.50 0.50
Gadchiroli CHC, Armori (R) n/a 0.00 0.00 0.25 0.00
Gondia Gondia Civil Hospital n/a 0.75 0.25 0.50 0.75
Gondia CHC, Deori (R) n/a 1.00 0.25 0.25 0.50
Hingoli Hingoli Civil Hospital n/a 0.25 1.50 1.00 1.25
Hingoli CHC, Vasmat (R) n/a 0.51 1.00 1.75 2.00
Jalgaon Jalgaon Civil Hospital n/a 1.75 1.75 1.75 1.75
Jalgaon CHC, Edlabad (R) n/a 1.25 1.25 1.75 1.25
Jalna Jalna Civil Hospital n/a 0.25 1.00 1.25 0.75
Jalna CHC, Ambad (R) n/a n/a 0.50 0.50 1.50
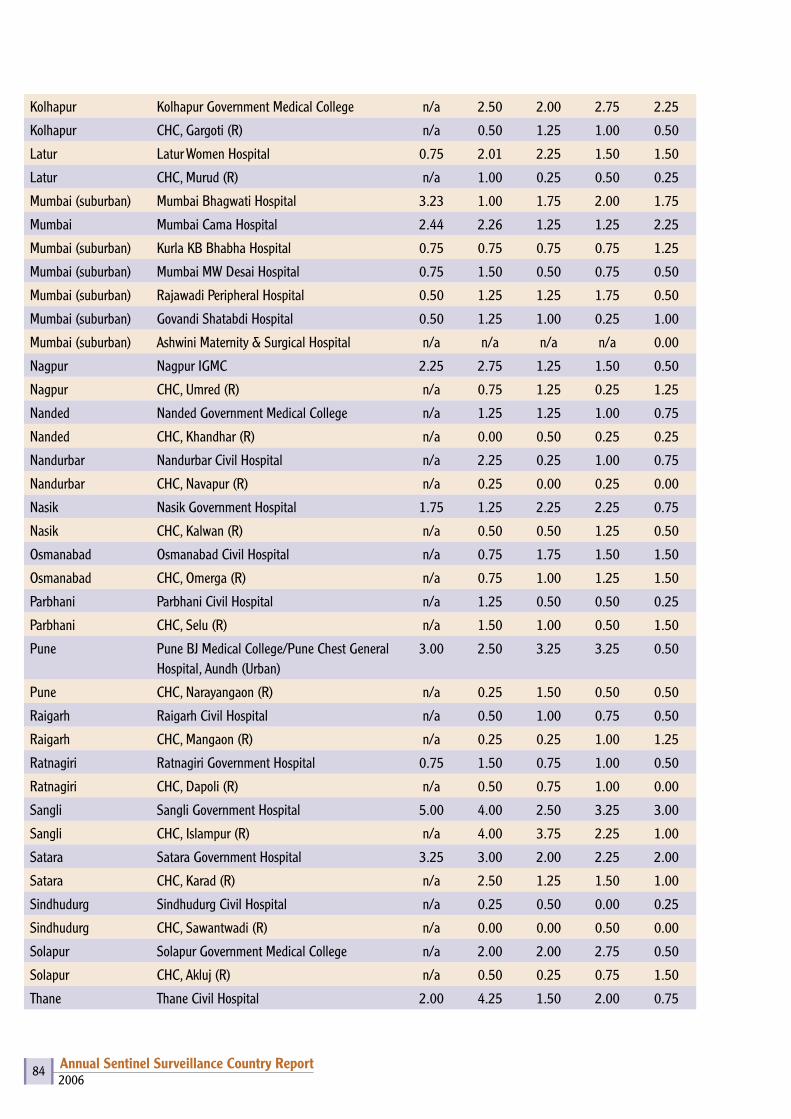
2006Annual Sentinel Surveillance Country Report 84
Kolhapur Kolhapur Government Medical College n/a 2.50 2.00 2.75 2.25
Kolhapur CHC, Gargoti (R) n/a 0.50 1.25 1.00 0.50
Latur Latur Women Hospital 0.75 2.01 2.25 1.50 1.50
Latur CHC, Murud (R) n/a 1.00 0.25 0.50 0.25
Mumbai (suburban) Mumbai Bhagwati Hospital 3.23 1.00 1.75 2.00 1.75
Mumbai Mumbai Cama Hospital 2.44 2.26 1.25 1.25 2.25
Mumbai (suburban) Kurla KB Bhabha Hospital 0.75 0.75 0.75 0.75 1.25
Mumbai (suburban) Mumbai MW Desai Hospital 0.75 1.50 0.50 0.75 0.50
Mumbai (suburban) Rajawadi Peripheral Hospital 0.50 1.25 1.25 1.75 0.50
Mumbai (suburban) Govandi Shatabdi Hospital 0.50 1.25 1.00 0.25 1.00
Mumbai (suburban) Ashwini Maternity & Surgical Hospital n/a n/a n/a n/a 0.00
Nagpur Nagpur IGMC 2.25 2.75 1.25 1.50 0.50
Nagpur CHC, Umred (R) n/a 0.75 1.25 0.25 1.25
Nanded Nanded Government Medical College n/a 1.25 1.25 1.00 0.75
Nanded CHC, Khandhar (R) n/a 0.00 0.50 0.25 0.25
Nandurbar Nandurbar Civil Hospital n/a 2.25 0.25 1.00 0.75
Nandurbar CHC, Navapur (R) n/a 0.25 0.00 0.25 0.00
Nasik Nasik Government Hospital 1.75 1.25 2.25 2.25 0.75
Nasik CHC, Kalwan (R) n/a 0.50 0.50 1.25 0.50
Osmanabad Osmanabad Civil Hospital n/a 0.75 1.75 1.50 1.50
Osmanabad CHC, Omerga (R) n/a 0.75 1.00 1.25 1.50
Parbhani Parbhani Civil Hospital n/a 1.25 0.50 0.50 0.25
Parbhani CHC, Selu (R) n/a 1.50 1.00 0.50 1.50
Pune Pune BJ Medical College/Pune Chest General Hospital, Aundh (Urban)
3.00 2.50 3.25 3.25 0.50
Pune CHC, Narayangaon (R) n/a 0.25 1.50 0.50 0.50
Raigarh Raigarh Civil Hospital n/a 0.50 1.00 0.75 0.50
Raigarh CHC, Mangaon (R) n/a 0.25 0.25 1.00 1.25
Ratnagiri Ratnagiri Government Hospital 0.75 1.50 0.75 1.00 0.50
Ratnagiri CHC, Dapoli (R) n/a 0.50 0.75 1.00 0.00
Sangli Sangli Government Hospital 5.00 4.00 2.50 3.25 3.00
Sangli CHC, Islampur (R) n/a 4.00 3.75 2.25 1.00
Satara Satara Government Hospital 3.25 3.00 2.00 2.25 2.00
Satara CHC, Karad (R) n/a 2.50 1.25 1.50 1.00
Sindhudurg Sindhudurg Civil Hospital n/a 0.25 0.50 0.00 0.25
Sindhudurg CHC, Sawantwadi (R) n/a 0.00 0.00 0.50 0.00
Solapur Solapur Government Medical College n/a 2.00 2.00 2.75 0.50
Solapur CHC, Akluj (R) n/a 0.50 0.25 0.75 1.50
Thane Thane Civil Hospital 2.00 4.25 1.50 2.00 0.75
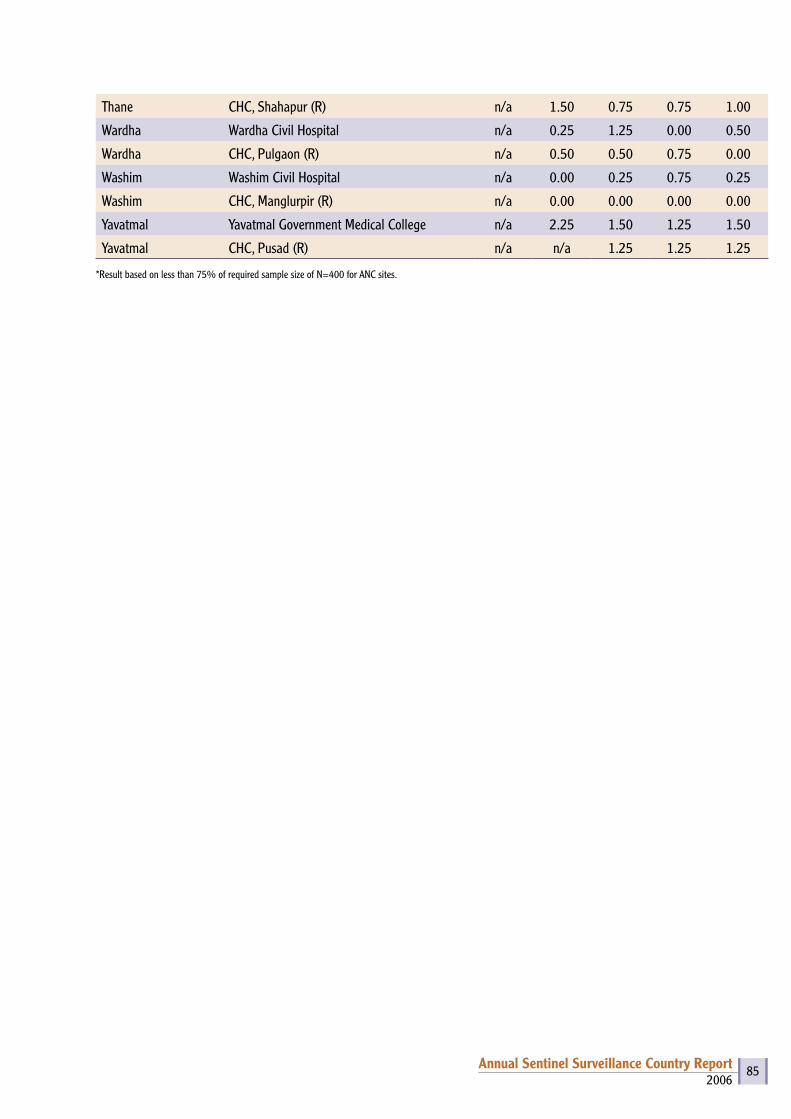
2006Annual Sentinel Surveillance Country Report 85
Thane CHC, Shahapur (R) n/a 1.50 0.75 0.75 1.00
Wardha Wardha Civil Hospital n/a 0.25 1.25 0.00 0.50
Wardha CHC, Pulgaon (R) n/a 0.50 0.50 0.75 0.00
Washim Washim Civil Hospital n/a 0.00 0.25 0.75 0.25
Washim CHC, Manglurpir (R) n/a 0.00 0.00 0.00 0.00
Yavatmal Yavatmal Government Medical College n/a 2.25 1.50 1.25 1.50
Yavatmal CHC, Pusad (R) n/a n/a 1.25 1.25 1.25
*Result based on less than 75% of required sample size of N=400 for ANC sites.
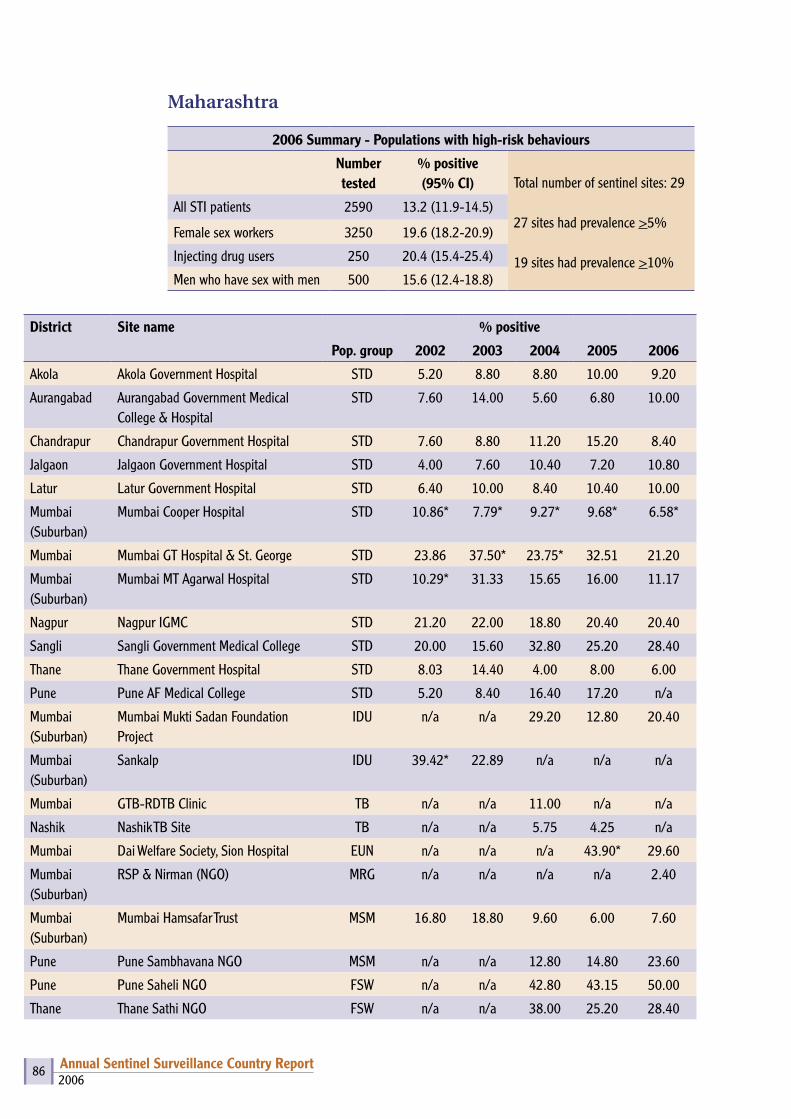
2006Annual Sentinel Surveillance Country Report 86
Maharashtra
2006 Summary - Populations with high-risk behaviours
Number tested
% positive(95% CI)
Total number of sentinel sites: 29
27 sites had prevalence >5%
19 sites had prevalence >10%
All STI patients 2590 13.2 (11.9-14.5)
Female sex workers 3250 19.6 (18.2-20.9)
Injecting drug users 250 20.4 (15.4-25.4)
Men who have sex with men 500 15.6 (12.4-18.8)
District Site name % positive
Pop. group 2002 2003 2004 2005 2006
Akola Akola Government Hospital STD 5.20 8.80 8.80 10.00 9.20
Aurangabad Aurangabad Government Medical College & Hospital
STD 7.60 14.00 5.60 6.80 10.00
Chandrapur Chandrapur Government Hospital STD 7.60 8.80 11.20 15.20 8.40
Jalgaon Jalgaon Government Hospital STD 4.00 7.60 10.40 7.20 10.80
Latur Latur Government Hospital STD 6.40 10.00 8.40 10.40 10.00
Mumbai (Suburban)
Mumbai Cooper Hospital STD 10.86* 7.79* 9.27* 9.68* 6.58*
Mumbai Mumbai GT Hospital & St. George STD 23.86 37.50* 23.75* 32.51 21.20
Mumbai (Suburban)
Mumbai MT Agarwal Hospital STD 10.29* 31.33 15.65 16.00 11.17
Nagpur Nagpur IGMC STD 21.20 22.00 18.80 20.40 20.40
Sangli Sangli Government Medical College STD 20.00 15.60 32.80 25.20 28.40
Thane Thane Government Hospital STD 8.03 14.40 4.00 8.00 6.00
Pune Pune AF Medical College STD 5.20 8.40 16.40 17.20 n/a
Mumbai (Suburban)
Mumbai Mukti Sadan Foundation Project
IDU n/a n/a 29.20 12.80 20.40
Mumbai (Suburban)
Sankalp IDU 39.42* 22.89 n/a n/a n/a
Mumbai GTB-RDTB Clinic TB n/a n/a 11.00 n/a n/a
Nashik Nashik TB Site TB n/a n/a 5.75 4.25 n/a
Mumbai Dai Welfare Society, Sion Hospital EUN n/a n/a n/a 43.90* 29.60
Mumbai (Suburban)
RSP & Nirman (NGO) MRG n/a n/a n/a n/a 2.40
Mumbai (Suburban)
Mumbai Hamsafar Trust MSM 16.80 18.80 9.60 6.00 7.60
Pune Pune Sambhavana NGO MSM n/a n/a 12.80 14.80 23.60
Pune Pune Saheli NGO FSW n/a n/a 42.80 43.15 50.00
Thane Thane Sathi NGO FSW n/a n/a 38.00 25.20 28.40

2006Annual Sentinel Surveillance Country Report 87
Jalgaon Adhar Babuuddeshiya Sanstha FSW n/a n/a n/a 21.60 11.20
Chandrapur Noble Shikshan Sanstha FSW n/a n/a n/a 22.00 20.80
Parbhani Setu Charitable Trust FSW n/a n/a n/a 15.60 10.40
Raigarh Lok Parishad FSW n/a n/a n/a 16.40 n/a
Nashik Late Dr. GM Bhavsar Charitable Trust FSW n/a n/a n/a 18.40 9.60
Ahmadnagar Snehalaya Project FSW n/a n/a n/a 16.40 26.80
Latur Shri Ganesh Bahuddeshiya Shikshan Prasarak, Mandal
FSW n/a n/a n/a 14.80 8.80
Kolhapur Muslim Samaj Probodhan Va Shikshan Sanstha
FSW n/a n/a n/a 29.20 29.60
Akola Priyadarshini, Akola FSW n/a n/a n/a n/a 5.20
Mumbai Mumbai Gaurabai Hospital FSW 54.50 54.29* 44.76 50.20 36.80
Mumbai (Suburban)
Malvani Urban Health Centre FSW n/a n/a n/a 11.20 4.00
Mumbai (Suburban)
Aditi – Source of Inspiration (NGO) FSW n/a n/a n/a n/a 12.80
*Result based on less than 75% of required sample size of N=250 for high-risk group sites.

2006Annual Sentinel Surveillance Country Report 88
Manipur
2006 Summary - Antenatal attendees
Number tested % positive (95% CI)Total number of sentinel sites: 14
8 sites had prevalence >1%
1 site had prevalence >3%
All women 5600 1.39 (1.09, 1.70)
Urban women 1142 1.66 (0.92, 2.41)
Rural women 4458 1.32 (0.99, 1.66)
District Site name % positive
2002 2003 2004 2005 2006
Bishnupur Bishnupur District Hospital 0.00 1.75 1.25 0.75 0.00
Bishnupur PHC, Moirang (R) n/a 1.50 1.25 1.75 0.75
Churachandpur Churachandpur District Hospital 8.75 5.00 2.75 1.50 2.25
Imphal East Imphal JN Hospital 0.00 1.00 2.50 1.00 0.75
Imphal East Jiribam CHC 0.25 0.00 0.25 0.25 1.25
Imphal West Lamphelpat RIMS 0.75 1.50 1.50 1.50 2.25
Imphal West CHC, Wangoi (R) n/a 0.50 0.75 0.00 0.25
Imphal West CHC, Khumbong (R) n/a 0.00 0.50 0.50 0.25
Chandel Moreh CHC Hospital 8.00 1.75 1.50 3.50 1.75
Senapati Senapati District Hospital 1.25 0.75 0.50 1.00 1.75
Tamenglong Tamenglong District Hospital 1.25 0.75 1.50 1.75 2.50
Thoubal Thoubal District Hospital 0.25 1.00 4.00 0.75 1.25
Thoubal CHC, Kakching (R) n/a 0.25 0.50 1.00 0.50
Ukhrul Ukhrul District Hospital 3.23 3.00 4.50 3.00 4.00
Note – Result based on less than 75% of required sample size of N=400 for ANC sites.

2006Annual Sentinel Surveillance Country Report 89
Manipur
2006 Summary - Populations with high-risk behaviours
Number tested
% positive(95% CI) Total number of sentinel sites: 10
9 sites had prevalence >5%
7 sites had prevalence >10%
All STI patients 500 4.80 (2.93, 6.67)
Female sex workers 750 11.60 (9.31, 13.89)
Injecting drug users 1000 19.80 (17.33, 22.27)
Men who have sex with men 250 10.40 (6.62, 14.18)
District Site name % positive
Pop. group 2002 2003 2004 2005 2006
Imphal East Imphal JN Hospital STD 6.00 7.60 6.00 8.80 2.80
Churachandpur Churachandpur District Hospital STD 13.20 18.40 8.40 15.60 6.80
Bishnupur Bishnupur District Hospital DDAC IDU 14.74 22.40 10.80 28.00 15.20
Churachandpur Churachandpur DDAC, Shalom IDU 50.80 32.93 29.20 20.00 24.00
Churachandpur DDAC, LRRC IDU n/a n/a 29.20 33.60 17.20
Imphal West DDAC, Imphal IDU 51.60 18.07 14.80 14.80 22.80
Imphal West Imphal SASO RIMS Road MSM n/a 29.20 14.00 15.60 10.40
Churachandpur FSW, PPO FSW n/a n/a n/a 12.80 16.00
Imphal West FSW, MLSS FSW n/a 12.80 12.40 13.20 8.40
Chandel FSW, New Generation, Moreh FSW n/a n/a n/a 4.00 10.40
Imphal West Imphal District TB Hospital Chingmeirong TUB n/a n/a 18.80 n/a n/a
Note – Result based on less than 75%of required sample size of N=250 for high-risk group sites.
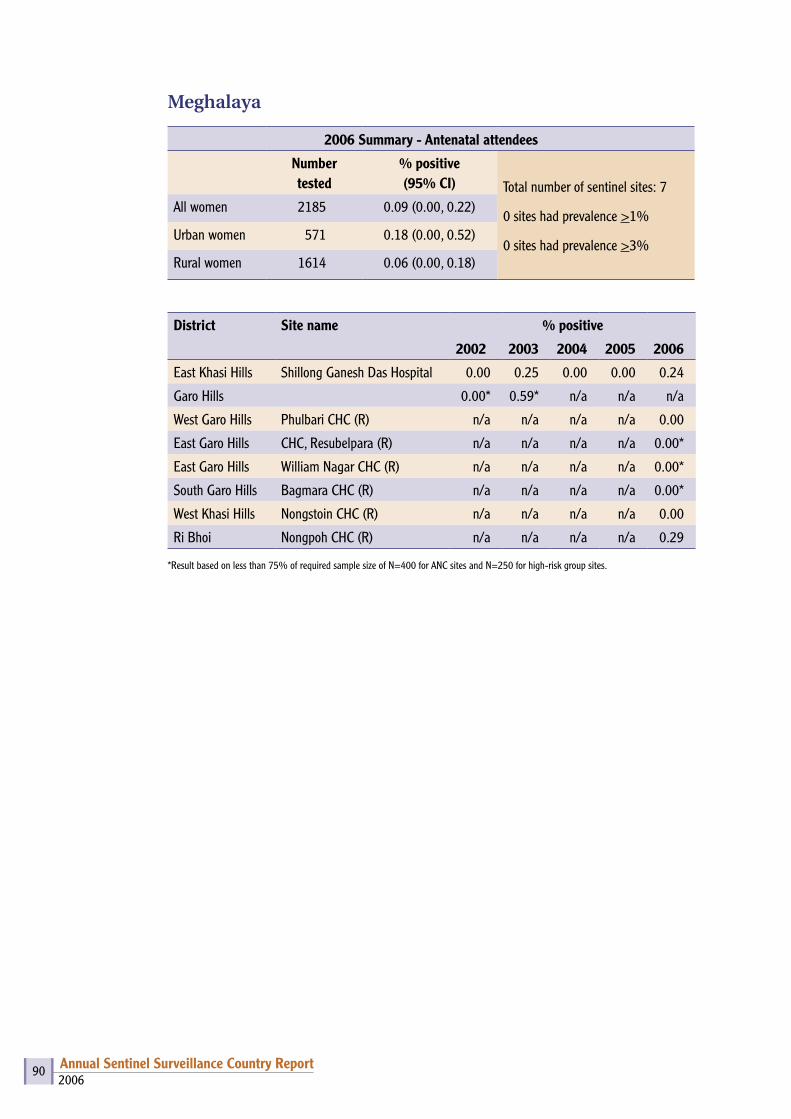
2006Annual Sentinel Surveillance Country Report 90
Meghalaya
2006 Summary - Antenatal attendees
Number tested
% positive (95% CI) Total number of sentinel sites: 7
0 sites had prevalence >1%
0 sites had prevalence >3%
All women 2185 0.09 (0.00, 0.22)
Urban women 571 0.18 (0.00, 0.52)
Rural women 1614 0.06 (0.00, 0.18)
District Site name % positive
2002 2003 2004 2005 2006
East Khasi Hills Shillong Ganesh Das Hospital 0.00 0.25 0.00 0.00 0.24
Garo Hills 0.00* 0.59* n/a n/a n/a
West Garo Hills Phulbari CHC (R) n/a n/a n/a n/a 0.00
East Garo Hills CHC, Resubelpara (R) n/a n/a n/a n/a 0.00*
East Garo Hills William Nagar CHC (R) n/a n/a n/a n/a 0.00*
South Garo Hills Bagmara CHC (R) n/a n/a n/a n/a 0.00*
West Khasi Hills Nongstoin CHC (R) n/a n/a n/a n/a 0.00
Ri Bhoi Nongpoh CHC (R) n/a n/a n/a n/a 0.29
*Result based on less than 75% of required sample size of N=400 for ANC sites and N=250 for high-risk group sites.
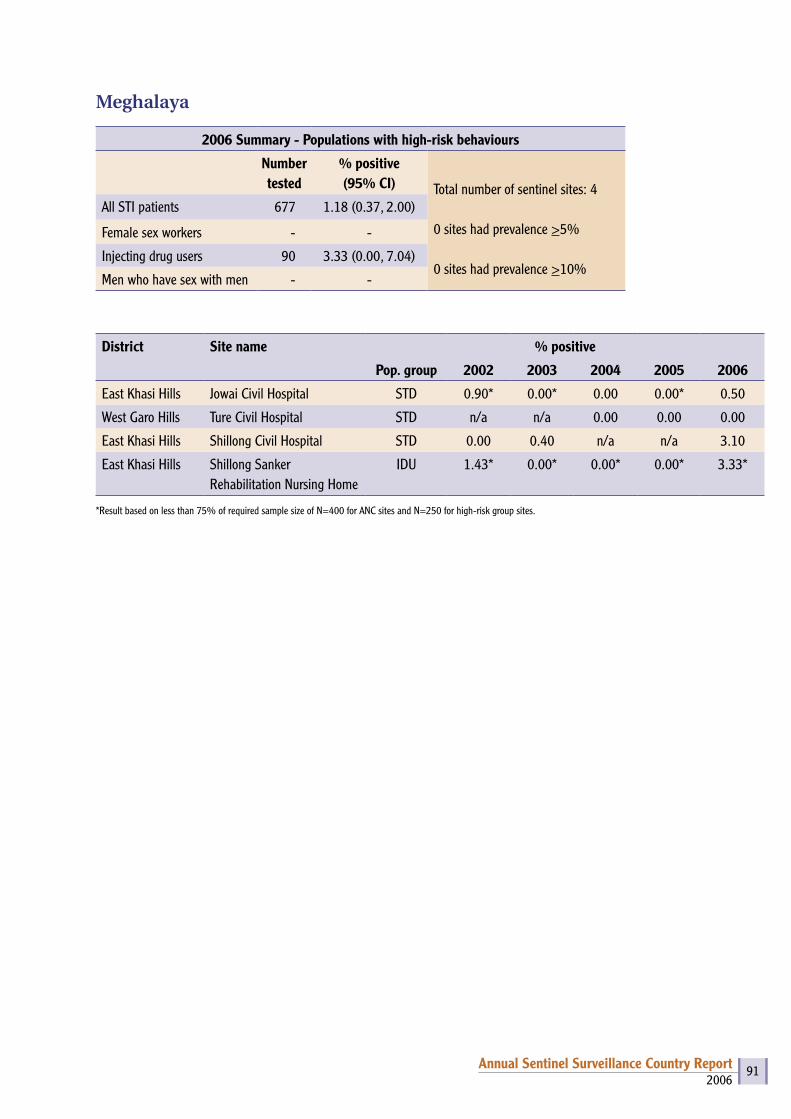
2006Annual Sentinel Surveillance Country Report 91
Meghalaya
2006 Summary - Populations with high-risk behaviours
Number tested
% positive(95% CI) Total number of sentinel sites: 4
0 sites had prevalence >5%
0 sites had prevalence >10%
All STI patients 677 1.18 (0.37, 2.00)
Female sex workers - -
Injecting drug users 90 3.33 (0.00, 7.04)
Men who have sex with men - -
District Site name % positive
Pop. group 2002 2003 2004 2005 2006
East Khasi Hills Jowai Civil Hospital STD 0.90* 0.00* 0.00 0.00* 0.50
West Garo Hills Ture Civil Hospital STD n/a n/a 0.00 0.00 0.00
East Khasi Hills Shillong Civil Hospital STD 0.00 0.40 n/a n/a 3.10
East Khasi Hills Shillong Sanker Rehabilitation Nursing Home
IDU 1.43* 0.00* 0.00* 0.00* 3.33*
*Result based on less than 75% of required sample size of N=400 for ANC sites and N=250 for high-risk group sites.
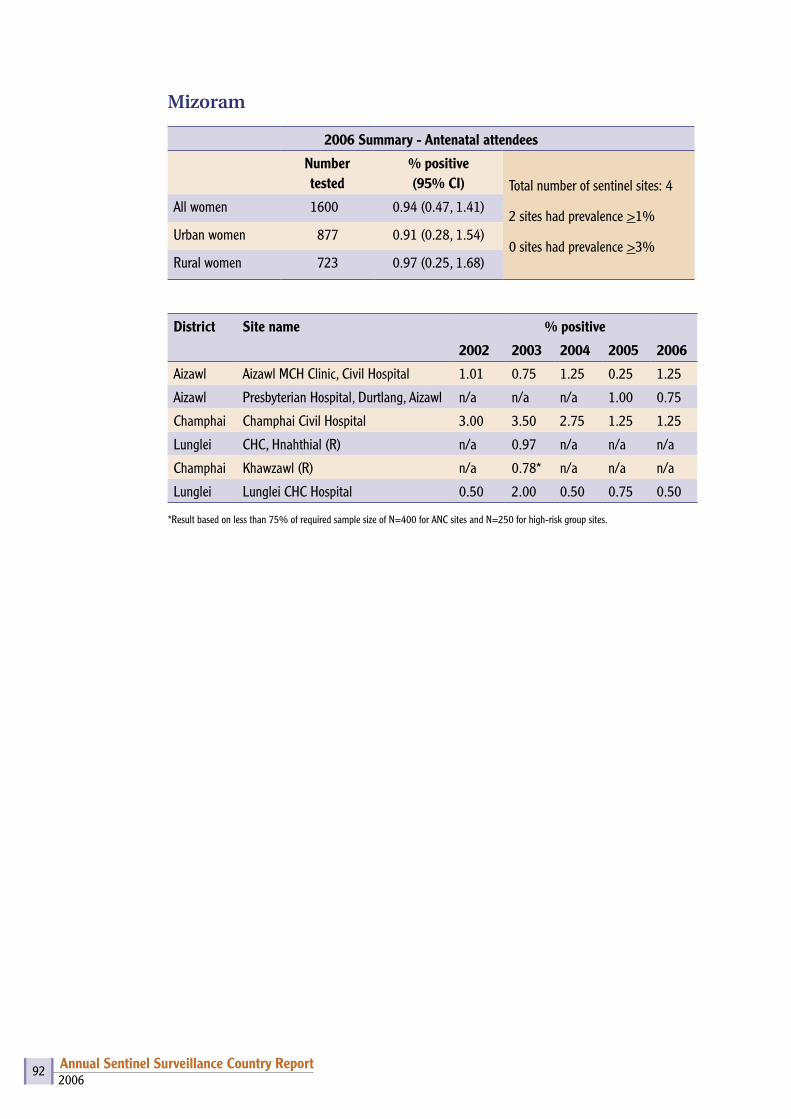
2006Annual Sentinel Surveillance Country Report 92
Mizoram
2006 Summary - Antenatal attendees
Number tested
% positive (95% CI) Total number of sentinel sites: 4
2 sites had prevalence >1%
0 sites had prevalence >3%
All women 1600 0.94 (0.47, 1.41)
Urban women 877 0.91 (0.28, 1.54)
Rural women 723 0.97 (0.25, 1.68)
District Site name % positive
2002 2003 2004 2005 2006
Aizawl Aizawl MCH Clinic, Civil Hospital 1.01 0.75 1.25 0.25 1.25
Aizawl Presbyterian Hospital, Durtlang, Aizawl n/a n/a n/a 1.00 0.75
Champhai Champhai Civil Hospital 3.00 3.50 2.75 1.25 1.25
Lunglei CHC, Hnahthial (R) n/a 0.97 n/a n/a n/a
Champhai Khawzawl (R) n/a 0.78* n/a n/a n/a
Lunglei Lunglei CHC Hospital 0.50 2.00 0.50 0.75 0.50
*Result based on less than 75% of required sample size of N=400 for ANC sites and N=250 for high-risk group sites.
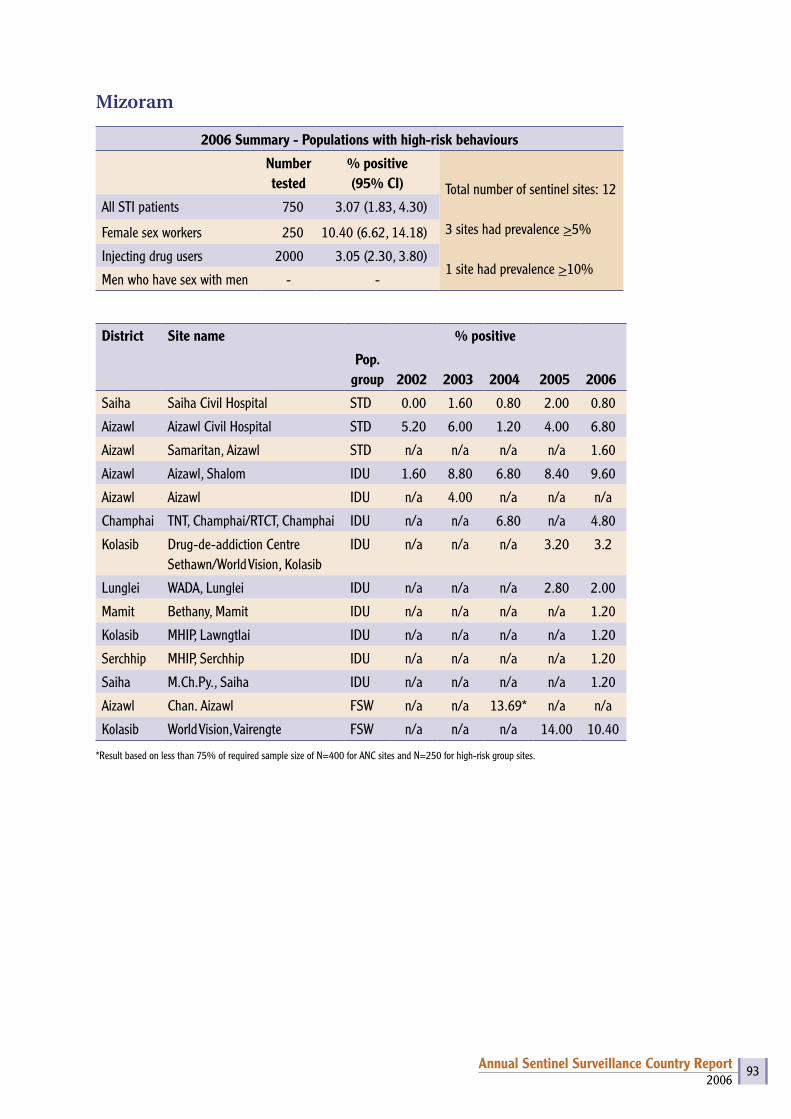
2006Annual Sentinel Surveillance Country Report 93
Mizoram
2006 Summary - Populations with high-risk behaviours
Number tested
% positive(95% CI) Total number of sentinel sites: 12
3 sites had prevalence >5%
1 site had prevalence >10%
All STI patients 750 3.07 (1.83, 4.30)
Female sex workers 250 10.40 (6.62, 14.18)
Injecting drug users 2000 3.05 (2.30, 3.80)
Men who have sex with men - -
District Site name % positive
Pop. group 2002 2003 2004 2005 2006
Saiha Saiha Civil Hospital STD 0.00 1.60 0.80 2.00 0.80
Aizawl Aizawl Civil Hospital STD 5.20 6.00 1.20 4.00 6.80
Aizawl Samaritan, Aizawl STD n/a n/a n/a n/a 1.60
Aizawl Aizawl, Shalom IDU 1.60 8.80 6.80 8.40 9.60
Aizawl Aizawl IDU n/a 4.00 n/a n/a n/a
Champhai TNT, Champhai/RTCT, Champhai IDU n/a n/a 6.80 n/a 4.80
Kolasib Drug-de-addiction Centre Sethawn/World Vision, Kolasib
IDU n/a n/a n/a 3.20 3.2
Lunglei WADA, Lunglei IDU n/a n/a n/a 2.80 2.00
Mamit Bethany, Mamit IDU n/a n/a n/a n/a 1.20
Kolasib MHIP, Lawngtlai IDU n/a n/a n/a n/a 1.20
Serchhip MHIP, Serchhip IDU n/a n/a n/a n/a 1.20
Saiha M.Ch.Py., Saiha IDU n/a n/a n/a n/a 1.20
Aizawl Chan. Aizawl FSW n/a n/a 13.69* n/a n/a
Kolasib World Vision, Vairengte FSW n/a n/a n/a 14.00 10.40
*Result based on less than 75% of required sample size of N=400 for ANC sites and N=250 for high-risk group sites.

2006Annual Sentinel Surveillance Country Report 94
Nagaland
2006 Summary - Antenatal attendees
Number tested
% positive (95% CI) Total number of sentinel sites: 19
9 sites had prevalence >1%
2 sites had prevalence >3%
All women 5741 1.36 (1.06, 1.66)
Urban women 2849 1.83 (1.33, 2.32)
Rural women 2892 0.90 (0.56, 1.24)
District Site name % positive
2002 2003 2004 2005 2006
Dimapur Dimapur Civil Hospital 1.26* 1.00 0.79 1.50 2.25
Dimapur CHC, Medziphema (R) n/a 0.79* 1.20* 0.87 0.36*
Kohima Kohima Naga Hospital 1.14 1.75 1.75 1.75 1.25
Peren Civil Hospital, Peren n/a n/a n/a n/a 2.25
Kohima CHC, Tseminyu (R) n/a 0.00* 3.16* 1.23* 0.83*
Mokokchung Mokokchung Civil Hospital 1.26 0.00 2.51 0.75 1.11
Mokokchung CHC, Changtonya (R) n/a n/a 0.61 1.21 0.83
Mon Mon Civil Hospital n/a 1.25 1.11 2.29 0.00
Mon CHC, Aboi (R) n/a 16.67* 0.00 n/a 1.37*
Phek Phek Civil Hospital n/a 2.13* 0.00* 1.86 0.26
Phek CHC, Pfutsero (R) n/a 7.09* 0.38* 0.00* 0.00*
Tuensang Tuensang Civil Hospital 8.00 4.25 3.64* 4.73 5.00
Kiphire Civil Hospital, Kiphire n/a n/a n/a n/a 1.17*
Longleng Civil Hospital, Longleng n/a n/a n/a n/a 0.00
Tuensang CHC, Tuensang (Noklak) (R) n/a n/a 7.07 8.36* 4.07*
Wokha Wokha Civil Hospital n/a 0.82 0.74 1.00 0.61
Wokha CHC, Bhandhari (R) n/a n/a 0.00* 2.34* 0.93*
Zunheboto Zunheboto Civil Hospital n/a 0.80* 1.88 1.50 2.00
Zunheboto CHC, Akuluto (R) n/a n/a 0.00* 0.00 0.00*
*Result based on less than 75% of required sample size of N=400 for ANC sites.
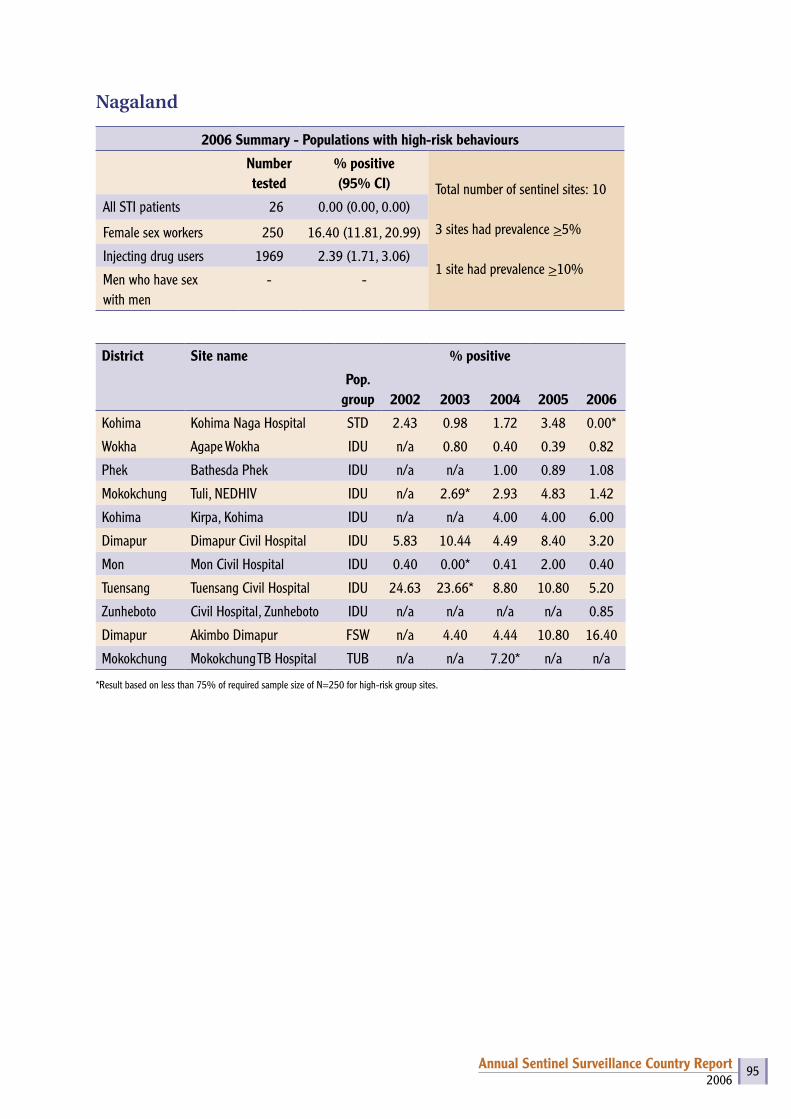
2006Annual Sentinel Surveillance Country Report 95
Nagaland
2006 Summary - Populations with high-risk behaviours
Number tested
% positive(95% CI) Total number of sentinel sites: 10
3 sites had prevalence >5%
1 site had prevalence >10%
All STI patients 26 0.00 (0.00, 0.00)
Female sex workers 250 16.40 (11.81, 20.99)
Injecting drug users 1969 2.39 (1.71, 3.06)
Men who have sex with men
- -
District Site name % positive
Pop. group 2002 2003 2004 2005 2006
Kohima Kohima Naga Hospital STD 2.43 0.98 1.72 3.48 0.00*
Wokha Agape Wokha IDU n/a 0.80 0.40 0.39 0.82
Phek Bathesda Phek IDU n/a n/a 1.00 0.89 1.08
Mokokchung Tuli, NEDHIV IDU n/a 2.69* 2.93 4.83 1.42
Kohima Kirpa, Kohima IDU n/a n/a 4.00 4.00 6.00
Dimapur Dimapur Civil Hospital IDU 5.83 10.44 4.49 8.40 3.20
Mon Mon Civil Hospital IDU 0.40 0.00* 0.41 2.00 0.40
Tuensang Tuensang Civil Hospital IDU 24.63 23.66* 8.80 10.80 5.20
Zunheboto Civil Hospital, Zunheboto IDU n/a n/a n/a n/a 0.85
Dimapur Akimbo Dimapur FSW n/a 4.40 4.44 10.80 16.40
Mokokchung Mokokchung TB Hospital TUB n/a n/a 7.20* n/a n/a
*Result based on less than 75% of required sample size of N=250 for high-risk group sites.
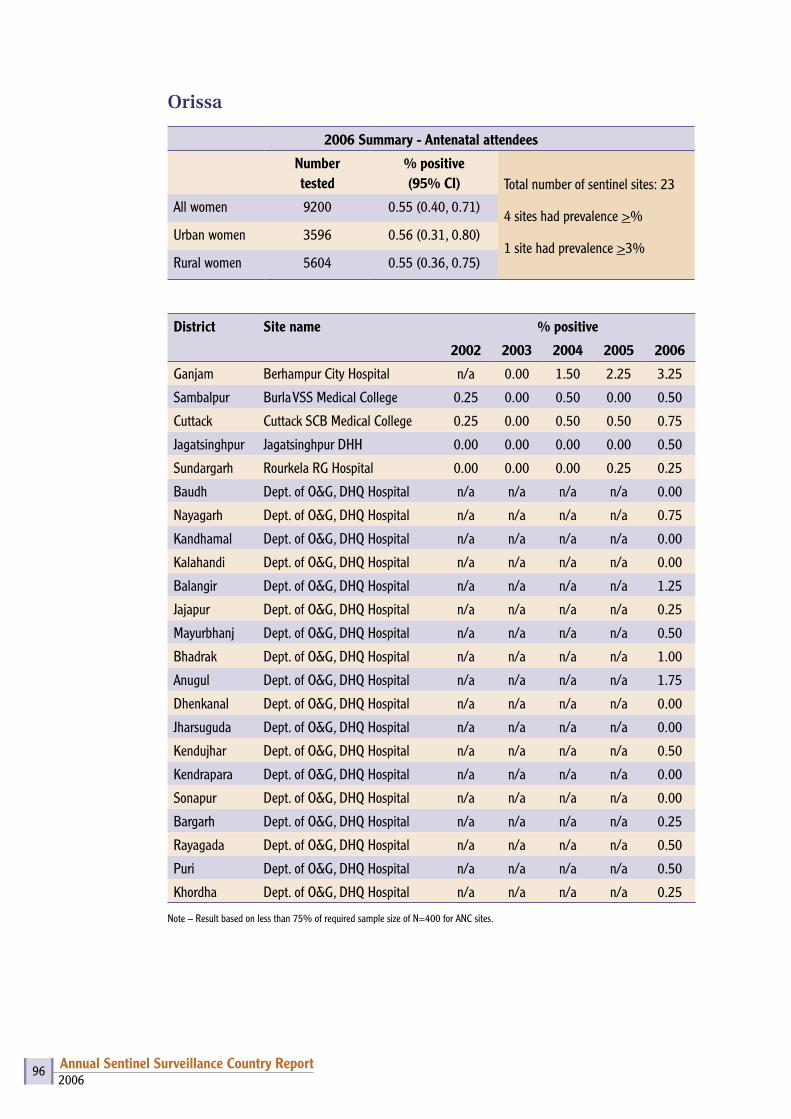
2006Annual Sentinel Surveillance Country Report 96
Orissa
2006 Summary - Antenatal attendees
Number tested
% positive (95% CI) Total number of sentinel sites: 23
4 sites had prevalence >%
1 site had prevalence >3%
All women 9200 0.55 (0.40, 0.71)
Urban women 3596 0.56 (0.31, 0.80)
Rural women 5604 0.55 (0.36, 0.75)
District Site name % positive
2002 2003 2004 2005 2006
Ganjam Berhampur City Hospital n/a 0.00 1.50 2.25 3.25
Sambalpur Burla VSS Medical College 0.25 0.00 0.50 0.00 0.50
Cuttack Cuttack SCB Medical College 0.25 0.00 0.50 0.50 0.75
Jagatsinghpur Jagatsinghpur DHH 0.00 0.00 0.00 0.00 0.50
Sundargarh Rourkela RG Hospital 0.00 0.00 0.00 0.25 0.25
Baudh Dept. of O&G, DHQ Hospital n/a n/a n/a n/a 0.00
Nayagarh Dept. of O&G, DHQ Hospital n/a n/a n/a n/a 0.75
Kandhamal Dept. of O&G, DHQ Hospital n/a n/a n/a n/a 0.00
Kalahandi Dept. of O&G, DHQ Hospital n/a n/a n/a n/a 0.00
Balangir Dept. of O&G, DHQ Hospital n/a n/a n/a n/a 1.25
Jajapur Dept. of O&G, DHQ Hospital n/a n/a n/a n/a 0.25
Mayurbhanj Dept. of O&G, DHQ Hospital n/a n/a n/a n/a 0.50
Bhadrak Dept. of O&G, DHQ Hospital n/a n/a n/a n/a 1.00
Anugul Dept. of O&G, DHQ Hospital n/a n/a n/a n/a 1.75
Dhenkanal Dept. of O&G, DHQ Hospital n/a n/a n/a n/a 0.00
Jharsuguda Dept. of O&G, DHQ Hospital n/a n/a n/a n/a 0.00
Kendujhar Dept. of O&G, DHQ Hospital n/a n/a n/a n/a 0.50
Kendrapara Dept. of O&G, DHQ Hospital n/a n/a n/a n/a 0.00
Sonapur Dept. of O&G, DHQ Hospital n/a n/a n/a n/a 0.00
Bargarh Dept. of O&G, DHQ Hospital n/a n/a n/a n/a 0.25
Rayagada Dept. of O&G, DHQ Hospital n/a n/a n/a n/a 0.50
Puri Dept. of O&G, DHQ Hospital n/a n/a n/a n/a 0.50
Khordha Dept. of O&G, DHQ Hospital n/a n/a n/a n/a 0.25
Note – Result based on less than 75% of required sample size of N=400 for ANC sites.
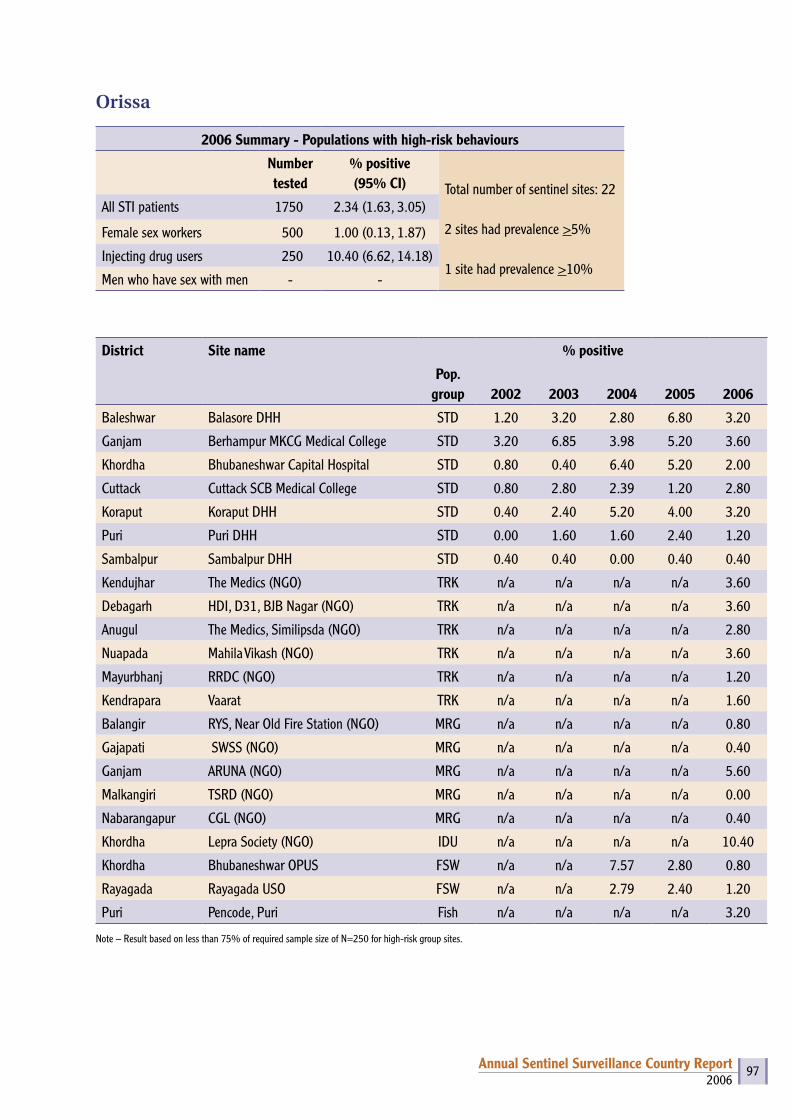
2006Annual Sentinel Surveillance Country Report 97
Orissa
2006 Summary - Populations with high-risk behaviours
Number tested
% positive(95% CI) Total number of sentinel sites: 22
2 sites had prevalence >5%
1 site had prevalence >10%
All STI patients 1750 2.34 (1.63, 3.05)
Female sex workers 500 1.00 (0.13, 1.87)
Injecting drug users 250 10.40 (6.62, 14.18)
Men who have sex with men - -
District Site name % positive
Pop. group 2002 2003 2004 2005 2006
Baleshwar Balasore DHH STD 1.20 3.20 2.80 6.80 3.20
Ganjam Berhampur MKCG Medical College STD 3.20 6.85 3.98 5.20 3.60
Khordha Bhubaneshwar Capital Hospital STD 0.80 0.40 6.40 5.20 2.00
Cuttack Cuttack SCB Medical College STD 0.80 2.80 2.39 1.20 2.80
Koraput Koraput DHH STD 0.40 2.40 5.20 4.00 3.20
Puri Puri DHH STD 0.00 1.60 1.60 2.40 1.20
Sambalpur Sambalpur DHH STD 0.40 0.40 0.00 0.40 0.40
Kendujhar The Medics (NGO) TRK n/a n/a n/a n/a 3.60
Debagarh HDI, D31, BJB Nagar (NGO) TRK n/a n/a n/a n/a 3.60
Anugul The Medics, Similipsda (NGO) TRK n/a n/a n/a n/a 2.80
Nuapada Mahila Vikash (NGO) TRK n/a n/a n/a n/a 3.60
Mayurbhanj RRDC (NGO) TRK n/a n/a n/a n/a 1.20
Kendrapara Vaarat TRK n/a n/a n/a n/a 1.60
Balangir RYS, Near Old Fire Station (NGO) MRG n/a n/a n/a n/a 0.80
Gajapati SWSS (NGO) MRG n/a n/a n/a n/a 0.40
Ganjam ARUNA (NGO) MRG n/a n/a n/a n/a 5.60
Malkangiri TSRD (NGO) MRG n/a n/a n/a n/a 0.00
Nabarangapur CGL (NGO) MRG n/a n/a n/a n/a 0.40
Khordha Lepra Society (NGO) IDU n/a n/a n/a n/a 10.40
Khordha Bhubaneshwar OPUS FSW n/a n/a 7.57 2.80 0.80
Rayagada Rayagada USO FSW n/a n/a 2.79 2.40 1.20
Puri Pencode, Puri Fish n/a n/a n/a n/a 3.20
Note – Result based on less than 75% of required sample size of N=250 for high-risk group sites.

2006Annual Sentinel Surveillance Country Report 98
Pondicherry
2006 Summary - Antenatal attendees
Number tested
% positive (95% CI) Total number of sentinel sites: 2
0 sites had prevalence >1%
0 sites had prevalence >3%
All women 800 0.25 (0.00, 0.60)
Urban women 255 0.39 (0.00, 1.16)
Rural women 545 0.18 (0.00, 0.54)
District Site name % positive
2002 2003 2004 2005 2006
Karaikal Karaikal General Hospital 0.25 0.25 0.25 0.50 0.50
Karaikal Karaikal (R) n/a 0.26 n/a n/a n/a
Pondicherry Pondicherry Maternity Hospital 0.25 0.00 0.25 0.00 0.00
Pondicherry Pondicherry (R) n/a 0.00 n/a n/a n/a
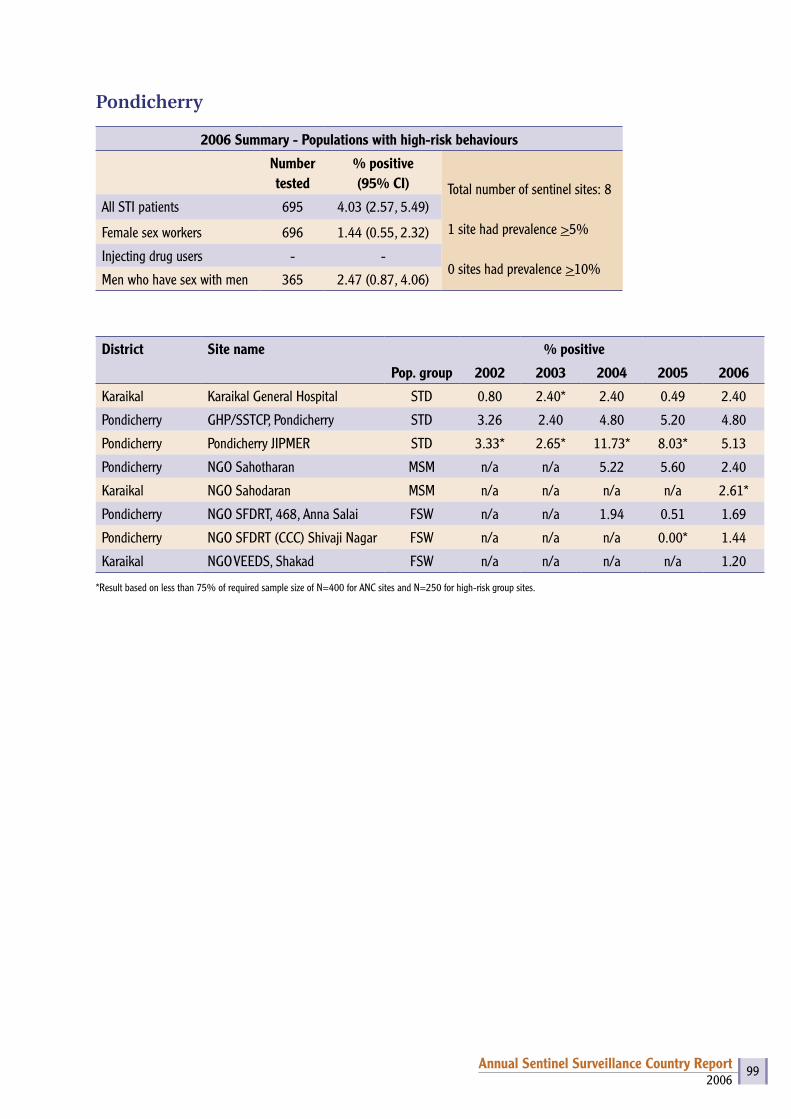
2006Annual Sentinel Surveillance Country Report 99
Pondicherry
2006 Summary - Populations with high-risk behaviours
Number tested
% positive(95% CI) Total number of sentinel sites: 8
1 site had prevalence >5%
0 sites had prevalence >10%
All STI patients 695 4.03 (2.57, 5.49)
Female sex workers 696 1.44 (0.55, 2.32)
Injecting drug users - -
Men who have sex with men 365 2.47 (0.87, 4.06)
District Site name % positive
Pop. group 2002 2003 2004 2005 2006
Karaikal Karaikal General Hospital STD 0.80 2.40* 2.40 0.49 2.40
Pondicherry GHP/SSTCP, Pondicherry STD 3.26 2.40 4.80 5.20 4.80
Pondicherry Pondicherry JIPMER STD 3.33* 2.65* 11.73* 8.03* 5.13
Pondicherry NGO Sahotharan MSM n/a n/a 5.22 5.60 2.40
Karaikal NGO Sahodaran MSM n/a n/a n/a n/a 2.61*
Pondicherry NGO SFDRT, 468, Anna Salai FSW n/a n/a 1.94 0.51 1.69
Pondicherry NGO SFDRT (CCC) Shivaji Nagar FSW n/a n/a n/a 0.00* 1.44
Karaikal NGO VEEDS, Shakad FSW n/a n/a n/a n/a 1.20
*Result based on less than 75% of required sample size of N=400 for ANC sites and N=250 for high-risk group sites.
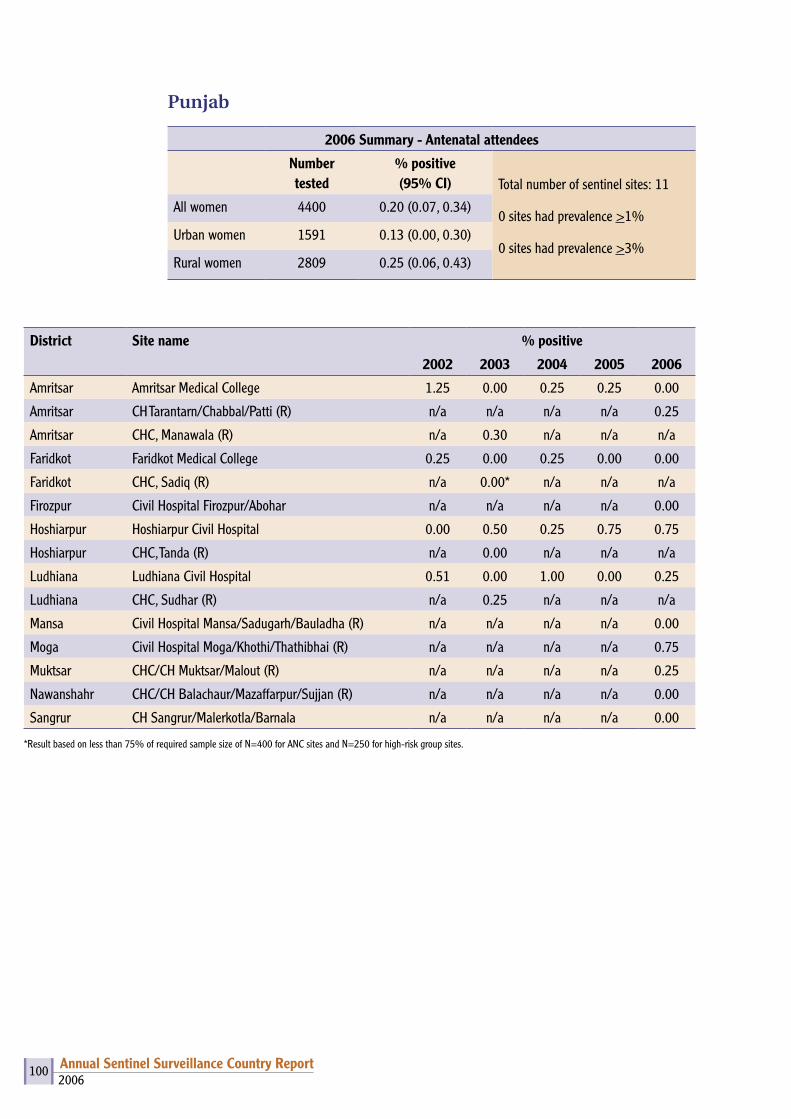
2006Annual Sentinel Surveillance Country Report 100
Punjab
2006 Summary - Antenatal attendees
Number tested
% positive (95% CI) Total number of sentinel sites: 11
0 sites had prevalence >1%
0 sites had prevalence >3%
All women 4400 0.20 (0.07, 0.34)
Urban women 1591 0.13 (0.00, 0.30)
Rural women 2809 0.25 (0.06, 0.43)
District Site name % positive
2002 2003 2004 2005 2006
Amritsar Amritsar Medical College 1.25 0.00 0.25 0.25 0.00
Amritsar CH Tarantarn/Chabbal/Patti (R) n/a n/a n/a n/a 0.25
Amritsar CHC, Manawala (R) n/a 0.30 n/a n/a n/a
Faridkot Faridkot Medical College 0.25 0.00 0.25 0.00 0.00
Faridkot CHC, Sadiq (R) n/a 0.00* n/a n/a n/a
Firozpur Civil Hospital Firozpur/Abohar n/a n/a n/a n/a 0.00
Hoshiarpur Hoshiarpur Civil Hospital 0.00 0.50 0.25 0.75 0.75
Hoshiarpur CHC, Tanda (R) n/a 0.00 n/a n/a n/a
Ludhiana Ludhiana Civil Hospital 0.51 0.00 1.00 0.00 0.25
Ludhiana CHC, Sudhar (R) n/a 0.25 n/a n/a n/a
Mansa Civil Hospital Mansa/Sadugarh/Bauladha (R) n/a n/a n/a n/a 0.00
Moga Civil Hospital Moga/Khothi/Thathibhai (R) n/a n/a n/a n/a 0.75
Muktsar CHC/CH Muktsar/Malout (R) n/a n/a n/a n/a 0.25
Nawanshahr CHC/CH Balachaur/Mazaffarpur/Sujjan (R) n/a n/a n/a n/a 0.00
Sangrur CH Sangrur/Malerkotla/Barnala n/a n/a n/a n/a 0.00
*Result based on less than 75% of required sample size of N=400 for ANC sites and N=250 for high-risk group sites.

2006Annual Sentinel Surveillance Country Report 101
Punjab
2006 Summary - Populations with high-risk behaviours
Number tested
% positive(95% CI) Total number of sentinel sites: 14
2 sites had prevalence >5%
1 site had prevalence >10%
All STI patients 750 0.27 (0.00, 0.64)
Female sex workers 1250 1.36 (0.72, 2.00)
Injecting drug users 500 13.80 (10.78, 16.82)
Men who have sex with men
250 4.80 (2.15, 7.45)
District Site name % positive
Pop. group 2002 2003 2004 2005 2006
Amritsar Amritsar Government Medical College STD 4.02 2.00 2.00 2.40 0.00
Patiala Patiala Medical College STD 0.81 1.60 1.09 0.80 0.80
Bathinda Bathinda Civil Hospital STD 0.00 1.20 0.40 0.00 0.00
Bathinda DEWS IDU n/a n/a n/a n/a 6.40
Ludhiana Swach IDU n/a n/a n/a n/a 21.20
Rupnagar Ambuja Cement, Ropar MSM n/a n/a n/a n/a 4.80
Patiala Progressive Youth Forum FSW n/a 0.00 n/a n/a 0.80
Jalandhar Swach FSW n/a n/a n/a n/a 2.40
Rupnagar FPAI (SAS Nagar) FSW n/a n/a n/a n/a 1.60
Amritsar Swami Vivekanand Medical Mission FSW n/a n/a n/a n/a 1.60
Fatehgarh Sahib S.S. Memorial Edu. Trust, Mandi, Gobind Garh FSW n/a n/a n/a n/a 0.40
Gurdaspur Vaho Vaho Sewak Sabha Batala Gurdaspur TRK n/a n/a n/a n/a 0.80
Kapurthala Yuvasatta Phagwara TRK n/a n/a n/a n/a 0.00
Rupnagar Ambuja Cement, Ropar TRK n/a n/a n/a n/a 2.40
Note – Result based on less than 75% of required sample size of N=400 for ANC sites and N=250 for high-risk group sites.
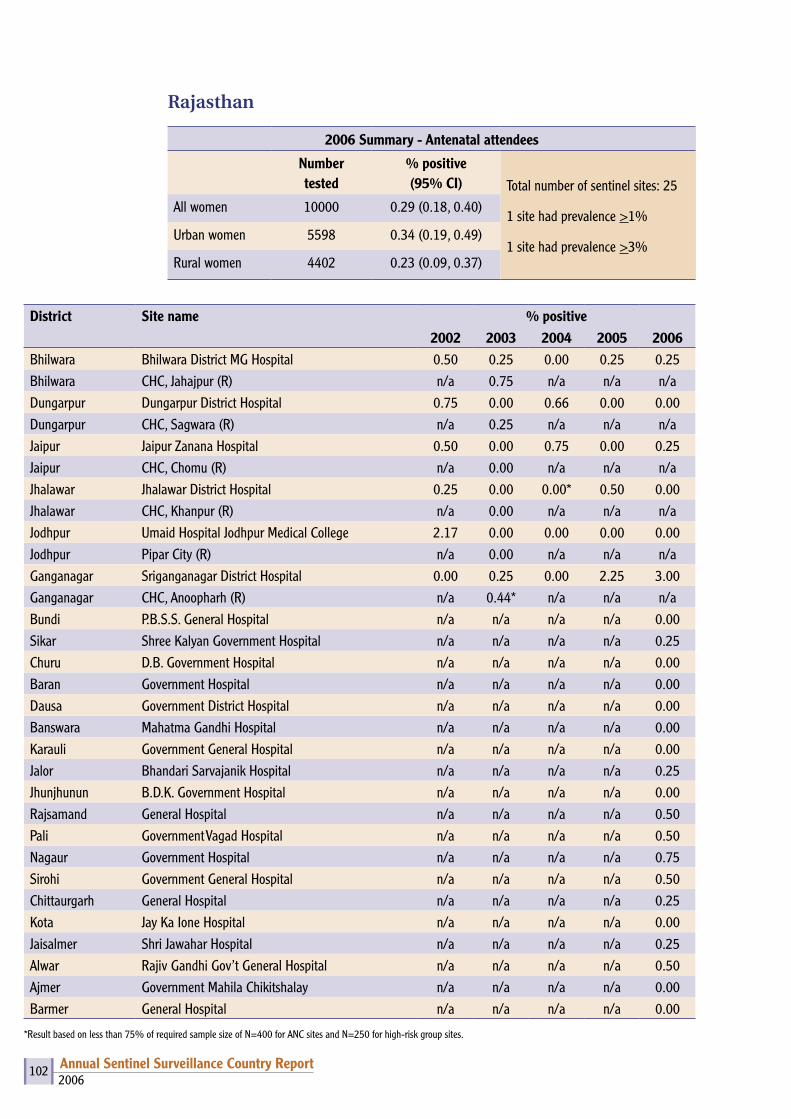
2006Annual Sentinel Surveillance Country Report 102
Rajasthan
2006 Summary - Antenatal attendees
Numbertested
% positive (95% CI) Total number of sentinel sites: 25
1 site had prevalence >1%
1 site had prevalence >3%
All women 10000 0.29 (0.18, 0.40)
Urban women 5598 0.34 (0.19, 0.49)
Rural women 4402 0.23 (0.09, 0.37)
District Site name % positive2002 2003 2004 2005 2006
Bhilwara Bhilwara District MG Hospital 0.50 0.25 0.00 0.25 0.25Bhilwara CHC, Jahajpur (R) n/a 0.75 n/a n/a n/aDungarpur Dungarpur District Hospital 0.75 0.00 0.66 0.00 0.00Dungarpur CHC, Sagwara (R) n/a 0.25 n/a n/a n/aJaipur Jaipur Zanana Hospital 0.50 0.00 0.75 0.00 0.25Jaipur CHC, Chomu (R) n/a 0.00 n/a n/a n/aJhalawar Jhalawar District Hospital 0.25 0.00 0.00* 0.50 0.00Jhalawar CHC, Khanpur (R) n/a 0.00 n/a n/a n/aJodhpur Umaid Hospital Jodhpur Medical College 2.17 0.00 0.00 0.00 0.00Jodhpur Pipar City (R) n/a 0.00 n/a n/a n/aGanganagar Sriganganagar District Hospital 0.00 0.25 0.00 2.25 3.00Ganganagar CHC, Anoopharh (R) n/a 0.44* n/a n/a n/aBundi P.B.S.S. General Hospital n/a n/a n/a n/a 0.00Sikar Shree Kalyan Government Hospital n/a n/a n/a n/a 0.25Churu D.B. Government Hospital n/a n/a n/a n/a 0.00Baran Government Hospital n/a n/a n/a n/a 0.00Dausa Government District Hospital n/a n/a n/a n/a 0.00Banswara Mahatma Gandhi Hospital n/a n/a n/a n/a 0.00Karauli Government General Hospital n/a n/a n/a n/a 0.00Jalor Bhandari Sarvajanik Hospital n/a n/a n/a n/a 0.25Jhunjhunun B.D.K. Government Hospital n/a n/a n/a n/a 0.00Rajsamand General Hospital n/a n/a n/a n/a 0.50Pali Government Vagad Hospital n/a n/a n/a n/a 0.50Nagaur Government Hospital n/a n/a n/a n/a 0.75Sirohi Government General Hospital n/a n/a n/a n/a 0.50Chittaurgarh General Hospital n/a n/a n/a n/a 0.25Kota Jay Ka Ione Hospital n/a n/a n/a n/a 0.00Jaisalmer Shri Jawahar Hospital n/a n/a n/a n/a 0.25Alwar Rajiv Gandhi Gov’t General Hospital n/a n/a n/a n/a 0.50Ajmer Government Mahila Chikitshalay n/a n/a n/a n/a 0.00Barmer General Hospital n/a n/a n/a n/a 0.00
*Result based on less than 75% of required sample size of N=400 for ANC sites and N=250 for high-risk group sites.
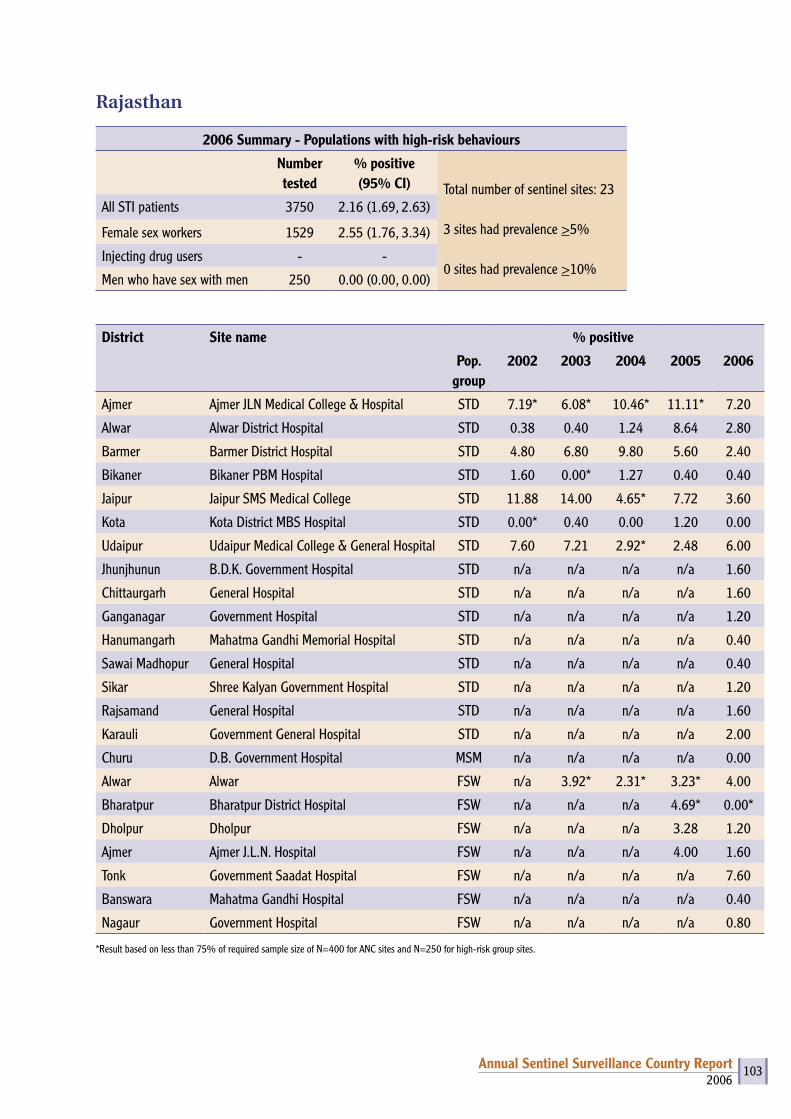
2006Annual Sentinel Surveillance Country Report 103
Rajasthan
2006 Summary - Populations with high-risk behaviours
Number tested
% positive(95% CI) Total number of sentinel sites: 23
3 sites had prevalence >5%
0 sites had prevalence >10%
All STI patients 3750 2.16 (1.69, 2.63)
Female sex workers 1529 2.55 (1.76, 3.34)
Injecting drug users - -
Men who have sex with men 250 0.00 (0.00, 0.00)
District Site name % positive
Pop. group
2002 2003 2004 2005 2006
Ajmer Ajmer JLN Medical College & Hospital STD 7.19* 6.08* 10.46* 11.11* 7.20
Alwar Alwar District Hospital STD 0.38 0.40 1.24 8.64 2.80
Barmer Barmer District Hospital STD 4.80 6.80 9.80 5.60 2.40
Bikaner Bikaner PBM Hospital STD 1.60 0.00* 1.27 0.40 0.40
Jaipur Jaipur SMS Medical College STD 11.88 14.00 4.65* 7.72 3.60
Kota Kota District MBS Hospital STD 0.00* 0.40 0.00 1.20 0.00
Udaipur Udaipur Medical College & General Hospital STD 7.60 7.21 2.92* 2.48 6.00
Jhunjhunun B.D.K. Government Hospital STD n/a n/a n/a n/a 1.60
Chittaurgarh General Hospital STD n/a n/a n/a n/a 1.60
Ganganagar Government Hospital STD n/a n/a n/a n/a 1.20
Hanumangarh Mahatma Gandhi Memorial Hospital STD n/a n/a n/a n/a 0.40
Sawai Madhopur General Hospital STD n/a n/a n/a n/a 0.40
Sikar Shree Kalyan Government Hospital STD n/a n/a n/a n/a 1.20
Rajsamand General Hospital STD n/a n/a n/a n/a 1.60
Karauli Government General Hospital STD n/a n/a n/a n/a 2.00
Churu D.B. Government Hospital MSM n/a n/a n/a n/a 0.00
Alwar Alwar FSW n/a 3.92* 2.31* 3.23* 4.00
Bharatpur Bharatpur District Hospital FSW n/a n/a n/a 4.69* 0.00*
Dholpur Dholpur FSW n/a n/a n/a 3.28 1.20
Ajmer Ajmer J.L.N. Hospital FSW n/a n/a n/a 4.00 1.60
Tonk Government Saadat Hospital FSW n/a n/a n/a n/a 7.60
Banswara Mahatma Gandhi Hospital FSW n/a n/a n/a n/a 0.40
Nagaur Government Hospital FSW n/a n/a n/a n/a 0.80
*Result based on less than 75% of required sample size of N=400 for ANC sites and N=250 for high-risk group sites.
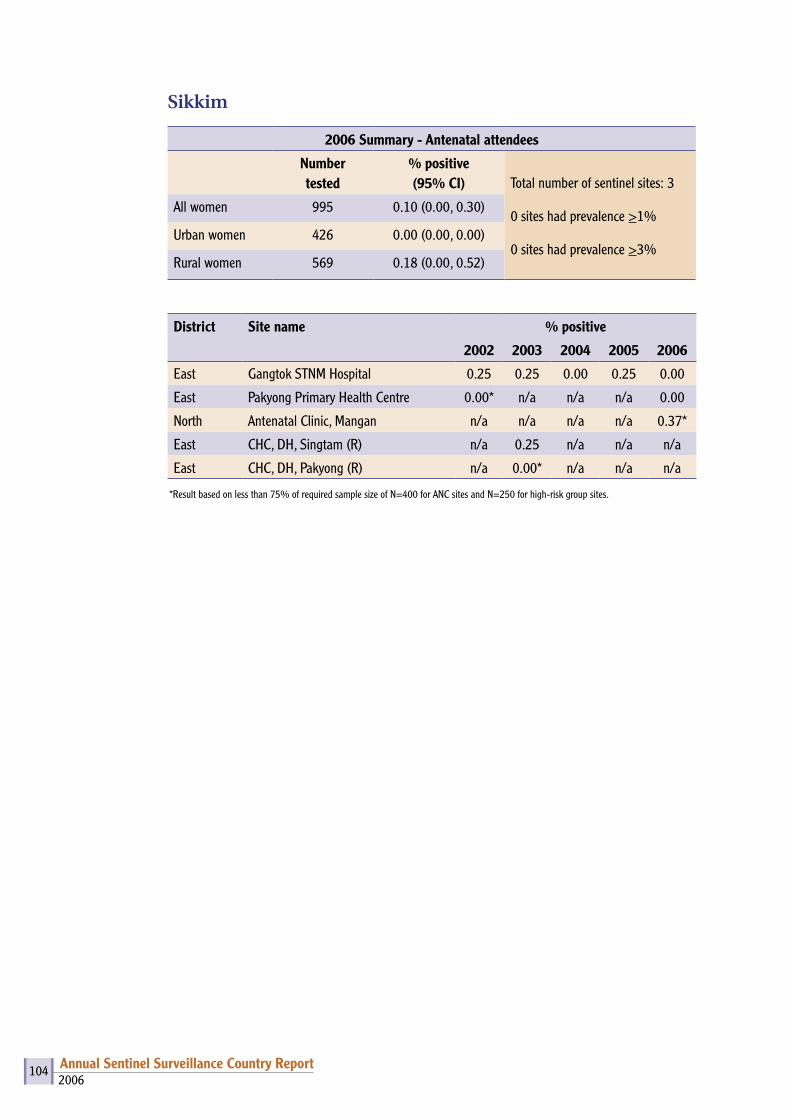
2006Annual Sentinel Surveillance Country Report 104
Sikkim
2006 Summary - Antenatal attendees
Number tested
% positive (95% CI) Total number of sentinel sites: 3
0 sites had prevalence >1%
0 sites had prevalence >3%
All women 995 0.10 (0.00, 0.30)
Urban women 426 0.00 (0.00, 0.00)
Rural women 569 0.18 (0.00, 0.52)
District Site name % positive
2002 2003 2004 2005 2006
East Gangtok STNM Hospital 0.25 0.25 0.00 0.25 0.00
East Pakyong Primary Health Centre 0.00* n/a n/a n/a 0.00
North Antenatal Clinic, Mangan n/a n/a n/a n/a 0.37*
East CHC, DH, Singtam (R) n/a 0.25 n/a n/a n/a
East CHC, DH, Pakyong (R) n/a 0.00* n/a n/a n/a
*Result based on less than 75% of required sample size of N=400 for ANC sites and N=250 for high-risk group sites.

2006Annual Sentinel Surveillance Country Report 105
Sikkim
2006 Summary - Populations with high-risk behaviours
Number tested
% positive(95% CI) Total number of sentinel sites: 3
0 sites had prevalence >5%
0 sites had prevalence >10%
All STI patients 100 0.00 (0.00, 0.00)
Female sex workers - -
Injecting drug users 500 0.20 (0.00, 0.59)
Men who have sex with men - -
District Site name % positive
Pop. group 2002 2003 2004 2005 2006
East Gangtok STNM Hospital STD 0.00* 0.00* 0.00* 0.86* 0.00*
East Gangtok, East Sikkim IDU n/a n/a n/a 0.48 0.40
South Hope Centre, Namchi IDU n/a n/a n/a n/a 0.00
*Result based on less than 75% of required sample size of N=400 for ANC sites and N=250 for high-risk group sites.

2006Annual Sentinel Surveillance Country Report 106
Tamil Nadu
2006 Summary - Antenatal attendees
Number tested
% positive (95% CI) Total number of sentinel sites: 64
13 sites had prevalence >1%
2 sites had prevalence >3%
All women 25602 0.54 (0.45, 0.63)
Urban women 7781 0.40 (0.26, 0.54)
Rural women 17821 0.61 (0.49, 0.72)
District Site name % positive2002 2003 2004 2005 2006
Ariyalur Ariyalur n/a 1.25 n/a n/a n/aChennai Chennai Institute of Obstetrics & Gynaecology 0.50 0.00 0.00 0.50 0.25Chennai St. Isabels Hospital n/a n/a 0.25 0.00 0.00Cuddalore Government Distt. Headquarters Hospital 0.25 0.25 0.50 0.25 0.00Cuddalore GH, Panruti (R) n/a 1.00 1.00 1.00 0.00Coimbatore Government Medical College Hospital 0.50 0.75 0.50 0.75 1.00Coimbatore Sheila Hospital n/a n/a 0.75 n/a 0.00Coimbatore GH, Pollachi (R) n/a 0.50 0.75 0.00 0.75Coimbatore Sheila Hospital (R) n/a n/a n/a 0.25 n/aDharmapuri Government Distt. Headquarters Hospital n/a n/a 1.25 0.75 0.50Dharmapuri ANC Krishnagiri n/a 1.50 1.00 1.00 1.00Dharmapuri ANC FRU Hosur (Krishnagiri) (R) n/a 1.25 0.58* 0.50 1.25Dharmapuri FRU Harur (R) n/a n/a 0.50 0.25 0.25Dindigul Government Distt. Headquarters Hospital 0.75 1.25 0.75 0.25 0.25Dindigul GH, Palani (R) n/a 0.25 0.75 0.75 0.50Erode Government Distt. Headquarters Hospital n/a 0.00 0.50 1.00 0.75Erode GH, Gobichettipalayam (R) n/a 0.25 0.50 0.25 0.75Kanchipuram Government Distt. Headquarters Hospital n/a 0.25 0.00 0.00 0.00Kanchipuram GH, Maduranthangam (R) n/a 0.25 0.75 0.00 0.00Kanyakumari Government Medical College Hospital, Nagercoil n/a 0.00 1.00 0.00 0.00Kanyakumari Jeyasekaran Hospital, Nagercoil n/a n/a 0.00 0.00 0.00Kanyakumari Government Hospital, Padmanabapuram (R) n/a n/a 0.50 0.00 0.25Karur Government Distt. Headquarters Hospital n/a 1.00 2.75 2.00 1.25Karur GH, Kulithali (R) n/a 0.50 3.25 0.25 0.50Madurai Government Madurai Medical College Rajaji Hospital 1.00 0.75 0.25 1.50 0.25Madurai GH, Melur (R) n/a 1.26 3.70* 1.00 0.25Nagapattinam Government Distt. Headquarters Hospital n/a 0.25 0.50 0.00 0.00Nagapattinam Arthur Hospital n/a n/a n/a n/a 0.25Nagapattinam Government Hospital, Mayiladuthurai (R) n/a n/a 0.50 0.00 0.50Nagapattinam Arthur Hospital (R) n/a n/a n/a 0.00 n/aNamakkal Government Distt. Headquarters Hospital 4.01 5.76 2.50 3.50 3.00
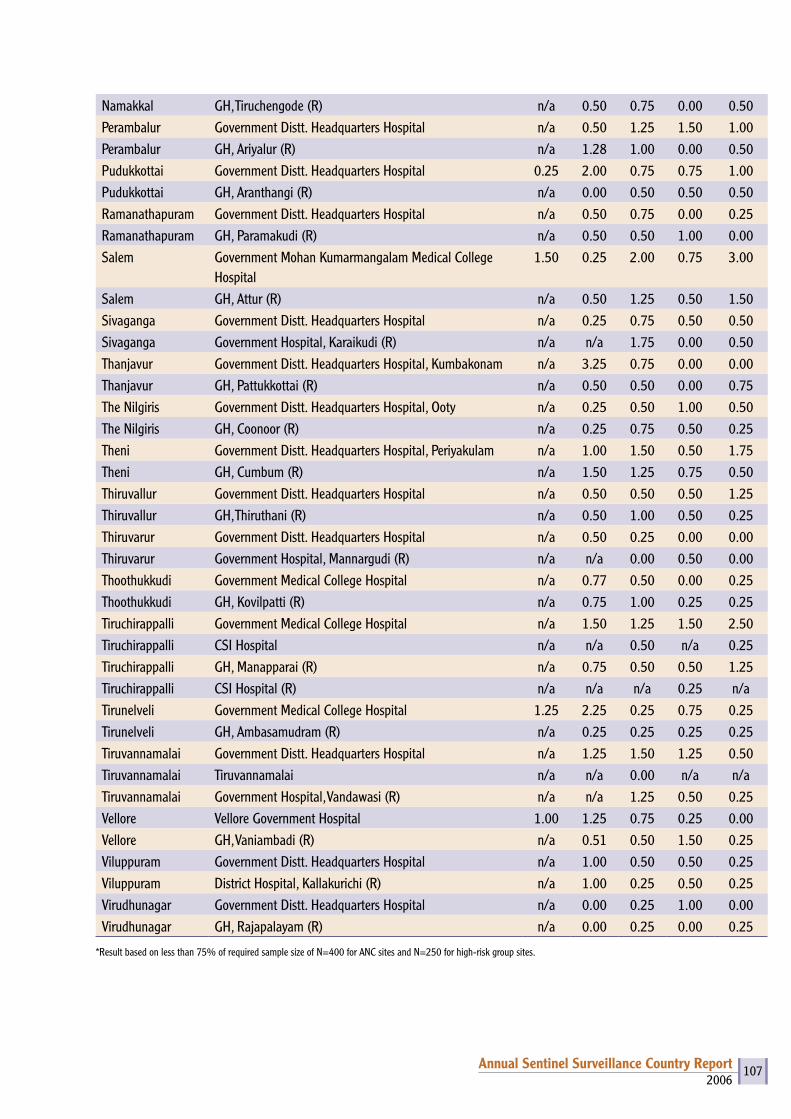
2006Annual Sentinel Surveillance Country Report 107
Namakkal GH, Tiruchengode (R) n/a 0.50 0.75 0.00 0.50Perambalur Government Distt. Headquarters Hospital n/a 0.50 1.25 1.50 1.00Perambalur GH, Ariyalur (R) n/a 1.28 1.00 0.00 0.50Pudukkottai Government Distt. Headquarters Hospital 0.25 2.00 0.75 0.75 1.00Pudukkottai GH, Aranthangi (R) n/a 0.00 0.50 0.50 0.50Ramanathapuram Government Distt. Headquarters Hospital n/a 0.50 0.75 0.00 0.25Ramanathapuram GH, Paramakudi (R) n/a 0.50 0.50 1.00 0.00Salem Government Mohan Kumarmangalam Medical College
Hospital1.50 0.25 2.00 0.75 3.00
Salem GH, Attur (R) n/a 0.50 1.25 0.50 1.50Sivaganga Government Distt. Headquarters Hospital n/a 0.25 0.75 0.50 0.50Sivaganga Government Hospital, Karaikudi (R) n/a n/a 1.75 0.00 0.50Thanjavur Government Distt. Headquarters Hospital, Kumbakonam n/a 3.25 0.75 0.00 0.00Thanjavur GH, Pattukkottai (R) n/a 0.50 0.50 0.00 0.75The Nilgiris Government Distt. Headquarters Hospital, Ooty n/a 0.25 0.50 1.00 0.50The Nilgiris GH, Coonoor (R) n/a 0.25 0.75 0.50 0.25Theni Government Distt. Headquarters Hospital, Periyakulam n/a 1.00 1.50 0.50 1.75Theni GH, Cumbum (R) n/a 1.50 1.25 0.75 0.50Thiruvallur Government Distt. Headquarters Hospital n/a 0.50 0.50 0.50 1.25Thiruvallur GH, Thiruthani (R) n/a 0.50 1.00 0.50 0.25Thiruvarur Government Distt. Headquarters Hospital n/a 0.50 0.25 0.00 0.00Thiruvarur Government Hospital, Mannargudi (R) n/a n/a 0.00 0.50 0.00Thoothukkudi Government Medical College Hospital n/a 0.77 0.50 0.00 0.25Thoothukkudi GH, Kovilpatti (R) n/a 0.75 1.00 0.25 0.25Tiruchirappalli Government Medical College Hospital n/a 1.50 1.25 1.50 2.50Tiruchirappalli CSI Hospital n/a n/a 0.50 n/a 0.25Tiruchirappalli GH, Manapparai (R) n/a 0.75 0.50 0.50 1.25Tiruchirappalli CSI Hospital (R) n/a n/a n/a 0.25 n/aTirunelveli Government Medical College Hospital 1.25 2.25 0.25 0.75 0.25Tirunelveli GH, Ambasamudram (R) n/a 0.25 0.25 0.25 0.25Tiruvannamalai Government Distt. Headquarters Hospital n/a 1.25 1.50 1.25 0.50Tiruvannamalai Tiruvannamalai n/a n/a 0.00 n/a n/aTiruvannamalai Government Hospital, Vandawasi (R) n/a n/a 1.25 0.50 0.25Vellore Vellore Government Hospital 1.00 1.25 0.75 0.25 0.00Vellore GH, Vaniambadi (R) n/a 0.51 0.50 1.50 0.25Viluppuram Government Distt. Headquarters Hospital n/a 1.00 0.50 0.50 0.25Viluppuram District Hospital, Kallakurichi (R) n/a 1.00 0.25 0.50 0.25Virudhunagar Government Distt. Headquarters Hospital n/a 0.00 0.25 1.00 0.00Virudhunagar GH, Rajapalayam (R) n/a 0.00 0.25 0.00 0.25
*Result based on less than 75% of required sample size of N=400 for ANC sites and N=250 for high-risk group sites.
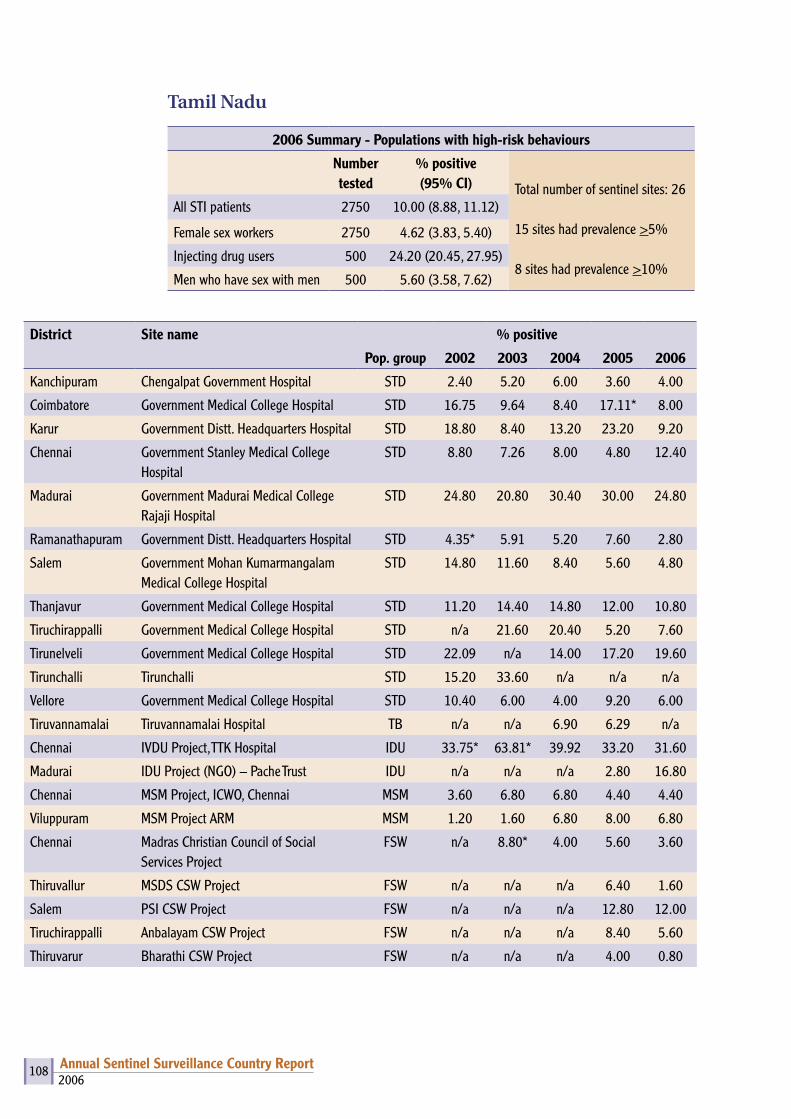
2006Annual Sentinel Surveillance Country Report 108
Tamil Nadu
2006 Summary - Populations with high-risk behaviours
Number tested
% positive(95% CI) Total number of sentinel sites: 26
15 sites had prevalence >5%
8 sites had prevalence >10%
All STI patients 2750 10.00 (8.88, 11.12)
Female sex workers 2750 4.62 (3.83, 5.40)
Injecting drug users 500 24.20 (20.45, 27.95)
Men who have sex with men 500 5.60 (3.58, 7.62)
District Site name % positive
Pop. group 2002 2003 2004 2005 2006
Kanchipuram Chengalpat Government Hospital STD 2.40 5.20 6.00 3.60 4.00
Coimbatore Government Medical College Hospital STD 16.75 9.64 8.40 17.11* 8.00
Karur Government Distt. Headquarters Hospital STD 18.80 8.40 13.20 23.20 9.20
Chennai Government Stanley Medical College Hospital
STD 8.80 7.26 8.00 4.80 12.40
Madurai Government Madurai Medical College Rajaji Hospital
STD 24.80 20.80 30.40 30.00 24.80
Ramanathapuram Government Distt. Headquarters Hospital STD 4.35* 5.91 5.20 7.60 2.80
Salem Government Mohan Kumarmangalam Medical College Hospital
STD 14.80 11.60 8.40 5.60 4.80
Thanjavur Government Medical College Hospital STD 11.20 14.40 14.80 12.00 10.80
Tiruchirappalli Government Medical College Hospital STD n/a 21.60 20.40 5.20 7.60
Tirunelveli Government Medical College Hospital STD 22.09 n/a 14.00 17.20 19.60
Tirunchalli Tirunchalli STD 15.20 33.60 n/a n/a n/a
Vellore Government Medical College Hospital STD 10.40 6.00 4.00 9.20 6.00
Tiruvannamalai Tiruvannamalai Hospital TB n/a n/a 6.90 6.29 n/a
Chennai IVDU Project, TTK Hospital IDU 33.75* 63.81* 39.92 33.20 31.60
Madurai IDU Project (NGO) – Pache Trust IDU n/a n/a n/a 2.80 16.80
Chennai MSM Project, ICWO, Chennai MSM 3.60 6.80 6.80 4.40 4.40
Viluppuram MSM Project ARM MSM 1.20 1.60 6.80 8.00 6.80
Chennai Madras Christian Council of Social Services Project
FSW n/a 8.80* 4.00 5.60 3.60
Thiruvallur MSDS CSW Project FSW n/a n/a n/a 6.40 1.60
Salem PSI CSW Project FSW n/a n/a n/a 12.80 12.00
Tiruchirappalli Anbalayam CSW Project FSW n/a n/a n/a 8.40 5.60
Thiruvarur Bharathi CSW Project FSW n/a n/a n/a 4.00 0.80

2006Annual Sentinel Surveillance Country Report 109
Madurai Merry Trust CSW Project FSW n/a n/a n/a 3.60 5.60
Theni Green Medic Trust CSW Project FSW n/a n/a n/a 4.80 2.00
Virudhunagar Annai Orphanage FSW FSW n/a n/a n/a 1.20 4.40
Tirunelveli CAST CSW Project FSW n/a n/a n/a 2.80 0.80
Kanniyakumari CSR FSW FSW n/a n/a n/a 2.00 0.40
Dharmapuri Arcod CSW Project FSW n/a n/a n/a 8.80 14.00
*Result based on less than 75% of required sample size of N=400 for ANC sites and N=250 for high-risk group sites.
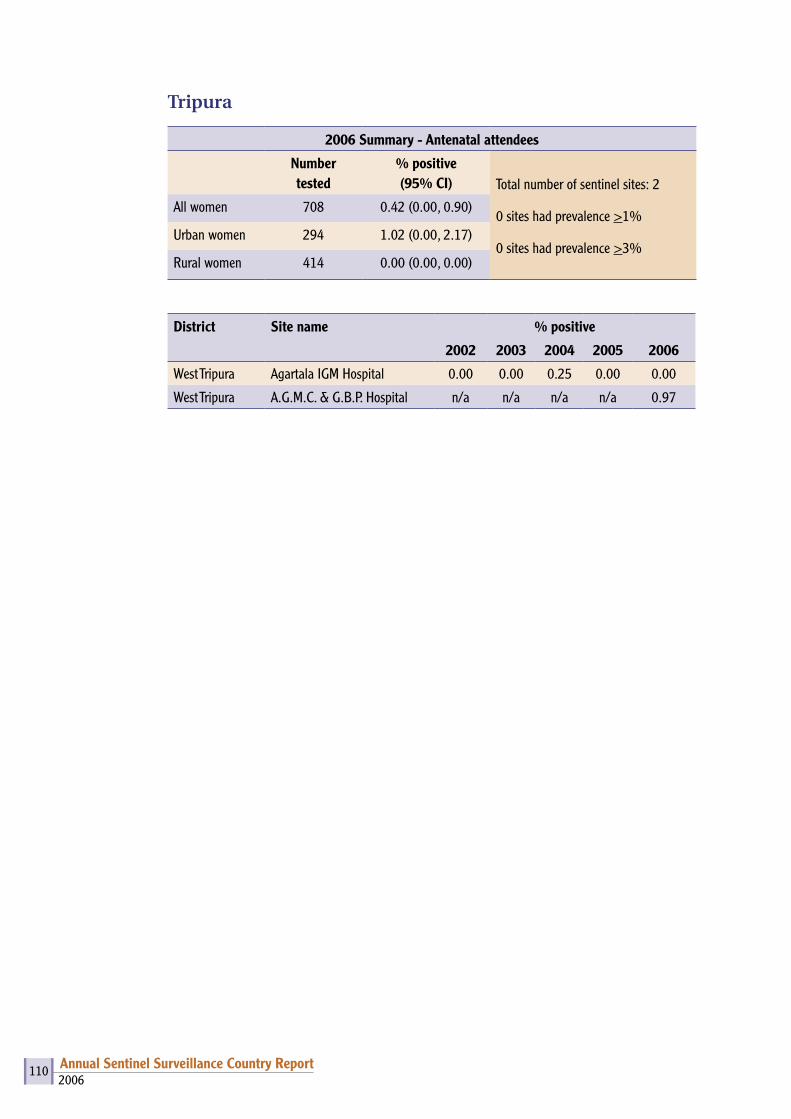
2006Annual Sentinel Surveillance Country Report 110
Tripura
2006 Summary - Antenatal attendees
Number tested
% positive (95% CI) Total number of sentinel sites: 2
0 sites had prevalence >1%
0 sites had prevalence >3%
All women 708 0.42 (0.00, 0.90)
Urban women 294 1.02 (0.00, 2.17)
Rural women 414 0.00 (0.00, 0.00)
District Site name % positive
2002 2003 2004 2005 2006
West Tripura Agartala IGM Hospital 0.00 0.00 0.25 0.00 0.00
West Tripura A.G.M.C. & G.B.P. Hospital n/a n/a n/a n/a 0.97
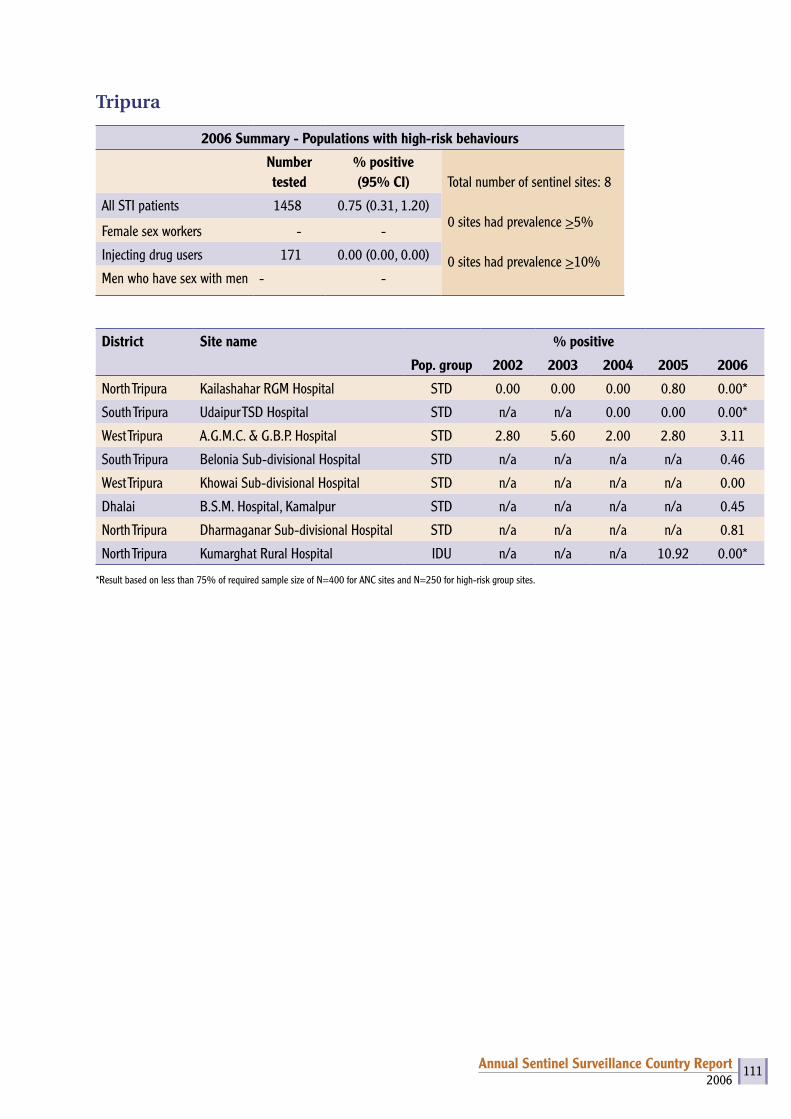
2006Annual Sentinel Surveillance Country Report 111
Tripura
2006 Summary - Populations with high-risk behaviours
Number tested
% positive(95% CI) Total number of sentinel sites: 8
0 sites had prevalence >5%
0 sites had prevalence >10%
All STI patients 1458 0.75 (0.31, 1.20)
Female sex workers - -
Injecting drug users 171 0.00 (0.00, 0.00)
Men who have sex with men - -
District Site name % positive
Pop. group 2002 2003 2004 2005 2006
North Tripura Kailashahar RGM Hospital STD 0.00 0.00 0.00 0.80 0.00*
South Tripura Udaipur TSD Hospital STD n/a n/a 0.00 0.00 0.00*
West Tripura A.G.M.C. & G.B.P. Hospital STD 2.80 5.60 2.00 2.80 3.11
South Tripura Belonia Sub-divisional Hospital STD n/a n/a n/a n/a 0.46
West Tripura Khowai Sub-divisional Hospital STD n/a n/a n/a n/a 0.00
Dhalai B.S.M. Hospital, Kamalpur STD n/a n/a n/a n/a 0.45
North Tripura Dharmaganar Sub-divisional Hospital STD n/a n/a n/a n/a 0.81
North Tripura Kumarghat Rural Hospital IDU n/a n/a n/a 10.92 0.00*
*Result based on less than 75% of required sample size of N=400 for ANC sites and N=250 for high-risk group sites.

2006Annual Sentinel Surveillance Country Report 112
Uttar Pradesh
2006 Summary - Antenatal attendees
Number tested
% positive (95% CI) Total number of sentinel sites: 62
3 sites had prevalence >1%
0 site had prevalence >3%
All women 18738 0.25 (0.18, 0.32)
Urban women 8457 0.13 (0.05, 0.21)
Rural women 10281 0.35 (0.24, 0.46)
District Site name % positive2002 2003 2004 2005 2006
Aligarh Aligarh Mahila Hospital 0.00 0.00 0.25 0.00 0.00Aligarh MH n/a 0.00* n/a n/a n/aAllahabad CHC, Handia (R) n/a n/a n/a n/a 1.50Bahraich Bahraich Mahila Hospital 0.00 0.00 0.50 0.37* 0.75Bahraich CHC, Nanara (R) n/a 0.00* n/a n/a 0.00*Ballia Ballia Mahila Hospital 0.25 0.00 0.53 0.00 0.00*Ballia CHC, Sikandarpur (R) n/a n/a n/a n/a 0.00Ballia CHC, IMS (R) n/a 0.00 n/a n/a n/aBanda Banda Mahila Hospital 0.00 0.00 1.75 0.00 0.00Barabanki Barabanki Mahila Hospital 0.25 0.00 0.75 0.00 0.50Barabanki CHC, Haidergarh (R) n/a n/a n/a n/a 0.00*Barabanki CHC, KGMU, Fatehpur (R) n/a 0.00* n/a n/a n/aBijnor Bijnor Mahila Hospital n/a 0.00 0.00 0.00 0.00Bijnor Najibabad/Najibabad CHC Hospital (R) n/a n/a n/a n/a 0.00Budaun CHC, Ujhani (R) n/a n/a n/a n/a 0.00*Etawah Etawah Mahila Hospital 3.00 0.00 1.25 0.25 0.00Gonda CHC, Mankapur (R) n/a n/a n/a n/a 0.95Gorakhpur Gorakhpur Mahila Hospital 0.25 0.00 0.75 0.00 0.25Gorakhpur CHC, Pipriach (R) n/a 2.90* n/a n/a 0.00*Hardoi CHC, Sandila (R) n/a n/a n/a n/a 0.00*Jaunpur Jaunpur Mahila Hospital 0.75 0.25 0.25 0.00 0.25Jaunpur CHC, Madiyaon (R) n/a n/a n/a n/a 0.00*Jaunpur CHC, IMS (R) n/a 4.26* n/a n/a n/aKanpur CH, Bidhoo (R) n/a 0.30 n/a n/a n/aKanpur Nagar Kanpur Medical College 0.00* 0.25 0.25 0.25 0.25Lalitpur Lalitpur Mahila Hospital 0.51 1.0 0.00 0.25 0.00Lalitpur Jhansi (R) n/a 0.00 n/a n/a n/aLucknow Lucknow Queens Mary Hospital 0.00 0.00 0.50 0.25 0.50Lucknow CHC, Mohanlalganj (R) n/a n/a n/a n/a 0.00*Lucknow Chinhat (R) n/a 0.00* n/a n/a n/aMirzapur Mirzapur Mahila Hospital 0.75 0.75 0.00 0.25 0.00
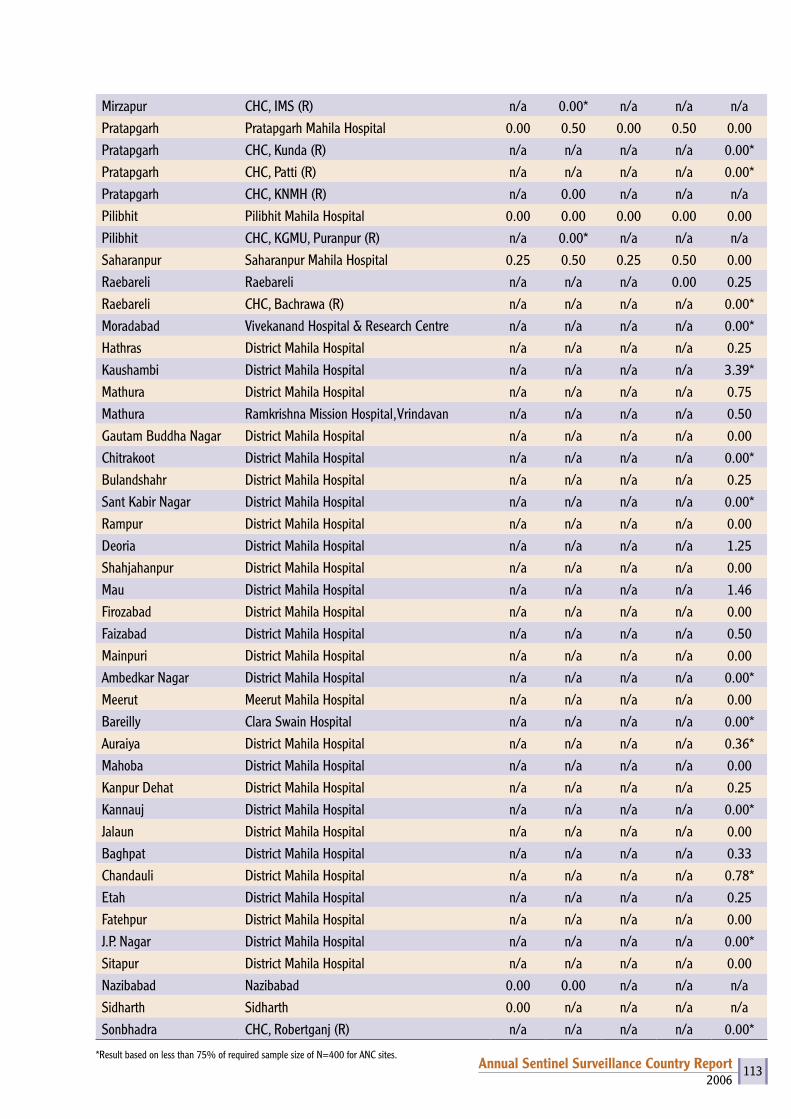
2006Annual Sentinel Surveillance Country Report 113
Mirzapur CHC, IMS (R) n/a 0.00* n/a n/a n/aPratapgarh Pratapgarh Mahila Hospital 0.00 0.50 0.00 0.50 0.00Pratapgarh CHC, Kunda (R) n/a n/a n/a n/a 0.00*Pratapgarh CHC, Patti (R) n/a n/a n/a n/a 0.00*Pratapgarh CHC, KNMH (R) n/a 0.00 n/a n/a n/aPilibhit Pilibhit Mahila Hospital 0.00 0.00 0.00 0.00 0.00Pilibhit CHC, KGMU, Puranpur (R) n/a 0.00* n/a n/a n/aSaharanpur Saharanpur Mahila Hospital 0.25 0.50 0.25 0.50 0.00Raebareli Raebareli n/a n/a n/a 0.00 0.25Raebareli CHC, Bachrawa (R) n/a n/a n/a n/a 0.00*Moradabad Vivekanand Hospital & Research Centre n/a n/a n/a n/a 0.00*Hathras District Mahila Hospital n/a n/a n/a n/a 0.25Kaushambi District Mahila Hospital n/a n/a n/a n/a 3.39*Mathura District Mahila Hospital n/a n/a n/a n/a 0.75Mathura Ramkrishna Mission Hospital, Vrindavan n/a n/a n/a n/a 0.50Gautam Buddha Nagar District Mahila Hospital n/a n/a n/a n/a 0.00Chitrakoot District Mahila Hospital n/a n/a n/a n/a 0.00*Bulandshahr District Mahila Hospital n/a n/a n/a n/a 0.25Sant Kabir Nagar District Mahila Hospital n/a n/a n/a n/a 0.00*Rampur District Mahila Hospital n/a n/a n/a n/a 0.00Deoria District Mahila Hospital n/a n/a n/a n/a 1.25Shahjahanpur District Mahila Hospital n/a n/a n/a n/a 0.00Mau District Mahila Hospital n/a n/a n/a n/a 1.46Firozabad District Mahila Hospital n/a n/a n/a n/a 0.00Faizabad District Mahila Hospital n/a n/a n/a n/a 0.50Mainpuri District Mahila Hospital n/a n/a n/a n/a 0.00Ambedkar Nagar District Mahila Hospital n/a n/a n/a n/a 0.00*Meerut Meerut Mahila Hospital n/a n/a n/a n/a 0.00Bareilly Clara Swain Hospital n/a n/a n/a n/a 0.00*Auraiya District Mahila Hospital n/a n/a n/a n/a 0.36*Mahoba District Mahila Hospital n/a n/a n/a n/a 0.00Kanpur Dehat District Mahila Hospital n/a n/a n/a n/a 0.25Kannauj District Mahila Hospital n/a n/a n/a n/a 0.00*Jalaun District Mahila Hospital n/a n/a n/a n/a 0.00Baghpat District Mahila Hospital n/a n/a n/a n/a 0.33Chandauli District Mahila Hospital n/a n/a n/a n/a 0.78*Etah District Mahila Hospital n/a n/a n/a n/a 0.25Fatehpur District Mahila Hospital n/a n/a n/a n/a 0.00J.P. Nagar District Mahila Hospital n/a n/a n/a n/a 0.00*Sitapur District Mahila Hospital n/a n/a n/a n/a 0.00Nazibabad Nazibabad 0.00 0.00 n/a n/a n/aSidharth Sidharth 0.00 n/a n/a n/a n/aSonbhadra CHC, Robertganj (R) n/a n/a n/a n/a 0.00*
*Result based on less than 75% of required sample size of N=400 for ANC sites.
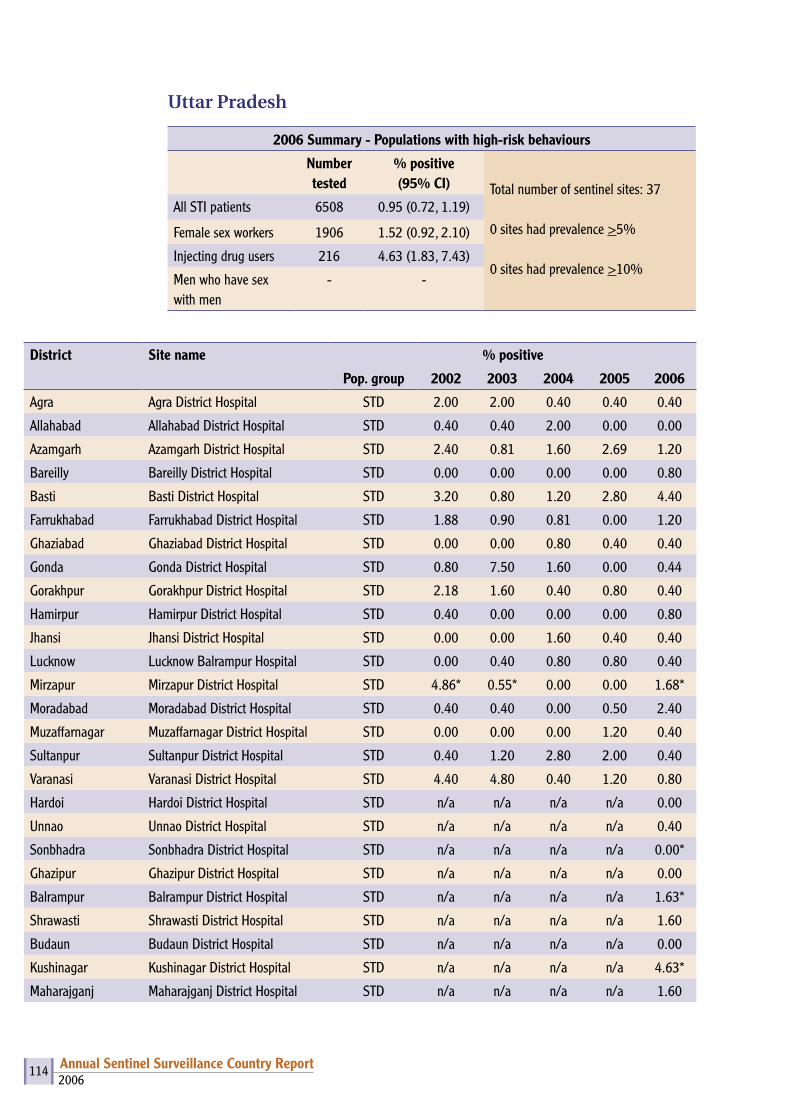
2006Annual Sentinel Surveillance Country Report 114
Uttar Pradesh
2006 Summary - Populations with high-risk behaviours
Number tested
% positive(95% CI) Total number of sentinel sites: 37
0 sites had prevalence >5%
0 sites had prevalence >10%
All STI patients 6508 0.95 (0.72, 1.19)
Female sex workers 1906 1.52 (0.92, 2.10)
Injecting drug users 216 4.63 (1.83, 7.43)
Men who have sex with men
- -
District Site name % positive
Pop. group 2002 2003 2004 2005 2006
Agra Agra District Hospital STD 2.00 2.00 0.40 0.40 0.40
Allahabad Allahabad District Hospital STD 0.40 0.40 2.00 0.00 0.00
Azamgarh Azamgarh District Hospital STD 2.40 0.81 1.60 2.69 1.20
Bareilly Bareilly District Hospital STD 0.00 0.00 0.00 0.00 0.80
Basti Basti District Hospital STD 3.20 0.80 1.20 2.80 4.40
Farrukhabad Farrukhabad District Hospital STD 1.88 0.90 0.81 0.00 1.20
Ghaziabad Ghaziabad District Hospital STD 0.00 0.00 0.80 0.40 0.40
Gonda Gonda District Hospital STD 0.80 7.50 1.60 0.00 0.44
Gorakhpur Gorakhpur District Hospital STD 2.18 1.60 0.40 0.80 0.40
Hamirpur Hamirpur District Hospital STD 0.40 0.00 0.00 0.00 0.80
Jhansi Jhansi District Hospital STD 0.00 0.00 1.60 0.40 0.40
Lucknow Lucknow Balrampur Hospital STD 0.00 0.40 0.80 0.80 0.40
Mirzapur Mirzapur District Hospital STD 4.86* 0.55* 0.00 0.00 1.68*
Moradabad Moradabad District Hospital STD 0.40 0.40 0.00 0.50 2.40
Muzaffarnagar Muzaffarnagar District Hospital STD 0.00 0.00 0.00 1.20 0.40
Sultanpur Sultanpur District Hospital STD 0.40 1.20 2.80 2.00 0.40
Varanasi Varanasi District Hospital STD 4.40 4.80 0.40 1.20 0.80
Hardoi Hardoi District Hospital STD n/a n/a n/a n/a 0.00
Unnao Unnao District Hospital STD n/a n/a n/a n/a 0.40
Sonbhadra Sonbhadra District Hospital STD n/a n/a n/a n/a 0.00*
Ghazipur Ghazipur District Hospital STD n/a n/a n/a n/a 0.00
Balrampur Balrampur District Hospital STD n/a n/a n/a n/a 1.63*
Shrawasti Shrawasti District Hospital STD n/a n/a n/a n/a 1.60
Budaun Budaun District Hospital STD n/a n/a n/a n/a 0.00
Kushinagar Kushinagar District Hospital STD n/a n/a n/a n/a 4.63*
Maharajganj Maharajganj District Hospital STD n/a n/a n/a n/a 1.60
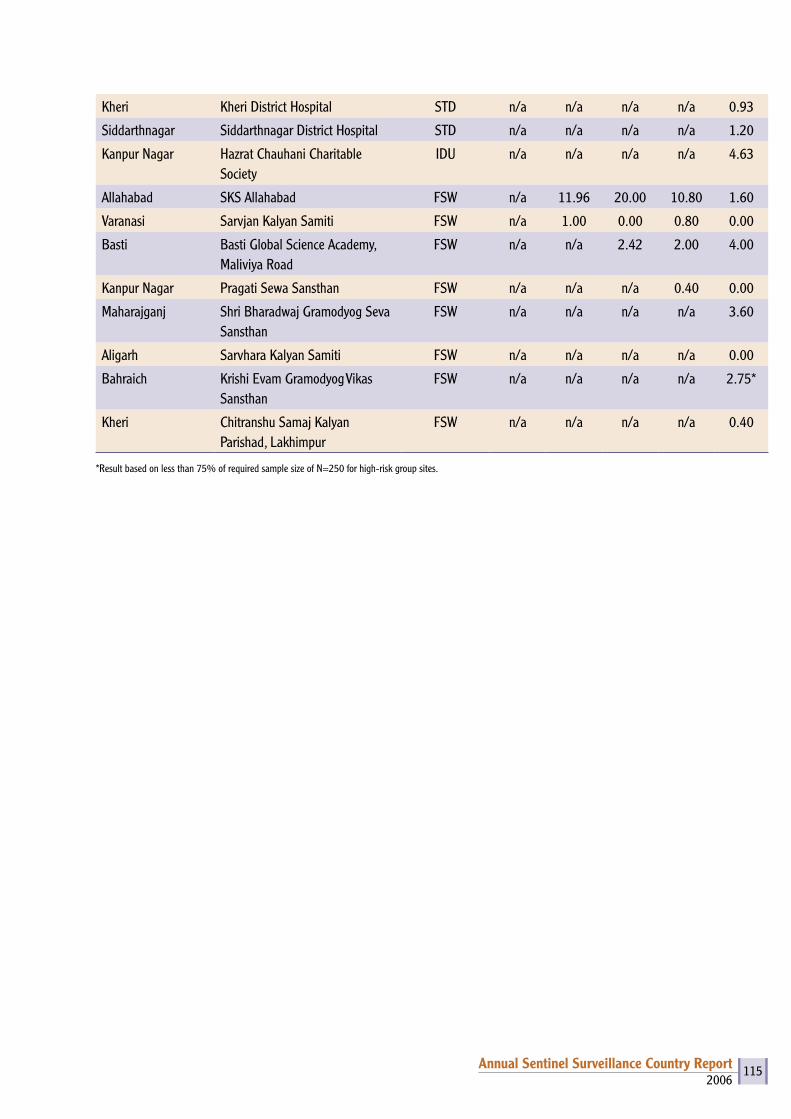
2006Annual Sentinel Surveillance Country Report 115
Kheri Kheri District Hospital STD n/a n/a n/a n/a 0.93
Siddarthnagar Siddarthnagar District Hospital STD n/a n/a n/a n/a 1.20
Kanpur Nagar Hazrat Chauhani Charitable Society
IDU n/a n/a n/a n/a 4.63
Allahabad SKS Allahabad FSW n/a 11.96 20.00 10.80 1.60
Varanasi Sarvjan Kalyan Samiti FSW n/a 1.00 0.00 0.80 0.00
Basti Basti Global Science Academy, Maliviya Road
FSW n/a n/a 2.42 2.00 4.00
Kanpur Nagar Pragati Sewa Sansthan FSW n/a n/a n/a 0.40 0.00
Maharajganj Shri Bharadwaj Gramodyog Seva Sansthan
FSW n/a n/a n/a n/a 3.60
Aligarh Sarvhara Kalyan Samiti FSW n/a n/a n/a n/a 0.00
Bahraich Krishi Evam Gramodyog Vikas Sansthan
FSW n/a n/a n/a n/a 2.75*
Kheri Chitranshu Samaj Kalyan Parishad, Lakhimpur
FSW n/a n/a n/a n/a 0.40
*Result based on less than 75% of required sample size of N=250 for high-risk group sites.
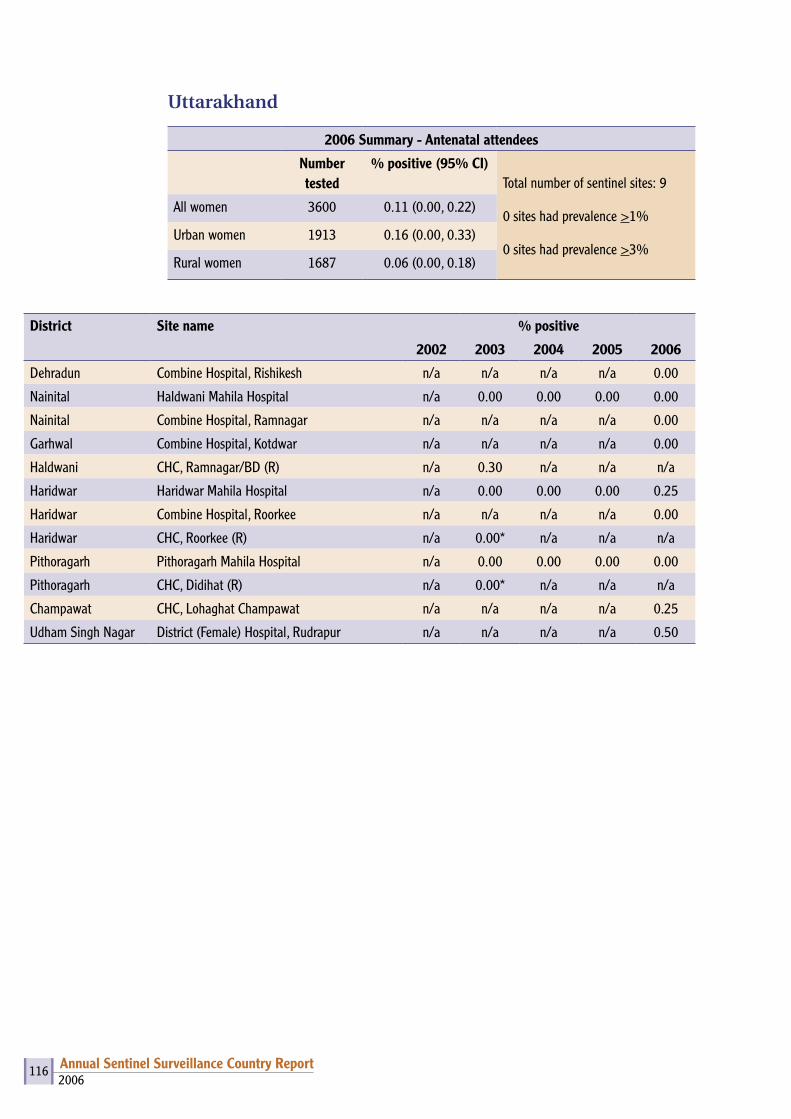
2006Annual Sentinel Surveillance Country Report 116
Uttarakhand
2006 Summary - Antenatal attendees
Number tested
% positive (95% CI)Total number of sentinel sites: 9
0 sites had prevalence >1%
0 sites had prevalence >3%
All women 3600 0.11 (0.00, 0.22)
Urban women 1913 0.16 (0.00, 0.33)
Rural women 1687 0.06 (0.00, 0.18)
District Site name % positive
2002 2003 2004 2005 2006
Dehradun Combine Hospital, Rishikesh n/a n/a n/a n/a 0.00
Nainital Haldwani Mahila Hospital n/a 0.00 0.00 0.00 0.00
Nainital Combine Hospital, Ramnagar n/a n/a n/a n/a 0.00
Garhwal Combine Hospital, Kotdwar n/a n/a n/a n/a 0.00
Haldwani CHC, Ramnagar/BD (R) n/a 0.30 n/a n/a n/a
Haridwar Haridwar Mahila Hospital n/a 0.00 0.00 0.00 0.25
Haridwar Combine Hospital, Roorkee n/a n/a n/a n/a 0.00
Haridwar CHC, Roorkee (R) n/a 0.00* n/a n/a n/a
Pithoragarh Pithoragarh Mahila Hospital n/a 0.00 0.00 0.00 0.00
Pithoragarh CHC, Didihat (R) n/a 0.00* n/a n/a n/a
Champawat CHC, Lohaghat Champawat n/a n/a n/a n/a 0.25
Udham Singh Nagar District (Female) Hospital, Rudrapur n/a n/a n/a n/a 0.50
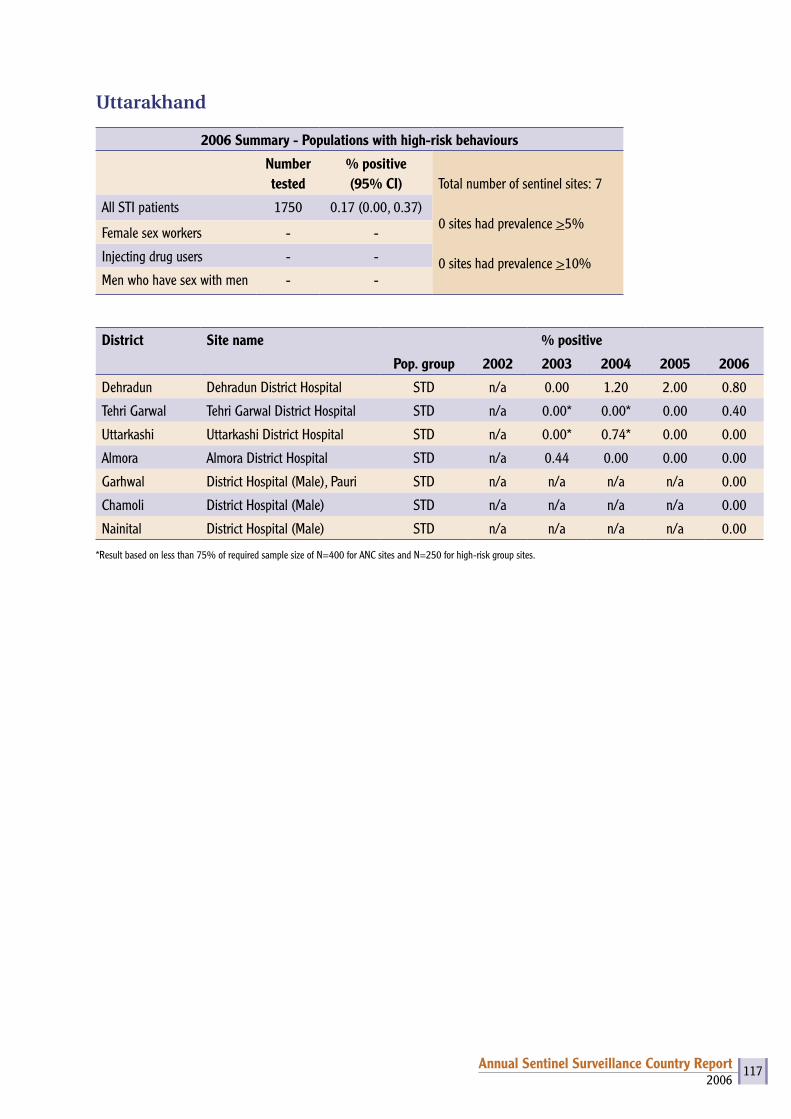
2006Annual Sentinel Surveillance Country Report 117
Uttarakhand
2006 Summary - Populations with high-risk behaviours
Number tested
% positive(95% CI) Total number of sentinel sites: 7
0 sites had prevalence >5%
0 sites had prevalence >10%
All STI patients 1750 0.17 (0.00, 0.37)
Female sex workers - -
Injecting drug users - -
Men who have sex with men - -
District Site name % positive
Pop. group 2002 2003 2004 2005 2006
Dehradun Dehradun District Hospital STD n/a 0.00 1.20 2.00 0.80
Tehri Garwal Tehri Garwal District Hospital STD n/a 0.00* 0.00* 0.00 0.40
Uttarkashi Uttarkashi District Hospital STD n/a 0.00* 0.74* 0.00 0.00
Almora Almora District Hospital STD n/a 0.44 0.00 0.00 0.00
Garhwal District Hospital (Male), Pauri STD n/a n/a n/a n/a 0.00
Chamoli District Hospital (Male) STD n/a n/a n/a n/a 0.00
Nainital District Hospital (Male) STD n/a n/a n/a n/a 0.00
*Result based on less than 75% of required sample size of N=400 for ANC sites and N=250 for high-risk group sites.
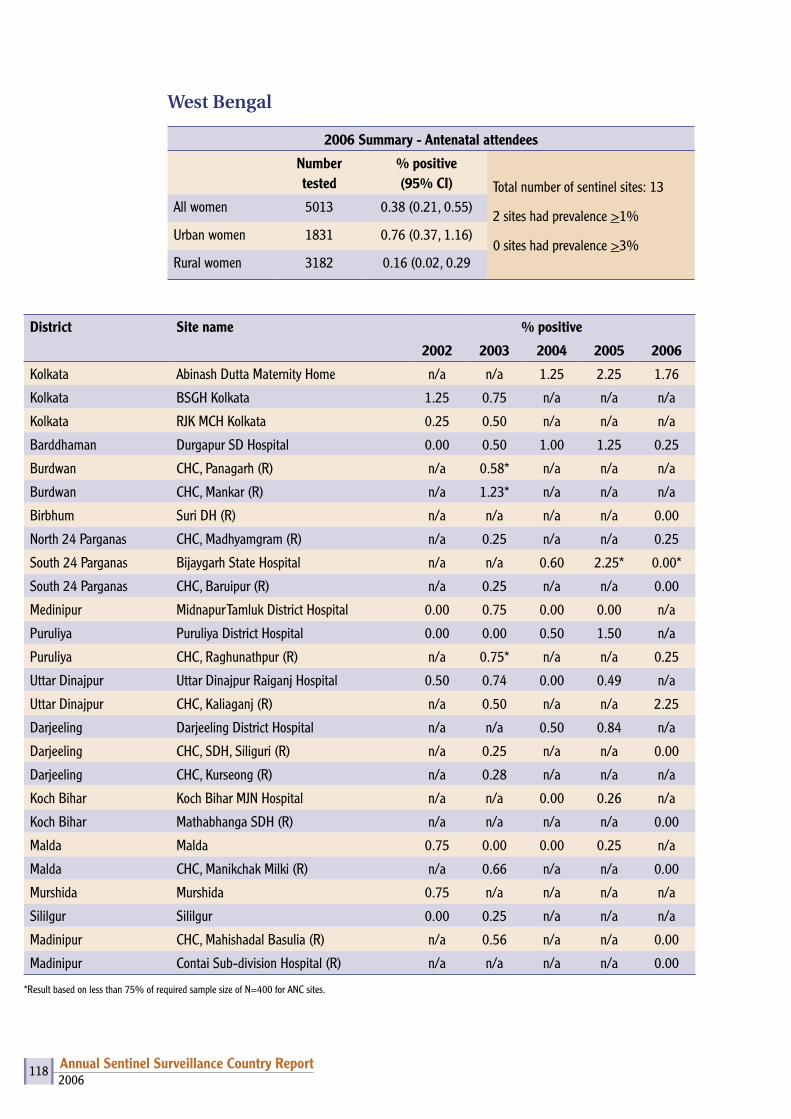
2006Annual Sentinel Surveillance Country Report 118
West Bengal
2006 Summary - Antenatal attendees
Number tested
% positive (95% CI) Total number of sentinel sites: 13
2 sites had prevalence >1%
0 sites had prevalence >3%
All women 5013 0.38 (0.21, 0.55)
Urban women 1831 0.76 (0.37, 1.16)
Rural women 3182 0.16 (0.02, 0.29
District Site name % positive
2002 2003 2004 2005 2006
Kolkata Abinash Dutta Maternity Home n/a n/a 1.25 2.25 1.76
Kolkata BSGH Kolkata 1.25 0.75 n/a n/a n/a
Kolkata RJK MCH Kolkata 0.25 0.50 n/a n/a n/a
Barddhaman Durgapur SD Hospital 0.00 0.50 1.00 1.25 0.25
Burdwan CHC, Panagarh (R) n/a 0.58* n/a n/a n/a
Burdwan CHC, Mankar (R) n/a 1.23* n/a n/a n/a
Birbhum Suri DH (R) n/a n/a n/a n/a 0.00
North 24 Parganas CHC, Madhyamgram (R) n/a 0.25 n/a n/a 0.25
South 24 Parganas Bijaygarh State Hospital n/a n/a 0.60 2.25* 0.00*
South 24 Parganas CHC, Baruipur (R) n/a 0.25 n/a n/a 0.00
Medinipur Midnapur Tamluk District Hospital 0.00 0.75 0.00 0.00 n/a
Puruliya Puruliya District Hospital 0.00 0.00 0.50 1.50 n/a
Puruliya CHC, Raghunathpur (R) n/a 0.75* n/a n/a 0.25
Uttar Dinajpur Uttar Dinajpur Raiganj Hospital 0.50 0.74 0.00 0.49 n/a
Uttar Dinajpur CHC, Kaliaganj (R) n/a 0.50 n/a n/a 2.25
Darjeeling Darjeeling District Hospital n/a n/a 0.50 0.84 n/a
Darjeeling CHC, SDH, Siliguri (R) n/a 0.25 n/a n/a 0.00
Darjeeling CHC, Kurseong (R) n/a 0.28 n/a n/a n/a
Koch Bihar Koch Bihar MJN Hospital n/a n/a 0.00 0.26 n/a
Koch Bihar Mathabhanga SDH (R) n/a n/a n/a n/a 0.00
Malda Malda 0.75 0.00 0.00 0.25 n/a
Malda CHC, Manikchak Milki (R) n/a 0.66 n/a n/a 0.00
Murshida Murshida 0.75 n/a n/a n/a n/a
Sililgur Sililgur 0.00 0.25 n/a n/a n/a
Madinipur CHC, Mahishadal Basulia (R) n/a 0.56 n/a n/a 0.00
Madinipur Contai Sub-division Hospital (R) n/a n/a n/a n/a 0.00
*Result based on less than 75% of required sample size of N=400 for ANC sites.
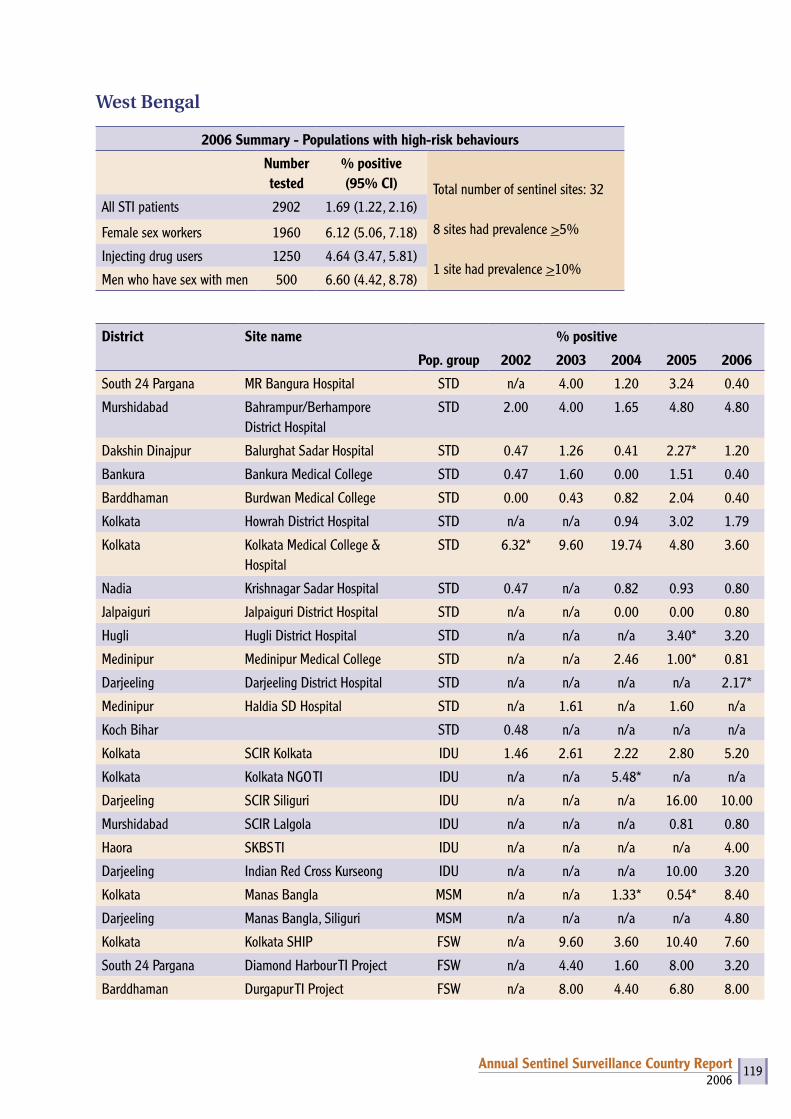
2006Annual Sentinel Surveillance Country Report 119
West Bengal
2006 Summary - Populations with high-risk behaviours
Number tested
% positive(95% CI) Total number of sentinel sites: 32
8 sites had prevalence >5%
1 site had prevalence >10%
All STI patients 2902 1.69 (1.22, 2.16)
Female sex workers 1960 6.12 (5.06, 7.18)
Injecting drug users 1250 4.64 (3.47, 5.81)
Men who have sex with men 500 6.60 (4.42, 8.78)
District Site name % positive
Pop. group 2002 2003 2004 2005 2006
South 24 Pargana MR Bangura Hospital STD n/a 4.00 1.20 3.24 0.40
Murshidabad Bahrampur/Berhampore District Hospital
STD 2.00 4.00 1.65 4.80 4.80
Dakshin Dinajpur Balurghat Sadar Hospital STD 0.47 1.26 0.41 2.27* 1.20
Bankura Bankura Medical College STD 0.47 1.60 0.00 1.51 0.40
Barddhaman Burdwan Medical College STD 0.00 0.43 0.82 2.04 0.40
Kolkata Howrah District Hospital STD n/a n/a 0.94 3.02 1.79
Kolkata Kolkata Medical College & Hospital
STD 6.32* 9.60 19.74 4.80 3.60
Nadia Krishnagar Sadar Hospital STD 0.47 n/a 0.82 0.93 0.80
Jalpaiguri Jalpaiguri District Hospital STD n/a n/a 0.00 0.00 0.80
Hugli Hugli District Hospital STD n/a n/a n/a 3.40* 3.20
Medinipur Medinipur Medical College STD n/a n/a 2.46 1.00* 0.81
Darjeeling Darjeeling District Hospital STD n/a n/a n/a n/a 2.17*
Medinipur Haldia SD Hospital STD n/a 1.61 n/a 1.60 n/a
Koch Bihar STD 0.48 n/a n/a n/a n/a
Kolkata SCIR Kolkata IDU 1.46 2.61 2.22 2.80 5.20
Kolkata Kolkata NGO TI IDU n/a n/a 5.48* n/a n/a
Darjeeling SCIR Siliguri IDU n/a n/a n/a 16.00 10.00
Murshidabad SCIR Lalgola IDU n/a n/a n/a 0.81 0.80
Haora SKBS TI IDU n/a n/a n/a n/a 4.00
Darjeeling Indian Red Cross Kurseong IDU n/a n/a n/a 10.00 3.20
Kolkata Manas Bangla MSM n/a n/a 1.33* 0.54* 8.40
Darjeeling Manas Bangla, Siliguri MSM n/a n/a n/a n/a 4.80
Kolkata Kolkata SHIP FSW n/a 9.60 3.60 10.40 7.60
South 24 Pargana Diamond Harbour TI Project FSW n/a 4.40 1.60 8.00 3.20
Barddhaman Durgapur TI Project FSW n/a 8.00 4.40 6.80 8.00
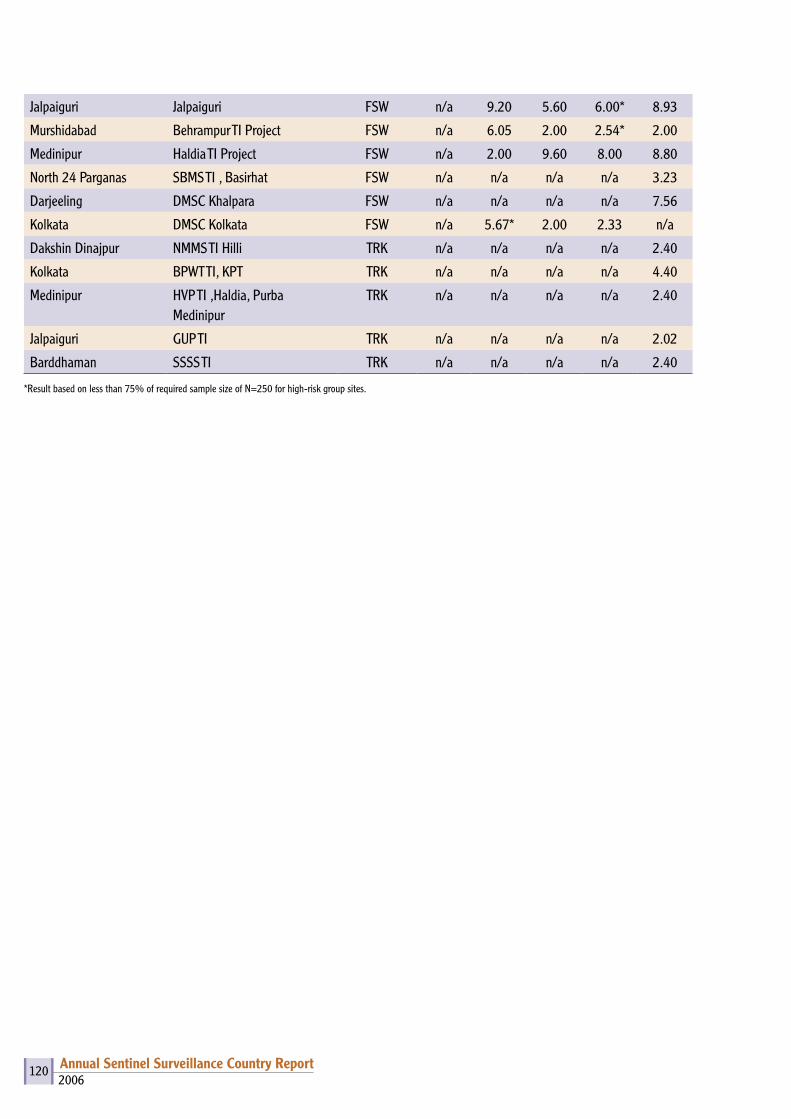
2006Annual Sentinel Surveillance Country Report 120
Jalpaiguri Jalpaiguri FSW n/a 9.20 5.60 6.00* 8.93
Murshidabad Behrampur TI Project FSW n/a 6.05 2.00 2.54* 2.00
Medinipur Haldia TI Project FSW n/a 2.00 9.60 8.00 8.80
North 24 Parganas SBMS TI , Basirhat FSW n/a n/a n/a n/a 3.23
Darjeeling DMSC Khalpara FSW n/a n/a n/a n/a 7.56
Kolkata DMSC Kolkata FSW n/a 5.67* 2.00 2.33 n/a
Dakshin Dinajpur NMMS TI Hilli TRK n/a n/a n/a n/a 2.40
Kolkata BPWT TI, KPT TRK n/a n/a n/a n/a 4.40
Medinipur HVP TI ,Haldia, Purba Medinipur
TRK n/a n/a n/a n/a 2.40
Jalpaiguri GUP TI TRK n/a n/a n/a n/a 2.02
Barddhaman SSSS TI TRK n/a n/a n/a n/a 2.40
*Result based on less than 75% of required sample size of N=250 for high-risk group sites.


NACONational AIDS Control Organisation (NACO)Ministry of Health & Family WelfareNew Delhi – 110 011
National Institute of Health & Family Welfare (NIHFW)Munirka, New Delhi – 110 067
Annual HIV Sentinel Surveillance Country Report
2006
vkjksX;e~ lq[klEinkvkjksX;e~ lq[klEink
Related Documents


![Sentinel versus passive surveillance for measuring changes ... · PDF file19.02.2016 · 3 79 Although laboratory-based sentinel surveillance has been recommended for dengue [9], 80](https://static.cupdf.com/doc/110x72/5a9e1ab47f8b9ad2298d5060/sentinel-versus-passive-surveillance-for-measuring-changes-79-although-laboratory-based.jpg)