City of Chicago Annual Financial Analysis 2017 Mayor Rahm Emanuel

Welcome message from author
This document is posted to help you gain knowledge. Please leave a comment to let me know what you think about it! Share it to your friends and learn new things together.
Transcript

C i t y o f C h i c a g o
Annual Financial Analysis2017
Mayor Rahm Emanuel


A n n u a l F i n a n c i a l A n a l y s i s 2 0 1 7
Table of Contents
Letter from the Mayor ......................................................................... 5
Executive Summary .................................................................................. 9
Three-Year Financial Forecast .........................................................13
• 2017 Corporate Fund Year-End Estimates ..............................14
• 2018 Corporate Fund Projections ...........................................15
• 2019-2020 Corporate Fund Outlooks ....................................18
• Outlook for Special Revenue Funds .........................................20
• Enterprise Fund Outlook .......................................................22

A n n u a l F i n a n c i a l A n a l y s i s 2 0 1 7
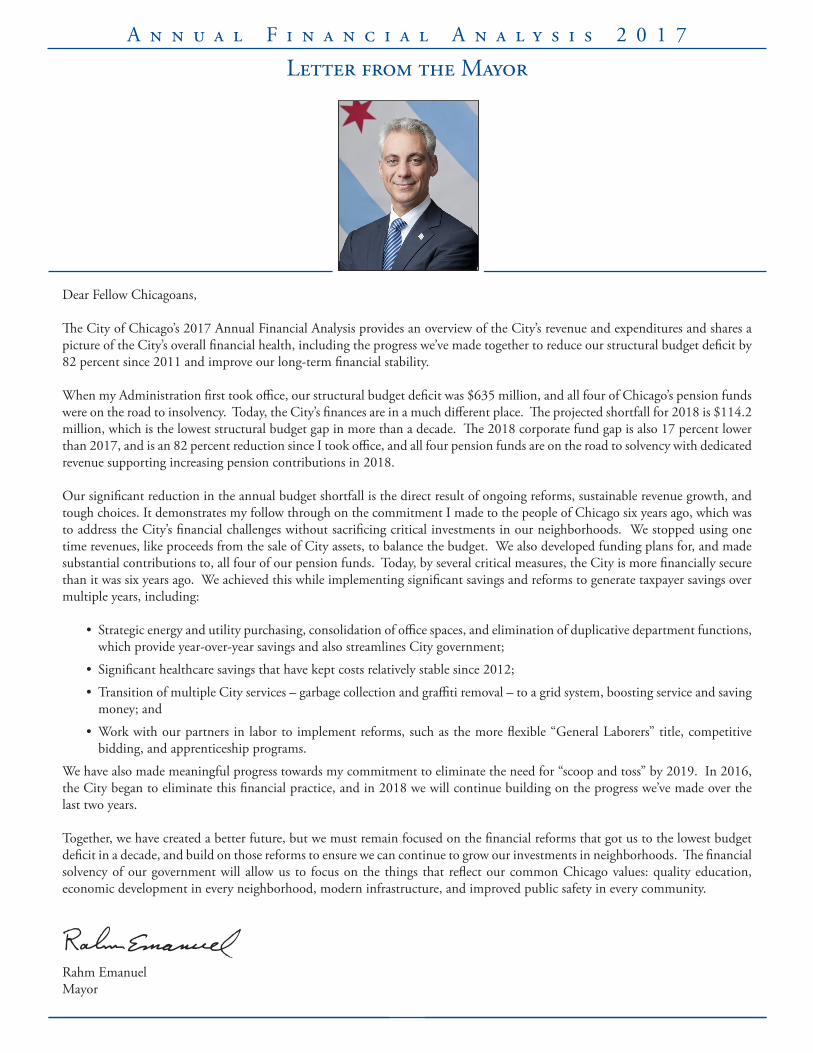
Dear Fellow Chicagoans, The City of Chicago’s 2017 Annual Financial Analysis provides an overview of the City’s revenue and expenditures and shares a picture of the City’s overall financial health, including the progress we’ve made together to reduce our structural budget deficit by 82 percent since 2011 and improve our long-term financial stability.
When my Administration first took office, our structural budget deficit was $635 million, and all four of Chicago’s pension funds were on the road to insolvency. Today, the City’s finances are in a much different place. The projected shortfall for 2018 is $114.2 million, which is the lowest structural budget gap in more than a decade. The 2018 corporate fund gap is also 17 percent lower than 2017, and is an 82 percent reduction since I took office, and all four pension funds are on the road to solvency with dedicated revenue supporting increasing pension contributions in 2018.
Our significant reduction in the annual budget shortfall is the direct result of ongoing reforms, sustainable revenue growth, and tough choices. It demonstrates my follow through on the commitment I made to the people of Chicago six years ago, which was to address the City’s financial challenges without sacrificing critical investments in our neighborhoods. We stopped using one time revenues, like proceeds from the sale of City assets, to balance the budget. We also developed funding plans for, and made substantial contributions to, all four of our pension funds. Today, by several critical measures, the City is more financially secure than it was six years ago. We achieved this while implementing significant savings and reforms to generate taxpayer savings over multiple years, including:
• Strategic energy and utility purchasing, consolidation of office spaces, and elimination of duplicative department functions, which provide year-over-year savings and also streamlines City government;
• Significant healthcare savings that have kept costs relatively stable since 2012;
• Transition of multiple City services – garbage collection and graffiti removal – to a grid system, boosting service and saving money; and
• Work with our partners in labor to implement reforms, such as the more flexible “General Laborers” title, competitive bidding, and apprenticeship programs.
We have also made meaningful progress towards my commitment to eliminate the need for “scoop and toss” by 2019. In 2016, the City began to eliminate this financial practice, and in 2018 we will continue building on the progress we’ve made over the last two years.
Together, we have created a better future, but we must remain focused on the financial reforms that got us to the lowest budget deficit in a decade, and build on those reforms to ensure we can continue to grow our investments in neighborhoods. The financial solvency of our government will allow us to focus on the things that reflect our common Chicago values: quality education, economic development in every neighborhood, modern infrastructure, and improved public safety in every community.
Rahm EmanuelMayor
Letter from the Mayor


Executive Summary
Annual Financial Analysis2017


A n n u a l F i n a n c i a l A n a l y s i s 2 0 1 7
9
Executive Summary
Disclaimer and Advice to Readers
The City of Chicago (“City”) is pleased to present this Annual Financial Analysis (“AFA”). The purpose of this site is to provide general information about the history and future of major components of the City’s overall finances and City budget. There is no assurance that the information contained on this site does not contain typographical or other errors which may have occurred.
Please keep in mind that information presented on this site only speaks as of the date it was posted or, if such information is dated, as of its date. The City may or may not update any information on this site.
This site includes forward-looking statements based on current beliefs and expectations about future events. Those events are uncertain; their outcome may differ from current expectations which may in turn significantly affect expected results. Where information is presented that has come from sources other than the City, the City presents that information only for convenience. The City does not undertake to verify any of that information.
If you choose to print all or portions of the AFA, some or all information may be missing or incomplete.
The AFA has not been prepared to give information for making decisions on buying or selling securities and should not be relied upon by investors in making investment decisions. With respect to any bonds, notes, or other debt obligations of the City, please refer for information only to the City’s ordinances and notifications of sale and the related disclosure documents, if any, or continuing disclosure filings, if any, for such bonds, notes, or other debt obligations.
The information in this site is provided “as is” without warranty of any kind. Neither the City nor any of its agencies nor any of its officers or employees shall be held liable for any use of the information described and/or contained in this site.
2017 Annual Financial Analysis Available Online
In previous years the City of Chicago’s Annual Financial Analysis (AFA) was distributed in print and the printed version was also available online. The full 2017 AFA is now available through an online platform on the City’s website. This AFA provides readers with more detailed information in an interactive format.
This document provides the financial forecast for 2018 and upcoming years.
The full City of Chicago 2017 AFA is available at the following link: http://www.cityofchicago.org/city/en/depts/obm/supp_info/annual-budget-recommendations---documents.html


Annual Financial Analysis2017
Financial Forecast


A n n u a l F i n a n c i a l A n a l y s i s 2 0 1 7
13
Financial Forecast
1 The Economic Considerations in this section are developed from sources including the Bureau of Economic Analysis (www.bea.gov), the Bureau of Labor Statistics (www.bls.gov), Illinois Department of Economic Security (www.ides.illinois.gov), CBRE (www.CBRE.com) , the Chicago Aviation Department (www.flychicago.com), the Illinois Commission on Government Forecasting and Accountability (http://cgfa.ilga.gov/), the Illinois Comptroller Office (https://illinoiscomptroller.gov/), the Illinois Realtors (www.illinoisrealtor.org) and World Business Chicago (www.worldbusinesschicago.com).
INTRODUCTION
This section discusses the City’s 2017 year-end estimates, 2018 preliminary revenue and expense projections, and three revenue and expense scenarios for the years 2019 and 2020 – with a base outlook, a negative outlook, and a positive outlook. These projections are based on historical revenue and expenditure data, current economic trends and conditions, and other known factors that are anticipated to have an impact on the City’s finances. The purpose of this analysis is to ensure that the 2018 budget is formulated within the context of the City’s current financial state, and with an informed view of future conditions and the long-term fiscal consequences of today’s decisions.
This forecast focuses primarily on the corporate fund, which not only accounts for many of the basic services provided by the City, but also has historically experienced the largest disparity between revenues and expenditures. Projections for the City’s major special revenue and enterprise funds are included at the end of this section.
GENERAL ECONOMIC CONSIDERATIONS1
As the U.S. economy continues to grow, benefiting from changing technologies and shifting consumer preferences, Chicago has seen overall growth in revenues in recent years with certain revenue sources growing at a faster pace than others.
Chicago continues to benefit from its diverse economic base. No single industry in the city employs more than 14.0 percent of the workforce, making Chicago one of the most diverse economies in the country and a key player in sectors from financial services to technology and healthcare. With ongoing investments in City services and infrastructure, the City has remained competitive with other emerging and established technology hubs across the country. Chicago is one of only four cities in the United States expected to be a top global technology innovation hub over the next four years.
Business growth and expansion has translated into an improved employment picture for Chicago and the metro area. Since 2011, Chicago has experienced significant job and wage growth. In fact, according to the Illinois Department of Employment Security report, more people are working in every part of Chicago than at any time since 2000. The City’s unemployment rate declined to 6.5 percent in 2016 from 6.6 percent in 2015, and figures for June 2017 suggest continued improvement with an unemployment rate of 5.5 percent.
Consumer spending, aided by wage growth and low inflation, continues to help drive the economy at the local and national levels. Preliminary estimates indicate the U.S. gross domestic product (GDP) grew at an annual rate of 2.6 percent in the second quarter of 2017 following a 1.2 percent growth in the first quarter. Growth thus far has been helped by consumer spending, capital investments by businesses, and exports. GDP is projected to end 2017 around 2.2 percent, and is forecasted to grow in a range between 2.4 and 2.7 percent for 2018 through 2019.
Chicago’s real estate development market is maintaining its growth. The city’s industrial occupancy rate is at a 15-year high and 2016 closed with the lowest office vacancy rate in the central business district since 2008. The housing market continues to gain strength locally with home prices appreciating and with home sales at 3.2 percent higher in the first half of 2017 than the same period of 2016.
Low fuel-prices and air fares have increased airline travel with both of Chicago’s airports seeing increased passenger volume in 2016 compared to 2015. A record 53.9 million visitors traveled to the City in 2016, marking a 2.5 percent increase over 2015.
Consumer sharing technologies, such as home and ride sharing services, have positively impacted the City’s revenues. In 2015, the City began collecting a $5 fee for all rideshare vehicles picking up and dropping off at the City’s airports, Navy Pier, and McCormick Place as well as an increased per ride charge for all rides that begin or end in Chicago. Also, a growing number of these visitors are booking overnight accommodations through HomeShare websites instead of

A n n u a l F i n a n c i a l A n a l y s i s 2 0 1 7
14
2017-2018 PROJECTED EXPENDITURES AND REVENUES$ Millions
Financial Forecast
traditional hotels. Beginning in February 2015, the City required website booking facilitators, to collect the hotel accommodations tax on transactions facilitated by their websites, and starting in July 2016, the City implemented a 4.0 percent surcharge on rental of licensed vacation rentals and home sharing units.
While the City anticipates modest but steady economic growth in the coming years, lingering uncertainty around government spending and policies at the state and federal level may result in short-term negative impacts on the local, regional, and national economy. The State of Illinois recently adopted a full year budget for the first time in two years, resulting in certain revenue reductions for the remainder of the City’s 2017 fiscal year and for fiscal year 2018. With over $14 billion of unpaid bills at the State due to the two year stalemate, the potential long-term economic effects of the State’s budget impasse remain to be seen. Nationally, proposed infrastructure investments, revisions to the federal income tax code, and changes in the healthcare industry could all have impacts on the local economy as well.
These broader economic factors are accounted for in the following projections. The 2018 projections and the base outlook for 2019-2020 present what is currently viewed as the most likely scenario. The positive and negative outlooks for 2019 and 2020 provide insight into how changes in the economy and other related factors could affect the City’s finances over the next three years.
2017 CORPORATE FUND YEAR-END ESTIMATES
2017 Year-End Revenues
The total corporate fund resources for 2017 are estimated to end this year approximately $11 million above budgeted levels at $3,745.9 million. Total revenues for 2017 are projected to
end the year on target, while certain revenues are expected to end below budget. These include fine revenue due to recent programmatic changes in automated enforcement and other economically sensitive revenues growing at a more modest pace than budgeted. These reductions are offset by strong performances among other economically-sensitive revenues, such as personal property lease transaction tax and recreation taxes. Major categories of revenue and trends are discussed below, and more detail for each revenue source is included online in the Revenue section of the 2017 AFA.
Personal property lease tax revenues are estimated to end 14.0 percent, or $31 million, above 2017 budget expectations due to growth in the technology industry and other business sectors coupled with recent modifications to the lease transaction tax to improve compliance. As discussed further in the revenue section of the AFA, the City lowered the personal property lease tax rate and waived taxes, penalties and interest for years prior to 2015 for certain cloud software and infrastructure.
Despite economic growth nationally and locally, performance in certain economically sensitive revenue streams has slowed because of changing consumer behavior, among other factors. In recent years, the City’s sales tax (Home Rule Occupation and Use Tax or HROT) revenue has remained relatively flat, following significant growth in the early 2010s as the economy rebounded. HROT collections were effectively flat in 2016 compared to 2015. 2017 HROT revenue is expected to end the year below budget estimates but close to the 2016 year-end revenues at $304.3 million. Part of the decline in the 2017 HROT revenue is due to a new 2.0 percent administrative charge that will be applied to local sales tax collections administered by the State of Illinois. This administrative charge was adopted by the General Assembly as part of the State’s recent budget. The administrative charge will be applied starting with the July 2017 HROT distribution and all subsequent distributions,
2017 YE Est 2018 ProjectedRevenue $3,745.9 $3,742.4Expenditure $3,735.4 $3,856.6Budget Surplus/(Deficit) $10.5 ($114.2)

A n n u a l F i n a n c i a l A n a l y s i s 2 0 1 7
15
Financial Forecast
thereby reducing HROT revenue in 2017 by $4.6 million. In contrast, the City’s share of the State’s sales tax (Municipal Retailer Occupation Tax or MROT) revenue has grown each year since the recession, ending 2017 at an estimated $370.4 million or 1.0 percent above 2016 year-end revenues.
Despite employment and wage gains, state income tax revenues are expected to end 2017 below budgeted amounts at $250.0 million, while the City’s share of personal property replacement tax (PPRT) revenue is estimated to finish the year nearly $30 million above budget at $160.4 million. The City previously expected to receive less PPRT revenue in 2017 as the State continued efforts to recover funds that were incorrectly paid to local taxing districts between April 2014 and March 2016. The reduction, however, has been less than expected, and PPRT revenue is ending 2017 well above budget projections. The City will continue to monitor PPRT disbursements in 2018 when all funds are expected to be fully recovered.
The mild winter, low natural gas prices, and increases in energy efficiencies have caused utility taxes to end $19.1 million below 2017 budgeted expectations. Transportation taxes are estimated to finish 4.5 percent above budget estimates due to the growing use of rideshare services. Additionally, amusement tax revenue continues to build on its year-over-year growth, and is ending the year $25.5 million above budget estimates helped by the popularity of professional sporting events and live theater performances in Chicago.
Non-tax revenues are expected to end 3.8 percent, or $42.7 million, below the 2017 budget, caused in part by a reduction in red light camera revenue from the elimination of six cameras and an increased grace period before the camera is triggered, which will reduce the total number of tickets issued in 2017. A 3.5 percent growth in charges for service and additional interest income from corporate fund investments are helping to offset revenue reductions in other non-tax revenues, but overall these revenues are down relative to budget.
2017 Year-End Expenditures
The 2017 corporate fund expenditures are currently expected to end the year on budget at $3,735.4 million. These estimates are based on year-to-date spending, incorporating
payroll trends, market pricing for commodities, and any known changes or events that have or are anticipated to occur, during the remainder of 2017.
The year-end projections in 2017 reflect lower than expected expenses in salary and wages due to normal position turnover, but this reduction is offset by increased expenses related to public safety overtime. Additionally, the year-end expenditure projections reflect minor variations from the 2017 budget due to small adjustments in certain expense categories. Healthcare costs are estimated to end 2017 slightly below budget along with certain non-personnel expenses, including lower than budgeted costs related to diesel, gasoline and other commodities. This is due to favorable diesel and gasoline prices and a mild winter.
While corporate fund revenues and expenses are anticipated to end 2017 on budget, numerous factors can impact the City’s revenues and expenditures, and these estimates may change as the year progresses. Decisions are made throughout the course of the year in response to new or changing needs and citywide priorities, and the City will continue to closely monitor its revenues and expenses.
2018 CORPORATE FUND PROJECTIONS
The difference between revenues and expenditures anticipated by the City in its preliminary corporate fund budget estimates each year is commonly referred to as the ‘gap.’ Based on current revenue and expenditure projections of existing operations, the City estimates a 2018 corporate fund gap of $114.2 million.
The $114.2 million gap for 2018 marks a 17.0 percent reduction from the 2017 structural deficit and an 82.0 percent decrease from 2011. This gap is also substantially smaller than what was projected for 2018 in both the 2015 and 2016 Annual Financial Analysis. This decrease is a direct result of sustainable and balanced revenue growth coupled with lasting savings and reforms made in the past six budgets. Savings and efficiencies resulting from strategic energy and utility purchasing, reduction of duplicative operations across departments, transition of garbage collection and other city services to a grid model, and healthcare cost savings have combined to reduce the City’s structural deficit year-over-year. The City achieved this progress while concurrently

A n n u a l F i n a n c i a l A n a l y s i s 2 0 1 7
16
Financial Forecast
phasing out the use of one-time revenue sources that had been used to balance the budget in the past. The increased employer contributions to all four City pension funds are accounted for in the 2018 gap, as are the revenue sources that will be used to make those contributions. As discussed further in the in the pension section, the City has adopted a dedicated revenue source for each pension fund.
The following is a detailed outline of the City’s operating revenue and expenditure projections for 2018. These expenditure and revenue projections do not assume any substantive changes to City operations, including expanded or new City services, in 2018. No cost-saving initiatives or new investments for 2018 are incorporated into these estimates as the 2018 projections reflect the structural gap in the City’s operating budget related to existing expenses and revenues. As in all previous years, revenue and expense initiatives are developed by the City and will be included in the 2018 budget recommendation submitted to the City Council in October.
2018 Projected Corporate Fund Revenues
Corporate fund resources in 2018 are projected to be similar to 2017 year-end estimates at $3,742.4 million. While revenues appear flat compared to 2017 year-end estimates, this is largely due to the collection of water-sewer tax revenues, which are solely dedicated to paying increased Municipal pension fund expenses. In 2018, the City’s corporate fund
will receive $64.0 million from the water-sewer tax, which will be combined with other budgeted revenue to fund the 2018 Municipal pension contribution.
Generally, sales and use taxes, income taxes, PPRT and other intergovernmental revenues are expected to show modest growth over the 2017 year-end estimates with some gains offset by State policy changes included in its fiscal year 2018 budget. The City’s portion of the state’s sales tax (MROT) is expected to increase by $3.7 million in 2018 compared to 2017 year-end estimates, while the City’s sales tax (HROT) in 2018 is expected to decrease slightly compared to 2017 year-end levels due primarily to the State imposing a 2.0 percent administrative charge on local sales tax collections administered by the State. PPRT revenue is held flat in 2018 compared to 2017 year-end estimates due to ongoing uncertainty around possible overpayment recovery by the State and continued diversion of local governments’ share of PPRT revenue for State expenses.
Amusement tax revenue for 2017 year-end is $25.5 million above budget and is expected to increase by $1.8 million to $170.5 million in 2018. Compliance levels for the personal property lease tax are projected to remain high in 2018, keeping lease transaction tax revenues level with year-end 2017 figures. Revenue from real property transfer tax remains strong, but is estimated to decrease by $4.4 million compared to 2017 year-end estimates due to fewer large property transfers expected in 2018.
CORPORATE FUND PRELIMINARY GAP$ Millions
2005
2006
2007
2008
2009
2010
2011
2012
2013
2014
2015
2016
2017
2018
($137.6)($114.2)
($220.4)
($94.1)
($64.5)
($217.7)
($420.0) ($519.7)
($654.7)($635.7)
($369.0)($338.7)
($297.3)($232.6)
$0
Historical Gap Projected Gap - 2017 AFA

A n n u a l F i n a n c i a l A n a l y s i s 2 0 1 7
17
YE Est
2017
Projected
2018
Tax Revenue Business Taxes
Income Tax, PPRT & Other Intergovernmental
Recreation Taxes
Sales and Use Taxes
Transaction Taxes
Transportation Taxes
Utility Taxes and Fees
Total
Non-Tax Revenue Charges for Services
Fines, Forfeitures and Penalties
Leases, Rentals and Sales
Licenses, Permits and Certificates
Municipal Parking
Reimbursement, Interest & Other
Total
Proceeds and Transfers In Proceeds and Transfers In
Total
Appropriated Prior Year Fund Balance Appropriated Prior Year Fund Balance
Total
Grand Total
$2,577.2
$417.9
$252.3
$430.0
$674.7
$249.2
$416.5
$136.6
$2,643.5
$497.4
$252.0
$422.6
$676.1
$250.4
$418.9
$126.1
$1,078.7
$468.4
$7.6
$128.2
$28.8
$326.7
$119.0
$1,035.9
$420.6
$7.6
$129.4
$36.6
$319.7
$122.0
$37.0
$37.0
$26.0
$26.0
$53.0
$53.0
$37.0
$37.0
$3,745.9 $3,742.4
RevenueCorporate Fund, $ Millions
-30.19% 30.19%% Change
REVENUE – CORPORATE FUND$ Millions
Financial Forecast
Business tax revenue is projected to decrease by $10.5 million to $126.1 million in 2018 compared to year-end 2017 estimates of $136.6 million. Revenue from the hotel accommodations tax is down $10.6 million compared to 2017 year-end estimates, but up $6.6 million relative to the 2017 budget. The 2017 year-end hotel tax revenue is ending above budget expectations due to the tax settlement payment made in spring 2017 by an internet hotel booking company. The City’s hotel accommodation tax receipts continue to benefit from the increase in tourism and business travel in recent years which is also helping to increase the supply of rooms from both traditional hotels as well as vacation rentals or shared housing units. This expanding market is helping to increase the base of businesses that pay this tax.
Non-tax revenue is expected to decrease by 4.0 percent from 2017 year-end estimates. In 2017, the City eliminated six automated enforcement cameras for red lights and increased the grace period before the camera is triggered, which will reduce the number of red light violations issued. These programmatic changes are expected to reduce 2018 fine
revenue related to red light cameras by approximately $19 million.
2018 Projected Corporate Fund Expenditures
The 2018 expenditures are forecast to grow by approximately $121 million over the 2017 budget and the 2017 year-end estimates to $3,856.6 million. These projections are based on 2017 estimates, adjusted for anticipated growth trends and known changes to existing expenses such as normal increases in contractual services, commodities and materials costs, and salary increases resulting from contractual obligations under collective bargaining agreements.
The majority of the projected expense increases for 2018 are personnel costs, primarily wages and other related expenses. The 2018 projection for these expenses assumes the same number of employees as 2017 with wages growing based on required contractual wage and prevailing rate increases. Further, the personnel services expenses are increased in 2018 based on trends in previous years to better account for

A n n u a l F i n a n c i a l A n a l y s i s 2 0 1 7
18
Financial Forecast
anticipated overtime expenses related to ongoing violence reduction efforts. Healthcare costs are expected to grow at a rate of 2.8 percent in 2018, which is well below national trends, due to the implementation of healthcare initiatives designed to reduce growth in the costs of the City’s healthcare plan.
As discussed previously, the City has identified dedicated revenue sources to make the increased contributions to all four pension funds in 2018. Therefore, increases in corporate fund expenses related to pensions are matched by a revenue increase and are not impacting the City’s structural gap in 2018.
In addition to addressing the 2018 operating deficit, the City will move forward with the second year of its two-year hiring plan in the Chicago Police Department and further investments in training, technology and personnel to support police reform efforts by the Administration. This increased cost is not incorporated into the 2018 operating deficit as it is a new investment for the upcoming year, not an existing, structural expense currently in the City’s corporate budget. The City will also continue to move forward with its plan to eliminate the need for “scoop and toss” by 2019. Over the past two years, the City has increased the funds available to make its debt services payments, and in 2018, the City will continue its progress in eliminating this practice by 2019. As with all other new investments, these additional public safety resources and steps to eliminate “scoop and toss” will be incorporated into the 2018 budget recommendation.
2019-2020 CORPORATE FUND OUTLOOKS
The following three scenarios project budget gaps for the years 2019 and 2020 for the City’s corporate fund based on different revenue and expenditure outlooks. While the City shows growth in the gap for 2019 and 2020, these numbers are based on the assumption that no substantive changes are made to City operations, revenue or the cost of City services as part of the 2018 budget and beyond.
Over the past six budgets, savings initiatives and revenue growth have steadily decreased the corporate fund gap and the out-year projected budget gaps. For example, as part of the 2015 AFA, the City projected a $436 million base outlook structural budget gap for 2018, and this year, the 2018 projected gap is $114.2 million.
The City’s services are delivered through its workforce with unionized employees comprising more than 90.0 percent of its total workforce. Similar to previous years, the majority of the projected expense increases in 2018 are personnel related. These personnel costs are the primary driver of corporate fund expenses in 2019 and 2020 as detailed in the gap projections for those years. The projected gap in each of one of the scenarios highlights the expenditure growth relative to revenue growth.
As discussed previously, the City identified dedicated revenue sources to make the increased contributions to the
YE Est
2017
Projected
2018
Expenditures Personnel Services
Benefits
Contractual Services
Commodities and Equipment
Claims, Refunds, Judgments, and Legal Fees
Delegate Agencies and Other Program Costs
Reimbursements and Financial Expenses
Miscellaneous
Transfers Out
Pension
Grand Total
$105.5
$146.9
$6.2
$20.4
$112.1
$64.5
$74.2
$330.9
$446.1
$2,428.7
$180.8
$146.8
$6.4
$20.7
$104.8
$42.4
$77.0
$339.8
$476.2
$2,461.7
$3,735.4 $3,856.6
ExpendituresCorporate Fund, $ Millions
-30.00% 30.00%% Change
EXPENDITURES – CORPORATE FUND$ Millions

A n n u a l F i n a n c i a l A n a l y s i s 2 0 1 7
19
Financial Forecast
Municipal and Laborers’ pension funds, thus they do not impact the 2019 and 2020 projected gap.
As it relates to Police and Fire pensions, the increasing pension contributions do not impact the gap through 2018 due to the four-year property tax increase adopted in 2015. In 2019, the required contribution for the Police and Fire pension funds will increase by $32 million and thus will increase the 2019 gap by $32 million. Under State law, beginning in 2020, the Police and Fire pension contributions will be actuarially determined, further increasing the City’s pension contributions going forward. The 2020 contribution will increase the 2020 gap; however the final amount is not yet available and is highly dependent on interest returns as well as other factors. The exact amount of the contribution will not be known until the pension funds make their 2020 funding requests in the summer of 2019. The City previously secured ongoing and sustainable funding sources to match these growing contributions, and the funding sources for these increased contributions will be determined through our annual budget process. Because these increases will be coupled with dedicated funding, the Police and Fire 2019 and 2020 contributions are presented separately from the operating budget deficits discussed below.
In addition, the City will eliminate the need for “scoop and toss” by 2019, and consistent with previous AFAs, the
expenses associated with ending “scoop and toss” are not incorporated in the structural budget gap as they will be dealt with separately, typically through the annual budget process.
Base Outlook
The base outlook projects overall corporate fund revenue growth is relatively flat compared to the prior year in both 2019 and 2020, resulting in total corporate fund revenues of $3,748.9 million and $3,747.2 million, respectively. As in past years, the City takes a conservative approach to these projections under the assumption that the economy will continue to experience modest growth going forward.
These projections are based on the continuation of similar revenue trends as discussed with respect to 2018, including a nearly 2.0 percent annual growth in recreation taxes in 2019 and 2020. Transaction taxes are expected to remain relatively flat which is similar to 2018 levels, while the City’s portion of the state’s sales tax (MROT) continues to grow at a projected pace of 1.0 percent annually in 2019 and 2020.
Corporate fund expenditures are projected to outpace corporate fund revenue growth during this period, due largely to normal growth in wages and other personnel related costs. In 2019 and 2020, expenditures are projected
FY2012 FY2013 FY2014 FY2015 FY2016 FY2017 FY2018 FY2019 FY20202011 AFA (635.7)$ (741.4)$ (790.7)$ 2012 AFA (369.0)$ (466.0)$ (580.0)$ 2013 AFA (338.7)$ (400.9)$ (528.6)$ 2014 AFA (297.3)$ (430.2)$ (587.7)$ 2015 AFA (232.6)$ (334.9)$ (436.0)$ 2016 AFA (137.6)$ (233.2)$ (324.2)$ 2017 AFA (114.2)$ (212.7)$ (330.3)$
2019-2020 PROJECTED GAP, PREVIOUS AND CURRENT AFAS$ Millions
2019 2020Positive Outlook ($21.1) ($89.5)Base Outlook ($212.7) ($330.3)Negative Outlook ($604.7) ($812.1)
2019-2020 PROJECTED OPERATING GAP$ Millions

A n n u a l F i n a n c i a l A n a l y s i s 2 0 1 7
20
Financial Forecast
to increase by approximately 3.0 percent annually over 2018 costs. In 2019, the projected expenditures reach $3,961.6 million, and in 2020, expenditures are projected to increase to $4,077.4 million.
Under the base outlook, most non-personnel categories of expenditures, including motor fuel, settlements and judgments, and other miscellaneous expenses are assumed to grow at their historical average rates. Salary and wages and healthcare expenditures – the largest portion of the City’s operating expenses – are projected based on the assumption that the number of full time equivalent positions will remain stable and that the costs associated with these positions will experience growth in line with long-term, historical trends.
Under the base outlook, the City would experience a structural budget shortfall of $212.7 million and $330.3 million in 2019 and 2020, respectively. Negative Outlook
The negative outlook presents a picture of City finances under stagnant to declining economic conditions in which revenues do not grow and actually decrease in some cases with expenditures growing at a significantly outpacing. Total corporate fund revenues in 2019 under this scenario are projected to be $3,633.1 million in 2019 and $3,627.7 million in 2020.
Slow economic growth coupled with cautious consumer sentiment would limit spending on retail goods, entertainment, and tourism impacting the majority of economically sensitive revenues from amusement taxes to transaction taxes. Economic factors, such as rising unemployment and contractions in the real estate market, would impact transaction tax revenue as well.
Assuming a similarly negative outlook for expenditures, in which City spending increases more rapidly over the next three years, corporate fund operating expenditures are driving the large operating shortfall. Costs in 2019 and 2020 would significantly outpace revenues, growing at an average annual rate of roughly 5.0 percent to $4,237.8 million in 2019 and $4,439.9 million in 2020. Most categories of expenditures are assumed to grow at the rates seen during their fastest period of historical growth in the past decade.Under the negative outlook, the City’s operating budget
shortfall would grow to $604.7 million in 2019 and $812.1 million in 2020.
Positive Outlook
The positive outlook assumes that the economy will grow at a slightly faster rate over the next three years resulting in modest revenue growth in corresponding revenues and slower average annual growth rate in expenses.
The positive outlook projects modest corporate fund revenue growth, resulting in total corporate fund revenues of $3,865.4 million in 2019 and $3,869.7 million in 2020. Under these projections, there is greater growth in areas where more moderate to flat growth was predicted under the base outlook. Transaction taxes and sales tax revenues grow in this scenario as the economy expands, tourism increases, and consumer confidence and spending also increase. In addition, as wages grow, employment rates improve, and corporate profits and income tax revenues increase. As a result, recreation taxes would grow at a rate of nearly 2.0 percent annually, while income tax is projected to grow by approximately 5.4 percent in 2019 and another 2.3 percent in 2020.
Under this positive outlook, the City is able to limit its future average annual growth rate, keeping expenditures lower than the base outlook. Total corporate fund expenditures grow to $3,886.4 million in 2019 and $3,959.3 million in 2020. Under this scenario, wage and salary costs experience a lower rate of growth, and healthcare costs remain flat. Spending on contractual services and commodities and materials grows slightly over current levels and favorable pricing is assumed for motor fuel and utilities, allowing the City to take further advantage of lower fuel prices through hedging.
Under a positive outlook, the ability to control expenditures, even with moderate revenue growth, the budget deficit in 2019 is projected to be $21.1 million and $89.5 million in 2020.
Outlook for Special Revenue Funds
Vehicle Tax Fund
The City anticipates revenue from the sale of vehicle stickers and other revenues in the vehicle tax fund will finish 2017 at $195.6 million, or 1.7 percent above budgeted expectations. The year-end revenue estimate for vehicle stickers is $126

A n n u a l F i n a n c i a l A n a l y s i s 2 0 1 7
21
million, which is $1.7 million below budgeted expectations, but this is offset by increased revenue from pavement cut fees, pushing the fund to end the year above budget.
Projected fund revenue for 2018 through 2020 is expected to increase slightly due to mandated increases in vehicle sticker fees resulting from rate adjustments based on consumer price index (CPI) changes. The first CPI rate adjustment was effective July 1, 2016, and another adjustment is expected on July 1, 2018. Rates increased 0.84 percent over prior rates in July 2016 and the 2018 vehicle sticker estimate assumes a 1.5 percent CPI increase effective July 1, 2018, with a similar increase in July 2020. Final rate adjustments will be based on actual CPI figures when available.
Other revenues to this fund, including impoundment fees, pavement cut fees, and reimbursements, are expected to remain approximately even with 2017 year-end revenue levels through 2020.
Motor Fuel Tax FundRevenues in the motor fuel tax fund are projected to end 2017 near budgeted levels at $72.3 million. Despite a long-term trend of declining revenue from fuel taxes, revenues are expected to increase slightly over the next few years as businesses and consumers alike continue to take advantage of low fuel prices.
The chart below reflects projected revenues in the motor fuel tax fund, which includes the City’s distributive share of motor fuel tax revenues from the State of Illinois and other revenues related to the Chicago Riverwalk. Both revenue streams are expected to grow in the coming years. A portion of motor fuel tax revenue is used to pay debt service on outstanding bonds. Revenue from Riverwalk concessions and tour boat operations has been pledged to pay debt service on a loan issued by the U.S. Department of Transportation under the Transportation Infrastructure Finance Innovation Act (TIFIA). The City used proceeds from the TIFIA loan to fund expansion of the Chicago Riverwalk.
Special Events and Hotel Operators’ Occupation Tax Fund
Further growth in business travel and tourism to Chicago will help hotel tax revenue and festival-related revenues grow modestly in 2017 and beyond. The year-end estimate for 2017 for hotel tax revenue is $23.6 million while the City’s special events and festivals are expected to generate $11.8 million.
Industry forecasts remain positive for growth in tourism, convention, and business travel. Based on this forecast, the City anticipates growth in both occupancy and room rates, and hotel tax revenue is projected to have steady annual growth through 2020, while event fees are expected to remain constant over the same period.
Financial Forecast
Projected Special Revenue Funds2017 YE Est 2018 2019 2020
$43.
2M
$72.
3M
$195
.6M
$43.
6M
$72.
6M
$197
.1M
$44.
1M
$73.
0M
$198
.1M
$44.
6M
$73.
4M
$199
.0M
Special Events & Hotel Tax Motor Fuel Tax Vehicle Tax Fund
PROJECTED SPECIAL REVENUE FUNDS$ Millions

A n n u a l F i n a n c i a l A n a l y s i s 2 0 1 7
22
Financial Forecast
Outlook for Enterprise Funds
Water and Sewer Funds
Water and sewer rates are expected to increase at the rate of inflation over the next three years, based on the current ordinance. The three-year projections in the chart below also account for anticipated population changes and collection rates; and, current trends in conservation efforts and meter installation. The repairs and upgrades funded with the revenue from these rate increases are discussed in the Capital Investment section of the online version of the AFA.
Aviation Funds
Estimates for the O’Hare and Midway International Airport funds anticipate that revenue, which is set at a level necessary to pay debt service and support the operations of the airports, will increase from 2017 levels by approximately 6.0 percent for O’Hare Airport and 6.0 percent for Midway airport in 2018. The City projects that similar growth will continue into 2019 and 2020 as the airports move forward with large scale capital projects and other improvements necessary to accommodate increased tourism and business travel.
Projected Water Fund and Sewer Fund Revenues2017 YE Est 2018 2019 2020
$371
.9M
$767
.7M
$370
.4M
$764
.5M
$368
.9M
$761
.3M
$367
.4M
$758
.2M
Sewer Fund Water Fund
PROJECTED WATER FUND AND SEWER FUND REVENUES$ Millions


C i t y o f C h i c a g oMayor Rahm Emanuel
w w w . c i t y o f c h i c a g o . o r g
Related Documents


![City of Chicago Dumpster Permit · 2020-05-29 · City of Chicago Dumpster Permit User Guide [Ver. 1.0] City of Chicago 2/10/2015](https://static.cupdf.com/doc/110x72/5f7543ef8295b937ab45fa96/city-of-chicago-dumpster-permit-2020-05-29-city-of-chicago-dumpster-permit-user.jpg)


