ANNUAL REPORT 2018 For the fiscal year ended March 31, 2018 Research & Development Center Touch Panel Division Functional Components Division Connection System Division USB Type-C TM Receptacle ECHONETLite TM Adapter (Wired) “D2 F/G” Resistive Decorative Film Touch Panel Sigfox RF Module “WF923” LGMCard SMK CORPORATION

Welcome message from author
This document is posted to help you gain knowledge. Please leave a comment to let me know what you think about it! Share it to your friends and learn new things together.
Transcript
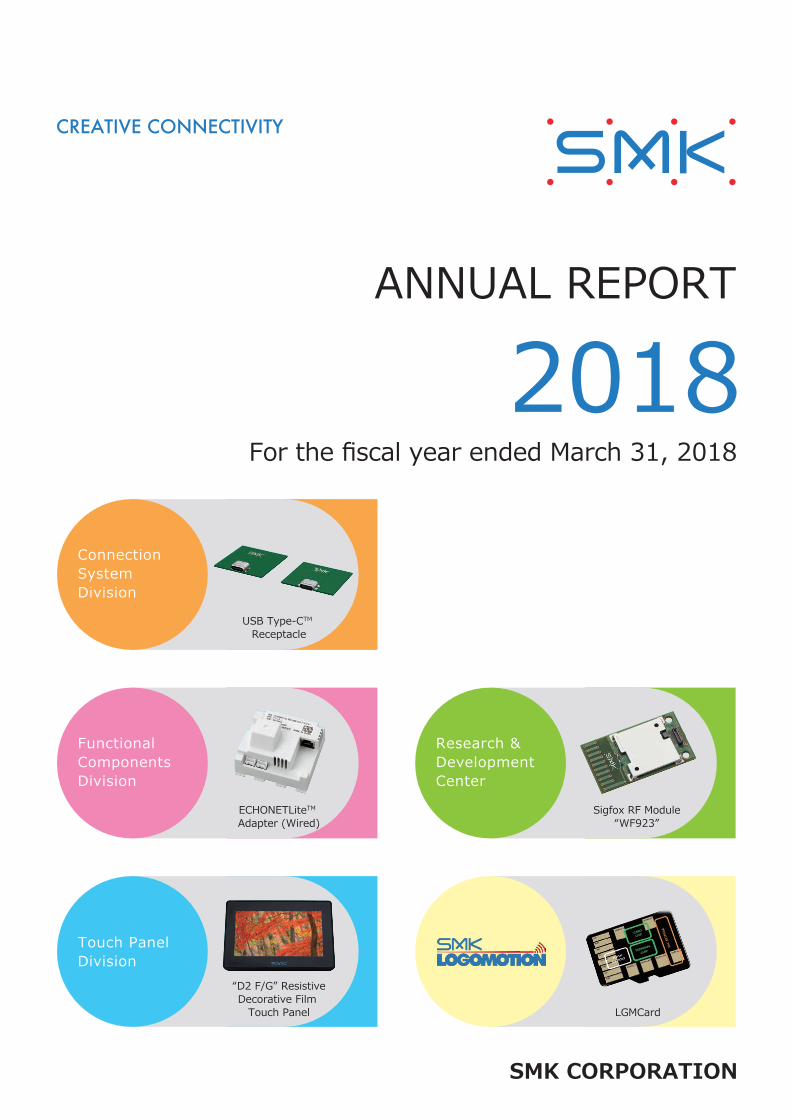
ANNUAL REPORT
2018For the fiscal year ended March 31, 2018
Research & Development Center
Touch Panel Division
Functional Components Division
Connection System Division
USB Type-CTM Receptacle
ECHONETLiteTM Adapter (Wired)
“D2 F/G” ResistiveDecorative Film
Touch Panel
Sigfox RF Module“WF923”
LGMCard
SMK CORPORATION
010_0284001373008.indd 2 2018/08/10 11:41:08
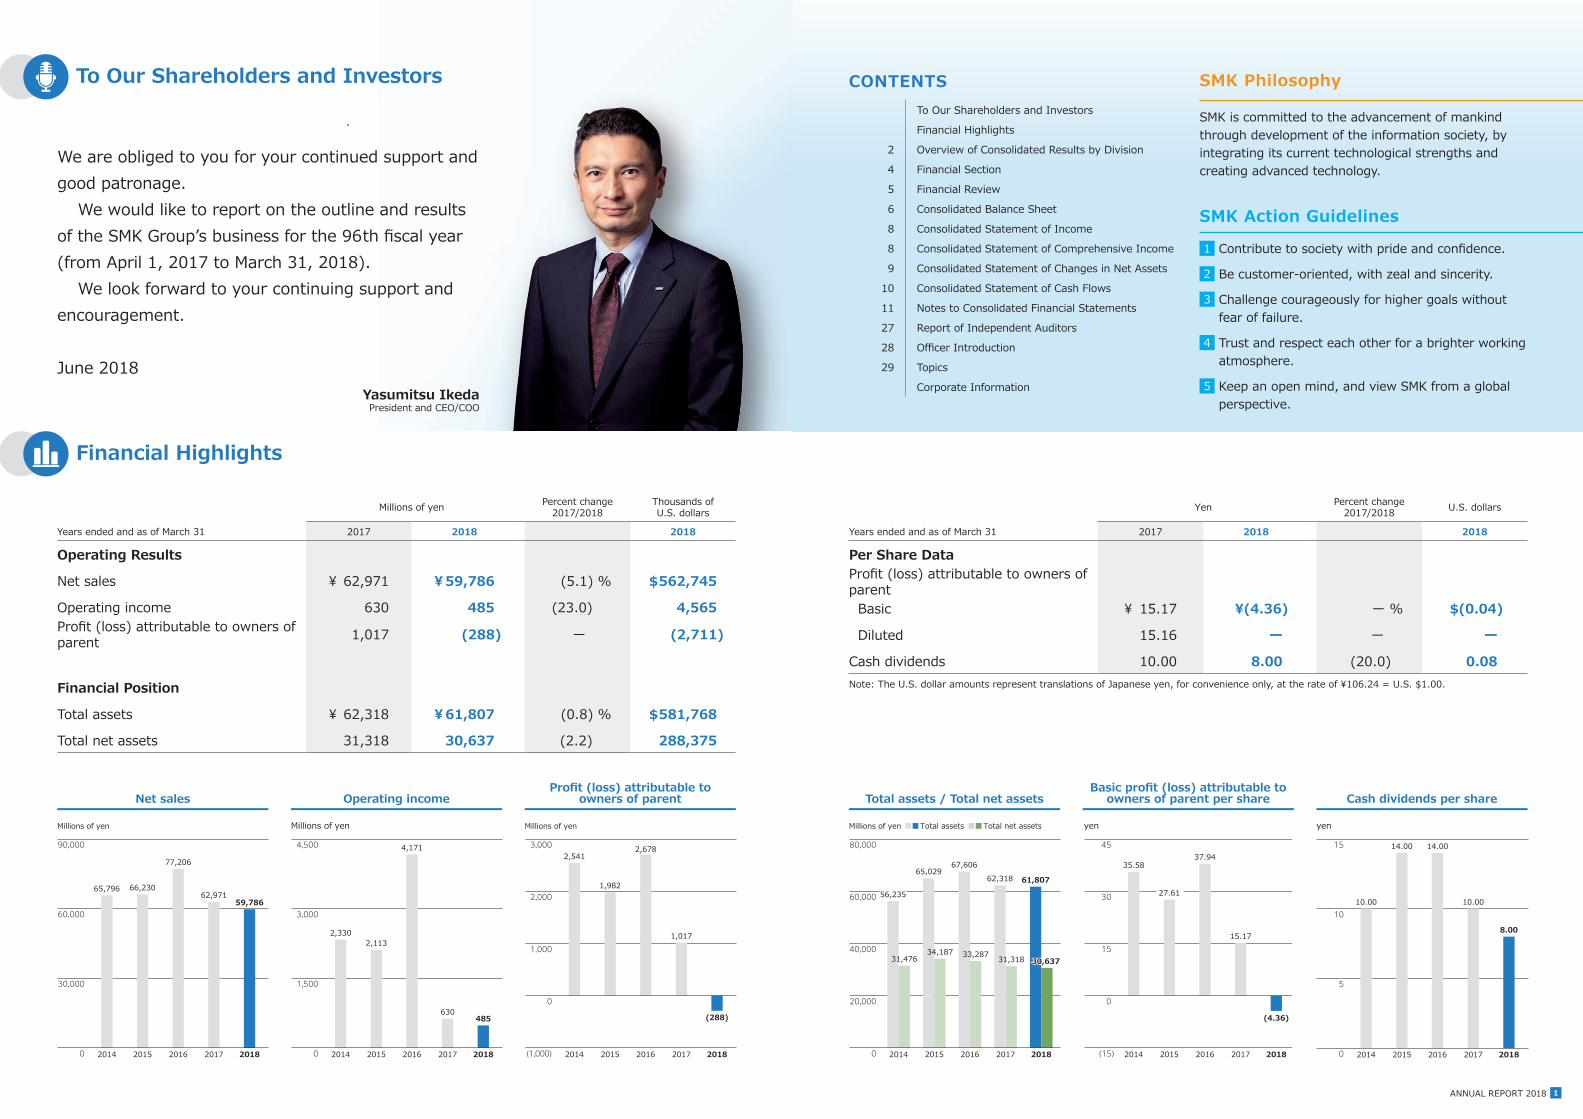
1ANNUAL REPORT 2018
1 Contribute to society with pride and confidence.
2 Be customer-oriented, with zeal and sincerity.
3 Challenge courageously for higher goals without fear of failure.
4 Trust and respect each other for a brighter working atmosphere.
5 Keep an open mind, and view SMK from a global perspective.
CONTENTS
SMK is committed to the advancement of mankind through development of the information society, by integrating its current technological strengths and creating advanced technology.
Millions of yen Percent change2017/2018
Thousands ofU.S. dollars
Years ended and as of March 31 2017 2018 2018
Operating Results
Net sales ¥ 62,971 ¥ 59,786 (5.1) % $ 562,745
Operating income 630 485 (23.0) 4,565 Profit (loss) attributable to owners of parent 1,017 (288) ー (2,711)
Financial Position
Total assets ¥ 62,318 ¥ 61,807 (0.8) % $ 581,768
Total net assets 31,318 30,637 (2.2) 288,375
Yen Percent change2017/2018 U.S. dollars
Years ended and as of March 31 2017 2018 2018
Per Share DataProfit (loss) attributable to owners of parent Basic ¥ 15.17 ¥(4.36) ー % $(0.04)
Diluted 15.16 ー ー ー
Cash dividends 10.00 8.00 (20.0) 0.08Note: The U.S. dollar amounts represent translations of Japanese yen, for convenience only, at the rate of ¥106.24 = U.S. $1.00.
Net salesBasic profit (loss) attributable to
owners of parent per shareOperating income Total assets / Total net assetsProfit (loss) attributable to
owners of parent Cash dividends per share
Yasumitsu IkedaPresident and CEO/COO
We are obliged to you for your continued support and good patronage.
We would like to report on the outline and results of the SMK Group’s business for the 96th fiscal year (from April 1, 2017 to March 31, 2018).
We look forward to your continuing support and encouragement.
June 2018
2014 2015 2016 2017 2018
66,230
77,206
Millions of yen
0
30,000
60,000
90,000
62,97159,786
65,796
2,113
4,171
Millions of yen
0
1,500
3,000
4,500
630485
2,330
2014 2015 2016 2017 2018
1,982
2,678
Millions of yen
1,000
2,000
3,000
(1,000)
1,017
(288)
2,541
0
2014 2015 2016 2017 2018
65,02967,606
Millions of yen
20,000
40,000
60,000
80,000
34,187 33,287
62,318 61,807
31,318 30,63730,63731,476
0 2014 2015 2016 2017 2018
56,235
Total assets Total net assets
37.94
yen
0
15
30
45
(15)
15.17
(4.36)
35.58
2014 2015 2016 2017 2018
27.61
14.00 14.00
yen
0
5
10
15
10.00
8.00
10.00
2014 2015 2016 2017 2018
Financial Highlights
To Our Shareholders and InvestorsTo Our Shareholders and Investors
Financial Highlights
2 Overview of Consolidated Results by Division
4 Financial Section
5 Financial Review
6 Consolidated Balance Sheet
8 Consolidated Statement of Income
8 Consolidated Statement of Comprehensive Income
9 Consolidated Statement of Changes in Net Assets
10 Consolidated Statement of Cash Flows
11 Notes to Consolidated Financial Statements
27 Report of Independent Auditors
28 Officer Introduction
29 Topics
Corporate Information
SMK Philosophy
SMK Action Guidelines
010_0284001373008.indd 3-1 2018/08/10 11:39:36
32 ANNUAL REPORT 2018 ANNUAL REPORT 2018
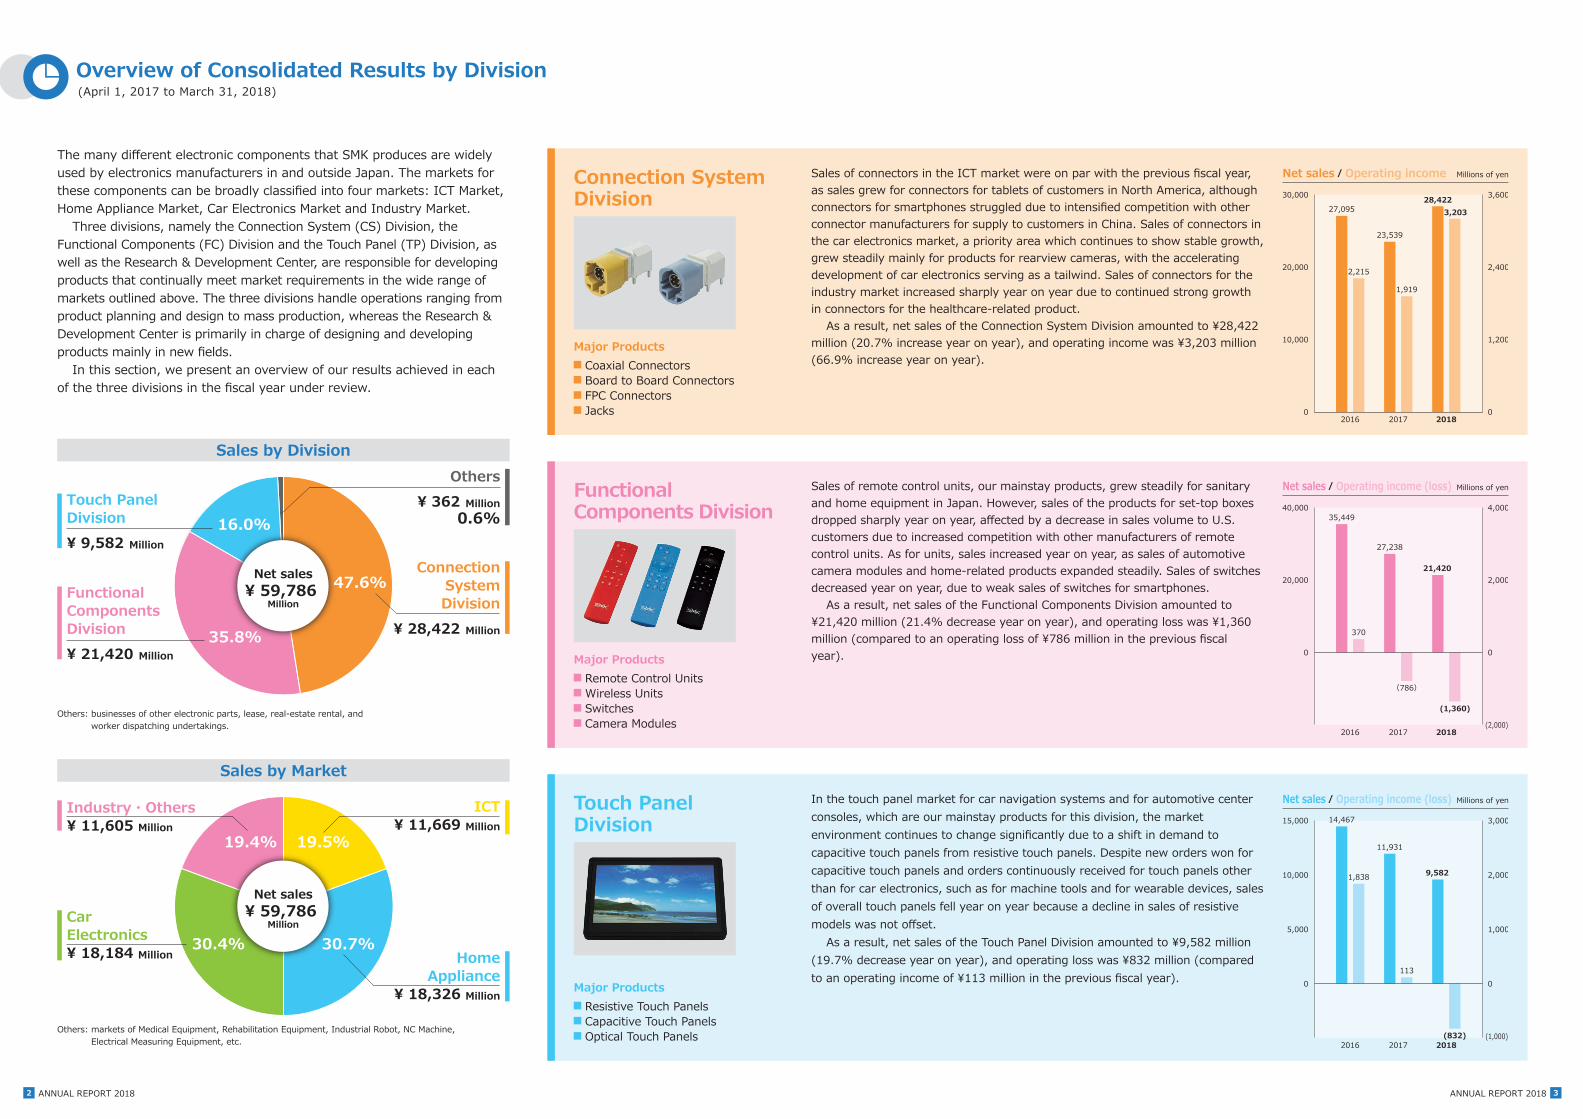
The many different electronic components that SMK produces are widely used by electronics manufacturers in and outside Japan. The markets for these components can be broadly classified into four markets: ICT Market, Home Appliance Market, Car Electronics Market and Industry Market.
Three divisions, namely the Connection System (CS) Division, the Functional Components (FC) Division and the Touch Panel (TP) Division, as well as the Research & Development Center, are responsible for developing products that continually meet market requirements in the wide range of markets outlined above. The three divisions handle operations ranging from product planning and design to mass production, whereas the Research & Development Center is primarily in charge of designing and developing products mainly in new fields.
In this section, we present an overview of our results achieved in each of the three divisions in the fiscal year under review.
Others: markets of Medical Equipment, Rehabilitation Equipment, Industrial Robot, NC Machine, Electrical Measuring Equipment, etc.
Others: businesses of other electronic parts, lease, real-estate rental, and worker dispatching undertakings.
Sales of connectors in the ICT market were on par with the previous fiscal year, as sales grew for connectors for tablets of customers in North America, although connectors for smartphones struggled due to intensified competition with other connector manufacturers for supply to customers in China. Sales of connectors in the car electronics market, a priority area which continues to show stable growth, grew steadily mainly for products for rearview cameras, with the accelerating development of car electronics serving as a tailwind. Sales of connectors for the industry market increased sharply year on year due to continued strong growth in connectors for the healthcare-related product.
As a result, net sales of the Connection System Division amounted to ¥28,422 million (20.7% increase year on year), and operating income was ¥3,203 million (66.9% increase year on year).
Major ProductsCoaxial ConnectorsBoard to Board ConnectorsFPC ConnectorsJacks
Sales of remote control units, our mainstay products, grew steadily for sanitary and home equipment in Japan. However, sales of the products for set-top boxes dropped sharply year on year, affected by a decrease in sales volume to U.S. customers due to increased competition with other manufacturers of remote control units. As for units, sales increased year on year, as sales of automotive camera modules and home-related products expanded steadily. Sales of switches decreased year on year, due to weak sales of switches for smartphones.
As a result, net sales of the Functional Components Division amounted to ¥21,420 million (21.4% decrease year on year), and operating loss was ¥1,360 million (compared to an operating loss of ¥786 million in the previous fiscal year).
Functional Components Division
Major ProductsRemote Control UnitsWireless UnitsSwitchesCamera Modules
In the touch panel market for car navigation systems and for automotive center consoles, which are our mainstay products for this division, the market environment continues to change significantly due to a shift in demand to capacitive touch panels from resistive touch panels. Despite new orders won for capacitive touch panels and orders continuously received for touch panels other than for car electronics, such as for machine tools and for wearable devices, sales of overall touch panels fell year on year because a decline in sales of resistive models was not offset.
As a result, net sales of the Touch Panel Division amounted to ¥9,582 million (19.7% decrease year on year), and operating loss was ¥832 million (compared to an operating income of ¥113 million in the previous fiscal year).
Touch Panel Division
Major ProductsResistive Touch PanelsCapacitive Touch PanelsOptical Touch Panels
Net sales / Operating income Millions of yen
Sales by Market
Net sales / Operating income (loss) Millions of yen
Net sales / Operating income (loss) Millions of yen
ConnectionSystemDivision
¥ 28,422 Million
Others¥ 362 Million
0.6%
47.6%
16.0%
35.8%
Touch PanelDivision¥ 9,582 Million
FunctionalComponentsDivision¥ 21,420 Million
Net sales¥ 59,786
Million
Sales by Division
ICT¥ 11,669 Million
CarElectronics¥ 18,184 Million
Industry・Others¥ 11,605 Million
HomeAppliance
¥ 18,326 Million
30.4% 30.7%
19.5%19.4%
Net sales¥ 59,786
Million
14,467
1,838
11,931
113
9,582
(832)2016 2017 2018
0
5,000
10,000
15,000
0
1,000
(1,000)
2,000
3,000
35,449
370
27,238
(786)
21,420
(1,360)
2016 2017 2018
0
20,000
40,000
(2,000)
0
2,000
4,000
27,095
2,215
23,539
1,919
28,4223,203
2016 2017 20180
10,000
20,000
30,000
0
1,200
2,400
3,600Connection System Division
Overview of Consolidated Results by Division(April 1, 2017 to March 31, 2018)
010_0284001373008.indd 2-3 2018/08/10 11:39:38

54 ANNUAL REPORT 2018 ANNUAL REPORT 2018
Millions of yen Thousands ofU.S. dollars
Years ended and as of March 31 2014 2015 2016 2017 2018 2018
Operating Results
Net sales ¥ 65,796 ¥ 66,230 ¥ 77,206 ¥ 62,971 ¥ 59,786 $ 562,745
Operating income 2,330 2,113 4,171 630 485 4,565
Profit (loss) attributable to owners of parent 2,541 1,982 2,678 1,017 (288) (2,711)
Financial Position
Total assets ¥ 56,235 ¥ 65,029 ¥ 67,606 ¥ 62,318 ¥ 61,807 $ 581,768
Total net assets 31,476 34,187 33,287 31,318 30,637 288,375
Yen U.S. dollars
Per Share Data
Total net assets ¥ 437.84 ¥ 475.42 ¥ 471.02 ¥ 473.50 ¥ 463.50 $ 4.36
Profit (loss) attributable to owners of parent
Basic 35.58 27.61 37.94 15.17 (4.36) (0.04)
Diluted 35.52 27.56 37.86 15.16 - -
Cash dividends 10.00 14.00 14.00 10.00 8.00 0.08
Note: The U.S. dollar amounts represent translations of Japanese yen, for convenience only, at the rate of ¥106.24 = U.S. $1.00.
Five-Year SummarySMK Corporation and Consolidated Subsidiaries
SMK’s net sales for the fiscal year ended March 31, 2018, decreased 5.1% year on year to ¥59,786 million (US$562,745 thousand), whereas operating income of ¥485 million (US$4,565 thousand) and loss attributable to owners of parent of ¥288 million (US$2,711 thousand) were recorded.
Despite favorable sales growth in products such as connectors for the healthcare market and automotive camera modules, sales of products such as connectors for smartphones for China, remote control units for set-top boxes for the U.S. customers and touch panels for automobiles were sluggish due to intensified competition in the market environment and other factors.
As a result, net sales were ¥59,786 million (US$562,745 thousand), down 5.1% year on year.
Net Sales
Despite our efforts such as proactive launch of new products and initiatives taken to reduce cost of sales and cut expenses, operating income amounted to ¥485 million (US$4,565 thousand) due to profit decreasing factors such as decreases in net sales and currency fluctuations.
Operating Income
Loss attributable to owners of parent was ¥288 million (US$2,711 thousand) as a result of recording rent income, rent expense, gain on sales of fixed assets, loss on impairment of fixed assets, etc. in other income and other expenses.
Loss attributable to owners of parent
As of March 31, 2018, total assets were ¥61,807 million (US$581,768 thousand), with ROA of (0.5) %.
Total Assets / ROA
As of March 31, 2018, total net assets were ¥30,637 million (US$288,375 thousand), with ROE of (0.9) %.
Total Net Assets / ROE
Cash Flows
Total net assets(As of March 31)
Return on equity (ROE)(Years ended March 31)
Return on assets (ROA)(Years ended March 31)
2014 2015 2016 2017 2018
Millions of yen
31,476
34,187
30,637
33,287
31,318
0
30,000
32,000
34,000
36,000
2014(4) 2015 2016 2017 2018
%
8.5
6.0
8.0
3.2
0
4
8
12
(0.9)
2014(2) 2015 2016 2017 2018
%
4.7
3.3
(0.5)
4.0
1.6
2
0
4
6
Financial Section Financial Review
Net cash provided by operating activities amounted to ¥2,788 million (US$26,242 thousand), net cash used in investing activities totaled ¥787 million (US$7,408 thousand), and net cash used in financing activities was ¥1,774 million (US$16,698 thousand).
010_0284001373008.indd 4-5 2018/08/10 11:39:39
76 ANNUAL REPORT 2018 ANNUAL REPORT 2018
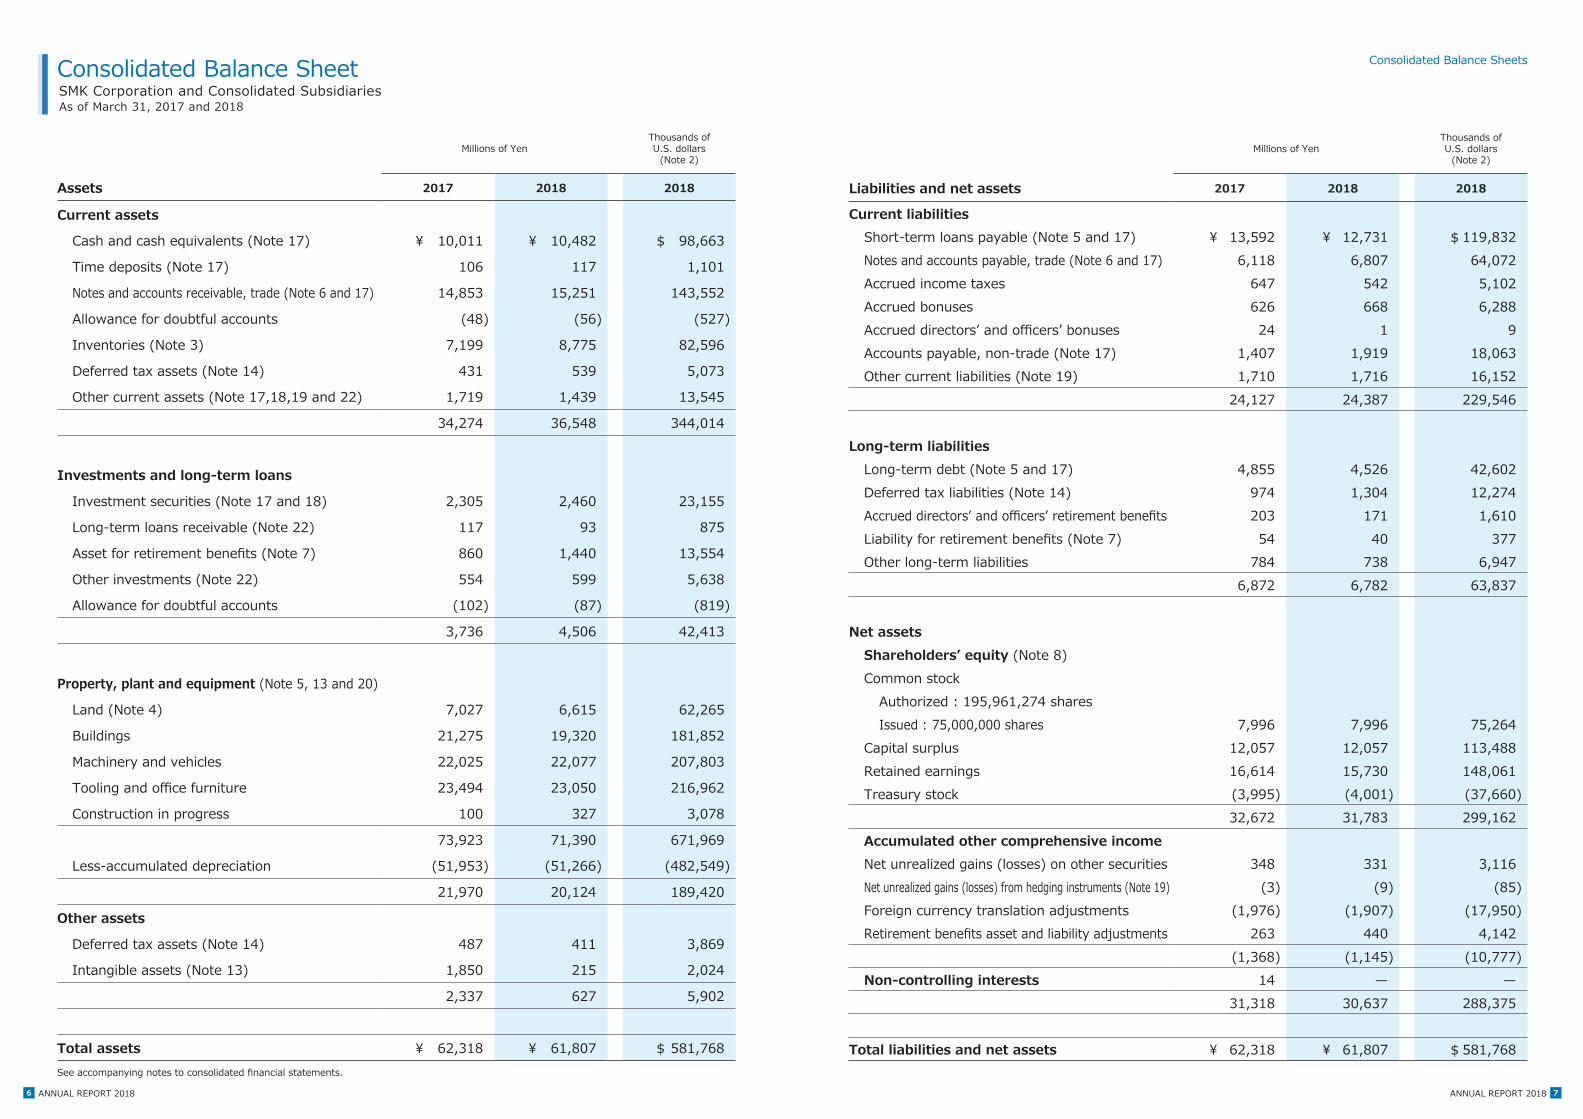
Millions of YenThousands ofU.S. dollars
(Note 2)
Assets 2017 2018 2018
Current assets
Cash and cash equivalents (Note 17) ¥ 10,011 ¥ 10,482 $ 98,663
Time deposits (Note 17) 106 117 1,101
Notes and accounts receivable, trade (Note 6 and 17) 14,853 15,251 143,552
Allowance for doubtful accounts (48) (56) (527)
Inventories (Note 3) 7,199 8,775 82,596
Deferred tax assets (Note 14) 431 539 5,073
Other current assets (Note 17,18,19 and 22) 1,719 1,439 13,545
34,274 36,548 344,014
Investments and long-term loans
Investment securities (Note 17 and 18) 2,305 2,460 23,155
Long-term loans receivable (Note 22) 117 93 875
Asset for retirement benefits (Note 7) 860 1,440 13,554
Other investments (Note 22) 554 599 5,638
Allowance for doubtful accounts (102) (87) (819)
3,736 4,506 42,413
Property, plant and equipment (Note 5, 13 and 20)
Land (Note 4) 7,027 6,615 62,265
Buildings 21,275 19,320 181,852
Machinery and vehicles 22,025 22,077 207,803
Tooling and office furniture 23,494 23,050 216,962
Construction in progress 100 327 3,078
73,923 71,390 671,969
Less-accumulated depreciation (51,953) (51,266) (482,549)
21,970 20,124 189,420
Other assets
Deferred tax assets (Note 14) 487 411 3,869
Intangible assets (Note 13) 1,850 215 2,024
2,337 627 5,902
Total assets ¥ 62,318 ¥ 61,807 $ 581,768
Millions of YenThousands ofU.S. dollars
(Note 2)
Liabilities and net assets 2017 2018 2018
Current liabilitiesShort-term loans payable (Note 5 and 17) ¥ 13,592 ¥ 12,731 $ 119,832Notes and accounts payable, trade (Note 6 and 17) 6,118 6,807 64,072Accrued income taxes 647 542 5,102Accrued bonuses 626 668 6,288Accrued directors’ and officers’ bonuses 24 1 9Accounts payable, non-trade (Note 17) 1,407 1,919 18,063Other current liabilities (Note 19) 1,710 1,716 16,152
24,127 24,387 229,546
Long-term liabilitiesLong-term debt (Note 5 and 17) 4,855 4,526 42,602Deferred tax liabilities (Note 14) 974 1,304 12,274Accrued directors’ and officers’ retirement benefits 203 171 1,610Liability for retirement benefits (Note 7) 54 40 377Other long-term liabilities 784 738 6,947
6,872 6,782 63,837
Net assetsShareholders’ equity (Note 8)Common stock
Authorized : 195,961,274 sharesIssued : 75,000,000 shares 7,996 7,996 75,264
Capital surplus 12,057 12,057 113,488Retained earnings 16,614 15,730 148,061Treasury stock (3,995) (4,001) (37,660)
32,672 31,783 299,162Accumulated other comprehensive incomeNet unrealized gains (losses) on other securities 348 331 3,116Net unrealized gains (losses) from hedging instruments (Note 19) (3) (9) (85)Foreign currency translation adjustments (1,976) (1,907) (17,950)Retirement benefits asset and liability adjustments 263 440 4,142
(1,368) (1,145) (10,777)Non-controlling interests 14 — —
31,318 30,637 288,375
Total liabilities and net assets ¥ 62,318 ¥ 61,807 $ 581,768
SMK Corporation and Consolidated SubsidiariesAs of March 31, 2017 and 2018
Consolidated Balance Sheet Consolidated Balance Sheets
See accompanying notes to consolidated financial statements.
011_0284001373008.indd 6-7 2018/08/10 11:40:05

98 ANNUAL REPORT 2018 ANNUAL REPORT 2018
Millions of YenThousands ofU.S. dollars
(Note 2)
2017 2018 2018Net sales (Note 21) ¥ 62,971 ¥ 59,786 $ 562,745 Cost of sales (Note 3 and 10) 52,211 49,429 465,258Selling, general and administrative expenses (Note 10 and 11) 10,130 9,871 92,912Operating income (Note 21) 630 485 4,565
Other incomeInterest and dividend income (Note 22) 95 98 922Rent income 1,243 1,175 11,060Gain on sales of fixed assets (Note 12) 459 2,341 22,035Gain on sales of investment securities (Note 18) 99 0 0Gain on redemption of investment securities — 46 433Other 378 297 2,796
Total other income 2,275 3,960 37,274
Other expensesInterest expense 124 114 1,073Rent expense (Note 22) 615 571 5,375Foreign exchange loss, net 25 921 8,669Loss on disposal of fixed assets (Note 12) 260 172 1,619Loss on impairment of fixed assets (Note 13) 443 1,815 17,084Loss on valuation of investment securities — 181 1,704Other 195 96 904
Total other expenses 1,664 3,875 36,474
Profit before income taxes 1,241 570 5,365Income taxes (Note 14)
Current 749 821 7,728Deferred (272) 51 480
Profit (loss) 764 (302) (2,843)Loss attributable to non-controlling interests (252) (14) (132)Profit (loss) attributable to owners of parent ¥ 1,017 ¥ (288) $ (2,711)
Yen U.S. dollars(Note 2)
Per share data (Note 16)Total net assets ¥ 473.50 ¥ 463.50 $ 4.36 Profit (loss) attributable to owners of parent
Basic 15.17 (4.36) (0.04) Diluted 15.16 — —
Cash dividends 10.00 8.00 0.08 See accompanying notes to consolidated financial statements.
Millions of YenThousands ofU.S. dollars
(Note 2)
2017 2018 2018Profit (loss) ¥ 764 ¥ (302) $ (2,843) Other comprehensive income(Note 15)
Net unrealized gains (losses) on other securities 171 (17) (160)Net unrealized gains (losses) from hedging instruments (3) (5) (47)Foreign currency translation adjustments (469) 69 649 Retirement benefits asset and liability adjustments 39 177 1,666 Total other comprehensive income (262) 223 2,099
Comprehensive income ¥ 502 ¥ (79) $ (744) Total comprehensive income attributable to:
Owners of parent ¥ 754 ¥ (65) $ (612) Non-controlling interests ¥ (252) ¥ (14) $ (132)
See accompanying notes to consolidated financial statements.
SMK Corporation and Consolidated SubsidiariesYears ended March 31, 2017 and 2018
Consolidated Statement of IncomeSMK Corporation and Consolidated SubsidiariesYears ended March 31, 2017 and 2018
Consolidated Statement of Changes in Net Assets
SMK Corporation and Consolidated SubsidiariesYears ended March 31, 2017 and 2018
Consolidated Statement of Comprehensive Income
Millions of yen
Shareholders’ equity Accumulated other comprehensive income
Subscription rights to
shares
Non-controlling
interestsTotal net
assets
Number of shares of common
stockCommon
stockCapital surplus
Retained earnings
Treasury stock
Total shareholders’
equity
Net unrealized gains (losses)
on other securities
Net unrealized gains (losses) from hedging
instruments
Foreign currency
translation adjustments
Retirement benefits asset
and liability adjustments
Total accumulated
other comprehensive
income
Balance at April 1, 2016 79,000,000 ¥7,996 ¥12,309 ¥18,149 ¥(4,353) ¥34,102 ¥176 ¥— ¥(1,506) ¥223 ¥(1,106) ¥25 ¥266 ¥33,287Cash dividends paid (891) (891) — (891)Profit attributable to owners of parent 1,017 1,017 — 1,017Acquisition of treasury stock (1,579) (1,579) — (1,579)Disposition of treasury stock (0) (0) 25 24 — 24Retirement of treasury stock (4,000,000) (251) (1,660) 1,911 — — —Net changes in items other than shareholders' equity — 171 (3) (469) 39 (262) (25) (252) (539)Total changes — — (252) (1,534) 357 (1,429) 171 (3) (469) 39 (262) (25) (252) (1,969)
Balance at March 31, 2017 75,000,000 7,996 12,057 16,614 (3,995) 32,672 348 (3) (1,976) 263 (1,368) — 14 31,318Balance at April 1, 2017 75,000,000 7,996 12,057 16,614 (3,995) 32,672 348 (3) (1,976) 263 (1,368) — 14 31,318
Cash dividends paid (594) (594) — (594)Loss attributable to owners of parent (288) (288) — (288)Acquisition of treasury stock (5) (5) — (5)Disposition of treasury stock — — —Retirement of treasury stock — — —Net changes in items other than shareholders’ equity — (17) (5) 69 177 223 — (14) 208Total changes — — — (883) (5) (889) (17) (5) 69 177 223 — (14) (680)
Balance at March 31, 2018 75,000,000 ¥7,996 ¥12,057 ¥15,730 ¥(4,001) ¥31,783 ¥331 ¥(9) ¥(1,907) ¥440 ¥(1,145) ¥— ¥— ¥30,637
Thousands of U.S. dollars (Note 2)
Shareholders’ equity Accumulated other comprehensive income
Subscription rights to
shares
Non-controlling
interestsTotal net
assetsCommon
stockCapital surplus
Retained earnings
Treasury stock
Total shareholders’
equity
Net unrealized gains (losses)
on other securities
Net unrealized gains (losses) from hedging
instruments
Foreign currency
translation adjustments
Retirement benefits asset
and liability adjustments
Total accumulated
other comprehensive
income
Balance at April 1, 2017 $75,264 $113,488 $156,382 $(37,604) $307,530 $3,276 $(28) $(18,599) $2,476 $(12,877) $— $132 $294,785Cash dividends paid (5,591) (5,591) — (5,591)Loss attributable to owners of parent (2,711) (2,711) — (2,711)Acquisition of treasury stock (47) (47) — (47)Disposition of treasury stock — — —Retirement of treasury stock — — —Net changes in items other than shareholders’ equity — (160) (47) 649 1,666 2,099 — (132) 1,958
Total changes — — (8,311) (47) (8,368) (160) (47) 649 1,666 2,099 — (132) (6,401)Balance at March 31, 2018 $75,264 $113,488 $148,061 $(37,660) $299,162 $3,116 $(85) $(17,950) $4,142 $(10,777) $— $— $288,375
011_0284001373008.indd 8-9 2018/08/10 11:40:05

1110 ANNUAL REPORT 2018 ANNUAL REPORT 2018
Millions of YenThousands ofU.S. dollars
(Note 2)
2017 2018 2018 Cash flows from operating activities
Profit before income taxes ¥ 1,241 ¥ 570 $ 5,365 Depreciation and amortization 4,381 4,187 39,411 Loss on impairment of fixed assets 443 1,815 17,084 Amortization of goodwill 137 — — Increase (decrease) in accrued bonuses (337) 40 377 Increase (decrease) in accrued directors’ and officers' retirement benefits 15 (31) (292) Increase (decrease) in asset and liability for retirement benefits (257) (382) (3,596) Interest and dividend income (95) (98) (922) Interest expense 124 114 1,073 (Gain) loss on sales of investment securities (99) (0) (0)(Gain) loss on redemption of investment securities — (46) (433) (Gain) loss on sales of fixed assets (459) (2,339) (22,016) (Gain) loss on valuation of investment securities — 181 1,704 Loss on disposal of fixed assets 260 172 1,619 (Increase) decrease in notes and accounts receivable, trade 1,110 (626) (5,892) (Increase) decrease in inventories (192) (1,662) (15,644) Increase (decrease) in notes and accounts payable, trade 2,047 777 7,314 (Increase) decrease in accounts receivable, non-trade 1,459 160 1,506 Increase (decrease) in accounts payable, non-trade (4,364) 692 6,514 Other (41) 209 1,967
Subtotal 5,371 3,735 35,156 Interest and dividends received 95 87 819 Interest paid (124) (110) (1,035) Income taxes paid (737) (923) (8,688)
Net cash provided by (used in) operating activities 4,604 2,788 26,242 Cash flows from investing activities
Payments into time deposits (103) (116) (1,092) Proceeds from time deposits 101 108 1,017 Purchases of fixed assets (4,680) (3,626) (34,130) Proceeds from sales of fixed assets 1,039 3,161 29,753 Payments for retirement of fixed assets — (29) (273) Purchases of intangible fixed assets (162) (59) (555) Purchases of investment securities (50) (282) (2,654) Proceeds from sales of investment securities 430 0 0 Proceeds from redemption of investment securities — 68 640 Payments for execution of loans (125) (39) (367) Collection of loans receivable 97 70 659 Other (11) (43) (405)
Net cash provided by (used in) investing activities (3,465) (787) (7,408) Cash flows from financing activities
Increase (decrease) in short-term loans payable 1,395 (1,668) (15,700) Proceeds from long-term debt 1,494 2,490 23,438 Payments of long-term debt (1,987) (2,007) (18,891) Purchases of treasury stock (1,578) (4) (38) Proceeds from sales of treasury stock 24 — — Dividends paid (889) (594) (5,591) Other — 10 94
Net cash provided by (used in) financing activities (1,541) (1,774) (16,698) Effect of exchange rate changes on cash and cash equivalents (254) 242 2,278 Increase (decrease) in cash and cash equivalents (656) 470 4,424 Cash and cash equivalents at beginning of the year 10,668 10,011 94,230 Cash and cash equivalents at end of the year ¥10,011 ¥10,482 $98,663
SMK Corporation and Consolidated SubsidiariesYears ended March 31, 2017 and 2018
Consolidated Statement of Cash Flows
Note 1. Summary of significant accounting policies( a ) Basis of presenting financial statements The accompanying consolidated financial statements of SMK Corporation (the “Company” ) and consolidated subsidiaries
are prepared on the basis of accounting principles generally accepted in Japan, which are different in certain respects as to the application and disclosure requirements of International Financial Reporting Standards, and are compiled from the consolidated financial statements prepared by the Company as required by the Financial Instruments and Exchange Act of Japan. For the purpose of this document, certain reclassifications have been made in the accompanying consolidated financial statements to facilitate understanding by readers outside Japan. In addition, certain reclassifications have been made to the prior year’s consolidated financial statements to conform to the current year’ s presentation.
( b ) Basis of consolidation and investments in affiliated companies The accompanying consolidated financial statements include the accounts of the Company and its subsidiaries over which
substantial control is exercised either through majority ownership of voting stock and/or by other means. All significant intercompany balances and transactions have been eliminated in consolidation. Certain foreign subsidiaries’ fiscal period ends on December 31, which differs from the year-end date of the Company;
however, the accounts of these companies were tentatively closed as of March 31 and the necessary adjustments for consolidation were made.
Investments in affiliates (companies over which the Company has the ability to exercise significant influence) are accounted for by the equity method. Consolidated profit attributable to owners of parent includes the Company’ s equity in the current profit attributable to owners of parent or loss of such companies, after the elimination of unrealized intercompany profits.
All assets and liabilities of the Company’s subsidiaries are revalued at the acquisition, if applicable, and the excess of cost over the underlying net assets at the date of acquisition is amortized over a period of five years on a straight-line basis if such excess is material, or charged to income when incurred if immaterial.
( c ) Scope of consolidation Number of consolidated subsidiaries: 28( d ) Application of equity method of accounting Number of affiliated companies accounted for by the equity method: 1( e ) Translation of foreign currencies All asset and liability accounts of foreign subsidiaries and affiliates are translated into Japanese yen at the appropriate year-
end exchange rates. Shareholders’ equity, which is translated at rates of exchange prevailing at the time the transactions occurred. Revenue and expense accounts are translated at the average rates of exchange prevailing during the year. Differences arising from the translation are presented as translation adjustments in the consolidated financial statements.
( f ) Cash and cash equivalents Cash and cash equivalents are composed of cash and time deposits all of which are low-risk, short-term financial
instruments readily convertible into cash.( g ) Inventories Inventories are mainly stated at the lower of cost or market. The following inventories are measured principally by their
respective methods: Finished products: Retail cost method Work in process: Actual raw material cost, determined by the most recent purchase cost method, plus direct labor costs
and manufacturing overheads Raw materials and supplies: Most recent purchase cost method Consolidated subsidiaries adopt mainly the moving average method.( h ) Securities Marketable securities classified as other securities are carried at fair value with any changes in unrealized holding gain or
loss, net of the applicable income taxes, included directly in net assets. Non-marketable securities classified as other securities are carried at cost. Cost of securities sold is determined by the moving average method.
( i ) Derivatives Derivatives are stated at fair value.( j ) Property, plant and equipment and depreciation Property, plant and equipment are stated at cost. Depreciation of property, plant and equipment is calculated principally by
the declining-balance method for the Company and its domestic subsidiaries, and by the straight-line method mainly for foreign subsidiaries. Certain buildings of the Company and its domestic subsidiaries acquired on or after April 1, 1998 and facilities attached to buildings and other non-building structures acquired on or after April 1, 2016 are depreciated by the straight-line method.
The estimated useful lives of the assets are as follows: Buildings: 10 to 50 years Machinery and vehicles: 4 to 10 years Tooling and office furniture: 2 to 6 years The residual values of the property, plant and equipment acquired on or before March 31, 2007 are depreciated equally
over a period of 5 years starting from the year following the year in which they have been depreciated up to their depreciable limit or 5% of the acquisition cost.
( k ) Intangible assets Amortization of intangible assets is calculated by the straight-line method. Software for own use is amortized based on the
utilizable period (5 years). Goodwill is amortized by the straight-line method mainly over 5 years.
SMK Corporation and Consolidated SubsidiariesNotes to Consolidated Financial Statements
011_0284001373008.indd 10-11 2018/08/10 11:40:06

1312 ANNUAL REPORT 2018 ANNUAL REPORT 2018
( l ) Allowance for doubtful accounts The allowance for doubtful accounts is provided based on past experience for normal receivables and on an estimate of the
collectability of receivables from companies in financial difficulty.( m ) Accrued bonus Accrued bonuses are provided on the estimate of the amounts to be paid in the future by the Company, domestic
consolidated subsidiaries and certain overseas subsidiaries based on an accrual basis at the balance sheet date.( n ) Accrued directors’ and officers’ bonuses Accrued directors’ and officers’ bonuses are provided on the estimate of the amounts to be paid subsequent to the balance
sheet date.( o ) Accrued directors’ and officers’ retirement benefits Accrued directors’ and officers’ retirement benefits have been provided at an amount equal to 100% of the amount which
would be required to be paid based on the Company’s bylaws if all directors and officers resigned from the Company on the balance sheet date.
( p ) Retirement benefits Asset and liability for retirement benefits for employees are recorded mainly at the amount calculated based on the
retirement benefit obligation and the fair value of the pension plan assets as of balance sheet date. The retirement benefit obligation for employees is attributed to each period by the benefit formula method over the
estimated years of service of the eligible employees. Actuarial gain or loss is amortized in the year following the year in which the gain or loss is recognized primarily by the straight-line method over a period of 5 years, which is within the estimated average remaining years of service of employees.
( q ) Hedge accounting( 1 ) Method of hedge accounting Deferral hedge accounting is applied for interest rate swap transactions. The exceptional treatment is applied for interest rate swap transactions meeting certain conditions.( 2 ) Hedging instruments and hedged items Hedging instruments: interest rate swaps Hedged items: long-term debt subject to interest rate fluctuation risk.( 3 ) Hedging policy The Company uses interest rate swaps to hedge risks from interest rate fluctuations on borrowings, only when approved
by the management.( 4 ) Assessment of effectiveness of hedging activities The Company evaluates the hedge effectiveness by comparing accumulated fluctuations of the hedging instrument and
hedged item every quarter. When the exceptional treatment is applied for interest rate swaps, the assessment of hedge effectiveness is omitted.
( r ) Income taxes Deferred income taxes are recognized based on the differences between financial reporting and the tax bases of the assets
and liabilities and are calculated using the enacted tax rates and laws which will be in effect when the differences are expected to reverse.
( s ) Per share information Basic net income per share is computed based on the net income available for distribution to shareholders of common
stock and weighted-average number of shares of common stock outstanding during the year. Diluted profit attributable to owners of parent per share is computed based on the profit attributable to owners of parent available for distribution to shareholders and average number of shares of common stock outstanding during each year after giving effect to the dilutive potential of shares of common stock to be issued upon the conversion of convertible bonds.
Net assets per share is computed based on the net assets available for distribution to shareholders of common stock and the number of shares of common stock outstanding at the balance sheet date. Cash dividends per share shown for each period in the consolidated statement of income represent the dividends applicable to the respective period.
( t ) Consumption taxes Transactions subject to consumption taxes are recorded at amounts exclusive of consumption taxes. Nondeductible
consumption taxes are expensed in the consolidated financial statements.( u ) Accounting standards issued but not yet effective Implementation Guidance on Tax Effect Accounting and Implementation Guidance on Recoverability of Deferred Tax Assets On February 16, 2018, the Accounting Standards Board of Japan (ASBJ) issued “Implementation Guidance on Tax Effect
Accounting” (ASBJ Guidance No.28) and “Implementation Guidance on Recoverability of Deferred Tax Assets” (revised 2018) (ASBJ Guidance No.26).( 1 ) Overview The accounting treatment for taxable temporary differences related to investments in subsidiaries when an entity
prepares separate financial statements was modified. In addition, the accounting treatment related to the recoverability of deferred tax assets in entities that qualify as Category 1 was clarified.
( 2 ) Scheduled date of adoption The Company expects to adopt the implementation guidance from the beginning of the fiscal year ending March 31, 2019.( 3 ) Impact of the adoption of implementation guidance The Company is currently evaluating the effect of the adoption of this implementation guidance on its consolidated
financial statements.
Accounting Standards and Implementation Guidance on Revenue Recognition On March 30, 2018, the ASBJ issued “Accounting Standard for Revenue Recognition” (ASBJ Statement No.29) and
“Implementation Guidance on Accounting Standard for Revenue Recognition” (ASBJ Guidance No.30).( 1 ) Overview This is a comprehensive accounting standard for revenue recognition. Specifically, the accounting standard establishes
the following five-step model that will apply to revenue from customers: 1. Identify the contract(s) with a customer 2. Identify the performance obligations in the contract 3. Determine the transaction price 4. Allocate the transaction price to the performance obligations in the contract 5. Recognize revenue when (or as) the entity satisfies a performance obligation( 2 ) Schedule date of adoption The Company expects to adopt the accounting standard and implementation guidance from the beginning of the fiscal
year ending March 31, 2022.( 3 ) Impact of the adoption of accounting standard and implementation guidance The Company is currently evaluating the effect of the adoption of this accounting standard and implementation
guidance on its consolidated financial statements.
( v ) Additional information During the consolidated fiscal year ended March 31, 2018, the Company and some of its consolidated subsidiaries applied
for the adoption of consolidated taxation regime, and the consolidated taxation regime was admitted to start from the consolidated fiscal year ending March 31, 2019. In line with this, effective the consolidated fiscal year ended March 31, 2018, the Company and some of its consolidated subsidiaries have applied accounting procedures taking into consideration of the adoption of consolidated taxation regime, based on “Practical Solution on Tentative Treatment of Tax Effect Accounting Under Consolidated Taxation System (Part 1)” (ASBJ PITF No.5 revised on January 16, 2015) and “Practical Solution on Tentative Treatment of Tax Effect Accounting Under Consolidated Taxation System (Part 2)” (ASBJ PITF No.7 revised on January 16, 2015).
Inventories as of March 31, 2017 and 2018 consisted of the following:Millions of yen Thousands of U.S. dollars
2017 2018 2018Finished products ¥ 2,881 ¥ 3,891 $ 36,625 Work in process 738 839 7,897 Raw materials and supplies 3,579 4,044 38,065 Total ¥ 7,199 ¥ 8,775 $ 82,596
The write-downs of inventories resulting from decreased profitability for the years ended March 31, 2017 and 2018 were as follows:
Millions of yen Thousands of U.S. dollars2017 2018 2018
Cost of sales ¥ 251 ¥ 333 $ 3,134
Note 2. U.S. dollar amountsThe U.S. dollar amounts are stated solely for the convenience of the reader at the rate of U.S. $1.00 = ¥106.24, the approximate rate of exchange at March 31, 2018. The translation should not be construed as a representation that the Japanese yen amounts actually represent, have been or could be converted into U.S. dollars at that or any other rate.
Note 3. Inventories
Reduction entries due to acceptance of prefectural government’ s grants relating to property, plant and equipment as of March 31, 2017 and 2018 were as follows:
Millions of yen Thousands of U.S. dollars2017 2018 2018
Land ¥ 101 ¥ 101 $ 951
Note 4. Reduction entries
011_0284001373008.indd 12-13 2018/08/10 11:40:06

1514 ANNUAL REPORT 2018 ANNUAL REPORT 2018
Note 7. Retirement benefits plansThe Company and certain of its domestic consolidated subsidiaries have either funded or unfunded defined benefit pension plans and defined contribution benefit pension plans.The Company has funded corporate pension fund plans and defined contribution pension plans. As a defined benefit pension plan, the Company has adopted a cash balance plan. Under the cash balance plan, the plan sponsor contributes money into a plan participant’s account based on the points according to the employee’s years of service and job performance and the points are calculated with an interest credit that reflects changes in market interest rates.Certain subsidiaries have funded and unfunded lump-sum payment plans and defined contribution pension plans. The simplified method is applied for the calculation of liability for retirement benefits and retirement benefit expense of certain domestic subsidiaries.
Short-term loans payable and long-term debt as of March 31, 2017 and 2018 consisted of the following:Short-term loans payable Millions of yen Thousands of U.S. dollars
2017 2018 2018Average interest rate on short-term loans payable, principally from banks, is 0.48%Secured ¥ 5,500 ¥ 3,400 $ 32,003 Unsecured 6,200 6,627 62,378 Total ¥ 11,700 ¥ 10,027 $ (94,381)Long-term debt Millions of yen Thousands of U.S. dollars
2017 2018 2018Average interest rate on long-term debt, principally from banks, is 0.84%Secured ¥ 2,969 ¥ 3,485 $ 32,803 Unsecured 3,778 3,745 35,250 Less: portion due within one year (1,892) (2,704) (25,452)Total ¥ 4,855 ¥ 4,526 $ 42,602
The assets pledged as collateral for short-term and long-term debt as of March 31, 2017 and 2018 were summarized as follows:Millions of yen Thousands of U.S. dollars
2017 2018 2018
(1) Factory foundationBuildings ¥ 1,476 ¥ 1,240 $ 11,672 Machinery and vehicles 161 76 715 Tooling and office furniture 86 82 772 Land 256 256 2,410 Total ¥ 1,981 ¥ 1,655 $ 15,578
(2) OtherBuildings ¥ 55 ¥ 51 $ 480 Tooling and office furniture 3 2 19 Land 39 39 367 Total ¥ 98 ¥ 92 $ 866
The aggregate annual maturities of long-term debt (including current portion) outstanding as of March 31, 2018 were summarized as follows:Year ending March 31, Millions of yen Thousands of U.S. dollars
2019 ¥ 2,704 $ 25,452 2020 1,897 17,856 2021 1,857 17,479 2022 550 5,177 2023 and thereafter 222 2,090 Total ¥ 7,230 $ 68,054
Note 5. Short-term loans payable and long-term debt
Note 6. Notes receivable and payable maturing on the balance sheet date Notes receivable and payable maturing on the balance sheet date are treated as if they were settled at the clearing date of notes. Consequently, as the balance sheet date for the fiscal year was a bank holiday, the following notes receivable and payable maturing on the balance sheet date were included in the amount of each balance at March 31, 2018.
Millions of yen Thousands of U.S. dollars2017 2018 2018
Notes receivable ¥ — ¥ 138 $ 1,299Notes payable ¥ — ¥ 2 $ 19
The changes in the retirement benefit obligation during the years ended March 31, 2017 and 2018 were as follows:Millions of yen Thousands of U.S. dollars
2017 2018 2018Balance at the beginning of the year ¥ 7,865 ¥ 7,660 $ 72,101
Service cost 322 326 3,069Interest cost 49 48 452Actuarial gain and loss 120 (135) (1,271)Retirement benefit paid (693) (849) (7,991)Other (4) (6) (56)
Balance at the end of the year ¥ 7,660 ¥ 7,042 $ 66,284
The changes in plan assets during the years ended March 31, 2017 and 2018 were as follows:Millions of yen Thousands of U.S. dollars
2017 2018 2018Balance at the beginning of the year ¥ 8,357 ¥ 8,466 $ 79,688
Expected return on plan assets 225 154 1,450Actuarial gain and loss 338 343 3,229Contributions by the Company 231 323 3,040Retirement benefits paid (686) (845) (7,954)
Balance at the end of the year ¥ 8,466 ¥ 8,443 $ 79,471
The funded status of the plans and the amounts recognized in the consolidated balance sheet as of March 31, 2017 and 2018 were as follows:
Millions of yen Thousands of U.S. dollars2017 2018 2018
Funded retirement benefit obligation ¥ 7,645 ¥ 7,021 $ 66,086Plan assets at fair value (8,466) (8,443) (79,471)
(820) (1,421) (13,375)Unfunded retirement benefit obligation 14 20 188Net liability for retirement benefits in the balance sheet (806) (1,400) (13,178)
Liability for retirement benefits 54 40 377Asset for retirement benefits (860) (1,440) (13,554)Net liability for retirement benefits in the balance sheet ¥ (806) ¥ (1,400) $(13,178)
The components of retirement benefit expense for the years ended March 31, 2017 and 2018 were as follows:Millions of yen Thousands of U.S. dollars
2017 2018 2018Service cost ¥ 322 ¥ 326 $ 3,069Interest cost 49 48 452Expected return on plan assets (225) (154) (1,450)Amortization of actuarial gain and loss (161) (237) (2,231)Retirement benefit expense ¥ (14) ¥ (16) $ (151)
The components of retirement benefits asset and liability adjustments included in other comprehensive income (before tax effect) for the years ended March 31, 2017 and 2018 were as follows:
Millions of yen Thousands of U.S. dollars2017 2018 2018
Actuarial gain and loss ¥ 56 ¥ 241 $ 2,268
The components of retirement benefits asset and liability adjustments included in accumulated other comprehensive income (before tax effect) as of March 31, 2017 and 2018 were as follows:
Millions of yen Thousands of U.S. dollars2017 2018 2018
Unrecognized actuarial gain and loss ¥ 382 ¥ 623 $ 5,864
The fair value of plan assets, by major category, as a percentage of total plan assets as of March 31, 2017 and 2018 were as follows:
2017 2018Bonds 4.3% 4.1%Stocks 41.8 43.6 Life insurances 38.3 36.2 Funds 14.4 14.8 Other 1.2 1.3 Total 100.0% 100.0%
1. The total plan assets include retirement benefit trusts which constitute 11.5% for the year ended March 31, 2017 and 12.5% for the year ended March 31, 2018.
2. The expected rates of return on plan assets has been estimated based on the anticipated allocation of plan assets to each asset category and the expected long-term returns on plan assets held in each category.
The required contributions to the defined contribution plans by the Company and its consolidated subsidiaries for the years ended March 31, 2017 and 2018 amounted to ¥90 million and ¥91 million ($857 thousand), respectively.
011_0284001373008.indd 14-15 2018/08/10 11:40:06

1716 ANNUAL REPORT 2018 ANNUAL REPORT 2018
Note 9. Stock options1. The account and the amount of stock options charged as expenses Not applicable.2. The amount of stock options charged as income due to their forfeiture resulting from nonuse
2017 2018Gain on reversal of share subscription rights 20 —
3. Description of stock options Not applicable.4. Change in stock options Not applicable.5. Estimation of the number of stock options vested Not applicable.
Note 8. Net assetsInformation regarding changes in net assets for the years ended March 31, 2017 and 2018 were as follows:1. Shares issued and outstanding / Treasury stock
2017 2018
Types of shares
Number of shares at April
1, 2016 Increase Decrease
Number of shares at March
31, 2017
Number of shares at April
1, 2017 Increase Decrease
Number of shares at March
31, 2018Shares issued:
Common stock 79,000,000 — 4,000,000 75,000,000 75,000,000 — — 75,000,000 Tresury stock:
Common stock 8,947,853 3,994,537 4,054,950 8,887,440 8,887,440 12,319 — 8,899,759 Number of shares
1. Details of the increase are as follows: 2017 2018
Increase due to purchase of shares 3,979,000 —Increase due to purchase of shares of less than standard unit 11,350 8,891Increase in shares held by affiliates accounted for by the equity method 4,187 3,428
2. Details of the decrease are as follows:Decrease due to exercising stock options 54,000 —Decrease due to retirement of shares 4,000,000 —Decrease due to sales of shares of less than standard unit 950 —
2. Share subscription rights Not applicable.3. Dividends(1) Dividends paid
2017
Resolution Type of sharesTotal dividends (Millions of yen)
Dividends per share (Yen) Cut-off date Effective date
Shareholders’ meeting on June 22, 2016
Common stock 561 8 March 31, 2016 June 23, 2016
Board of Directors’ meeting on October 25, 2016
Common stock 331 5 September 30,
2016November 21,
2016
2018 2018
Resolution Type of sharesTotal dividends (Millions of yen)
Dividends per share (Yen) Cut-off date Effective date
Total dividends (Thousands of U.S. dollars)
Dividends per share (U.S. dollars)
Shareholders’ meeting on June 22, 2017
Common stock 331 5 March 31, 2017 June 23, 2017 3,116 0.05
Board of Directors’ meeting on October 25, 2017
Common stock 265 4 September 30,
2017November 20,
2017 2,494 0.04
(2) Dividends with the cut-off date in the year ended March 31, 2017 and the effective date in the year ended March 31, 20182017
Resolution Type of shares Source of dividendsTotal dividends (Millions of yen)
Dividends per share (Yen) Cut-off date Effective date
Shareholders’ meeting on June 22, 2017
Common stock
Retained earnings 331 5 March 31, 2017 June 23, 2017
Dividends with the cut-off date in the year ended March 31, 2018 and the effective date in the year ending March 31, 20192018 2018
Resolution Type of shares Source of dividendsTotal dividends (Millions of yen)
Dividends per share (Yen) Cut-off date Effective date
Total dividends (Thousands of U.S. dollars)
Dividends per share (U.S. dollars)
Shareholders’ meeting on June 22, 2018
Common stock
Retained earnings 264 4 March 31, 2018 June 25, 2018 2,485 0.04
Note 10. Research and development costs
Note 11. Selling, general and administrative expenses
Note 12. Gains and losses of fixed assets
Research and development costs included in cost of sales and selling, general and administrative expenses for the years ended March 31, 2017 and 2018 amounted to ¥3,314 million and ¥3,150 million ($ 29,649 thousand), respectively.
Major elements of selling, general and administrative expenses for the years ended March 31, 2017 and 2018 were as follows:Millions of yen Thousands of U.S. dollars
2017 2018 2018Salaries and wages of employees ¥ 4,384 ¥ 4,531 $ 42,649 Provision for bonus 316 338 3,181 Provision for directors’ and officers’ bonus 23 1 9 Retirement benefit cost 38 37 348 Provision for directors' and officers' retirement benefits 33 5 47 Provision for doubtful accounts (0) (1) (9)
The components of gains and losses of fixed assets for the year ended March 31, 2017 and 2018 were as follows:Gains on sales of fixed assets
Millions of yen Thousands of U.S. dollars2017 2018 2018
Buildings ¥ 232 ¥ 1,610 $ 15,154 Machinery and vehicles 9 25 235 Tooling and office furniture 5 64 602 Land 208 640 6,024 Intangible asset 3 — — Total ¥ 459 ¥ 2,341 $ 22,035
Loss on disposal of fixed assetsMillions of yen Thousands of U.S. dollars
2017 2018 2018Buildings ¥ 1 ¥ 84 $ 791 Machinery and vehicles 240 69 649 Tooling and office furniture 18 17 160 Intangible asset 0 0 0 Total ¥ 260 ¥ 172 $ 1,619
Assumptions to calculate the actuarial present value of the benefit obligation and the expected return on plan assets as of March 31, 2017 and 2018 were as follows:
2017 2018Discount rate 0.6% 0.6%Re-evaluation rate 1.23% 1.00%Expected rates of return on plan assets 3.0% 2.0%
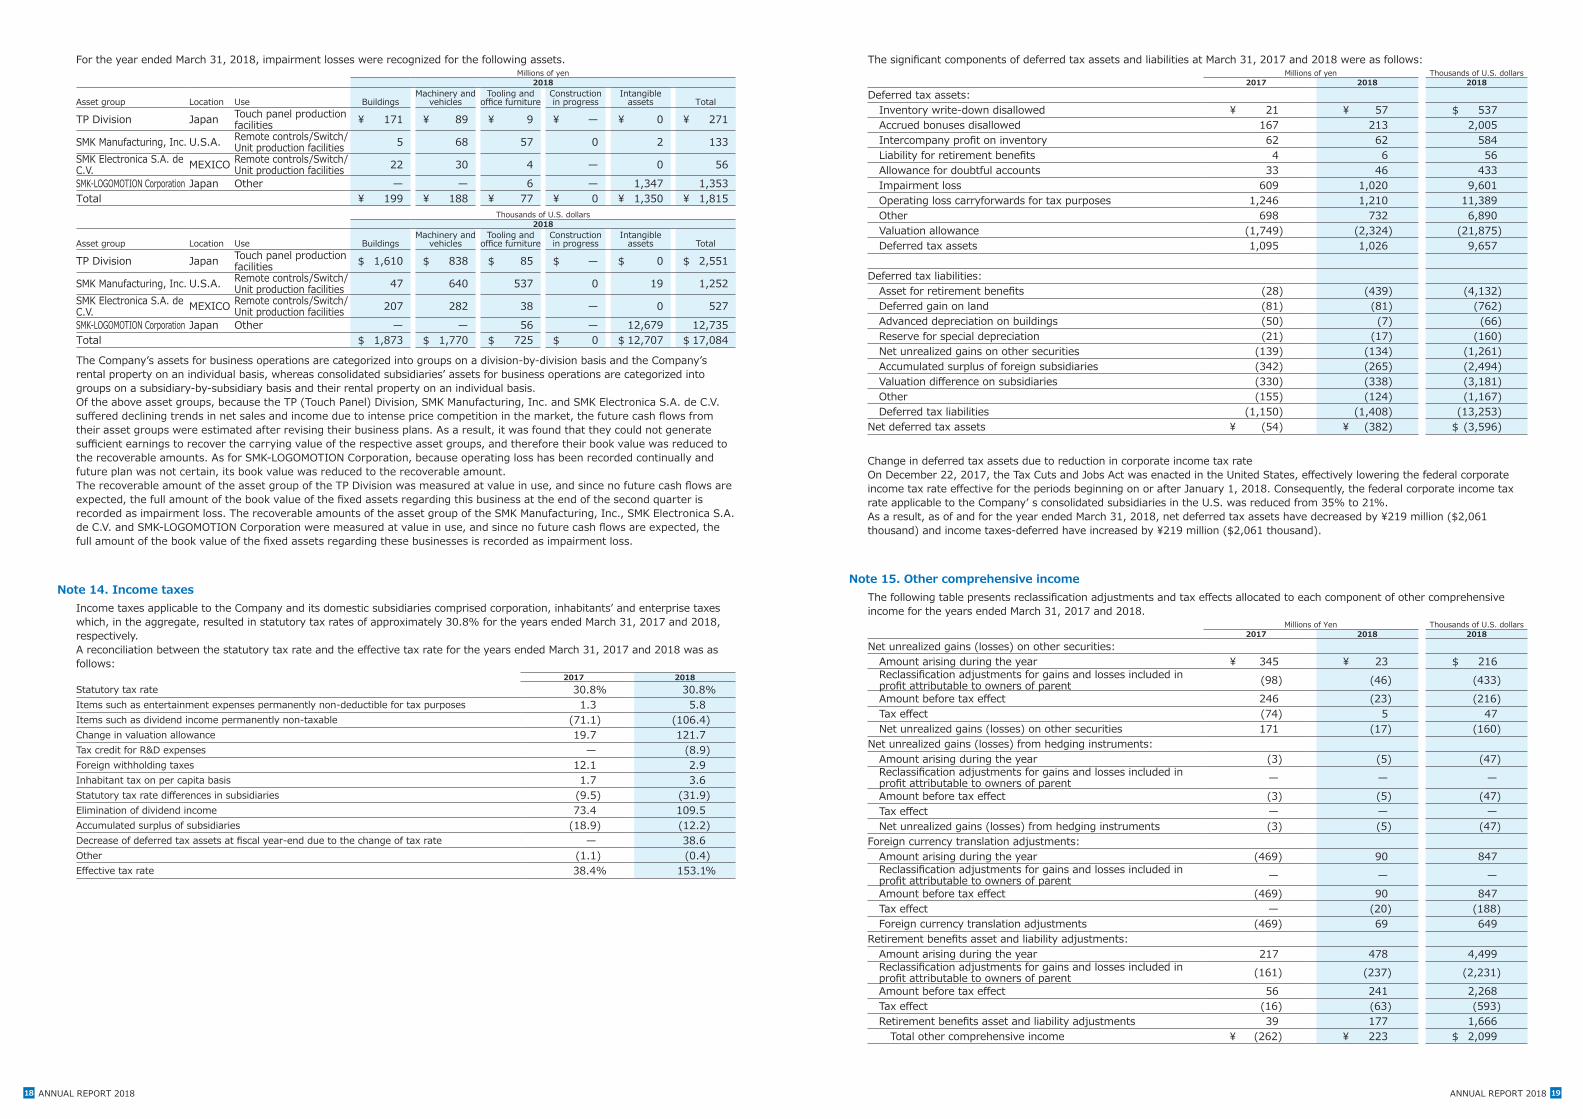
Note 13. Loss on impairment of fixed assetsAn impairment loss is recognized when the carrying amount of an asset exceeds undiscounted future net cash flows which are expected to be generated by such asset. The impairment loss is measured by the amount by which the carrying amount of the asset exceeds its recoverable amount being the higher of the discounted future net cash flows or net realizable value.For the year ended March 31, 2017, impairment losses were recognized for the following assets.
Millions of yen2017
Asset group Location UseMachinery and
vehiclesTooling and
office furniture Goodwill TotalFunctional components Japan Other ¥ — ¥ — ¥ 263 ¥ 263 SMK Manufacturing, Inc. U.S.A. Remote controls/Switch/
Unit production facilities 151 28 — 179 Total ¥ 151 ¥ 28 ¥ 263 ¥ 443
011_0284001373008.indd 16-17 2018/08/10 11:40:06
1918 ANNUAL REPORT 2018 ANNUAL REPORT 2018
Note 14. Income taxesIncome taxes applicable to the Company and its domestic subsidiaries comprised corporation, inhabitants’ and enterprise taxes which, in the aggregate, resulted in statutory tax rates of approximately 30.8% for the years ended March 31, 2017 and 2018, respectively.A reconciliation between the statutory tax rate and the effective tax rate for the years ended March 31, 2017 and 2018 was as follows:
2017 2018Statutory tax rate 30.8% 30.8% Items such as entertainment expenses permanently non-deductible for tax purposes 1.3 5.8 Items such as dividend income permanently non-taxable (71.1) (106.4)Change in valuation allowance 19.7 121.7 Tax credit for R&D expenses — (8.9)Foreign withholding taxes 12.1 2.9 Inhabitant tax on per capita basis 1.7 3.6 Statutory tax rate differences in subsidiaries (9.5) (31.9)Elimination of dividend income 73.4 109.5Accumulated surplus of subsidiaries (18.9) (12.2)Decrease of deferred tax assets at fiscal year-end due to the change of tax rate — 38.6 Other (1.1) (0.4)Effective tax rate 38.4% 153.1%
For the year ended March 31, 2018, impairment losses were recognized for the following assets.Millions of yen
2018
Asset group Location Use BuildingsMachinery and
vehiclesTooling and
office furnitureConstruction in progress
Intangible assets Total
TP Division Japan Touch panel production facilities ¥ 171 ¥ 89 ¥ 9 ¥ — ¥ 0 ¥ 271
SMK Manufacturing, Inc. U.S.A. Remote controls/Switch/Unit production facilities 5 68 57 0 2 133
SMK Electronica S.A. de C.V. MEXICO Remote controls/Switch/
Unit production facilities 22 30 4 — 0 56 SMK-LOGOMOTION Corporation Japan Other — — 6 — 1,347 1,353 Total ¥ 199 ¥ 188 ¥ 77 ¥ 0 ¥ 1,350 ¥ 1,815
Thousands of U.S. dollars2018
Asset group Location Use BuildingsMachinery and
vehiclesTooling and
office furnitureConstruction in progress
Intangible assets Total
TP Division Japan Touch panel production facilities $ 1,610 $ 838 $ 85 $ — $ 0 $ 2,551
SMK Manufacturing, Inc. U.S.A. Remote controls/Switch/Unit production facilities 47 640 537 0 19 1,252
SMK Electronica S.A. de C.V. MEXICO Remote controls/Switch/
Unit production facilities 207 282 38 — 0 527 SMK-LOGOMOTION Corporation Japan Other — — 56 — 12,679 12,735 Total $ 1,873 $ 1,770 $ 725 $ 0 $ 12,707 $ 17,084
The Company’s assets for business operations are categorized into groups on a division-by-division basis and the Company’s rental property on an individual basis, whereas consolidated subsidiaries’ assets for business operations are categorized into groups on a subsidiary-by-subsidiary basis and their rental property on an individual basis.Of the above asset groups, because the TP (Touch Panel) Division, SMK Manufacturing, Inc. and SMK Electronica S.A. de C.V. suffered declining trends in net sales and income due to intense price competition in the market, the future cash flows from their asset groups were estimated after revising their business plans. As a result, it was found that they could not generate sufficient earnings to recover the carrying value of the respective asset groups, and therefore their book value was reduced to the recoverable amounts. As for SMK-LOGOMOTION Corporation, because operating loss has been recorded continually and future plan was not certain, its book value was reduced to the recoverable amount. The recoverable amount of the asset group of the TP Division was measured at value in use, and since no future cash flows are expected, the full amount of the book value of the fixed assets regarding this business at the end of the second quarter is recorded as impairment loss. The recoverable amounts of the asset group of the SMK Manufacturing, Inc., SMK Electronica S.A. de C.V. and SMK-LOGOMOTION Corporation were measured at value in use, and since no future cash flows are expected, the full amount of the book value of the fixed assets regarding these businesses is recorded as impairment loss.
The significant components of deferred tax assets and liabilities at March 31, 2017 and 2018 were as follows:Millions of yen Thousands of U.S. dollars
2017 2018 2018Deferred tax assets:
Inventory write-down disallowed ¥ 21 ¥ 57 $ 537 Accrued bonuses disallowed 167 213 2,005Intercompany profit on inventory 62 62 584Liability for retirement benefits 4 6 56 Allowance for doubtful accounts 33 46 433 Impairment loss 609 1,020 9,601 Operating loss carryforwards for tax purposes 1,246 1,210 11,389 Other 698 732 6,890 Valuation allowance (1,749) (2,324) (21,875) Deferred tax assets 1,095 1,026 9,657
Deferred tax liabilities:Asset for retirement benefits (28) (439) (4,132) Deferred gain on land (81) (81) (762) Advanced depreciation on buildings (50) (7) (66) Reserve for special depreciation (21) (17) (160) Net unrealized gains on other securities (139) (134) (1,261) Accumulated surplus of foreign subsidiaries (342) (265) (2,494) Valuation difference on subsidiaries (330) (338) (3,181) Other (155) (124) (1,167) Deferred tax liabilities (1,150) (1,408) (13,253)
Net deferred tax assets ¥ (54) ¥ (382) $ (3,596)
Change in deferred tax assets due to reduction in corporate income tax rateOn December 22, 2017, the Tax Cuts and Jobs Act was enacted in the United States, effectively lowering the federal corporate income tax rate effective for the periods beginning on or after January 1, 2018. Consequently, the federal corporate income tax rate applicable to the Company’ s consolidated subsidiaries in the U.S. was reduced from 35% to 21%.As a result, as of and for the year ended March 31, 2018, net deferred tax assets have decreased by ¥219 million ($2,061 thousand) and income taxes-deferred have increased by ¥219 million ($2,061 thousand).
Note 15. Other comprehensive incomeThe following table presents reclassification adjustments and tax effects allocated to each component of other comprehensive income for the years ended March 31, 2017 and 2018.
Millions of Yen Thousands of U.S. dollars2017 2018 2018
Net unrealized gains (losses) on other securities:Amount arising during the year ¥ 345 ¥ 23 $ 216Reclassification adjustments for gains and losses included in profit attributable to owners of parent (98) (46) (433)Amount before tax effect 246 (23) (216)Tax effect (74) 5 47Net unrealized gains (losses) on other securities 171 (17) (160)
Net unrealized gains (losses) from hedging instruments:Amount arising during the year (3) (5) (47)Reclassification adjustments for gains and losses included in profit attributable to owners of parent — — —Amount before tax effect (3) (5) (47)Tax effect — — —Net unrealized gains (losses) from hedging instruments (3) (5) (47)
Foreign currency translation adjustments:Amount arising during the year (469) 90 847Reclassification adjustments for gains and losses included in profit attributable to owners of parent — — —Amount before tax effect (469) 90 847Tax effect — (20) (188)Foreign currency translation adjustments (469) 69 649
Retirement benefits asset and liability adjustments:Amount arising during the year 217 478 4,499Reclassification adjustments for gains and losses included in profit attributable to owners of parent (161) (237) (2,231)Amount before tax effect 56 241 2,268Tax effect (16) (63) (593)Retirement benefits asset and liability adjustments 39 177 1,666
Total other comprehensive income ¥ (262) ¥ 223 $ 2,099
011_0284001373008.indd 18-19 2018/08/10 11:40:06

2120 ANNUAL REPORT 2018 ANNUAL REPORT 2018
Note 17. Financial instruments( 1 ) Policy for financial instruments The Company and consolidated subsidiaries manage temporary cash surpluses through low-risk financial assets. The Company and consolidated subsidiaries raise funds through bank borrowings. The Company and consolidated subsidiaries use derivatives for the purpose of reducing risk and do not enter into derivatives
for speculative or trading purposes.( 2 ) Types of financial instruments and related risk Trade receivables—trade notes and accounts receivable—are exposed to credit risk in relation to customers. Regarding this
risk, the credit management is executed periodically. Marketable securities and investment securities are exposed to market risk. The fair value of those securities is reported in a
board meeting periodically. Substantially all trade payables – trade notes and accounts payable – have payment due dates within one year. Short-term loans payable are raised mainly in connection with business activities, and the repayment dates of long-term debt
extend up to four years from the balance sheet date. Long-term debt with variable interest rates is exposed to interest rate fluctuation risk. However, to reduce such risk and fix interest expense for long-term debt bearing interest at variable rates, the Company and consolidated subsidiaries utilizes interest rate swap transactions as a hedging instrument. Information regarding the method of hedge accounting, hedging instruments and hedged items, hedging policy, and the assessment of effectiveness of hedging activities is found in Note 1 (q).
Execution and management of derivatives transactions are carried out in accordance with the company rules specifying the transaction authority. In addition, in order to alleviate credit risk, derivative transactions are restricted to banks with high credit ratings. Although operating liabilities and loans payable are exposed to liquidity risk, the Group’ s companies are able to manage it by using methods such as preparing monthly cash management plans.
( 3 ) Additional information regarding fair value of financial instruments Fair value of financial instruments includes the value based on the market price. In addition, if such information is absent,
reasonable assessments of their value are included. Furthermore, the contract amounts, etc. relating to derivatives transactions are described in Note 19. Derivatives themselves do not serve as indicators of market risk involved in derivatives transactions.
Information regarding fair value of financial instruments at March 31, 2017 and 2018 was summarized as follows:Millions of yen Thousands of U.S. dollars
2017 2018 2018Book value Fair value Difference Book value Fair value Difference Book value Fair value Difference
Cash and cash equivalents ¥10,011 ¥10,011 ¥ — ¥10,482 ¥10,482 ¥ — $98,663 $98,663 $ —Time deposits 106 106 — 117 117 — 1,101 1,101 —Notes and accounts receivable, trade 14,853 14,853 — 15,251 15,251 — 143,552 143,552 —Other current assets and Investment securities 2,063 2,063 — 2,019 2,019 — 19,004 19,004 —Notes and accounts payable, trade 6,118 6,118 — 6,807 6,807 — 64,072 64,072 —Short-term loans payable 11,700 11,700 — 10,027 10,027 — 94,381 94,381 —Accounts payable, non-trade 1,407 1,407 — 1,919 1,919 — 18,063 18,063 —Long-term debt 6,747 6,743 (3) 7,230 7,228 (2) 68,053 68,035 (19)Derivatives 2 2 — 37 37 — 348 348 —
Long-term debt includes current portion of long-term debt recorded as short-term loans payable in the consolidated balance sheets.The assets and liabilities arising from derivatives are shown on a net basis with the amount in parentheses representing a net liability position.
Note 16. Amounts per share1. Profit (loss) attributable to owners of parent per share of common stock is based on the following information
Millions of yen Thousands of U.S. dollars2017 2018 2018
Basic profit (loss) attributable to owners of parent per share:Profit (loss) attributable to owners of parent ¥ 1,017 ¥ (288) ($2,711)Profit (loss) attributable to owners of parent not attributable to common stockholders — — —Profit (loss) attributable to owners of parent attributable to common stock 1,017 (288) (2,711)
Thousands of shares2017 2018
Average number of shares of common stock outstanding during the year 67,064 66,106
2. Diluted profit attributable to owners of parent per share of common stock is based on the following informationMillions of yen Thousands of U.S. dollars
2017 2018 2018Diluted profit attributable to owners of parent per share:
Adjustments ¥ — ¥ — $ —Thousands of shares
2017 2018Increase in number of shares of common stock 15 —(share subscription rights) 15 —Description of dilutive securities which were not included in the calculation of diluted profit attributable to owners of parent per share of common stock as they have no dilutive effects
— —
1. Methods to determine the estimated fair value of financial instruments and other matters related to securities and derivative transactions
Cash and cash equivalents, time deposits, and notes and accounts receivable, trade Since these items are settled in a short period of time, their carrying value approximates fair value. Investment securities The fair value of stocks is based on quoted market prices. Short-term loans payable, notes and accounts payable, trade and accounts payable, non-trade Since these items are settled in a short period of time, their carrying value approximates fair value. Long-term debt The fair value of long-term debt is based on the present value of the total of principal and interest discounted by the interest
rate to be applied if similar new loans were entered into. Derivatives Please refer to Note 19 Derivatives of the notes to the consolidated financial statements.
2. Financial instruments whose fair value is extremely difficult to determineMillions of yen Thousands of U.S. dollars
2017 2018 2018Unlisted securities ¥ 306 ¥ 440 $ 4,142
Unlisted securities are not included in the investment securities because there were no quoted market prices available and the fair value is extremely difficult to determine.
3. The schedules for redemption of monetary assets and securities with maturitiesMillions of yen Thousands of U.S. dollars
2017 2018 2018
Due within one year
Due after one year through
five years
Due after five years through
ten yearsDue within one year
Due after one year through
five years
Due after five years through
ten yearsDue within one year
Due after one year through
five years
Due after five years through
ten yearsCash equivalents and time deposits ¥9,996 ¥ — ¥ — ¥ 10,590 ¥ — ¥ — $ 99,680 $ — $ —Notes and accounts receivable, trade 14,853 — — 15,251 — — 143,552 — —Other current assets and Investment securities 64 — — — — — — — —Total ¥24,914 ¥ — ¥ — ¥ 25,841 ¥ — ¥ — $ 243,232 $ — $ —
Note 18. SecuritiesInformation regarding securities classified as other securities at March 31, 2017 and 2018 was summarized as follows:
Millions of yen Thousands of U.S. dollars2017 2018 2018
Fair value CostUnrealized gain (loss) Fair value Cost
Unrealized gain (loss) Fair value Cost
Unrealized gain (loss)
Securities whose fair value exceeds their cost
Stocks ¥ 1,632 ¥ 1,051 ¥ 581 ¥1,562 ¥ 1,055 ¥ 507 $ 14,703 $9,930 $ 4,772 Others 64 21 42 — — — — — —
Subtotal 1,697 1,073 623 1,562 1,055 507 14,703 9,930 4,772 Securities whose cost exceeds their fair value
Stocks 366 502 (135) 457 499 (42) 4,302 4,697 (395)Subtotal 366 502 (135) 457 499 (42) 4,302 4,697 (395)Total ¥ 2,063 ¥ 1,575 ¥ 487 ¥2,019 ¥ 1,554 ¥ 464 $ 19,004 $ 14,627 $ 4,367
Unlisted stocks of ¥95 million at March 31, 2017 and ¥191 million ($1,797 thousand) at March 31, 2018 are not included in the above table because there were no quoted market prices available and the fair value is extremely difficult to determine.
Investment securities in unconsolidated subsidiaries and affiliates are as follows: Millions of yen Thousands of U.S. dollars
2017 2018 2018Investment securities ¥ 210 ¥ 248 $ 2,334
Information regarding sales of securities classified as other securities for the years ended March 31, 2017 and 2018 were as follows:
Millions of yen Thousands of U.S. dollars2017 2018 2018
Proceeds from sales of securities ¥ 430 ¥ 0 $ 0Stocks 430 0 0
Gains on sales 99 0 0Stocks 99 0 0
Losses on sales 0 — —Stocks 0 — —
Impairment of investment securities classified as other securities for the years ended March 31, 2017 and 2018 were as follows:Millions of yen Thousands of U.S. dollars
2017 2018 2018Stocks ¥ — ¥ 181 $ 1,704
011_0284001373008.indd 20-21 2018/08/10 11:40:07

2322 ANNUAL REPORT 2018 ANNUAL REPORT 2018
Note 20. Investment and rental propertyThe profit of investment and rental property for the years ended March 31, 2017 and 2018 amounted to ¥627 million and ¥604 million ($5,685 thousand), respectively.Information on the fair value of investment and rental property at March 31, 2017 and 2018 was summarized as follows:
Millions of yen Thousands of U.S. dollars2017 2018 2018
Book valuebeginning of the year
Book valueend of the
year Fair value
Book valuebeginning of the year
Book valueend of the
year Fair value
Book valuebeginning of the year
Book valueend of the
year Fair value¥ 8,875 ¥ 8,410 ¥ 15,481 ¥ 8,410 ¥ 7,603 ¥ 14,158 $ 79,160 $ 71,564 $ 133,264
1. The fair value represents the acquisition cost less accumulated depreciation.2. The fair value is mainly based upon the amount appraised by outside independent real estate appraisers.
Note 21. Segment information(Overview)The reportable segments of the Company and consolidated subsidiaries are designed as business segments whose segregated financial information can be obtained and to which the management reviews to decide on the allocation of managerial and financial resources and to evaluate their financial performance.The Company and consolidated subsidiaries are primarily engaged in the three divisions as follows;CS (Connection System) Division: The division produces and sells connectors and jacks.FC (Functional Components) Division: The division produces and sells switches, remote controls and camera modules.TP (Touch Panel) Division: The division produces and sells touch panels.
The business segment information is prepared in a manner similar to the accounting treatment as described in Note 1. Segment performance is evaluated based on operating income or loss.
Note 19. DerivativesAs a matter of policy, the Company does not speculate in derivative transactions. The Company does not anticipate nonperformance by any of the counterparties to the derivative transactions, all of whom are leading domestic financial institutions with high bond ratings.In accordance with the Company’s policy, the accounting department controls derivative transactions and requires approval by the director responsible for accounting and the representative directors of the Company. The director who has the responsibility to control the performance and the related risks connected with derivatives reports these to the Management Committee of the Company.The Company uses interest rate swaps to hedge the risks from interest rate fluctuations on borrowings. The exceptional method of hedge accounting is used to account for those transactions.(Currency related) Millions of yen Thousands of U.S. dollars
Contract amount Fair value Unrealized gain (loss)Contract amount Fair value
Unrealized gain (loss)
Forward foreign exchange contracts: 2017 2018 2017 2018 2017 2018 2018 2018 2018
Sell: US$ / Buy: Yen ¥ 1,281 ¥ 1,853 ¥ 6 ¥ 47 ¥ 6 ¥ 47 $ 17,442 $ 442 $ 442 Sell: US$ / Buy: GBP 44 39 (0) 0 (0) 0 367 0 0Sell: US$ / Buy: EUR 29 78 0 0 0 0 734 0 0 Total ¥ 1,355 ¥ 1,971 ¥ 6 ¥ 47 ¥ 6 ¥ 47 $ 18,552 $ 442 $ 442
( 1 ) Calculation of fair value The fair value is calculated by the forward exchange rate.( 2 ) Derivative transactions to which hedge accounting was applied are excluded from the above table.(Interest related) Millions of yen Thousands of U.S. dollars
Contract amount Due after one year Fair valueContract amount
Due after one year Fair value
2017 2018 2017 2018 2017 2018 2018 2018 2018Interest rate swaps(Deferral hedge accounting) ¥ 800 ¥ 1,941 ¥ 800 ¥ 1,872 ¥ (3) ¥ (9) $ 18,270 $ 17,620 $ (85)Interest rate swaps(Exceptional treatment) ¥ 3,598 ¥ 1,938 ¥ 1,938 ¥ 1,240 ¥ — ¥ — $ 18,242 $ 11,672 $ —
( 1 ) Calculation of fair value The fair value is calculated by the forward interest rate.( 2 ) Regarding interest rate swaps to which the exceptional treatment applied, they are accounted for as if they were an integral
part of the hedged long-term debt, and their fair value is included in the fair value of long-term debt in Note 17.
1. Business segment informationMillions of yen
Reportable Segments
2017
Connection System Division
Functional Components
DivisionTouch Panel
Division Subtotal Other Total Adjustment ConsolidatedNet sales
Outside customers ¥ 23,539 ¥ 27,238 ¥ 11,931 ¥ 62,708 ¥ 263 ¥ 62,971 ¥ — ¥ 62,971Intersegment sales — — — — — — — —Total 23,539 27,238 11,931 62,708 263 62,971 — 62,971
Operating income (loss) 1,919 (786) 113 1,246 (616) 630 — 630Identifiable assets 13,779 14,070 6,047 33,897 11,927 45,824 16,493 62,318Others
Depreciation 2,117 1,131 636 3,885 495 4,381 — 4,381Increase in fixed assets and intangible fixed assets 2,263 1,637 543 4,443 152 4,595 — 4,595
Millions of yenReportable Segments
2018
Connection System Division
Functional Components
DivisionTouch Panel
Division Subtotal Other Total Adjustment ConsolidatedNet sales
Outside customers ¥ 28,422 ¥ 21,420 ¥ 9,582 ¥ 59,424 ¥ 362 ¥ 59,786 ¥ — ¥ 59,786Intersegment sales — — — — — — — —Total 28,422 21,420 9,582 59,424 362 59,786 — 59,786
Operating income (loss) 3,203 (1,360) (832) 1,011 (526) 485 — 485Identifiable assets 16,359 13,289 5,107 34,756 9,553 44,310 17,496 61,807Others
Depreciation 2,235 943 580 3,759 427 4,187 — 4,187Increase in fixed assets and intangible fixed assets 2,053 542 442 3,038 121 3,160 — 3,160
Thousands of U.S. dollarsReportable Segments
2018
Connection System Division
Functional Components
DivisionTouch Panel
Division Subtotal Other Total Adjustment ConsolidatedNet sales
Outside customers $ 267,526 $ 201,619 $ 90,192 $ 559,337 $ 3,407 $ 562,745 $ — $ 562,745Intersegment sales — — — — — — — —Total 267,526 201,619 90,192 559,337 3,407 562,745 — 562,745
Operating income (loss) 30,149 (12,801) (7,831) 9,516 (4,951) 4,565 — 4,565Identifiable assets 153,982 125,085 48,070 327,146 89,919 417,075 164,684 581,768Others
Depreciation 21,037 8,876 5,459 35,382 4,019 39,411 — 39,411Increase in fixed assets and intangible fixed assets 19,324 5,102 4,160 28,596 1,139 29,744 — 29,744
Other is business segments not included in the reportable segments. It includes other parts, leasing, property rental and worker dispatch businesses.Adjustment includes corporate assets which are not allocable to the reportable segments.
2. Geographical information( 1 ) Net sales
Millions of yen2017 Japan Asia North America Europe Consolidated China Other U.S.A. OtherNet sales ¥ 13,545 ¥ 16,014 ¥ 7,459 ¥ 22,083 ¥ 591 ¥ 3,277 ¥ 62,971
Millions of yen2018 Japan Asia North America Europe Consolidated China Other U.S.A. Other Ireland OtherNet sales ¥ 14,368 ¥ 14,797 ¥ 7,731 ¥ 15,071 ¥ 508 ¥ 7,301 ¥ 6 ¥ 59,786
Thousands of U.S. dollars2018 Japan Asia North America Europe Consolidated China Other U.S.A. Other Ireland OtherNet sales $ 135,241 $ 139,279 $ 72,769 $ 141,858 $ 4,782 $ 68,722 $ 56 $ 562,745
( 2 ) Fixed assetsMillions of yen
2017 Japan Asia North America Europe Consolidated
China Philippines OtherFixed assets ¥ 15,402 ¥ 3,198 ¥ 2,344 ¥ 379 ¥ 233 ¥ 411 ¥ 21,970
Millions of yen2018 Japan Asia North
America Europe Consolidated China Philippines OtherFixed assets ¥ 13,951 ¥ 3,383 ¥ 2,012 ¥ 352 ¥ 18 ¥ 406 ¥ 20,124
Thousands of U.S. dollars2018 Japan Asia North
America Europe Consolidated China Philippines OtherFixed assets $ 131,316 $ 31,843 $ 18,938 $ 3,313 $ 169 $ 3,822 $ 189,420
011_0284001373008.indd 22-23 2018/08/10 11:40:07
2524 ANNUAL REPORT 2018 ANNUAL REPORT 2018
Note 22. Related party transactionsSignificant transactions with related parties for the years ended March 31, 2017 and 2018 were as follows:
Millions of yen2017 Transactions Balances
Purchase of golf
membership
Guaranty money
deposited RentOther
investments
Other current assets
Terutaka Ikeda (Supreme corporate adviser) ¥ 12 ¥ — ¥ 14 ¥ 14 ¥ 1 Millions of yen
Transactions BalancesCollection
of loan receivable
Interest income
Other current assets
Long-term loans
receivablePaul Evans (Director) ¥ 1 ¥ 1 ¥ 1 ¥ 35
Millions of yen2018 Transactions Balances
Purchase of golf
membership
Guaranty money
deposited RentOther
investments
Other current assets
Terutaka Ikeda (Supreme corporate adviser) ¥ — ¥ — ¥ 14 ¥ 14 ¥ 1 Millions of yen
Transactions BalancesCollection
of loan receivable
Interest income
Other current assets
Long-term loans
receivablePaul Evans (Director) ¥ 1 ¥ 1 ¥ 30 ¥ 2
Thousands of U.S. dollars2018 Transactions Balances
Purchase of golf
membership
Guaranty money
deposited RentOther
investments
Other current assets
Terutaka Ikeda (Supreme corporate adviser) $ — $ — $ 132 $ 132 $ 9 Thousands of U.S. dollars
Transactions BalancesCollection
of loan receivable
Interest income
Other current assets
Long-term loans
receivablePaul Evans (Director) $ 9 $ 9 $ 282 $ 19
Note 23. Subsequent EventsChange of the number of shares to constitute one unit and consolidation of sharesOn April 26, 2018, the Board of Directors resolved to change the number of shares to constitute one unit. In addition, the Board of Directors resolved to propose an agenda item of the consolidation of shares at the 96th General Meeting of Shareholders on June 22, 2018. This proposal for the consolidation of shares was approved at the General Meeting of Shareholders. The details of this are as follows.( 1 ) Purpose of change of the number of shares to constitute one unit and consolidation of shares Japanese stock exchanges (including the Tokyo Stock Exchange) set a deadline of October 1, 2018 by which the trading
units of all listed companies in Japan must be unified to 100 shares. Therefore, we changed the trading unit of our common
3. Information about major customers The Company and consolidated subsidiaries have no major customers which account for 10% or more of net sales.
4. Information about the loss on impairment of fixed assetsMillions of yen Thousands of U.S. dollars
2017 2018 2018Connection System Division ¥ — ¥ — $ —Functional Components Division 443 190 1,788Touch Panel Division — 271 2,551Subtotal 443 461 4,339Other — 1,353 12,735Adjustments and eliminations — — —Consolidated ¥ 443 ¥ 1,815 $ 17,084
The amount of other is related to SMK-LOGOMOTION Corporation.
5. Information about the amortization of goodwill and the balance of goodwillMillions of yen
Reportable Segments
2017
Connection System Division
Functional Components
DivisionTouch Panel
Division Subtotal Other Adjustment ConsolidatedAmortization ¥ — ¥ 91 ¥ 45 ¥ 137 ¥ — ¥ — ¥ 137Balance — — — — — — —
Impairment loss on goodwill in the amount of ¥263 million was recognized for the year ended March 31, 2017.Not applicable for the year ended March 31, 2018.
stock from the current 1,000 shares to 100 shares to respect the spirit of this movement as a company that is listed on the Tokyo Stock Exchange. In addition, we will also maintain the level with respect to the price per trading unit of our shares. Together with this, we will implement a consolidation to turn ten of our shares into one share so that no changes occur in the number of voting rights of each shareholder.
( 2 ) Particulars of consolidation of shares( i ) Type of shares to be consolidated Common shares( ii ) Consolidation ratio On October 1, 2018, shares held by shareholders recorded in the latest Shareholder Registry as of September 30,
2018 (actually September 28) will be consolidated at the ratio of 10 shares to 1 share.(iii) Number of shares reduced through consolidation
Total number of shares issued before consolidation (as of March 31, 2018) 75,000,000 sharesNumber of shares reduced through consolidation 67,500,000 sharesTotal number of shares issued after consolidation 7,500,000 shares
( 3 ) Treatment of fractional shares If any fractional shares arise as a result of the consolidation of shares, pursuant to the provisions of the Companies Act, the
Company will sell all such fractional shares and distribute the proceeds to shareholders having fractional shares in proportion to their respective fractions.
( 4 ) ScheduleResolution of the Board of Directors April 26, 2018Resolution of General Meeting of Shareholders June 22, 2018Effective date of consolidation of shares and change of the number of shares to constitute one unit October 1, 2018
( 5 ) Effects on per share information The following provides the per share information of the previous consolidated fiscal year and this consolidated fiscal year
under the assumption that the applicable consolidation of shares was enforced at the beginning of the previous consolidated fiscal year.
Yen U.S. dollars2017 2018 2018
Net assets per share ¥ 4,734.95 ¥ 4,635.03 $ 43.63Net income (loss) per share 151.65 (43.63) (0.41)
Introduction of Board Benefit TrustWe resolved at the Board of Directors’ meeting held on April 26, 2018 to introduce a new share-based compensation plan, a “Board Benefit Trust (BBT)” (the “Plan” ) and the Plan was approved at the 96th General Meeting of Shareholders on June 22, 2018 (the “General Shareholders’ Meeting” ).( 1 ) Background and purpose Our Board of Directors resolved to introduce the Plan, subject to the approval of shareholders at the General Shareholders’
Meeting regarding executive compensation, for the purpose of raising awareness of contributing to the improvement of medium- to long-term business results and increasing corporate value by further clarifying the link between the compensation of directors (including executive officer, excluding outside directors; “Directors” ) and our share value, and by Directors sharing with shareholders not only the benefits of share price rises, but also the risks of share price declines. Our Board of Directors submitted a proposal for the Plan to the General Shareholders’ Meeting.
( 2 ) Outline of the Plan( i ) Outline of the Plan The Plan is a share-based compensation plan under which our shares are acquired through a trust (the trust established in
accordance with the Plan, the “Trust” ) by using the funds contributed by us. Directors will receive our shares as well as the amount of money equivalent to the market value of our shares (as at the date of the retirement of Directors) through the Trust in accordance with the officer stock benefit rules formulated by us. In principle, Directors will receive benefits, such as Shares, on their retirement.
( ii ) Scope of the Plan Directors and executive officers (excluding outside directors and auditors)( iii ) Trust period The trust period shall be from August 2018 (planned) up to the expiry of the Trust (a specific expiry date has not been
determined for the trust period of the Trust, and the Trust will continue as long as the Plan continues; the Plan shall be terminated if the Company’s shares are delisted, the Officer Stock Benefit Regulations are discontinued, or other similar circumstances arise.)
( iv ) Trust amount Subject to the approval of the Plan at the General Shareholders’ Meeting, the Company shall introduce the Plan to cover the
period of three fiscal years from the fiscal year ending on March 31, 2019 to the fiscal year ending on March 31, 2021 (hereinafter, this period of three fiscal years is referred to as the “initial applicable period,” and the initial applicable period and each period of three fiscal years starting after the initial applicable period are referred to as an “applicable period” ) and each subsequent applicable period, and the Company shall contribute cash to the Trust as follows as funds for the acquisition of the Company’s shares by the Trust, in order to deliver the Company’s shares to Directors, etc.
First, at the start of the trust period described in (iii) above, the Company shall contribute funds to the Trust up to ¥430 million (US$4,047 thousand) as the funds required for the initial applicable period (including ¥192 million (US$1,807 thousand) for Directors).
In addition, after the initial applicable period, the Company shall continue to make additional contributions to the Trust up to ¥430 million (US$4,047 thousand) (including ¥192 million (US$1,807 thousand) for Directors) for each applicable period, in principle, until the Plan is terminated. However, if the Company’s shares (excluding those that correspond to points granted to Directors, etc. for each applicable period until the immediately preceding period, that have yet to be delivered to
011_0284001373008.indd 24-25 2018/08/10 11:40:07

2726 ANNUAL REPORT 2018 ANNUAL REPORT 2018
Directors, etc.) and cash ( “residual shares, etc.” ) remain in the trust assets when making such additional contributions, the total amount of the residual shares, etc. (for the Company’s shares, the fair value on the final day of the immediately preceding applicable period) and any amount additionally contributed shall be no more than ¥430 million (US$4,047 thousand) (including ¥192 million (US$1,807 thousand) for Directors).
Furthermore, the Company may contribute funds to the Trust on multiple occasions during an applicable period, including the initial applicable period, until the cumulative amount of contributions in that applicable period reaches the aforementioned maximum amount for each applicable period. If the Company decides to make additional contributions, they shall be disclosed in a timely and appropriate manner.
( v ) Method of acquiring the Company’s shares and number of shares to be acquired The Trust shall acquire the Company’s shares through trading markets or acquiring treasury shares from the Company,
using the funds contributed as described in (iv) above, and no new shares shall be issued. For the initial applicable period, the Trust shall acquire up to 438,000 shares promptly upon the establishment of the Trust. The details of the acquisition of the Company’s shares by the Trust shall be disclosed in a timely and appropriate manner.( vi ) Method of calculating the number of the Company’s shares to be delivered to Directors, etc. For each fiscal year, Directors, etc. shall be granted a number of points determined in consideration of their position, level of
achievement of business results, and other factors, based on the Officer Stock Benefit Regulations. However, points shall not be granted if operating income is negative for that fiscal year. The maximum total number of points to be granted to Directors, etc. per fiscal year shall be 146,000 points (including 65,000 points for Directors). This number has been determined by comprehensively taking into consideration of the current level of officer remuneration paid, trends in the number of Directors, etc., future expectations, and other factors. The Company has determined it to be appropriate.
Each point granted to Directors, etc. shall be converted into one share of common stock of the Company when the Company’s shares are delivered as described in (vii) below (however, in case of events such as a stock split, a gratis allotment of shares or a reverse stock split of the Company’s shares after approval and resolution by shareholders at this Shareholders’ Meeting, the maximum number of points, the number of points already granted and the conversion ratio shall be reasonably adjusted in accordance with the ratio thereof and other conditions).
In principle, the standard number of points for a Director, etc. when delivering the Company’s shares as described in (vii) below shall be the number of points granted up to the time of retirement (hereinafter, the number of points thus calculated shall be referred to as the “vested number of points” ).
( vii ) Delivery of the Company’s shares If a Director, etc. retires and he or she satisfies the beneficiary requirements set forth in the Officer Stock Benefit
Regulations, he or she shall receive delivery from the Trust of a number of the Company’s shares corresponding to his or her “vested number of points” determined as set forth in (vi) above after retirement, in principle, by completing the prescribed beneficiary vesting procedures.
( viii ) Exercise of voting rights Voting rights pertaining to the Company’s shares held in the Trust account shall not be exercised altogether, in accordance
with the directions of the trust administrator, to ensure neutrality to the Company’s management.( ix ) Treatment of dividends The Trust shall receive dividends pertaining to the Company’s shares held in the Trust account, and they shall be used for
purposes such as funds for acquiring the Company’s shares and trust fees for the trustee. Furthermore, if the Trust is terminated, any residual dividends, etc. in the Trust shall be distributed to incumbent Directors, etc. at that time in proportion with the respective number of points held, in accordance with the provisions of the Officer Stock Benefit Regulations.
( x ) At the expiry of the Trust The Trust shall be terminated if the Company’s shares are delisted, the Officer Stock Benefit Regulations are discontinued,
or other similar circumstances arise. The Company intends to acquire without consideration all of the Company’s shares among the Trust’s residual assets at its
expiry and retire them by resolution of the Board of Directors. Any cash among the Trust’s residual assets at its expiry shall be delivered to the Company after excluding any cash to be delivered to Directors, etc. in accordance with (ix) above.
( xi ) Overview of the Trust 1. Name: Board Benefit Trust (BBT) 2. Entrustor: SMK corporation 3. Trustee: Mizuho Trust & Banking Co., Ltd. (re-entrusted by: Asset Management Trust & Custody Services Bank, Ltd.) 4. Beneficiaries: Retired Directors who meet the beneficiary eligibility requirements provided in the Officer Stock Benefit
Regulations 5. Trust administrator: A third party with no conflict of interests with us is to be selected 6. Types of trust: Money trust other than cash trusts (third-party benefit trust) 7. Date of conclusion of this trust agreement: August 2018 (planned) 8. Date on which the funds are entrusted: August 2018 (planned) 9. Period of the Trust: From August 2018 (planned) until the Trust is terminated (No specific date has been set for the
termination of the Trust; the Trust will continue as long as the Plan continues).
SMK Corporation and Consolidated SubsidiariesReport of Independent Auditors
011_0284001373008.indd 26-27 2018/08/10 11:40:08

1 Relocation of SMK Shenzhen Factory
2 Relocation of SMK's China Technology Development Center
SMK Electronics (Shenzhen) Co., Ltd. in Shenzhen, China, relocated and started operating from March, 2018.
The Shenzhen factory is the SMK Group's main overseas connector factory, where it produces a wide variety of connectors and harnesses for the ICT, car electronics and industry market.
The factory relocated to a high-tech business enterprise zone owned by Shenzhen City, Nanshan District local government, which is located approximately 6km from the old factory. This industrial park comes complete with welfare facilities such as a kindergarten, company dormitory, supermarket, and canteen.
By relocating to a new factory, we will be equipped to handle a wider range of products.
SMK Electronics Technology Development (Shenzhen) Co., Ltd., in Shenzhen, China, relocated to the New Jianxing Block in the Jianxing Science & Technology Building, located in the Nanshan District, Shenzhen City in June, 2017.
The new office is located on the top floor (9F) of a building in the business district that is easily accessible by public transport.
With a beautiful view, in the most suitable env i ronment for des ign, engineer s o f Development Center are working on the development of new products of connectors, remote control units and touch panels.
Section 5, Bldg. 23, Baiwangxin Industrial Area, Songbai Road, Xili Street, Nanshan District, Shenzhen City, Guangdong, ChinaLocation
Location New Jianxing Block A 901, Jianxing Science & Technology Building, ShaHe West Road, Nanshan District, Shenzhen City, Guangdong, China
Small Coaxial Connector for Automotive Camera Module
<Main Products of the Shenzhen factory>
Waterproof FAKRA Connector for Automotive Devices
USB Type-C™ Receptacle
Entrance
Design office
2928 ANNUAL REPORT 2018 ANNUAL REPORT 2018
Masanobu Ikeo Tetsuo Hara
Mitsuyuki Masubuchi
Executive Vice President Executive Vice President
Vice PresidentHiroshi Usami
Vice President,Chief Information Officer
Atsushi ObinataVice President
Fumikazu HataVice President
Morikazu FukuiOutside Auditor
Hiroshi MiyakawaVice President
Hideo MatsumotoVice President
Shigechika YanagiExecutive Vice President
Takemi IshibashiVice President
Naru Nakashima Ichiro ShimizuTetsuya NakamuraOutside Auditor Outside AuditorAuditor and
Chairman of Auditors’ Meeting
Kohei OhgakiExecutive Vice President,
Chief Financial Officer
Auditors
Mitsuhiko GotoVice President
Corporate Executive Officers
Toshio NakamuraOutside Director
Yasumitsu IkedaPresident,
Chief Executive Officer andChief Operating Officer
Paul Evans Kaoru IshikawaDirector and
Executive Vice PresidentOutside Director
Directors
Yoshiyuki Kaku Mikio WakabayashiDirector and
Executive Deputy President,Chief Technology Officer
Director andExecutive Vice President
Officer Introduction (As of June 22, 2018)
Topics
011_0284001373008.indd 28-29 2018/08/10 11:40:16
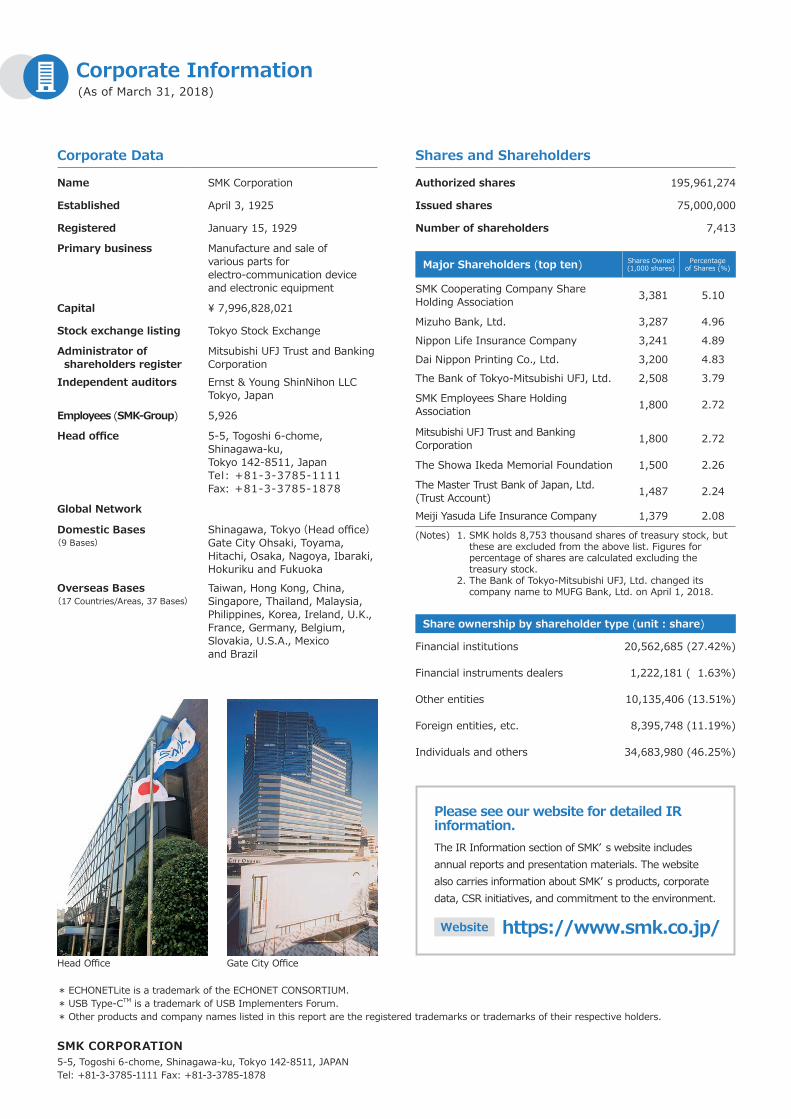
SMK CORPORATION5-5, Togoshi 6-chome, Shinagawa-ku, Tokyo 142-8511, JAPANTel: +81-3-3785-1111 Fax: +81-3-3785-1878
ANNUAL REPORT
2018For the fiscal year ended March 31, 2018
Research & Development Center
Touch Panel Division
Functional Components Division
Connection System Division
USB Type-CTM Receptacle
ECHONETLiteTM Adapter (Wired)
“D2 F/G” ResistiveDecorative Film
Touch Panel
Sigfox RF Module“WF923”
LGMCard
SMK CORPORATION
Shares and ShareholdersCorporate Data
Name SMK Corporation
Established April 3, 1925
Registered January 15, 1929
Primary business Manufacture and sale ofvarious parts forelectro-communication deviceand electronic equipment
Capital ¥ 7,996,828,021
Stock exchange listing Tokyo Stock Exchange
Administrator of shareholders register
Mitsubishi UFJ Trust and Banking Corporation
Independent auditors Ernst & Young ShinNihon LLCTokyo, Japan
Employees (SMK-Group) 5,926
Head office 5-5, Togoshi 6-chome, Shinagawa-ku,Tokyo 142-8511, JapanTel: +81-3-3785-1111Fax: +81-3-3785-1878
Global Network
Domestic Bases(9 Bases)
Shinagawa, Tokyo(Head office)Gate City Ohsaki, Toyama, Hitachi, Osaka, Nagoya, Ibaraki, Hokuriku and Fukuoka
Overseas Bases(17 Countries/Areas, 37 Bases)
Taiwan, Hong Kong, China, Singapore, Thailand, Malaysia, Philippines, Korea, Ireland, U.K., France, Germany, Belgium, Slovakia, U.S.A., Mexico and Brazil
Share ownership by shareholder type (unit : share)
Financial institutions 20,562,685 (27.42%)
Financial instruments dealers 1,222,181 ( 1.63%)
Other entities 10,135,406 (13.51%)
Foreign entities, etc. 8,395,748 (11.19%)
Individuals and others 34,683,980 (46.25%)
Authorized shares 195,961,274
Issued shares 75,000,000
Number of shareholders 7,413
Major Shareholders (top ten) Shares Owned(1,000 shares)
Percentageof Shares (%)
SMK Cooperating Company Share Holding Association 3,381 5.10
Mizuho Bank, Ltd. 3,287 4.96Nippon Life Insurance Company 3,241 4.89Dai Nippon Printing Co., Ltd. 3,200 4.83The Bank of Tokyo-Mitsubishi UFJ, Ltd. 2,508 3.79
SMK Employees Share Holding Association 1,800 2.72
Mitsubishi UFJ Trust and Banking Corporation 1,800 2.72
The Showa Ikeda Memorial Foundation 1,500 2.26
The Master Trust Bank of Japan, Ltd. (Trust Account) 1,487 2.24
Meiji Yasuda Life Insurance Company 1,379 2.08(Notes) 1. SMK holds 8,753 thousand shares of treasury stock, but
these are excluded from the above list. Figures for percentage of shares are calculated excluding the treasury stock.
2. The Bank of Tokyo-Mitsubishi UFJ, Ltd. changed its company name to MUFG Bank, Ltd. on April 1, 2018.
* ECHONETLite is a trademark of the ECHONET CONSORTIUM.* USB Type-CTM is a trademark of USB Implementers Forum.* Other products and company names listed in this report are the registered trademarks or trademarks of their respective holders.
Please see our website for detailed IR information.The IR Information section of SMK’ s website includes annual reports and presentation materials. The website also carries information about SMK’ s products, corporate data, CSR initiatives, and commitment to the environment.
Website https://www.smk.co.jp/Head Office Gate City Office
Corporate Information(As of March 31, 2018)
010_0284001373008.indd 1 2018/08/10 11:41:08
Related Documents