www.eia. gov U.S. Energy Information Administration Independent Statistics & Analysis U.S. Energy Information Administration Spring, 2011 | Washington, DC Annual Energy Outlook 2011 Reference Case

Annual Energy Outlook 2011 Reference Case
Mar 23, 2016
Annual Energy Outlook 2011 Reference Case. U.S. Energy Information Administration Spring, 2011 | Washington, DC. Key results from the AEO2011 Reference case, which assumes current laws remain unchanged. - PowerPoint PPT Presentation
Welcome message from author
This document is posted to help you gain knowledge. Please leave a comment to let me know what you think about it! Share it to your friends and learn new things together.
Transcript
www.eia.govU.S. Energy Information Administration Independent Statistics & Analysis
U.S. Energy Information AdministrationSpring, 2011 | Washington, DC
Annual Energy Outlook 2011Reference Case

2AEO2011, April 2011
Key results from the AEO2011 Reference case,which assumes current laws remain unchanged• Increased estimates for U.S. shale gas resources drive increased
U.S. production, lower prices, and lower imports of natural gas
• Industrial natural gas demand recovers, reversing recent trend
• Non-hydro renewables and natural gas are the fastest growing electricity generation sources, but coal remains the dominant fuel because of the large amount of existing capacity
• Oil imports fall due to increased domestic production—including biofuels—and greater fuel efficiency
• U.S. carbon dioxide emissions rise slowly, but do not pass 2005 levels again until 2027

3
What is included (and excluded) in developing EIA’s “Reference case” projections?• Generally assumes current laws and regulations
– excludes potential future laws and regulations (e.g., proposed greenhouse gas legislation and proposed fuel economy standards are not included)
– provisions generally sunset as specified in law (e.g., renewable tax credits expire)
• Some grey areas– adds a premium to the capital cost of CO2-intensive technologies to reflect market
behavior regarding possible CO2 regulation– assumes implementation of existing regulations that enable the building of new energy
infrastructure and resource extraction
• Includes technologies that are commercial or reasonably expected to become commercial over next decade or so
– includes projected technology cost and efficiency improvements, as well as cost reductions linked to cumulative deployment levels
– does not assume revolutionary or breakthrough technologies
AEO2011, April 2011
4
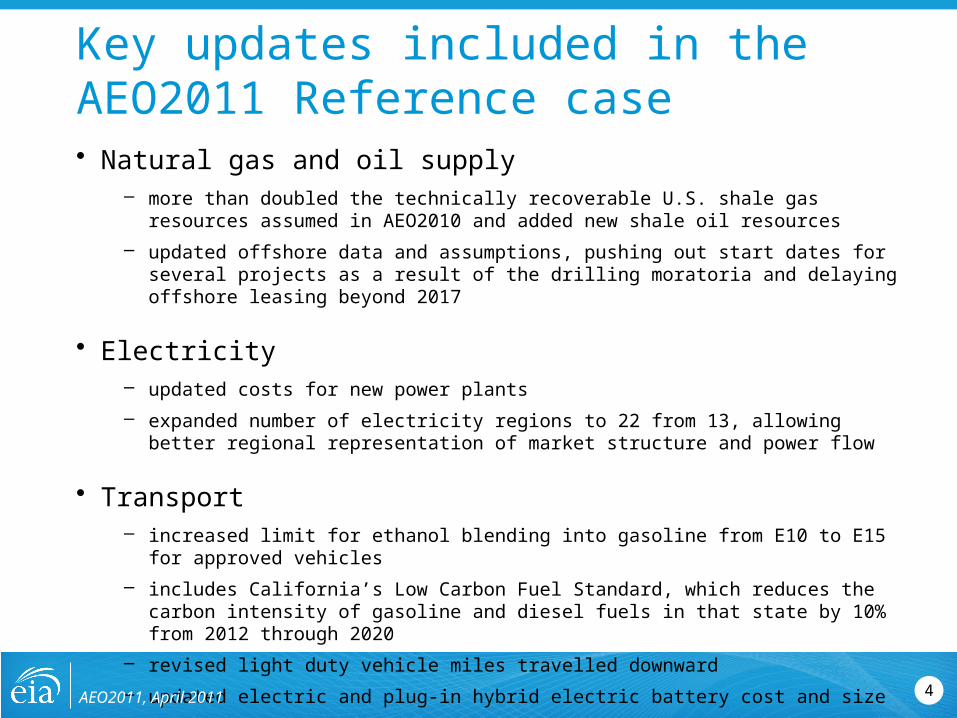
Key updates included in the AEO2011 Reference case• Natural gas and oil supply
– more than doubled the technically recoverable U.S. shale gas resources assumed in AEO2010 and added new shale oil resources
– updated offshore data and assumptions, pushing out start dates for several projects as a result of the drilling moratoria and delaying offshore leasing beyond 2017
• Electricity– updated costs for new power plants– expanded number of electricity regions to 22 from 13, allowing better regional
representation of market structure and power flow
• Transport– increased limit for ethanol blending into gasoline from E10 to E15 for approved vehicles– includes California’s Low Carbon Fuel Standard, which reduces the carbon intensity of
gasoline and diesel fuels in that state by 10% from 2012 through 2020 – revised light duty vehicle miles travelled downward– updated electric and plug-in hybrid electric battery cost and size
AEO2011, April 2011

5
Global energy consumption
AEO2011, April 2011
6
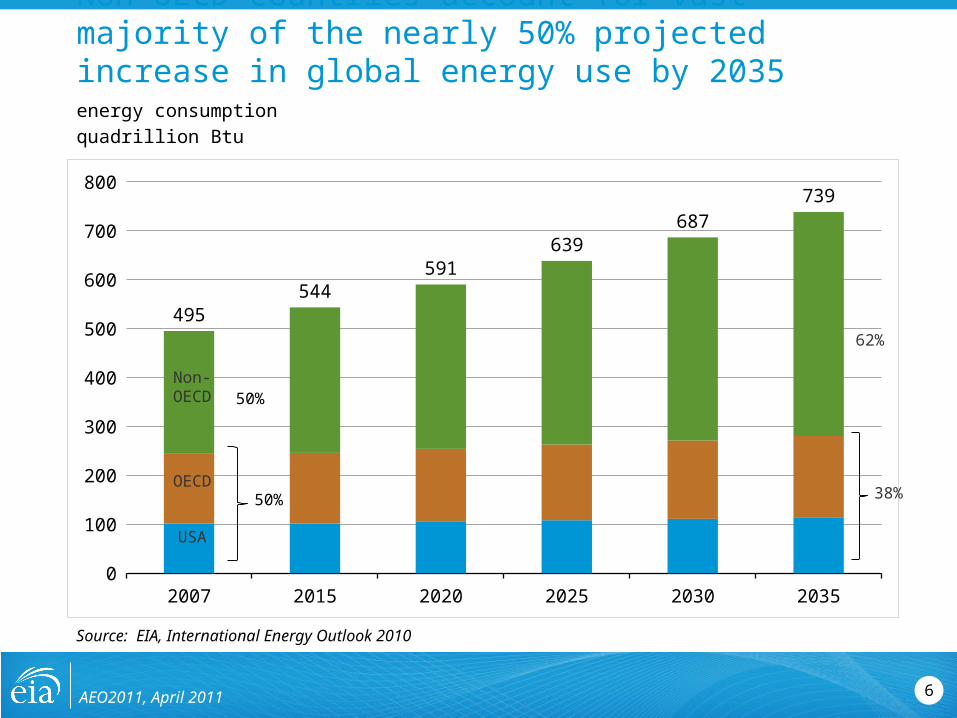
Non-OECD countries account for vast majority of the nearly 50% projected increase in global energy use by 2035
2007 2015 2020 2025 2030 20350
100
200
300
400
500
600
700
800
495544
591639
687739
energy consumptionquadrillion Btu
Source: EIA, International Energy Outlook 2010
Non-OECD
OECD
USA
50%
50%
62%
38%
AEO2011, April 2011

7
Overview of U.S. energy supply and demand
AEO2011, April 2011
8
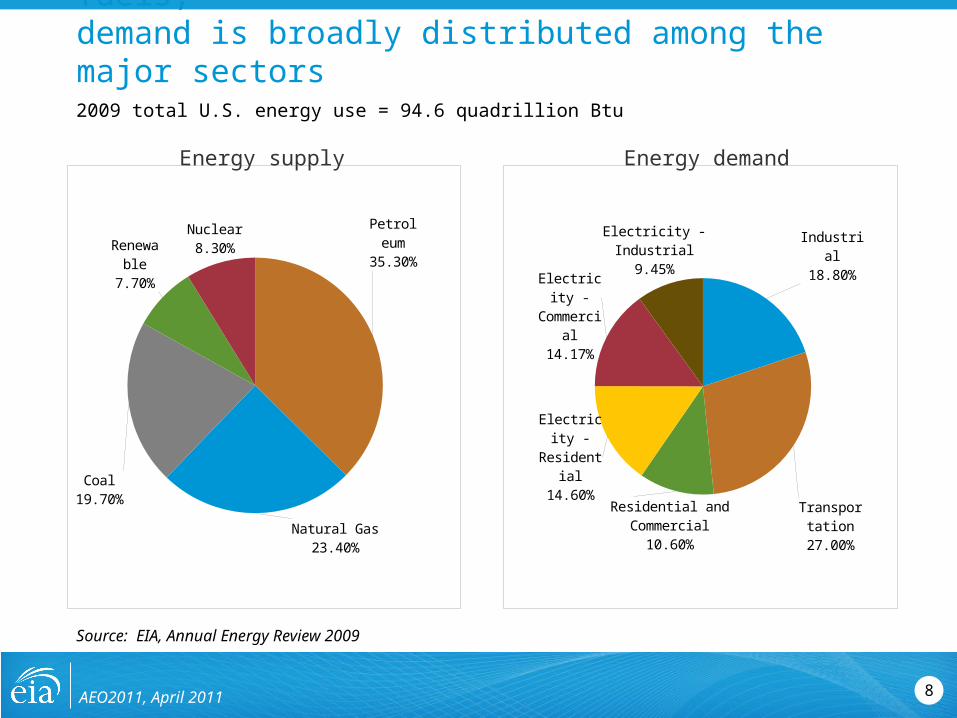
Current U.S. energy supply is 83% fossil fuels;demand is broadly distributed among the major sectors
Petro-leum
35.30%
Natural Gas23.40%
Coal19.70%
Re-new-able
7.70%
Nuclear8.30%
2009 total U.S. energy use = 94.6 quadrillion Btu
Source: EIA, Annual Energy Review 2009
Industrial18.80%
Trans-portation27.00%
Residential and Commercial
10.60%
Electric-ity - Res-idential14.60%
Electric-ity -
Com-mercial14.17%
Electricity - Indus-trial
9.45%
Energy supply Energy demand
AEO2011, April 2011

9
Renewables grow rapidly, but under current policies fossil fuels still provide 78% of U.S. energy use in 2035
0
20
40
60
80
100
120
NuclearNuclearNuclearNuclearNuclearNuclearNuclearNuclearNuclearNuclearNuclearNuclearNuclearNuclearNuclearNuclearNuclearNuclearNuclearNuclearNuclearNuclearNuclearNuclearNuclearNuclearNuclearNuclearNuclearNuclearNuclearNuclearNuclearNuclearNuclearNuclearNuclearNuclearNuclearNuclearNuclearNuclearNuclearNuclearNuclearNuclearNuclearNuclearNuclearNuclearNuclearNuclearNuclearNuclearNuclearNuclear
Oil and other liquid fuels
Oil and other liquid fuelsOil and other liquid fuelsOil and other liquid fuelsOil and other liquid fuelsOil and other liquid fuelsOil and other liquid fuelsOil and other liquid fuelsOil and other liquid fuelsOil and other liquid fuelsOil and other liquid fuelsOil and other liquid fuelsOil and other liquid fuelsOil and other liquid fuelsOil and other liquid fuelsOil and other liquid fuelsOil and other liquid fuelsOil and other liquid fuelsOil and other liquid fuelsOil and other liquid fuelsOil and other liquid fuelsOil and other liquid fuelsOil and other liquid fuelsOil and other liquid fuelsOil and other liquid fuelsOil and other liquid fuelsOil and other liquid fuelsOil and other liquid fuelsOil and other liquid fuelsOil and other liquid fuelsOil and other liquid fuelsOil and other liquid fuelsOil and other liquid fuelsOil and other liquid fuelsOil and other liquid fuelsOil and other liquid fuelsOil and other liquid fuelsOil and other liquid fuelsOil and other liquid fuelsOil and other liquid fuelsOil and other liquid fuelsOil and other liquid fuelsOil and other liquid fuelsOil and other liquid fuelsOil and other liquid fuelsOil and other liquid fuelsOil and other liquid fuelsOil and other liquid fuelsOil and other liquid fuelsOil and other liquid fuelsOil and other liquid fuelsOil and other liquid fuelsOil and other liquid fuelsOil and other liquid fuelsOil and other liquid fuelsOil and other liquid fuels
Liquid biofuelsLiquid biofuelsLiquid biofuelsLiquid biofuelsLiquid biofuelsLiquid biofuelsLiquid biofuelsLiquid biofuelsLiquid biofuelsLiquid biofuelsLiquid biofuelsLiquid biofuelsLiquid biofuelsLiquid biofuelsLiquid biofuelsLiquid biofuelsLiquid biofuelsLiquid biofuelsLiquid biofuelsLiquid biofuelsLiquid biofuelsLiquid biofuelsLiquid biofuelsLiquid biofuelsLiquid biofuelsLiquid biofuelsLiquid biofuelsLiquid biofuelsLiquid biofuelsLiquid biofuelsLiquid biofuelsLiquid biofuelsLiquid biofuelsLiquid biofuelsLiquid biofuelsLiquid biofuelsLiquid biofuelsLiquid biofuelsLiquid biofuelsLiquid biofuelsLiquid biofuelsLiquid biofuelsLiquid biofuelsLiquid biofuelsLiquid biofuelsLiquid biofuelsLiquid biofuelsLiquid biofuelsLiquid biofuelsLiquid biofuelsLiquid biofuelsLiquid biofuelsLiquid biofuelsLiquid biofuelsLiquid biofuelsLiquid biofuelsNatural gasNatural gasNatural gasNatural gasNatural gasNatural gasNatural gasNatural gasNatural gasNatural gasNatural gasNatural gasNatural gasNatural gasNatural gasNatural gasNatural gasNatural gasNatural gasNatural gasNatural gasNatural gasNatural gasNatural gasNatural gasNatural gasNatural gasNatural gasNatural gasNatural gasNatural gasNatural gasNatural gasNatural gasNatural gasNatural gasNatural gasNatural gasNatural gasNatural gasNatural gasNatural gasNatural gasNatural gasNatural gasNatural gasNatural gasNatural gasNatural gasNatural gasNatural gasNatural gasNatural gasNatural gasNatural gasNatural gasCoalCoalCoalCoalCoalCoalCoalCoalCoalCoalCoalCoalCoalCoalCoalCoalCoalCoalCoalCoalCoalCoalCoalCoalCoalCoalCoalCoalCoalCoalCoalCoalCoalCoalCoalCoalCoalCoalCoalCoalCoalCoalCoalCoalCoalCoalCoalCoalCoalCoalCoalCoalCoalCoalCoalCoal
Renewables (excluding liquid
biofuels)Renewables
(excluding liquid biofuels)
Renewables (excluding liquid
biofuels)
Renewables (excluding liquid
biofuels)
Renewables (excluding liquid
biofuels)
Renewables (excluding liquid
biofuels)
Renewables (excluding liquid
biofuels)
Renewables (excluding liquid
biofuels)
Renewables (excluding liquid
biofuels)
Renewables (excluding liquid
biofuels)
Renewables (excluding liquid
biofuels)
Renewables (excluding liquid
biofuels)
Renewables (excluding liquid
biofuels)
Renewables (excluding liquid
biofuels)
Renewables (excluding liquid
biofuels)
Renewables (excluding liquid
biofuels)
Renewables (excluding liquid
biofuels)
Renewables (excluding liquid
biofuels)
Renewables (excluding liquid
biofuels)
Renewables (excluding liquid
biofuels)
Renewables (excluding liquid
biofuels)
Renewables (excluding liquid
biofuels)
Renewables (excluding liquid
biofuels)
Renewables (excluding liquid
biofuels)
Renewables (excluding liquid
biofuels)
Renewables (excluding liquid
biofuels)
Renewables (excluding liquid
biofuels)
Renewables (excluding liquid
biofuels)
Renewables (excluding liquid
biofuels)Renewables
(excluding liquid biofuels)
Renewables (excluding liquid
biofuels)
Renewables (excluding liquid
biofuels)
Renewables (excluding liquid
biofuels)
Renewables (excluding liquid
biofuels)
Renewables (excluding liquid
biofuels)
Renewables (excluding liquid
biofuels)
Renewables (excluding liquid
biofuels)
Renewables (excluding liquid
biofuels)
Renewables (excluding liquid
biofuels)
Renewables (excluding liquid
biofuels)
Renewables (excluding liquid
biofuels)
Renewables (excluding liquid
biofuels)
Renewables (excluding liquid
biofuels)
Renewables (excluding liquid
biofuels)
Renewables (excluding liquid
biofuels)
Renewables (excluding liquid
biofuels)
Renewables (excluding liquid
biofuels)
Renewables (excluding liquid
biofuels)
Renewables (excluding liquid
biofuels)
Renewables (excluding liquid
biofuels)
Renewables (excluding liquid
biofuels)
Renewables (excluding liquid
biofuels)
Renewables (excluding liquid
biofuels)
Renewables (excluding liquid
biofuels)
Renewables (excluding liquid
biofuels)
Renewables (excluding liquid
biofuels)
U.S. primary energy consumptionquadrillion Btu per year
Source: EIA, Annual Energy Outlook 2011
History Projections2009
37%
25%
21%
9%
7%
1%
33%
24%
21%
10%
8%
3%
Shares of total U.S. energy
AEO2011, April 2011

10
Energy efficiency gains reduce consumption 13% from where it would otherwise be; structural change is even larger
quadrillion Btu
Source: EIA, Annual Energy Outlook 2011
2005
2007
2009
2011
2013
2015
2017
2019
2021
2023
2025
2027
2029
2031
2033
2035
0
50
100
150
200
250Constant Intensity
Constant Ef-ficiency
Reference Case Consumption
Efficiency change
Structural change-33%
-13%
AEO2011, April 2011

11
Energy and CO2 per dollar of GDP continue to decline;per-capita energy use also declines
index, 2005=1
Source: EIA, Annual Energy Outlook 2011
1980
1983
1986
1989
1992
1995
1998
2001
2004
2007
2010
2013
2016
2019
2022
2025
2028
2031
2034
0.00
0.25
0.50
0.75
1.00
1.25
1.50
1.75
Per dollarPer capitaCO2 per GDP
History Projections2009
AEO2011, April 2011
12
1990
1992
1994
1996
1998
2000
2002
2004
2006
2008
2010
2012
2014
2016
2018
2020
2022
2024
2026
2028
2030
2032
2034
0
1
2
3
4
5
6
7
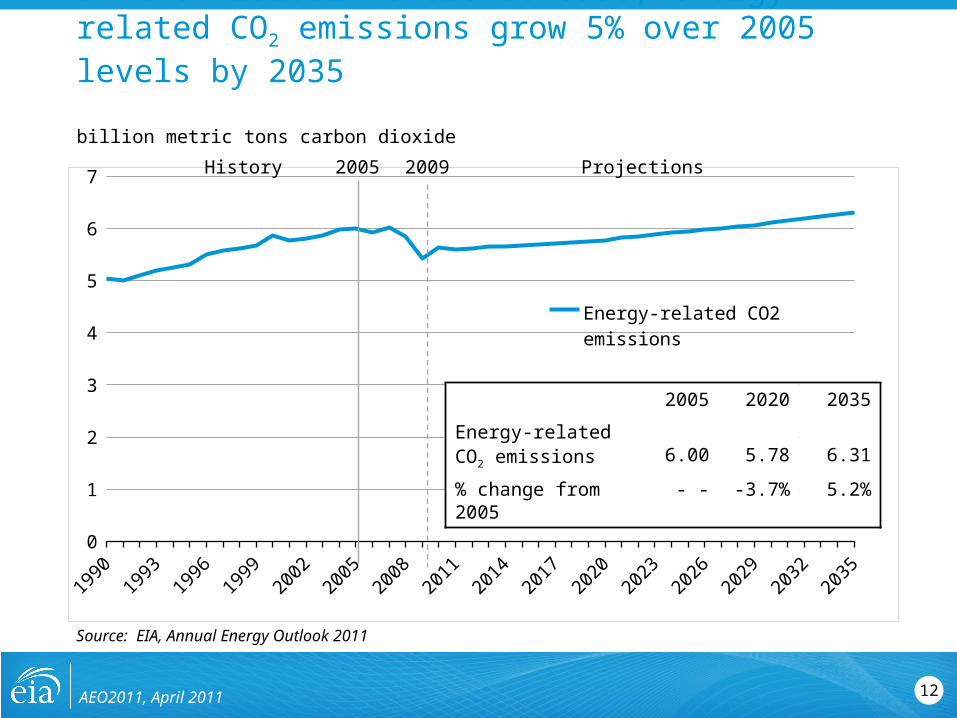
Energy-related CO2 emissions
2005 2020 2035
Energy-related CO2 emissions
6.00 5.78 6.31
% change from 2005 - - -3.7% 5.2%
In the AEO2011 Reference case, energy-related CO2 emissions grow 5% over 2005 levels by 2035
billion metric tons carbon dioxide
Source: EIA, Annual Energy Outlook 2011
ProjectionsHistory 20092005
AEO2011, April 2011

13
Electricity
AEO2011, April 2011
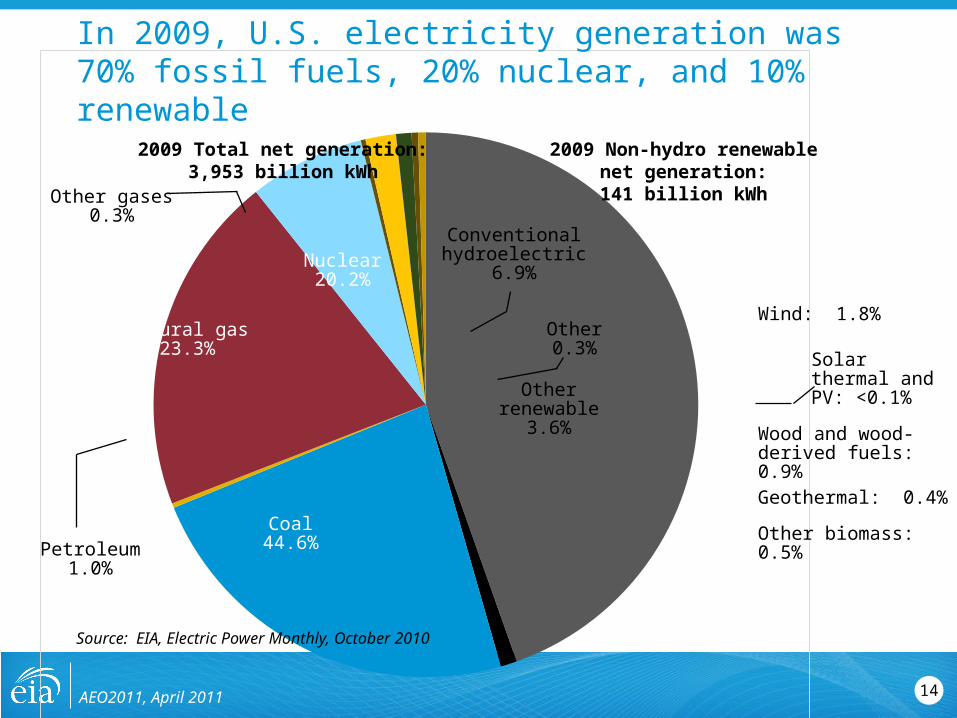
In 2009, U.S. electricity generation was 70% fossil fuels, 20% nuclear, and 10% renewable
Nuclear20.2%
Natural gas23.3%
2009 Total net generation:3,953 billion kWh
Coal44.6%
2009 Non-hydro renewablenet generation:141 billion kWh
Geothermal: 0.4%
Other biomass: 0.5%
Wood and wood-derived fuels: 0.9%
Otherrenewable
3.6%
Conventionalhydroelectric
6.9%
Other0.3%
Wind: 1.8%
Solar thermal and PV: <0.1%
Petroleum1.0%
Other gases0.3%
14
Source: EIA, Electric Power Monthly, October 2010
AEO2011, April 2011

While projected electricity consumption grows by 30%, the rate of growth has slowed
15
percent growth (3-year rolling average)
Source: EIA, Annual Energy Outlook 2011
1950
1960
1970
1980
1990
2000
2010
2020
2030
0
2
4
6
8
10
12
14
Projections
HistoryPeriod Annual Growth1950s 9.81960s 7.31970s 4.71980s 2.91990s 2.42000-2009 0.52009-2035 1.0
Structural Change in Economy - Higher prices - Standards - Improved efficiency
2009
AEO2011, April 2011
1990
1995
2000
2005
2010
2015
2020
2025
2030
2035
0
1
2
3
4
5
6
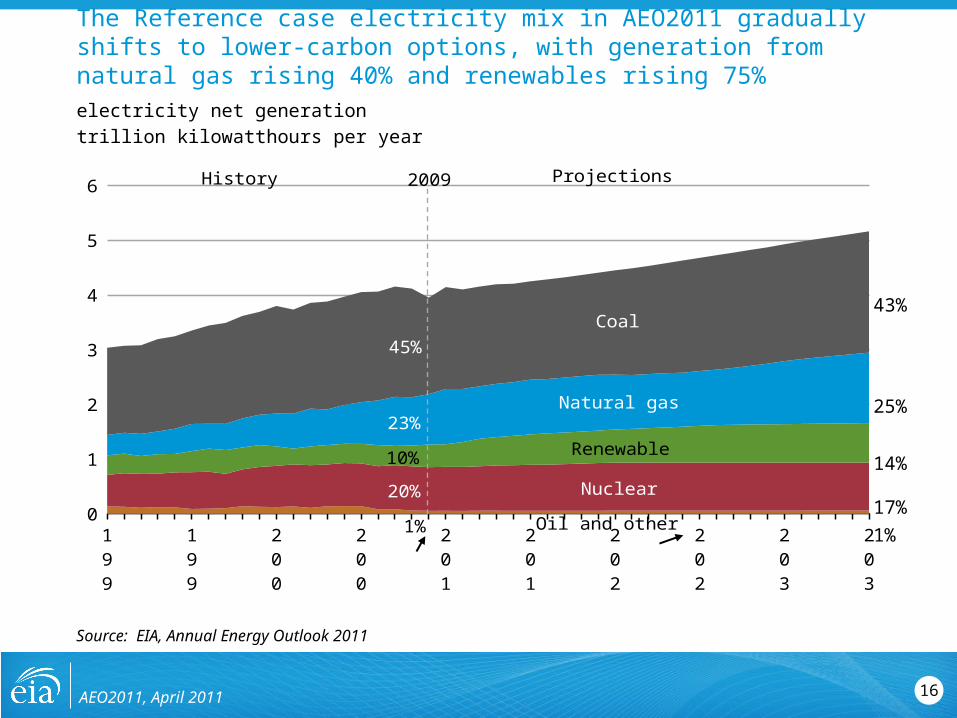
45%
23%
10%
20%
1%
Coal
Natural gas
Renewable
Nuclear
Oil and other
ProjectionsHistory 2009
25%
1%
43%
14%
17%
The Reference case electricity mix in AEO2011 gradually shifts to lower-carbon options, with generation from natural gas rising 40% and renewables rising 75%
16
electricity net generationtrillion kilowatthours per year
Source: EIA, Annual Energy Outlook 2011
AEO2011, April 2011

17
Updated electric power plant capital costs show increases for nuclear, coal, and wind, while solar costs declineovernight capital cost2009 dollars per kilowatt
Source: EIA, Annual Energy Outlook 2011
Natural Gas CC
Pulverized Coal
IGCC CCS
Nuclear Wind Biomass Solar Thermal
Photovoltaic0
1000
2000
3000
4000
5000
6000
7000
AEO 2010 AEO 2011
+ 1%
+ 25%
+ 39% + 37%
+ 21%
- 2%
- 10%
- 25%
AEO2011, April 2011
1990
1995
2000
2005
2010
2015
2020
2025
2030
2035
0
50
100
150
200
250
300
350
400
450 ProjectionsHistory 2009
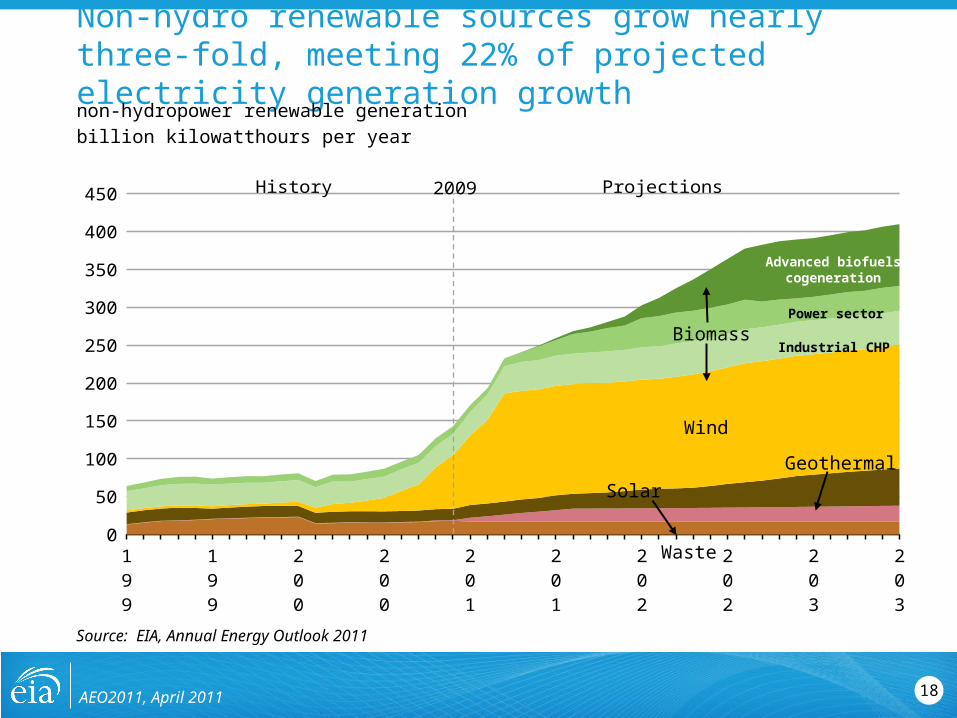
Non-hydro renewable sources grow nearly three-fold, meeting 22% of projected electricity generation growth
18
non-hydropower renewable generationbillion kilowatthours per year
Source: EIA, Annual Energy Outlook 2011
Wind
Solar
Biomass
Geothermal
Waste
Industrial CHP
Power sector
Advanced biofuels cogeneration
AEO2011, April 2011
19
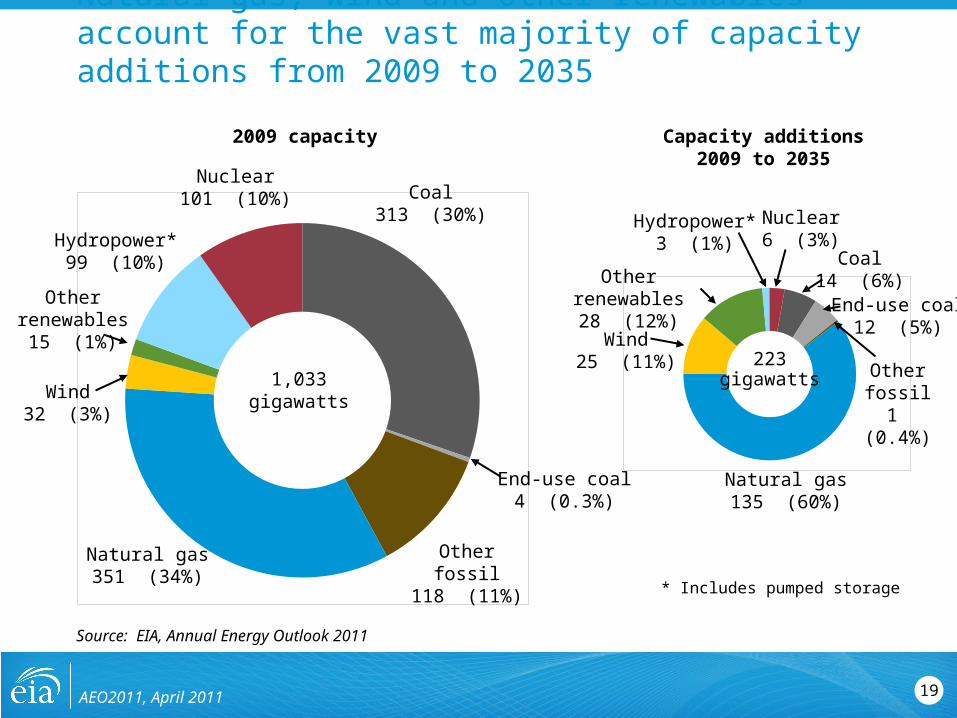
Natural gas, wind and other renewables account for the vast majority of capacity additions from 2009 to 2035
Source: EIA, Annual Energy Outlook 2011
Coal313 (30%)
Natural gas351 (34%)
Hydropower*99 (10%)
Nuclear101 (10%)
Other renewables
15 (1%)
Other fossil118 (11%)
* Includes pumped storage
Coal14 (6%)
Natural gas135 (60%)
Hydropower*3 (1%)
Nuclear6 (3%)
Other renewables28 (12%)
Other fossil
1 (0.4%)
2009 capacity Capacity additions 2009 to 2035
1,033gigawatts
223gigawatts
Wind25 (11%)
Wind32 (3%)
End-use coal4 (0.3%)
End-use coal12 (5%)
AEO2011, April 2011

20
Natural Gas
AEO2011, April 2011

Over the last decade, U.S. shale gas production has increased 14-fold and now comprises about 22 percent of total U.S. production
21
annual shale gas production trillion cubic feet
Sources: EIA, Lippman Consulting2000 2001 2002 2003 2004 2005 2006 2007 2008 2009 20100
1
2
3
4
5
6
Eagle Ford (TX)Marcellus (PA and Other Eastern states)Haynesville (LA and TX)Woodford (OK)Fayetteville (AR)Barnett (TX)Antrim (MI, IN, and OH)
AEO2011, April 2011

22
Shale gas has been the primary source of recent growth in U.S. technically recoverable natural gas resources
2000 2005 2006 2007 2008 2009 2010 20110
500
1000
1500
2000
2500
3000
U.S. dry gas resourcestrillion cubic feet
*Alaska resource estimates prior to AEO2009 reflect resources from the North Slope that were not included in previously published documentation.Source: EIA, Annual Energy Outlook 2011
2543
245
827
1472
Unproved shale gas
Unproved other gas (including Alaska* and offshore)
Proved reserves (all types and locations)
AEO2011, April 2011

23
30% domestic gas production growth outpaces 16% consumption growth, leading to declining imports
1990
1992
1994
1996
1998
2000
2002
2004
2006
2008
2010
2012
2014
2016
2018
2020
2022
2024
2026
2028
2030
2032
2034
0
5
10
15
20
25
30
U.S. dry gastrillion cubic feet per year
Source: EIA, Annual Energy Outlook 2011
ProjectionsHistory 2009
Consumption
Domestic supply
AEO2011 Reference caseAEO2010 Reference case
Net imports 11%
1%
6%
AEO2011, April 2011

1990
1995
2000
2005
2010
2015
2020
2025
2030
2035
0
5
10
15
20
25
30
2%
Shale gas offsets declines in other U.S. supply to meet consumption growth and lower import needs
24
U.S. dry gastrillion cubic feet per year
Source: EIA, Annual Energy Outlook 2011
Non-associated offshore
ProjectionsHistory
Associated with oilCoalbed methane
Net imports
Non-associated onshore
Shale gas
2009
11%
1%
9% 7%
9%9%
20%
14%
8%
8%
6%
46%
Alaska 1%
Tight gas28%22%
AEO2011, April 2011

25
Natural gas consumption is quite dispersed; industrial and electric power use drives future demand growth
1990
1992
1994
1996
1998
2000
2002
2004
2006
2008
2010
2012
2014
2016
2018
2020
2022
2024
2026
2028
2030
2032
2034
0
5
10
15
20
25
30
U.S. dry gas consumptiontrillion cubic feet per year
*Includes combined heat-and-power and lease and plant fuel. **Includes pipeline fuel.Source: EIA, Annual Energy Outlook 2011
ProjectionsHistory 2009
Industrial*
Central electric power
Commercial
Residential Transportation**
35%
18%
14%
30%
3%
32%
21%
14%
30%
3%
AEO2011, April 2011
26
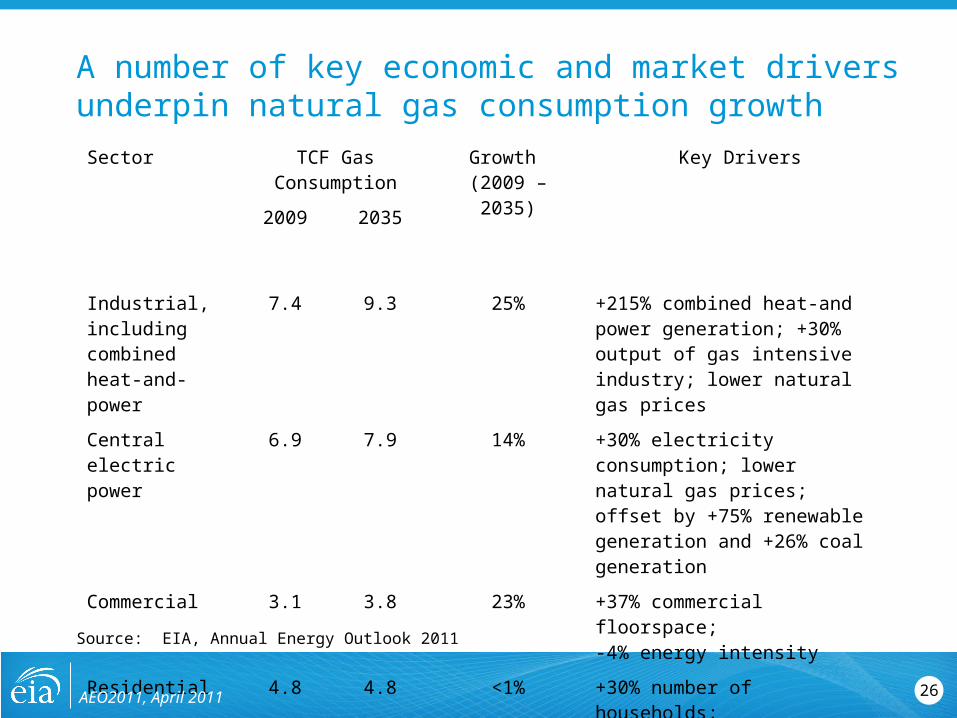
A number of key economic and market drivers underpin natural gas consumption growth
Sector TCF Gas Consumption
Growth (2009 – 2035)
Key Drivers
2009 2035
Industrial, including combined heat-and-power
7.4 9.3 25% +215% combined heat-and power generation; +30% output of gas intensive industry; lower natural gas prices
Central electric power
6.9 7.9 14% +30% electricity consumption; lower natural gas prices; offset by +75% renewable generation and +26% coal generation
Commercial 3.1 3.8 23% +37% commercial floorspace; -4% energy intensity
Residential 4.8 4.8 <1% +30% number of households; +19% total square footage;-17% energy intensity
Source: EIA, Annual Energy Outlook 2011
AEO2011, April 2011
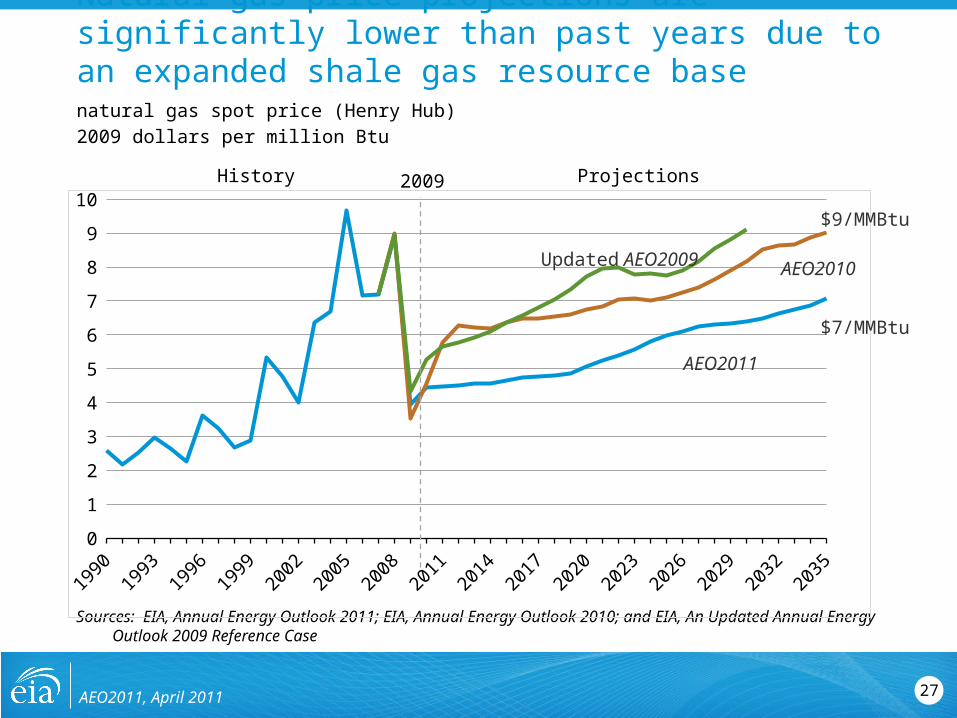
27
Natural gas price projections are significantly lower than past years due to an expanded shale gas resource basenatural gas spot price (Henry Hub)2009 dollars per million Btu
Sources: EIA, Annual Energy Outlook 2011; EIA, Annual Energy Outlook 2010; and EIA, An Updated Annual Energy Outlook 2009 Reference Case
1990
1992
1994
1996
1998
2000
2002
2004
2006
2008
2010
2012
2014
2016
2018
2020
2022
2024
2026
2028
2030
2032
2034
0
1
2
3
4
5
6
7
8
9
10
ProjectionsHistory 2009
Updated AEO2009
AEO2011
AEO2010
$9/MMBtu
$7/MMBtu
AEO2011, April 2011
28
Oil and other liquid supply
AEO2011, April 2011
29
1980
1985
1990
1995
2000
2005
2010
2015
2020
2025
2030
2035
0
25
50
75
100
125
150
175
200
225
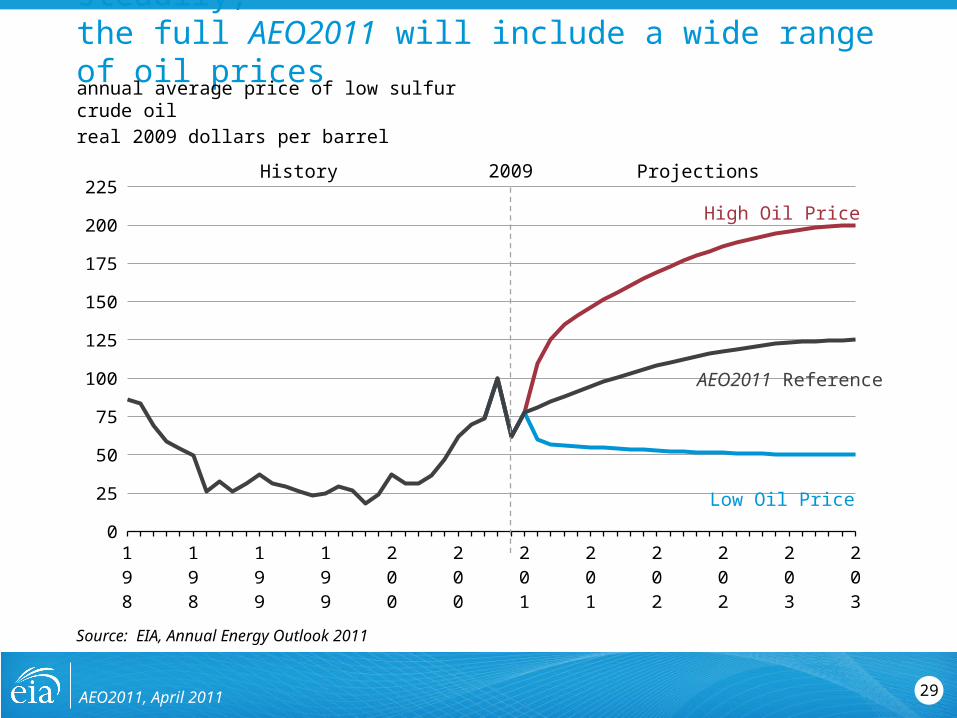
Oil prices in the Reference case rise steadily;the full AEO2011 will include a wide range of oil pricesannual average price of low sulfur crude oilreal 2009 dollars per barrel
Source: EIA, Annual Energy Outlook 2011
ProjectionsHistory 2009
High Oil Price
Low Oil Price
AEO2011 Reference
AEO2011, April 2011
30
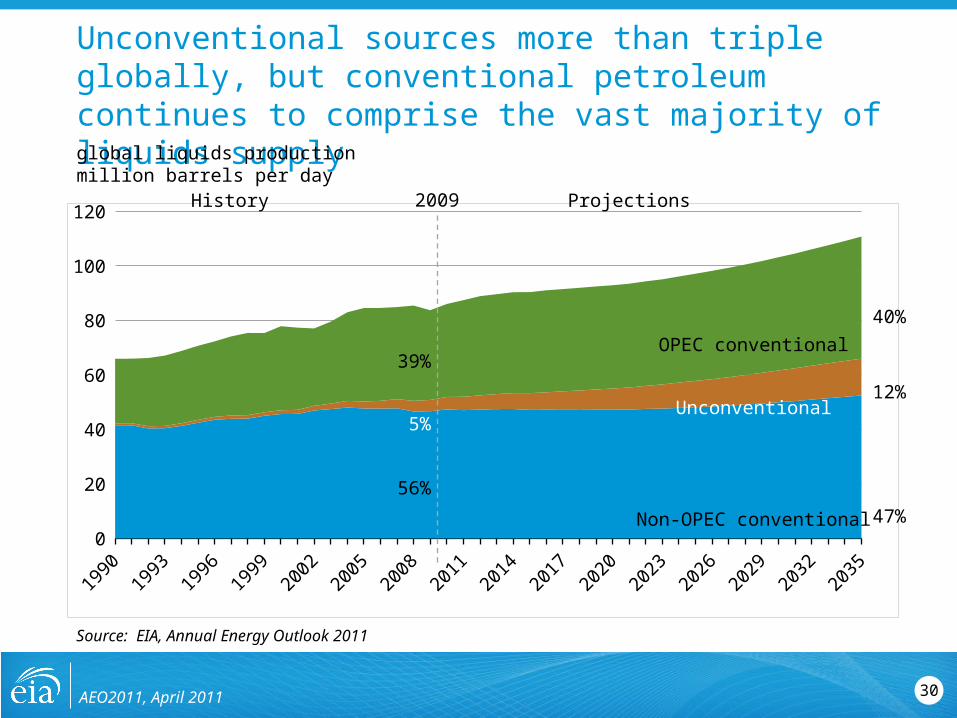
Unconventional sources more than triple globally, but conventional petroleum continues to comprise the vast majority of liquids supply
1990
1992
1994
1996
1998
2000
2002
2004
2006
2008
2010
2012
2014
2016
2018
2020
2022
2024
2026
2028
2030
2032
2034
0
20
40
60
80
100
120
global liquids productionmillion barrels per day
Source: EIA, Annual Energy Outlook 2011
ProjectionsHistory 2009
OPEC conventional
Non-OPEC conventional
Unconventional12%
47%
40%
39%
5%
56%
AEO2011, April 2011

31
U.S. imports of liquid fuels fall due to increased domestic production – including biofuels – and greater fuel efficiencyU.S. liquid fuels consumptionmillion barrels per day
Source: EIA, Annual Energy Outlook 2011
1970
1975
1980
1985
1990
1995
2000
2005
2010
2015
2020
2025
2030
2035
0
5
10
15
20
25ProjectionsHistory
Natural gas plant liquids
Petroleum supply
Biofuels including imports
Net petroleum imports
2009
13%
11%
41%
32%
10%
52%
34%
4%
Liquids from coal3%
AEO2011, April 2011

32
Biofuels, natural gas liquids, and crude oil production are key sources of increased domestic liquids supplyU.S. liquid fuelsmillion barrels per day
Source: EIA, Annual Energy Outlook 2011
0 2 4 6 8 10 12 14 16 18 20 22
Series4
Series3
Net product imports
Net crude oil imports
Natural gas plant liquids
Liquids from coalGulf of Mexico
Crude oil production
Biofuels (including net imports)
Refinery processing gain
Total consumption
AEO2011, April 2011

33
2009 2022 2035 0
5
10
15
20
25
30
35
40
45
Other Advanced
Biofuels fall short of the goal in 2022, but exceed the 36 billion gallon RFS target by 2031
billions ethanol-equivalent gallons
Source: EIA, Annual Energy Outlook 2011
Legislated RFS in 2022
RFS with adjustments under CAA Sec.211(o)(7)
BiodieselNet imports
Cellulosic biofuels
Corn ethanol
AEO2011, April 2011

34
2000
2005
2010
2015
2020
2025
2030
2035
0
5
10
15
20
25
30
35
40
45
New light duty vehicle fuel economy achieves almost 38 mpg by 2035 in the Reference case
miles per gallon
Source: EIA, Annual Energy Outlook 2011
2009 ProjectionsHistory
Summary of standards
2012-2016: 34.1 mpg CAFE average (based on NHTSA vehicle footprint sales distribution)
2020: 35 mpg by statute2017-2025: Reference case does not include proposal
planned for September 2011
AEO2011, April 2011

35
1995
2000
2005
2010
2015
2020
2025
2030
2035
0
4
8
12
16
Most transport fuel growth is in light and heavy duty vehiclesU.S. transportation energy consumptionmillion barrels per day oil equivalent
Source: EIA, Annual Energy Outlook 2011
Rail
Air
ProjectionsHistory
Heavy-duty vehicles
Light-duty vehicles
Marine
2009
4%
67%
2%
10%
16%
64%
20%
9%4%2%
AEO2011, April 2011

36
Efficiency improvements partially offset underlying drivers of growth in transportation services
* Equal to a 25% reduction in fuel use per mile. ** Equal to an 8% reduction in fuel use per mile.
Source: EIA, Annual Energy Outlook 2011
2009 2035Growth
(2009-2035)
Light duty vehiclesFuel consumption (million barrels per day oil equivalent) 8.9 10.2 14%
Number of licensed drivers (millions) 207 265 28%
Miles per licensed driver 13,100 15,300 17%
Efficiency of vehicle stock (mpg) 20.8 27.9 34%*
Heavy duty vehiclesFuel consumption (million barrels per day oil equivalent) 2.2 3.2 47%
Manufacturing output (billion 2005 dollars) 4,197 6,770 61%
Number of freight trucks (millions) 8.7 16.6 90%
Miles per vehicle 23,700 20,200 -15%
Efficiency of vehicle stock (mpg) 6.1 6.6 9%**
AEO2011, April 2011
37
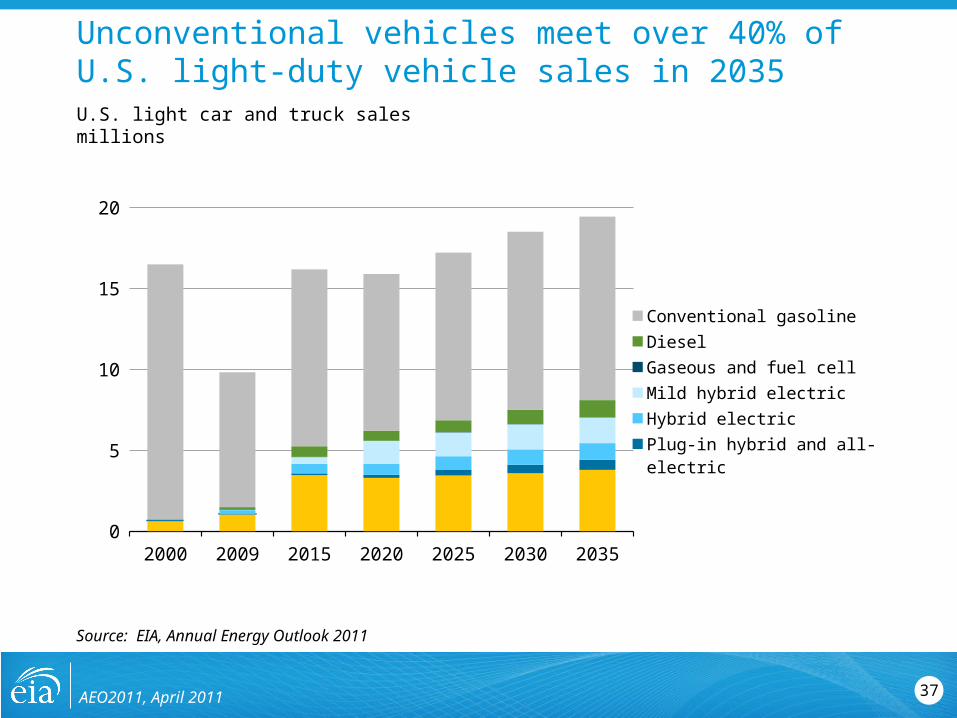
Unconventional vehicles meet over 40% of U.S. light-duty vehicle sales in 2035U.S. light car and truck salesmillions
Source: EIA, Annual Energy Outlook 2011
2000 2009 2015 2020 2025 2030 20350
5
10
15
20
Conventional gasolineDieselGaseous and fuel cellMild hybrid electricHybrid electricPlug-in hybrid and all-electricE85 flex fuel
AEO2011, April 2011

38
For more informationU.S. Energy Information Administration home page | www.eia.gov
Short-Term Energy Outlook | www.eia.gov/steo
Annual Energy Outlook | www.eia.gov/aeo
International Energy Outlook | www.eia.gov/ieo
Monthly Energy Review | www.eia.gov/mer
AEO2011, April 2011
Related Documents


![NUCLEAR ENERGY OUTLOOK Oarai... · ThD / 16 April 2007 Oarai [Japan] 3 World Energy Outlook 2006 Contents Reference scenario Alternative Policy scenario Focus on key topics ¾Impact](https://static.cupdf.com/doc/110x72/5fff909af7411f0b500558ef/nuclear-energy-outlook-oarai-thd-16-april-2007-oarai-japan-3-world-energy.jpg)