Annual Comprehensive Financial Report of the Freehold Regional High School District County of Monmouth Englishtown , New Jersey For the Fiscal Year Ended June 30, 2021 Prepared by FRHSD Business Office

Welcome message from author
This document is posted to help you gain knowledge. Please leave a comment to let me know what you think about it! Share it to your friends and learn new things together.
Transcript

Annual ComprehensiveFinancial Report
of the
Freehold Regional High School District
County of Monmouth
Englishtown, New Jersey
For the Fiscal Year Ended June 30, 2021
Prepared by
FRHSD Business Office


TABLE OF CONTENTS
PAGEINTRODUCTORY SECTION
Letter of TransmittalRoster of OfficialsConsultants and AdvisorsOrganizational Chart
1-4567
FINANCIAL SECTION
Independent Auditor's Report 8-10
REQUIRED SUPPLEMENTARY INFORMATION - Part I 11
Management’s Discussion and Analysis (Unaudited) 12-22
BASIC FINANCIAL STATEMENTS 23
A. District-Wide Financial Statements: 24
A-1 Statement of Net PositionA-2 Statement of Activities
2526
B. Major Fund Financial Statements: 27
Governmental Funds:
B-1 Balance SheetStatement of Revenues, Expenditures, and Changes in FundBalanceReconciliation of the Statement of Revenues, Expenditures, andChanges in Fund Balances of Governmental Funds to theStatement of Activities
28-29B-2
30B-3
31
Other Funds: 32
Propriety Funds:
B-4 Statement of Net PositionStatement of Revenues, Expenses, and Changes in Net PositionStatement of Cash Flows
33B-5 34B-6 35
Fiduciary Funds:
B-7 Statement of Fiduciary Net PositionB-8 Statement of Changes in Fiduciary Net Position
3637
Notes to the Financial Statements 38-88

TABLE OF CONTENTS (CONTINUED)PAGE
REQUIRED SUPPLEMENTARY INFORMATION - Part II 89
C. Budgetary Comparison Schedules:
C-1 General FundC-2 Special Revenue FundC-3 Budget to GAAP Reconciliation
90
91-105106107
REQUIRED SUPPLEMENTARY INFORMATION - Part III 108
L. Schedules Related to Accounting and Reporting for Pension (GASB 68)
Schedule of the District’s Proportionate Share of the Net PensionLiability - Public Employees Retirement System- Last Ten YearsSchedule of the District’s Contributions - Public EmployeesRetirement System- Last Ten YearsSchedule of the District’s Proportionate Share of the Net PensionLiability Teachers Pension and Annuity Fund- Last Ten YearsSchedules Related to Accounting and Reporting for Pension (GASB 68)Note to RSI III for the Fiscal Year Ended June 30, 2021
109
L-1110
L-2111
L-3112
L-4113
REQUIRED SUPPLEMENTARY INFORMATION - Part IV 114
M. Schedule Related to Accounting and Reporting for Postemployment BenefitsOther Than Pensions (GASB 75)
M-1 Schedule of Changes in the Total OPEB Liability and Related Ratios- Last Ten Years
M-2 Notes to the Required Supplementary Information Part IV
115
116117
OTHER SUPPLEMENTARY INFORMATION 118
D. School Level Schedules N/A
E. Special Revenue Fund:
E-1 Combining Schedule of Revenues and Expenditures- Budgetary Basis
E-2 Demonstrably Effective Program Aid Schedule of Expenditures -Budgetary Basis
E-3 Early Childhood Program Aid Schedule of Expenditures -Budgetary Basis
E-4 Distance Learning Network Aid Schedule of Expenditures -Budgetary Basis
E-5 Instructional Supplement Aid Schedule of Expenditures -Budgetary Basis
119
120-122
N/A
N/A
N/A
N/A
F. Capital Projects Fund 123
F-1 Summary Statement of Project Expenditures - Budgetary BasisSummary Schedule of Revenues, Expenditures and Changes inFund Balance - Budgetary Basis
124F-2
125

TABLE OF CONTENTS (CONTINUED)PAGE
F. Capital Projects Fund (Continued)
Summary Schedule of Project Revenues, Expenditures and Changesin Fund Balance - Budgetary Basis - Freehold Boro High School -Roof Replacement
F-2a
126
F-2b Summary Schedule of Project Revenues, Expenditures and Changesin Fund Balance - Budgetary Basis - Marlboro High School - RoofReplacementSummary Schedule of Project Revenues, Expenditures and Changesin Fund Balance - Budgetary Basis - Freehold Boro High School -Boiler & HVAC ReplacementSummary Schedule of Project Revenues, Expenditures and Changesin Fund Balance - Budgetary Basis - Districtwide Energy SavingsImprovement PlanSummary Schedule of Project Revenues, Expenditures and Changesin Fund Balance - Budgetary Basis - Colts Neck High School RoofReplacementSummary Schedule of Project Revenues, Expenditures and Changesin Fund Balance - Budgetary Basis - Howell High School RoofReplacementSummary Schedule of Project Revenues, Expenditures and Changesin Fund Balance - Budgetary Basis - Freehold Township High SchoolRoof ReplacementSummary Schedule of Project Revenues, Expenditures and Changesin Fund Balance - Budgetary Basis - Manalapan High School RoofReplacementSummary Schedule of Project Revenues, Expenditures, ProjectBalance and Project Status - Budgetary Basis - School SecurityGrant: Interior Door Security Upgrades - Districtwide
127F-2c
128F-2d
129F-2e
130F-2f
131F-2g
132F-2h
133F-2i
134
G. Proprietary Funds
Enterprise Fund:
G-1 Combining Statement of Net PositionG-2 Combining Statement of Revenues, Expenses and Changes in
Fund Net PositionG-3 Combining Statement of Cash Flows
135
136
137138
H. Fiduciary Fund N/A
I. Long-Term Debt 139
Schedule of Serial BondsSchedule of Obligations Under Capital Leases
1-1 140I-2 141

TABLE OF CONTENTS (CONTINUED)PAGE
STATISTICAL SECTION - UNAUDITED
J-1 142Net Position by ComponentChanges in Net PositionFund Balances - Governmental FundsChanges in Fund Balances - Governmental FundsGeneral Fund Other Local Revenue by SourceAssessed Value and Actual Value of Taxable PropertyDirect and Overlapping Property Tax RatesPrincipal Property Taxpayers - Current Year and Nine Years AgoProperty Tax Levies and CollectionRatios of Outstanding Debt by TypeRatios of General Bonded Debt OutstandingRatios of Overlapping Governmental Activities DebtLegal Debt Margin InformationDemographic and Economic StatisticsPrincipal Employers - Current Year and Nine Years AgoFull-Time Equivalent District Employees by Function/ProgramOperating StatisticsSchool Building InformationSchedule of Allowable Maintenance for School FacilitiesInsurance Schedule
143-144J-2J-3 145J-4 146J-5 147J-6 148-150
151-153154-157
J-7J-8J-9 158J-10 159J-11 160J-12 161J-13 162J-14 163-165J-15 166J-16 167J-17 168J-18 169J-19 170J-20 171
SINGLE AUDIT SECTION
K-1 Independent Auditor's Report on Internal Control Over FinancialReporting and on Compliance and Other Matters Based on anAudit of Basic Financial Statements Performed in Accordance withGovernment Auditing Standards 172-173
K-2 Independent Auditor’s Report on Compliance with RequirementsApplicable to Each Major Federal and State Financial AssistancePrograms and on Internal Control Over Compliance in Accordancewith the Uniform Guidance and New Jersey OMB Circular 15-08 174-175
K-3 Schedule of Expenditures of Federal Awards, Schedule A 176
Schedule of Expenditures of State Financial Assistance, Schedule BK-4 177
Notes to the Schedules of Expenditures of Federal Awards and StateFinancial Assistance
K-5178-179
K-6 Schedule of Findings and Questioned Costs 180-182
K-7 Schedule of Prior Year Audit Findings 183

INTRODUCTORY SECTION

FREEHOLD REGIONAL HIGH SCHOOL DISTRICTAdministration Building11 Pine Street Englishtown NJ 07726
(732 ) 792-7300 ext. 8519Fax: (732 ) 446-5192
February 1, 2022
Honorable President andMembers of the Board of Education
Freehold Regional High School DistrictCounty of MonmouthEnglishtown, New Jersey
Dear Board Members:
We are pleased to present to you the Annual Comprehensive Financial Report (ACFR) of the FreeholdRegional High School District (District) for the fiscal year ended June 30, 2021. Responsibility for both theaccuracy of the data and completeness and fairness of the presentation, including all disclosures, restswith the management of the Board of Education (Board). To the best of our knowledge and belief, the datapresented in this report is accurate in all material respects and is reported in a manner designed to presentfairly the basic financial statements and results of operations of the District. This report will provide thetaxpayers of the Freehold Regional High School District with comprehensive financial data in a formatenabling them to gain an understanding of the School District's financial affairs.
The Annual Comprehensive Financial Report is presented in four sections as follows:
• The Introductory Section contains this Letter of Transmittal, List of Principal Officials, and anOrganizational Chart of the School District;
The Financial Section begins with the Independent Auditors' Report and includes the Management'sDiscussion and Analysis, the Basic Financial Statements and Notes providing an overview of theSchool District's financial position and operating results, and other schedules providing detailedbudgetary information;
• The Statistical Section includes selected economic and demographic information, financial trendsand the fiscal revenue and debt capacities and other operating information of the School District;
• The Single Audit Section - The District is required to undergo an annual single audit in conformitywith the provisions of Title 2 U.S. Code of Federal Regulations Part 200, “Uniform AdministrativeRequirements, Cost Principles and Audit Requirements for Federal Awards (Uniform Guidance)" andthe New Jersey State Treasury Circular Letter 15-08 OMB, “Single Audit Policy for Recipients ofFederal Grants, State Grants, and State Aid.” Information related to this single audit, including theindependent auditors’ report on the internal control and compliance with applicable laws, regulations,contracts and grants, along with findings and questioned costs, if any, are included in the single auditsection of this report.
1

Reporting Entity
The Freehold Regional High School District is an independent reporting entity within the criteria adopted bythe Governmental Accounting Standards Board's (GASB) as established by Statement No. 39. All fundsof the District are included in this report. The Freehold Regional High School District Board of Educationand its six high schools constitute the District's reporting entity.
School District Organization
The Freehold Regional High School District, the largest limited-purpose regional high school district in thestate, is one of 56 school districts in Monmouth County. The School District provides education to studentsin grades nine through twelve.
An elected nine-member Board of Education (the "Board") serves as the policy maker for the School District.The Board adopts an annual budget and directly approves all expenditures which serve as the basis forcontrol over and authorization for all expenditures of School District tax money.
The Superintendent is the chief executive officer of the School District, responsible to the Board for totaleducational and support operations. The Assistant Superintendent for Business/Board Secretary is thechief financial officer of the School District, responsible to the Board for maintaining all financial records,issuing warrants in payment of liabilities incurred by the School District, acting as custodian of all SchoolDistrict funds, and investing idle funds as permitted by New Jersey law.
Geographically, the District is comprised of the Townships of Colts Neck, Freehold, Howell, Manalapan andMarlboro and the Boroughs of Englishtown, Farmingdale and Freehold. Established in 1953, the District'stotal area is 198 square miles. As of the October 2021 student count, there were 10,468 resident students.Of these resident students,10,323 students are enrolled in one of the Freehold Regional High SchoolDistrict’s six high schools. District enrollment had been steadily declining, however, there was a slightincrease in student enrollment as of the October 2021 count.
Freehold Regional High School DistrictCH Colts Neck TownshipCZI Englishtown Borough
Farmingdale BoroughI Freehold Borough
Freehold TownshipLJ Howell Township
I Manalapan Township JF 1 Marlboro Township V J-"-fW
Monmouth CountyNew Jersey
%\
i
2
Economic Condition and Outlook
Monmouth County is steeped in history from pre-revolutionary times to the present day. Rich in naturalresources, Monmouth's deep forests, rolling countryside and miles of beautiful sandy beaches offer aperfect backdrop for the vast variety of recreational, cultural and leisure opportunities in the area. TheCounty has horse country and thriving agricultural industry in the west, beaches and seaside resorts in theeast, and a booming business community throughout. The Freehold Regional High School District servesstudents from a wide range of socioeconomic backgrounds.
Monmouth County is located in the center of the state approximately 47 miles south of New York City and55 miles east of Philadelphia. Newark Liberty International Airport is just 40 minutes away. The public andprivate transportation systems include more than 2,600 miles of rails and roads, making the Countyaccessible to virtually all of New Jersey as well as nearby New York and Philadelphia.The District’s General Fund budget derives a material amount of its support in the form of Unrestricted StateAid. In 2018 the State of New Jersey passed legislation which reallocated this aid amongst the State'sschool districts based upon a revised funding formula. As a result, the Freehold Regional High SchoolDistrict will see it’s Unrestricted State Aid reduced by a cumulative almost $115 million over seven years.Federal funding in response to the pandemic helped offset a portion of the financial impact of S2, but thisone-time revenue will not solve the long-term permanent reductions under S2. The District’s administrationcontinues to formulate plans to deal with the ramifications of this loss of revenue.
Educational Program
The District supports students in pursuing their passions in fields of study and career interests throughoffering various opportunities within the educational program. Rising ninth graders who are accepted intoone of our prestigious magnet programs become full-time students at the program's home school for allfour years of their high school career.
Incoming 8,h grade students are invited to apply to any of the twelve competitive magnet programs locatedthroughout the district. Colts Neck is home to the Law & Public Service program and the Naval JuniorROTC program. Freehold High School has three programs: Culinary Arts & Hospitality Management,Computer Science, and Medical Sciences. At Freehold Township High School, the Animal & BotanicalSciences program and the Global Studies program are offered. Howell High School is home to the Fine& Performing Arts, as well as the Humanities program. Manalapan High School houses the Science &Engineering program and the Law Enforcement & Public Safety program. Finally, Marlboro High Schoolcontains the Business Administration magnet program. In addition, certain schools offer the InternationalBaccalaureate (IB) Diploma Programme - a comprehensive and rigorous pre-university course of studiesfor highly motivated 11th and 12th graders. The IB Diploma Programme is widely recognized in the UnitedStates and around the world.
Major Initiatives
Strategic Planning
Compass 2.0, the successor to the original Compass Strategic Plan, was developed and will continue toenhance the work commenced in the 2012-17 school years. Through the Compass 2.0 project, theFreehold Regional High School District mapped priorities and projects for the 2018-22 school years in thefour core areas that support the District’s mission: Whole Child; Equity and Opportunity; Student Growthand Learning; and, Community Partnerships. View our plan mission, detailed information on each of thefour core areas and implementation progress via The Compass Project link on the district's website.
3

Capital Planning
The current budget law limits opportunities to fund high dollar facility needs through the annual schoolbudget or local reserves. The district initially developed a capital referendum that addressed the followingfour broad areas of need: Modernized Learning Environment, Expanded Utilization of Athletic Facilities,Enhanced Safety and Security, and Infrastructure Maintenance. The initial referendum, which did notreceive voter support, was re-offered to the public in November of 2019 as three separate questions andwas again defeated. The District scaled down the projects in the referendum to only include the criticalinfrastructure needs of roofing and paving. This $14,460,000 question was approved by the public inNovember 2021. As the District has and will always have additional capital needs outside of this limited-scope referendum, management will continue to evaluate funding alternatives such as through budgetappropriation or drawing down on capital reserve funds.
Acknowledgements
We would like to express our appreciation to the members of the Freehold Regional High School DistrictBoard for their commitment to providing fiscal accountability to the citizens and taxpayers of the schooldistrict and thereby contributing their commitment to the development and maintenance of our financialoperation. The preparation of this report could not have been accomplished without the efficient anddedicated services of our financial and accounting staff.
Respectfully a
Charles SampsonSuperintendent of Schools
Sean Boyce, CPAAssistant Superintendent for Business
4

FREEHOLD REGIONAL HIGH SCHOOL BOARD OF EDUCATIONENGLISHTOWN, NEW JERSEY
ROSTER OF OFFICIALSJUNE 30, 2021
TermExpiresMembers of the Board of Education
Peter Bruno, President 2021
Marc Parisi, Vice President 2022
Diana Cappieilo 2022
Debra Fanelli 2023
Elizabeth Higley 2023
Kathie Lavin 2022
Michael Messinger 2023
Heshy Moses 2021
Adam Weiss 2021
Other Officials
Charles Sampson, Superintendent of Schools
Sean Boyce, CPA, Assistant Superintendent for Business Administration/Board Secretary
Mark Toscano, Esq., Solicitor
5

FREEHOLD REGIONAL HIGH SCHOOL BOARD OF EDUCATIONCONSULTANTS AND ADVISORS
JUNE 30, 2021
Audit FirmSuplee, Clooney & Company
308 East Broad StreetWestfield, NJ 07090
AttorneyMark Toscano
Comegno Law Group, P.C.521 Pleasant Valley Avenue
Moorestown, NJ 08057
Official DepositoryBank of America
One West Main StreetFreehold, New Jersey 07728
6

Free
hold
Reg
iona
l Hig
hSc
hool
Dis
trict
Org
aniz
atio
nal C
hart
Supe
rinte
nden
t
Assi
stan
tSup
erin
tend
ent
for B
usin
ess
Chief
Acad
emic
Offi
cer
* -4
Dire
ctor
ofCu
rricu
lum
&In
stru
ctio
nD
irect
orof
Stud
ent
Serv
ices
Dire
ctor
ofG
uida
nce
&O
pera
tions
Dire
ctor
ofPl
anni
ngRe
sear
ch&
Eval
uatio
nAd
min
istra
tor o
f Fin
ance
Dire
ctor
ofPe
rson
nel
Prin
cipal
s
Adm
inis
trativ
eSu
perv
isors
Dis
trict
Supe
rvis
orof
Inst
ruct
ion
Dire
ctor
ofBu
ildin
gs&
Gro
unds
Assis
tant
Prin
cipal
s&
Supe
rvis
ors
Tran
spor
tatio
nD
irect
orTe
chno
logy
Coor
dina
tor
Adm
inis
trativ
eSu
perv
isor

FINANCIAL SECTION

SUPLEE, CLOONEY & COMPANYCERTIFIED PUBLIC ACCOUNTANTS
308 East Broad Street , Westf ie ld , New Jersey 07090- 2122
Telephone 908-789-9300
E-mai lFax 908-789-8535
INDEPENDENT AUDITOR’S REPORT
Honorable President and Membersof the Board of Education
Freehold Regional High School DistrictCounty of MonmouthEnglishtown, New Jersey
Report on the Financial Statements
We have audited the accompanying financial statements of the governmental activities, thebusiness-type activities and each major fund of the Freehold Regional High School District, County ofMonmouth, New Jersey as of and for the year ended June 30, 2021, and the related notes to thefinancial statements, which collectively comprise the District’s basic financial statements as listed inthe table of contents.
Management’s Responsibility for the Financial Statements
Management is responsible for the preparation and fair presentation of these financialstatements in accordance with accounting principles generally accepted in the United States ofAmerica; this includes the design, implementation, and maintenance of internal control relevant to thepreparation and fair presentation of financial statements that are free from material misstatement,whether due to fraud or error.
Auditor’s Responsibility
Our responsibility is to express opinions on these financial statements based on our audit. Weconducted our audit in accordance with auditing standards generally accepted in the United States ofAmerica and the standards applicable to financial audits contained in Government Auditing Standardsissued by the Comptroller General of the United States, audit requirements prescribed by the Divisionof Finance, Department of Education, State of New Jersey, the audit requirements of Title 2 U.S.Code of Federal Regulations Part 200, Uniform Administrative Requirements, Cost Principles, andAudit Requirements for Federal Awards (Uniform Guidance) and State of New Jersey OMB Circular15-08 "Single Audit Policy for Recipients of Federal Grants, State Grants and State Aid.” Thosestandards and provisions require that we plan and perform the audit to obtain reasonable assuranceabout whether the financial statements are free from material misstatement.
8

SUPLEE, CLOONEY & COMPANYAn audit involves performing procedures to obtain audit evidence about the amounts and
disclosures in the financial statements. The procedures selected depend on the auditor’s judgment,including the assessment of the risks of material misstatement of the financial statements, whetherdue to fraud or error. In making those risk assessments, the auditor considers internal control relevantto the District's preparation and fair presentation of the financial statements in order to design auditprocedures that are appropriate in the circumstances, but not for the purpose of expressing an opinionon the effectiveness of the District’s internal control. Accordingly, we express no such opinion. Anaudit also includes evaluating the appropriateness of accounting policies used and thereasonableness of significant accounting estimates made by management, as well as evaluating theoverall presentation of the financial statements.
We believe the audit evidence we have obtained is sufficient and appropriate to provide abasis for our audit opinions.
Opinion
In our opinion, the financial statements referred to above present fairly, in all material respects,the respective financial position of the governmental activities, the business-type activities and eachmajor fund of the Freehold Regional High School District, County of Monmouth, New Jersey as ofJune 30, 2021, and the respective changes in financial position, and, where applicable, cash flowsthereof for the year then ended in accordance with accounting principles generally accepted in theUnited States of America.
Other Matters
Required Supplementary Information
Accounting principles generally accepted in the United States of America require that theManagement’s Discussion and Analysis and budgetary comparison information in Exhibit C-1 throughC-3 and the schedules related to accounting and reporting for pensions in Exhibit L-1 through L-4 andthe schedules related to accounting and reporting for postretirement benefits other than pensions(OPEB) in Exhibit M-t and M-2 be presented to supplement the basic financial statements. Suchinformation, although not a part of the basic financial statements, is required by the GovernmentalAccounting Standards Board who considers it to be an essential part of financial reporting for placingthe basic financial statements in an appropriate operational, economic, or historical context. We haveapplied certain limited procedures to the required supplementary information in accordance withauditing standards generally accepted in the United States of America, which consisted of inquiries ofmanagement about the methods of preparing the information and comparing the information forconsistency with management's responses to our inquiries, the basic financial statements, and otherknowledge we obtained during our audit of the basic financial statements. We do not express anopinion or provide any assurance on the information because the limited procedures do not provide uswith sufficient evidence to express an opinion or provide any assurance.
9

SUPLEE, CLOONEY & COMPANY
Other Information
Our audit was conducted for the purpose of forming opinions on the financial statements thatcollectively comprise the Freehold Regional High School District's basic financial statements. Theaccompanying supplementary information schedules such as the introductory section, combiningstatements and individual fund financial statements, the statistical section and the Schedules ofExpenditures of Federal Awards and State Financial Assistance, as listed in the table of contents, asrequired by the Uniform Guidance, New Jersey’s OMB Circular 15-08, "Single Audit Policy forRecipients of Federal Grants, State Grants and State Aid,” and the State of New Jersey, Departmentof Education, Division of Finance, are presented for purposes of additional analysis and are not arequired part of the basic financial statements.
The combining and individual fund financial statements and the Schedules of Expenditures ofFederal Awards and State Financial Assistance, as listed in the table of contents, as required by theUniform Guidance, New Jersey's OMB Circular 15-08, "Single Audit Policy for Recipients of FederalGrants, State Grants and State Aid,” and the State of New Jersey, Department of Education, Divisionof Finance is the responsibility of management and was derived from and relates directly to theunderlying accounting and other records used to prepare the basic financial statements,information has been subjected to the auditing procedures applied in the audit of the basic financialstatements and certain additional procedures, including comparing and reconciling such informationdirectly to the underlying accounting records used to prepare the basic financial statements or to thebasic financial statements themselves, and other additional procedures in accordance with auditingstandards generally accepted in the United States of America. In our opinion, the combining andindividual fund financial statements and the Schedules of Expenditures of Federal Awards and StateFinancial Assistance are fairly stated, in all material respects, in relation to the basic financialstatements as a whole.
Such
The other information, such as the introductory and statistical sections, has not been subjectedto the auditing procedures applied in the audit of the basic financial statements, and accordingly, wedo not express on opinion or provide any assurance on it.
Other Reporting Required by Government Auditing Standards
In accordance with Government Auditing Standards, we have also issued our report datedFebruary 1, 2022 on our consideration of the Freehold Regional High School District's internal controlover financial reporting and on our tests of its compliance with certain provisions of laws, regulations,contracts, and grant agreements and other matters. The purpose of that report is to describe thescope of our testing of internal control over financial reporting and compliance and the results of thattesting, and not to provide an opinion on internal control over financial reporting or on compliance.That report is an integral part of an audit performed in accordance with Government AuditingStandards in considering the Freehold Regional High School District’s internal control over financialreporting and compliance.
/ACERTIFIED PUBLIC ACCOUNTANTS
PUBLIC SCHOOL ACCOUNTANT NO. 948February 1, 2022
10

REQUIRED SUPPLEMENTARY INFORMATION- PART I
11

MANAGEMENT’S DISCUSSION AND ANALYSIS
12

FREEHOLD REGIONAL HIGH SCHOOL DISTRICTENGLISHTOWN, NJ
MANAGEMENT'S DISCUSSION AND ANALYSISFOR THE FISCAL YEAR ENDED JUNE 30, 2021
UNAUDITED
The discussion and analysis of Freehold Regional High School District's financial performance provides an overallreview of the School District's financial activities for the fiscal year ended June 30, 2021. The intent of thisdiscussion and analysis is to look at the School District's financial performance as a whole; readers should alsoreview the basic financial statements and notes to enhance their understanding of the School District's financialperformance. Certain comparative information between the current fiscal year (2020-2021) and the prior fiscalyear (2019-2020) is presented in the MD&A.
FINANCIAL HIGHLIGHTS
Key financial highlights for 2021 are as follows:
9- While COVID-19 continued to disrupt in-person education and operations, school and state-wide closuresand modified schedules resulted in modest savings to the District. Even though Federal funding receivedin response to the pandemic helped soften the financial blow of S2, this law remains the most significantinfluence on the short and long-term success of Freehold Regional High School District. The District'sadministration continues to modify programs and services to adapt to the loss of revenue expected fromthe S2 legislation passed by the State of New Jersey in 2018.Net Position of governmental activities increased $7,274,792, which represents a 10.4 percent increasefrom 2020. This is largely due to the impact of GASB 68 - FY21 saw a decrease in actuarily calculatednet pension liability. In addition, COVID-19 related disruptions and schedule modifications decreasedexpenditures in several areas including Transportation.
a- Net Position of business-type activities decreased $254,520, which represents a 65.1 percent decreasefrom 2020. Although students returned to school in October of 2020, the schedule was modified to a halfday for the entire year and lunch was not served. School returned to a full-time in-person schedule inSeptember of 2021 with meals being free to all students. It is expected that the return to operationscoupled with the enhanced reimbursement for free meals from the Federal Government will allow the foodsen/ice operation to be profitable again.
Property taxes continue to provide the majority of revenue for the Governmental Funds accounting for 62.0percent in 2021. During the ten years the tax levy cap has been in place, the District has forgone morethan $32 million in available property tax. However, the District is slated to lose a cumulative almost $115million in State Aid under the S2 legislation. In 2021, the third year of S2’s seven-year Equalization Aidphase out plan, there was a cumulative reduction of $10.8 million with an additional $6.7 million reductionslated for FY22.
K- Governmental Fund expenses (exclusive of the Capital Projects Fund and on-behalf contributions)decreased by $6,979,563 which represents a 3.6 percent decrease from 2020. This decrease was mainlydue to no debt service payments in FY 2021 as the last payment on bonds was made in FY 20, as well ascontinued savings resulting from COVID-19 school disruptions discussed above and throughout this report.
USING THIS ANNUAL COMPREHENSIVE FINANCIAL REPORT (ACFR)
This annual report consists of a series of financial statements and notes to those statements. These statementsare organized so the reader can understand Freehold Regional High School District as a financial whole, an entireoperating entity. The statements then proceed to provide an increasingly detailed look at specific financialactivities.
The focus of governmental accounting differs from that of business enterprises. In government, the financialstatement user is concerned with determining accountability for funds, evaluating operating results, and assessingthe level of service that can be provided by the government along with its ability to meet obligations as theybecome due. In comparison, the primary emphasis in the private sector from both an operational and reportingperspective is on the maximization of profits.
13

FREEHOLD REGIONAL HIGH SCHOOL DISTRICTENGLISHTOWN, NJ
MANAGEMENT S DISCUSSION AND ANALYSISFOR THE FISCAL YEAR ENDED JUNE 30, 2021
UNAUDITED (CONTINUED)
Reporting the School District as a Whole
Statement of Net Position and the Statement of Activities
The Statement of Net Position and Statement of Activities provide information about the activities of a wholeschool district, presenting both an aggregate view of a school district’s finances and a longer-term view of thosefinances. Fund financial statements provide the next level of detail. For governmental funds, these statementstell how services were financed in the short-term as well as what remains for future spending.
This document looks at all financial transactions and asks the question, "How did we do financially during 2020?”The Statement of Net Position and the Statement of Activities attempt to answer this question. These statementsinclude all assets and liabilities using the accrual basis of accounting similar to the accounting used by mostprivate-sector businesses. This basis of accounting takes into account all of the current year’s revenues andexpenses regardless of when cash is received or paid.These two statements report the District's Net Position and changes in those assets. This change in Net Positionis important because it tells the reader that, for the District as a whole, the financial position of the District hasimproved or diminished. The causes of this change may be the result of many factors. Non-financial factorsinclude the School District's property tax base, current laws in New Jersey restricting revenue growth, facilitycondition, required educational programs, and other factors.In the Statement of Net Position and the Statement of Activities, the School District is divided into two distinctkinds of activities:
• Governmental activities - All of the School District's programs and services are reported here includinginstruction, support services, administration, operating maintenance of plant services, studenttransportation, and extracurricular activities.
• Business-Type Activities - This service is provided on a charge-for-goods-or-services basis to recover allthe expenses of the goods or services provided. The Food Service and Extra Curricular funds are reportedas a business activity.
Reporting the School District's Most Significant Funds
Fund Financial Statements
Fund financial reports provide detailed information about the School District's funds. The School District usesmany funds to account for a multitude of financial transactions. The School District's governmental funds are theGeneral Fund, Special Revenue Fund, Capital Projects Fund and Debt Service Fund.
Governmental FundsThe School District's activities are reported in governmental funds, which focus on how money flows intoand out of those funds and the balances left at year-end available for spending in the future years. Thesefunds are reported using an accounting method called modified accrualaccounting, which measures cashand all other financial assets that can readily be converted to cash. The governmental fund statementsprovide a detailed short-term view of the School District's general government operations and the basicservices it provides. Governmental fund information helps the reader determine whether there are moreor fewer financial resources that can be spent in the near future to finance educational programs. Therelationship (or differences) between governmental activities (reported in the Statement of Net Positionand the Statement of Activities) and governmental funds is reconciled in the financial statements.Enterprise FundThe enterprise fund uses the same basis of accounting as business-type activities; therefore, thesestatements are essentially the same as in private industry.
14

FREEHOLD REGIONAL HIGH SCHOOL DISTRICTENGLISHTOWN, NJ
MANAGEMENT'S DISCUSSION AND ANALYSISFOR THE FISCAL YEAR ENDED JUNE 30, 2021
UNAUDITED (CONTINUED)
Notes to the Basic Financial Statements
The notes to the basic financial statements provide additional information that is essential to a full understandingof the data provided in the District-wide and fund financial statements.
THE SCHOOL DISTRICT AS A WHOLE
Recall that the Statement of Net Position provides the perspective of the School District as a whole. Net Positionmay serve over time as a useful indicator of a government's financial position.The District's financial position is the product of several financial transactions including the net results of activities,the acquisition and payment of debt, the acquisition and disposal of capital assets, and the depreciation of capitalassets.
Table 1 provides a summary of the School District's Net Position for 2021 and 2020.
TABLE1Net Position
2020-21 2019-20Governmental
ActivitiesBusinessActivities
GovernmentalActivities
BusinessActivitiesTotal Total
ASSETSCurrent & Other AssetsCapital Assets
Total Assets
$59,493,400104,754,167
$346,210 $59,839,610342,992 105,097,159
$47,386,282109,378,955
$680,306 $48,066,588384,411 109,763,366
164,247,567 689,202 164,936,769 156,765,237 1,064,717 157,829,954
DEFERRED OUTFLOWS OF RESOURCES:Loss on Refunding of Long Term DebtPension Related
Total Deferred Outflow of Resources 6,579,1456,579,145 6,579,145 8,744,318 8,744,318
6,579,145 8,744,318 8,744,318
LIABILITIESLong-Term LiabilitiesOther Liabilities
Total Liabilities
55,445,89319,168,480
265,894 55,711,787287,050 19,455,530
63,236,30114,362,563
393,100 63,629,401280,839 14,643,402
74,614,373 552,944 75,167,317 77,598,864 673,939 78,272,803
DEFERRED INFLOWS OF RESOURCES:Pension Related
Total Deferred Inflow of Resources19,096,486 19,096,486 18,069,630 18,069,63019,096,486 19,096,486 18,069,630 18,069,630
NET POSITIONNet Investment in Capital AssetsRestrictedUnrestricted (Deficit)
Pension RelatedOther
90,306,87140,677,885
96,991 90,403,86240,677,885
93,886,10536,663,498
61,045 93,947,15036,663,498
(54,674,273)805,370
(54,674,273)844,637
(56,896,290)(3,812,252)
(56,896,290)329,733 (3,482,519)39,267
Total Net Fbsition $77,115,853 $136,258 $77,252,111 $69,841,061 $390,778 $70,231,839
15

FREEHOLD REGIONAL HIGH SCHOOL DISTRICTENGLISHTOWN, NJ
MANAGEMENT S DISCUSSION AND ANALYSISFOR THE FISCAL YEAR ENDED JUNE 30, 2021
UNAUDITED (CONTINUED)
Table 2 details the changes in Net Position for fiscal year 2021 and 2020.TABLE 2
CHANGES IN NET POSITION
2020-21 2019-20Governmental
ActivitiesBusinessActivities
GovernmentalActivities
BusinessActivitiesTotal Total
Revenues:Program Revenues:Charges for ServicesOperating Grants & Contributions
General RevenuesProperty TaxesGrants (includes State Aid)and Entitlements
Other Revenues
$1,584,92061,523,780
$128,257130,061
$1,713,17761,653,841
$448,194 $1,549,21342,287,847 484,773
$1,997,40742,772,620
140,379,308 140,379,308 141,762,932 141,762,932
51.152,887686,794
45.584,82276,611
45,584,82276,611
51,152,887686,794
$249,149,441 $258,318 $249,407,759 $236,338,654 $2,033,986 $238,372,640
Expenses:InstructionTuition, Student and Instruction
Related ServicesGeneral Administration, SchoolAdministration, Central ServicesInformation Technology & Maintenance
TransportationInterest on Long-TermDebtBusiness-TypeOther
Total Expenses
141,274.593 141.274,593 128,989,730 128,989,730
46,890,611 46,890,611 42,787,997 42,787,997
34,040,98913,981,765
8,101
34,040,98913,981,765
8,101512,838
5,678,590
33,820,35015,612,449
192,408
33,820,35015,612,449
192,4082,111,0895,978,678
512,838 2,111,0895,678,590 5,978,678
$241,874,649 $512,838 $242,387,487 $227,381,612 $2,111,089 $229,492,701
($254,520)390,778
Change in Net PositionNet Position July 1 (as restated)
$7,274,79269,841,061
$7,020,27270,231,839
$8,957,04260,884,019
($77,103)467,881
$8,879,93961,351,900
Net Position June 30, $77,115,853 $136,258 $77,252,111 $69,841,061 $390,778 $70,231,839
The presentation of net position in the District's June 30, 2021 financial statements includes revenues from federaland state grant programs as well as the state’s on-behalf contributions to the Teachers’ Pension and Annuity Fund(TPAF) and actuarially calculated expense for the Public Employees Retirement System (PERS). Correspondingamounts have been appropriately assigned throughout governmental expenses.
Variances in both the revenues and expenditures are significantly affected by the actuarially calculated revenueand expense for TPAF and PERS Pension under GASB 68 and Postemployment Benefits under GASB 75.
16

FREEHOLD REGIONAL HIGH SCHOOL DISRICTENGLISHTOWN, NJ
MANAGEMENTS DISCUSSION AND ANALYSISFOR THE FISCAL YEAR ENDED JUNE 30, 2021
UNAUDITED (CONTINUED)
Governmental Activities
The Statement of Activities shows the cost of program services and the charges for services and grants offsettingthose services. Table 3 shows the total cost of services and the net cost of services for the District. The net costshows the financial burden that was placed on the District’s taxpayers by each of these functions.
TABLE 3NET COST OFSERVICES
Total Cost ofServices
2020$128,989,730
Total Cost ofServices
2021$141,274,593
Net Cost ofServices
2021$94,276,159
Net Cost ofServices
2020$95,433,054Instruction
Tuition, Student and InstructionRelated Services
General Administration, SchoolAdministration, Central ServicesInformation Technology & Maintenance
TransportationInterest on Long-Term DebtBusiness-TypeOther
Total Expenses
$46,890,611 42,787,997 35,687,236 36,482,218
$34,040,989$13,981,765
$8,101$512,838
$5,678,590
33,820,35015,612,449
192,4082,111,0895,978,678
29,386,71013,729,153
8,101254,520
5,678,590
31,019,22515,606,443
125,95377,103
5,978,678$242,387,487 $229,492,701 $179,020,469 $184,722,674
As noted above, the presentation of position in the District’s June 30, 2021 financial statements includes theallocation of expenses funded by federal and state grant programs as well as the state’s on-behalf contributionsto the Teachers’ Pension and Annuity Fund as well as the allocation of Postemployment Benefits under GASB75. In FY21, revenue and expense recognized for Postemployment Benefits increased by over $13 million andgreatly skews the cost of services presented above. This increase was due to a decrease in the discount rate aswell as major changes in assumptions used in the actuarial calculations.
> Instruction expenses include activities directly dealing with the teaching of pupils and the interactionbetween teacher and student, including extracurricular activities.
> Tuition, student and instruction related services include the activities involved with assisting staff with thecontent and process of teaching to students, including curriculum and staff development.
> General administration, school administration, central services, information technology and maintenanceinclude expenses associated with administrative and financial supervision of the District, as well as costsassociated with the upkeep of school grounds, buildings, and equipment in an effective working condition.
> Pupil transportation includes activities involved with the conveyance of students to and from school, aswell as to and from school activities, as provided by State law.
> Interest on long-term debt involves the transactions associated with the payment of interest and otherrelated charges to debt of the School District.
> Business-type expenses include all expenses associated with the food service and extracurricular funds.
> "Other" includes depreciation on capital assets that is not allocated to a specific function mentioned above.
17

FREEHOLD REGIONAL HIGH SCHOOL DISTRICTENGLISHTOWN, NJ
MANAGEMENT'S DISCUSSION AND ANALYSISFOR THE FISCAL YEAR ENDED JUNE 30, 2021
UNAUDITED (CONTINUED)
Business-Type Activities
Revenues for the District’s business-type activities (food service and extra-curricular programs) were comprisedof charges for services and federal and state reimbursements. The food service operation continued to experiencemajor losses as lunch was not served for the entire 2021 school year. The District followed a modified reducedday schedule due to COVID-19. Meals were made available to free and reduced lunch students either by district-run delivery or via parent pick-up. The only revenue received was in the form of reimbursement for free andreduced meals from the State and Federal government and from meals sold to employees. Also, a one-timepayment in the amount of $51k was received from the United States Department of Agriculture to compensate forlost revenues due to the pandemic; this helped resuscitate the finances of the Food Service Fund. Students didreturn to a full time in-person schedule in September of 2021 with the lunch program resuming, however theFederal government initiated a program where meals were free to all students. The Federal government willprovide reimbursement for these meals and an enhanced reimbursement is expected starting in January 2022. Itis anticipated that the Food Service program will rebound by the end of 2022
THE SCHOOL DISTRICT’S FUNDS
All governmental funds are accounted for using the modified accrual basis of accounting. Totals (excluding CapitalProjects) for revenues amounted to $226,333,546 and expenditures were $218,792,777. The net change in fundbalance was an increase of $8,569,032. As demonstrated by the various statements and schedules included inthe financial section of this report, the District continues to meet its responsibility for sound financial management.Governmental Funds Revenues and Expenditures (exclusive of Capital Projects) are summarized in Table 4 andChart 1 below.
Table 4Governmental Funds Revenues and Expenditures
(Exclusive of Capital Projects)Increas ©/(Decrease)
from 2Q20($1,383,624)
$766,284($206,937)1,462,531
PercentageChangeREVENUES:
Property TaxesCharges for ServicesState SourcesFederal Sources
Percentage62.02
Amount$140,379,308
$2,062,95679,301,235
4,590,047
(0.98)59.10(0.26)46.76
0.9135.042.03
$226,333,546 $638,254Total 100.00 0.28
lncrease/(Decrease)from 2020
$164,898726,527148,343161,292
(950,779)(2,068,410)5,507,387
366,900(5,465,250)
PercentageChangeEXPENDITURES:
Instruction & TuitionStudent Support ServicesAdministrationCental Services & TechnologyMaintenance & OperationsTransportationEmployee BenefitsCapital OutlayDebt Service
Amount Percentage$93,463,528
18,881,7718,796,2983,798,679
13,314,93114,889,18063,411,394
2,236,996
42.72 0.188.63 4.004.02 1.72
4.431.746.09 (6.66)
(12.20)6.819.5128.98
1.02 19.62(100.00)
$218,792,777Total ($1,409,092)100.00 (0.64)
18

FREEHOLD REGIONAL HIGH SCHOOL DISTRICTENGLISHTOWN, NJ
MANAGEMENT'S DISCUSSION AND ANALYSISFOR THE FISCAL YEAR ENDED JUNE 30, 2021
UNAUDITED (CONTINUED)
Chart 1Governmental Funds Revenues and Expenditures
(Exclusive of Capital Projects)
Sources of Revenues FY21
3S.M4
62.0%
« Charges for ServicesFederal Sources
"Property Taxes
State Sources
Expenditures FY21i.o%
__ 42.7%
6,8%
6.1%1.7% 4.0% • 8.6%
Student Support ServicesCental Services & Technology
•TransportationCapital Outlay
* Instruction & TuitionAdministration
•Maintenance & OperationsEmployee BenefitsDebt Service
19

FREEHOLD REGIONAL HIGH SCHOOL DISTRICTENGLISHTOWN, NJ
MANAGEMENT'S DISCUSSION AND ANALYSISFOR THE FISCAL YEAR ENDED JUNE 30, 2021
UNAUDITED (CONTINUED)
Highlights include the following:
• The decrease in Property Taxes was due to the District no longer receiving taxes for debt service as theserial bonds were paid in full in FY2020. The decrease in state revenue was due to the reduction inEqualization Aid legislated by S2, offset by an increase in on-behalf contributions. The District will lose anadditional $6.7 million in FY22 and a cumulative loss of approximately $115 million through FY25. Theincrease in Charges for Services results from adopting GASB 84 as now Student Activity and Scholarshiprevenues are included here. The increase in Federal sources was a result of coronavirus relief funding.
• Expenses for instruction, tuition and student support services as a group slightly increased from FY20.There was a budgeted reduction of professional positions due to declining enrollment which resulted inan overall decrease in instruction. This was offset by an increase in tuition as tuition during FY20 waslower due to COVID-19 closures.
• It appears that student support services increased, however, the increase is due to GASB 84 whichresulted in student activities and scholarships now being included in this figure. Absent the effects ofGASB 84, student support services decreased mainly due to lower costs for paraprofessionals as theschedule started out virtual, went to a hybrid cohort-based model and only for the fourth marking perioddid students return every day. The entire year was on a reduced day schedule.
• The Operations and Maintenance of Plant Services section of the budget decreased primarily due to asignificantly lower ESIP payment in FY21 as compared to FY20.
• Transportation costs also decreased from FY20 due to the COVID-19 closures and modified schedules.
• Excluding on-behalf payments, expenses for employee benefits were essentially flat year over year.Normal increases in health care costs were offset by health and social security savings from the reductionsin staff. COVID-19 also played a role in the containment of health care costs, as employees were lesslikely to seek routine medical care and have elective procedures, however that number cannot bequantified.
• Capital Outlay represents mercury remediation and subsequent gym floor replacements at five of the sixschools as well as the completion Marlboro High School boiler project and HVAC improvements in theManalapan High School Auditorium.
• Debt Service decreased as the last payment on serial bonds was made in March of 2020.
Capital Projects
The current budget law limits opportunities to fund high dollar facility needs through the annual school budget orlocal reserves. The district initially developed a capital referendum that addressed the following four broad areasof need: Modernized Learning Environment, Expanded Utilization of Athletic Facilities, Enhanced Safety andSecurity, and Infrastructure Maintenance. The initial referendum, which did not receive voter support, was re-offered to the public in November of 2019 as three separate questions and was again defeated. The District scaleddown the projects in the referendum to only include the critical infrastructure needs of roofing and paving. This$14,460,000 question was approved by the public in November 2021. As the District has and will always haveadditional capital needs outside of this limited-scope referendum, management will continue to evaluate fundingalternatives such as through budget appropriation or drawing down on capital reserve funds.
20

FREEHOLD REGIONAL HIGH SCHOOL DISTRICTENGLISHTOWN, NJ
MANAGEMENT S DISCUSSION AND ANALYSISFOR THE FISCAL YEAR ENDED JUNE 30, 2021
UNAUDITED (CONTINUED)
CAPITAL ASSETS
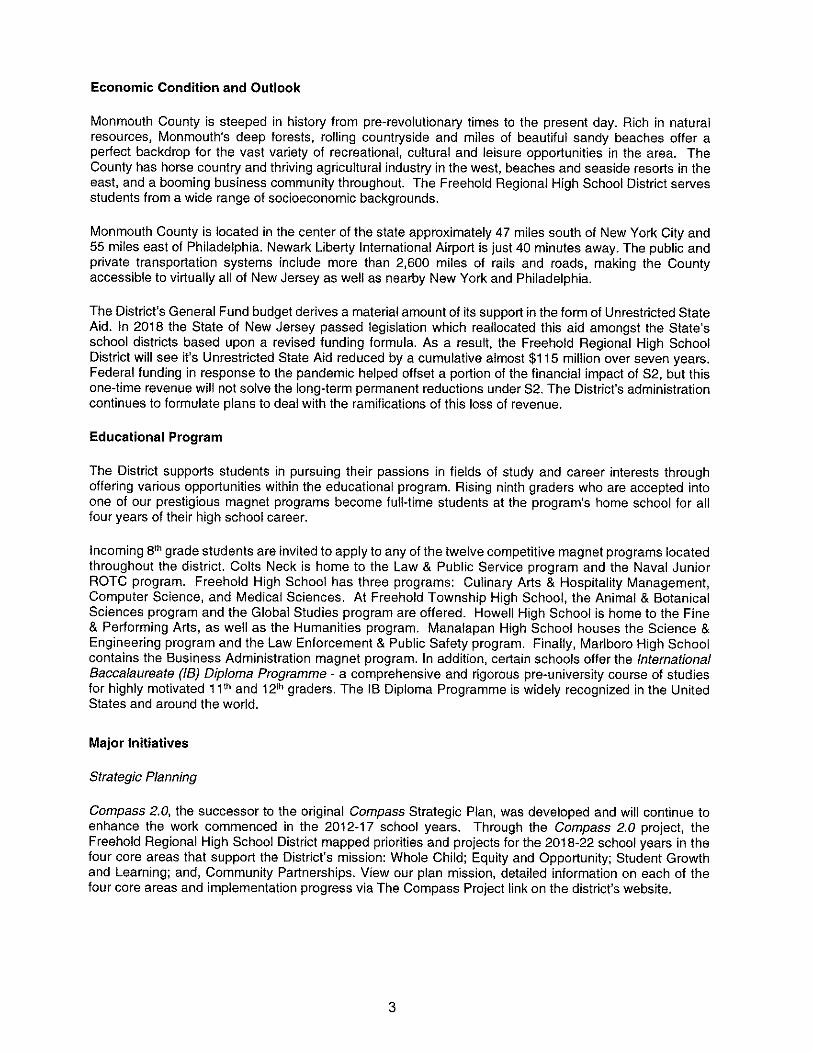
The District focused its limited resources on mercury remediation and gym floor replacements at five of its six highschools. Work on the door security project, partially funded by the Securing Our Children’s Future Bond Act(Alyssa’s Law), School Security Grant, commenced in FY21. Construction in Progress decreased as the work onthe Manalapan Auditorium and for the Marlboro Boiler were completed. The District made equipment purchasesincluding various technology infrastructure/equipment upgrades, school buses, and buildings and groundsequipment. Table 5 shows the FY21 Capital Asset activity of the District.
Table 5Capital Assets for the Fiscal Year Ended June 30, 2021
BeginningBalance
Transfers orAdditions Retirements
EndingBalance
Governmental activities:Capital assets not being depreciated:
LandConstruction In Progress
Total capital assets not being depreciatedCapital assets being depreciated:
Site improvementsBuilding and improvementsEquipment
Total capital assets being depreciated
$ 446,4881,687,734 $ 289,264 $ (1,923,686)
$ 446,48853,312
2,134,222 289,264 (1,923,686) 499,800
17,892,228230,787,66623,846,882
26,4051,626,589
419,080
17,918,633234,337,94123,270,700
1,923,686(995,262)
272,526,776 2,072,074 928,424 275,527,274
Total Gross Assets (Memo Only) 274,660,998 2,361,338 (995,262) 276,027,074
Less accumulated depreciation for:Site improvementsBuilding and improvementsEquipment
Total accumulated depreciationTotal capital assets being depreciated, net’
Government activities capita! assets, net
(9,834,861) (862,489)(136,508,234) (4,768,311)(18,938,948) (1,355,326)
(10,697,350)(141,276,545)(19,299,012)995,262
(165,282,043) (6,986,126) 995,262 (171,272,907)(4,914,052)107,244,733 1,923,686 104,254,367
$ 109,378,955 $(4,624,788) $ $ 104,754,167
Business-type activities:Capital assets being depreciated:
EquipmentLess accumulated depreciation
Enterprise fund capital assets, net
$ 1,050,693(666,282) $ (46,062)
$ 1,055,3364,643(712,344)
s 384,411 $ (41,419) $ $ 342,992
21

FREEHOLD REGIONAL HIGH SCHOOL DISTRICTENGLISHTOWN, NJ
MANAGEMENT S DISCUSSION AND ANALYSISFOR THE FISCAL YEAR ENDED JUNE 30, 2021
UNAUDITED (CONCLUDED)
DEBT ADMINISTRATION
Among the district's outstanding liabilities at June 30, 2021, $3,294,742 is for compensated absences, and$15,588,804 is for obligations under capital leases.
CONTACTING THE SCHOOL DISTRICT
This financial report is designed to provide the District's citizens, taxpayers, bond holders, and creditors with ageneral overview of the District's finances and to show the District's accountability for the resources it receives. Ifyou have questions about this report or need additional information, contact the Assistant Superintendent forBusiness Administration at Freehold Regional Board of Education, 11 Pine Street, Englishtown, NJ 07726.
Please visit our website at www.frhsd.com
22

BASIC FINANCIAL STATEMENTS
The basic financial statements provide a financial overview ofthe District's operations. These financial statements present the financial position and
operating results of all funds as of June 30, 2021
23

DISTRICT-WIDE FINANCIAL STATEMENTS
The statement of net position and the statement of activities display information about the District. These statements include thefinancial activities of the overall district, except for fiduciary activities. Eliminations have been made to minimize the double counting
of internal activities. These statements distinguish between the governmental and business-type activities of the District.
24

EXHIBIT "A-1”
FREEHOLD REGIONAL HIGH SCHOOL DISTRICTSTATEMENT OF NET POSITION
JUNE 30. 2021
BUSINESS-TYPEACTIVITIES
GOVERNMENTALACTIVITIES TOTAL
ASSETS:
51,989 $253,648
40,573
46,697,7595.420,821
40,573
46.645.770 $5,167,173
$Cash and cash equivalentsReceivables, netInventoryRestricted assets:Restricted cash and cash equivalents
Capital assets:Land and construction in progressOther capital assets, net of depreciationTotal Assets
7,680,4577,680,457
499,800104,597,359
499,800104,254,367 342,992164.247,567 689,202 164,936,769
DEFERRED OUTFLOW OF RESOURCES:Pension related 6,579,1456,579,145
LIABILITIES:
4,802,4083,635,215
134,34647,56237.591
176,181121,968
7,820,000
38,446 4,840,8543,635,215
161,29847,56237,591
270,627121,968
7,820,000
Accounts payablePayroll deductions payableInterfund payableState unemployment insurance payablePayable to state governmentUnearned revenueOther current liabilitiesAccrued liability for insurance claimsNoncurrent liabilities:Due within one year:
Capital leases payableDue beyond one year:
Compensated absences payableCapital leases payableNet pension liabilityTotal liabilities
26,952
94,446
2,520,415127,2062,393,209
3,294,74213,068,38839,348,657
3,294,74212,802,49439,348,657
265,894
75,167,317552,94474,614,373
DEFERRED INFLOW OF RESOURCES:Pension related 19,096,48619,096,486
NET POSITION:Net investment in capital assetsRestricted for:Capital projects fundOther purposes
Unrestricted (deficit)
90,403,86296,99190,306,871
6,021,95134,655,934
(53,829,636)
6,021,95134,655,934
(53,868,903) 39,267
77,252,111136,258 $77,115,853 $$Total net position
The accompanying Notes to the Financial Statements are an integral part of this statement.
25

EXHI
BIT
" A-2"
FREE
HOLD
REG
IONA
LHI
GH
SCHO
OL
DIST
RICT
STAT
EMEN
TOF
ACTI
VITI
ESJU
NE30
.202
1
Indi
rect
Cost
Allo
catio
n
Pro
gram
sR
even
ues
Net
(Exp
ense
) Rev
enue
and
Cha
nges
inN
etPo
sitio
nCh
arge
sfo
rSe
rvice
sO
pera
ting
Gran
tsan
dCo
ntrib
utio
nsG
over
nmen
tal
Busin
ess -
type
Activ
ities
Func
tions
/Pro
qram
sE
xpen
ses
Activ
ities
Tota
l
Gov
ernm
enta
lAct
iviti
es:
Inst
ruct
ion:
Reg
ular
Spec
ial
Oth
erin
stru
ctio
nSu
ppor
t ser
vice
s :T u
ition
Stud
ent&
inst
ruct
ion
rela
ted
serv
ices
Gen
eral
adm
inist
rativ
ese
rvice
sSc
hool
adm
inist
rativ
ese
rvice
sC
entra
lser
vice
Adm
inin
form
atio
nte
chno
logy
Plan
tope
ratio
nsan
dm
aint
enan
cePu
pil t
rans
porta
tion
Unal
loca
ted
bene
fits
^Inte
rest
onlo
ng-te
rmde
btUn
allo
cate
dde
prec
iatio
nTo
talg
over
nmen
tal a
ctivi
ties
$69
.451
, 098
$
18.1
96, 0
866 ,
962.
862
35, 0
18,1
64$
8.38
8.843
3.25
7,54
0
221,
324
$34
, 032
, 788
$9 ,
690.
389
3.05
3 .933
(70 ,
215,
150 )
$( 1
6 ,89
4.54
0)( 7
.166
,469
)
$(7
0 ,21
5,15
0)( 1
6,89
4,54
0)( 7
.166
, 469
)
15, 9
45, 5
9122
.093
, 236
1.78
8,85
68 ,
576.
286
1 ,43
5,10
02.
114,1
7812
,638
, 038
12, 0
82.2
0663
, 596.
885
8,10
16.
986,
126
( 15,
945,
591)
( 19.
741.6
45)
(1,9
09, 9
29)
( 9, 0
28, 7
11)
( 1,7
79, 2
58)
( 2.5
92,3
38)
( 14,
076,
474)
( 13 ,
729 ,
153)
( 15,
945,
591 )
( 19.
741,
645)
( 1.9
09, 9
29)
( 9, 0
28, 7
11)
(1, 7
79.2
58)
( 2.5
92.338
)( 1
4 ,07
6.47
4)( 1
3,72
9,15
3 )
8 ,85
1,78
414
7,83
64,
559,
702
432 ,
279
530 ,
380
1,81
8.33
41 ,
899,
559
( 63 ,
596.
885)
1,36
3,59
69,
839 ,
779
26, 7
634 ,
107 ,
277
88, 1
2152
, 220
379,
898
252,
612
(8, 1
01)
(5, 6
78, 5
90)
(8, 1
01)
( 5, 6
78, 5
90)
( 1, 3
07,5
36)
241,
874,
649
1,58
4,92
061
, 523
, 780
( 178
, 765
, 949
)( 1
78, 7
65,9
49)
Busi
ness
-type
activ
ities
Food
serv
ice
Extra
-curri
cula
rTo
talb
usin
ess -t
ype
activ
ities
402,
686
110,
152
18, 1
0511
0.15
213
0.06
1( 2
54.5
20)
( 254
, 520
)
512,
838
128 ,
257
130,
061
( 254
, 520
)( 2
54, 5
20)
1 ,71
3,17
7$
Tota
l prim
ary
gove
rnm
ent
$24
2,38
7,48
7$
61,6
53, 8
41S
( 178
, 765
, 949
)$
( 254
, 520
)£
( 179
, 020
, 469
)
Gen
eral
Reve
nues
:Ta
xes:
Prop
erty
taxe
s,le
vied
for g
ener
alpu
rpos
es,ne
tFe
dera
land
stat
eai
dno
tres
trict
edFe
dera
land
stat
eai
dre
stric
ted
Misc
ellan
eous
inco
me
Tota
l gen
eral
reve
nues
$14
0,37
9 ,30
8$
45, 4
40, 2
5814
4 ,56
476
,611
$14
0 ,37
9.30
845
, 440
.258
144,
564
76, 6
1118
6,04
0,74
118
6 ,04
0,74
1
Chan
gein
netp
ositi
on7,
274.
792
(254
, 520
)7,
020 ,
272
NetP
ositi
on-b
egin
ning
( as
rest
ated
)Ne
tPos
ition
endi
ng69
,841
, 061
390 ,
778
70, 2
31, 8
39$
77, 1
15, 8
53$
136,
258
$77
, 252
, 111
The
acco
mpa
nyin
gN
otes
toth
eFi
nanc
ial S
tate
men
tsar
ean
inte
gral
part
ofth
isst
atem
ent.

MAJOR FUND FINANCIAL STATEMENTS
The Individual Fund financial statements and schedules present more detailed information for the individualfund in a format that segregates information by fund type.
27

EXHIBIT ”B-rSHEET #1
FREEHOLD REGIONAL HIGH SCHOOL DISTRICTBALANCE SHEET
GOVERNMENTAL FUNDSJUNE 3Q. 2021
TOTALGOVERNMENTAL
FUNDS
SPECIALREVENUE
FUND
CAPITALPROJECTS
FUNDGENERAL
FUND
ASSETS:
54,195,867130,360112,720
3,255,1315,054,453
52,274,419 $130,360105,756
3,251,5254,390,611
1,724,760 $ 196,688 $Cash and cash equivalentsCash with fiscal agentsOther receivablesDue from other fundsReceivables from other governments
$
6,9643,606
97,076566,766
62,748,5312,298,490 297,370Total assets 60,152,671
LIABILITIES AND FUND BALANCES:
Liabilities:Accounts payablePayroll Deductions PayableState Unemployment Insurance PayablePayable to state governmentInterfund payables
Unearned revenueOther current liabilitiesAccrued liability for insurance claims
197,079 1,994,1333,635,215
47,56237,591
3,389,477176,181121,968
7,820,000
1,793,4483,635,215
47,562
3,606
37,591162,879
176,1813,226,598
121,9687,820,000
17,222,1273,606573,730Total liabilities 16,644,791
Fund balances:Restricted:Capital Reserve AccountEmergency Reserve AccountMaintenance Reserve AccountExcess Surplus designated for
subsequent years expendituresExcess surplusCapital Projects fundState Unemploment InsuranceStudent ActivitiesScholarships
Assigned:Designated for subsequent years expenditures
EncumbrancesSEMI/FFCRA - designated for
subsequent year expenditureUnassigned
6,021,9518,302
1,519,844
6,021,9518,302
1,519,844
14,505,87013,303,766
293,7641,072,680
917,505807,255
14,505,87013,303,766
293,7641,072,680
917,505807,255
1,982,205526,439
1,982,205526,439
12,0684,554,755
12,0684,554,755
45,526,404293,7641,724,76043,507,880Total fund balances
62,748,531297,370 $2,298,490 $60,152,671 $$Total liabilities and fund balances
The accompanying Notes to the Financial Statements are an integral part of this statement.
28

EXHIBIT "B-TSHEET #2
FREEHOLD REGIONAL HIGH SCHOOL DISTRICTBALANCE SHEET
GOVERNMENTAL FUNDSJUNE 30. 2021
$ 45.526,404Total Fund Balances (Brought Forward)
Amounts Reported for Governmental Activities in the Statementof Net Position (A-1) are different because:
Capital assets used in governmental activities are not financialresources and therefore are not reported in the funds.Cost of AssetsAccumulated Depreciation
$ 276,027.074(171,272.907)
104.754,167
Long term liabilities, including bonds payable, and other relatedamounts that are not due and payable in the current periodand therefore are not reported as liabilities in the funds.Net Pension ExpenseCompensated AbsencesCapital Lease Payable
(39,348,657)(3,294,742)
(15,195,704)(57,839,103)
Deferred Outflows and Inflows of resources are applicableto future periods and therefore are not reported in the funds.
Deferred Outflows:Pension relatedEmployer Contribution related to pensions
$ 3,770,8712,808,275
6.579,1466,579,146
Deferred Inflows:Pension related (19,096,486)
Certain liabilities are not due and payable in the current periodand therefore, are not reported in the governmental funds.
Accounts Payable - Pension Related (2,808,275)(2,808,275)
$ 77,115,853Net Position of Governmental Activities
The accompanying Notes to the Financial Statements are an integral part of this statement
29

EXHIBIT "B-r
FREEHOLD REGIONAL HIGH SCHOOL DISTRICTSTATEMENT OF REVENUES. EXPENDITURES AND CHANGES IN FUND BALANCE
GOVERNMENTAL FUNDSFOR THE FISCAL YEAR ENDED JUNE 30. 2021
TOTALGOVERNMENTAL
FUNDS
SPECIALREVENUE
FUND
CAPITALPROJECTS
FUNDGENERAL
FUNDREVENUES:
Local sources:Local Tax LevyTuition From IndividualsTuition -LEAs Within StateTuition - Other Governmental Sources Within StateTuition - Other LEAs Outside the StateTransportation Fees Other LEA'S
Unrestricted Miscellaneous RevenueInterest Earned on Emergency ReserveInterest Earned on Maintenance ReserveInterest Earned on Capital Reserve FundsOther Restricted Miscellaneous Revenue
140,379,3085,0273,712
75,89061,15975,53673,555
140,379,308 $5,0273,712
75,89061,15975,53673,555
$$ $
111111653653
2,2921,765,021
2,292200,469 1,564,552
142,442,2641,564,552140,877,712Total - local sources
79,398,3114,590,047
97,076State sourcesFederal sources
79,120,252127,967
180,9834,462,080
226.430,6226,207,615 97,076220,125,931Total revenues
EXPENDITURES:Current expense:
Regular instructionSpecial instructionOther instruction
Support services:TuitionStudent & instruction related servicesGeneral administrative servicesSchool administrative servicesCentral serviceAdministrative information technology servicesPlant operations and maintenancePupil transportation
Unallocated benefitsCapital outlay
56,630,88115,125,452
5,761.604
1,438,2921,883,259
55,192,58913,242,193
5,761,604
15,945,59118,881,7711,835,6426,960,6561,591,1792,207,500
13,314,93114,889,180
63,411.3942,369.439
15,945,59115,842,7261,835,6426,960,6561,591,1792,207,500
13,314,93114,889,18063,411,394
2,148,187
3,039,045
132,44388,809
218,925,220132,4436,449,405212,343,372Total expenditures
Excess (deficiency) of revenuesover (under) expenditures 7,505.402(35,367)(241,790)7,782,559
Other financing sources (uses):Transfer (1,028,263)1,028,263
(1,028,263)1,028,263Total other financing sources (uses)
7,505,402(1,063.630)(241,790)8,810,822Net change in fund balances
38,021,0021,357,3941,966,55034,697,058Fund balances, July 1, 2020 (as restated)
45,526,404293,764 $1,724,760 $43,507,880 $$Fund balances, June 30, 2021
The accompanying Notes to the Financial Statements are an integral part of this statement.
30

EXHIBIT "B-3”
FREEHOLD REGIONAL HIGH SCHOOL DISTRICTRECONCILIATION OF THE STATEMENT OF REVENUES. EXPENDITURES
AND CHANGES IN FUND BALANCES OF GOVERNMENTAL FUNDSTO THE STATEMENT OF ACTIVITIES
FOR THE FISCAL YEAR ENDED JUNE 30. 2021
7,505,402Total net change in fund balances - governmental funds (from B-2) $
Amounts reported for governmental activities in the statement of activities (A-2) aredifferent because:
Capita) outlays are reported in governmental funds as expenditures. However, in thestatement of activities, the cost of those assets is allocated over their estimated usefullives as depreciation expense. This is the amount by which capital outlays exceededdepreciation in the period.
(6,986,126)Depreciation expenseCapital outlaysLess: Capital Outlays not capitalized
2,369,439(8,101)
$
2,361,338
Repayment of long-term debt is an expenditure in the governmental funds, but therepayment reduces long-term liabilities in the statement of Net Position and is notreported in the statement of activities.
2,357,651Payment of capital lease payable
District pension contributions are reported as expenditures in the governmental funds when made.However, they are reported as deferred outflows of resources in the Statement of Net Position becausethe reported net pension liability is measured a year before the District's report date. Pension expense,which is the change in the net pension liability adjusted for changes in deferred outflows and inflows ofresources related to pensions, is reported in the Statement of Activities.
2,639,629(417,611)
District pension contributionsLess: Pension expense
2,222,018
In the statement of activities, contributed capital assets are reflected in the activity in which they are utilizedwhereas in the governmental funds, they are reflected as an expense. The change in net assets on thestatement of activities must therefore reflect this contribution as a transferIn the statement of activities, certain expenses, eg., compensated absences (vacations)are measured by the amounts earned during the year. In governmental funds, however,expenditures for these items are reported in the amount of financial resources used (paid).When the earned amount exceeds the paid amount, the difference is a reduction in thereconciliation (-). When the paid amount exceeds the earned amount the difference is anaddition to the reconciliation (+). (185,491)
7,274,792$Change in net position of governmental activities (A-2)
The accompanying Notes to the Financial Statements are an integral part of this statement.
31

OTHER FUNDS
32

EXHIBIT "B-4M
FREEHOLD REGIONAL HIGH SCHOOL DISTRICTCOMBINING STATEMENT OF NET POSITION
PROPRIETARY FUNDS - ENTERPRISE FUNDSJUNE 30. 2021
BUSINESS-TYPE ACTIVITIES - ENTERPRISE FUNDEXTRA-CURRICULAR
FUNDFOOD SERVICE
FUND TOTALASSETS:Current assets:Cash and cash equivalentsAccounts receivable:
StateFederalOther
Interfund receivableInventories
51,989$ 51,989 $ $
422 42260,712
4,265161,297
40,573
60,71231,217
161,29740,573
26,952
346,21026,952319,258Total current assets
Noncurrent assets:Furniture, machinery and equipmentLess accumulated depreciation
1,055,337(712,345)
1,055,337(712,345)
342,992342,992Total noncurrent assets
662,250 689,20226,952Total assets
LIABILITIES:Current liabilities:Accounts payableInterfund PayablesLease payableUnearned revenue
38.44626,952
393,10094.446
38,44626,952
393,10094,446
552,94426,952525,992Total current liabilities
NET POSITION:Net investment in capital assetsUnrestricted
96,99139,267
96,99139,267
136,258$136,258 $$Total net position
The accompanying Notes to the Financial Statements are an integral part of this statement.
33

EXHIBIT "B-5"
FREEHOLD REGIONAL HIGH SCHOOL DISTRICTSTATEMENT OF REVENUES. EXPENSES AND CHANGES IN NET POSITION
PROPRIETARY FUNDSFOR THE FISCAL YEAR ENDED JUNE 30. 2021
BUSINESS-TYPE ACTIVITIES - ENTERPRISE FUNDEXTRA-CURRICULAR
FUNDFOOD SERVICE
FUND TOTALOPERATING REVENUES:
Charges for services:Daily sales - non-reimbursable programsSpecial functionsFees - individuals
12,431 $5,674
$ 12,4315,674
110,152
$
110,152
110,152 128,25718,105Total operating revenues
OPERATING EXPENSES:Cost of sales - reimbursable programsCost of sales - non-reimbursable programsSalaries and benefitsSupplies and materialsManagement feeMiscellaneousDepreciationLease purchase interest
83,68725,827
293.825
83,68725,827
191,930 101,895599599
4,37143,50346,06314,963
4,37135,24646,06314,963
8,257
512,838110,152402,686Total operating expenses
(384,581)(384,581)Operating (loss)
NONOPERATING REVENUES (EXPENSES):State Sources
State school lunch programFederal Sources
National school lunch programSchool breakfast programEmergency Operational CostsReimbursement Program
National food distribution commoditiesTotal nonoperating revenues (expenses)
1,8741,874
39,28021,531
39,28021,531
51,78415,592
51,78415,592
130,061130,061
(254.520)(254,520)Income (loss) before contributions and transfers
(254,520)(254,520)Change in net position
390,778390,778Total net position - beginning
136,258$136,258 $$Total net position - ending
The accompanying Notes to the Financial Statements are an integral part of this statement.
34

EXHIBIT "B-6"
FREEHOLD REGIONAL HIGH SCHOOL DISTRICTCOMBINING STATEMENT OF CASH FLOWS
PROPRIETARY FUNDS - ENTERPRISE FUNDSFOR THE FISCAL YEAR ENDED JUNE 30. 2021
BUSINESS-TYPE ACTIVITIES - ENTERPRISE FUNDFOOD SERVICE
FUNDEXTRA-CURRICULAR
FUND TOTAL
Cash flows from operating activities:Receipts from customersPayments to employeesPayments for employee benefitsPayments to suppliers
48,510 $(101,895)
37,293(284,732)
(9,092)(106,857)
(11,217) $(182,837)
(9,092)(98,600)
$
(8,257)
(363,388)(301,746) (61,642)Net cash provided by (used for) operating activities
Cash flows from noncapital financing activities:State sourcesFederal sourcesOperating subsidies and transfers to other funds
5,33360,430
383,053
5,33360,430
321,411 61,642
448,81661,642Net cash provided by noncapital financing activities 387,174
Cash flows from capital and related financing activities:Capital lease paymentPurchases of capital assets
(123,626)(4,643)
(123,626)(4,643)
Net cash provided by (used for) capital andrelated financing activities (128,269)(128,269)
(42,841)Net increase (decrease) in cash and cash equivalents (42,841)
94,83094,830Cash and cash equivalents, July 1, 2020
51,98951,989 $ $Cash and cash equivalents, June 30, 2021 $
Reconciliation of operating income (loss) to net cashprovided (used) by operating activities
Operating income (loss)Adjustments to reconciling operating income (loss) to
net cash provided by (used for) operating activities:DepreciationFederal commodities
Change in assets and liabilities:(Increase) decrease in accounts receivable,netIncrease (decrease) in unearned revenueIncrease (decrease) in accounts payable(Increase) decrease in inventories
(384,581)(384,581) $ $$
46,06315,592
46,06315,592
(28.361)(27,912)
3,59112,220
(26,952)(1,409)(27,912)38,28112,220
(34,690)
21,19382,835 (61,642)
(363,388)(61,642) $(301,746) $Net cash provided by (used for) operating activities $
The accompanying Notes to the Financial Statements are an integral part of this statement.
35

Freehold Regional High School DistrictNotes to the Financial Statements
For the Fiscal Year Ending June 30. 2021
NOTE 1: SUMMARY OF SIGNIFICANT ACCOUNTING POLICIES
The financial statements of the Freehold Regional High School District (the“District”) have been prepared in conformity with accounting principles generallyaccepted in the United States of America (GAAP) as applied to governmentalunits. The Governmental Accounting Standards Board (GASB) is the acceptedstandard-setting body for establishing governmental accounting and financialreporting principles. The more significant of the District’s accounting policies aredescribed below:
Reporting Entity
The Freehold Regional High School District is a Type II District located inMonmouth County, New Jersey. The School District is an instrumentality of theState of New Jersey, established to function as an educational institution. TheBoard of Education of the Freehold Regional High School District, comprised ofnine elected individuals, is the primary governing authority of the District. Asuperintendent is appointed by the Board and is responsible for theadministrative control of the District.
The primary criterion for including activities within the District's reporting entity,are set forth in Statement No. 39 of the Governmental Accounting StandardsBoard entitled “Determining Whether Certain Organizations are ComponentUnits" (GASB 39), as codified in Section 2100 of the GASB Codification ofGovernmental Accounting and Financial Reporting Standards.
Organizations that are legally separate, tax-exempt entities and meet all of thefollowing criteria should be discretely presented as component units. Thesecriteria are:
1. The economic resources received or held by the separate organizationare entirely or almost entirely for the direct benefit of the primarygovernment
2. The primary government, or its component unit, is entitled to, or has theability to otherwise access, a majority of the economic resources of theorganization
3. The economic resources received or held by an individual organizationthat the specific primary government, or its component units, is entitle to,or has the ability to otherwise access, are significant to that primarygovernment
36

Freehold Regional High School DistrictNotes to the Financial Statements
For the Fiscal Year Ending June 30. 2021
SUMMARY OF SIGNIFICANT ACCOUNTING POLICIES (CONTINUED!NOTE 1:
Reporting Entity (Continued)
The combined financial statements include all funds of the District over which theBoard exercises operating control. The operations of the District include six HighSchools. There were no additional entities required to be included in the reportingentity under the criteria as described above, in the current fiscal year.Furthermore, the District is not includable in any other reporting entity on thebasis of such criteria.
Basis of Presentation
The District’s basic financial statements consist of District-wide statements,including a statement of net assets and a statement of activities, and fundfinancial statements which provide a more detailed level of financial information.
District-wide Statements: The statement of net assets and the statement ofactivities display information about the District as a whole. These statementsinclude the financial activities of the overall District.. Eliminations have beenmade to minimize the double-counting of internal activities. These statementsdistinguish generally between the governmental and business-type activities ofthe District. Governmental activities generally are financed through taxes,intergovernmental revenues, and other non-exchange transactions. Business-type activities are financed in whole or in part by fees charged to external parties.
The statement of net assets presents the financial condition of the governmentaland business-type activities of the District at fiscal year end. The statement ofactivities presents a comparison between direct expenses and program revenuesfor the business-type activity of the District and for each function of the District’sgovernmental activities. Direct expenses are those that are specificallyassociated with a program or function and, therefore, are clearly identifiable to aparticular function. Program revenues include (a) fees and charges paid by therecipients of goods or services offered by the programs and (b) grants andcontributions that are restricted to meeting the operational or capital requirementof a particular program. Revenues that are not classified as program revenues,including all taxes, are presented as general revenues. The comparison of directexpenses with program revenues identifies the extent to which eachgovernmental function or business segment is self-financing or draws from thegeneral revenues of the District.
37

Freehold Regional High School DistrictNotes to the Financial Statements
For the Fiscal Year Ending June 30. 2021
NOTE 1: SUMMARY OF SIGNIFICANT ACCOUNTING POLICIES (CONTINUED)
Basis of Presentation (Continued)
Fund Financial Statements: During the fiscal year, the District segregatestransactions related to certain District functions or activities in separate funds inorder to aid financial management and to demonstrate legal compliance. Thefund financial statements provide information about the District’s funds. Separatestatements are presented for each fund category-proprietary. The New Jersey Department of Education (NJDOE) has elected torequire New Jersey districts to treat each governmental fund as a major fund inaccordance with the option noted in GASB No. 34, paragraph 76. The NJDOEas the oversight entity believes that the presentation of all funds as major isimportant for the public interest and to promote consistency among Districtfinancial reporting models.
governmental and
Governmental Funds
General Fund The genera! fund is the general operating fund of the District andis used to account for all expendable financial resources except those required tobe accounted for in another fund, included are certain expenditures for vehiclesand movable instructional or non instructional equipment which are classified inthe capital outlay sub-fund.
As required by the New Jersey Statement Department of Education, the Districtincludes budgeted capital outlay in this fund. U.S. Generally AcceptedAccounting Principles as they pertain to governmental entities state that generalfund resources may be used to directly finance capital outlays for long-livedimprovements as long as the resources in such cases are derived exclusivelyfrom unrestricted revenues. Resources for budgeted capital outlay purposes arenormally derived from State of New Jersey Aid, district taxes, and appropriatedfund balance. Expenditures are those that result in the acquisition of or additionsto capital assets for land, existing buildings, improvements of grounds,construction of buildings, additions to or remodeling of buildings and thepurchase of built-in equipment. These resources can be transferred from and tothe current expense by Board resolution; in certain instances approval by theCounty Superintendent of Schools may also be required.
Special Revenue Fund The special revenue fund is used to account for theproceeds of specific revenue sources from State and Federal Government (otherthan those for major capital projects, debt service or proprietary funds) and localappropriations that are legally restricted to expenditures for specified purposes.
38

Freehold Regional High School DistrictNotes to the Financial Statements
For the Fiscal Year Ending June 30. 2021
NOTE 1: SUMMARY OF SIGNIFICANT ACCOUNTING POLICIES (CONTINUED!
Capital Projects Funds The capita! projects fund is used to account for allfinancial resources to be used for the acquisition or construction of major capitalfacilities (other than those financed by proprietary funds),resources are derived from temporary notes or serial bonds that are specificallyauthorized by the voters as a separate question on the ballot either during theannual election or at a special election.
The financial
Debt Service Fund The debt service fund is used to account for theaccumulation of resources for, and the payment of principal and interest on debtissued to finance major property acquisition, construction and improvementprograms.
Proprietary Funds
Enterprise Fund The enterprise fund accounts for all revenues and expensespertaining to the District’s Food Service and Extra-Curricular (ice Hockey)program operations. These funds are utilized to account for operations that arefinanced and operated in a manner similar to private business enterprises. Thestated intent is that the cost (i.e., expenses including depreciation and indirectcosts) of providing goods or services to the students on a continuing basis arefinanced or recovered primarily through user charges.
Recently Adopted Accounting Pronouncements
Beginning with the year ended June 30, 2021, the District has implementedGASB Statement 84, Fiduciary Activities. The objective of this new Statement isto improve guidance regarding the identification of fiduciary activities foraccounting and financial reporting purposes and how those activities should bereported. This Statement establishes criteria for identifying fiduciary activities ofall state and local governments. The focus of the criteria generally is on (1)whether a government is controlling the assets of the fiduciary activity and (2) thebeneficiaries with whom a fiduciary relationship exists. Separate criteria areincluded to identify fiduciary component units and postemployment benefitarrangements that are fiduciary activities.
39

Freehold Regional High School DistrictNotes to the Financial Statements
For the Fiscal Year Ending June 30. 2021
NOTE 1: SUMMARY OF SIGNIFICANT ACCOUNTING POLICIES (CONTINUED)
Recently Adopted Accounting Pronouncements (Continued)
An activity meeting the criteria should be reported in a fiduciary fund in the basicfinancial statements. Governments with activities meeting the criteria shouldpresent a statement of fiduciary net position and a statement of changes infiduciary net position. An exception to that requirement is provided for abusiness-type activity that normally expects to hold custodial assets for threemonths or less.
As a result of the implementation of this Statement, the New Jersey Departmentof Education has made the following determinations as to the reporting of certainfunds which, in prior years, have been reported as Fiduciary Activities:
AfterImplementation of
GASB 84Special Revenue
FundSpecial Revenue
FundGeneral FundGeneral Fund
Prior toimplementation of
GASB 84Activity
Student Activity Funds Fiduciary Fund
Fiduciary FundFiduciary FundFiduciary Fund
Scholarship FundsPayroll Agency FundsState Unemployment CompensationFund
Basis of Accounting-Measurement Focus
Basis of accounting determines when transactions are recorded in the financialrecords and reported in the financial statements.
District-wide and Proprietary: The District-wide financial statements are preparedusing the accrual basis of accounting. Governmental funds use the modifiedaccrual basis of accounting. Differences in the accrual and modified accrualbasis of accounting arise in the recognition of revenue, the recording of deferredrevenue, and in the presentation for expenses versus expenditures. Ad Valorem(Property) Taxes are susceptible to accrual as under New Jersey State Statute amunicipality is required to remit to its school district the entire balance of taxes inthe amount voted upon or certified, prior to the end of the school year. TheDistrict records the entire approved tax levy as revenue (accrued) at the start ofthe fiscal year, since the revenue is both measurable and available.
40

Freehold Regional High School DistrictNotes to the Financial Statements
For the Fiscal Year Ending June 30. 2021
NOTE 1: SUMMARY OF SIGNIFICANT ACCOUNTING POLICIES (CONTINUED)
Basis of Accounting-Measurement Focus (Continued)
The District is entitled to receive monies under the established payment scheduleand the unpaid amount is considered to be an “accounts receivable". Revenuefrom grants, entitlements, and donations are recognized in the fiscal year inwhich all eligibility requirements have been satisfied. Governmental FundFinancial Statements: Governmental funds are reported using the currentfinancial resources measurement focus and the modified accrual basis ofaccounting. Under this method, revenues are recognized when measurable andavailable.determined and “available” means collectible within the current period or soonenough thereafter to be used to pay liabilities of the current period. Expendituresare recorded when the related fund liability is incurred, except for principal andinterest on long-term debt, claims and judgments, and compensated absences,which are recognized as expenditures to the extent they have matured. Generalcapital asset acquisitions are reported as expenditures in governmental funds.Proceeds from the issuance of long-term debt and acquisitions under capitalleases are reported as other financing sources.
“Measurable” means the amount of the transactions can be
Budqets/Budaetarv Control
Annua! appropriated budgets are prepared in the spring of each year for thegeneral, special revenue, and debt service funds. The budgets are submitted tothe county office for approval. In accordance with P.L. 2011, c. 202, whichbecame effective January 17, 2012, the District elected to move the school Boardelection to the date of the November general election thereby eliminating the voteon the annual base budget. Budgets are prepared using the modified accrualbasis of accounting. The legal level of budgetary control is established at lineitem accounts within each fund. Line item accounts are defined as the lowest(most specific) level of detail as established pursuant to the minimum chart ofaccounts referenced in N.J.A.C. 6A:23-2.2(f)1. Expenditures may not legallyexceed budgeted appropriations at the line item level. All budget amendmentsand transfers must be approved by School Board resolution.
All budget amounts presented in the accompanying supplementary informationreflect the original budget and the amended budget (which have been adjustedfor legally authorized revisions of the annual budgets during the year).
Appropriations, except remaining project appropriations, encumbrances, andunexpended grant appropriations, lapse at the end of each fiscal year. Thecapital projects fund presents the remaining project appropriations compared tocurrent year expenditures. Formal budgetary integration into the accountingsystem is employed as a management control device during the fiscal year.
41

Freehold Regional High School DistrictNotes to the Financial Statements
For the Fiscal Year Ending June 30. 2021
NOTE 1: SUMMARY OF SIGNIFICANT ACCOUNTING POLICIES (CONTINUED)
For governmental funds, there are no substantial differences between thebudgetary basis of accounting and generally accepted accounting principles(GAAP) with the exception of the legally mandated (N.J.S.A. 18A:22-44.2)revenue recognition of one or more deferred State Aid payments for budgetarypurposes only due to the State deferral of such payments into the subsequentbudget year and the accounting treatment of encumbrances in the specialrevenue fund as described below. Encumbrance accounting is also employedas an extension of formal budgetary integration in the governmental fund types.Unencumbered appropriations lapse at fiscal year end.
The accounting records of the special revenue fund are maintained on the grantaccounting budgetary basis. The grant accounting budgetary basis differs fromGAAP in that the grant accounting budgetary basis recognized encumbrances asexpenditures and also recognizes the related revenues, whereas the GAAP basisdoes not. Sufficient supplemental records are maintained to allow for thepresentation of GAAP basis financial records.
Encumbrance Accounting
Under encumbrance accounting purchase orders, contracts and othercommitments for the expenditures of resources are recorded to reserve a portionof the applicable appropriation. Open encumbrances in governmental fundsother than the special revenue fund are reported as assigned fund balances atfiscal year-end as they do not constitute expenditures or liabilities but rathercommitments related to unperformed contracts for goods and services.
Open encumbrances in the special revenue for which the District has receivedadvances are reflected in the balance sheet as unearned revenues at fiscal year-end.
The encumbered appropriation authority carries over into the next fiscal year. Anentry will be made at the beginning of the next fiscal year to increase theappropriation reflected in the certified budget by the outstanding encumbranceamount as of the current fiscal year end.
Interfunds
Interfund receivables and payables arise from transactions between particularfunds and are considered short term in duration. The interfund transactions arerecorded by all funds affected in the period in which the transactions areexecuted and are part of the district's available spendable resources.
42

Freehold Regional High School DistrictNotes to the Financial Statements
For the Fiscal Year Ending June 30, 2021
NOTE 1: SUMMARY OF SIGNIFICANT ACCOUNTING POLICIES (CONTINUED!
Inventories and Prepaid Expenses
Inventories of materials and supplies held for consumption in the governmentalfunds are recorded as expenditures at the time of purchase and year endbalances are not reported in the financial statements.
Inventories of food and/or supplies in the food service fund are recorded at coston a first-in, first-out basis or, in the case of Food Distribution Commodities, atstated value which approximates market.
Prepaid expenses which benefit future periods, other than those recorded in theenterprise fund, are recorded as expenditures in the year of purchase.
Capital Assets
The District has an established formal system of accounting for its capital assets.Capital Assets used for governmental purposes, which include land, buildingsand improvements and furniture and equipment, are only reported in the district-wide financial statements. The District generally defines capital assets as assetswith an initial cost of $2,000 or more and an estimated useful life in excess of oneyear. Purchased or constructed capital assets are reported at cost. Donatedcapital assets are valued at their estimated fair market value on the datereceived. The cost of normal maintenance and repairs that do not add to thevalue of the asset or materially extend assets’ lives are not capitalized.In fiscal year 2016, the District implemented GASB 72 The objective of thisStatement is to improve financial reporting by clarifying the definition of fair valuefor financial reporting purposes, establishing general principles for measuring fairvalue, providing additional fair value application guidance, and enhancingdisclosures about fair value measurements. These improvements are based inpart on the concepts and definitions established in Concepts Statement No. 6,Measurement of Elements of Financial Statements, and other relevant literature.
Capital assets are depreciated in the district-wide statements using the straight-line method over the following estimated useful lives:
Estimated Life
50School BuildingsBuilding ImprovementsElectrical/Plumbing
VehiclesOffice and computer equipment
Instructional equipmentGrounds equipment
20308
101015
43

Freehold Regional High School DistrictNotes to the Financial Statements
For the Fiscal Year Ending June 30, 2021
SUMMARY OF SIGNIFICANT ACCOUNTING POLICIES (CONTINUED!NOTE 1:
Compensated Absences
The District accounts for compensated absences (e.g., unused vacation, sickleave) as directed by Governmental Accounting Standards Board Statement No.16 (GASB 16), “Accounting for Compensated Absences.” A liability forcompensated absences attributable to services already rendered and notcontingent on a specific event that is outside the control of the employer andemployee is accrued as employees earn the rights to the benefits.
District employees are granted varying amounts of vacation and sick leave inaccordance with the District’s personnel policy and/or collective bargaining unitcontracts. Benefits are paid upon termination.
The District estimates its accrued compensated absences liability based on theaccumulated sick and vacation days at the balance sheet date by thoseemployees who are currently eligible to receive termination payments.
For the district-wide statements, the current portion is the amount estimated to beused in the following year. For the governmental funds in the fund financialstatements, a liability is reported only for to the extent of the amount actually dueat year end as a result of employee resignations/retirements. Compensatedabsences are a reconciling item between the fund level and district-widepresentations.
Fund Equity
Fund balance restrictions are used to indicate that portion of the fund balancethat is not available for expenditures or is legally segregated for a specific futureuse. Designation of portions of the fund balances are established to indicatetentative plans for financial utilization in a future period. The unassigned fundbalances represent the amount available for future budgetary operations.
Unearned Revenue
Unearned revenue in the General, Special Revenue and Proprietary fundsrepresents funds which have been received but not yet earned.
44

Freehold Regional High School DistrictNotes to the Financial Statements
For the Fiscal Year Ending June 30. 2021
SUMMARY OF SIGNIFICANT ACCOUNTING POLICIES (CONTINUED)NOTE 1:
Accrued Liabilities and Long-Term Obligations
All payables, accrued liabilities, and long-term obligations are reported on thedistrict-wide financial statements. In general, governmental fund payables andaccrued liabilities that, once incurred, are paid in a timely manner and in full fromcurrent financial resources are reported as obligations of the funds. However,contractually required pension contributions and compensated absences that arepaid from governmental funds are reported as liabilities on the fund financialstatements only to the extent that they are due for payment during the currentyear. Long term debt is recognized as a liability on the fund financial statementswhen due.
Net Position
In accordance with GASB 63, Net Position represents the difference betweenassets and liabilities. Net investment in capital assets consists of capital assets,net of accumulated depreciation, reduced by the outstanding balance of anyborrowing used for the acquisition, construction, or improvement of those assets.Net position is reported as restricted when there are limitations imposed on theiruse either through the enabling legislation adopted by the District or throughexternal restrictions imposed by creditors, grantors, or laws or regulations ofother governments. The District’s policy is to first apply restricted resourceswhen an expense is incurred for purposes for which both restricted andunrestricted net positions are available.
Fund Balance Reserves
The District has implemented GASB Statement 54, “Fund Balance Reporting andGovernmental Fund Type Definitions”. This statement modifies fund balancereporting and clarifies fund type definitions. This Statement aims to enhance theusefulness of fund balance information by providing clearer fund balanceclarifications that can be applied more consistently.Under the new standard, in the fund financial statements, governmental fundsreport the following classifications of fund balance:
Nonsoendable - includes amounts that cannot be spent because they are eithernot spendable in form or are legally or contractually required to be maintainedintact.
45

Freehold Regional High School DistrictNotes to the Financial Statements
For the Fiscal Year Ending June 30. 2021
NOTE 1: SUMMARY OF SIGNIFICANT ACCOUNTING POLICIES (CONTINUED)
Fund Balance Reserves (Continued)
Restricted - includes amounts restricted by external sources (creditors, laws ofother governments, etc.) or by constitutional provision or enabling legislation. TheDistrict reports the Capital Reserve, Maintenance Reserve, Emergency Reserve,State Unemployment Insurance, Student Activities and Excess Surplus asRestricted Fund Balance.
Committed - includes amounts that can only be used for specific purposes.Committed fund balance is reported pursuant to resolutions passed by the Boardof Education, the District’s highest level of decision making authority.Commitments may be modified or rescinded only through resolutions approvedby the Board of Education. The District does not report any Fund Balance in thiscategory
Assigned - includes amounts that the District intends to use for a specificpurpose, but do not meet the definition of restricted or committed fund balance.Under the District’s policy, amounts may be assigned by the BusinessAdministrator. The District reports Year End Encumbrances and Designated forSubsequent Years Expenditures as Assigned Fund Balance.Unassiqned - is the residual classification for the genera! fund. This classificationrepresents fund balance that has not been assigned to other funds and that hasnot been restricted, committed, or assigned to specific purposes within thegeneral fund. The general fund should be the only fund that reports a positiveunassigned fund balance amount. In other governmental funds, if expendituresincurred for specific purposes exceeded the amounts restricted, committed, orassigned to those purposes, it may be necessary to report a negative unassignedfund balance.
When an expenditure is incurred for purposes for which both restricted andunrestricted fund balance is available, the District considers restricted funds tohave been spent first. When an expenditure is incurred for which committed,assigned, or unassigned fund balance are available, the District considersamounts to have been spent first out of committed funds, then assigned funds,and finally unassigned funds, as needed.
Revenues Exchange and Non-exchange Transactions
Revenue resulting from exchange transactions, in which each party gives andreceives essentially equal value, is recorded on the accrual basis when theexchange takes place. On the modified accrual basis, revenue is recorded in thefiscal year in which the resources are measurable and become available.Available means the resources will be collected within the current fiscal year orare expected to be collected soon enough thereafter to be used to pay liabilitiesof the current fiscal year. For the District, “available” means within sixty days ofthe fiscal year end.
46

Freehold Regional High School DistrictNotes to the Financial Statements
For the Fiscal Year Ending June 30. 2021
NOTE 1: SUMMARY OF SIGNIFICANT ACCOUNTING POLICIES (CONTINUED)
Revenues Exchange and Non-exchange Transactions (Continued!
Non-exchange transactions, in which the District receives value without directlygiving equal value in return, include property taxes, income taxes, grants,entitlements, and donations. On the accrual basis, revenue from property taxesis recognized in the fiscal year for which the taxes are levied. Revenue fromproperty taxes is recognized in the period in which the income is earned.Revenue from grants, entitlements, and donations is recognized in the fiscal yearin which all eligibility requirements have been satisfied.
Eligibility requirements include timing requirements, which specify the year whenthe resources are required to be used or the fiscal year when use is firstpermitted; matching requirements, in which the District must provide localresources to be used for a specific purpose; and expenditure requirements, inwhich the resources are provided to the District on a reimbursement basis. Onthe modified accrual basis, revenue from non-exchange transactions must alsobe available before it can be recognized.
Under the modified accrual basis, the following revenue sources are consideredboth measurable and available at fiscal year-end: property taxes available as anadvance, interest, and tuition.
Operating Revenues and Expenses
Operating revenues are those revenues that are generated directly from theprimary activity of the enterprise fund. For the District, these revenues are salesin the Enterprise Funds. Operating expenses are necessary costs incurred toprovide the service that is the primary activity of the enterprise fund.
Allocation of Indirect Expenses
The District reports all direct expenses by function in the Statement of Activities.Direct expenses are those that are clearly identifiable with a function. Indirectexpenses are allocated to functions but are reported separately in the Statementof Activities. Employee benefits, including the employer’s share of socialsecurity, workers compensation, and medical and dental benefits, were allocatedbased on salaries of the program. Depreciation expense, where practicable, isspecifically identified by function and is included in the indirect expense columnof the Statement of Activities. Depreciation expense that could not be attributedto a specific function is considered an indirect expense and is reportedseparately on the Statement of Activities.
47

Freehold Regional High School DistrictNotes to the Financial Statements
For the Fiscal Year Ending June 30. 2021
NOTE 1: SUMMARY OF SIGNIFICANT ACCOUNTING POLICIES (CONTINUED!
Extraordinary and Special Items
Extraordinary items are transactions or events that are unusual in nature andinfrequent of occurrence. Special items are transactions or events that are withincontrol of management and are either unusual in nature or infrequent inoccurrence. Neither of these types of transactions occurred during the fiscalyear.Management Estimates
The preparation of financial statements in conformity with accounting principlesgenerally accepted in the United States requires management to make estimatesand assumptions that affect the reported amounts of revenues andexpenditures/expenses during the reporting period. Actual results could differfrom those estimates.
Accounting and Financial Reporting for Pensions
in the District-Wide Financial Statements for purposes of measuring the netpension liability, deferred outflows of resources and deferred inflows of resourcesrelated to pensions, and pension expense, information about the fiduciary netposition of the District’s proportionate share of the New Jersey Public EmployeesRetirement System (“PERS") and the Teachers’ Pension and Annuity Fund(“TPAF”) and the additions to/deductions from these retirement systems’fiduciary net position have been determined on the same basis as they werereported by PERS and TPAF. For this purpose, benefit payments (includingrefunds of employee contributions) are recognized when due and payable inaccordance with the benefit terms. Investments are reported at fair value.In the Governmental Fund Financial Statements, the year end Net pensionliability is not required to be reflected. Pension related revenues andexpenditures are reflected based on amounts that are normally expected to beliquidated with available financial resources for required pension contributions.Expenditures for PERS are recognized based upon billings made by the State ofNew Jersey due April 1st of each fiscal year. TPAF contributions are paid on theDistrict’s behalf by the State of New Jersey. The Governmental Fund FinancialStatements reflect both a revenue and expenses for this pension contribution.
48

Freehold Regional High School DistrictNotes to the Financial Statements
For the Fiscal Year Ending June 30, 2021
NOTE 1: SUMMARY OF SIGNIFICANT ACCOUNTING POLICIES (CONTINUED)
Deferred Outflows/Inflows of Resources
In addition to assets, the statement of financial position will sometimes report aseparate section for deferred outflows of resources. This separate financialstatement element, deferred outflows of resources, represents a consumption ofnet position that applies to a future period(s) and so will not be recognized as anoutflow of resources (expense/expenditure) until then. Currently, the District hasone item that qualifies for reporting in this category, deferred amounts related topensions.
In addition to liabilities, the statement of financial position will sometimes report aseparate section for deferred inflows of resources. This separate financialstatement element, deferred inflows of resources, represents an acquisition ofnet position that applies to a future period(s) and so will not be recognized as aninflow of resources (revenue) until that time. The District has one item thatqualifies as a Deferred Inflow. Deferred amounts related to pensions.
NOTE 2: CASH AND CASH EQUIVALENTS AND INVESTMENTS
The Board considers petty cash, change funds, cash in banks, and short terminvestments with original maturities of three months or less as cash and cashequivalents. Investments are stated at cost, which approximates market.Deposits
New Jersey statutes permit the deposit of public funds in public depositorieswhich are located in New Jersey and which meet the requirements of theGovernmental Unit Deposit Protection Act (GUDPA). GUDPA requires a bankthat accepts public funds to be a public depository. A public depository is definedas a state bank, a national bank, or a savings bank, which is located in the Stateof New Jersey, the deposits of which are insured by the Federal DepositInsurance Corporation. The statutes also require public depositories to maintaincollateral for deposits of public funds that exceed certain insurance limits. Eachdepository participating in the GUDPA system must pledge collateral equal to 5%of the average amount of its public deposits and 100% of the average amount ofits public funds in excess of 75% of its capital funds. No collateral is required foramounts covered by FDIC insurance. The collateral which may be pledged tosupport these deposits includes obligations of the State and federalgovernments, insured securities and other collateral approved by theDepartment. When the capital position of the depository deteriorates or thedepository takes an unusually large amount of public deposits, the Department ofBanking and Insurance requires additional collateral to be pledged. Under(GUDPA), if a public depository fails, the collateral it has pledged, plus thecollateral of all other public depositories, is available to pay the full amount of thedeposits to the governmental unit.
49

Freehold Regional High School DistrictNotes to the Financial Statements
For the Fiscal Year Ending June 30. 2021
NOTE 2: CASH AND CASH EQUIVALENTS AND INVESTMENTS (CONTINUED)
Deposits
The Freehold Regional High School District had the following cash and cashequivalents at June 30, 2021:
Fund Type AmountCash in Bank:
Governmental FundsProprietary Funds
Total Cash in BankLess: Reconciling Items
$ 57,008,16772,513
$ 57,080,680(2,702,464)
$ 54,378,216
Custodial Credit Risk - Deposits - Custodial credit risk is the risk that in the eventof a bank failure, the deposits may not be returned. The District does not have aspecific deposit policy for custodial credit risk other than those policies thatadhere to the requirements of statute. As of June 30, 2021, based upon thecoverage provided by FDIC and NJGUDPA, no amount of the bank balance wasexposed to custodial credit risk. Of the cash on balance in the bank of$57,080,680, $750,000 was covered by Federal Depository Insurance, and$56,330,680 was covered under the provisions of NJGUDPA.
InvestmentsThe types of investments which may be purchased by the District are strictlylimited by the express authority of the N.J.S.A. 18A:20-37 Education,Administration of School Districts. Permitted investments include any of thefollowing type of securities:
1. Bonds or other obligations of the United States of America or obligationsguaranteed by the United States of America;
2. Government money market mutual funds which are purchased from aninvestment company or investment trust which is registered with theSecurities and Exchange Commission under the “Investment Company Act of1940," 15 U.S.C. 80a1 et seq., and operated in accordance with 17 C.F.R. §270.2a7 and which portfolio is limited to U.S. Government securities thatmeet the definition of an eligible security pursuant to 17 C.F.R. § 270.2a7 andrepurchase agreements that are collateralized by such U.S. Governmentsecurities in which direct investment may be made pursuant to paragraphs(1) and (3) of N.J.S.A. 18A:20-37. These funds are also required to be ratedby a nationally recognized statistical rating organization.
50

Freehold Regional High School DistrictNotes to the Financial Statements
For the Fiscal Year Ending June 30. 2021
CASH AND CASH EQUIVALENTS AND INVESTMENTS (CONTINUED)NOTE 2:
Investments (Continued)
3. Any obligation that a federal agency or a federal instrumentality has issued inaccordance with an act of Congress, which security has a maturity date notgreater than 397 days from the date of purchase, provided that suchobligation bears a fixed rate of interest not dependent on any index or otherexternal factor;
4. Bonds or other obligations of the Local Unit or bonds or other obligations ofschool districts of which the Local Unit is a part or within which the schooldistrict is located.
5. Bonds or other obligations, having a maturity date not more than 397 daysfrom date of purchase, approved by the Division of Investment of theDepartment of Treasury for investment by School Districts;
6. Local government investment pools that are fully invested in U.S.Government securities that meet the definition of eligible security pursuant to17 C.F.R. § 270a7 and repurchase agreements that are collateralized bysuch U.S. Government securities in which direct investment may be madepursuant to paragraphs (1) and (3) of N.J.S.A. 18A:20-37. This type ofinvestment is also required to be rated in the highest category by a nationallyrecognized statistical rating organization.
7. Deposits with the State of New Jersey Cash Management Fund establishedpursuant to section 1 of P.L. 1977, c.281 C. 52:18A-90.4); or
Agreements for the repurchase of fully collateralized securities if:8.
the underlying securities are permitted investments pursuant toparagraphs (1) and (3) of this subsection;
a.
the custody of collateral is transferred to a third party;b.
the maturity of the agreement is not more than 30 days;c.
the underlying securities are purchased through a publicdepository as defined in section 1 of P.L. 1970, c.236 C. 17:1941);
d.
and
a master repurchase agreement providing for the custody andsecurity of collateral is executed.
e.
51

Freehold Regional High School DistrictNotes to the Financial Statements
For the Fiscal Year Ending June 30, 2021
NOTE 2: CASH AND CASH EQUIVALENTS AND INVESTMENTS (CONTINUED!
Investments (Continued)
Based upon the limitations set forth by New Jersey Statutes 40A:5-15.1, theDistrict is generally not exposed to credit risks and interest rate risks for itsinvestments, nor is it exposed to foreign currency risk for its deposits andinvestments.
NOTE 3: RECEIVABLES
Receivables at June 30, 2021 are listed below. All receivables are consideredcollectible in full. A summary of the principal items of governmental receivablesfollows:
District-WideFinancial
Statements
GovernmentalFinancial
Statements4,477,028
577,425$$4,477,028
577,4253,255,131
112,720
State AidFederal AidInterfundsOtherGross ReceivablesLess: Allowance for UncollectiblesTotal Receivables, Net
112,7205,167,1738,422,304
$5,167,173$8,422,304
52
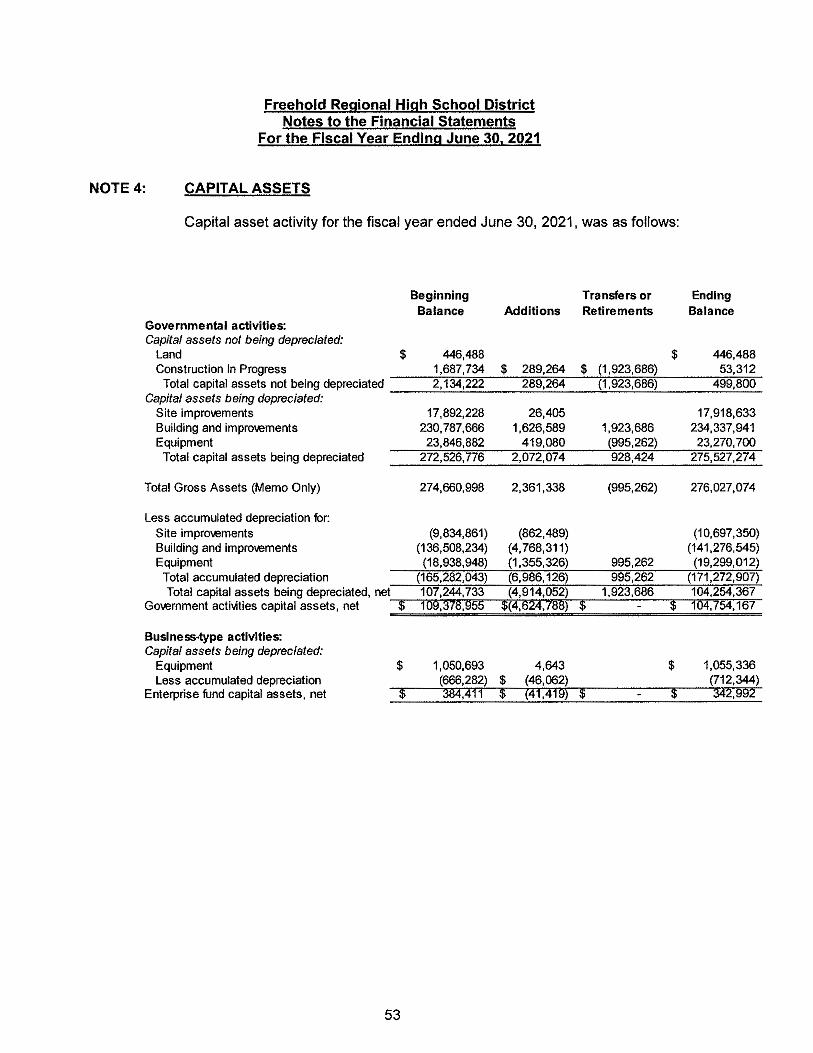
Freehold Regional High School DistrictNotes to the Financial Statements
For the Fiscal Year Ending June 30, 2021
CAPITAL ASSETSNOTE 4:
Capital asset activity for the fiscal year ended June 30, 2021, was as follows:
BeginningBalance
Transfers orAdditions Retirements
EndingBalance
Governmental activities:Capital assets not being depreciated:
LandConstruction In Progress
Total capital assets not being depreciatedCapital assets being depreciated:
Site improvementsBuilding and improvementsEquipment
Total capital assets being depreciated
$ 446,4881,687,734 $ 289,264 $ (1,923,686)
$ 446,48853,312
2,134,222 289,264 (1,923,686) 499,800
17,892,228230,787,666
23,846,882
17,918,633234,337,94123,270,700
26,4051,626,589
419,0801,923,686(995,262)
272,526,776 2,072,074 928,424 275,527,274
Total Gross Assets (Memo Only) 274,660,998 2,361,338 (995,262) 276,027,074
Less accumulated depreciation for:Site improvementsBuilding and improvementsEquipment
Total accumulated depreciationTotal capital assets being depreciated, net
Government activities capital assets, net
(9,834,861) (862,489)(136,508,234) (4,768,311)(18,938,948) (1,355,326)
(10,697,350)(141,276,545)(19,299,012)995,262
995,262 (171,272,907)(165,282,043) (6,986,126)1,923,686 104,254,367107,244,733 (4,914,052)
$ 109,378,955 $(4,624,788) $7^ taaae as a i tsammmam t.
$ 104,754,167
Business-type activities:Capital assets being depreciated:
EquipmentLess accumulated depreciation
Enterprise fund capital assets, net
$ 1,055,336(712,344)
1 342,992
$ 1,050,693(666,282) $
4,643(46,062)
$ 384,411 $ (41,419) $
53

Freehold Regional High School DistrictNotes to the Financial Statements
For the Fiscal Year Ending June 30. 2021
CAPITAL ASSETS (CONTINUED)NOTE 4:
Depreciation expense was charged to functional expenses areas of the Districtas follows:
Function Amount$ 113,111
3,32632,9401,1375,0353,777
293,56594,604
760,0415,678,590
Regular InstructionOther InstructionStudent & Instruction Related ServicesGeneral Administrative ServicesSchool Administrative ServicesCentral ServiceAdministrative TechnologyPlant, Operations & MaintenancePupil TransportationUnallocated
$ 6,986,126
LONG-TERM LIABILITIESNOTE 5:
Bonds are issued by the District pursuant to the provisions of Title 18A,Education, of the New Jersey Statutes and are required to be approved by thevoters of the municipality through referendum. The proceeds of bonds arerecorded in the Capital Projects Fund and are restricted to the use for whichthey were approved in the bond referendum. All bonds are retired in annualinstallments within the statutory period of usefulness
School Bonds issued by the District are entitled to and benefit from the provisionof the New Jersey School Board Reserve Act P.L. 1980 c.72. Basically, fundsare held by the State of New Jersey within its State Fund for the Support of FreePublic Schools as a school bond reserve pledged by law to secure payment ofprincipal and interest due on such bonds in the event of the inability of the issuerto make payments.
54

Freehold Regional High School DistrictNotes to the Financial Statements
For the Fiscal Year Ending June 30. 2021
NOTE 5: LONG-TERM LIABILITIES (CONTINUED)
The following is a summary of transactions that affect long-termliabilities for the year ended June 30, 2021:
Governmental Activities:
Amounts dueWithin
one year
BalanceJune 30,
2021
BalanceJune 30,
2020 ReductionsAdditions
$ 185,491 $ 3,294,74215,195,70439,348,657
Compensated AbsencesCapita! Leases PayablePension Liability
$ 3,109,25117,553,35544,931,347
$ 2,393,2092,357,6515,582,690
$57,839,103$65,593,953 $185,491 $7,940,341 $2,393,209Total
Business-Type Activities
Amounts dueWithin
one year
BalanceJune 30,
2020
BalanceJune 30,
2021Additions Reductions
$ 127,206Capital Leases Payable $ $ $ 123,626 $ 393,100516,726
$ 123,626$ $ 127,206Total $ 516,726 $ 393,100
Bonds Authorized But Not Issued
As of June 30, 2021, the District had no Bonds Authorized but not issued.
55

Freehold Regional High School DistrictNotes to the Financial Statements
For the Fiscal Year Ending June 30. 2021
NOTE 5: LONG-TERM LIABILITIES (CONTINUED)
Capital Leases Payable
The District is leasing various equipment and improvements totaling $25,192,000as follows:
InterestRateDescription Date Term Amount
District Wide Energy SavingsImprovement Plan $17,498,00012/31/13 15 Years 2.690%
School Buses, Technology andCopiers 1.290% $3,052,0007/15/16 5 Years
School Buses, Technology andBuildings and Grounds Equipment $2,560,0001.680%7/15/17 5 Years
School Buses, Technology,Cafeteria, and Buildings andGrounds Equipment $2,082,0002.896%7/15/18 5 Years
The following is a schedule of the future minimum lease payments under thecapital lease and the present value of the net minimum lease payments atJune 30, 2021:
Business-Type ActivitieFood Service
FundGovernmental
ActivitiesFiscal Year Ended
June 30,
$ 138,589138,589138,589
2,778,0542,180,0711,678,6991,401,8381,440,6197,728,615
$20222023202420252026
2027-2031
415,76722,667
17,207,8962,012,192
Total Minimum Lease PaymentsLess: Amount Representing Interest
$ 393,10015,195,704$Present Value of Lease Payments
56

Freehold Regional High School DistrictNotes to the Financial Statements
For the Fiscal Year Ending June 30. 2021
LONG-TERM LIABILITIES (CONTINUED)NOTE 5:
Operating Leases
The District has a commitment to lease building space, and a parking lot underan operating lease that expires on June 30, 2021. The District also hasoperating leases for copiers and postage machines that expire on various datesover the next five years. The total operating lease payments made during theyear ended June 30, 2021 were $240,626.
Future minimum lease payments are as follows:
2022 $329,0772023 353,7502024 383,5542025 391,5612026 395.890Total $1.853.832
PENSION PLANSNOTE 6:
Description of Plans
All required employees of the District are covered by the Public Employees’Retirement System, the Teachers’ Pension and Annuity Fund or the DefinedContribution Retirement Program which have been established by state statuteand are administered by the New Jersey Division of Pension and Benefits(Division). According to the State of New Jersey Administrative Code, allobligations of each system will be assumed by the State of New Jersey shouldthe system terminate. The Division issues a publicly available financial reportthat includes the financial statements and required supplementary information foreach of the above systems. These reports may be obtained by writing to theDivision of Pensions and Benefits, PO Box 295, Trenton, New Jersey, 08625 oronline at www.state.nj.us/treasury/pensions.
57

Freehold Regional High School DistrictNotes to the Financial Statements
For the Fiscal Year Ending June 30. 2021
NOTE 6: PENSION PLANS
Description of Plans (Continued)
Teachers’ Pension and Annuity Fund (TPAFI The Teachers’ Pension andAnnuity Fund was established as of January 1, 1955, under the provisions ofN.J.S.A. 18A:66 to provide retirement benefits, death, disability and medicalbenefits to certain qualified members. The Teachers’ Pension and Annuity Fundis considered a cost-sharing multiple employer plan with a special fundingsituation, as under current statute, all employer contributions are made by theState of New Jersey on behalf of the District and the system's other related non-contributing employers. Membership is mandatory for substantially all teachersor members of the professional staff certified by the State Board of Examiners,and employees of the Department of Education who have titles that areunclassified, professional and certified.
Public Employees’ Retirement System (PERS) The Public Employees’Retirement System (PERS) was established as of January 1, 1955 under theprovision of N.J.S.A. 43:15A to provide retirement, death, disability and medicalbenefits to certain qualified members. The Public Employees’ RetirementSystem is a cost-sharing multiple employer plan. Membership is mandatory forsubstantially all full-time employees of the State of New Jersey or any county,municipality, school district, or public agency, provided the employee is notrequired to be a member of another state administered retirement system orother state or local jurisdiction.
Defined Contribution Retirement Program (DCRP) The Defined ContributionRetirement Program (DCRP) was established under the provision of Chapter 92,P.L. 2007 and Chapter 103, P.L. 2007 to provide coverage elected and certainappointed officials, effective July 1, 2007. Membership is mandatory for suchindividuals with vesting occurring after one year of membership.
Significant Legislation
Effective June 28, 2011, P.L. 2011, c. 78 enacted certain changes in theoperations and benefit provisions of the TPAF and the PERS systems.
58

Freehold Regional High School DistrictNotes to the Financial Statements
For the Fiscal Year Ending June 30. 2021
NOTE 6: PENSION PLANS (CONTINUED!
Pension Plan Design Changes
Effective June 28, 2011, P.L. 2011, c. 78, new members of TPAF and PERS,hired on or after June 28, 2011, will need 30 years of creditable service and haveattained the age of 65 for receipt of the early retirement benefit without areduction of 1/4 of 1% for each month that the member is under age 65. Newmembers will be eligible for a service retirement benefit at age 65.Funding Changes
Under the new legislation, the methodology for calculating the unfunded accruedliability payment portion of the employer’s annual pension contribution to thePERS, and TPAF. The unfunded actuarial accrued liability (UAAL) will beamortized for each plan over an open-ended 30 year period and paid in leveldollars. Beginning with the July 1, 2019 actuarial valuation (July 1, 2018 forPFRS), the UAAL will be amortized over a closed 30 year period until theremaining period reaches 20, when the amortization period will revert to an open-ended 20 year period.
COLA Suspension
The payment of automatic cost-of-living adjustment to current and future retireesand beneficiaries are suspended until reactivated as permitted by this law.Vesting and Benefit Provisions The vesting and benefit provisions of PERSare set by N.J.S.A. 43:15A and 43.3B, and N.J.S.A. 18A:6C for TPAF. Allbenefits vest after ten years of service, except for post-retirement healthcarebenefits that vest after 25 years of service.
Members are always fully vested for their own contributions and, after threeyears of service credit, become vested for 2% of related interest earned on thecontributions. In the case of death before retirement, members’ beneficiaries areentitled to full interest credited to the members’ accounts.
Contribution Reguirements The contribution policy is set by N.J.S.A. 43:15Aand N.J.S.A. 18:66, and requires contributions by active members andcontributing employers. Plan member and employer contributions may beamended by State of New Jersey legislation. As of April 1, 2018 employeecontributions rates were increased to 7.50%
59

Freehold Regional High School DistrictNotes to the Financial Statements
For the Fiscal Year Ending June 30. 2021
PENSION PLANS (CONTINUED!NOTE 6:
Employers are required to contribute at an actuarially determined rate in bothTPAF and PERS. The actuarially determined contribution includes funding forcost-of-living adjustments, noncontributory death benefits, and post-retirementmedical premiums. Under current statute the District is a non-contributingemployer of TPAF (i.e., the State of New Jersey makes the employer contributionon behalf of public school districts).
Three Year Trend Information for PERS
AnnualPension Cost
(APC)
Percentageof APC
ContributedNet PensionObligation
Year EndedJune 30,
$2,639,629$2,425,575$2,550,635
$2,639,629$2,425,575$2,550,635
100%100%100%
202120202019
Three Year Trend Information for TPAF (On-Behalf)
Percentageof APC
Contributed
AnnualPension Cost
(APC)Net PensionObligation
Year EndedJune 30,
$21,428,184$16,447,694$14,884,315
100%100%100%
-0-2021-0-2020-0-2019
In accordance with N.J.S.A. 18A:66-66 the State of New Jersey reimbursed theDistrict for the years ended June 30, 2021, 2020 and 2019 $5,654,877,$5,677,663, and $5,606,650, respectively for the employer’s share of socialsecurity contributions for TPAF members, as calculated on their base salaries.
60

Freehold Regional High School DistrictNotes to the Financial Statements
For the Fiscal Year Ending June 30. 2021
NOTE 6: ACCOUNTING AND FINANCIAL REPORTING FOR PENSION - GASB 68
Public Employees Retirement System (PERS)
At June 30, 2021, the District reported a liability of $39,348,657.00 for itsproportionate share of the net pension liability. The net pension liability wasmeasured as of June 30, 2020, and the total pension liability used to calculatethe net pension liability was determined by an actuarial valuation as of July 1,2019 which was rolled forward to June 30, 2020. The District's proportion of thenet pension liability was based on a projection of the District's long-term share ofcontributions to the pension plan relative to the projected contributions of allparticipating members, actuarially determined. At June 30, 2020, the District'sproportion was 0.2412934827 percent, which was an decrease of 0.0080690592percent from its proportion measured as of June 30, 2019.
For the year ended June 30, 2021, the District recognized pension expense of$417,611.00 in the district-wide financial statements. This pension expense wasbased on the pension plans June 30, 2020 measurement date.
At June 30, 2021, the District reported deferred outflows of resources anddeferred inflows of resources related to PERS from the following sources:
DeferredInflow of
Resources
DeferredOutflow ofResources
$139,154$716,474Differences between expected and actual experience
Changes of assumptions
Net difference between projected and actual earningson pension plan investments
Changes in proportion and differences between Districtcontributions and proportionate share of contributions
District contributions subsequent to the measurement date
1,276,515 16,475,655
1,344,969
2,481,677432,912
2,808,275
$6,579,145 $19,096,486
61

Freehold Regional High School DistrictNotes to the Financial Statements
For the Fiscal Year Ending June 30. 2021
ACCOUNTING AND FINANCIAL REPORTING FOR PENSION - GASB 68NOTE 6:(Continued)
Public Employees Retirement System (PERS) (Continued)
The $2,808,275.00 reported as deferred outflows of resources related topensions resulting from school district contributions subsequent to themeasurement date (i.e. for the school year ending June 30, 2021, the planmeasurement date is June 30, 2020) will be recognized as a reduction of the netpension liability in the year ended June 30, 2022.
Other amounts reported as deferred outflows of resources and deferred inflowsof resources related to pensions will be recognized in pension expense asfollows:
Year EndedJune 30 Amount
2021 ($5,347,290)(4,911,286)(2,982,264)(1,450,033)
(634,743)
2022202320242025
($15,325,616)
62

Freehold Regional High School DistrictNotes to the Financial Statements
For the Fiscal Year Ending June 30. 2021
NOTE 6: ACCOUNTING AND FINANCIAL REPORTING FOR PENSION - GASB 68(CONTINUED)
Public Employees Retirement System (PERS) (Continued)
Actuarial Assumptions
The total pension liability for the June 30, 2020 measurement date wasdetermined by an actuarial valuation as of July 1, 2019, which rolled forward toJune 30, 2020. These actuarial valuations used the following assumptions:
June 30, 2019June 30. 2020Inflation rate:
PriceWage
Salary Increases:Through 2026
2.75%3.25%
2.75%3.25%
2.00%-6.00%Based on Years of
Service3.00%-7.00%
Based on Years ofService
2.00%-6.00%Based on Years of
Service3.00%-7.00%
Based on Years ofService
Thereafter
7.00%7.00%Investment Rate of Return
Pre-retirement mortality rates were based on the Pub-2010 General Below-Median Income Employee mortality table with an 82.2% adjustment for malesand 101.4% adjustment for females, and with future improvement from the baseyear of 2010 on a generational basis. Post-retirement mortality rates were basedon the Pub-2010 General Below-Median Income Healthy Retiree mortality tablewith a 91.4% adjustment for males and 99.7% adjustment for females, and withfuture improvement from the base year of 2010 on a generational basis.Disability retirement rates used to value disabled retirees were based on thePub-2010 Non-Safety Disabled Retiree mortality table with a 127.7% adjustmentfor males and 117.2% adjustment for females, and with future improvement fromthe base year of 2010 on a generational basis. Mortality improvement is basedon Scale MP-2020.
The actuarial assumptions used in the July 1, 2019 valuation were based on theresults of an actuarial experience study for the period July 1, 2014 to June 30,2018.
63

Freehold Regional High School DistrictNotes to the Financial Statements
For the Fiscal Year Ending June 30, 2021
NOTE 6: ACCOUNTING AND FINANCIAL REPORTING FOR PENSION - GASB 68(CONTINUED)
Public Employees Retirement System (PERS) (Continued)
Actuarial Assumptions (Continued)
Long-Term Rate of Return
In accordance with State statute, the long-term expected rate of return on planinvestments (7.00% at both June 30, 2020 and June 30, 2019) is determined bythe State Treasurer, after consultation with the Directors of the Division ofInvestment and Division of Pensions and Benefits, the board of trustees and theactuaries. The long-term expected rate of return was determined using a buildingblock method in which best-estimate ranges of expected future real rates ofreturn (expected returns, net of pension plan investment expense and inflation)are developed for each major asset class. These ranges are combined toproduce the long-term expected rate of return by weighting the expected futurereal rates of return by the target asset allocation percentage and by addingexpected inflation. Best estimates of arithmetic rates of return for each majorasset class included in PERS’s target asset allocation as of June 30, 2020 aresummarized in the following table:
Long-TermExpected RealRate of Return
TargetAllocationAssets Class
7.71%8.57%
10.23%11.42%9.73%9.56%5.95%7.59%2.67%0.50%1.94%3.40%
27.00%13.50%5.50%
13.00%3.00%8.00%2.00%8.00%8.00%4.00%5.00%3.00%
U.S. EquityNon-U.S. Developed Market EquityEmerging Market EquityPrivate EquityReal Estate AssetsReal EstateHigh YieldPrivate CreditInvestment Grade CreditCash EquivalentsU.S. TreasuriesRisk Mitigation Strategies
64

Freehold Regional High School DistrictNotes to the Financial Statements
For the Fiscal Year Ending June 30, 2021
NOTE 6: ACCOUNTING AND FINANCIAL REPORTING FOR PENSION - GASB 68(CONTINUED)
Public Employees Retirement System (PERS) (Continued)
Actuarial Assumptions (Continued)
Discount Rate
The discount rate used to measure the total pension liability was 7.00% and6.28% as of June 30, 2020 and June 30, 2019, respectively. The projection ofcash flows used to determine the discount rate assumed that contributions fromplan members will be made at the current member contribution rates and thatcontributions from employers and the nonemployer contributing entity will bebased on 78% of the actuarially determined contributions for the State employerand 100% of actuarially determined contributions for the local employers.
Based on those assumptions, the plan's fiduciary net position was projected to beavailable to make all projected future benefit payments of current plan members.Therefore, the long-term expected rate of return on plan investments was appliedto all projected benefit payments to determine the total pension liability.
Sensitivity of the collective Net Pension Liability to changes in the discountrate
The following presents the District’s proportionate share of the net pensionliability as of June 30, 2020, calculated using the discount rate as disclosedabove as well as what the collective net pension liability would be if it wascalculated using a discount rate that is 1-percentage point lower or 1-percentage-point higher than the current rate
1% At CurrentDiscount Rate
7.00%
1%Decrease
6.00%Increase8.00%
District's proportionate shareof the net pension liability $49,922,896 $39,348,657 $30,948,087
65

Freehold Regional High School DistrictNotes to the Financial Statements
For the Fiscal Year Ending June 30, 2021
ACCOUNTING AND FINANCIAL REPORTING FOR PENSION - GASB 68NOTE 6:(CONTINUED!
Public Employees Retirement System (PERS) (Continued)
Pension Plan Fiduciary Net Position
Detailed information about the pension plan’s fiduciary net position is available inthe separately issued Financial Report for the State of New Jersey PublicEmployees Retirement System (PERS). The report may be obtained at State ofNew Jersey Division of Pensions and Benefits P.O. Box 295 Trenton, NewJersey 08625-0295 http://www.state.ni.us/treasurv/pensions.
Teachers Pensions and Annuity Fund (TPAF)
The employer contributions for local participating employers are legally required to befunded by the State in accordance with N.J.S.A 18:66-33. Therefore, these localparticipating employers are considered to be in a special funding situation as definedby GASB Statement No. 68 and the State is treated as a nonemployer contributingentity. Since the local participating employers do not contribute directly to the plan(except for employer specific financed amounts), there is no net pension liability ordeferred outflows or inflows to report in the financial statements of the localparticipating employers. However, the notes to the financial statements of the localparticipating employers must disclose the portion of the nonemployer contributingentities' total proportionate share of the net pension liability that is associated with thelocal participating employer.
The portion of the TPAF Net Pension Liability that was associated with the Districtrecognized at June 30, 2021 was as follows:
Net Pension Liability:Districts proportionate shareState’s proportionate share
associated with the District
-0-
$485,090,861
$485,090,861
The net pension liability was measured as of June 30, 2020, and the total pensionliability used to calculate the net pension liability was determined by an actuarialvaluation as of June 30, 2019 which was rolled forward to June 30, 2020. The netpension liability associated with the District was based on a projection of the District'slong-term share of contributions to the pension plan relative to the projectedcontributions of all participating school districts and the State, actuarially determined.At June 30, 2020, the proportion of the TPAF net pension liability associated with theDistrict was .7366738416% which was a decrease of .0046037217 percent from itsproportion measured as of June 30, 2019.
66

Freehold Regional High School DistrictNotes to the Financial Statements
For the Fiscal Year Ending June 30. 2021
ACCOUNTING AND FINANCIAL REPORTING FOR PENSION - GASB 68NOTE 6:(CONTINUED)
Teachers Pensions and Annuity Fund (TPAF) (Continued)
For the year ended June 30, 2021, the District recognized on-behaif pensionexpense and revenue of $30,165,015.00 in the government-wide financialstatements for contributions provided by the State. This pension expense andrevenue was based on the pension plans June 30, 2020 measurement date.
The total pension liability for the June 30, 2020 measurement date wasdetermined by an actuarial valuation as of July 1, 2019, which was rolled forwardto June 30, 2020. This actuarial valuation used the following actuarialassumptions, applied to all periods in the measurement:
June 30, 2020 June 30, 2019Inflation rate:
PriceWage
Salary Increases:Through 2026
2.75%3.25%
2.75%3.25%
1.55%-4.45%Based on Years of
Service2.75%-5.65%
Based on Years ofService
1.55%-4.55%Based on Years of
Service2.00%-5.65%
Based on Years ofService
Thereafter
7.00%Investment Rate of Return 7.00%
Mortality Rates
Pre-retirement mortality rates were based on the Pub-2010 Teachers Above-Median Income Employee mortality table with a 93.9% adjustment for males and85.3% adjustment for females, and with future improvement from the base yearof 2010 on a generational basis. Post-retirement mortality rates were based onthe Pub-2010 Teachers Above-Median Income Healthy Retiree mortality tablewith a 114.7% adjustment for males and 99.6% adjustment for females, and withfuture improvement from the base year of 2010 on a generational basis.Disability mortality rates were based on the Pub-2010 Non-Safety DisabledRetiree mortality table with a 106.3% adjustment for males and 100.3%adjustment for females, and with future improvement from the base year of 2010on a generational basis. Mortality improvement is based on Scale MP-2020.
67

Freehold Regional High School DistrictNotes to the Financial Statements
For the Fiscal Year Ending June 30. 2021
ACCOUNTING AND FINANCIAL REPORTING FOR PENSION - GASB 68NOTE 6:(CONTINUED)
Teachers Pensions and Annuity Fund (TPAF) (Continued)
Actuarial Assumptions (Continued)
The actuarial assumptions used in the July 1, 2019 valuation were based on theresults of an actuarial experience study for the period July 1, 2015 to June 30,2018.
Long-Term Expected Rate of Return
The long-term expected rate of return was determined using a building blockmethod in which best-estimate ranges of expected future real rates of return(expected returns, net of pension plan investment expense and inflation) aredeveloped for each major asset class. These ranges are combined to producethe long-term expected rate of return by weighting the expected future real ratesof return by the target asset allocation percentage and by adding expectedinflation. Best estimates of arithmetic real rates of return for each major assetclass included in TPAF's target asset allocation as of June 30, 2020 aresummarized in the following table:
Long-TermExpected RealRate of Return
TargetAllocationAssets Class
7.71%8.57%10.23%11.42%9.73%9.56%5.95%7.59%2.67%0.50%1.94%3.40%
27.00%13.50%5.50%
13.00%3.00%8.00%2.00%8.00%8.00%4.00%5.00%3.00%
U.S. EquityNon-U.S. Developed Market EquityEmerging Market EquityPrivate EquityReal Estate AssetsReal EstateHigh YieldPrivate CreditInvestment Grade CreditCash EquivalentsU.S. TreasuriesRisk Mitigation Strategies
68

Freehold Regional High School DistrictNotes to the Financial Statements
For the Fiscal Year Ending June 30, 2021
ACCOUNTING AND FINANCIAL REPORTING FOR PENSION - GASB 68NOTE 6:(CONTINUED)
Teachers Pensions and Annuity Fund (TPAF) (Continued)
Actuarial Assumptions (Continued)
Discount Rate
The discount rate used to measure the total pension liability was 5.40% and5.60% as of June 30, 2020 and 2019, respectively. This single blended discountrate was based on the long-term expected rate of return on pension planinvestments of 7.00% for both June 30, 2020 and 2019, and a municipalbond rate of 2.21% and 3.50% as of June 30, 2020 and 2019, respectively,based on the Bond Buyer Go 20-Bond Municipal Bond Index which includes tax-exempt general obligation municipal bonds with an average rating of AA/Aa orhigher. The projection of cash flows used to determine the discount rateassumed that contributions from plan members will be made at the currentmember contribution rates and that contributions from employers will be basedon 78% of the actuarially determined contributions for the State. Based on thoseassumptions, the plan's fiduciary net position was projected to be available tomake projected future benefit payments of current plan members through 2062.Therefore, the long-term expected rate of return on plan investments was appliedto projected benefit payments through 2062 and the municipal bond rate wasapplied to projected benefit payments after that date in determining the totalpension liability.
Sensitivity of the Net Pension Liability to Changes in the Discount Rate
Because the District's proportionate share of the net pension liability is zero,consideration of potential changes in the discount rate is not applicable to theDistrict.
Pension Plan Fiduciary Net Position
Detailed information about the pension plan’s fiduciary net position is available inthe separately issued Financial Report for the State of New Jersey TeachersPublic and Annuity Fund (TPAF). The report may be obtained at State of NewJersey Division of Pensions and Benefits P.O. Box 295 Trenton, New Jersey08625-0295 http://www.state.ni.us/treasurv/pensions.
69

Freehold Regional High School DistrictNotes to the Financial Statements
For the Fiscal Year Ending June 30, 2021
NOTE 7: ACCOUNTING AND FINANCIAL REPORTING FOR POST-RETIREMENTBENEFITS OTHER THAN PENSIONS - GASB 75
Plan Description and Benefits Provided
The State Health Benefit Local Education Retired Employees Plan is a multiple-employer defined benefit OPEB plan, which is administered on a pay-as-you-gobasis. Accordingly, no assets are accumulated in a qualifying trust that meets thecriteria in paragraph 4 of GASB Statement No. 75, Accounting and FinancialReporting for Postemployment Benefits Other Than Pensions. The State HealthBenefit Local Education Retired Employees Plan provides medical, prescriptiondrug, and Medicare Part B reimbursement to retirees and their covereddependents of local education employers.
The employer contributions for the participating local education employers arelegally required to be funded by the State of New Jersey in accordance withN.J.S.A 52:14-17.32f. Therefore, these local participating employers areconsidered to be in a special funding situation as defined by GASB StatementNo. 75 and the State is treated as a nonemployer contributing entity. Accordingto N.J.S.A 52:14-17.32f, the State provides employer-paid coverage toemployees who retire from a board of education or county college with 25 yearsor more of service credit in, or retires on a disability pension from, one or more ofthe following plans: the Teachers' Pension and Annuity Fund (TPAF), the PublicEmployees' Retirement System (PERS), the Police and Firemen RetirementSystem (PFRS), or the Alternate Benefit Program (ABP). Pursuant to Chapter 78,P.L, 2011, future retirees eligible for postretirement medical coverage who haveless than 20 years of creditable service on June 28, 2011 will be required to paya percentage of the cost of their health care coverage in retirement provided theyretire with 25 or more years of pension service credit. The percentage of thepremium for which the retiree will be responsible will be determined based on theretiree’s annual retirement benefit and level of coverage.
Employees Covered by Benefit Terms
The State Health Benefit Local Education Retired Employees Plan Membershipcovered by the benefit terms consisted of the following:
Active Plan MembersInactive Plan Members or BeneficiariesCurrently Receiving Benefits
Inactive Plan Members or BeneficiariesNot Yet Receiving BenefitsTotal Plan Members
216,804
149,304
- 0 -366.108
70

Freehold Regional High School DistrictNotes to the Financial Statements
For the Fiscal Year Ending June 30. 2021
NOTE 7: ACCOUNTING AND FINANCIAL REPORTING FOR POST-RETIREMENTBENEFITS OTHER THAN PENSIONS - GASB 75 (CONTINUED!Total Non-Employer OPEB Liability
The portion of the total Non-Employer OPEB Liability that was associated withthe District at June 30, 2021 was as follows:
Total OPEB Liability:District's Proportionate ShareState's Proportionate Share associated
with the District
$-0-
435,781,480
$435,781,480
The total Non-Employer OPEB liability as of June 30, 2020 was determined byan actuarial valuation as of June 30, 2019, which was rolled forward to June 30,2020.
The total Non-Employer OPEB liability was determined separately based onactual data of the District.
For the year ended June 30, 2021, the District recognized on-behalf post-employment expense and revenue of $20,697,245 in the government-widefinancial statements for contributions provided by the State. This expense andrevenue was based on the plans June 30, 2020 measurement date.
At June 30, 2020, the District's proportion was .6426511138 percent, which wasa decrease of .0062321978 from its proportion measured as of June 30, 2019.
The State, a nonemployer contributing entity, is the only entity that has a legalobligation to make employer contributions to OPEB for qualified retired PERS,TPAF/ABP and PFRS participants. The District’s proportionate share percentagedetermined under paragraphs 193 and 203 through 205 of GASBS No. 75 is zeropercent. Consequently, the District did not recognize any portion of the collectiveNon-Employer OPEB liability on the Statement of Net Position.
71

Freehold Regional High School DistrictNotes to the Financial Statements
For the Fiscal Year Ending June 30, 2021
NOTE 7: ACCOUNTING AND FINANCIAL REPORTING FOR POST-RETIREMENTBENEFITS OTHER THAN PENSIONS - GASB 75 (CONTINUED)
Actuarial Assumptions and Other Inputs
The total Non-Employer OPEB liability that was associated with the District as ofJune 30, 2020 was determined by an actuarial valuation as of June 30, 2019,which was rolled forward to June 30, 2020.The actuarial assumptions vary foreach plan member depending on the pension plan the member is enrolled in.This actuarial valuation used the following actuarial assumptions, applied to allperiods in the measurement:
June 30. 2020
TPAF/ABP PERS PFRS
Inflation - 2.5%
Salary Increases
Through 2026 1.55-4.45%* 2.00-6.00%* 3.25-15.25%*
Thereafter 1.55-4.45%* 3.00-7.00%* Applied toAll Future Years
June 30, 2019
PFRSPERSTPAF/ABP
CPI - 2.5%
Salary Increases
Through 2026 1.55-3.05%* 2.00-6.00%* 3.25-15.25%*
1.55-3.05%* 3.00-7.00%* Applied toAll Future Years
Thereafter
*- Based on Years of Service
Preretirement mortality rates were based on the Pub-2010 Healthy "Teachers"(TPAF/ABP), "General" (PERS), and "Safety" (PFRS) classification headcount-weighted mortality table with fully generational mortality improvement projectionsfrom the central year using Scale MP-2020. Postretirement mortality rates werebased on the Pub-2010 "General" classification headcount-weighted mortalitytable with fully generational mortality improvement projections from the centralyear using Scale MP-2020. Disability mortality was based on the Pub-2010"General" classification headcount-weighted disabled mortality table with fullygenerational mortality improvement projections from the central year using ScaleMP-2020.
72

Freehold Regional High School DistrictNotes to the Financial Statements
For the Fiscal Year Ending June 30, 2021
NOTE 7: ACCOUNTING AND FINANCIAL REPORTING FOR POST-RETIREMENTBENEFITS OTHER THAN PENSIONS - GASB 75 (CONTINUED!
Actuarial Assumptions and Other Input (Continued!The actuarial assumptions used in the June 30, 2019 valuation were based onthe results of actuarial experience studies for the periods July 1, 2015— June 30,2018, July 1, 2014 — June 30, 2018, and July 1, 2013 - June 30, 2018 for TPAF,PERS and PFRS, respectively.Health Care Trend Assumptions
For pre-Medicare medical benefits, the trend rate is initially 5.6% and decreasesto a 4.5% long-term trend rate after seven years. For post-65 medical benefits,the actual fully-insured Medicare Advantage trend rates for fiscal year 2021through 2022 are reflected. The assumed post-65 medical trend is 4.5% for allfuture years. For prescription drug benefits, the initial trend rate is 7.0% anddecreases to a 4.5% long-term trend rate after seven years. For the MedicarePart B reimbursement, the trend rate is 5.0%.
Discount Rate
The discount rate for June 30, 2020 and June 30, 2019 was 2.21% and 3.50%respectively. This represents the municipal bond return rate as chosen by theDivision. The source is the Bond Buyer Go 20-Bond Municipal Bond index, whichincludes tax-exempt general obligation municipal bonds with an average rating ofAA/Aa or higher. As the long-term rate of return is less than the municipal bondrate, it is not considered in the calculation of the discount rate, rather the discountrate is set at the municipal bond rate.
73

Freehold Regional High School DistrictNotes to the Financial Statements
For the Fiscal Year Ending June 30, 2021
NOTE 7: ACCOUNTING AND FINANCIAL REPORTING FOR POST-RETIREMENTBENEFITS OTHER THAN PENSIONS - GASB 75 (CONTINUED)
Changes in the Total Non-Emplover OPEB Liability
Shown below are details regarding The Total OPEB non-empioyer Liabilityassociated with the District for the measurement period from June 30, 2019 toJune 30, 2020.
Balance at 6/30/19 $270,773,043
Changes for the year:Service costInterestDifferences between expected
and actual experienceChanges in assumptions or
other inputsMembership ContributionsBenefit payments - Net
Net changes
10,822,0329,728,193
72,212,559
79,602,301229,949
(7,586,597)165,008,437
$435,781,480Balance at 6/30/20
Sensitivity of the Total Non-Emplover OPEB Liability to Changes in theDiscount Rate
The following presents the total Non-Employer OPEB liability associated with theDistrict as of June 30, 2020, calculated using the discount rate as disclosedabove as well as what the total Non-Employer OPEB liability would be if it wascalculated using a discount rate that is 1 -percentage point lower or 1-percentagepoint higher than the current rate:
June 30, 20201.00%
Increase (3.21%)At Discount1.00%
Decrease (1.21%) Rate (2.21%)State of New Jersey's
Proportionate Share ofthe total Non-EmployerOPEB Liability associatedwith the District $365,741,998$435,781,480$525,357,067
74

Freehold Regional High School DistrictNotes to the Financial Statements
For the Fiscal Year Ending June 30. 2021
NOTE 7: ACCOUNTING AND FINANCIAL REPORTING FOR POST-RETIREMENTBENEFITS OTHER THAN PENSIONS - GASB 75 (CONTINUED)
Sensitivity of the Total Non-Emplover OPEB Liability to Changes inHealthcare Trends
The following presents the total Non-Employer OPEB liability associated with theDistrict as of June 30, 2020, calculated using the healthcare trend rate asdisclosed above as well as what the total Non-Employer OPEB liability would beif it was calculated using a healthcare trend rate that is 1- percentage point loweror 1-percentage point higher than the current rate:
June 30, 20201.00%
Decrease1.00%
IncreaseHealthcare Cost
Trend RateState of New Jersey’s
Proportionate Share ofthe total Non-EmployerOPEB Liability associatedwith the District $535,811,542$351,777,506 $435,781,480
OPEB Expense and Deferred Outflows of Resources and Deferred Inflowsof Resources Related to Non-Emplover OPEB Liability
At June 30, 2020, the State reported deferred outflows of resources and deferredinflows of resources related to retired school employee's Non-Employer OPEBLiability associated with the District from the following sources:
DeferredInflow of
Resources
DeferredOutflow ofResources
Differences between expectedand actual experience
Changes of assumptions
Changes in proportion
58,935,62966,162,981 $$
49,725,13574,124,994
3,743,6442,761,750
112,404,408143,049,725 $$
75

Freehold Regional High School DistrictNotes to the Financial Statements
For the Fiscal Year Ending June 30. 2021
NOTE 7: ACCOUNTING AND FINANCIAL REPORTING FOR POST-RETIREMENTBENEFITS OTHER THAN PENSIONS - GASB 75 fCONTINUED)
OPEB Expense and Deferred Outflows of Resources and Deferred Inflowsof Resources Related to Non-Employer OPEB Liability (Continued!
Amounts reported as deferred outflows of resources and deferred inflows ofresources related to the State’s proportionate share of the total Non-EmployerOPEB Liability associated with the District will be recognized in OPEB expenseas follows:
MeasurementPeriod Ended
June 30, Amount
2021 $82,791$82,791$82,791$82,791$82,791
$30,231,361
2022202320242025
Total Thereafter
$30,645,317
In accordance with GASBS No. 75, the District’s proportionate share of schoolretirees OPEB is zero. There is no recognition of the allocation of proportionateshare of deferred outflows of resources and deferred inflows of resources in thefinancial statements.
State Health Benefit Local Education Retired Employee Plan Information
The New Jersey Division of Pension and Benefits issues publicly availablereports on the OPEB plan. Those reports may be obtained by writing to theDivision of Pension and Benefits, PO Box 295, Trenton, NJ 08625-0295 or ontheir website at http://www.state.ni.us/treasurv/pensions/financial-reports.shtml
76

Freehold Regional High School DistrictNotes to the Financial Statements
For the Fiscal Year Ending June 30. 2021
NOTE 8: LITIGATION
The District's counsel advises that there is no litigation, pending litigation, claims,contingent liabilities, unasserted claims or assessments or statutory violationswhich involve the School District and which might materially affect the District'sfinancial position with the exception of the following:
MON-L-Q02968-2Q This matter involves potential claims against the District foralleged actions that occurred during the 1985-1986 school year. It should benoted that this claim was brought pursuant to the recently enacted legislation inthe State of New Jersey that provides a window for certain claims that werepreviously time barred to now be brought. The Board has located it’s insurancecarrier from that time period and has secured a defense and coverage from thatcarrier.
CONTINGENCIESNOTE 9:
The District receives financial assistance from the State of New Jersey and theU.S. Government in the form of grants. Entitlement to the funds is generallyconditional upon compliance with terms and conditions of the grant agreementsand applicable regulations, including the expenditure of the funds for eligiblepurposes. The State and Federal grants received and expended in the 2020-2021 fiscal year were subject to the Uniform Guidance and New Jersey OMBCircular 15-08 which mandates that grant revenues and expenditures be auditedin conjunction with the District's annual audit if expenditures for federal or stateprograms exceed $750,000. Findings and questioned costs, if any, relative tofederal and state financial assistance programs are discussed in the Single AuditSection, Schedule of Findings and Questioned Costs. In addition, all grants andcost reimbursements are subject to financial and compliance audits by thegrantors. The District’s management does not believe any such audit wouldresult in material amounts of disallowed costs.
NOTE 10: RISK MANAGEMENT
The District is exposed to various risks of loss related to torts; theft of, damageto, and destruction of assets; errors and omissions; injuries to employees; andnatural disasters.
Property and Liability Insurance - The District maintains insurance coveragecovering each of those risks of loss. The administration believes such coverageis sufficient to preclude any significant uninsured losses to the District. Settledclaims have not exceeded the insurance coverage in any of the past three fiscalyears.
77

Freehold Regional High School DistrictNotes to the Financial Statements
For the Fiscal Year Ending June 30. 2021
RISK MANAGEMENT (CONTINUED)NOTE 10:
New Jersey Unemployment Compensation Insurance - The District haselected to fund its New Jersey Unemployment Compensation Insurance underthe "Benefit Reimbursement Method". Under this plan, the District is required toreimburse the New Jersey Unemployment Trust Fund for benefits paid to itsformer employees and charged to its account with the State. The District is billedquarterly for amounts due to the State. Charges are applied to theUnemployment Compensation Claims Payable first, and any remaining chargesare applied to the Unemployment Compensation budget appropriation. Thefollowing is a summary of District contributions, employee contributions,reimbursements to the State for benefits paid, and the ending balance of theDistrict's unemployment trust fund for the current and previous two years:
Analysis of Balance 06/30/21Ending State Unemployment RestrictedBalance Insurance Payable Fund Balance
$47,562 $1,072,680
Year EndedJune 30,
EmployeeContributions
AmountReimbursedInterest
$ 382 $7,6206,220
396,083 $298,770234,375
2021 443,263 $309,879249,508
1,120,2421,072,6801,053,951
N/A N/A2020N/A2019 N/A
Workers' Compensation Insurance - The Board is self-insured for workers'compensation insurance. Claims are managed by PMA Management Corp.through a service agreement for which competitive proposals were sought. Thefinancial statements reflect the current expenses of the program as well as anaccrued liability for future claims against the current fiscal year. At June 30,2021, the amount was $3,420,000.
Health Benefits - The District provides health benefits to employees through aminimum premium insurance policy administered by Horizon Blue Cross BlueShield of New Jersey (“Horizon”). The incurred but not reported liability (“IBNR”)actuarially computed by Horizon was $4,400,000 at June 30, 2021. It was alsonoted that the entire IBNR is adjusted for changes in estimate at year end andsuch changes are reflected in the district’s budget and the entire liability istreated as a liability for budgetary purposes.
78

Freehold Regional High School DistrictNotes to the Financial Statements
For the Fiscal Year Ending June 30. 2021
NOTE 11: COMPENSATED ABSENCES
The District accounts for compensated absences (e.g., unused vacation and sickleave) as directed by Governmental Accounting Standards Board Statement No.16 (GASB 16), "Accounting for Compensated Absences". A liability forcompensated absences attributable to services already rendered and notcontingent on a specific event that is outside the control of the employer andemployee is accrued as employees earn the rights to the benefits.
District employees are granted varying amounts of vacation and sick leave inaccordance with the District's personnel policy. Upon termination, employees arepaid for accrued vacation. The District's policy permits employees to accumulateunused sick leave and carry forward the amount to subsequent years. Uponretirement, employees shall be paid by the District for the unused sick leave inaccordance with the Districts agreements with the various employee unions.
The liability for vested compensated absences of the governmental fund typesare recorded in the district - wide statement of net assets. As of June 30, 2021, aliability existed for compensated absences for governmental fund-types in thedistrict- wide Statement of Net Position in the amount of $3,294,742.
For additional descriptive information see Note 1, Summary of SignificantAccounting Policies.
79

Freehold Regional High School DistrictNotes to the Financial Statements
For the Fiscal Year Ending June 30. 2021
NOTE 12: FUND BALANCE APPROPRIATED
General Fund The table below reflects the District’s Fund Balance at June 30,2021 on both a GAAP (Exhibit B-1) and Budgetary (Exhibit C-1) basis includingthe required adjustment related to the last state aid payment which under GAAP isnot recognized:
GAAPBasis
BudgetaryBasis Adjustment
Restricted:Designated for Subsequent
Year's Expenditures:Excess Surplus
Excess Surplus Current YearMaintenance ReserveCapital ReserveEmergency ReserveSEMI FFCRAState Unemployment Insurance
Assigned:Designated for Subsequent
Year's Expenditures:Encumbrances
Unassigned
14,505,87013,303,7661,519,8446,021,951
8,30212,068
1,072,680
$14,505,870 $13,303,7661,519,8446,021,951
8,30212,068
1,072,680
$
1,982,205526,439
4,554,755
1,982,205526,439
8,516,414 (3,961,659)
43,507,880(3,961,659) $47,469,539 $$
80

Freehold Regional High School DistrictNotes to the Financial Statements
For the Fiscal Year Ending June 30. 2021
NOTE 13: CALCULATION OF EXCESS SURPLUS- BUDGETARY BASIS
Calculation of Excess Surplus In accordance with N.J.S.A. 18A:7F-7, as amendedby P.L. 2007, c73 (S1701), the Restricted Fund Balance- Excess Surplus is arequired calculation pursuant to the New Jersey Comprehensive EducationalImprovement and Financing Act of 1996 (CEIFA). New Jersey school districts arerequired to reserve General Fund balance at the fiscal year end of June 30 if theDistrict did not appropriate a required minimum amount as budgeted fund balance inthe subsequent year’s budget.
General Fund Expenditures:Fiscal Year Ended, June 30, 2021
Increased by:Transfer from Capital Outlay to Capital Projects
$ 212,343,372
250,000212,593,372
Less:Reimb. TPAF Social Security ContributionsReimb. TPAF Pension Contributions
$ 5,654,87728,153,084
33,807,961Adjusted General Fund ExpendituresExcess Surplus Percentage
178,785,4114.00%
7,151,416Increased by:Non-Public Transportation Aid (unbudgeted)Extraordinary Aid (unbudgeted)
189,7901,175,208
1,364,998Maximum Unreserved/UndesignatedGeneral Fund Balance
Actual Unassigned - General Fund Balance
8,516,414
21,820,180
$ 13,303,766Excess Surplus
Recapitulation of Excess Surplus, June 30, 2021:Restricted for Excess Surplus - Designated for
Subsequent Year's ExpenditureRestricted for Excess Surplus
$ 14,505,87013,303,766
27,809,636$
As of June 30, 2021, $14,505,870 is reported as Restricted Fund Balance ExcessSurplus Designated for Subsequent Year’s Expenditure and is required to beappropriated for property tax relief in the 2021-22 budget. $13,303,766 is reported asRestricted Fund Balance Excess Surplus and is required to be appropriated forproperty tax relief in the 2022-23 budget.
81

Freehold Regional High School DistrictNotes to the Financial Statements
For the Fiscal Year Ending June 30. 2021
NOTE 14: INTERFUND RECEIVABLES AND PAYABLES
The following interfund balances remained on the balance sheet at June 30, 2021:
Interfund BalanceFund Receivable Payable
General FundSpecial Revenue FundCapital Projects FundProprietary Funds
$ 3,251,525 $ 3,226,598162,879
3,606134,346
$ 3,389,477 $ 3,389,477
All balances resulted from the time lag between the dates that short-term loanswere disbursed and payments between funds were received.
NOTE 15: CAPITAL RESERVE ACCOUNT
A capital reserve account was established by the Freehold Regional High SchoolDistrict Board of Education for the accumulation of funds for use as capital outlayexpenditures in subsequent fiscal years. The capital reserve account ismaintained in the general fund and its activity is included in the general fundannual budget.
Funds placed in the capital reserve account are restricted to capital projects inthe district’s approved Long Range Facilities Plan (LRFP). Upon submission ofthe LRFP to the Department of Education, a district may increase the balance inthe capital reserve by appropriating funds in the annual general fund budgetcertified for taxes or by transfer by Board resolution at year end (June 1 to June30) of any unanticipated revenue or unexpended line item appropriations, orboth. A district may also appropriate additional amounts when the expressapproval of the voters has been obtained by either a separate proposal at budgettime or by a special question at one of the four special election dates authorizedby N.J.S.A. 19:60-2. Pursuant to N.J.A.C. 6A:23A-14.1(g), the balance in theaccount cannot at any time exceed the local support costs of uncompleted capitalprojects in its approved LRFP.
82

Freehold Regional High School DistrictNotes to the Financial Statements
For the Fiscal Year Ending June 30. 2021
NOTE 15: CAPITAL RESERVE ACCOUNT (CONTINUED)
The activity of the capital reserve for the July 1, 2020 to June 30, 2021 fiscal yearis as follows:
$ 7,335,861Balance, July 1, 2020
Increased by:Transfer from Capital Projects - cancel balance of ESIPCancel balance of Gym Floor Replacement ProjectInterest
$ 271,298412,500
2,292686,090
8,021,951Decreased by:Budgeted Withdrawal of Capital Reserve
Gym Floor Replacement 2,000,000
2,000,000
$ 6,021,951Balance, June 30, 2021
83

Freehold Regional High School DistrictNotes to the Financial Statements
For the Fiscal Year Ending June 30. 2021
NOTE 16: EMERGENCY RESERVE ACCOUNT
In accordance with N.J.S.A. 18A:7F-41c(1), an emergency reserve account wasestablished by the District. The emergency reserve account is maintained in thegeneral fund.
The funds in the reserve shall be used to finance unanticipated general fundcurrent expense costs required for T&E. For the purpose of the emergencyreserve account “unanticipated” shall mean reasonably unforeseeable and shallnot include additional costs caused by poor planning or error.
The account balance is not to exceed $250,000 or one percent of the district’sgeneral fund budget up to a maximum of $1,000,000 whichever is greater.Withdrawals require approval by the Commissioner.
At June 30, 2021, the balance of the Emergency Reserve Account was $8,302and is within the statutory limitations.
The activity of the emergency reserve for the July 1, 2020 to June 30, 2021 fiscalyear is as follows:
258,191$Balance, July 1, 2020
Increased by:Interest 111
258,302Decreased by:
Withdrawal to supplement School Security Grant 250,000
8,302$Balance, June 30, 2021
84

Freehold Regional High School DistrictNotes to the Financial Statements
For the Fiscal Year Ending June 30, 2021
NOTE 17: MAINTENANCE RESERVE ACCOUNT
In accordance with N.J.S.A. 18A:7G-13, a Maintenance reserve account wasestablished by the District. The Maintenance reserve account is maintained inthe general fund.
A district board of education or board of school estimate, as appropriate, mayincrease the balance in the maintenance reserve account by appropriating fundsin the annual general fund budget certified for taxes.
A district board of education or board of school estimate, as appropriate, may byresolution withdraw such funds from the maintenance reserve account andappropriate into the required maintenance account lines at budget time or anytime during the year for use on required maintenance activities for a schoolfacility as reported in the comprehensive maintenance plan pursuant to N.J.A.C.6A:26A-4.
The district board of education shall ensure that the maintenance reserveaccount balance does not, at any time, exceed four percent of the replacementcost of the school district’s school facilities for the current year. If the accountexceeds this maximum amount at June 30, the district board of education shallreserve and designate such excess in the subsequent year’s budget.
At June 30, 2021, the balance of the Maintenance Reserve Account was$1,519,844 and is within the statutory limitations.
The activity of the emergency reserve for the July 1, 2020 to June 30, 2021,fiscal year is as follows:
$ 1,519,191Balance, July 1, 2020
Increased by:Cancellation of withdrawal to supplement SchoolSecurity GrantInterest
$ 492,797653
493,450Decreased by:
Withdrawal to supplement School Security Grant 492,797
$ 1,519,844Balance, June 30, 2021
85

Freehold Regional High School DistrictNotes to the Financial Statements
For the Fiscal Year Ending June 30, 2021
NOTE 18: INVENTORY
Inventory in the Food Service Fund at June 30, 2021 consisted of the following:
Food and Supplies
The value of Federal donated commodities as reflected on Schedule A (requiredby the Single Audit Amendments of 1996) is the difference between market valueand cost of the commodities at the date of purchase and has been included asan item of non-operating revenue in the financial statements.
$40 573
NOTE 19: TAX ABATEMENTS
As defined by the Governmental Accounting Standards Board (GASB), a taxabatement is an agreement between a government and an individual or entity inwhich the government promises to forgo tax revenues and the individual or entitypromises to subsequently take a specific action that contributes to economicdevelopment or otherwise benefits the government or its citizens. School districtsare not authorized by New Jersey statute to enter into tax abatementagreements. However, the county or municipality in which the school district issituated may have entered into tax abatement agreements, and that potentialmust be disclosed in these financial statements. If the county or municipalityentered into tax abatement agreements, those agreements will not directly affectthe school district’s local tax revenue because N.J.S.A. 54:4-75 and N.J.S.A.54:4-76 require that amounts so forgiven must effectively be recouped from othertaxpayers and remitted to the school district.
The District has identified tax abatement agreements that have been entered intothat require disclosure under this statement. The gross dollar amount, on anaccrual basis, by which the District’s property tax revenues were potentiallyreduced during the reporting period as a result of tax abatement agreementstotaled $624,713.44. It is important to note that the District Tax Levy isguaranteed to be paid in full by the municipalities and that the District collectedits full tax levy for FY2021.
86

Freehold Regional High School DistrictNotes to the Financial Statements
For the Fiscal Year Ending June 30. 2021
NOTE 20: PRIOR PERIOD ADJUSTMENTS
As of July 1, 2020 the District implemented GASB Statement No. 84 FiduciaryActivities (GASB 84). Certain agency funds previously accounted for activitiesthat are not considered fiduciary in nature and are now reported in theGovernmental Funds. The District restated the net position and fund balance ofthe funds indicated below to appropriately reflect the June 30, 2020 balances asfollows:
District-Wide Financial Statements:Governmental
Activities$66,801,831Beginning Net Position 06/30/20
Adjustments:Unemployment CompensationStudent Activity Fund BalanceScholarship
Beginning Net Position06/30/20 (As restated)
1,072,6801,134,471
832,079
$69,841,061
Special RevenueFund
Fund Financial Statements:Fiduciary Fund
$1,904,759General Fund
$33,624,378Fund Balance 06/30/20
Adjustments:Unemployment Compensation FundStudent ActivitiesScholarships
(1,072,680)1,072,6801,134,471
832,079 (832,079)
$1,966,550$34,697,058 -0-Fund Balance 06/30/20 (As restated)
Fiduciary Fund$4,765,614Liabilities Balance 06/30/20
(66,166)(34,559)
(3,530,418)(1,134,471)
Accounts payableInterfund payablePayroll deductions and withholdingsDue to student groups
Liabilities 06/30/20 (As restated) $-0-
87

Freehold Regional High School DistrictNotes to the Financial Statements
For the Fiscal Year Ending June 30, 2021
NOTE 20: SUBSEQUENT EVENTS
The Board of Education has evaluated subsequent events occurring after thefinancial statement date through February 1, 2022 which is the date the financialstatements were available to be issued. The District has determined that thefollowing subsequent events require disclosure:
Bond Referendum
On November 2, 2021 the Freehold Regional High School District communitypassed a $14,460,000 bond referendum that will pay for critical roofing andpaving infrastructure projects. On December 21, 2021, the District issued SchoolBonds in the same amount to finance these projects. The interest rate is variableand ranges from .05% to 2.125%. The bonds are payable annually, beginningAugust 15, 2022 and ending August 15, 2041. Principal payments range from$490,000 to $930,000.
Lease Agreement
On July 14, 2021, the District entered into a lease agreement in the amount of$2,160,000 for the purchase of nineteen school buses with security cameras,various technology items and buildings and grounds equipment. The lease is fora term of five years with an interest rate of 1.019%.
American Recovery Plan
Freehold Regional High School District was awarded a total of $5,904,476 underthe American Rescue Plan Act of 2021- Elementary and Secondary SchoolsEmergency Relief Fund (ARP-ESSER) Grant and Subgrants. Grant allocationswere as follows: ARP ESSER $4,940,706; Accelerated Learning Coaching andEducator Support Grant $808,522; Evidence-Based Summer Learning andEnrichment Activities Grant $55,124; Evidence-Based Comprehensive Beyondthe School Day Activities Grant $55,124; and, the NJTSS Mental Health SupportStaffing Grant $45,000. These grants will be expended through September of2023.
Stabilization Aid
The District applied for and was awarded $1,922,264 in Stabilization Aid from theNew Jersey Department of Education. The District originally applied for$4,805,659 to be used for priority 1 and priority 2 capital project expenditures butwas only awarded 40% of that amount with the NJDOE stating this is comparableto the amount of state share of a capital expenditure under the EducationalFacilities and Construction Financing Act. These funds are to be used for capitalneeds only.
88

REQUIRED SUPPLEMENTARY INFORMATION - PART II
89

BUDGETARY COMPARISON SCHEDULES
90

EXH
IBIT
”C-r
SHEE
T# 1
FREE
HO
LDR
EGIO
NAL
HIG
HSC
HO
OL
DIS
TRIC
TG
ENER
ALFU
NDCO
MPA
RATI
VEST
ATEM
ENTS
OF
REVE
NUES
.EXP
END
ITU
RES
AND
CHAN
GES
INFU
ND
BALA
NC
E- B
UDG
ETAN
DAC
TUAL
FOR
THE
FISC
ALYE
AREN
DED
JUN
E30
.202
1
VARI
ANCE
FAVO
RABL
E/( U
NFA
VOR
ABLE
)O
RIG
INAL
BUDG
ETBU
DG
ETTR
ANSF
ERS
FINA
LBU
DG
ETAC
TUAL
REV
ENU
ESLo
cals
ourc
es:
Loca
lTax
Levy
Tuitio
nfro
mIn
divi
dual
sTu
ition
from
LEA '
sW
ithin
Stat
eTu
ition
from
Oth
erG
over
nmen
tSou
rces
With
inSt
ate
Tuiti
onfro
mO
ther
LEA'
sO
utsi
deth
eSt
ate
Tran
spor
tatio
nU
nres
trict
edM
iscel
lane
ous
Reve
nue
Inte
rest
Earn
edon
Emer
genc
yRe
serv
eIn
tere
stEa
rned
onM
aint
enan
ceRe
serv
eIn
tere
stEa
rned
onC
apita
l Res
erve
Fund
sO
ther
Res
trict
edM
isce
llane
ous
Rev
enue
$14
0,37
9,30
8$
50, 0
00$
140,
379,
308
$50
, 000
140,
379,
308
$5,
027
3,71
275
,890
61, 1
5975
, 536
73, 5
55
( 44,
973)
3,71
275
, 890
61, 1
5975
, 536
( 76.
445)
150,
000
1,00
04,
000
5,00
01,
793,
494
150,
000
1,00
04 ,
000
5,00
01,
793,
494
111
( 889
)65
3( 3
,347
)( 2
, 708
)( 1
, 593
, 025
)
CD2,
292
200,
469
142,
382,
802
Tota
l -lo
cals
ourc
es14
2,38
2 ,80
214
0,87
7,71
2( 1
, 505
, 090
)
Stat
eso
urce
s:Eq
ualiz
atio
nAi
dCa
tego
rical
Tran
spor
tatio
nAi
dC
ateg
oric
alSp
ecia
l Edu
catio
nAi
dS
ecur
ityAi
dO
ther
Stat
eAi
dsO
utof
Cap
Ext
raor
dina
ryAi
dO
n -beh
alf T
PAF
Pens
ion
( non
-budg
eted
)O
n -beh
alf T
PAF
Post
Ret
irem
ent C
ontri
butio
ns( n
on-bu
dget
ed)
On -b
ehal
fTPA
FLo
ng-Te
rmD
isab
ility
Insu
ranc
eCo
ntrib
utio
ns( n
on-b
udge
ted)
Rei
mbu
rsed
TPAF
Soci
alSe
curit
yCo
ntrib
utio
ns( n
on-bu
dget
ed)
31,1
50, 5
311 ,
816,
395
7,03
0,18
573
5,59
4
31, 1
50, 5
311,
816,
395
7,03
0,18
573
5,59
4
31, 1
50, 5
311,
816,
395
7,03
0,18
573
5 ,59
418
9,79
03 ,
775,
208
21, 4
28, 1
846 ,
715,
259
9,64
15,
654 ,
877
189,
790
1,17
5,20
821
, 428
, 184
6 ,71
5,25
99,
641
5,65
4 ,87
7
2,60
0,00
02,
600,
000
Tota
l -st
ate
sour
ces
43, 3
32, 7
0543
, 332
, 705
78, 5
05, 6
6435
, 172
, 959
Fede
rals
ourc
es:
Med
icai
dre
imbu
rsem
ent
FFC
RA/
SEM
ITo
tal -f
eder
also
urce
s
138,
344
138,
344
115,
899
12, 0
68( 2
2,44
5)12
, 068
138,
344
138,
344
127,
967
( 10,
377 )
185,
853,
851
185,
853,
851
219,
511,
343
Tota
lrev
enue
s33
, 657
, 492

EXHI
BIT
"C-r
SHEE
T# 2
FREE
HO
LDR
EGIO
NAL
HIG
HSC
HO
OL
DIS
TRIC
TG
ENER
ALFU
NDC
OM
PAR
ATIV
EST
ATEM
ENTS
OF
REV
ENU
ES.E
XPEN
DIT
UR
ESAN
DC
HAN
GES
INFU
ND
BALA
NC
E-B
UD
GET
AND
ACTU
ALFO
RTH
EFI
SCAL
YEAR
ENDE
DJU
NE30
.202
1
VAR
IAN
CE
FAVO
RABL
E/( U
NFA
VOR
ABLE
)O
RIG
INAL
BUD
GET
BUDG
ETTR
ANSF
ERS
FIN
ALB
UD
GE
TAC
TUAL
EXPE
ND
ITU
RES
CURR
ENT
EXPE
NSE
:In
stru
ctio
n-r
egul
arpr
ogra
ms :
Sala
ries
ofte
ache
rs:
Gra
des
9 -12
52, 8
57, 1
56$
52, 8
55, 2
79$
$51
, 808
, 639
$1,
048,
517
$1,
877
52, 8
55, 2
791,
877
Tota
l Sal
arie
sof
teac
hers:
51, 8
08, 6
391,
048,
517
52, 8
57, 1
56
Reg
ular
Prog
ram
s-H
ome
Inst
ruct
ion :
Sala
ries
ofte
ache
rsPu
rcha
sed
prof
essi
onal
educ
atio
nals
ervic
es19
0,00
080
, 000
190 ,
000
10, 9
4882
, 880
6,42
810
7,12
04 ,
520
CD NO( 6
9 ,05
2)
Tota
lReg
ular
Prog
ram
s-Ho
me
Inst
ruct
ion:
200,
948
89, 3
0811
1,64
027
0,00
0( 6
9,05
2)
Reg
ular
prog
ram
s-u
ndist
ribut
edin
stru
ctio
n:Pu
rcha
sed
prof
essi
onal
educ
atio
nal s
ervi
ces
Purc
hase
dte
chni
cals
ervic
esO
ther
purc
hase
dse
rvic
es( 4
00-50
0se
ries)
Gen
eral
supp
lies
Text
book
sO
ther
Obj
ects
1,50
013
2,99
117
5,59
312
1,35
673
,617
11, 9
47
( 300
)4 ,
700
244,
434
525.
684
1,74
4 ,417
228.6
8517
, 086
3,20
011
1,44
335
0,09
11,
623,
061
155,
068
5,13
9
5,00
025
0,30
659
9 ,19
31,
501,
229
258,
943
17, 7
66
( 5, 8
72)
( 73,
509)
243,
188
( 30,
258 )
( 680
)
2,24
8 ,00
2To
talR
egul
arpr
ogra
ms
-und
istrib
uted
inst
ruct
ion
2, 632
,437
132,
569
2,76
5, 006
517,
004
1,11
2,03
455
, 823
, 110
55, 1
92, 5
8963
0,52
1To
talR
egul
arPr
ogra
ms
-Inst
ruct
ion
54, 7
11, 0
76

EXH
IBIT
"C-1 "
SHEE
T#3
FREE
HO
LDR
EGIO
NAL
HIG
HSC
HO
OL
DIS
TRIC
TG
ENER
ALFU
ND
CO
MPA
RAT
IVE
STAT
EMEN
TSO
FR
EVEN
UES
.EXP
ENDI
TURE
SAN
DC
HAN
GES
INFU
ND
BALA
NC
E-B
UD
GET
AND
ACTU
ALFO
RTH
EFI
SCAL
YEAR
END
EDJU
NE
30.2
021
VAR
IAN
CE
FAVO
RABL
E/( U
NFA
VOR
ABLE
)O
RIG
INAL
BUD
GET
BUD
GET
TRAN
SFER
SFI
NAL
BUD
GET
ACTU
ALSp
ecia
l edu
catio
n :C
ogni
tive
-Mild
:Sa
larie
sof
teac
hers
Oth
ersa
larie
sfo
r ins
truct
ion
Gen
eral
supp
lies
Tota
lCog
nitiv
e-M
ild
$14
9 ,19
0$
229,
685
312
$14
9,50
2$
229,
685
149,
502
$22
2,67
27,
013
144
5886
144
379 ,
019
379,
331
372,
232
7 ,09
931
2
Cog
nitiv
e-M
oder
ate :
Sala
ries
ofte
ache
rsO
ther
sala
ries
for i
nstru
ctio
nO
ther
purc
hase
dse
rvice
s(40
0 -500
serie
s)G
ener
a!su
pplie
sTo
talC
ogni
tive
-Mod
erat
e
227,
164
153,
768
225,
935
153 ,
768
1,22
922
8,44
414
9,97
98 ,
200
7,00
0
( 1, 2
80)
3 ,78
9( 8
, 200
)2,
308
CO CO
9,24
69,
308
6239
3,62
3( 3
, 383
)39
0,24
038
8,94
91,
291
Lear
ning
and
/ or L
angu
age
Disa
biliti
es:
Sala
ries
ofte
ache
rsO
ther
sala
ries
for i
nstru
ctio
nO
ther
purc
hase
dse
rvice
s(40
0 -500
serie
s)G
ener
alsu
pplie
sTe
xtbo
oks
Oth
erO
bjec
tsTo
talL
earn
ing
and
/ orL
angu
age
Disa
biliti
es
859,
352
280,
029
848,
366
254,
732
10, 9
8625
, 297
859 ,
352
283,
818
15, 0
003 ,
184
1 ,71
0
( 3, 7
89)
( 15 ,
000)
2,80
31,
224
( 201
)2,
983
1 ,22
418
0( 4
86)
300
300
300
1,16
3,36
4( 1
9,47
6)1 ,
143,
888
1,10
7,42
536
, 463

EXHI
BIT
"C-1 "
SHEE
T# 4
FREE
HO
LDR
EGIO
NAL
HIG
HSC
HO
OL
DIS
TRIC
TG
ENER
ALFU
ND
CO
MPA
RAT
IVE
STAT
EMEN
TSO
FR
EVEN
UES
.EXP
ENDI
TURE
SAN
DCH
ANG
ESIN
FUN
DBA
LAN
CE
-BU
DG
ET
AN
DA
CTU
AL
FOR
THE
FISC
ALYE
AREN
DED
JUN
E30
.202
1
VAR
IAN
CE
FAVO
RAB
LE/
( UN
FAVO
RAB
LE)
OR
IGIN
ALBU
DG
ETBU
DG
ETTR
ANSF
ERS
FIN
ALBU
DG
ETAC
TUAL
Beha
viora
lDisa
biliti
es:
Sala
ries
ofte
ache
rsO
ther
sala
ries
fori
nstru
ctio
nPu
rcha
sed
prof
essi
onal
educ
atio
nals
ervic
esG
ener
alsu
pplie
sTo
talB
ehav
iora
lDisa
biliti
es:
968
$26
1,31
7$
51, 6
9349
3,47
01,
050
261 ,
317
$51
, 256
493,
470
1 ,00
0
$26
0,34
9$
51, 6
9349
3,47
02,
500
437
( 1, 4
50)
5080
7,53
080
7,04
380
8,01
2( 4
82)
487
Reso
urce
room
/ reso
urce
cent
er:
Sala
ries
ofte
ache
rsG
ener
a!su
pplie
sTo
tal R
esou
rce
room
/reso
urce
cent
er
10, 1
36, 3
7128
, 192
( 201
, 830
)( 5
, 126
)9,
934,
541
23, 0
669,
934 ,
541
22, 8
2624
0CO
10, 1
64, 5
63( 2
06, 9
56)
9,95
7,60
724
09,
957,
367
Autis
m:Sa
larie
sof
teac
hers
Oth
ersa
larie
sfo
rins
truct
ion
Gen
eral
supp
lies
Tota
lAut
ism
266,
904
367,
718
5 ,24
0
264 ,
941
367,
718
13, 5
00
1,96
326
6,90
426
3 ,75
03,
417
103,
968
1,82
3( 8
, 260
)63
9,86
264
6,15
9( 6
, 297
)53
4,07
110
5,79
1
Hom
eIn
stru
ctio
n :Sa
larie
sof
teac
hers
Purc
hase
dpr
ofes
sion
al-e
duca
tiona
lser
vices
Tota
l Hom
eIn
stru
ctio
n :
( 20 ,
133)
79, 8
6710
0,00
044
, 797
30, 3
0935
, 070
69, 6
9110
0,00
010
0,00
0( 2
0,13
3)17
9,86
775
, 106
104,
761
200,
000
Tota
lspe
cial
educ
atio
n( 2
56, 4
15)
13, 4
98, 3
2513
, 242
, 193
256 ,
132
13, 7
54, 7
40
Basi
csk
ills/ re
med
ial:
Sala
ries
ofte
ache
rsTo
talb
asic
skills
/ rem
edia
l42
7,47
660
, 542
528,
018
( 40,
000)
( 40,
000)
488,
018
427,
476
488,
018
60, 5
4252
8,01
8

EXH
IBIT
" C-r
SHEE
T# 5
FREE
HO
LDR
EGIO
NAL
HIG
HSC
HO
OL
DIS
TRIC
TG
ENER
ALFU
ND
COM
PARA
TIVE
STAT
EMEN
TSO
FR
EVEN
UES
.EXP
END
ITU
RES
AND
CH
ANG
ESIN
FUND
BALA
NC
E- B
UD
GET
AND
ACTU
ALFO
RTH
EFI
SCAL
YE
AR
END
EDJU
NE
30.2
021
VARI
ANCE
FAVO
RAB
LE/
( UN
FAVO
RAB
LE!
ORI
GIN
ALBU
DG
ETBU
DG
ETTR
ANSF
ERS
FIN
ALBU
DG
ETAC
TUAL
Bilin
gual
educ
atio
n :Sa
larie
sof
teac
hers
Oth
erpu
rcha
sed
serv
ices
( 400
-500
serie
s)G
ener
alsu
pplie
sTo
talb
ilingu
aled
ucat
ion
267,
147
$10
, 000
$27
4,42
9$
7,28
2$
264,
429
$80
0( 8
00)
448
448
450
( 2)
274,
877
267,
595
7 ,28
226
5,67
99,
198
Scho
olsp
onso
red
Co -c
urric
uiar
and
Extra
-Cur
ricul
arac
tivitie
s:Sa
larie
sPu
rcha
sed
serv
ices
( 300
-500
serie
s)S
uppl
ies
and
Mat
eria
lsO
ther
Obj
ects
Tota
lsch
ools
pons
ored
Co -c
urric
ular
and
Extra
-curri
cula
ract
ivitie
s
851,
781
8,23
019
, 739
7,06
3
172,
197
9,47
788
, 604
13, 3
81
1 ,05
0,19
727
, 758
27, 1
6822
, 210
( 26 ,
219)
( 10,
051)
81,1
750
, 766
)
1 ,02
3,97
817
, 707
108,
343
20, 4
44CD CJ
i88
6,81
328
3,65
943
, 139
1,17
0,47
21,
127,
333
Scho
olsp
onso
red
athl
etics
:Sa
larie
sPu
rcha
sed
serv
ices
( 300
-500
serie
s)Su
pplie
san
dM
ater
ials
Oth
erO
bjec
tsTo
tals
choo
lspo
nsor
edat
hlet
ics
3,34
5,02
149
5,66
228
4,70
852
, 556
3,34
5,02
144
0,71
326
7,68
949
, 471
3,31
8,29
154
8,70
223
0,39
012
4,70
0
26, 7
30( 5
3,04
0)54
, 318
( 72,
144)
54,9
4917
, 019
3,08
54,
102,
894
75, 0
53( 4
4,13
6)4 ,
222,
083
4 ,17
7 ,94
7
Oth
erin
stru
ctio
nalp
rogr
ams :
Sala
ries
Purc
hase
dse
rvice
s( 3
00-50
0se
ries)
Supp
lies
and
Mat
eria
lsO
ther
Obj
ects
Tota
loth
erin
stru
ctio
nalp
rogr
ams
72, 8
881,
998
1,60
0
1,47
212
, 502
8 ,40
02,
660
( 495
,000
)56
9,36
014
, 500
10, 0
003 ,
000
74, 3
6014
, 500
10, 0
003,
000
340
25,0
34( 4
95, 0
00)
101,
860
76, 8
2659
6,86
0
451,
570
6,21
3,17
45,
761,
604
6 ,73
9 ,97
3( 5
26, 7
99)
Tota
loth
erin
stru
ctio
nalp
rogr
ams
1,33
8,22
375
, 534
, 609
74, 1
96, 3
8675
, 205
, 789
328,
820
Tota
l -ins
truct
ion

EXH
IBIT
"CM
"SH
EET
# 6
FREE
HO
LDR
EGIO
NAL
HIG
HSC
HO
OL
DIS
TRIC
TG
ENER
ALFU
NDCO
MPA
RATI
VEST
ATEM
ENTS
OF
REV
ENU
ES.E
XPEN
DIT
UR
ESAN
DC
HAN
GES
INFU
ND
BALA
NCE
-BU
DG
ETAN
DAC
TUAL
FOR
THE
FISC
ALYE
AREN
DED
JUNE
30.2
021
VAR
IAN
CE
FAVO
RAB
LE/
( UN
FAVO
RAB
LE)
BUDG
ETTR
ANSF
ERS
FIN
ALBU
DG
ETO
RIG
INAL
BUD
GET
ACTU
AL
Undi
strib
uted
expe
nditu
res :
Inst
ruct
ion:
Tuiti
onto
othe
rLEA
' swi
thin
the
stat
e -spe
cial
Tuiti
onto
coun
tyvo
catio
nals
choo
ldis
trict
-regu
lar
Tuiti
onto
coun
tyvo
catio
nals
choo
ldis
trict
-spec
ial
Tuiti
onto
CSS
Dan
dre
gion
alda
ysc
hool
sTu
ition
topr
ivat
esc
hool
sfo
rthe
hand
icap
ped
with
inst
ate
T uitio
n -sta
tefa
cilit
ies
219 ,
554
$4,
433,
925
594 ,
333
2,48
5,21
49 ,
343 ,
218
398,
720
17, 5
32$
300,
000
206,
358
$4,
404,
858
500,
700
2,25
2,94
98,
182,
006
398,
720
13, 1
9629
, 067
93,6
3323
2 ,26
51,
161,
212
$20
2,02
24,
133,
925
594,
333
2,33
6 ,34
59,
370,
567
398 ,
720
148,
869
( 27,
349)
17, 4
74, 9
6415
,945
,591
1,52
9 ,37
3To
talu
ndist
ribut
edex
pend
iture
s-in
stru
ctio
n17
,035
,912
439,
052
CD oAt
tend
ance
and
soci
alw
ork
serv
ices
:Sa
larie
sO
ther
purc
hase
dse
rvice
s( 4
00-50
0se
ries)
Supp
lies
and
Mat
eria
ls
683 ,
262
2,22
976
1,45
9( 7
8 ,19
7)68
1,03
355
5555
841,
300
( 73)
1,22
71,
143
( 78,
270)
682,
231
2,31
3To
tala
ttend
ance
and
socia
lwor
kse
rvice
s76
2,81
468
4,54
4
Hea
lthse
rvic
es:
Sala
ries
Purc
hase
dpr
ofes
sion
alan
dte
chni
cal s
ervi
ces
Oth
erPu
rcha
sed
Serv
ices
( 400
-500
serie
s)Su
pplie
san
dm
ater
ials
Oth
erO
bjec
ts
1,25
7,83
111
4,15
51,
277
24,7
07
1,22
9,63
412
7 , 155
1,70
613
, 900
28, 1
97( 1
3,00
0)1,
257,
831
82,5
2231
, 633
( 429
)29
498
311
,196
10, 8
0713
, 511
100
100
100
25, 5
751,
354, 1
5843
, 912
1,37
2 ,49
51,
398,
070
Tota
lhea
lthse
rvice
s
Oth
ersu
ppor
t ser
vices
-spee
ch, O
T,PT
&re
late
dse
rvice
s:Sa
larie
sPu
rcha
sed
prof
essi
onal
-Edu
catio
nal s
ervi
ces
Supp
lies
and
mat
eria
ls
588,
899
229 ,
522
57, 6
1716
2,23
464
6,51
639
1,75
664
6 ,51
639
1 ,75
6( 4
10)
410
818,
421
219,
851
Tota
loth
ersu
ppor
t ser
vices
-spe
ech ,
OT ,
PT&
rela
ted
serv
ices
1,03
8,68
2( 4
10)
1,03
8,27
2

EXHI
BIT
"C-1 ”
SHEE
T#7
FREE
HOLD
REG
IONA
LH
IGH
SCH
OO
LD
ISTR
ICT
GEN
ERAL
FUN
DC
OM
PAR
ATIV
EST
ATEM
ENTS
OF
REV
ENU
ES.E
XPEN
DIT
UR
ESAN
DC
HAN
GES
INFU
ND
BALA
NC
E-B
UD
GET
AND
ACTU
ALFO
RTH
EFI
SCAL
YEAR
ENDE
DJU
NE30
.202
1
VARI
ANCE
FAVO
RAB
LE/
( UN
FAVO
RAB
LE)
BUD
GET
TRAN
SFER
SFI
NAL
BUD
GET
ORI
GIN
ALBU
DG
ETAC
TUAL
Oth
ersu
ppor
t ser
vice
s -Ex
traor
dina
rySe
rvic
esSa
larie
sPu
rcha
sed
Prof
essi
onal
-Edu
catio
nal S
ervic
es( 2
97, 9
00)
$1,
710,
896
$2,
868,
497
1,46
0,00
4$
1 ,53
8,04
725
0 ,89
21 ,
330,
450
$2,
008,
796
$2,
868,
497
2,99
8 ,05
11,
581,
342
4,87
7,29
3( 2
97, 9
00)
4,57
9,39
3To
talo
ther
supp
ort s
ervic
es-Ex
traor
dina
rySe
rvice
s
Oth
ersu
ppor
tser
vice
s-G
uida
nce;
Sala
ries
ofot
herp
rofe
ssio
nal s
taff
Sala
ries
ofse
cret
aria
land
cler
ical
assi
stan
tsO
ther
Sala
ries
Oth
erPu
rcha
sed
Prof
essi
onal
and
Tech
nica
lSer
vice
sO
ther
Purc
hase
dSe
rvic
es( 4
00-50
0se
ries)
Supp
lies
and
Mat
eria
lsO
ther
obje
cts
4 ,14
1,71
363
0, 299
26,6
5058
, 151
28,7
0218
, 082
3,42
5
4,14
6,41
263
0,29
926
,650
65,2
2849
, 547
19, 2
394,
575
4 ,69
94,
147,
863
621,
398
14, 1
0067
, 000
52,7
6321
, 609
4,57
5
( 1, 4
51)
8,90
112
, 550
0,77
2)( 3
, 216
)( 2
,370
)
CD "si
7,07
720
, 845
1,15
71,
150
34, 9
284,
941,
950
4,90
7 ,02
2To
talo
ther
supp
ort s
ervi
ces
-Gui
danc
e12
, 642
4 ,92
9,30
8
Oth
ersu
ppor
t ser
vice
s-ch
ildst
udy
team
s:Sa
larie
sof
othe
rpro
fess
iona
l sta
ffSa
larie
sof
secr
etar
iata
ndcl
eric
alas
sista
nts
Purc
hase
dPr
ofes
siona
l -Edu
catio
nal S
ervi
ces
Oth
erPu
rcha
sed
Prof
essio
nala
ndTe
chni
calS
ervi
ces
Oth
erPu
rcha
sed
Serv
ices
( 400
-500
serie
s)Su
pplie
san
dM
ater
ials
3,69
7( 2
74, 8
78)
4,87
82, 6
05, 3
8035
5,72
073
4,50
04,
000
8,30
064
, 577
2,60
1,68
335
5, 720
186,
448
2,88
0,25
835
0 ,84
273
4,50
04,
000
8,10
076
, 356
548,
052
4,00
08 ,
139
200
161
555
64, 0
22( 1
1,77
9)
3 ,20
8,03
456
4,44
3( 2
81, 5
79)
3,77
2,47
7To
talo
ther
supp
ort s
ervic
es-c
hild
stud
yte
ams
4 ,05
4,05
6

EXHI
BIT
" C-T
SHEE
T#8
FREE
HO
LDR
EGIO
NAL
HIG
HSC
HO
OL
DIS
TRIC
TG
ENER
ALFU
ND
COM
PARA
TIVE
STAT
EMEN
TSO
FR
EVEN
UES
.EXP
END
ITU
RES
AND
CH
ANG
ESIN
FUN
DBA
LAN
CE
-BU
DG
ETAN
DAC
TUAL
FOR
THE
FISC
ALYE
AREN
DED
JUN
E30
.202
1
VAR
IAN
CE
FAVO
RABL
E/( U
NFA
VOR
ABLE
)BU
DG
ETTR
ANSF
ERS
FIN
ALBU
DG
ETO
RIG
INAL
BUD
GET
ACTU
AL
Impr
ovem
ento
fins
truct
iona
lser
vices
:Sa
larie
sof
Supe
rvis
ors
ofIn
stru
ctio
nSa
larie
sof
secr
etar
iala
ndcl
eric
alas
sist
ants
Oth
erSa
larie
sO
ther
Purc
hase
dSe
rvic
es(4
00-50
0)Su
pplie
san
dM
ater
ials
Oth
erob
ject
s
577,
103
$21
9,35
116
7 ,04
018
, 495
4,68
736
, 600
( 61 ,
780)
$5,
397
577,
203
$21
9 ,35
119
7,26
062
, 370
34, 2
3037
, 275
100
$63
8,98
3$
213 ,
954
197,
260
62,1
0011
, 500
36, 2
75
30, 2
2043
,875
29, 5
4327
022
,730
1,00
067
5
104,
413
( 32,
383)
1,12
7,68
91,
023,
276
Tota
lIm
prov
emen
tofi
nstru
ctio
nals
ervi
ces :
1,16
0 ,07
2CD 00
Educ
atio
nalm
edia
serv
ices
/ sch
oolli
brar
y :Sa
larie
sPu
rcha
sed
Prof
essi
onal
and
Tech
nica
l Ser
vice
sO
ther
Purc
hase
dSe
rvic
es( 4
00-50
0)Su
pplie
san
dM
ater
ials
168,
239
38, 9
122,
343
167,
856
55.5
0010
.500
2,58
5
168,
239
41, 9
243,
500
383
3 ,01
21,
157
( 13,
576)
(7, 0
00)
0, 7
50)
727
108
835
209,
602
4,89
6( 2
1,94
3)21
4,49
8To
tale
duca
tiona
lmed
iase
rvice
s/sc
hool
libra
ry23
6,44
1
Inst
ruct
iona
lSta
ffTr
aini
ngSe
rvice
s:Sa
larie
sof
Supe
rvis
ors
ofIn
stru
ctio
nSa
larie
sof
secr
etar
iala
ndcl
eric
alas
sista
nts
Purc
hase
dPr
ofes
sion
al-E
duca
tiona
lSer
vice
sO
ther
Purc
hase
dSe
rvic
es( 4
00-50
0)Su
pplie
san
dM
ater
ials
Oth
erob
ject
s
( 168
)54
7,53
134
, 337
16, 8
2839
, 423
3,81
2
886
548 ,
585
34, 1
6959
, 441
77, 8
7011
, 500
3,80
0
548,
417
34, 3
3756
, 441
73, 0
5411
, 500
3,80
0
168
39, 6
1333
, 631
7,68
83,
800
( 3, 0
00)
(4,8
16)
641,
931
727,
549
85, 6
1873
5,36
5( 7
, 816
)To
tal in
stru
ctio
nals
taff
train
ing
serv
ices
:

EXHI
BIT
"C-1 "
SHEE
T# 9
FREE
HO
LDR
EGIO
NAL
HIG
HSC
HO
OL
DIS
TRIC
TG
ENER
ALFU
NDC
OM
PAR
ATIV
EST
ATEM
ENTS
OF
REVE
NUES
.EXP
END
ITU
RES
AND
CHAN
GES
INFU
ND
BALA
NC
E-B
UD
GET
AND
ACTU
ALFO
RTH
EFI
SCAL
YEAR
END
EDJU
NE
30.2
021
VARI
ANCE
FAVO
RAB
LE/
( UN
FAVO
RAB
LE)
BUD
GET
TRAN
SFER
SFI
NAL
BUD
GET
ORI
GIN
ALBU
DG
ETAC
TUAL
Supp
ort s
ervic
esge
nera
l adm
inis
tratio
n:Sa
larie
sLe
gal s
ervic
esAu
ditF
ees
Arch
itect
ural
/ Eng
inee
ring
Serv
ices
Oth
erpu
rcha
sed
prof
essi
onal
serv
ices
Purc
hase
dte
chni
cals
ervi
ces
Com
mun
icatio
ns/ te
leph
one
BOE
Oth
erpu
rcha
sed
serv
ices(
580 -5
85)
Mis
c.pu
rcha
sed
serv
ices(
400 -5
00Se
ries,
othe
r tha
n53
0&
585)
Gen
eral
supp
lies
BOE
in-ho
use
train
ing /
mee
ting
supp
lies
Misc
ella
neou
sex
pend
iture
sBO
Em
embe
rshi
pdu
esan
dfe
es
417,
925
$42
3 ,70
759
, 000
17, 5
108 ,
985
9 ,96
869
4,74
7
7,06
380
, 840
5 ,00
015
,990
8,91
58,
362
58,2
534,
602
26,4
834,
985
3,66
53 ,
421
30, 0
00$
424,
988
$50
4,54
764
, 000
33,5
0017
, 900
18, 3
3075
3,00
05,
000
181,
504
15, 0
844,
000
14,7
0527
, 000
$39
4,98
8$
504,
547
64, 0
0050
,000
1 ,40
018
, 330
751,
000
5,00
017
6 ,17
215
, 500
4,00
014
,705
27, 0
00
( 16,
500)
16, 5
00
2,00
039
815
5,02
110
,099
5,33
2( 4
16)
CD CD
335
11, 2
8426
, 663
337
227,
916
2,06
3,55
81,
835 ,
642
2,02
6,64
236
,916
Tota
lsup
port
serv
ices
gene
ral a
dmin
istra
tion
Supp
ort s
ervic
essc
hool
adm
inist
ratio
n:Sa
larie
sof
prin
cipa
ls/ a
sst,
prin
cipal
sSa
larie
sof
othe
rpro
fess
iona
l sta
ffSa
larie
sof
secr
etar
iala
ndcl
eric
alas
sist
ants
Oth
erPu
rcha
sed
Serv
ices
( 400
-500
serie
s)Su
pplie
san
dM
ater
ials
Oth
erob
ject
s
289,
160
73, 3
171,
601
25,8
159,
494
14, 4
66
3,75
8,65
81,
798 ,
655
1,48
1,87
469
, 082
111,
132
155,
108
3 ,46
9 ,49
81,
725 ,
338
1,48
0,27
343
, 267
101 ,
638
140,
642
3,60
8,65
81,
723,
655
1,40
6 ,87
469
,032
95, 4
5114
9,36
0
150,
000
75,0
0075
, 000 50
15, 6
815,
748
7,37
4 ,50
96,
960,
656
413,
853
7,05
3,03
032
1,47
9To
tals
uppo
rtse
rvice
ssc
hool
adm
inis
tratio
n

EXH
IBIT
"C-r
SHEE
T#1
0
FREE
HO
LDR
EGIO
NAL
HIG
HSC
HO
OL
DIS
TRIC
TG
ENER
ALFU
ND
CO
MPA
RAT
IVE
STAT
EMEN
TSO
FRE
VENU
ES.E
XPEN
DIT
UR
ESAN
DC
HAN
GES
INFU
ND
BALA
NC
E-B
UD
GET
AND
ACTU
ALFO
RTH
EFI
SCAL
YEAR
ENDE
DJU
NE
30.2
021
VAR
IAN
CE
FAVO
RAB
LE/
( UN
FAVO
RAB
LE)
BUD
GET
TRAN
SFER
SFI
NAL
BUD
GET
ORI
GIN
ALBU
DG
ETAC
TUAL
Cent
ralS
ervi
ces:
Sala
ries
Purc
hase
dpr
ofes
sion
alse
rvic
esPu
rcha
sed
tech
nica
lser
vices
Mis
c .pu
rcha
sed
serv
ices
( 400
-500
serie
s)Su
pplie
san
dm
ater
ials
Inte
rest
onLe
ase
Purc
hase
Agre
emen
tM
iscel
lane
ous
expe
nditu
res
1,38
8,12
0$
$1,
384,4
71$
4,00
032
, 210
103,
600
54, 1
5091
, 353
9,80
0
1,43
4 ,47
1$
4,00
032
, 210
102 ,
100
54, 1
5091
, 353
9,80
0
46,3
514 ,
000
10, 0
4533
, 796
24,5
8614
,963
3,16
4
50, 0
00$
22, 1
6568
, 304
29,5
6476
, 390
6,63
6
( 1, 5
00)
1,72
8,08
413
6,90
548
, 500
1,59
1,17
91,
679,
584
Tota
lcen
tral s
ervic
eso o
Adm
inis
trativ
eIn
form
atio
nTe
chno
logy:
Sala
ries
Purc
hase
dte
chni
cals
ervic
esO
ther
purc
hase
dse
rvic
es( 4
00-50
0se
ries )
Supp
lies
and
Mat
eria
ls
30,4
7015
2,61
21,
889
10, 9
58
857 ,
610
886,
915
480,
904
178,
000
827,
140
734,
303
479,
015
167,
042
34, 0
0010
8 ,50
030
, 500
49, 0
00
823,
610
778,
415
450,
404
129,
000
195 ,
929
2,40
3,42
92,
207,
500
2,18
1,42
922
2,00
0To
talA
dmin
istra
tive
Info
rmat
ion
Tech
nolo
gy
Req
uire
dM
aint
enan
cefo
rSch
oolF
acilit
ies:
Sala
ries
Cle
anin
g ,R
epai
r and
Mai
nten
ance
Serv
ices
Mis
c.pu
rcha
sed
serv
ices
( 400
-500
serie
s)G
ener
alsu
pplie
sO
ther
obje
cts
856,
752
1,48
8 ,02
37,
000
343,
749
86, 0
00
72, 8
1918
3,26
26,
881
167 ,
591
41, 7
52
783,
933
1 ,304
, 761
856,
752
1,50
8,02
37,
000
344,
067
61, 0
00
( 20,
000)
119
( 318
)17
6,15
844
, 248
25, 0
00
2,30
9,21
947
2,30
54,
682
2,78
1,52
4To
talR
equi
red
Mai
nten
ance
for S
choo
lFac
ilitie
s2,
776,
842

EXH
IBIT
" C-1H
SHEE
T# 1
1
FREE
HO
LDR
EGIO
NAL
HIG
HSC
HO
OL
DIST
RICT
GEN
ERAL
FUN
DC
OM
PAR
ATIV
EST
ATEM
ENTS
OF
REV
ENU
ES.E
XPEN
DIT
UR
ESAN
DC
HAN
GES
INFU
ND
BALA
NC
E-B
UD
GET
AND
ACTU
ALFO
RTH
EFI
SCAL
YEAR
ENDE
DJU
NE
30.2
021
VAR
IAN
CE
FAVO
RAB
LE/
( UN
FAVO
RAB
LE)
BUD
GET
TRAN
SFER
SO
RIG
INAL
BUD
GET
ACTU
ALFI
NAL
BUD
GET
Cust
odia
lSer
vice
s :Sa
larie
sPu
rcha
sed
prof
essi
onal
and
tech
nica
lser
vices
Cle
anin
g,re
pair
and
mai
nten
ance
serv
ices
Ren
talo
fland
and
build
ing
-oth
erth
anle
ase
purc
hase
agre
emen
tLe
ase
Purc
hase
Paym
ents
-Ener
gySa
ving
sIm
prov
emen
tPro
g .O
ther
purc
hase
dpr
oper
tyse
rvice
sIn
sura
nce
Gen
eral
supp
lies
Ener
gy( N
atur
alG
as)
Ener
gy(E
lect
ricity
)En
ergy
( Gas
olin
e)
4,23
2,94
6$
334 ,
657
80, 9
0824
6,46
81,
304,
109
172,
110
437,
746
346,
454
628,
848
1,08
2 ,73
230
6,08
4
$4,
514 ,
646
$34
3,93
016
3,67
127
0,000
1 , 304
,109
242,
770
439,
837
438,
000
700,
000
1,65
0,00
065
8,13
0
281 ,
700
9 ,27
382
, 763
23,5
32
$4 ,
514,
646
$34
3, 700
163,
671
270 ,
000
1,30
4 ,10
924
3,00
043
9,83
739
0,00
070
0,00
01,
650,
000
750,
000
230
70, 6
602,
091
91,5
4671
, 152
567 ,
268
352,
046
( 230
)
48, 0
00O
( 91,
870)
1,55
2,03
110
, 725
, 093
9,17
3,06
210
, 768
, 963
( 43,
870)
Tota
lcus
todi
alse
rvice
s
Care
&U
pkee
pof
Gro
unds
:Sa
larie
sC
lean
ing,
Rep
air a
ndM
aint
enan
ceSe
rvic
esG
ener
alsu
pplie
s
527 ,
681
530,
674
115,
478
151,
978
16, 3
8644
, 522
679 ,
659
547 ,
060
160,
000
679 ,
659
422,
060
160,
000
125 ,
000
1,38
6,71
91,
173,
833
212,
886
1,26
1,71
912
5,00
0To
tal C
are
and
Upke
epof
Gro
unds
Secu
rity :
Sala
ries
Purc
hase
dPr
ofes
siona
l&Te
chni
cal S
ervi
ces
( 300
-500)
Cle
anin
g,R
epai
r and
Mai
nten
ance
Serv
ices
Gen
eral
Supp
lies
34, 7
3522
2,75
65,
715
495,
085
409,
227
6 ,00
011
, 770
460,
350
186 ,
471
495,
085
409,
625
6,00
09,
350
( 398
)28
511
, 711
592,
420
263,
265
922,
082
658,
817
920,
060
2,02
2To
tal S
ecur
ity
2,50
0,48
715
,815
, 418
13, 3
14, 9
3115
, 727
, 584
87, 8
34To
talo
pera
tion
and
mai
nten
ance
ofpl
ant s
ervic
es

EXH
IBIT
"C-r
SHEE
T# 1
2
FREE
HO
LDRE
GIO
NAL
HIG
HSC
HO
OL
DIS
TRIC
TG
ENER
ALFU
ND
CO
MPA
RAT
IVE
STAT
EMEN
TSO
FR
EVEN
UES
.EXP
END
ITU
RES
AND
CH
ANG
ESIN
FUN
DBA
LAN
CE
-BU
DG
ETAN
DAC
TUAL
FOR
THE
FISC
ALYE
AREN
DED
JUN
E30
.202
1
VAR
IAN
CE
FAVO
RAB
LE/
( UN
FAVO
RAB
LE)
BUD
GET
TRAN
SFER
SFI
NAL
BUD
GET
OR
IGIN
ALBU
DG
ETAC
TUAL
Stud
entt
rans
porta
tion
serv
ices :
Sala
ries
ofN
on-lns
truct
iona
lAid
esSa
larie
sfo
rpup
iltra
nspo
rtatio
n( b
etwe
enho
me
and
scho
ol)-re
gu!a
rSa
larie
sfo
rpup
iltra
nspo
rtatio
n( b
etwe
enho
me
and
scho
ol)-S
peci
alEd
Sala
ries
forp
upilt
rans
porta
tion
( oth
erth
anbe
twee
nho
me
&sc
hool)
Man
agem
entF
ee-E
SC& C
TSA
trans
porta
tion
prog
ram
sO
ther
Purc
hase
dpr
ofes
sion
alan
dte
chni
cal s
ervi
ces
Cle
anin
g,R
epai
r and
Mai
nten
ance
Serv
ices
Leas
ePu
rcha
sePa
ymen
ts-S
choo
lBus
esCo
ntra
cted
Serv
ices
-bet
ween
hom
ean
dsc
hool
vend
ors
Cont
ract
edse
rvic
es( o
ther
than
btw
hom
e&
scho
ol)-ve
ndor
sC
ontra
ctSe
rv.(
btw
hom
ean
dSc
h)Jo
intA
gree
men
tsC
ontra
ctSe
rv.( s
pec
edst
uden
ts) -v
endo
rsC
ontra
ct. S
erv.
( spe
ced
stud
ents)
-Join
tAgr
eem
ents
Cont
ract
edse
rvice
s(r
egul
arst
uden
ts) -
ESCs
&CT
SAs
Cont
ract
edse
rvice
s( s
pec
edst
uden
ts) -E
SCs
&CT
SAs
Con
tract.
Serv
-Aid
inLi
euPy
mts
-Non -P
ublic
Scho
ols
Trav
elM
isce
llane
ous
purc
hase
dse
rvice
s-T
rans
porta
tion(
580 -5
90)
Gen
eral
supp
lies
Tran
spor
tatio
nSu
pplie
sO
ther
obje
cts
$29
3,84
0$
201,
982
$91
, 858
$29
3,84
0$
256 ,
882
3,31
1,55
33 ,
054,
671
3,31
1,55
3
171,
014
757 ,
916
586,
902
757,
916
304,
701
123,
648
140 ,
218
13, 8
60
450,
000
270 ,
000
284 ,
550
840, 0
0071
8,77
15 ,
479 ,
000
233,
670
29, 0
0036
, 369
44, 9
6699
,000
5,065
, 259
481, 0
00
145,
299
146,
352
144,
332
826, 1
4071
8,771
5,07
5,23
3
450,
000
270,
000
283,
500
840,
000
718,
771
5,13
5 ,00
025
6,70
0
O1,
050
ro
403,
767
233,
670
344,
000
( 23,
030)
29, 0
0016
, 369
379
28, 6
2129
, 195
7 ,17
444
, 966
62, 1
282,
329,
684
20, 0
0044
, 966
400,
000
5,07
1,62
818
0,00
02,
000
189 ,
665
5,00
061
0,00
02,
500
36,8
722,
735,
575
480,
958
( 301
, 000
)( 6
, 369
)30
1,00
0( 2
, 000
)18
, 000
2,15
082
,000
42
207 ,
665
7,15
069
2,00
02,
500
206,
986
6 ,70
846
3, 170
1,41
3
679
442
228,
830
1,08
7
14,8
89, 1
804 ,
415,
029
461 ,
170
19, 3
04, 2
0918
, 843
, 039
Tota
lstu
dent
trans
porta
tion
serv
ices

EXHI
BIT
" C-1 "
SHEE
T#1
3
FREE
HO
LDR
EGIO
NAL
HIG
HSC
HO
OL
DIS
TRIC
TG
ENER
ALFU
ND
CO
MPA
RAT
IVE
STAT
EMEN
TSO
FR
EVEN
UES
.EXP
END
ITU
RES
AND
CH
ANG
ESIN
FUN
DBA
LAN
CE
-BU
DG
ETAN
DAC
TUAL
FOR
THE
FISC
ALYE
AREN
DED
JUN
E30
.202
1
VAR
IAN
CE
FAVO
RAB
LE/
( UN
FAVO
RAB
LE)
OR
IGIN
ALBU
DG
ETBU
DGET
TRAN
SFER
SFI
NAL
BUD
GET
ACTU
AL
Unal
loca
ted
Bene
fits
-Em
ploy
eeBe
nefit
s :So
cialS
ecur
ityC
ontri
butio
nsO
ther
retir
emen
tcon
tribu
tions
-PER
SU
nem
ploy
men
tCom
pens
atio
nW
orke
rsCo
mpe
nsat
ion
Hea
lthBe
nefit
sTu
ition
Reim
burs
emen
tsO
ther
Empl
oyee
Bene
fits
1,96
9 ,78
5$
2, 639
, 631
8,94
01,
124,
822
23, 5
60, 5
9498
, 606
201,
055
30, 2
1570
,369
$2,
000,
000
$2,
710,
000
7,50
086
9,94
330
, 737
, 579
200,
000
270,
000
$2,
000,
000
$2,
710,
000
9,00
01,
353,
943
28, 9
26, 5
7920
0,00
027
0,00
0
601,
500
484,
000
(1, 8
11, 0
00)
229 ,
121
5,36
5,98
510
1,39
468
, 945
O5,
866 ,
089
( 1,3
25, 5
00)
35, 4
69, 5
2229
, 603
, 433
Tota
lUna
lloca
ted
Bene
fits
-Em
ploy
eeBe
nefit
s:36
, 795
, 022
u>
21, 4
28,1
846,
715,
259
9,64
15,
654,
877
( 21,
428,
184)
( 6, 7
15,2
59)
( 9, 6
41)
( 5, 6
54, 8
77)
On -b
ehal
f TPA
FPe
nsio
n( n
on-bu
dget
ed)
On -b
ehal
fTPA
FPo
stRe
tirem
ent C
ontri
butio
ns( n
on-bu
dget
ed)
On -b
ehal
f TPA
FLo
ng-Te
rmD
isab
ility
Insu
ranc
eC
ontri
butio
ns(n
on-bu
dget
ed)
Reim
burs
edTP
AFSo
cial
Secu
rity
Con
tribu
tions
( non
-budg
eted
)
( 33,
807,
961)
33, 8
07, 9
61To
talO
n -beh
alfc
ontri
butio
ns
( 27,
941,
872)
36, 7
95, 0
22( 1
, 325
, 500
)35
, 469
, 522
63, 4
11, 3
94To
talp
erso
nal s
ervi
ces
135,
998,
799
( 15,
880,
664)
120 ,
508,
768
( 390
, 633
)12
0,11
8,13
5To
talU
ndist
ribut
edEx
pend
iture
s
( 14,
542,
441)
( 61,
813)
195,
652,
744
210,
195,
185
TOTA
LEX
PEND
ITUR
ES-G
ENER
ALCU
RREN
TEX
PEN
SEFU
ND
1119
5,71
4,55
7

EXHI
BIT
" C-r
SHEE
T# 1
4
FREE
HO
LDR
EGIO
NAL
HIG
HSC
HO
OL
DIS
TRIC
TG
ENER
ALFU
NDC
OM
PAR
ATIV
EST
ATEM
ENTS
OF
REV
ENU
ES.E
XPEN
DIT
UR
ESAN
DC
HAN
GES
INFU
ND
BALA
NC
E-B
UD
GET
AND
ACTU
ALFO
RTH
EFI
SCAL
YEAR
END
EDJU
NE
30.2
021
VARI
ANCE
FAVO
RABL
E/( U
NFA
VOR
ABLE
)O
RIG
INAL
BUDG
ETBU
DGET
TRAN
SFER
SFI
NAL
BUD
GET
ACTU
AL
CAP
ITAL
OUT
LAY:
Equi
pmen
t:R
egul
arpr
ogra
m-In
stru
ctio
nG
rade
s9 -1
2Sp
ecia
l edu
catio
nR
esou
rce
Roo
mSc
hool
spon
sore
dan
dot
heri
nstru
ctio
nalp
rogr
amUn
dist
ribut
edEx
pend
iture
sCh
ildSt
udy
Team
Gen
eral
Adm
in .Sc
hool
Adm
in.
Adm
inis
trativ
eIn
form
atio
nTe
chno
logy
Mai
nten
ance
ofsc
hool
faci
lity
Cust
odia
lser
vice
sC
are
&up
keep
grou
nds
Tota
l Equ
ipm
ent
65, 8
16$
581
61, 8
97$
66, 3
97$
$4,
500
$
7,99
879
, 205
8,00
090
, 369
8,00
095
, 669
2o
16, 4
645,
300
6 ,00
03 ,
084
3,46
312
4,25
035
, 553
16, 0
0070
, 933
6,00
06 ,
000
3 ,08
43,
263
122,
602
30, 0
9915
,200
44, 7
98
3,08
43,
463
( 45,
000)
( 60,
000)
200
1,64
85 ,
454
169,
250
95, 5
5316
, 000
70, 9
3380
026
, 135
372,
065
57,2
8461
, 813
429,
349
367,
536
Facil
ities
acqu
isiti
onan
dco
nstru
ctio
nse
rvice
s:Ar
chite
ctur
al/ E
ngin
eerin
gSe
rvice
sCo
nstru
ctio
nse
rvice
sAs
sess
men
tfor
Deb
t Ser
vice
onSD
AFu
ndin
g
243 ,
412
1,91
2,31
88 ,
101
69, 7
5131
7 ,95
817
3 ,66
11,
594,
360
8,10
1
201,
541
1 ,95
4,18
98 ,
101
41, 8
71( 4
1,87
1)
2,16
3,83
138
7,70
92,
163,
831
1,77
6,12
2To
tal f
acilit
ies
acqu
is,
and
cons
t,se
rvice
s
2,14
8,18
744
4,99
32,
531,
367
61, 8
132,
593,
180
TOTA
LCA
PITA
LO
UTLA
Y

EXH
IBIT
" C-1”
SHEE
T# 1
5
FREE
HO
LDR
EGIO
NAL
HIG
HSC
HO
OL
DIST
RICT
GEN
ERAL
FUN
DCO
MPA
RATI
VEST
ATEM
ENTS
OF
REVE
NUES
.EXP
ENDI
TURE
SAN
DCH
ANG
ESIN
FUN
DBA
LAN
CE
-BU
DG
ETAN
DAC
TUAL
FOR
THE
FISC
ALYE
AREN
DED
JUN
E30
.202
1
VAR
IAN
CE
FAVO
RAB
LE/
( UN
FAVO
RAB
LE)
OR
IGIN
ALBU
DG
ETBU
DG
ETTR
ANSF
ERS
FIN
ALBU
DG
ETAC
TUAL
TOTA
LEX
PEND
ITUR
ES$
198,
245,
924
$$
198 ,
245,
924
$21
2,34
3,37
2$
( 14,
097,
448)
Exce
ss( d
efic
ienc
y)of
reve
nues
over
( und
er)
expe
nditu
res
Oth
erfin
anci
ngso
urce
s /( u
ses)
Tran
sfer
sTo
talo
ther
finan
cing
sour
ces
Exce
ssof
Rev
enue
san
dot
herF
inan
cing
Sour
ces
Ove
rEx
pend
iture
san
dO
ther
Expe
nditu
res
and
othe
rFi
nanc
ing
Sour
ces
( 12,
392,
073)
( 12,
392,
073)
7,16
7,97
119
, 560
, 044
1,02
8,26
31,
028,
263
1,02
8,26
31,
028,
263
O cn( 1
2,39
2,07
3)( 1
2,39
2,07
3)8,
196,
234
20, 5
88, 3
07
Fund
bala
nces
, Jul
y1
( as
rest
ated
)39
, 273
, 305
39, 2
73, 3
0539
, 273
, 305
Fund
bala
nces
,Jun
e30
$26
, 881
, 232
$26
, 881
, 232
$47
, 469
, 539
$20
, 588
, 307
Rec
apitu
latio
n:R
estri
cted
:Ex
cess
Surp
lus
-Des
igna
ted
forS
ubse
quen
t Yea
r 'sEx
pend
iture
sEx
cess
Surp
lus
-Cur
rent
Year
Mai
nten
ance
Res
erve
Cap
ital R
eser
veEm
erge
ncy
Res
erve
Stat
eU
nem
ploy
men
tIns
uran
ceAs
sign
ed:
Des
igna
ted
forS
ubse
quen
t Yea
r' sEx
pend
iture
sEn
cum
bran
ces
SEM
I/ FFC
RA-d
esig
nate
dfo
rsub
sequ
ent y
ear e
xpen
ditu
reU
nass
igne
d
$14
, 505
, 870
13, 3
03, 7
661,
519 ,
844
6,02
1,95
18,
302
1,07
2 ,68
0
1 ,98
2,20
552
6,43
912
, 068
8 ,51
6,41
447
, 469
, 539
Rec
onci
liatio
nto
Gov
ernm
enta
l Fun
dsSt
atem
ents
( GAA
P):
Less
: Las
tTwo
Stat
eAi
dPa
ymen
tsno
trec
ogni
zed
onG
AAP
basi
s3,
961,
659
Fund
Bala
nce
per G
over
nmen
tal F
unds
( GAA
P)$
43, 5
07, 8
80

EXHIBIT ”C-2"
FREEHOLD REGIONAL HIGH SCHOOL DISTRICTBUDGETARY COMPARISON SCHEDULE
SPECIAL REVENUE FUNDFOR THE FISCAL YEAR ENDED JUNE 30, 2021
BUDGETTRANSFERS/
AMENDMENTSVARIANCE
FINAL TO ACTUALFINAL
BUDGETORIGINALBUDGET ACTUAL
REVENUES:Federal sourcesState sourcesOther sources
4,474,711 $175,220
1,569,556
(2,723,601)(37,867)
(586,186)
4,098,452 $63,28620,365
7,198,312 $213,087
2,155,742
$ 3,099,860 $149,801
2,135,377
6,219,487 (3,347,654)9,567,1414,182,1035,385,038Total revenues
EXPENDITURES:Instruction:
Salaries of teachersOther salariesOther purchased professional-educational servicesOther purchased servicesTuitionSupplies and materialsTextbooksMiscellaneous expenditures
284,612256,108184,85473,660
1,893,259623,001
14,0891,885
23,54840,18112,47613,886
5,340110,559
2,330
308,160296,289197,330
87,5461,893,2592,518,123
21,0774,893
302,820185,730195,000
87,5001,500,000
221,77513,365
4,800
46393,259
2,296,3487,712
1,895,1226,9883,00893
1,995,2093,331,4682,815,687 5,326,6772,510,990Total instruction
Support services:Other salariesPersonal services - employee benefitsPurchased professional - educational servicesPurchased technical servicesOther purchased servicesSupplies and materialsMiscellaneous expenditures
72,41011,320
587,85710,75219,85267,834
340,587
109,720208,752177,93124,43841,504
852,6921,625,963
(2.870)158,574415,788
(810)(644)
795,526
182,130220,072765,788
35,19061,356
920,5261,966,550
185,00061,498
350,00036,00062,000
125,0001,966,550
1,110,6121,365,564 4,151,612 3,041,0002,786,048Total support services
Facilities acquisition and construction services:Instructional equipmentNon-lnstructional equipment
4336,25252,557
295 36,29552,557
36,00052,000 557
4388,809852 88,85288,000Total facilities acquisition and construction serv.
3,105,8646,461,2774,182,103 9,567,1415,385,038Total expenditures
Excess (deficiency) of revenues over(under) expenditures (241,790)(241,790) $$$ $$
1,966,550.00Fund Balance, July 1 (as restated)
1,724,760.00$Fund Balance, June 30
106
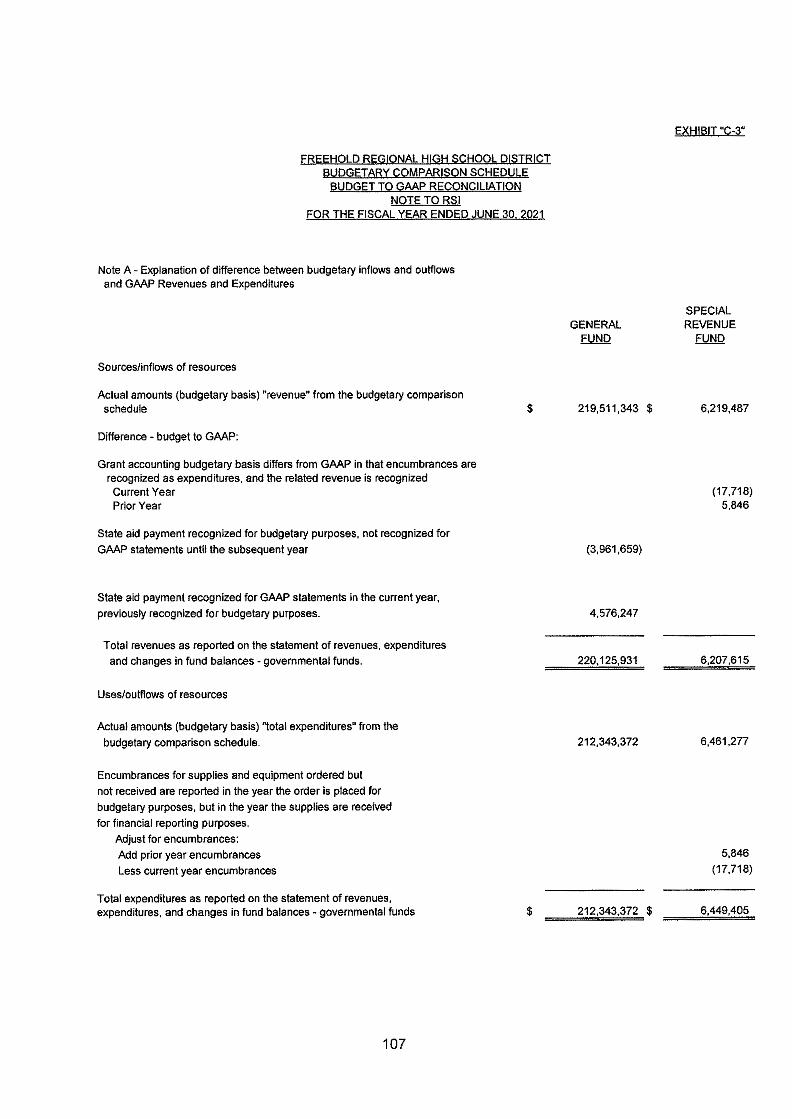
EXHIBIT "C-3"
FREEHOLD REGIONAL HIGH SCHOOL DISTRICTBUDGETARY COMPARISON SCHEDULE
BUDGET TO GAAP RECONCILIATIONNOTE TO RSI
FOR THE FISCAL YEAR ENDED JUNE 30. 2021
Note A - Explanation of difference between budgetary inflows and outflowsand GAAP Revenues and Expenditures
SPECIALREVENUE
FUNDGENERAL
FUND
Sources/inflows of resources
Actual amounts (budgetary basis) "revenue" from the budgetary comparisonschedule $ 219,511,343 $ 6,219,487
Difference - budget to GAAP:
Grant accounting budgetary basis differs from GAAP in that encumbrances arerecognized as expenditures, and the related revenue is recognizedCurrent YearPrior Year
(17,718)5,846
State aid payment recognized for budgetary purposes,not recognized forGAAP statements until the subsequent year (3,961,659)
State aid payment recognized for GAAP statements in the current year,previously recognized for budgetary purposes. 4.576,247
Total revenues as reported on the statement of revenues, expendituresand changes in fund balances - governmental funds. 6,207,615220,125,931
Uses/outflows of resources
Actual amounts (budgetary basis) "total expenditures" from thebudgetary comparison schedule. 6,461,277212,343,372
Encumbrances for supplies and equipment ordered butnot received are reported in the year the order is placed forbudgetary purposes, but in the year the supplies are receivedfor financial reporting purposes.
Adjust for encumbrances:Add prior year encumbrancesLess current year encumbrances
5,846(17,718)
Total expenditures as reported on the statement of revenues,expenditures, and changes in fund balances - governmental funds 6,449,405212,343,372 $$
107

REQUIRED SUPPLEMENTARY INFORMATION - PART III
108

SCHEDULES RELATED TO ACCOUNTING AND REPORTING FOR PENSION (GASB 68)
109

EXH
IBIT
"L-1
"
FREE
HO
LDR
EGIO
NAL
HIG
HSC
HO
OL
DIS
TRIC
TSC
HED
ULE
OF
THE
DIST
RICT
' SPR
OPO
RTI
ON
ATE
SHAR
EO
FTH
EN
ETPE
NSI
ON
LIAB
ILIT
YPU
BLIC
EMPL
OYE
ESR
ETIR
EMEN
TSY
STEM
LAST
TEN
YEAR
S
Dis
trict
’sPr
opor
tion
Shar
eof
the
Net
Pens
ion
Liab
ility
( Ass
et)
asa
perc
enta
geof
it 'sC
over
ed-
Emol
ovee
Pay
roll
Plan
Fidu
ciar
yN
etPo
sitio
nas
ape
rcen
tage
ofth
eto
tal
Pens
ion
Liab
ility
Dis
trict
' sPr
opor
tiona
teSh
are
ofth
eN
etPe
nsio
nLi
abili
ty( A
sset
)
Dis
trict
' sPr
opor
tion
Shar
eof
the
Net
Pens
ion
Liab
ility
( Ass
et)
Dis
trict
'sC
over
ed-Em
ploy
eeP
ayro
ll
Fisc
alYe
arEn
ding
June
30.
277.
34%
286.
92%
327.
61%
433.
69%
332.
93%
284.
30%
262.
03%
226.
43%
48.7
2%52
.08%
47.9
2 %40
.14%
48.1
0%53
.60%
56.2
7%58
.32 %
17, 0
91,6
0016
, 998
, 122
17, 2
23,3
1317
, 291
, 154
17, 6
67, 0
3917
,759
, 374
17, 1
47,6
3817
, 377
, 580
0.24
8018
6673
%0.
2604
9109
30%
0.25
1363
2728
%0.
2531
9947
82%
0.25
2673
9183
%0.
2564
2849
00%
0.24
9362
5419
%0.
2412
9348
27%
$47
, 401
,295
$48
, 771
, 057
56,4
26, 0
1874
, 990
,423
58, 8
18,4
4950
,489
,491
44, 9
31, 3
4739
,348
, 657
2013
2014
o20
1520
1620
1720
1820
1920
20
Not
e:Sc
hedu
leis
inte
nded
tosh
owte
nye
artre
nd. A
dditi
onal
year
sw
illbe
repo
rted
asth
eybe
com
eav
aila
ble.

EXH
IBIT
"L-2
"
FREE
HO
LDR
EGIO
NAL
HIG
HSC
HO
OL
DIS
TRIC
TSC
HED
ULE
OF
THE
DIS
TRIC
T 'S
CO
NTR
IBU
TIO
NS
PUBL
ICEM
PLO
YEES
RETI
REM
ENT
SYST
EMLA
STTE
NYE
ARS
Con
tribu
tions
asa
Perc
enta
geof
Cov
ered
-Em
ploy
eeP
ayro
ll
Con
tribu
tions
inR
elat
ion
toth
eC
ontra
ctua
llyR
equi
red
Con
tribu
tions
Dis
trict
’sC
over
ed-
Empl
oyee
Pay
roll
Con
tract
ually
Req
uire
dC
ontri
butio
n
Con
tribu
tion
Def
icie
ncy
( Exc
ess)
Fisc
alYe
arEn
ding
June
30.
2014
$$
$$
$10
.99%
12.4
7%12
.50%
12.7
3%13
.18%
14.8
7%13
.96%
16.1
4%
1,86
8,77
02,
147,
451
2,16
1,05
02,
249,
388
2,34
0,75
42,
550 ,
635
2,42
5,56
32,
639,
631
1,86
8,77
02,
147,
451
2,16
1 ,05
02,
249 ,
388
2,34
0,75
42,
550 ,
635
2,42
5 ,56
32,
639 ,
631
-0-
16,9
98, 1
2217
,223
,313
17,2
91,1
5417
,667
, 039
17, 7
59,3
7417
,147
,638
17,3
77,5
8016
,349
,754
-0-
2015
2016
-0-
2017
-0-
2018
-0-
2019
-0-
2020
-0-
2021
-0-
Not
e:Sc
hedu
leis
inte
nded
tosh
owte
nye
artre
nd.A
dditi
onal
year
sw
illbe
repo
rted
asth
eybe
com
eav
aila
ble.

EXH
IBIT
" L-3 "
FREE
HO
LDR
EGIO
NAL
HIG
HSC
HO
OL
DIS
TRIC
TSC
HED
ULE
OF
THE
DIS
TRIC
T 'S
PRO
POR
TIO
NAT
ESH
ARE
OF
THE
NET
PEN
SIO
NLI
ABIL
ITY
TEAC
HER
SPE
NSI
ON
AND
ANN
UIT
YFU
ND
LAST
TEN
YEAR
S
Dis
trict
'sPr
opor
tion
Shar
eof
the
Net
Pens
ion
Liab
ility
( Ass
et)
asa
perc
enta
geof
it 'sC
over
ed-
Em
plov
eeP
ayro
ll
Plan
Fidu
ciar
yN
etPo
sitio
nas
ape
rcen
tage
ofth
eto
tal
Pens
ion
Liab
ility
Dis
trict
' sPr
opor
tiona
teSh
are
ofth
eN
etPe
nsio
nLi
abili
ty( A
sset
)
Dis
trict
'sPr
opor
tion
ofth
eN
etPe
nsio
nLi
abili
ty( A
sset
)
Dis
trict
' sC
over
ed-Em
ploy
eeP
ayro
ll
Fisc
alYe
arEn
ding
June
30,
33.7
6%33
.64%
28.7
1 %22
.33%
25.4
1%26
.49%
26.9
5%24
.60%
0.69
6497
1070
%0.
7258
5435
95%
0.72
1632
0523
%0.
7355
0130
65%
0.74
8760
9350
%0.
7465
4117
36%
0.74
1277
5633
%0.
7366
7384
16%
$-0
-20
13$
71,2
84, 3
7773
,554
,631
76,2
15,7
3576
, 690
,024
76, 7
73,7
9775
,957
,485
77, 9
53, 0
2077
,081
, 579
-0-
N>
-0-
- 0-
2014
-0 -20
15- 0
- -0 --0
-20
16-0 -
2017
-0 --0
-20
18- 0
-- 0
--0
-20
1920
20-0 -
-0 -N
ote:
Sche
dule
isin
tend
edto
show
ten
year
trend
. Add
itiona
lyea
rsw
illbe
repo
rted
asth
eybe
com
eav
aila
ble.

EXHIBIT ML-4"
FREEHOLD REGIONAL HIGH SCHOOL DISTRICTNOTES TO REQUIRED SUPPLEMENTARY INFORMATION PART IK
FOR THE FISCAL YEAR ENDED JUNE 30. 2021
PUBLIC EMPLOYEES RETIREMENT SYSTEM (PERS)
Change in benefit terms:
None
Change in assumptions:
The following assumptions were used in calculating the net pensionliability in their respective accounting periods:
Long-TermExpectedRate ofReturn
ActuarialExperience
Study Period07/01/14-06/30/1807/01/14-06/30/1807/01/11-06/30/1407/01/11-06/30/1407/01/11-06/30/1407/01/08-06/30/1107/01/08-06/30/1107/01/08-06/30/11
MeasurementDate Ending
June 30.Discount
Rate7.00%7.00%7.00%7.00%7.65%7.90%7.90%7.90%
7.00%6.28%5.66%5.00%3.98%4.90%5.39%5.55%
20202019201820172016201520142013
TEACHERS PENSION AND ANNUITY FUND (TPAR
Change in benefit terms:
None
Change in assumptions:
The following assumptions were used in calculating the net pensionliability in their respective accounting periods:
Long-TermExpectedRate ofReturn
ActuarialExperience
Study Period
MeasurementDate Ending
June 30.Discount
Rate5.40%5.60%4.86%4.25%3.22%4.13%4.68%4.95%
07/01/15-06/30/1807/01/15-06/30/1807/01/12-06/30/1507/01/12-06/30/1507/01/12-06/30/1507/01/09-06/30/1207/01/09-06/30/1207/01/09-06/30/12
7.00%7.00%7.00%7.00%7.65%7.90%7.90%7.90%
20202019201820172016201520142013
113

REQUIRED SUPPLEMENTARY INFORMATION - PART IV
114

SCHEDULE RELATED TO ACCOUNTING AND REPORTING FOR POSTEMPLOYMENT BENEFITS OTHER THANPENSIONS (GASB 75)
115

EXHIBIT "M-r
FREEHOLD REGIONAL HIGH SCHOOL DISTRICTSCHEDULE OF CHANGES IN THE
TOTAL OPEB LIABILITY AND RELATED RATIOSLAST TEN YEARS
Fiscal Year Ended June 30,
2020 2019 2018 2017Changes for the year:
Service costInterestDifferences between expected
and actual experienceChanges in assumptions or
other inputsMembership ContributionsBenefit Payments - Net
Net changes
$10,822,0329,728,193
$10,681,79411,802,170
$12,065,68612,633,063
14.557,134.0010,916,077.00
72,212,559 (45,960,962)
79,602,301229,949
(7,586,597)
4.037,248246,389
(8,311,925)
(63,349.626)275,658
(7,975,856)
(45,435,718.00)293,930.00
(7,972,348.00)165,008,437 (27,505,286) (46,351,075) (27,640,925)
Beginning Balance $270,773,043 $298,278.329 344.629,404 372,280,329
Ending Balance $270,773,043$435,781,480 $298,278,329 $344,639,404
Covered Employee Payroll 94,459.159 95,100,658 93.716.859 94,440,836
District's Proportionate Share of the Total Non-EmployerOPEB Liability as a percentage of the District'sCovered Employee Payroll
-0- -0--0- -0-
State's Proportionate Share of the Total Non-EmployerOPEB Liability associated with the District as apercentage of the District’s Covered Employee Payroll 320.37% 364.92%461.34% 284.04%
Note: Schedule is intended to show ten year trend. Additional years will be reported as they become available.
116

EXHIBIT "M-2"
FREEHOLD REGIONAL HIGH SCHOOL DISTRICTNOTES TO REQUIRED SUPPLEMENTARY INFORMATION PART IV
FOR THE FISCAL YEAR ENDED JUNE 30, 2021
Change in benefit terms: None
Change in assumptions:The following assumptions were used in calculating the net OPEB liabilityin their respective accounting periods:
MeasurementDate Ending
June 30,
DiscountRate
202020192018
2.21%3.50%3.87%
117

OTHER SUPPLEMENTARY INFORMATION
118

SPECIAL REVENUE FUNDDETAIL STATEMENTS
119

EXHI
BIT
" E-1 "
SHEE
T# 1
FREE
HO
LDR
EGIO
NAL
HIG
HSC
HO
OL
DIS
TRIC
TSP
ECIA
LRE
VENU
EFU
NDC
OM
BIN
ING
SCH
EDU
LEO
FR
EVEN
UES
AND
EXPE
NDIT
URES
-BU
DG
ETAR
YBA
SIS
FOR
THE
FISC
ALYE
AREN
DED
JUN
E30
.20
21
TITL
EIII
IMM
IGR
ANT
CARL
D.PE
RKI
NS
TITL
EI
TITL
EU
ATI
TLE
IIAPY
TITL
EIII
TITL
EIV
IDEA
PAR
TB
REVE
NUES
:Fe
dera
lsou
rces
Stat
eso
urce
sO
ther
sour
ces
45, 2
30$
25, 8
80$
1,24
5$
2,19
8,63
7$
$61
3,52
0$
91, 6
73$
42.6
89S
24, 9
35
613,
520
$91
,673
$45
, 230
25, 8
80$
1,24
5$
42, 6
892,
198,
637
$24
, 935
Tota
lreve
nues
$
EXPE
NDIT
URES
:In
stru
ctio
n :Sa
larie
sof
teac
hers
Othe
rsal
arie
sO
ther
purc
hase
dpr
ofes
sion
al-ed
ucat
iona
lsen
/ ices
Oth
erpu
rcha
sed
serv
ices
Tuitio
nSu
pplie
sand
mat
eria
lsTe
xtbo
oks
Misc
ella
neou
sex
pend
iture
s
284.
612
26, 2
4285
.753
508,
670
16, 9
7193
.050
18, 0
0015
95.
440
6.691
1 ,89
3,25
912
.444
3.44
81,
245
7,89
513
,618
2.97
0
N)
890
597
398
o2,
016 ,
753
400,
174
10, 5
871 ,
245
34, 4
2619
, 217
Tota
linst
ruct
ion
Supp
orts
ervi
ces :
Oth
erSa
larie
sPe
rson
alse
rvice
s -em
ploy
eebe
nefit
sPu
rcha
sedp
rofe
ssio
nal -e
duca
tiona
lser
vices
Purc
hase
dte
chni
cals
ervic
esOt
herp
urch
ased
serv
ices
Supp
lies
and m
ater
ials
Misc
ella
neou
sexp
endi
ture
s
1 ,20
02, 0
0049
, 950
3.82
19 ,
000
42.01
63 ,
214
5,10
419
2.91
216
595
663
7,11
915
8,73
17,
000
3,20
0
600
3,55
323
.379
5.52
316
, 034
1,03
3
5,71
84.
495
8,26
318
1,88
419
9,04
991
, 673
45, 2
30To
tal s
uppo
rtse
rvice
s
Facil
ities
acqu
isitio
nand
cons
truct
ion
serv:
Instr
uctio
nale
quip
men
tN
on-lns
truct
iona
lequ
ipm
ent
10, 7
9814
, 297
10, 7
98To
tal fa
cilitie
sacq
uisi
tion
and
cons
truct
ion
serv .
14, 2
97
25, 8
80$
1.24
5$
42.6
89$
2.19
8 .637
$24
.935
613,
520
$91
, 673
$45
.230
Tota
lexp
endi
ture
sS
Exce
ss(D
efic
ienc
y )of
Rev
enue
sO
ver(
Und
er)E
xpen
ditu
res
Fund
Balan
ce.Jul
y1( a
sres
tate
d )
Fund
Bala
nce,
June
30
( Con
tinue
don
next
page
)

EXHI
BIT'' £'1"
SHEE
TU 2
FREE
HO
LDRE
GIO
NAL
HIG
HSC
HOOL
DIST
RICT
SPEC
IAL
REVE
NUE
FUND
COM
BINI
NGSC
HEDU
LEO
FRE
VENU
ESAN
DEX
PEND
ITUR
ES-B
UDG
ETAR
YBA
SIS
FOR
THE
FISC
ALYE
AREN
DED
JUNE
30,
2021
DIGI
TAL
DIVI
DECO
RONA
VIRU
SRE
LIEF
FUND
fCRF
)NO
NPUB
LIC
NO
N-P
UBLI
CNU
RSIN
GN
ON
*PU
BLIC
TEXT
BOOK
SJR
OTC
CARE
SCR
FR
EVEN
UES
:Fe
dera
lsou
rces
Stat
eso
urce
sO
ther
sour
ces
$24
.632
S55
4.23
95
416.
344
$42
1.02
7S
14,6
60$
24,4
39$
14, 0
89
Tota
lreve
nues
S24
, 632
554,
239
416,
344
$42
1,02
7$
14, 6
60$
24.4
39$
14, 0
89
EXPE
NDIT
URES
:In
stru
ctio
n :Sa
larie
s oft
each
ers
Oth
ersa
larie
sO
ther
purc
hase
dpr
ofes
sion
al-ed
ucat
iona
lser
vice
sO
ther
purc
hase
dse
rvic
esTu
ition
Supp
lies
and
mat
eria
lsTe
xtbo
oks
Misc
ella
neou
sexp
endi
ture
s
24.6
3230
.912
18.1
16
385,
432
113.
610
14.6
6014
, 089
NO
Tota
linst
ruct
ion
24.6
3241
6.34
413
1.72
614
, 660
14, 0
89
Supp
ort s
ervic
es:
Oth
ersa
larie
sPe
rson
alse
rvic
es-e
mpl
oyee
bene
fits
Purc
hase
dpr
ofes
sion
al-ed
ucat
iona
l ser
vice
sPu
rcha
sed
tech
nica
lser
vice
sO
ther
purc
hase
dse
rvice
sSu
pplie
s and
mat
eria
lsM
iscel
lane
ous
expe
nditu
res
5,20
824
, 439
496 ,
474
289, 3
01
501,
682
Tota
l sup
port
serv
ices
289.
301
24, 4
39
Facil
itiesa
cqui
sitio
nan
dco
nstru
ctio
nse
rv.
inst
ruct
iona
lequ
ipm
ent
Non
-Instru
ctio
nale
quip
men
t52
,557
52,5
57To
tal f
acilit
ies
acqu
isiti
onan
dco
nstru
ctio
nse
rv.
Tota
lexp
endi
ture
s24
, 632
$55
4.239
$42
1.027
$$
416,
344
S14
, 660
$24
, 439
$14
, 089
Exce
ss(D
efic
ienc
y )of
Rev
enue
sO
ver(
Unde
r)Ex
pend
iture
s
Fund
Bala
nce .J
uly
1( a
sres
tate
d)
Fund
Bala
nce .J
une
30
( Con
tinue
don n
extp
age )

EXHI
BIT
" E-r
SHEE
T«3
FREE
HO
LDRE
GIO
NAL
HIG
HSC
HOO
LDI
STRI
CTSP
ECIA
LRE
VENU
EFU
NDCO
MBI
NING
SCHE
DULE
OF
REVE
NUES
AND
EXPE
NDIT
URES
-BUD
GETA
RYBA
SIS
FOR
THE
FISC
ALYE
AREN
DED
JUNE
30.2
021
CARE
ERPA
THW
AYS
YR5
NO
N-P
UBLI
CSE
CURI
TYSU
MM
ERPR
OG
RAM
SST
UDEN
TAC
TIVI
TIES
OTHE
RLO
CAL
SAT
SCHO
LARS
HIPS
TOTA
LRE
VENU
ES:
Fede
rals
ource
sSt
ate
sour
ces
Oth
erso
urce
s
S4.
474.7
1117
5,22
01 ,
569,
556
$41
.825
$94
,867
52,0
005,
946
$S
S12
7 ,43
7$
1,36
3,59
6$
20, 5
77
Tota
l reve
nues
$41
.825
$12
7,43
7S
52, 0
00S
94,8
67$
5 ,94
6$
1,36
3,59
6$
20, 5
77$
6.21
9,48
7
EXPE
NDIT
URES
;
Inst
ruct
ion:
Sala
ries
ofte
ache
rsO
ther
sala
ries
Oth
erpu
rcha
sed
prof
essi
onal
-educ
atio
nals
ervic
esO
ther
purc
hase
dse
rvic
esT u
ition
Supp
liesa
ndm
ater
ials
Text
book
sM
isce
llane
ousE
xpen
ditu
res
284,
612
256,
108
178,
164
80, 3
511.
893,
259
623,
001
14, 0
891 ,
885
500
127.
437
52, 0
00
64, 0
353 ,
644
ro64
, 535
127.
437
Tota
linst
ruct
ion
52,0
003 ,
644
3.33
1 .469
Supp
ort s
ervic
es:
Othe
rsal
arie
sPe
rson
alse
rvic
es-e
mpl
oyee
bene
fits
Purc
hase
dpro
fess
iona
l -edu
catio
nal s
erv
ice
s
Purc
hase
dTe
chni
cal S
ervi
ces
Oth
erpu
rcha
sed
serv
ices
Supp
lies
and
mat
eria
lsM
isce
llane
ous
expe
nditu
res
9 ,45
010
9.72
020
8,75
017
7 ,93
129
, 647
36.2
9685
2,69
21 ,
625 ,
963
761
8,76
420
041
,825
2.30
21 ,
580,
562
45, 4
01
41, 8
2519
, 175
1,5
80, 5
62To
tals
uppo
rtse
rvic
es2,
302
45,4
013,
040 ,
999
Facil
ities
acqu
isitio
nan
dco
nstru
ctio
nse
rv:
Inst
ruct
iona
lequ
ipm
ent
Non
-Inst
ruct
iona
l equ
ipm
ent
11, 1
5736
, 252
52, 5
57
Tota
l facil
itiesa
cqui
sitio
nan
dco
nstru
ctio
nse
rv .11
, 157
88, 8
09
41.8
25S
127.
437
STo
tal e
xpen
ditu
res
S52
, 000
$94
,867
S5,
946
$1.
580, 5
62$
45,4
01S
6.46
1 .277
Exce
ss(D
efic
ienc
y)of
Rev
enue
sO
ver(
Und
er)E
xpen
ditu
res
(216
,966
)( 2
4 ,82
4)( 2
41.7
90)
1 ,13
4 ,47
1Fu
ndBa
lanc
e,Ju
ly1
( as r
esta
ted)
832,
079
1 ,96
6 ,55
0
807 ,
255
Fund
8a! an
ce,J
une
3091
7 ,50
51.7
24, 7
60—
tsaa

CAPITAL PROJECTS FUNDDETAIL STATEMENTS
123

EXHI
BIT
MF-1
M
FREE
HOLD
REGI
ONAL
HIG
HSC
HOO
LDI
STRI
CTCA
PITA
LPR
OJE
CTS
FUND
SUM
MAR
YST
ATEM
ENT
OF
PRO
JECT
EXPE
NDIT
URES
-BU
DGET
ARY
BASI
SA
SO
FJU
NE
30.2
021
( MEM
OON
LY)
UNEX
PEND
EDPR
OJEC
TBA
LANC
E
REVI
SED
BUDG
ETAR
YAP
PROP
RIAT
IONS
ORIG
INAL
DATE
EXPE
NDIT
URES
TOPA
TECU
RREN
TYE
ARPR
IOR
YEAR
ISSU
E/PR
OJE
CTTI
TLE
$1,
194 ,
713
$1,
194,
713
$6/
20/ 2
014
$Fr
eeho
ldBo
roHi
ghSc
hool
-Ro
ofRe
plac
emen
t
6/20
/201
489
2 ,96
389
2 ,96
3M
arlb
oro
High
Scho
ol-R
oofR
epla
cem
ent
Free
hold
Boro
High
Scho
ol-
Boile
r&HV
ACRe
plac
emen
t6/
20/ 2
014
1 ,67
8 ,82
41,
678 ,
824
Distr
ictwi
deEn
ergy
Savi
ngs
Impr
ovem
entP
lan
79,1
3119
,228
,702
19,1
49, 5
713/
10/ 2
014
ro62
9,14
56 /
26/ 2
015
629 ,
145
4̂Co
ltsNe
ckHi
ghSc
hool
-Roo
fRep
lace
men
t
1 ,59
0,48
56/
26/ 2
015
1 ,59
0,48
5Ho
wellH
igh
Scho
ol-
Roof
Repl
acem
ent
975,
254
975,
254
Free
hold
Town
ship
High
Scho
ol-
Roof
Repl
acem
ent
6/26
/ 201
5
1,39
8,13
9M
anal
apan
High
Scho
ol-R
oofR
epla
cem
ent
6/26
/ 201
51 ,
398,
139
Scho
olSe
curit
yGr
ant:
Inte
riorD
oorS
ecur
ityUp
grad
es-D
istric
twid
e53
, 312
882,
895
12/ 1
0 /20
2093
6,20
7
27,5
09,0
94$
132 ,
443
$$
28, 52
4,43
2$
882,
895
Tota
ls

EXHIBIT "F-2"
FREEHOLD REGIONAL HIGH SCHOOL DISTRICTCAPITAL PROJECTS FUND
SUMMARY SCHEDULE OF REVENUES. EXPENDITURES AND CHANGES IN FUND BALANCE - BUDGETARY BASISFOR THE YEAR ENDED JUNE 30. 2021
Revenues and Other Financing Sources:State SourcesTotal revenues
$ 686,207686,207
Expenditures and Other Financing Uses:Architectural/engineering servicesConstruction servicesTotal expenditures
53,31279,131
132,443
553,764Excess (deficiency) of revenues over (under) expenditures
Other financing sources (uses):Transfer from Emergency ReserveTransfers out
Total other financing sources (uses)
250,000(1,278,263)(1,028,263)
(474,499)Net change in fund balance
1,357,394Fund balance - beginning
882,895$Fund balance - ending
882,895(589,131)
$Fund Balance - budgetary basisSDA Grant not Recognized
293,764$Fund Balance - GAAP basis (B-1)
125

EXHI
BIT
" F-2
a"
FREE
HO
LDR
EGIO
NAL
HIG
HSC
HOO
LDI
STRI
CTC
APIT
ALPR
OJE
CTS
FUN
DSU
MM
ARY
SCH
EDU
LEO
FPR
OJE
CT
REV
ENU
ES. E
XPEN
DITU
RES .
PRO
JEC
TBA
LAN
CE
AND
PRO
JEC
TST
ATU
S-B
UDG
ETAR
YBA
SIS
FREE
HO
LDBO
RO
HIG
HSC
HO
OL
-RO
OF
REP
LAC
EMEN
TFO
RTH
EYE
AREN
DED
JUN
E30
.202
1
Rev
ised
Auth
orize
dCo
stPr
ior P
erio
ds*
Cur
rent
Year
Tota
ls
Rev
enue
san
dO
ther
Fina
ncin
gSo
urce
s :St
ate
Sou
rces
-SD
AG
rant
Cap
ital L
ease
Tota
lrev
enue
s
$$
477,
256
$84
8,25
047
7,25
6$
717,
457
477,
256
717,
457
( 130
,793
)1,
325 ,
506
( 130
, 793
)1 ,
194,
713
1,19
4,71
3
Expe
nditu
res
and
Oth
erFi
nanc
ing
Use
s :Le
gal s
ervi
ces
Arch
itect
ural
/ eng
inee
ring
serv
ices
Oth
erpu
rcha
sed
prof
essi
onal
and
tech
nica
lser
vice
sCo
nstru
ctio
nse
rvic
esTo
tale
xpen
ditu
res
5,50
792
,370
8,53
01 ,
088,
306
5 ,50
792
, 370
8,53
01 ,
088,
306
5,50
792
, 370
8 ,53
01,
088,
306
ro CD
1,19
4,71
31,
194 ,
713
1,19
4 ,71
3
130,
793
$$
Exce
ss( d
efic
ienc
y)of
reve
nues
over
( und
er) e
xpen
ditu
res
$( 1
30, 7
93)
$
Asre
stat
ed
Addi
tiona
lpro
ject
info
rmat
ion :
Proj
ectN
umbe
rG
rant
Dat
eLe
ase
Auth
oriza
tion
Dat
eLe
ase
Auth
orize
dLe
ase
Issu
edO
rigin
alAu
thor
ized
Cost
Cha
nge
inAu
thor
ized
Cos
tRe
vised
Auth
oriz
edC
ost
1650
-050
-14-G
2 AF
06/ 2
0/14
03/1
0/14
$ 930
, 793
$ 930
, 793
$1, 5
51, 3
21( $
356,
608)
$ 1,1
94,7
13
-22.
99%
100.
00%
FY15
FY19
Perc
enta
geln
crea
se/ ( d
ecre
ase)
over
Orig
inal
Auth
orize
dCo
stPe
rcen
tage
com
plet
ion
Orig
inal
targ
etco
mpl
etio
nda
teR
evis
edta
rget
com
plet
ion
date

EXH
IBIT
T-2b
"
FREE
HO
LDR
EGIO
NAL
HIG
HSC
HO
OL
DIS
TRIC
TC
APIT
ALPR
OJE
CTS
FUN
DSU
MM
ARY
SCH
EDU
LEO
FPR
OJE
CT
REV
ENU
ES.E
XPEN
DIT
UR
ES.P
RO
JEC
TBA
LAN
CE
AND
PRO
JEC
TST
ATU
S-B
UD
GET
ARY
BASI
SM
ARLB
OR
OH
IGH
SCH
OO
L-R
OO
FRE
PLAC
EMEN
TFO
RTH
EYE
AREN
DED
JUN
E30
.202
1
Rev
ised
Auth
oriz
edC
ost
Cur
rent
Year
Prio
r Per
iods
*To
tals
Reve
nues
and
Oth
erFi
nanc
ing
Sour
ces:
Stat
eSo
urce
s-S
DA
Gra
ntC
apita
l Lea
seTo
talr
even
ues
336,
764
$55
6,19
933
6,76
4$
587 ,
690
$33
6,76
455
6,19
9$
( 31 ,
491)
892,
963
892,
963
( 31,
491)
924,
454
Expe
nditu
res
and
Oth
erFi
nanc
ing
Use
s :Le
gal s
ervi
ces
Arch
itect
ural
/ eng
inee
ring
serv
ices
Oth
erpu
rcha
sed
prof
essi
onal
and
tech
nica
l ser
vice
sC
onst
ruct
ion
serv
ices
Tota
lexp
endi
ture
s
2,98
968
, 618
9,43
781
1,91
9
2,98
968
, 618
9 ,43
781
1,91
9
2,98
968
, 618
9,43
781
1 ,91
9
ro NJ
892,
963
892,
963
892,
963
31, 4
91$
( 31 ,
491)
$$
Exce
ss(d
efic
ienc
y)of
reve
nues
over
( und
er)
expe
nditu
res
$
Asre
stat
ed
Addi
tiona
l pro
ject
info
rmat
ion:
Proj
ectN
umbe
rG
rant
Dat
eLe
ase
Auth
oriz
atio
nD
ate
Leas
eAu
thor
ized
Leas
eIs
sued
Orig
inal
Auth
oriz
edCo
stAd
ditio
nalA
utho
rized
Cos
tR
evis
edAu
thor
ized
Cos
t
1650
-080
-14 -
G2A
J06
/ 20 /
1403
/ 10 /
14$ 5
05, 1
47$ 5
05, 1
47$ 8
41, 9
11$ 5
1,05
2$ 8
92, 9
63
6.06
%10
0.00
%FY
15FY
18
Perc
enta
geln
crea
se/( d
ecre
ase)
over
Orig
inal
Auth
orize
dC
ost
Per
cent
age
com
plet
ion
Orig
inal
targ
etco
mpl
etio
nda
teR
evis
edta
rget
com
plet
ion
date

EXHI
BIT
"F^c "
FREE
HO
LDR
EGIO
NAL
HIG
HSC
HO
OL
DIS
TRIC
TC
APIT
ALPR
OJE
CTS
FUN
DSU
MM
ARY
SCH
EDU
LEO
FPR
OJE
CT
REV
ENU
ES.E
XPEN
DIT
UR
ES.P
RO
JEC
TBA
LAN
CE
AND
PRO
JEC
TST
ATU
S-B
UD
GET
ARY
BASI
SFR
EEH
OLD
BOR
OH
IGH
SCH
OO
L-B
OIL
ER&
HVA
CR
EPLA
CEM
ENT
FOR
THE
YEAR
ENDE
DJU
NE
30.2
021
Rev
ised
Auth
oriz
edC
ost
Cur
rent
Year
Tota
lsPr
iorP
erio
ds*
Rev
enue
san
dO
ther
Fina
ncin
gSo
urce
s:St
ate
Sour
ces
-SD
AG
rant
Cap
italL
ease
Tota
lrev
enue
s
668 ,
135
$1 ,
521 ,
657
$66
8,13
5$
1 ,01
0,68
9$
668,
135
1,01
0 ,68
9( 5
10, 9
68)
1,67
8,82
41,
678,
824
2,18
9,79
2( 5
10, 9
68)
Expe
nditu
res
and
Oth
erFi
nanc
ing
Use
s :Le
gal s
ervic
esAr
chite
ctur
ai/ e
ngin
eerin
gse
rvic
esO
ther
purc
hase
dpr
ofes
sion
alan
dte
chni
cals
ervi
ces
Con
stru
ctio
nse
rvic
esTo
tal e
xpen
ditu
res
—V9,
003
100, 7
5612
, 431
1,55
6 ,63
4
9,00
310
0,75
612
, 431
1,55
6,63
4
9,00
310
0,75
612
,431
1,55
6,63
4
M CO
1,67
8,82
41,
678,
824
1,67
8,82
4
$51
0,96
8$
( 510
, 968
)$
Exce
ss( d
efici
ency
) of r
even
ues
over
( und
er) e
xpen
ditu
res
$
*As
rest
ated
Addi
tiona
lpro
ject
info
rmat
ion :
Proj
ect N
umbe
rG
rant
Dat
eLe
ase
Auth
oriza
tion
Dat
eLe
ase
Auth
oriz
edLe
ase
Issu
edO
rigin
alAu
thor
ized
Cos
tC
hang
ein
Auth
oriz
edC
ost
Rev
ised
Auth
oriz
edC
ost
1650
-050 -
14-G
2AE
06/2
0 /14
03/1
0/14
$ 1, 5
21, 6
57$1
, 521
, 657
$ 2, 5
36, 0
95( $
857,
271)
$1, 6
78, 8
24
-33.
80%
100.
00%
Perc
enta
geln
crea
se/ ( d
ecre
ase)
over
Orig
inal
Auth
oriz
edC
ost
Perc
enta
geco
mpl
etio
nO
rigin
alta
rget
com
plet
ion
date
Rev
ised
targ
etco
mpl
etio
nda
teFY
15FY
18

EXH
IBIT
T-2
cT
FREE
HOLD
REG
ION
ALH
IGH
SCH
OO
LDI
STRI
CTC
APIT
ALPR
OJE
CTS
FUN
DSU
MM
ARY
SCH
EDU
LEO
FPR
OJE
CT
REV
ENU
ES.E
XPEN
DIT
UR
ES.P
RO
JEC
TBA
LANC
EAN
DPR
OJE
CT
STAT
US-B
UD
GET
ARY
BASI
SD
ISTR
ICTW
IDE
ENER
GY
SAVI
NG
SIM
PRO
VEM
ENT
PLAN
FOR
THE
YEAR
ENDE
DJU
NE
30.2
021
Rev
ised
Auth
oriz
edC
ost
Cur
rent
Year
Prio
r Per
iods
Tota
ls
Rev
enue
san
dO
ther
Fina
ncin
gSo
urce
s :En
ergy
savi
ngs
oblig
atio
ns(E
SIP)
Tran
sfer
from
Cap
ital R
eser
veTo
tal r
even
ues
$17
,500
, 000
$2,
000,
000
$17
, 500
, 000
$1,
728,
702
17,5
00, 0
001,
728,
702
( 271
, 298
)19
,228
, 702
19, 2
28, 7
0219
, 500
,000
( 271
,298
)
Expe
nditu
res
and
Oth
erFi
nanc
ing
Use
s :Le
gal s
ervic
esAr
chite
ctur
al/ e
ngin
eerin
gse
rvice
sO
ther
purc
hase
dpr
ofes
sion
alan
dte
chni
cals
ervic
esCo
nstru
ctio
nse
rvic
esTo
tale
xpen
ditu
res
17, 5
001,
413,
070
67, 4
7317
, 651
, 528
17, 5
001,
416,
676
67, 4
7317
, 727
,053
17, 5
001 ,
416 ,
676
67, 4
7317
, 727
, 053
ro3 ,
606
co
75, 5
2519
, 228
, 702
19,1
49, 5
7119
,228
, 702
79, 1
31
350,
429
$$
$( 3
50, 4
29)
$Ex
cess
( def
icie
ncy)
ofre
venu
esov
er( u
nder
) exp
endi
ture
s
Addi
tiona
lpro
ject
info
rmat
ion :
Proj
ectN
umbe
rG
rant
Dat
eLe
ase
Auth
oriz
atio
nD
ate
Leas
eAu
thor
ized
Leas
eIs
sued
Orig
inal
Auth
oriz
edCo
stAd
ditio
nalA
utho
rized
Cost
Rev
ised
Auth
orize
dC
ost
N/ A
N/ A
03/1
0 /14
$ 17,
500,
000
$ 17,
500,
000
$ 17,
500,
000
$ 1, 7
28, 7
02$ 1
9,22
8 ,70
2
9.88
%10
0.00
%FY
16FY
19
Perc
enta
geln
crea
se/ ( d
ecre
ase)
over
Orig
inal
Auth
oriz
edCo
stPe
rcen
tage
com
plet
ion
Orig
inal
targ
etco
mpl
etio
nda
teR
evis
edta
rget
com
plet
ion
date

EXH
IBIT
" F-2e
M
FREE
HO
LDR
EGIO
NAL
HIG
HSC
HO
OL
DIS
TRIC
TC
APIT
ALPR
OJE
CTS
FUN
DSU
MM
ARY
SCHE
DULE
OF
PRO
JEC
TR
EVEN
UES
.EXP
ENDI
TURE
S.PR
OJE
CT
BALA
NC
EAN
DPR
OJE
CT
STAT
US
-BU
DG
ETAR
YBA
SIS
COLT
SNE
CKHI
GH
SCHO
OL
-RO
OF
REPL
ACEM
ENT
FOR
THE
YEAR
END
EDJU
NE
30.2
021
Rev
ised
Auth
oriz
edC
ost
Prio
rPer
iods
Cur
rent
Year
Tota
ls
Rev
enue
san
dO
ther
Fina
ncin
gSo
urce
s :St
ate
Sour
ces
-SD
AG
rant
Cap
ital L
ease
Tota
l rev
enue
s
249 ,
373
$43
2,12
0$
249 ,
373
$37
9,77
224
9,37
337
9,77
2$
(52 ,
348)
(52 ,
348)
629,
145
629,
145
681,
493
Expe
nditu
res
and
Oth
erFi
nanc
ing
Use
s :Le
gal s
ervi
ces
Arch
itect
ural/
engi
neer
ing
serv
ices
Oth
erpu
rcha
sed
prof
essi
onal
and
tech
nica
lser
vice
sC
onst
ruct
ion
serv
ices
Tota
lexp
endi
ture
s
1 ,98
758
, 047
9 ,55
955
9,55
2
1,98
758
, 047
9,55
955
9,55
2
1,98
758
, 047
9,55
955
9,55
2co o
629,
145
629 ,
145
629,
145
$( 5
2,34
8)$
$52
, 348
$Ex
cess
( def
icie
ncy)
ofre
venu
esov
er( u
nder
) exp
endi
ture
s
Addi
tiona
l pro
ject
info
rmat
ion :
Proj
ect N
umbe
rG
rant
Dat
eLe
ase
Auth
oriza
tion
Dat
eLe
ase
Auth
orize
dLe
ase
Issu
edO
rigin
alAu
thor
ized
Cos
tC
hang
ein
Auth
orize
dC
ost
Rev
ised
Auth
orize
dC
ost
1650
-010
-14-G
2WA
06/ 2
6/15
02/ 1
1/15
$ 517
, 991
$ 517
,991
$ 863
, 318
($23
4,17
3)$ 6
29, 1
45
-27.1
2%10
0.00
%FY
16FY
17
Perc
enta
gein
crea
se/( d
ecre
ase)
over
Orig
inal
Auth
oriz
edC
ost
Perc
enta
geco
mpl
etio
nO
rigin
alta
rget
com
plet
ion
date
Revis
edta
rget
com
plet
ion
date

EXH
IBIT
MF-2f
*
FREE
HOLD
REG
IONA
LH
IGH
SCHO
OL
DIST
RICT
CAP
ITAL
PRO
JECT
SFU
ND
SUM
MAR
YSC
HED
ULE
OF
PRO
JECT
REVE
NUES
.EXP
ENDI
TURE
S .PR
OJE
CTBA
LANC
EAN
DPR
OJE
CTST
ATU
S-B
UDG
ETAR
YBA
SIS
HO
WEL
LH
IGH
SCHO
OL
-RO
OF
REPL
ACEM
ENT
FOR
THE
YEAR
END
EDJU
NE
30.2
021
Revis
edAu
thor
ized
Cos
tC
urre
ntYe
arTo
tals
Prio
r Per
iods
Rev
enue
san
dO
ther
Fina
ncin
gSo
urce
s:St
ate
Sour
ces
-SD
AG
rant
Cap
ital L
ease
Tota
lrev
enue
s
$63
1,81
9$
958,
666
631 ,
819
958 ,
666
$63
1 ,81
9$
1,10
2 ,39
2( 1
43,7
26)
1,59
0 ,48
51,
734 ,
211
( 143
, 726
)1,
590,
485
Expe
nditu
res
and
Oth
erFi
nanc
ing
Use
s :Le
gal s
ervi
ces
Arch
itect
ural
/ eng
inee
ring
serv
ices
Oth
erpu
rcha
sed
prof
essi
onal
and
tech
nica
l ser
vice
sCo
nstru
ctio
nse
rvic
esTo
tal e
xpen
ditu
res
4,92
214
3 ,76
719
,784
1,42
2,01
2
4,92
214
3,76
719
,784
1,42
2,01
2
4,92
214
3 ,76
719
,784
1,42
2,01
2co
1,59
0 ,48
51,
590,
485
1,59
0,48
5
$( 1
43,7
26)
$14
3,72
6$
Exce
ss(d
efic
ienc
y)of
reve
nues
over
(und
er)
expe
nditu
res
$
Addi
tiona
l pro
ject
info
rmat
ion :
Proj
ect N
umbe
rG
rant
Dat
eLe
ase
Auth
oriza
tion
Dat
eLe
ase
Auth
orize
dLe
ase
Issu
edO
rigin
alAu
thor
ized
Cos
tC
hang
ein
Auth
orize
dC
ost
Revis
edAu
thor
izedC
ost
1650
-060 -1
4 -G
2 AH
06/2
6 /15
02/ 1
1/15
$ 1, 3
21, 6
27$ 1
, 321,
627
$ 2, 2
02, 7
12( $
612,
227)
$ 1,5
90,4
85
-2779
%10
0.00
%FY
16FY
17
Perc
enta
geln
crea
se/( d
ecre
ase)
over
Orig
inal
Auth
oriz
edC
ost
Perc
enta
geco
mpl
etio
nO
rigin
alta
rget
com
plet
ion
date
Revis
edta
rget
com
plet
ion
date

EXHI
BIT
"F-2
Q "
FREE
HO
LDR
EGIO
NAL
HIG
HSC
HOO
LDI
STRI
CTC
APIT
ALPR
OJE
CTS
FUN
DSU
MM
ARY
SCHE
DULE
OF
PRO
JEC
TR
EVEN
UES
.EXP
END
ITU
RES
.PR
OJE
CT
BALA
NCE
AND
PRO
JEC
TST
ATUS
-BU
DG
ETAR
YBA
SIS
FREE
HOLD
TOW
NSH
IPH
IGH
SCHO
OL
-RO
OF
REPL
ACEM
ENT
FOR
THE
YEAR
ENDE
DJU
NE30
.202
1
Rev
ised
Auth
orize
dC
ost
Curre
ntYe
arPr
iorP
erio
dsTo
tals
Rev
enue
san
dO
ther
Fina
ncin
gSo
urce
s :St
ate
Sour
ces
-SD
AG
rant
Capi
tal L
ease
Tota
lrev
enue
s
387,
125
$58
8 ,12
9$
387,
125
$63
1 ,12
2$
387,
125
588,
129
( 42,
993)
1,01
8 ,24
7( 4
2,99
3)97
5,25
497
5,25
4
Expe
nditu
res
and
Oth
erFi
nanc
ing
Use
s :Le
gal s
ervi
ces
Arch
itect
ural
/ eng
inee
ring
serv
ices
Oth
erpu
rcha
sed
prof
essi
onal
and
tech
nica
lser
vice
sC
onst
ruct
ion
serv
ices
Tota
lexp
endi
ture
s
3,08
071
, 532
12, 7
2188
7 ,92
1
3,08
071
, 532
12,7
2188
7 ,92
1
3,08
071
, 532
12, 7
2188
7,92
1co
975,
254
975,
254
975,
254
42, 9
93$
( 42,
993)
$$
Exce
ss(d
efic
ienc
y)of
reve
nues
over
( und
er) e
xpen
ditu
res
$
Addi
tiona
lpro
ject
info
rmat
ion:
Proj
ectN
umbe
rG
rant
Date
Leas
eAu
thor
izatio
nD
ate
Leas
eAu
thor
ized
Leas
eIs
sued
Orig
inal
Auth
oriz
edC
ost
Cha
nge
inAu
thor
ized
Cos
tRe
vised
Auth
oriz
edC
ost
1650
-055 -1
4 -G2A
G06
/ 26/
1502
/ 11/
15$ 7
70, 9
71$ 7
70, 9
71$ 1
, 284
,952
($30
9,69
8 )$ 9
75, 2
54
-24.
10%
100.
00%
FY16
FY19
Perc
enta
geln
crea
se/ ( d
ecre
ase)
over
Orig
inal
Auth
oriz
edC
ost
Perc
enta
geco
mpl
etio
nO
rigin
alta
rget
com
plet
ion
date
Revis
edta
rget
com
plet
ion
date

EXHI
BIT
"F-2h
"
FREE
HOLD
REG
ION
ALH
IGH
SCH
OO
LDI
STRI
CTC
APIT
ALPR
OJE
CTS
FUN
DSU
MM
ARY
SCHE
DULE
OF
PRO
JECT
REVE
NUES
.EXP
ENDI
TURE
S .PR
OJE
CT
BALA
NC
EAN
DPR
OJE
CTST
ATU
S-B
UDG
ETAR
YBA
SIS
MAN
ALAP
ANHI
GH
SCHO
OL
-RO
OF
REP
LAC
EMEN
TFO
RTH
EYE
AREN
DED
JUN
E30
.202
1
Rev
ised
Auth
orize
dC
ost
Prio
r Per
iods
Cur
rent
Year
Tota
ls
Rev
enue
san
dO
ther
Fina
ncin
gSo
urce
s:St
ate
Sour
ces
-SD
AG
rant
Cap
italL
ease
Tota
lrev
enue
s
$40
8 ,41
9$
1,08
4,36
6$
408,
419
$98
9 ,72
040
8,41
998
9,72
0( 9
4 ,64
6)( 9
4 ,64
6)1,
398 ,
139
1 ,49
2,78
51,
398,
139
Expe
nditu
res
and
Oth
erFi
nanc
ing
Use
s :Le
gal s
ervi
ces
Arch
itect
ural
/ eng
inee
ring
serv
ices
Oth
erpu
rcha
sed
prof
essi
onal
and
tech
nica
lser
vices
Cons
truct
ion
serv
ices
Tota
lexp
endi
ture
s
5 ,28
810
1,85
611
, 575
1 ,27
9,42
0
5,28
810
1 ,85
611
,575
1,27
9,42
0
5 ,28
810
1,85
611
, 575
1 ,27
9,42
0co co
1,39
8 ,13
91 ,
398,
139
1 ,39
8,13
9
$Ex
cess
(def
icie
ncy)
ofre
venu
esov
er( u
nder
) exp
endi
ture
s$
94, 6
46$
( 94,
646)
$
Addi
tiona
lpro
ject
info
rmat
ion :
Proj
ectN
umbe
rG
rant
Dat
eLe
ase
Auth
oriza
tion
Date
Leas
eAu
thor
ized
Leas
eIs
sued
Orig
inal
Auth
oriz
edCo
stAd
ditio
nalA
utho
rized
Cost
Rev
ised
Auth
oriz
edC
ost
1650
-070 -1
4 -G2 A
I06
/ 26/
1502
/ 11/
15$ 6
12, 6
29$ 6
12, 6
29$ 1
, 021
,048
$ 377
, 091
$ 1, 3
98, 1
39
36.9
3%10
0.00
%FY
16FY
19
Perc
enta
ge! n
crea
se/( d
ecre
ase)
over
Orig
inal
Auth
oriz
edC
ost
Perc
enta
geco
mpl
etio
nO
rigin
alta
rget
com
plet
ion
date
Rev
ised
targ
etco
mpl
etio
nda
te

EXH
IBIT
"F-2
iM
FREE
HO
LDR
EGIO
NAL
HIG
HSC
HO
OL
DIS
TRIC
TC
APIT
ALPR
OJE
CTS
FUN
DSU
MM
ARY
SCH
EDU
LEO
FPR
OJE
CT
REV
ENU
ES.EX
PEN
DIT
UR
ES.P
RO
JEC
TBA
LAN
CE
AND
PRO
JEC
TST
ATU
S-B
UD
GET
ARY
BASI
SSC
HOO
LSE
CU
RIT
YG
RAN
T :IN
TER
IOR
DO
OR
SEC
UR
ITY
UPG
RAD
ES-D
ISTR
ICTW
IDE
FOR
THE
YEAR
END
EDJU
NE
30.2
021
Rev
ised
Auth
oriz
edC
ost
Prio
r Per
iods
Cur
rent
Year
Tota
ls
Rev
enue
san
dO
ther
Fina
ncin
gSo
urce
s:St
ate
Sour
ces
-Sch
oolS
ecur
ityG
rant
Tran
sfer
from
emer
genc
yre
serv
eTo
talr
even
ues
S68
6,20
7$
250,
000
$68
6,20
7$
250 ,
000
686,
207
250 ,
000
936,
207
936 ,
207
936 ,
207
Expe
nditu
res
and
Oth
erFi
nanc
ing
Use
s :Ar
chite
ctur
al/ e
ngin
eerin
gse
rvic
esC
onst
ruct
ion
serv
ices
Tota
lexp
endi
ture
s
53, 3
1253
, 312
69,7
5086
6,45
7oo -fc.
53, 3
1253
, 312
936 ,
207
Exce
ss(d
efic
ienc
y )of
reve
nues
over
(und
er) e
xpen
ditu
res
$-
$88
2,89
5$
882,
895
$
Addi
tiona
lpro
ject
info
rmat
ion:
Proj
ect N
umbe
rG
rant
Dat
eLe
ase
Auth
oriza
tion
Dat
eLe
ase
Auth
orize
dLe
ase
Issu
edO
rigin
alAu
thor
ized
Cos
tAd
ditio
nalA
utho
rized
Cos
tR
evis
edAu
thor
ized
Cos
t
1650
-XXX
-21-10
0005
/ 17/
21N
/ AN
/ AN
/ A$ 9
36, 2
07
Perc
enta
geln
crea
se/ ( d
ecre
ase)
over
Orig
inal
Auth
oriz
edC
ost
Perc
enta
geco
mpl
etio
nO
rigin
alta
rget
com
plet
ion
date
Rev
ised
targ
etco
mpl
etio
nda
te
0.00
%0.
00%
FY22

PROPRIETARY FUND DETAIL STATEMENTS
Proprietary funds are used to account for operations that are financed and operated in a mannersimilar to private business enterprises - where the intent of the district's board is that the costs
of providing goods or services be financed through user charges.
This fund provides for the operation of Food serviceswithin the school district.
FOOD SERVICES FUND:
This fund provides for the operation of an ice hockey programwithin the school district.
EXTRACURRICULAR FUND
135

EXHIBIT “G-r
FREEHOLD REGIONAL HIGH SCHOOL DISTRICTCOMBINING STATEMENT OF NET POSITION
PROPRIETARY FUNDS - ENTERPRISE FUNDSJUNE 30. 2021
BUSINESS-TYPE ACTIVITIES - ENTERPRISE FUNDFOOD SERVICE
FUNDEXTRA-CURRICULAR
FUND TOTALASSETS:Current assets:
Cash and cash equivalentsAccounts receivable:StateFederalOther
Interfund receivableInventories
$ 51,989 $ 51,989
422 42260,7124,265
161,29740,573
60,71231,217
161,29740,573
26,952
Total current assets 319,258 26,952 346,210
Noncurrent assets:Furniture, machinery and equipmentLess accumulated depreciation
1,055,337(712,345)
1,055,337(712,345)
Total noncurrent assets 342,992 342,992
Total assets 662,250 26,952 689,202
LIABILITIES:Current liabilities:
Accounts payableInterfund payableLease payableUnearned revenue
38,446 38.44626,952
393,10094.446
26,952393,100
94,446
Total current liabilities 525,992 26,952 552,944
Total liabilities 552,944525,992 26,952
NET POSITION:Net investment in capital assetsUnrestricted
96,99139,267
96,99139,267
Total net position $ 136,258 $ 136,258$
136

EXHIBIT "G-2"
FREEHOLD REGIONAL HIGH SCHOOL DISTRICTCOMBINING STATEMENT OF REVENUES. EXPENSES AND CHANGES IN FUND NET POSITION
PROPRIETARY FUNDS - ENTERPRISE FUNDSFOR THE FISCAL YEAR ENDED JUNE 30. 2021
BUSINESS-TYPE ACTIVITIES - ENTERPRISE FUNDFOOD SERVICE
FUNDEXTRA-CURRICULAR
FUND TOTALOPERATING REVENUES:
Charges for services:Daily sales - reimbursable programsDaily sales - non-reimbursable programsSpecial functionsFees - individuals
$ $ $
12,4315,674
12,4315,674
110,152110,152
Total operating revenues 18,105 128,257110,152
OPERATING EXPENSES:Cost of sales - reimbursable programsCost of sales - non-reimbursable programsSalaries and benefitsSupplies and materialsManagement feeMiscellaneousDepreciationLease purchase interestFacility rental
83,68725,827
191,930
83,68725,827
293,825101,895599 599
4,37143,50346,06314,963
4,37135,24646,06314,963
8,257
512,838110,152Total operating expenses 402,686
(384,581)(384,581)Operating income (loss)
NONOPERATING REVENUES (EXPENSES):State sourcesState school lunch program
Federal sourcesNational school lunch programSchool breakfast programEmergency Operational Costs Reimbursement Program
National food distribution commodities
1,8741,874
39,28021,53151,78415,592
39,28021,53151,78415,592
130,061130,061Total nonoperating revenues (expenses)
(254,520)Change in net position (254,520)
390,778Total net position - beginning, as restated 390,778
136,258$Total net position - ending $ 136,258 $
137

EXHIBIT "G-3M
FREEHOLD REGIONAL HIGH SCHOOL DISTRICTCOMBINING STATEMENT OF CASH FLOWS
PROPRIETARY FUNDS - ENTERPRISE FUNDSFOR THE FISCAL YEAR ENDED JUNE 30. 2Q21
BUSINESS-TYPE ACTIVITIESENTERPRISE FUND
FOOD SERVICEFUND
EXTRA-CURRICULARFUND TOTAL
Cash flows from operating activities:Receipts from customersPayments to employeesPayments for employee benefitsPayments to suppliers
$ $ 48,510 $(101,895)
(11,217)(182,837)
(9,092)(98,600)
37,293(284,732)
(9,092)(106,857)(8,257)
Net cash provided by (used for) operating activities (301,746) (61,642) (363,388)
Cash flows from noncapital financing activities:State sourcesFederal sourcesOperating subsidies and transfers to other funds
5,33360,430
321,411
5,33360,430
383,05361,642
Net cash provided by noncapital financing activities 387,174 61,642 448,816
Cash flows from capital and related financing activities:Capital lease paymentsPurchases of capital assets
(123,626)(4,643)
(123,626)(4,643)
Net cash provided by (used for)capital and related financing activities (128,269) (128,269)
Net increase (decrease) in cash and cash equivalents (42,841)(42,841)
Cash and cash equivalents, July 1, 2020 94,83094,830
$ 51,989Cash and cash equivalents, June 30, 2021 $ $51,989
Reconciliation of operating income (loss) to net cashprovided (used) by operating activities
Operating income (loss)Adjustments to reconciling operating income (loss) tonet cash provided by (used for) operating activities:DepreciationFederal commodities
Change in assets and liabilities:(Increase) decrease in accounts receivable, netIncrease (decrease) in unearned revenueIncrease (decrease) in accounts payable(Increase) decrease in inventories
$ (384,581)$ (384,581) $
46,06315,592
46,06315,592
(28,361)(27,912)
3,59112,220
(26,952)(1,409)(27,912)38,28112,220
(34,690)
21,193(61,642)82,835
(363,388)Net cash provided by (used for) operating activities (61,642) $(301,746)$ $
138

LONG-TERM DEBT SCHEDULES
The Long-Term schedules are used to reflect the outstanding principal balances of the long-termliabilities of the District. This includes obligations under Serial Bonds and Capital Leases
139

EXH
IBIT
”1 -111
FREE
HOLD
REG
IONA
LH
IGH
SCHO
OL
DIST
RICT
LON
G-TE
RM
DEB
TSC
HEDU
LEO
FSE
RIA
LBO
NDS
JUN
E30
.202
1
BALA
NC
EJU
NE
30.2
021
RA
TEO
FIN
TER
EST
BALA
NCE
JULY
1 .20
20DA
TEM
ATU
RED
DATE
OF
ISSU
EAM
OU
NT
OF
ISS
UE
RET
IRED
DAT
EIS
SUE
Not
Cur
rent
lyAp
plic
able
o$
o$
$
0$
0$
$
o

EXHI
BIT
”1 -2”
FREE
HO
LDR
EGIO
NAL
HIG
HSC
HO
OL
DIS
TRIC
TSC
HED
ULE
OF
OBL
IGAT
ION
SU
ND
ERC
APIT
ALLE
ASES
ASO
FJU
NE
30.2
021
AMO
UNT
OU
TSTA
ND
ING
JUN
E30
.202
0
AMO
UN
TO
UTS
TAN
DIN
GJU
NE
30.2
021
INTE
REST
RATE
PAYA
BLE
AMO
UN
TO
FO
RIG
INAL
LEAS
ED
ECR
EASE
TER
MSE
RIE
SG
over
nem
enta
lFun
ds:
Dis
trict
Wid
eEn
ergy
Savi
ngs
Impr
ovem
entP
lan
( ES
IP)
17,4
98,0
00$
$12
,623
,383
$94
5,41
42.
690%
13, 5
68, 7
9715
Year
s
618,
172
626 ,
147
1.29
0%3,
052,
000
1,24
4,31
9Sc
hool
Buse
s,Te
chno
logy
&Co
pier
s5
Year
s
Scho
olBu
ses,
Tech
nolo
gy&
Build
ings
and
Gro
unds
Equi
pmen
t51
2,59
81,
051,
177
1.68
0%1,
563,
775
5Ye
ars
2,56
0,00
0
Scho
olBu
ses,
Tech
nolo
gy, C
afet
eria
,an
dBu
ildin
gs&
Gro
unds
Equi
pmen
t1,
176,
464
894,
997
1,44
6,61
728
1,46
75
Year
s2.
896%
A
2,35
7 ,65
115
, 195
, 704
17, 5
53,3
55To
talG
over
nmen
talF
unds
Pro
prie
tary
Fund
-Foo
dSe
rvic
e :39
3,10
012
3,62
62.
896%
516,
726
5Ye
ars
635,
383
Cafe
teria
Equi
pmen
t
2,48
1,27
7$
18, 0
70, 0
81$
15, 5
88, 8
04$
Gra
ndTo
tal

THIS PAGE INTENTIONALLY LEFT BLANK

STATISTICAL SECTION - UNAUDITED

FREEHOLD REGIONAL HIGH SCHOOL DISTRICTSTATISTICAL SECTION
PageContents
Financial Trends:
These schedules contain trend information to help the reader understand howthe district's financial performance and well being have changed over time. J-1 to J-4
Revenue Capacity:
These schedules contain information to help the reader assess the district'smost significant local revenue source, the property tax. J-5 to J-9
Debt Capacity:
These schedules present information to help the reader assess the affordabilityof the district's current levels of outstanding debt and the district's ability to issueadditional debt in the future. J-10 to J-13
Demographic and Economic Information:
These schedules offer demographic and economic indicators to help the readerunderstand the environment within which the district's financial activities take place. J-14 to J-15
Operating Information:
These schedules contain service and infrastructure data to help the reader understandhow the information in the district's financial report relates to the services the districtprovides and the activities it performs. J-16 to J-20
Sources
Unless otherwise noted, the information in these schedules is derived from the comprehensive annualfinancial reports (ACFR) for the relevant year.

Exhi
bit J
-1
FREE
HO
LDR
EGIO
NAL
HIG
HSC
HO
OL
DIST
RICT
NET
POSI
TIO
NBY
CO
MPO
NEN
T
LAS
TTE
NFI
SCAL
YEAR
S( A
CCRU
ALBA
SIS
OF
ACC
OU
NTI
NG
)( U
NAU
DIT
ED)
2013
2012
2018
2017
2016
2015
2014
2021
2019
2020
Gov
ernm
entA
ctivi
ties :
NetI
nves
tmen
tin
capi
tal a
sset
sRe
stric
ted
Unre
stric
ted(
defic
it)
64, 8
42, 3
5021
, 024
, 274
( 195
, 128
)
87, 2
07, 1
82$
27, 6
48, 4
06( 5
8,57
5,62
7)
76, 7
58, 4
15$
30, 3
94, 6
25( 5
1,29
2,19
1)
74, 3
31, 4
09$
31.0
27, 1
26( 2
, 056
, 310
)
76, 3
97, 0
45$
27, 3
08.4
31( 1
, 962
, 535
)
93, 8
86, 1
05$
33, 6
24,2
68( 6
0,70
8,54
2)
90, 8
58, 0
48$
28.1
30, 9
55( 6
1, 144
, 214
)
89, 0
24, 7
27$
26, 1
12, 0
90( 6
0,74
5 ,28
0)
80, 4
65.5
72$
28, 4
46, 9
08( 5
0,66
7,79
5)
$90
, 306
, 871
$40
, 677
.885
( 53,
868,
903)
101,
742,
941
$85
,671
, 496
54, 3
91, 5
37$
56, 2
79, 9
61$
58, 2
44, 6
85$
55, 8
60, 8
49$
103,
302.
225
$66
, 801
, 831
$57
, 844
, 789
STo
talG
over
nmen
tAct
iviti
esNe
tPos
ition
$77
, 115
, 853
$
Busin
ess -T
ype
Activ
ities :
Net
Inve
stm
ent i
nca
pita
l ass
ets
Unre
stric
ted
220, 7
47$
215,
462
271,
952
$30
9,74
789
, 992
624,
296
493 , 1
55$
171,
231
154,
865
$66
7,14
818
2,31
5$
413,
584
238.3
57$
129,
757
61, 0
45$
329,
733
38, 2
28$
429,
653
$96
, 991
$39
,267
436,
209
$36
8,11
4$
581.
699
$71
4,28
866
4,38
6$
822,
013
$59
5,89
9$
390.
778
$46
7,88
1$
Tota
lBus
ines
s -Typ
eAc
tivitie
sN
etPo
sitio
n$
136 ,
258
$
Dist
rict -w
ide :
Net I
nves
tmen
tinca
pita
l ass
ets
Rest
ricte
d^
Unre
stric
ted(
defic
it)
74, 5
69, 7
66$
31, 0
27, 1
26( 1
, 926
, 553
)
76.6
68,9
97$
27.3
08.43
1( 1, 6
52, 7
88)
64, 9
32, 3
4221
, 024
, 274
429, 1
68
90, 8
96, 2
76$
22, 9
28, 1
42( 5
5, 511
, 748
)
87, 3
62, 0
47$
27, 6
48, 4
06( 5
7,90
8,47
9)
80, 6
47, 8
87$
28.4
46, 9
08( 5
0,25
4,21
1)
76, 9
79, 1
62$
30, 3
94, 6
25( 5
1,07
6,72
9)
$93
, 947, 1
50$
33, 6
24, 2
68( 6
0,37
8 ,80
9)
89, 5
17, 8
82$
26, 1
12, 0
90( 6
0,57
4,04
9)
90, 4
03, 8
62$
40, 6
77, 8
85( 5
3,82
9,63
6)
103.
670 .33
9$
102,
324,
640
$86
, 385
, 784
57, 1
01, 9
74$
58, 8
40, 5
84$
56, 2
97, 0
58$
77.2
52, 1
11$
mia
gg
atr
sig.iiu
.ij, . : ..
67, 1
92, 6
09$
58, 3
12, 6
70$
55, 0
55.9
23$
$To
tal D
istric
tNet
Posit
ion
*20
14ha
sno
tbee
nre
stat
edfo
rthe
impa
ctof
GAS
B68

Exhi
bit J
-2Sh
eet1
FREE
HOLD
REG
ION
ALHI
GH
SCHO
OL
OlS
TRlC
T
CHAN
GES
INNE
TPO
SITI
ON
LAST
TEN
FISC
ALYE
ARS
( ACC
RUAL
BASI
SO
FAC
COUN
TING
)
( UN
AUD
ITED
)
2021
2020
2019
2018
2017
2016
2015
2014
2013
2012
Gov
ernm
enta
lAct
ivitie
s:In
stru
ctio
n:R
egul
arSp
ecia
l Edu
catio
nO
ther
Spec
ialE
duca
tion
Supp
ortS
ervi
ces :
Tuiti
onSt
uden
t&in
stru
ctio
nre
late
dse
rvic
esG
ener
alAd
min
istra
tive
Serv
ices
Scho
olAd
min
istra
tive
Serv
ices
Cen
tra! S
ervi
ces/
Adm
in. In
form
atio
nTe
chno
logy
Plan
tOpe
ratio
nsan
dM
aint
enan
cePu
pilT
rans
porta
tion
Serv
ices
Spec
ial S
choo
lsTr
ansf
erto
Cha
rterS
choo
lsIn
tere
ston
Long
-Term
Deb
tUn
allo
cate
dD
epre
ciat
ion
and
Amor
tizat
ion
S10
4.46
9,26
2$
26.5
84, 9
2910
, 220
,402
94, 3
61, 8
36S
24, 5
37.7
8010
,090
,114
98, 7
63, 6
06S
24.9
53, 8
8411
.215
.656
106.
525,
172
S27
, 318
,294
12,4
00, 2
11
102.
658,
266
S27
.929
, 556
11, 7
47, 4
07
92, 3
43.9
59S
25.7
59, 4
2510
.604
.135
87.5
14,8
68$
24.43
9.970
9,85
9,06
5
75.2
00, 1
78S
20.49
7, 345
8 ,30
6.19
2
80.4
76,8
46S
17,2
29, 0
768,
998.
877
79, 3
20.3
7113
.906
,774
8.91
6,00
4
15.44
8, 397
29, 5
30,2
112,
278,
719
12.2
61.778
5.07
4 .147
17, 8
44, 1
4617
, 281
, 025
15, 6
00.0
9532
.227
.254
1.83
5,50
712
.800
, 205
5,68
1.92
519
.473 .74
917
.235
,383
15.0
76.68
130
.730
.3901,
893.
992
12, 3
30, 1
326.
268 .3
6620
, 976
, 707
16, 6
30.5
74
14.9
80.35
727
.893
.131
1.71
6,51
811
.230
, 302
4 ,71
9,86
917
, 069
.282
16.8
04.098
14, 7
11, 4
9225
, 721
, 936
1 ,70
1.17
710
.673
.330
4.64
4,45
615
.943
.060
17, 1
18.6
97
15.9
45, 5
9130
.945
.020
1,93
6.69
213
, 135
,988
4,51
1,93
714
,456
,372
13, 9
81.76
5
14.8
87, 8
9227
, 900
, 105
1,92
6,59
111
.409
.076
4,55
6,84
015
, 927
, 843
15, 6
12, 4
49
14, 1
04.0
9521
.748
.9661.
675, 8
989.
221 .0
803.
690.8
9415
.679
, 073
16.7
40,3
67
13, 3
43,8
2419
.632
, 989
9 ,44
8.28
32.
011 .0
694.
122, 5
6415
.303.2
9616
, 297
.004
13, 9
94, 3
6218
.231
,436
9.41
9,26
82,
155.
127
3,58
8,07
015
.753
, 689
16, 1
74.0
59
29, 3
121.
872,
820
34.3
0393
6,85
14,
917,
067
1 ,15
9,71
94 ,
667,
161
1.353
.7374 ,
881,
749
8,10
15,
678,
590
192,
408
5,97
8 ,67
844
5.26
35,
884.0
1374
1,08
45,
324,
671
1,54
8,57
14 ,
836,
689
1.699
, 266
34.3
03
252.
095,
989
229.
167,
956
216.
563 .5
3724
1,87
4.64
922
7.33
1, 612
240,
980,
645
257.
163,
550
193,
249.
548
188,
597,
397
183,
395,
595
CO
3,58
3,67
123
3,96
23,
201 ,
580
240,
311
402,
686
110 ,
152
1.89
6,77
121
4.31
82.
723,
536
212.
545
3,16
7,97
525
6,68
83 ,
096,
810
227,
246
3,21
1,87
123
6,78
83,
433,
767
213,
993
Food
Serv
iceEx
traCu
rricu
larF
und
SAT
Prep
Prog
ram
3.56
8,34
723
8,97
625
, 538
3.81
7,63
33,
441 ,
891
3.32
4 .056
3 ,64
7.760
512.
838
2.11
1, 089
2,93
6,08
13 ,
424.
663
3.44
8.659
3.83
2 .861
242.
387 .48
7£
229,
492.7
01S
243,
916,
926
$26
0 ,96
1,18
3S
255,
537,
880
$23
2,59
2,61
9S
221,
887,
593
$19
6.69
8 .207
$19
2,24
5,15
7S
$18
7.22
6 .456
Gov
ernm
enta
lAct
ivitie
s:C
harg
esfo
rSer
vice
s:In
stru
ctio
nO
pera
ting G
rant
san
dCo
ntnb
utio
ns21
2,47
5S
64, 9
54.1
5423
0,37
7$
59.6
93.390
289,
578
S43
.912
.263
1.58
4 .920
$
61.5
23, 7
8044
8 ,19
4S
42, 2
87,8
4734
5,79
7S
50, 0
51,4
8231
9.03
9$
35, 8
21, 8
6725
7.41
8S
16, 8
56, 8
1515
9,31
3$
426,
007
S25
4,97
146
8,01
8
59.9
23,7
6763
,108
, 700
42, 7
36.0
4150
, 397
, 279
65,1
66,6
2944
.201
.841
36, 1
40, 9
0617
.114.2
3358
5.320
722 ,
989
Busi
ness
-Type
Activ
ities :
Cha
rges
for S
ervic
es:
Food
Serv
iceEx
traC
urric
ular
Fund
SAT
Prep
Prog
ram
Ope
ratin
gG
rant
san
dCo
ntrib
utio
ns
2,76
1,40
424
0.31
12.
691 .5
5925
6.68
82.
559.6
0722
7,24
62.
527 .7
3923
6,78
82.
642 .03
719
0.19
318
.105
110,
152
1.33
4 .895
214,
318
1 ,98
7,01
521
2,54
52.
760,
504
233,
962
2,90
9,21
126
2,77
622
.202
433,
012
130,
061
484.
773
540.
016
665.
540
666,
290
636.
106
605 ,
298
470.
547
486.
782
258 ,
318
2.73
9,57
63.
660,
006
3,66
8.00
53.
584,
353
3,39
2,15
13,
235,
074
2.03
3, 986
3,31
9.01
23,
627.
201
68.8
26,6
35S
63.5
91.77
2S
47, 7
86, 1
94S
63, 3
67.0
16S
44.7
70.027
$53
,136
, 655
S39
.533
, 057
S20
.349
.307
SS
3.90
4, 332
S4.
350, 1
90
( 191
, 996
.921
)S
(157
, 627
)( 1
92, 1
72, 2
22)
$
226,
114
( 184
.966
, 115
)S
159.
690
( 182
, 422
.631
)S
68, 0
95( 1
76, 1
35, 3
15)
S( 2
13, 5
85)
$( 1
78.7
65,9
49)
S( 2
54, 5
20)
( 184
, 645
.571
)S
( 77,
103)
( 190
.533
, 566
)S
( 196
.505
)( 1
88, 01
2.077
)S
( 328
, 748
)( 1
82.6
72.60
5)( 2
05.6
60)
Gov
ernm
enta
lAct
iviti
esBu
sines
s -Typ
eAc
tivitie
s
( 179
, 020
, 469
)$
( 134
, 722
, 674)
S( 1
90, 7
80.0
71)
S( 1
92,1
54, 5
48)
S( 1
91, 9
46,1
08)
£( 1
84.8
06, 4
25)
S( 1
82, 3
54.5
36)
S( 1
76, 3
48, 9
00)
S( 1
88.3
40,8
25)
S( 1
82, 8
78, 2
65)
$

Exhi
bit J
-2Sh
eet2
FREE
HO
LDRE
GIO
NAL
HIG
HSC
HOOL
DIS
TRIC
T
CHAN
GES
INNE
TPO
SITI
ON
LAST
TEN
FISC
ALYE
ARS
( ACC
RUAL
BASI
SO
FAC
COUN
TING
)( U
NAU
DIT
ED)
2021
2020
2019
2018
2017
2 Q16
2015
2014
2013
2012
Gov
ernm
enta
lAct
ivitie
s :Pr
oper
lyTa
xes
Levi
edfo
rGen
era !
Purp
oses
, Net
5Ta
xes
Levi
edfo
rD
ebt S
ervic
eU
nres
trict
edG
rant
san
dC
ontri
butio
nsR
estri
cted
Gra
nts
and
Con
tribu
tions
Mis
cella
neou
sIn
com
eGa
inZ( L
oss)
onSa
leof
Equ
ipm
ent
140.
379,
308
S13
7.62
6 .773
S4 ,
136.
159
49, 8
55, 4
881.
297 .3
9968
6.79
4
134.
270,
320
$4.
122,
537
53, 4
80.9
211 ,
290.
740
872.
300
131.
637,
569
S4.
114.7
7954
, 362
, 826
1 ,22
1.65
945
9.66
1
128,
147.
673
S4.
105.6
9854
.709
, 469
1 ,16
1,89
82.
082 .7
60
125.6
34.97
4$
4.09
9.644
54.2
24, 3
172.
651, 1
6678
2,77
0( 4
2.92
0)
121,
473,
208
S4.
093, 2
1054
, 428
, 665
2.23
9 .175
148.
292
119,
091.
381
S4,
086.
778
54.01
5.433
1.08
8 .884
303,
863
116.
756 .25
6S
4.076
.75068
, 350
, 311
3.80
8,52
957
6.64
0
115.
600 .2
534.
071,2
6264
.262
, 301
4 ,25
0.26
793
1,18
5( 9
, 896
)
45, 4
40.2
5814
4.56
476
, 611
193 ,
602 ,
613
186.
040 .74
119
4 ,03
6.81
819
1 ,79
6,49
419
0,20
7.49
816
7 ,34
9,95
118
2.38
2.550
178.
586,
339
193.
566, 4
8618
9,10
5.37
2
186.
040 .7
41S
193.
602.6
13S
S19
4.03
6 .818
S19
1.79
6.494
S19
0.20
7 .498
S18
7.34
9 .951
$18
2.38
2 .550
$17
8.58
6.339
Ssa
ssss
tBB
Oa
at
m: i
193.
568 .4
86S
189.
105 .3
72
Gov
ernm
enta
l Act
iviti
esBu
sine
ss-Ty
peAc
tivitie
s$
7,27
4.79
2S
( 254
,520
)8.
957, 0
42S
( 77 ,
103)
3.45
3 .252
S( 1
96, 5
05)
( 200
, 427
)S
( 157
, 627
)(1
, 964.
724)
S22
6,11
42,
383,
836
S15
9.69
0( 4
0,08
1)S
68, 0
952.
451 .02
4$
( 213
, 585
)S,
556.
409
$( 3
28, 7
48)
6.43
2,76
6( 2
05, 6
60)
S7,
020.
272
S8.
879 .9
39S
3.25
6,74
7S
( 1.7
38.6
10)
S( 3
58.0
54)
S2,
543.
526
S28
.014
S2.
237 .4
39S
5.22
7 .661
S6,
227,
106
*20
14ha
sno
tbee
nre
stat
edfo
r the
impa
ctof
GASB
68

Exhi
bit J
-3FR
EEH
OLD
REG
ION
ALH
IGH
SCH
OO
LDI
STRI
CT
FUN
DBA
LAN
CES
.GO
VERN
MEN
TAL
FUN
DS
LAST
TEN
FISC
ALYE
ARS
( MO
DIF
IED
ACC
RU
ALBA
SIS
OF
ACC
OU
NTI
NG
)
( UNA
UDIT
ED)
2013
2012
2016
2015
2014
2018
2017
2019
2020
2021
Gen
eral
Fund
:
27, 0
73,4
50$
1,00
0,00
021
, 024
, 274
2,21
8,59
827
, 823
,998
$29
, 394
, 625
$1,
450 ,
900
31, 0
27, 1
26$
763 ,
915
32, 6
31, 9
26$
992,
452
27, 2
99, 5
40$
824,
245
7,17
0
25, 2
35,6
95$
592.
262
284,
133
26, 8
92, 8
72$
755,
534
$36
, 432
,413
$2,
520,
712
4.554
, 755
Res
trict
edAs
sign
edU
nass
igne
d
28, 0
73,4
50$
23, 2
42, 8
7227
, 648
, 406
$27
, 823
, 998
$30
, 845
, 525
$31
,791
, 041
$33
, 624
, 378
$28
, 130
, 955
$26
.112
, 090
$$
43, 5
07,8
80$
Tota
l Gen
eral
Fund
AllO
ther
Gov
ernm
enta
lFun
ds:
Rest
ricte
dU
nres
erve
d,R
epor
ted
In:
Cap
italP
roje
cts
Fund
944,
577
$7,
799,
283
$20
, 088
, 887
$$
1 ,26
8,32
9$
1,16
4,35
8$
1,26
8 ,26
3$
1,19
0 ,79
7$
$2,
018,
524
$
5,03
1,27
210
9,58
41,
054,
420
11, 6
41,3
7089
, 131
486,
442
89, 1
31
cn19
, 440
, 653
$20
, 198
, 471
$$
5 ,97
5,84
9$
1, 3
57, 4
60$
1,67
7,23
9$
2,21
8,77
8$
2,01
8,52
4$
1,35
7,39
4$
Tota
l AllO
ther
Gov
ernm
enta
lFun
d;$

Exhi
bit J
-4FR
EEHO
LORE
GIO
NAL
HUG
HSC
HO
OL
DIST
RICT
CHAN
GE
INFU
NDBA
LANC
ES,G
OVE
RNM
ENTA
LFU
NDS
LAST
TEN
FISC
ALYE
ARS
( MO
DIFI
EDAC
CRUA
LBA
SIS
OF
ACCO
UNTI
NG)
( UNA
UDIT
ED)
2021
2020
2019
2018
2017
2016
2015
2 QU
2013
2012
Rev
enue
s :Ta
xLe
vyTu
ition
Cha
rges
Tran
spor
tatio
nFe
esM
isce
llane
ous
Stat
eSo
urce
sFe
dera
l Sou
rces
138.3
92.85
7$
197.
903
844.
978
347.7
2582
, 174
.400
3,21
1, 211
140,
379, 3
08S
145.
788
75, 5
361.
841 .6
3279
, 398.3
114 ,
590.
047
141.
762, 9
32$
251, 1
6494
, 101
951, 4
0779
, 508
.106
3.127
.516
135.7
52.34
8$
50.2
7545
0 ,26
842
2,84
479
,967
, 728
3,24
3,76
4
132,
253,
371
$66
,286
2.074
, 962
385 ,
828
77,0
88, 1
333,
211.
622
129.
734 .61
8S
70, 9
2977
6,31
745
1,78
375
.427 .9
433,
172.
682
$12
5,56
6,41
8S
124,
280
135.
277
327.
157
72, 5
70, 0
632 ,
628,
807
123.
178 .1
59$
72.56
329
4,53
431
1,73
468
, 952
, 756
2.89
0 .626
120.
833 .00
6S
62, 1
7736
, 974
636,
802
69.67
6 .088
2.90
8,75
9
119,
671 ,
515
166,
772
38, 9
4091
7,14
463
, 785
, 249
5,19
5 ,33
7
225,
695,
226
209,
634,
272
Tota
l Rev
enue
s22
6,43
0 ,62
222
5,16
9, 074
219,
887.
227
215,
080,
202
195.
700, 5
7220
1 ,55
2.00
219
4,15
3 ,80
618
9 ,77
4.95
7
Expe
nditu
res :
Inst
ruct
ion
Regu
lar
Spec
ial
Oth
erSu
ppor
t Ser
vices
:Tu
ition
Stud
ent &
inst
ruct
ion
rela
ted
serv
ices
Scho
olAd
min
istra
tive
Serv
ices
Gen
eral
Adm
inist
rativ
eSe
rvic
esG
ener
alan
dC
entra
lSer
vices
Cent
ralS
ervic
es/ A
dmin
.Info
rmat
ion
Tech
Plan
tOpe
ratio
nsan
dM
aint
enan
ceSt
uden
tTra
nspo
rtatio
nSe
rvic
esUn
allo
cate
dEm
ploy
eeBe
nefit
sSp
ecia
l Sch
ools
Cha
rterS
choo
lsDe
btSe
rvice
:Pn
ncip
alIn
tere
stan
dO
ther
Cha
rges
Cap
ital O
utla
y
56.6
30.88
115
.125
.4525.7
61.60
4
56.7
26,3
6115
, 042
, 122
6.71
1 .149
56, 2
02, 9
9315
, 266
, 006
6.863
.471
55,1
38,1
3416
, 290
, 116
6,64
6 ,10
5
54.42
0.588
16.3
50.910
6.543
.186
56, 62
0.517
15, 52
7.70
26,
262,
519
54, 5
80.0
6316
.147, 4
796,
385,
427
53.22
6 .236
15.2
92.60
16.3
27.79
3
54.4
61, 2
7012
.044
.633
6 , 519
, 860
53, 01
0.88
59.7
09.78
76 ,
474 ,
132
15, 9
45, 5
9118
, 881
, 771
6,96
0,65
61.8
35,6
42
15.44
8 .397
18.S 06
.187
6.67
7 .808
2.151
, 455
15, 0
76,6
8118
.249
, 119
6.60
0, 419
1,64
2,38
8
14.9
80, 3
5717
, 927
,006
6,60
7,80
31 ,
556,
498
14, 8
87, 8
9218
.155 .24
46,
821,
962
1.825
, 993
15, 60
0.09
518
.587
.291
6,71
3.49
01.
635,
198
14, 7
11.4
9217
.224.74
66.
579 .1
231 ,
581,
794
14.1
04, 0
9515
.900
, 229
6 ,50
7.814
1.535
.368
13.34
3.824
14.0
16.576
6.558
.728
1 ,81
7,37
4
13.9
94.36
212
.952, 3
356 ,
550.
897
1 ,98
5.654
3.79
8,679
13, 3
14,9
3114
.889
.180
63.4
11.39
4
3,63
7,38
714
, 265
,710
16, 95
7.590
57, 9
04.00
7
3.742
, 376
16, 2
21.4
3318
.147
.561
55.40
7 .404
3,46
3,72
216
, 848
.948
17, 14
4.259
51, 1
22.26
5
3,91
7,28
615
, 518.
081
18, 5
08,3
1457
, 663
, 911
3,22
1, 782
14.59
3 .778
16.81
2 .407
47, 6
37,3
66
2,59
4,84
013
.908
, 423
14.96
0, 904
41, 3
68, 8
03
-r *3,
277,
294
13, 8
21.8
9116
, 052.5
5743
.750
, 109
2,79
2,12
112
, 570
, 393
14.0
06, 1
8543
.899
.7252, 6
60,1
0112
.971
, 617
13, 8
36, 5
7441
, 829
,101
O)
29,3
12
5.205
, 000
260,
250
1 ,87
0,09
6
4,94
0.000
507.
250
2 ,36
7,61
3
4, 695
, 000
742,
000
4,21
9,75
2
4.46
0, 000
965.
000
7,87
6,85
1
4 ,24
0.00
01,
177, 0
0021
,699
,940
4,03
0 ,00
01 ,
378,
500
7 ,31
3,71
0
3,83
0,00
01.
570,
000
1,34
9,98
1
3,63
5,00
01 ,
751,
750
2.67
3, 424
3 ,45
5 ,00
01.
924 .5
0071
6.145
2.36
9,43
9
224,
885,
934
221,
524.0
07To
talE
xpen
ditu
res
218.
925,
220
220,
201,
869
224.
044 .0
7022
7,76
8 ,62
120
6,83
4.18
519
2.47
7 .087
190,
090.
663
162.1
00, 4
02
Exce
ss/ ( D
ef« ci
ency
)of
Rev
enue
sOv
erZ(
Unde
r)Ex
pend
iture
s7,
505.4
025,
493,
357
283,
140
( 4, 15
5.84
3)( 6
.443
.805)
( 18,
134,
349)
( 5.2
82, 1
83)
3.223
,485
4 ,06
2,94
37.6
74, 5
55
Oth
erFi
nanc
ing
Sou
rces
/( Use
s):
Cap
ital le
ases
(non
-budg
eted
)Tr
ansf
ers
Out
Proc
eeds
from
ener
gysa
ving
sob
ligat
ions
( ESI
P)
1.415
, 946
2,07
8,98
82,
511,
142
1 ,64
8.01
83 ,
581.
100
( 2, 2
51)
2,95
7,59
7
17, 5
00, 0
00
Tota
l Oth
erFi
nanc
ing
Sour
ces/
( Use
s >1 ,
415,
946
2,07
8,98
82,
511,
142
1,64
8.01
83.5
76, 8
4920
.457.5
97
5 ,49
3,35
7S
7.50
5,40
2S
1.69
9,08
6S
( 2.0
77, 6
55)
S( 3
, 932
, 663
)$
( 16,
486.
331)
SN
etC
hang
ein
Fund
Bala
nces
S( 1
.703
.334)
S23
.681
, 082
S4 ,
062.
943
S7.
674,
555
Debt
Serv
iceas
aPe
rcen
tage
ofN
onca
pita
lExp
endi
ture
s2.
50%
2.45
%2.
54%
2.63
%N
/ A2.
47%
2.71
%2.
87%
2.83
%2.
97%
Sour
ce: D
istric
trec
ords
Not
eN
onca
pita
lexp
endi
ture
sar
eto
tale
xpen
ditu
res
less
Cap
ita!O
utla
y

Exhi
bitJ
-5
FREE
HO
LDR
EGIO
NAL
HIG
HSC
HO
OL
DIST
RICT
GEN
ERAL
FUN
D-O
THER
LOC
ALRE
VENU
EBY
SOU
RC
E
LAST
TEN
FISC
ALYE
ARS
( MO
DIF
IED
ACC
RU
ALBA
SIS
OF
ACCO
UNTI
NGS
( UN
AUD
ITED
)
Res
trict
edU
nres
trict
edAn
nual
Tota
lsR
efun
dof
Prio
rYe
arE
xpen
ditu
res
Athl
etic
Fees
Faci
lity
Ren
tal
Fisc
alYe
arE
ndin
gJu
ne30
,M
isce
llane
ous
58, 8
86$
35, 0
5019
6,90
553
, 236
1,49
842
4,49
571
, 847
72, 0
8291
, 737
429,
465
215 ,
138
$59
1 ,86
064
4,39
639
3,04
32,
072 ,
765
351,
822
63, 4
3022
2,45
224
0,26
624
4,14
0
274,
024
729,
839
989,
195
608,
479
2,23
8,35
499
4,96
633
0,03
647
9,38
949
7,75
183
1,11
4
$$
$20
21*
2020
2019
2018
26, 9
0270
,138
80, 6
5586
, 713
145,
330
116 ,
991
115,
159
97, 1
3688
, 199
76, 0
2777
,756
81, 5
4577
, 378
73, 3
1977
,768
69, 6
9668
, 612
69, 3
10
2017
45*.
2016
2015
-420
1420
1320
12
Sour
ce:
Dist
rictr
ecor
ds
*No
Athl
etic
Fees
orFa
cilit
yR
enta
lrev
enue
in20
21as
are
sult
ofC
OVI
D -19

Exhib
itJ-6
Shee
t1
FREE
HO
LDR
EGIO
NAL
HIG
HSC
HO
OL
DIS
TRIC
T
ASSE
SSED
VALU
EAN
DAC
TUAL
VALU
EO
FTA
XABL
EPR
OPE
RTY
LAST
TEN
FISC
ALYE
ARS
UN
AUD
ITED
Tota
lDi
rect
Scho
olEs
timat
edAc
tual
(Cou
nty
Equa
lized
)Va
lue
Tota
lAs
sess
edVa
lue
Tax -
Exem
ptPr
oper
ty( 3
)
Net
Tax
Valu
atio
nPu
blic
Utilit
ies(
1)Va
cant
land
Indu
stria
lTa
xable
Rat
e( 2
)Re
siden
tial
Qfa
rmCo
mm
ercia
lA
partm
ent
Col
tsN
eck
3,74
7,20
0$
169.6
35, 3
003.
913 .70
04.
032,7
004 ,
069,
600
4,04
5, 100
4.20
3 .100
4.12
5 .100
4,15
9,90
04.1
58.70
04 ,
145,
400
$3,
076.
228, 2
003,
000,
128,
500
3,02
1, 437
.200
3,02
1, 200
, 000
2.99
5.440,
900
2.988
.174,
700
2,96
8,22
4,00
03,
014, 9
42.5
003.0
45, 34
8.70
03.
064 .49
1 ,40
0
4,48
6 ,45
7$
3,08
0.71
4, 657
4 ,24
1,00
73.
004 .36
9,50
74 ,
241,
007
3 ,02
5,67
8.207
3,87
6.76
33.
025. 07
6.763
3,07
7,79
42.
998 .51
8 ,69
43,
065.
471
2, 991
.240
.171
3.15
9 .066
2,97
1,38
3,06
63,
079,
851
3.01
8 .022.
351
3,72
3, 634
3.04
9, 072
.334
3,72
3,97
53.
068 .21
5,37
5
0.37
4S
0.39
40.
423
0.44
60.
466
0.43
90.
454
0.44
70.
408
0.39
0
3, 107
, 278
, 138
3,04
8.816
, 984
3 ,07
9, 828
, 708
3.04
8 .057.
282
3, 015
, 171
, 174
3,01
7,64
9.78
93,
041.
417.55
13.
066 .22
2, 327
3,12
2,79
9,19
13,
117,
456,
897
35.2
94, 4
00S
34.04
8, 800
35, 8
78,3
0039
.970
.60041
, 407
, 700
41, 7
48, 2
0038
, 448
, 100
39, 8
81, 8
0041
, 257
, 000
44.5
09.600
2.66
0 .186,
500
$20
7, 364
, 800
$
2.575
. 335.8
002.
583 .15
5.80
02,
574.
100, 7
002.
552 .99
4.800
2.53
4 .198.6
002.5
03. 435
.400
2.54
0.498 ,
000
2.55
8 .728.
600
2.575
.313.4
00
S20
21$
219.3
44.800
235.
671, 0
0024
1, 579
, 500
232.
105 .70
024
4,13
2,60
025
7.605
.800
263,
017.8
0026
3,08
1,00
025
5.778
.700
167.4
85.40
016
2.69
9 .40016
1.47
9 .600
164.8
87.60
016
3,89
2,20
016
4.60
9 .600
167.
385,
000
178.1
23.400
184,
744.
300
2020
2019
2018
2017
2016
2015
2014
2013
2012
Eng
llsht
own
-fc. 0025
9, 441
, 744
262, 7
89, 8
3525
7, 909
.176
253, 0
41, 8
0123
8,95
8.08
523
2.97
3 .581
223,
236.
967
221, 6
39.38
623
1.103
.589
235,
241.
820
$27
6.79
8 .200
263.
644 .70
025
6,45
6, 600
248.
186 .00
024
2, 616, 5
0024
0.537
.90023
9.85
0 .700
249.
645 .90
025
4.020
.90024
9.869
, 200
0.36
2$
0.40
30.
422
0.40
20.
414
0.38
00.
373
0.37
20.
404
0.39
3
$21
3.22
6 .400
201,0
65, 8
0019
5.430
, 000
190,
588,
800
185.5
00,7
0018
3.420
.40018
3,61
9, 000
200, 0
60.3
0020
6.535
.000
201,
896.
900
37.9
74.100
$37
.958
.100
36.86
7 .300
35.4
21.300
36, 0
71, 0
0035
,820
, 000
34, 98
9.90
039
, 188
,600
35.3
32,5
0035
, 742
, 000
7.93
9, 100
$7.
282 .90
06,
865,
300
6,39
6.80
06.
393 .90
06,
452,
500
6.35
8 .900
7.267.200
7.61
7 .200
8.583
.900
16.3
43.100
$27
6,79
8,20
016
.065
.20015
, 711
.000
14, 4
58, 7
0013
.302
.100
13.2
68.100
13.22
8.100
1 ,26
2,10
01,
262,
100
1,26
2,10
0
2021
1,31
5, 500
$1.2
72.700
1 ,58
3 ,00
01,
320,
400
1.34
8.800
1,57
6,90
01.
654 .80
01.
867 .70
03,
274,
100
2,38
4,30
0
$26
3.644
.700
256.4
56, 6
0024
8,18
6,00
024
2, 616
, 500
240.5
37.900
239.
850 .70
024
9.645
.90025
4,02
0,90
024
9,86
9,20
0
2020
2019
2018
2017
2016
2015
2014
2013
2012
Fam
ilngd
ale
0.37
7$
0.35
20.
354
0.33
90.
345
0.32
60.
308
0.29
80.
397
0,35
0
19.0
83.000
$17
7,50
2.10
019
, 109
, 100
15, 4
85, 2
0015
, 357, 9
0015
.321.400
15.31
5 .400
15, 3
14.7
0013
.947 .40
013
.947
.40013
.947
.400
177,
502,
100
172.
551 .600
166.3
44.900
166.
874 .60
015
5.67
3 .900
154, 0
74,00
015
4 ,50
0,40
015
0,56
2,80
015
1.31
7 .900
2,52
9, 438
154,
327,
838
175.
392,
966
171,
914 ,
944
159,
094,
861
149,
658 ,
560
146,
043,
388
145,
958,
075
138,
780 ,
348
137,
417.
398
145,
089 ,
919
149,
581,
365
125, 3
58.2
00$
121.1
97.400
119, 7
15.30
012
0,28
3.900
106 ,
525,
800
105.7
77.400
106,
279,
000
110,
869, 6
0011
1.706
.50011
2.13
3 .500
26,4
00$
25, 9
0016
, 300
S16
, 300
17, 5
0017
, 500
2,70
02,
700
2,70
014
, 200
14, 2
0014
, 200
27.36
8.900
$26
.712 .90
026
, 880
, 000
26.9
18.700
26, 7
00.8
0027
.171.70
027
.115
, 000
20, 5
23, 5
0020
, 320
.000
20, 3
20.0
00
4.56
4 .200
$4, 2
08, 5
003,
273, 4
003, 3
11, 8
003.3
11.80
03.
318.2
003.
319 .80
02.7
42.80
02.7
42.800
2.74
2 .800
S1,
085 ,
100
$1,
281.5
0097
3,50
098
4,80
03,
226,
700
1.89
8.600
1.90
5 .600
1,86
5, 300
1 ,86
5,30
01,
918,
800
2021
172.
551 .60
016
6.344
.90016
6.87
4 .600
155.6
73.90
015
4,07
4, 000
154.
500 .40
015
0,56
2,80
015
1.31
7 .900
151.7
98.400
2020
2019
2018
584.
700
590 ,
000
563.
600
600,
000
721.
700
721,
700
2017
2016
2015
2014
2013
2012

exhi
bitJ
-6Sh
eet 2
FREE
HO
LDRE
GIO
NAL
HIG
HSC
HOO
LD
ISTR
ICT
ASSE
SSED
VALU
EAN
DAC
TUAL
VALU
EO
FTA
XABL
EPR
OPE
RTY
LAST
TEN
FISC
ALYE
ARS
Tota
lDi
rect
Scho
olEs
timat
edAc
tual
(Cou
nty
Equa
lized
)
Valu
e
Tota
lAs
sess
edVa
lue
Tax -
Exem
ptP
rope
rty( 3
)
Net
Tax
Publ
icUt
ilities
( 1)
Valua
tion
Taxa
ble
Vaca
ntLa
ndQ
farm
Com
mer
cial
Rat
e( 2
)Re
siden
tial
Farm
Reg
-In
dust
rial
Apa
rtm
ent
Free
hold
Bor
o
42, 1
55.6
00$
1,13
7,89
8,00
0$
41.5
48.500
1,10
5.87
9 .000
40, 8
97.0
001,
083.
860.60
032
.216
.500
1,05
5.47
0.500
32.1
37.100
1.04
4, 411, 5
2022
.454.100
1.02
7 .825,
600
22.06
5, 400
1.02
9, 213
, 400
22.3
88.400
1,05
0,55
1, 700
22.3
88.400
1,06
2.37
6 .800
22.38
8 .400
1.06
6,85
3.70
0
$1 ,
137,
898.
000
1,10
5,87
9 ,00
01,
083,
860.6
001 ,
055.
470, 5
001,
044.
411,
520
1,02
7,82
5.60
01,
029, 2
13, 4
001 ,
050, 5
51.7
001,
062, 3
76.8
001 ,
066,
853 ,
700
0.36
4$
0.37
40.
364
0.34
20.
343
0.32
00.
295
0.31
10.
321
0.34
1
1 , 153
, 639.
683
1,11
0,62
6.70
41,
091,
828.
385
1 ,04
9,93
2,00
11,
032, 1
01, 0
9298
6,30
4,99
295
1, 845
.338
974,
389,
434
1.02
5 .327,
919
1,13
9,21
5, 781
25.5
70.200
$25
, 327
, 700
25.4
50.20
025
.411, 8
0025
.373
.90025
,353
, 000
25.34
5.900
25.3
45.900
25.3
45.900
25, 3
45, 9
00
1,35
1,40
02,
265.9
002.
254 .60
02.3
69, 5
001 ,
181,
800
1,12
8,80
01.
390, 0
001.
423.60
02,
476,
800
3.408
.000
9,45
9,20
0$
8 ,67
6,00
010
, 783
.800
9,60
0,10
09.
632, 8
0010
, 627
, 200
10,1
20, 1
0010
.235
, 100
10.2
36.40
010
.244
.400
$24
3.69
8 .000
$23
9.787
.50023
4,73
3.200
233.7
86.500
231,
066 ,
700
229.8
22.500
230.
456.50
023
7,22
5.10
023
9,84
0,30
024
1, 264
, 600
2021
$81
7 , 015
.000
790,
539,
300
771.
996.40
075
4 ,45
5,60
074
6,20
1, 020
739.
568 .80
074
1,22
5,50
075
5, 357
, 200
764.
565 .80
076
7.61
0 .400
2020
2019
2018
2017
2016
2015
2014
2013
2012
COFr
eeho
ldTo
wns
hip
176, 9
72, 9
00$
154.
144 .10
015
4.69
7 .800
154.
713 .70
015
4,51
3 ,50
015
3.24
1 .300
148.9
05.300
146.5
63.70
014
6,52
1,20
015
6.782.10
0
101,
720,
900
$6,
868,
119,
600
$98
.555
.8006,
717.
431, 9
0094
.626 .700
6 ,59
2.450, 9
0084
.626.70
06.
326, 3
67, 0
0084
.791.80
06.
145,
883,
500
78, 6
12, 5
006,
027, 6
00, 6
0071, 0
94.3
005,
893, 9
58, 1
0060
,794
, 300
5,48
2.57
5 .400
60, 7
94, 3
005 ,
486, 8
11, 0
0061
, 500
, 000
6, 114
, 837
.200
$6 ,
868,
119,
600
6.71
7 .431.
900
6.59
2 .450.9
006 ,
326,
367,
000
6,14
5,88
3,50
06,
027, 6
00, 6
005,
893.
958 .10
05.
482.57
5,40
05 ,
486,
811 ,
000
6.11
4 .837,
200
0.41
2$
0.40
80.
417
0.44
10.
455
0.48
20.
452
0.48
00.
471
0.41
1
7,05
0,94
1 ,430
6.71
0,55
6 ,69
86,
615,
462.
721
6,51
0,73
1,90
16,
456,
448,
298
6.58
9, 292
.604
6 ,09
5,13
6,63
15.
837, 6
54, 0
065.8
73, 4
38, 8
636,
197, 3
54,7
50
1,49
0,00
0$
1,39
9.76
0 .900
$1.
508.50
01,
492,
227.
500
1.53
8, 100
1.45
7, 447
.400
1 ,53
5,20
01,
417,
161,
400
1.444
.5001,
396,8
97, 6
001.
456 .90
01,
387.
324 .00
01.
464 .900
1,32
0,21
6,20
01.
440 .90
01 ,
239,
936, 4
001,
466 ,
400
1,24
3,83
4, 300
1,50
9 ,70
01 ,
245.9
30.30
0
3,96
9, 600
3,96
9,60
03.
969 .60
03.6
12.60
03.6
12.600
3.61
2 .600
3 ,61
2.60
041
, 400
$52
.455.30
0$
54,9
64, 9
0050
.698 .70
048
, 609
, 600
52, 9
22, 0
0051
.370.30
055
.908 .80
050
.881
.700
56, 0
04, 9
0067
, 931
, 000
5,10
3,04
7,50
0$
4,88
3.71
7, 000
4,79
9, 653
, 300
4.588. 49
2.60
04.4
25.631
.400
4.325
.592.2
004.2
66. 39
8.600
3.95
5. 292.2
003,
949 ,
909,
700
4.548
.659.40
0
32.67
2 .100
$32
.314
.10033
, 788
.900
31, 2
27, 8
0029
.682 .70
030, 0
03, 4
0029
, 970
, 000
27.6
66.200
28.2
80.200
32.52
4 .700
2021
2020
2019
2018
2017
2016
2015
2014
2013
2012
How
ell
$7,
546,
137,
900
7 ,38
8,63
0,60
07.1
95.667
.500
6,90
3,93
2.00
06,
642,
287.0
006,
365,
439,
700
8, 470
.420
6,15
1, 762
, 520
7,63
2, 229
5,57
4, 386
, 229
8,86
7, 486
5,53
3,01
1,28
611
, 032
, 948
5.50
0,83
8,14
8
0.42
8$
0.43
20.
448
0.44
90.
436
0.43
30.
432
0.45
20.
483
0.47
8
7,75
4,65
0,08
47,
644, 3
93.3
927,
493.6
85.01
07,
130,
335.6
556,
760,
028.
111
6.59
1 .132.
558
6,38
8,59
7.383
6,08
7,37
0,78
76,
199,
518.
124
6 ,50
9.42
0,35
0
2.349
.700$
713.
280, 8
00$
2.43
2 .200
2.66
9 .500
2,62
4,60
02,
397,
100
2.70
1, 000
2.75
5 .700
2.67
3 .500
2,76
8,80
02.
640 .50
0
124.
386 .40
0$
113.
613 .300
111.
137 .70
010
5.862
.10010
4.535
.300
112.3
76.100
107.7
04.400
101.
664 .90
010
1,85
6.60
010
3.34
4 .900
40, 1
38,0
00$
7,54
6,13
7,90
039
, 900
, 900
7.38
8, 630
, 600
39, 8
43, 4
007,
195,
667,
500
38, 6
71.7
006,
903.
932,0
0037
.293
.500
6.642
, 287
, 000
32, 2
59,8
006 ,
365.
439, 7
0032
, 259
, 800
6,14
3,29
2,10
05,
566,
754, 0
005.
524 .14
3.80
05.
489 .805
.200
113.2
86.200
$10
1,85
2, 000
112.
105 .800
114.7
74.90
011
8.52
3 .800
114.7
02.200
127.
426 .60
013
7.473
.90015
5,56
7,40
014
7.94
0 .600
6.44
9, 143
.300
$6.
318. 62
0.400
6.14
9 .486.4
005.8
75.284
.700
5.65
4 .440.
800
5.37
3 . 302.7
005.
157 .74
4.800
4.623
. 682.70
04,
579 ,
708,
000
4.55
4 . 735.
400
103.
553 .50
0$
102.
076, 6
0098
.207 .20
098
.123, 4
0098
.312
.20010
1.965
.50098
,908
, 600
89, 3
84, 8
0089
, 858
, 000
85.5
98, 1
00
$20
2171
0.13
5 .200
682, 2
17,5
0066
8 ,59
0 ,60
062
6,784
, 300
628,
132,
400
616.
492 .20
061
1.874
.20059
4,38
5, 000
595,
545 ,
700
2020
2019
2018
2017
2016
2015
2014
2013
2012

Exhib
itJ-6
Shee
t3
FREE
HOLD
REG
IONA
LHI
GH
SCHO
OL
DIST
RICT
ASSE
SSED
VALU
EAN
DAC
TUAL
VALU
EO
FTA
XABL
EPR
OPE
RTY
LAST
TEN
FISC
ALYE
ARS
UNAU
DITE
DTo
tal
Dire
ctSc
hool
Estim
ated
Actu
al(C
ount
yEq
ualiz
ed)
Valu
e
Tota
lAs
sess
edVa
lue
Tax -
Net
Valu
atio
nEx
empt
Pro
perty
( 3)
Publ
icUt
ilitie
s(1)
Tax
Vaca
ntTa
xabl
eRa
te( 2
)Fa
rmR
eg.
Com
mer
cial
Indu
stria
lA
partm
ent
Land
Resid
entia
lQ
farm
Man
alap
an
$7,
165.3
22, 4
007,
058 ,
050,
500
6.94
4 . 410.
400
6,64
1,16
5,50
06.
399 .51
4.400
6.30
1, 366
.160
6.14
0,59
9,85
05,
842.
218 .47
65,
791 ,
041 ,
500
5.74
6. 321.
400
6,53
6,00
9,20
0$
6 ,43
6,52
6,60
06,
362, 9
22, 9
006.
071, 3
86.9
005,
872,
797, 4
005,
786, 8
49, 6
605.6
57.693
, 750
5 ,35
9, 086
.600
5,29
9,33
1,50
05, 2
41.1
49.800
41, 0
63, 8
00$
40.98
5 .400
37.98
3 .500
37, 9
18, 2
0035
.508
.50033
, 999
, 000
34, 2
67.1
0032
.130 .40
031
, 538
, 900
32, 2
67, 8
00
1,87
4,80
0$
524,
132,
500
S1.
838 .30
01.
822, 7
001.
895 .90
01.
944,
000
1.956
.9002 ,
250,
500
2,26
9,20
02,
316,
400
2.35
2 .300
25, 0
26.6
00$
25.1
97, 4
0023
, 999
, 000
23.58
7.100
20.8
63.100
20, 4
54, 0
0020
.451
.60020
.269
.60020
.269
.60022
, 667
, 200
$7.1
65, 3
22, 4
00$
7 ,05
8.05
0, 500
6.94
4 .410.
400
6.64
1, 165
.500
6.39
9 .514.4
006,
301.
366 .16
06.
140 .59
9, 850
5.842
, 218
.476
5,79
1,04
1,50
05.
746 .32
1.40
0
$0.
427
$0.
416
0.42
00.
415
0.41
80.
414
0.42
00.
436
0.42
50.
420
7,47
7,54
0,52
37,
324,
554.
794
7.31
6, 476
, 259
6,69
2,36
6,75
46,
463,
681.
306
6,38
5.559
.2296,
234,
359,
701
6.10
9, 982
.591
5,97
8, 278
, 610
6.16
9, 252
, 662
2021
37.2
15.500
$34
.613
.800
39.2
92.50
038
.604
.600
35.7
76.600
34.93
8.600
38.7
65.80
047
.846
.60058
.673 .900
70.4
82.90
0
$51
8 ,88
9 ,00
047
8.38
9 .800
467.7
72.800
432.6
24.800
423,1
68, 0
0038
7.17
1, 100
380, 6
16, 0
7637
8 ,91
1 ,20
037
7,40
1,40
0
2020
2019
2018
2017
2016
2015
2014
Ol
2013
O20
12
Mar
lbor
o
497,
299,
500
$49
0.91
1 .300
465.
858 .30
045
7,85
3 ,70
045
7,48
0.80
045
4,55
0,00
044
4.22
3, 200
428,
732,
400
424,
031, 3
0042
0,12
0,90
0
50.7
53.900
$7.
281, 8
86, 8
20$
27.88
0 .900
7.24
5 . 302.
300
13.2
53.900
7,19
8 ,73
8,90
022
.287, 0
007.1
89, 3
17, 7
0022
, 287
.000
7,17
2.39
2 .700
22.2
87, 0
007,
164 ,
469,
700
21.7
56.900
7,09
6.74
7, 024
18.6
19.900
6,74
6,02
2,87
418
.619
.900
6,74
9, 578
, 000
18.61
9.900
6,89
2, 828
, 400
48,0
0048
, 000
48, 0
00
$7 ,
281.
886 .82
07 , 2
45, 3
02, 3
007,
198,
738,
900
7.189
.317.7
007.
172 .39
2.70
07.
164 .46
9.70
07.
096, 7
47, 0
246 ,
746 ,
022, 8
746,
749, 5
78, 0
009,
347,
305
6,90
2,17
5,70
5
0.47
2$
0.46
60.
474
0.41
50.
456
0.44
00.
445
0.44
70.
433
0.40
3
8.22
3, 019
.294
8.12
5, 904
, 617
7,99
9.68
5.880
7,63
7.73
6 .943
7 ,46
0.30
7, 716
7,35
4, 851
, 699
7.18
6,55
8,93
77,
013, 2
77, 2
247 ,
085.
446 .67
97.
266 .19
7.377
53, 8
88, 3
50$
55, 2
80, 2
0073
, 126.
400
75, 7
38, 30
062
, 232.
800
64, 5
33, 0
0069
, 839
, 100
77.8
22.90
085
, 204
, 500
92.25
3 .900
6 ,56
6,45
4 , 270
$6.
556 .863
.800
6,52
7.605
, 100
6.514. 54
5.800
6,51
1, 414
.300
6,50
3,78
9 ,00
06.
439 .59
7.62
46.
099 . 93
1.774
6,09
8,10
6,50
06.2
34, 1
33, 5
00
31, 8
05, 3
00$
32.67
1 .40037
.138
.400
37, 1
19, 7
0038
.867 .80
038
, 438
, 000
37.7
57.200
35.20
5 .200
36, 0
36, 3
0038
.633 .80
0
905,
600
$91
4,80
097
6,90
099
3.30
01,
079,
700
1.08
4 .200
1 ,09
4 ,70
01,
036,
800
1,03
6.50
01,
045,
400
80.77
9.900
$80
.779.90
080
.779.90
080
.779 .90
079
, 030
,300
79,7
88, 5
0082
, 478
, 300
84.6
73.900
86, 5
43, 0
0088
.021 .00
0
$20
2120
2020
1920
1820
1720
1620
1520
1420
1320
12
Sour
ce:
Cou
nty
Boar
dof
Taxa
tion
Rea
l pro
perty
isre
quire
dto
beas
sess
edat
som
e per
cent
age
oftru
eva
lue
{ fair
orm
arke
tval
ue) e
stab
lishe
dby
the
Cou
nty
boar
dof
taxa
tion.
Not
e :
Rea
sses
smen
tocc
ursw
hen
orde
red
byth
eCo
unty
Boar
dof
Taxa
tion.
( 1)
Taxa
ble
Valu
eof
Mac
hine
ry,I
mpl
emen
ts&
Equi
pmen
tof T
elep
hone
,Te
legr
aph
&M
esse
nger
Syst
emC
ompa
nies
.
( 2)
Tax r
ates
are
per$
100 .
(3)
Taxe
xem
ptpr
oper
tyal
read
yex
clude
d fro
mas
sess
edva
lue
bypr
oper
tycl
ass

Exhibit J-7Sheet 1
FREEHOLD REGIONAL HIGH SCHOOL DISTRICTDIRECT AND OVERLAPPING PROPERTY TAX RATES
LAST TEN FISCAL YEARSUNAUDITED
(RATE PER $100 OF ASSESSED VALUATION)
Overlapping RatesFreehold Regional
GeneralObligation
DebtService
Total Direct &Elementary Local Library/ Monmouth Overlapping Tax
School Purpose Other CountyBasicRate
TotalDirect Rate
Colts Neck
1.7461.7641.7611.7751.7691.7311.7351.6871.6181.570
0.0120.0120.0120.0120.0120.0120.0120.0120.0120.012
0.2780.2860.2900.2980.2920.3000.3110.3090.3090.294
0.2690.2600.2600.2580.2500.2410.2280.2140.2030.194
0.3740.3810.4100.4320.4520.4250.4400.4320.3940.377
0.3740.3940.4230.4460.4660.4390.4540.4470.4080.390
0.8130.8120.7760.7610.7490.7390.7300.7050.6860.680
20210.0130.0130.0140.0140.0140.0140.0150.0140.013
202020192018201720162015201420132012
Englishtown
2.1522.2262.2232.3402.2582.1972.1302.0101.9691.909
0.2640.2860.2890.3080.2900.2830.2930.2680.2810.276
0.8780.9060.8810.9980.9330.9130.8730.8120.7860.778
0.3620.3910.4100.3890.4020.3680.3550.3600.3910.376
0.3620.4030.4220.4020.4140.3800.3730.3720.4040.393
0.6480.6310.6310.6320.6210.6210.5910.5580.4980.462
20210.0120.0120.0130.0120.0120.0180.0120.0130.017
202020192018201720162015201420132012
Farmingdale
0.2780.2860.2780.2870.2780.2880.2810.2900.2930.290
2.2942.2692.2772.1152.0852.0471.8841.8271.9431.811
1.3211.3201.3521.2281.2181.1921.0781.0271.0410.960
0.3180.3110.2930.2610.2440.2410.2170.2120.2120.211
0.3770.3520.3540.3390.3450.3260.3080.2980.3970.350
2021 0.3770.3420.3430.3280.3350.3160.2980.2880.3840.342
0.0100.0110.0110.0100.0100.0100.0100.0130.008
202020192018201720162015201420132012
151

Exhibit J-7Sheet 2
FREEHOLD REGIONAL HIGH SCHOOL DISTRICTDIRECT AND OVERLAPPING PROPERTY TAX RATES
LAST TEN FISCAL YEARSUNAUDITED
(RATE PER $100 OF ASSESSED VALUATION )
Overlapping RatesFreehold Regional
GeneralObligation
DebtService
Total Direct &Elementary Local Library/ Monmouth Overlapping Tax
School Purpose Other CountyBasicRate
TotalDirect Rate
Freehold Borough
2.6232.6622.6502.7012.7122.6552.5342.4192.3432.326
1.0221.0200.9920.9930.9740.9440.9130.8750.8510.814
0.0340.0340.0340.0330.0330.0320.0310.0310.0320.036
0.2620.2670.2700.2760.2690.2610.2630.2690.2770.293
0.3640.3740.3640.3420.3430.3200.2950.3110.3210.341
0.9410.9670.9901.0571.0931.0981.0320.9330.8620.842
2021 0.3640.3630.3540.3320.3330.3110.2860.3010.3100.329
0.0110.0100.0110.0100.0090.0090.0100.0110.012
202020192018201720162015201420132012
Freehold Township
2.1212.1302.1392.2112.2432.2862.2582.3492.2932.010
0.2840.2820.2860.3030.3050.3220.3190.3300.3270.292
0.3350.3360.3320.3400.3460.3470.3440.3580.3480.294
0.0300.0300.0300.0300.0300.0300.0300.0300.0300.030
2021 0.4120.3960.4030.4270.4400.4680.4380.4640.4550.398
0.4120.4080.4170.4410.4550.4820.4520.4800.4710.411
1.0601.0741.0741.0971.1071.1051.1131.1511.1170.983
0.0120.0140.0140.0150.0140.0140.0160.0160.013
202020192018201720162015201420132012
Howell
2.2132.2402.2842.2952.3202.3502.3742.5592.5852.585
0.0200.0200.0200.0200.0200.0200.0200.0200.0200.020
0.2890.2980.3020.3110.3020.3130.3260.3460.3480.347
0.3870.3950.3950.3880.3970.3990.3980.4480.4570.453
0.4280.4320.4480.4490.4360.4330.4320.4520.4830.478
1.0891.0951.1191.1271.1651.1851.1981.2931.2771.287
2021 0.4280.4190.4340.4360.4230.4190.4180.4370.4670.367
0.0130.0140.0130.0130.0140.0140.0150.0160.111
202020192018201720162015201420132012
152

Exhibit J-7Sheet 3
FREEHOLD REGIONAL HIGH SCHOOL DISTRICTDIRECT AND OVERLAPPING PROPERTY TAX RATES
LAST TEN FISCAL YEARSUNAUDITED
(RATE PER $100 OF ASSESSED VALUATION)
Overlapping RatesFreehold Regional
GeneralObligation
DebtService
Total Direct &Elementary Local Library/ Monmouth Overlapping Tax
School Purpose Other CountyTotal
DirectBasicRate Rate
Manalapan
2.0322.0082.0112.0232.0212.0042.0252.0802.0312.006
0.0200.0200.0200.0200.0200.0200.0200.0200.0200.020
0.2860.2930.2990.2970.2920.2990.3120.3270.3160.315
0.3510.3340.3310.3370.3410.3380.3410.3520.3450.339
0.4270.4160.4200.4150.4180.4140.4200.4360.4250.420
0.9480.9450.9410.9540.9500.9330.9320.9450.9250.912
0.4270.4040.4070.4020.4050.4010.4070.4220.4110.410
20210.0120.0130.0130.0130.0130.0130.0140.0140.010
202020192018201720162015201420132012
Marlboro
2.2872.2632,2652.2272.1832.1752.1422.1632.1052.018
0.3160.3220.3210.3170.3060.3090.3170.3270.3170.311
0.4010.3930.3780.3790.3660.3670.3560.3770.3600.338
0.0100.0100.0100.0100.0100.0100.0100.0100.0100.010
1.0881.0721.0821.0631.0451.0491.0141.0020.9850.956
0.4720.4660.4740.4580.4560.4400.4450.4470.4330.403
0.4720.4520.4600.4440.4420.4260.4310.4320.4190.399
20212020 0.014
0.0140.0140.0140.0140.0140.0150.0140.004
20192018201720162015201420132012
153

Exhi
bitJ
-8Sh
eet1
FREE
HO
LDR
EGIO
NAL
HIG
HSC
HO
OL
DIS
TRIC
TP
RIN
CIP
AL
PRO
PER
TYTA
XPAY
ERS
CU
RR
ENT
YEAR
AND
NIN
EYE
ARS
AGO
UNAU
DITE
D
2012
2021
Asa
%of
Com
mun
ity's
NetA
sses
sed
Valu
atio
n
Asa
%of
Com
mun
ity’s
NetA
sses
sed
Valu
atio
n
Taxa
ble
Asse
ssed
Valu
e
Taxa
ble
Asse
ssed
Valu
eCo
mm
unity
/ Tax
paye
rC
omm
unity
/Tax
paye
r
Colts
Neck
Trum
pN
atio
nalG
olf C
lub
Due
Proc
ess
Gol
d&
Hor
seSt
able
s,LL
CIn
divid
ualT
axpa
yer1
Wel
lspr
ing
Stab
les
Flor
ida,
LLC
Indi
vidua
lTax
paye
r 224
Real
ty,L
LCBa
l Col
t 'sNe
ckLL
CLa
ird&
Co .
Inc.
Pega
sus
Prop
ertie
sLL
CC
olts
Neck
Shop
ping
Cent
erAs
socia
tes
Colts
Neck
Trum
pNa
tiona
l Gol
f Clu
bD
uePr
oces
sG
olf&
Hor
seSt
able
s,LL
CW
ells
prin
gSt
able
sFl
orid
a ,LL
CG
&F
Rea
ltyof
Ric
hmon
d,LL
CIn
divid
ualT
axpa
yer1
Indi
vidua
lTax
paye
r 2Pe
gasu
sPr
oper
ties
LLC
Indi
vidua
lTax
paye
r 3Co
ltsNe
ckSh
oppi
ngCe
nter
Asso
ciate
s36
Hig
hway
34So
uth
Asso
ciat
esLL
C
$31
, 006
, 800
21, 0
00, 0
0012
, 263
, 800
10, 9
34, 7
009 ,
017,
400
8,50
7,40
08 ,
006 ,
100
8,00
0,00
07,
542,
200
6 ,80
9,70
0
1.01
%0.
68%
0.40
%0.
36%
0.29
%0.
28%
0.26
%0.
26%
0.25
%0.
22%
1.04
%0.
65%
0.38
%0.
36%
0.32
%0.
26%
0.25
%0.
20%
0.19
%0.
18%
$32
, 006
, 800
19.9
41.700
11, 8
02, 0
0011
.150
.7009.
759 .20
07,
972,
100
7.542
.2006,
178,
600
5,69
6,80
05,
634,
400
cn
4.00
%$
123.
088 .
100
383
%$
117.
684 .5
00To
tal
Tota
l
Engl
isht
own
BTR
Engl
ishto
wnLL
CBA
LG
over
nor 's
Cros
sing
LLC
Stam
ford
Squa
re, L
LCW
emac
s,LL
CVi
llage
Cent
erAs
socia
tes
LLC
Dor
othy
Leo,
Inc.
DC
DLL
CBr
ookla
wnG
arde
nsIn
cK&
KEn
glish
town
, Inc
.M
osko
witz,
KTr
ust&
Berg
er, V
Trus
t
Engl
isht
own
Stam
ford
Squa
reLL
CBA
LG
over
nor 's
Cro
ssin
gLL
CTh
ree
Cor
ners
Vent
ures
LLC
Villa
geCe
nter
Asso
ciate
s,LL
CAm
beH
oldi
ng,L
LCW
emac
sLL
CDC
DLL
CBr
ookla
wnG
arde
nsFi
veSo
uth
Mai
nSt
reet
LLC
Degi
acom
oR
ealty
LLC
2.86
%1.
66%
1.49
%1.
33%
1.25
%0.
87%
0.85
%0.
80%
0,71
%0.
54%
$7.
229 .30
04,
200,
000
3.750
.7003.3
66.700
3.16
5 .700
2,20
0,00
02.1
50.300
2, 021
, 800
1,78
2,80
01.3
74.700
5.29
%1.
84%
1.53
%1.
36%
1.19
%1.
09%
0.79
%0.
77%
0.75
%0.
60%
$14
, 641
,900
5,09
6,00
04,
243, 5
003 ,
753 ,
200
3,29
3,90
03,
025,
000
2,19
4, 600
2,13
4,30
02,0
76, 9
001,
665 ,
000
12.3
8%$
31, 2
42, 0
0015, 2
2%$
42, 1
24, 3
00To
tal
Tota
l

Exhi
bit J
-8Sh
eet2
FREE
HO
LDR
EGIO
NAL
HIG
HSC
HO
OL
DIST
RICT
PRIN
CIP
ALPR
OPE
RTY
TAXP
AYER
SC
UR
REN
TYE
ARAN
DNI
NEYE
ARS
AGO
UNAU
DITE
D
2021
2012
Asa
%of
Com
mun
ity' s
Net
Asse
ssed
Valu
atio
n
Asa
%of
Com
mun
ity' s
Net
Asse
ssed
Valu
atio
n
Taxa
ble
Asse
ssed
Valu
e
Taxa
ble
Asse
ssed
Valu
eC
omm
unity
/ Tax
paye
rC
omm
unity
/Tax
paye
r
Farm
ingd
ale
Farm
ingd
ale
Gar
den
Apar
tmen
ts, L
LC30
Sout
hard
Ave ,
Farm
ingd
ale
LLC
Veriz
onCo
mm
unica
tions
Farm
ingd
ale
Shop
ping
Cen
ter,
LLC
R.T.
Equi
ties
LLC
Indi
vidua
lTax
paye
r 1in
divi
dual
Taxp
ayer
2In
divid
ualT
axpa
yer3
Farm
ingd
ale
Trai
nSt
atio
n,LL
CBe
ll Atla
ntic
Farm
ingd
ale
Farm
ingd
ale
Gar
den
Apar
tmen
ts, L
LC30
Sout
hard
Ave,
Farm
ingd
ale
LLC
Farm
ingd
ale
Shop
ping
Cent
er, L
LC32
0C
hest
nutR
ealty
LLC
Acad
emy
Apar
tmen
tsLL
CFa
rmin
gdal
eBP
KPFa
rmin
gdal
e,LL
CBe
ll Atla
ntic
Road
side
Hol
ding
s ,LL
C57
and
64M
ain
St.L
LC
9.11
%4.
39%
2.12
%2.
05%
0.95
%0.
87%
0.77
%0.
59%
0.48
%0.
40%
$11
, 500
, 000
3,79
5,40
02,
558,
005
2.442
.2002.
107 .20
01,
476, 6
001 ,
400 ,
000
1 ,29
7,00
01,
190,
000
992.
800
$16
,176
, 100
7 ,79
9,40
03,
766,
800
3.641
.5001 ,
692,
200
1.54
6 .500
1.37
5.500
1,05
0,30
084
4.500
703.5
00
7.58
%2.
50%
1.69
%1.
61%
1.39
%0.
97%
0.92
%0.
86%
0.78
%0.
65%
Ol cn
mm
*$
38.5
96.3
0021
JA%
Tota
l$
28.7
59,20
5To
tal
Free
hold
Bor
ough
Free
hold
Rac
ing
Asso
ciat
ion
Nest
leUS
AAE
WBr
ooks
ide
East
Coa
chPo
st&
Coac
hPa
rkPl
aza
Shop
ping
Free
fern
Asso
ciat
es18
-20
E,M
ain
Stre
etLL
CSp
ring
Terra
ceAp
artm
ents
, LLC
BellA
tlant
icC
hiu 's
Prop
erty
Inc .
Free
hold
Bor
ough
Nes
tleU
SAFr
eeho
ldR
acin
gAs
socia
tion
Brid
ge-Br
ooks
ide
LLC
East
Coa
stPo
st&
Coa
chLL
CFr
eefe
rnAs
soci
ates
Tow
erSp
ring
Terra
ceLL
CM
onm
outh
Apar
tmen
tsLL
CPa
rkPl
aza
Shop
ping
Cent
er,I
nc.
18-2
0E.
Mai
nSt
reet
LLC
597
Park
Aven
ue, L
LC
$29
, 225
, 300
23, 6
74, 4
0014
, 269
,000
6,49
5, 700
5,56
0,90
04,
565,
000
3,19
1,00
03,
000 ,
000
3,00
0 ,00
02,
650,
000
2.10
%1.
90%
1.52
%1.
04%
0.81
%0.
65%
0.45
%0.
45%
0.38
%0.
29%
$23
, 910
, 200
21, 6
72, 6
0017
, 286
, 200
11, 7
96, 1
009.
231 .30
07.
343.40
05,
103,
600
5,08
6,90
04.
337 .40
03.3
47.300
2.74
%2.
22%
1.34
%0.
61%
0.52
%0.
43%
0.30
%0.
28%
0.28
%0.
25%
$10
9,11
5,00
0$
95, 6
31, 3
00To
tal
& 9S 2&
LTo
tal

Exhi
bitJ
-8Sh
eet3
FREE
HO
LDR
EGIO
NAL
HIG
HSC
HO
OL
DIS
TRIC
TPR
INC
IPAL
PRO
PER
TYTA
XPAY
ERS
CU
RR
EN
TYE
ARAN
DN
INE
YEAR
SAG
OU
NAU
DIT
ED
2012
2021
Asa
%of
Com
mun
ity' s
Net
Asse
ssed
Valu
atio
n
As
a%
ofC
omm
unity
' sN
etAs
sess
edVa
luat
ion
Taxa
ble
Asse
ssed
Valu
e
Taxa
ble
Asse
ssed
Valu
eC
omm
unity
/ Tax
paye
rC
omm
unity
/Tax
paye
r
Free
hold
Twp .
Free
mal
lAss
ocia
tes ,
LLC
Free
hold
Fina
ncin
g ,LL
CCe
nter
forA
ging
dba/
Appl
ewoo
dIro
nM
ount
ain ,
Inc .
New
Jers
eyBe
llTel .
Co.
Free
hold
Shop
ping
Asso
ciat
esR
aint
reet
owne
Cent
erAs
socia
tes,
LPRo
nard
iFre
ehol
dEn
terp
rises
LLC
Sam
'sR
ealE
stat
eBu
sines
sTr
ust
Mac
y 'sEa
st, I
nc.
Free
hold
Twp.
Free
mal
l Ass
ocia
tes,
LLC
100
Lam
bert
LLC
/Eag
leRo
ckAd
visor
sIro
nM
ount
ain,
Inc .
Cen
terf
orAg
ing
DBA
/ App
iewo
odFr
eem
allA
ssoc
iate
s,LL
CU
shpi
zin
Asso
ciate
s,LL
CAs
pen
Rt9
LLC
Rai
ntre
etow
neC
ente
r Ass
ocia
tes,
LPM
acy's
East,I
ncR
onar
diFr
eeho
ldEn
terp
rises
,LLC
5.14
%0.
84%
0.80
%0.
74%
0.42
%0.
39%
0.39
%0.
35%
0.32
%0.
32%
5.23
%1.
02%
0.70
%0.
54%
0.47
%0.
42%
0.36
%0.
36%
0.35
%0.
35%
$35
9,21
1,70
069
.726.70
047
.990.70
037
.246 .80
032
,304
,000
28, 8
29, 1
0024
, 837
, 400
24.7
71.800
23,9
39,0
0023
, 707
, 500
$31
4,47
1,80
051
,500
,000
48,9
26,9
0045
.159.20
025
, 858
,700
24,1
08,0
0023
, 800
, 000
21, 2
82, 4
0019
.620
.20019
, 542
, 000
oi
a>
9.71
%$
594,
269,
200
$67
2,56
4,70
09.
79%
Tota
lTo
tal
How
ell
Buffa
lo-P
arkt
on&
Feue
rste
in&
Wai
nco
Cent
exH
omes
, LLC
How
ellF
riend
ship
Rea
lEst
ate
Co.
Hom
eDe
potU
SALo
we'
sHo
me
Cent
ers
Inc .
DS&
DJR
ealty
, LLC
Wal
-Mar
tSto
res,
Inc .
Targ
etC
orpo
ratio
nIn
divi
dual
Taxp
ayer
1Fa
irfie
ldPa
rkLL
C
How
ell
Buffa
lo -Pa
rkto
n&
Feue
rste
in&
Wai
nco
Howe
llVer
dana
LLC
&Ve
rdon
na,L
LCHo
wellF
riend
ship
Real
Esta
teCo
.Ea
gle
Gol
fEnt
erpr
ises,
LLC
DS&
DJ
Rea
lty, L
LCH
ome
Dep
otU
SAIn
c.Lo
we' s
Hom
eC
ente
rs, I
nc.
Targ
etC
orpo
ratio
nW
al-M
artS
tore
s ,In
c .Al
drich
Plaz
a,LL
C
0.58
%0.
53%
0.29
%0.
22%
0.21
%0.
20%
0.20
%0.
19%
0.19
%0.
19%
43, 6
93, 8
0039
.900.90
021
,639
,500
16, 9
45, 2
0015
.996
.10015
.412
.40014
.961
.40014
.268
.90014
, 188
,300
14.14
4 .100
0.66
%0.
42%
0.32
%0.
25%
0.24
%0.
22%
0.20
%0.
20%
0.20
%0.
19%
$45
, 138
, 000
29, 0
81, 6
0022
.105 .60
017
, 465
, 500
16, 1
71, 0
0015
, 305
, 700
14, 0
00, 0
0013
, 800
, 000
13.7
14.600
13, 2
59, 3
00
$20
0,04
1,30
02.
91%
2.80
%To
tal
$21
1,15
0,60
0To
tal

Exhi
bitJ
-8Sh
eet 4
FREE
HO
LDR
EGIO
NAL
HIG
HSC
HO
OL
DIS
TRIC
TPR
INC
IPAL
PRO
PER
TYTA
XPAY
ERS
CU
RR
ENT
YEAR
AND
NINE
YEAR
SAG
OU
NAU
DIT
ED
2012
2021
Asa
%of
Com
mun
ity's
Net
Asse
ssed
Valu
atio
n
Asa
%of
Com
mun
ity's
Net
Asse
ssed
Valu
atio
n
Taxa
ble
Asse
ssed
Valu
e
Taxa
ble
Asse
ssed
Valu
eC
omm
unity
/Tax
paye
rC
omm
unity
/ Tax
paye
r
Man
alap
anM
anal
apan
Rea
ltyM
anal
apan
VFK
Hovn
ania
nat
Man
alap
an111
, LLC
Town
ePo
inte
Asso
ciat
esTr
ans
Equi
tyRe
alty,
LLC
Reiss
Man
ufac
turin
gTa
ylor9
Sout
hAs
soc.,
LLC
Mon
mou
thIn
vest
ors,
LLC
Leni
ne,L
LCPe
nsio
nR
oad
Real
tyAs
soci
ates
Man
alap
anM
anal
apan
Real
tyM
anal
apan
VFM
erid
ian
Livi
ngat
Man
alap
anLL
CTo
wne
Poin
teAs
socia
tes
Fiel
dsof
Dre
ams
Rea
l Est
ate ,
LLC
Tran
sEq
uity
Rea
lty, L
LCTe
nnen
t9Pl
aza ,
LLC
Wel
ltowe
rNNN
Gro
up, L
LCG
ACCa
terin
gIn
c.G
ordo
nsC
orne
rRea
lty, L
LC
0.75
%0.
53%
0.31
%0,
23%
0.17
%0.
14%
0.13
%0.
13%
0.13
%0.
13%
$42
,593
,600
29.98
9 .700
17.9
25.700
12, 9
17,5
009,
694,
600
7,95
8,00
07,
593,
400
7,50
0,00
07,
356 ,
000
7 ,20
0,00
0
$61
, 869
, 100
33, 5
42,7
0020
, 133
, 500
16, 2
31,2
0014
, 700
, 000
10, 9
46, 0
0010
, 635
, 000
9,35
9,40
09 ,
040, 2
008,
670,
000
0.86
%0.
47%
0.28
%0.
23%
0.21
%0.
15%
0.15
%0.
13%
0.13
%0.
12%
on -si
$15
0,72
8,50
02.
72%
Tota
l2.
65%
$19
5 ,12
7,10
0To
tal
Mar
lbor
oM
arlb
oro
Plaz
aUn
ion
Hill
Nin
eAs
soci
ates
LLC
TMC
Mar
lbor
oLL
CM
arlb
oro
Low
e ’sBr
ooks
Edge
Plaz
aLL
CRo
yalP
ines
Sunr
iseAs
sist
edLi
ving
Sam
uelA
ssoc
iate
sD
ave
Mar
ion
Cor
pEx
clus
ive
Plaz
a
Mar
lbor
oM
arlb
oro
Plaz
aUn
ion
Hill
Nine
Asso
ciat
esLL
CTM
CM
arlb
oro
LLC
Amer
ican
Plaz
a,LL
CC
amel
otW
est A
tMar
lbor
o48
0Ro
ute
9Re
alitie
s,LL
CM
arlb
oro
Com
mon
sLL
CM
arlb
oro
Lowe
'sC
RP
Roy
alPi
nes
LLC
Broo
ksEd
gePl
aza,
LLC
0.63
%0.
42%
0.31
%0.
24%
0.20
%0.
19%
0.17
%0.
17%
0.17
%0.
16%
$45
,843
, 100
30.54
9 .100
22, 5
00, 0
0017
.468.10
014
, 627
, 000
13,7
00, 0
0012
.713
.10012
, 501
,900
12.1
32.100
11, 7
76, 2
00
$36
, 642
, 400
30, 5
49, 1
0022
, 500
,000
14,7
08, 2
0012
, 700
, 000
11, 4
00,0
009,
300,
000
8,80
1,00
08,
750,
000
7,50
1,60
0
0.53
%0.
44%
0.33
%0.
21%
0.18
%0.
17%
0.14
%0.
13%
0.13
%0.
11%
2L3S
&$
162,
852,
300
Tota
l2.
66%
$19
3,81
0,60
0To
tal
Sour
ce:
Mun
icipa
l Tax
Asse
ssor
s

Exhibit J-9
FREEHOLD REGIONAL HIGH SCHOOL DISTRICT
PROPERTY TAX LEVIES AND COLLECTION
LAST TEN FISCAL YEARSUNAUDITED
Collected Within the Fiscal Year of the LevyCollections in
Percentage of Levy Subsequent YearsFiscal Year Ended Taxes Levied for the
Fiscal YearJune 30, Amount
100.00% $100.00% $100.00%100.00%100.00%100.00%100.00%100.00%100.00%100.00%
2021 $ 140,379,308141,762,932138,392,857135,752,348132,253,371129,734,619125,566,418123,178,158120,833,006119,671,515
$ 140,379,308141,762,932138,392,857135,752,348132,253,371129,734,619125,566,418123,178,158120,833,006119,671,515
202020192018201720162015201420132012
Source: District records including the Certificate and Report of School Taxes {A4F form)
158

Exhibit J-10
FREEHOLD REGIONAL HIGH SCHOOL DISTRICT
RATIOS OF OUTSTANDING DEBT BY TYPELAST TEN FISCAL YEARS
UNAUDITED
Governmental Activities
BondAnticipation
NotesParticipation Capital Leases (BANs) Total District
FiscalYear
EndedJune 30
GeneralObligation
Bonds
Percentage ofPersonalIncomea
Certificatesof
Per Capita a
2021 $ N/A $ 80$ 15,195,70417,553,35520,900,18923,203,37224,833,67026,275,41827,264,15024,741,9751,155,792
$ 15,195,70417,553,35526,105,18933,348,37239,673,67045,575,41850,804,15052,311,97531,400,00035,035,000
N/A 9220201372019 5,205,000
10,145,00014,840,00019,300,00023,540,00027,570,00031,400,00035,035,000
0.17%0.22%0.27%0.33%0.40%0.43%0.27%0.31%
1752018208201723620162622015271201416420131832012
N/A At the time of ACFR completion, this data was not yet available
Source: District ACFR Schedules 1-1, I-2
Note: Details regarding the district’s outstanding debt can be found in the notes to the basic financial statements.
a See J-14 for personal income and population data. These ratios are calculated using personal income andpopulation for the prior calendar year.
159

Exhibit J-11
FREEHOLD REGIONAL HIGH SCHOOL DISTRICT
RATIOS OF GENERAL BONDED DEBT OUTSTANDING
LAST TEN FISCAL YEARSUNAUDITED
Percentage ofActual Taxable
Value ofProperty
SchoolDistrict
Population
FiscalYear Ended
June 30,
GeneralObligation
BondsNet AssessedValue Taxable Per Capita
0.00%0.00%0.02%0.03%0.05%0.06%0.08%0.10%0.11%0.12%
$$ n/a $ 33,534,379,67732,955,860,10732,463,608,00731,566,390,06330,801,298,21430,272,553,83129,832,515,46028,113,985,73028,077,229,72028,803,438,566
20212020 190,292
190,598191,140191,721193,282192,454192,804192,610191,737
2720192018
5,205,00010,145,00014,840,00019,300,00023,540,00027,570,00031,400,00035,035,000
53772017
10020161222015143201416320131832012
Note: Details regarding the District's outstanding debtcan be found in the Notes to the Basic Financial Statements.
not available at the date the report was publishedSee J-6 for property tax data.Population data can be found in J-14.
n/aab
160

Exhibit J-12
FREEHOLD REGIONAL HIGH SCHOOL DISTRICT
RATIOS OF OVERLAPPING GOVERNMENTAL ACTIVITIES DEBT
AS OF JUNE 30. 2021UNAUDITED
EstimatedPercentage
Applicable (a)Estimated Share ofOverlapping DebtDebt OutstandingGovernmental Unit
Debt repaid with property taxesColts Neck TownshipEnglishtown BoroughBorough of FarmingdaleBorough of FreeholdFreehold TownshipHowell TownshipManalapan TownshipMarlboro Township
28,156,2941,991,129
766,97512,023,63857,894,06665,735,74916,175,00056,483,727
100.000% $100.000%100.000%100.000%100.000%100.000%100.000%100.000%
$ 28.156,2941,991,129
766,97512,023,63857,894,06665,735,74916,175,00056,483,727
Other debtMonmouth County
Colts Neck TownshipEnglishtown BoroughBorough of FarmingdaleBorough of FreeholdFreehold TownshipHowell TownshipManalapan TownshipMarlboro Township
481,238,393 Net Valuation2.338%0.210%0.135%0.863%5.211%5.726%5.437%5.525%
11,249,5181,010,755
648,1664,155,141
25,079,58327,555,43026,164,84726,590,493
3,080,714,657276,798,200177,502,100
1,137,898,0006,868,119,6007,546,137,9007,165,322,4007,281,886,820
361,680,510Subtotal, overlapping debtCounty Total Net Valuation
131,788,589,629
Freehold Regional High School District Direct Debt
$ 361,680,510Total Direct and Overlapping Debt
Note:Overlapping governments are those that coincide, at least in part, with the geographic boundaries of the District.This schedule estimates the portion of the outstanding debt of those overlapping governments that is borne by theresidents and business of the regional district. This process recognizes that, when considering the District's ability toissue and repay long-term debt, the entire debt burden borne by the residents and businesses should be taken intoaccount, However, this does not imply that every taxpayer is a resident, and therefore responsible of repaying the debt,of each overlapping payment.
(a) For debt repaid with property taxes, the percentage of overlapping debt applicable is estimated using taxable assessedproperty values. Applicable percentages were estimated by determining the portion of another government unit's taxablevalue that is within the District's boundaries and dividing it by each unit's total taxable value
161

Exhi
bitJ
-13FR
EEHO
LDRE
GIO
NAL
HIG
HSC
HOO
LDI
STRI
CT
LEGA
LDE
BTM
ARG
ININ
FORM
ATIO
N
LAST
TEN
FISC
ALYE
ARS
UN
AUD
ITED
Fisc
alYe
arEn
ded
June
30,
2014
2012
2018
£017
2016
2015
2013
2 Q21
2019
2020
1,03
6,15
4,32
8$
757 ,
521.6
04$
948,
278,
226
$94
3,33
8,22
6$
916,
523,
946
$89
0,82
6,08
5$
893,
432 ,
552
$89
7, 823
, 311
$91
9,81
9,45
2$
948,
256,
347
$De
btLi
mit
35, 0
35, 0
0019
, 300
, 000
23, 5
40, 0
0031
, 400
, 000
14,8
40,0
0027
, 570
, 000
5,20
5,00
010
, 145
, 000
Tota
lNet
Debt
Appl
icabl
eto
Limit
884,
784,
452
$91
3,22
1,34
71
, 036
, 154
, 328
$75
7,52
1, 604
$94
3,07
3,22
6$
933,
193,
226
$90
1,68
3,94
6$
871,
526,
085
$86
9,89
2,55
2$
870,
253,
311
$$
Lega
lDeb
tMar
gin
Tota
lNet
Deb
t App
licab
leto
the
Lim
itas
aPe
rcen
tage
ofDe
btLi
mit
3.55
%2.
21%
2.71
%3.
17%
3.84
%0.
00%
1.09
%1.
65%
0.00
%0.
55%
Equa
lized
Valu
atio
nBa
sis
Year
CD K)
$34
, 013, 9
71, 0
0034
,399
, 557
, 968
35, 2
01, 9
03, 8
62
2019
2020
2021
[ A]
$10
3,61
5,43
2,83
0
[A/ 3
]$
34,5
38, 4
77, 6
10Av
erag
eEq
ualiz
edVa
luat
ion
ofTa
xabl
ePr
oper
ty
[ B]
$1, 0
36, 1
54, 3
28( a
)De
btlim
it( 3
%of
aver
age)
Netb
onde
dsc
hool
debt
asof
June
30, 2
021
Lega
ldeb
t mar
gin
[C]
[ B-C]
$1, 0
36, 15
4,32
8
Sour
ce:
Abst
ract
ofR
atab
les
and
Dis
trict
Rec
ords
.(a
) Lim
itse
tby
NJSA
18A :
24-19
fora
9 -12
dist
rict.

Exhibit J-14Sheet 1
FREEHOLD REGIONAL HIGH SCHOOL DISTRICTDEMOGRAPHIC AND ECONOMIC STATISTICS
LAST TEN FISCAL YEARSUNAUDITED
Fiscal YearEnded June Per Capita Unemployment
Personal Income b Personal Income 0 RateSchool DistrictPopulation a d eCommunity30,
7.9%10.0%10.6%7.8%8.7%9.1%9.0%7.6%
N/AN/AColts NeckEnglishtownFarmingdaleFreehold BoroughFreehold Twp.HowellManalapanMarlboro
9,8411,9081,351
11,65834,67952,00639,22539,624
2020N/AN/AN/AN/A
N/A N/AN/AN/A
N/A N/AN/AN/AN/AN/A
2.7%2.9%3.6%2.8%2.9%3.2%2.8%2.7%
$ $9,8311,9141,356
11,70034,68552,02939,38439,699
811,558,881158,002,614111,939,156965,846,700
2,863,281,4354,295,045,9793,251,188,5843,277,192,149
82,55182,55182,55182,55182,55182,55182,55182,551
2019 Colts NeckEnglishtownFarmingdaleFreehold BoroughFreehold Twp.HowellManalapanMarlboro
2.9%3.5%4.9%3.3%
$ 79,47179,47179,47179,47179,47179,47179,47179,471
$ 784,299,299152,902,204104,981,191934,499,489
2,760,902,0114,139,405,9773,145,621,1223,167,475,647
9,8691,924
2018 Colts NeckEnglishtownFarmingdaleFreehold BoroughFreehold Twp.HowellManalapanMarlboro
1,32111,75934,74152,08739,58239,857
3.5%3.7%3.3%3.0%
3.3%4.2%4.9%3.8%3.9%4.1%3.7%3.4%
$ 75,91675,91675,91675,91675,91675,91675,91675,916
9,898 $ 751,416,568146,593,796
97,855,724896,947,540
2,645,748,5163,957,121,5003,019,407,0683,039,600,724
Colts NeckEnglishtownFarmingdaleFreehold BoroughFreehold Twp.HowellManalapanMarlboro
20171,9311,289
11,81534,85152,12539,77340,039
163

Exhibit J-14Sheet 2
FREEHOLD REGIONAL HIGH SCHOOL DISTRICTDEMOGRAPHIC AND ECONOMIC STATISTICS
LAST TEN FISCAL YEARSUNAUDITED
Fiscal YearEnded June Unemployment
RatedPer Capita
Personal Incomeb Personal Income 0
School DistrictPopulation a30, Community
725,375,817 $141,100,10194,188,519
865,525,9952,572,683,7683,801,299,5622,914,875,2613,008,259,999
3.7%4.5%5.5%4.1%4.1%4.5%
73,07173,07173,07173,07173,07173,07173,07173,071
9,927 $1,9311,289
11,84535,20852,02239,89141,169
2016 Colts NeckEnglishtownFarmingdaleFreehold BoroughFreehold Twp.HowellManaiapanMarlboro
4.1%3.8%
4.2%5.4%6.5%4.4%4.4%
Colts NeckEnglishtownFarmingdaleFreehold BoroughFreehold Twp.HowellManaiapanMarlboro
9,980 $1,9361,293
11,87535,31551,77739,99840,280
705,366,440 $136,832,608
91,386,654839,301,250
2,495,993,5703,659,494,8062,826,978,6442,846,909,840
70,67870,67870,67870,67870,67870,67870,67870,678
2015
5.1%4.4%4.0%
4.7%6.7%8.4%5.2%
10,027 $1,9431,299
11,92635,43851,76340,02040,388
675,739,584 $130,942,656
87,542,208803,716,992
2,388,237,6963,488,412,0962,697,027,8402,721,828,096
67,39267,39267,39267,39267,39267,39267,39267,392
Colts NeckEnglishtownFarmingdaleFreehold BoroughFreehold Twp.HowellManaiapanMarlboro
2014
5.1%6.2%5.5%4.9%
3.1%6.4%6.1%7.0%6.4%7.6%7.0%5.9%
643,557,342 $123,741,371
83,495,081763,593,499
2,273,659,8533,285,566,5732,548,484,5192,582,406,392
63,88363,88363,88363,88363,88363,88363,88363,883
10,074 $1,9371,307
11,95335,59151,43139,89340,424
Colts NeckEnglishtownFarmingdaleFreehold BoroughFreehold Twp.HowellManaiapanMarlboro
2013
164

Exhibit J-14Sheet 3
FREEHOLD REGIONAL HIGH SCHOOL DISTRICTDEMOGRAPHIC AND ECONOMIC STATISTICS
LAST TEN FISCAL YEARSUNAUDITED
Fiscal YearEnded June Per Capita Unemployment
Personal Income b Personal Income 0 RatedSchool DistrictPopulation aCommunity30
7.6%7.1%5.0%
12.6%7.4%8.9%8.3%6.8%
636,211,910 $121,612,970
82,484,770755,111,150
2,250,376,3803,222,081,0502,488,995,2902,543,648,550
10,081 $1,9271,307
11,96535,65851,05539,43940,305
63,11063,11063,11063,11063,11063,11063,11063,110
2012 Colts NeckEnglishtownFarmingdaleFreehold BoroughFreehold Twp.HowellManalapanMarlboro
613,838,120 $111,662,04079,836,540
727,864,3402,168,983,6003,096,954,5602,383,699,6402,442,743,520
60,62060,62060,62060,62060,62060,62060,62060,620
7.3%6.8%4.8%12.1%7.1%8.8%7.9%6.2%
10,126 $1,8421,317
12,00735,78051,08839,32240,296
2011 Colts NeckEnglishtownFarmingdaleFreehold BoroughFreehold Twp.HowellManalapanMarlboro
a Population information provided by the NJ Dept of Labor and Workforce Developmentb Personal income has been estimated based upon the municipal population and per capita
personal income presented.0 Per capita personal income is based on the County of Monmouth and was computed using Census Bureau
midyear population estimates by the US Bureau of Economic Analysis.d Unemployment data provided by the NJ Dept of Labor and Workforce Developmente The sharp rise in unemployment in 2020 was the result of the COVID-19 pandemic
165

Exhi
bit J
-15
FREE
HO
LDR
EGIO
NAL
HIG
HSC
HO
OL
DIST
RICT
PRIN
CIP
ALEM
PLO
YER
S
CU
RR
ENT
YEAR
AND
NIN
EYE
ARS
AGO
UN
AUD
ITED
2012
2021
Perc
enta
geof
Tota
lEm
ploy
men
t
Perc
enta
geof
Tota
lEm
ploy
men
tEm
ploy
ees
Empl
oyer
Empl
oyee
sEm
ploy
er
Mer
idia
nH
ealth
Syst
em,N
eptu
neSa
kerS
hopr
ites
Inc .,
Free
hold
AirS
afet
yEq
uipm
entI
nc.H
olm
dei
Cent
raSt
ate
Hea
lthca
re,F
reeh
old
Mon
mou
thM
edic
alCe
nter
, Lon
gBr
anch
Visi
ting
Nur
seAs
soc
ofC
entra
lJer
sey
Hov
nani
anEn
terp
rises
Inc,
Red
Bank
Food
Circ
usSu
perm
arke
tsIn
c.M
iddl
etow
nM
onm
outh
Uni
vers
ity,W
est L
ong
Bran
chBa
ysho
reCo
mm
unity
Hea
lthSe
rvic
es,H
olm
dei
2.28
%2.
06%
1.32
%0.
71%
0.64
%0.
52%
0,49
%0.
39%
0.39
%0.
36%
3.53
%1.
02%
0.82
%0.
59%
0.46
%0.
34%
0.29
%0.
26%
0.25
%0.
24%
Hac
kens
ack
Mer
idia
nH
ealth
, Wal
lSa
kerS
hopr
ites
Inc .,
Free
hold
Cent
raSt
ate
Heal
thca
reIn
c ., F
reeh
old
RW
JBa
rnab
as-M
onm
outh
Med
ical C
ente
r,Lo
ngBr
anc
Mon
mou
thU
nive
rsity
,W
estL
ong
Bran
chVi
sitin
gN
urse
Asso
cof
Cen
tralJ
erse
y ,R
edBa
nkCo
mm
vaul
t,Ti
nton
Falls
Rena
issan
ceG
arde
ns-S
eabr
ook
Villa
ge,T
into
nFa
llsN
JR
esou
rces
,Wal
lFo
odCi
rcus
Supe
rmar
kets
Inc.,
Mid
dlet
own
11, 5
603 ,
327
2,68
11,
932
1,51
31,
099
7 ,50
06 ,
800
4,35
02,
354
2 ,10
01,
700
1 ,62
91,
300
1,29
01,
200
CD CD94
485
083
480
0
9.17
%7.
79%
30, 2
2325
, 540
Tota
lEm
ploy
men
t in
Cou
nty
327,
712
329,
571
Mos
trec
enta
vaila
ble
data
pres
ente
d .
Sour
ce:
Maj
orem
ploy
ers
prov
ided
byth
eM
onm
outh
Cou
nty
Div
isio
nof
Econ
omic
Dev
elop
men
t .To
tale
mpl
oym
ent p
rovi
ded
byth
eN
ewJe
rsey
Dep
artm
ent o
fLab
oran
dW
orkf
orce
Dev
elop
men
t

Exhi
bit J
-16FR
EEH
OLD
REG
IONA
LH
IGH
SCH
OO
LD
ISTR
ICT
FULL
-TIM
EE
QU
IVA
LEN
TDI
STRI
CTEM
PLO
YEES
BYFU
NC
TIO
N/P
RO
GR
AM
LAST
TEN
FISC
ALYE
ARS
( UNA
UDIT
ED)
2015
2012
2017
2016
2014
2013
2021
2020
2019
2018
Func
tion/
Pro
gra
m
Inst
ruct
ion
Reg
ular
Spec
iale
duca
tion
Oth
erIn
stru
ctio
n
620.
816
8.0
619.
616
8.0
593.
215
7.4
597.
619
3.6
616.
018
0.0
619.
917
7.9
627.
215
4.0
587.
615
1.4
590.
815
6.4
596.
217
0.0
2.0
21.7
4.0
2.0
2.0
3.0
21.7
21.7
21.7
12.5
Supp
ortS
ervic
es:
Stud
ent&
Inst
ruct
ion
Rel
.Svc
sSc
hool
Adm
inist
rativ
eSe
rvic
esG
ener
alan
dC
entra
lSer
vices
Plan
tOpe
ratio
ns&
Mai
nten
ance
Pupi
lTra
nspo
rtatio
nTo
tal
O22
3.0
223.
020
5.8
174.
817
7.3
191.
220
7.0
208.
517
2.0
176.
8-si
44.0
61.0
60.0
44.0
44.0
44.0
65.3
64.3
65.8
61.0
31, 5
31.3
31.3
36.0
36.0
36.0
28.1
28.0
36.0
28.1
118.
014
3.0
119.
014
6.0
117.
014
5.0
128.
514
8.0
128.
014
0.0
128.
014
1.0
124.
014
2.0
127.
014
2.0
118.
014
5.0
127.
014
1.0
1 ,35
6.8
1,35
4.6
1,35
9.0
1,30
5.0
1,31
1.4
1,32
3.0
1,35
5.2
1,34
8.0
1,35
3.3
1,29
4.1
Sour
ce:D
istri
ctR
ecor
ds

Exhi
bit J
-17
FRE
EH
OLD
REG
iON
ALH
IGH
SCH
OO
LD
ISTR
ICT
OPE
RAT
ING
STAT
ISTI
CS
LAST
TEN
FISC
ALYE
ARS
( UN
AUD
ITED
)
Aver
age
Dai
lyAv
erag
eD
aily
%C
hang
ein
Stud
ent
Atte
ndan
ceAv
erag
eD
aily
Atte
ndan
ce( A
DA) c
Enro
llmen
tPe
rcen
tage
Fisc
alYe
arEn
ded
June
Ope
ratin
gEn
rollm
ent
Expe
nditu
res
aC
ost P
erPu
pil
Teac
hing
Pupi
l / Tea
cher
Enro
llmen
tR
atio
Perc
enta
geC
hang
eSt
affb
( AP
E)c
30,
10, 2
39.8
10.4
16. 7
10.4
63.8
10.6
03.1
10,7
92.7
10, 9
08.0
11, 0
66.5
11.2
53. 9
11.2
47.1
11, 0
65.3
216,
555,
781
212,
866,
523
217,
071,
071
214 ,
387 ,
318
208,
222,
156
200 ,
651 ,
681
194,
111,
975
185,
727,
106
182 ,
030,
689
175,
985,
090
21,1
0720
, 372
20, 6
1020
, 095
19,5
2718
, 298
17, 1
7416
,361
15, 9
0515
,207
1.14
.51.
14.4
1.14
.41.
14.4
1.14
. 41:
14.2
1 :14
.81 :
15.2
1 :15
.81:
14.8
9.84
6.8
10, 0
19.6
9.85
3.99 ,
939.
110
,135
.710
.268
.410
, 412
.010
.558
.110
.573
. 510
.457
.2
( 1.7
0)( 0
.45)
( 1.3
1)( 1
.76)
( 1.0
6)(1
.43)
( 1.6
6)
10, 2
60.0
10, 4
49.0
10.5
32. 5
10.6
68.5
10, 8
13.0
10, 9
66.0
11.3
02.5
11, 3
52.0
11, 4
45.0
11, 5
73.0
3.61
%- 1
.15%
2.56
%2.
91%
6.72
%6.
54%
4.97
%2.
87%
4.59
%1.
41%
96.2
%96
.2%
94.2
%93
.7%
93.9
%94
.1%
94.1
%93
.8%
94.0
%94
.5%
2021
693
723
2020
2019
734
2018
748
<J)75
020
17co
2016
770
2015
771
0.06
2014
776
1.64
2013
768
( 4.5
6)74
920
12
Sour
ce:
Dis
trict
reco
rds
Not
e :En
rollm
entb
ased
onan
nual
Oct
ober
dist
rict c
ount
.
aO
pera
ting
expe
nditu
res
equa
l tot
alex
pend
iture
sle
ssde
btse
rvic
ean
dca
pita
l out
lay,
bTe
achi
ngst
aff i
nclu
des
only
full -t
ime
equi
vale
nts
ofce
rtific
ated
staf
f.c
Aver
age
daily
enro
llmen
t&av
erag
eda
ilyat
tend
ance
are
obta
ined
from
the
Scho
olR
egis
ters
.

Exhi
bitJ
-18FR
EEH
OLD
REG
iON
ALH
IGH
SCH
OO
LD
ISTR
ICT
SCHO
OL
BUIL
DING
INFO
RM
ATIO
N
LAST
TEN
FISC
ALYE
ARS
( UNA
UDIT
ED)
2021
2020
2012
2019
2018
2016
2015
2013
2017
W*
Dis
tric
tBu
ildin
g
Hig
hSc
hool
sC
olts
Neck
Hig
hSc
hool
( 199
8)Sq
uare
Feet
Cap
acity
(stu
dent
s )En
rollm
ent
Free
hold
Boro
ugh
Hig
hSc
hool
( 195
4)Sq
uare
Feet
Cap
acity
( stu
dent
s)En
rollm
ent
Free
hold
Tow
nshi
pH
igh
Scho
ol( 1
968)
Squa
reFe
etCa
pacit
y( s
tude
nts)
Enro
llmen
tHo
wellH
igh
Scho
ol( 1
962)
Squa
reFe
etC
apac
ity( s
tude
nts)
Enro
llmen
tM
anal
apan
Hig
hSc
hool
( 196
8)Sq
uare
Feet
Cap
acity
( stu
dent
s)En
rollm
ent
Mar
lbor
oH
igh
Scho
ol(1
966)
Squa
reFe
etC
apac
ity( s
tude
nts)
Enro
llmen
t
219,
490
1,74
81,
328
219,
490
1,74
81,
316
219,
490
1,74
821
9,49
01 ,
748
1,45
0
219, 4
901, 7
481,
352
219,
490
1,74
81,
430
219,
490
1,74
81,
457
219,
490
1, 748
1,49
3
219,
490
219,
490
1.74
81.
478
1,74
81,
403
1,51
3
187,
256
1,56
41,
314
187,
256
1,56
41,
357
187.
256
1,56
41,
377
187.
256
1 ,56
41,
451
187,
256
1,56
418
7,25
61,
564
1,42
2
187,
256
1,56
4
1,47
8
187,
256
1,56
418
7,25
61,
564
1,58
0
187,
256
1,56
41,
566
1,36
11,
551
258,
840
2,22
425
8.840
2,22
425
8,840
2,22
42.
047
258, 8
402,
224
258,
840
2,22
42,
062
258,
840
2,22
42,
102
258, 8
402,
224
2,09
1
258,
840
2,22
42,
127
258,
840
2,22
42,
034
258,
840
2,22
41,
996
2.02
12,
041
2,16
2G
)CD
249 ,
497
2,27
42,
039
249.
497
2.27
42.
082
249.
497
2,27
42,
099
249.
497
2,27
42,
085
249,
497
2,27
42,
154
249,
497
2,27
42,
217
249,
497
2,27
42,
112
249,
497
2,27
42,
252
249,
497
2,27
42,
299
249,
497
2.27
42 ,
456
256,
293
2.34
11,
805
256,
293
2,34
11,
850
256,
293
256,
293
256,
293
2,34
11,
908
256,
293
2,34
11,
934
256,
293
256.
293
256,
293
256,
293
2,34
11,
948
2.34
12,
341
2.34
11,
991
2,34
12,
341
1,85
31,
923
1,91
71,
890
264,
142
2,45
01,
792
264.
142
2.45
026
4,14
22,
450
1.81
8
264,
142
2,45
01,
849
264,
142
2, 450
1,91
9
264,
142
2,45
01,
937
264,
142
2,45
01,
956
264,
142
2,45
01,
950
264.1
422,
450
1, 971
264.
142
2,45
01,
920
1,81
1
Oth
erAd
min
istra
tionB
uild
ing
( 198
2)Sq
uare
Feet
Tran
spor
tatio
nSq
uare
Feet
Mai
nten
ance
Offi
ces
Squa
reFe
et
22, 0
0022
, 000
22, 0
0022
, 000
22, 0
0022
, 000
22, 0
0022
, 000
22, 0
0022
.000
9.60
09,
600
9,60
09,
600
9,60
09,
600
9,60
09,
600
9,60
09,
600
400
400
400
400
400
400
400
400
400
400
Num
bero
f Sch
ools
atJu
ne30
, 202
1H
igh
Scho
ol=6
Oth
er=3
Sou
rce:
Dist
rict r
ecor
ds.AS
SA
Not
e :Ye
arof
orig
inal
cons
truct
ion
issh
own
inpa
rent
hese
s .In
crea
ses
insq
uare
foot
age
and
capa
city
are
the
resu
ltof
addi
tions
.En
rollm
ent is
base
don
the
annu
alO
ctob
erdi
stric
t cou
nt.

Exhi
bitJ
-19FR
EEH
OLD
REG
ION
ALH
IGH
SCH
OO
LD
ISTR
ICT
GEN
ERAL
FUND
SCH
EDU
LEO
FAL
LOW
ABLE
MAI
NTE
NAN
CE
FOR
SCH
OO
LFA
CIL
ITIE
S
LAST
TEN
FISC
ALYE
ARS
END
ING
JUN
E30
UNAU
DITE
D
Undi
strib
uted
Expe
nditu
res
-Req
uire
dM
aint
enan
cefo
r Sch
oolF
acilit
ies
11-00
0 -261
-XXX
Tota
lP
roje
ct( #
) s20
2020
1920
1820
1720
1620
1520
1420
12Sc
hool
Facil
ities
2021
2013
$58
4,92
1$
553,
134
$31
1,40
137
4 ,63
232
5,00
132
6,99
633
5,72
82,
434,
785
2,25
8,67
92,
313,
630
2,41
4,81
5
513,
687
316,
229
446.
244
380,
272
401,
235
357,
148
$39
4 ,64
1$
342,
022
473,
569
473,
569
473 ,
569
473,
569
2,63
0,93
924
, 950
, 593
$52
7,40
829
0,39
838
5,00
036
2,18
439
5,71
534
8,51
4
782,
460
$34
0,25
541
6,26
640
4 ,74
436
4,03
836
5,18
52,
672,
948
2,67
9,55
1
$67
3,82
437
9,28
038
9,20
343
1 ,80
636
4,38
638
5,40
7
583 ,
941
$31
7,77
943
5,21
538
7,88
336
6,30
334
3,66
4
$49
1,65
038
8,51
441
3,92
835
6,26
945
3,71
550
8,04
5
5,75
7,54
63,
417, 2
754,
152,
188
3 ,91
4,47
33,
875,
071
3,83
4,04
0
Colts
Nec
kH
igh
Scho
olFr
eeho
ldBo
roug
hH
igh
Scho
olFr
eeho
ldTo
wns
hip
Hig
hSc
hool
How
ellH
igh
Scho
olM
anal
apan
-Engl
ishto
wnH
igh
Scho
olM
arlb
oro
Hig
hSc
hool
Tota
l Sch
oolF
acilit
ies
NA
$65
1,88
041
7,55
942
7,90
741
7 ,37
438
4,03
638
0,79
5
313 ,
838
390 ,
224
375,
371
345,
078
335,
985
NA NA NA NA NA
2,30
9,21
92,
623,
906
2,61
2,12
1O
Oth
erFa
cilit
ies
$2,
434,
785
$2,
258,
679
$2,
313,
630
$2,
414,
815
$2,
612,
121
$2,
630,
939
$24
,950
,593
$2,
309 ,
219
$2,
672,
948
$2,
679,
551
$2,
623,
906
Gra
ndTo
tal
Scho
olfa
cilit
ies
asde
fined
unde
r EFC
FA.
( N.J .
A .C.6
A:26
-1.2an
dN.
J.A .C
.6 A:2
6 A-1.
3)
Sour
ce:
Dist
rictr
ecor
ds

Exhi
bitJ
-20
FREE
HO
LDR
EGIO
NAL
HIG
HSC
HO
OL
DIS
TRIC
T
INSU
RAN
CE
SCH
EDU
LE
FOR
THE
YEAR
END
EDJU
NE
30.2
021
UNAU
DITE
D
Dedu
ctib
ie/R
eten
tion
Cov
erag
e
USI
Insu
ranc
eSe
rvice
sPr
oper
tyE
quip
men
t Bre
akdo
wn( In
clud
edin
Prop
erty
)$
Floo
d,ea
choc
curre
nce
Earth
quak
e ,ea
choc
curre
nce
Oth
erlo
sses
25, 0
0025
,000
5,00
0
$ 356
, 841
, 272
$ 3, 0
00,0
00G
ener
alAg
greg
ate
$ 1, 0
00,0
00Ea
chW
rong
fulA
ctor
Offe
nse
/ $3,
000,
000
Aggr
egat
$ 1, 0
00, 0
00pe
r occ
urre
nce/
aggr
egat
e$ 2
50, 0
00lim
it$ 1
0 ,00
0,00
0$ 1
0QK -$
500K
,de
pend
ing
onty
pe$ 1
,000
, 000
Gen
eral
Liab
ility
Scho
olD
istri
ctan
dEd
ucat
ors
Lega
lLia
bilit
yEm
ploy
men
t Pra
ctic
esC
yber
Com
mer
cial
Umbr
ella/
Exce
ssLi
abilit
yC
rime
Auto
mob
ile
10, 0
0010
, 000
2,50
010
, 000
1,00
01,
000
1,00
0C
ompr
ehen
sive
dedu
ctib
leC
ollis
ion
dedu
ctib
le
50, 0
00or
75, 0
00de
pend
ing
onco
nditio
n$ 1
, 000
, 000
per o
ccur
renc
e/$ 3
, 000
, 000
aggr
egat
eEn
viron
men
talIm
pairm
ent L
iabi
lity
1,00
0$ 7
00,0
00Bo
ard
Secr
etar
y
N/ A
Stat
utor
yW
orke
rsC
ompe
nsat
ion
-Sel
f -Insu
red
with
PMA
asTP
A
Sou
rce :
Dis
trict
Rec
ords

SINGLE AUDIT SECTION

EXHIBIT “K-1"
SUPLEE, CLOONEY & COMPANYCERTIFIED PUBLIC ACCOUNTANTS
308 East Broad Street , Westf ie ld , New Jersey 07090 - 2122
Fax 908 -789-8535Te lephone 908-789-9300E-mai l in [email protected]
INDEPENDENT AUDITOR’S REPORT ON INTERNAL CONTROLOVER FINANCIAL REPORTING AND ON COMPLIANCE AND
OTHER MATTERS BASED ON AN AUDIT OF BASIC FINANCIALSTATEMENTS PERFORMED IN ACCORDANCE WITH
GOVERNMENT AUDITING STANDARDS
Honorable President and Membersof the Board of Education
Freehold Regional High School DistrictCounty of MonmouthEnglishtown, New Jersey
We have audited, in accordance with the auditing standards generally accepted in the UnitedStates of America, and the standards applicable to financial audits contained in Government AuditingStandards issued by the Comptroller General of the United States and in compliance with the auditrequirements as prescribed by the Office of School Finance, Department of Education, State of NewJersey, the financial statements of the governmental activities, the business-type activities and eachmajor fund of the Freehold Regional High School District (the "District") as of and for the year endedJune 30, 2021, and the related notes to the financial statements, which collectively comprise theDistrict’s basic financial statements, and have issued our report thereon dated February 1, 2022.
Internal Control Over Financial Reporting
In planning and performing our audit of the financial statements, we considered the District'scontrol over financial reporting (internal control) as a basis for designing audit procedures that areappropriate in the circumstances for the purpose of expressing our opinions on the financialstatements but not for the purpose of expressing an opinion on the effectiveness of the District’sinternal control. Accordingly, we do not express an opinion on the effectiveness of the FreeholdRegional High School District’s internal control.
A deficiency in internal control exists when the design or operation of a control does not allowmanagement or employees, in the normal course of performing their assigned functions, to prevent, ordetect and correct, misstatements on a timely basis. A material weakness is a deficiency, or acombination of deficiencies, in internal control, such that there is a reasonable possibility that amaterial misstatement of the District’s financial statements will not be prevented, or detected andcorrected on a timely basis. A significant deficiency is a deficiency, or a combination of deficiencies,in internal control that is less severe than a material weakness, yet important enough to meritattention by those charged with governance.
172

SUPLEE, CLOONEY & COMPANY
Our consideration of internal control was for the limited purpose described in the firstparagraph of this section and was not designed to identify all deficiencies in internal control that mightbe material weaknesses or significant deficiencies. Given these limitations, during our audit we did notidentify any deficiencies in internal control that we consider to be material weaknesses. However,material weaknesses may exist that have not been identified.
Compliance and Other Matters
As part of obtaining reasonable assurance about whether the District’s financial statements are freefrom material misstatement, we performed tests of its compliance with certain provisions of laws,regulations, contracts, and grant agreements, noncompliance with which could have a direct andmaterial effect on the determination of financial statement amounts. However, providing an opinion oncompliance with those provisions was not an objective of our audit, and accordingly, we do notexpress such an opinion. The results of our tests disclosed no instances of noncompliance or othermatters that are required to be reported under Government Auditing Standards and the auditrequirements as prescribed by the Office of School Finance, Department of Education, State of NewJersey.
Purpose of This Report
The purpose of this report is solely to describe the scope of our testing of internal control andcompliance and the results of that testing, and not to provide an opinion on the effectiveness of theDistrict’s internal control or on compliance. This report is an integral part of an audit performed inaccordance with Government Auditing Standards in considering the District’s internal control andcompliance. Accordingly, this communication is not suitable for any other purpose.
CERTIFIED PUBLIC ACCOUNTANTS
(AJ ijLyL-PUBLIC SCHOOL ACCOUNTANT NO. 948
February 1, 2022
173

EXHIBIT “K-2"
SUPLEE, CLOONEY & COMPANYCERTIFIED PUBLIC ACCOUNTANTS
308 East Broad Street , Westf ie ld , New Jersey 07090 - 2122
Fax 908 -789-8535Telephone 908 -789- 9300E-mai l info@scnco . com
INDEPENDENT AUDITOR'S REPORT ON COMPLIANCEWITH REQUIREMENTS APPLICABLE TO EACH MAJOR FEDERAL
AND STATE FINANCIAL ASSISTANCE PROGRAMS AND ONINTERNAL CONTROL OVER COMPLIANCE IN ACCORDANCE
WITH THE UNIFORM GUIDANCE AND NEW JERSEY OMB CIRCULAR 15-08
Honorable President and Membersof the Board of Education
Freehold Regional High School DistrictCounty of MonmouthEnglishtown, New Jersey
Report on Compliance for Each Major Federal and State Program
We have audited the Freehold Regional High School District’s compliance with the types ofcompliance requirements described in the OMB Compliance Supplement and the New Jersey OMBState Grant Compliance Supplement that could have a direct and material effect on each of theFreehold Regional High School District’s major federal and state programs for the year ended June30, 2021. The District’s major federal and state programs are identified in the summary of auditor’sresults section of the accompanying schedule of findings and questioned costs.
Management’s Responsibility
Management is responsible for compliance with the requirements of laws, regulations,contracts, and grants applicable to its federal and state programs.
Auditor’s Responsibility
Our responsibility is to express an opinion on compliance for each of the Freehold RegionalHigh School District’s major federal and state programs based on our audit of the types of compliancerequirements referred to above. We conducted our audit of compliance in accordance with auditingstandards generally accepted in the United States of America; the standards applicable to financialaudits contained in Government Auditing Standards, issued by the Comptroller General of the UnitedStates; and the audit requirements of Title 2 U.S. Code of Federal Regulations Part 200, UniformAdministrative Requirements, Cost Principles, and Audit Requirements for Federal Awards(Uniform Guidance) and New Jersey OMB 15-08. Those standards, the Uniform Guidance and NewJersey OMB 15-08 require that we plan and perform the audit to obtain reasonable assurance aboutwhether noncompliance with the types of compliance requirements referred to above that could havea direct and material effect on a major federal or state program occurred. An audit includesexamining, on a test basis, evidence about the Freehold Regional High School District’s compliancewith those requirements and performing such other procedures as we considered necessary in thecircumstances.
174

SUPLEE, CLOONEY & COMPANY
We believe that our audit provides a reasonable basis for our opinion on compliance for eachmajor federal and state program. However, our audit does not provide a legal determination of theFreehold Regional High School District's compliance.
Opinion on Each Major Federal and State Program
In our opinion, the Freehold Regional High School District complied, in all material respects,with the types of compliance requirements referred to above that could have a direct and materialeffect on each of its major federal and state programs for the year ended June 30, 2021.Report on Internal Control Over Compliance
Management of the Freehold Regional High School District is responsible for establishing andmaintaining effective internal control over compliance with the types of compliance requirementsreferred to above. In planning and performing our audit of compliance, we considered FreeholdRegional High School District’s internal control over compliance with the types of requirements thatcould have a direct and material effect on each major federal and state program to determine theauditing procedures that are appropriate in the circumstances for the purpose of expressing anopinion on compliance for each major federal program and to test and report on internal control overcompliance in accordance with the Uniform Guidance and New Jersey OMB 15-08, but not for thepurpose of expressing an opinion on the effectiveness of internal control over compliance.Accordingly, we do not express an opinion on the effectiveness of the Freehold Regional High SchoolDistrict’s internal control over compliance.
A deficiency in internal control over compliance exists when the design or operation of acontrol over compliance does not allow management or employees, in the normal course ofperforming their assigned functions, to prevent, or detect and correct, noncompliance with a type ofcompliance requirement of a federal or state program on a timely basis. A material weakness ininternal control over compliance is a deficiency, or combination of deficiencies, in internal control overcompliance, such that there is a reasonable possibility that material noncompliance with a type ofcompliance requirement of a federal or state program will not be prevented, or detected andcorrected, on a timely basis. A significant deficiency in internal control over compliance is a deficiency,or a combination of deficiencies, in internal control over compliance with a type of compliancerequirement of a federal or state program that is less severe than a material weakness in internalcontrol over compliance, yet important enough to merit attention by those charged with governance.
Our consideration of internal control over compliance was for the limited purpose described inthe first paragraph of this section and was not designed to identify all deficiencies in internal controlover compliance that might be material weaknesses or significant deficiencies. We did not identify anydeficiencies in internal control over compliance that we consider to be material weaknesses. However,material weaknesses may exist that have not been identified.
The purpose of this report on internal control over compliance is solely to describe the scopeof our testing of internal control over compliance and the results of that testing based on therequirements of the Uniform Guidance and State of New Jersey OMB 15-08. Accordingly, this reportis not suitable for any other purpose.
CERTIFIED PUBLIC ACCOUNTANTS
PUBLIC SCHOOL ACCOUNTANT NO. 948February 1, 2022
175

SCH
EDU
LEA
EXHI
BIT
K -3FR
EEHO
LDRE
GIO
NAL
HIG
HSC
HOO
LD
ISTR
ICT
SCHE
DULE
OF
EXPE
NDIT
URES
OF
FEDE
RAL
AWAR
DS
FOR
THE
FISC
ALYE
ARS
END
EDJU
NE
30.2
021
FEDE
RAL
CFDA
NUM
BER
GRA
NTO
RST
ATE
PRO
JECT
NUM
BER
ADJU
STED
BALA
NCE
ATJU
NE
30,20
20
REPA
YMEN
TO
FP
/ Y'S
BALA
NCE
BALA
NCE
JUNE
30.20
21FE
DERA
LG
RAN
TOR
/PAS
S -THR
OUG
HG
RA
NTO
R/ P
RO
GR
AMTI
TLE
FED
ERAL
AWAR
DID
ENTI
FICA
TIO
NNU
MBE
RAW
ARD
AMO
UN
TG
RANT
PERI
OO
BUDG
ETAR
YEX
PEN
DIT
UR
ESC
ASH
REC
EIVE
D( A
CCO
UNTS
UNEA
RNED
RECE
IVAB
LE)
REV
ENU
EG
RAN
TOR
DUE
FRO
MTO
Gen
eral
Fund
:U .S
.Dep
artm
ento
f Hea
lthan
dH
uman
Serv
ices
Pas
sed -
thro
ugh
Stat
eD
epar
tmen
t of E
duca
tion:
Med
ical
Assi
stan
cePr
ogra
m( S
EMI)
FFC
RA /
SEM
iTo
tal G
ener
alFu
nd
93.7
7893
.778
2005
NJ5
MAP
N/ A
511
5.90
012
, 067
7/1/
2020
1/1 /
2020
6 /30
/ 202
1S
12/3
1/20
205
115,
900
$
12.06
7( 1
15.9
00)
S( 1
2.067
)$
S$
N/A
127.
967
( 127
.967
)
Spe
cial
Rev
enue
Fund
:U .S
.Dep
artm
ento
f Edu
catio
nPa
ssed
-throu
ghSt
ate
Depa
rtmen
t ofE
duca
tion :
Spec
ial E
duca
tionC
lust
erI. D
. E.A.
Part
BBa
sicI. D
. E.A.
Part
BBa
sic
Tota
lSpe
cial
Educ
atio
nC
lust
er
84.0
2784
.027
H02
7 A20
0100
H02
7A19
0100
IDEA
1650
20ID
EA16
5019
2,22
7,36
32 ,
140,
331
7/1/
2020
7/1/
2019
6 /30
/ 202
16/
30/ 2
020
1,94
4, 644
400 ,
389
( 2.19
8, 637
)( 2
53, 9
93)
( 400
, 389
)( 4
00, 38
9)2,
345,
033
( 2, 1
98, 6
37)
( 253
, 993
)
TitleI .Pa
rtA
Basi
cTi
tlel,
Part
ABa
sic
Title
II,Pa
rtA
Teac
her&
Prin
cipa
lTra
inin
gTi
tleII .P
artA
Teac
her&
Prin
cipa
l Tra
inin
gTi
tleIII
Title
IIITi
tleIII,I
mm
igra
ntTi
tleIII.Im
mig
rant
Title
IVTi
tleIV
Voca
tiona
lEdu
catio
n-Pe
rkin
sVo
catio
nalE
duca
tion
-Perk
ins
84.0
1084
.010
84.3
6784
.367
84.3
6584
.365
84.3
6584
.365
84.4
2484
.424
84.0
4884
.048
S010
A 200
030
SO10
A190
030
S367
A 200
029
S367
A190
029
S36
5 A20
0030
S36
5 A19
0030
S365
A20
0030
S365
A190
030
S42
4A20
0031
S 424
A190
031
V048
A20
0030
V048
A190
030
NC
LB16
5020
NCLB
1650
19N
CLB
1650
20NC
LB16
5019
NC
LB16
5020
NC
LB16
5019
NCLB
1650
20NC
LB16
5019
NCLB
1650
20NC
LB16
5019
744.
986
709 ,
199
208.
327
188.
684
32, 3
6422
,043
11, 2
677 ,
780
56, 1
5244
,968
29, 1
8227
.381
7/1/
2020
7/1 /
2019
7/1/
2020
7 /1/
2019
7/1/
2020
7/1/
2019
7/1/
2020
7/1/
2019
7/1/
2020
7/1/
2019
7/1/
2020
7/1
/ 201
9
6 /30
/ 202
16 /
30/2
020
6 /30
/ 202
16/
30/2
020
6/30
/ 202
16 /
30/ 2
020
6/30
/ 202
16 /
30/ 2
020
6/30
/ 202
16 /
30/ 2
020
6 /30
/ 202
16/
30/ 2
020
354 ,
929
239,
337
67.6
0062
, 908
15.6
162.
174
1.24
52,
527
35, 3
31
( 613
, 519
)( 2
58, 5
90)
( 239
,337
)( 9
1, 673
)( 4
5,23
0)( 2
5,88
0)
( 24,
073)
( 17,
678)
( 10,
264)
( 2.17
4)( 1
.245
)( 2
.527)
( 42.
689)
( 7.3
58)
( 663
)66
315
, 777
2.37
2( 9
.159)
N/ A
( 24,
936)
-v ! CDN
/ A( 2
.372
)
Educ
atio
nSt
abiliz
atio
nFun
dCA
RES
-ESSE
RFTo
talE
duca
tion
Stab
ilizat
ion
Fund
84.4
25D
S42
5 D20
0027
554.
239
3/13
/ 20
554.
239
( 554
, 239
)N/
A9/
30/ 2
255
4,23
9( 5
54, 2
39)
U .S .
Depa
rtmen
t of T
reas
ury
Pass
ed-thr
ough
Stat
eDe
partm
ent o
fEdu
catio
n :Co
rona
virus
Relie
fFun
d :CR
F-No
npub
licTe
chno
logy
CR
F-Br
idgi
ngth
eD
igita
l Div
ide
CR
F-LE
AR
eope
nTo
tal C
oron
avtru
sRe
liefF
und
21.0
1921
.019
2101
9
S377
A13
0031
N/A
14.6
6041
6 ,34
442
1.02
7
7/16
/ 202
07/
16/ 2
020
9/1/ 2
020
10/ 3
1/20
2010
/31 /
2020
12/ 3
0/20
20
14.6
6041
6,34
442
1.02
7
( 14.
660)
( 416
,344
)( 4
21, 0
27)
N/ A
N/ A
21-51
20-51
7N
/A( 8
52, 0
31)
852.
031
Uni
ted
Stat
esD
epar
tmen
t of D
efen
se:
JROT
CTo
talS
peci
alRe
venu
eFu
nd12
.357
24.6
327/
1 /20
206/
30/ 2
021
19,7
83( 2
4,63
2 ?(4
, 849)
N/ A
N/A
( 4.4
74, 7
11)
( 665
, 140
)4.
571.5
65( 5
68.2
86)
Ente
rpris
eFu
nd:
U .S.
Depa
rtmen
t of A
gric
ultu
rePa
ssed
-throu
ghSt
ate
Depa
rtmen
tof E
duca
tion;
Child
Nutri
tion
Clus
ter
Scho
olBr
eakf
astP
rogr
amSc
hool
Brea
kfas
t Pro
gram
-COVI
DC
omm
odity
Supp
lem
enta
lFoo
dPr
ogra
mC
omm
odity
Supp
lem
enta
l Foo
dPr
ogra
mNa
tiona
l Sch
oolL
unch
Prog
ram
Nat
iona
l Sch
oolL
unch
Prog
ram
-CO
VID
Heal
thy
Hung
erFr
eeKi
dsAc
tHe
alth
yHun
ger F
ree
Kids
Act
Child
Nutri
tionP
rogr
amEm
erge
ncy O
pera
ting
Cost
s10
.555
Tota
l Chi
ldNu
tritio
nCl
uste
r
10.5
5310
.553
10.5
5510
.555
10.5
5510
.555
10.5
5110
.551
( 1.7
78)
211N
J304
N109
920
1NJ3
04N
1099
211N
J304
N109
920
1NJ3
04N1
099
211N
J304
N109
920
1NJ 3
04N1
099
211N
J304
N10
9920
1NJ3
Q 4N1
099
211N
J304
N10
99
N/A
21, 5
3118
, 745
15,5
9289
,729
38.5
1250
, 220
7/1
/ 202
07/
1/20
197/
1/20
207 /
1/20
197/
1/20
207/
1/20
197/
1/20
207/
1/20
197/
1/20
20
6 /30
/ 202
16/
30/ 2
020
6 /30
/ 202
16 /
30/ 2
020
6 /30
/ 202
16 /
30/ 2
020
6/30
/ 202
16 /
30/ 2
020
6/30
/202
1
19, 7
533.
311
15.3
32
( 21.
531)
N/A
( 3.3
11)
(15,
332 )
N/A
260
(260
)N/
A( 3
8,51
2)( 7
.087
)31
, 425
5.132
N/ A
( 5.13
2)N
/ AN
/ A76
870
4( 7
68)
( 64)
N/A
14.43
151
, 784
(105
)10
5( 5
1,78
4 )( 5
1, 784
)N/
A75
, 762
( 128
.187
)(6
0 ,71
3)( 6, 2
88)
75.7
62( 1
28, 1
87)
( 60 ,
713)
( 8.2
68)
Tota
lEnt
erpr
ise
Fund
4 ,77
5.29
4$
( 4.7
30.66
S)$
$( 6
28, 9
99)
$$
5( 6
73, 4
28)
6To
tal F
eder
alFi
nanc
ialA
ssis
tanc
e
See
acco
mpa
nyin
gno
tes
tosc
hedu
les
offin
anci
alas
sist
ance
.

Exm
ar-K -4-
SCHE
DULE
“ B"
FREE
HOLD
REG
IONA
LHIG
HSC
HOO
LDI
STRI
CT
EQB -
THE .F ) $
CALI
E »fl£
NP. £P
Jy.M
UtU
ga
i
MEM
OBA
LANC
EJU
NE
30,
2020
ADJU
STM
ENTS'
REPA
YMEN
TOF
PRIO
RYE
ARS
BALA
NCES
CUM
ULAT
IVE
TOTA
LBA
LANC
EJU
NE30
.202
1BU
DGET
ARY
RECE
IVAB
LEGR
ANT
OR
STAT
EPR
OJEC
TNU
MBE
RBU
DGET
ARY
EXPE
NDIT
URES
AWAR
DAM
OUNT
GRA
NTPE
RIOD
DUE
STAT
E/fA
CGTS
REC
)
CA
SH
RECE
IVED
{ ACC
OUN
TSRE
CEIV
ABLE
)
UNEA
RNED
REVE
NUE
DU
EG
RANT
OR
STAT
EG
RANT
OR
/ PR
OG
RAM
TITL
ESt
ate
Dep
artm
ent o
f Edu
catio
nG
ener
alFu
nds.
Stat
eA
dPu
blic
Clus
ter
Cate
goric
alSp
ecia
l Edu
catio
nA
dEq
ualiz
atio
nA
dCa
tego
rical
Secu
rity
Aid
Cate
goric
alSp
ecia
l Edu
catio
nA
dEq
ualiz
atio
nA
dCa
tego
rical
Secu
rity
A «a
Tota
l Sta
teAd
Publi
c Clu
ster
7.03
0 .185
36.93
3, 216
735.
594
7.03
0 .165
31, 1
50, 5
3173
5.59
4
$69
1.63
93, 6
33.54
072
.369
6,34
6.430
26.1
20,8
3366
4,05
0
Ss
20-49
5 -034-51
20-08
9S
20-495
-034-512
0 -078
20-495
-034 -5
120 -0
8421
-495-034
-5120
-08921
-495 -0
34-51
20-078
21-49
5 -034
-5120
-004
7.03
0 .105
7/1/
2019
36.93
3,21
67 /
1/20
1973
5.59
47/
1/20
197.
030, 1
057/
1/20
2031
, 150, 5
317/
1/20
2073
5.59
47/
1/20
20
S/3 D
/ 202D
S6/
30/20
206 /
30/ 20
206/3
0 /20
216/ 3
0 /20
216 /
30/ 2
021
<691.
639)
S( 3
.633
.540)
( 72,
369)
683.
755
3, 029
, 698
71, 5
44
5$
(7, 0
30.1
85)
( 31.
150 .53
1)( 7
35,5
94)
683.
755
3, 029
, 698
71, 5
4439
, 528
.861
( 38.9
16.310
)( 6
12, 5
51)
3,78
4,99
783
, 615
, 305
1 ,01
6.395
1.81
6,39
52,
816.9
633.
775 .20
810
9,79
09.
641
21.4
28.18
46.7
15.259
5.654
.8775,
677,
663
2049
5 -034 -5
120 -014
2149
5034
-5120
-014
204
95-03
4 -512
0 -044
2149
5 -034
-5120
-044
21-100
-034 -5
120 -0
6621
495 -0
34-50
94-00
421
495 -0
34-50
94-002
2149
5 -034
-5094
-001
2149
5 -034
-5095
-051
2049
5 -034
-5095 -0
51
1,81
6.395
7/1/
2019
1,81
6.395
7/1/ 2
020
2.81
G .963
7/1/
2019
3 ,77
5.208
7/1/
2020
109.
790
7/1/
2020
9.64
17/
1/2
020
21.4
28, 1
847/
1 /20
206.
715,
259
7/1
/ 2020
5.654
.877
7 /1
/ 202
05.6
77, 6
637/ 1
/201
9
178,
699
1 ,63
9.73
32,
816.
963
( 178
.699)
176,
662
Cate
goric
alTr
ansp
orta
tion
Aid
Cat
egor
ical
Tran
spor
tatio
nAi
dEx
traor
dina
ryS
peci
alEd
ucati
onC
osts
Ad
Extra
ordi
nary
Spe
cial
Educ
ation
Cos
tsAi
dN
cn-Pub
leTr
ansp
orta
tion
Cost
sAd
On -b
ehal
fLon
g -term
Dis
abilit
y Ins
uran
ceOr
vbeh
aNTP
AFPe
nsio
nO
n -beh
alf T
PAF
Post
Ret
rem
entM
edica
lRe
imbu
rsed
TPAF
Soc
ialS
ecur
ityRe
imbu
rsed
TPAF
Socia
lSec
urity
Tota
l Gen
eral
Fund
s
6/30
/ 202
06/
30/ 2
021
6/30
/ 202
06 /
3 C/ 2
021
6 /3 C
/ 202
16/
3 C/ 2
021
6/30
/ 202
16/
30/ 2
021
6/30
/ 202
16/
30/ 2
020
( 1.8
16, 3
95)
176.
662
( 2, 8
16, 9
63)
( 3.7
75, 2
08)
( 189
.790)
( 9, 6
41)
( 21.
428, 1
84)
( 8, 71
5 ,25
9)( 5
,654
,877
)
( 3.7
75.208
)( 1
89, 7
90)
3.77
5 .208
109,
790
9.64
121
.428
.1846.7
15.25
95.6
54.877
276,
394
( 278
.394
)( 3
.095
.357)
76.25
0, 611
( 3,9
64, 9
98)
7.926
, 657
( 78,
505.
664)
( 614
.586
)13
3.51
5 .680
Spe
cial
Rev
enue
Fund
N. J
.Nonp
uble
Ard .
Text
book
Aid
Textb
ookA
dN
ursi
ngSe
rvice
sN
ursi
ngSe
rvic
esTe
chno
logy
Ad
Secu
rity
Ad
Socu
rity
Ad
Exam
and
Cla
ssifi
catio
n..
. ,yCa
reer
Pat
hway
s-Vo
catio
nalA
d
16.0
5521
.077
23,9
8335
,190
9.39
748
,113
60,3
751 ,
300
99.9
54
20-100
-034 -5
120 -
064
2MO
O-034
-5120 -0
6420
-100-03
4 -5120
-07021
-100 -0
34-51
20-070
20-100
-034 -5
120 -3
7320
-100 -0
34-51
20-50
921
-100 -0
34-51
20-50
921
-100 -0
34-51
20-06
621
-100 -03
4 -506
2 -032
6 /30
/ 202
06 /
30/ 2
021
6/30
/ 202
06/
30/ 2
021
6/30
/2020
6/30
/ 202
06/
30/ 2
021
6/30
/ 202
12/
28/ 2
021
1.23
416
,055
7/1/
2019
21.07
77/
1/20
2023
.9B3
7/1/
2019
35.1
907/
1/20
209.
397
7/1/
2019
48.1
137/
1 /20
1960
.375
7 /1/ 2
020
1.30
07 /
1 /20
2099
.954
3 /1/
2020
( 1.2
34)
21, 0
78( 1
4.009
)6,
969
7.83
3( 7
.833)
( 24.4
39)
35,1
9110
, 752
2.41
11.
087
( 2A1
1)(1
, 087
)60
.375
1 ,170
08.6
97
( 41.
825)
18,5
501 ,
300
( 130
)( 1
0,98
0)( 4
.609
)( 9
4.86
6)( 1
0.98
0)
-J( 1
75, 2
21)
( 12.
565)
( 10.
980)
315,4
44To
talS
peci
alRe
venu
eFu
nd7 ,
756
206.
511
( 11 ,
110)
37.5
91
Ent
erpr
ise
Fund
:Na
tiona
lSch
ool L
unch
Prog
ram
( Sta
teSh
are)
Natio
nalS
choo
l Lun
chP
rogr
am( S
tate
Shar
e)•C
OVI
DNa
tiona
l Sch
ool L
unch
Prog
ram
( Sta
teSh
are)
Tota
lEnt
erpr
ise
Fund
14.5
187/ 1
/201
96 /
30/ 2
020
190
7/1/
2020
6 /30
/202
11
684
7/ 1/ 2
020
6 /30
/ 202
1
3.882
14, 5
1820
-100 -0
10-33
50-023
21-10
0 -034 -5
120 -1
2221
-100 -0
34-51
20-12
2
( 3.8
82)
3.88
2( 1
90)
190
190
( 190
)
( 1,8
74)
232
1.66
41.
452
( 232
)
( 3.8
82)
5 ,33
4( 4
22)
16.3
924 ,
304
New
Jers
eyEc
onom
icD
evel
opm
ent A
utho
rity
Cap
ita!
Proj
ects
Fund
:To
talC
apita
lPro
ject
s Fun
d16
50-XX -
21-100
066
6.20
77/
1/20
206 /
30/ 2
022
( 97.
076)
( 97.
076)
686,
207
97, 0
76( 9
7.076
)( 9
7.07
6)
Tota
l Sta
teFi
nanc
ialAs
sista
nce
6( 3, 0
91,4
83)
$70
.462
.456
$(4, 0
73.60
6)$
$37
,591
S7 ,
919.
961
$13
3.647
, 516
Less.O
n -Beh
alfam
oier
tsno
tutili
zed f
orde
term
inatio
nof
Maj
orPr
ogra
ms
On -b
ehalf
Long
-term
Disa
bility
Insu
ranc
eO
n -beh
alf T
PAF
Pens
ion
On -b
ehal
f TPA
Fpo
stre
tirem
entm
ecte
a !
S( 9
.641
)5
( 21, 4
28.18
4)( 6
, 715
, 259
)
9.64
121,4
28,1
846,
715,
259
50.3
09.372
$( 5
0,62
6,75
1)To
tal S
tate
Fina
ncial
Assis
tanc
eSu
bjec
t toSi
ngle
Au
di
5
See
acco
mpa
nyin
gno
test
osc
hedu
les
offin
ancia
l ass
ista
nce .

EXHIBIT “K-5”Freehold Regional High School District
Notes to the Schedules of Expenditures of Federal Awardsand State Financial Assistance
Year Ended June 30. 2021
NOTE 1: GENERAL
The accompanying schedules of expenditures of federal awards and statefinancial assistance include federal and state activity of the Freehold RegionalHigh School District (“the District”). The District is defined in Note 1 to the basicfinancial statements. All federal and state awards received directly from thefederal and state agencies, as well as federal awards and state financialassistance passed through other government agencies is included on theschedule of expenditures of federal awards and state financials assistance.
NOTE 2: BASIS OF ACCOUNTING
The accompanying schedules of expenditures of federal awards and statefinancial assistance are presented on the budgetary basis of accounting with theexceptions of programs recorded in the food service fund, which are presentedusing the accrual basis of accounting. These bases of accounting are describedin Note 1 of the District’s basic financial statements. The information in thisschedule is presented in accordance with the requirements of 2 CFR 200Uniform Administrative Requirements, Cost Principles, and Audit Requirementsfor Federal Awards (“Uniform Guidance"), Audits of States, Local Governments,and Non-Profit Organizations. Therefore, some amounts presented in thisschedule may differ from amounts presented in, or used in the preparation of, thebasic financial statements. The District has elected not to use the 10 percent deminimis indirect cost rate as allowed under the Uniform Guidance.
NOTE 3: RELATIONSHIP TO BASIC FINANCIAL STATEMENTS
The basic financial statements present the general fund and special revenuefund on a GAAP basis. Budgetary comparison statements or schedule (RSI) arepresented for the general fund and special revenue fund to demonstrate finance-regulated legal compliance in which certain revenue is permitted by law or grantagreement to be recognized in the audit year, whereas for GAAP reporting,revenue is not recognized until the subsequent year or when expenditures havebeen made.
The General fund is presented in the accompanying schedules on the modifiedaccrual basis with the exception of the revenue recognition of the deferred stateaid payments in the current budget year, which is mandated pursuant to N.J.S.A.18A:22-44.2. For GAAP accounting purposes, those payments are notrecognized until the subsequent budget year due to the state deferral andrecording of the state aid payments in the subsequent year. The special revenuefund is presented in the accompanying schedules on the grant accountingbudgetary basis which recognizes encumbrances as expenditures and alsorecognizes the related revenue, whereas GAAP basis does not.
178

EXHIBIT “K-5”Freehold Regional High School District
Notes to the Schedules of Expenditures of Federal Awardsand State Financial Assistance
Year Ended June 30. 2021
RELATIONSHIP TO BASIC FINANCIAL STATEMENTS fCONTINUED)NOTE 3:
The net adjustment to reconcile from the budgetary basis to the GAAP basis is($614,588) for the general fund, $6,689 for the special revenue fund. See thenotes to the required supplementary information for a reconciliation of thebudgetary basis to the modified accrual basis of accounting for the general andspecial revenue funds. Federal awards and state financial assistance revenuesare reported in the Board’s basic financial statements on a GAAP basis asfollows:
Federal TotalState
$79,120,252180,98397,076
1,874
$79,248,2194,643,063
97,076130,061
$127,9674,462,080
General FundSpecial Revenue FundCapital Projects FundFood Service Fund 128,187
79,400,185 84,118,4194,718,234GAAP Adjustments:State AidEncumbrances (net)Total Awards &
Financial Assistance
(614,588)6,869
(614,588)(5,762)12,631
$78,779,835 $83,510,700$4,730,865
RELATIONSHIP TO FEDERAL AND STATE FINANCIAL REPORTSNOTE 4:
Amounts reported in the accompanying schedules agree with the amountsreported in the related federal and state financial reports.
NOTE 5: OTHER
Revenues and expenditures reported in the Food Distribution Program representcurrent year value received and current year distributions respectively. Theamount reported as TPAF pension contributions, post-retirement benefits andlong-term disability insurance represents the amount paid by the state on behalfof the district for the year ended June 30, 2021. TPAF Social Securitycontributions represent the amount reimbursed by the state for the employer’sshare of Social Security contributions for TPAF members for the year endedJune 30, 2021.
179

EXHIBIT “K-6”Freehold Regional High School District
Monmouth County. New Jersey
Schedule of Findings and Questioned CostsFor the Fiscal Year Ended June 30. 2021
Section I- Summary of Auditor’s Results
Financial Statements
UnmodifiedType of Auditor's Report Issued:(D(2) Internal Control Over Financial Reporting:
(a) Material weakness(es) identified? No
(b) Significant deficiencies identified that are notconsidered to be material weaknesses? No
(3) Noncompliance material to the basic financialstatements noted during the audit? No
Federal Proqram(s)
Internal Control Over Major Federal Programs:(1)
(a) Material weaknesses identified? No
(b) Significant deficiencies identified that are notconsidered to be material weaknesses? No
(2) Type of Auditor’s Report issued on compliance for major federalprogram(s)? Unmodified
Any audit findings disclosed that are required to be reported inaccordance with section .516(a) of Circular OMB Uniform Guidance? No
(3)
(4) Identification of Major Federal Program(s):
CFDAProgram
Coronavirus Relief FundEducation Stabilization Fund
21.01984.425D
(5) Program Threshold Determination:Type A Federal Program Threshold > $750,000.00Type B Federal Program Threshold <= $750,000.00
(6) Auditee qualified as a low-risk auditee under OMB Circular UniformGuidance? Yes
180

EXHIBIT “K-6”Freehold Regional High School District
Monmouth County, New Jersey
Schedule of Findings and Questioned CostsFor the Fiscal Year Ended June 30. 2021
Section I- Summary of Auditor’s Results (Continued)
State Programfs)
Internal Control Over Major State Programs:(1)
No(a) Material weakness(es) identified?
(b) Significant deficiencies identified that are notconsidered to be material weaknesses? No
(2) Type of Auditor’s Report issued on compliance for major stateprogram(s)? Unmodified
Any audit findings disclosed that are required to be reported inaccordance with N.J. OMB Circular 15-08?
(3)No
(4) Identification of Major State Program(s):
Project NumberProgram Title495-034-5120-078495-034-5120-089495-034-5120-084495-034-5120-014495-034-5095-051
Equalization AidCategorical Special Education AidCategorical Security AidCategorical Transportation AidReimbursed TPAF Social Security
(5) Program Threshold Determination:Type A State Program Threshold > $1,515,890.00Type B State Program Threshold <= $1,515,890.00
Yes(6) Auditee qualified as a low-risk auditee under OMB Circular 15-08?
if**1'181

EXHIBIT “K-6"Freehold Regional High School District
Monmouth County. New Jersey
Schedule of Findings and Questioned CostsFor the Fiscal Year Ended June 30. 2021
Section II - Financial Statement Audit - Reported Findings Under Government AuditingStandards
Internal Control Findings- None Reported
Compliance Findings- None Reported
Section III - Findings and Questioned Costs Relative to Major Federal and StatePrograms
Federal Programs -None Reported
State Programs -None Reported
182

EXHIBIT “K-rFreehold Regional High School District
Monmouth County, New Jersey
Schedule of Prior Year Audit Findings
Not Applicable
183

Related Documents