Annual Comprehensive Financial Report 2021 FOR THE FISCAL YEAR ENDED JUNE 30, 2021 Focused on the present, building on the future.

Welcome message from author
This document is posted to help you gain knowledge. Please leave a comment to let me know what you think about it! Share it to your friends and learn new things together.
Transcript

Annual Comprehensive
Financial Report
202 1
FOR THE FISCAL YEAR ENDED JUNE 30, 2021
Focused on the present , bu i ld ing on the future .


FOR THE FISCAL YEAR ENDED JUNE 30, 2021 City of Dinuba, California
Prepared by the Finance Department
ANNUAL COMPREHENSIVE FINANCIAL REPORT


CITY OF DINUBA
ANNUAL COMPREHENSIVE FINANCIAL REPORT
FOR THE YEAR ENDED JUNE 30, 2021
TABLE OF CONTENTS Page Number INTRODUCTORY SECTION Letter of Transmittal .............................................................................................................................. i GFOA Certificate of Achievement for Excellence in Financial Reporting ........................................... vi Organization Chart & Principal Officials ............................................................................................. vii FINANCIAL SECTION INDEPENDENT AUDITORS’ REPORT .............................................................................................. 1 MANAGEMENT'S DISCUSSION AND ANALYSIS ............................................................................ 4 BASIC FINANCIAL STATEMENTS
Government-Wide Financial Statements: Statement of Net Position .................................................................................................... 18 Statement of Activities .......................................................................................................... 19
Fund Financial Statements:
Balance Sheet - Governmental Funds ................................................................................. 21 Reconciliation of the Balance Sheet of Governmental Funds to the Statement of Net Position .......................................................................................... 23 Statement of Revenues, Expenditures and Changes in Fund Balances - Governmental Funds ......................................................................................... 24 Reconciliation of the Statement of Revenues, Expenditures and Changes in Fund Balances of Governmental Funds to the Statement of Activities .......................................................................................................... 26 Statement of Net Position - Proprietary Funds .................................................................... 27 Statement of Revenues, Expenses and Changes in Fund Net Position - Proprietary Funds .......................................................................................... 29 Statement of Cash Flows - Proprietary Funds ..................................................................... 31
Statement of Fiduciary Net Position - Fiduciary Funds ........................................................ 33 Statement of Changes in Fiduciary Net Position - Fiduciary Funds .................................... 34
Notes to Basic Financial Statements .......................................................................................... 35

CITY OF DINUBA
ANNUAL COMPREHENSIVE FINANCIAL REPORT
FOR THE YEAR ENDED JUNE 30, 2021
TABLE OF CONTENTS Page Number REQUIRED SUPPLEMENTARY INFORMATION
Schedule of Revenues, Expenditures and Changes in Fund Balance – Budget and Actual: General Fund ....................................................................................................................... 80 HUD Grants .......................................................................................................................... 81
Schedule of Proportionate Share of the Net Pension Liability ................................................... 82 Schedule of Plan Contributions .................................................................................................. 84
Schedule of Changes in the Total OPEB Liability and Related Ratios ...................................... 86
Notes to Required Supplementary Information .......................................................................... 87
SUPPLEMENTAL INFORMATION
Non-Major Governmental Funds: Description of Non-Major Governmental Funds .................................................................. 89 Combining Balance Sheets .................................................................................................. 91 Combining Statement of Revenues, Expenditures and Changes in Fund Balances .......... 95
Schedule of Revenues, Expenditures and Changes in Fund Balances – Budget and Actual:
Public Safety Sales Tax Fund .............................................................................................. 99 Gas Tax Fund .................................................................................................................... 100 Parks Reserve Fund .......................................................................................................... 101 Transportation Fund ........................................................................................................... 102 System Development Charges Fund ................................................................................. 103 Community Enhancement Grants Fund ............................................................................. 104 Assessment Districts Fund ................................................................................................ 105 Road Repair and Accountability Act of 2017 Fund (SB 1) ................................................. 106 Transportation Construction Fund ..................................................................................... 107 General Construction Fund ................................................................................................ 108 Vocational Center Fund ..................................................................................................... 109 MTBE Fund ........................................................................................................................ 110 Financing Authority Fund ................................................................................................... 111 General Debt Service Fund ............................................................................................... 112
Non-Major Enterprise Funds:
Description of Non-Major Enterprise Funds ....................................................................... 113 Combining Statement of Net Position ................................................................................ 114 Combining Statement of Revenues, Expenses and Changes in Net Position .................. 115 Combining Statement of Cash Flows ................................................................................. 116

CITY OF DINUBA
ANNUAL COMPREHENSIVE FINANCIAL REPORT
FOR THE YEAR ENDED JUNE 30, 2021
TABLE OF CONTENTS Page Number
Internal Service Funds: Description of Internal Service Funds ................................................................................ 117 Combining Statement of Net Position ................................................................................ 118 Combining Statement of Revenues, Expenses and Changes in Net Position .................. 119 Combining Statement of Cash Flows ................................................................................. 120
STATISTICAL SECTION Statistical Section Description .................................................................................................. 121 Financial Trends Information:
Net Position by Component ............................................................................................... 122 Change in Net Position ...................................................................................................... 123 Fund Balances Governmental Funds ................................................................................ 127 Changes in Fund Balances Governmental Funds ............................................................. 128 Government-Wide Revenues ............................................................................................. 130 General Government Revenues by Source ....................................................................... 131
Revenue Capacity Information: Property Ad Valorem Tax Assessed Values ...................................................................... 132 Principal Property Taxpayers ............................................................................................. 133 Direct and Overlapping Property Tax Rates ...................................................................... 134 Property Tax Levies and Collections ................................................................................. 135
Debt Capacity Information: Ratios of Outstanding Debt by Type .................................................................................. 136 Ratios of General Bonded Debt Outstanding .................................................................... 137 Statement of Direct and Overlapping Debt ........................................................................ 138 Computation of Legal Debt Margin .................................................................................... 139 Pledged Revenue Coverage .............................................................................................. 140 General Bonded Indebtedness Maturities by Fiscal Year .................................................. 141
Demographic and Economic Information: Population and Unemployment Rate ................................................................................. 142 Principal Employers ........................................................................................................... 143 Employees by Function (Full Time Equivalents) ................................................................ 144 Construction Activity ........................................................................................................... 145 Tulare County Crop Statistics ............................................................................................ 146
Operating Information: Capital Assets Used ........................................................................................................... 147 Demands for City Services................................................................................................. 148 General Governmental Expenditures by Function ............................................................. 149 Sales Tax Rate ................................................................................................................... 150 Top 25 Sales Tax Generators ............................................................................................ 151 Annual Sales Tax by Category .......................................................................................... 152 Schedule of Insurance in Force ......................................................................................... 153

THIS PAGE INTENTIONALLY LEFT BLANK

i

ii

iii

iv

v

Government Finance Officers Association
Certificate of Achievementfor Excellence
in Financial Reporting
Presented to
City of DinubaCalifornia
For its Annual ComprehensiveFinancial Report
For the Fiscal Year Ended
June 30, 2020
Executive Director/CEO
vi

Organizational Chart and Principal Officials
Citizens of Dinuba
City Council
Linda Launer Maribel Reynosa Vice Mayor
Rachel Nerio‐Guerrero Armando Longoria Kuldip Thusu Council Member Council Member Council Member
City Commissions
City Attorney Nancy Jenner
City Manager Luis Patlan
City Clerk Linda Barkley
Administrative Services Karina Solis, Interim Director
Information Technology Daniel James, Assistant City Manager
Human Resources Maria Alaniz, Manager
Police Devon Popovich, Chief
Parks and Recreation Stephanie Hurtado, Director
Public Works Ismael Hernandez, Director
Fire Department Jordan Webster, Interim Chief
Community Development George Avila, Business Manager
vii

THIS PAGE INTENTIONALLY LEFT BLANK


THIS PAGE INTENTIONALLY LEFT BLANK

2151 River Plaza Dr., Suite 150 Sacramento , CA 95833 Phone: 916.503.9691 Lance, Soll & Lunghard, LLP
INDEPENDENT AUDITORS’ REPORT
To the Honorable Mayor and Members of the City Council City of Dinuba, California Report on the Financial Statements Opinions We have audited the accompanying financial statements of the governmental activities, the business-type activities, each major fund, and the aggregate remaining fund information of City of Dinuba, California, (the City) as of and for the year ended June 30, 2021, and the related notes to the financial statements, which collectively comprise the City’s basic financial statements as listed in the table of contents. In our opinion, the financial statements referred to above present fairly, in all material respects, the respective financial position of the governmental activities, the business-type activities, each major fund, and the aggregate remaining fund information of the City as of June 30, 2021, and the respective changes in financial position and, where applicable, cash flows thereof for the year then ended in accordance with accounting principles generally accepted in the United States of America. Basis for Opinions We conducted our audit in accordance with auditing standards generally accepted in the United States of America (GAAS) and the standards applicable to financial audits contained in Government Auditing Standards, issued by the Comptroller General of the United States. Our responsibilities under those standards are further described in the Auditor’s Responsibilities for the Audit of the Financial Statements section of our report. We are required to be independent of the City and to meet our other ethical responsibilities, in accordance with the relevant ethical requirements relating to our audits. We believe that the audit evidence we have obtained is sufficient and appropriate to provide a basis for our audit opinion. Responsibilities of Management for the Financial Statements Management is responsible for the preparation and fair presentation of these financial statements in accordance with accounting principles generally accepted in the United States of America; and for the design, implementation, and maintenance of internal control relevant to the preparation and fair presentation of financial statements that are free from material misstatement, whether due to fraud or error. In preparing the financial statements, management is required to evaluate whether there are conditions or events, considered in the aggregate, that raise substantial doubt about the City’s ability to continue as a going concern for twelve months beyond the date of the financial statements.

To the Honorable Mayor and Members of the City Council City of Dinuba, California Auditor’s Responsibilities for the Audit of the Financial Statements Our objectives are to obtain reasonable assurance about whether the financial statements as a whole are free from material misstatement, whether due to fraud or error, and to issue an auditor’s report that includes our opinion. Reasonable assurance is a high level of assurance but is not absolute assurance and therefore is not a guarantee that an audit conducted in accordance with GAAS and Government Auditing Standards will always detect a material misstatement when it exists. The risk of not detecting a material misstatement resulting from fraud is higher than for one resulting from error, as fraud may involve collusion, forgery, intentional omissions, misrepresentations, or the override of internal control. Misstatements are considered material if, there is a substantial likelihood that, individually or in the aggregate, they would influence the judgment made by a reasonable user based on the financial statements. In performing an audit in accordance with GAAS and Government Auditing Standards, we:
Exercise professional judgment and maintain professional skepticism throughout the audit. Identify and assess the risks of material misstatement of the financial statements, whether due to
fraud or error, and design and perform audit procedures responsive to those risks. Such procedures include examining, on a test basis, evidence regarding the amounts and disclosures in the financial statements.
Obtain an understanding of internal control relevant to the audit in order to design audit procedures that are appropriate in the circumstances, but not for the purpose of expressing an opinion on the effectiveness of the City’s internal control. Accordingly, no such opinion is expressed.
Evaluate the appropriateness of accounting policies used and the reasonableness of significant accounting estimates made by management, as well as evaluate the overall presentation of the financial statements.
Conclude whether, in our judgment, there are conditions or events, considered in the aggregate, that raise substantial doubt about the City’s ability to continue as a going concern for a reasonable period of time.
We are required to communicate with those charged with governance regarding, among other matters, the planned scope and timing of the audit, significant audit findings, and certain internal control-related matters that we identified during the audit. Other Reporting Responsibilities Required Supplementary Information Accounting principles generally accepted in the United States of America require that management’s discussion and analysis and the required supplementary information, as listed in the table of contents, be presented to supplement the basic financial statements. Such information is the responsibility of management and, although not a part of the basic financial statements, is required by the Governmental Accounting Standards Board, who considers it to be an essential part of financial reporting for placing the basic financial statements in an appropriate operational, economic, or historical context. We have applied certain limited procedures to the required supplementary information in accordance with auditing standards generally accepted in the United States of America, which consisted of inquiries of management about the methods of preparing the information and comparing the information for consistency with management’s responses to our inquiries, the basic financial statements, and other knowledge we obtained during our audit of the basic financial statements. We do not express an opinion or provide any assurance on the information because the limited procedures do not provide us with sufficient evidence to express an opinion or provide any assurance.
2

To the Honorable Mayor and Members of the City Council City of Dinuba, California Supplementary Information Our audit was conducted for the purpose of forming opinions on the financial statements that collectively comprise the City’s basic financial statements. The combining and individual fund financial statements and schedules are presented for purposes of additional analysis and are not a required part of the basic financial statements. The combining and individual fund financial statements and schedules are the responsibility of management and were derived from and relate directly to the underlying accounting and other records used to prepare the basic financial statements. The information has been subjected to the auditing procedures applied in the audit of the basic financial statements and certain additional procedures, including comparing and reconciling such information directly to the underlying accounting and other records used to prepare the basic financial statements or to the basic financial statements themselves, and other additional procedures in accordance with auditing standards generally accepted in the United States of America. In our opinion, the combining and individual fund financial statements and schedules are fairly stated, in all material respects in relation to the basic financial statements as a whole. Other Information Management is responsible for the other information included in the annual report. The other information comprises the introductory section and statistical section but does not include the basic financial statements and our auditor’s report thereon. Our opinions on the financial statements does not cover the other information, and we do not express an opinion or any form of assurance thereon. In connection with our audit of the financial statements, our responsibility is to read the other information and consider whether a material inconsistency exists between the other information and the financial statements, or the other information otherwise appears to be materially misstated. If, based on the work performed, we conclude that an uncorrected material misstatement of the other information exists, we are required to describe it in our report. Other Reporting Required by Government Auditing Standards In accordance with Government Auditing Standards, we have also issued our report dated May 17, 2022 on our consideration of the City’s internal control over financial reporting and on our tests of its compliance with certain provisions of laws, regulations, contracts, and grant agreements and other matters. The purpose of that report is solely to describe the scope of our testing of internal control over financial reporting and compliance and the results of that testing, and not to provide an opinion on the effectiveness of the City’s internal control over financial reporting or on compliance. That report is an integral part of an audit performed in accordance with Government Auditing Standards in considering the City’s internal control over financial reporting and compliance.
Sacramento, California May 17, 2022
3


This management’s discussion and analysis provides an overview of financial activities of the City of Dinuba (City) for the fiscal year ended June 30, 2021. Please read this discussion and analysis in conjunction with the accompanying transmittal letter, the basic financial statements, and the accompanying notes to the basic financial statements.
City-Wide City total assets increased by $22.5 million to $338.7 million, of which $258.4 million
represented governmental assets and $80.3 million represented business-type assets. City total liabilities increased by $2.3 million to $99.9 million, of which $77.2 million
were governmental liabilities and $22.7 million were business-type liabilities. The City’s total net position increased by $23.6 million to $244.7 million. City-wide revenues were $68.9 million, of which $48.7 million were generated by
governmental activities and $20.2 were generated by business-type activities. City-wide expenses were $44.2 million, of which $29.9 million were incurred by
governmental activities and $14.3 were incurred by business-type activities. Fund Level
Governmental Fund balances increased $9.6 million to $53.9 million. Of this amount $15.5 million was unassigned fund balance and available for spending at the City’s discretion.
Governmental Fund revenues were $40 million, an increase of $8.4 million from the previous year.
Governmental Fund expenditures increased by $5.6 million to $31.6 million in fiscal year 2021.
Enterprise net position increased by $4.8 million to $59.2 million. Of this amount, $8.7 million was unrestricted net position and available for spending at the City’s discretion.
Enterprise Fund operating revenues increased by $1.3 million to $15.3 million compared to the previous fiscal year.
Enterprise Fund operating expenses were $14.0 million in fiscal year 2021, a decrease of $3.4 million compared to the previous fiscal year.
The Annual Comprehensive Financial Report is composed of the following:
1. Introductory section, including the Transmittal Letter 2. Management’s Discussion and Analysis 3. Basic Financial Statements, which include the Government-wide and the Fund financial
statements 4. Notes to the financial statements 5. Combining statements for Non-Major Governmental, Internal Service and Fiduciary
Funds 6. Statistical information
Management’s Discussion and Analysis Fiscal Year Ended June 30, 2021
FINANCIAL HIGHLIGHTS
OVERVIEW OF THE BASIC FINANCIAL STATEMENTS
4

Basic Financial Statements The Basic Financial Statements consist of the City-wide Financial Statements and the Fund Financial Statements. These two sets of financial statements provide a short-term view as well as a long-term view. The City-wide Financial Statements are designed to provide a broad overview of all of the City’s finances taken as a whole, using a long-term view, in a manner similar to private-sector businesses. The City-wide Financial Statements consist of the Statement of Net Position and the Statement of Activities. The Statement of Net Position provides information about the financial position of the City as a whole, including all of its capital assets, liabilities and long-term liabilities with the difference between the two reported as net position. The full accrual basis of accounting is used, thus the flow of all economic resources are measured. The Statement of Activities presents financial information reporting how the City’s net position changed during the fiscal year by listing the revenues and expenses of each of the City’s major activities. The full accrual basis of accounting is also used, thereby all changes to net position are reported as soon as the underlying event giving rise to the change occurs, regardless of the timing of the related cash flows. Thus revenues and expenses are reported in this statement for some items that will result in cash flows in a future fiscal period. The fund financial statements report the City’s operations in more detail than the City-wide statement and focus primarily on the sort-term activities of the City’s General Fund and other Major Funds. The Fund Financial Statements measure only current revenues and expenditures, current, assets, liabilities and fund balances; they exclude capital assets, long-term debt and other long-term amounts. City-wide Financial Statements All of the City’s activities are grouped into either Governmental Activities or into Business-type Activities. Governmental Activities are those functions that are principally supported by taxes or by specific governmental program revenues such as developer fees. Business Activities are those services supported by charges paid by direct users of the service such as Disposal collection. City-wide financial statements are prepared on the accrual basis, which means they measure the flow of all economic resources of the City as a whole. Fund Financial Statements The fund financial statements are designed to report information about related accounts that have been segregated for specific activities or objectives. The City uses fund accounting to ensure and demonstrate compliance with finance related legal requirements. All of the City’s funds are divided into three categories: governmental funds, proprietary funds and fiduciary funds. The Fund Financial Statements provide detailed information about each of the City’s most significant funds called Major Funds. Major Funds account for the major financial activities of the City and are presented individually, while the activities of the Non-major funds are presented in summary as Other Governmental Funds. Subordinate schedules of the Non-major funds present detailed financial information of the City’s smaller funds.
5

Governmental Funds Most of the City’s basic services are reported in governmental funds. These funds focus on reporting the flow of money into and out of those funds and the balances left at year-end that are available for spending. These funds are reported using the modified accrual basis of accounting. Under the modified accrual basis of accounting, revenues are recognized when susceptible to accrual (i.e., when they become measurable and available). “Measurable” means that the amount of the transaction can be determined and “available” means that it is collectible within the current period or soon enough thereafter to be used. The governmental fund financial statements provide a detailed short-term view of the City’s general government operations and the basic services provided. Governmental fund information helps determine whether there are more or fewer financial resources that can be spent in the near future to finance the City’s programs. The differences between the Governmental Fund Financial Statements and the Government-Wide Financial Statements are explained in a reconciliation following the Governmental Funds’ Financial Statements.
Proprietary Funds When the City charges customers for services - whether to outside customers or to programs of the City - these services are generally reported in proprietary funds. Proprietary funds are reported in the same way in that all activities are reported in the Statement of Net Position and the Statement of Revenues, Expenses, and Changes in Fund Net Position. The City’s enterprise funds are the same as the business-type activities reported in the Government-Wide Financial Statements, but provide more detail and additional information, such as cash flows for each enterprise fund. The City also uses internal service funds to report activities that provide supplies and services for the City’s internal program and activities, such as the City’s self-insurance. Fiduciary Funds
The City is the trustee, or fiduciary, for certain funds established to account for assets held by the City in a trustee capacity, or as an agent for individuals, private organizations, and other governmental units. The City’s fiduciary activities are reported in separate Statements of Fiduciary Net Position. These activities are excluded from the City’s Government-Wide Financial Statements because the City cannot use these assets to finance its operations. The City is responsible for ensuring that the assets reported in these funds are used for their specified purposes. Notes to the Financial Statements The notes provide additional information that is essential to a full understanding of the data provided in the government-wide and fund financial statements. The notes to the financial statement can be found following the fund financial statements in this report.
The net position and changes in net position of the City’s Governmental Activities (Tables 1 and 2) and Business-Type Activities (Tables 3 and 4) are presented in the City-wide Statement of Net Position and Statement of Activities.
GOVERNMENT-WIDE FINANCIAL ANALYSIS
6

Governmental Activities
FY 2021 FY 2020 Change
Current and other assets 66,006$ 57,187$ 8,819$ Capital Assets 192,401 179,993 12,408 Total Assets 258,407 237,180 21,227
Deferred outflows 8,298 5,821 2,477
Total deferred outflow 8,298 5,821 2,477
Current and other liabilities 9,631 11,616 (1,985) Long-term obligations outstanding 67,600 60,541 7,059 Total liabilities 77,231 72,157 5,074
Deferred inflows 3,931 4,220 (289) Total deferred inflow 3,931 4,220 (289)
Net Position
Net investment in capital assets 169,863 156,273 13,590 Restricted 36,825 35,598 1,227 Unrestricted (21,122) (25,246) 4,124 Total net position 185,566$ 166,625$ 18,941$
Table 1Governmental Net Position at June 30, 2020 and 2021
(in Thousands)
Net Position As shown in Table 1, the City’s governmental Total Net Position is $185.5 million. During fiscal year 2021, the overall net position increased by $18.9 million, or 11%. During fiscal year 2015, the City implemented GASB 68 & 71, which required the recording of net pension liability and pension related deferred inflows and outflows. The largest portion of the City’s net position, approximately $192 million, reflects its investment in capital assets (e.g., land, buildings, improvements other than buildings, equipment, infrastructure, and construction in progress); less any related debt used to acquire those assets that is still outstanding. The City uses these capital assets to provide services to citizens; consequently, these assets are not available for future spending. Although the City’s investment in its capital assets is reported net of related debt, it should be noted that the resources needed to repay this debt must be provided from other sources, since the capital assets themselves rarely are used to liquidate these liabilities. Resources that are subject to restriction that may only be used to construct specified capital projects, debt service or other special revenue programs represent 21.1 % of the City’s Governmental Net Position. These are external restrictions and cannot be changed by the City.
7

Unrestricted net position can be used to finance day-to-day operation without constraints. Due to the restrictions mentioned and the implementation GASB 68 & 71, the unrestricted net position was ($21.1) million at year end. Changes in Net Position The Statement of Activities provides information regarding the entirety of the City’s governmental revenues and expenses. The Statement describes in detail the changes in net position from the previous year. The City’s Governmental Net Position increased by $18.9 million in fiscal year 2021. Revenues increased $28.0 million and expenses increased by $1.4 million. The increase in revenues is primarily due to decreases in Sales Tax and Special Items recorded in 2020, while the increases in expenses are throughout all governmental activities.
8

FY 2021 FY 2020 Change
RevenuesProgram Revenues Charges for services 3,747$ 5,370$ (1,623)$ Operating contribution and grants 7,124 1,077 6,047 Capital contributions and grants 2,237 3,614 (1,377) General Revenues Taxes Sales Tax 19,277 14,059 5,218 Motor Vehicle in Lieu 2,152 2,033 118 Utility Users Tax 1,668 1,535 133 Property Tax 1,517 1,377 140 Other Tax 1,409 1,257 152 Investment Earnings 663 725 (62) Miscellaneous 8,107 (11,129) 19,236
Total Revenues 47,901 19,918 27,983
Expenses Public Safety 12,899 12,802 98 General Government 7,635 4,464 3,171 Community Development 2,576 2,427 149 Public Works 3,009 5,117 (2,107) Parks and Recreation 2,858 2,706 152 Interest on Long-Term Debt 935 1,002 (66)
Total Expenses 29,913 28,517 1,396
Excess (deficiency)before transfers and special items 17,988 (8,599) 26,587
Transfers & Special Items (Note 18) 874 2,865 (1,992) Total Transfers & Special Items 874 2,865 (1,992)
Change in Net Position 18,862 (5,733)
Net Position- Beginning, Restated 166,704 172,358 (5,655)
Net Position- Ending 185,566$ 166,625$ 18,941$
Table 2Changes in Governmental Net Position
(in Thousands)
9

The following charts display the City’s governmental activities for fiscal year 2021, highlighting the makeup of the governmental revenues and expenses.
Revenues by Source Governmental Activities
Expenses by Function Governmental Activities
10

Business Type Activities The statement of Business-Type Net Position (Table 3) and statement of Business-Type Activities (Table 4) are presented below. Net Position The business–type activities of the City showed a minor increase $1.3 million in total assets. Of the total business type net position, 85.3% was net investment in capital assets and 14.7% was unrestricted, which is available for future operations.
FY 2021 FY 2020 Change
Current and other assets 17,527$ 15,906$ 1,621$ Capital Assets 62,761 63,109 (348) Total Assets 80,288 79,015 1,273
Deferred outflows 2,249 2,243 6 Total deferred outflow 2,249 2,243 6
Current and other liabilities 1,659 1,661 (2) Long-term obligations outstanding 21,069 23,801 (2,732) Total liabilities 22,728 25,462 (2,734)
Deferred inflows 633 1,347 (714) Total deferred inflow 633 1,347 (714)
Net Position Net investment in capital assets 50,502 50,288 214 Unrestricted 8,674 4,161 4,513 Total net position 59,176$ 54,449$ 4,727$
Table 3Business-Type Net Position at June 30, 2020 and 2021
(in Thousands)
Changes in Net Position As shown in Table 4, net revenues for business-type activities were $20.6 million in fiscal year 2021, an increase of $1.8 million over the prior year. The increase is attributed to additional service charges received across all enterprise funds, but primarily in Ambulance and Golf. Expenses for business-type activities decreased by $4.2 million compared to the previous fiscal year. The decrease in expenses are attributed to the Water, Sewer, Disposal and Golf funds. The largest decreases are in the Golf and Sewer funds. In the Sewer fund the decreases are attributed to the savings provided by the refinancing of the 2007 Waste Water Bond. In the Golf fund, the decreases are attributed to the adjustment of accumulated depreciation for a prior year adjustment that was made in fiscal year 2020.
11

FY 2021 FY 2020 Change
RevenuesProgram Revenues Charges for services 15,154$ 13,629$ 1,524$ Operating contribution and grants 5,089 4,948 141 General Revenues Investment Earnings 572 206 366 Miscellaneous (222) 58 (280)
Total Revenues 20,593 18,841 1,752
Expenses Disposal 2,716 3,129 (414) Golf Course 1,042 4,098 (3,055) Sewer 1,804 3,255 (1,451) Water 3,461 3,564 (103) Ambulance 3,012 2,647 365 Transit 1,563 1,089 474 Compressed Natural Gas 305 318 (13)
Total Expenses 13,902 18,100 (4,184)
Excess (deficiency)before transfers and special items 6,691 741 5,936
Transfers & Special Items (Note 18) (874) (4,215) 3,342 Total Transfers & Special Items (874) (4,215) 3,342
Change in Net Position 5,817 (3,474) 9,292
Net Position- Beginning, Restated 53,359 57,923 (4,564)
Net Position- Ending 59,176$ 54,449$ 4,727$
(in Thousands)
Table 4Business-Type Activities
12

Table 5 summarizes the Governmental balances at the fund level.
FY 2021 FY 2020 Change
Total Assets 67,348$ 57,759$ 9,589$ Total Liabilities 12,931 12,983 (53) Total Deferred Inflows of Resources 526 489 37 Total Fund Balances 53,891 44,287 9,604 Total Revenues 40,047 31,565 8,482 Total Expenditures 31,592 25,926 5,666 Total Other Financing Sources (Uses) 1,070 (10,085) 11,155
Table 5Financial Highlights at Fund Level at June 30, 2020 and 2021
(in Thousands)
General Fund The General Fund accounts for all financial resources traditionally associated with government activities that are not accounted for reported in another fund. Fund balance in the General Fund increased by 95.5% to end the fiscal year at a balance of $17.2 million. The increase was due primarily to additions of capital projects and increased Sales Tax revenues. The final budget amount for General Fund expenditures totaled $15.7 million excluding transfers out. In comparison, actual expenditures excluding transfers out totaled $15.4 million. The variance in expenditures was $0.3 million. Total revenues were budgeted at $22 million; actual revenues in the General Fund were $24.7 million with a variance of $2.7 million. Other Major Funds HUD Grants The fund accounts for the Community Development Block Grants (CDBG) and Home Investment Partnership Program (HOME). The fund’s assets include $24.1 million in notes and loans receivable. The loans are offset by deferred inflows as the loans are not expected to be repaid within the next year. The notes and loans receivable are for housing acquisition assistance and housing rehabilitation. Transportation Construction: Revenue in the Transportation Construction fund came to $.9 million. The revenue is primarily composed of intergovernmental revenues originating with the Tulare County Association of Governments. Housing: Net activity in housing remained virtually the same compared to the previous year for day to day operations.
FINANCIAL ANALYSIS OF CITY’S MAJOR FUNDS
13

Other Governmental Funds: These funds (referred to a Non-major Funds) are not presented separately in the Basic Financial Statements, but are individually presented in Supplementary Information. Combined they received $8.3 million in revenue and have a combined Fund Balance at year-end of $10.6 million. Business-Type Funds The business-type funds account for operations that are financed and operated in a manner similar to private business enterprises, wherein the cost of goods and services to the general public are financed or recovered primarily through user charges.
Water The net position in the water fund increased slightly by $0.8 million to $14.7 million. The unrestricted portion of the net position totaled $1.0 million. Sewer The sewer fund ended the year with a net position of $14.4 million of which $0.4 million was unrestricted. Operating revenues exceeded operating expenses by just a little over $1.7 million. The fund’s net position increased by $1.5 million. Disposal Operating revenues and expenses were virtually flat when compared to the previous fiscal year. The fund ended the year with a net position of $1.0 million of which $.85 million was unrestricted. Ambulance In 2021, the City continued to participate in the Inter-governmental Transfer funding provided by the State. Revenue from the IGT transfer was $2.4 million in 2021. As of June 30, 2021 the fund had net position of $8.0 million.
Golf Course Operating revenues increased by $0.6 million from the prior fiscal year. Operating expenses decreased by $1.4 million from the prior year. This was largely due to a prior period adjustment to the depreciation expense of the club house and restaurant. The net position of the Golf Course at the end of the fiscal year was $17.3 million.
14

A summary of the City’s capital assets is shown below in Table 6. More detail regarding the assets can be found in Note 7 of the financial statements.
FY 2021 FY 2020 Change
Governmental ActivitiesLand 113,425$ 112,694$ 731$ Artwork 69 69 - Construction in Progress 7,097 355 6,742 Buildings 21,011 15,151 5,860 Improvements 3,892 259 3,633 Equipment and Machinery 8,412 (190) 8,601 Infrastructure 88,537 51,655 36,882
Total 242,443$ 179,993$ 62,450$
Business-Type ActivitiesLand 7,752$ 7,752$ -$ Construction in Progress - - - Buildings and Improvements 19,115 20,192 (1,078) Equipment and Machinery 1,914 1,936 (22) Infrastructure 33,980 33,228 752
Total 62,761$ 63,109$ (348)$
Table 6Capital Assets Net of Accumulated Depreciation at June 30
(in Thousands)
The net increase of $62.5 million for governmental activity assets is comprised of the Buildings, Improvements, Equipment and Machinery and Infrastructure that is depreciated throughout the year. The net decrease of $348 thousand for business-type activity assets is attributed to depreciation of Buildings and Improvements and Equipment and Machinery. For Government-wide Financial Statements, capital asset purchases for governmental activities are capitalized and depreciated. In contrast, in the Fund Financial Statements capital asset purchases for governmental activities are recorded as expenditures. More information concerning the City’s investment in capital assets is available in Note 8 in the Notes to Basic Financial Statements section later in this document.
CAPITAL ASSETS
15

Each debt is discussed in more detail in Note 9 to the financial statements. The City’s total long-term debt decreased by $1.9 million compared to the prior fiscal year. The decrease was primarily due to not acquiring new debt and making payments throughout the fiscal year. The following table provides a breakdown of the City’s outstanding indebtedness as of June 30, 2021:
FY 2021 FY 2020 Change
Governmental Activity DebtRevenue Bonds Payable 13,960$ 14,742$ (782)$ Notes and Capital Leases Payable 9,156 9,519 (363) Original Issue Discount (209) - (209) Original Issue Premium 145 - 145
Total 23,052$ 24,261$ (1,209)$
Business-Type DebtRevenue Bonds Payable 8,518$ 9,045$ (527)$ Notes and Capital Leases Payable 4,554 4,700 (146) Original Issue Premium 37 39 (2)
Total 13,109$ 13,784$ (675)$
Total Long-Term Obligations 36,161$ 38,046$ (1,885)$
Table 7Outstanding Debt
(in Thousands)
The City’s annual budget is the legally adopted expenditure control document of the City. Budgetary comparison statements are required for the General Fund and all major special revenue funds and may be found immediately following the Government-wide financial statements in this Financial Section of the Annual Comprehensive Financial Report. These statements compare the original adopted budget, the budget as amended throughout the fiscal year, and the actual expenditures for each fund, prepared on a budgetary basis. Budgets are prepared on the modified accrual basis of accounting consistent with GAAP, except that encumbrances are included in budgeted expenditures. Appropriations lapse at fiscal year-end. The City Council generally reauthorizes appropriations for continuing projects and activities. The City Council has the legal authority to amend the budget of any fund at any time during the fiscal year. The budgetary legal level of control (the level on which expenditures may not legally exceed appropriations) is generally at the fund
DEBT ADMINISTRATION
BUDGETING
16

level. For budgeting purposes, the General Fund is composed of several departments while all other budgeted funds (special revenue funds included) are considered a single department. Budgeted expenditures may be reallocated within a division and between divisions within a department without City Council approval.
Based upon sales tax revenues, it appears that the local business climate has increased slightly. Excluding revenues from the Internet Sales Tax, sales tax from the top 10 sources increased by 18% from fiscal year 2020 to 2021. This substantial increase is attributed to increases in retail, auto sales and fuel stations. As the economy stabilized from the impacts from the shuttering of businesses in early 2020, the unemployment rates have returned to pre-pandemic levels. In June of 2019, the unemployment rate was 8.5%, in 2020 it increased to 10.9% and in June of 2021 the rate dropped down to 8.4%. There was a significant decrease in the construction of new homes. There were 242 permits issued in 2020 for single family residential homes while in 2021, there were 111 permits issued for single family residential homes.
This management’s discussion and analysis is designed to provide the City’s residents, taxpayers, customers, investors, and creditors with a general overview of the City’s finances and to demonstrate the City’s accountability. If you have questions about this document, separate reports of the City’s component unit, or wish any additional financial information, contact:
Karina Solis Administrative Services Director 405 East El Monte Way Dinuba, California 93618 Phone (559) 591-5900
CONTACT THE CITY’S FINANCIAL MANAGEMENT
ECONOMIC OUTLOOK
17

Dinuba Ridge Creek Golf

THIS PAGE INTENTIONALLY LEFT BLANK

CITY OF DINUBA
STATEMENT OF NET POSITION
Governmental Business-TypeActivities Activities Total
Assets:Cash and investments 28,641,029$ 13,122,819$ 41,763,848$ Receivables:
Accounts 561,046 3,372,043 3,933,089 Notes and loans 25,508,836 3,170 25,512,006 Accrued interest 18,583 7,678 26,261
Internal balances 1,697,621 (1,697,621) - Prepaid costs 125,731 77,570 203,301 Due from other governments 8,615,059 1,894,512 10,509,571 Inventories - 103,337 103,337 Restricted assets:
Cash with fiscal agent 838,339 643,594 1,481,933 Capital assets not being depreciated 120,591,403 7,751,714 128,343,117 Capital assets, net of depreciation 71,832,128 55,008,916 126,841,044
Total Assets 258,429,775 80,287,732 338,717,507
Deferred Outflows of Resources:Deferred charge on refunding 491,249 850,189 1,341,438 Deferred pension related items 4,530,779 1,009,825 5,540,604 Deferred OPEB related items 3,275,833 389,374 3,665,207
Total Deferred Outflows of Resources 8,297,861 2,249,388 10,547,249
Liabilities:Accounts payable 3,321,296 722,793 4,044,089 Accrued liabilities 4,939,101 120,792 5,059,893 Accrued interest 200,445 163,027 363,472 Unearned revenue 2,609 319,557 322,166 Deposits payable 1,167,972 332,774 1,500,746 Accrued compensated absences due within one year 224,645 57,054 281,699 Accrued claims and judgments due within one year 50,000 - 50,000 Bonds, notes, and capital leases due within one year 1,359,890 1,180,633 2,540,523 Noncurrent liabilities:
Accrued compensated absences due in more than one year 819,796 159,097 978,893 Bonds, notes, and capital leases due in more than one year 21,692,134 11,928,364 33,620,498 Net pension Liability due in more than one year 17,592,485 4,669,969 22,262,454 Total OPEB Liability due in more than one year 25,860,988 3,073,894 28,934,882
Total Liabilities 77,231,361 22,727,954 99,959,315
Deferred Inflows of Resources:Deferred pension related items 268,747 197,840 466,587 Deferred OPEB related items 3,661,802 435,250 4,097,052
Total Deferred Inflows of Resources 3,930,549 633,090 4,563,639
Net Position:Net investment in capital assets 169,862,756 50,501,822 220,364,578 Restricted for: Community development projects 25,057,824 - 25,057,824 Public safety 2,301,408 - 2,301,408 Parks and recreation 463,201 - 463,201 Public works 5,620,612 - 5,620,612 Capital projects 1,488,820 - 1,488,820 Debt service 1,893,366 - 1,893,366 Unrestricted (21,122,261) 8,674,254 (12,448,007)
Total Net Position 185,565,726$ 59,176,076$ 244,741,802$
JUNE 30, 2021
Primary Government
See Notes to Financial Statement. 18

CITY OF DINUBA
STATEMENT OF ACTIVITIESYEAR ENDED JUNE 30, 2021
Operating CapitalCharges for Contributions Contributions
Expenses Services and Grants and Grants
Functions/ProgramsPrimary Government:Governmental Activities:
General government 7,635,027$ 1,263,713$ 38,918$ -$ Public safety 12,899,424 516,452 168,681 - Community development 2,576,069 - 5,855,340 - Parks & Rec 2,858,033 238,428 - - Public works 3,009,339 1,728,740 1,061,364 2,237,038 Interest on long-term debt 935,126 - - -
Total Governmental Activities 29,913,018 3,747,333 7,124,303 2,237,038
Business-Type Activities:Water 3,460,883 3,240,648 1,201,756 - Sewer 1,803,845 3,816,657 - - Golf Course 2,839,155 2,397,750 - - Disposal 3,013,999 3,202,112 - - Ambulance 1,562,676 2,302,744 3,012,617 - Transit 1,280,248 19,241 874,410 - Compressed Natural Gas 304,582 174,801 - -
Total Business-Type Activities 14,265,388 15,153,953 5,088,783 -
Total Primary Government 44,178,406$ 18,901,286$ 12,213,086$ 2,237,038$
General Revenues:Taxes: Property taxes, levied for general purpose Transient occupancy taxes Sales taxes Franchise taxes Business licenses taxes Utility users tax Other taxesMotor vehicle in lieu - unrestrictedUse of money and propertyOtherContributions
Transfers
Total General Revenues, Contributions, and Transfers
Change in Net Position
Net Position at Beginning of Year
Restatement of Net Position
Net Position at End of Year
Program Revenues
See Notes to Financial Statement. 19

Primary Government
Governmental Business-TypeActivities Activities Total
(6,332,396)$ -$ (6,332,396)$ (12,214,291) - (12,214,291)
3,279,271 - 3,279,271 (2,619,605) - (2,619,605) 2,017,803 - 2,017,803 (935,126) - (935,126)
(16,804,344) - (16,804,344)
- 981,521 981,521 - 2,012,812 2,012,812 - (441,405) (441,405) - 188,113 188,113 - 3,752,685 3,752,685 - (386,597) (386,597) - (129,781) (129,781)
- 5,977,348 5,977,348
(16,804,344) 5,977,348 (10,826,996)
1,517,322 - 1,517,322 266,474 - 266,474
19,276,913 - 19,276,913 279,774 - 279,774 254,098 - 254,098
1,668,455 - 1,668,455 609,054 - 609,054
2,151,555 - 2,151,555 662,583 572,378 1,234,961 294,859 - 294,859
7,811,698 141,246 7,952,944 873,612 (873,612) -
35,666,397 (159,988) 35,506,409
18,862,053 5,817,360 24,679,413
166,624,837 54,448,847 221,073,684
78,836 (1,090,131) (1,011,295)
185,565,726$ 59,176,076$ 244,741,802$
Net (Expenses) Revenues and Changes in Net Position
See Notes to Financial Statement. 20

CITY OF DINUBA
BALANCE SHEETGOVERNMENTAL FUNDS JUNE 30, 2021
GeneralAssets:Pooled cash and investments 18,594,387$ -$ 1,025$ Receivables:
Accounts 394,027 20,000 - Notes and loans - 24,135,048 85,050 Accrued interest 12,159 310 -
Prepaid costs 28,840 - - Due from other governments 3,623,168 2,618,229 - Due from other funds 2,529,659 - - Advances to other funds 1,496,405 - 116,904 Restricted assets:
Cash and investments with fiscal agents - - -
Total Assets 26,678,645 26,773,587 202,979
Liabilities, Deferred Inflows of Resources, and Fund Balances:Liabilities:Accounts payable 2,983,109 158,745 - Accrued liabilities 4,841,815 - - Unearned revenues 2,609 - - Deposits payable 567,972 - - Due to other funds - 1,674,947 - Advances from other funds 1,031,663 - -
Total Liabilities 9,427,168 1,833,692 -
Deferred Inflows of resources:Unavailable revenues 48,815 - 85,050
Total Deferred Inflows of Resources 48,815 - 85,050
Fund Balances: Nonspendable: Prepaid costs 28,840 - - Advances to other funds 1,496,405 - - Restricted for: Community development projects - 24,939,895 117,929 Public safety - - - Parks and recreation - - - Public works - - - Capital Projects - - - Debt service - - - Unassigned 15,677,417 - -
Total Fund Balances 17,202,662 24,939,895 117,929
Total Liabilities, Deferred Inflows of Resources, and Fund Balances 26,678,645$ 26,773,587$ 202,979$
Housing Authority HUD Grants
Special Revenue Funds
See Notes to Financial Statement. 21

CITY OF DINUBA
BALANCE SHEETGOVERNMENTAL FUNDSJUNE 30, 2021
Assets:Pooled cash and investmentsReceivables:
AccountsNotes and loansAccrued interest
Prepaid costsDue from other governmentsDue from other fundsAdvances to other fundsRestricted assets:
Cash and investments with fiscal agents
Total Assets
Liabilities, Deferred Inflows of Resources, and Fund Balances:Liabilities:Accounts payableAccrued liabilitiesUnearned revenuesDeposits payableDue to other fundsAdvances from other funds
Total Liabilities
Deferred Inflows of resources:Unavailable revenues
Total Deferred Inflows of Resources
Fund Balances: Nonspendable: Prepaid costs Advances to other funds Restricted for: Community development projects Public safety Parks and recreation Public works Capital Projects Debt service Unassigned
Total Fund Balances
Total Liabilities, Deferred Inflows of Resources, and Fund Balances
Capital Projects Funds
Other TotalGovernmental Governmental
Funds Funds
860,184$ 7,125,138$ 26,580,734$
- 139,165 553,192 - 1,288,738 25,508,836
294 4,688 17,451 - 9,835 38,675
161,163 2,212,499 8,615,059 - - 2,529,659 - 1,124,333 2,737,642
- 766,778 766,778
1,021,641 12,671,174 67,348,026
28,073 89,753 3,259,680 - 88,757 4,930,572 - - 2,609 - 600,000 1,167,972 - 546,166 2,221,113 - 316,904 1,348,567
28,073 1,641,580 12,930,513
- 392,175 526,040
- 392,175 526,040
- 9,835 38,675 - - 1,496,405
- - 25,057,824 - 2,301,408 2,301,408 - 463,201 463,201 - 5,620,612 5,620,612
993,568 495,252 1,488,820 - 1,893,366 1,893,366 - (146,255) 15,531,162
993,568 10,637,419 53,891,473
1,021,641$ 12,671,174$ 67,348,026$
Transportation Construction
See Notes to Financial Statement. 22


CITY OF DINUBA
RECONCILIATION OF THE BALANCE SHEET OF GOVERNMENTAL FUNDSTO THE STATEMENT OF NET POSITIONJUNE 30, 2021
Fund balances of governmental funds 53,891,473$
Amounts reported for governmental activities in the statement of net position are different because:
Capital assets net of depreciation have not been included as financial resources in governmental fund activity. 192,238,946
Long-term debt, pension liabilites, OPEB liabilities and compensated absences that have not been included in the governmental fund activity:
Bonds payable (13,960,000)$ Unamortized bond (premiums)discounts 63,956 Unamortized deferred charges 491,249 Capital leases payable (9,047,966) Net pension liability (17,036,099) Total OPEB Liability (25,001,622) Compensated Absences (999,760) (65,490,242)
Accrued interest payable for the current portion of interest due on bonds has not been reported in the governmental funds. (200,445)
Revenues reported as unavailable revenue in the governmental funds and recognized in the statement of activities. These are included in the intergovernmental revenues in the governmental fund activity. 526,040
Deferred outflows related to pension items that are not included in governmental 4,410,468 fund activity
Deferred inflows related to pension items that are not included in governmental (245,177) fund activity
Deferred outflows related to OPEB items that are not included in governmental 3,166,976 fund activity
Deferred inflows related to OPEB items that are not included in governmental (3,540,119) fund activity
Internal service funds are used by management to charge the costs of certain activities, such as equipment management and self-insurance, to individual funds. The assets and liabilities of the internal service funds must be added to the statement of net position. 807,806
Net Position of Governmental Activities 185,565,726$
See Notes to Financial Statement. 23

CITY OF DINUBA
STATEMENT OF REVENUES,EXPENDITURES AND CHANGES IN FUND BALANCESGOVERNMENTAL FUNDS YEAR ENDED JUNE 30, 2021
General Revenues:Taxes 19,941,618$ -$ -$ Assessments 1,200,122 - - Intergovernmental 2,190,473 5,855,340 - Charges for services 1,210,835 - - Use of money and property (40,945) 299,221 - Fines and forfeitures 75,100 - - Miscellaneous 145,475 - -
Total Revenues 24,722,678 6,154,561 -
Expenditures:Current: General government 2,861,175 - - Public safety 9,100,121 - - Community development 1,193,065 211,519 - Parks and recreation 1,814,007 - - Public works - 286,000 - Capital outlay 348,901 6,339,121 - Debt service: Principal retirement 56,601 - - Interest and fiscal charges 3,590 - -
Total Expenditures 15,377,460 6,836,640 -
Excess (Deficiency) of Revenues Over (Under) Expenditures 9,345,218 (682,079) -
Other Financing Sources (Uses):Transfers in 123,524 1,115,154 - Transfers out (1,343,131) (63,524) - Capital leases 122,592 - - Proceeds from sale of capital asset 49,128 - -
Total Other Financing Sources (Uses) (1,047,887) 1,051,630 -
Net Change in Fund Balances 8,297,331 369,551 -
Fund Balances, Beginning of Year, as previously reported 8,826,495 24,570,344 117,929
Restatements 78,836 - -
Fund Balances, Beginning of Year, as restated 8,905,331 24,570,344 117,929
Fund Balances, End of Year 17,202,662$ 24,939,895$ 117,929$
Special Revenue Funds
HUD Grants Housing Authority
See Notes to Financial Statement. 24

CITY OF DINUBA
STATEMENT OF REVENUES,EXPENDITURES AND CHANGES IN FUND BALANCESGOVERNMENTAL FUNDSYEAR ENDED JUNE 30, 2021
Revenues:TaxesAssessmentsIntergovernmentalCharges for servicesUse of money and propertyFines and forfeituresMiscellaneous
Total Revenues
Expenditures:Current: General government Public safety Community development Parks and recreation Public worksCapital outlayDebt service: Principal retirement Interest and fiscal charges
Total Expenditures
Excess (Deficiency) of Revenues Over (Under) Expenditures
Other Financing Sources (Uses):Transfers inTransfers outCapital leasesProceeds from sale of capital asset
Total Other Financing Sources (Uses)
Net Change in Fund Balances
Fund Balances, Beginning of Year, as previously reported
Restatements
Fund Balances, Beginning of Year, as restated
Fund Balances, End of Year
Capital Projects Funds
Other TotalGovernmental Governmental
Funds Funds
-$ 3,930,472$ 23,872,090$ - - 1,200,122
882,997 2,584,086 11,512,896 - 1,066,507 2,277,342
2,249 377,844 638,369 - 176,120 251,220
103 149,384 294,962
885,349 8,284,413 40,047,001
- 16,980 2,878,155 - 2,022,932 11,123,053 - - 1,404,584 - - 1,814,007 - 1,902,240 2,188,240
1,385,884 1,820,653 9,894,559
- 1,320,131 1,376,732 - 908,852 912,442
1,385,884 7,991,788 31,591,772
(500,535) 292,625 8,455,229
604,951 2,778,410 4,622,039 - (2,391,928) (3,798,583) - 74,884 197,476 - - 49,128
604,951 461,366 1,070,060
104,416 753,991 9,525,289
889,152 9,883,428 44,287,348
- - 78,836
889,152 9,883,428 44,366,184
993,568$ 10,637,419$ 53,891,473$
Transportation Construction
See Notes to Financial Statement. 25


CITY OF DINUBA
RECONCILIATION OF THE STATEMENT OF REVENUES, EXPENDITURES,AND CHANGES IN FUND BALANCES OF GOVERNMENTAL FUNDSTO THE STATEMENT OF ACTIVITIESYEAR ENDED JUNE 30, 2021
Net change in fund balances - total governmental funds 9,525,289$
Amounts reported for governmental activities in the statement of activities aredifferent because:
Governmental funds report capital outlays as expenditures. However, in the statement of activities, the costs of those assets is allocated over their estimated useful lives as depreciation expense. This is the amount by which capital outlays exceeded depreciation in the current period.
Capital outlay 8,341,728$ Depreciation (3,342,022) Contributed capital assets 7,811,698 Proceeds on sale of capital assets 49,128 Gain/(loss) on sale of capital assets (385,244) 12,475,288
Repayment of bond principal is an expenditure in the governmental funds, but the repayment reduces long-term liabilities in the statement of net position. Issuance of long-term debt is an other financing source in the governmental funds, but the issuance increased long-term liabilities on the statement of net position.
Principal repayments 1,377,785 Amortization of bond premiums(discounts) (3,692) Amortization of deferred charges (49,931) Capital leases issued (197,476) 1,126,686
Accrued interest for long-term liabilities. This is the net change in accrued interest for the current period. 13,216
Compensated absences expenses reported in the statement of activities do not require the use of current financial resources and, therefore, are not reported as expenditures in governmental funds. 71,135
OPEB obligation expenses are expenditures in the governmental funds, but reduce the total OPEB liability in the statement of net position. (4,284,098)
Revenues reported as unavailable revenue in the governmental funds and recognized in the statement of activities. These are included in the intergovernmental revenues in the governmental fund activity. 37,469
Internal service funds are used by management to charge the costs of certain activities, such as equipment management and self-insurance, to individual funds. The net revenues (expenses) of the internal service funds is reported with governmental activities. 1,084,786
Pension obligation expenses are expenditures in the governmental funds, but reduce to the net pension liability in the statement of net position. (1,187,718)
Change in Net Position of Governmental Activities 18,862,053$
See Notes to Financial Statement. 26

CITY OF DINUBA
STATEMENT OF NET POSITIONPROPRIETARY FUNDS JUNE 30, 2021
Assets:Current:
Cash and investments 2,724,612 $ 362,912 $ 362,883 $ 1,014,871 $ Receivables:
Accounts 1,371,953 781,152 8,375 395,448 Accrued interest 1,795 178 - 637
Prepaid costs 5,102 5,663 554 60,976 Due from other governments - - - - Inventories - - 103,337 -
Restricted:Cash with fiscal agent 50,189 593,405 - -
Total Current Assets 4,153,651 1,743,310 475,149 1,471,932
Noncurrent:Notes and loans 3,170 - - - Advances to other funds - - - 200,000 Capital assets - net of accumulated depreciation 17,685,640 21,712,187 19,361,950 210,526
Total Noncurrent Assets 17,688,810 21,712,187 19,361,950 410,526
Total Assets 21,842,461 23,455,497 19,837,099 1,882,458
Deferred Outflows of Resources:Deferred charge on refunding - 850,189 - - Deferred pension related items 207,457 106,749 - 89,030 Deferred OPEB related items 210,078 80,897 - 40,941
Total Deferred Outflows of Resources 417,535 1,037,835 - 129,971
Liabilities:Current:
Accounts payable 181,201 134,526 159,949 124,882 Accrued liabilities 14,022 11,707 41,079 6,363 Accrued interest 53,031 109,996 - - Unearned revenues - - 319,557 - Deposits payable 332,774 - - - Due to other funds - - - - Accrued compensated absences 6,951 8,856 - 5,071 Accrued claims and judgments - - - - Bonds, notes, and capital leases 526,170 549,870 92,004 11,125
Total Current Liabilities 1,114,149 814,955 612,589 147,441
Noncurrent:Advances from other funds - - 1,589,075 - Accrued compensated absences 36,300 16,437 - 18,702 Net pension Liability 959,391 493,665 - 411,723 Total OPEB Liability 1,658,452 638,642 - 323,210 Bonds, notes, and capital leases 3,541,744 8,047,948 291,463 41,219
Total Noncurrent Liabilities 6,195,887 9,196,692 1,880,538 794,854
Total Liabilities 7,310,036 10,011,647 2,493,127 942,295
Deferred Inflows of Resources:Deferred pension related items 40,644 20,914 - 17,442 Deferred OPEB related items 234,830 90,429 - 45,765
Total Deferred Inflows of Resources 275,474 111,343 - 63,207
Net Position:Net investment in capital assets 13,617,726 13,964,558 18,978,483 158,182 Unrestricted 1,056,760 405,784 (1,634,511) 848,745
Total Net Position 14,674,486$ 14,370,342$ 17,343,972$ 1,006,927$
Disposal
Business-Type Activities - Enterprise Funds
Water Sewer Golf Course
See Notes to Financial Statement. 27

CITY OF DINUBA
STATEMENT OF NET POSITIONPROPRIETARY FUNDSJUNE 30, 2021
Assets:Current:
Cash and investmentsReceivables:
AccountsAccrued interest
Prepaid costsDue from other governmentsInventories
Restricted:Cash with fiscal agent
Total Current Assets
Noncurrent:Notes and loansAdvances to other fundsCapital assets - net of accumulated depreciation
Total Noncurrent Assets
Total Assets
Deferred Outflows of Resources:Deferred charge on refundingDeferred pension related itemsDeferred OPEB related items
Total Deferred Outflows of Resources
Liabilities:Current:
Accounts payableAccrued liabilitiesAccrued interestUnearned revenuesDeposits payableDue to other fundsAccrued compensated absencesAccrued claims and judgmentsBonds, notes, and capital leases
Total Current Liabilities
Noncurrent:Advances from other fundsAccrued compensated absencesNet pension LiabilityTotal OPEB LiabilityBonds, notes, and capital leases
Total Noncurrent Liabilities
Total Liabilities
Deferred Inflows of Resources:Deferred pension related itemsDeferred OPEB related items
Total Deferred Inflows of Resources
Net Position:Net investment in capital assetsUnrestricted
Total Net Position
GovernmentalOther Activities-
Enterprise InternalFunds Totals Service Funds
8,257,666 $ 399,875 $ 13,122,819$ 2,060,295 $
812,151 2,964 3,372,043 7,854 4,791 277 7,678 1,132 4,984 291 77,570 87,056
1,280,329 614,183 1,894,512 - - - 103,337 -
- - 643,594 71,561
10,359,921 1,017,590 19,221,553 2,227,898
- - 3,170 - - - 200,000 -
507,431 3,282,896 62,760,630 184,585
507,431 3,282,896 62,963,800 184,585
10,867,352 4,300,486 82,185,353 2,412,483
- - 850,189 - 605,865 724 1,009,825 120,311 46,535 10,923 389,374 108,857
652,400 11,647 2,249,388 229,168
51,660 70,575 722,793 61,616 46,291 1,330 120,792 8,529
- - 163,027 - - - 319,557 - - - 332,774 - - 308,546 308,546 -
35,080 1,096 57,054 11,073 - - - 50,000
1,464 - 1,180,633 31,288
134,495 381,547 3,205,176 162,506
- - 1,589,075 - 84,291 3,367 159,097 33,608
2,801,842 3,348 4,669,969 556,386 367,364 86,226 3,073,894 859,366
5,990 - 11,928,364 76,726
3,259,487 92,941 21,420,399 1,526,086
3,393,982 474,488 24,625,575 1,688,592
118,698 142 197,840 23,570 52,017 12,209 435,250 121,683
170,715 12,351 633,090 145,253
499,977 3,282,896 50,501,822 76,571 7,455,078 542,398 8,674,254 731,235
7,955,055$ 3,825,294$ 59,176,076$ 807,806$
Ambulance
Business-Type Activities - Enterprise Funds
See Notes to Financial Statement. 28

CITY OF DINUBA
STATEMENT OF REVENUES, EXPENSESAND CHANGES IN FUND NET POSITIONPROPRIETARY FUNDS YEAR ENDED JUNE 30, 2021
Operating Revenues:Sales and service charges 3,240,648$ 3,816,657$ 2,397,750$ 3,202,112$ Miscellaneous 19,543 124 - 2,045
Total Operating Revenues 3,260,191 3,816,781 2,397,750 3,204,157
Operating Expenses:Salaries and benefits 672,768 525,243 1,304,301 309,812 Contractual services 888,616 218,543 114,690 2,226,221 Materials and supplies 302,463 119,502 305,294 61,125 Insurance - - - - Employee health insurance - - - - Repairs and maintenance 25,298 265,030 62,956 1,836 Utilities 389,863 153,283 166,828 26,137 Allocated costs 389,706 (423,473) - 331,714 Depreciation expense 623,942 516,016 753,652 50,032 Bad debt expense - - 6,486 -
Total Operating Expenses 3,292,656 1,374,144 2,714,207 3,006,877
Operating Income (Loss) (32,465) 2,442,637 (316,457) 197,280
Nonoperating Revenues (Expenses):Intergovernmental 1,201,756 - - - Interest revenue 12,420 18,208 6,135 500,896 Interest expense (168,227) (429,701) (1,331) (5,382) Loss on disposal of capital assets (18,689) (23,302) (123,617) (1,740)
Total Nonoperating Revenues (Expenses) 1,027,260 (434,795) (118,813) 493,774
Income (Loss) Before Transfers 994,795 2,007,842 (435,270) 691,054
Transfers in 925,035 833,860 - - Transfers out (1,151,304) (1,341,796) - (25,691)
Changes in Net Position 768,526 1,499,906 (435,270) 665,363
Net Position:Beginning of Year, as previously reported 13,905,960 12,870,436 17,779,242 341,564
Restatements - - - -
Beginning of Fiscal Year, as restated 13,905,960 12,870,436 17,779,242 341,564
End of Fiscal Year 14,674,486$ 14,370,342$ 17,343,972$ 1,006,927$
Golf Course Disposal
Business-Type Activities - Enterprise Funds
Water Sewer
See Notes to Financial Statement. 29

CITY OF DINUBA
STATEMENT OF REVENUES, EXPENSESAND CHANGES IN FUND NET POSITIONPROPRIETARY FUNDSYEAR ENDED JUNE 30, 2021
Operating Revenues:Sales and service chargesMiscellaneous
Total Operating Revenues
Operating Expenses:Salaries and benefitsContractual servicesMaterials and suppliesInsuranceEmployee health insuranceRepairs and maintenanceUtilitiesAllocated costsDepreciation expenseBad debt expense
Total Operating Expenses
Operating Income (Loss)
Nonoperating Revenues (Expenses):IntergovernmentalInterest revenueInterest expenseLoss on disposal of capital assets
Total Nonoperating Revenues (Expenses)
Income (Loss) Before Transfers
Transfers inTransfers out
Changes in Net Position
Net Position:Beginning of Year, as previously reported
Restatements
Beginning of Fiscal Year, as restated
End of Fiscal Year
GovernmentalOther Activities-
Enterprise InternalFunds Totals Service Funds
2,302,744$ 194,042$ 15,153,953$ 5,933,510$ - 161,525 183,237 -
2,302,744 355,567 15,337,190 5,933,510
460,941 158,464 3,431,529 555,093 121,580 546,372 4,116,022 103,873 351,678 82,098 1,222,160 112,911
- - - 1,563,982 - - - 2,307,754
31,831 54,404 441,355 186,212 4,313 73,821 814,245 7,393
361,359 130,632 789,938 27,174 177,215 301,079 2,421,936 34,153 53,759 - 60,245 -
1,562,676 1,346,870 13,297,430 4,898,545
740,068 (991,303) 2,039,760 1,034,965
3,012,617 874,410 5,088,783 - 31,853 2,866 572,378 5,291
- - (604,641) (5,626) - (237,960) (405,308) -
3,044,470 639,316 4,651,212 (335)
3,784,538 (351,987) 6,690,972 1,034,630
- - 1,758,895 60,964 (102,236) (11,480) (2,632,507) (10,808)
3,682,302 (363,467) 5,817,360 1,084,786
5,362,884 4,188,761 54,448,847 (276,980)
(1,090,131) - (1,090,131) -
4,272,753 4,188,761 53,358,716 (276,980)
7,955,055$ 3,825,294$ 59,176,076$ 807,806$
Ambulance
Business-Type Activities - Enterprise Funds
See Notes to Financial Statement. 30

CITY OF DINUBA
STATEMENT OF CASH FLOWSPROPRIETARY FUNDS YEAR ENDED JUNE 30, 2021
Cash Flows from Operating Activities:Cash received from customers and users 2,814,665$ 3,800,521$ 2,517,723$ 3,140,272$ Cash received from interfund service provided - - - - Cash paid to suppliers for goods and services (1,931,258) (344,050) (625,875) (2,652,205) Cash paid to employees for services (827,337) (1,301,167) (1,304,301) (840,967) Cash received from (payments to) others 19,543 124 - 2,045
Net Cash Provided (Used) by Operating Activities 75,613 2,155,428 587,547 (350,855)
Cash Flows from Non-CapitalFinancing Activities:
Cash transfers in 925,035 833,860 - - Cash transfers out (1,151,304) (1,341,796) - (25,691) Short-term loans repaid to other funds - - - - Intergovernmental revenue 1,201,756 - - - Repayments (made)/received on notes/loans 4,818 - - 3,000 Advance from other funds - - (200,000) -
Net Cash Provided (Used) by Non-Capital Financing Activities 980,305 (507,936) (200,000) (22,691)
Cash Flows from Capital and Related Financing Activities:
Acquisition and construction of capital assets (776,310) (797,443) - - Principal paid on capital debt (526,561) (542,149) (72,430) (11,946) Interest paid on capital debt (174,121) (301,674) (2,376) (2,304)
Net Cash Provided (Used) by Capital and Related Financing Activities (1,476,992) (1,641,266) (74,806) (14,250)
Cash Flows from Investing Activities:Interest earnings 20,358 18,876 6,333 502,961
Net Cash Provided (Used) byInvesting Activities 20,358 18,876 6,333 502,961
Net Increase (Decrease) in Cashand Cash Equivalents (400,716) 25,102 319,074 115,165
Cash and Cash Equivalents at Beginning of Year 3,175,517 931,215 43,809 899,706
Cash and Cash Equivalents at End of Year 2,774,801$ 956,317$ 362,883$ 1,014,871$
Reconciliation of Operating Income to Net CashProvided (Used) by Operating Activities:Operating income (loss) (32,465)$ 2,442,637$ (316,457)$ 197,280$
Adjustments to reconcile operating income (loss) net cash provided (used) by operating activities:
Depreciation 623,942 516,016 753,652 50,032 Changes in pension related items 107,900 (19,246) - (22,557) Changes in OPEB related items (244,634) (741,334) - (506,235) (Increase) decrease in accounts receivable (425,983) (16,136) 76,195 (61,840) (Increase) decrease in due from other governments - - - - (Increase) decrease in prepaid expense (2,926) (4,246) 21,899 (952) (Increase) decrease in inventory - - 13,161 - Increase (decrease) in accounts payable & accrued liabilities 37,931 (6,919) (11,167) (4,220) Increase (decrease) in deposits payable 29,683 - - - Increase (decrease) in unearned revenue - - 50,264 - Increase (decrease) in compensated absences (17,835) (15,344) - (2,363)
Total Adjustments 108,078 (287,209) 904,004 (548,135)
Net Cash Provided (Used) by Operating Activities 75,613$ 2,155,428$ 587,547$ (350,855)$
Non-Cash Investing, Capital, and Financing Activities:Capital leased assets 22,873$ 13,971$ 425,154$ 7,620$ Bad debt expense - - (6,486) -
Sewer Golf Course Disposal
Business-Type Activities - Enterprise Funds
Water
See Notes to Financial Statement. 31

CITY OF DINUBA
STATEMENT OF CASH FLOWSPROPRIETARY FUNDSYEAR ENDED JUNE 30, 2021
Cash Flows from Operating Activities:Cash received from customers and usersCash received from interfund service providedCash paid to suppliers for goods and servicesCash paid to employees for servicesCash received from (payments to) others
Net Cash Provided (Used) by Operating Activities
Cash Flows from Non-CapitalFinancing Activities:
Cash transfers inCash transfers outShort-term loans repaid to other fundsIntergovernmental revenueRepayments (made)/received on notes/loansAdvance from other funds
Net Cash Provided (Used) by Non-Capital Financing Activities
Cash Flows from Capital and Related Financing Activities:
Acquisition and construction of capital assetsPrincipal paid on capital debtInterest paid on capital debt
Net Cash Provided (Used) by Capital and Related Financing Activities
Cash Flows from Investing Activities:Interest earnings
Net Cash Provided (Used) byInvesting Activities
Net Increase (Decrease) in Cashand Cash Equivalents
Cash and Cash Equivalents at Beginning of Year
Cash and Cash Equivalents at End of Year
Reconciliation of Operating Income to Net CashProvided (Used) by Operating Activities:Operating income (loss)
Adjustments to reconcile operating income (loss) net cash provided (used) by operating activities:
DepreciationChanges in pension related itemsChanges in OPEB related items(Increase) decrease in accounts receivable(Increase) decrease in due from other governments(Increase) decrease in prepaid expense(Increase) decrease in inventoryIncrease (decrease) in accounts payable & accrued liabilitiesIncrease (decrease) in deposits payableIncrease (decrease) in unearned revenueIncrease (decrease) in compensated absences
Total Adjustments
Net Cash Provided (Used) by Operating Activities
Non-Cash Investing, Capital, and Financing Activities:Capital leased assetsBad debt expense
GovernmentalOther Activities-
Enterprise InternalFunds Totals Service Funds
523,525$ 191,078$ 12,987,784$ -$ - - - 5,960,160
(819,488) (1,052,041) (7,424,917) (4,453,273) (1,815,388) (232,627) (6,321,787) (480,946)
- 161,525 183,237 -
(2,111,351) (932,065) (575,683) 1,025,941
- - 1,758,895 60,964 (102,236) (11,480) (2,632,507) (10,808)
- 308,546 308,546 - 3,012,617 491,126 4,705,499
- - 7,818 - - - (200,000) -
2,910,381 788,192 3,948,251 50,156
(213,298) (212,271) (1,999,322) (11,405) (2,077) - (1,155,163) (32,694)
- - (480,475) (5,626)
(215,375) (212,271) (3,634,960) (49,725)
43,994 4,324 596,846 6,244
43,994 4,324 596,846 6,244
627,649 (351,820) 334,454 1,032,616
7,630,017 751,695 13,431,959 1,099,240
8,257,666$ 399,875$ 13,766,413$ 2,131,856$
740,068$ (991,303)$ 2,039,760$ 1,034,965$
177,215 301,079 2,421,936 34,153 242,064 (70,309) 237,852 46,836
(1,636,728) (8,317) (3,137,248) 35,104 (445,131) (2,964) (875,859) 26,650
(1,280,329) - (1,280,329) - (4,984) 270 9,061 (71,785)
- - 13,161 - 56,257 (164,984) (93,102) (72,189)
- - 29,683 - - - 50,264 -
40,217 4,463 9,138 (7,793)
(2,851,419) 59,238 (2,615,443) (9,024)
(2,111,351)$ (932,065)$ (575,683)$ 1,025,941$
7,454$ -$ 477,072$ -$ (53,759) - (60,245) -
Ambulance
Business-Type Activities - Enterprise Funds
See Notes to Financial Statement. 32

CITY OF DINUBA
STATEMENT OF FIDUCIARY NET POSITIONFIDUCIARY FUNDSJUNE 30, 2021
Assets:Pooled cash and investments 2,133,850$ Receivables:
Accrued interest 1,035 Prepaid costs 186 Land held for resale 1,888,463 Restricted assets:
Cash and investments with fiscal agents 109,953 Capital assets:
Capital assets, not being depreciated 2,730,606 Capital assets, net of accumulated depreciation 44,986
Total Assets 6,909,079
Deferred Outflows of Resources:Deferred charge on refunding 2,629,648
Total Deferred Outflows of Resources 2,629,648
Liabilities:Accounts payable 8,975 Accrued liabilities 4,843 Accrued interest 587,912 Due to other governments 186 Long-term liabilities:
Due in one year 1,505,000 Due in more than one year 42,138,572
Total Liabilities 44,245,488
Deferred Inflows of Resources:
Net Position:Restricted for dissolution of former RDA (34,706,761)
Total Net Position (34,706,761)$
Redevelopment Successor Agency
Private-Purpose Trust Fund
See Notes to Financial Statements. 33

CITY OF DINUBA
STATEMENT OF CHANGES IN FIDUCIARY NET POSITIONFIDUCIARY FUNDSYEAR ENDED JUNE 30, 2021
Additions:Contributions:Taxes 3,566,634$ Interest and change in fair value of investments 18,164
Total Additions 3,584,798
Deductions:Administrative expenses 232,979 Contractual services 22,621 Interest expense 2,058,250 Depreciation expense 5,559
Total Deductions 2,319,409
Changes in Net Position 1,265,389
Net Position - Beginning of the Year (35,972,150)
Net Position - End of the Year (34,706,761)$
Redevelopment Successor Agency
Private-Purpose Trust Fund
See Notes to Financial Statements. 34


CITY OF DINUBA NOTES TO BASIC FINANCIAL STATEMENTS JUNE 30, 2021
Note 1: Summary of Significant Accounting Policies
The financial statements of the City of Dinuba (City) have been prepared in conformity with accounting principles generally accepted in the United States of America (USGAAP) as applied to governmental units. The Governmental Accounting Standards Board (GASB) is the accepted standard-setting body for establishing governmental accounting and financial reporting principles. The more significant of the government’s accounting policies are described below.
a. Reporting Entity
The City of Dinuba is a political subdivision provided for by the General Law of the State of California and, as such, can exercise the powers specified by the Constitution and laws of the State of California. The City was incorporated in 1906 as a general law city. On June 4, 1994, the voters of the City approved a Charter which gives the City Council greater self-rule, and the Charter was accepted by the Secretary of State on July 7, 1994. The City operates under a council-manager form of government. The City of Dinuba is a municipal corporation governed by an elected five-member City Council who, in turn, elects one of its members to serve as the Mayor. As required by accounting principles generally accepted in the United States of America, these financial statements present the government and its component units, entities for which the government is considered to be financially accountable. Blended component units, although legally separate entities, are, in substance, part of the government’s operations and so data from these units are combined with data of the City. The blended component units have a June 30 fiscal year end to coincide with the City’s. Blended Component Unit. In addition, in May 1994, the Dinuba Financing Authority (Authority) was formed in order to provide a funding vehicle for necessary street improvements within the City. The governing board of the Dinuba Financing Authority is the City Council, and the City Manager acts as Executive Director. A separate financial report is not being issued for the Dinuba Financing Authority. The activity of the Authority is reported in the Financing Authority Debt Service Fund of the City.
b. Government-wide and Fund Financial Statements The government-wide financial statements (i.e., the statement of net position and the statement of activities) report information on all of the nonfiduciary activities of the primary government and its component units. For the most part, the effect of interfund activity has been removed from these statements. Governmental activities, which normally are supported by taxes and intergovernmental revenues, are reported separately from business-type activities, which rely to a significant extent on fees and charges for support. The statement of activities demonstrates the degree to which the direct expenses of a given function or segment are offset by program revenues. Direct expenses are those that are clearly identifiable with a specific function or segment. Program revenues include: 1) charges to customers or applicants who purchase, use, or directly benefit from goods, services, or privileges provided by a given function or segment and (2) grants and contributions that are restricted to meeting the operational or capital requirements of a particular function or segment. Taxes and other items not properly included among program revenues are reported instead as general revenues.
35

CITY OF DINUBA NOTES TO BASIC FINANCIAL STATEMENTS (CONTINUED) JUNE 30, 2021
Note 1: Summary of Significant Accounting Policies (Continued) Separate financial statements are provided for governmental funds, proprietary funds, and fiduciary funds, even though the latter are excluded from the government-wide financial statements. Major individual governmental funds and major individual enterprise funds are reported as separate columns in the fund financial statements.
c. Measurement Focus, Basis of Accounting, and Financial Statement Presentation The government-wide financial statements are reported using the economic resources measurement focus and the accrual basis of accounting, as are the proprietary funds financial statements. Revenues are recorded when earned and expenses are recorded when the liability is incurred, regardless of the timing of related cash flows. Property taxes are recognized as revenues in the fiscal year for which they are levied. Grants and similar items are recognized as revenue as soon as all eligibility requirements imposed by the provider have been met. In the Fund Financial Statements, fiduciary funds are presented using the accrual basis of accounting. The private-purpose trust funds use the economic resources measurement focus. The agency funds do not have a measurement focus. Governmental funds financial statements are reported using the current financial resources measurement focus and the modified accrual basis of accounting. Revenues are recognized as soon as they are both measurable and available. Revenues are considered to be available when they are collectible within the current period. For this purpose, the government considers revenues to be available if they are collected within 60 days of the end of the current fiscal period. Expenditures generally are recorded when the liability is incurred, as under accrual accounting. However, debt service expenditures, as well as expenditures related to compensated absences and claims and judgments, are recorded only when payment is due. Property taxes, franchise taxes, licenses, and interest associated with the current fiscal period are all considered to be susceptible to accrual and so have been recognized as revenues of the current fiscal period. Only the portion of special assessments receivable due within the current fiscal period is considered to be susceptible to accrual as revenue of the current period. All other revenue items are considered to be measurable and available only when cash is received by the government. The City reports the following major governmental funds: The General Fund is the City’s primary operating fund. It accounts for all financial resources of the general government, except those required to be accounted for in other funds. HUD Grants Fund – This fund accounts for certain designated projects paid for the HUD Grant Federal program monies received from the State, along with repayments of loans. Housing Authority Fund – This fund is used for account for activities of the former low and moderate income housing fund of the former Dinuba Redevelopment Agency. Transportation Construction Fund – This fund accounts for other major street construction projects.
36

CITY OF DINUBA NOTES TO BASIC FINANCIAL STATEMENTS (CONTINUED) JUNE 30, 2021
Note 1: Summary of Significant Accounting Policies (Continued)
The City reports the following major proprietary funds: The Water Enterprise Fund – This fund accounts for the operation and maintenance of the City’s water distribution system. The Sewer Enterprise Fund – This fund accounts for the operation and maintenance of the City’s wastewater collection system including operating costs of the wastewater treatment facility.
The Golf Course Fund – This fund accounts for the operation and maintenance of the City’s golf course. The Disposal Enterprise Fund – This fund accounts for the collection and disposal of solid waste from industrial, commercial, and residential users throughout the Dinuba area. The Ambulance Enterprise Fund – This fund accounts for ambulance service fees and all costs associated with providing ambulance service throughout the City. Additionally, the City reports the following fund types: The Debt Service Funds are used to account for financial resources that are restricted, committed, or assigned to expenditure for principal and interest. The Internal Service Funds account for financial transactions related to the City’s billing and collections, maintenance and repairs, self-insurance programs and technology replacement. These services are provided to other departments or agencies of the City on a cost reimbursement basis. The Fiduciary Funds are used to report resources held by the City in a purely custodial capacity, which involves only the receipt, temporary investment, and remittance of fiduciary resources to individuals, private organizations, or other governments. These funds are not included in the government-wide financial statements. The Private-Purpose Trust Funds are used to account for the assets of the former City of Dinuba Redevelopment Agency during the wind down period. As a general rule, the effect of interfund activity has been eliminated from the government-wide financial statements. Exceptions to this general rule are charges between the government’s proprietary funds function and various other functions of the government. Elimination of these charges would distort the direct costs and program revenues reported for the various functions concerned.
Proprietary funds distinguish operating revenues and expenses from nonoperating items. Operating revenues and expenses generally result from providing services and producing and delivering goods in connection with a proprietary fund’s principal ongoing operations. The principal operating revenues of the Enterprise Funds and of the Internal Service Fund are charges to customers for sales and services. Operating expenses for the Enterprises Funds and the Internal Service Funds include the cost of sales and services, administrative expenses, and depreciation on capital assets. All revenues and expenses not meeting this definition are reported as nonoperating revenues and expenses. When both restricted and unrestricted resources are available for use, it is the government’s policy to use restricted resources first, then unrestricted resources as they are needed.
37

CITY OF DINUBA NOTES TO BASIC FINANCIAL STATEMENTS (CONTINUED) JUNE 30, 2021
Note 1: Summary of Significant Accounting Policies (Continued)
d. Assets, Deferred Outflows of Resources, Liabilities, Deferred Inflows of Resources, Net Position or Equity Cash and Investments In order to maximize the flexibility of its investment program and to aid in cash budgeting, the City pools the cash of all funds, except for monies deposited with fiscal agents in accordance with related bond indentures. The cash and investments balance in each fund represent that fund’s equity share of the City’s cash and investment pool. As the City places no restrictions on the deposit or withdrawal of a particular fund’s equity in the pool, the pool operates like a demand deposit account for the participating funds. Interest income earned on pooled cash and investments is allocated monthly to the various funds based on month-end balances and is adjusted at fiscal year-end. Interest income on restricted cash and investments with fiscal agents is credited directly to the related fund. In accordance with the State of California Government Code, the City adopts an investment policy annually that, among other things, authorizes types and concentrations of investments and maximum investment terms. The City’s investments are carried at fair value. The fair value of equity and debt securities is determined based on sales prices or bid-and-asked quotations from SEC- registered securities exchanges or NASDAQ dealers. LAIF determines the fair value of its portfolio quarterly and reports a factor to the City; the City applies that factor to convert its share of LAIF from amortized cost to fair value. Changes in fair value are allocated to each participating fund. For purposes of the statement of cash flows, the City has defined cash and cash equivalents to be change and petty cash funds, equity in the City’s cash and investment pool, and restricted non-pooled investments with initial maturities of three months or less. Property Taxes Assessed values for purposes of property taxes are determined on an annual basis for the period July 1 to June 30 by the Tulare County Assessor as of January 1. Taxes are levied annually on July 1 and become a lien on real property at January 1. Taxes are due November 1 and February 1 and are delinquent if not paid by December 10 and April 10, respectively, at which time applicable penalties and interest are assessed. Unsecured taxes became delinquent if not paid by August 31. Prepaid Items Payments to vendors that reflect costs applicable to future accounting periods are recorded as prepaid items in both government-wide and fund financial statements. The cost of prepaid items is recorded as expenditures/expenses when consumed rather than when purchased. Restricted Assets Certain proceeds of the City’s long-term debt, as well as certain resources set aside for their repayment, are classified as restricted assets on the balance sheet because they are maintained in separate bank accounts and their use is limited by applicable bond covenants.
38

CITY OF DINUBA NOTES TO BASIC FINANCIAL STATEMENTS (CONTINUED) JUNE 30, 2021
Note 1: Summary of Significant Accounting Policies (Continued)
In the absence of specific statutory provisions governing the issuance of bonds, certificates, or leases, these bond monies may be invested in accordance with the ordinance; resolutions and indentures specifying the types of investments its trustees or fiscal agents may make. These ordinances, resolutions, and indentures are generally more restrictive than the City’s general investment policy. In no instance have additional types of investments been authorized that are not permitted by the City’s general investment policy. Capital Assets Capital assets, which include property, plant, equipment, fine art, and infrastructure assets (e.g., roads, bridges, sidewalks, traffic lights and signals, street lights, and similar items), are reported in the applicable governmental or business-type activities columns in the government-wide financial statements. Capital assets are defined by the City as assets with an initial, individual cost of $2,500 or more and an estimated useful life in excess of one year. Such capital assets are recorded at historical cost or estimated historical cost if purchased or constructed. Donated capital asset, donated works of art and similar items, and capital assets received in a service concession arrangement are reported at acquisition value. The cost of normal maintenance and repairs that do not add to the value of the capital asset or materially extend capital asset lives are not capitalized. Major outlays for capital assets and improvements are capitalized as projects are constructed. Interest incurred during the construction phase of capital assets of business- type activities is included as part of the capitalized value of the assets constructed. No interest was capitalized during the fiscal year ended June 30, 2021. Capital assets of the City are depreciated using the straight-line method over the following estimated useful lives:
Assets YearsBuildings 30Improvements other than buildings 30Infrastructure 20 to 40Utility systems 40 to 75Vehicles 5 to 15Computer equipment 7
The City’s art collection is not depreciated. Periodic restoration and maintenance costs on particular items are charged to expense as incurred. Compensated Absences It is the City’s policy to permit employees to accumulate earned but unused vacation and sick leave benefits. All vacation and sick leave benefits are accrued as earned by employees. A portion of unused sick leave benefits, varying by employee bargaining unit, vests and is payable upon retirement. For proprietary funds, a current liability is reported for that portion of the estimated value of vacation and sick leave benefits to be used during the subsequent fiscal year, and the estimated value of vested sick leave benefits of employees approaching or at their respective retirement ages.
39

CITY OF DINUBA NOTES TO BASIC FINANCIAL STATEMENTS (CONTINUED) JUNE 30, 2021
Note 1: Summary of Significant Accounting Policies (Continued) Long-Term Obligations In the government-wide financial statements, and proprietary fund types in the fund financial statements, long-term debt and other long-term obligations are reported as liabilities in the applicable governmental activities, business-type activities, or proprietary fund type statement of net position. Initial-issue bond premiums and discounts are deferred and amortized over the life of the bonds using the straight-line method (which approximates the effective interest method). The difference between the reacquisition price of refunding bonds and the net carrying amount of refunded debt (deferred amount on refunding) is amortized over the shorter of the life of the refunding debt or remaining life of the refunded debt. Amortization of bond premiums or discounts, and deferred amounts on refunding is included in interest expense. In the fund financial statements, governmental fund types recognize bond premiums, discounts, and issuance costs during the period issued. The face amount of debt issued is reported as other financing sources. Premiums received are reported as other financing sources, while discounts are reported as other financing uses. Issuance costs, whether or not withheld from the actual debt proceeds received, are reported as debt service expenditures.
Net Pension Liability For purposes of measuring the net pension liability, deferred outflows and inflows of resources related to pensions, and pension expense, information about the fiduciary net position and additions to/deductions from the fiduciary net position have been determined on the same basis as they are reported by the CalPERS Financial Office. For this purpose, benefit payments (including refunds of employee contributions) are recognized when currently due and payable in accordance with the benefit terms. Investments are reported at fair value. CalPERS audited financial statements are publicly available reports that can be obtained at CalPERS’ website under Forms and Publications. Other Post-Employment Benefits (OPEB) For purposes of measuring the total OPEB liability, deferred outflows of resources and deferred inflows of resources related to OPEB, and OPEB expense have been determined by an independent actuary. For this purpose, benefit payments are recognized when currently due and payable in accordance with the benefit terms.
Generally accepted accounting principles require that the reported results must pertain to liability information within certain defined timeframes. For this report, the following timeframes are used: Valuation Date June 30, 2019 Measurement Date June 30, 2020 Measurement Period June 30, 2019 to June 30, 2020 Deferred Outflows and Inflows of Resources In addition to assets, the statement of net position will sometimes report a separate section for deferred outflows of resources. This separate financial statement element, deferred outflows of resources, represents a consumption of net position that applies to a future period(s) and so will not be recognized as an outflow of resources (expense) until then. The City reports deferred charges on bond refunding’s as well as deferred outflows relating
40

CITY OF DINUBA NOTES TO BASIC FINANCIAL STATEMENTS (CONTINUED) JUNE 30, 2021
Note 1: Summary of Significant Accounting Policies (Continued) to the net pension liability and total OPEB liability reported in the government-wide statement of net position for governmental and business-type activities. In addition to liabilities, the statement of net position and governmental balance sheet will sometimes report a separate section for deferred inflows of resources. This separate financial statement element, deferred inflows of resources, represents an acquisition of net position that applies to a future period(s) and so will not be recognized as an inflow of resources (revenue) until that time. The City has three items that qualify for reporting in the category. The first item are deferred inflows relating to the net pension liability reported in the government-wide statement of net position for governmental and business-type activities. The second item relates to revenues earned, but not yet available for resources. The third item is deferred inflows relating to the total OPEB liability reported in the government-wide statement of net position for governmental and business-type activities.
Interfund Transactions Interfund transactions are reflected as either loans, services provided, reimbursements, or transfers. Loans are reported as receivables and payables as appropriate, are subject to elimination upon consolidation and are referred to as either “due to/from other funds” (i.e., the current portion of interfund loans) or “advances to/from other funds” (i.e., the noncurrent portion of interfund loans). Any residual balances outstanding between the governmental activities and the business-type activities are reported in the government-wide financial statements as “internal balances”. Advances between funds, as reported in the fund financial statements, are offset by a fund balance reserve account in applicable governmental funds to indicate that they are not available for appropriation and are not available financial resources. Services provided, deemed to be at market or near market rates, are treated as revenues and expenditures/expenses. Reimbursements are when one fund incurs a cost, charges the appropriate benefiting fund, and reduces its related cost as a reimbursement. All other interfund transactions are treated as transfers. Transfers between governmental or proprietary funds are netted as part of the reconciliation to the government-wide presentation. Net Position and Fund Equity GASB Statement No. 63 requires that the difference between assets added to the deferred outflows of resources and liabilities added to the deferred inflows of resources be reported as net position. Net position is classified as either net investment in capital assets, restricted, or unrestricted.
Net position that is net investment in capital assets consist of capital assets, net of accumulated depreciation, and reduced by the outstanding principal of related debt. Restricted net position is the portion of net position that has external constraints placed on it by creditors, grantors, contributors, laws, or regulations of other governments, or through constitutional provisions or enabling legislation. Unrestricted net position consists of net position that does not meet the definition of net investment in capital assets or restricted net position. In the fund financial statements, governmental funds report fund balance as non-spendable, restricted, committed, assigned or unassigned based primarily on the extent to which the City is bound to honor constraints on how specific amounts can be spent.
41

CITY OF DINUBA NOTES TO BASIC FINANCIAL STATEMENTS (CONTINUED) JUNE 30, 2021
Note 1: Summary of Significant Accounting Policies (Continued) Non-spendable fund balance – amounts that cannot be spent because they are
either (a) not spendable in form or (b) legally or contractually required to be maintained intact.
Restricted fund balance – amounts with constraints placed on their use that are either
(a) externally imposed by creditors, grantors, contributors, or laws or regulations of other governments; or (b) imposed by law through constitutional provisions or enabling legislation.
Committed fund balance – amounts that can only be used for specific purposes
determined by formal action of the City Council which includes the City Charter, ordinances and resolutions and that remain binding unless removed in the same manner. The underlying action that imposed the limitation needs to occur no later than the close of the reporting period.
Assigned fund balance – amounts that are constrained by the City’s intent to be used
for specific purposes but are neither restricted nor committed. Such intent should be expressed by the City Council or its designated officials to assign amounts to be used. Constraints imposed on the use of assigned amounts can be removed with no formal Council actions.
Unassigned fund balance – the residual classification for the City’s General Fund
that includes amounts not contained in the other classifications. In other funds, the unassigned classification is used only if expenditures incurred for specific purposes exceed the amounts restricted, committed, or assigned to those purposes.
The City Council establishes, modifies, or rescinds fund balance commitments and assignments by passage of a resolution or other formal action. This is done through adoption of the budget, subsequent budget amendments, resolution, or other formal actions when necessary that occur throughout the year. When both restricted and unrestricted resources are available for use, it is the City’s policy to use restricted resources first, followed by unrestricted committed, assigned and unassigned resources as they are needed.
e. Use of Estimates
The preparation of basic financial statements in conformity with accounting principles generally accepted in the United States of America requires management to make estimates and assumptions that affect the reported amounts of assets and liabilities and disclosure of contingent assets and liabilities at the date of the financial statements and the reported amounts of revenue and expenses/expenditures during the reporting period. Actual results could differ from those estimates.
42

CITY OF DINUBA NOTES TO BASIC FINANCIAL STATEMENTS (CONTINUED) JUNE 30, 2021
Note 2: Stewardship, Compliance, and Accountability
a. Deficit Fund Balances and Net Position The Assessment Districts Fund has a deficit fund balance of $70,144 which should be alleviated as additional revenues or transfers are received.
The MTBE Fund has a deficit fund balance of $68,089 which should be alleviated as additional revenues or transfers are received. The Property and Equipment Internal Service Fund has a deficit net position of $580,412.
These deficits should be alleviated as additional revenues are received by City departments.
Note 3: Cash and Investments
Cash and investments as of June 30, 2021, are classified in the accompanying financial statements as follows:
Statement of net position:Cash and investments 41,763,848$ Restricted cash and investments with fiscal agents 1,481,933
Fiduciary funds:Cash and investments 2,133,850 Restricted cash and investments with fiscal agents 109,953
45,489,584$
Cash and investments as of June 30, 2021, consist of the following:
Cash on hand 8,370$ Deposits with financial institutions 5,622,782 Investments 39,858,432
Total cash and investments 45,489,584$
a. Investments Authorized by the California Government Code and the City’s
Investment Policy
The table below identifies the investment types that are authorized for the City of Dinuba (City) by the California Government Code (or the City’s investment policy, where more restrictive). The table also identifies certain provisions of the California Government Code (or the City’s investment policy, where more restrictive) that address interest rate risk, credit risk, and concentration of credit risk. This table does not address investments of debt proceeds held by bond trustee that are governed by the provisions of debt agreements of the City, rather than the general provisions of the California government Code or the City’s investment policy.
43

CITY OF DINUBA NOTES TO BASIC FINANCIAL STATEMENTS (CONTINUED) JUNE 30, 2021
Note 3: Cash and Investments (Continued)
Authorized Investment TypeMaximum Maturity
Maximum Percentage of Portfolio
Maximum Investment in One Issuer
Local Agency Investment Fund (State Pool) N/A None $50 millionU.S. Treasury Obligations N/A None NoneU.S. Government Agency Issues N/A None NoneInsured Passbook on Demand Deposits with Banks and Savings and Loans N/A None 100,000Certificates of Deposit 5 years None 100,000Money Market Funds (must be comprised of eligible securities permitted under this policy) N/A None NoneRepurchase agreements 1 year None None
The investment policy allows for the above investments which have equal safety and liquidity as all other allowed investments. Maturity depends on the cash needs of the City.
b. Investments Authorized by Debt Agreements
Investment of debt proceeds held by bond trustees are governed by provisions of the debt agreements, rather than the general provisions of the California Government Code or the City’s investment policy. The table below identifies the investment types that are authorized for investments held by bond trustee. The table also identifies certain provisions of these debt agreements that address interest rate risk, credit risk, and concentration of credit risk.
Authorized Investment TypeMaximum Maturity
Maximum Percentage of Portfolio
Maximum Investment in One Issuer
Local Agency Investment Fund (State Pool) N/A None $50 millionU.S. Treasury Obligations N/A None NoneU.S. Government Agency Issues N/A None NoneInsured Passbook on Demand Deposits with Banks and Savings and Loans N/A None 100,000Certificates of Deposit 5 years None 100,000Commercial PaperMutual Funds (must be comprised of eligible securities permitted under this policy)Money Market Funds (must be comprised of eligible securities permitted under this policy) N/A None NoneMunicipal Bonds (rated highest 2 categories) N/A None NoneInvestment Agreements N/A None NoneRepurchase agreements 1 year None None The investment policy allows for the above investments which have equal safety and liquidity as all other allowed investments. Maturity depends on the cash needs of the City.
44
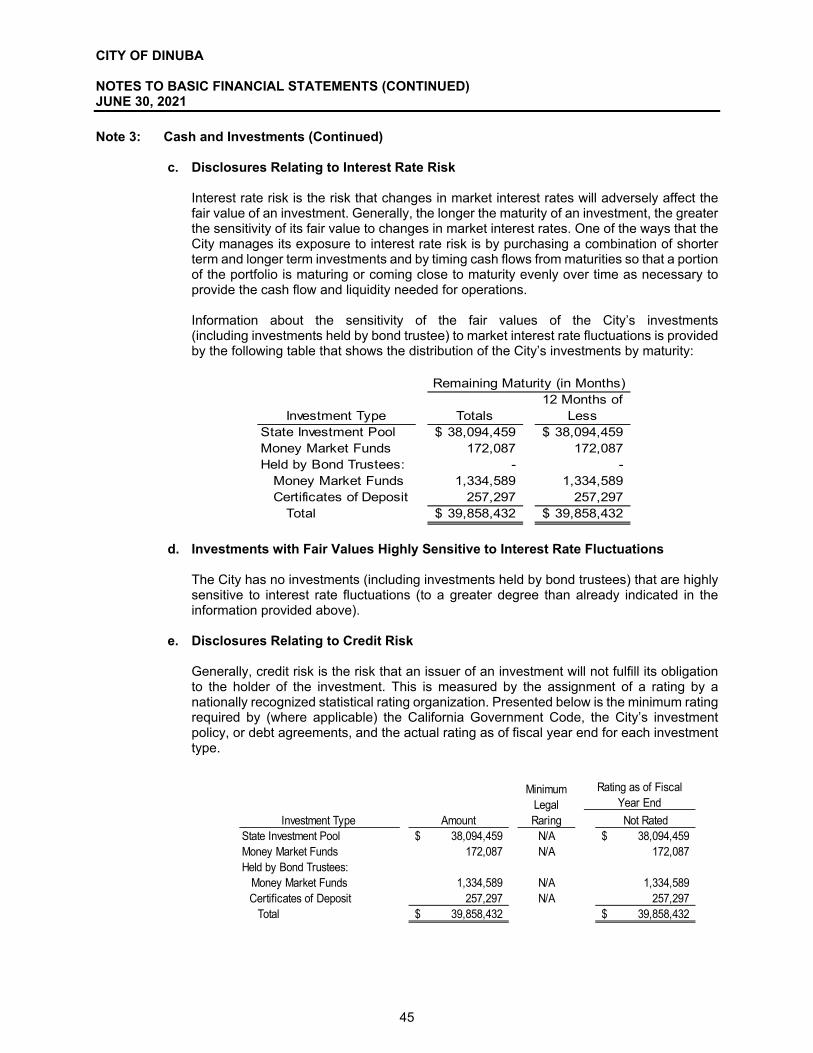
CITY OF DINUBA NOTES TO BASIC FINANCIAL STATEMENTS (CONTINUED) JUNE 30, 2021
Note 3: Cash and Investments (Continued)
c. Disclosures Relating to Interest Rate Risk Interest rate risk is the risk that changes in market interest rates will adversely affect the fair value of an investment. Generally, the longer the maturity of an investment, the greater the sensitivity of its fair value to changes in market interest rates. One of the ways that the City manages its exposure to interest rate risk is by purchasing a combination of shorter term and longer term investments and by timing cash flows from maturities so that a portion of the portfolio is maturing or coming close to maturity evenly over time as necessary to provide the cash flow and liquidity needed for operations. Information about the sensitivity of the fair values of the City’s investments (including investments held by bond trustee) to market interest rate fluctuations is provided by the following table that shows the distribution of the City’s investments by maturity:
Totals12 Months of
Less38,094,459$ 38,094,459$
172,087 172,087 - -
1,334,589 1,334,589 257,297 257,297
Total 39,858,432$ 39,858,432$
Remaining Maturity (in Months)
Money Market FundsCertificates of Deposit
Investment TypeState Investment PoolMoney Market FundsHeld by Bond Trustees:
d. Investments with Fair Values Highly Sensitive to Interest Rate Fluctuations
The City has no investments (including investments held by bond trustees) that are highly sensitive to interest rate fluctuations (to a greater degree than already indicated in the information provided above).
e. Disclosures Relating to Credit Risk
Generally, credit risk is the risk that an issuer of an investment will not fulfill its obligation to the holder of the investment. This is measured by the assignment of a rating by a nationally recognized statistical rating organization. Presented below is the minimum rating required by (where applicable) the California Government Code, the City’s investment policy, or debt agreements, and the actual rating as of fiscal year end for each investment type.
Investment Type Amount Not RatedState Investment Pool 38,094,459$ N/A 38,094,459$ Money Market Funds 172,087 N/A 172,087 Held by Bond Trustees: Money Market Funds 1,334,589 N/A 1,334,589
Certificates of Deposit 257,297 N/A 257,297 Total 39,858,432$ 39,858,432$
Rating as of Fiscal Year End
Minimum Legal Raring
45

CITY OF DINUBA NOTES TO BASIC FINANCIAL STATEMENTS (CONTINUED) JUNE 30, 2021
Note 3: Cash and Investments (Continued)
The investment policy of the City contains limitations on the amount that can be invested in any one issuer. There are no investments in any one issuer (other than U.S. Treasury securities, mutual funds, and external investment pools) that represent 5% or more of total City investments.
f. Custodial Credit Risk
Custodial credit risk for deposits is the risk that, in the event of the failure of a depository financial institution, a government will not be able to recover its deposits or will not be able to recover collateral securities that are in the possession of an outside party. The custodial credit risk for investments is the risk that, in the event of the failure of the counterparty (e.g. broker- dealer) to a transaction, a government will not be able to recover the value of its investment or collateral securities that are in the possession of another party. The California Government Code and the City’s investment policy do not contain legal or policy requirements that would limit the exposure to custodial credit risk for deposits or investments. The California Government Code requires that a financial institution secure deposits made by state or local governmental units by pledging securities in an undivided collateral pool held by a depository regulated under state law (unless so waived by the government unit). The fair value of the pledged securities in the collateral pool must equal at least 110% of the total amount deposited by the public agencies. California law also allows financial institutions to secure City deposits by pledging first trust deed mortgage notes having a value of 150% of the secured public deposits. As of June 30, 2021, all of the City’s deposits with financial institutions in excess of federal depository insurance limits were held in collateralized accounts. As of June 30, 2021, City investments in the following investment types were held by the same broker-dealer (counterparty) that was used by the City to buy the securities:
Reported Amount
257,297$ 1,506,676
Investment TypeCertificates of DepositMoney Market Funds
g. Investment in State Investment Pool
The City is a voluntary participant in the Local Agency Investment Fund (LAIF) that is regulated by the California Government Code under the oversight of the Treasurer of the State of California. The fair value of the City’s investment in this pool is reported in the accompanying financial statements at amounts based upon the City’s pro-rata share of the fair value provided by LAIF for the entire LAIF portfolio (in relation to the amortized cost of that portfolio). The balance available for withdrawal is based on the accounting records maintained by LAIF, which are recorded on an amortized cost basis.
h. Fair Value Measurements The City categorizes its fair value measurements within the fair value hierarchy establish by generally accepted accounting principles. These principles recognize a three tiered fair value hierarchy as follows: Level 1 – Investments reflect prices quoted in active markets; Level 2 – Investments reflect prices that are based on similar observable asset either directly or indirectly, which may include inputs in markets that are not considered active; and Level 3 – Investments reflect prices based upon unobservable sources. The City has marketable securities that are measured with recurring fair value measurements as of June 30, 2021 and are valued using quoted market prices (level 1 inputs).
46

CITY OF DINUBA NOTES TO BASIC FINANCIAL STATEMENTS (CONTINUED) JUNE 30, 2021
Note 4: Notes and Loans Receivable
Notes receivable as of June 30, 2021, totaled $25,512,006 and were recorded as follows:
Special Revenue Funds 25,508,836$ Enterprise Funds 3,170
Total Notes and Loans Receivables 25,512,006$
Notes and loans receivable by type are:
Home Loan Rehabilitation Program loans to assist low incomeresidents to afford safe and sanitary housing, includingimprovements to the housing; non-interest bearing to 10 percentinterest; principal and interest generally due at maturity or changeof home ownership; secured by deeds of trust; proceeds are paiddirectly to the builder and a receivable is recorded from the homepurchaser. 13,859,332$
HOME program funds were used to loan to a developer for theconstruction of an affordable Senior housing complex. 3,100,000
Promissory notes from developers for the acquisition anddevelopment of property for housing projects within the City;interest rates from 3% to 4.81%; terms of the notes are thirty toforty years; notes secured by deeds of trust. 8,552,674
Totals 25,512,006$
Note 5: Accounts Receivable
The following is a list of accounts receivable at June 30, 2021:
Receivable Allowance NetGovernmental Activities -
Due from other governments 8,615,059$ -$ 8,615,059$ Accounts 561,046 - 561,046
9,176,105$ -$ 9,176,105$ Business-type Activities -
Due from other governments 1,894,512$ -$ 1,894,512$ Accounts 4,324,203 952,160 3,372,043
6,218,715$ 952,160$ 5,266,555$
47

CITY OF DINUBA NOTES TO BASIC FINANCIAL STATEMENTS (CONTINUED) JUNE 30, 2021
Note 6: Interfund Transactions
a. Current Interfund Balances Current interfund balances arise in the normal course of business and are expected to be repaid shortly after the end of the fiscal year. These balances normally represent loans to cover temporary shortages of cash in individual funds. The following presents a summary of current interfund balances at June 30, 2021:
Amount Due From Fund AmountGeneral Fund 1,674,947$ HUD Grants 1,674,947$ General Fund 546,166 Non-Major Governmental Funds 546,166 General Fund 308,546 Other Enterprise Fund 308,546
Total 2,529,659$ Total 2,529,659$
Due to Fund
b. Long-term Interfund Advances
At June 30, 2021, the funds below have made/received advances that were not expected to be repaid within one year:
Amount AmountMajor Fund: Major Fund:
General 1,031,663$ General 1,496,405$ Major Proprietary Fund: Housing Authority 116,904
Golf Course 1,589,075 Major Proprietary Fund:Non-Major Governmental Funds 316,904 Disposal 200,000
Non-Major Governmental Funds 1,124,333
Total 2,937,642$ Total 2,937,642$
Payable Fund Receivable Fund
Advances will be repaid to the advancing fund when revenue in the receiving fund is adequate. These usually occur as impact fees, operating, fees, tax revenues, or sales of property occur.
48

CITY OF DINUBA NOTES TO BASIC FINANCIAL STATEMENTS (CONTINUED) JUNE 30, 2021
Note 6: Interfund Transactions (Continued)
c. Transfers Between Funds
With Council approval, resources may be transferred from one City fund to another. The purpose of the majority of transfers is to cover operating costs and fund capital projects, less often, an equity transfers may be made to open or close a fund.
Amount AmountMajor Governmental: Major Governmental:
General 123,524$ General 1,343,131$ HUD Grants 1,115,154 HUD Grants 63,524 Transportation Construction 604,951 Major Enterprise:
Major Enterprise: Water 1,151,304 Water 925,035 Sewer 1,341,796 Sewer 833,860 Disposal 25,691
Internal Service Funds 60,964 Ambulance 102,236 Non-major Governmental Funds 2,778,410 Other Enterprise Funds 11,480
Internal Service Funds 10,808 Non-major Governmental Funds 2,391,928
6,441,898$ 6,441,898$
Transfers In Transfers Out
Note 7: Compensated Absences
The following is a summary of changes in the City’s compensated absences for the fiscal year ended June 30, 2021:
Balance June 30, 2020 Additions Reductions
Balance June 30, 2021
Current Portion
Governmental activities 1,123,369$ 942,565$ 1,021,493$ 1,044,441$ 224,645$ Business-type activities 207,013 289,042 279,904 216,151 57,054
Total 1,330,382$ 1,231,607$ 1,301,397$ 1,260,592$ 281,699$
Compensated absences in governmental activities have been liquidated in the past fiscal year in the general fund, the gas tax, transportation, public safety sales tax and community enhancement grant, (Special Revenue Funds) and general construction, vocational center, and public works management (Capital Projects funds).
49

CITY OF DINUBA NOTES TO BASIC FINANCIAL STATEMENTS (CONTINUED) JUNE 30, 2021
Note 8: Capital Assets
a. Governmental Activities Capital asset governmental activity for the fiscal year ended June 30, 2021 was as follows:
Balance at July 1, 2020 Additions Deletions
Balance at June 30, 2021
Capital Assets not being depreciated:Land 105,978,954$ -$ -$ 105,978,954$ Artwork 68,641 - - 68,641 Right of way s/easements 6,715,256 731,190 - 7,446,446 Construction in progress 355,354 6,742,008 - 7,097,362
Total 113,118,205 7,473,198 - 120,591,403
Capital Assets being depreciated:Buildings 21,010,879 - - 21,010,879 Improvements other than buildings 3,070,681 821,443 - 3,892,124 Equipment and machinery 8,428,920 377,252 394,276 8,411,896 Infrastructure 81,153,087 7,470,642 87,052 88,536,677
Total 113,663,567 8,669,337 481,328 121,851,576
Less accumulated depreciation for:Buildings (5,859,900) (350,035) - (6,209,935) Improvements other than buildings (2,811,729) (465,365) - (3,277,094) Equipment and machinery (8,618,454) (435,922) 82,266 (8,972,110) Infrastructure (29,498,402) (2,124,853) 62,946 (31,560,309)
Total (46,788,485) (3,376,175) 145,212 (50,019,448)
Total, net of accumulated depreciation 66,875,082 5,293,162 336,116 71,832,128
Total Capital Assets, Net 179,993,287$ 12,766,360$ 336,116$ 192,423,531$
Depreciation expense was charged to functions/programs of the City’s governmental activities as follows:
General Government 668,405$ Public Safety 668,405 Community Development 668,404 Parks & Rec 668,404 Public Works 668,404 Internal Service Funds 34,153
Total 3,376,175$
50

CITY OF DINUBA NOTES TO BASIC FINANCIAL STATEMENTS (CONTINUED) JUNE 30, 2021
Note 8: Capital Assets (Continued)
b. Business-type Activities
Capital asset business-type activity for the fiscal year ended June 30, 2021, was as follows:
Balance at July 1, 2020 Additions Deletions
Balance at June 30, 2021
Water Fund:Capital Assets not being depreciated:
Land 261,806$ -$ -$ 261,806$ Total capital assets not being depreciated 261,806 - - 261,806
Capital Assets being depreciated:Infrastructure 21,233,240 776,295 - 22,009,535 Buildings and improvements 4,852,279 - - 4,852,279 Equipment and machinery 1,168,628 22,888 53,608 1,137,908
Total capital assets being depreciated 27,254,147 799,183 53,608 27,999,722
Less accumulated depreciation for:Infrastructure (6,854,572) (353,620) - (7,208,192) Buildings and improvements (2,556,014) (161,589) - (2,717,603) Equipment and machinery (576,278) (108,733) 34,918 (650,093)
Total accumulated depreciation (9,986,864) (623,942) 34,918 (10,575,888) Total capital assets being depreciated, net 17,267,283 175,241 18,690 17,423,834
Water Fund Capital Assets, net 17,529,089$ 175,241$ 18,690$ 17,685,640$
Sewer Fund:Capital Assets not being depreciated:
Land 4,388,142$ -$ -$ 4,388,142$ Total capital assets not being depreciated 4,388,142 - - 4,388,142
Capital Assets being depreciated:Infrastructure 19,751,275 687,075 - 20,438,350 Buildings and improvements 4,403,718 - - 4,403,718 Equipment and machinery 660,448 124,339 27,150 757,637
Total capital assets being depreciated 24,815,441 811,414 27,150 25,599,705
Less accumulated depreciation for:Infrastructure (4,792,469) (358,090) - (5,150,559) Buildings and improvements (2,391,145) (124,747) - (2,515,892) Equipment and machinery (579,877) (33,179) (3,847) (609,209)
Total accumulated depreciation (7,763,491) (516,016) (3,847) (8,275,660) Total capital assets being depreciated, net 17,051,950 295,398 23,303 17,324,045
Sewer Fund Capital Assets, net 21,440,092$ 295,398$ 23,303$ 21,712,187$
Disposal Fund:Capital Assets being depreciated:
Equipment and machinery 693,114$ 7,620$ -$ 700,734$
Less accumulated depreciation for:Equipment and machinery (440,176) (50,032) - (490,208)
Disposal Fund Capital Assets, net 252,938$ (42,412)$ -$ 210,526$
51

CITY OF DINUBA NOTES TO BASIC FINANCIAL STATEMENTS (CONTINUED) JUNE 30, 2021
Note 8: Capital Assets (Continued)
Balance at July 1, 2020 Additions Deletions
Balance at June 30, 2021
Ambulance Fund:Capital Assets being depreciated:
Equipment and machinery 1,377,355$ 220,752$ 202,963$ 1,395,144$
Less accumulated depreciation for:Equipment and machinery (913,461) (177,215) (202,963) (887,713)
Ambulance Fund Capital Assets, net 463,894$ 43,537$ -$ 507,431$
Golf Course Fund:Capital Assets not being depreciated:
Land 3,101,766$ -$ -$ 3,101,766$ Total capital assets not being depreciated 3,101,766 - 3,101,766
Capital Assets being depreciated:Infrastructure 6,530,587 - - 6,530,587 Buildings and improvements 20,878,871 - - 20,878,871 Equipment and machinery 1,062,361 425,154 991,623 495,892
Total capital assets being depreciated 28,471,819 425,154 991,623 27,905,350
Less accumulated depreciation for:Infrastructure (2,639,585) - - (2,639,585) Buildings and improvements (8,240,143) (693,605) - (8,933,748) Equipment and machinery (880,838) (60,047) (869,052) (71,833)
Total accumulated depreciation (11,760,566) (753,652) (869,052) (11,645,166) Total capital assets being depreciated, net 16,711,253 (328,498) 122,571 16,260,184
Golf Course Fund Capital Assets, net 19,813,019$ (328,498)$ 122,571$ 19,361,950$
Other Enterprise Funds:Capital Assets being depreciated:
Buildings and improvements 4,638,847$ 61,672$ -$ 4,700,519$ Equipment and machinery 1,845,757 150,599 405,357 1,590,999
Total capital assets being depreciated 6,484,604 212,271 405,357 6,291,518
Less accumulated depreciation for:Buildings and improvements (1,394,375) (159,251) - (1,553,626) Equipment and machinery (1,480,565) (141,828) (167,397) (1,454,996)
Total accumulated depreciation (2,874,940) (301,079) (167,397) (3,008,622) Total capital assets being depreciated, net 3,609,664 (88,808) 237,960 3,282,896
Other Enterprise Funds Capital Assets, net 3,609,664$ (88,808)$ 237,960$ 3,282,896$
Total Business-type Capital Assets, net 63,108,696$ 54,458$ 402,524$ 62,760,630$ Depreciation expense was charged to functions/programs of the City’s business-type activities as follows:
Business-Type ActivitiesWater 623,942$ Sewer 516,016 Disposal 50,032 Ambulance 177,215 Golf 753,652 Other Enterprise Funds 301,079
Total 2,421,936$
52

CITY OF DINUBA NOTES TO BASIC FINANCIAL STATEMENTS (CONTINUED) JUNE 30, 2021
Note 9: Long-Term Liabilities
The following is a summary of changes in the City’s long-term liabilities for the fiscal year ended June 30, 2021:
Balance at
July 1, 2020 Additions ReductionsBalance at
June 30, 2021Due Within One Year
Governmental Activities:
Direct Borrowings:Capital leases payable 9,518,983$ 197,476$ (560,479)$ 9,155,980$ 464,890$
Public Offerings:Lease revenue bonds payable 14,810,000 - (850,000) 13,960,000 895,000 Original issue discount (221,301) - 12,090 (209,211) - Original issue premium 153,653 - (8,398) 145,255 -
Total Governmental Activities 24,261,335$ 197,476$ (1,406,787)$ 23,052,024$ 1,359,890$
Business-type Activities:
Direct Borrowings:Capital leases payable 415,111$ 481,878$ (180,184)$ 716,805$ 184,680$ Water notes payable 4,284,949 - (447,966) 3,836,983 459,953
Public Offerings:Revenue bonds 6,685,000 - (420,000) 6,265,000 430,000 Original issue premium 39,359 - (2,150) 37,209 -
Private Placement:Revenue bonds 2,360,000 - (107,000) 2,253,000 106,000
Total Business-type Activities 13,784,419$ 481,878$ (1,157,300)$ 13,108,997$ 1,180,633$
a. Governmental Activities – Lease Revenue Bonds (Public Offerings)
2012 DFA Lease Revenue Bonds Payable. On November 7, 2012, the Dinuba Financing Authority issued $11,270,000 of 2012 Lease Revenue Refunding Bonds. The proceeds of the bonds were used to refund the 2002 Lease Revenue Bonds in the amount of $6,430,000, refund the $3,825,000 remaining balance of the 2010 Lease Revenue Notes issued by the Redevelopment Agency, fund a reserve account, and pay costs of issuance. The bonds consist of $5,285,000 of serial bonds with maturity dates from September 1, 2014 through 2024. Interest rates vary between 2.0%-3.0% with semi-annual payments due each March 1 and September 1. There are also $4,650,000 of term bonds due September 1, 2032 and $1,335,000 term bonds due September 1, 2038, which carry interest rates of 3.75% and 4.00%, respectively. The principal balance outstanding on the 2012 bonds as of June 30, 2021 was $7,880,000. The refunding of the 2002 bonds resulted in a cash savings over the repayment period of $690,097 and an economic gain of $481,729. The refunding of the 2010 bonds resulted in a cash deficit of $2,361,946 as the 2010 bonds were due in 2017 whereas the 2012 bonds are due through 2038. 2012 DFA Lease Revenue Refunding Bonds Payable. On September 20, 2012, the Dinuba Financing Authority issued $1,500,000 of Lease Revenue Bonds. The proceeds of these bonds are to be used for financing and refinancing the purchase of certain land parcels within the City and pay costs of issuance. The bonds carry interest at 3.0%, interest is paid semi-annually each March 1 and September 1. Principal is due each September 1 through 2022. The outstanding balance of the 2012 Lease Revenue Bonds as of June 30, 2021 was $400,000.
53

CITY OF DINUBA NOTES TO BASIC FINANCIAL STATEMENTS (CONTINUED) JUNE 30, 2021
Note 9: Long-Term Liabilities (Continued) 2016 DFA Lease Revenue Refunding Bonds Payable. On October 12, 2016, the Dinuba Financing Authority issued $6,580,000 of 2016 Lease Revenue Refunding Bonds. The proceeds of the bonds were used to refund the 2007 Lease Revenue Bonds in the amount of $6,255,000 and pay costs of issuance. The bonds consist of $6,580,000 of serial bonds with maturity dates from September 1, 2018 through 2038. Interest rates vary between 2.0%-4.0% with semi-annual payments due each March 1 and September 1. The refunding of the 2007 bonds resulted in a cash savings over the repayment period of $1,529,810 and an economic loss of $296,346. The principal balance outstanding on the 2016 bonds as of June 30, 2021 was $5,680,000.
b. Governmental Activities – Capital Leases Payable (Direct Borrowings)
On July 1, 2015, the City entered into a Site and Facility Lease with Compass Bank. The City determined it was necessary and desirable to repay a loan to the Successor Agency to the Dinuba Redevelopment Agency. The City will lease real property and improvements consisting of the Dinuba Transit Center to Compass in consideration for Compass’s paying the City the sum of not to exceed $1,300,000 in advance rental. Compass bank will then lease the site and facility back to the City at an interest rate not to exceed 5.25%. The site and facility lease will commence on July 1, 2015 and shall end on May 25, 2030. The outstanding principal balance of this lease at June 30, 2021 is $933,941. On December 1, 2013, the City entered into a lease purchase agreement with the Dinuba Financing Authority and Western Alliance Bank in the amount of $8,433,377. The lease was executed to finance the costs associated with the acquisition, construction, and installation of solar energy improvements to City facilities. The funds are to be deposited into a project fund ($8,146,742), a capitalized interest fund ($176,785) and a delivery costs fund ($109,850). Lease payments are made semi-annually on June 12 and December 12. Interest is 4.1925%. The lease term matures on December 12, 2033. The City has the right to prepay the lease at any time. The outstanding balance as of June 30, 2021 is $7,777,353. On July 1, 2016, the City entered into an agreement with Ray Morgan Company (RMC) for the purpose leasing a City Hall copy machine in the amount of $159,000. The monthly payments begin July 1, 2016 with a final maturity date of June 1, 2021. On May 17, 2021, the City re-entered into an agreement with RMC for the purpose leasing a City Hall copy machine in the amount of $98,265. The agreement has no stated interest rate and the monthly payments are $2,075. Payments are split between the governmental and business-type funds. The outstanding balance of the lease obligation as of June 30, 2021 related to the governmental funds was $97,037. On October 15, 2015, the City entered into an agreement with US Bank Equipment Finance for the purpose of leasing multiple copiers for the Police Department in the amount of $52,140. The monthly payments begin October 15, 2015 with a final maturity date of October 15, 2020. On June 6, 2019, the City re-entered into an agreement with US Bank Equipment Finance for the purpose of leasing multiple copiers for the Police Department in the amount of $50,160. The monthly payments begin June 2019 with a final maturity date of May 2024. The agreement has no stated interest rate and the monthly payments are $869 and $836, respectively. The outstanding balance of the lease obligation as of June 30, 2021 was $29,260.
54

CITY OF DINUBA NOTES TO BASIC FINANCIAL STATEMENTS (CONTINUED) JUNE 30, 2021
Note 9: Long-Term Liabilities (Continued)
On July 1, 2016, the City entered into an agreement with Ray Morgan Company (RMC) for the purpose leasing a Public Works copy machine in the amount of $50,190. The monthly payments begin July 1, 2016 with a final maturity date of June 1, 2021. On May 18, 2021, the City re-entered into an agreement with RMC for the purpose leasing a Public Works copy machine in the amount of $8,127. The agreement has no stated interest rate and the monthly payments are $645. Payments are split between the governmental and business-type funds. The outstanding balance of the lease obligation as of June 30, 2021 related to the governmental funds was $8,127. On June 26, 2018, the City entered into an agreement with Enterprise Car Trust for the purpose of leasing thirteen 2019 Ram 1500 Classics in the amount of $354,082; of which $147,203 relates to governmental activities. The interest rate is 1.35% and the monthly payments are $5,270. The outstanding balance of the lease obligations as of June 30, 2021 was $73,713.
On April 14, 2020, the City entered into an agreement with John Deere Financial for the purpose of leasing a 2017 John Deere Tractor, 2019 John Deere Loader, 2019 Frontier Rotary Tiller and 2019 Frontier CAT 1 Box Blade. The interest rate is 4.20% and the monthly payments are $8,030. The outstanding balance of the lease obligations as of June 30, 2021 was $15,085.
On June 26, 2019. The City entered into an agreement with Ray Morgan Company (RMC) for the purpose of leasing a Lanier copy machine for the Fire Department in the amount of $5,880. The first monthly payment was made in June 2019. The monthly payments are $98. The outstanding balance of the lease obligations as of June 30, 2021 was $3,430. On September 25, 2019, the City entered into an agreement with Dell Financial Services for the purpose of providing services, software and hardware in the amount of $160,114. The first payment was due November 1, 2019. The agreement has an interest rate of 4.13% and the monthly payments are $2,948. The outstanding balance of the lease obligation as of June 30, 2021 was $108,014. On December 1, 2019, the City entered into an agreement with Enterprise to lease 3 vehicles for the Police Department in the amount of $55,472. The first monthly payment was made in January 2020. The monthly payments are $2,616. Subsequently on August 14, 2020, the City entered into an additional agreement with Enterprise to lease 2 vehicles for the Police Department. The monthly payments are $1,611. The outstanding balance of the lease obligations as of June 30, 2021 was $96,250. On August 3, 2020, the City entered into an agreement with Image 200 to lease a copier for the Fire Department in the amount of $16,200. The first monthly payment was made in October 2020. The monthly payments are $270. The outstanding balance of the lease obligations as of June 30, 2021 was $13,770.
55

CITY OF DINUBA NOTES TO BASIC FINANCIAL STATEMENTS (CONTINUED) JUNE 30, 2021
Note 9: Long-Term Liabilities (Continued)
c. Long-Term Debt Amortization – Governmental Activities
The annual requirements to amortize long-term debt outstanding at June 30, 2021 (other than compensated absences) are as follows:
Fiscal Year Ended June 30, Principal Interest Total
2022 455,000$ 277,800$ 732,800$ 2023 470,000 263,925 733,925 2024 475,000 249,750 724,750 2025 495,000 235,200 730,200 2026 510,000 218,212 728,212
2027-2031 2,845,000 784,969 3,629,969 2032-2036 1,925,000 279,031 2,204,031 2037-2039 705,000 43,100 748,100
7,880,000$ 2,351,987$ 10,231,987$
Fiscal Year Ended June 30, Principal Interest Total
2022 200,000$ 18,000$ 218,000$ 2023 200,000 6,000 206,000
400,000$ 24,000$ 424,000$
Fiscal Year Ended June 30, Principal Interest Total
2022 240,000$ 177,750$ 417,750$ 2023 240,000 170,550 410,550 2024 250,000 163,200 413,200 2025 260,000 154,250 414,250 2026 265,000 143,750 408,750
2027-2031 1,500,000 560,000 2,060,000 2032-2036 1,745,000 311,325 2,056,325 2037-2039 1,180,000 53,700 1,233,700
5,680,000$ 1,734,525$ 7,414,525$
2012 DFA Lease Revenue Refunding Bonds
2016 DFA Lease Revenue Refunding Bonds
2012 Lease Revenue Bonds
56

CITY OF DINUBA NOTES TO BASIC FINANCIAL STATEMENTS (CONTINUED) JUNE 30, 2021
Note 9: Long-Term Liabilities (Continued)
Fiscal Year Ended June 30, Principal Interest Total
2022 78,340$ 47,377$ 125,717$ 2023 82,452 43,266 125,718 2024 86,777 38,940 125,717 2025 91,331 34,386 125,717 2026 96,123 34,386 130,509
2027-2031 498,918 87,043 585,961 933,941$ 285,398$ 1,219,339$
Fiscal Year Ended June 30, Principal Interest Total
2022 257,476$ 323,395$ 580,871$ 2023 304,955 312,108 617,063 2024 356,286 298,790 655,076 2025 411,724 283,278 695,002 2026 471,541 283,278 754,819
2027-2031 3,429,293 1,093,975 4,523,268 2032-2034 2,546,078 298,919 2,844,997
7,777,353$ 2,893,743$ 10,671,096$
Fiscal Year Ended June 30, Principal Interest Total
2022 19,671$ -$ 19,671$ 2023 19,671 - 19,671 2024 19,671 - 19,671 2025 19,671 - 19,671 2026 18,353 - 18,353
97,037$ -$ 97,037$
Fiscal Year Ended June 30, Principal Interest Total
2022 3,240$ -$ 3,240$ 2023 3,240 - 3,240 2024 3,240 - 3,240 2025 3,240 - 3,240 2026 810 - 810
13,770$ -$ 13,770$
Solar Energy Lease
Site and Facility Lease
RMC City Hall Copier Lease
DeLage Fire Department
57

CITY OF DINUBA NOTES TO BASIC FINANCIAL STATEMENTS (CONTINUED) JUNE 30, 2021
Note 9: Long-Term Liabilities (Continued)
Fiscal Year Ended June 30, Principal Interest Total
2022 10,032$ -$ 10,032$ 2023 10,032 - 10,032 2024 9,196 - 9,196
29,260$ -$ 29,260$
Fiscal Year Ended June 30, Principal Interest Total
2022 1,625$ -$ 1,625$ 2023 1,625 - 1,625 2024 1,625 - 1,625 2025 1,625 - 1,625 2026 1,627 - 1,627
8,127$ -$ 8,127$
Fiscal Year Ended June 30, Principal Interest Total
2022 54,658$ 10,999$ 65,657$ 2023 54,658 10,999 65,657 2024 42,393 7,338 49,731 2025 18,254 1,192 19,446
169,963$ 30,528$ 200,491$
Fiscal Year Ended June 30, Principal Interest Total
2022 7,384$ 646$ 8,030$ 2023 7,701 330 8,031
15,085$ 976$ 16,061$
US Bank Police Department Copier Lease
RMC Public Works Copier Lease
Enterprise Car Leases
John Deere Tractor Scraper
58

CITY OF DINUBA NOTES TO BASIC FINANCIAL STATEMENTS (CONTINUED) JUNE 30, 2021
Note 9: Long-Term Liabilities (Continued)
Fiscal Year Ended June 30, Principal Interest Total
2022 1,176$ -$ 1,176$ 2023 1,176 - 1,176 2024 1,078 - 1,078
3,430$ -$ 3,430$
Fiscal Year Ended June 30, Principal Interest Total
2022 31,288$ 4,085$ 35,373$ 2023 32,605 2,768 35,373 2024 36,872 1,448 38,320 2025 7,249 110 7,359
108,014$ 8,411$ 116,425$
Fiscal Year Ended June 30, Principal Interest Total
2022 1,359,890$ 860,052$ 2,219,942$ 2023 1,428,115 809,946 2,238,061 2024 1,282,138 759,466 2,041,604 2025 1,308,094 708,416 2,016,510 2026 1,363,454 679,626 2,043,080
2027-2031 8,273,211 2,525,987 10,799,198 2032-2036 6,216,078 889,275 7,105,353 2037-2039 1,885,000 96,800 1,981,800
Subtotal 23,115,980 7,329,568$ 30,445,548$
(63,956)
23,052,024$
Total Governmental Activities
RMC Fire Department Copier Lease
Dell Financial Services
Grand Total Governmental Activities
Net Premium (Discount)
59

CITY OF DINUBA NOTES TO BASIC FINANCIAL STATEMENTS (CONTINUED) JUNE 30, 2021
Note 9: Long-Term Liabilities (Continued)
d. Business-Type Activities
Capital Leases (Direct Borrowings) On April 29, 2016, the City entered into an agreement with PNC Equipment Finance, LLC (Lessor) for the purpose of financing the purchase of 5 Utility Vehicles in the amount of $58,746. The monthly payments begin December 5, 2016 with a final maturity date of December 5, 2020. On August 1, 2017 entered into an additional agreement with PNC Equipment Finance LLC to finance the purchase of two additional Utility Vehicles in the amount of $15,558. The monthly payment began September 21, 2017 with a final maturity date of September 21, 2021. The agreements have no stated interest rates and the monthly payments are $1,224 and $324, respectively. The outstanding balance of the lease obligations as of June 30, 2021 was $326.
On June 26, 2018, the City entered into an agreement with Enterprise Car Trust for the purpose of leasing thirteen 2019 Ram 1500 Classics in the amount of $354,082; of which $206,879 relates to governmental activities. The interest rate is 1.35% and the monthly payments are $5,270. The outstanding balance of the lease obligations as of June 30, 2021 was $99,278. On October 19, 2018, the City entered into an agreement with Xio, Inc. for the purpose of leasing a Cloud SCADA water control system in the amount of $61,912 with a final maturity date of October 2021. The monthly payments are $1,968 including interest. The outstanding balance of the lease obligation as of June 30, 2021 was $10,319. On July 1, 2016, the City entered into an agreement with Ray Morgan Company (RMC) for the purpose leasing a City Hall copy machine in the amount of $159,000. The monthly payments begin July 1, 2016 with a final maturity date of June 1, 2021. On May 17, 2021, the City re-entered into an agreement with RMC for the purpose leasing a City Hall copy machine in the amount of $26,150. The agreement has no stated interest rate and the monthly payments are $2,075. Payments are split between the governmental and business-type funds. The outstanding balance of the lease obligation as of June 30, 2021 related to the business-type funds was $26,150. On July 1, 2016, the City entered into an agreement with Ray Morgan Company (RMC) for the purpose leasing a Public Works copy machine in the amount of $50,190. The monthly payments begin July 1, 2016 with a final maturity date of June 1, 2021. On May 18, 2021, the City re-entered into an agreement with RMC for the purpose leasing a Public Works copy machine in the amount of $30,574. The agreement has no stated interest rate and the monthly payments are $645. Payments are split between the governmental and business-type funds. The outstanding balance of the lease obligation as of June 30, 2021 related to the business-type funds was $30,574. On December 1, 2019, the City entered into an agreement with Leasing 2, Inc for the purpose of leasing a PipeHunter VacHunter excavator in the amount of $174,830. The first payment was due June 1, 2020. The agreement has an interest rate of 3.77%. The outstanding balance of the lease obligation as of June 30, 2021 was $127,099.
60

CITY OF DINUBA NOTES TO BASIC FINANCIAL STATEMENTS (CONTINUED) JUNE 30, 2021
Note 9: Long-Term Liabilities (Continued) On March 16, 2020, the City entered into an agreement with RJMS Corporation for the purpose of leasing a Toyota Madvac Litter Vacuum in the amount of $50,332. The first payment was due April 8, 2020. The agreement has a total finance charge of $7,312. The outstanding balance of the lease obligation as of June 30, 2021 was $39,918. On September 18, 2020, the City entered into an agreement with PNC Equipment Finance, LLC (Lessor) for the purpose of financing the purchase of 75 Golf Carts in the amount of $280,512. The monthly payments begin January 1, 2021 with a final maturity date of January 1, 2025. The agreement has no stated interest rate and the monthly payments are $5,844. The outstanding balance of the lease obligation as of June 30, 2021 was $245,446. On February 1, 2021, the City entered into an agreement with PNC Equipment Finance, LLC (Lessor) for the purpose of financing the purchase of utility equipment in the amount of $144,642. The monthly payments begin March 1, 2021 with a final maturity date of March 1, 2026. The agreement has interest rate of 5.017% and the monthly payments are $2,331. The outstanding balance of the lease obligation as of June 30, 2021 was $137,695. 2012 Wastewater Revenue Refunding Bonds (Public Offering) On November 7, 2012, the City issued $8,145,000 of Series 2012 Wastewater Revenue Refunding Bonds. The bonds were issued to refund $3,005,000 of outstanding 1998A Refunding Certificates of Participation, $3,845,000 of outstanding 2008 Lease Revenue Bonds, fund a reserve fund, and pay the costs of issuance. These bonds will be payable from and secured by net revenues and certain funds and accounts of the City’s wastewater system. The bonds consist of $1,880,000 of service bonds at an interest rate of 2% and maturing between 2014 and 2020. The issue also includes $6,265,000 of term bonds with interest rates ranging from 2.50% to 5.00% and maturing between 2022 and 2038. Interest is payable semi-annually each March 1 and September 1. Principal is due annually each September 1. The outstanding principal balance of the bonds as of June 30, 2021 was $6,265,000 The City advance refunded the 1998A Refunding Certificates of Participation of the 2008 Lease Revenue Bonds to reduce its total debt service over the next 25 years by $416,788 and $869,754, respectively. These refunding’s also provided an economic gain of $311,941 and $561,370, respectively. 2019 Wastewater Revenue Refunding Bonds (Private Placement) On November 1, 2019, the City issued $2,360,000 of Series 2019 Wastewater Revenue Refunding Bonds. The bonds were issued to refund $2,430,000 of outstanding 2007 DFA Wastewater System Revenue Bonds and $110,777 of the proceeds is to pay the cost of issuance. These bonds will be payable from and secured by net revenues and certain funds and accounts of the City’s wastewater system. The bonds have an interest rate of 2.66% and maturing between 2020 and 2038. Interest is payable semi-annually each March 1 and September 1, commencing on March 1, 2020. Principal is due annually each September 1. The outstanding principal balance of the bonds as of June 30, 2021 was $2,253,000.
61

CITY OF DINUBA NOTES TO BASIC FINANCIAL STATEMENTS (CONTINUED) JUNE 30, 2021
Note 9: Long-Term Liabilities (Continued) Water Notes Payable (Direct Borrowing) The State of California Department of Water Resources granted a loan to the Water Fund of the City for construction of water facilities in the amount of $2,700,000. Of this amount, $1,924,399 was drawn down from the State. The note calls for semiannual payments of $54,710 including interest at 2.955% until January 2024. The balance at June 30, 2021 is $260,570. The State of California Department of Water Resources granted a loan to the Water Fund of the City for construction of water facilities in the amount of $7,462,450. Of this amount, $6,956,217 was drawn down from the State. The note calls for semiannual payments of $224,125 including interest at 2.60% until January 2029. The balance at June 30, 2021 is $3,576,413.
e. Long-Term Debt Amortization – Business-type Activities The annual requirements to amortize enterprise long-term debt outstanding at June 30, 2021 are as follows:
Fiscal Year Ended June 30, Principal Interest Total
2022 70,128$ -$ 70,128$ 2023 70,128 - 70,128 2024 70,128 - 70,128 2025 35,062 - 35,062
245,446$ -$ 245,446$
Fiscal Year Ended June 30, Principal Interest Total
2022 21,876$ 6,096$ 27,972$ 2023 22,656 5,316 27,972 2024 23,820 4,152 27,972 2025 25,042 2,930 27,972 2026 26,328 1,644 27,972 2027 18,299 349 18,648
138,021$ 20,487$ 158,508$
Golf Cart Lease
Utility Vehicle Leases
62

CITY OF DINUBA NOTES TO BASIC FINANCIAL STATEMENTS (CONTINUED) JUNE 30, 2021
Note 9: Long-Term Liabilities (Continued)
Fiscal Year Ended June 30, Principal Interest Total
2022 5,229$ -$ 5,229$ 2023 5,229 - 5,229 2024 5,229 - 5,229 2025 5,229 - 5,229 2026 5,234 - 5,234
26,150$ -$ 26,150$
Fiscal Year Ended June 30, Principal Interest Total
2022 6,115$ -$ 6,115$ 2023 6,115 - 6,115 2024 6,115 - 6,115 2025 6,115 - 6,115 2026 6,114 - 6,114
30,574$ -$ 30,574$
RMC City Hall Copier Lease
RMC Public Works Copier Lease
Fiscal Year Ended June 30, Principal Interest Total
2022 430,000$ 231,563$ 661,563$ 2023 440,000 220,688 660,688 2024 455,000 208,363 663,363 2025 470,000 194,488 664,488 2026 475,000 178,531 653,531
2027-2031 1,970,000 629,875 2,599,875 2032-2036 1,180,000 358,438 1,538,438 2037-2039 845,000 64,625 909,625
6,265,000$ 2,086,571$ 8,351,571$
2012 Lease Revenue Bonds
Fiscal Year Ended June 30, Principal Interest Total
2022 102,381$ 7,040$ 109,421$ 2023 105,445 3,976 109,421 2024 52,744 810 53,554
260,570$ 11,826$ 272,396$
1998 Water Note Payable
63

CITY OF DINUBA NOTES TO BASIC FINANCIAL STATEMENTS (CONTINUED) JUNE 30, 2021
Note 9: Long-Term Liabilities (Continued)
Fiscal Year Ended June 30, Principal Interest Total
2022 357,572$ 90,678$ 448,250$ 2023 366,930 81,320 448,250 2024 1,983,807 257,443 2,241,250 2025 868,104 28,396 896,500
3,576,413$ 457,837$ 4,034,250$
2005 Water Note Payable
Fiscal Year Ended June 30, Principal Interest Total
2022 38,793$ 12,476$ 51,269$ 2023 38,793 12,476 51,269 2024 21,692 7,719 29,411
99,278$ 32,671$ 131,949$
Fiscal Year Ended June 30, Principal Interest Total
2022 10,319$ 1,488$ 11,807$ 10,319$ 1,488$ 11,807$
Fiscal Year Ended June 30, Principal Interest Total
2022 23,573$ 4,795$ 28,368$ 2023 24,462 3,906 28,368 2024 25,385 2,983 28,368 2025 26,343 2,025 28,368 2026 27,336 1,031 28,367
127,099$ 14,740$ 141,839$
Enterpise Car Leases
SCADA Lease
Pipehunter Excavator
64

CITY OF DINUBA NOTES TO BASIC FINANCIAL STATEMENTS (CONTINUED) JUNE 30, 2021
Note 9: Long-Term Liabilities (Continued)
Fiscal Year Ended June 30, Principal Interest Total
2022 8,647$ 1,868$ 10,515$ 2023 9,107 1,405 10,512 2024 9,591 924 10,515 2025 12,573 382 12,955
39,918$ 4,579$ 44,497$
Fiscal Year Ended June 30, Principal Interest Total
2022 106,000$ 58,520$ 164,520$ 2023 110,000 55,647 165,647 2024 113,000 52,681 165,681 2025 116,000 49,636 165,636 2026 119,000 46,510 165,510
2027-2031 643,000 182,835 825,835 2032-2036 730,000 91,717 821,717 2037-2039 316,000 8,459 324,459
2,253,000$ 546,005$ 2,799,005$
Fiscal Year Ended June 30, Principal Interest Total
2022 1,180,633$ 414,524$ 1,595,157$ 2023 1,198,865 384,734 1,583,599 2024 2,766,511 535,075 3,301,586 2025 1,564,468 277,857 1,842,325 2026 659,012 227,716 886,728
2027-2031 2,631,299 813,069 3,444,368 2032-2036 1,910,000 450,155 2,360,155 2037-2039 1,161,000 73,084 1,234,084
Subtotal 13,071,788 3,176,214$ 16,248,002$
37,209
13,108,997$
Total Business-type Activities
Madvac Litter Vacuum
2019 Wastewater Refunding Bond
Net Premium (Discount)Grand Total Governmental
Activities
65

CITY OF DINUBA NOTES TO BASIC FINANCIAL STATEMENTS (CONTINUED) JUNE 30, 2021
Note 10: Pension Plan
Plan Description
All qualified permanent and probationary employees are eligible to participate in the City of Dinuba Miscellaneous & Safety cost-sharing multiple-employer defined benefit pension plan administered by the California Public Employees’ Retirement System (CalPERS). Benefit provisions under the Plan are established by State statute and Local Government resolution. CalPERS issues publicly available reports that include a full description of the pension plans regarding benefit provisions, assumptions and membership information that can be found on the CalPERS website.
Benefits Provided CalPERS provides service retirement and disability benefits, annual cost of living adjustments and death benefits to plan members, who must be public employees and beneficiaries. Benefits are based on years of credited service, equal to one year of full-time employment. Members with five years of total service are eligible to retire at age 50 with statutorily reduced benefits. All members are eligible for non-duty disability benefits after 10 years of service. The death benefit is one of the following: the Basic Death Benefit, the 1957 Survivor Benefit, or the Optional Settlement 2W Death Benefit. The cost of living adjustments for each plan are applied as specified by the Public Employees’ Retirement Law. The rate plan provisions and benefits in effect at June 30, 2021, are summarized as follows:
Tier 1* PEPRA
On or afterHire date January 1, 2013Benefit formula 2% @ 55 2% @ 62Benefit vesting schedule 5 years service 5 years serviceBenefit payments monthly for life monthly for lifeRetirement age minimum 50 yrs minimum 52 yrsMonthly benefits, as a % of eligible compensation 1.426% to 2.418% 1.0% to 2.5%Required employee contribution rates 7.000% 6.250%Required employer normal contribution rates 9.409% 6.842%Required employer UAL contributions $ 508,848 $ 4,355
Miscellaneous Cost-Sharing Rate Plans
Prior to January 1, 2013
66

CITY OF DINUBA NOTES TO BASIC FINANCIAL STATEMENTS (CONTINUED) JUNE 30, 2021
Note 10: Pension Plan (Continued)
Tier 1*PEPRAPolice
PEPRAFire
Hire dateBenefit formula 3% @ 55 2.7% @ 57 2.7% @ 57Benefit vesting schedule 5 years service 5 years service 5 years serviceBenefit payments monthly for life monthly for life monthly for lifeRetirement age minimum 50 yrs minimum 50 yrs minimum 50 yrsMonthly benefits, as a % of eligible compensation 2.4% to 3.0% 2.0% to 2.7% 2.0% to 2.7%Required employee contribution rates 9.000% 12.000% 12.000%Required employer contribution rates 16.704% 12.141% 12.141%Required employer UAL contributions $ 738,190 $ 1,954 $ 1,462
Safety Cost-Sharing Rate Plans
Prior to January 1, 2013
On or after January 1, 2013
On or after January 1, 2013
Contribution Description
Section 20814(c) of the California Public Employees’ Retirement Law (PERL) requires that the employer contribution rates for all public employers be determined on an annual basis by the actuary and shall be effective on the July 1 following notice of a change in the rate. The total plan contributions are determined through the CalPERS’ annual actuarial valuation process. For public agency cost-sharing plans covered by either the Miscellaneous or Safety risk pools, the Plan’s actuarially determined rate is based on the estimated amount necessary to pay the Plan’s allocated share of the risk pool’s costs of benefits earned by employees during the year, and any unfunded accrued liability. The employer is required to contribute the difference between the actuarially determined rate and the contribution rate of employees. For the year ended June 30, 2021, the employer contributions recognized as a reduction to the net pension liability for the Plan were $1,023,527 for Miscellaneous and $1,702,909 for Safety. Pension Liabilities, Pension Expense and Deferred Outflows and Deferred Inflows of Resources Related to Pensions
As of June 30, 2021, the City reported net pension liabilities for its proportionate shares of the net pension liability of the Plan as follows:
Miscellaneous Plan 9,846,994$ Safety Plan 12,415,460
Total Plan Net Pension Liability 22,262,454$
Proportionate Share of Net Pension Liability/(Asset)
The City’s net pension liability for the Plan is measured as the proportionate share of the net pension liability. The net pension liability of the Plan is measured as of June 30, 2020, and the total pension liability for the Plan used to calculate the net pension liability was determined by an actuarial valuation as of June 30, 2019 rolled forward to June 30, 2020, using standard
67

CITY OF DINUBA NOTES TO BASIC FINANCIAL STATEMENTS (CONTINUED) JUNE 30, 2021
Note 10: Pension Plan (Continued) update procedures. The City’s proportion of the net pension liability was based on a projection of the City’s long-term share of contributions to the pension plan relative to the projected contributions of all participating employers, actuarially determined. The City’s proportionate share of the net pension liability for the City’s Miscellaneous Rate Plan as of the June 30, 2019 and 2020 measurement dates were as follows:
Miscellaneous PlanProportion - June 30, 2019 0.20036%Proportion - June 30, 2020 0.20461%Change - Increase(Decrease) 0.00425%
The City’s proportionate share of the net pension liability for the City’s Safety Rate Plan as of June 30, 2019 and 2020 measurement dates were as follows:
Safety Plan Proportion - June 30, 2019 0.08889%Proportion - June 30, 2020 0.09050%Change - Increase(Decrease) 0.00161%
For the year ended June 30, 2021, the City recognized a total pension expense of $1,730,869 for the Miscellaneous Plan and $2,658,249 for the Safety Plan. At June 30, 2021, the City reported deferred outflows and deferred inflows of resources related to the Miscellaneous Plan as follows:
Deferred Outflows of Resources
Deferred Inflows of Resources
Pension contributions subsequent tomeasurement date 1,096,427$ -$ Change of Assumptions - 70,233 Difference between Expected and ActualExperiences 507,445 - Net Difference between Projected and ActualEarnings on Pension Plan Investments
292,521 - Adjustment due to differences in proportions 232,902 - Difference in proportionate share ofcontributions - 346,928
Total 2,129,295$ 417,161$
68

CITY OF DINUBA NOTES TO BASIC FINANCIAL STATEMENTS (CONTINUED) JUNE 30, 2021
Note 10: Pension Plan (Continued)
At June 30, 2021, the City reported deferred outflows and deferred inflows of resources related to the Safety Plan as follows:
Deferred Outflows of Resources
Deferred Inflows of Resources
Pension contributions subsequent to themeasurement date 1,842,579$ -$ Change of Assumptions - 41,356 Difference between Expected and ActualExperiences 962,757 - Net Difference between Projected and ActualEarnings on Pension Plan Investments
269,840 - Adjustment due to differences in proportions 151,097 8,070 Difference in proportionate share ofcontributions 185,036 -
Total 3,411,309$ 49,426$
The $1,096,427 for the Miscellaneous Plan and the $1,842,579 for the Safety Plan, reported as deferred outflows of resources related to contributions subsequent to the measurement date will be recognized as a reduction of the net pension liability in the year ended June 30, 2022. Other amounts reported as deferred outflows or deferred inflows of resources related to pensions will be recognized as pension expense as follows:
Fiscal Year Ended June 30:
Miscellaneous Plan Safety Plan Total
2022 44,831$ 476,024$ 520,855$ 2023 224,784 551,513 776,297 2024 205,792 356,563 562,355 2025 140,300 135,204 275,504
615,707$ 1,519,304$ 2,135,011$
Deferred Outflows/(Inflows) of Resources
69

CITY OF DINUBA NOTES TO BASIC FINANCIAL STATEMENTS (CONTINUED) JUNE 30, 2021
Note 10: Pension Plan (Continued) Actuarial Methods and Assumptions Used to Determine Total Pension Liability For the measurement period ended June 30, 2020, the total pension liability was determined by rolling forward the June 30, 2019 total pension liability. The June 30, 2019 and the June 30, 2020 total pension liabilities were based on the following actuarial methods and assumptions:
Actuarial Cost Method Entry Age Normal in accordance with the
requirements of GASB Statement No. 68
Discount Rate 7.15%Inflation 2.50%Salary Increases Varies by Entry Age and ServiceMortality Rate Table (1) Derived using CalPERS’ Membership Data
for all Funds Post Retirement Benefit Increase
Contract COLA up to 2.50% until Purchasing Power Protection Allowance Floor on Purchasing Power applies
Actuarial Assumptions
(1)The mortality table used was developed based on CalPERS-specific data. The table includes 15 years of mortality improvements using Society of Actuaries Scale 90% ofscale MP 2016. For more details on this table, please refer to the December 2017experience study report (based on CalPERS demographic data from 1997 to 2015) thatcan be found on the CalPERS website.
Discount Rate The discount rate used to measure the total pension liability for PERF C was 7.15%. The projection of cash flows used to determine the discount rate assumed that contributions from plan members will be made at the current member contribution rates and that contributions from employers will be made at statutorily required rates, actuarially determined. Based on those assumptions, the Plan’s fiduciary net position was projected to be available to make all projected future benefit payments of current plan members. Therefore, the long-term expected rate of return on plan investments was applied to all periods of projected benefit payments to determine the total pension liability. The long-term expected rate of return on pension plan investments was determined using a building-block method in which expected future real rates of return (expected returns, net of pension plan investment expense and inflation) are developed for each major asset class. In determining the long-term expected rate of return, CalPERS took into account both short-term and long-term market return expectations as well as the expected pension fund (PERF C) cash flows. Taking into account historical returns of all the Public Employees Retirement Funds’ asset classes (which includes the agent plan and two cost-sharing plans or PERF A, B, and C funds), expected compound (geometric) returns were calculated over the short-term (first 10 years) and the long-term (11+ years) using a building-block approach.
70

CITY OF DINUBA NOTES TO BASIC FINANCIAL STATEMENTS (CONTINUED) JUNE 30, 2021
Note 10: Pension Plan (Continued) Using the expected nominal returns for both short-term and long-term, the present value of benefits was calculated for each PERF C fund. The expected rate of return was set by calculating the single equivalent expected return that arrived at the same present value of benefits for cash flows as the one calculated using both short-term and long-term returns. The expected rate of return was then set equal to the single equivalent rate calculated above and rounded down to the nearest one quarter of one percent. The table below reflects long-term expected real rate of return by asset class. The rate of return was calculated using the capital market assumptions applied to determine the discount rate and asset allocation. The target allocation shown was adopted by the Board effective on July 1, 2014.
Asset ClassAssumed Asset
AllocationReal Return
Years 1 - 10 (1)Real Return Years 11+ (2)
Global Equity 50.00% 4.80% 5.98%Fixed Income 28.00% 1.00% 2.62%Inflation Assets 0.00% 0.77% 1.81%Private Equity 8.00% 6.30% 7.23%Real Assets 13.00% 3.75% 4.93%Liquidity 1.00% 0.00% -0.92%
(1) An expected inflation of 2.0% used for this period. (2) An expected inflation of 2.92% used for this period.
Sensitivity of the Proportionate Share of the Net Pension Liability to Changes in the Discount Rate The following presents the City’s proportionate share of the net pension liability for the Plan, calculated using the discount rate for the Plan, as well as what the City’s proportionate share of the net pension liability would be if it were calculated using a discount rate that is 1% point lower or 1% point higher than the current rate:
Discount Rate - 1% Current Discount Discount Rate +1%6.15% 7.15% 8.15%
Miscellaneous Plan 14,949,918$ 9,846,994$ 5,630,608$ Safety Plan 18,550,866 12,415,460 7,380,779
Total 33,500,784$ 22,262,454$ 13,011,387$
Plan
Proportionate Share of Net Pension Liability/(Asset)
Pension Plan Fiduciary Net Position Detailed information about the pension plan’s fiduciary net position is available in the separately issued CalPERS financial reports. See CalPERS website for additional information.
Note 11: Other Post-Employment Benefits (OPEB)
Description of the Plan The City sponsors and administers a single-employer health care plan (HC Plan) for its employees. The plan provides medical, dental and vision plan coverage. Medical coverage is provided through CalPERS under the Public Employees' Medical and Hospital Care Act (PEMHCA), also referred to as PERS Health. Children are eligible for coverage until age 26.
71

CITY OF DINUBA NOTES TO BASIC FINANCIAL STATEMENTS (CONTINUED) JUNE 30, 2021
Note 11: Other Post-Employment Benefits (OPEB) (Continued) As the City's OPEB benefits are administered by City personnel, no separate financial statements are issued.
The City participates in the CalPERS Health Program, a community-rated program for its medical coverage. Employees Covered
As of the June 30, 2019 actuarial valuation, the following current and former employees were covered by the benefit terms under the Plan: Active 114Inactive employees or beneficiaries currently receiving benefits 30
144
Contributions The HC Plan and its contribution requirements are established by Memoranda of Understanding with the applicable employee bargaining units and may be amended by agreements between the City and the bargaining units. The City is funding the benefits as a “Pay-as-you-go”, meaning the City only contributes the required benefits when due. Total contributions were $516,380, which include the City’s cash contributions of $383,380 and implied subsidy of $133,127. Total OPEB Liability The City’s Total OPEB liability was measured as of June 30, 2020 and the total OPEB liability used to calculate the total OPEB liability was determined by an actuarial valuation dated June 30, 2019, based on the following actuarial methods and assumptions: Actuarial Cost Method Entry Age Normal
Discount Rate 2.45% at June 30, 2020 Bond Buyer Index3.13% at June 30, 2019 Bond Buyer Index
Inflation 2.50%Salary Increase 3.00% per yearMortality* CalPERS 2017 Experience Study; Projected
with MacLeod Scale 2020Medical Trend 5.40% in 2021, fluctuating down 4% by 2076
*
Actuarial Assumptions
Demographic actuarial assumptions used in this valuation are based on the 2017experience study of the CalPERS using date from 1997 to 2015, except for a differentbasis used to project future mortality improvements. The representative mortality rateswere those published by CalPERS and adjusted to back out 15 years Scale MP 2016 tocentral year 2015.
Changes of Assumptions Discount rate changed from 3.13% as of June 30, 2019 to 2.45% as of June 30, 2020, based on the published change in return for the applicable municipal bond index.
72

CITY OF DINUBA NOTES TO BASIC FINANCIAL STATEMENTS (CONTINUED) JUNE 30, 2021
Note 11: Other Post-Employment Benefits (OPEB) (Continued)
Discount Rate The discount rate used to measure the total OPEB liability was 2.45 percent. The projection of cash flows used to determine the discount rate assumed that City contributions will be made at rates equal to the actuarially determined contribution rates. The City does not participate in a trust fiduciary fund.
Changes in the OPEB Liability The changes in the Total OPEB liability for the HC Plan are as follows:
Increase(Decrease) Total OPEB Liability
Balance at June 30, 2020 (measurement date 06/30/2019) 24,385,241$ Changes recognized over the measurement period:
Service Cost 1,040,926 Interest 787,756 Change of assumptions 3,237,466 Difference between expected and actual experience - Benefit payments (516,507)
Net Changes 4,549,641 Balance at June 30, 2021 (measurement date 06/30/2020) 28,934,882$
Sensitivity of the Total OPEB Liability to Changes in the Discount Rate The following presents the total OPEB liability of the City if it were calculated using a discount rate that is one percentage point lower or one percentage point higher than the current rate, for measurement period ended June 30, 2020:
1% Decrease (1.45%)
Current Discount Rate
(2.45%)1% Increase
(3.45%)Total Net OPEB Liability 34,812,362$ 28,934,882$ 24,349,715$
Sensitivity of the total OPEB Liability to Changes in the Health Care Cost Trend Rates The following presents the total OPEB liability of the City if it were calculated using health care cost trend rates that are one percentage point lower or one percentage point higher than the current rate, for measurement period ended June 30, 2020:
1% Decrease Current Healthcare Cost Trent Rates 1% Increase
Total Net OPEB Liability 23,770,213$ 28,934,882$ 35,757,221$
73
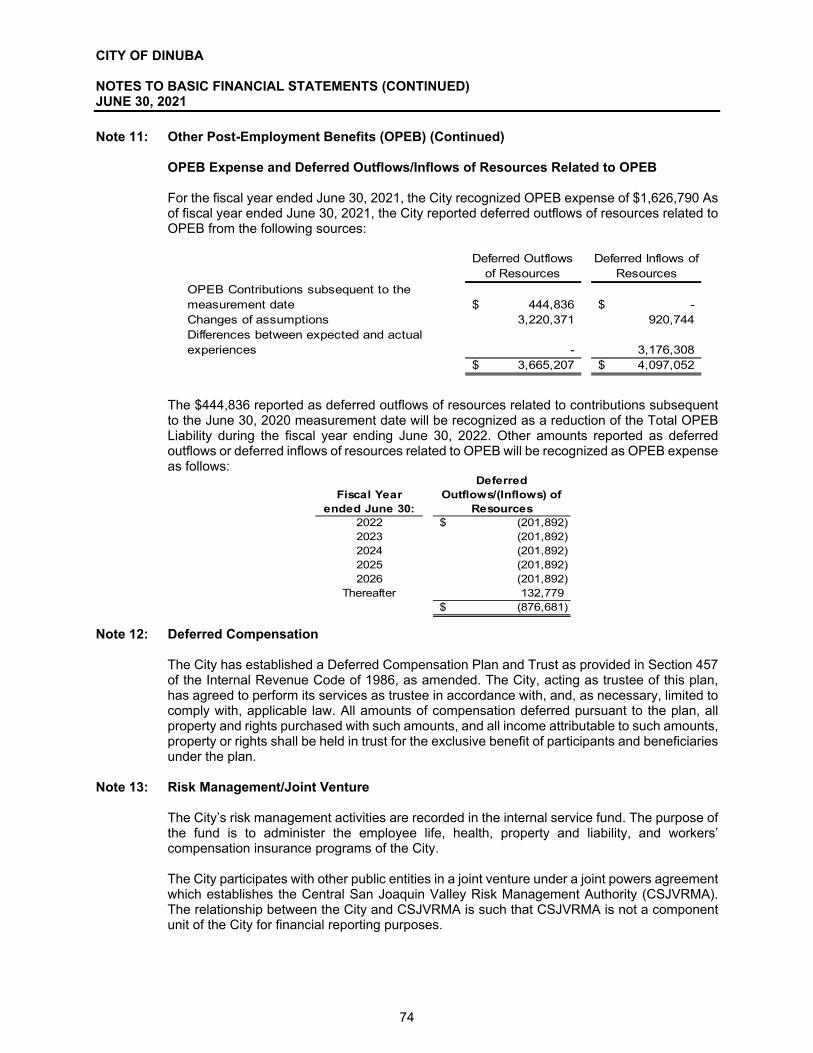
CITY OF DINUBA NOTES TO BASIC FINANCIAL STATEMENTS (CONTINUED) JUNE 30, 2021
Note 11: Other Post-Employment Benefits (OPEB) (Continued)
OPEB Expense and Deferred Outflows/Inflows of Resources Related to OPEB For the fiscal year ended June 30, 2021, the City recognized OPEB expense of $1,626,790 As of fiscal year ended June 30, 2021, the City reported deferred outflows of resources related to OPEB from the following sources:
Deferred Outflows of Resources
Deferred Inflows of Resources
OPEB Contributions subsequent to the measurement date 444,836$ -$ Changes of assumptions 3,220,371 920,744 Differences between expected and actual experiences - 3,176,308
3,665,207$ 4,097,052$
The $444,836 reported as deferred outflows of resources related to contributions subsequent to the June 30, 2020 measurement date will be recognized as a reduction of the Total OPEB Liability during the fiscal year ending June 30, 2022. Other amounts reported as deferred outflows or deferred inflows of resources related to OPEB will be recognized as OPEB expense as follows:
Fiscal Year ended June 30:
Deferred Outflows/(Inflows) of
Resources2022 (201,892)$ 2023 (201,892) 2024 (201,892) 2025 (201,892) 2026 (201,892)
Thereafter 132,779 (876,681)$
Note 12: Deferred Compensation
The City has established a Deferred Compensation Plan and Trust as provided in Section 457 of the Internal Revenue Code of 1986, as amended. The City, acting as trustee of this plan, has agreed to perform its services as trustee in accordance with, and, as necessary, limited to comply with, applicable law. All amounts of compensation deferred pursuant to the plan, all property and rights purchased with such amounts, and all income attributable to such amounts, property or rights shall be held in trust for the exclusive benefit of participants and beneficiaries under the plan.
Note 13: Risk Management/Joint Venture
The City’s risk management activities are recorded in the internal service fund. The purpose of the fund is to administer the employee life, health, property and liability, and workers’ compensation insurance programs of the City. The City participates with other public entities in a joint venture under a joint powers agreement which establishes the Central San Joaquin Valley Risk Management Authority (CSJVRMA). The relationship between the City and CSJVRMA is such that CSJVRMA is not a component unit of the City for financial reporting purposes.
74

CITY OF DINUBA NOTES TO BASIC FINANCIAL STATEMENTS (CONTINUED) JUNE 30, 2021
Note 13: Risk Management/Joint Venture (Continued)
The City is covered for the first $1,000,000 of each general liability claim and $500,000 of each worker’s compensation claim through the CSJVRMA. The City has the right to receive dividends or the obligation to pay assessments based on a formula which among other expenses, charges the City’s account for liability losses under $50,000 and workers’ compensation losses under $50,000. The CSJVRMA purchases excess reinsurance from $1,000,000 to $29,000,000. The CSJVRMA participates in an excess pool which provides Workers’ Compensation coverage from $500,000 to $1,500,000 and purchases excess reinsurance above $5,000,000 to the statutory limit. The CSJVRMA is a consortium of fifty-five (55) cities in San Joaquin Valley, California. It was established under the provisions of California Government Code Section 6500 et seq. The CSJVRMA is governed by a Board of Directors, which meets three times per year, consisting of one member appointed by each member city. The day-to-day business is handled by a management group employed by the CSJVRMA. The financial statements of CSJVRMA can be obtained at 1831 K Street, Sacramento, California 95814. The financial position and results of operations for the CSJVRMA as of June 30, 2021 are presented below:
Total Assets 150,621,596$
Total Liabilities 129,774,819$ Total Net Position 20,846,777
Total Liabilities and Net Position 150,621,596$
Revenues for Fiscal Year 55,391,674$ Expenses for Fiscal Year 54,309,239
Change in Position 1,082,435$
At the termination of the joint powers agreement and after all claims have been settled, any excess or deficit will be divided among the cities in accordance with its governing documents.
The City is self-insured for health insurance for its employees. Each department and division is charged an actuarially determined amount for health insurance expenses based on its employees. All claims are administered by an independent insurance processor; the City is responsible for reimbursing the company for all claims up to $50,000 per covered individual, with any expenses greater than that being covered by the insurance provider. The claims liability of $50,000 for health insurance at June 30, 2021 is based on the requirements of Governmental Accounting Standards Board Statement No. 10, which requires that a liability for claims be reported if information prior to the issuance of the financial statements indicates that it is probable that a liability has been incurred at the date of the financial statements and the amount of the loss can be reasonably estimated. The claims liability was estimated from the average amount of claims paid per lag reports provided by the administrator. Settlements have not exceeded coverages for each of the past three fiscal years.
75

CITY OF DINUBA NOTES TO BASIC FINANCIAL STATEMENTS (CONTINUED) JUNE 30, 2021
Note 13: Risk Management/Joint Venture (Continued)
Changes in health claim liabilities at June 30, 2021 and 2020, were as follows:
2021 2020Liability - beginning of fiscal year 50,000$ 50,000$
Current year claims and changes in estimates 2,307,754 2,755,157
Claim payments (2,307,754) (2,755,157)
Liability - end of fiscal year 50,000$ 50,000$
Note 14: Commitments
The City is committed to pay the local Chamber of commerce 40% of the annual business license fees collected. For the fiscal year ended June 30,2021 this amount is approximately $96,168. The budgeted amount for fiscal year June 30, 2022 is $97,390.
Note 15: Contingent Liabilities
Amounts received or receivable from grantor agencies are subject to audit and adjustment by grantor agencies, principally the federal government. Any disallowed claims, including amounts already collected, may constitute a liability of the applicable funds. The amount, if any, of expenditures that may be disallowed by the grantor cannot be determined at this time, although the government expects such amounts, if any, to be immaterial. The City is subject to various lawsuits and claims involving public liability and other actions incidental to the ordinary course of City operations. In the aggregate, those claims seek monetary damages in significant amounts. To the extent the outcome of such litigation may be determined to result in financial loss to the City, in the opinion of City management, any potential liability for these actions is adequately provided for in the basic financial statements. The timing of potential payment of such losses cannot presently be determined.
Note 16: Successor Agency Trust for Assets of the Former Redevelopment Agency (SADRA)
On December 29, 2011, the California Supreme Court upheld AB X1 26 that provides for the dissolution of all redevelopment agencies in the State of California. This action impacted the reporting entity of the City that previously had reported a redevelopment agency within the reporting entity of the City as a blended component unit. AB X1 26 provides that upon dissolution of a redevelopment agency, either the city or another unit of local government will agree to serve as the “successor agency” to hold the assets until they are distributed to other units of state and local government. The City Council elected to become the Successor Agency for the former redevelopment agency in accordance with AB X1 26. After enactment of the law, which occurred on June 28, 2011, redevelopment agencies in the State of California cannot enter into new projects, obligations or commitments. Subject to the control of a newly established oversight board, remaining assets can only be used to pay enforceable obligations in existence at the date of dissolution (including the completion of any unfinished projects that were subject to legally enforceable contractual commitments).
76

CITY OF DINUBA NOTES TO BASIC FINANCIAL STATEMENTS (CONTINUED) JUNE 30, 2021
Note 16: Successor Agency Trust for Assets of the Former Redevelopment Agency (SADRA) In future fiscal years, successor agencies will only be allocated revenue in the amount that is necessary to pay the estimated annual installment payments on enforceable obligations of the former redevelopment agency until all enforceable obligations of the prior redevelopment agency have been paid in full and all assets have been liquidated. AB X1 26 directs the State Controller of the State of California to review the propriety of any transfers of assets between redevelopment agencies and other public bodies that occurred after January 1, 2011. If the public body that received such transfers is not contractually committed to a third party for the expenditure or encumbrance of those assets, the State Controller is required to order the available assets to be transferred to the public body designated as the successor agency by AB X1 26. In accordance with the timeline set forth in the Bill (as modified by the California Supreme Court on December 29, 2011) all redevelopment agencies in the State of California were dissolved and ceased to operate as a legal entity as of February 1, 2012. Prior to that date, the final seven months of the activity of the redevelopment agency continued to be reported in the Low-Moderate Income Housing, Tax Allocation and Redevelopment Agency governmental funds of the City. After the date of dissolution, the assets and activities of the dissolved redevelopment agency are reported in a fiduciary fund (private-purpose trust fund) in the financial statements of the City. a. Capital Assets Held by SADRA
Balance July 1, 2020 Additions Deletions
Balance June 30, 2021
Capital assets, not depreciated:Land 2,730,606$ -$ -$ 2,730,606$
Total capital assets, not depreciated 2,730,606 - - 2,730,606
Capital assets, depreciated:Buildings and structures 167,848 - - 167,848
Total capital assets, depreciated 167,848 - - 167,848
Less accumulated depreciation for:Buildings and structures (117,303) (5,559) - (122,862)
Total accumulated depreciation (117,303) (5,559) - (122,862) Total capital assets, depreciated, net 50,545 (5,559) - 44,986 Total capital assets, net 2,781,151$ (5,559)$ -$ 2,775,592$
Depreciation expense for the fiscal year ended June 30, 2021 was $5,559.
b. Summary of SADRA’s Long-Term Debt
Balance
July 1, 2020 DeletionsBalance
June 30, 2021 Current PortionPublic Offerings:
Tax allocation bonds 44,030,000$ 1,520,000$ 42,510,000$ 1,505,000$ Original issue premium 1,250,511 84,878 1,165,633 N/AOriginal issue discount (33,805) (1,744) (32,061) N/A
Total long-term liabilities, net 45,246,706$ 1,603,134$ 43,643,572$ 1,505,000$
77

CITY OF DINUBA NOTES TO BASIC FINANCIAL STATEMENTS (CONTINUED) JUNE 30, 2021
Note 16: Successor Agency Trust for Assets of the Former Redevelopment Agency (SADRA) (Continued)
2012 Subordinate Tax Allocation Refunding Bonds. On December 6, 2012, SADRA issued $1,700,000 Subordinate Tax Allocation Refunding Bonds bearing interest of 2.0% to 4.25% payable semi-annually on March 1 and September 1 commencing March 1, 2014. The bonds mature annually at various amounts through September 2039. The bonds are payable from and secured by incremental tax revenues. Bonds outstanding as of June 30, 2021 were $1,335,000. The Bonds were issued to refinance the Agency’s previously issued $1,370,000, 2009 Tax Allocation Notes. As a result, the 2009 Tax Allocation Notes are considered to be defeased and the liability for those bonds have been removed from the long-term liabilities. The aggregate debt service payments of the new debt is $1,406,600 more than the old debt. After using funds remaining from the 2001 and 2003 issues, recognizing an original issue premium, paying costs of issuance, and paying an escrow agent for the refunding, the SADRA recognized a deferred loss on refunding in the amount of $495,141. 2014 Tax Allocation Refunding Bonds. On May 14, 2014, the Successor Agency to the Dinuba Redevelopment Agency issued $14,650,000 Tax Allocation Refunding Bonds bearing interest of 3% payable semi-annually on March 1 and September 1 commencing September 1, 2014. The bonds mature annually at various amounts through September 1, 2033. The bonds are payable from and secured by incremental tax revenues. Bonds outstanding as of June 30, 2021 were $11,400,000. The Bonds are being issued to refinance the outstanding amount ($9,630,000) of the Agency’s previously issued 2001 Tax Allocation Bonds and outstanding amount ($6,465,000) of the Agency’s 2003 Tax Allocation Bonds. As a result, the 2001 and 2003 Tax Allocation Bonds are considered to be defeased and the liability for those bonds have been removed from the long-term liabilities of the Private Purpose Trust Fund. 2015 Tax Allocation Refunding Bonds. On October 1, 2015, the Successor Agency to the Dinuba Redevelopment Agency issued $15,055,000 Tax Allocation Refunding Bonds bearing interest of 3% payable semi-annually on March 1 and September 1 commencing March 1, 2017. The bonds mature annually at various amounts through September 1, 2036. The bonds are payable from and secured by incremental tax revenues. Bonds outstanding as of June 30, 2021 were $12,385,000. The Bonds were issued to refinance the outstanding amount ($4,440,000) of the Agency’s previously issued 2005 Tax Allocation Refunding Bonds and outstanding amount ($11,375,000) of the Agency’s 2006 Tax Allocation Refunding Bonds. As a result, the 2005 Tax Allocation Refunding Bonds are considered to be defeased and the liability for the bonds have been removed from the long-term liabilities of the Private Purpose Trust Fund. As a result of this refunding, the SADRA recognized a deferred loss on refunding in the amount of $828,923.
78

CITY OF DINUBA NOTES TO BASIC FINANCIAL STATEMENTS (CONTINUED) JUNE 30, 2021
Note 16: Successor Agency Trust for Assets of the Former Redevelopment Agency (SADRA) (Continued)
2017 Tax Allocation Refunding Bonds. On February 22, 2017, the Successor Agency to the Dinuba Redevelopment Agency issued $18,875,000 Tax Allocation Refunding Bonds bearing interest of 2%-4% payable semi-annually on March 1 and September 1 commencing September 1, 2017. The bonds mature annually at various amounts through September 1, 2041. The bonds are payable from and secured by incremental tax revenues. Bonds outstanding as of June 30, 2021 were $17,390,000. The Bonds were issued to refinance the outstanding amount ($3,000,000) of the Agency’s previously issued 2006 Tax Allocation Refunding Bonds, outstanding amount ($10,365,000) of the Agency’s previously issued 2011A Tax Allocation Refunding Bonds and outstanding amount ($4,325,000) of the Agency’s 2011B Tax Allocation Refunding Bonds. As a result, the 2006, 2011A, and 2011B Tax Allocation Refunding Bonds are considered to be defeased and the liability for the bonds have been removed from the long-term liabilities of the Private Purpose Trust Fund. As a result of this refunding, the SADRA recognized a deferred loss on refunding in the amount of $2,820,201. The annual requirements to amortize long-term debt outstanding at June 30, 2021 are as follows:
Fiscal Year Ended June 30, Principal Interest Total
2022 1,505,000$ 1,756,182$ 3,261,182$ 2023 1,570,000 1,691,082 3,261,082 2024 1,625,000 1,619,619 3,244,619 2025 1,710,000 1,541,175 3,251,175 2026 1,795,000 1,458,644 3,253,644
2027-2031 10,130,000 6,093,772 16,223,772 2032-2036 12,530,000 3,609,119 16,139,119 2037-2041 10,795,000 1,132,001 11,927,001
2042 850,000 17,000 867,000 Subtotal 42,510,000 18,918,594$ 61,428,594$
1,133,572
43,643,572$
Net Premium (Discount)
Grand Total SADRA
Note 17: Restatement
At June 30, 2021, the City reported a prior period adjustment in the amount of $78,836 in the General Fund. The prior period adjustment was due to the implementation of GASB Statement No. 84, Fiduciary Activities, for accounting and financial reporting purposes. A restatement of $1,090,131 in the Ambulance Fund was recorded to adjust accounts receivable.
79


THIS PAGE INTENTIONALLY LEFT BLANK

80


81

CITY OF DINUBA
COST SHARING MULTIPLE-EMPLOYER PLANSCHEDULE OF PROPORTIONATE SHARE OF THE NET PENSION LIABILITYAS OF JUNE 30, 2021
2015 2016 2017 2018Measurement Date 6/30/2014 6/30/2015 6/30/2016 6/30/2017Miscellaneous Rate PlanRate Plan's Proportion of the Net Pension Liability 0.09025% 0.08449% 0.08530% 0.08633%
Rate Plan's Proportionate Share of the Net Pension Liability 5,615,605$ 5,799,429$ 7,380,757$ 8,561,182$
Rate Plan's Covered Payroll 4,337,752$ 4,535,654$ 4,950,525$ 4,855,630$
Rate Plan's Proportionate Share of the Net Pension Liability as Percentage of Covered Payroll 129.46% 127.86% 149.09% 176.31%
Safety Rate PlanRate Plan's Proportion of the Net Pension Liability 0.12534% 0.11578% 0.10988% 0.10815%
Rate Plan's Proportionate Share of the Net Pension Liability 7,798,956$ 7,946,896$ 9,507,786$ 10,725,363$
Rate Plan's Covered Payroll 4,361,016$ 4,579,907$ 4,837,830$ 4,868,573$
Rate Plan's Proportionate Share of the Net Pension Liability as Percentage of Covered Payroll 178.83% 173.52% 196.53% 220.30%
Total PlanPlan Proportion of the Net Pension Liability 0.21558% 0.20027% 0.19517% 0.19447%
Plan Proportionate Share of the Net Pension Liability 13,414,561$ 13,746,325$ 16,888,543$ 19,286,545$
Plan Covered Payroll 8,698,768$ 9,115,561$ 9,788,355$ 9,724,203$
Plan Proportionate Share of the Net Pension Liability as Percentage of Covered Payroll 154.21% 150.80% 172.54% 198.34%
The Pension Plan's (PERF-C) Fiduciary Net Position as a Percentageof the Total Pension Liability 79.82% 78.40% 74.06% 73.31%
Notes to Schedule:
(1) Historical information is required only for measurement for which GASB 68 is applicable. Fiscal Year 2015 was the first year of implementation,therefore only seven years are shown.
Changes of Assumptions: None in 2019 or 2020. In 2018, demographic assumptions and inflation rate were changed in accordance to the CalPERS Experience Study and Review of Actuarial Assumptions December 2017. There were no changes in discount rate in 2018. In 2017, the accounting discount rate reduced from 7.65 percent to 7.15 percent. In 2016, there were no changes. In 2015, amounts reported reflect an adjustment of the discount rate from 7.5 percent (net of administrative expense) to 7.65 percent (without a reduction for pension plan administrative expense.) In 2014, amounts reported were based on the 7.5 percent discount rate.
Benefit Changes: The figures above include any liability impact that may have resulted from voluntary benefit changes that occurred after the June 30, 2019 valuation. However, offers of Two Years Additional Service Credit (a.k.a. Golden Handshakes) that occurred after the June 30, 2019 valuation date are not included in the figures above, unless the liability impact is deemed to be material by the plan actuary.
82

2019 2020 20216/30/2018 6/30/2019 6/30/2020
0.08682% 0.08889% 0.09050%
8,366,578$ 9,108,392$ 9,846,994$
4,623,761$ 4,190,146$ 4,115,214$
180.95% 217.38% 239.28%
0.02695% 0.11147% 0.11411%
10,683,936$ 11,422,641$ 12,415,460$
5,340,189$ 5,275,144$ 5,276,932$
200.07% 216.54% 235.28%
0.11378% 0.20036% 0.20461%
19,050,514$ 20,531,033$ 22,262,454$
9,963,950$ 9,465,290$ 9,392,146$
191.19% 216.91% 237.03%
75.26% 75.18% 75.06%
83

CITY OF DINUBA
COST SHARING MULTIPLE-EMPLOYER PLANSCHEDULE OF PLAN CONTRIBUTIONSAS OF JUNE 30, 2021
2015 2016 2017 2018
Miscellaneous Rate PlanActuarially Determined Contribution 558,710$ 588,950$ 699,287$ 801,836$ Contribution in Relation to the Actuarially Determined Contribution (558,710) (588,950) (699,287) (801,836) Contribution Deficiency (Excess) -$ -$ -$ -$
Covered Payroll 4,535,654$ 4,950,525$ 4,855,630$ 4,623,761$
Contributions as a Percentage of Covered Payroll 12.32% 11.90% 14.40% 17.34%
Safety Rate PlanActuarially Determined Contribution 1,170,656$ 1,201,260$ 1,211,650$ 1,487,592$ Contribution in Relation to the Actuarially Determined Contribution (1,170,656) (1,201,260) (1,211,650) (1,487,592) Contribution Deficiency (Excess) -$ -$ -$ -$
Covered Payroll 4,579,907$ 4,837,830$ 4,868,573$ 5,340,189$
Contributions as a Percentage of Covered Payroll 25.56% 24.83% 24.89% 27.86%
Total PlanActuarially Determined Contribution 1,729,366$ 1,790,210$ 1,910,937$ 2,289,428$ Contribution in Relation to the Actuarially Determined Contribution (1,729,366) (1,790,210) (1,910,937) (2,289,428) Contribution Deficiency (Excess) -$ -$ -$ -$
Covered Payroll 9,115,561$ 9,788,355$ 9,724,203$ 9,963,950$
Contributions as a Percentage of Covered Payroll 18.97% 18.29% 19.65% 22.98%
Note to Schedule:
Valuation Date:
Methods and assumptions used to determine contribution rates:Actuarial Cost MethodAmortization method
Asset valuation methodInflationPayroll GrowthProjected Salary IncreasesInvestment Rate of ReturnRetirement Age
Mortality The mortality table used was developed based on CalPERS' specific data. The tableincludes 15 years of mortality improvements using 90 percent of Society of Actuaries'Scale 2016. For more details on this table, please refer to the 2017 experience studyreport.
All other actuarial assumptions used in the June 30, 2019 valuation were based on theresults of an actuarial experience study for the period from 1997 to 2015, includingupdates to salary increase, mortality and retirement rates. The Experience Study reportmay be accessed on the CalPERS website at www.calpers.ca.gov under Forms andPublications.
Direct rate smoothing2.50%2.75%Varies by Entry Age and Service7.15% (net of pension plan investment and administrative expenses, includes inflation)
June 30, 2018
Entry Age Normal Cost Method
(1) Historical information is required only for measurement for which GASB 68 is applicable. Fiscal Year 2015 was the first year of implementation,therefore only seven years are shown.
Level percentage of pay, a summary of the current policy is provided in the table below:
84

2019 2020 2021
882,029$ 1,023,527$ 1,096,427$ (882,029) (1,023,527) (1,096,427)
-$ -$ -$
4,190,146$ 4,115,214$ 2,742,630$
21.05% 24.87% 39.98%
1,553,598$ 1,702,909$ 1,842,579$ (1,553,598) (1,702,909) (1,842,579)
-$ -$ -$
5,275,144$ 5,276,932$ 4,272,963$
29.45% 32.27% 43.12%
2,435,627$ 2,726,436$ 2,939,006$ (2,435,627) (2,726,436) (2,939,006)
-$ -$ -$
9,465,290$ 9,392,146$ 7,015,593$
25.73% 29.03% 41.89%
85

CITY OF DINUBA
SCHEDULE OF CHANGES IN THE TOTAL OPEB LIABILITY AND RELATED RATIOSAS OF JUNE 30, FOR THE LAST TEN FISCAL YEARS (1)
2018 2019 2020 2021Total OPEB LiabilityService cost 1,508,388$ 1,308,469$ 1,330,644$ 1,040,926$ Interest on the total OPEB liability 759,508 879,229 942,696 787,756 Differences between expected and actual experiences (3,331,140) - (1,369,150) - Changes in assumptions 475,464 (255,242) (914,613) 3,237,466 Benefit payments (459,273) (591,507) (630,017) (516,507) Net Change in Total OPEB Liability (1,047,053) 1,340,949 (640,440) 4,549,641 Total OPEB liability - beginning 24,731,785 23,684,732 25,025,681 24,385,241 Total OPEB liability - ending (a) 23,684,732$ 25,025,681$ 24,385,241$ 28,934,882$
Covered-employee payroll 7,746,382$ 7,359,008$ 6,955,744$ 7,015,595$
Net OPEB liability as a percentage of covered-employee payroll 305.75% 340.07% 350.58% 412.44%
(2) Total employer contributions consist of $383,380 explicit contributions and $133,127 implicit contributions.
(1) Historical information is required only for the measurement periods for which GASB 75 is applicable. Fiscal Year 2018 was the first year ofimplementation. Future years' information will be displayed up to 10 years as information becomes available.
See Notes to Required Supplementary Information. 86

CITY OF DINUBA
NOTES TO REQUIRED SUPPLEMENTARY INFORMATION JUNE 30, 2021
Note 1: Budgets and Budgetary Data
a. The annual budget adopted by the City Council provides for the general operation of theCity. It includes proposed expenditures and the means of financing them.
b. The City Council approves total budgeted appropriations and any amendments toappropriations throughout the fiscal year. All amendments made during the fiscal year areincluded in the budgetary amounts reported herein. The “appropriated budget” covers allCity expenditures, with the exception of debt service on bond issues and capitalimprovement projects carried forward from prior fiscal years, which expenditures constitutelegally authorized “non-appropriated budget”. Actual expenditures may not exceedbudgeted appropriations at the fund level, which is the legal level of control.
The City Manager is authorized to transfer budgeted amounts between departments within any fund; however, any revisions that alter the total expenditures of any fund must be approved by the City Council.
c. Formal budgetary integration is employed as a management control device during the fiscalyear. Commitments for materials and services, such as purchase orders and contracts, arerecorded as encumbrances to assist in controlling expenditures. Appropriations which areencumbered lapse at fiscal year-end, and then are added to the following fiscal year’sbudgeted appropriations.
d. Budgets for the General, Special Revenue, and Debt Service Funds are adopted on a basissubstantially consistent with accounting principles generally accepted in the United Statesof America (USGAAP). Accordingly, actual revenues and expenditures can be comparedwith related budgeted amounts without any significant reconciling items.
The Housing Authority Fund does not have legally adopted budgets for the fiscal year ended June 30, 2021.
Budget comparisons are not presented for the Proprietary Funds, as the City is not legally required to adopt a budget for these type funds.
e. Capital projects are budgeted through the Capital Projects Funds. Appropriations for capitalprojects authorized but not constructed or completed during the fiscal year are carriedforward as continuing appropriations into the following fiscal year’s budget.
f. Under Article XIII-B of the California constitution (the Gann Spending Limitation Initiative),the City is restricted as to the amount of annual appropriations from the proceeds of taxes,and if proceeds of taxes exceed allowed appropriations, the excess must either berefunded to the State Controller or returned to the taxpayers through revised tax rates orrevised fee schedules, or an excess in one year may be offset by a deficit in the followingyear. For the fiscal year ended June 30, 2021, based on calculations by City staff, proceedsof taxes did not exceed appropriations. Further, Section 5 of Article XIII-B allows the Cityto designate a portion of fund balance for general contingencies, to be used for anypurpose.
87

CITY OF DINUBA NOTES TO REQUIRED SUPPLEMENTARY INFORMATION (CONTINUED) JUNE 30, 2021 Note 2: Excess Expenditures over Appropriations
The following are major funds in which certain expenditures exceeded appropriations for the fiscal year ended June 30, 2021:
Fund/FunctionFinal
Appropriation Expenditures ExcessMajor Funds: HUD Grants Fund Public Works 275,857 286,000 (10,143) Capital Outlay 5,081,785 6,339,121 (1,257,336) Transfers out 700 63,524 (62,824)
88


THIS PAGE INTENTIONALLY LEFT BLANK

CITY OF DINUBA
NONMAJOR GOVERNMENTAL FUNDS
SPECIAL REVENUE FUNDS
Special revenue funds are used to account for specific revenue (other than those for major capital projects)that are restricted legally to expenditures for particular purposes.
PUBLIC SAFETY SALES TAX FUND - This fund accounts for 3/4% add-on sales tax approved by voters inNovember 2005 for enhanced public saftey services.
GAS TAX FUND - This fund accounts for street projects paid for out of the City’s share of the gas tax moniesreceived from the state.
PARKS RESERVE FUND – Monies received from developers for the purpose of acquiring additionalparklands are accounted for in this fund.
TRANSPORTATION FUND – This fund accounts for monies received under the Transportation DevelopmentAct for street and road projects, and for planning purposes.
SYSTEM DEVELOPMENT CHARGES FUND – This fund accounts for developer deposits for expandingexisting water, sewer, and/or transportation systems, and to provide new systems necessary in new real
t t d l tCOMMUNITY ENHANCEMENT GRANTS FUND – This fund accounts for various State and Federal grantsawards to the City.
ASSESSMENT DISTRICTS FUND – This fund accounts for the lighting and maintenance district costs ofvarious medians and landscape areas in the City. Funding is provided by assessments charged to propertyowners within the district.
ROAD REPAIR AND ACCOUNTABILITY ACT OF 2017 (SB1) FUND – This fund accounts for fees collectedfrom developers and saved for future capital outlays for fire equipment.
89

9090


CITY OF DINUBA
COMBINING BALANCE SHEETNONMAJOR GOVERNMENTAL FUNDSJUNE 30, 2021
Assets:Pooled cash and investments 851,826$ 96,145$ 497,634$ -$ Receivables:
Accounts - - - - Notes and loans - - 117,543 - Accrued interest 569 94 305 -
Prepaid costs - 1,054 - 81 Due from other governments 627,638 363,806 - 1,167,157 Advances to other funds - - - - Restricted assets:
Cash and investments with fiscal agents - - - -
Total Assets 1,480,033$ 461,099$ 615,482$ 1,167,238$
Liabilitites, Deferred Inflows of Resources,and Fund Balances:Liabilities:Accounts payable 3,481$ 25,048$ 7,490$ 5,249$ Accrued liabilities 61,361 12,551 - 8,753 Deposits payable - - - - Due to other funds - - - 274,298 Advances from other funds - - 116,904 -
Total Liabilities 64,842 37,599 124,394 288,300
Deferred Inflows of Resources:Unavailable revenues - - 27,887 -
Total Deferred Inflows of Resources - - 27,887 -
Fund Balances: Nonspendable: Prepaid costs - 1,054 - 81 Restricted for: Public safety 1,415,191 - - - Parks and recreation - - 463,201 - Public works - 422,446 - 878,857 Capital Projects - - - - Debt service - - - - Unassigned - - - -
Total Fund Balances 1,415,191 423,500 463,201 878,938
Total Liabilities, Deferred Inflows of Resources, and Fund Balances 1,480,033$ 461,099$ 615,482$ 1,167,238$
Special Revenue Funds
Public Safety Sales Tax Gas Tax Parks Reserve Transportation
91

CITY OF DINUBA
COMBINING BALANCE SHEETNONMAJOR GOVERNMENTAL FUNDSJUNE 30, 2021
Assets:Pooled cash and investmentsReceivables:
AccountsNotes and loansAccrued interest
Prepaid costsDue from other governmentsAdvances to other fundsRestricted assets:
Cash and investments with fiscal agents
Total Assets
Liabilitites, Deferred Inflows of Resources,and Fund Balances:Liabilities:Accounts payableAccrued liabilitiesDeposits payableDue to other fundsAdvances from other funds
Total Liabilities
Deferred Inflows of Resources:Unavailable revenues
Total Deferred Inflows of Resources
Fund Balances: Nonspendable: Prepaid costs Restricted for: Public safety Parks and recreation Public works Capital Projects Debt service Unassigned
Total Fund Balances
Total Liabilities, Deferred Inflows of Resources, and Fund Balances
(CONTINUED)
3,869,202$ 107,292$ -$ 400,776$
- - - - 1,171,195 - - -
2,786 65 10 215 - - 8,022 - - 1,939 4,984 46,975 - - - -
- - - -
5,043,183$ 109,296$ 13,016$ 447,966$
27,436$ -$ 15,649$ -$ - 3,195 2,897 - - - - - - - 64,614 - - - - -
27,436 3,195 83,160 -
364,288 - - -
364,288 - - -
- - 8,022 -
780,116 106,101 - - - - - -
3,871,343 - - 447,966 - - - - - - - - - - (78,166) -
4,651,459 106,101 (70,144) 447,966
5,043,183$ 109,296$ 13,016$ 447,966$
Special Revenue Funds
System Development
Charges
Community Enhancement
Grants Assessment
Districts
Road Repair and Accountability
Act of 2017 FUND (SB 1)
92

CITY OF DINUBA
COMBINING BALANCE SHEETNONMAJOR GOVERNMENTAL FUNDSJUNE 30, 2021
Assets:Pooled cash and investmentsReceivables:
AccountsNotes and loansAccrued interest
Prepaid costsDue from other governmentsAdvances to other fundsRestricted assets:
Cash and investments with fiscal agents
Total Assets
Liabilitites, Deferred Inflows of Resources,and Fund Balances:Liabilities:Accounts payableAccrued liabilitiesDeposits payableDue to other fundsAdvances from other funds
Total Liabilities
Deferred Inflows of Resources:Unavailable revenues
Total Deferred Inflows of Resources
Fund Balances: Nonspendable: Prepaid costs Restricted for: Public safety Parks and recreation Public works Capital Projects Debt service Unassigned
Total Fund Balances
Total Liabilities, Deferred Inflows of Resources, and Fund Balances
Debt Service Funds
104,520$ 995,532$ -$ 72,594$
- - 139,165 - - - - - - 600 - 44 - 678 - - - - - - - - - -
- - - 766,778
104,520$ 996,810$ 139,165$ 839,416$
419$ 4,981$ -$ -$ - - - - - 600,000 - - - - 207,254 - - - - 200,000
419 604,981 207,254 200,000
- - - -
- - - -
- 678 - -
- - - - - - - - - - - -
104,101 391,151 - - - - - 639,416 - - (68,089) -
104,101 391,829 (68,089) 639,416
104,520$ 996,810$ 139,165$ 839,416$
Capital Projects Funds
General Construction
Vocational Center MTBE
Financing Authority
93

CITY OF DINUBA
COMBINING BALANCE SHEETNONMAJOR GOVERNMENTAL FUNDSJUNE 30, 2021
Assets:Pooled cash and investmentsReceivables:
AccountsNotes and loansAccrued interest
Prepaid costsDue from other governmentsAdvances to other fundsRestricted assets:
Cash and investments with fiscal agents
Total Assets
Liabilitites, Deferred Inflows of Resources,and Fund Balances:Liabilities:Accounts payableAccrued liabilitiesDeposits payableDue to other fundsAdvances from other funds
Total Liabilities
Deferred Inflows of Resources:Unavailable revenues
Total Deferred Inflows of Resources
Fund Balances: Nonspendable: Prepaid costs Restricted for: Public safety Parks and recreation Public works Capital Projects Debt service Unassigned
Total Fund Balances
Total Liabilities, Deferred Inflows of Resources, and Fund Balances
Debt Service Funds
129,617$ 7,125,138$
- 139,165 - 1,288,738 - 4,688 - 9,835 - 2,212,499
1,124,333 1,124,333
- 766,778
1,253,950$ 12,671,174$
-$ 89,753$ - 88,757 - 600,000 - 546,166 - 316,904
- 1,641,580
- 392,175
- 392,175
- 9,835
- 2,301,408 - 463,201 - 5,620,612 - 495,252
1,253,950 1,893,366 - (146,255)
1,253,950 10,637,419
1,253,950$ 12,671,174$
General Debt Service
Total Governmental
Funds
94
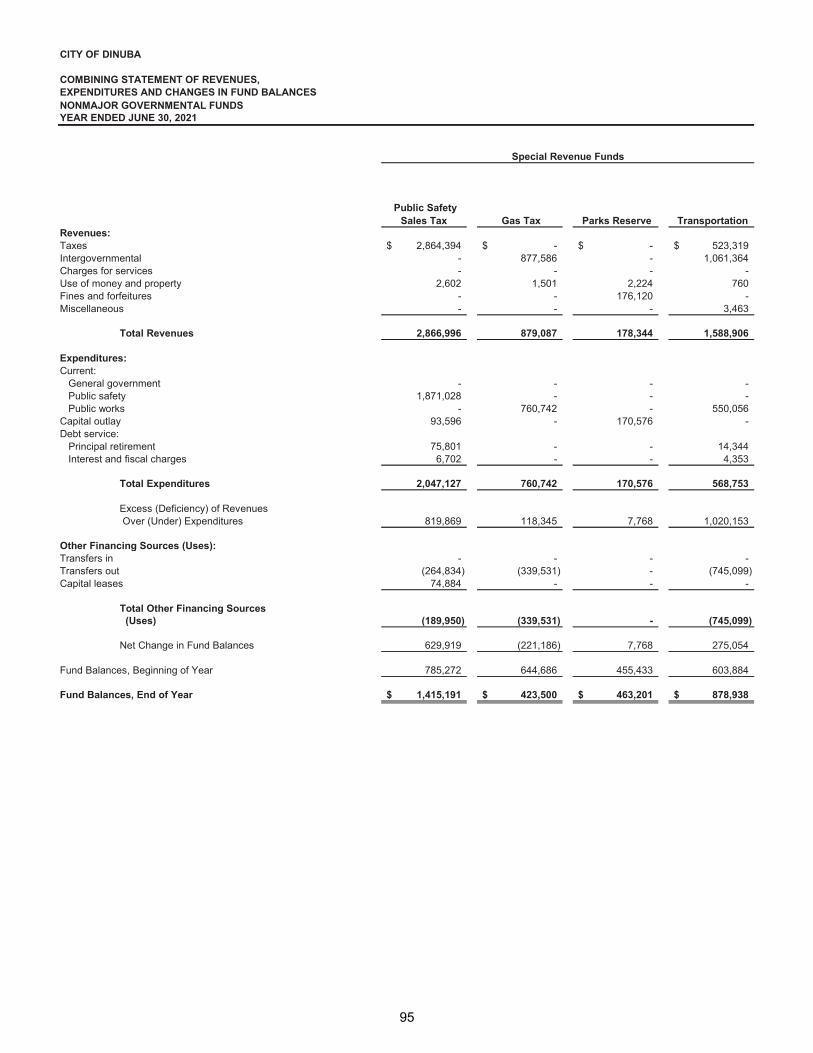
CITY OF DINUBA
COMBINING STATEMENT OF REVENUES,EXPENDITURES AND CHANGES IN FUND BALANCESNONMAJOR GOVERNMENTAL FUNDS YEAR ENDED JUNE 30, 2021
Revenues:Taxes 2,864,394$ -$ -$ 523,319$ Intergovernmental - 877,586 - 1,061,364 Charges for services - - - - Use of money and property 2,602 1,501 2,224 760 Fines and forfeitures - - 176,120 - Miscellaneous - - - 3,463
Total Revenues 2,866,996 879,087 178,344 1,588,906
Expenditures:Current: General government - - - - Public safety 1,871,028 - - - Public works - 760,742 - 550,056 Capital outlay 93,596 - 170,576 - Debt service: Principal retirement 75,801 - - 14,344 Interest and fiscal charges 6,702 - - 4,353
Total Expenditures 2,047,127 760,742 170,576 568,753
Excess (Deficiency) of Revenues Over (Under) Expenditures 819,869 118,345 7,768 1,020,153
Other Financing Sources (Uses):Transfers in - - - - Transfers out (264,834) (339,531) - (745,099) Capital leases 74,884 - - -
Total Other Financing Sources (Uses) (189,950) (339,531) - (745,099)
Net Change in Fund Balances 629,919 (221,186) 7,768 275,054
Fund Balances, Beginning of Year 785,272 644,686 455,433 603,884
Fund Balances, End of Year 1,415,191$ 423,500$ 463,201$ 878,938$
Special Revenue Funds
Public Safety Sales Tax Gas Tax Parks Reserve Transportation
95

CITY OF DINUBA
COMBINING STATEMENT OF REVENUES,EXPENDITURES AND CHANGES IN FUND BALANCESNONMAJOR GOVERNMENTAL FUNDSYEAR ENDED JUNE 30, 2021
Revenues:TaxesIntergovernmentalCharges for servicesUse of money and propertyFines and forfeituresMiscellaneous
Total Revenues
Expenditures:Current: General government Public safety Public worksCapital outlayDebt service: Principal retirement Interest and fiscal charges
Total Expenditures
Excess (Deficiency) of Revenues Over (Under) Expenditures
Other Financing Sources (Uses):Transfers inTransfers outCapital leases
Total Other Financing Sources (Uses)
Net Change in Fund Balances
Fund Balances, Beginning of Year
Fund Balances, End of Year
(CONTINUED)
-$ -$ 542,759$ -$ - 168,681 - 476,455
1,066,507 - - - 18,858 392 23 1,788
- - - - 1,350 - - -
1,086,715 169,073 542,782 478,243
- - - - - 151,904 - -
112,910 - 478,532 - 249,743 - 46,388 616,080
- - 5,539 - - - 1,784 -
362,653 151,904 532,243 616,080
724,062 17,169 10,539 (137,837)
(80,596) 2,000 - 82,333 (1,042,464) - - -
- - - -
(1,123,060) 2,000 - 82,333
(398,998) 19,169 10,539 (55,504)
5,050,457 86,932 (80,683) 503,470
4,651,459$ 106,101$ (70,144)$ 447,966$
Community Enhancement
Grants Assessment
Districts
System Development
Charges
Road Repair and
Accountability Act of 2017
FUND (SB 1)
Special Revenue Funds
96

CITY OF DINUBA
COMBINING STATEMENT OF REVENUES,EXPENDITURES AND CHANGES IN FUND BALANCESNONMAJOR GOVERNMENTAL FUNDSYEAR ENDED JUNE 30, 2021
Revenues:TaxesIntergovernmentalCharges for servicesUse of money and propertyFines and forfeituresMiscellaneous
Total Revenues
Expenditures:Current: General government Public safety Public worksCapital outlayDebt service: Principal retirement Interest and fiscal charges
Total Expenditures
Excess (Deficiency) of Revenues Over (Under) Expenditures
Other Financing Sources (Uses):Transfers inTransfers outCapital leases
Total Other Financing Sources (Uses)
Net Change in Fund Balances
Fund Balances, Beginning of Year
Fund Balances, End of Year
Debt Service Funds
-$ -$ -$ -$ - - - - - - - - - 346,215 - 3,481 - - - - - - 144,571 -
- 346,215 144,571 3,481
- 16,980 - - - - - - - - - -
552,694 - 91,576 -
- - - 888,609 - - - 810,543
552,694 16,980 91,576 1,699,152
(552,694) 329,235 52,995 (1,695,671)
656,964 - - 1,696,401 - - - - - - - -
656,964 - - 1,696,401
104,270 329,235 52,995 730
(169) 62,594 (121,084) 638,686
104,101$ 391,829$ (68,089)$ 639,416$
General Construction
Vocational Center MTBE
Financing Authority
Capital Projects Funds
97

CITY OF DINUBA
COMBINING STATEMENT OF REVENUES,EXPENDITURES AND CHANGES IN FUND BALANCESNONMAJOR GOVERNMENTAL FUNDSYEAR ENDED JUNE 30, 2021
Revenues:TaxesIntergovernmentalCharges for servicesUse of money and propertyFines and forfeituresMiscellaneous
Total Revenues
Expenditures:Current: General government Public safety Public worksCapital outlayDebt service: Principal retirement Interest and fiscal charges
Total Expenditures
Excess (Deficiency) of Revenues Over (Under) Expenditures
Other Financing Sources (Uses):Transfers inTransfers outCapital leases
Total Other Financing Sources (Uses)
Net Change in Fund Balances
Fund Balances, Beginning of Year
Fund Balances, End of Year
Debt Service Funds
-$ 3,930,472$ - 2,584,086 - 1,066,507 - 377,844 - 176,120 - 149,384
- 8,284,413
- 16,980 - 2,022,932 - 1,902,240 - 1,820,653
335,838 1,320,131 85,470 908,852
421,308 7,991,788
(421,308) 292,625
421,308 2,778,410 - (2,391,928) - 74,884
421,308 461,366
- 753,991
1,253,950 9,883,428
1,253,950$ 10,637,419$
Total Governmental
Funds General Debt
Service
98

99

100

101

102

103

104

105

106

107

108

109

110

111

112


113

CITY OF DINUBA
COMBINING STATEMENT OF NET POSITIONNON-MAJOR ENTERPRISE FUNDSJUNE 30, 2021
TotalsAssets:Current:
Cash and investments -$ 399,875$ 399,875$ Receivables:
Accounts 2,964 - 2,964 Accrued interest - 277 277
Prepaid costs 291 - 291 Due from other governments 614,183 - 614,183
Total Current Assets 617,438 400,152 1,017,590
Noncurrent:Capital assets - net of accumulated depreciation 1,588,371 1,694,525 3,282,896
Total Noncurrent Assets 1,588,371 1,694,525 3,282,896
Total Assets 2,205,809 2,094,677 4,300,486
Deferred Outflows of Resources:Deferred pension related items 724 - 724 Deferred OPEB related items 10,923 - 10,923
Total Deferred Outflows of Resources 11,647 - 11,647
Liabilities:Current:
Accounts payable 62,621 7,954 70,575 Accrued liabilities 147 1,183 1,330 Due to other funds 308,546 - 308,546 Accrued compensated absences - 1,096 1,096
Total Current Liabilities 371,314 10,233 381,547
Noncurrent:Accrued compensated absences - 3,367 3,367 Net pension liability 3,348 - 3,348 Total OPEB Liability 86,226 - 86,226
Total Noncurrent Liabilities 89,574 3,367 92,941
Total Liabilities 460,888 13,600 474,488
Deferred Inflows of Resources:Deferred pension related items 142 - 142 Deferred OPEB related items 12,209 - 12,209
Total Deferred Inflows of Resources 12,351 - 12,351
Net Position:Invested in capital assets 1,588,371 1,694,525 3,282,896 Unrestricted 155,846 386,552 542,398
Total Net Position 1,744,217$ 2,081,077$ 3,825,294$
Business-Type Activities - Enterprise Funds
Transit Compressed Natural Gas
114

CITY OF DINUBA
COMBINING STATEMENT OF REVENUES, EXPENSESAND CHANGES IN FUND NET POSITIONNON-MAJOR ENTERPRISE FUNDS YEAR ENDED JUNE 30, 2021
TotalsOperating Revenues:Charges for services 19,241$ 174,801$ 194,042$ Miscellaneous - 161,525 161,525
Total Operating Revenues 19,241 336,326 355,567
Operating Expenses:Salaries and benefits 94,792 63,672 158,464 Contractual services 528,463 17,909 546,372 Materials and supplies 82,091 7 82,098 Repairs and maintenance 17,545 36,859 54,404 Utilities 15,639 58,182 73,821 Allocated costs 99,392 31,240 130,632 Depreciation expense 204,366 96,713 301,079
Total Operating Expenses 1,042,288 304,582 1,346,870
Operating Loss (1,023,047) 31,744 (991,303)
Nonoperating Revenues (Expenses):Intergovernmental 874,410 - 874,410 Interest revenue 755 2,111 2,866 Gain (loss) on disposal of capital assets (237,960) - (237,960)
Total Nonoperating Revenues (Expenses) 637,205 2,111 639,316
Income (Loss) Before Transfers (385,842) 33,855 (351,987)
Transfers out (3,563) (7,917) (11,480)
Changes in Net Position (389,405) 25,938 (363,467)
Net Position:
Beginning of Year 2,133,622 2,055,139 4,188,761
End of Fiscal Year 1,744,217$ 2,081,077$ 3,825,294$
Business-Type Activities - Enterprise Funds
Transit Compressed Natural Gas
115

CITY OF DINUBA
COMBINING STATEMENT OF CASH FLOWSNON-MAJOR ENTERPRISE FUNDS YEAR ENDED JUNE 30, 2021
TotalsCash Flows from Operating Activities:Cash received from customers and users 16,277$ 174,801$ 191,078$ Cash paid to suppliers for goods and services (893,641) (158,400) (1,052,041) Cash paid to employees for services (11,893) (220,734) (232,627) Cash received from (payments to) others - 161,525 161,525
Net Cash Provided (Used) by Operating Activities (889,257) (42,808) (932,065)
Cash Flows from Non-CapitalFinancing Activities:
Cash transfers out (3,563) (7,917) (11,480) Short-term loans (paid to) received from other funds 308,546 - 308,546 Intergovernmental revenue 491,126 - 491,126
Net Cash Provided (Used) by Non-Capital Financing Activities 796,109 (7,917) 788,192
Cash Flows from Capital and Related Financing Activities:
Acquisition and construction of capital assets (150,599) (61,672) (212,271)
Net Cash Used by Capital and Related Financing Activities (150,599) (61,672) (212,271)
Cash Flows from Investing Activities:Interest earnings 1,108 3,216 4,324
Net Cash Provided (Used) byInvesting Activities 1,108 3,216 4,324
Net Increase in Cashand Cash Equivalents (242,639) (109,181) (351,820)
Cash and Cash Equivalents at Beginning of Year 242,639 509,056 751,695
Cash and Cash Equivalents at End of Year -$ 399,875$ 399,875$
Reconciliation of Operating Income to Net CashProvided (Used) by Operating Activities:Operating loss (1,023,047)$ 31,744$ (991,303)$ Adjustments to reconcile operating loss net cash provided (used) by operating activities:
Depreciation 204,366 96,713 301,079 Changes in pension related items (4,613) (65,696) (70,309) Changes in OPEB related items 87,512 (95,829) (8,317) (Increase) decrease in accounts receivable (2,964) - (2,964) (Increase) decrease in prepaid expense - 270 270 Increase (decrease) in accounts payable & accrued liabilities (150,511) (14,473) (164,984) Increase (decrease) in compensated absences - 4,463 4,463
Total Adjustments 133,790 (74,552) 59,238 Net Cash Provided (Used) by Operating Activities (889,257)$ (42,808)$ (932,065)$
Business-Type Activities - Enterprise Funds
Transit Compressed Natural Gas
116

CITY OF DINUBA
INTERNAL SERVICE FUNDS
Internal service funds are used to account for the financing of goods or services provided to departmentsor agencies of the government and to other government units, on a cost reimbursement basis.
INSURANCE FUND – This fund was set up to account for the cost of general liability, property damage,and employee related health insurance costs. The City is involved in a self-insurance program through ajoint powers authority with other local municipalities. The source of funding for the City’s program is acharge to all operating departments through a budgeting of the estimated costs to be allocated.
PROPERTY AND EQUIPMENT SERVICE FUND – This fund was set up to account for the costs ofmaintenance and repairs for both buildings and equipment throughout the City. The source of this fundingis a charge against the departments for services rendered.
TECHNOLOGY REPLACEMENT FUND - This fund was set up as a computer replacement program,implemented to account for the costs associated with computer, server and Information Technologyreplacements throughout the City. All costs are spread amongst the benefitting funds.
117
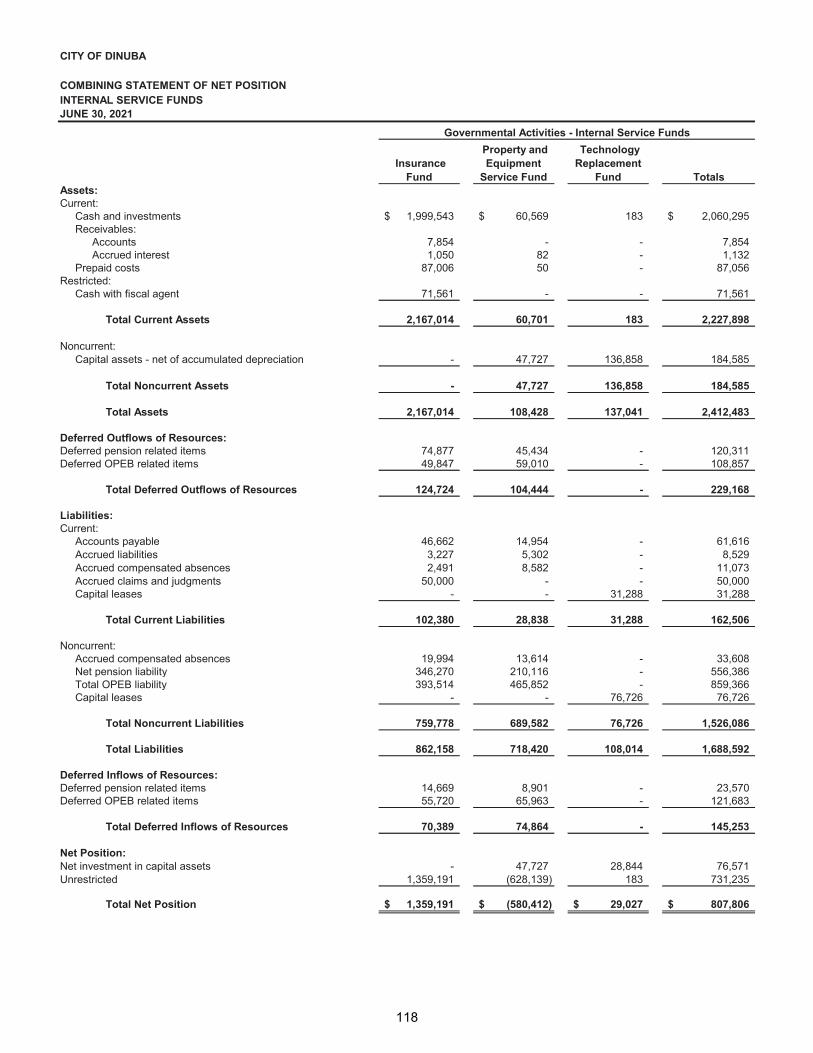
CITY OF DINUBA
COMBINING STATEMENT OF NET POSITIONINTERNAL SERVICE FUNDSJUNE 30, 2021
TotalsAssets:Current:
Cash and investments 1,999,543$ 60,569$ 183 2,060,295$ Receivables:
Accounts 7,854 - - 7,854 Accrued interest 1,050 82 - 1,132
Prepaid costs 87,006 50 - 87,056 Restricted:
Cash with fiscal agent 71,561 - - 71,561
Total Current Assets 2,167,014 60,701 183 2,227,898
Noncurrent:Capital assets - net of accumulated depreciation - 47,727 136,858 184,585
Total Noncurrent Assets - 47,727 136,858 184,585
Total Assets 2,167,014 108,428 137,041 2,412,483
Deferred Outflows of Resources:Deferred pension related items 74,877 45,434 - 120,311 Deferred OPEB related items 49,847 59,010 - 108,857
Total Deferred Outflows of Resources 124,724 104,444 - 229,168
Liabilities:Current:
Accounts payable 46,662 14,954 - 61,616 Accrued liabilities 3,227 5,302 - 8,529 Accrued compensated absences 2,491 8,582 - 11,073 Accrued claims and judgments 50,000 - - 50,000 Capital leases - - 31,288 31,288
Total Current Liabilities 102,380 28,838 31,288 162,506
Noncurrent:Accrued compensated absences 19,994 13,614 - 33,608 Net pension liability 346,270 210,116 - 556,386 Total OPEB liability 393,514 465,852 - 859,366 Capital leases - - 76,726 76,726
Total Noncurrent Liabilities 759,778 689,582 76,726 1,526,086
Total Liabilities 862,158 718,420 108,014 1,688,592
Deferred Inflows of Resources:Deferred pension related items 14,669 8,901 - 23,570 Deferred OPEB related items 55,720 65,963 - 121,683
Total Deferred Inflows of Resources 70,389 74,864 - 145,253
Net Position:Net investment in capital assets - 47,727 28,844 76,571 Unrestricted 1,359,191 (628,139) 183 731,235
Total Net Position 1,359,191$ (580,412)$ 29,027$ 807,806$
Governmental Activities - Internal Service Funds
Insurance Fund
Property and Equipment
Service Fund
Technology Replacement
Fund
118

CITY OF DINUBA
COMBINING STATEMENT OF REVENUES, EXPENSESAND CHANGES IN FUND NET POSITIONINTERNAL SERVICE FUNDSYEAR ENDED JUNE 30, 2021
TotalsOperating Revenues:Charges for services 5,233,510$ 700,000$ - 5,933,510$
Total Operating Revenues 5,233,510 700,000 - 5,933,510
Operating Expenses:Salaries and benefits 259,478 295,615 - 555,093 Contractual services 28,537 75,336 - 103,873 Materials and supplies 312 70,478 42,121 112,911 Insurance 1,563,982 - - 1,563,982 Employee health insurance 2,307,754 - - 2,307,754 Repairs and maintenance - 186,212 - 186,212 Utilities - 7,393 - 7,393 Allocated costs - 27,174 - 27,174 Depreciation expense - 8,887 25,266 34,153
Total Operating Expenses 4,160,063 671,095 67,387 4,898,545
Operating Income (Loss) 1,073,447 28,905 (67,387) 1,034,965
Nonoperating Revenues (Expenses):Interest revenue 4,926 365 - 5,291 Interest expense - - (5,626) (5,626)
Total Nonoperating Revenues (Expenses) 4,926 365 (5,626) (335)
Income (Loss) Before Transfers 1,078,373 29,270 (73,013) 1,034,630
Transfers in - - 60,964 60,964 Transfers out - (10,808) - (10,808)
Changes in Net Position 1,078,373 18,462 (12,049) 1,084,786
Net Position:
Beginning of Year 280,818 (598,874) 41,076 (276,980)
End of Fiscal Year 1,359,191$ (580,412)$ 29,027$ 807,806$
Governmental Activities - Internal Service Funds
Insurance Fund
Property and Equipment
Service Fund
Technology Replacement
Fund
119

CITY OF DINUBA
COMBINING STATEMENT OF CASH FLOWSINTERNAL SERVICE FUNDSYEAR ENDED JUNE 30, 2021
TotalsCash Flows from Operating Activities:Cash received from interfund service provided 5,260,160$ 700,000$ -$ 5,960,160$ Cash paid to suppliers for goods and services (4,023,409) (371,287) (58,577) (4,453,273) Cash paid to employees for services (202,751) (278,195) - (480,946)
Net Cash Provided (Used) by Operating Activities 1,034,000 50,518 (58,577) 1,025,941
Cash Flows from Non-CapitalFinancing Activities:
Cash transfers in - - 60,964 60,964 Cash transfers out - (10,808) - (10,808)
Net Cash Provided (Used) by Non-Capital Financing Activities - (10,808) 60,964 50,156
Cash Flows from Capital and Related Financing Activities:
Acquisition and construction of capital assets - (11,405) - (11,405) Principal paid on capital debt - - (32,694) (32,694) Interest paid on capital debt - - (5,626) (5,626)
Net Cash Used by Capital and Related Financing Activities - (11,405) (38,320) (49,725)
Cash Flows from Investing Activities:Interest earnings 5,809 435 - 6,244
Net Cash Provided (Used) byInvesting Activities 5,809 435 - 6,244
Net Increase (Decrease) in Cashand Cash Equivalents 1,039,809 28,740 (35,933) 1,032,616
Cash and Cash Equivalents at Beginning of Year 1,031,295 31,829 36,116 1,099,240
Cash and Cash Equivalents at End of Year 2,071,104$ 60,569$ 183$ 2,131,856$
Reconciliation of Operating Income to Net CashProvided (Used) by Operating Activities:Operating income (loss) 1,073,447$ 28,905$ (67,387)$ 1,034,965$
Adjustments to reconcile operating income (loss) net cash provided (used) by operating activities:
Depreciation - 8,887 25,266 34,153 Changes in pension related items 41,035 5,801 - 46,836 Changes in OPEB related items 16,074 19,030 - 35,104 (Increase) decrease in accounts receivable 26,650 - - 26,650 (Increase) decrease in prepaid expense (76,187) 1,454 2,948 (71,785) Increase (decrease) in accounts payable & accrued liabilities (46,637) (6,148) (19,404) (72,189) Increase (decrease) in compensated absences (382) (7,411) - (7,793)
Total Adjustments (39,447) 21,613 8,810 (9,024)
Net Cash Provided (Used) by Operating Activities 1,034,000$ 50,518$ (58,577)$ 1,025,941$
Governmental Activities - Internal Service Funds
Insurance Fund
Property and Equipment
Service Fund
Technology Replacement
Fund
120


THIS PAGE INTENTIONALLY LEFT BLANK

121


CITY OF DINUBANET POSITION BY COMPONENTLAST TEN FISCAL YEARS(Accrual Basis of Accounting)
2012 2013 2014 2015 2016Governmental Activities Investment In Capital Assets 125,564,573$ 125,814,202$ 148,079,509$ 145,008,916$ 162,419,353$ Restricted 33,514,558 33,633,364 41,313,341 34,836,273 33,955,040 Unrestricted 2,903,128 468,534 (6,418,737) (1,260,101) (9,391,284)Total Governmental Activities Net Position 161,982,259 159,916,100 182,974,113 178,585,088 186,983,109
Business-Type Activities Investment In Capital Assets 45,077,861 49,997,905 47,545,851 47,536,365 46,474,326 Restricted Unrestricted 5,348,820 5,179,596 6,046,622 2,514,439 4,986,126Total Business-Type Activities Net Position 50,426,681 55,177,501 53,592,473 50,050,804 51,460,452
Primary Government Investment In Capital Assets 170,642,434 175,812,107 195,625,360 192,545,281 208,893,679 Restricted 33,514,558 33,633,364 41,313,341 34,836,273 33,955,040 Unrestricted 8,251,948 5,648,130 (372,115) 1,254,338 (4,405,158)
Total Primary Government Net Position 212,408,940$ 215,093,601$ 236,566,586$ 228,635,892$ 238,443,561$
2017 2018 2019 2020 2021Governmental Activities Investment In Capital Assets 162,951,223$ 175,427,868$ 157,295,209$ 156,273,132$ 169,862,756$ Restricted 33,547,768 40,668,235 41,721,018 35,598,022 36,825,231 Unrestricted (6,391,796) (27,286,468) (26,278,675) (25,246,317) (21,122,261)Total Governmental Activities Net Position 190,107,195 188,809,635 172,737,552 166,624,837 185,565,726
Business-Type Activities Investment In Capital Assets 46,126,105 52,249,502 53,298,542 50,287,699 50,501,822 Restricted Unrestricted 4,641,804 1,298,646 5,352,135 4,161,148 8,674,254Total Business-Type Activities Net Position 50,767,909 53,548,148 58,650,677 54,448,847 59,176,076
Primary Government Investment In Capital Assets 209,077,328 227,677,370 210,593,751 206,560,831 220,364,578 Restricted 33,547,768 40,668,235 41,721,018 35,598,022 36,825,231 Unrestricted (1,749,992) (25,987,822) (20,926,540) (21,085,169) (12,448,007)
Total Primary Government Net Position 240,875,104$ 242,357,783$ 231,388,229$ 221,073,684$ 244,741,802$
Source: City of Dinuba Financial Services Division
(50,000,000)
0
50,000,000
100,000,000
150,000,000
200,000,000
250,000,000
300,000,000
2012 2013 2014 2015 2016 2017 2018 2019 2020 2021
Investment In Capital Assets Restricted Unrestricted
122

CITY OF DINUBACHANGES IN NET POSITIONLAST TEN FISCAL YEARS(Accrual Basis of Accounting)
2012 2013 2014 2015 2016ExpensesGovernmental Activities General Government 3,439,679$ 4,339,158$ 4,703,501$ 5,345,434$ 4,802,762$ Public Safety 8,167,990 8,990,013 9,591,236 13,275,052 13,746,235 Public Works 1,826,602 2,197,625 2,761,922 3,334,975 3,943,500 Community Development 1,007,987 636,986 548,112 1,641,605 1,178,906 Parks and Recreation 1,796,570 1,136,847 1,224,454 1,682,401 1,824,431 Interest on Long-Term Debt 1,720,593 1,020,371 1,521,663 1,204,781 1,278,342 Unallocated Depreciation 953,544 823,524 1,018,182 2,635,342 3,029,796Total Governmental Activities Expenses 18,912,965 19,144,524 21,369,070 29,119,590 29,803,972
Business-Type Activities Water 2,159,494 2,963,788 2,970,062 2,931,923 3,204,634 Sewer 2,427,747 2,459,666 2,914,729 3,182,025 3,247,602 Disposal 2,109,008 2,922,065 3,320,744 3,336,842 3,239,137 Ambulance 1,150,496 1,450,622 1,386,124 1,377,304 1,368,670 Transit 639,059 699,102 875,313 1,044,207 1,243,710 Golf Course 3,244,707 3,250,394 3,422,866 3,335,866 3,560,260 Compressed Natural Gas 120,212 137,950 174,521 165,208 159,572 Engineering 506,333 662,791 658,837 738,550Total Business-Type Activities Expenses 11,850,723 14,389,920 15,727,150 16,032,212 16,762,135
Total Primary Government Net Expenses 30,763,688$ 33,534,444$ 37,096,220$ 45,151,802$ 46,566,107$
Program RevenuesGovernmental Activities Charges for Services General Government 52,073$ 4,688$ 1,509,801$ 3,055,054$ 5,470,676$ Public Safety 519,454 423,329 276,308 898,323 274,181 Public Works 2,320,459 2,313,306 3,226,541 3,824,832 1,808,508 Community Development 38,410 11,941 70,343 120,322 22,282 Parks and Recreation 184,657 146,557 162,281 183,922 174,473 Operating Contributions and Grants 3,279,460 4,462,789 6,248,747 3,274,094 3,375,630 Capital Contributions and Grants 2,436,154 5,669,203 25,473,768 10,114,120 12,075,630 Total Governmental Activities Program Revenues 8,830,667 13,031,813 36,967,789 21,470,667 23,201,380
Business-Type Activities Charges for Services Water 2,647,422 2,847,344 2,763,415 2,604,665 2,510,596 Sewer 2,610,812 2,574,505 2,719,638 2,751,349 2,838,956 Disposal 2,980,135 3,324,925 3,080,017 3,081,958 3,175,398 Ambulance 1,078,428 1,281,703 1,288,620 1,271,302 1,332,373 Transit 46,089 44,959 53,507 61,929 85,333 Golf Course 2,239,576 2,255,964 2,343,736 2,346,921 2,441,531 Compressed Natural Gas 188,775 217,120 214,162 262,922 284,800 Engineering 486,415 591,278 493,851 710,226 Operating Contributions and Grants 627,400 868,397 885,831 1,705,461 3,178,252 Capital Contributions and Grants 969,433 1,188,785 715,188 449,819 1,165,634 Total Business-Type Activities Program Revenues 13,388,070 15,090,117 14,655,392 15,030,177 17,723,099
Total Primary Government Program Revenues 22,218,737$ 28,121,930$ 51,623,181$ 36,500,844$ 40,924,479$
Source: City of Dinuba Financial Services Division
Fiscal Year
123

2017 2018 2019 2020 2021
7,661,240$ 3,989,322$ 3,647,223$ 4,464,243$ 7,635,027$ 13,897,596 12,920,443 12,503,075 12,801,801 12,899,424
3,752,225 6,577,677 2,429,367 5,116,719 3,009,339637,522 2,350,919 2,277,992 2,427,047 2,576,069
2,007,951 2,127,602 2,527,531 2,705,703 2,858,0331,604,463 978,293 1,008,877 1,001,611 935,1263,011,661 - - - -
32,572,658 28,944,256 24,394,065 28,517,124 29,913,018
2,977,849 2,965,352 2,985,641 3,563,885 3,460,8833,156,499 4,553,169 3,048,253 3,255,224 1,803,8453,206,889 3,430,622 3,102,875 3,129,253 3,013,9991,523,498 2,760,551 2,798,210 2,647,280 1,562,6761,137,529 1,147,311 1,123,030 1,088,585 1,280,2483,491,319 3,131,513 2,298,467 4,097,713 2,839,155
140,572 181,928 306,316 318,069 304,582- - - - -
15,634,155 18,170,446 15,662,792 18,100,009 14,265,388
48,206,813$ 47,114,702$ 40,056,857$ 46,617,133$ 44,178,406$
8,259,877$ 1,500,372$ 1,602,391$ 1,231,142$ 1,263,713$ 30,863 549,566 500,114 837,538 516,452
1,530,664 1,977,090 2,132,137 2,675,164 1,728,740 - 115,498 60,995 65,077 -
38,475 352,536 336,771 560,971 238,428 5,263,630 2,168,438 2,292,863 1,076,942 7,124,303 3,011,810 19,289,803 5,687,693 3,613,910 2,237,038
18,135,319 25,953,303 12,612,964 10,060,744 13,108,674
2,648,278 2,962,303 3,005,484 3,195,777 3,240,648 2,947,782 3,368,250 3,566,985 3,591,874 3,816,657 3,088,068 3,105,381 3,167,180 3,173,221 3,202,112 1,396,312 1,487,640 1,200,884 1,573,951 2,302,744
120,565 103,623 89,775 67,142 19,241 2,223,355 2,072,902 2,104,304 1,812,421 2,397,750
199,896 210,677 209,972 215,107 174,801 - - - - -
2,496,256 3,889,532 3,295,905 4,947,792 5,088,783 - - - - -
15,120,512 17,200,308 16,640,489 18,577,285 20,242,736
33,255,831$ 43,153,611$ 29,253,453$ 28,638,029$ 33,351,410$
Fiscal Year
124

CITY OF DINUBACHANGES IN NET POSITIONLAST TEN FISCAL YEARS(Accrual Basis of Accounting)
2012 2013 2014 2015 2016Net (Expense)/RevenueGovernmental Activities (10,082,298)$ (6,112,711)$ 15,598,719$ (7,648,923)$ (6,602,592)$ Business-Type Activities 1,537,347 700,197 (1,071,758) (1,002,035) 960,964
Total Primary Government Net Expense (8,544,951)$ (5,412,514)$ 14,526,961$ (8,650,958)$ (5,641,628)$
General Revenues and Other Changes in Net PositionGovernmental Activities Taxes Property Taxes 3,461,506$ 645,437$ 742,122$ 846,306$ 1,260,845$ Transient Occupancy Taxes 133,920 171,817 184,211 226,817 248,579 Sales Taxes 9,843,519 3,677,282 3,700,400 5,461,810 9,729,414 Franchise Taxes 230,613 226,904 243,956 256,883 252,761 Business Licenses Taxes Utility Users Tax 1,600,423 1,622,049 1,612,836 1,630,654 1,683,265 Other Taxes 870,086 240,387 249,602 292,650 487,363 Motor Vehicle Tax 1,565,696 1,553,701 1,571,490 1,633,128 1,754,885 Use of Money and Property 288,456 287,977 262,191 113,494 262,770 Other/Contributions 946,090 1,552,988 18,522 109,931 552,748 Gain (Loss) on Sale of Capital Assets (2,019,092) 400,323 266,189 261,425 - Transfers 703,133 (4,065,884) 195,877 391,944 (269,724) Total Governmental Activities 17,624,350 6,312,981 9,047,396 11,225,042 15,962,906
Business-Type Activities Use of Money and Property 19,536 - 37,243 18,524 37,175 Other/Contributions (338,718) 45,845 92,839 - - Special Item (Note 18) - - - - - Transfers (703,133) 4,065,884 (195,877) (391,944) 269,724 Total Business-Type Activities (1,022,315) 4,111,729 (65,795) (373,420) 306,899
Extraordinary Item - Litigation Settlement - 145,910 104,921 - - Extraordinary Item - RDA Dissolution 51,196,332 - - - -
Total Primary Government 67,798,367$ 10,570,620$ 9,086,522$ 10,851,622$ 16,269,805$
Change in Net PositionGovernmental Activities 58,738,384$ 346,180$ 24,751,036$ 3,576,119$ 9,360,314$ Business-Type Activities 515,032 4,811,926 (1,137,553) (1,375,455) 1,267,863Total Primary Government 59,253,416$ 5,158,106$ 23,613,483$ 2,200,664$ 10,628,177$
Source: City of Dinuba Financial Services Division
125

2017 2018 2019 2020 2021
(14,437,339)$ (2,990,953)$ (11,781,101)$ (18,456,380)$ (16,804,344)$ (513,643) (970,138) 977,697 477,276 5,977,348
(14,950,982)$ (3,961,091)$ (10,803,404)$ (17,979,104)$ (10,826,996)$
1,149,426$ 1,166,971$ 1,301,585$ 1,377,047$ 1,517,322$ 281,005 291,190 289,263 244,052 266,474
9,080,769 9,926,107 10,777,734 14,059,028 19,276,913 216,407 234,815 245,102 258,084 279,774
233,387 237,357 259,787 254,098 1,482,077 1,491,791 1,475,873 1,534,979 1,668,455
273,161 478,877 504,884 495,334 609,054 1,847,746 1,841,147 1,943,492 2,033,375 2,151,555
201,154 454,092 695,301 724,898 662,583 539,928 698,424 345,361 280,254 8,106,557
- - - - - 988,600 816,888 354,520 2,865,489 873,612
16,060,273 17,633,689 18,170,472 12,723,029 35,666,397
50,643 59,094 137,539 205,916 572,378 - 6,585,197 4,054,738 58,101 141,246 - - - (1,350,000) -
(988,600) (816,888) (354,520) (2,865,489) (873,612) (937,957) 5,827,403 3,837,757 (3,951,472) (159,988)
- - - - - - - - - -
15,122,316$ 23,461,092$ 22,008,229$ 8,771,557$ 35,506,409$
1,622,934$ 14,642,736$ 6,389,371$ (5,733,351)$ 18,862,053$ (1,451,600) 4,857,265 4,815,454 (3,474,196) 5,817,360
171,334$ 19,500,001$ 11,204,825$ (9,207,547)$ 24,679,413$
126


CITY OF DINUBAFUND BALANCES OF GOVERNMENTAL FUNDSLAST TEN FISCAL YEARS (Modified Accrual Basis of Accounting)
2012 2013 2014 2015 2016General Fund Nonspendable 3,005,321$ 2,742,077$ 2,736,489$ 2,699,439$ 3,082,112$ Unassigned 1,587,709 1,217,109 1,894,697 2,255,325 1,219,528
Total General Fund 4,593,030$ 3,959,186$ 4,631,186$ 4,954,764$ 4,301,640$
All Other Governmental Funds Nonspendable Funds 5,792,649$ 21,170$ 572,060$ 8,957,449$ 10,334,283$ Restricted Funds 6,840,553 16,917,455 24,668,685 10,838,675 7,636,453 Assigned Funds 4,478,409 147,627 184,506 103,142 55,075 Unassigned Funds (484,580) (312,176) (1,215,832) (618,061) (695,780)
Total All Other Governmental Funds ( 16,627,031$ 16,774,076$ 24,209,419$ 19,281,205$ 17,330,031$
Total Governmental Funds 21,220,061$ 20,733,262$ 28,840,605$ 24,235,969$ 21,631,671$
2017 2018 2019 2020 2021General Fund Nonspendable 3,436,060$ 3,846,794$ 4,257,720$ 1,724,529$ 1,525,245$ Unassigned 1,113,239 1,533,739 3,369,500 7,101,966 15,677,417
Total General Fund 4,549,299$ 5,380,533$ 7,627,220$ 8,826,495$ 17,202,662$
All Other Governmental Funds Nonspendable Funds 5,045,407$ 1,298$ 7,450$ 2,720$ 9,835$ Restricted Funds 13,091,326 40,668,235 41,721,018 35,598,022 36,825,231 Assigned Funds 64,462 - - - - Unassigned Funds (451,012) (453,629) (242,862) (139,889) (146,255)
Total All Other Governmental Funds ( 17,750,183$ 40,215,904$ 41,485,606$ 35,460,853$ 36,688,811$
Total Governmental Funds 22,299,482$ 45,596,437$ 49,112,826$ 44,287,348$ 53,891,473$
(a) The change in total fund balance for the General Fund and other governmental funds is explained in Management's Discussion and Analysis.
127

CITY OF DINUBACHANGES IN FUND BALANCES OF GOVERNMENTAL FUNDSLAST TEN FISCAL YEARS (Modified Accrual Basis of Accounting)
2012 2013 2014 2015 2016Revenues Taxes and Assessments 15,763,647$ 10,054,422$ 10,127,924$ 14,673,041$ 15,417,110$ Licenses and Permits 490,803 533,126 388,248 825,421 410,496 Assessments - - - - - Intergovernmental 6,873,909 8,840,363 13,389,637 10,254,854 9,817,361 Charges for Services 2,297,156 1,842,951 2,611,700 2,629,858 1,386,822 Use of Money and Property 615,073 105,029 372,987 116,046 265,203 Fines and Forfeitures 393,113 118,693 83,015 83,345 96,196 Reimbursements 1,983,721 1,993,316 1,866,721 773,948 2,560,957 Miscellaneous 280,827 183,644 193,101 26,586 46,056
Total Revenues 28,698,249 23,671,544 29,033,333 29,383,099 30,000,201
Expenditures Current General Government 3,198,893 3,567,574 3,062,629 3,221,524 3,504,184 Public Safety 7,622,470 8,512,170 9,155,928 9,573,198 10,454,857 Public Works 2 2,305,236 2,108,997 2,497,426 2,361,778 2,880,100 Community development 1,254,396 3,077,272 1,813,416 1,205,315 813,013 Parks and Recreation 1 1,595,747 1,108,050 1,140,903 1,235,269 1,458,541 Capital Outlay 5,230,041 5,070,355 12,419,958 14,428,933 11,512,821 Debt Service Principal Retirement 2,209,513 1,814,520 991,156 1,001,685 980,865 Interest and Fiscal Charges 1,967,183 816,403 1,010,139 1,177,009 1,216,247 Debt Issuance Costs 331,022 106,924 - -
Total Expenditures 25,383,479 26,406,363 32,198,479 34,204,711 32,820,628
Excess of Revenues Over (Under) Expenditures 3,314,770 (2,734,819) (3,165,146) (4,821,612) (2,820,427)
Other Financing Sources (Uses) Proceeds from Issuance of debt - - - - 1,300,000 Transfers In 7,319,087 2,330,637 6,091,537 10,198,943 3,115,598 Transfers Out (8,270,637) (6,500,021) (5,549,298) (10,506,999) (3,385,322) Sales of Property 291,150 500,687 402,248 368,524 148,146 Capital Leases - - - - - Special Item - - - - - Issuance of Long Term Debt - 12,770,000 8,982,000 - - Original issuance discount - (314,360) - - - Payment to Refunded Bond Escrow Agent - (6,684,833) - - -
Total Other Financing Sources (Uses) (660,400) 2,102,110 9,926,487 60,468 1,178,422
Net Change in Fund Balances before Extraordinary Item 2,654,370 (632,709) 6,761,341 (4,761,144) (1,642,005)
Extraordinary Item - Litigation Settlement - 145,910 - - -
Net Change In Fund Balances 2,654,370$ (486,799)$ 6,761,341$ (4,761,144)$ (1,642,005)$
Debt Service as a percentage of non-capital expenditures 21.5% 13.5% 10.1% 11.0% 11.5%
Source: City of Dinuba Financial Services Division
128

2017 2018 2019 2020 2021
17,699,777$ 13,823,138$ 14,831,798$ 18,228,311$ 23,872,090$ 269,630 - - - -
- 1,553,351 1,567,928 1,168,344 1,200,122 3,885,183 5,099,899 6,329,384 6,724,227 11,512,896 1,275,159 2,818,004 2,909,545 3,610,155 2,277,342
205,154 454,092 695,301 971,096 638,369 113,012 235,466 178,240 517,712 251,220
2,205,415 - - - - 157,286 326,652 345,486 345,331 294,962
25,810,616 24,310,602 26,857,682 31,565,176 40,047,001
6,363,752 3,824,662 2,565,387 2,737,350 2,878,155 10,820,834 10,786,365 10,465,411 10,827,257 11,123,053
2,299,448 6,072,381 1,758,071 2,211,741 2,188,240 270,174 1,911,234 1,614,439 1,665,387 1,404,584
1,640,604 1,780,297 1,840,142 1,838,979 1,814,007 2,811,519 739,058 3,656,178 4,394,413 9,894,559
7,131,417 1,156,606 1,208,551 1,293,760 1,376,732 1,762,202 1,020,930 989,520 957,349 912,442
- - - - -
33,099,950 27,291,533 24,097,699 25,926,236 31,591,772
(7,289,334) (2,980,931) 2,759,983 5,638,940 8,455,229
6,764,759 437,479 36,863 373,064 - 5,091,147 2,907,190 2,610,730 4,339,191 4,622,039
(4,094,047) (2,081,721) (2,248,067) (3,473,677) (3,798,583) - - - - 49,128 - - 197,363 85,667 197,476 - - - (11,409,298) - - - - - - - - - - - - - - - -
7,761,859 1,262,948 596,889 (10,085,053) 1,070,060
472,525 (1,717,983) 3,356,872 (4,446,113) 9,525,289
- - - - -
472,525$ (1,717,983)$ 3,356,872$ (4,446,113)$ 9,525,289$
29.0% 8.3% 10.8% 9.5% 9.8%
129

TotalCharges Operating Capital Total Total Government-
For Grants And Grants And Program General WideFiscal Year Services Contributions Contributions Revenues Revenues Revenues
2012 3,115,053$ 3,279,460$ 2,436,154$ 8,830,667$ 18,940,309$ 27,770,976$ 2013 2,899,821 4,462,789 5,669,203 13,031,813 9,978,542 23,010,355 2014 5,245,274 6,248,747 25,473,768 36,967,789 8,585,330 45,553,119 2015 8,082,453 3,274,094 10,114,120 21,470,667 11,225,042 32,695,709 2016 7,750,120 3,375,630 12,075,630 23,201,380 16,232,630 39,434,010 2017 9,859,879 5,263,630 3,011,810 18,135,319 15,071,673 33,206,992 2018 4,495,062 2,168,438 19,289,803 25,953,303 16,816,801 42,770,104 2019 4,632,408 2,292,863 5,687,693 12,612,964 17,815,952 30,428,916 2020 5,369,892 1,076,942 3,613,910 10,060,744 21,266,838 31,327,582 2021 3,747,333 7,124,303 2,237,038 13,108,674 34,792,785 47,901,459
All Use Of TotalProperty Sales Utility Users Other Money And General
Fiscal Year Taxes Taxes Taxes Taxes Property Revenues
2011 5,078,633$ 5,803,277$ 1,560,074$ 2,972,620$ 360,997$ 15,775,601$ 2012 3,461,506 9,843,519 1,600,423 3,746,405 288,456 18,940,309 2013 645,437 3,677,282 1,622,049 3,745,797 287,977 9,978,542 2014 742,122 3,700,400 1,612,836 2,267,781 262,191 8,585,330 2015 846,306 5,461,810 1,630,654 2,519,409 766,863 11,225,042 2016 1,260,845 9,729,414 1,683,265 3,296,336 262,770 16,232,630 2017 1,149,426 9,080,769 1,482,077 3,158,247 201,154 15,071,673 2018 1,166,971 9,926,107 1,491,791 3,777,840 454,092 16,816,801 2019 1,301,585 10,777,734 1,475,873 3,565,459 695,301 17,815,952 2020 1,377,047 14,059,028 1,534,979 3,570,886 724,898 21,266,838 2021 1,517,322 19,276,913 1,668,455 11,667,512 662,583 34,792,785
Source: City of Dinuba Financial Services Division
PROGRAM REVENUES
CITY OF DINUBAGOVERNMENT-WIDE REVENUESLAST TEN FISCAL YEARS
GENERAL REVENUES
130

Taxes Licenses Charges Use Of FinesAnd And For Money And And
Fiscal Year Assessments Permits Intergovernmental Services Property Forfeitures
2012 15,763,647$ 490,803$ 6,873,909$ 2,297,156$ 615,073$ 393,113$ 2013 10,054,422 533,126 8,840,363 1,842,951 105,029 118,693 2014 10,127,924 388,248 13,389,637 2,611,700 372,987 165,482 2015 14,673,041 825,421 10,254,854 2,629,858 116,046 83,345 2016 15,417,110 410,496 9,817,361 1,386,822 265,203 96,196 2017 17,699,777 269,630 3,885,183 1,275,159 205,154 113,012 2018 13,823,138 - 5,099,899 2,818,004 454,092 235,466 2019 14,831,798 - 6,329,384 2,909,545 695,301 178,240 2020 18,228,311 - 6,724,227 3,610,155 971,096 517,712 2021 23,872,090 - 11,512,896 2,277,342 638,369 251,220
TotalGeneral
GovernmentFiscal Year Reimbursements Miscellaneous Assessments Revenues
2012 1,983,721$ 280,827$ -$ 28,698,249$ 2013 1,993,316 183,644 - 23,671,544 2014 1,866,721 193,101 - 29,115,800 2015 773,948 26,586 - 29,383,099 2016 2,560,957 46,056 - 30,000,201 2017 2,205,415 157,286 - 25,810,616 2018 - 326,652 1,553,351 24,310,602 2019 - 345,486 1,567,928 26,857,682 2020 - 345,331 1,168,344 31,565,176 2021 - 294,962 1,200,122 40,047,001
Source: City of Dinuba Financial Services Division
CITY OF DINUBAGENERAL GOVERNMENT REVENUES BY SOURCE 1
LAST TEN FISCAL YEARS
131

Year County Portion ofEnded Assessed Tax Rate Assessed
June 30 Value 2 Per $100 Value Tax Rate 3 Tax Levy
2012 921,046,459$ 1.1160 376,464,415$ 0.174% 655,249$ 2013 933,234,251 1.1110 383,803,558 0.168% 645,437 2014 976,358,668 1.1110 406,708,703 0.182% 742,122 2015 985,816,882 1.2246 424,657,013 0.194% 823,237 2016 1,060,846,254 1.1285 431,998,964 0.287% 1,238,278 2017 1,116,863,014 1.1459 444,394,065 0.259% 1,149,426 2018 1,104,970,655 1.6906 457,636,600 0.255% 1,166,972 2019 1,167,672,497 1.1450 473,212,129 0.275% 1,301,585 2020 1,217,137,041 1.8701 491,911,581 0.280% 1,377,047 2021 1,289,180,103 1.0813 535,203,627 0.284% 1,517,322
1 Estimated Actual Value of Taxable Property is not available since passage of Proposition 13 in 1978. Property assessed values may rise only to a maximum of 2% per year unless there is new construction or when the property is sold. Consequently, estimated values are not available.
2 Pursuant to chapter 1207 of the statutes of 1978, "Assessed Value" means 100% of full taxable value.
3 The City's total direct tax rate varies by tax rate area. The rate shown is the combined rate for the entire city and may not match the rate shown on the "Direct and Overlapping Property Tax Rates" schedule.
Source: Tulare County Auditor's OfficeSource: California Municipal Statistics, Inc.
CITY OF DINUBAPROPERTY AD VALOREM TAX ASSESSED VALUES 1
LAST TEN FISCAL YEARS
City
$-
$200
$400
$600
$800
$1,000
$1,200
$1,400
2012 2013 2014 2015 2016 2017 2018 2019 2020 2021
Mill
ions
Series2
132

Percent Of Percent OfTotal Total
Assessed Assessed Assessed AssessedTaxpayer Type Of Business Valuation Valuation Rank Valuation Valuation Rank
Ruiz Foods Products Inc. Frozen Food 67,485,575$ 5.54% 1 58,571,952$ 6.31% 2
Best Buy Stores, Inc. Distribution Center 42,803,700 3.52% 2 64,356,206 6.93% 1
Best Buy Warehouse Logistic Distribution Center 23,231,720 1.91% 3 16,554,619 1.78% 4
Wal-mart Store Inc Retail Store 19,393,900 1.59% 4 14,526,860 1.56% 5
Patterson Dental Supply Wholesaler 15,353,430 1.26% 5
Dinuba Properties Apartment Complex 10,848,588 0.89% 6
Boscacci Group Real Estate Investment 7,745,373 0.64% 7 6,611,643 9
Aung San LLC Holiday Inn 6,650,098 0.55% 8
College Operations LLC Real Estate Investment 5,377,250 0.44% 9
Red Rock Plaza Center LLC Real Estate Investment 5,250,000 0.43% 10 7,040,150 0.76% 7
Odwalla, Inc. Fruit Juices 43,374,060 4.67% 3
Dinuba - Veto LLC Real Estate Investment 8,457,067 0.91% 6
PEPSU Inc 6,989,841 0.75% 8
West Star Construction 6,226,175 0.67% 10204,139,634$ 16.77% 232,708,573$ 24.34%
Source: Tulare County Auditor's Office
Fiscal Year 2021 Fiscal Year 2012
CITY OF DINUBAPRINCIPAL PROPERTY TAXPAYERSAS OF JUNE 30, 2021 AND 2012
133

CITY OF DINUBADIRECT AND OVERLAPPING PROPERTY TAX RATES(Rate per $100 of Assessed Value)LAST FIVE FISCAL YEARS
2017 2018 2019 2020 2021City Direct Rates: City basic rate 0.191$ 0.191$ 0.189$ 0.189$ 0.188$
Total City Direct Rate 0.191 0.191 0.189 0.189 0.188
Overlapping Rates:Tulare County 0.177 0.177 0.176 0.176 0.176Library 0.015 0.153 0.015 0.015 0.015Dinuba School District 0.273 0.273 0.272 0.273 0.273Community College District 0.046 0.456 0.046 0.456 0.046Tuluare County Schools 0.024 0.024 0.024 0.240 0.024Alta Cemetery 0.008 0.008 0.008 0.008 0.008Alta Hospital District 0.018 0.018 0.018 0.018 0.018Delta Vector Control 0.014 0.014 0.014 0.136 0.014Dinuba Memorial District 0.005 0.005 0.005 0.005 0.005Tulare County Air Pollution District 0.000 0.000 0.000 0.000 0.003Tulare County Flood District 0.002 0.002 0.002 0.002 0.002Education Revenue Augmentation 0.227 0.226 0.230 0.230 0.231Dinuba School District Bonds 0.120 0.120 0.120 0.095 0.060Community College Bonds 0.026 0.023 0.026 0.026 0.018Total Direct Rate1
1.146$ 1.691$ 1.145$ 1.870$ 1.081$
NOTE: In 1978, California voters passed Proposition 13, which sets the property tax rate at a 1.000% fixed amount. This 1.000% is shared by all taxing agencies for which the subject property resides within. In addition to the fixed amount, property owners are charged taxes as a percentage of assessed property values for the payment of bonded debt service on the voter-approved School District and Community College bonds.
1 The City's total direct tax rate varies by tax rate area. The rate provided comes from tax rate area 001-005 and is representative of other tax rate areas within the City.
Source: Tulare County Assessor's Office
134

Year Current Percent ofEnded Total Tax Levy
June 30 Tax Levy Collections Collected 1
2012 3,311,306$ 3,231,844$ 97.60
2013 2 665,948 645,437 96.92
2014 759,282 742,122 97.74
2015 844,692 823,237 97.46
2016 1,267,299 1,238,278 97.71
2017 1,178,415 1,149,426 97.54
2018 1,192,370 1,166,972 97.87
2019 1,329,640 1,301,585 97.89
2020 1,408,743 1,377,047 97.75
2021 1,545,764 1,517,322 98.16
2 Previously, redevelopment tax increment was shown in this table. With the dissolution of of redevelopment, only the City's property is being shown.
Source: Tulare County Auditor's Office
CITY OF DINUBAPROPERTY TAX LEVIES AND COLLECTIONSLAST TEN FISCAL YEARS
$-
$500,000
$1,000,000
$1,500,000
$2,000,000
$2,500,000
$3,000,000
$3,500,000
2012 2013 2 2014 2015 2016 2017 2018 2019 2020 2021Tax Levy Tax Collections
135

CITY OF DINUBARATIOS OF OUTSTANDING DEBT BY TYPELAST TEN FISCAL YEARS
GeneralBonded Total
Fiscal Debt Capital Contracts Notes Premiums GovernmentalYear Outstanding Leases Payable Payable Discounts Activities
2012² $11,291,970 $932,596 $190,471 $1,247,879 $0 $13,662,9162013 $19,595,000 $701,861 $146,016 $23,549 ($306,247) $20,160,1792014 $18,895,000 $9,442,497 $99,516 $20,257 ($318,416) $28,138,8542015 $18,265,000 $9,012,913 $50,877 $16,734 ($281,909) $27,063,6152016 $17,590,000 $10,085,195 $0 $12,965 ($269,740) $27,418,4202017 $17,230,000 $9,897,810 $0 $8,932 ($78,724) $27,058,0182018 $16,425,000 $10,000,236 $0 $4,616 ($75,032) $26,354,8202019 $15,640,000 $9,778,664 $0 $0 ($71,340) $25,347,3242020 $14,810,000 $9,518,983 $0 $0 ($67,648) $24,261,3352021 $13,960,000 $9,155,980 $0 $0 ($63,956) $23,052,024
Certificates TotalFiscal Of Notes Capital Contracts Premiums Business-TypeYear Participation Payable Leases Payable Discounts Activities
2012 $3,005,000 $7,580,353 $0 $611,334 $0 $11,196,6872013 $11,030,000 $7,108,030 $292,146 $534,813 $0 $18,964,9892014 $18,895,000 $6,736,215 $222,586 $454,773 $0 $26,308,5742015 $10,540,000 $7,194,326 $150,758 $373,930 $0 $18,259,0142016 $10,315,000 $6,602,194 $76,588 $292,286 $0 $17,286,0682017 $10,085,000 $5,994,444 $0 $209,814 $45,809 $16,335,0672018 $9,845,000 $5,365,859 $185,699 $126,516 $43,659 $15,566,7332019 $9,605,000 $4,721,122 $344,996 $42,382 $41,509 $14,755,0092020 $9,045,000 $4,284,949 $415,111 $0 $39,359 $13,784,4192021 $8,518,000 $3,836,983 $716,805 $0 $37,209 $13,108,997
Fiscal Primary Per
Year Government Capita 1
2012 $24,859,603 $1,0992013 $39,125,168 $1,6952014 $54,447,428 $2,3022015 $45,322,629 $1,8912016 $44,704,488 $1,8132017 $43,393,085 $1,7452018 $41,921,553 $1,6852019 $40,102,333 $1,5832020 $38,045,754 $1,4642021 $36,161,021 $1,364
Note: Details regarding the City's outstanding debt can be found in the Notes to theFinancial Statements.
1 See the table of Population and Unemployment Rate later in this section for personal
income and population data. Personal income data is not available.2 As of February 1, 2012, obligations of the former Redevelopment Agency were transferred to the
Successor Agency resulting in a decrease in Government Bonds outstanding Tax Allocation Bonds, notes and loans, and other revenue bonds of the former Agency will be paid as enforceable obligations of the Successor Agency.
Source: City of Dinuba Financial Services Division
Governmental Activities
Business-Type Activities
136

Less: Amounts TotalAvailable General Percentage
Lease in Debt Bonded of AssessedRevenue Service Debt Value of Per
Fiscal Year Bonds Funds Outstanding Property 1 Capita
2012 2 13,455,000$ 2,163,030$ 11,291,970$ 1.2% 499$ 2013 13,160,000 1,907,038 11,252,962 1.2% 488 2014 18,895,000 739 18,894,261 1.9% 799 2015 18,265,000 2,952 18,262,048 1.9% 762 2016 17,590,000 1,260,186 16,329,814 1.5% 662 2017 17,230,000 1,256,567 15,973,433 1.4% 643 2018 16,425,000 1,257,257 15,167,743 1.4% 610 2019 15,640,000 1,256,850 14,383,150 1.2% 568 2020 14,810,000 1,389,617 13,420,383 1.1% 516 2021 13,960,000 1,253,950 12,706,050 1.0% 479
1 Estimated Actual Value of Taxable Property is not available since passage of Proposition 13 in 1978.
Property assessed values may rise only to a maximum of 2% per year unless there is new construction or when the property is sold. Consequently, estimated values are not available.
2 As of February 1, 2012, obligations of the former Redevelopment Agency were transferred to the Successor Agency resulting in a decrease in Government Bonds outstanding Tax Allocation Bonds, notes and loans, and other revenue bonds of the former Agency will be paid as enforceable obligations
of the Successor Agency.
Source: City of Dinuba Financial Services Division
CITY OF DINUBARATIOS OF GENERAL BONDED DEBT OUTSTANDINGLAST TEN FISCAL YEARS
137

2020 - 2021 Assessed Valuation: $1,289,180,103
Redevelopment Incremental Valuation:----------------------------------
City Adjusted Assessed Valuation $1,289,180,103
ESTIMATEDOUTSTANDING SHARE OF
DEBT OUTSTANDING
6/30/2021 % APPLICABLE 1 DEBT
OVERLAPPING TAX AND ASSESSMENT DEBT State Center Community College District $343,015,000 1.351% $4,634,133
Dinuba Joint Unified School District 17,326,634 68.431% 11,856,789
Kings Canyon Joint Unified School District 76,974,916 0.882% 678,919
--------------------- ---------------------
TOTAL OVERLAPPING TAX AND ASSESSMENT DEBT 437,316,550 17,169,840
DIRECT AND OVERLAPPING GENERAL FUND DEBT: Tulare County General Fund Obligations 29,800,000 3.343% 996,214
Tulare County Pension Obligation Bonds 222,800,000 3.343% 7,448,204
Tulare County Board of Education Certificates of Participation 36,800,000 3.343% 1,230,224
Dinuba Joint Unified School District Certificates of Participation 9,395,000 68.431% 6,429,092
City of Dinuba General Fund Obligations 23,502,024 100.000% 23,502,024
--------------------- ---------------------
TOTAL OVERLAPPING GENERAL FUND OBLIGATION DEBT 322,297,024 39,605,758
OVERLAPPING TAX INCREMENT DEBT (Successor Agency): 42,510,000 100.0000% 42,510,000
TOTAL DIRECT DEBT 23,502,024
TOTAL OVERLAPPING DEBT 75,783,575
COMBINED TOTAL DEBT 99,285,599$ 2
Debt Ratios:
Ratios to 2020-21 Adjusted Valuation: Total Overlapping Tax and Assessment Debt 1.33%
Total Direct Debt ($22,884,902) 1.78%
Combined Total Debt 7.65%
Ratios to Redevelopment Increment Valuation ($797,268,522): Total Overlapping Tax Increment Debt 5.33%
1 The percentage of overlapping debt applicable to the city is estimated using taxable assessed property value. Applicable
percentages were estimated by determining the portion of the overlapping district's assessed value that is within the boundaries
of the city divided by the district's total taxable assessed value.
2 Excludes tax and revenue anticipation notes, enterprise revenue, mortgage revenue and non-bonded capital lease obligations.
Qualified Zone Academy bonds are included based on principal due at maturity.
Source: California Municipal Statistics, Inc.
CITY OF DINUBASTATEMENT OF DIRECT AND OVERLAPPING DEBTAs of June 30, 2021
138

Total Assessed Valuation $1,289,180,103
Debt Limit - 15% of Total Assessed Valuation $193,377,015
Amount of Debt Applicable to the Limit 43,393,085
Legal Debt Margin $149,983,930
Total DebtApplicable
Total Legal As ADebt Debt Debt Percentage
Fiscal Year Limit Applicable Margin Of Debt Limit
2012 $138,156,969 $24,859,603 $113,297,366 18.0%
2013 $139,985,138 $39,125,168 $100,859,970 27.9%
2014 $146,453,800 $54,447,428 $92,006,372 37.2%
2015 $147,872,532 $45,322,629 $102,549,903 30.6%
2016 $159,126,938 $44,704,488 $114,422,450 28.1%
2017 $167,529,452 $43,393,085 $124,136,367 25.9%
2018 $165,745,598 $41,921,553 $123,824,045 25.3%
2019 $175,150,875 $40,102,333 $135,048,542 22.9%
2020 $182,570,556 $38,045,754 $144,524,802 20.8%
2021 $193,377,015 $36,161,021 $157,215,994 18.7%
Source: City of Dinuba Financial Services Division
LEGAL DEBT MARGIN INFORMATIONLAST TEN FISCAL YEARS
CITY OF DINUBACOMPUTATION OF LEGAL DEBT MARGINFOR THE FISCAL YEAR ENDED JUNE 30, 2020
139

Year Sewer Charges Less: NetEnded And Other Operating Available Total Debt Service
June 30 Contributions 1 Expenses 2 Revenue Principal Interest Debt Service Coverage
2012 3,293,667$ 1,744,908$ 1,548,759$ 290,000$ 938,250$ 1,228,250$ 1.262013 2,945,488 1,641,917 1,303,571 240,000 618,372 858,372 1.522014 3,062,058 1,920,430 1,141,628 270,000 421,644 691,644 1.652015 3,915,684 2,063,218 1,852,466 220,000 415,412 635,412 2.922016 4,027,942 2,275,360 1,752,582 225,000 409,500 634,500 2.762017 4,067,626 2,155,155 1,912,471 230,000 403,355 633,355 3.022018 3,443,625 3,581,543 (137,918) 240,000 396,891 636,891 (0.22)2019 3,845,532 2,053,342 1,792,190 240,000 324,271 564,271 3.182020 3,712,741 2,234,678 1,478,063 490,000 268,986 758,986 1.952021 4,650,641 1,595,020 3,055,621 527,000 302,490 829,490 3.68
1 Includes transfers from the Water Fund. Bond proceeds from the 2002 Refunding Bond were also used to fund certain Water projects. Therefore, the water fund pays a proportionate share of the debt service.2 Depreciation is eliminated for this calculation.
Source: City of Dinuba Financial Services Division
CITY OF DINUBAPLEDGED-REVENUE COVERAGELAST TEN FISCAL YEARS
Certificates of Participation (Sewer Fund)
(0.50)
0.00
0.50
1.00
1.50
2.00
2.50
3.00
3.50
4.00
2012 2013 2014 2015 2016 2017 2018 2019 2020 2021
Series14
140

Fiscal Year Principal Interest Total
2022 895,000$ 474,450$ 1,369,450$ 2023 910,000 440,475 1,350,475 2024 725,000 412,950 1,137,950 2025 755,000 389,450 1,144,450 2026 775,000 361,963 1,136,963 2027 805,000 331,656 1,136,656 2028 835,000 300,194 1,135,194 2029 870,000 268,988 1,138,988 2030 900,000 238,088 1,138,088 2031 935,000 206,044 1,141,044 2032 960,000 172,931 1,132,931 2033 1,000,000 138,675 1,138,675 2034 550,000 111,950 661,950 2035 565,000 93,175 658,175 2036 595,000 73,625 668,625 2037 610,000 53,325 663,325 2038 625,000 32,500 657,500 2039 650,000 10,975 660,975
13,960,000$ 4,111,413$ 18,071,413$
Source: City of Dinuba Financial Services Division
CITY OF DINUBAGENERAL BONDED INDEBTEDNESS
Lease Revenue Bonds
MATURITIES BY FISCAL YEAR
141

City PopulationCity Tulare County as % of Unemployment
Fiscal Year Population 1 % Change Population County Population Rate 3
2012 22,614 2.94% 450,840 5.02% 21.2%2013 23,082 2.03% 455,599 5.07% 18.9%2014 23,666 2.47% 459,446 5.15% 17.3%2015 23,966 1.25% 462,189 5.19% 10.9%2016 24,657 2.80% 466,339 5.29% 10.7%2017 24,861 0.82% 471,842 5.27% 9.5%2018 24,873 0.05% 475,479 5.23% 8.3%2019 25,328 1.80% 479,112 5.29% 8.5%2020 25,994 2.56% 479,977 5.42% 10.9%2021 26,517 1.97% 481,733 5.50% 8.4%
Source: California Department of Finance California Employment Development Department
Note: Per capita income and total personal income information not available.
CITY OF DINUBAPOPULATION AND UNEMPLOYMENT RATELAST TEN FISCAL YEARS
4.70%4.80%4.90%5.00%5.10%5.20%5.30%5.40%5.50%5.60%
2012 2013 2014 2015 2016 2017 2018 2019 2020 2021
Series8
142

Percent of Percent ofTotal TotalCity City
Employer Type of Business Employees Employment Rank Employees Employment Rank
Ruiz Foods Products Inc. Frozen Food 1,644 44% 1 1,540 38% 1
Dinuba Public Schools Education 697 19% 2 639 16% 2
Best Buy Stores, Inc. Distribution Center 500 13% 3 330 8% 5
Wal-Mart Retail Store 455 12% 4 400 10% 4
Patterson Dental Wholesaler 179 5% 5 151 4% 7
City of Dinuba Local Government 165 4% 6
United Market Retail Store 44 1% 7
Tractor Supply Retail Store 25 1% 8
Grocery Outlet Retail Store 23 1% 9
MV Transportation Transportation 10 0% 10
Family Tree Farms Produce Packing 500 12% 3
Surabian and Sons Produce/Packing 125 3% 8
Odwalla 1 Fruit Juices 210 5% 6
Patterson Dental Wholesaler 92 2% 10
Kmart Retail Store 98 2% 9
3,742 100.00% 4,085 100.00%
Source: City of Dinuba and the U. S. Bureau of the Census
CITY OF DINUBAPRINCIPAL EMPLOYERSAS OF JUNE 30, 2021 AND 2012
Fiscal Year 2021 Fiscal Year 2012
143

CITY OF DINUBAEMPLOYEES BY FUNCTION (FULL TIME EQUIVALENTS)LAST TEN FISCAL YEARS
Fiscal Year2012 2013 2014 2015 2016 2017 2018 2019 2020 2021
Governmental Activities General Government 17.6 18.0 18.0 17.0 19.1 18.5 17.4 16.5 12.7 10.0 Public Safety 81.5 84.0 90.4 94.4 99.5 112.7 101.5 87.5 95.9 90.5 Public Works 14.0 14.7 13.0 16.0 18.1 10.9 22.8 21.5 23.5 20.6 Parks and Recreation 1 13.7 13.1 12.7 13.2 17.3 13.3 23.0 21.9 23.8 22.7 Water 5.2 6.2 6.2 6.2 7.7 7.7 8.7 7.3 9.4 9.9 Sewer 5.3 5.3 5.3 5.3 5.3 5.3 6.3 5.7 7.0 7.5 Disposal 1.2 1.2 1.9 1.9 2.8 2.6 3.7 2.3 3.1 3.6Total Government-Wide Employees 138.5 142.5 147.4 154.0 169.8 170.9 183.2 162.7 175.5 164.8
0.0
20.0
40.0
60.0
80.0
100.0
120.0
140.0
160.0
180.0
200.0
2012 2013 2014 2015 2016 2017 2018 2019 2020 2021
Disposal Sewer Water Parks and Recreation 1 Public Works Public Safety General Government 16.8 34.0 37.2 25.5 11.0 12.2 11.8 24.3 24.3 24.9 24.7 18.0 18.0 19.0
144

CITY OF DINUBACONSTRUCTION ACTIVITYLAST TEN CALENDAR YEARS
Calendar Total Total Number NumberYear Permits Valuation Permits Valuation Permits Valuation
2012 543 43,487,055$ 13 9,295,706$ 161 20,246,430$
2013 430 20,466,026 4 1,488,000 99 11,149,388
2014 437 16,722,112 5 8,448,970 41 4,244,435
2015 552 14,559,111 2 490,000 78 8,286,981
2016 689 7,134,510 2 1,110,000 57 5,565,450
2017 712 15,863,961 5 1,517,700 62 5,777,900
2018 754 31,539,649 1 60,000 70 9,485,662
2019 734 24,624,270 2 2,500,000 88 13,024,036
2020 945 46,726,003 3 1,525,400 242 33,023,369
2021 880 37,467,036 2 698,982 111 18,212,861
Calendar Number NumberYear Permits Valuation Permits Valuation
2012 0 -$ 382 13,944,919$
2013 1 2,450,000 326 5,378,638
2014 0 - 391 4,028,707
2015 0 - 472 5,782,130
2016 0 - 630 459,060
2017 0 - 645 8,568,361
2018 3 8,522,081 680 13,471,903
2019 0 - 644 9,100,234
2020 0 - 709 12,177,264
2021 0 - 767 18,555,193
Source: City of Dinuba Annual Building Report
Commercial and Office Residential Single
Residential Multi-Units All Other
145

CITY OF DINUBA
GROSS VALUE
1. Milk 1,866,696,000$ 2. Oranges - Navels & Valencias 1,062,257,000 3. Cattle & Calves 602,035,000 4. Grapes 569,813,000 5. Pistachio Nuts 444,235,000 6. Tangerines - Fresh 402,116,000 7. Almonds Meats & Hulls 352,338,000 8. Lemon 268,650,000 9. Corn - Grain & Silage 185,758,000
10. Peach Cling & Freestone 171,961,000
Total Value of the Top Ten Tulare County Crops 5,925,859,000$
Total Value of All Tulare County Crops 7,140,076,500$
Source: Tulare County Agricultural Commissioner news release
PRODUCT
ranching for 2020.The following list comprises the major cash crops in the county from farming and
which currently ranks second in the nation in agricultural productivity.
TULARE COUNTY CROP STATISTICSFOR THE CALENDAR YEAR 2020
Dinuba lies in the heart of the farming area of Tulare County, California,
146

CITY OF DINUBACAPITAL ASSETS USEDLAST TEN FISCAL YEARS
2012 2013 2014 2015 2016 2017 2018 2019 2020 2021
Water: Number Water Wells 8 8 8 8 8 8 8 8 8 8 Annual Production (Million Gal) 1,996 1,570 1,790 1,578 1,218 1,274 1,399 1,463 1,468 1,635 Service Connections 5,581 5,633 5,937 5,742 5,862 5,964 6,031 6,131 6,327 6,448
Police: Stations 2 2 2 2 2 1 1 1 1 1
Sworn Officers 35 34 33 36 28 27 24 32 32 34
Support Personnel 10 10 9 11 11 13 11 11 11 11
Part-Time Support Personnel 8 3 3 2 2 2 2 2 2 2
Police Vehicles 35 37 36 40 38 43 46 49 37 36
Motorcycles 2 2 4 4 4 4 4 4 5 5
Fire: Stations 1 1 1 1 1 1 1 1 1 1 Firefighters 24 23 26 26 26 26 26 26 26 26 Fire and Rescue Vehicles 5 5 5 5 5 6 6 6 6 6 Ambulances 4 4 5 5 5 6 6 6 6 6 Staff Vehicles 5 6 6 4 5 5 5 5 5 6
Parks and Recreation: Parks 13 13 13 13 13 13 13 13 13 13 Acres of Park land 66 66 66 66 66 66 66 66 66 66 Acres of Open Space 56 56 56 56 56 56 56 56 56 56 Recreation Centers 2 2 2 2 2 2 2 2 2 2
Other: City Land Area (Square Miles) 4.90 4.90 4.90 4.90 4.90 4.90 4.90 4.90 4.90 4.90
Miles of Water Main 74.0 74.0 74.0 74.0 74.0 74.0 74.0 74.0 74.0 74.0
Miles of Storm Drain 19.0 19.0 19.0 19.0 19.0 19.0 19.0 19.0 19.0 19.0
Miles of Sewer Main 74.0 74.0 74.0 74.0 74.0 74.0 74.0 74.0 74.0 74.0
Miles of City Streets 65.7 65.7 65.7 65.7 65.7 65.7 65.7 65.7 65.7 65.7
Source: City of Dinuba Financial Services Division
147

CITY OF DINUBADEMANDS FOR CITY SERVICESLAST TEN FISCAL YEARS
Number of Number of Number of Number ofUtility Police 911 Emergency Sworn
Fiscal Year Population Customers Calls - Total Calls Officers
2012 22,614 5,581 39,161 4,535 352013 23,082 5,633 38,550 5,967 342014 23,666 5,927 34,611 5,844 352015 23,966 5,742 38,637 13,397 342016 24,657 5,862 41,314 1,845 282017 24,861 5,964 42,319 1,487 372018 24,873 6,031 40,019 2,271 322019 25,328 6,131 38,525 8,811 322020 25,994 6,327 37,870 3,065 322021 26,517 6,448 36,655 1,774 34
Number of Number of Number ofFire Ambulance Fire
Fiscal Year Calls 1 Runs Fighters
2012 460 3,304 242013 572 3,594 232014 666 3,646 262015 887 3,647 242016 773 4,154 262017 861 3,968 262018 984 4,093 262019 613 4,466 262020 529 4,522 262021 458 5,471 26
1 Includes calls for fires, explosions, and hazardous conditions.
Source: City of Dinuba Financial Services Division, Fire Department, and Police Department
148

CITY OF DINUBAGENERAL GOVERNMENTALEXPENDITURES BY FUNCTIONLAST TEN FISCAL YEARS 1
2012 2013 2014 2015 2016
Governmental Activities General Government 3,439,679$ 4,339,158$ 4,703,501$ 5,345,434$ 4,802,762$ Public Safety 8,167,990 8,990,013 9,591,236 13,275,052 13,746,235 Public Works 1,826,602 2,197,625 2,761,922 3,334,975 3,943,500 Community Development 1,007,987 636,986 548,112 1,641,605 1,178,906 Parks and Recreation 1,796,570 1,136,847 1,224,454 1,682,401 1,824,431 Debt Service 1,720,593 1,020,371 1,521,663 1,204,781 1,278,342 Unallocated Depreciation 953,544 823,524 1,018,182 2,635,342 3,029,796 Total Governmental Activities Expenses 18,912,965$ 19,144,524$ 21,369,070$ 29,119,590$ 29,803,972$
2017 2018 2019 2020 2021
Governmental Activities General Government 7,661,240$ 3,989,322$ 3,647,223$ 4,464,243$ 7,635,027$ Public Safety 13,897,596 12,920,443 12,503,075 12,801,801 12,899,424 Public Works 3,752,225 6,577,677 2,429,367 5,116,719 3,009,339 Community Development 637,522 2,350,919 2,277,992 2,427,047 2,576,069 Parks and Recreation 2,007,951 2,127,602 2,527,531 2,705,703 2,858,033 Debt Service 1,604,463 978,293 1,008,877 1,001,611 935,126 Unallocated Depreciation 3,011,661 - - - - Total Governmental Activities Expenses 32,572,658$ 28,944,256$ 24,394,065$ 28,517,124$ 29,913,018$
1 Includes General, Special Revenue, Debt Service, and Capital Projects Funds.
Source: City of Dinuba Financial Services Division
149

YEAR EFFECTIVE DATE STATE RATE LOCAL RATE
2012 7/1/2011 7.25% 8.50%
2013 1/1/2013 7.50% 8.75%
2014 1/1/2013 7.50% 8.75%
2015 1/1/2013 7.50% 8.75%
2016 1/1/2013 7.50% 8.75%
2017 1/1/2017 7.25% 8.50%
2018 1/1/2017 7.25% 8.50%
2019 1/1/2017 7.25% 8.50%
2020 1/1/2017 7.25% 8.50%
2021 1/1/2017 7.25% 8.50%
Source: California State Board of Equalization
CITY OF DINUBASALES TAX RATESLAST TEN FISCAL YEARS
150

Taxpayer Business Type Taxpayer Business Type
Ace Hardware Bldg.Matls-Retail Autozone Auto Parts/RepairArco AM/PM Mini Marts Service Stations Bestbuy.com Furniture/ApplianceAutozone Auto Parts/Repair Big 5 Sporting Goods Recreation ProductsBest Buy Warehouse Logistics Business Services Burger King Restaurants RestaurantsBestbuy.com Furniture/Appliance Candy's Diesel Repair Auto Parts/RepairBig 5 Sporting Goods Recreation Products Dinuba Lumber Company Bldg.Matls-WhsleDinuba Auto Plaza Auto Sales - Used E B M Auto Sales Auto Sales - UsedEd Dena's Auto Center Auto Sales - New Ed Dena's Auto Center Auto Sales - NewElite Auto Wholesale Auto Salers - Used El Monte Gas Food & Car Wash Service StationsJack In The Box Restaurants Restaurants Gamestop Miscellaneous RetailJim Manning Dodge Chryslr Jeep Auto Sales - New Jack In The Box Restaurants RestaurantsKwik Serve Station Service Stations Jim Manning Dodge Chryslr Jeep Auto Sales - NewLiquor Locker Liquor Stores K Mart Stores Department StoresMcDonald's Restaurants Restaurants McDonald's Restaurants RestaurantsO'reilly Auto Parts Auto Parts/Repair Patterson Veterinary Supply Light IndustryPanda Express Restaurants Quick Shop Markets Food MarketsPatterson Veterinary Supply Light Industry Quick-N-Handy Mart & Deli Food MarketsQuick N Handy Mart & Deli Food Markets R J Food & Gas Service StationsQuick Shop Markets Food Markets Rhodes Service Stations Service StationsRite Aid Drug Stores Drug Stores Rite Aid Drug Stores Drug StoresScout Specialties Miscellaneous Other Ruiz Food Products Food Processing EqpTaco Bell Restaurants Smith Auto Parts Auto Parts/RepairTractor Supply Company Miscellaneous Retail United Market Food MarketsValero Service Stations Service Stations Valero Service Stations Service StationsWal Mart Stores Department Stores Walgreen's Drug Stores Drug Stores
Source: MuniServices
2020-21 2011-12
AS OF JUNE 30, 2021 AND 2012
CITY OF DINUBATOP 25 SALES TAX GENERATORS
(in alphabetical order)
Principal Sales Tax Producers
151

NAICS Category2016 2017 2018 2019 2020
Accommodation and Food Services 328,812$ 340,345$ 357,492$ 378,630$ 367,252$ Administrative and Support and Waste Management and Remediation Services 9,973 11,937 12,650 13,862 10,900 Agriculture, Forestry, Fishing and Hunting 25,747 40,868 110,241 48,492 9,213 Arts, Entertainment, and Recreation 3,093 2,812 2,244 5,302 - Construction 106,464 62,693 49,760 6,712 3,217 Information - - 1 - - Manufacturing 569,830 485,256 542,565 579,767 617,453 Mining, Quarrying, and Oil and Gas Extraction 8,963 9,865 10,615 7,727 12,188 Other Services (except Public Administration) 24,848 24,817 22,682 21,113 61,847 Professional, Scientific, and Technical Services 2,022 2,812 2,166 1,988 649 Real Estate and Rental and Leasing 808 1,006 908 263 78 Retail Trade 6,517,225 9,414,016 9,872,079 11,095,144 27,195,653 Undefined 405 (3,623) (726) (461) - Utilities 11,064 10,593 10,720 11,398 6,534 Grand Total 7,609,253$ 10,403,397$ 10,993,396$ 12,169,937$ 28,284,984$
Source: MuniServices
Note: 2020 is latest available year.
CITY OF DINUBAANNUAL SALES TAX BY CATEGORY2016-2020 CALENDAR YEARS
152

AMOUNT1. GENERAL LIABILITY
a. Self-insured retention, $1,000,000 limit 50,000$
b. Liability excess coverage 19,000,000
2. AUTO PHYSICAL DAMAGE
a. Comprehensive coverage, fire trucks, dump trucks, and ambulances, 5% of values at time of loss subject to 11,319,361 $10,000 minumum and $25,000 maximum.
b. Comprehensive coverage, low value vehicles under $25,000, $2,000 deductible 892,982
3. PROPERTY COVERAGE
a. Covers all owned buildings and contents at replacement cost, including data processing equipment and valuable papers, $5,000 deductible. 72,623,787
b. Miscellaneous Property Floater 6,301,331
c. Special Equipment. 3,814,462
d. Extra Expense Associated with Physical Damage or Loss 562,000
e. Extra Expense Associated with Floater Equipment 10,000
4. WORKERS' COMPENSATION
a. Self-insured retention $500,000 limit 50,000
b. Workers' compensation excess coverage 4,500,000
5. OTHER
a. Employee's fidelity dishonesty bond (Blanket) 250,000
b. Money & Securities 15,000
c. Wrongful Discharge, Discrimination, and Sexual Harrassment 1,000,000
d. Boiler & Machinery Property Coverage 100,000
e. Loss of Earnings/Extra Expense 2,828,400 $5,000 deductible
Source: City of Dinuba Risk Manager
CITY OF DINUBASCHEDULE OF INSURANCE IN FORCE FOR THE FISCAL YEAR ENDED JUNE 30, 2021
TYPES AND DETAILS OF COVERAGE
153

Related Documents