Annual Charter Evaluation 2020-21 Northwood Academy Charter School REPORT PURPOSE This report is the primary means by which the Charter Schools Office (CSO) of The School District of Philadelphia (District) presents performance information for each Philadelphia brick and mortar charter school. The Annual Charter Evaluation (ACE) is organized around the three performance domains of the CSO Performance Framework: Academic Success, Organizational Compliance and Viability, and Financial Health and Sustainability. The Charter School Performance Framework provides a detailed outline of the standards and categories that the CSO evaluates within each domain. Each domain receives a rating of “Meets Standard,” “Approaches Standard,” or “Does Not Meet Standard” based on points and ratings received. The Charter School Performance Framework also outlines the point and rating system. In the final year of the charter term, the CSO produces a Renewal Recommendation Report that provides a comprehensive review of the charter school's performance across these three domains throughout its charter term. These ratings and the substance of the evidence within each domain guide the overall renewal recommendation. If a charter school receives a “Does Not Meet Standard” rating in one or more domains, the CSO will review all evidence and data underlying the ratings to determine whether it will recommend a charter school for non-renewal. School receives "Approaches Standard" or "Meets Standard" ratings in all three domains School receives a "Does Not Meet Standard" rating in any of the domains School is recommended for renewal, possibly with conditions School is considered for a non - renewal recommendation How Performance Impacts Renewal Page 1 of 24

Welcome message from author
This document is posted to help you gain knowledge. Please leave a comment to let me know what you think about it! Share it to your friends and learn new things together.
Transcript

Annual Charter Evaluation 2020-21
Northwood Academy Charter School
REPORT PURPOSEThis report is the primary means by which the Charter Schools Office (CSO) of The School District of
Philadelphia (District) presents performance information for each Philadelphia brick and mortar charter
school.
The Annual Charter Evaluation (ACE) is organized around the three performance domains of the CSO
Performance Framework: Academic Success, Organizational Compliance and Viability, and Financial Health
and Sustainability. The Charter School Performance Framework provides a detailed outline of the standards
and categories that the CSO evaluates within each domain. Each domain receives a rating of “Meets
Standard,” “Approaches Standard,” or “Does Not Meet Standard” based on points and ratings received. The
Charter School Performance Framework also outlines the point and rating system.
In the final year of the charter term, the CSO produces a Renewal Recommendation Report that provides a
comprehensive review of the charter school's performance across these three domains throughout its charter
term. These ratings and the substance of the evidence within each domain guide the overall renewal
recommendation. If a charter school receives a “Does Not Meet Standard” rating in one or more domains, the
CSO will review all evidence and data underlying the ratings to determine whether it will recommend a charter
school for non-renewal.
School receives "Approaches Standard" or "Meets Standard"
ratings in all three domains
School receives a"Does Not Meet Standard"
rating in any of the domains
School is recommended for renewal, possibly with conditions
School is considered for a non-renewal recommendation
How Performance Impacts Renewal
Page 1 of 24

Student Demographics
Academic Success Domain Summary
Oraganizational Compliance and Viability Domain Summary
Financial Health and Sustainability Domain Summary
PSSA Proficiency Rates
PSSA Average Growth Indexes (AGI)
Attendance
Special Education
English Learners
Enrollment
Student Discipline
Personnel
Timely Reporting
Food, Health, and Safety
Board Governance Page 14
Financial Health
Proficiency Rates
Average Growth Indexes (AGI)
Attendance
Chronic Absenteeism
Suspension and Expulsion
Retention
Teacher Tenure
Page 20
Page 21
Page 22
Page 23
Page 23
Annual Charter Evaluation 2020-21
Northwood Academy Charter School
CONTENTS
School Overview Page 3
Page 7
Page 7
Page 8
Academic Success Domain
Executive Summary Overview
Page 5
Page 6
Page 6
Page 12
Page 13
Page 17
Page 9
Page 9
Page 10
Page 11
Page 12
Page 4
Page 18
Page 19
Organizational Compliance and Viability Domain
Financial Health and Sustainability Domain
Page 15
Fiscal Management
Climate and Equity
Metric Information Page 24
Page 2 of 24

Phone 215-289-5606
Website http://www.northwoodcs.org/
763 788
Total Enrollment Authorized
2018-19 Amy Hollister K-8 784 788
Network N/A
Annual Charter Evaluation 2020-21
SCHOOL OVERVIEWNorthwood Academy Charter School
General Information
Address 4621 Castor Ave., 19124
Enrollment
2016-17 Amy Hollister K-8 793 788
Mission
"The mission of Northwood Academy Charter School is to educate the whole child by providing the
academic, social, and emotional foundations and successes necessary to become contributing
community members who possess the skills, desire and confidence to lead meaningful lives.
Northwood Academy Charter School is committed to creating and sustaining a learning sanctuary that
is built upon integrity and dedicated to high achievement and purposeful experiences."
Leadership, Grades Served, and Enrollment History
School Year School Leader Grades Served(as of October 1)
History
2016-17 61.6 57.6 53.0
2017-18 67.1 57.8 54.8
Pennsylvania School Performance Profile Scores
School Year This School Charter School Average District School Average
Opened in 2005
Current Term 2020-21 to 2024-25
Admission Citywide with Neighborhood Preference
2019-20 Amy Hollister K-8 768 788
2020-21 Amy Hollister K-8 790 788
2017-18 Amy Hollister K-8
Similar Schools Groups
Similar Schools Groups (SSGs) are comprised of District and charter schools that are the same school type (ES, MS, K8,
HS) and serve similar populations of students based on the percentages of students who are economically disadvantaged
(+/-10%), students with disabilities (+/-5%), and English learners (+/-7.5%).
Schools must fall within all three ranges to be included in a given school’s SSG. If a school’s SSG has fewer than five
schools, the ranges expand to include five schools. The CSO updates SSGs annually.
Similar Schools:
Ad Prima Charter School, Discovery Charter School, First Philadelphia Preparatory Charter School, Franklin Towne
Charter Elementary School, Laboratory Charter School of Communication and Languages, Philadelphia Performing Arts:
A String Theory Charter School, Russell Byers Charter School, Southwest Leadership Academy Charter School, Tacony
Academy Charter School, Universal Institute Charter School, West Oak Lane Charter School
2018-19 61.1 58.6 54.1
2019-20 N/A N/A N/A
Page 3 of 24
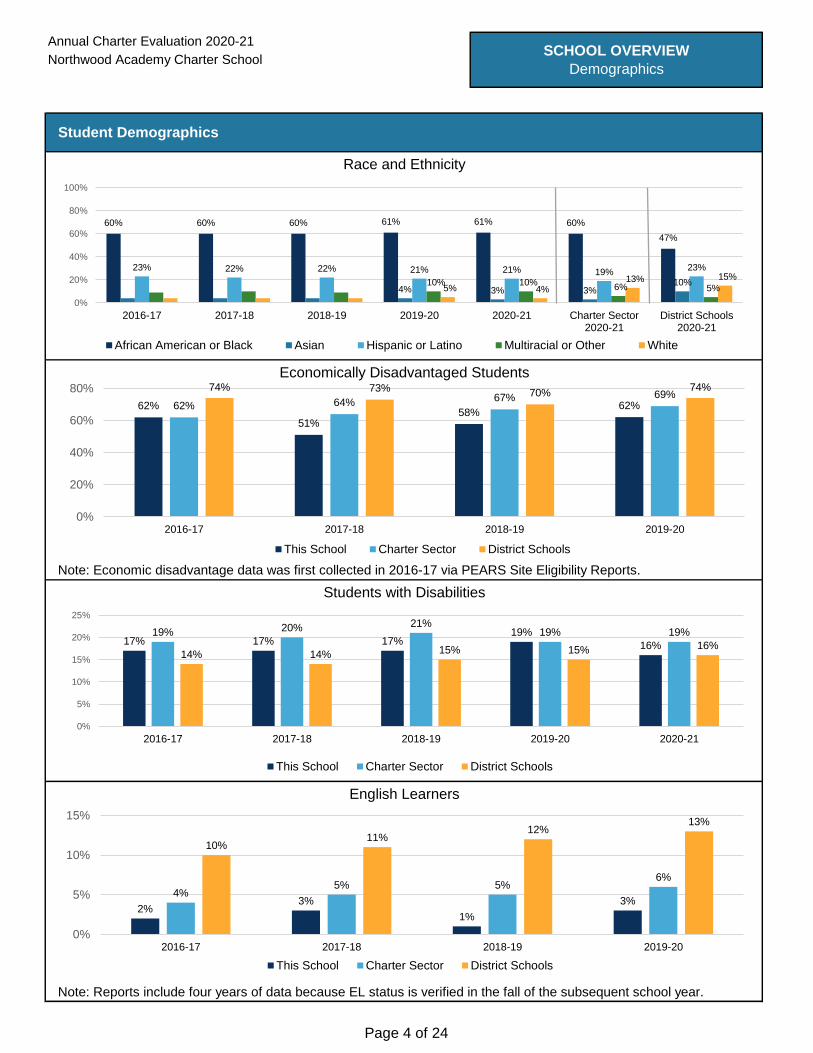
Student Demographics
Race and Ethnicity
Economically Disadvantaged Students
Note: Economic disadvantage data was first collected in 2016-17 via PEARS Site Eligibility Reports.
Annual Charter Evaluation 2020-21SCHOOL OVERVIEW
DemographicsNorthwood Academy Charter School
Students with Disabilities
English Learners
Note: Reports include four years of data because EL status is verified in the fall of the subsequent school year.
62%
51%58%
62%62% 64% 67% 69%74% 73% 70%
74%
0%
20%
40%
60%
80%
2016-17 2017-18 2018-19 2019-20
This School Charter Sector District Schools
17% 17% 17%19%
16%
19% 20% 21%19% 19%
14% 14% 15% 15% 16%
0%
5%
10%
15%
20%
25%
2016-17 2017-18 2018-19 2019-20 2020-21
This School Charter Sector District Schools
2%3%
1%
3%4%
5% 5%6%
10%11%
12%13%
0%
5%
10%
15%
2016-17 2017-18 2018-19 2019-20
This School Charter Sector District Schools
60% 60% 60% 61% 61% 60%
47%
4% 3% 3%10%
23% 22% 22% 21% 21% 19%23%
10% 10%6% 5%5% 4%
13% 15%
0%
20%
40%
60%
80%
100%
2016-17 2017-18 2018-19 2019-20 2020-21 Charter Sector2020-21
District Schools2020-21
African American or Black Asian Hispanic or Latino Multiracial or Other White
Page 4 of 24

Proficiency 10 / 10
Growth 4 / 10 8.75 / 10 5 / 10 N/A
Attendance 5 / 5 5 / 5 5 / 5 N/A
Category Standard SY 2016-17 SY 2017-18 SY 2018-19 SY 2019-20
EXECUTIVE SUMMARY OVERVIEWThe Executive Summary provides an overview of key indicators that are evaluated annually for each school.
These indicators are taken into consideration during the comprehensive renewal process, which occurs in the
last year of a charter term. The length of a charter term is typically five years for charter schools in
Pennsylvania. The table below summarizes school performance information for the last four years across the
three domains evaluated at renewal: Academic Success, Organizational Compliance and Viability, and
Financial Health and Sustainability.
The tables below summarize whether the Charter School meets the standard (5), approaches the standard
(7), or does not meet the standard (6) during the charter term. The Charter School Performance Framework
outlines the point allocation for the standards and categories evaluated within each domain.
Academic Success
Annual Charter Evaluation 2020-21
EXECUTIVE SUMMARYNorthwood Academy Charter School
Proficiency
Sci. 8
PSSA
5 6 6
5 5 4 4 4
Math Science
PSSA 5 5 5 5 7 5 5
Math Science ELA Math Science ELAELA Math Science ELA
Math Sci. 4 Sci. 8 ELA Math Sci. 4Sci. 8 ELA Math Sci. 4 Sci. 8 ELA
Growth
ELA Math Sci. 4
4 4All Students
PSSA
5 6 5 5 5 5
6 5 6 5 4 46 5 5 6 5
4 4 4 4Lowest Performing 5 5 6 5 6 5
5
5
5
5
5
5
4
4
8 / 10 10 / 10 N/A
Symbol Key
5 Full Credit 7 Half Credit 6 No Credit
Chronic
Absenteeism
95%+
Attendance
Points Earned by Category and School Year
SY 2016-17 SY 2017-18 SY 2018-19 SY 2019-20
N/A Not Applicable
Page 5 of 24

Debt Ratio 5 5 5 5Debt Service Coverage Ratio 5 5 6 5
Fiscal Management Category
Audit Findings 6 5 5 5Delinquency and Default 5 5 5 5PSERS 5 5 5 5
Category Standard FY17 FY18 FY19 FY20
Financial Health Category
Total Margin 5 5 5 5Current Ratio 5 5 6 5Average Days Cash on Hand 5 5 5 5Net Position 5 5 5 5Non-Restricted Fund Balance 7 5 5 5
Timely Reporting
(5 points possible at Renewal)
Timely Annual Report 5 5 5 5Timely Financial Audit 5 5 5 5
Financial Health and Sustainability
Water Quality 4 4 6 5
Board Governance
(15 points possible at Renewal)
Sunshine Act 5 5 6 5Board Oversight 5 5 5 5Board Accessibility 5 5 6 5Statements of Financial Interest 5 5 6 5
Certified ESL Teachers 5 5 5 5Certified SPED Teachers 5 5 5 5Certified Instructional Leader 5 5 5 5
Personnel
(10 points possible at Renewal)
Food, Health, and Safety
(10 points possible at Renewal)
Food Safety 5 5 5 5Health Services Policy 6 5 5 5Emergency Preparedness 5 5 5 5
5 5 5
Organizational Compliance and Viability
Category Standard 2017 2018 2019 2020
Mission and Educational Program
(15 points possible at Renewal)N/A - Evaluated at Time of Renewal Only
English Learners
(10 points possible at Renewal)
5Accessibility 5 5 5 5Code Due Process 6 5 5 5Manifestation Determination
5Student Application 5 5 5 5
Truancy Policy 5 5 6 5Renaissance-District Alignment 4 4 4 4
5 5
ESL Policy 5 5 5 5EL Timely Evaluation 5 5 5 5ESL ACCESS 5 5 5 5Policy 5 5
5
5
Materials 5 5 5
Annual Charter Evaluation 2020-21
EXECUTIVE SUMMARYNorthwood Academy Charter School
Special Education
(10 points possible at Renewal)Child Find Notice 5 5
Enrollment
(15 points possible at Renewal)
Student Discipline
(10 points possible at Renewal)
Page 6 of 24

PROFICIENCY
Grades 3 - 8 Grades 4 & 8Points
Possible:4 per year 4 per year 2 per year
Proficiency rates are compared to the same grades served by the Charter School in two comparison groups:
Similar Schools (charter and District schools with similar demographics) and District Schools. Schools earn
full credit if their proficiency rate meets or exceeds both Similar Schools and District Schools and half credit
for meeting or exceeding only one of the comparison groups. Please note that state tests were not
administered during the 2019-20 school year due to the COVID-19 pandemic.
PSSA Proficiency Rates
ELA Math Science
Grades 3 - 8
Annual Charter Evaluation 2020-21ACADEMIC SUCCESS
Northwood Academy Charter SchoolProficiency & Growth
20% 55% 39% 33%
2017-18 64% 56% 37% 30% 31%
District
Schools
This
School
Similar
Schools
District
Schools
2016-17 62% 41% 35% 30% 18%
School
Year
This
School
Similar
Schools
District
Schools
This
School
Similar
Schools
23% 59% 55% 41%
2019-20 N/A N/A N/A N/A N/A
21% 54% 54% 36%
2018-19 58% 50% 37% 35% 29%
GROWTHThe Pennsylvania Department of Education (PDE) sets the Average Growth Indexes (AGI) standard for all
schools (see chart below). Schools earn full credit for overall and lowest performing AGIs at or above -1, the
minimum score reflecting evidence that the school met the growth standard, and no credit for AGIs below -1,
which indicates that there was evidence that the school did not meet the growth standard. Please note that
state tests were not administered during the 2019-20 school year due to the COVID-19 pandemic.
PSSA Average Growth Indexes
ELA Math Science Science
N/A N/A N/A N/A
0.25
per year
1.25
per year
0.25
per year
School
Year
All
Students
Lowest
Performing
All
Students
Lowest
Performing
All
Students
Lowest
Performing
Grades 4 - 8 Grades 4 - 8 Grade 4 Grade 8Points
Possible:
2.5
per year
1
per year
2.5
per year
1
per year
1.25
per year
-0.22
2017-18 0.82 0.68 3.20 2.00 -1.53 -0.60 0.26 0.28
All
Students
Lowest
Performing
2016-17 0.99 0.65 -1.16 -1.29 -1.87 -0.35 -1.46
PA Department of Education Growth Measure
< -2.0 -2.0 to -1.0 -1.0 to 1.0 1.0 to 2.0 > 2.0
N/A N/A
-1.26 -0.63 -0.70
2019-20 N/A N/A N/A N/A N/A N/A
2018-19 -1.20 -3.74 2.15 -0.88 -1.89
Significant evidence that
the school did not meet
the standard for PA
Academic Growth
Moderate evidence that
the school did not meet
the standard for PA
Academic Growth
Evidence that the school
met the standard for PA
Academic Growth
Moderate evidence that
the school exceeded the
standard for PA
Academic Growth
Significant evidence that
the school exceeded the
standard for PA Academic
Growth
Note: Prior to SY2017-18, the Pennsylvania Department of Education (PDE) provided the AGI for the Lowest Performing
20% of students. Beginning in SY2017-18, PDE calculated the rate for the Lowest Performing 33% of students.
Page 7 of 24

30%
2017-18 7% 13% 27%
2019-20 7% 13% 21%
Attendance rates are compared to the same grades served by the Charter School in two comparison groups:
Similar Schools (charter and District schools with similar demographics) and District Schools. Schools earn
full credit if their 95%+ attendance rate (the percentage of students attending 95% or more instructional days)
meets or exceeds both Similar Schools and District Schools and earn half credit for meeting or exceeding
only one of the comparison groups. Please note that 2019-20 attendance data reflects attendance through
March 13, 2020 and is for informational purposes only.
95%+ Attendance Rates
Annual Charter Evaluation 2020-21ACADEMIC SUCCESS
Northwood Academy Charter SchoolAttendance
ATTENDANCE
Points
Possible:2.5 per year
School
YearThis School Similar Schools District Schools
2018-19
2016-17
2017-18
72% 53% 41%
71% 59% 46%
72% 60% 48%
2019-20 72% 64% 56%
2018-19 9% 14% 25%
CHRONIC ABSENTEEISMChronic Absenteeism rates are compared to the same grades served by the Charter School in two
comparison groups: Similar Schools (charter and District schools with similar demographics) and District
Schools. Schools earn full credit if their chronic absenteeism rate (the percentage of students attending fewer
than 90% of instructional days) is lower than both Similar Schools and District Schools and earn half credit if
it is lower than only one of the comparison groups. Please note that 2019-20 attendance data reflects
attendance through March 13, 2020 and is for informational purposes only.
Chronic Absenteeism Rates
Points
Possible:2.5 per year
School
YearThis School Similar Schools District Schools
2016-17 7% 20%
Page 8 of 24

5 2018 ACE
5 2019 ACE
EL Timely Evaluation. English as a
Second Language policy includes
expectation for timely evaluation of
students, within the first 30 days of school
or if transferred, within 14 days of
enrollment.
5 2017 ACE
5 2018 ACE
ESL ACCESS. English Learners are
administered the ACCESS assessment
annually.
Annual Charter Evaluation 2019-20ORGANIZATIONAL COMPLIANCE
Northwood Academy Charter SchoolSpecial Education & English Learners
5 2017 ACE
5 2018 ACE
Special Education
Child Find Notice. Special education
child find policy is accessible on the school
website and includes information on
program availability, screening activities,
and how parents can request services.
5 2019 ACE
5 2020 ACE
English Learners
ESL Policy. English as a Second
Language policy, including notification,
identification, programming, and
expectations for proficiency, is consistent
with Pennsylvania English as a Second
Language regulations.
5 2017 ACE
5 2018 ACE
5 2019 ACE
5 2020 ACE
5 2017 ACE
5 2019 ACE
5 2020 ACE 0
0
5 2020 ACE 0
Page 9 of 24

Enrollment Materials. Enrollment
materials only require proof of age and
address, home language survey,
immunization record and parent
registration statements to enroll. No
prohibited items as defined by PDE are
included.
5 2017 ACE
Enrollment Accessibility. School accepts
at least two sources of documentation to
demonstrate proof of age and address.
Student Application. Student application
only requires name, address, date of birth
or age, gender, grade applying for, current
school, guardian information, and sibling
information.
5 2018 ACE
5 2019 ACE
5 2020 ACE
2020 ACE
Enrollment
5 2017 ACE
5 2019 ACE
5 2020 ACE
2018 ACE
Enrollment Policy. Enrollment policy
complies with Pennsylvania regulations on
student enrollment, including no additional
mandatory paperwork or steps for families
beyond what can be required, recognition
of a lottery process if needed, and no
noncompliant lottery preferences.
5 2019 ACE
5
Annual Charter Evaluation 2019-20ORGANIZATIONAL COMPLIANCE
Northwood Academy Charter SchoolEnrollment
5 2020 ACE
5 2017 ACE
5 2018 ACE
5 2019 ACE
5 2018 ACE
5 2017 ACE
5
Page 10 of 24

Annual Charter Evaluation 2019-20ORGANIZATIONAL COMPLIANCE
Northwood Academy Charter SchoolStudent Discipline
5 2019 ACE
5 2020 ACE
6 2017 ACECode of Conduct did not fully identify due process rights,
including formal and informal hearing rights.
5 2018 ACE
Student Discipline
Code Due Process. The School's Code
of Conduct identifies all student due
process rights codified in Chapter 12 of
the PA Public School Code, including
those related to long-term suspensions
and expulsions, such as formal hearing
and appeal rights.
N/A 2019 ACE Applies to Renaissance Charter Schools only.
5 2020 ACE 0
Truancy Policy. School’s truancy policy
requires an attendance conference before
referral of truancy matters to a legal entity
and prohibits suspension, expulsion, or
transfer due to truant behavior.
5 2017 ACE
5 2018 ACE
6 2019 ACESchool submitted documentation with inconsistent
statements regarding an attendance meeting taking place
before making a referral to a legal entity.
N/A 2020 ACE Applies to Renaissance Charter Schools only.
Renaissance-District Alignment. Code
of Conduct is aligned in intent with District
Code of Conduct for out-of-school
suspensions and expulsions, including
policy on suspensions by grade level, as
required by the charter agreement.
N/A 2017 ACE Applies to Renaissance Charter Schools only.
N/A 2018 ACE Applies to Renaissance Charter Schools only.
5 2017 ACEManifestation Determination. Student
Code of Conduct is differentiated for
students with disabilities referencing
specific, compliant procedures for
manifestation determination.
5 2018 ACE
5 2019 ACE
5 2020 ACE
Page 11 of 24

Timely Reporting
5 2019 ACE
5 2020 ACE
5 2020 ACE
Personnel
Certified ESL Teachers. ESL teachers
are directly employed and appropriately
certified.
5 2020 ACE100% of ESL teachers were appropriately certified during the
2019-20 school year.
Certified SPED Teachers. Special
education teachers are appropriately
certified.
5 2017 ACE100% of Special Education teachers were appropriately
certified.
5 2018 ACE100% of Special Education teachers were appropriately
certified.
5 2017 ACE 100% of ESL teachers were appropriately certified.
5 2018 ACE 100% of ESL teachers were appropriately certified.
100% of Special Education teachers were appropriately
certified.
Annual Charter Evaluation 2019-20ORGANIZATIONAL COMPLIANCE
Northwood Academy Charter SchoolPersonnel & Timely Reporting
5 2019 ACE At least one instructional leader was appropriately certified.
5 2020 ACE At least one instructional leader was appropriately certified.
5 2019 ACE 100% of ESL teachers were appropriately certified.
Certified Instructional Leader.
Instructional Leader is appropriately
certified.
5 2017 ACE At least one instructional leader was appropriately certified.
5 2018 ACE At least one instructional leader was appropriately certified.
5 2019 ACE100% of Special Education teachers were appropriately
certified.
5 2020 ACE
Timely Financial Audit. Submits final,
audited financial statements by December
31, annually.
5 2017 ACE
5 2018 ACE
Timely Annual Report. Submits complete
annual report information by August 1,
annually.
5 2017 ACE
5 2018 ACE
5 2019 ACE
Page 12 of 24

Annual Charter Evaluation 2019-20ORGANIZATIONAL COMPLIANCE
Northwood Academy Charter SchoolFood, Health, & Safety
Emergency Preparedness. School has a
complete and up-to-date fire safety and
evacuation plan, completed all the
required emergency evacuation drills in a
timely manner, and has no violations
related to portable fire extinguishers.
5 2017 ACE
5 2018 ACE
2019 ACE 1 of 1 inspection was compliant.
5 2020 ACE 1 of 1 inspection was compliant.
Health Services Policy. School’s Health
Services Policy clearly outlines all
mandated student health services and a
process for ensuring compliance with
student immunization requirements.
6 2017 ACEPolicy did not acknowledge School's responsibility to provide
physical and dental exams, and did not include screening
requirements.
5
Food, Health, and Safety
Food Safety. School provides a safe and
clean food facility as evaluated by the City
of Philadelphia Department of Public
Health and Office of Food Protection.
5 2017 ACE
5 2018 ACE
5
5 2020 ACE
2018 ACE
5 2019 ACE
5 2020 ACE
Water Quality. School complies with
applicable water quality requirements of
the Pennsylvania Board of Health and the
school posted its most recent water quality
testing results on its publicly available
website.
N/A 2017 ACE Standard was not evaluated.
N/A 2018 ACE Standard was not evaluated.
6
5 2019 ACE
5 2020 ACE
2019 ACESchool did not have evidence of testing posted to its website
at time of review.
Page 13 of 24
Annual Charter Evaluation 2019-20ORGANIZATIONAL COMPLIANCE
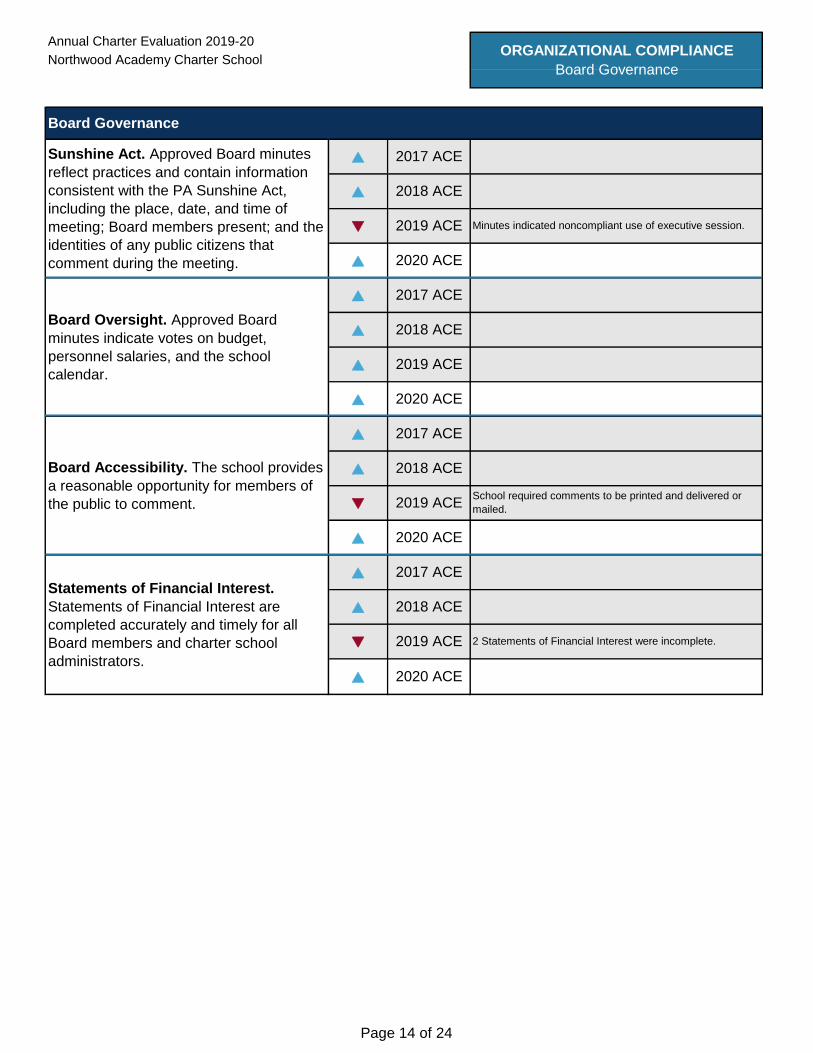
Northwood Academy Charter SchoolBoard Governance
Board Governance
Board Accessibility. The school provides
a reasonable opportunity for members of
the public to comment.
Statements of Financial Interest.
Statements of Financial Interest are
completed accurately and timely for all
Board members and charter school
administrators.
5 2020 ACE
Board Oversight. Approved Board
minutes indicate votes on budget,
personnel salaries, and the school
calendar.
5 2017 ACE
5 2018 ACE
Sunshine Act. Approved Board minutes
reflect practices and contain information
consistent with the PA Sunshine Act,
including the place, date, and time of
meeting; Board members present; and the
identities of any public citizens that
comment during the meeting.
5 2017 ACE
5 2018 ACE
6 2019 ACE Minutes indicated noncompliant use of executive session.
6 2019 ACESchool required comments to be printed and delivered or
mailed.
5 2020 ACE
5 2017 ACE
5 2018 ACE
5 2019 ACE
5 2020 ACE
2 Statements of Financial Interest were incomplete.2019 ACE6
2018 ACE5
5 2017 ACE
5 2020 ACE
Page 14 of 24

Fiscal YearTotal Margin
(% of Revenue)Current Ratio
Average Days
Cash on Hand
FINANCIAL HEALTH
Evaluative metrics measured the Charter School’s short-term and long-term financial health over each of the
four fiscal years of available data. Metrics that do not meet the standard are displayed in red.
Annual Charter Evaluation 2020-21 FINANCIAL HEALTH
Northwood Academy Charter School AND SUSTAINABILITY
Financial Health
FY19 11.1% 0.55 177
FY20 5.8% 3.57 202
FY17 0.1% 2.03 85
FY18 5.1% 2.22 138
Short-Term Metrics
This School - - - Meets Standard
Charter Sector Median - - - Does Not Meet Standard
Total Margin (% of Revenue) Current Ratio Average Days Cash on Hand
0.1%
5.1%
11.1%
5.8%
0.1%
4.2%
5.4%
7.2%
-15%
-10%
-5%
0%
5%
10%
15%
FY17 FY18 FY19 FY20
2.03
2.22
0.55
3.57
1.64
1.86
2.15
2.80
0.00
0.50
1.00
1.50
2.00
2.50
3.00
3.50
4.00
FY17 FY18 FY19 FY20
85
138
177
202
54
68
90
117
0
50
100
150
200
250
FY17 FY18 FY19 FY20
Page 15 of 24

Annual Charter Evaluation 2020-21 FINANCIAL HEALTH
Northwood Academy Charter School AND SUSTAINABILITY
Financial Health
FY17 104.5% 11.8% 0.48 1.66
FY18 103.3% 23.7% 0.46 2.26
Long-Term Metrics
Fiscal YearNet Position
(% of Revenue)
Non-Restricted
Fund BalanceDebt Ratio
Debt Service
Coverage Ratio*
Note: Negative Debt Service Coverage Ratios are displayed as 0.
Net Position (% of Revenue) Non-Restricted Fund Balance (% of Revenue)
Debt Ratio Debt Service Coverage Ratio
FY19 107.0% 30.4% 0.42 0.34
FY20 109.5% 37.3% 0.41 3.06
This School - - - Meets Standard
Charter Sector Median - - - Does Not Meet Standard
104.5% 103.3%107.0%
109.5%
19.4% 20.8%23.1%
27.0%
0%
20%
40%
60%
80%
100%
120%
FY17 FY18 FY19 FY20
11.8%
23.7%
30.4%
37.3%
6.7%
11.1%
14.4%
20.0%
0%
5%
10%
15%
20%
25%
30%
35%
40%
FY17 FY18 FY19 FY20
0.480.46
0.42 0.41
0.700.67
0.52
0.47
0.0
0.1
0.2
0.3
0.4
0.5
0.6
0.7
0.8
0.9
1.0
FY17 FY18 FY19 FY20
1.66
2.26
0.34
3.06
1.31
1.73
2.00
2.30
0.0
0.5
1.0
1.5
2.0
2.5
3.0
3.5
FY17 FY18 FY19 FY20
Page 16 of 24

FINANCIAL HEALTH
5 2019 ACE
5 2019 ACE
5 2020 ACE
Compliance Requirements Reviewed by CSO
Audit Findings. No material audit
findings, deficiencies, or weaknesses
identified in the annual audit.
6 2017 ACEMaterial Weakness: Prior period adjusting to journal entries
was required to correct the school's opening net position in
the financial statements.
5 2018 ACE
Northwood Academy Charter School AND SUSTAINABILITY
Fiscal Management
Fiscal Management
Annual Charter Evaluation 2020-21
5 2020 ACE
5 2020 ACE
PSERS. No missed payments to PSERS
that exceed the lower of 1% of revenues
or $100,000.
5 2017 ACE
5 2018 ACE
Debt Delinquency and Default. The
school is meeting its debt obligations and
covenants.
5 2017 ACE
5 2018 ACE
5 2019 ACE
Page 17 of 24

Annual Charter Evaluation 2020-21
Northwood Academy Charter School
PSSA Proficiency Rates by Grade Level
PSSA Proficiency Rates by Student Group
PROFICIENCY (SY2018-19)Proficiency rates reflect the percentage of students scoring in the advanced and proficient score categories.
The most recent available data (from the 2018-19 school year) is reflected below.
EQUITY AND CLIMATE OVERVIEW
The CSO recognizes that there are multiple dimensions to both equity and climate, many of which are not
captured in this report. The CSO encourages stakeholders to use this data, along with other resources, to
gain insights into students' experiences, assess the school environment's fairness, and, if neccessary, to
make adjustments that promote positive experiences and successful outcomes for all students.
The Charter Schools Office reports additional indicators of Equity and School Climate for informational
purposes. When possible, graphs present information disaggregated by student group and grade level to
reflect students’ experiences throughout their tenure at the school. Similar School and District School rates
provide context.
58%
35%
59% 56%
31%
56%
91% 91%
N/A
61%
33%
58%62%
48%
N/A
59%
44%
64%
30%
18%
31%
N/A N/A N/A0%
10%
20%
30%
40%
50%
60%
70%
80%
90%
100%
EL
A
Ma
th
Scie
nce
EL
A
Ma
th
Scie
nce
EL
A
Ma
th
Scie
nce
EL
A
Math
Scie
nce
EL
A
Ma
th
Scie
nce
EL
A
Ma
th
Scie
nce
EL
A
Ma
th
Scie
nce
EL
A
Ma
th
Scie
nce
All Students African Americanor Black
Asian Hispanic orLatino
Multiracial orOther
White Students withDisabilities
English Learners
This School Similar Schools District Schools
58%
35%
59%55% 53%
71%
34%
74%
45%
37%
59%
27%
63%
39%
57%
16%
43%
0%
10%
20%
30%
40%
50%
60%
70%
80%
90%
100%
ELA Math Science ELA Math ELA Math Science ELA Math ELA Math ELA Math ELA Math Science
All Students 3rd Grade 4th Grade 5th Grade 6th Grade 7th Grade 8th Grade
This School Similar Schools District Schools
Page 18 of 24

AVERAGE GROWTH INDEXES (AGI)
Significant evidence that
the school did not meet
the standard for PA
Academic Growth
Moderate evidence that
the school did not meet
the standard for PA
Academic Growth
Evidence that the school
met the standard for PA
Academic Growth
Moderate evidence that
the school exceeded the
standard for PA
Academic Growth
Significant evidence that
the school exceeded the
standard for PA Academic
Growth
Values below -2 indicate that there is significant evidence that the standard was not met.
PSSA AGI by Student Group
The Pennsylvania Department of Education (PDE) sets the Average Growth Indexes (AGI) standard for all
schools (see chart below). In the graphs below, values above 3 are represented as 3 and values below -3
are represented as -3. The most recent available data (from the 2018-19 school year) is reflected below.
Annual Charter Evaluation 2020-21EQUITY & CLIMATE
Northwood Academy Charter SchoolAcademic Growth
Values below -2 indicate that there is significant evidence that the standard was not met.
PA Department of Education Growth Measure
< -2.0 -2.0 to -1.0 -1.0 to 1.0 1.0 to 2.0 > 2.0
PSSA AGI by Grade Level
-3.00
-2.00
-1.00
0.00
1.00
2.00
3.00
EL
A
Ma
th
Sci4
Sci8
EL
A
Math
Scie
nce
EL
A
Ma
th
Scie
nce
EL
A
Ma
th
Scie
nce
EL
A
Ma
th
Scie
nce
EL
A
Ma
th
Scie
nce
EL
A
Ma
th
Scie
nce
EL
A
Ma
th
Scie
nce
All Students AfricanAmerican or
Black
Asian Hispanic orLatino
Multiracial orOther
White Students withDisabilities
English Learners
Significant evidence that the standard was exceeded Moderate evidence that the standard was exceededEvidence that the standard was met Moderate evidence that the standard was not met
This School Similar Schools District Schools
-3.00
-2.00
-1.00
0.00
1.00
2.00
3.00
ELA Math ELA Math Science ELA Math ELA Math ELA Math ELA Math Science
All Students 4th Grade 5th Grade 6th Grade 7th Grade 8th Grade
Significant evidence that the standard was exceeded Moderate evidence that the standard was exceeded
Evidence that the standard was met Moderate evidence that the standard was not met
Page 19 of 24

Regular Attendance Rates by Grade Level
Northwood Academy Charter SchoolAttendance & Chronic Absenteeism
REGULAR ATTENDANCERegular Attendance rates reflect the percentage of students that attended 95% or more school days. This is
equivalent to having 9 or fewer days of absence during a 180-day school year.
Regular Attendance Rates by Student Group
Annual Charter Evaluation 2020-21EQUITY & CLIMATE
72% 73%
79%76%
66%
51%
73%
61%
0%
10%
20%
30%
40%
50%
60%
70%
80%
90%
100%
All Students African Americanor Black
Asian Hispanic orLatino
Multiracial orOther
White Students withDisabilities
English Learners
This School Similar Schools District Schools
72%67%
70% 72% 72%
66%69%
75%79%
83%
0%
10%
20%
30%
40%
50%
60%
70%
80%
90%
100%
All Students Kindergarten 1st Grade 2nd Grade 3rd Grade 4th Grade 5th Grade 6th Grade 7th Grade 8th Grade
This School Similar Schools District Schools
Page 20 of 24

CHRONIC ABSENTEEISMChronic Absenteeism rates reflect the percentage of students that were not present for 10% or more school
days. This is equivalent to missing at least one day of school every two weeks in a 180-day school year.
Chronic Absenteeism Rates by Student Group
Chronic Absenteeism Rates by Grade Level
Northwood Academy Charter SchoolChronic Absenteeism
Annual Charter Evaluation 2020-21EQUITY & CLIMATE
7%6%
10%
7%
9%
16%
8%
13%
0%
5%
10%
15%
20%
25%
30%
35%
All Students African Americanor Black
Asian Hispanic orLatino
Multiracial orOther
White Students withDisabilities
English Learners
This School Similar Schools District Schools
7%
12%
9%
7%
11%10%
6%
4% 4%
2%
0%
5%
10%
15%
20%
25%
30%
All Students Kindergarten 1st Grade 2nd Grade 3rd Grade 4th Grade 5th Grade 6th Grade 7th Grade 8th Grade
This School Similar Schools District Schools
Page 21 of 24

Suspension Rate and Expulsion Trends
SUSPENSIONStudent suspension rates reflect the percentage of the charter school’s students that received at least one
out-of-school suspension.
Suspension Rates by Student Group
Suspension Rates by Grade Level
Northwood Academy Charter SchoolStudent Discipline
Annual Charter Evaluation 2020-21EQUITY & CLIMATE
6%7%
3%
5%
3% 3%
7%
0%0%
2%
4%
6%
8%
10%
12%
All Students African Americanor Black
Asian Hispanic orLatino
Multiracial orOther
White Students withDisabilities
English Learners
This School Similar Schools District Schools
6%5%
6%
2%
4%3%
10%
12%
6%5%
0%
2%
4%
6%
8%
10%
12%
14%
All Students Kindergarten 1st Grade 2nd Grade 3rd Grade 4th Grade 5th Grade 6th Grade 7th Grade 8th Grade
This School Similar Schools District Schools
0 0 0 0
10%
8%
11%
6%
0
5
10
15
20
0%
2%
4%
6%
8%
10%
12%
14%
2016-17 2017-18 2018-19 2019-20
Expuls
ion C
ount
Suspensio
n R
ate
Count of Expulsions at This School Suspension Rate at This SchoolSuspension Rate at Similar Schools Suspension Rate at District Schools
Page 22 of 24

Student and Teacher Retention Rate Trends
Student Retention Rates by Student Group
Annual Charter Evaluation 2020-21EQUITY & CLIMATE
Northwood Academy Charter SchoolRetention & Staffing
RETENTION
Student retention rates reflect the percentage of students who were enrolled in the charter school at the
beginning of the school year and remained enrolled through the beginning of the following school year.
Similarly, teacher retention rates reflect the percentage of teachers who were employed by the charter school
at the beginning of the school year and remained employed through the beginning of the following year.
TEACHER TENUREThe graph below reflects Pennsylvania Department of Education data about the average number of years
teachers have worked at the LEA (charter school or school district) and as educators at any school.
9.1
4.5
13.2
2.9
3.7
0 2 4 6 8 10 12 14
This School
Charter Schools (Median)
District Schools (Median)
Average Teacher Tenure in LEA (In Years) Average Teacher Tenure in Education (In Years)
N/A N/A N/A N/A N/A N/A N/A N/A0%
20%
40%
60%
80%
100%
All Students African Americanor Black
Asian Hispanic orLatino
Multiracial orOther
White Students withDisabilities
English Learners
This School Charter Schools District Schools (data available at District level only)
96% 98% 95% 92%
0%
20%
40%
60%
80%
100%
120%
2016-17 2017-18 2018-19 2019-20
This School (Students) Charter Schools (Students) District Schools (Students)
This School (Teachers) Charter Schools (Teachers) District Schools (Teachers)
Page 23 of 24

Metric Information
Authorized Enrollment - The maximum number of students a school is allowed to enroll per their charter agreement.
Average Days Cash on Hand - The number of days a school could operate without receiving additional money,
calculated as total unrestricted cash divided by the average daily operating expense adjusted to remove non-cash
expenses such as depreciation and bad debt.
Chronic Absenteeism - The percentage of students attending fewer than 90% of school days. Student absences are
provided to the CSO by each charter school via the annual data packet. Students’ days enrolled are obtained through
enrollment records that charter schools input to the District’s student information system.
Current Ratio - The ratio of short-term assets to short-term liabilities, which measures if a school has enough resources
to pay its debt and obligations over the next year.
Debt Ratio - The percentage of a school's total assets that are owed to other individuals or businesses, calculated as
total liabilities divided by total assets.
Debt Service Coverage Ratio - Whether a school can meet its debt obligations in the coming year, calculated as net
income divided by annual principal, interest, and lease payments.
District Schools Rate - Rate calculated based on all students in District Schools enrolled in the same grades as those
served by the Charter School.
First Fall College Matriculation Rate - The percentage of students matriculating into post-secondary institutions in the
first fall following high school graduation. Matriculation data is provided by the National Student Clearinghouse.
Graduation Rate - The percentage of students in the 9th grade adjusted cohort that graduate within 4 years. All
calculations are based on student records entered into the School District of Philadelphia’s student information system by
the Charter School.
Growth - The average growth index (AGI) for each student group, based on the PA Department of Education's Growth
Measure.
Net Position - How much a school is worth as a percentage of its total annual revenue, calculated as net position divided
by total revenue.
Non-Restricted Fund Balance - How much a school is worth as a percentage of its total annual revenue after removing
certain items such as property, equipment, and long-term debt, calculated as total non-restricted fund balance divided by
total revenue.
Proficiency Rate - The percentage of students scoring in the proficient or advanced categories of the PSSA/Keystone
exam in math/Algebra I, ELA/Literature and science/Biology. PSSA results also include all PASA and PSSA-M results
and are for all test takers by school year. Keystone proficiency rates are based on the banked 11th grade accountability
method.
Regular Attendance - The percentage of students attending 95% or more instructional days. Student absences are
provided to the CSO by each charter school via the annual data packet. Students’ days enrolled are obtained through
enrollment records that charter schools input to the District’s student information system.
Retention Rate - The percentage of students attending the Charter School at the end of a school year that re-enroll in the
fall (excluding students in terminal grades).
SAT/ACT College Ready Rate - The percentage of students scoring at or above the threshold for college-readiness, as
determined by the ACT and the College Board.
Similar Schools Rate - Rate calculated based on all students in the school's Similar Schools Group enrolled in the same
grades as those served by the charter school.
Suspension Rate - The percentage of students receiving one or more out-of-school suspensions.
Total Margin - The percentage of a school's total annual revenue not spent, calculated as change in net position divided
by total revenue.
Page 24 of 24
Related Documents