AWE LIMITED 2014 ANNUAL REPORT

Welcome message from author
This document is posted to help you gain knowledge. Please leave a comment to let me know what you think about it! Share it to your friends and learn new things together.
Transcript

AWE LIMITED 2014
A N N UA L R E PORT

OUR VISIONBy the end of 2012-13, AWE had built a diverse
production portfolio and was turning its attention
to realising the signifi cant potential of its major
development and exploration assets: Sugarloaf,
BassGas, Ande Ande Lumut and the onshore Perth
Basin. That year, the company achieved 5 mmboe in
production and Field EBITDAX of $185 million. Looking
ahead, AWE knew it had the ability to grow signifi cantly
with the projects it already had, without needing
additional capital, and announced its 5 year growth
targets at the 2013 Annual General Meeting:
+ Double production to 10 mmboe
+ Triple Field EBITDAX to more than $500 million.
AWE aims to achieve these goals by the end of 2018.
OUR STRATEGYAWE’s strategy is built around a number of key elements,
each characterised by diversity and fl exibility. While many
would regard this level of detail unusual for a company
the size of AWE, it serves to illustrate how AWE’s Board
and management are thinking well into the future and
mapping a clear path to delivering growth.
3 Core Products – To manage price volatility and optimise
margins, AWE is targeting Oil, High Value Gas and
Unconventional Liquids and Gas.
Geographic Diversity – AWE’s portfolio of exploration,
development and production assets – located in
Australia, New Zealand, Indonesia, China and the
USA – is focused on proven petroleum basins.
Lifecycle Exposure – AWE’s asset portfolio spans
the full upstream lifecyle: Exploration, Appraisal,
Development and Production. The company is an active
manager of assets and aims to ensure that AWE’s equity
interest refl ects the appropriate balance between risk
and reward at every stage in an asset’s lifecycle. AWE
prefers to have involvement at early stages in projects
where it can add substantial value.
Financial Strength – A robust balance sheet and
strong operating cash fl ows allow the company to stay
in control of its exploration and development agenda
and deliver growth.

INSIDE
115
22
18
6Operational Overview
Reserves and Resources
Exploration
14Growth Projects
Sustainability in the Perth Basin
Highlights 2
From the Chairman 4
Operational Overview 6
Managing Director’s Review 8
Financial Management 12
Growth Projects 14
Exploration 18
Sustainability in the Perth Basin 22
Board and Senior Executives 26
Financial Report 27
Additional Information 114

AWE LIMITED ANNUAL REPORT 2014
H I G H L I G H T S
HIGHLIGHTS
US$188Mfor sale of 50% of Ande Ande Lumut exceeds market expectations
$85Mfor sale of 11.25% of BassGas
$300Mundrawn debt facilityand $42 million net cash at 30 June 2014
STRONG FINANCIAL, OPERATING AND HSE PERFORMANCE HAS AWE POSITIONED TO DELIVER GROWTH
2 AWE LIMITED ANNUAL REPORT 2014

AWE LIMITED ANNUAL REPORT 2014 3AWE LIMITED ANNUAL REPORT 2014
Performance relative to previous
year unless otherwise stated.
2013GUIDE 2014
5.6 MMBOETotal production
+13%
NOLost Time Injuries or Reportable Environmental Incidents
+9% $328.2MSales revenue
+213% $62.5MNet Profi t After Tax
+31% +31%Growth in Sugarloaf production, with 82% increase in 2P Reserves + 2C Resources

4 AWE LIMITED ANNUAL REPORT 2014
F R O M T H E C H A I R M A N
The past three years involved some diffi cult decisions
that were required to successfully transform AWE into
a business that features a strong operating base with
outstanding growth potential. The company now has
a diversifi ed asset base with the potential to deliver
signifi cant long term growth and value to shareholders.
Pleasingly, the transformation of AWE is also now
beginning to gain traction with the investment community,
which was refl ected in the company’s total shareholder
return of 45% for the fi nancial year.
Strong production and revenue, good progress on major
development projects, and exploration success in the
Perth Basin were highlights of the past year that have
substantially enhanced AWE’s ability to meet its ambitious
growth targets.
The exciting new Waitsia gas discovery, announced just
after the end of the fi nancial year, is an excellent platform
from which to start the development of the conventional
and unconventional resource potential of the Perth Basin.
This discovery, along with AWE’s other cornerstone
projects at Sugarloaf, BassGas and Ande Ande Lumut
are a refl ection of the technical and fi nancial skills within
AWE that are being applied to deliver growth and create
shareholder value.
We are especially proud of AWE’s Health, Safety and
Environment performance in the past year. AWE has
not recorded a Lost Time Injury since September 2012,
our reportable safety case frequency is one third of the
industry average, and we had no reportable environmental
incidents during 2013-14. This focus on HSE underlines
our commitment to not only our staff, but to the
communities where we operate.
AWE’s production and fi nancial performance for the year
was also strong. Production of 5.6 mmboe and revenue of
$328 million were well above the previous year and exceeded
market guidance. Field EBITDAX of $209 million refl ects
robust operating cash fl ows and is a good indicator of the
underlying strength of our production assets.
AWE’s sound balance sheet and healthy operating cash
fl ows should provide adequate funding to support the
company’s growth plans.
Delivering growth opportunities
AWE is recognised for its technical and commercial
capabilities, and this has translated into exploration,
development and portfolio management successes
over the past 18 months.
A series of sound commercial transactions – the sale of a
50% interest in Ande Ande Lumut and an 11.25% interest
in BassGas, together with the acquisition of an additional
15% in Tui and a further 5% in T/18P (Trefoil) in Bass Strait
– delivered signifi cant value to the company.
On the technical side, large gains were made on a
number of major exploration and development projects.
Accelerated drilling activity at Sugarloaf is exciting and
paves the way for increased production from this asset
in 2014-15 and the potential for further upgrades to
Reserves and Resources. The Ande Ande Lumut oil project
continues to make good progress and the transition
of Operatorship from AWE to Santos was completed
smoothly. At BassGas, AWE has worked closely with the
Operator, Origin Energy, to tackle the remaining phases
of the Mid Life Enhancement project. Both remaining
phases – development drilling and the installation of gas
compression and condensate pumping modules – are
planned for the summer of 2014-15.
Exploration success in the onshore Perth Basin,
highlighted by the recent discovery of the Waitsia gas
fi eld and the successful appraisal of the Senecio gas
fi eld, has been rewarding and validates AWE’s long-
held technical view of the signifi cant conventional and
unconventional potential in our West Australian acreage.
Sustainability practices
AWE’s commitment to sustainable business practices
is a critical part of our growth strategy. We aim to
work proactively with all our stakeholders and make
positive contributions to the communities in which we
operate. In addition to our ongoing focus on Health,
Safety and Environment, AWE devotes signifi cant
resources to community and stakeholder engagement
in areas where we operate in New Zealand, Western
Australia and Indonesia and we aim to be honest, open
and transparent in our dealings with communities,
regulators and other stakeholders.
In light of this, shareholders can be proud that last year
AWE received the Australian Council of Superannuation
Investors’ highest level of achievement available to
ASX listed companies with respect to reporting on its
sustainability practices.
FROM THE CHAIRMANWe are delighted that the 2013-14 year proved productive for our patient shareholders.
360 Bcfgross 2C
Resources for
Senecio/Waitsia
discovery
45%Total Shareholder
Return for 2013-14

5AWE LIMITED ANNUAL REPORT 2014
Market demand
Energy demand, in AWE’s key markets of Asia and
Australia, continues to grow. Oil and condensate prices
have remained relatively steady, despite the political and
economic volatility experienced in a number of major
markets. The success of shale oil in the USA, refl ected
in the excellent performance of our Sugarloaf asset, is a
signifi cant contributing factor to this stability.
In Australia, the BassGas and Casino gas contracts on the
east coast are coming up for renegotiation in a strengthening
market, and in Indonesia we are pushing forward with a
development plan for the Lengo gas fi eld. These are good
commercial opportunities where AWE is well placed to
benefi t from substantially higher gas pricing.
M&A activity
AWE continually evaluates M&A opportunities and in
December 2013 the company received an unsolicited
approach for a merger with another ASX listed energy
company. The approach was a share-based offer and,
upon evaluation of the proposal, your Board of Directors
decided against recommending the deal to shareholders.
This decision was not taken lightly, but proved correct as
the proposer’s share price decreased 10% while AWE’s
share price increased 52% from when the proposal was
made through to 30 June 2014.
Creating shareholder value
The AWE Board is focused on creating long-term
shareholder value. The company’s growth strategy
is based around maximising our core capabilities to
explore, develop and operate energy projects.
The company will continue to focus on delivering growth
while extracting maximum value from current assets and
identifying new assets with signifi cant potential. AWE’s
existing exploration and production operations in Australia,
Indonesia and New Zealand remain crucial components of
the company’s portfolio approach and many of these will
provide additional growth opportunities.
The disparity between AWE’s share price and the value of
our underlying assets has begun to improve as the market
recognises the success of our strategies. Continued
focus on creating shareholder value remains the Board’s
key priority. We continually assess capital management
options, however, any initiatives will be tested against
the funding requirements of our portfolio of high return
growth projects.
A strong and supportive shareholder base underpins these
ambitions and AWE is looking forward to delivering further
success for shareholders.
"THE AWE BOARD IS FOCUSED ON CREATING LONG-TERM SHAREHOLDER VALUE."
Bruce Phillips
Chairman

6 AWE LIMITED ANNUAL REPORT 2014
O P E R A T I O N A L O V E R V I E W
OPERATIONALOVERVIEW
1SUGARLOAF AMI Texas, USA
AWE has a 10% working interest (~7.5% net revenue interest) in the Marathon
Oil operated Sugarloaf AMI (Area of Mutual Interest) in Southwest Texas, where
the Eagle Ford Shale and the Austin Chalk are the prolifi c target formations
for unconventional gas and oil. The AMI covers a number of leases totalling
approximately 24,000 acres. The AMI is in an area where the Eagle Ford Shale
and Austin Chalk produce liquids-rich gas via long horizontal wells that are
stimulated by multiple hydraulic fracture treatments.
0.862 MMBOEProduction
23.9 MMBOE2P Reserves
13.2 MMBOE2C Resources
CLIFF HEAD OIL PROJECT
Perth Basin, Western Australia
AWE has a 57.5% interest in the
Roc Oil operated Cliff Head Oil
Project in the Perth Basin, offshore
Western Australia. Oil production
from the Cliff Head fi eld is produced
via an offshore wellhead platform
connected by pipeline to an onshore
processing plant in the Arrowsmith
locality. Crude oil is trucked from
Arrowsmith for sale to BP at their
Kwinana refi nery.
BLOCK 09/05
Bohai Bay Basin, China
AWE acquired a 40% interest in Block
09/05 located in the western part of
the Bohai Bay Basin approximately
10km southeast of Tanggu, the
largest port in China. The block
covers an area of 335 km2 with water
depths from approximately 5m to
10m. The block has the benefi t of
low drilling and development costs,
proximity to existing infrastructure
and attractive fi scal terms.
2 5INDONESIAN
EXPLORATION PROJECTS
East Java Sea, Indonesia
AWE holds interests in various
other Indonesian exploration
PSCs, including Bulu, East Muriah,
Terumbu, Titan and North Madura
PSCs, located in the East Java Sea.
The Bulu PSC contains the Lengo
gas fi eld discovery where a Plan of
Development has been prepared
and submitted to the government for
approval. AWE is also evaluating the
potential for onshore unconventional
gas resources.
4
9.5 MMBOE2C Resources
0.452 MMBBLSProduction
2.6 MMBBLS2P Reserves
0.6 MMBBLS2C Resources
ANDE ANDE LUMUT
OIL PROJECT
Natuna Sea, Indonesia
AWE acquired a 100% interest
in the Northwest Natuna PSC in
early 2012 for US$139 million.
In November 2013, the company
announced that it had completed
the sale of a 50% interest in the
Northwest Natuna PSC, which
includes the Ande Ande Lumut
(AAL) Oil Project, to a subsidiary of
Santos Limited for US$188 million.
The heavy oil fi eld will be developed
using horizontal wells drilled from a
wellhead platform producing to an
adjacent spread-moored FPSO.
3
23.2 MMBOE2P Reserves
8.4 MMBOE2C Resources

7AWE LIMITED ANNUAL REPORT 2014
TUI OIL PROJECT
Taranki Basin, New Zealand
AWE has a 57.5% interest in, and is
the Operator of, the Tui Oil Project
in the Taranaki Basin offshore the
west coast of the North Island of
New Zealand. Oil is produced from
the Tui, Amokura and Pateke oil
fi elds via subsea wells connected
to the Floating Production Storage
and Offl oading (FPSO) vessel, the
‘Umuroa’. AWE also holds a 51%
interest in, and is Operator of,
the onshore exploration permit
PEP55768 in the Taranaki Basin,
New Zealand.
CASINO GAS PROJECT
Otway Basin, Victoria
AWE holds a 25% interest in
the Santos operated Casino Gas
Project in the Otway Basin in
Victorian waters. Gas from the
Casino, Henry and Netherby
gas fi elds is produced via subsea
wells connected by pipeline to
the Energy Australia operated
gas processing facility at Iona in
Victoria. The Otway Basin permits
also contain several exploration
prospects, including Blackwatch.
ONSHORE PERTH BASIN
Western Australia
AWE’s onshore Perth Basin
assets, near the town of Dongara
approximately 360km north of Perth
in Western Australia, include varying
AWE and Origin Energy operated
fi elds and associated facilities.
AWE’s interests range from 33%
to 100%. Produced gas is primarily
processed at either the AWE operated
Dongara or Origin operated Beharra
Springs gas plants. Gas is sold
via the APA operated Parmelia
Pipeline, and oil and condensate are
trucked to the BP Kwinana refi nery.
The Perth Basin acreage includes
conventional and unconventional
gas opportunities that AWE is
currently appraising with the view
to commercialisation. In September
2014, AWE announced the discovery
of the Waitsia gas fi eld which may
provide signifi cant conventional and
unconventional resources.
2
3
4
5 6
7
1
8 9
6 7 8 9
1.277 MMBOEProduction
9.7 MMBOE2P Reserves
1.8 MMBOE2C Resources
0.370 MMBOEProduction
2.1 MMBOE2P Reserves
7.1 MMBOE2C Resources*
BASSGAS PROJECT
Bass Basin, Tasmania
AWE has a 46.25%* interest in the
Origin Energy operated BassGas
Project that produces from the
Yolla fi eld located near the centre
of Bass Strait in the Bass Basin
in Tasmania waters. Gas and
associated liquid production from
the Yolla fi eld is conveyed from a
wellhead platform via a pipeline
to a gas processing facility at Lang
Lang in Victoria. AWE also holds
a 44.75%** interest in the Origin
Energy operated T/18P Bass Basin
permit that contains the Trefoil gas
discovery and other contingent and
prospective resources.
1.961 MMBOEProduction
26 MMBOE2P Reserves
36 MMBOE2C Resources
0.684 MMBBLSProduction
3.6 MMBBLS2P Reserves
* Excludes 2C Resources for upgrade to Senecio gas fi eld and newly discovered Waitsia gas field, announced in September 2014.
* AWE’s share of BassGas will reduce to 35% on completion of the sale of an 11.25% interest to Prize Petroleum
** AWE’s share of T/18P will reduce to 40% once the sale of a 9.75% interest to Prize Petroleum and an unrelated purchase of a 5% interest from Drillsearch are completed

8 AWE LIMITED ANNUAL REPORT 2014
A year of signifi cant achievements has propelled AWE
fi rmly towards our fi ve year growth objective of doubling
production to 10 mmboe and tripling Field EBITDAX to
over $500 million by 2018, and our progress has been
recognised by strong share price growth.
The solid operating performance from our production
assets generated excellent revenue and robust cash fl ow.
Together with our strong balance sheet, we have the
capacity and fl exibility to pursue a range of growth and
exploration projects.
In a year of highlights, the sell down of 50% of the Ande
Ande Lumut oil project to Santos, the performance of
Sugarloaf and the Senecio/Waitsia exploration success
stand out.
The sale price achieved for 50% of Ande Ande Lumut
was well in excess of the original acquisition cost for
the 100% interest. I believe this transaction underscores
AWE’s capacity to evaluate an asset, recognise value,
and unlock potential through a disciplined technical and
commercial approach.
Production from Sugarloaf increased by 31% over the
previous year while revenue increased by 34% due to the
high proportion of liquids. In addition, an 82% increase in
booked 2P Reserves plus 2C Contingent Resources was
achieved during the year following an independent review.
The operator continues to perform at a high level, and we
have identifi ed the potential for further upside in reserves,
production and revenue.
A POSITIVE OUTLOOKAWE has achieved or exceeded the goals we set for 2013-14, while continuing to improve our Health Safety and Environmental performance and making material progress towards our longer term growth objectives.

9AWE LIMITED ANNUAL REPORT 2014
M A N A G I N G D I R E C T O R ’ S R E V I E W
assessed in regions where we already have teams in place
and access to infrastructure. We have also increased our
knowledge and understanding of unconventional oil and gas
exploration and production and we are now applying that
expertise to the Perth Basin.
Active portfolio management
Considerable success has been achieved in rebalancing
our asset portfolio through asset sales and farm-ins. We
now have in place a well balanced and valuable portfolio
of assets capable of delivering our short and medium
term growth objectives as well as providing longer term,
material growth opportunities for AWE.
We have diversity of product mix and geography with
conventional and unconventional assets spread across
exploration, appraisal, development and production.
Balancing risk and reward at each stage of the asset
lifecycle is a key focus for AWE’s management team.
"THE STRATEGIC PLATFORM CREATED BY AWE IN RECENT YEARS HAS REPOSITIONED THE COMPANY FOR A PERIOD OF STRONG GROWTH."
The company’s core technical strengths were again
demonstrated in the discovery of the potentially signifi cant
Waitsia gas fi eld in the Perth Basin, located beneath the
previously appraised Senecio gas fi eld. The discovery of
this fi eld, located just seven kilometres from AWE’s existing
Dongara gas processing plant which is linked to the Western
Australian domestic and industrial markets by an existing
gas pipeline, typifi es the quick thinking and technical skills
that are characteristic of AWE.
Production and revenue growth
Oil and gas production exceeded market guidance with
total output of 5.6 mmboe up 13% on the previous year.
Sales revenue, derived from sales volume of 5.4 mmboe,
also exceeded guidance and was up 9% over the previous
year. Our production portfolio is well balanced between
gas, 58%, and liquids, 42%.
The remaining major phases of the BassGas Mid Life
Enhancement project are planned for the summer of
2014-15 and gross production is anticipated to return
to system capacity of 60-70 TJ per day by the middle of
2015. The new development wells and the installation of
gas compression and condensate pumping modules will
support BassGas production well into the next decade.
In the Tui fi eld, the Pateke-4H development well will be tied
in to the FPSO “Umuroa” with work commencing in the
fi rst quarter of 2015. Production from Pateke-4H is likely
to commence late in the second quarter of 2015 and will
signifi cantly enhance Tui revenues over the short term.
As a result of the planned shut downs for development
work at BassGas and Tui, combined with reduced equity
in BassGas following the anticipated completion of the
sale of an 11.25% interest to Prize Petroleum, production
in 2014-15 is expected to be lower at 4.6 to 5.1 mmboe
before resuming growth in 2015-16. Importantly, sales
revenue in 2014-15 is expected to remain at the same
level as the previous year largely due to increased liquids
production from Sugarloaf.
Strategic success
The strategic platform created by AWE in recent years has
repositioned the company for a period of strong growth.
Not only have we acquired new projects and achieved
substantial exploration success, we have worked assets
harder through a combination of clever technical
and commercial expertise. We are expanding the
exploration portfolio and working with our joint venture
partners to achieve better performance from development
and production assets. Further opportunities are being
6
5
4
3
2
1
0
FY12 FY13 FY14 FY15
4.7
5.0
5.6
4.6-5.1m
illio
n B
OE
TOTAL PRODUCTION FOR 12 MONTHS ENDING 30 JUNE
Oil Condensate ForecastLPG Gas
91.0MMBOE2P Reserves
76.6MMBOE2C Resources*
* excludes upgrade to Senecio and initial 2C estimates for Waitsia discovery

10 AWE LIMITED ANNUAL REPORT 2014
Exploration
The technical strength of AWE’s exploration team has
been a driver of the company’s growth and development.
Our major focus over the next 12 months will be further
exploration and appraisal of the conventional and
unconventional potential of the Perth Basin. This will be
initially targeted at the Senecio and Waitsia discoveries,
where fl ow testing of Senecio-3 and further appraisal
drilling is planned for 2014-15. This activity is a crucial
step in moving these discoveries forward to potential
development. With access to existing infrastructure and
our depth of technical and operational experience, I am
confi dent the Perth Basin will become a substantial
growth asset for AWE.
We will also be focusing on Ande Ande Lumut, where
the joint venture is assessing the possibility of drilling an
appraisal well in the G-sand in 2015, below the primary
K-sand development, where AWE has identifi ed an
additional potential 35 mmbbls gross recoverable oil.
Work on other prospects in the Northwest Natuna PSC
is also progressing.
During the year, AWE secured new exploration acreage
in Australia, New Zealand and China and we acquired 3D
seismic over the La Bella fi eld in the Otway Basin which
is being evaluated. Our exploration plans for 2014-15 are
similar in magnitude to previous years, albeit with additional
appraisal activity in the Perth Basin which is appropriate for
the company at this stage of its development.
Building a sustainable business
2014 has been a landmark year for the company’s safety
performance. Through focus and application, we have achieved
two years, or almost two million man hours, without a lost time
injury. Our fi rm belief, from Board level down, is that everyone,
including our contractors, should go home at night just as
healthy as they were when they started the day. AWE’s safety
record, as measured by incident frequency, is now signifi cantly
better than the industry average and we will do our utmost to
ensure this continues.
Our environmental performance during the year was
also pleasing. We had no reportable incidents and added
substantially to our systems and processes, particularly in
relation to our growing onshore operations.
We remain focused on building lasting relationships with
communities and stakeholders in areas where we operate
in Australia, New Zealand and Indonesia. We are devoting
considerable resources to ensure our activities in the
Perth Basin are fully understood and we remain open and
transparent in our dealings with all stakeholders. AWE
currently provides approximately $5 million per year in
economic benefi t to local communities in the Perth Basin,
and we anticipate that this will increase should we move
into the development phase for the Senecio and Waitsia
gas fi elds.
People
We believe that developing and retaining skilled and talented
people is critical to managing growth and achieving our
goals. AWE’s exciting projects and varied locations have
attracted some of the most talented people in the industry
to our organisation. As we grow our business in Australasia
and Asia, there will be new opportunities across a wide
range of disciplines.
M A N A G I N G D I R E C T O R ’ S R E V I E W
7.0
6.0
5.0
4.0
3.0
2.0
1.0
0.0
Jul-13
Aug-13
Sep-1
3
Oct-1
3
Nov
-13
Dec
-13
Jan-1
4
Feb-
14
Mar
-14
Apr-1
4
May
-14
Jun-1
4
Inju
ries
per
mill
ion
man
hou
rs
AWE OPERATED 12 MONTH ROLLING AVERAGE PERFORMANCE INDICATORS
AWE Total Recordable Case Frequency
AWE Lost Time Injury Frequency
APPEA Total Recordable Injury Rate 4.9 (2012–13)
0 1 2 3 4 5
km
Beharra
Springs
L11
L14
L2
L7
L1
Redback
Trapdoor
Waitsia
(Senicio Deep)
Port Denison
Dongara
Dongara
Corybas
Synaphea
Irwin
N
Senecio-3
N O RT H E R N P E RT H BA S I N
AWE Permit Area
Gas Field
Oil Field
Gas Discovery/Appraisal
Prospects
Gas Pipeline
Gas well, suspended

11AWE LIMITED ANNUAL REPORT 2014
Our success has been driven by a motivated and capable
team of employees and contractors. The results from all
our operations, but particularly from Ande Ande Lumut and
the Perth Basin, have highlighted how a clever and agile
team can deliver superior performance.
I would like to thank the team for their efforts and for the
results we have achieved in 2013-14.
Looking to the future
The outlook for AWE over the next three to fi ve years
is exceptional.
Our existing production assets are performing well and
we have put in place the cornerstone assets to deliver
our ambitious growth targets. Our exploration portfolio
is being revitalised, and we continue to look for new
growth opportunities in Australia, New Zealand and Asia.
In recent years we have successfully increased the
proportion of liquids in our portfolio, but we have also
concentrated on building up our exposure to high
value gas assets, particularly in Australia. Much of
our gas production will come off contract in 2017 and
2018 providing the potential to lock in higher returns in
strengthening east coast gas markets.
Our base operating business will continue to deliver
strong production, revenue and cash fl ow needed to fund
our exciting future. We have a robust balance sheet with
signifi cant capacity and a clear strategy to achieve our
goals. We have a talented and capable team of employees
and contractors, and I look forward to working with them
to achieve our goals and to deliver substantial value for our
shareholders.
73% Australia
12% New Zealand
15% USA
ANNUAL PRODUCTION 2013–14BY GEOGRAPHY TOTAL: 5.6 MMBOE
59% Australia
19% New Zealand
22% USA
SALES REVENUE 2013–14BY GEOGRAPHY TOTAL: $328.2M
SALES REVENUE 2013–14 BY PRODUCT TOTAL: $328.2M
35% Oil
28% Condensate
10% LPG
27% Gas
Bruce Clement
Managing Director
NO(ZERO)Lost Time
Injuries
NO(ZERO)Reportable
Environmental
Incidents

12 AWE LIMITED ANNUAL REPORT 2014
F I N A N C I A L M A N A G E M E N T
F I N A N C I A L M A N A G E M E N T
AWE’s disciplined approach to fi nancial management
continued to make a signifi cant contribution to the
company’s excellent results in the 2013-14 fi nancial year.
During the past three years, AWE has undertaken a
targeted and disciplined approach to rebalancing its
portfolio of assets and has positioned the balance sheet
to deliver growth and superior returns to shareholders.
During the 2013-14 fi nancial year, we achieved a
number of milestones that helped deliver a statutory
NPAT of $62.5 million.
We exceeded production and revenue guidance and
achieved Field EBITDAX of $209 million from our
diverse portfolio of assets. Development and exploration
expenditure of $188 million was below guidance, and the
average operating cost of $22 per BOE was lower than
prior years. At the end of the fi nancial year, AWE had
cash of $42 million and no debt.
One of AWE’s core strengths is the ability to create and
extract value from asset acquisitions and divestments.
This year we achieved outstanding fi nancial outcomes
from three key transactions: the sale of a 50% interest
in the Ande Ande Lumut oil project for US$188 million
(which resulted in $97 million profi t on sale in 2013-14),
the sale of an 11.25% interest in the BassGas project for
$85 million (which will reduce development expenditure in
2014-15), and the acquisition of an additional 15% interest
in the Tui oil project for US$6.4 million. Each transaction
was strategic in nature and collectively were a key part of
positioning AWE to achieve our growth objectives.
Strong operating cash fl ows critical to driving growth
Diversity in our asset portfolio is an important feature
of our approach to risk management and maximising
return on investment. Our portfolio of assets spans the
upstream value chain from exploration and appraisal
through to development and production. A strong
balance of cash fl ows from our producing assets also
means that AWE has the fi nancial capacity to reinvest
in the growth of the business.
8% Australia
41% New Zealand
20% USA
7% Indonesia
24% Exploration
43% Australia
7% New Zealand
20% USA
13% Indonesia
17% Exploration
INVESTMENT EXPENDITURE BY GEOGRAPHY 2013–14TOTAL: $188M (DEVELOPMENT & EXPLORATION)
INVESTMENT EXPENDITURE BY GEOGRAPHY 2014–15 (PLANNED)TOTAL: $270M–$300M (DEVELOPMENT & EXPLORATION)
"DIVERSITY IN OUR ASSET PORTFOLIO IS AN IMPORTANT FEATURE OF OUR APPROACH TO RISK MANAGEMENT AND MAXIMISING RETURN ON INVESTMENT."

13AWE LIMITED ANNUAL REPORT 2014
This operating model is not unique to AWE, but the diversity
and potential value of our production and development
assets does make AWE stand out amongst its peers.
We have successfully rebalanced AWE’s product mix to
be more weighted towards higher margin liquid assets
and, over time, this will support our goal of tripling Field
EBITDAX to over $500 million by the end of 2018.
Strong operating cash fl ow is key to AWE’s ability to
fund its capital requirements over the next three to fi ve
years. AWE also has as a $300 million corporate debt
facility, successfully refi nanced for a four-year term in
December 2013. This facility was undrawn at the end
of 2013-14. The combination of strong operating cash
fl ows and a $300 million undrawn debt facility places
AWE in an excellent fi nancial position and provides us
with the fl exibility to pursue growth projects and other
opportunities as they arise.
In the coming year, capital expenditure is expected to
peak and we expect to move into a net debt position as
we make signifi cant progress on major development
projects, including BassGas, Sugarloaf, Ande Ande
Lumut and the tie-in of the Pateke well at Tui. We will also
focus on further exploration and appraisal activity in the
Perth Basin. Importantly, the balance sheet has the
capacity to support this planned activity and we remain
confi dent that we can continue to pursue additional
growth while maintaining balance sheet strength.
Risk management
Risk management remains a key responsibility of
both the AWE Board and management. The Audit and
Governance Committee and management have put in
place a governance framework that provides a clear
structure and pathway for decision making. Considerable
time and resources are devoted to fi nancial analysis and
stress testing assumptions, which are critical to ongoing
fi nancial management as well as investment decisions.
Financial, operational, safety and sustainability risks are
reviewed regularly and managed using a comprehensive
risk register.
Overall, AWE’s performance has been strong right across
the company. Our commitment to fi scal discipline, portfolio
management and strict targets has proved successful. We
are achieving our production, development and exploration
milestones and our balance sheet has signifi cant capacity
to fund increased activity and investment.
FIELD EBITDAX FOR THE 12 MONTHS ENDING 30 JUNE
90
80
70
60
50
40
30
20
10
0
Western Australia South-Eastern Australia
New Zealand United States
49
3841
60
41
34
45
85
A$
M
FY13 $185.0m FY14 $208.8m
$62.5MNet Profi t After Tax
$209MField EBITDAX
$300MUndrawn debt facility at 30 June 2014
Ayten Saridas, CFO
Ayten Saridas
Chief Financial Offi cer

GROWTHPROJECTS
G R O W T H P R O J E C T S
SUGARLOAF
BASSGAS
ANDE ANDE LUMUT
SENECIO/WAITSIA
TUI/PATEKE
LENGO

15AWE LIMITED ANNUAL REPORT 2014
Sugarloaf(10%, net ~7.5%) - Eagle Ford, Texas, USA
Sugarloaf has been an excellent growth project for AWE
and is now the company’s third largest production asset
on a barrel of oil equivalent basis. Representing AWE’s
exposure to the unconventional oil and gas revolution in
the USA, the Eagle Ford play has evolved into some of the
most productive unconventional acreage in the United
States. Production from Sugarloaf was up 31% over the
previous year. Cash fl ow from the project is excellent
and the operator has advised that enhanced completion
designs are yielding a 25% improvement in initial well
production performance. Revenues from Sugarloaf are
largely generated by liquids.
The operator, Marathon Oil, has introduced a number
of initiatives that have signifi cantly enhanced the
project, including an accelerated drilling program to
approximately 100 wells per year, a reduction in well
spacing to increase Reserves and Resources, improved
drilling, fraccing and completion techniques, and a
continued focus on reducing well costs. The operator
has moved to batch drilling and batch completions
which will help reduce costs further.
More recently, the appraisal and development of a
new play – the Austin Chalk – is gaining momentum and
early indications are that well production performance
is matching that of wells in the Eagle Ford Shale.
During the year, Sugarloaf’s 2P Reserves plus 2C
Resources were increased by 82% after an independent
review by DeGolyer & MacNaughton. Given the initial
success of wells in the Austin Chalk, AWE believes
there is signifi cant upside potential for both production
and Reserves.
The company has an exciting range of
growth projects at different stages of
development maturity and will continue
to actively manage its portfolio of
quality assets, including sourcing new
opportunities in Australasia and Asia.
Four cornerstone projects – Ande Ande Lumut in
Indonesia, Sugarloaf in the USA, BassGas in Victoria
and the exciting new gas opportunities in Western
Australia’s Perth Basin – will underpin AWE’s near
to medium term growth.
AWE’S GROWTH STRATEGY IS DRIVEN BY NEW PROJECT DEVELOPMENTS, EXPLORATION SUCCESS AND THE EXPANSION OR EXTENSION OF EXISTING OPERATIONS.
82% increase in 2P Reserves plus 2C Resources
31% increase in production in 2013-14

16 AWE LIMITED ANNUAL REPORT 2014
Compression module lift planned for late 2014
Development drilling planned for early 2015
BassGas (46.25%^) – Bass Basin, Australia
The BassGas project consists of the offshore
Yolla platform and production wells connected by
pipeline to the onshore gas processing facility at
Lang Lang, Victoria. Gas is currently produced from
the Yolla-4 well while the Yolla-3 well is shut in.
The Mid-Life Enhancement (MLE) project is designed
to ensure that the BassGas operation maintains its
position as one of AWE’s cornerstone projects well
into the next decade. The MLE project aims to access
signifi cant remaining Reserves, deliver increased
production in the near term, and extend the overall
project life, with the potential to add further
production from nearby discoveries, including the
Trefoil gas and condensate fi eld.
A Final Investment Decision (FID) has confi rmed the
Yolla 5 and Yolla 6 development wells will be drilled
over the coming summer using the jack-up rig, 'West
Telesto'. Drilling is currently scheduled for early 2015,
subject to rig arrival. When fi nished, production from
BassGas should increase to 60-70 TJ per day gross.
Plans for a heavy lift vessel to install gas compression
and condensate pumping modules on the Yolla
platform have been completed and installation is
scheduled for late 2014, subject to vessel availability.
This upgrade to the on-platform processing facilities
will support increased production from Yolla and
provide the opportunity for development of nearby
resources and discoveries. FID planned for mid-2015
Considering new appraisal well on deeper G sand reservoir
Ande Ande Lumut (50%) – Natuna Sea, Indonesia
The Ande Ande Lumut oil project in the offshore
Northwest Natuna PSC in Indonesia is one of AWE’s
major growth projects planned to produce fi rst oil in
late 2017. AWE acquired a 100% interest in the project
in early 2012 for US$139 million and over the next 18
months completely revised the reservoir interpretation
and development plan, resulting in a substantial
increase in estimated recoverable oil. In November
2013, a 50% interest in the project was sold to Santos
Limited for US$188 million. As part of this transaction,
Operatorship was transferred to Santos.
AWE is now working closely with Santos to add even
greater value to the project by considering appraisal and
potential development of the deeper G sand in addition
to the originally planned K sand development. The
joint venture is currently evaluating the potential for an
appraisal well in the G sand in 2015. Successful appraisal
drilling of the G sand in 2015 could add an estimated 35
million barrels of gross recoverable oil to the project and
create substantial additional shareholder value.
Front End Engineering and Design (FEED) work for the
well head platform is nearing completion and Santos has
submitted the tender plan for the Floating Production
Storage and Offl oading (FPSO) vessel contract to the
Indonesian authorities. FID is planned for mid-2015,
following completion of FPSO contract tendering.
^ AWE’s share of BassGas will reduce to 35% on completion of the sale of an 11.25% interest to Prize Petroleum

17AWE LIMITED ANNUAL REPORT 2014
Operator submits draft Plan of Development
Lengo (42.5%) – East Java Sea, Indonesia
In the Bulu PSC in the East Java Sea in Indonesia, the
development of the Lengo gas project has advanced with
the operator submitting a draft Plan of Development to
the regulator SKK Migas.
With an estimated 200 Bcf of recoverable gas, Lengo
has the potential to be a signifi cant contributor to
AWE’s production growth in the medium term. The
fi eld’s proximity to the strengthening gas market on
East Java provides a number of development and gas
marketing options.
Pateke-4H well will boost production in 2015
Tui/Pateke (57.5%, Operator) – Taranaki Basin, New Zealand
The Pateke-4H development well was drilled,
completed and suspended in May 2014 ready for
tie-in to the “Umuroa” FPSO. Production is scheduled
to commence towards the middle of calendar 2015
following installation and commissioning of a sub-sea
fl owline and control equipment connecting the well to
the Tui fi eld system.
Drilling Pateke–4H presented several signifi cant
challenges, requiring two side-track holes to be drilled,
resulting in total drilling costs of US$111 million
(AWE share US$64 million).
The Tui oil project remains a key component of AWE’s
production base and a signifi cant contributor to revenue
and cash fl ow. In October 2013, AWE acquired an
additional 15% interest in the project from Mitsui for
US$6.4 million to lift its equity in the project to 57.5%.
Waitsia a 290 Bcf gross new gas discovery
Senecio gas resources boosted to 70 Bcf gross
Senecio/Waitsia (50%, Operator) – Onshore Perth Basin, Australia
The Waitsia discovery and successful appraisal of
the Senecio Field in August/September 2014 has the
potential to transform the future for onshore gas
development and production in the Perth Basin.
After successfully appraising the Dongara/Wagina tight
gas reservoir, the Senecio-3 well was deepened more
than 500m after AWE identifi ed elevated gas shows in
deeper formations. The decision to continue drilling
through these gas shows in the Carynginia Shale and
Irwin River Coal Measures resulted in the discovery
of the Waitsia gas fi eld in the Kingia and High Cliff
Sandstones. Waitsia could be the largest onshore
conventional gas discovery in Western Australia for 50
years, with signifi cant unconventional upside, and could
open up a major new gas play in the Perth Basin.
AWE has made an initial Contingent Resource estimate for
the Waitsia discovery, in the Kingia/High Cliff sandstones,
between 65 Bcf to 1170 Bcf with a best estimate (2C) of
290 Bcf. Together, the Senecio and Waitsia gas fi elds
offer the prospect of relatively low cost, early conventional
production with combined gross 2C (P50) Contingent
Resources of 360 Bcf of gas.
This discovery offers major potential benefi ts to the
local Perth Basin, Western Australia and Australian
communities.

18 AWE LIMITED ANNUAL REPORT 2014
EXPLORATIONEXPLORATION SUCCESS HAS BEEN A KEY DRIVER OF AWE’S PRODUCTION GROWTH AND SHAREHOLDER VALUE CREATION STRATEGY SINCE THE COMPANY WAS FORMED IN 1997.
BOHAI BASIN
PERTH BASIN
OTWAY BASIN
BASS BASIN
NORTH CARNARVON BASIN
TARANAKI BASIN
EAST JAVA SEA

19AWE LIMITED ANNUAL REPORT 2014
E X P L O R A T I O N
In 2013-14, AWE increased its exploration and appraisal
drilling activity and recorded a number of successes,
particularly in the Perth Basin. Exploration and appraisal
drilling is expected to increase further in the current
fi nancial year.
Strengthening gas markets in Australia and Indonesia
are providing the impetus for expanded exploration
efforts. AWE’s exploration strategy focuses on generating
additional development and growth opportunities in areas
close to infrastructure and in strong domestic gas markets.
Bohai Basin, China
AWE recently acquired a 40% working interest in Block
09/05 in the offshore Bohai Basin in China. This prolifi c
offshore basin, 10km South East of Tanggu (China’s largest
port), is close to existing infrastructure, lies in very shallow
water, and offers low drilling and development costs with
close proximity to existing infrastructure and production
facilities, and attractive fi scal terms. The fi rst well was
drilled in August-September 2014 and was unsuccessful.
A second well is planned for 2015.
Block 09/05
(40%)
0 5 10 15 20
km
B O H A I BA S I NBlock 09/05,
Bohai Bay (40%)
Oil Field
Gas Field

20 AWE LIMITED ANNUAL REPORT 2014
E X P L O R A T I O N
WA-497-P
(100%)
0 10 20 30 40 50
kmN
Woodada
Woodada
Deep-1
Redback
Trapdoor
Beharra Springs
Cliff Head
Dongara
Corybas
L7
L2
L14
L11
L1
EP 320
EP 413
L4
EP 455
WA-31-L
0 5 10 15 20
kmN
Senecio-3
Arrowsmith-2
Synaphea
Waitsia
(Senicio Deep)
Irwin
L5
Drover-1
P E RT H BA S I N10 onshore permits (33%-100%, some Operated)
N O RT H C A R N A R V O N BA S I NWA-497P, Exmouth Sub Basin (100%, Operator)
Perth Basin, Western Australia
AWE drilled two exploration and appraisal wells during
the 2014 calendar year: Drover-1 in EP455 (AWE 81.5%,
Operator) and Senecio-3 in L1/L2 (AWE 50%, Operator),
with a third well, Irwin-1 in EP320 (AWE 33%), planned
for early 2015.
Senecio-3, located in the northern part of the Perth
Basin, successfully appraised the Senecio gas fi eld in
the Dongara/Wagina sands and also discovered the
Waitsia gas fi eld in the deeper Kingia/High Cliff sands.
AWE is planning a conventional fl ow test of Senecio-3
and the drilling of an additional appraisal well on the
Waitsia discovery in early 2015. In addition, the Irwin-1
exploration well will target the same Dongara/Wagina
and Kingia/High Cliff sands intersected by Senecio-3.
Further south, the Drover–1 vertical exploration well
was suspended in July 2014 after achieving signifi cant
gas readings in the Kockatea Shale and Carynginia
Shale. Well logs and core data from these intervals will
be fully analysed and evaluated before deciding on the
next phase of exploration activity, which may include
hydraulic fracturing.
During the year, appraisal of a number of shale gas
targets continued at Arrowsmith-2 located in the middle
of the Perth Basin. Testing of the Arrowsmith-2 well,
operated by Norwest in exploration permit EP413 (AWE
44.25%), resumed in late August 2013.
AWE HAS CONTINUED TO BUILD EXPLORATION OPPORTUNITIES IN WESTERN AUSTRALIA
Oil Field
Gas Field
Oil Pipeline
Gas Pipeline
Proposed Gas Pipeline
Oil Field
Gas Field
Kockatea & CarynginiaOil & Gas Shale Trend
Gas Discovery/Appraisal
Gas Pipeline
Oil Pipeline
AWE Permit area
Gas well, suspended

21AWE LIMITED ANNUAL REPORT 2014
TA R A N A K I BA S I NPEP 55768, Onshore, (51%, Operator)
An initial comingled gas fl ow rate of 3.5 million scf/d was
recorded on 18 September 2013, and the well averaged
test fl ow rates of 315,000 scf/d from 19 September
to 17 October 2013. The gas fl ow was achieved from
the Carynginia Shale formation, the Irwin River
Coal Measures and the High Cliff Sandstones. A 3D
seismic survey over the area round Arrowsmith-2 will
enable selection of the most appropriate zone for the
placement of a possible horizontal well.
An independent technical assessment of AWE’s four
most southern exploration permits in the Perth Basin
resulted in a gross unconventional gas estimate of 11.1
Tcf of gas and 31 million barrels of NGLs (9.2 Tcf and 14
million barrels net to AWE) for the Kockatea Shale, the
Carynginia Shale, the Irwin River Coal Measures and the
High Cliff Sandstone.
Otway Basin, Victoria
In September 2013, AWE signed a farm-in agreement to
acquire a 60% working interest in permit Vic/P67, offshore
Victoria containing the undeveloped La Bella gas fi eld.
Under the terms of the farm-in agreement, AWE agreed
to pay 75% of the total cost, capped at US$9 million, to
acquire a state-of-the-art 3D marine seismic survey over
the La Bella fi eld and surrounding exploration targets.
Following review of the new seismic data, AWE has the
option to participate in a two-well exploration program
as Operator at either 30% or 60% working interest or
surrender its interest at no additional cost.
In permit VIC/P44, where AWE holds a 25% interest in
the producing Casino Gas Project, reinterpretation of 3D
seismic PSDM reprocessing data is underway to assess
the remaining prospectivity. The Operator, Santos, is also
evaluating potential drilling opportunities.
Bass Basin, Tasmania
AWE has future expansion opportunities with the Trefoil, White Ibis and
Rockhopper fi elds located near the existing Yolla production facility in the
Bass Basin. AWE’s net interest in T/18P (Trefoil) will be 40% once the sale
of a 9.75% interest to Prize Petroleum and the purchase of a 5% interest
from Drillsearch Energy are completed.
North Carnarvon Basin, Western Australia
AWE has continued to build exploration opportunities in Western Australia
and was awarded a new offshore permit, WA–497P (AWE 100%, Operator),
in the Exmouth sub-basin/North Carnarvon Basin. The permit was awarded
through the Australian 2013 Offshore Petroleum Exploration Acreage Release
and is located near a number of signifi cant producing assets.
The permit was bid on the basis of a mandatory work program, including
seismic reprocessing, seismic inversion and G&G studies. To meet the Year
1 commitment, AWE has begun broadband reprocessing of approximately
1,200km2 of 3D and 280km of 2D seismic survey data with fi nal data due in
the fi rst quarter of the 2015 calendar year.
Taranaki Basin, New Zealand
The onshore permit PEP 55768 (AWE 51%, Operator) was awarded to
AWE in December 2013. The reprocessing of existing 2D and 3D seismic
survey data commenced during the period. The permit is close to existing
infrastructure and a good domestic gas market in New Zealand.
East Java Sea, Indonesia
AWE remains active in the East Java Sea region with the acquisition of
2D seismic over potential exploration opportunities in the North Madura
PSC (AWE 50%, Operator) and Terumbu PSC (AWE 100%, Operator) planned
for the second half of 2014. Early stage preparation work is under way for
an exploration well in the North Madura PSC in 2015.
Gas Field
Gas Pipeline
Oil Pipeline
PEP 55768
Kaimiro
Ngatoro
Mangahewa
New Plymouth
PEP 55768
0 10 20 30 40
kmN
PEP 55768
AWE 51%
(Operator)
Gas Field
Gas Pipeline
Oil Pipeline

SUSTAINABILITYENGAGING WITH KEY STAKEHOLDERS, ESPECIALLY LOCAL COMMUNITIES, IS CRUCIAL TO AWE’S LONG TERM BUSINESS SUSTAINABILITY.
ACTIVE CONSULTATION IN THE PERTH BASIN
STAKEHOLDER ENGAGEMENT
ENVIRONMENTAL MANAGEMENT
SUPPLY CHAIN PARTNERSHIPS
INDIGENOUS HERITAGE
BEYOND COMPLIANCE
in the Perth Basin

23AWE LIMITED ANNUAL REPORT 2014
Engaging and working with key stakeholders,
especially local communities, is crucial to AWE’s long
term business sustainability. AWE engages with the
communities in which it operates in a number of ways,
including presentations, information meetings and
face-to-face discussions. The company’s community
engagement process offers stakeholders an insight into
current and planned operations as well as providing an
opportunity for communities and landowners to voice
their concerns and offer input to planned or upcoming
business activities.
Active consultation in the Perth Basin
AWE and its predecessors have been operating in the
Perth Basin since the 1960s. AWE is committed to
working in an open and transparent way in all its business
activities, including with communities in the Perth Basin.
Ongoing consultation has identifi ed a number of important
issues that AWE is addressing as part of its community and
stakeholder engagement programs:
+ consultation and communication
+ transparency and disclosure
+ community investment and sponsorship
+ local job opportunities
+ potential environmental impacts
+ prevention of groundwater contamination
+ access to culturally signifi cant sites.
AWE IS COMMITTED TO OPERATING A SUSTAINABLE BUSINESS IN THE ONSHORE PERTH BASIN AND WE RECOGNISE THE IMPORTANCE OF ACTIVELY ENGAGING AND WORKING WITH THE COMMUNITIES IN WHICH WE OPERATE.

D I R E C T O R S ’ R E P O R T
24 AWE LIMITED ANNUAL REPORT 2014
Stakeholder engagement
AWE has developed a comprehensive stakeholder
engagement plan that identifi es stakeholders, their
information needs and the timing of communications
and engagement. The company is continuing to adapt
the plan, learning from experience how to engage most
effectively with key stakeholders.
During the year, AWE held local community information
sessions in preparation for planned drilling activity
in the Perth Basin, which commenced in June 2014.
In addition, regular meetings were held with various
stakeholder groups and local residents to keep them
informed of AWE’s current and planned operations.
AWE’s website has been enhanced to serve as a
community education resource on the subject of
conventional and unconventional gas exploration
including hydraulic fracture stimulation (or 'fraccing').
In September 2014, AWE hosted a number of site tours
at the Senecio-3 well site. Councillors and staff of
local shires participated in the tours, as did business
and landowner representatives, media, members of
parliament and staff from key regulators. For many
participants, it was the fi rst time they had seen a drill rig
in operation and they were able to see the considerable
health, safety and environmental management controls
put in place. It was also a valuable opportunity to
discuss a range of issues and explore perceptions and
misconceptions about gas exploration and production.
$5M AWE contributes approximately $5 million per year to the Perth Basin's Mid West economy in wages, local contracts and community partnerships
16organisations received fi nancial support totalling $36,000
4
site tours for government and community groups
Environmental management
Western Australia has some of the most diverse and
unique fl ora and fauna, boasting an abundance of
wildfl owers and native species. AWE’s approach to
environmental management takes into account the
diversity of locations and the associated variety of
environmental risks across the Perth Basin.
The process for gaining environmental approvals from
government departments, and ongoing compliance,
has been integrated with the company’s exploration
appraisal, development and operations activities. A
summary of the Environmental Plan for each well drilled
is located on AWE’s website (www.awexplore.com).
AWE is aware of the high value placed on the Mid West
environment by landowners, community members
and other stakeholders, and has undertaken rigorous
environmental risk assessments, testing and monitoring
of waterways and sampling of soils. Particular attention
is placed on protecting freshwater aquifers, and sections
of well bores that intersect aquifers are safeguarded by
multiple layers of steel casing and cement.
Supply chain partnerships
AWE continues to make a signifi cant economic
contribution to the Mid West communities in the Perth
Basin. The company’s employment and procurement
policies offer direct employment and local supply chain
opportunities for individuals and companies based in
the Mid West region. AWE contributes approximately $5
million per year to the Mid West economy in wages, local
contracts and community partnerships and anticipates
this will increase substantially should recent discoveries
be commercialised.
39 meetings with local councils, community groups and NGOs
1,344 emails/letters to landowners and local residents

D I R E C T O R S ’ R E P O R T
25AWE LIMITED ANNUAL REPORT 2014
AWE’S SUSTAINABILITY PRINCIPLES
1Operate a healthy and safe workplace with a goal to achieve zero harm to people
2 Minimise the impact of our business activities on the environment
Indigenous heritage
To understand and address Aboriginal heritage
considerations, AWE undertakes Aboriginal heritage
surveys to identify any heritage sites that could
potentially be affected by our operations. Although
no potential heritage sites were identifi ed within or in
close proximity to drilling sites in the Perth Basin, AWE
engaged indigenous representatives to monitor initial
groundworks at the Drover-1 and Senecio-3 sites to
ensure no artefacts were disturbed. This approach has
been incorporated into standard operating procedures
and will also occur at future operational locations.
Beyond compliance
AWE’s approach to community and stakeholder
engagement stands on four key pillars:
+ operational excellence
+ beyond compliance
+ open engagement
+ returns to the community.
AWE helped develop and is a founding signatory to the
Western Australia Onshore Gas Code of Practice for
Hydraulic Fracturing. The Code of Practice commits its
signatories to high standards of work and environmental
management. It provides a best practice framework for
safe, effi cient and environmentally responsible operations
when undertaking hydraulic fraccing. The code can be
downloaded at: http://wa-onshoregas.info/.
AWE's full Sustainability Report can be found at:
www.awexplore.com.
4 Build a team that is engaged, motivated and rewarded by working with AWE
Deliver superior, sustainable returns for shareholders
5
3Benefi t the local communities in which we operate
D I R E C T O R S ’ R E P O R T
26 AWE LIMITED ANNUAL REPORT 2014
BOARD AND SENIOR EXECUTIVES
D I R ED I R ED I R ED I R ED I R ED I R ED I R ED I R ER ER EEEEER ED I R C T O RC T O RC T O RC T O RC T O RC T OC T O RC T O RT O RRRRRRC T O RRRRRC T OCC T O RR S ’ RS ’ RS ’ RS ’ RS ’ RS ’ RS ’S ’ RS ’ RS ’ RRS ’ RS ’ RRSS RR E P O RE P O RE P O RE P O RE P O RE P O RE P O RE P O RP OE P O RP O RE P O RE P O ROP O RP O RE P O RE TTTTTTTTT
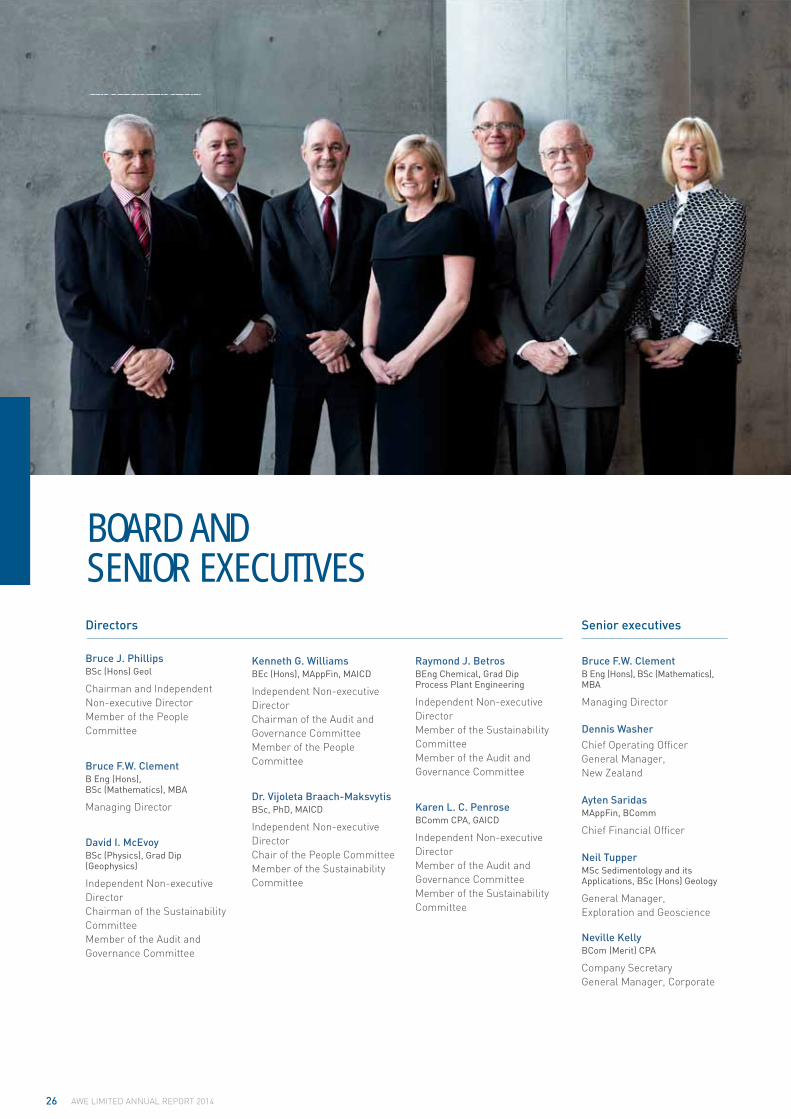
Bruce J. PhillipsBSc (Hons) Geol
Chairman and Independent
Non-executive Director
Member of the People
Committee
Bruce F.W. ClementB Eng (Hons), BSc (Mathematics), MBA
Managing Director
David I. McEvoyBSc (Physics), Grad Dip (Geophysics)
Independent Non-executive
Director
Chairman of the Sustainability
Committee
Member of the Audit and
Governance Committee
Kenneth G. WilliamsBEc (Hons), MAppFin, MAICD
Independent Non-executive
Director
Chairman of the Audit and
Governance Committee
Member of the People
Committee
Dr. Vijoleta Braach-Maksvytis BSc, PhD, MAICD
Independent Non-executive
Director
Chair of the People Committee
Member of the Sustainability
Committee
Bruce F.W. ClementB Eng (Hons), BSc (Mathematics), MBA
Managing Director
Dennis Washer
Chief Operating Offi cer
General Manager,
New Zealand
Ayten SaridasMAppFin, BComm
Chief Financial Offi cer
Neil TupperMSc Sedimentology and its Applications, BSc (Hons) Geology
General Manager,
Exploration and Geoscience
Neville KellyBCom (Merit) CPA
Company Secretary
General Manager, Corporate
Raymond J. Betros BEng Chemical, Grad Dip Process Plant Engineering
Independent Non-executive
Director
Member of the Sustainability
Committee
Member of the Audit and
Governance Committee
Karen L. C. PenroseBComm CPA, GAICD
Independent Non-executive
Director
Member of the Audit and
Governance Committee
Member of the Sustainability
Committee
Senior executivesDirectors

Directors’ report 28
Auditor’s independence declaration 38 to the directors of AWE Limited
Remuneration report 40
Corporate governance statement 55
Consolidated income statement 65
Consolidated statement of 66 comprehensive income
Consolidated statement of fi nancial position 67
Consolidated statement of cash fl ows 68
Consolidated statement of changes in equity 69
Notes to the consolidated 70 fi nancial statements
Directors’ declaration 111
Independent auditor's report to 112 the members of AWE Limited
AWE LIMITED
2014 FINANCIAL REPORT
28 AWE LIMITED ANNUAL REPORT 2014
D I R E C T O R S ’ R E P O R T
Directors’ Report
The directors present their report together with the consolidated
fi nancial report of the entity being AWE Limited (“AWE” or “the
Company”), and its controlled entities, for the year ended 30 June
2014 and the auditor’s report thereon.
The directors of the Company during the year are set out on
page 34 of the Directors’ Report.
Operating and fi nancial review
The directors of AWE Limited present the Operating and Financial
Review of the consolidated entity, prepared in accordance with section
299A of the Corporations Act 2001 (Cth), for the year ended 30 June
2014. The information provided in this review forms part of the
Directors’ Report and provides information to assist readers assess
the operations, fi nancial position and business strategies of AWE.
The principal activities of AWE continue to be the exploration for,
development and production of hydrocarbons.
1. Performance overview
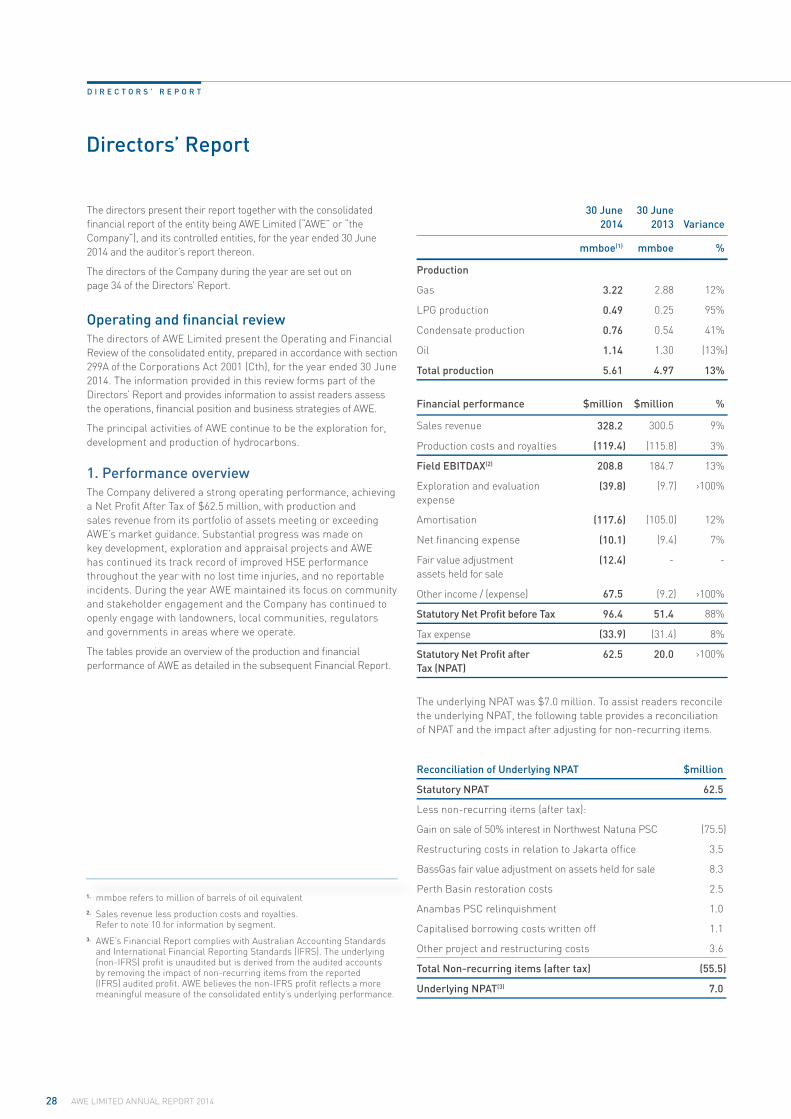
The Company delivered a strong operating performance, achieving
a Net Profi t After Tax of $62.5 million, with production and
sales revenue from its portfolio of assets meeting or exceeding
AWE’s market guidance. Substantial progress was made on
key development, exploration and appraisal projects and AWE
has continued its track record of improved HSE performance
throughout the year with no lost time injuries, and no reportable
incidents. During the year AWE maintained its focus on community
and stakeholder engagement and the Company has continued to
openly engage with landowners, local communities, regulators
and governments in areas where we operate.
The tables provide an overview of the production and fi nancial
performance of AWE as detailed in the subsequent Financial Report.
30 June
2014
30 June
2013 Variance
mmboe(1) mmboe %
Production
Gas 3.22 2.88 12%
LPG production 0.49 0.25 95%
Condensate production 0.76 0.54 41%
Oil 1.14 1.30 (13%)
Total production 5.61 4.97 13%
Financial performance $million $million %
Sales revenue 328.2 300.5 9%
Production costs and royalties (119.4) (115.8) 3%
Field EBITDAX(2) 208.8 184.7 13%
Exploration and evaluation
expense
(39.8) (9.7) ›100%
Amortisation (117.6) (105.0) 12%
Net fi nancing expense (10.1) (9.4) 7%
Fair value adjustment
assets held for sale
(12.4) - -
Other income / (expense) 67.5 (9.2) ›100%
Statutory Net Profi t before Tax 96.4 51.4 88%
Tax expense (33.9) (31.4) 8%
Statutory Net Profi t after
Tax (NPAT)
62.5 20.0 ›100%
The underlying NPAT was $7.0 million. To assist readers reconcile
the underlying NPAT, the following table provides a reconciliation
of NPAT and the impact after adjusting for non-recurring items.
Reconciliation of Underlying NPAT $million
Statutory NPAT 62.5
Less non-recurring items (after tax):
Gain on sale of 50% interest in Northwest Natuna PSC (75.5)
Restructuring costs in relation to Jakarta offi ce 3.5
BassGas fair value adjustment on assets held for sale 8.3
Perth Basin restoration costs 2.5
Anambas PSC relinquishment 1.0
Capitalised borrowing costs written off 1.1
Other project and restructuring costs 3.6
Total Non-recurring items (after tax) (55.5)
Underlying NPAT(3) 7.0
1. mmboe refers to million of barrels of oil equivalent
2. Sales revenue less production costs and royalties. Refer to note 10 for information by segment.
3. AWE’s Financial Report complies with Australian Accounting Standards and International Financial Reporting Standards (IFRS). The underlying (non-IFRS) profi t is unaudited but is derived from the audited accounts by removing the impact of non-recurring items from the reported (IFRS) audited profi t. AWE believes the non-IFRS profi t refl ects a more meaningful measure of the consolidated entity’s underlying performance.
b f t illi f b l f il i l t

29AWE LIMITED ANNUAL REPORT 2014
30 June 2014 30 June 2013
South East
Australia
Western
Australia
New
Zealand USA Total Total
Production (mmboe)
Gas 2.62 0.37 0.23 3.22 2.88
LPG production 0.30 0.19 0.49 0.25
Condensate production 0.32 0.44 0.76 0.54
Oil 0.45 0.68 1.14 1.30
Total Production 3.24 0.82 0.68 0.86 5.61 4.97
2. Production and development
1.1 Financial performance
The consolidated entity reported a net profi t after tax of $62.5
million for the year (2013: $20.0 million).
Total oil and gas production of 5.6 million BOE was 13% higher
than the previous fi nancial year and refl ects a signifi cant increase
in gas and condensate production at Sugarloaf and strong
production for the year from BassGas.
AWE recorded sales revenue for 2014 of $328 million from 5.4
MMBOE of sales volume, 9% higher than the previous year (2013:
$300 million) At year end, the company held inventory of over 0.2
MMBOE at Tui, equivalent to an additional $23 million of revenue
deferred to the 2014/15 fi nancial year. The average realised oil
and condensate price for the period was 6% higher at A$109 per
barrel, compared to A$103 per barrel in the previous year.
Operating costs were marginally higher at $119.4 million for the
year (2013: $115.8 million) refl ecting higher production volumes
and increased royalties. However on a cost per BOE (sold) basis,
operating costs were lower than the prior year at $22.08, compared
to $22.99 in 2013.
Field EBITDAX of $208.8 million was 13% higher than the previous year
(2013: $184.7 million) and refl ects the strong performance of the core
producing assets across the portfolio. Net cash from operating activities
was higher than prior year at $123.7 million (2013: $118.2 million).
In accordance with AWE’s successful efforts accounting policy,
$39.8 million of exploration and evaluation costs were expensed
in 2014, compared to $9.7 million in 2013. Exploration and
evaluation costs expensed during the year include $11.5 million
incurred in respect of the Oi exploration well in New Zealand and
$11.8 million for the acquisition of the La Bella marine 3D seismic
survey in the Otway Basin.
The taxation expense for the year was $33.9 million (2013: $31.4
million). Taxation expense includes the tax effect of Petroleum
Resources Rent Tax (PRRT) in Australia and the New Zealand
Accounting Profi ts Royalty (APR).
After adjusting for non-recurring items after tax of $55.5 million,
an underlying profi t of $7.0 million was derived for the period,
compared to an underlying profi t of $17.1 million in 2013.
1.2 Summary of fi nancial position
The Company maintained a sound balance sheet position with a
net cash holding of $42.4 million and no drawn debt at the end
of the period. This compares to a net debt balance of $37 million
at 30 June 2013 and refl ects the Company’s disciplined approach
to capital management and the proactive management of its
asset portfolio. The fi nancial position of the Company was further
strengthened during the year with the execution of a new four-
year, $300 million unsecured syndicated bank loan facility. With
strong operating cashfl ows and an undrawn facility at period end,
the Company is well positioned to fund its future development and
growth initiatives.
30 June 2014
30 June
2013
South East
Australia
Western
Australia
New
Zealand USA Indonesia Total Total
Development Expenditure ($m) 14.8 0.3 76.5 38.8 13.4 143.8 142.6

30 AWE LIMITED ANNUAL REPORT 2014
2.1 South East Australia
BassGass Project (offshore Bass Basin, AWE 46.25%)
The BassGas project achieved gross gas production of 17.5 PJ,
673,000 barrels of condensate and 56,000 tonnes of LPG. AWE’s
share of production was 8 PJ of gas, 311,000 barrels of condensate
and 26,000 tonnes of LPG. This represented an increase of 69%
with the project in production for the full year, compared to the
previous fi nancial year where the Yolla Field was shut-in for
approximately 3 months.
The BassGas Mid Life Enhancement (MLE) project achieved a
number of milestones during the period including reaching a
Final Investment Decision (FID) for the development drilling and
the subsequent contracting of a rig to undertake the two well
drilling program which is planned for the 2014/15 Australian
summer. The joint venture is also considering bringing forward
the remaining phases of the project by completing the lifts for the
gas compression and condensate pumping modules prior to the
commencement of the drilling program. The schedule for these
activities is dependent on the timing of the mobilisation of the
contracted rig, fi nalisation of the heavy lift vessel charter and FID.
The drilling program is targeting increasing production by 50%
compared to 2014 fi nancial year production.
On 28 January 2014, the Company also announced the sale of
11.25% interest in BassGas (TL1) and a 9.75% interest in the
Trefoil exploration asset (T18P) to Prize Petroleum for a total cash
consideration of $85 million. The sale is expected to complete in
the fi rst quarter of the 2014/15 fi nancial year and an after tax loss
on sale of $8.3 million is recognised in NPAT in connection with
the sale. Following completion of the sale, the Company’s interest
in BassGas will decrease from 46.25% to 35%.
Casino Gas Project (offshore Otway Basin, AWE 25%)
The Casino gas project, including the Casino, Henry and Netherby
gas fi elds, achieved gross production of 30.5 PJ of gas and 20,000
barrels of condensate. AWE’s share of production for the year was
7.6 PJ of gas and 5,000 barrels of condensate. This represented a
9% decrease compared to the previous year. The Henry-2 well was
shut-in for part of the period, returning to production in April 2014.
The Casino joint venture has defi ned a range of concept designs
for the next phase of development for the project and the selection
of a development concept, including potential drilling opportunities
and facility modifi cations, is expected in early 2015.
2.2 Western Australia
Cliff Head Oil Project (offshore Perth Basin, AWE 57.5%)
The Cliff Head oil project contributed gross production of
0.79 million barrels of oil. AWE’s net share of production was
approximately 0.45 million barrels for the year, a reduction of 22%
due to natural fi eld decline and the shut-in of the CH-13 well for
the replacement of its electric submersible pump (ESP). The well
came back into production in June 2014.
Onshore Perth Basin (AWE 33.0% to 100%)
The Onshore Perth Basin operations contributed 0.4 million BOE
to AWE’s gas and oil production for the year, with AWE’s share
totalling 2.2 PJ of natural gas, with approximately 4,000 barrels
of condensate.
AWE operates the Dongara and Corybas gas fi elds in the region.
AWE also has equity in the Beharra Springs/Redback gas fi elds,
which were shut-in for approximately two months during the
period and then operated at reduced production for a further four
months due to fl owline repairs, returning to full production in the
fourth quarter of the fi nancial year.
The Hovea and Jingemia facilities remained shut-in following
suspension of oil production from the two fi elds during
the previous fi nancial year. The Hovea and Jingemia fi elds
are expected to remain in care and maintenance while the
prospectivity of the area and potential future commercial
production from the fi elds is evaluated.
2.3 New Zealand
Tui Oil Project (offshore Taranaki Basin, AWE 57.5%)
The Tui oil project recorded gross oil production of 1.28 million
barrels (AWE share 0.68 million barrels), down 3% on the previous
corresponding period. The purchase of an additional 15% interest from
Mitsui for USD6.4 million during the period increased AWE’s share
of production and partly offset the impact of planned maintenance,
the shutdown for the Floating Production Storage and Offl oading
(FPSO) vessel generator upgrade, and natural fi eld decline.
Drilling of the Pateke-4H development well was completed
during the period. The well will be tied-back to the Tui FPSO for
production, and this work is expected to commence in the third
quarter of the 2014/15 fi nancial year.
2.4 United States of America
Sugarloaf AMI (onshore Texas, AWE share 10%, net ~7.5% after
landowner royalties)
Production continued to accelerate at the Sugarloaf AMI shale
gas project during the year. AWE’s share increased 31% over the
previous year to approximately 443,000 barrels of condensate,
1.4 PJ of gas and 16,000 tonnes of LPG, net of landowner royalties.
A total of 38 wells were brought into production during the year,
bringing the total number of wells on-line at the end of the period
to 128, with a further 33 wells being drilled and/or completed.
Drilling was commenced on a total of 55 wells during the fi nancial
year, with 30 of these during the fi nal quarter.
An independent reserves review was completed by DeGolyer and
MacNaughton during the period resulting in an 82% increase in
Sugarloaf’s Reserves and Resources, with the Company reporting
an additional 7.7 million BOE of net 2P Reserves and an additional
13.2 million BOE of net 2C Contingent Resources.
Construction of the new West Karnes Central Facility, with capacity
to handle 20,000 bopd and 80 MMcf gas/day, was completed during
the period, and brought on line in the fi rst quarter of the 2015
fi nancial year.
D I R E C T O R S ’ R E P O R T

31AWE LIMITED ANNUAL REPORT 2014
2.5 Indonesia
Ande Ande Lumut Oil Project (Northwest Natuna PSC, offshore
Indonesia, AWE 50%)
A signifi cant milestone was achieved during the period with the
completion of the sale of a 50% interest in the Northwest Natuna
PSC that contains the Ande Ande Lumut (AAL) oil fi eld to Santos
Limited for USD188 million, resulting in an after tax profi t of $75.5
million. The sale included the transfer of Operatorship which took
effect in December 2013.
Good progress continues to be made on the AAL project with Front
End Engineering and Design (“FEED”) on the wellhead platform
nearing completion at the end of the period. The Operator has
lodged a revised tender plan for the FPSO with the Indonesian
regulator and once approved, the tender process is expected to
commence in the fi rst quarter of the 2014/15 fi nancial year.
In addition to the development of the primary K-sand reservoir,
the joint venture is considering appraisal drilling of the deeper
G-sand during the calendar year 2015 to evaluate its development
potential. If successful, the G-sand could add signifi cant reserves
to the project and substantial value for shareholders.
The FID for the project is expected mid-2015 calendar year,
following completion of the FPSO tender process, with fi rst oil
expected in late 2017 calendar year.
30 June 2014 30 June 2013
South East
AustraliaWestern
AustraliaNew
Zealand Indonesia Other Total Total
Exploration
Expenditure ($m) 13.1 7.5 11.6 6.3 5.8 44.3 34.4
3. Exploration Operations
3.1 South East Australia
Bass Basin
The Company continues to assess the feasibility of the Trefoil,
White Ibis and Rockhopper fi elds located in the T/18P permit (AWE
49.75%). A review of the exploration opportunities identifi ed in the
Chappell 3D area in T/18P was nearing completion at the end of
the period.
During the period the Company executed a sale and purchase
agreement to acquire an additional 5% of T/18P from Drillsearch
at nominal cost, increasing AWE’s interest from 44.75% to 49.75%.
AWE’s share of T/18P will reduce to 40% once the sale of a 9.75%
interest to Prize Petroleum is complete.
Otway Basin
In exploration permit VIC/P67 (AWE 60%), a 3D marine seismic
survey covering an area of approximately 928km2 which includes
the La Bella gas fi eld was completed and interpretation of the data
was in progress at the end of the period which will provide the
basis for the Company’s decision to proceed to the drilling phase.
In exploration permit VIC/P44 (AWE 25%), reprocessed 3D seismic
data was being evaluated to assess the remaining prospectivity
in the permit and the Operator was evaluating potential drilling
opportunities at the end of the period.
In retention lease VIC/RL12 (AWE 25%), the Operator is evaluating
development options for the Blackwatch gas fi eld. The fi eld
is covered by State and Federal exploration permits and a co-
ordinated approach will be required between regulators and
relevant joint venture parties to optimise recovery from the permit.
3.2 Western Australia
Onshore Perth Basin
The Company’s unconventional gas activities accelerated
signifi cantly during the period with the commencement of a
three well drilling program in the onshore Perth Basin.
In exploration permit EP455 (AWE 81.5%, Operator), drilling
commenced on the Drover-1 well in the fourth quarter of the period
with the well reaching target depth in July 2014. The well intersected
the Kockatea Shale, Carynginia Shale, Irwin River Coal Measures and
the High Cliff Sandstone. Signifi cant gas readings were observed
and cores taken will be fully analysed and evaluated before a decision
is made to proceed to the next phase of activity.
In licence area L1/L2 (AWE 50%, Operator), drilling of the Senecio-3
vertical appraisal/development well commenced subsequent to
year end and is expected to be completed in the fi rst quarter of
the 2014/15 fi nancial year. The well will target the western side of
the unconventional gas reservoir, and if successful, the Company
expects to commence the approval process for the fi rst phase of fi eld
development which would likely involve drilling a horizontal, multi-
stage hydraulically fracture stimulated well.
In exploration permit EP320 (AWE 33%, Origin Operator), an
exploration well in the Irwin prospect is planned to be drilled in the
fi rst half of the 2014/15 fi nancial year. The Irwin prospect straddles
EP320 and licence area L1 (AWE 50%, AWE Operator) and is expected
to be operated by AWE.
In exploration permit EP413 (AWE 44.25%), the Operator is preparing
for a 3D seismic acquisition program to commence in the fi rst half of
fi nancial year 2014/15. The data will be used as the basis for selecting
the location of the proposed Arrowsmith-3 horizontal well.
During the period, an independent technical assessment of
exploration permits EP413, EP455, L4 and L5 was undertaken by
Deloitte LLP’s Calgary-based Resource Evaluation and Advisory
practice (REA) resulting in the release of a gross unconventional
prospective resource estimate of 11.1 Trillion Cubic Feet (TCF) of gas
and 31 million barrels of Natural Gas Liquids (NGLs) across the four
most southern exploration permits in the onshore Perth Basin.

32 AWE LIMITED ANNUAL REPORT 2014
North Carnarvon Basin
In April 2014, AWE was awarded a new permit, WA-497P (AWE 100%,
Operator), in the Australian 2013 Offshore Petroleum Exploration
Acreage Release. The primary term includes a mandatory work
program consisting of seismic reprocessing, seismic inversion and
geological and geophysical studies. AWE has commenced broadband
reprocessing of approximately 1,200km2 of 3D seismic and 280km2
of 2D seismic survey data.
3.3 New Zealand
Taranaki Basin
In Permit PMP38158 (AWE 57.5%, Operator), the Oi-1/2 exploration
well commenced drilling in June 2014 and reached its target depth
after the end of the period. The well intersected the primary target
Kapuni F10 sands. No signifi cant oil shows were encountered and
well data indicated the reservoir is water bearing. Subsequent to year
end, the well was plugged and abandoned. AWE participated in the
drilling of the Oi -1/2 exploration well at reduced equity of 31.25%.
The cost of the drilling incurred to 30 June 2014 was $11.5 million
and is recognised in exploration expense. An estimated $5.3 million is
expected to be incurred in the 2014/15 fi nancial year.
In onshore permit PEP 55768 (AWE 51% and Operator),
the reprocessing of existing 2D and 3D seismic survey data
commenced during the period.
3.4 Indonesia
East Java Basin
In the Bulu PSC (AWE 42.5%), the Operator completed a
Plan of Development (POD) for the Lengo gas fi eld following
gas commercialisation studies and has submitted a draft POD
to the regulator.
In the East Muriah PSC (AWE 50%) processing of the fast track
component of the 2D seismic survey data commenced during
the period.
Acquisition of a 2D seismic survey in the North Madura PSC
(AWE 50%, Operator) and the Terembu PSC (AWE 100%, Operator)
is planned for the fi rst quarter of the 2014/15 fi nancial year.
The relinquishment of the Titan PSC (AWE 40%, Operator)
commenced during the period.
Natuna Sea
In the Anambas PSC (AWE 100%, Operator), following the review of
development feasibility studies, a decision was made to relinquish
the PSC on the expiry of the 10 year exploration period in June 2014.
Sumatra
The Joint Study of the Jembar-Rimba area, located in the Central
Sumatra Basin, was completed and approved by the regulator.
In the next phase, the block will be offered by the regulator in a
future unconventional oil and gas bid round, where AWE would
retain the right to match any offer submitted for the block.
3.5 Yemen
During the period, the Company entered into an agreement with
Petsec Energy (Yemen) to sell its interest in Block 7. The agreement
was awaiting government approvals at the end of the period.
4. Drilling activity
The wells drilled during the year are summarised as follows:
Well
name Location
AWE
Share Comments
Pateke – 4H Taranaki
Basin
57.5% Well successfully
completed and suspended
pending tie-in to
production facilities
Oi – 1/2 Taranaki
Basin
31.25% Plugged and abandoned
Drover-1 Onshore
Perth Basin
81.5% Well successfully
completed and suspended
subsequent to year end
55 wells in
Sugarloaf AMI
Eagle
Ford
Shale
10.0%* 128 wells in production at
year end; 33 wells being
drilled and/or completed
* Net working interest of 10%; net interest approximately 7.5% after land-owner royalties
5. Business strategy & opportunities
5.1 Business strategy
AWE’s goal is to be a leading energy company in Australia by
building a sustainable business that delivers superior returns
to shareholders.
The Company has implemented a strategy that is focused on
pursuing opportunities in oil, high value gas, and unconventionals
in a geographic area comprising Australia, New Zealand, Asia
and the USA.
AWE has compiled a diverse and valuable portfolio of exploration,
appraisal, development and production assets across multiple
geographic regions. The Company has a suite of established and
valuable producing assets that deliver stable operating cashfl ows
and which underpins the ability of the Company to reinvest in key
development projects to drive growth. Combined with a strong
balance sheet and a disciplined fi nancial approach, the Company
is well positioned to fund new and existing opportunities to deliver
superior returns to shareholders.
The Company’s operational and fi nancial targets to the end of
calendar year 2018 are to:
+ Double annual production from the 2013 fi nancial year of 5
MMBOE to 10 MMBOE; and
+ Triple EBITDAX from the 2013 fi nancial year to over $500 million.
The Company aims to deliver this goal through the following activities:
+ Optimising performance from the base business;
+ Commercialisation and exploitation of existing opportunities
within the portfolio;
+ Identifying and pursuing new acquisitions that can deliver
superior returns on investment; and
+ Leveraging the technical and commercial skills and experience
of the AWE team, particularly in early stages of exploration and
development projects.
D I R E C T O R S ’ R E P O R T

33AWE LIMITED ANNUAL REPORT 2014
5.3 Material business risks
The following material business risks have been identifi ed as
key issues that have the potential to impact the Company’s
performance:
+ Commodity price risk which directly impacts AWE through the
realised price received from the sale of hydrocarbons – gas,
crude oil, condensate and LPG, with the exception of Australian
gas sales which are made under long-term contracts where the
price is denominated in Australian dollars.
+ Reserves and production risks, where future performance of
individual assets may not meet current estimates and forecasts.
+ Execution of development and operating projects, including
meeting schedule and budget, which could be subject to
changes in future industry and economic conditions.
+ Sovereign risk relating to the expected fi scal, tax and regulatory
environment in jurisdictions that AWE does business.
+ Health, Safety and Environmental risks which are recognised by
AWE as being of critical importance in ensuring AWE continues
to build and operate a sustainable business and which remain a
key priority for the Company.
+ Maintaining the Company’s social licence to operate by
proactively engaging with the communities, regulators and
other key stakeholders, particularly in relation to onshore oil
and gas exploration, development and production activities.
AWE is committed to these goals while preserving our commitment of
zero harm to our people, minimising our impact on the environment,
supporting the communities in which we operate and building a
motivated and engaged team.
5.2 Opportunities
To maintain sustainable returns to shareholders, AWE will pursue
growth initiatives from its extensive portfolio of exploration and
development assets as well as new opportunities where it can add
or create value.
Key projects and opportunities being pursued during the 2014/15
fi nancial year include:
+ The AAL oil fi eld development in Indonesia, where it is planned
to progress the project through several important milestones
including completion of the FEED work for the well head platform,
the tender for the FPSO and subsequently FID in mid-2015.
+ The BassGas MLE project is expected to complete drilling of
the two planned development wells in the Australian summer of
2014/15 with the potential to accelerate the implementation of the
lift of the gas compression and condensate pumping modules.
+ In the onshore Perth Basin, the three well unconventional
drilling program, comprising Drover-1, Senecio-3 and the
Irwin prospect, is expected to be completed during the 2014/15
fi nancial year, providing valuable data for the analysis and
evaluation of potential hydrocarbon commercialisation options in
the various permit areas.
+ In New Zealand, the tie in of the Pateke-4H development well is
planned for the second half of the 2014/15 fi nancial year.
+ In the United States, the accelerated drilling program in the
Sugarloaf AMI is expected to continue to increase production and
has the potential to further upgrade 2P Reserves in the Eagle
Ford Shale and development of 2C Contingent Resources in the
Austin Chalk.
+ In Indonesia, the approval of a Plan of Development for the
Lengo gas fi eld in the Bulu PSC is expected to be achieved
during the 2014/15 fi nancial year.
AWE will continue to progress the review of a range of other
exploration and new business opportunities in conventional
and unconventional oil and gas and new energy assets, with a
particular focus on appraisal and pre-development assets where
AWE possesses the core skills to add signifi cant value.

34 AWE LIMITED ANNUAL REPORT 2014
Directors’ qualifi cations and experience
Name Experience
Bruce J. Phillips
BSc (Hons) Geol
Independent Non-executive
Director and Chairman
Member of the People Committee
Bruce Phillips is a petroleum explorationist who has more than 30 years of technical, fi nancial and managerial
experience in the upstream energy sector of the oil and gas industry. He has broad domestic and international
exploration and production experience throughout Australia, South East Asia, Africa and South America. Bruce is an
active member of PESA and the Australian Society of Exploration Geophysicists.
Bruce is currently a non-executive director of AGL Energy Limited and non-executive Chairman of Platinum Capital
Limited. He was formerly a non-executive director of Sunshine Gas Limited.
Bruce was founder and Managing Director of AWE. He retired as Managing Director on 31 August 2007 and was
appointed as a non-executive director on 19 November 2009 and non-executive Chairman on 18 November 2010.
Bruce F.W. Clement
B Eng (Hons), BSc
(Mathematics), MBA
Managing Director
Bruce Clement is an Engineer with over 30 years extensive experience in Australian and international oil and gas
businesses in senior technical, fi nancial and managerial roles with Esso Australia, Ampolex, AIDC, and Roc Oil. Bruce’s
career has included leadership roles in major appraisal, development and production projects in Australia and in Asia as
well as key executive roles in fi nancial and commercial management. Bruce was appointed Managing Director of AWE on
1 February 2011.
David I. McEvoy
BSc (Physics),
Grad Dip (Geophysics)
Independent Non-executive
Director
Chairman of the
Sustainability Committee
Member of the Audit and
Governance Committee
David McEvoy has a petroleum geoscience background with almost 40 years’ experience in international exploration and
development. He has held several senior executive positions in affi liates of ExxonMobil, most recently Vice President,
Business Development in ExxonMobil Exploration Company from 1997 to 2002.
David is currently a non-executive director of Woodside Petroleum Ltd, and was formerly a non-executive director of Po
Valley Energy Limited and ACER Energy Limited (formerly Innamincka Petroleum Ltd).
David was appointed a non-executive director of AWE on 22 June 2006.
Kenneth G. WilliamsBEc (Hons), MAppFin, MAICD
Independent Non-executive
Director
Chairman of the Audit and
Governance Committee
Member of the People Committee
Kenneth Williams has over 20 years operational experience in corporate fi nance with an emphasis on treasury
and fi nancial risk management as well as diverse experience in mergers, acquisitions, divestments and corporate
reconstructions. During his executive career he has worked for signifi cant Australian enterprises including Renison
Goldfi elds, Qantas, Normandy Mining and Newmont Australia.
Ken has an Honours degree in Economics and a Masters of Applied Finance and is a member of the Australian institute
of Company Directors. Ken is a non-executive Chairman of Havilah Resources NL, non-executive director of Curnamona
Energy Limited and a non-executive director of Geothermal Resources Limited (the latter two companies now delisted
from ASX).
Ken was appointed as a non-executive director of AWE on 26 August 2009.
Vijoleta Braach-Maksvytis BSc, PhD, MAICD
Independent Non-executive
Director
Chair of the People Committee
Member of the Sustainability
Committee
Dr Vijoleta Braach-Maksvytis is an innovation strategist with more than 20 years’ experience in science and technology,
the commercialisation of technology, and intellectual property strategy. Previous roles include Head of the Offi ce of
the Chief Scientist of Australia, Senior Executive and Director Global Development for CSIRO, Deputy Vice Chancellor
Innovation and Development at the University of Melbourne. She was the Chairman of Melbourne Ventures Pty Ltd
and member of the Australian Federal Government’s Green Car Innovation Fund Committee and Advisory Board of the
Intellectual Property Research Institute of Australia.
Vijoleta is a Member of the Australian Federal Government’s Green Car Innovation Fund Committee, on the advisory
board of the Intellectual Property Research Institute of Australia, and is also a member of other public interest boards.
She is currently a non-executive director of Orbital Corporation Limited.
Vijoleta was appointed as a non-executive director of AWE on 7 October 2010.
Raymond J. Betros BEng Chemical, Grad Dip
Process Plant Engineering
Independent Non-executive
Director
Member of the Sustainability
Committee
Member of the Audit and
Governance Committee
Raymond Betros is a highly experienced senior executive specialising in international business and project development
and technical management. His expertise in forming and leading multi-disciplinary teams to undertake large scale
ventures involving complex interrelated activities is internationally recognised.
Raymond has held various senior executive positions at BHP/BHP Billiton (1993-2004), BG Group (2004-2008) and most
recently Santos (2008-2011) where he held the position of Executive Vice-President Technical until his retirement from
executive duties.
Raymond was appointed as a non-executive director of AWE on 22 November 2012.
Karen L. C. Penrose
BComm CPA, GAICD
Independent Non-executive
Director
Member of the Audit and
Governance Committee
Member of the Sustainability
Committee
Karen Penrose has over 30 years’ experience in the fi nance and corporate sectors, including 20 years in banking with
the Commonwealth Bank of Australia and HSBC Bank Australia. In the eight years to early 2014 Ms Penrose held Chief
Financial Offi cer and Chief Operating Offi cer roles with Wilson HTM Investment Group Ltd and Keybridge Capital Limited.
Karen is a non-executive director of Commonwealth Managed Investments Limited and CFX Co Limited and a non-
executive director and Deputy Chairman of Silver Chef Limited. She is also a director of Marshall Investments Pty
Limited and Council Member for Chief Executive Women.
Karen was appointed a non-executive director of AWE on 28 August 2013.
D I R E C T O R S ’ R E P O R T

35AWE LIMITED ANNUAL REPORT 2014
Mr Andy Hogendijk retired as a non-executive director of AWE
on 27 November 2013.
No directors of the Company either resigned or were appointed
since the end of the fi nancial year.
It is intended that Mr Phillips and Mr McEvoy by rotation, will stand
for re-election at the Company’s 2014 Annual General Meeting.
Company secretary
Mr Neville Kelly was appointed to the position of Company
Secretary in October 1999. Mr Kelly (BCom, Merit, CPA) is an
accountant with over 30 years commercial experience in the
upstream sector of the Australian oil and gas industry, including
12 years’ experience with Bridge Oil Limited. Neville was also
the Chief Financial Offi cer of AWE until 31 October 2011 and
joined the Company on its public listing in 1997.
Remuneration report
The Remuneration Report set out on pages 40 to 54 forms part of
the Directors’ Report for the fi nancial year ended 30 June 2014.
Corporate governance statement
Details of the Company’s corporate governance practices are
included in the Corporate Governance Statement set out on pages
55 to 64.
Dividends
Dividends paid or declared by the Company to members since
the end of the previous fi nancial year were:
Cents per
share
Total
amount
$’000 Franking
Date of
payment
Declared and paid
during the 2014
fi nancial year
- - - -
Declared and paid
during the 2013
fi nancial year
- - - -
Events subsequent to balance date
Subsequent to year end, the Company completed the drilling
of the Oi-1/2 exploration well. The well intersected the primary
target Kapuni F10 sands, however no signifi cant oil shows
were encountered and the well was subsequently plugged and
abandoned. The Company has recognised the full cost of the
drilling expenditure incurred up to the end of the fi nancial year
of $11.5 million in the 2013/14 fi nancial year, and a further $5.3
million is expected to be incurred subsequent to year end.
The Company entered into a farm-in agreement with ROC Oil
Company Limited on 8 August 2014 for a 40% participating interest
in exploration Block 09/05 in the Bohai Bay area, People’s Republic
of China.
In the opinion of the directors, no other matter or circumstance
has arisen since 30 June 2014 that has signifi cantly affected, or
may signifi cantly affect:
a. the consolidated entity’s operations in future fi nancial years, or
b. the results of those operations in future fi nancial years, or
c. the consolidated entity’s state of affairs in future fi nancial years.
Directors’ interests
The relevant interest of each director in the share capital of the
Company, as notifi ed by the directors to the Australian Securities
Exchange (“ASX”) in accordance with section 205G(1) of the
Corporations Act 2001, at the date of this report is as follows:
Director Fully paid ordinary shares
B. J. Phillips 2,900,914
B. F. W. Clement 260,061
D. I. McEvoy 30,000
K. G. Williams 20,000
V. Braach-Maksvytis -
R.J Betros 70,000
K. L. C. Penrose 17,935
No directors’ interests are subject to margin loans. Further details
of directors’ interests in share capital are set out in note 32 to the
fi nancial statements, Related party disclosures.

36 AWE LIMITED ANNUAL REPORT 2014
Directors’ meetings
The number of meetings, including meetings of committees of
directors and the number of meetings attended by each director of
the Company during the fi nancial year were:
Directors’ meetings
Audit and Governance
Committee meetings
People Committee
meetings
Sustainability Committee
meetings
Director Held1 Attended Held1 Attended Held1 Attended Held1 Attended
B. J. Phillips 13 13 4 4
B. F. W. Clement 13 13
D. I. McEvoy 13 13 6 6 4 4
A. J. Hogendijk2 5 5 3 3 2 2
K. G. Williams 13 13 6 6 4 4
V. Braach-Maksvytis 13 12 4 4 4 4
R.J Betros 13 12 4 4 4 4
K. L. C. Penrose3 10 10 4 4 3 3
1. Refl ects the number of meetings held during the time the Director held offi ce, or was a member of the Committee during the year.
2. Resigned on 27 November 2013.
3. Appointed 28 August 2013.
Indemnifi cation and insurance of offi cers
Under the Company’s Constitution, and to the extent permitted by
law, every person who is, or has been, a director or offi cer of the
Company is indemnifi ed against:
1. a liability incurred by that person, in his or her capacity
as a director or secretary, to another person (other than
the Company or a related body corporate of the Company)
provided that the liability does not arise out of conduct
involving a lack of good faith; and
2. a liability for costs and expenses incurred by that person:
i. in defending any proceedings in which judgement is
given in that person’s favour, or in which that person is
acquitted, or
ii. in connection with an application in relation to any
proceedings in which the Court grants relief to that
person under the Corporations Act.
During the fi nancial year, the Company paid premiums based on
normal commercial terms and conditions to insure all directors,
offi cers and employees of the Company against the costs and
expenses in defending claims brought against the individual while
performing services for the consolidated entity. The premium
paid has not been disclosed as it is subject to the confi dentiality
provisions of the insurance policy.
The Company has entered into Indemnity Deeds to indemnify
directors and certain executives of the Company against all
liabilities incurred in the course of or arising out of their
employment with the Company and its controlled entities, except
where the liability results wholly or in part from serious and wilful
misconduct by the executive or director.
D I R E C T O R S ’ R E P O R T

37AWE LIMITED ANNUAL REPORT 2014
Audit and non-audit services
Details of the amounts paid to the auditor of the Company, Ernst
& Young, and its related practices for audit and non-audit services
provided during the year are set out below.
EY2014
$2013
$
Audit services - auditor of the Company
Audit and review of fi nancial reports 398,151 410,915
Taxation Services
Taxation compliance services 95,000 87,653
Other Services
Advisory and assurance services 63,357 222,372
Total remuneration of Ernst & Young 556,508 720,940
During the year Ernst & Young, the Company’s auditor, has
performed certain other services in addition to their statutory
duties. The Board has considered the non-audit services
provided during the year by the auditor and in accordance with
written advice provided by resolution of the Audit & Governance
Committee, is satisfi ed that the provision of those non-audit
services during the year by the auditor is compatible with the
auditor independence requirements of the Corporations Act 2001
for the following reasons:
+ All non–audit services do not impact the integrity and objectivity
of the auditor; and
+ The non-audit services do not undermine the general principles
relating to auditor independence as set out in APES 110 Code
of Ethics for Professional Accountants, as they did not involve
reviewing or auditing the auditor’s own work, in a management
or decision making capacity for the Company, acting as an
advocate for the Company or jointly sharing risks and rewards.
38 AWE LIMITED ANNUAL REPORT 2014
The auditor’s independence declaration is set out on page 39 and
forms part of the Directors’ Report for the year ended 30 June 2014.
Rounding off
The Company is of a kind referred to in Australian Securities and
Investments Commission (“ASIC”) Class Order 98/100 dated 10
July 1998 and in accordance with that Class Order amounts in the
fi nancial report and the Directors’ Report have been rounded off to
the nearest one thousand dollars unless otherwise stated.
Signed in accordance with a resolution of the directors:
B. J. Phillips
Chairman
B. F. W. Clement
Managing Director
Dated at Sydney this 26th day of August 2014
Auditor’s independence declaration under section 307C of the Corporations Act 2001
D I R E C T O R S ’ R E P O R T

39AWE LIMITED ANNUAL REPORT 2014
Liability limited by a scheme approvedunder Professional Standards Legislation
680 George StreetSydney NSW 2000 AustraliaGPO Box 2646 Sydney NSW 2001
Tel: +61 2 9248 5555Fax: +61 2 9248 5959ey.com/au
Auditor’s Independence Declaration to the Directors of AWE Limited
In relation to our audit of the financial report of AWE Limited for the financial year ended 30 June 2014,to the best of my knowledge and belief, there have been no contraventions of the auditor independencerequirements of the Corporations Act 2001 or any applicable code of professional conduct.
Ernst & Young
Trent van VeenPartnerSydney26 August 2014

t
2014REMUNERATIONREPORT
1. Introduction 41
2. Remuneration governance framework 41
3. Executive remuneration arrangements 42
3.1. Principles and strategy 43
3.2. Fixed remuneration 44
3.3. Short term incentives 44
3.4. Long term incentive plans 45
3.5. Other benefi ts 47
4. Service agreements 47
5. June 2014 executive remuneration outcomes 49
5.1. Remuneration tables 49
5.2. Analysis of short term performance benefi ts included in remuneration 50
5.3. Analysis of long term performance benefi ts included in remuneration 50
5.4. Analysis of movement in long term performance benefi ts 53
6. Non-executive director remuneration 54
Key PointsContents
Total
Shareholder
Return (TSR)
TSR for the June 2014 fi nancial year of 45%
compared to ASX 200 Energy Index of 19%
TSR for 3 years to 30 June 2014 of 49% compared to
ASX 200 Energy Index of 6%
Short term
Incentive (STI)
STI payment to Managing Director set at 60% of
maximum allowable
STI payment to senior executives averaged 57% of
maximum allowable
Long term
Incentive (LTI)
Managing Director and senior executives:
Vesting of
Rights – 3 year
cycle to June
2014
+ Relative TSR Rights – 100% vesting based
on 3 year performance at 80th percentile of
comparator group;
+ Absolute TSR Rights – 100% vesting based on 3
year TSR of 14.1% compound; and
+ Retention Rights – 100% vesting (1)
Award of
Rights – 3 year
cycle to 30
June 2016
60% of maximum entitlement granted to
Managing Director
Average of 62% of maximum entitlement granted
to senior executives
Fixed
remuneration
Fixed remuneration of Managing Director
increased by 4%
Non-executive
directors
Increased fees of 2.5% in line with CPI
No participation in LTI or STI
Changes to
Remuneration
Structures for
Financial Year
June 2015
Deferral and clawback provisions to apply to
LTI and STI for Managing Director and senior
executives for awards granted from July 2014
Comparator group used for Relative TSR
performance for awards granted from July
2014 changed to only include these companies
in the relevant index at the end of the 3 year
measurement period
1. Retention rights are not granted to the Managing Director.

41AWE LIMITED ANNUAL REPORT 2014
R E M U N E R A T I O N R E P O R T
1. Introduction
The directors of AWE Limited (“AWE” or the “Company”) present
the Remuneration Report prepared in accordance with section
300A of the Corporations Act 2001 (“the Act”) for the consolidated
entity for the year ended 30 June 2014.
The information provided in this report forms part of the Directors
Report and outlines the remuneration arrangements of the
consolidated entity in accordance with the requirements of the Act
and its regulations. This information has been audited as required
by section 308 (3C) of the Act.
This report details remuneration information pertaining to
directors and senior executives who are the ‘Key Management
Personnel’ (“KMP”) of the consolidated entity. KMP are defi ned
as those persons having authority and responsibility for planning,
directing and controlling the activities of the consolidated entity,
directly or indirectly, including any director (whether executive or
otherwise) of AWE.
The following non-executive directors (“NEDs”) and senior executives
have been identifi ed as KMP for the purpose of this report:
Non-executive directors
Bruce J. Phillips Chairman
David I. McEvoy Non-Executive
Director
Andy J. Hogendijk Non-Executive
Director
Retired 27 November
2013
Kenneth G. Williams Non-Executive
Director
Vijoleta Braach-Maksvytis Non-Executive
Director
Raymond J. Betros Non-Executive
Director
Appointed 22
November 2012
Karen L.C. Penrose Non-Executive
Director
Appointed 28 August
2013
Executive director and senior executives
Bruce F. W. Clement Managing Director
Dennis Washer Chief Operating
Offi cer/General
Manager, New
Zealand
Ayten Saridas Chief Financial Offi cer
Neil P. Tupper General Manager,
Exploration and
Geoscience
Appointed 20 May
2013
Michael Drew Group General
Counsel/General
Manager Commercial
Appointed 1 May 2013,
ceased employment
30 June 2014
Neville F. Kelly Company Secretary/
General Manager
Corporate
David R. N. Gaudoin Vice President,
Exploration and
Exploitation,
Indonesia
Ceased employment 1
November 2013
Dates of appointment or resignation are noted in the above tables
if the appointment or resignation occurred within the previous two
fi nancial years.
2. Remuneration governance framework
The People Committee is responsible for making
recommendations to the Board on remuneration policies and
employment practices applicable to directors, senior executives
and other employees.
The role and responsibilities of the People Committee is
documented in a charter approved by the Board and is reviewed
as required but in any event at least each 2 years. A copy of this
charter is available on the Company’s website.
The People Committee must comprise at least two non-executive
directors, the majority of whom shall be independent. No executive
can be a member of the Committee. The People Committee
currently comprises Vijoleta Braach-Maksvytis (Chair), Kenneth
Williams (former committee Chairman), and Bruce Phillips, all
of whom are non-executive directors and are considered to be
independent. Mr Andy Hogendijk retired as a member of the
People Committee on 27 November 2013.

42 AWE LIMITED ANNUAL REPORT 2014
R E M U N E R A T I O N R E P O R T
Role
The role of the People Committee as defi ned in the charter is to
ensure that the remuneration policies and employment practices
of AWE:
+ Are consistent with the Company’s goals and objectives;
+ Deliver outcomes in line with strategic business goals;
+ Recognise the scale and complexity of the Company’s
business activities;
+ Encourage directors and senior executives to deliver short term
objectives and to pursue the long term growth and success of
the Company within an appropriate control framework;
+ Deliver a level and composition of remuneration that is
appropriate and fair to a broad range of stakeholders;
+ Defi ne the relationship of remuneration to corporate and
individual performance; and
+ Attract and retain talented and effective directors and
employees so as to encourage enhanced performance
of the Company.
The People Committee also evaluates the appropriateness of
remuneration packages given trends in comparable companies,
the need to drive a performance-based culture and the objectives
of the Company’s remuneration strategy.
Responsibilities
The responsibilities of the People Committee as defi ned in the
charter are to review and make recommendations to the Board
or its related committees on:
+ Policies for employment and remuneration of all AWE employees;
+ Recruitment, retention and termination policies and procedures
for senior executives;
+ The remuneration package of the Managing Director;
+ The remuneration packages of senior executives in consultation
with the Managing Director;
+ Performance schemes including short term and long
term incentives;
+ Superannuation arrangements;
+ The remuneration framework for non-executive directors,
within the limit approved by shareholders;
+ Management succession planning;
+ Procedures necessary to ensure compliance with industrial
relations law;
+ The appointment of external remuneration consultants
and evaluation of advice from remuneration consultants
in accordance with the Act;
+ The diversity disclosure plan and the Company’s progress
in achieving measurable diversity objectives;
+ The annual Statutory Remuneration Report;
+ People related disclosures in the annual Sustainability Report; and
+ Other matters as requested by the Board.
Should the Company receive advice from external consultants
to assist in making decisions on the amount or structure of the
remuneration of one or more KMP:
+ The consultant is to be appointed by the People Committee or
NED’s;
+ Advice received from the consultant must be provided directly
to the People Committee or NED’s;
+ Fees paid to the consultant must be disclosed; and
+ The consultant must declare their independence.
No remuneration consultants were appointed during the current
fi nancial year.
3. Executive remuneration arrangements
3.1. Principles and strategy
Objectives
The key obje ctives of AWE’s remuneration practices are to:
+ Align the interests of senior executives, employees and
shareholders;
+ Attract and retain suitably qualifi ed senior executives and
employees; and
+ Motivate senior executives and employees to achieve superior
performance.
Mix of remuneration
To achieve these objectives remuneration packages consist of:
+ Fixed remuneration;
+ Short term performance benefi ts; and
+ Long term performance benefi ts.
The remuneration structures are designed to align the interests of
shareholders with remuneration outcomes by taking into account:
+ The performance of the consolidated entity including:
− The growth in total returns to shareholders;
− The consolidated entity’s fi nancial results;
− Delivery of base business (that is, “business as usual”);
− The results of exploration, development and production
activities;
− Business growth;
− Delivery of strategic objectives;
− Adherence to health, safety and environment policies
and targets; and
− Compliance with regulations.
+ The capability and experience of senior executives;
+ The ability of senior executives to control the performance
of their relevant area of responsibility; and
+ Current economic and industry circumstances.

43AWE LIMITED ANNUAL REPORT 2014
The Company has been monitoring the progress of legislative
changes relating to the deferral and clawback of performance
based remuneration and has implemented appropriate changes
from 1 July 2014 to remuneration arrangements for senior
executives. These changes are summarised in “Changes to
remuneration structures” below.
With the Company’s international operations it should be noted
that expatriate personnel are entitled to assignment benefi ts
in addition to fi xed remuneration and performance related
benefi ts. These expatriate benefi ts are provided to compensate
for circumstances particular to the assignment location and are
in line with market practice and market conditions in the relevant
location. The Company considers that these costs should be
recognised as an investment in the continued success of projects
and long term value creation.
Market comparatives
In order to attract and retain suitably qualifi ed senior executives
and technical personnel and to ensure that salary packages are
reasonable and competitive but not excessive, fi xed remuneration
levels and at risk remuneration structures in the form of short
term incentive benefi ts and long term incentive benefi ts are
benchmarked against independently provided data on Australian
upstream oil and gas companies. The market for such senior
executives and technical professionals in the upstream oil and
gas industry continues to be very competitive and the Company’s
remuneration framework is structured accordingly.
To ensure that long term incentive structures are appropriately
aligned to the long term interests of shareholders, the vesting of
share rights (“rights”) are conditional on performance conditions
which are tied to the three year total shareholder return of the
Company and to the three year total shareholder returns of
comparator ASX listed energy companies.
Company performance
The table above identifi es the consolidated entity’s performance
in respect of the current fi nancial year and the previous four
fi nancial years.
2014 2013 2012 2011 2010
Profi t/(loss) ($ millions) 62.5 20.0 (66.5) (117.6) (28.9)
30 June share price ($) 1.80 1.24 1.34 1.28 1.78
Change in share price ($) 0.56 (0.10) 0.06 (0.50) (0.79)
Total shareholder return (%) 45% (7%) 9% (28%) (31%)
AWE performance relative to ASX Energy 200 Energy Index 26% (15%) 30% (35%) (27%)
AWE performance relative to ASX 200 Index 26% (30%) 21% (35%) (40%)
Changes to remuneration structures
As noted in last year’s Remuneration Report and as part of
the continual review of remuneration structures, the Company
advised of refi nements made to reduce the amount of share
rights (“rights”) that can be issued as follows:
+ Establishing the maximum number of rights that can be issued
with the actual number of rights that are granted (which will be
less than or equal to this maximum) being determined by the
Board;
+ Basing the number of rights that are granted on Company
and individual performance in the previous fi nancial year; and
+ Reducing the participation scales for the Managing Director
and senior executives.
Further, the vesting criteria applying to rights have been tightened by:
+ Increasing the hurdle rates applying to absolute performance
measures;
+ Increasing the hurdle rates applying to relative performance
measures; and
+ Decreasing the retention component for senior executives.
Additional refi nements to remuneration arrangements to be
introduced with effect from the June 2015 fi nancial year include:
Deferral and Clawback of Performance–Based Remuneration
Scope
+ A deferral and clawback policy has been adopted for performance-
based remuneration which applies to the managing director and
senior executives;
+ The policy is to apply on a prospective basis for STI and LTI awards
granted from July 2014; and
+ The Board (or delegated committee of the Board) has the discretion
and authority to make determinations under this policy.
Application
+ Clawback can include reduction, clawback or cancellation of awards;
+ Clawback applies to both vested awards which have been deferred
and awards granted but not yet vested; and
+ Once an STI or LTI award is vested, 50% of that award will be
deferred for a period of 12 months and will be subject to clawback.
Clawback Circumstances
+ Serious misconduct;
+ Material misstatement in AWE’s fi nancial statements; or
+ Material error or miscalculation that results in the award
of performance based remuneration that would not have
otherwise been awarded.

44 AWE LIMITED ANNUAL REPORT 2014
Relative TSR Comparator Group
AWE acknowledges that an inherent diffi culty in determining
appropriate peer group companies to be included in the
comparator group of companies for Relative TSR purposes is that
over the testing period of three years this peer group of companies
can change. These changes could be caused by a number of
factors including companies no longer being listed on ASX or
when better performing companies subsequently gain entry to
the nominated ASX index, or alternatively when poorer performing
companies are no longer included in the nominated ASX index.
Accordingly for grants of rights for the three year period
commencing from 1 July 2014 the board has determined that the
comparator group of companies to be used in determining Relative
TSR performance will be upstream oil and gas companies in the
ASX Energy 300 Index at the end of the measurement period in 30
June 2017. The TSR performance of these comparator companies
over the three year period will be measured at the end of the three
year period to determine the relative performance of the Company.
3.2. Fixed remuneration
Fixed remuneration consists of base salary calculated on a total
cost basis, including fringe benefi ts tax and superannuation
contributions (or equivalent).
Remuneration levels are reviewed at least annually by the People
Committee through a process that considers independent
externally provided remuneration data and also taking into account
the overall performance of the consolidated entity to ensure that
remuneration is appropriate and competitive in the market place.
For details of fi xed remuneration paid to senior executives and
directors refer to section 5 and 6.
3.3. Short term incentives
Short term performance benefi ts are awarded in the form of cash
bonuses. These benefi ts are “at risk” and are paid for performance
during the fi nancial year and are designed to reward senior
executives for meeting or exceeding Company and individual Key
Performance Indicators (“KPIs”).
Managing Director KPIs
Each year, the Board sets corporate KPIs for the Managing Director
which are based on overall corporate performance targets.
June 2014 and June 2015 Financial Years
For both the June 2014 and June 2015 fi nancial years the corporate
KPIs for the Managing Director are based on a balanced scorecard
approach which are designed to deliver sustainable shareholder
returns both in the short term and long term. These performance
measures include:
+ Delivery of base business (50%) –includes specifi c targets
with respect to delivery of production, capital expenditure
and exploration programs, operating expenditure, reserves
replacement, fi nancing activities, team performance, HSE
performance and community and regulatory engagement.
+ Strategy and growth (30%) – includes targets with respect to
portfolio management, business development, exploration
new ventures, unconventional gas strategy, and new energy
initiatives.
+ Board discretion (20%) – includes an allowance to cover
the potential and inevitable changing company and industry
circumstances during the fi nancial year.
On a assessment of actual performance under these measures
for the 2014 fi nancial year the board has determined that a total
of 60% of maximum KPI will be awarded to the Managing Director.
For further details refer to section 5.2.
Given the continuing changing circumstances of both the Company
and the upstream oil and gas industry in general, the board is of
the view that these KPI performance measures will inevitably be
required to respond to such circumstances and accordingly may
vary from year to year. The board believes that the attainment of
these measures will result in sustainable shareholder returns
both in the short term and long term.
Senior Executives KPIs
Corporate KPIs for senior executives are based on the same
corporate KPIs as the Managing Director. In addition, the Managing
Director sets individual KPIs for the senior executives. These KPIs
take into account individual and departmental performance over
which the senior executive has responsibility. The board believes that
the attainment of these individual and departmental KPIs is essential
in delivering overall corporate objectives.
The structure of these short term incentive (“STI”) benefi ts as a
percentage of fi xed remuneration is as follows:
Managing
Director(1)
Senior
Executives(2)
Target – meets performance
objectives
25% 20%
Stretch – exceeds performance
objectives
25% 20%
50% 40%
1. 100% of Managing Director KPIs are based on achieving corporate performance measures.
2. 50% of senior executive KPIs are based on the same corporate KPIs as the Managing Director and 50% are subject to individual and departmental KPIs over which the individual senior executive has responsibility.
R E M U N E R A T I O N R E P O R T

45AWE LIMITED ANNUAL REPORT 2014
The maximum STI is only payable if both the Company and individual
performance are at the highest level and exceed expectation or in
exceptional circumstances of outstanding individual performance
where the Board may award up to 100% of that individual’s short
term performance benefi t even though some KPIs have not been
achieved. This special circumstance is designed to reward and retain
outstanding employees in times where outstanding individual results
have been achieved even though some KPI targets have not been
achieved due to circumstances beyond the control of the individual
senior executive.
3.4. Long term incentive plans
Long term incentive (“LTI”) “at risk” performance benefi ts are
awarded in the form of share rights with vesting conditions tied to
retention, absolute Total Shareholder Return (“TSR”) and relative TSR.
The rationale for the choice of these criteria includes:
+ To align employees with the commonly shared goals of
delivering high returns for shareholders over the medium
to long term;
+ To encourage and assist employees to become shareholders
of AWE;
+ To provide a long term component of remuneration to enable
AWE to compete effectively for the calibre of talent required for
the Company to be successful; and
+ To help retain talented personnel, minimise employee turnover
and stabilise the workforce.
The Company no longer issues employee share options as a
method of rewarding long term performance. No employee
share options have been issued since June 2009 and all residual
employee share options expired unexercised during the June 2014
fi nancial year.
Share Rights Plan
The Company introduced a Share Rights Plan in June 2010 for the
award of long term performance benefi ts. The Plan is designed to
generate performance-based awards that may be converted, at the
Board’s discretion, into AWE shares or cash.
The key elements of the Plan include:
+ Rights are granted each year with the number of rights granted
being determined by the employee’s level in the Company,
fi xed remuneration at the time of grant and taking into account
both the Company and employee’s performance in the previous
fi nancial year.
+ There are three tranches of rights with separate vesting criteria:
− Retention(1);
− Absolute TSR; and
− Relative TSR.
+ The vesting period is for three years, the rights will lapse after
three years if not vested and there will be no retesting.
+ Rights granted in any particular fi nancial year are tested for
vesting over the three year period commencing 1 July of the
grant year.
1. Retention rights are not granted to the Managing Director
The Plan defi nes TSR as “The percentage change over a period
in shareholder value due to share price movement and dividends
paid assuming dividends are reinvested into AWE shares”.
Early vesting of rights is not permitted other than at the time of
change in control of the Company where the extent of any vesting
is to be determined at the discretion of the Board. On termination
of employment, rights are forfeited unless and to the extent
determined by the Board. The Board has discretion whether or not
to make a determination and reserves the right to exercise that
discretion having regard to the circumstances that might arise
from time to time.

46 AWE LIMITED ANNUAL REPORT 2014
Rights granted from the June 2013 Financial Year
Maximum number of rights available as a
percentage of Fixed Remuneration(1)
Retention
vesting
condition
Absolute
TSR vesting
condition
Relative
TSR vesting
condition Total(1)
Managing
Director
NA 50% 50% 100%
Senior
Executives 15% 30% 30% 75%
Rights granted from the June 2012 Financial Year
Maximum number of rights available as a
percentage of Fixed Remuneration(1)
Retention
vesting
condition
Absolute
TSR vesting
condition
Relative
TSR vesting
condition Total(1)
Managing
Director
NA 75% 75% 150%
Senior
Executives 20% 30% 30% 80%
1. Maximum total number of rights to be granted from June 2013 fi nancial year decreased from previous years and number of rights granted is now a maximum number based on past Company and individual performance
Vested rights will entitle the senior executive to an award which
will vary with the AWE share price at the time of vesting. The board
may decide in its absolute discretion the form of payment (cash or
issue of shares) to satisfy these vested rights.
Retention grants
+ Number of rights calculated using the 30-day VWAP of the AWE
share price as at 30 June of grant year.
+ Vest after three years if the employee remains employed by AWE.
Absolute TSR grants
+ Number of rights calculated using the 30-day VWAP of the AWE
share price in June of grant year.
+ Vest after three years according to the Company’s Absolute TSR
for that three year period.
+ The vesting scales to apply for Absolute TSR grants are as follows:
The above table represents the maximum number of rights that
can be awarded but will vest only if all performance conditions
are satisfi ed to 100% (and then only if the maximum number of
initial rights were granted based on past Company and individual
performance).
Rights granted from the June 2013 Financial Year(1)
AWE TSR % of rights to vest
‹ 8% pa compound -
8% pa compound 25%
›8% and ‹10% pa compound Pro rata
10% pa compound 50%
›10% and ‹12% pa compound Pro rata
12% pa compound 100%
Rights granted up to the June 2012 Financial Year(2)
AWE TSR % of rights to vest
‹ 6% pa compound -
6% pa compound 25%
›6% and ‹9% pa compound Pro rata
9% pa compound 50%
›9% and ‹12% pa compound Pro rata
12% pa compound 100%
1. Performance hurdles increased
2. Tested for vesting in fi nancial years up to June 2014
The maximum number of rights that can be granted as a
percentage of fi xed remuneration at the time of grant and
converted to a number of rights using the 30 day volume weighted
average price (“VWAP”) of the AWE share price as at 30 June of
the grant year are as follows:
R E M U N E R A T I O N R E P O R T

47AWE LIMITED ANNUAL REPORT 2014
Relative TSR grants
+ Number of rights calculated using the 30-day VWAP of AWE
share price in June of grant year.
+ Vest after three years according to the Company’s TSR relative
to comparable companies in ASX Energy 300 Index in grant year
as per the table below (companies no longer in the index are
excluded).
+ The vesting scales to apply for Relative TSR grants are as follows:
The Board determines in advance the appropriate comparator
group to apply to Relative TSR grants for the following 3 year period.
Rights granted from the June 2013 Financial Year(1)
AWE TSR relative to TSR of
companies in S&P/ASX Energy
Index at date of grant % of rights to vest
‹ 50% -
50% 25%
›50% and ‹90% Pro rata
90% and above 100%
Rights granted up to the June 2012 Financial Year(2)
AWE TSR relative to TSR of
companies in S&P/ASX Energy
Index at date of grant % of rights to vest
‹ 50% -
50% 50%
›50% and ‹75% Pro rata
75% and above 100%
1. Performance hurdles increased
2. Tested for vesting in fi nancial years up to June 2014
Employee Share Option Plan (closed during 2009)
The Company no longer issues employee share options as a
method of rewarding long term performance. No employee
share options have been issued since June 2009 and all residual
employee share options expired unexercised during the June 2014
fi nancial year.
For an analysis of employee share options forfeited in the June
2014 fi nancial year, refer to section 5.3.
3.5. Other benefi ts
The personal needs of directors and senior executives may
be taken into account when determining the appropriate
remuneration mix and the Company allows salary sacrifi ce
arrangements to the extent that it complies with all applicable
laws, and there is no net cost to the Company doing so.
4. Service agreements
Managing Director – Bruce Clement
On 1 February 2011, Mr Bruce Clement commenced as Managing
Director and at the time of his formal appointment, the details
of the service agreement entered into with Mr Clement were
disclosed and are summarised as follows:
Terms of Contract Contract commenced 1 February 2011
and continues until terminated under the
termination provisions of the contract.
Remuneration Remuneration is made up of the following
components:
+ Fixed Remuneration for fi nancial year
2014 was $899,891 per annum inclusive of
salary, superannuation and fringe benefi ts
tax which is reviewed annually effective 1
July;
+ At risk short term performance benefi ts
which are summarised in section 3.3 and
can represent up to 50% of base salary for
the year; and
+ At risk long term performance benefi ts
which are granted on an annual basis in
the form of rights under the Company’s
Cash Share Rights Plan. The board has
determined that all awards of rights to
Mr Clement are subject to approval of
shareholders at the Company’s Annual
General Meeting. Details of rights currently
held by Mr Clement are at section 5.4.
Termination The service agreement contract may be
terminated in the following circumstances:
+ Voluntary termination by the Company
or Mr Bruce Clement on six months’
notice. On termination by the Company, a
termination payment of 6 months of then
base salary is payable in addition to any
payment in lieu of notice. On termination by
Mr Clement, no such termination payment
will be made. Pro-rated short term benefi ts
will be paid according to the achievement
of KPIs to the date on which notice is given.
Any granted but unvested rights at the date
on which notice is given will be forfeited;
+ Termination by the Company on three
months’ notice in the event of illness or
injury. Pro-rated short term benefi ts will be
paid according to the achievement of KPIs
to the date on which notice is given. Any
granted but unvested rights at the date on
which notice is given will be forfeited; or
+ Termination by the Company for cause and
without notice. Any short term benefi ts or
rights that have not vested at the date on
which notice is given will be forfeited

48 AWE LIMITED ANNUAL REPORT 2014
Remuneration Executive Service Contracts standardise the executive’s entitlement to:
+ Fixed remuneration;
+ Short term performance benefi ts;
+ Long term performance benefi ts; and
+ Any other benefi ts that may be provided by the Company.
Termination Service agreements may be terminated under the following circumstances:
+ Resignation on three months’ notice by the executive;
+ Termination on three months’ notice by the Company; or
+ Termination without notice by the Company for cause.
In the event of a redundancy or defi ned change in circumstances the senior executive is entitled to a 12
month termination payment (in the case of Neville Kelly this entitlement is two years under certain defi ned
circumstances) unless not otherwise permitted by law.
However, for senior executives commencing employment after 1 July 2011 (Ms Saridas and Mr Tupper) this
termination payment has been reduced to 6 months.
Term The service contracts have no fi xed term.
Senior Executives
The key terms and conditions of service agreements for all other senior executives (excluding the Managing Director) are summarised
as follows:
Notes in relation to certain executives:
Neil Tupper
Mr Neil Tupper, General Manager Exploration and Geoscience, was appointed on 20 May 2013. In accordance with the terms of his Executive
Services Agreement, he is entitled to receive a retention payment as follows:
+ $50,000 gross to be paid at 30 June 2014 on the basis that he remains employed by the Company; and
+ $50,000 gross to be paid at 30 June 2015 on the basis that he remains employed by the Company at that time.
David Gaudoin
Mr David Gaudoin was Vice President Exploration and Exploitation, Indonesia to 1 November 2013. He received normal base salary and
superannuation until the date he ceased employment. On cessation of employment he received:
+ Unpaid accrued annual and long service leave; and
+ An amount equal to one year’s average base salary calculated in accordance with the Corporations Act 2001.
In respect of long-term performance benefi ts held by Mr Gaudoin:
+ Rights were forfeited to the extent of the retention component but otherwise retained for testing in July 2014 and July 2015 on a pro rata basis.
R E M U N E R A T I O N R E P O R T

49AWE LIMITED ANNUAL REPORT 2014
5. Executive remuneration outcomes
5.1 Remuneration tables
Details of the nature and amount of each major element of remuneration of the managing director of the Company and each of the
named senior executives are as follows:
Consolidated entity Short-term Post employment Share based payments
Sa
lary
pa
ck
ag
e(1
)
Ca
sh
bo
nu
s
No
n-m
on
eta
ry b
en
efi
ts/
all
ow
an
ce(2
)
To
tal
Su
pe
ran
nu
ati
on
be
ne
fi ts
(3)
Oth
er
lon
g-t
erm
(4)
Te
rmin
ati
on
be
ne
fi ts
(5)
To
tal
ca
sh
re
late
d
Va
lue
of
rig
hts
(6)
To
tal
Pe
rfo
rma
nce
re
late
d
Va
lue
of
rig
hts
(6)
$ $ $ $ $ $ $ $ $ $ % %
Executive director
B.F.W. Clement 2014 880,862 270,000 15,865 1,166,727 19,029 14,876 - 1,200,632 304,288 1,504,920 38% 20%
2013 846,438 151,424 15,633 1,013,495 18,842 (16,687) - 1,015,650 437,879 1,453,529 41% 30%
Other key management personnel (KMP)
D. Washer (7) 2014 606,899 137,534 4,247 748,680 51,825 - - 800,505 142,520 943,025 30% 15%
2013 516,701 85,671 4,350 606,722 44,248 - - 650,970 158,354 809,324 30% 20%
A. Saridas 2014 435,613 119,700 3,122 558,435 16,294 2,103 - 576,832 122,972 699,804 35% 18%
2013 419,530 87,200 2,863 509,593 16,470 (3,895) - 522,168 77,138 599,306 27% 13%
N. Tupper (8) and (9) 2014 514,981 183,800 85,355 784,136 20,344 2,071 - 806,551 52,474 859,025 28% 6%
2013 62,005 10,200 149 72,354 3,045 106 - 75,505 - 75,505 14% -
N. F. Kelly 2014 397,228 100,500 13,367 511,095 21,527 11,099 - 543,721 113,827 657,548 33% 17%
2013 380,948 76,500 12,760 470,208 21,716 11,583 - 503,507 120,843 624,350 32% 19%
M. Drew(10) 2014 401,911 60,636 3,025 465,572 23,395 (121) - 488,846 - 488,846 12% -
2013 59,417 13,200 222 72,839 4,167 121 - 77,127 - 77,127 17% -
D.R.N. Gaudoin(11) 2014 214,102 - 53,867 267,969 - 24,804 509,117 801,890 (43,078) 758,812 (6%) (6%)
2013 579,720 68,700 292,202 940,622 5,458 (11,781) - 934,299 126,446 1,060,745 18% 12%
Total executive KMP
2014 3,451,596 872,170 178,848 4,502,614 152,414 54,832 509,117 5,218,977 736,081 5,911,980 27% 12%
2013 2,864,759 492,895 328,179 3,685,833 113,946 (20,553) - 3,779,226 920,660 4,699,886 30% 20%
Notes in relation the remuneration table above.1. Salary package includes amounts salary sacrifi ced.
2. Amounts included in non-monetary benefi ts for Mr Gaudoin include costs associated with his Indonesian expatriate assignment including housing, motor vehicle and school fees; and for Mr Tupper these costs include relocation costs.
3. Superannuation benefi ts include the amount required to be contributed by the consolidated entity and does not include amounts salary sacrifi ced.
4. Other long-term benefi ts comprise the amount of long service leave accrued and adjustments to underlying assumptions therein in the period.
5. Amounts classifi ed as termination benefi ts include salaries paid after the senior executive ceased to be classifi ed as key management personnel but continued to be employed by the consolidated entity.
6. The fair value of rights granted have been calculated at the grant date using a Black-Scholes Pricing Model and assuming an expected share price volatility of 25% and vesting probability of 43.5% for performance related awards.
The value disclosed is the portion of the fair value of rights allocated to this reporting period. The value disclosed does not therefore represent cash received.
Notes in relation to key management personnel 7. Mr Dennis Washer is paid in NZ dollars. Accordingly, Mr Washer’s cash related remuneration will vary with exchange rate movements.
8. Included within short-term cash bonus paid to Mr Tupper is a $50,000 cash retention payment.
9. Mr Neil Tupper commenced employment as General Manager, Exploration & Geoscience on 20 May 2013.
10. Mr Michael Drew commenced employment as Group General Counsel / General Manager Commercial 1 May 2013 and ceased employment on 30 June 2014.
11. Mr David Gaudoin ceased employment with AWE on 1 November 2013 and certain rights valuations previously expensed have been reversed in the current fi nancial year.

50 AWE LIMITED ANNUAL REPORT 2014
5.2 Analysis of short term performance benefi ts included in remuneration
Award of short term performance benefi ts
Section 3.3 of this report details the consolidated entity’s approach
to the granting and vesting of short term performance benefi ts.
The award of short term performance benefi ts in the form of
cash bonuses to the Managing Director and senior executives in
recognition of Company performance and individual performance
in the June 2014 fi nancial year together with the vesting profi le of
these bonuses are as follows:
Included in
remuneration (1)
$
Vested
in year (2)
%
Forfeited
in year(3)
%
Director
B.F.W. Clement 270,000 60.0% 40.0%
Executives
D. Washer 137,534 52.5% 47.5%
A. Saridas 119,700 66.0% 34.0%
N. Tupper(4) 133,800 62.5% 37.5%
N. F. Kelly 100,500 60.0% 40.0%
M. Drew(5) 60,636 42.5% 57.5%
1. Amounts included in remuneration represent the amount that vested in the fi nancial year including superannuation payments applicable. No amounts vest in future fi nancial years.
2. Refer to section 3.1 for details of deferral and clawback of performance based remuneration introduced with effect from the June 2015 fi nancial year.
3. The percentages forfeited are due to that component of base and stretch performance criteria not being met in the fi nancial year.
4. Mr Neil Tupper commenced employment on 20 May 2013.
5. Mr Michael Drew commenced employment on 1 May 2013 and ceased employment 30 June 2014.
5.3 Analysis of long term performance benefi ts included in remuneration
Section 3.4 of this report details the consolidated entity’s approach
to the granting and vesting of long term performance benefi ts.
The value of rights are allocated to each reporting period over
the period from grant date to vesting date. Accordingly, amounts
included as remuneration for the fi nancial year represent that
amount allocated to the fi nancial year from the grant of rights both
in the current fi nancial year and previous fi nancial years.
Granting of Share Rights
The number and value of rights granted during the fi nancial year
to the managing director and senior executives is detailed below:
Granted during the year in respect of June 2013 fi nancial year
performance and vesting post 30 June 2014
Gra
nt
da
te
Nu
mb
er(1
)
% o
f m
ax
imu
m
ava
ila
ble
To
tal
valu
e$ F
air
va
lue
pe
r ri
gh
t g
ran
ted
$
Director
B.F.W. Clement(2) 27.11.13 427,474 60% 222,212 0.52
Executives
D. Washer 16.01.14 198,034 54% 141,080 0.71
A. Saridas 16.01.14 193,189 69% 137,628 0.71
N. Tupper 16.01.14 221,174 60% 157,564 0.71
N. F. Kelly 16.01.14 170,674 66% 121,588 0.71
M. Drew(3) 16.01.14 181,467 60% 129,277 0.71
1. The number of rights granted is based on past company and individual performance.
2. The granting of these rights was approved by shareholders at the 2013 Annual General Meeting.
3. Mr Michael Drew commenced employment on 1 May 2013 and ceased employment on 30 June 2014. All rights were forfeited on cessation of employment.
R E M U N E R A T I O N R E P O R T

51AWE LIMITED ANNUAL REPORT 2014
The movement during the fi nancial year in the number of rights held by the managing director and senior executives is detailed below:
Movement in share rights
Opening
balance
Granted as
remuneration Exercised
Lapsed
unexercised
Net change
other
Closing
balance
As at 30 June 2014
Director
B. F. W. Clement(1) 1,477,565 427,474 (230,061) - - 1,674,978
Executives
D. Washer 497,979 198,034 (47,102) - - 648,911
A. Saridas 282,372 193,189 - - - 475,561
N.P. Tupper(2) - 221,174 - - - 221,174
N. F. Kelly 381,992 170,674 (35,622) - - 517,044
M. Drew(3) - 181,467 - - (181,467) -
D. R. N. Gaudoin(4) 461,792 - (39,988) - (421,804) -
3,101,700 1,392,012 (352,773) - (603,271) 3,537,668
As at 30 June 2013
Director
B. F. W. Clement(1) 1,836,275 331,474 - (690,184) - 1,477,565
Executives
D. Washer 618,328 153,973 (33,254) (241,068) - 497,979
A. Saridas 162,850 119,522 - - - 282,372
N. F. Kelly 475,656 116,813 (25,903) (184,574) - 381,992
D. R. N. Gaudoin(4) 557,179 140,886 (29,077) (207,196) - 461,792
3,650,288 862,668 (88,234) (1,323,022) - 3,101,700
1. All share rights issued to Mr Clement have been approved by shareholders at previous Annual General Meetings of the Company.
2. Mr Tupper commenced employment on 20 May 2013.
3. Mr Drew commenced employment on 1 May 2013 and ceased employment 30 June 2014.
4. Mr Gaudoin ceased employment on 1 November 2013.

52 AWE LIMITED ANNUAL REPORT 2014
Vesting of Share Rights
The following table describes the actual vesting criteria applying to rights tested for vesting conditions at 30 June 2014 for the managing
director and senior executives:
Senior executives rights vesting performance 3 years to June 2014
Retention rights Absolute TSR rights Relative TSR Rights
Retention rights vested based
on the following criteria:
All Absolute TSR rights vested
based on the following criteria :
All Relative TSR rights vested
based on the following criteria:
Senior executive employed by the
consolidated entity three years
subsequent to initial grant.
Minimum annual
compound rate
required for full
vesting:
12.0% Minimum relative
performance
required for full
vesting:
75th percentile
Actual AWE annual
compound TSR for
the three year period
to 30 June 2014:
14.1% AWE relative
performance against
ASX 300 Energy Index
comparator group for
the three year period
to 30 June 2014
80th percentile
On the application of the vesting criteria described above details of 30 June 2014 vesting rights which were tested for vesting conditions
subsequent to the end of the fi nancial year are as follows:
30 June 2014 vesting share rights
Retention Rights Absolute TSR Rights Relative TSR Rights Total Rights
Director
B.F.W. Clement (1) On Issue - 458,015 458,015 916,030
Forfeited - - - -
Vested - 458,015 458,015 916,030
Executives
D. Washer On Issue 74,226 111,339 111,339 296,904
Forfeited - - - -
Vested 74,226 111,339 111,339 296,904
A. Saridas On Issue 40,712 61,069 61,069 162,850
Forfeited - - - -
Vested 40,712 61,069 61,069 162,850
N. F. Kelly On Issue 57,389 86,084 86,084 229,557
Forfeited - - - -
Vested 57,389 86,084 86,084 229,557
D.R.N. Gaudoin On Issue - 82,062 82,062 164,124
Forfeited - - - -
Vested - 82,062 82,062 164,124
Total On Issue 172,327 798,569 798,569 1,769,465
Forfeited - - - -
Vested 172,327 798,569 798,569 1,769,465
1. Approval was received at the Company’s 2011 Annual General Meeting to grant these rights to the managing director, and further, approval was received under ASX Listing Rule 10.14 to issue shares to the managing director on the vesting of these rights.
All the above rights were originally issued in the June 2012 fi nancial year. The board has determined that vested rights for the
managing director and senior executives will be settled by the issue of AWE shares.
R E M U N E R A T I O N R E P O R T

53AWE LIMITED ANNUAL REPORT 2014
Employee Share Options
The Company no longer issues employee share options as a method of rewarding long term performance. No employee share options
have been issued since June 2009 and all residual employee share options expired unexercised during the June 2014 fi nancial year.
Details of employee options lapsing during the fi nancial year are detailed below:
Grant date Number lapsed during year ended 30 June 2014
Director
Nil - -
Executives
D. Washer 15 August 2008 100,000
N. F. Kelly 15 August 2008 100,000
D. R. N. Gaudoin 16 June 2009 200,000
All the above options were granted in the June 2009 fi nancial year and no value was attributable to options that lapsed during the fi nancial year.
5.4 Analysis of movements in long term performance benefi ts
Employee Share Rights
Details of employee rights granted as remuneration to the managing director of the Company and each of the named senior executives
and held at the end of the June 2014 fi nancial year are detailed below:
Grant date Number(1)
Financial years in
which rights vest(2)
Fair value
per right granted(3)
$
Directors
B.F.W. Clement(4) 24 November 2011 916,030 5 30-June-2014 0.54
22 November 2012 331,474 30-June-2015 0.58
27 November 2013 427,475 30-June-2016 0.52
Executives
D. Washer 16 September 2011 296,904 5 30-June-2014 0.60
4 December 2012 153,973 30-June-2015 0.71
16 January 2014 198,034 30-June-2016 0.71
A. Saridas 31 October 2011 162,850 5 30-June-2014 0.80
4 December 2012 119,522 30-June-2015 0.71
16 January 2014 193,189 30-June-2016 0.71
N. F. Kelly 16 September 2011 229,557 5 30-June-2014 0.60
4 December 2012 116,813 30-June-2015 0.71
16 January 2014 170,674 30-June-2016 0.71
N. Tupper 16 January 2014 221,174 30-June-2014 0.71
D. R. N. Gaudoin(6) 16 September 2011 164,124 5 30-June-2014 0.60
4 December 2012 112,710 30-June-2015 0.71
1. The vesting of rights is conditional upon satisfaction of vesting conditions as described in section 3.4.
2. Rights vesting on 30 June 2014 tested for satisfaction of vesting conditions subsequent to the end of the fi nancial year.
3. The fair value per right granted represents the valuation for rights granted and calculated at grant date.
4. Grants of rights to Mr Clement have been approved by shareholders at previous Annual General Meetings of the Company.
5. Satisfi ed vesting conditions effective 30 June 2014 on the determination of the board subsequent to the end of the fi nancial year. Refer section 5.3 for further details.
6. Mr David Gaudoin ceased employment on 1 November 2013.

54 AWE LIMITED ANNUAL REPORT 2014
R E M U N E R A T I O N R E P O R T
6. Non-executive director remuneration
Total remuneration for all non-executive directors, last voted upon by shareholders at the 2009 Annual General Meeting of the Company,
is not to exceed $900,000 per annum, inclusive of superannuation. Total remuneration paid to non-executive directors in the fi nancial year
amounted to $875,404 (2013: $815,328). Fees are set based on review of externally provided remuneration data with reference to fees paid
to other non-executive directors of comparable companies.
As the total fees paid to non-executive directors are nearing the annual cap previously approved by shareholders, it is intended that the
Company seek approval at the 2014 Annual General Meeting to increase this maximum amount by $300,000 to $1,200,000. This increase
will enable the Company in the future, if required, to provide for:
+ Adequate fi nancial incentives commensurate with the market to attract and retain suitably qualifi ed and experienced directors to
replace existing non-executive directors;
+ Appropriate arrangements to be put in place to ensure a smooth transition on replacement of directors, including a period of overlap if
required; and
+ Increases in the number of non-executive directors in the future should it be considered appropriate.
Non-executive directors fees (including superannuation) for the 2014 fi nancial year were as follows:
Board
Audit
Committee
People
Committee
Sustainability
Committee
Chair $226,013 $23,678 $17,220 $17,220
Member $96,863 $11,839 $8,610 $8,610
Non-executive directors do not receive incentive-based remuneration and do not receive any retirement benefi ts other than
statutory entitlements.
Company & consolidated entity Short-term Post-employment
Fees(1)
Non-monetary
benefi ts Total
Superannuation
benefi ts(2)
Termination
benefi ts
Total cash
related Total
$ $ $ $ $ $ $
Non-Executive Directors
B. J. Phillips 2014 214,757 - 214,757 19,865 - 234,622 234,622
2013 210,000 - 210,000 18,901 - 228,901 228,901
D. I. McEvoy 2014 115,260 - 115,260 10,662 - 125,922 125,922
2013 112,706 - 112,706 10,144 - 122,850 122,850
A. J.
Hogendijk(3)
2014 45,596 - 45,596 4,218 49,814 49,814
2013 115,596 - 115,596 10,404 - 126,000 126,000
K. G. Williams 2014 117,757 - 117,757 10,893 - 128,650 128,650
2013 112,706 - 112,706 10,144 - 122,850 122,850
N. N. Jukes(4) 2014 - - - - - - -
2013 37,277 - 37,277 3,355 - 40,632 40,632
V. Braach-
Maksvytis
2014 111,082 - 111,082 10,275 - 121,357 121,357
2013 102,110 - 102,110 9,190 - 111,300 111,300
R. J. Betros (4) 2014 105,698 - 105,698 9,777 - 115,475 115,475
2013 57,610 - 57,610 5,185 - 62,795 62,795
K. L.C.
Penrose(5)
2014 91,134 - 91,134 8,430 - 99,564 99,564
2013 - - - - - - -
Total
2014 801,284 - 801,284 74,120 - 875,404 875,404
2013 748,005 - 748,005 67,323 - 815,328 815,328
1. Fees include amounts salary sacrifi ced.
2. Superannuation benefi ts include the amount required to be contributed by the consolidated entity and does not include amounts salary sacrifi ced.
3. Mr Andy Hogendijk resigned as a director on 27 November 2013.
4. Mr Nick Jukes resigned as a director and Mr Raymond Betros was appointed a director on 22 November 2012.
5. Ms Karen Penrose was appointed as a director on 28 August 2013.

C O R P O R A T E G O V E R N A N C E S T A T E M E N T
55AWE LIMITED ANNUAL REPORT 2014
Corporate Governance Statement
The ASX Listing Rules require listed entities to disclose the extent
to which they have followed the Corporate Governance Principles
and Recommendations set by the ASX Corporate Governance
Council during the reporting period. This corporate governance
statement summarises the corporate governance practices that
have been formally reviewed and adopted by the AWE Board with a
view to ensuring continued investor confi dence in the operations of
the Company and endorsing the corporate governance principles
relevant to a company of AWE’s nature and size.
The 3rd edition of the ASX Corporate Governance Principles and
Recommendations was introduced on 27 March 2014 and takes
effect for a listed entity’s fi rst full fi nancial year ending on or after
1 July 2014. In AWE’s case this will mean initial reporting against
these revised principles in the 2015 Annual Report.
Accordingly this Corporate Governance Statement has been
prepared on the basis of disclosure under the 2nd Edition of these
principles with a table included at the back of this statement
detailing the Company’s compliance with these principles during
the period.
The Company’s website at www.awexplore.com contains a
corporate governance section that includes copies of the
Company’s corporate governance policies and board committee
charters mentioned in this statement.
ASX Principle 1 – Lay solid foundations for management and oversight
Role of the Board
The responsibilities of the Board are to:
+ set the strategic direction for the Company and monitor
progress of those strategies;
+ establish and monitor policies appropriate for the Company;
+ approve the business plan and annual work programs and
budgets in line with the approved strategy;
+ authorise material investment and strategic commitments;
+ authorise material asset divestments;
+ review capital management initiatives;
+ take responsibility for risk management and control processes;
+ review and ratify systems for health, safety and environmental
management;
+ report to shareholders, including but not limited to, the fi nancial
statements of the Company;
+ evaluate the performance of the Board, Board committees and
the Managing Director;
+ monitor Board succession planning including to identifi cation
and appointment of the Managing Director and non-executive
directors;
+ take responsibility for corporate governance and regulatory
compliance;
+ if required, approve any external directorship held by directors
or senior executives;
+ ensure that trading in the Company’s securities takes place in
an effi cient, competitive and informed market; and
+ approve the annual Notice of Annual General Meeting
Board committees have been established to assist the Board in
discharging these responsibilities.
Delegation to Management
Other than matters specifi cally reserved for the Board,
responsibility for the operation and administration of the Company
has been delegated to the Managing Director. This responsibility
is subject to an approved delegation of authority which is reviewed
regularly and at least annually.
Internal control processes are designed to allow management
to operate within the parameters approved by the Board and the
Managing Director cannot commit the Company to additional
activities or obligations in excess of these delegated authorities
without specifi c approval of the Board.
ASX Principle 2 - Structure the board to add value
Composition of the Board
The names of the directors of the Company in offi ce at the date
of this statement and information regarding directors’ experience
and responsibilities are set out in the Directors’ Report.
The Company’s constitution provides for the Board to determine a
number of directors that is not less than three and not more than
ten directors.
The Board has resolved that it will at all times have a majority of non-
executive directors, with at least 50% of directors considered to be
independent, including the Chairman, who shall be non-executive.
The preferred combination of skills and experience for the Board
of AWE include:
+ technical disciplines of upstream oil and gas exploration,
development and production;
+ fi nance, taxation, treasury and accounting;
+ company strategy and business planning;
+ business growth and corporate development;
+ both local and international experience; and
+ ASX listed public company administration.
The Board considers that collectively the current Board has the
appropriate range of skills and experience to direct the Company.
Chairman of the Board
The Chairman of the Board will be a non-executive director and
the Chairman will be elected by the directors. The Board considers
that at the date of this report, the Chairman Mr Bruce Phillips, is
also independent.

56 AWE LIMITED ANNUAL REPORT 2014
C O R P O R A T E G O V E R N A N C E S T A T E M E N T
Independent Directors
The Board considers that a director is independent if that director complies with the following criteria:
+ apart from director’s fees and shareholdings, independent directors should not have any business dealings which could materially
affect their independent judgement;
+ must not have been in an executive capacity in the Company in the last three years;
+ must not have been in an advisory capacity to the Company in the last three years;
+ must not be a signifi cant customer or supplier for the Company;
+ must not be appointed through a special relationship with another board member;
+ must not owe allegiance to a particular group of shareholders which gives rise to a potential confl ict of interest;
+ must not hold confl icting cross directorships; and
+ must not be a substantial shareholder or a nominee of a substantial shareholder (as defi ned under section 9 of the Corporations Act).
The Board considers that on application of the above guidelines
the status of the independence of directors is as follows:
Independent Directors AWE BoardAudit and Governance
Committee People Committee Sustainability Committee
Mr B.J. Phillips(1) Chairman - Member -
Mr D.I. McEvoy Member Member - Chairman
Mr K.G. Williams Member Chairman Member -
V. Braach-Maksvytis Member - Chair Member
Mr R.J. Betros Member Member - Member
Ms K. L.C. Penrose Member Member - Member
Executive Director
Mr B.F.W Clement Managing Director - - -
1. Mr Bruce Phillips was previously Managing Director of the Company up to 31 August 2007, remained as an employee until 31 December 2007 and was appointed a non-executive director on 19 November 2009 and non-executive Chairman on 18 November 2010. The Board considers Mr Phillips is independent since it has been in excess of three years since Mr Phillips held an executive role with the Company and that there has been signifi cant change in the composition of the senior executive committee of the Company since that time.
Following the retirement of Mr Hogendijk and the appointment of Ms Penrose during the period, committee memberships were
restructured with Mr Williams being appointed Chairman of the Audit and Governance Committee and Dr Braach-Maksvytis being
appointed Chair of the People Committee.
Retirement and rotation of directors
Retirement and rotation of directors are governed by the Corporations Act 2001 and the Constitution of the Company. Each year, one third
of directors must retire and offer themselves for re-election. Any casual vacancy fi lled will be subject to shareholder vote at the
next Annual General Meeting of the Company.
It is intended that Mr Phillips and Mr McEvoy by rotation, will stand for re-election at the Company’s 2014 Annual General Meeting.
Role of company secretary
The Company Secretary, through the Chairman, is accountable to the Board for the effectiveness of corporate governance processes,
ensuring adherence to the Board’s principles and procedures. All directors have access to the Company Secretary who has a direct
reporting line to the Chairman.
57AWE LIMITED ANNUAL REPORT 2014
Independent professional advice
Each director has the right to seek independent professional
advice at the Company’s expense after consultation with the
Chairman. Once received, the advice is to be made immediately
available to all Board members.
Access to employees
Directors have the right of access to any employee. Any employee
shall report any breach of corporate governance principles or
Company policies to the Managing Director who shall remedy
the breach. If the breach is not rectifi ed to the satisfaction of
the employee, they shall have the right to report any breach
to an independent director without further reference to senior
executives of the Company.
Directors’ and offi cers’ liability insurance
Directors’ and offi cers’ liability insurance for directors is arranged
by the Company at the Company’s expense.
Share ownership
Directors are encouraged to own Company shares. The Company’s
policy is that directors shall not engage in speculative trading.
Also, directors must inform the Chairman if any Company
securities are subject to a margin loan. The Company reserves
the right to disclose this arrangement to the ASX if the Company
believes it is appropriate having regard to the Listing Rules.
Board meetings
The frequency of board meetings and the extent of reporting from
management at board meetings are as follows:
+ a minimum of six scheduled meetings are to be held per year;
+ other meetings will be held as required;
+ meetings can be held where practicable by electronic means;
+ information provided to the Board includes all material
information related to the operations of the Company including
exploration, development and production operations, budgets,
forecasts, cash fl ows, funding requirements, investment and
divestment proposals, business development activities, investor
relations, fi nancial accounts, taxation, external audits, internal
controls, risk assessments, people and health, safety and
environmental reports and statistics;
+ the Chairman of the appropriate board committee reports to the
next subsequent board meeting the outcomes of that meeting
and the minutes of those committee meetings are also tabled.
The number of directors’ meetings (including meetings of
committees of directors) and the number of meetings attended by
each of the directors of the Company during the fi nancial year are
set out in the Directors’ Report.
Board performance review
A review of the Board’s own performance and effectiveness is
conducted annually and the performance of individual directors is
also undertaken.
As required by their respective charters the Audit and Governance
Committee, the Sustainability Committee and the People Committee
undertake an annual self-assessment. The Board and the Board
committees have the discretion for these reviews to be conducted
independently from time to time.
In respect of the June 2014 fi nancial year an external independent 360
degree review of the Board and Board committees was performed.
Performance evaluation of the Managing Director, senior
executives and employees is undertaken at least annually (refer
to separate discussion in the June 2014 Remuneration Report).
Board committees
Audit and governance committee
The role of the Audit and Governance Committee is documented
in a formal charter approved by the Board and is reviewed as
required but in any event at least every two years.
The Audit and Governance Committee’s primary role is to assist
the Board of Directors in discharging its responsibilities in respect
of the fi nancial affairs and related matters of the Company and to
advise and make appropriate recommendations to the Board in
respect of such fi nancial responsibilities.
The objectives of the Audit and Governance Committee are to:
+ assist the Board in discharging its responsibility to exercise due
care, diligence and skill in relation to the Company’s:
− reporting of fi nancial information to users of fi nancial
reports;
− application of accounting policies;
− fi nancial management;
− internal control system;
− corporate and governance risk management;
− taxation risk management;
− business policies and practices;
− protection of the entity’s assets; and
− compliance with applicable laws, regulations, standards
and best practice guidelines;
+ improve the credibility and objectivity of the accountability
process (including fi nancial reporting), especially where the role
of the Audit and Governance Committee and its membership
by independent non-executive directors is disclosed to
shareholders and the public;
+ provide a forum for communication between the Board and
senior fi nancial management;
+ improve the effi ciency of the Board by delegating tasks to
the Committee and thus allowing more time for issues to be
discussed in suffi cient depth;
+ improve the effectiveness of the external audit functions and to
be a forum for improving communication between the Board
and the external auditor;
+ satisfy itself as to the independence of the external auditor
(each reporting period the external auditor provides an
independence declaration in relation to the audit or review); and
+ improve the quality of internal and external reporting of fi nancial
information.

58 AWE LIMITED ANNUAL REPORT 2014
Under its charter, the Audit and Governance Committee must
be comprised of at least three independent non-executive Board
members appointed by the Board. Any director who is not a
member of the Audit and Governance Committee may attend
Audit and Governance Committee meetings but will have no voting
powers at such meetings. Members will have the appropriate
skills (including fi nancial literacy) and time to fi ll their role on the
Audit and Governance Committee. The majority of members will
have signifi cant experience with fi nancial and business matters.
The Managing Director should not be a member of the Audit and
Governance Committee. The Chairperson of the Board of Directors
should not be the Chairperson of the Audit and Governance
Committee.
At the discretion of the Audit and Governance Committee, the
external auditor and the Managing Director and other executives
are invited to attend meetings. At least twice per year, the
Audit and Governance Committee meets with the external
auditor without executives present. The Audit and Governance
Committee comprises Mr Williams (Chairman), Mr McEvoy,
Mr Betros and Ms Penrose, all of whom are non-executive and
considered to be independent. Meetings are to be scheduled prior
to the commencement of each fi nancial year and the charter
stipulates that meetings are to be held at least three times a
year. The number of Audit and Governance Committee meetings
and number of meetings attended by each of the members of
the Audit and Governance Committee during the fi nancial year
and information regarding committee member experience and
responsibilities are set out in the Directors’ Report.
The Managing Director and the Chief Financial Offi cer have
declared in writing to the Board that the Company and
consolidated entity’s fi nancial reports for the year ended 30 June
2014 present a true and fair view, in all material respects, of
the Company and consolidated entity’s fi nancial condition and
operational results and are in accordance with relevant accounting
standards. This representation is made by the Managing Director
and Chief Financial Offi cer prior to the directors’ approval of
the release of both the annual and six-monthly accounts. This
representation is made after enquiry of, and representation by,
appropriate levels of management (refer also to Risk Management
section for declaration made in respect of risk management).
People committee
The roles and responsibilities of the People Committee is
documented in a formal charter approved by the Board and is
reviewed as required but in any event at least every two years.
Refer to the Company’s June 2014 Remuneration Report for
further information.
For details in relation to the Company’s Share Rights Plan,
refer to note 21 to the fi nancial statements and to the June 2014
Remuneration Report.
For details of remuneration paid to directors and senior
executives for the fi nancial year and the process for evaluating the
performance of senior executives, please refer to the June 2014
which is included in the Directors’ Report on pages 40 to 54.
The People Committee comprises Dr Braach-Maksvytis (Chair),
Mr Phillips and Mr Williams all of whom are non-executive and are
considered to be independent at the date of this report.
Sustainability committee
The role of the Sustainability Committee is documented in a
formal charter approved by the Board and is reviewed as required
but in any event at least every two years.
The Sustainability Committee’s role is to assist the Board in
meeting its oversight responsibilities in relation to the health,
safety, sustainability, integrity and community relations aspects
of the Company’s operations.
The responsibilities of the Sustainability Committee are:
+ Corporate responsibility:
− Monitoring of compliance with and suggested changes
to the Company’s policies and procedures in respect of
responsible and ethical business dealings.
+ Occupational Health and Safety (“OHS”)
− Review of the management of OHS risks and issues; and
− Monitoring of the Company’s OHS performance and
compliance with the relevant OHS legislation.
+ Sustainability
− Review of the management of environmental risks and
issues;
− Monitoring of the Company’s environmental reporting
requirements and processes and compliance with relevant
legislation; and
− Review of and recommendation for approval of the annual
Sustainability Report.
+ Operational Risk
− In accordance with the Company’s Risk Policy, review of
the management of the material operational risk factors
associated with the Company’s equity/participatory
interests in oil and gas exploration, development and
production projects and operations; and
− In accordance with the Company’s Risk Policy, overseeing
the appropriateness of risk mitigation measures identifi ed
for these material operational risks.
The Sustainability Committee will be comprised of not less than three
non-executive directors, and where possible, the majority of members
will have signifi cant experience in oil and gas operations.
The members of the Sustainability Committee are Mr McEvoy
(Chairman), Dr Braach-Makvytis, Mr Betros and Ms Penrose.
The number of Sustainability Committee meetings and the number
of meetings attended by each of the members of the Sustainability
Committee during the fi nancial year and information regarding
committee member experience and responsibilities are set out in
the Directors’ Report.
C O R P O R A T E G O V E R N A N C E S T A T E M E N T

59AWE LIMITED ANNUAL REPORT 2014
ASX Principle 3 – Promote ethical and responsible decision-making
Code of conduct
The goal of establishing AWE as a signifi cant Australian-based
petroleum exploration and production company is underpinned by
its core values of honesty, integrity, common sense and respect
for people. AWE desires to remain a good corporate citizen and
appropriately balance, protect and preserve all stakeholders’
interests.
The Board has adopted a Code of Conduct for directors, employees
and contractors of the Company. The Company’s goal of achieving
above average wealth creation for our shareholders should be
enhanced by complying with this Code of Conduct, which provides
principles with which directors, key executives and employees should
be familiar and with which they are expected to adhere and advocate.
AWE is committed to:
+ Ensuring that its employees act ethically and professionally;
+ Conducting its business fairly, honourably and with integrity;
+ Providing an equal opportunity workplace;
+ Carrying out our work professionally, competently and in a
courteous manner;
+ Providing an equal opportunity workplace;
+ Conducting business in compliance with the law in all
jurisdictions where the Company operates; and
Further, AWE is committed to adhering to our Health Safety and
Environment Policy by protecting the health and safety of all
employees and ensuring that our activities have minimal impact
on the environment and the greater community.
In meeting these objectives AWE has implemented a range of
policies that provide clear guidance to AWE’s directors, employees
and contractors on the standards of behaviour that is expected
at all times when dealing with internal and external stakeholders
including suppliers, joint venture partners, governments offi cials
and regulators. These policies include:
+ Fraud and Anti-Corruption Policy;
+ Whistleblower Policy; and
+ Procurement Policy.
Given the Company’s expanding international operations, during
the period staff training was undertaken to ensure directors,
employees and contractors understood and acknowledged the
principles and responsibilities underlying these policies.
Further details on the Company’s business ethics is provided in
the Company’s 2014 Sustainability Report.
Trading in Company Securities by Directors,
Offi cers and Employees
Trading of AWE’s shares is covered by, amongst other things,
the Corporations Act and the ASX Listing Rules. The Board has
established a Securities Trading Policy that establishes strict
guidelines as to when a director, offi cer or an employee can deal
in Company shares. The policy prohibits trading in the Company’s
securities during designated blackout periods, particularly around
quarterly, six monthly and annual results announcements and
whilst the director, offi cer or employee is in the possession of
price-sensitive information.
The policy also describes the Company’s policy in respect of
equity-based remuneration, “hedge contracts”, speculative trading
and margin lending. This policy is reviewed by the Board on an
annual basis with any material changes being notifi ed to ASX.
For details of shares held by directors and offi cers, please refer to
the Directors’ Report and note 32 to the fi nancial statements.
Diversity
AWE is committed to a workplace culture that promotes the
engagement of diverse, qualifi ed, capable and motivated staff at all
levels of the organisation in order to deliver enhanced corporate
performance, reputation and shareholder value for the AWE group.
Over the past year AWE has continued to develop a diverse and
effective workforce to enable the Company to achieve its strategic
goals and female staff continue to be represented at all levels
within AWE.
While AWE has a strong merit based culture for all employees and
management, a key focus of the Company is to support greater
gender diversifi cation in the workplace where possible. AWE is
pleased to report on a number of improvements in this regard.
The following table shows the comparative gender representation
of men and women at various levels within AWE year on year as at
30 June 2014.

60 AWE LIMITED ANNUAL REPORT 2014
Gender Representation of AWE’s Workforce
Males Females Change %
No. Males 2013
No. Males 2014
% Males
2013
% Males
2014
No. Females
2013
No. Females
2014
%Females
2013
%Females
2014
Non-Executive
Directors
5 4 83% 67% 1 2 17% 33% 16%
Senior Executives ¹ 6 4 86% 80% 1 1 14% 20% 6%
Senior Manager 16 16 94% 94% 1 1 6% 6% -
Senior Technical &
Professional
26 20 72% 65% 10 11 28% 35% 7%
Technical &
Professional
39 20 72% 65% 15 11 28% 35% 7%
Support Staff 10 5 27% 22% 27 18 73% 78% 5%
Total workforce 102 69 65% 61% 55 44 35% 39% 4%
1. Includes Managing Director
For the purposes of both the above statistics, AWE defi nes
“workforce” as all full-time, part-time and temporary employees
and independent contractors.
+ During the June 2014 fi nancial year, there was a reduction in
the total workforce and an overall increase in the proportion of
women across the organisation.
+ At director level, with the retirement of one director and
the appointment of a new director to the Board, AWE has
successfully added a second female member to the Board of
Directors resulting in a 33% female representation at non-
executive director level.
+ At the Senior Technical & Professional level the proportion of
female to male staff has increased from 28% in June 2013 to
35% in June 2014 with women now fi lling HSE and Taxation
management positions.
+ Similarly, in the Technical & Professional level, the proportion
of female to male staff has increased from 28% in June
2013 to 35% in June 2014 with women fi lling positions such
as Geophysicist, Reservoir Engineer and Senior Financial
Accountant.
+ AWE actively reviews pay equity to ensure alignment of pay for
the same roles irrespective of gender.
+ AWE supports a culture of work-life balance regardless of an
employee’s position within the organisation. Excluding directors,
13 out of the 42 female staff (i.e. 31% of female employees) have
a fl exible working arrangement for either working from home
for some of the time, or for part-time employment.
+ During the year AWE launched its inaugural Womens’
Leadership Program as a means of developing and mentoring
female staff in the Company. The program is designed to
support career advancement and in so doing, to develop
individuals within the organisation to align with Company
strategies including future succession planning.
+ During the year AWE rolled out a new Discrimination,
Harassment and Bullying Policy that includes affi rmative
action to promote diversity and equal opportunity for women
within the organisation. This was done though an online
E-learning training program that included testing knowledge
and understanding of the policies. It was mandatory training
for all staff at all levels across the organisation. In addition, an
external trainer ran a separate session specifi cally targeted for
Executives and Senior Managers.
+ Retention of women within the Company in 2013-2014 has been
stable. Of female staff, 7% have been with the Company more
than 10 years; 14% between 7 and 9 years; 30% between 4 and 6
years; and the remaining less than 3 years.
In order to assess and measure objectives for achieving diversity across
the organisation, the Board has established the following commitments
which are embedded within the Company’s Diversity Policy:
+ To recruit and retain people on the basis of their ability and
performance regardless of factors such as age, cultural, ethnic or
religious background, gender, nationality, physical ability or race.
+ Never to accept any type of unlawful bullying, discrimination,
harassment, victimisation or vilifi cation anywhere in the AWE group.
+ While retaining a merit based culture for all staff across
the organisation, a key focus is to seek and support, where
possible, greater gender diversifi cation in AWE operations and
management.
+ To support staff in their professional development; with
work-life balance and with their career progression within the
organisation.
+ At least annually, to review pay equity to address any anomalies
and any gender gaps.
+ To undertake and monitor diversity initiatives and measure their
effectiveness at least annually.
+ To review the Diversity Policy regularly and update it as required.
C O R P O R A T E G O V E R N A N C E S T A T E M E N T

61AWE LIMITED ANNUAL REPORT 2014
The Diversity Policy is available on AWE’s website in the Corporate Governance section.
The measureable gender diversity objectives set by the board for 2014 are outlined below together with a report on progress towards
achieving these objectives:
Objectives for 2014 Initiatives Progress in achieving the objective
Increase the percentage of female
directorship on the board over the next
three years.
Female candidates to be actively considered for
any director vacancies that may arise.
Achieved in 2014.
A medium term goal (3-5 years) is to be
equal to, or better than, AWE’s peer group
with respect to its gender diversity mix
across the organisation.
A comparison of current gender split between
AWE and its peers shows that AWE is ranked in
the upper 50th percentile.
Achieved in 2013 and ongoing.
Increase the number of female senior
managers within its organisation through
appropriate succession planning and
recruitment.
Female staff continue to be represented at all
levels within the Company.
Several new Senior Technical & Professional
and also Technical & Professional positions
were fi lled by women during the last fi nancial
year including:
+ HSEQ Manager (Sydney)
+ Taxation Manager (Sydney)
+ Reservoir Engineer (Perth)
+ Geophysicist (Sydney)
+ Senior Financial Accountant (Sydney)
Achieved in 2014 and ongoing.
Increase the number of female graduates
joining the Company in the engineering
and G & G disciplines.
To raise awareness of the industry. AWE is
the premier sponsor of UNSW Engineering
Society and is the silver sponsor of the UNSW
Geoscience Faculty.
Ongoing consideration of prospective
female graduates as and when a
vacancy arises.
Support further education opportunities
for employees, including women, in
support of their career progression to
more senior positions.
A female employee, who fi rst joined the
Company as a Graduate Accountant before
being promoted to Corporate Accountant is
being sponsored to undertake her professional
qualifi cations to become a Chartered
Accountant through the Institute of Chartered
Accountants Australia and New Zealand.
AWE has launched its fi rst Women in
Leadership program with 12 female staff
participating in its inaugural year.
Achieved and ongoing.
Roll out Discrimination, Harassment
and Bullying Policy that will include
affi rmative action to promote diversity and
equal opportunity for women within the
organisation.
Target training for all staff members. Achieved and ongoing.
Increase the average length of service of
women in the workplace and track their
retention.
Through retention, increase length of service of
women in the workplace at AWE.
Retention levels for female staff have
been stable with 41% of the female
staff having been with the Company
for over 5 years.

62 AWE LIMITED ANNUAL REPORT 2014
It should be noted that diversity refers to other factors beyond
gender and the Company is proud of its achievements in other
areas of diversity. The Company’s Diversity Policy includes a
commitment to recruit and retain people regardless of factors
such as age, cultural, ethnic or religious background, gender,
nationality, physical ability or race. Further information on the
Company’s progress towards achieving an appropriate diversity
mix will be provided in the Company’s Sustainability Report.
ASX Principle 4 - Safeguard integrity in fi nancial reporting
The Board is committed to ensuring that the Company’s fi nancial
reports present a true and fair view of the Company’s fi nancial
position that comply with relevant accounting standards.
It is the responsibility of the Audit and Governance Committee to
assist the Board in discharging its responsibilities for fi nancial
reporting and to ensure that appropriate internal controls are
in place. For full details on the roles and responsibilities of the
Audit and Governance Committee and the processes in place for
safeguarding the integrity of the fi nancial reporting processes
please refer to commentary on the Audit and Governance
Committee in Principle 2 above.
Further, during the current period the Company developed and
implemented an internal audit plan, employing both internal
and external resources, to provide assurance in relation to the
effectiveness of internal controls, risk management procedures
and governance. Internal audit plans are to be approved annually
by the Audit and Governance Committee.
ASX Principle 5 - Make timely and balanced disclosure
The Board is committed to the promotion of investor confi dence in
the Company by ensuring that trading in the Company’s securities
takes place in a fully informed and effi cient market. The Company
has in place policies and procedures that are designed to ensure
compliance with ASX Listing Rule disclosure requirements
and to ensure accountability at a senior executive level for that
compliance. This disclosure policy includes processes for the
identifi cation of matters that may have a material effect on the
price of the Company’s securities, notifying such matters to the
ASX on a timely basis and posting these ASX releases immediately
on the Company’s website.
Briefi ngs with investors and analysts are held regularly and
processes are in place to ensure that any price sensitive
information included in such presentations is fi rst made available to
the market. The Company maintains a summary for internal use of
issues discussed at briefi ngs with investors and analysts, including a
record of those present and the time and place of the meeting.
The Company has in place a formal Disclosure Policy which
contains detailed processes for ensuring compliance with ASX
continuous disclosure and periodic disclosure requirements.
ASX Principle 6 - Respect the rights of shareholders
Shareholder communications
The Board aims to ensure that shareholders and investors have
equal access to the Company’s information.
The Company also has a strategy to promote effective
communication with shareholders and encourage effective
participation at general meetings through a policy of open
disclosure to shareholders, regulatory authorities and the
broader community of all material information with respect
to the Company’s affairs including, but not limited to:
+ confl icts of interest and related party transactions;
+ executive remuneration;
+ grant of and share rights;
+ external directorships;
+ process for performance evaluation of the Board, its
committees, and senior executives;
+ the link between remuneration paid to the Managing Director
and senior executives and corporate performance; and
+ shorter, more comprehensible notices of meetings.
The following information is communicated to shareholders:
+ the Annual Report and notices of meetings of shareholders
including the ability to receive notices of meetings and to lodge
proxy votes electronically;
+ for those shareholders not electing to be mailed a copy of the
Annual Report, a copy can be viewed on the Company’s website;
+ shareholders are given the opportunity to ask questions of the
Board, management or the auditor electronically prior to the
Annual General Meeting;
+ all documents that are released to the ASX are made
immediately available on the Company’s website and via the
website, shareholders may elect to receive notifi cation of all ASX
releases;
+ the Company webcasts key events such as profi t results and
Annual General Meetings;
+ all relevant shareholder information is made available on the
Company’s website including past ASX releases, annual reports,
quarterly reports, investor presentations and information on the
Company’s operational activities; and
+ all operational information on the Company’s website is updated
at least quarterly.
Further, all the material policies adopted by the Company
are available in the Corporate Governance section of the
Company’s website.
C O R P O R A T E G O V E R N A N C E S T A T E M E N T

63AWE LIMITED ANNUAL REPORT 2014
ASX Principle 7 – Recognise and manage risk
Risk management
AWE recognises the need to proactively manage the risks and
opportunities associated with both day-to-day operations of the
organisation and its longer term strategic objectives. AWE seeks
to achieve the following through its risk management framework:
+ Risks are well understood and managed proactively by those in
the organisation best able to deal with them.
+ Staff are actively involved in risk management activities.
Time is taken to discuss and explore risk issues with
colleagues that may not otherwise be addressed as part
of day-to-day management.
+ Risk reporting provides insight, accountability, and a trigger
for escalation of signifi cant risk issues.
+ Consistent use of language and risk scales across the
organisation enables prioritisation and comparison of risks
arising from different functional areas.
+ The organisation constantly strives to achieve effective
risk management best practice through adherence to risk
management standards, while retaining an adaptive approach
that evolves to meet the needs of the organisation.
While every person in the organisation has responsibility for
managing risk effectively, there are specifi c responsibilities
for providing oversight to ensure that risks are being managed
appropriately as follows:
+ The Board and delegated Board committees are responsible
for oversight of risk management activities within AWE. On an
annual basis the Board also undertakes a full review of the
material business risks facing the organisation.
+ The Company’s Senior Executive Committee is responsible for
reviewing summarised risk registers and preparing consolidated
risk reports of signifi cant risk issues arising for inclusion in
papers submitted to the Board and relevant Board Committees.
+ Managers are responsible for ensuring that each functional
area they oversee has identifi ed, assessed and are proactively
managing risks appropriately. Each functional area must
maintain a live risk register for documenting the results of this
risk management process.
The Board has identifi ed the following major sources of material
business risks for the organisation:
Risk category Overseen by Type of impact
Strategic AWE Board Financial
Reputational
Operational Sustainability
Committee
Safety
Environmental
Financial
Reputational
Corporate and
Governance
Audit and
Governance
Committee
Financial
Reputational
External Board oversight but
generally assumed
shareholders
accept these risks
Financial
Reputational
The organisation’s approach to risk management aligns with the
AS/NZS ISO 31000 Risk Management Principles and Guidelines.
For more information on how the Company implements risk
management, please refer to the Risk Policy which can be found
on AWE’s website. This policy was revised in October 2013.
The Managing Director and the Chief Financial Offi cer have
declared in writing to the Board that fi nancial reporting risk
management and associated compliance and controls have been
assessed and found to be operating effectively in all material
respects in relation to fi nancial reporting risks and such other
risks as specifi ed by the Board. This representation is made by
the Managing Director and Chief Financial Offi cer prior to the
directors’ approval of the release of the annual and half-yearly
accounts. This representation is made after enquiry of, and
representation by, appropriate levels of management.
Sustainability and environment
The Board and management are committed to developing and
building a sustainable business, ensuring that the Company is an
active and responsible member of the communities in which we
operate. Employees and contractors are encouraged to personally
support and implement the sustainability initiatives being pursued
by the Company and to contribute to identifying opportunities to
further improve our performance.
Based on the Company’s public disclosure materials for the
June 2013 fi nancial reporting year, the Australian Council of
Superannuation Investors has rated the Company’s disclosure
of environmental, social and corporate governance risks as
“Comprehensive”, the highest level achievable.
The Company’s commitment to sustainability is more fully detailed
in the June 2014 Sustainability Report.
Reserves reporting
The Company has formed a Reserves Committee reporting to the
Managing Director with the role of monitoring:
+ The integrity of the reporting of the Company’s oil and gas
reserves and resources (“reserves”);
+ Compliance by the Company with legal and regulatory
requirements with respect to reserves, especially in respect to
revised ASX rules effective December 2013;
+ The discharge of the Company’s responsibilities with respect to
annual and interim reviews of the Company’s reserves; and
+ The Company’s procedures with respect to the engagement of
independent reserves evaluators.
ASX Principle 8 – Remunerate fairly and responsibly
The Company is committed to adopting remuneration practices
that:
+ Align the interests of employees and shareholders;
+ Attract and retain suitably qualifi ed employees; and
+ Motivate employees to achieve superior performance.
It is the responsibility of the People Committee to assist the
Board in achieving these objectives. For full details on the roles
and responsibilities of the People Committee and the Company’s
remuneration practices please refer to the commentary on the
People Committee in Principle 2 above and to the Company’s June
2014 Remuneration Report.

64 AWE LIMITED ANNUAL REPORT 2014
C O R P O R A T E G O V E R N A N C E S T A T E M E N T
ASX Corporate governance principle and recommendations
The table below identifi es the Corporate Governance Principles and Recommendations (2nd Edition) and whether or not the Company has
complied with the recommendations during the reporting period:
Complied Note
1.1 Establish the functions reserved to the board and those delegated to senior management and disclose those functions
1.2 Disclose the process for evaluating the performance of senior executives
1.3 Provide the information indicated in Guide to Reporting on Principle 1
2.1 A majority of the board should be independent directors
2.2 The chair should be an independent director
2.3 The roles of chair and chief executive offi cer should not be exercised by the same individual
2.4 The board should establish a nomination committee -1-
2.5 Disclose the process for evaluating the performance of the board, its committees and individual directors
2.6 Provide the information indicated in Guide to Reporting on Principle 2
3.1 Establish a code of conduct and disclose the code or a summary of the code as to:
+ the practices necessary to maintain confi dence in the Company’s integrity the practices necessary to take into account their legal obligations and the reasonable expectations of their stakeholders
+ the responsibility and accountability of individuals for reporting and investigating reports of unethical practices
3.2 Establish a policy concerning diversity and disclose or a summary of that policy which should include requirements for the board to establish measurable objectives for achieving gender diversity for the board to assess annually both the objectives and progress in achieving them
3.3 Disclose in each annual report the measurable objectives for achieving gender diversity set by the board in accordance with the diversity policy and progress towards achieving them
3.4 Disclose in each annual report the proportion of women employees in the whole organisation, in senior executive positions and on the board
3.5 Provide the information indicated in Guide to Reporting on Principle 3
4.1 The board should establish an audit committee
4.2 Structure the audit committee so that it consists of:
+ only non-executive directors
+ a majority of independent directors
+ an independent chair, who is not chair of the board
+ at least three members
4.3 The audit committee should have a formal charter
4.4 Provide the information indicated in Guide to Reporting on Principle 4
5.1 Establish written policies designed to ensure compliance with ASX Listing Rule disclosure requirements and to ensure accountability at a senior executive level for that compliance and disclose those policies or a summary of those policies
5.2 Provide the information indicated in Guide to Reporting on Principle 5
6.1 Design a communications policy for promoting effective communication with shareholders and encouraging their participation at general meetings and disclose their policy or a summary of that policy
6.2 Provide the information indicated in Guide to Reporting on Principle 6
7.1 Companies should establish policies for the oversight and management of material business risks and disclose a summary of those policies
7.2 The board should require management to design and implement the risk management and internal control system to manage the company’s material business risks and report to it on whether those risks are being managed effectively. The board should disclose that management has reported to it as to the effectiveness of the company’s management of its material business risks
7.3 The board should disclose whether it has received assurance from the chief executive offi cer (or equivalent) and the chief fi nancial offi cer (or equivalent) that the declaration provided in accordance with section 295A of the Corporations Act is founded on a sound system of risk management and internal control and that the system is operating effectively in relation to fi nancial reporting risks
7.4 Provide the information indicated in Guide to Reporting on Principle 7
8.1 The board should establish a remuneration committee
8.2 The remuneration committee should be structured so that it:
+ consists of a majority of independent directors
+ is chaired by an independent chair
+ has at least three members
8.3 Clearly distinguish the structure of non-executive directors’ remuneration from that of executive directors and senior executives
8.4 Provide the information indicated in Guide to Reporting on Principle 8
Note 1: The Board of Directors of the Company does not have a nomination committee. The Board is of the opinion that due to the relatively small size of the Company’s Board and the specialised nature of the upstream oil and gas industry it is appropriate that the functions performed by a nomination committee be handled by the full Board.

65AWE LIMITED ANNUAL REPORT 2014
F I N A N C I A L S T A T E M E N T S
Consolidated income statementFor the year ended 30 June 2014
Note
30 June 2014
$’000
30 June 2013
$’000
Revenue 2 329,291 301,774
Cost of sales 3 (237,015) (220,862)
Gross profi t 92,276 80,912
Other income 4 97,609 2,930
Exploration and evaluation expenses 15 (39,806) (9,735)
Fair value adjustment on held for sale assets 14 (12,438) -
Other expenses 5 (31,128) (13,256)
Results from operating activities 106,513 60,851
Finance income 515 912
Finance costs (10,605) (10,332)
Net fi nance costs 6 (10,090) (9,420)
Profi t before tax 96,423 51,431
Income tax expense 7 (21,228) (14,913)
Royalty related taxation expense 7 (12,695) (16,481)
Profi t for the year 62,500 20,037
Profi t attributable to members of the Company 62,500 20,037
Cents Cents
Basic earnings per ordinary share (cents) 8 11.96 3.84
Diluted earnings per ordinary share (cents) 8 11.73 3.79
The above Consolidated income statement is to be read in conjunction with the notes to the fi nancial statements.

66 AWE LIMITED ANNUAL REPORT 2014
F I N A N C I A L S T A T E M E N T S
Consolidated statement of comprehensive incomeFor the year ended 30 June 2014
30 June 2014$’000
30 June 2013 $’000
Profi t for the year 62,500 20,037
Items that may be reclassifi ed subsequently to profi t and loss
Foreign currency translation differences for foreign operations (12,089) 11,776
Income tax relating to other comprehensive income - -
Other comprehensive (loss) / income (net of income tax) (12,089) 11,776
Total comprehensive income for the year 50,411 31,813
Total comprehensive income attributable to owners of the company 50,411 31,813
The above Consolidated statement of comprehensive income is to be read in conjunction with the notes to the fi nancial statements.

67AWE LIMITED ANNUAL REPORT 2014
Consolidated statement of fi nancial positionAs at 30 June 2014
Note
30 June 2014
$’000
30 June 2013
$’000
Current assets
Cash and cash equivalents 11 42,144 41,131
Trade and other receivables 12 33,101 57,023
Inventory 13 18,747 5,227
Held for sale assets 14 84,301 -
Total current assets 178,293 103,381
Non-current assets
Trade and other receivables 12 88,003 10,675
Exploration and evaluation assets 15 109,284 111,034
Oil and gas assets 16 802,054 926,782
Other plant and equipment 17 1,601 1,611
Intangible assets 18 348 52
Deferred tax assets 24 22,960 27,974
Total non-current assets 1,024,250 1,078,128
Total assets 1,202,543 1,181,509
Current liabilities
Trade and other payables 19 90,904 48,712
Employee benefi ts 21 2,331 3,957
Liabilities associated with assets held for sale 14 11,702 -
Provisions 22 17,127 20,169
Taxation payable 23 (209) 18,337
Total current liabilities 121,855 91,175
Non-current liabilities
Interest bearing liabilities 20 - 77,834
Employee benefi ts 21 614 346
Provisions 22 138,899 123,183
Total non-current liabilities 139,513 201,363
Total liabilities 261,368 292,538
Net assets 941,175 888,971
Equity
Issued capital 25 772,172 772,172
Reserves 12,549 22,845
Retained profi ts 156,454 93,954
Total equity 941,175 888,971
The above Consolidated statement of fi nancial position is to be read in conjunction with the notes to the fi nancial statements.

68 AWE LIMITED ANNUAL REPORT 2014
Consolidated statement of cash fl owsFor the year ended 30 June 2014
Note
30 June 2014
$’000
30 June 2013
$’000
Cash fl ows from operating activities
Cash receipts in the course of operations 375,558 311,153
Cash payments in the course of operations (176,303) (147,366)
Payments for exploration and evaluation expenses (30,583) (12,039)
Interest received 530 939
Borrowing costs paid (7,711) (6,502)
Income tax received/(paid) (6,157) (9,160)
Royalty related taxation paid (31,648) (18,835)
Net cash provided by operating activities 29 123,686 118,190
Cash fl ows from investing activities
Exploration and evaluation assets initially capitalised (9,754) (22,947)
Oil and gas assets (130,200) (151,867)
Other plant and equipment and intangibles (1,168) (1,080)
Payments for investments (7,184) -
Net proceeds from sale of oil and gas assets 86,751 -
Deposit received in relation to proposed sale of oil and gas assets 16,000 -
Proceeds from sale of plant and equipment - 114
Net cash used in investing activities (45,555) (175,780)
Cash fl ows from fi nancing activities
Proceeds from borrowings 5,000 85,200
Repayment of borrowings (82,834) (28,926)
Net cash provided/(used in) by fi nancing activities (77,834) 56,274
Net decrease in cash held 297 (1,316)
Cash at the beginning of the year 41,131 42,759
Effect of exchange rate fl uctuations on the balances of cash held in foreign currencies 31 716 (312)
Cash at the end of the year 11 42,144 41,131
The above Consolidated statement of cash fl ows is to be read in conjunction with the notes to the fi nancial statements.
F I N A N C I A L S T A T E M E N T S

69AWE LIMITED ANNUAL REPORT 2014
Consolidated statement of changes in equity For the year ended 30 June 2014
Share capital
$’000
Equity
compensation
reserve
$’000
Translation
reserve
$’000
Retained
earnings
$’000
Total equity
$’000
Balance at 1 July 2012 772,172 11,167 (2,234) 73,917 855,022
Profi t for the year ended 30 June 2013 - - - 20,037 20,037
Other comprehensive income
Foreign currency translation differences
for foreign operations
- - 11,776 - 11,776
Total other comprehensive income - - 11,776 - 11,776
Total comprehensive income for the year - - 11,776 20,037 31,813
Transactions with owners in their capacity as owners
Share Rights Plan - 2,136 - - 2,136
Balance at 30 June 2013 772,172 13,303 9,542 93,954 888,971
Profi t for the year ended 30 June 2014 - - - 62,500 62,500
Other comprehensive income
Foreign currency translation differences for foreign
operations
- - (12,089) - (12,089)
Total other comprehensive income - - (12,089) - (12,089)
Total comprehensive income for the year - - (12,089) 62,500 50,411
Transactions with owners in their capacity as owners
Share Rights Plan - 1,793 - - 1,793
Balance at 30 June 2014 772,172 15,096 (2,547) 156,454 941,175
The above Consolidated statement of changes in equity is to be read in conjunction with the notes to the fi nancial statements.

70 AWE LIMITED ANNUAL REPORT 2014
N O T E S T O T H E C O N S O L I D A T E D F I N A N C I A L S T A T E M E N T S
Notes to the consolidated fi nancial statements
1. Statement of signifi cant accounting policies
AWE Limited (the “Company”) is a for profi t company domiciled
in Australia. The consolidated fi nancial statements of the
Company for the fi nancial year ended 30 June 2014 comprises the
Company and its controlled entities (together referred to as the
“consolidated entity”).
(a) Basis of preparation
(i) Statement of compliance
The consolidated fi nancial statements are general purpose
fi nancial statements which have been prepared in accordance with
Australian Accounting Standards (“AASBs”) (including Australian
Interpretations) adopted by the Australian Accounting Standards
Board (“AASB”) and the Corporations Act 2001. The consolidated
fi nancial statements also comply with IFRSs and interpretations
issued but not yet adopted by the International Accounting
Standards Board.
The accounting policies set out in this note have been applied
consistently to all periods presented in these consolidated
fi nancial statements. Certain comparative amounts have been
reclassifi ed to conform with the current year’s presentation.
The consolidated fi nancial statements were authorised for issue
by the directors on 26 August 2014.
(ii) Functional and presentation currency
The fi nancial statements are presented in Australian Dollars,
which is the Company’s functional currency and the functional
currency of the majority of controlled entities within the
consolidated entity.
The Company is of a kind referred to in Class Order 98/100,
issued by the Australian Securities and Investments Commission
(“ASIC”), relating to the “rounding off” of amounts in the fi nancial
statements. Amounts in the fi nancial statements have been
rounded off in accordance with that Class Order to the nearest
thousand dollars, or in certain cases, the nearest dollar.
(iii) Basis of measurement
The fi nancial statements are prepared on the historical cost basis
except that derivative fi nancial instruments and available for sale
fi nancial assets are stated at their fair value.
(iv) Use of estimates and judgements
The preparation of fi nancial statements in conformity with
Australian Accounting Standards requires management to make
judgements, estimates and assumptions that affect the application
of policies and reported amounts of assets and liabilities, income
and expenses. The estimates and associated assumptions are
based on historical experience and various other factors that are
believed to be reasonable under the circumstances, the results
of which form the basis of making the judgements about carrying
values of assets and liabilities that are not readily apparent from
other sources. Actual results may differ from these estimates.
The estimates and underlying assumptions are reviewed on a
regular basis. Revisions to accounting estimates are recognised
in the period in which the estimate is revised if the revision affects
only that period, or in the period of the revision and future periods
if the revision affects both current and future periods.
The most signifi cant estimates and assumptions that have a
signifi cant risk of causing a material adjustment to the carrying
amounts of assets and liabilities within the next fi nancial year
relate to:
Exploration and evaluation assets
The consolidated entity’s accounting policy for exploration and
evaluation expenditure is set out at Note 1 (l). The application
of this policy necessarily requires management to make certain
estimates and assumptions as to future events and circumstances,
in particular, the assessment of whether economic quantities of
reserves have been found. Any such estimates and assumptions
may change as new information becomes available. If, after having
capitalised expenditure under this policy, management concludes
that the capitalised expenditure is unlikely to be recovered
by future exploitation or sale, then the relevant capitalised
amount will be written off to the income statement. Changes in
assumptions may result in a material adjustment to the carrying
amount of exploration and evaluation assets.
Restoration obligations
The consolidated entity estimates the future removal costs of
production facilities and wells at the time of installation of the
assets. In most instances, removal of assets occurs many years
into the future. This requires judgemental assumptions regarding
removal date, future environmental legislation, the extent of
reclamation activities required, the engineering methodology
for estimating cost, future removal technologies in determining
the removal cost, and asset specifi c discount rates to determine
the present value of these cash fl ows. The consolidated entity’s
accounting policy for restoration obligations is set out at Note 1(r).
Reserve estimates
Estimates of recoverable quantities of proven and probable
reserves reported include assumptions regarding commodity
prices, exchange rates, discount rates, production and
transportation costs for future cash fl ows. It also requires
interpretation of geological and geophysical models in order
to make an assessment of the size, shape, depth and quality
of reservoirs and their anticipated recoveries. The economic,
geological and technical factors used to estimate reserves may
change from period to period. Changes in reported reserves can
impact asset carrying values, the provision for restoration and
the recognition of deferred tax assets, due to changes in expected
future cash fl ows. Reserves are integral to the calculation of
depreciation and amortisation charged to the income statement.

71AWE LIMITED ANNUAL REPORT 2014
Impairment of oil and gas assets
The consolidated entity assesses whether oil and gas assets
are impaired when preparing its annual and interim fi nancial
statements. Estimates of the recoverable amount of oil and gas
assets are made based on the present value of future cash fl ows.
Income taxes
The consolidated entity is subject to income taxes in Australia
and jurisdictions where it has foreign operations. Signifi cant
judgement is required in determining the worldwide provision for
income taxes. There are certain transactions and calculations
undertaken during the ordinary course of business for which the
ultimate tax determination is uncertain. The consolidated entity
estimates its tax liabilities based on the application of the relevant
tax law. Where the fi nal tax outcome of these matters is different
from the amounts that were initially recorded, such differences
will impact the current and deferred income tax assets and
liabilities in the period in which such determination is made.
Share-based payment transactions
The consolidated entity measures the cost of equity-settled
transactions with employees by reference to the fair value of the
equity investments at the date on which they are granted.
(v) New and amended standards and interpretations
The following standards and interpretations which became
effective and were applied for the fi rst time during the year ended
30 June 2014 were assessed to have no material impact on the
Company:
AASB 10 Consolidated Financial statements
AASB 11 Joint Arrangements
AASB 12 Disclosure of Interests in Other Entities
AASB 13 Fair value Measurement
AASB 119 Employee Benefi ts
AASB 2012–2 Amendments to Australian Accounting Standards
– Disclosures - Offsetting Financial Assets and
Financial Liabilities
AASB 2012–5 Amendments to Australian Accounting Standards
Arising from Annual Improvements 2009 – 2011
Cycle
AASB 2012–9 Amendments to Australian Accounting Standards
Arising from the withdrawal of Australian
Interpretation 1039
AASB 2011-4 Amendments to Australian Accounting Standards
to Remove Individual Key Management Personnel
Disclosure Requirements
AASB1053 Application of tiers of Australian Accounting
Standards
The following recently issued standards and interpretations which
are not yet effective and have not been applied by the Company,
have been assessed to have no material impact on the Company:
AASB 2102–3 Amendments to Australian Accounting
standards – Offsetting Financial Assets and
Financial Liabilities
Interpretation 21 Levies
AASB 9 Financial Instruments
AASB 2013-3 Amendments to AASB136 – Recoverable
Amount disclosures for Non-Financial Assets
AASB 2013-4 Amendments to Australian Accounting
Standards – Novation of Derivatives and
Continuation of Hedge Accounting (AAS139)
AASB 2013-5 Amendments to Australian Accounting
Standards – Investment Entities
Annual Improvements
2011-2013 Cycle Annual Improvements to IFRSs 2011-2013
Cycle
AASB1031 Materiality
AASB 2013-9 Amendments to Australian Accounting
Standards – Conceptual Framework,
Materiality and Financial Instruments
(b) Basis of consolidation
(i) Controlled entities
Controlled entities are entities controlled by the Company. Control
exists when the Company has the power, directly or indirectly, to
govern the fi nancial and operating policies of an entity so as to
obtain benefi ts from its activities. In assessing control, potential
voting rights that presently are exercisable or convertible are taken
into account. The fi nancial statements of controlled entities are
included in the consolidated fi nancial statements from the date
that control commences until the date that control ceases.
Non-controlling interests in the results and equity of subsidiaries
are shown separately in the consolidated income statement,
statement of comprehensive income, statement of changes in
equity and statement of fi nancial position respectively.
(ii) Jointly controlled operations and assets
The interests of the Company and of the consolidated entity in
unincorporated joint ventures and jointly controlled assets are
brought to account by recognising in the fi nancial statements the
proportionate share of the assets they control, the liabilities and
expenses they incur, and their share of the income that they earn
from the sale of goods or services by the joint venture.
(iii) Transactions eliminated on consolidation
Intragroup balances and any unrealised gains and losses or
income and expenses arising from intragroup transactions, are
eliminated in preparing the consolidated fi nancial statements.

72 AWE LIMITED ANNUAL REPORT 2014
(iv) Changes in ownership interests
The consolidated entity treats transactions with non-controlling
interests that do not result in a loss of control as transactions with
equity owners of the consolidated entity. A change in ownership
interest results in an adjustment between the carrying amounts
of the controlling and non-controlling interests to refl ect their
relative interests in the subsidiary. Any difference between the
amount of the adjustment to non-controlling interests and any
consideration paid or received is recognised in a separate reserve
within equity attributable to owners of AWE Limited.
When the consolidated entity ceases to have control, joint
control or signifi cant infl uence, any retained interest in the entity
is adjusted to fair value with the change in carrying amount
recognised in profi t or loss. The fair value is the initial carrying
amount for the purposes of subsequently accounting for the
retained interest as an associate, jointly controlled entity or
fi nancial asset. In addition, any amounts previously recognised
in other comprehensive income in respect of that entity are
accounted for as if the consolidated entity had directly disposed
of the related assets or liabilities. This may mean that amounts
previously recognised in other comprehensive income are
reclassifi ed to the income statement.
If the ownership interest in a jointly-controlled entity or an
associate is reduced but joint control or signifi cant infl uence
is retained, only a portionate share of the amounts previously
recognised in other comprehensive income is reclassifi ed to the
income statement where appropriate.
(c) Business combinations
The acquisition method of accounting is used to account for all
business combinations, including business combinations involving
entities or businesses under common control, regardless of
whether equity instruments or other assets are acquired. The
consideration transferred for the acquisition of a subsidiary
comprises the fair values of the assets transferred, the liabilities
incurred and the equity interests issued by the consolidated entity.
The consideration transferred also includes the fair value of any
contingent consideration arrangement and the fair value of any
pre-existing equity interest in the subsidiary. Acquisition-related
costs are expensed as incurred. Identifi able assets acquired
and liabilities and contingent liabilities assumed in a business
combination are, with limited exceptions, measured initially at
their fair values at the acquisition date. On an acquisition-by-
acquisition basis, the consolidated entity recognises any non-
controlling interest in the acquiree either at fair value or at the
non-controlling interest’s proportionate share of the acquiree’s
net identifi able assets.
The excess of total consideration transferred over the fair value
of the consolidated entity’s share of the net identifi able assets
acquired is recorded as goodwill. If those amounts are less than
the fair value of the net identifi able assets of the subsidiary
acquired and the measurement of all amounts has been reviewed,
the difference is recognised directly in the income statement.
Where settlement of any part of cash consideration is deferred,
the amounts payable in the future are discounted to their present
value as at the date of exchange. The discount rate used is the
entity’s incremental borrowing rate, being the rate at which a
similar borrowing could be obtained from an independent fi nancier
under comparable terms and conditions.
Contingent consideration is classifi ed either as equity or a
fi nancial liability. Amounts classifi ed as a fi nancial liability are
subsequently remeasured to fair value with changes in fair value
recognised in profi t or loss.
(d) Foreign currency
(i) Foreign currency transactions
Transactions in foreign currencies are translated at the foreign
exchange rate at the date of the transaction. Monetary assets
and liabilities denominated in foreign currencies at the end of the
reporting period are translated at the foreign exchange rate ruling
at that date. Foreign exchange differences arising on translation
are recognised in the income statement. Non-monetary assets
and liabilities that are measured in terms of historical cost in a
foreign currency are translated using the exchange rate at the
date of the transaction. Non-monetary assets and liabilities
denominated in foreign currencies that are stated at fair value are
translated at foreign exchange rates ruling at the dates the fair
value was determined.
(ii) Financial statements of foreign operations
The assets and liabilities of foreign operations, including goodwill
and fair value adjustments arising on consolidation, are translated
to Australian dollars at foreign exchange rates at the end of the
reporting period. The revenues and expenses of foreign operations
are translated to Australian dollars at rates approximating the
foreign exchange rates at the dates of the transactions. Foreign
exchange differences arising on retranslation are recognised
directly in a separate component of equity.
(iii) Presentation of foreign exchange gains and losses in the
income statement
The consolidated entity presents its foreign exchange gains
and losses within net fi nancing income/expense in the income
statement.
(e) Impairment
The carrying amounts of the Company’s and the consolidated entity’s
assets, other than inventories (refer note 1(h)) and deferred tax assets
(refer note 1(u)), are reviewed at the end of the reporting period to
determine whether there is any indication of impairment. If any such
indication exists, the asset’s recoverable amount is estimated.
An impairment loss is recognised whenever the carrying amount of
an asset or its cash-generating unit exceeds its recoverable amount.
Calculation of recoverable amount
The recoverable amount of an asset is the greater of its fair
value less cost to sell and value in use. In assessing value in use,
the estimated future cash fl ows are discounted to their present
value using a post-tax discount rate that refl ects current market
assessments of the time value of money and the risks specifi c
to the asset. For an asset that does not generate independent
cash infl ows, the recoverable amount is determined for the cash-
generating unit to which the asset belongs.
N O T E S T O T H E C O N S O L I D A T E D F I N A N C I A L S T A T E M E N T S

73AWE LIMITED ANNUAL REPORT 2014
Reversals of impairment
An impairment loss is reversed if there has been a change in
the estimates used to determine the recoverable amount.
An impairment loss is reversed only to the extent that the asset’s
carrying amount does not exceed the carrying amount that would
have been determined, net of depreciation or amortisation, if no
impairment loss had been recognised.
(f) Cash and cash equivalents
Cash and cash equivalents comprise cash balances and call
deposits. Bank overdrafts that are repayable on demand and form
an integral part of the consolidated entity’s cash management
are included as a component of cash and cash equivalents for the
purpose of the statement of cash fl ows.
(g) Trade and other receivables
Trade receivables are recognised initially at fair value and
subsequently measured at amortised cost using the effective
interest method, less provision for impairment. Trade receivables
are generally due for settlement between 14 and 30 days.
Collectability of trade receivables is reviewed on an ongoing
basis. Debts which are known to be uncollectable are written off
by reducing the carrying amount directly. An allowance account
(provision for impairment of trade receivables) is used when
there is objective evidence that the consolidated entity will not be
able to collect all amounts due according to the original terms
of the receivables. Signifi cant fi nancial diffi culties of the debtor,
probability that the debtor will enter bankruptcy or fi nancial
reorganisation, and default or delinquency in payments are
considered indicators that the trade receivable is impaired. The
amount of the impairment allowance is the difference between the
asset’s carrying amount and the present value of estimated future
cash fl ows, discounted at the original effective interest rate. Cash
fl ows relating to short-term receivables are not discounted if the
effect of discounting is immaterial.
The amount of the impairment loss is recognised in profi t or
loss within other expenses. When a trade receivable for which
an impairment allowance had been recognised becomes
uncollectable in a subsequent period, it is written off against the
allowance account. Subsequent recoveries of amounts previously
written off are credited against other expenses in profi t or loss.
(h) Inventory
Oil inventory is recorded at the lower of cost and net realisable
value. Cost is determined on an average basis and includes
production costs and amortisation of producing oil and gas assets.
Other inventories are recorded at the lower of cost and net
realisable value. The cost of inventories is based on the fi rst-in
fi rst-out principle and includes expenditure incurred in acquiring
the inventories and bringing them to their existing location and
condition.
(i) Investments and other fi nancial assets
(i) Classifi cation
The consolidated entity classifi es its fi nancial assets in the
following categories: fi nancial assets at fair value through profi t
or loss, loans and receivables, held-to-maturity investments and
available-for-sale fi nancial assets. The classifi cation depends
on the purpose for which the investments were acquired.
Management determines the classifi cation of its investments at
initial recognition and, in the case of assets classifi ed as held-
to-maturity, re-evaluates this designation at the end of each
reporting period.
Financial assets at fair value through profi t or loss
A fi nancial asset is classifi ed as fair value through profi t or loss
if it is classifi ed as held for trading or is designated as such upon
initial recognition. A fi nancial asset is classifi ed in this category if
acquired principally for the purpose of selling in the short term.
Derivatives are classifi ed as held for trading unless they are
designated as hedges. Assets in this category are classifi ed as
current assets.
Loans and receivables
Loans and receivables are non-derivative fi nancial assets with
fi xed or determinable payments that are not quoted in an active
market. They are included in current assets, except for those with
maturities greater than 12 months which are classifi ed as non-
current assets. Loans and receivables are included in trade and
other receivables in the statement of fi nancial position.
(ii) Subsequent measurement
Loans and receivables and held-to-maturity investments are
carried at amortised cost using the effective interest method.
Available-for-sale fi nancial assets and fi nancial assets at fair value
through profi t or loss are subsequently carried at fair value.
Gains or losses arising from changes in the fair value of the
“fi nancial assets at fair value through profi t or loss” category are
presented in profi t or loss within other income or other expenses
in the period in which they arise. Dividend income from fi nancial
assets at fair value through profi t or loss is recognised in profi t
or loss as part of revenue from continuing operations when the
consolidated entity’s right to receive payments is established.
74 AWE LIMITED ANNUAL REPORT 2014
Changes in the fair value of monetary securities denominated
in a foreign currency and classifi ed as available-for-sale are
analysed between translation differences resulting from changes
in amortised cost of the security and other changes in the
carrying amount of the security. The translation differences
related to changes in the amortised cost are recognised in profi t
or loss, and other changes in carrying amount are recognised in
other comprehensive income. Changes in the fair value of other
monetary and non-monetary securities classifi ed as available-for-
sale are recognised in other comprehensive income.
When securities classifi ed as available-for-sale are sold,
the accumulated fair value adjustments recognised in other
comprehensive income are reclassifi ed to profi t or loss as gains
and losses from investment securities.
Details on how the fair value of fi nancial instruments is
determined are disclosed in note 31.
(iii) Impairment
The consolidated entity assesses at the end of each reporting
period whether there is objective evidence that a fi nancial asset is
impaired. In the case of equity securities classifi ed as available-
for-sale, a signifi cant or prolonged decline in the fair value of
a security below its cost is considered as an indicator that the
securities are impaired. If any such evidence exists for available-
for-sale fi nancial assets, the cumulative loss - measured as
the difference between the acquisition cost and the current fair
value, less any impairment loss on that fi nancial asset previously
recognised in the income statement - is reclassifi ed from equity
and recognised in the income statement as a reclassifi cation
adjustment. Impairment losses recognised in profi t or loss on
equity instruments classifi ed as available-for-sale are not reversed
through the income statement.
If there is evidence of impairment for any of the consolidated
entity’s fi nancial assets carried at amortised cost, the loss is
measured as the difference between the asset’s carrying amount
and the present value of estimated future cash fl ows, excluding
future credit losses that have not been incurred. The cash fl ows
are discounted at an appropriate rate. The loss is recognised in the
income statement.
(j) Asset held for sale
The Company classifi es non-current assets as held for sale if
the carrying amounts will be recovered principally through a sale
rather than through continuing use. Such assets are measured
at the lower of their carrying value and fair value less costs to
sell. The criteria for held for sale classifi cation is regarded as met
when the sale is highly probable and the asset or disposal group is
available for immediate sale and management must be suffi ciently
committed to the sale such that it will occur within 1 year.
(k) Property, plant and equipment
(i) Oil and gas assets
The cost of oil and gas producing assets and capitalised
expenditure on oil and gas assets under development are
accounted for separately and are stated at cost less accumulated
depreciation and impairment losses. Costs include expenditure
that is directly attributable to the acquisition or construction of the
item as well as past exploration and evaluation costs. In addition,
costs include:
i. the initial estimate at the time of installation and
during the period of use, when relevant, of the costs of
dismantling and removing the items and restoring the
site on which they are located, and
ii. changes in the measurement of existing liabilities
recognised for these costs resulting from changes in
the timing or outfl ow of resources required to settle the
obligation or from changes in the discount rate.
When an oil and gas asset commences production, costs carried
forward will be amortised on a units of production basis over the
life of the economically recoverable reserves. Changes in factors
such as estimates of economically recoverable reserves that affect
amortisation calculations do not give rise to prior fi nancial period
adjustments and are dealt with on a prospective basis.
Expenditure on major maintenance refi ts or overhauls comprises
the cost of replacement assets or parts of assets, inspection costs
and overhaul costs. Where an asset or part of an asset that was
separately depreciated and is now written off is replaced and it
is probable that future economic benefi ts associated will result,
the expenditure is capitalised. Where part of the asset was not
separately considered as a component, the replacement value
is used to estimate the carrying amount of the replaced assets
which is immediately written off. All other maintenance costs are
expensed as incurred.
(ii) Other plant and equipment
The cost of other plant and equipment is stated at cost less
accumulated depreciation and impairment losses. Costs include:
i. the initial estimate at the time of installation and
during the period of use, when relevant, of the costs of
dismantling and removing the items, and
ii. changes in the measurement of existing liabilities
recognised for these costs resulting from changes in
the timing or outfl ow of resources required to settle the
obligation or from changes in the discount rate.
Other plant and equipment is depreciated using the straight line
method over its estimated useful life. The depreciation rates used
for other plant and equipment are in the range 5% to 27% (2013:
5% to 27%).
N O T E S T O T H E C O N S O L I D A T E D F I N A N C I A L S T A T E M E N T S

75AWE LIMITED ANNUAL REPORT 2014
(l) Exploration and evaluation
Exploration and evaluation costs are accumulated in respect of
each separate area of interest and are accounted for using the
successful efforts method of accounting. An area of interest is
usually represented by an individual oil or gas fi eld.
The cost of acquisition of joint venture interests, successful drilling
costs and costs incurred in relation to feasibility studies and the
technical evaluation of a potential development are carried forward
where right to tenure of the area of interest is current and they are
expected to be recouped through sale or successful development
and exploitation of the area of interest, or where the assessment to
determine the existence of economically recoverable reserves for
a potential development in an area of interest is not yet complete.
Exploration and evaluation assets are reviewed for impairment
indicators annually. When an indicator is identifi ed, assessment is
performed for each area of interest to which the exploration and
evaluation expenditure is attributed. To the extent that capitalised
expenditure is not expected to be recovered it is charged to the
income statement.
All other exploration and evaluation costs, including pre-licence
costs are expensed as incurred.
(m) Capitalised borrowing costs
Borrowing costs relating to oil and gas assets under development
up to the date of commencement of operations are capitalised as
a cost of the development. Where funds are borrowed specifi cally
for qualifying projects the actual borrowing costs incurred are
capitalised. Where the projects are funded through general
borrowings the borrowing costs are capitalised based on the
weighted average borrowing rate. Other borrowing costs are
expensed.
(n) Intangible assets
The costs of computer software and loan establishment fees are
stated at cost less accumulated depreciation. Amortisation on
computer software is calculated on a straight-line basis over 2.5
years. Amortisation on loan establishment fees is calculated on a
straight-line basis over the life of the loan.
(o) Trade and other payables
These amounts represent liabilities for goods and services
provided to the consolidated entity prior to the end of the fi nancial
year which are unpaid. The amounts are unsecured and are
usually paid within 14 days of recognition.
(p) Interest-bearing borrowings
Interest-bearing borrowings are recognised at fair value.
Fees paid on the establishment of loan facilities are treated as
a prepayment and are recognised as such to the extent that it
is probable that the facility will be drawn down. These fees are
recognised as transaction costs relating to the loan and are
amortised over the period of the facility.
(q) Employee benefi ts
(i) Wages, salaries and annual leave
The provisions for employee entitlements to wages, salaries and
annual leave represents the amount which the consolidated entity
has a present obligation to pay resulting from employees’ services
provided up to the end of each reporting period. The provisions
have been calculated at undiscounted amounts based on wage and
salary rates that the consolidated entity expects to pay and include
related on-costs.
(ii) Long-term service benefi ts
Long service leave represents the present value of the estimated
future cash outfl ows to be made resulting from an employee’s
services provided to the end of each reporting period. The
provision is calculated using estimated future increases in
wage and salary rates including related on-costs and expected
settlement dates based on turnover history and is discounted
using the rates attaching to national government securities at
balance date which most closely match the terms of maturity of
the related liabilities.
(iii) Share-based payment transactions
Share-based compensation benefi ts are provided to employees via
the long-term Employee Share Rights Plan. Information relating to
these schemes is set out in the remuneration report as well note
21 of this report.
The fair value of the rights granted is measured using the
Black-Scholes Option Pricing model. In valuing the equity settled
transactions no account is taken of any performance conditions
other than conditions linked to market performance. The fair value
of rights granted is recognised as an employee expense with a
corresponding increase in equity or to the extent the share rights
are expected to be cash settled, with a corresponding increase in
liabilities. The Board has discretion regarding the settlement of
share rights into either AWE shares or cash.
The total expense is recognised over the vesting period, which is
the period over which all of the specifi ed vesting conditions are
to be satisfi ed. At the end of each period, the entity revises its
estimates of the number of rights and options that are expected
to vest based on the non-market and service related vesting
conditions. It recognises the impact of the revision to original
estimates, if any, in the income statement, with a corresponding
adjustment to equity.
(iv) Superannuation plans
Obligations for contributions to accumulation type superannuation
plans are recognised as an expense in the income statement as
incurred.
(r) Provisions
A provision is recognised in the statement of fi nancial position
when the consolidated entity has a present legal or constructive
obligation as a result of a past event, and it is probable that
an outfl ow of economic benefi ts will be required to settle the
obligation. If the effect is material, provisions are determined by
discounting the expected future cash fl ows at a pre-tax rate that
refl ects current market assessments of the time value of money
and, where appropriate, the risks specifi c to the liability.

76 AWE LIMITED ANNUAL REPORT 2014
Site restoration
Provisions made for decommissioning, restoration and
environmental rehabilitation are recognised where there is a
present obligation as a result of exploration, development or
production activities having been undertaken, and it is probable
that an outfl ow of economic benefi ts will be required to settle
the obligation. The estimated future obligations include the
costs of removing facilities, abandoning wells and restoring the
affected areas. The provision for future restoration costs is the
best estimate of the present value of the expenditure required to
settle the obligation at the end of each reporting period, based on
current legal requirements and technology. The ultimate costs are
uncertain and cost estimates can vary in response to many factors
including changes to relevant legal requirements, the emergence
of new techniques or experience at other production sites. Future
restoration costs are reviewed annually and any changes are
refl ected in the present value of the restoration provision at the
end of the reporting period. The amount of the provision for future
restoration costs relating to exploration and development activities
is capitalised as a cost of those activities. If the effect is material,
provisions are determined by discounting the expected future cash
fl ows at a pre-tax rate that refl ects current market assessments of
the time value of money, and where appropriate the risks specifi c
to the liability. The unwinding of discounting on the provision is
recognised as a fi nance cost.
(s) Revenue recognition
(i) Sales revenue
Revenue from the sale of oil and gas is recognised in the income
statement when the signifi cant risks and rewards of ownership
have been transferred to the buyer. Revenue received during the
commissioning phase of oil and gas assets is recorded, together
with the related costs of production, against the capitalised
carrying value of the asset.
Revenues received under take or pay sales contracts in respect of
undelivered volumes are accounted for as deferred revenue.
(ii) Other revenues
Other revenues are recognised on an accrual basis and include
royalty receipts and equipment rental income.
(t) Leased assets
Leases of property, plant and equipment where the consolidated
entity, as lessee, has substantially all the risks and rewards of
ownership are classifi ed as fi nance leases. Finance leases are
capitalised at the lease’s inception at the fair value of the leased
property or, if lower, the present value of the minimum lease
payments. The corresponding rental obligations, net of fi nance
charges, are included in other short-term and long-term payables.
Each lease payment is allocated between the liability and fi nance
cost. The fi nance cost is charged to profi t or loss over the lease
period so as to produce a constant periodic rate of interest on the
remaining balance of the liability for each period. The property, plant
and equipment acquired under fi nance leases is depreciated over the
asset’s useful life or over the shorter of the asset’s useful life and the
lease term if there is no reasonable certainty that the consolidated
entity will obtain ownership at the end of the lease term.
Leases in which a signifi cant portion of the risks and rewards of
ownership are not transferred to the consolidated entity as lessee
are classifi ed as operating leases and are not recognised on the
consolidated entity’s statement of fi nancial position. Payments
made under operating leases (net of any incentives received from
the lessor) are charged to profi t or loss on a straight-line basis
over the period of the lease.
(u) Taxation
(i) Income tax
Income tax on the income statement comprises current and
deferred tax. Income tax is recognised in the income statement
except to the extent that it relates to items recognised directly in
equity, in which case it is recognised in equity.
Current tax is the expected tax payable on the taxable income for
the year, using tax rates enacted or substantially enacted at the
end of the reporting period, and any adjustment to tax payable in
respect of previous years.
Deferred tax is provided using the balance sheet method, providing
for temporary differences between the carrying amounts of
assets and liabilities for fi nancial reporting purposes and the
amounts used for taxation purposes. The following temporary
differences are not provided for goodwill not deductible for tax
purposes, the initial recognition of assets or liabilities that affect
neither accounting nor taxable profi t, and differences relating
to investments in controlled entities to the extent that they will
probably not reverse in the foreseeable future. The amount
of deferred tax provided is based on the expected manner of
realisation or settlement of the carrying amount of assets and
liabilities, using tax rates enacted or substantively enacted at the
end of the reporting period.
A deferred tax asset is recognised only to the extent that it is
probable that future taxable profi ts will be available against which
the asset can be utilised. Deferred tax assets are reduced to the
extent that it is no longer probable that the related tax benefi t will
be realised.
Additional income taxes that arise from the distribution of
dividends are recognised at the same time as the liability to pay
the related dividend.
N O T E S T O T H E C O N S O L I D A T E D F I N A N C I A L S T A T E M E N T S

77AWE LIMITED ANNUAL REPORT 2014
(ii) Petroleum Resource Rent Tax (“PRRT”) and other
government royalties
In addition to corporate income taxes, the consolidated fi nancial
statements also include and disclose certain taxes determined
from oil and gas production and levied on net income.
Resource rent taxes and government royalties are treated as
taxation arrangements when they are imposed under Government
authority and when the calculation of the amount payable falls
within the defi nition of “taxable profi t” for the purposes of AASB
112. Current and deferred tax is then provided on the same basis
as described in (i) above.
Royalty arrangements that do not meet the criteria for treatment
as a tax are recognised on an accruals basis.
The Australian Government enacted legislation to extend the
PRRT regime to all onshore oil and gas projects, from 1 July 2012.
PRRT is applied to onshore and offshore oil and gas projects at
a rate of 40%. State petroleum royalties will continue to apply to
projects within state jurisdictions; however these royalties are fully
creditable against PRRT liabilities. The extended PRRT applies to
AWE’s onshore Perth basin operations.
Disclosures in relation to PRRT for the year ended 30 June 2014
in the consolidated fi nancial statements are in relation to both
onshore and offshore oil and gas projects.
(iii) Tax consolidation
The Company and its wholly-owned Australian resident entities
have formed a tax consolidated group with effect from 1 July 2003
and are therefore taxed as a single entity from that date. The head
entity within the tax-consolidated group is AWE Limited.
Current tax expense/income, deferred tax liabilities and deferred
tax assets arising from temporary differences of the members
of the tax-consolidated group are recognised in the separate
fi nancial statements of the members of the tax-consolidated group
using a modifi ed stand-alone tax allocation methodology.
Any current tax liabilities (or assets) and deferred tax assets
arising from unused tax losses of the controlled entities are
assumed by the head entity in the tax-consolidated group and are
recognised as amounts payable (receivable) to (from) other entities
in the tax-consolidated group in conjunction with any tax funding
arrangements.
The Company recognises deferred tax assets arising from unused
tax losses of the tax-consolidated group to the extent that it
is probable that future taxable profi ts of the tax-consolidated
group will be available against which the asset can be utilised.
Any subsequent period adjustments to deferred tax assets arising
from unused tax losses as a result of revised assessments of the
probability of recoverability is recognised by the head company only.
(iv) Nature of tax funding and tax sharing arrangements
The head entity, in conjunction with other members of the tax-
consolidated group, has entered into a tax funding arrangement
which sets out the funding obligations of members of the tax-
consolidated group in respect of tax amounts. The tax funding
arrangements require payments to/from the head entity equal to
the current tax liability (asset) assumed by the head entity and any
tax-loss deferred tax asset assumed by the head entity, resulting
in the head entity recognising an inter-entity receivable (payable)
equal in amount to the tax liability (asset) assumed. The inter-
entity receivable (payable) is at call.
(v) Goods and services tax
Revenue, expenses and assets are recognised net of the amount
of goods and services tax (“GST”), except where the amount of
GST incurred is not recoverable from the taxation authority. In
these circumstances, the GST is recognised as part of the cost of
acquisition of the asset or as part of the expense.
Receivables and payables are stated with the amount of GST
included. The net amount of GST recoverable from, or payable to,
the Australian Taxation Offi ce (“ATO”) is included as a current asset
or liability in the statement of fi nancial position.
Cash fl ows are included in the statement of cash fl ows on a gross
basis. The GST components of cash fl ows arising from investing
and fi nancing activities which are recoverable from, or payable to,
the ATO are classifi ed as operating cash fl ows.
(w) Australian Government’s carbon pricing mechanism
The Australian Government’s Clean Energy Act (CEA) was enacted
during the 2012 fi nancial year leading to a potential obligation,
from the 2013 fi nancial year, to acquire and surrender eligible
emission units in respect of the covered emissions from operated
and non-operated facilities under AWE’s existing joint venture
arrangements (or be liable to unit shortfall charges). The net cash
fl ows arising from liabilities arising under the CEA have been
included in operating costs and expected future net cash fl ows in
the estimated recoverable amount for assets when assessing their
carrying values; however the impact on the recoverable amount is
not material.
Subsequent to year-end this legislation was repealed effective
from 1 July 2014.

78 AWE LIMITED ANNUAL REPORT 2014
(x) Segment reporting
An operating segment is a component of the consolidated entity
that engages in business activities from which it may earn
revenues and incur expenses, including revenues and expenses
that relate to transactions with any of the consolidated entity’s
other components. An operating segment’s operating results
are reviewed regularly by the chief operating decision maker to
make decisions about resources to be allocated to the segment
and assess its performance, and for which discrete fi nancial
information is available.
Segment results that are reported to the chief operating decision
maker include items directly attributable to a segment as well as
those that can be allocated on a reasonable basis.
Segment assets include both oil and gas assets, exploration assets
and other assets, such as cash, receivables and inventory, which
are directly attributable to the segment.
Unallocated items comprise mainly head offi ce income and
expenses, foreign exchange gains and losses and corporate
assets.
(y) Contributed equity
Ordinary shares are classifi ed as equity. Incremental costs directly
attributable to the issue of new shares, share rights or options
are shown in equity as a deduction, net of tax, from the proceeds.
Incremental costs directly attributable to the issue of new shares,
share rights or options for the acquisition of a business are not
included in the cost of the acquisition as part of the purchase
consideration.
If the entity reacquires its own equity instruments, for example, as
the result of a share buy-back, those instruments are deducted
from equity and the associated shares are cancelled. No gain
or loss is recognised in profi t or loss and the consideration paid
including any directly attributable incremental costs (net of income
taxes) is recognised directly in equity.
(z) Dividends
Provision is made for the amount of any dividend declared,
being appropriately authorised and no longer at the discretion
of the entity, on or before the end of the reporting period but not
distributed at the end of the reporting period.
(aa) Earnings per share
(i) Basic earnings per share
Basic earnings per share is calculated by dividing the profi t
attributable to owners of the Company by the weighted average
number of ordinary shares outstanding during the fi nancial year.
(ii) Diluted earnings per share
Diluted earnings per share adjusts the fi gures used in the
determination of basic earnings per share to take into account the
weighted average number of additional ordinary shares that would
have been outstanding assuming the conversion of all dilutive
potential ordinary shares.
N O T E S T O T H E C O N S O L I D A T E D F I N A N C I A L S T A T E M E N T S

79AWE LIMITED ANNUAL REPORT 2014
2014
$’000
2013
$’000
2. Revenue
Sales revenue - oil and gas 328,250 300,509
Other revenue from continuing operations 1,041 1,265
329,291 301,774
3. Cost of sales
Production costs 105,307 98,807
Royalties 20,137 15,948
Amortisation 125,378 103,838
Movement in oil inventory:
Production costs (6,004) 1,087
Amortisation (7,803) 1,182
237,015 220,862
Made up of:
Production costs (net of movement in oil inventory) 99,303 99,894
Royalties 20,137 15,948
Amortisation (net of movement in oil inventory) 117,575 105,020
237,015 220,862
4. Other income
Net gain on disposal of 50% of the Northwest Natuna PSC 96,683 -
Other income 926 2,930
97,609 2,930
On the 22nd of November 2013 AWE completed the sale of a 50% participating interest in the Northwest Natuna PSC to a subsidiary of
Santos Limited for USD$188 million which comprised an upfront cash consideration of USD$100 million and deferred consideration of
USD$88 million through a capital expenditure carry. Included within the $86.5 million non-current trade and other receivables balance is
an amount of $79.8 million in respect of the capital expenditure carry refl ecting its fair value. The sale generated a profi t after tax of $75.5
million (pre-tax profi t $96.7million, taxation expense $21.2 million).
5. Other expenses
General and administrative expenses 17,794 10,703
Share-based payments 2,549 2,553
Restoration expense non-producing fi elds 3,645 -
Business development and other project costs 2,868 -
Restructuring costs 4,272 -
31,128 13,256
6. Net fi nancing (expense)/income
Interest income 515 912
Borrowing costs (7,378) (7,810)
Unwinding of discount – restoration provisions (refer note 22) (2,189) (2,155)
Adjustment of discount - capital expenditure carry (460) -
Net foreign exchange gain/(loss) (578) (367)
Finance costs (10,605) (10,332)
Net fi nance expense (10,090) (9,420)

80 AWE LIMITED ANNUAL REPORT 2014
2014
$’000
2013
$’000
7. Taxation expense
Recognised in income statement
Tax expense comprises:
Income tax
Current tax expense (11,851) (8,215)
Adjustments from prior years 714 2,126
Tax expense related to movements in deferred tax balances (10,091) (8,824)
(21,228) (14,913)
PRRT / APR(1)
Current tax expense (19,477) (19,427)
Tax benefi t related to movements in deferred tax balances 6,782 2,946
(12,695) (16,481)
Tax expense reported in the consolidated income statement (33,923) (31,394)
Numerical reconciliation between loss before tax and tax (expense)/benefi t:
Profi t/(loss) before tax 96,423 51,431
Prima facie taxation expense at 30% (2013: 30%) (28,927) (15,429)
(Increase)/decrease in income tax expense due to:
Differences in tax rates 12,053 -
Non-deductible expenses (7,044) (1,459)
Overseas tax losses not recognised as a deferred tax asset (2,619) (740)
Derecognition of tax losses - (4,276)
Foreign exchange and other translation adjustments (1,229) (562)
Other 5,823 5,427
Adjustments for prior years 715 2,126
Income tax expense (21,228) (14,913)
PRRT(1) (10,178) (5,453)
APR(1) (2,517) (11,028)
Total royalty-related tax expense (12,695) (16,481)
Total tax expense (33,923) (31,394)
For information in relation to taxation payments made during the fi nancial year refer to the Consolidated Statement of Cash Flows.
For further information in relation to tax payable and deferred tax assets and liabilities refer to note 24.
1. As a producer of oil and gas in Australian and New Zealand offshore waters, the consolidated entity is subject to, in addition to income tax, additional government imposts in the form of PRRT in Australia and APR in New Zealand. PRRT is levied on Australian offshore oil and gas production operations and from 1 July 2012 to onshore operation at a rate of 40% of project profi ts after allowing for the recoupment of past deductible project costs and after appropriate compounding of these past costs. Further, subject to the satisfaction of certain tests, exploration costs incurred by the consolidated entity in Australia can be transferred to PRRT payable projects thereby having the effect of reducing or deferring the actual liability to pay PRRT. Similarly, APR is levied on the Tui production operation in New Zealand at a rate of 20% of project profi ts after allowing for the recoupment of past deductible project costs. These past project costs are not compounded and exploration costs incurred outside of the Tui project cannot be transferred to the Tui project. PRRT and APR are deductible for income tax purposes in Australia and New Zealand respectively.
N O T E S T O T H E C O N S O L I D A T E D F I N A N C I A L S T A T E M E N T S

81AWE LIMITED ANNUAL REPORT 2014
2014
$’000
2013
$’000
8. Earnings per share
Earnings used in calculating earnings per share
Basic & diluted earnings - from continuing operations 62,500 20,037
Weighted average number of ordinary shares used as the denominator
2014
Number
2013
Number
Issued ordinary shares - opening balance 522,116,985 521,871,941
Effect of shares issued 261,921 158,723
Weighted average number of ordinary shares 522,378,906 522,030,664
Weighted average number of ordinary shares (diluted)
Weighted average number of ordinary shares at 30 June 522,378,906 522,030,664
Effect of employee rights on issue 10,605,205 7,300,595
Weighted average number of ordinary shares adjusted for effect of dilution 532,984,111 529,331,259
2014
Cents
2013
Cents
Basic earnings per share from continuing operations attributable to the ordinary
equity holders of the company
11.96 3.84
Diluted earnings per share from continuing operations attributable to the ordinary
equity holders of the company
11.73 3.79
9. Auditors’ remuneration
Ernst & Young
2014
$
2013
$
Audit services - auditor of the Company
Audit and review of fi nancial reports 398,151 410,915
Taxation Services
Taxation compliance services 95,000 87,653
Other Services
Advisory and assurance services 63,357 222,372
Total remuneration of Ernst & Young 556,508 720,940

82 AWE LIMITED ANNUAL REPORT 2014
10. Segment reporting
(a) Description of segments
Management has determined the operating segments based on the reports reviewed by the chief operating decision maker that are used
to make strategic decisions. The chief operating decision maker considers the business from both a product and a geographic perspective
and on this basis has identifi ed six reportable segments. For each reportable segment, the chief operating decision maker reviews
internal management reports on at least a monthly basis. The following summary describes the operations in each of the consolidated
entity’s reportable segments:
South East Australia Production and sale of gas, condensate and LPG from the BassGas (T/L1, Bass Basin, offshore southern
Australia) and Casino gas (VIC/L 24, Otway Basin, offshore southern Australia) projects.
Western Australia Production and sale of crude oil, gas and condensate from the Cliff Head oil project (WA 31 L, Perth Basin,
offshore Western Australia) and oil and gas fi elds in the Perth Basin, onshore, Western Australia.
New Zealand Production and sale of crude oil from the Tui Area oil project (PMP 38158, offshore Taranaki Basin, New
Zealand).
USA Production and sale of gas, LNG and condensate from the Sugarloaf AMI (Texas, United States of America).
Indonesia Predominantly comprising the development asset comprising a 50% in the Ande Ande Lumut (AAL) oil fi eld.
Exploration Activities Exploration and evaluation activities within the production licences and exploration permits held by AWE.
N O T E S T O T H E C O N S O L I D A T E D F I N A N C I A L S T A T E M E N T S

83AWE LIMITED ANNUAL REPORT 2014
South East Australia
Western Australia New Zealand USA Indonesia
Exploration Activities Total
2014$’000
2013$’000
2014$’000
2013$’000
2014$’000
2013$’000
2014$’000
2013$’000
2014$’000
2013$’000
2014$’000
2013$’000
2014$’000
2013$’000
Sales revenue
124,537 82,781 68,303 79,555 61,561 82,947 73,849 55,226 - - - - 328,250 300,509
Production costs
(39,129) (41,302) (29,719) (29,532) (20,172) (21,947) (10,283) (7,105) - - - (8) (99,303) (99,894)
Royalties (102) (38) (730) (1,112) (511) (967) (18,794) (13,831) - - - - (20,137) (15,948)
Segment result before amortisation and impairment 85,306 41,441 37,854 48,911 40,878 60,033 44,772 34,290 - - - (8) 208,810 184,667
Exploration and evaluation expenses
- - - - - - - - - - (39,806) (9,735) (39,806) (9,735)
Amortisation (59,293) (41,383) (13,008) (19,643) (22,607) (16,903) (22,667) (27,091) - - - - (117,575) (105,020)
Fair value adjustment (12,438) - - - - - - - - - - - (12,438) -
Reportable segment profi t / (loss) 13,575 58 24,846 29,268 18,271 43,130 22,105 7,199 - - (39,806) (9,743) 38,991 69,912
Unallocated income/(expenses)
Other revenue
1,041 1,265
Other income
97,609 2,930
Net fi nancing expense
(10,090) (9,420)
Other Expenses
(31,128) (13,256)
Net profi t before income tax
96,423 51,431
Segment Assets:
Oil and gas assets
348,247 478,863 76,540 87,223 122,602 56,915 163,852 147,932 90,813 155,849 - - 802,054 926,782
Exploration assets
- - - - - - - - - - 109,284 111,034 109,284 111,034
Assets held for sale
84,301 - - - - - - - - - - - 84,301 -
Other assets 8,756 5,558 3,900 2,178 23,654 7,652 - - 4,312 6,948 - - 40,622 22,336
441,304 484,421 80,440 89,401 146,256 64,567 163,852 147,932 95,125 162,797 109,284 111,034 1,036,261 1,060,152
Corporate and unallocated assets
166,282 121,357
Total assets 1,202,543 1,181,509
10 Segment reporting (continued)
(b) Segment information provided to the chief operating decision maker for the year ending 30 June

84 AWE LIMITED ANNUAL REPORT 2014
2014
$’000
2013
$’000
10. Segment reporting (continued)
(c) Major customers
The consolidated entity had revenues from four external customers that each represents greater than 10% of total sales revenue, and
when combined represent 78% of total sales revenue (2013: four external customers; 75%):
Revenues from major customers by segment
New Zealand 61,561 82,948
South East Australia 124,537 82,780
Western Australia 68,303 60,787
254,401 226,515
11. Cash and cash equivalents
Bank balances 13,053 7,780
Call deposits 13,759 22,146
Cash held by joint ventures 15,332 11,205
42,144 41,131
12. Trade and other receivables
Current
Trade debtors 22,039 48,010
Less: Provision for doubtful debts - -
Net trade debtors 22,039 48,010
Interest receivable - 16
Joint venture debtors 6,945 4,363
Other debtors 2,076 2,255
Prepayments 2,041 1,439
Other - 940
Total other receivables 11,062 9,013
Total current trade and other receivables 33,101 57,023
Non-current
Prepayments 1,520 1,949
Other receivables 86,483 8,726
Total non-current trade and other receivables 88,003 10,675
Trade receivables are non–interest bearing and are generally on terms of 30 days. All trade and other receivable are carried at values
approximating fair value. Refer note 31 for further details regarding how the Company manages credit risk.
Included within non-current receivables is $79.8 million related to the capital expenditure carry from Santos Limited in connection with
the sale of 50% interest in the Northwest Natuna PSC (refer note 4) and VAT recoverable related to Indonesian development assets.
13. Inventory
Oil (at cost) 14,996 1,541
Spares and consumables 3,751 3,686
18,747 5,227
N O T E S T O T H E C O N S O L I D A T E D F I N A N C I A L S T A T E M E N T S

85AWE LIMITED ANNUAL REPORT 2014
2014
$’000
2013
$’000
14. Held for sale assets
Assets classifi ed as held for sale
Exploration assets 5,881 -
Oil and gas assets 89,626 -
Fair value adjustment on held for sale assets (12,438) -
Other 1,232 -
84,301 -
Liabilities directly associated with assets classifi ed as held for sale
Restoration and abandonment provision (11,702) -
Net asset held for sale 72,599 -
On 24 January 2014 the Company executed a contract for the sale of a 9.75% interest in T/18P (Exploration asset associated with BassGas)
and a 12.5% interest in T/L1 (Production asset associated with BassGas). As at 30 June 2014 the sale remains subject to a number of
conditions precedent, therefore the underlying assets and associated liabilities are treated as being held for sale until such time that all
the conditions precedent are satisfi ed.
Fair value adjustment related to held for sale assets
As a consequence of the sale agreement a fair value adjustment has been recognised on the relevant exploration and oil and gas assets
related to T/18P and T/L1. These were previously valued on a value in use basis rather than fair value less costs to sell. This adjustment
amounted to pre-tax $12.4 million ($8.3 million after tax).
15. Exploration and evaluation assets
Exploration and evaluation assets 109,284 111,034
Reconciliation of movement:
Opening balance 111,034 84,154
Additions (net of amount recovered from joint ventures) 44,277 34,420
Exploration costs incurred and expensed during the year (39,806) (9,735)
Transfer to asset held for sale (note 14) (5,881) -
Foreign exchange translation difference (340) 2,195
Carrying amount at the end of the fi nancial year 109,284 111,034
The recoverability of the carrying amounts of exploration and evaluation assets is dependent on the successful development and
commercial exploitation or sale of the respective area of interest.
There were no disposals or impairments charged in 2013.
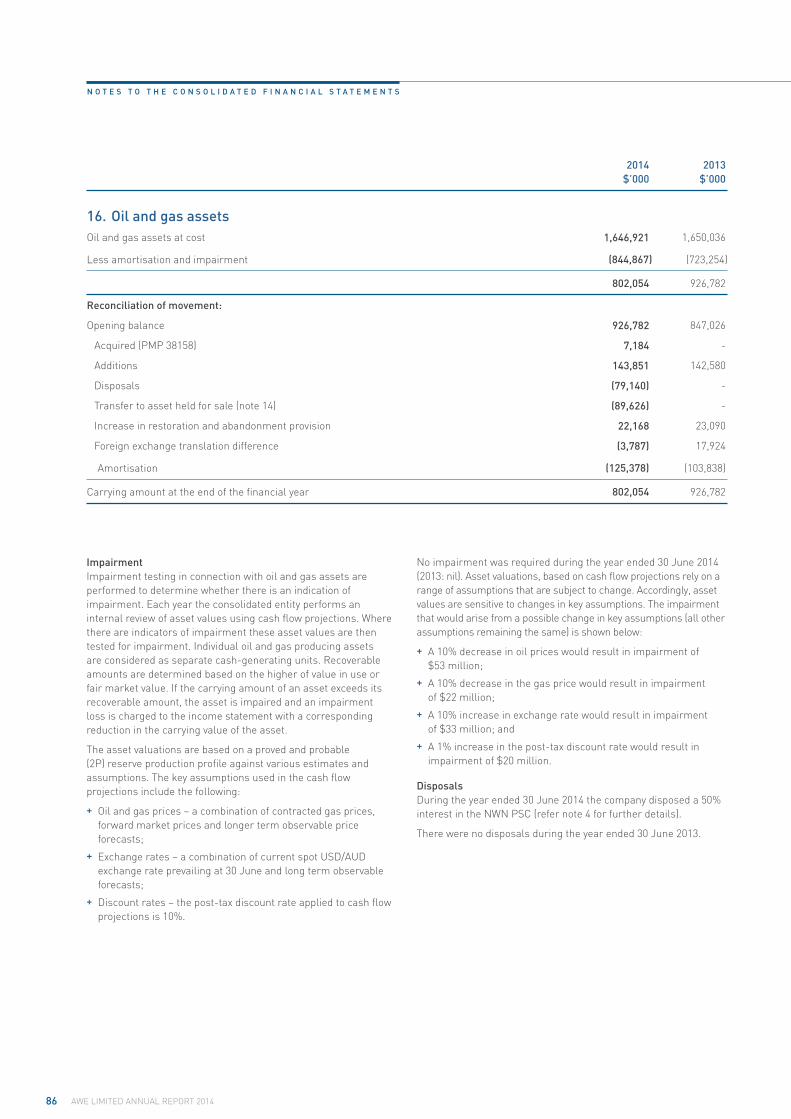
86 AWE LIMITED ANNUAL REPORT 2014
2014
$’000
2013
$’000
16. Oil and gas assets
Oil and gas assets at cost 1,646,921 1,650,036
Less amortisation and impairment (844,867) (723,254)
802,054 926,782
Reconciliation of movement:
Opening balance 926,782 847,026
Acquired (PMP 38158) 7,184 -
Additions 143,851 142,580
Disposals (79,140) -
Transfer to asset held for sale (note 14) (89,626) -
Increase in restoration and abandonment provision 22,168 23,090
Foreign exchange translation difference (3,787) 17,924
Amortisation (125,378) (103,838)
Carrying amount at the end of the fi nancial year 802,054 926,782
Impairment
Impairment testing in connection with oil and gas assets are
performed to determine whether there is an indication of
impairment. Each year the consolidated entity performs an
internal review of asset values using cash fl ow projections. Where
there are indicators of impairment these asset values are then
tested for impairment. Individual oil and gas producing assets
are considered as separate cash-generating units. Recoverable
amounts are determined based on the higher of value in use or
fair market value. If the carrying amount of an asset exceeds its
recoverable amount, the asset is impaired and an impairment
loss is charged to the income statement with a corresponding
reduction in the carrying value of the asset.
The asset valuations are based on a proved and probable
(2P) reserve production profi le against various estimates and
assumptions. The key assumptions used in the cash fl ow
projections include the following:
+ Oil and gas prices – a combination of contracted gas prices,
forward market prices and longer term observable price
forecasts;
+ Exchange rates – a combination of current spot USD/AUD
exchange rate prevailing at 30 June and long term observable
forecasts;
+ Discount rates – the post-tax discount rate applied to cash fl ow
projections is 10%.
No impairment was required during the year ended 30 June 2014
(2013: nil). Asset valuations, based on cash fl ow projections rely on a
range of assumptions that are subject to change. Accordingly, asset
values are sensitive to changes in key assumptions. The impairment
that would arise from a possible change in key assumptions (all other
assumptions remaining the same) is shown below:
+ A 10% decrease in oil prices would result in impairment of
$53 million;
+ A 10% decrease in the gas price would result in impairment
of $22 million;
+ A 10% increase in exchange rate would result in impairment
of $33 million; and
+ A 1% increase in the post-tax discount rate would result in
impairment of $20 million.
Disposals
During the year ended 30 June 2014 the company disposed a 50%
interest in the NWN PSC (refer note 4 for further details).
There were no disposals during the year ended 30 June 2013.
N O T E S T O T H E C O N S O L I D A T E D F I N A N C I A L S T A T E M E N T S

87AWE LIMITED ANNUAL REPORT 2014
2014
$’000
2013
$’000
17. Other plant and equipment
Other plant and equipment (at cost) 5,410 4,925
Less accumulated depreciation (3,809) (3,314)
1,601 1,611
Reconciliation of the movement in other plant and equipment:
Opening balance 1,611 1,887
Additions 605 259
Depreciation (615) (535)
Carrying amount at the end of the fi nancial year 1,601 1,611
18. Intangible assets
Intangible assets (at cost) 3,082 2,682
Less accumulated amortisation (2,734) (2,630)
348 52
Reconciliation of the movement in intangible assets:
Computer software
Opening balance 52 133
Additions 398 2
Amortisation (102) (83)
Carrying amount at the end of the fi nancial year 348 52
19. Trade and other payables
Current
Trade payables 197 148
Joint venture creditors 48,128 30,996
Other payables and accrued expenses 26,579 17,568
Deposit received in connection with asset held for sale 16,000 -
90,904 48,712
20. Interest-bearing liabilities
Bank loans - unsecured - 77,834
- 77,834
The consolidated entity has access to the following lines of credit:
Bank loans - unsecured 300,000 300,000
Facilities utilised at balance date - 77,834
Facilities not utilised at balance date 300,000 222,166
300,000 300,000
During December 2013 AWE executed a $300 million unsecured multicurrency syndicated bank loan facility which replaced the existing
bilateral loan facilities. The facility is for general corporate purposes and bears interest at the applicable base rate plus a margin. The
new facility expires in December 2017. At 30 June 2014 no borrowings had been drawn under the facility. At 30 June 2013, under the terms
of the previous facility $77.8 million had been drawn down.
Unamortised loan establishment fees of $2.1 million associated with the new facility are classifi ed as an asset and have been included
in current and non-current prepayments. These fees are amortised over the life of the facility. In prior periods loan establishment fees
were netted off against the interest bearing liability. Comparative information relating to loan establishment fees have been reclassifi ed
to prepayments for consistency with current period disclosure. During the period unamortised loan establishment fees of $1.5 million
associated with the previous facility were written off in full.

88 AWE LIMITED ANNUAL REPORT 2014
2014
$’000
2013
$’000
21. Employee benefi ts
Current
Provision for employee benefi ts 2,331 3,957
Non-current
Provision for employee benefi ts 614 346
(a) Superannuation plans
The consolidated entity makes contributions to complying accumulation type superannuation plans nominated by individual employees.
The consolidated entity contributes at least the amount required by law. The amount recognised as an expense was $978,001 for the
fi nancial year ended 30 June 2014 (2013: $760,600).
(b) Employee benefi ts expensed
Salaries and wages and other associated personnel costs are allocated to various income statement
categories based on the function of the expenditure.
Salaries and wages 26,732 23,567
Share-based payments 2,549 2,553
Other associated personnel costs 8,472 6,032
37,753 32,152
N O T E S T O T H E C O N S O L I D A T E D F I N A N C I A L S T A T E M E N T S

89AWE LIMITED ANNUAL REPORT 2014
Rights granted from the June 2013 Financial Year (1)
AWE TSR % of rights to vest
‹ 8% pa compound -
8% pa compound 25%
›8% and ‹10% pa compound Pro rata
10% pa compound 50%
›10% and ‹12% pa compound Pro rata
12% pa compound 100%
Rights granted up to the June 2012 Financial Year(2)
AWE TSR % of rights to vest
‹ 6% pa compound -
6% pa compound 25%
›6% and ‹9% pa compound Pro rata
9% pa compound 50%
›9% and ‹12% pa compound Pro rata
12% pa compound 100%
1. Performance hurdles increased
2. Tested for vesting in fi nancial years up to 30 June 2014
Relative TSR Grants
+ Number of rights calculated using the 30-day VWAP of AWE share
price in June of grant year.
+ Vest after three years according to the Company’s TSR relative to
comparable companies in ASX Energy300 Index in grant year as
per the table below.
+ The vesting scales to apply for Relative TSR grants are as follows:
The Board determines annually in advance the appropriate
comparator group to apply to Relative TSR grants for the following
3 year period.
Rights granted from the June 2013 Financial Year (1)
AWE TSR relative to TSR of
companies in S&P/ASX Energy
Index at date of grant % of rights to vest
‹ 50% -
50% 25%
›50% and ‹90% Pro rata
90% and above 100%
Rights granted up to the June 2012 Financial Year(2)
AWE TSR relative to TSR of
companies in S&P/ASX Energy
Index at date of grant % of rights to vest
‹ 50% -
50% 50%
›50% and ‹75% Pro rata
75% and above 100%
1. Performance hurdles increased
2. Tested for vesting in fi nancial years up to 30 June 2014
21. Employee benefi ts (Continued)
(c) Share-based payments – Share Rights Plan
The employee Share Rights Plan is designed to generate
performance-based cash awards that may be converted, at the
Board’s discretion, into AWE shares or cash. The key elements of
the plan include:
+ Rights are granted each year and the number of rights granted
will be determined by the employee’s level in the Company, fi xed
remuneration at the time of grant and both the Company and
employee’s performance in the previous fi nancial year;
+ There are three tranches of rights with separate vesting criteria:
− Retention(1);
− Absolute TSR(2); and
− Relative TSR.
+ The vesting period is for three years, the rights will lapse after three
years and there will be no retesting.
+ Rights granted in any particular fi nancial year are tested for vesting
over the three year period commencing 1 July of grant year.
1. Retention rights are not granted to the Managing Director.
2. TSR refers to ‘Total Shareholder Return’ and is defi ned as the percentage change over a period in shareholder value due to share price movement and dividends paid assuming dividends are reinvested into AWE shares.
The conditions for the award of rights and the criteria for vesting are:
Retention Grants
+ Number of rights calculated using the 30-day VWAP of the
AWE share price in June of grant year.
+ Vest after three years if the employee remains employed
by AWE.
Absolute TSR Grants
+ Number of rights calculated using the 30-day VWAP of the
AWE share price in June of grant year.
+ Vest after three years according to the Company’s Absolute
TSR for that three year period.
+ The vesting scales to apply for Absolute TSR grants are as follows:

90 AWE LIMITED ANNUAL REPORT 2014
Grant date
Vesting
date
Opening
balance Granted Vested Lapsed
Closing
balance
AWE share price
at date of issue
As at 30 June 2014
3-Dec-10 30-Jun-13 344,645 - (344,645) - - $1.74
25-Jun-11 30-Jun-13 82,006 - (82,006) - - $1.21
30-Jun-11 30-Jun-13 230,062 - (227,987) (2,075) - $1.28
16-Sep-11 30-Jun-14 2,947,111 - - (261,499) 2,685,612 $1.04
31-Oct-11 30-Jun-14 162,850 - - - 162,850 $1.39
24-Nov-11 30-Jun-14 916,032 - - - 916,032 $1.25
22-Nov-12 30-Jun-15 331,474 - - - 331,474 $1.34
4-Dec-12 30-Jun-15 2,241,677 - - (187,221) 2,054,456 $1.30
28-Jun-13 30-Jun-15 44,738 - - (2,415) 42,323 $1.24
27-Nov-13 30-Jun-16 - 427,474 - - 427,474 $1.195
16-Jan-14 30-Jun-16 - 3,723,695 - (288,377) 3,435,318 $1.30
20-Jun-14 30-Jun-16 - 115,437 - - 115,437 $1.86
7,300,595 4,266,606 (654,638) (741,587) 10,170,976
As at 30 June 2013
19-Nov-09 30-Jun-12 332,136 - - (332,136) 0 $2.80
22-Jan-10 30-Jun-12 1,322,800 - (284,379) (1,038,421) 0 $2.83
31-Mar-10 30-Jun-12 20,770 - (6,271) (14,499) 0 $2.72
23-Apr-10 30-Jun-12 10,181 - (2,855) (7,326) 0 $2.58
3-Dec-10 30-Jun-13 1,710,193 - - (1,365,548) 344,645 $1.74
25-Jun-11 30-Jun-13 339,431 - - (257,425) 82,006 $1.21
30-Jun-11 30-Jun-13 920,246 - - (690,184) 230,062 $1.28
16-Sep-11 30-Jun-14 3,149,578 - - (202,467) 2,947,111 $1.04
31-Oct-11 30-Jun-14 162,850 - - - 162,850 $1.39
24-Nov-11 30-Jun-14 916,032 - - - 916,032 $1.25
22-Nov-12 30-Jun-15 - 331,474 - - 331,474 $1.34
4-Dec-12 30-Jun-15 - 2,333,503 - (91,826) 2,241,677 $1.30
28-Jun-13 30-Jun-15 - 44,738 - - 44,738 $1.24
8,884,217 2,709,715 (293,505) (3,999,832) 7,300,595
A summary of rights in the consolidated entity and the Company is as follows:
For grants of rights, the fair value has been calculated at the grant date using a Black-Scholes Pricing Model and assuming a vesting
probability of 43.5% for performance related awards and a 10% staff turnover rate for retention awards.
The fair value of rights has been calculated at the grant date and allocated to each reporting period evenly over the period from grant date
to vesting date. The value disclosed is the portion of the fair value of the rights allocated to this reporting period. The value disclosed does
not therefore represent cash received.
The share rights outstanding at 30 June 2014 have fair value in the range of $0.45 to $1.86, and a weighted average remaining contractual
life of 1 year (2013: 1.3 years).
21. Employee benefi ts (Continued)
N O T E S T O T H E C O N S O L I D A T E D F I N A N C I A L S T A T E M E N T S

91AWE LIMITED ANNUAL REPORT 2014
(c) Share-based payments – Share Rights Plan (continued)
The fair value of services rendered in return for share rights granted is measured by reference to the fair value of share rights granted.
The inputs into the model are shown in the following table:
Grant date
Fair value at
measurement date
Weighted average
share price
Expected
volatility
Expected
dividends
Vesting
probability
Assumed staff
turnover
As at 30 June 2014
27-Nov-13 $0.52 $1.195 25% 0% to 3% 43.5% 10%
16-Jan-14 $0.57 to $1.30 $1.30 25% 0% to 3% 43.5% 10%
20-Jun-14 $0.81 to $1.86 $1.86 25% 0% to 3% 43.5% 10%
As at 30 June 2013
22-Nov-12 $0.58 $1.34 25% 0% to 3% 43.5% 10%
4-Dec-12 $0.57 to $1.30 $1.30 25% 0% to 3% 43.5% 10%
28-Jun-13 $0.54 to $1.24 $1.24 25% 0% to 3% 43.5% 10%
(d) Share-based payments – Employee share option plan
Under the Company’s legacy Employee Share Option Plan, options to subscribe for ordinary shares in the Company were issued to
employees at the discretion of the directors and the exercise price and exercise period were determined to reward employees if the
Company’s share price achieves signifi cant long-term growth. Options were unlisted and were granted with exercise prices not less than
the average market price of the Company’s shares for the fi ve days prior to grant.
The Company no longer issues employee share options. No employee share options have been issued since June 2009 and all remaining
employee share options expired unexercised during the fi nancial year.
A summary of outstanding options to acquire ordinary shares in the Company is as follows:
Grant date
Expiry
date
Exercise
price
Opening
balance Granted Exercised Lapsed
Closing
balance
Value of
shares at
exercise date
As at 30 June 2014
15-Aug-08 14-Aug-13 3.28 1,466,000 - - (1,466,000) - -
16-Jan-09 15-Jan-14 2.60 75,000 - - (75,000) - -
16-Jun-09 15-Jun-14 2.75 437,500 - - (437,500) - -
1,978,500 - - (1,978,500) - -
As at 30 June 2013
13-Jul-07 14-Jul-12 3.56 2,165,000 - - (2,165,000) - -
9-Oct-07 8-Oct-12 3.56 45,000 - - (45,000) - -
26-Nov-07 30-Aug-12 3.18 300,000 - - (300,000) - -
7-Apr-08 6-Apr-13 3.65 125,000 - - (125,000) - -
16-May-08 12-May-13 4.10 275,000 - - (275,000) - -
12-Jun-08 11-Jun-13 4.08 300,000 - - (300,000) - -
15-Aug-08 14-Aug-13 3.28 1,466,000 - - - 1,466,000 -
16-Jan-09 15-Jan-14 2.60 75,000 - - - 75,000 -
16-Jun-09 15-Jun-14 2.75 437,500 - - - 437,500 -
5,188,500 (3,210,000) 1,978,500 -
21. Employee benefi ts (Continued)

92 AWE LIMITED ANNUAL REPORT 2014
2014
$’000
2013
$’000
22. Provisions
Current
Restoration and abandonment 16,228 18,285
Deferred revenue 896 1,881
Other 3 3
17,127 20,169
Non-current
Restoration and abandonment 138,899 123,183
138,899 123,183
Total provisions 156,026 143,352
Reconciliation of movement
Restoration and abandonment
Carrying amount at the beginning of the fi nancial year 141,468 112,980
Write back in provisions due to assets classifi ed as held for sale (11,702) -
Provisions made during the year 22,168 23,090
Foreign exchange translation difference 1,004 3,243
Unwind of discount 2,189 2,155
Carrying amount at the end of the fi nancial year 155,127 141,468
Deferred revenue and other
Carrying amount at the beginning of the fi nancial year 1,884 939
Provisions reversed during the year (985) (40)
Provisions made during the year - 985
Carrying amount at the end of the fi nancial year 899 1,884
Provisions made for environmental rehabilitation are recognised where there is a present obligation as a result of exploration,
development or production activities having been undertaken and it is probable that an outfl ow of economic benefi ts will be required to
settle the obligation. The estimated future obligations include the costs of removing facilities, abandoning wells and restoring the affected
areas. Due to the long-term nature of the liability, there is some uncertainty in estimating the provision of the costs that will be incurred.
In particular, the consolidated entity has assumed that restoration will use technology and materials that are available currently. The
basis for accounting is set out in note 1(r).
23. Taxation (receivable) / payable
Income tax - New Zealand (2,071) 4,136
Accounting Profi ts Royalty (APR) – New Zealand 34 9,090
Petroleum Resource Rent Tax (PRRT) - Australia 1,828 4,861
Other - 250
(209) 18,337
No Australian income tax is payable for the 30 June 2014 fi nancial year. Refer Note 24 for information with regards to the tax loss position
of the consolidated entity.
N O T E S T O T H E C O N S O L I D A T E D F I N A N C I A L S T A T E M E N T S

93AWE LIMITED ANNUAL REPORT 2014
2014
$’000
2013
$’000
24. Deferred tax assets and liabilities
Deferred tax asset
Tax benefi t attributable to tax losses 94,256 60,820
Provisions and accruals 47,852 43,803
Other 437 1,178
142,545 105,801
Deferred tax liability
Exploration and evaluation assets (26,112) (26,268)
Oil and gas assets (66,223) (30,241)
Arising from PRRT and APR (15,279) (21,318)
Other receivables - non-current (11,971) -
(119,585) (77,827)
Net deferred tax assets 22,960 27,974
Unrecognised deferred tax assets
Tax value of Australian income tax losses (calculated at 30%) 84,941 69,797
Deferred tax asset recognised (55,531) (40,387)
Tax value of Australian income tax losses not recognised as an asset (calculated at 30%) 29,410 29,410
Australian Petroleum Resource Rent Tax and
New Zealand Accounting Profi ts Royalty
The consolidated entity applies tax effect accounting to both PRRT
and to APR for all of the consolidated entity’s onshore and offshore
Australian and offshore New Zealand producing operations.
Applying tax effect accounting principles to both PRRT and APR
causes the tax effect of the difference between the PRRT/APR tax
base and the accounting base of these assets to be recognised as
a deferred tax asset or deferred tax liability on the balance sheet.
The PRRT/APR tax base represents the remaining deductible
project costs of the relevant projects. The accounting base
represents the written down net balance sheet value of the project
which is amortised over the life of reserves. Where the remaining
deductible project costs for a project exceed the accounting base
and the excess cannot be transferred to a PRRT payable project
then no deferred tax asset is recorded. The application of tax
effect accounting to both PRRT and APR may impact the reported
income tax expense whether or not a current tax liability to pay
PRRT or APR arises.
Deferred tax assets in relation to carried forward losses
Total Australian income tax losses incurred prior to forming a tax
consolidated group amount to $29.4 million (calculated at 30%) are
not recognised as a deferred tax asset.
All Australian income tax losses incurred after 30 June 2003 and
that remain unutilised at 30 June 2014 have been recorded as a
deferred tax asset ($55.6 million calculated at 30%).
Unutilised New Zealand tax losses have been recorded as a
deferred tax asset ($20 million calculated at 28%).
All US income tax losses as at 30 June 2014 have been recorded as
a deferred tax asset ($18.4 million calculated at 35%).
Tax losses or Production Sharing Contract (PSC’s) unrecovered
costs incurred in other jurisdictions have been treated as
permanently not deductible due to uncertainty of future usage
due to insuffi cient estimated recoverable taxable income in those
jurisdictions.

94 AWE LIMITED ANNUAL REPORT 2014
2014
$’000
2013
$’000
25. Capital and reserves
(a) Share capital
522,696,385 (2013: 522,116,985) ordinary shares, fully paid 772,172 772,172
Dividend franking account
30% franking credits available at 30 June 311 311
30% franking credits available to shareholders for subsequent fi nancial years 311 311
There were no movements in share capital during the year.
Holders of ordinary shares are entitled to receive dividends as declared from time to time and are entitled to one vote per share at
shareholders’ meetings.
(b) Equity compensation reserve
The equity compensation reserve represents the fair value of options expensed by the Company to 30 June 2014.
(c) Translation reserve
The translation reserve comprises all foreign exchange differences arising from the translation of the fi nancial statements of foreign
operations where the functional currency is different to the presentation currency of the reporting entity.
(d) Fair value reserve
The fair value reserve comprises the cumulative net change in the fair value of available-for-sale fi nancial assets until the investments
are derecognised or impaired.
(e) Dividends paid
No dividends were paid during the year (2013: nil).
(f) Dividend franking account
N O T E S T O T H E C O N S O L I D A T E D F I N A N C I A L S T A T E M E N T S

95AWE LIMITED ANNUAL REPORT 2014
Consolidated percentage interest
Permit Country and geographical area
2014
%
2013
%
T/L1 Yolla Australia, Bass basin 46.25 46.25
T/18P Australia, Bass basin 44.75 44.75
VIC/L 24 Casino Australia, Otway basin 25.00 25.00
VIC/L 30 Henry, Netherby Australia, Otway basin 25.00 25.00
VIC/P 44 Australia, Otway basin 25.00 25.00
VICRL11 Martha Australia, Otway basin 25.00 25.00
VICRL12 Blackwatch Australia, Otway basin 25.00 25.00
VIC / P67 La Bella Australia, Otway basin 60.00 -
WA 31 L Cliff Head Australia, North Perth basin, Offshore 57.50 57.50
WA 497P Australia, Carnarvon basin 100.00 -
L1/L2 Dongara, Yardarino Australia, North Perth basin, Onshore 100.00 100.00
L1/L2 Hovea and Eremia Australia, North Perth basin, Onshore 50.00 50.00
L1/L2 Corybas Australia, North Perth basin, Onshore 50.00 50.00
L4/L5 Woodada Australia, North Perth basin, Onshore 100.00 100.00
L7 Mt Horner Australia, North Perth basin, Onshore 100.00 100.00
L11 Beharra Springs, Redback Terrace Australia, North Perth basin, Onshore 33.00 33.00
L14 Jingemia Australia, North Perth basin, Onshore 44.14 44.14
EP 320 Australia, North Perth basin, Onshore 33.00 33.00
EP 413 Australia, North Perth basin, Onshore 44.25 44.25
EP 455 Australia, North Perth basin, Onshore 81.50 81.50
PMP 38158 Tui, Amokura,Pateke New Zealand, Taranaki Basin, Offshore 57.50 42.50
PEP 55768 New Zealand, Taranaki Basin, Onshore 51.00 -
Bulu PSC Indonesia, Java Sea 42.50 42.50
East Muriah PSC Indonesia, Java Sea 50.00 50.00
Terumbu PSC Indonesia, Java Sea 100.00 100.00
North Madura PSC Indonesia, Java Sea 50.00 50.00
Titan PSC Indonesia, Java Sea 40.00 40.00
North West Natuna PSC Indonesia, Natuna Sea 50.00 100.00
Anambas PSC Indonesia, Natuna Sea 100.00 100.00
Yemen Block no. 7 Yemen, Shabwa basin 19.25 19.25
Yemen Block no. 74 Yemen, Masilah basin 29.75 29.75
Sugarloaf Area of Mutual Interest United States of America, Karnes County, Texas 10.00 10.00
26. Interests in oil and gas permits
At the end of the fi nancial year the consolidated entity held the following oil and gas production, exploration and appraisal permits:

96 AWE LIMITED ANNUAL REPORT 2014
Included in the assets and liabilities of AWE are the following items which represent AWE’s interest in the assets and liabilities employed
in the permits.
2014
$’000
2013
$’000
Current assets
Cash and cash equivalents 15,332 11,205
Trade and other receivables 6,945 4,363
Inventory 3,751 3,686
26,028 19,254
Non-current assets
Exploration and evaluation assets 109,284 111,034
Oil and gas assets 802,054 926,782
911,338 1,037,816
Total assets 937,366 1,057,070
Current liabilities
Trade and other payables 48,128 30,996
Total liabilities 48,128 30,996
Refer to notes 27 and 28 for details of commitments and contingent liabilities.
27. Capital and other commitments
(a) Capital expenditure commitments
Contracted but not provided for or payable:
Not later than one year 140,743 52,156
AWE participates in a number of development projects that were in progress at the end of the period. These projects require AWE, either
directly or through joint venture arrangements, to enter into contractual commitments for future expenditures. Contractual commitments
for expenditures at year end include $78 million in relation to long lead items for the BassGas MLE development drilling, $21 million in
relation to the Pateke development well in New Zealand and $41 million for development drilling at Sugarloaf in the USA.
(b) Exploration and evaluation expenditure commitments
Total exploration and evaluation expenditure contracted for
but not provided for in the fi nancial statements, payable:
Not later than one year 23,300 37,200
Later than one year but not later than fi ve years 14,700 66,100
38,000 103,300
AWE participates in a number of licences, permits and production sharing contracts for which the Company has made commitments with
relevant governments to complete minimum work programmes. In addition, the Company, directly or through joint venture arrangements,
has made contractual commitments at year end in relation to exploration activities to be undertaken in the 2014-15 year.
Commitments not later than one year include $14 million in relation to the La Bella exploration well, $30.6 million in relation to the
onshore Perth Basin and $7million offshore Indonesia.
Commitments later than one year include $14 million relating to La Bella (VIC / P67) $6.7 million in relation to Otway (VIC P/44) $12.6
million for BassGas (T/18P), $13.1 million for Carnarvon and $8 million relation to Terumbu in Indonesia.
26. Interests in oil and gas permits (continued)
N O T E S T O T H E C O N S O L I D A T E D F I N A N C I A L S T A T E M E N T S

97AWE LIMITED ANNUAL REPORT 2014
28. Contingencies
In accordance with normal industry practice, the consolidated
entity has entered into joint venture operations with other parties
for the purpose of exploring and developing its permit interests.
If a party to a joint venture operation defaults and does not
contribute its share of joint venture operation obligations, then
the other joint venturers are liable to meet those obligations. In
this event, the permit interest held by the defaulting party may be
redistributed to the remaining joint venturers.
In accordance with normal industry practice and under the terms
of various joint venture operating and product sales agreements,
the consolidated entity may have provided performance
guarantees to third parties on behalf of wholly-owned controlled
entities to fulfi l its permit obligations in various jurisdictions where
it conducts its operations.
The Operator of the Tui Area oil project (PMP 38158, offshore
Taranaki Basin, New Zealand) has entered into a charter contract
for the provision of an FPSO for the Tui Field development. The
Charter Contractor own and operates the FPSO as part of the
charter arrangement. The contract is for a fi xed initial term to 31
December 2015 with options exercisable by the joint venture for
seven one-year extensions. The consolidated entity has provided
a letter of credit in favour of the Charter Contractor amounting to
US$7.5 million (2013: US$8.7 million).
The Company is responsible for taxes payable in respect of earlier
years by entities acquired from Genting (Oil and Gas) in connection
with the acquisition of a participating interest in the Northwest
Natuna and Anambas PSC’s. The entities are subject to claims
by the Indonesian Tax Offi ce in respect of VAT and withholding
taxes in respect of the 2005 to 2011 years totalling US1.4 million.
The potential liability to earlier years’ taxes is also the subject of
arbitration proceedings against Genting that are in progress at the
report date.
The consolidated entity has made an accounting provision for all
known environmental liabilities. There can be no assurance that
as a result of new information or regulatory requirements with
respect to the consolidated entity’s assets that provisions will not
be increased at a future date.
The Native Title Act (“NTA”) may impact on the consolidated
entity’s ability to gain access to new prospective exploration areas
or obtain production titles. Some of the consolidated entity’s
onshore petroleum tenements now include land which may
become the subject of a Native Title claim under the NTA.
(c) Time charter commitments
Floating Production Storage and Offtake vessel (“FPSO”) time charter contracted
for but not provided for in the fi nancial statements, payable:
2004
$’000
2013
$’000
Not later than one year 14,546 14,513
Later than one year but not later than fi ve years 8,483 22,354
23,029 36,867
The Operator of the Tui Area oil project (PMP 38158, offshore Taranaki Basin, New Zealand) has entered into a USD denominated charter
contract for the provision of an FPSO for the Tui Field development. The Charter Contractor owns and operates the FPSO as part of the
charter arrangement. The contract is for a fi xed initial term to 31 December 2015 with options exercisable by the joint venture for seven
one-year extensions.
(d) Non-cancellable operating lease commitments
Future operating lease rentals, not provided for in the fi nancial statements, payable:
Not later than one year 10,677 4,363
Later than one year but not later than fi ve years 10,652 3,662
21,329 8,025
Operating lease commitments include offi ce premises and site service agreements.
27. Capital and other commitments (Continued)

98 AWE LIMITED ANNUAL REPORT 2014
29. Reconciliation of cash fl ows from operating activities
2004
$’000
2013
$’000
Cash fl ows from operating activities
Profi t / (loss) for the period 62,500 20,037
Adjustments for:
Amortisation of oil and gas assets 125,378 103,838
Amortisation of intangible assets 103 83
Depreciation 616 535
(Gain)/loss on disposal of oil and gas assets (96,690) -
Branch profi ts tax on disposal of oil and gas assets 9,662 -
(Gain)/loss on disposal of other assets - (114)
Fair value adjustment related to disposal group 12,438 -
Loan establishment fees written off/amortised 2,282 981
Unwinding of discount – restoration provisions 2,190 2,155
Fair value adjustment in relation to NWN carry (& adjust for discount unwind) 459 -
Share-based payments 2,549 2,136
Net foreign currency losses 225 403
Change in assets and liabilities during the fi nancial year:
(Increase)/decrease in trade and other receivables 20,635 (16,153)
Decrease/(increase) in oil inventory (13,807) 2,270
(Increase)/ decrease in income taxes payable (18,722) -
(Increase)/ decrease in deferred tax assets 2,469 3,997
Increase/(decrease) in provisions and employee benefi ts 1,580 1,750
Decrease in accounts payable 9,819 (3,728)
Net cash from operating activities 123,686 118,190
N O T E S T O T H E C O N S O L I D A T E D F I N A N C I A L S T A T E M E N T S

99AWE LIMITED ANNUAL REPORT 2014
Name Note
Country of
incorporation
Equity holding
2014
%
2013
%
Parent entity
AWE Limited
Controlled entities
AWE Administration Pty Limited 1 Australia 100 100
AWE Finance Pty Limited 1 Australia 100 100
AWE Overseas Pty Limited 1 Australia 100 100
AWE Offshore Pty Limited 1 Australia 100 100
AWE Argentina Pty Limited 1 & 2 Australia 100 100
AWE New Zealand Pty Limited 1 & 2 Australia 100 100
AWE UK Pty Limited 1 Australia 100 100
AWE Australia Pty Limited 1 Australia 100 100
Omega Oil Pty Ltd 1 Australia 100 100
Wells Fargo Resources Pty Ltd Australia 100 100
AWE Petroleum Pty Ltd 1 Australia 100 100
Peedamullah Petroleum Pty Ltd 1 Australia 100 100
AWE (Carnarvon) Pty Ltd 1 & 3 Australia 100 100
AWE Resources (Western Australia) Pty Ltd 1 Australia 100 100
AWE Oil (Western Australia) Pty Ltd 1 Australia 100 100
Perthshire Petroleum Pty Ltd 1 Australia 100 100
Tepstew Pty Ltd 1 Australia 100 100
Western Petroleum Management Pty Ltd 1 Australia 100 100
AWE (NSW) Pty Ltd 1 Australia 100 100
AWE (Australia) Energy Pty Ltd 1 Australia 100 100
AWE Energy (Australasia) Pty Ltd 1 Australia 100 100
AWE Perth Pty Ltd 1 & 4 Australia 100 100
AWE (Beharra Springs) Pty Ltd Australia 100 100
AWE Energy Holdings Pty Limited 1 & 6 Australia 100 100
AWE (WA) Trading Pty Ltd 1 & 7 Australia 100 100
AWE (WA) Investment Company Pty Ltd 1 & 8 Australia 100 100
AWE (Wandoo) Pty Ltd 1 & 9 Australia 100 100
AWE (Bass Gas) Pty Ltd 1 & 10 Australia 100 100
AWE (Offshore PB) Pty Limited 1 & 11 Australia 100 100
Adelphi Energy Pty Limited 1 Australia 100 100
Adelphi Energy (Yemen) Pty Ltd 1 Australia 100 100
Adelphi Holdings (Australia) Pty Limited 12 Australia 100 -
AWE Malaysia Pty Limited 1 Australia 100 100
Adelphi Energy Texas Inc. USA 100 100
AWE Finance US Inc. USA 100 100
Adelphi Energy Yemen (B74) Limited British Virgin Islands 100 100
AWE Holdings NZ Limited New Zealand 100 100
AWE Taranaki Limited New Zealand 100 100
AWE (Satria) NZ Limited New Zealand 100 100
AWE (East Muriah) NZ Limited New Zealand 100 100
AWE (Terumbu) NZ Limited New Zealand 100 100
AWE (North Madura) NZ Limited New Zealand 100 100
AWE (Titan) NZ Limited New Zealand 100 100
AWE Finance NZ Limited New Zealand 100 100
AWE (AAL) NZ Limited New Zealand 100 100
AWE (Sugarloaf) NZ Limited 12 New Zealand 100 -
AWE Singapore Pte. Ltd. Singapore 100 100
AWE Holdings Singapore Pte. Ltd. Singapore 100 100
AWE Vietnam Pte. Ltd. Singapore 100 100
AWE (Northwest Natuna) Pte. Ltd. Singapore 100 100
AWE (Anambas) Pte. Ltd. Singapore 100 100
AWE Offshore UK Limited UK 100 100
Greenslopes Limited Papua New Guinea 100 100
30. Controlled entities

100 AWE LIMITED ANNUAL REPORT 2014
Notes in relation to the controlled entities:
30. Controlled entities (continued)
1. These controlled entities are a party to a Deed of Cross Guarantee between those group entities and the Company pursuant to ASIC Class Order 98/1418 and are not required to prepare and lodge fi nancial statements and directors’ reports (refer note 33). The Company and those group entities are the “Closed Group”.
2. AWE New Zealand Pty Limited and AWE Argentina Pty Limited are Australian companies with branches in New Zealand and Argentina respectively.
3. AWE (Carnarvon) Pty Ltd was previously known as AWE Services, its named changed during the year.
4. Previously known as ARC Energy Pty Limited.
5. Previously known as ARC (Beharra Springs) Pty Ltd.
6. Previously known as ARC Energy Holdings Pty Limited.
7. Previously known as ARC Energy Trading Pty Ltd.
8. Previously known as ARC Investment Company Pty Ltd.
9. Previously known as ARC (Wandoo) Pty Ltd.
10. Previously known as ARC (BassGas) Pty Ltd.
11. Previously known as ARC (Offshore PB) Pty Limited.
12. New entity incorporated during the year.
31. Financial risk management
The consolidated entity has exposure to foreign currency, interest
rate, commodity price, credit and liquidity risks that arise in the
normal course of its business. In accordance with Board approved
policies derivative fi nancial instruments may be used to hedge
the exposure to fl uctuations in exchange rates, interest rates and
commodity prices.
The Board of Directors has overall responsibility for the
establishment and oversight of the fi nancial risk management
framework of the consolidated entity. The Board has delegated
to the Audit and Governance Committee the responsibility for
developing and monitoring fi nancial risk management policies
across the Company. The Audit and Governance Committee’s
primary role is to advise and assist the Board of Directors in
assessing the management of key fi nancial risks of the Company.
The fi nancial risk management policies and systems are reviewed
annually by the Audit and Governance Committee to refl ect
changes in market conditions and the entity’s business activities.
Management of fi nancial risks is carried out by a centralised
treasury function which operates under Board approved
policies. The Board approved Treasury and Risk Management
Guidelines provide clear guidelines to management in respect
of the management of fi nancial risks of the Company and are
designed to ensure that it adequately refl ects the strategic risk
management objectives of the Board.
The objective of AWE’s fi nancial risk management strategy is
to minimise the impact of volatility in fi nancial markets on the
fi nancial performance, cash fl ows and shareholder returns of
AWE. This includes the need to ensure that suffi cient liquidity
is available to fund its strategic business plans. Identifi cation
and analysis of relevant fi nancial risks and its impact on the
achievement of the Company’s objectives forms the basis for
determining how such risks should be managed. The forecast
fi nancial position of the consolidated entity is regularly monitored
and derivative fi nancial instruments may be used within approved
guidelines to hedge exposure to fl uctuations in interest rates,
exchange rates and commodity prices.
(a) Market risk
(i) Commodity price risk
The consolidated entity is exposed to commodity price risk
through its revenue from the sale of hydrocarbons – gas, crude
oil, condensate and LPG. Australian gas sales are not subject
to commodity price risk as the product is sold in Australian
Dollars under long-term contracts with CPI escalators in place.
However, crude oil, condensate and LPG are priced against world
benchmark commodity prices and the consolidated entity is
therefore subject to commodity price risk for these products.
Subject to approval of the Board, the consolidated entity may enter
into certain derivative instruments to manage its commodity price
risk. As at the end of the fi nancial year, the consolidated entity has
no commodity price hedging or derivatives in place.
(ii) Interest rate risk
The Company has available an unsecured multi-currency
syndicated bank loan facility of A$300 million. The facility utilised
at 30 June 2014 was nil (2013: $77.8 million) (refer note 20). When
drawn, the Australian Dollar portion of the facility bears interest
at the bank bill swap rate plus a margin, the United States Dollar
portion of the facility bears interest at LIBOR plus a margin and
the New Zealand portion of the facility bears interest at BKBM
plus a margin. Borrowings under the facility are at fl oating rates
and when the facility is drawn the consolidated entity would be
subject to interest rate risk from movements in the Australian
dollar bank bill swap rate, United States dollar LIBOR and New
Zealand BKBM. Similarly, the consolidated entity is subject to
interest rate risk from movements in the Australian, United States
and New Zealand cash deposits.
In accordance with Board approved policies, the consolidated entity
may enter into certain derivative instruments to manage its interest
rate risk. As at the end of the fi nancial year, the consolidated entity
has no interest rate hedging or derivatives in place.
(iii) Foreign exchange risk
The consolidated entity operates internationally and is exposed to
foreign exchange risk arising from various currency exposures,
primarily with respect to United States and New Zealand dollars.
The consolidated entity is subject to foreign exchange risk through
the sale of products denominated is US dollars, borrowings
denominated in US and NZ dollars and foreign currency capital
and operating expenditure.
The Company manages its foreign exchange exposures on a net
basis and may use forward foreign exchange contracts or cross
currency swaps to manage its exposures. As at the end of the
fi nancial year, the consolidated entity has no foreign exchange
hedging or derivatives in place.
N O T E S T O T H E C O N S O L I D A T E D F I N A N C I A L S T A T E M E N T S

101AWE LIMITED ANNUAL REPORT 2014
31. Financial risk management (continued)
(a) Market risk (continued)
(iii) Foreign exchange risk (continued)
The following signifi cant exchange rates applied during the year:
Average rate
Spot rate at the end of the
reporting period
2014 2013 2014 2013
AUD/USD 0.9183 1.0272 0.9420 0.9275
AUD/NZD 1.1063 1.2494 1.0761 1.1871
2014
A$’000
2013
A$’000
The fi nancial instruments denominated in United States dollars and New Zealand dollars are as follows:
United States dollars:
Financial assets
Cash 18,467 22,608
Trade and other receivables 22,252 38,627
Financial liabilities
Trade and other payables (34,947) (20,076)
Bank loans - (32,345)
New Zealand dollars:
Financial assets
Cash 1,371 198
Financial liabilities
Trade and other payables - -
Bank loans - (45,489)
The effects of exchange rate fl uctuations on the balances of cash held in foreign currencies shown in the Consolidated statement of cash
fl ows is as follows:
Effect of exchange rate fl uctuations on the balances of cash held in
foreign currencies 716 (312)

102 AWE LIMITED ANNUAL REPORT 2014
31. Financial risk management (continued)
(a) Market risk (continued)
(iii) Foreign exchange risk (continued)
Summarised sensitivity analysis
The following table summarises the sensitivity of the consolidated entity’s fi nancial assets and fi nancial liabilities to interest rate risk,
foreign exchange risk and other price risk.
Carrying amount
$’000
Commodity & other price risk Interest rate risk Foreign exchange risk
-10% 10% -1% 1% -10% 10%
Profi t
$’000
Other equity
$’000
Profi t
$’000
Other equity
$’000
Profi t
$’000
Other equity
$’000
Profi t
$’000
Other equity
$’000
Profi t
$’000
Other equity
$’000
Profi t
$’000
Other equity
$’000
30 June 2014
Financial assets
Cash and cash equivalents
42,144 - - - - (296) - 296 - 1,392 - (1,392) -
Trade and other receivables
31,060 - - - - - - - - 1,090 - (1,090) -
Prepayments 2,041 - - - -
Financial liabilities
Trade and other payables
90,904 - - - - - - - - (2,446) - 2,446 -
Bank loans - - - - - - - - - - - -
Total increase / (decrease) - - - - (296) - 296 - 36 - (36) -
30 June 2013
Financial assets
Cash and cash equivalents
41,131 - - - - (287) - 287 - 1,601 - (1,601) -
Trade and other receivables
55,584 - - - - - - - - 2,704 - (2,704) -
Prepayments 1,439 - - - - - - - -
Financial liabilities
Trade and other payables
48,712 - - - - - - - - (1,405) - 1,405 -
Bank loans 77,834 - - - - 545 - (545) - - - -
Total increase / (decrease) - - - - 258 - (258) - 2,900 - (2,900) -
N O T E S T O T H E C O N S O L I D A T E D F I N A N C I A L S T A T E M E N T S

103AWE LIMITED ANNUAL REPORT 2014
31. Financial risk management (continued)
(b) Credit risk
Credit risk is the risk of sustaining a fi nancial loss as a result of the default by a counterparty to make full and timely payments on
transactions which have been executed, after allowing for set-offs which are legally enforceable. The credit risk on fi nancial assets of
the consolidated entity which have been recognised on the statement of fi nancial position is the carrying amount, net of any provision for
doubtful debts.
Credit risk arises from investments in cash and cash equivalents with bank, derivative fi nancial instruments and credit exposure
to customers and/or suppliers. Credit risk also arises from bank facilities which offer committed lines of credit, overdraft facilities,
transaction banking services and fi nancial guarantees, which may not be honoured when relied upon. The Board approved Treasury Risk
Management Guidelines outline how credit risk exposure will be managed by Treasury.
Receivables and cash and cash equivalents represent the Company’s and the consolidated entity’s maximum exposure to credit risk:
2014
$’000
2013
$’000
Cash 42,144 41,131
Trade and other receivables 121,104 67,698
The consolidated entity does not hold any credit derivatives to offset its credit exposure. With the exception of the capital expenditure
carry of $79.8 million due from Santos in connection with the sale of a 50% interest in the Northwest Natuna PSC (refer note 4) there is no
concentration of credit risk to a single party.
The ageing of trade receivables at the end of each reporting period was as follows:
Less than 1 month 22,039 48,010
1 month to 3 months - -
Greater than 3 months - -
22,039 48,010
There are no trade receivables past due or impaired at the end of the reporting period (2013: Nil).

104 AWE LIMITED ANNUAL REPORT 2014
31. Financial risk management (continued)
(c) Liquidity risk
Liquidity risk is the risk that the consolidated entity will not have suffi cient liquidity to meet its fi nancial obligations as they fall due.
The Board approved Treasury Risk Management Guidelines provide an appropriate framework for the management of the consolidated
entity’s short, medium and long-term funding and liquidity management requirements.
The consolidated entity manages liquidity risk by continually monitoring forecast and actual cash fl ows and matching maturity profi les of
fi nancial assets and liabilities. Short and long-term cash fl ow projections are prepared periodically and submitted to the Board at each
board meeting of the Company. In addition corporate debt facilities are required to be refi nanced well in advance of its maturity date.
Contractual cash
fl ows Note
Total
$’000
Less than 1 year
$’000
1-2 years
$’000
2-5 years
$’000
More than 5 years
$’000
30 June 2014
Consolidated
Trade and other
payables
19 90,904 90,904 - - -
Bank loans 20 - - - - -
30 June 2013
Consolidated
Trade and other
payables
19 48,712 48,712 - - -
Bank loans 20 77,834 - 77,834 - -
(d) Fair values of fi nancial assets and liabilities
The carrying values of fi nancial assets and liabilities of the
consolidated entity and the Company approximate their fair value.
The fair values are determined as follows:
+ the fair value of fi nancial assets and liabilities with standard
terms and conditions and traded on an active liquid market is
determined with reference to the quoted price; and
+ the fair value of other fi nancial assets and liabilities is
determined in accordance with generally accepted pricing
models based on discounted cash fl ow analyses.
AWE Limited has adopted the amendment to AASB 13 Fair
Value Measurement which requires disclosure of fair value
measurements by level of the following fair value measurement
hierarchy:
+ quoted prices (unadjusted) in active markets for identical assets
or liabilities (level 1);
+ inputs other than quoted prices included within level 1 that are
observable for the asset or liability, either directly (as prices) or
indirectly (derived from prices) (level 2), and
+ inputs for the asset or liability that are not based on observable
market data (unobservable inputs) (level 3).
The fair value of fi nancial instruments traded in active markets is
based on quoted market prices at the end of the reporting period.
The quoted market price used for fi nancial assets held by the
consolidated entity is the current bid price. These instruments
are included in level 1. There were no available-for-sale fi nancial
assets during the year.
(e) Capital management
The consolidated entity maintains an ongoing review of its
capital management strategy to ensure it maintains an
appropriate capital structure.
The overriding objective of the Company’s capital management
strategy is to increase shareholder returns whilst maintaining
the fl exibility to pursue the strategic initiatives of the Company
within a prudent capital structure.
The ability of the Company to make future dividends or conduct
any form of capital return to shareholders is regularly reviewed
by the Board. This is considered against the Company’s future
funding requirements and ability to access capital and where
there is surplus capital to distribute. The Board will endeavour
to optimise the return to AWE shareholders via capital
management initiatives where it can do so.
N O T E S T O T H E C O N S O L I D A T E D F I N A N C I A L S T A T E M E N T S

105AWE LIMITED ANNUAL REPORT 2014
32. Related party disclosures
(a) Key management personnel
(i) Key management personnel compensation
The key management personnel compensation included in
note 21 is as follows:
2014
$’000
2013
$’000
Salaries and wages 4,320 4,219
Share-based
payments
736 921
Other associated
personnel costs
179 348
5,235 5,488
(ii) Individual directors’ and executives’ compensation disclosures
Apart from the details disclosed in this note, no director or
executive has entered into a material contract with the consolidated
entity since the end of the previous fi nancial year and there were no
material contracts involving directors’ or executives’ interests existing
at year-end.
(iii) Shares
The movement during the fi nancial year in the number of ordinary
shares in the Company held, directly, indirectly or benefi cially, by
each key management person, including their related parties, is
on the next page:

106 AWE LIMITED ANNUAL REPORT 2014
Movements in shares Opening balance
Granted as
remuneration
Received on
exercise of rights Net change other Closing balance
As at 30 June 2014
Directors
B. J. Phillips 2,900,914 - - - 2,900,914
B. F. W. Clement(1) 30,000 - 230,061 - 260,061
D. I. McEvoy 30,000 - - - 30,000
A. J. Hogendijk(2) 10,000 - - (10,000) -
K. G. Williams 20,000 - - - 20,000
V. Braach-Maksvytis - - - - -
R. J. Betros(3) 20,000 - - 50,000 70,000
K. Penrose(4) - - - 17,935 17,935
Executives
D. Washer 43,254 - 47,102 - 90,356
A. Saridas - - - - -
N .P. Tupper(5) - - - - -
M. Drew(6) - - - - -
N. F. Kelly 151,379 - 35,622 - 187,001
D. R. N. Gaudoin(7) 29,077 - 39,988 (69,065) -
As at 30 June 2013
Directors
B. J. Phillips 2,900,914 - - - 2,900,914
B. F. W. Clement(1) 30,000 - - 30,000
D. I. McEvoy 30,000 - - - 30,000
A. J. Hogendijk(2) 10,000 - - - 10,000
K. Williams 20,000 - - 20,000
V. Braach-Maksvytis - - - - -
R. J. Betros(3) - - - 20,000 20,000
Executives
D. Washer 10,000 - 33,254 - 43,254
A. Saridas - - - - -
N. F. Kelly 125,476 - 25,903 - 151,379
D. R. N. Gaudoin(7) - - 29,077 - 29,077
1. Mr Clement was appointed a director of the Company on 1 February 2011.
2. Mr Hogendijk retired as a director on 27 November 2013.
3. Mr Betros was appointed a director on 22 November 2012.
4. Ms Penrose was appointed a director on 28 August 2013.
5. Mr Tupper commenced employment on 20 May 2013.
6. Mr Drew commenced employment on 1 May 2013 and ceased employment 30 June 2014.
7. Mr Gaudoin ceased employment on 1 November 2013.
N O T E S T O T H E C O N S O L I D A T E D F I N A N C I A L S T A T E M E N T S

107AWE LIMITED ANNUAL REPORT 2014
32. Related party disclosures (continued)
(a) Key management personnel (continued)
(iii) Shares (continued)
Changes in shareholdings classifi ed as “Net change other” in the table above do not necessarily refl ect purchases or disposals of shares
but may include movements relating to changes in key management personnel during the period.
No shares were granted to key management personnel during the fi nancial year as remuneration.
The disclosures above may not be consistent with the disclosure in the Directors’ Report as the basis of calculation differs due to the
differing requirements of the Corporations Act 2001 and the Accounting Standards
(iv) Share rights
The movement during the fi nancial year in the number of share rights in the Company held, directly, indirectly or benefi cially, by each key
management person, including their related parties, is as follows:
Movement
in share rights
Opening
balance
Granted as
remuneration Exercised
Lapsed
unexercised
Net change
other
Closing
balance
As at 30 June 2014
Directors
B. F. W. Clement(1) 1,477,565 427,474 (230,061) - - 1,674,978
Executives
D. Washer 497,979 198,034 (47,102) - - 648,911
A. Saridas 282,372 193,189 - - - 475,561
N.P. Tupper(2) - 221,174 - - - 221,174
M. Drew(3) - 181,467 - - (181,467) -
N. F. Kelly 381,992 170,674 (35,622) - - 517,044
D. R. N. Gaudoin(4) 461,792 - (39,988) - (421,804) -
As at 30 June 2013
Directors
B. F. W. Clement(1) 1,836,275 331,474 - (690,184) - 1,477,565
Executives
D. Washer 618,328 153,973 (33,254) (241,068) - 497,979
A. Saridas 162,850 119,522 - - - 282,372
N. F. Kelly 475,656 116,813 (25,903) (184,574) - 381,992
D. R. N. Gaudoin(4) 557,179 140,886 (29,077) (207,196) - 461,792
1. All share rights issued to Mr Clement have been approved by shareholders at previous Annual General Meetings of the Company.
2. Mr Tupper commenced employment on 20 May 2013.
3. Mr Drew commenced employment on 1 May 2013 and ceased employment 30 June 2014.
4. Mr Gaudoin ceased employment on 1 November 2013.
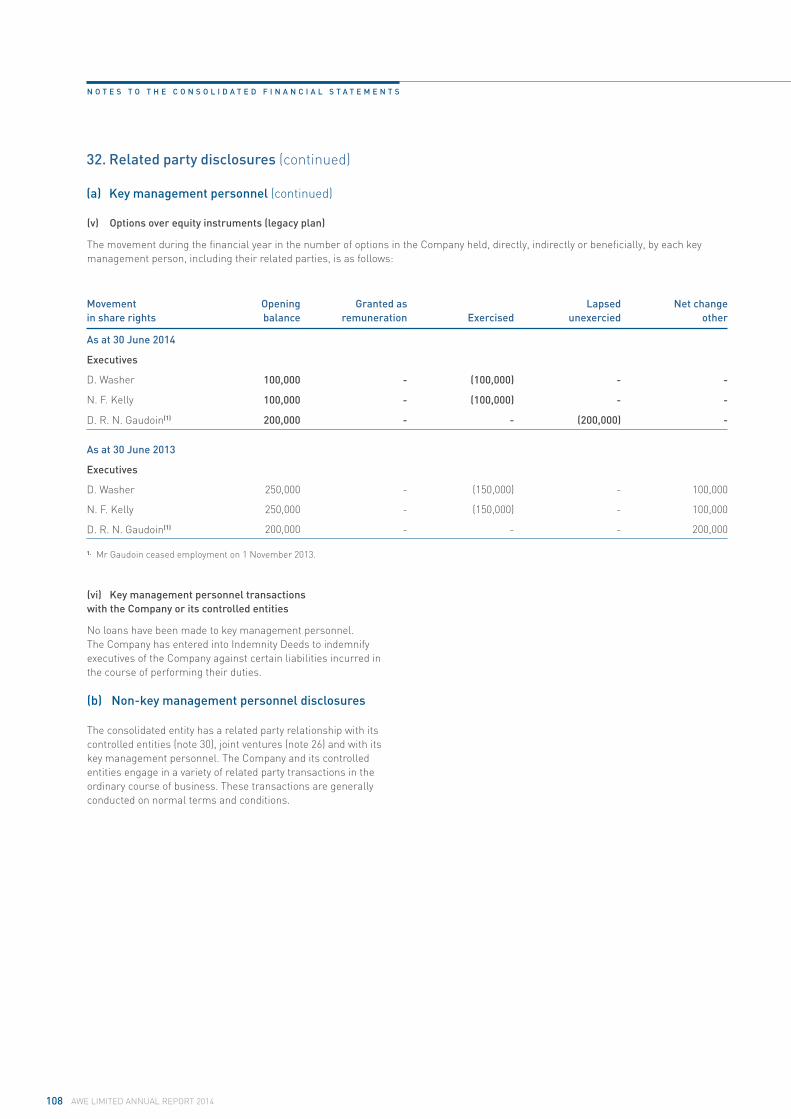
108 AWE LIMITED ANNUAL REPORT 2014
(v) Options over equity instruments (legacy plan)
The movement during the fi nancial year in the number of options in the Company held, directly, indirectly or benefi cially, by each key
management person, including their related parties, is as follows:
Movement
in share rights
Opening
balance
Granted as
remuneration Exercised
Lapsed
unexercied
Net change
other
As at 30 June 2014
Executives
D. Washer 100,000 - (100,000) - -
N. F. Kelly 100,000 - (100,000) - -
D. R. N. Gaudoin(1) 200,000 - - (200,000) -
As at 30 June 2013
Executives
D. Washer 250,000 - (150,000) - 100,000
N. F. Kelly 250,000 - (150,000) - 100,000
D. R. N. Gaudoin(1) 200,000 - - - 200,000
1. Mr Gaudoin ceased employment on 1 November 2013.
(vi) Key management personnel transactions
with the Company or its controlled entities
No loans have been made to key management personnel.
The Company has entered into Indemnity Deeds to indemnify
executives of the Company against certain liabilities incurred in
the course of performing their duties.
(b) Non-key management personnel disclosures
The consolidated entity has a related party relationship with its
controlled entities (note 30), joint ventures (note 26) and with its
key management personnel. The Company and its controlled
entities engage in a variety of related party transactions in the
ordinary course of business. These transactions are generally
conducted on normal terms and conditions.
32. Related party disclosures (continued)
(a) Key management personnel (continued)
N O T E S T O T H E C O N S O L I D A T E D F I N A N C I A L S T A T E M E N T S

109AWE LIMITED ANNUAL REPORT 2014
33. Parent entity disclosures
As at, and throughout the year ended 30 June 2014 the parent company of the consolidated entity was AWE Limited.
The Company
2014
$’000
2013
$’000
Result of the parent entity
Profi t / (Loss) for the period 399 (3,082)
Other comprehensive income - -
Total comprehensive income for the period 399 (3,082)
Financial position of the parent entity at year end
Current assets 337,876 350,187
Total assets 880,541 882,689
Current liabilities 376 1,124
Total liabilities 1,412 1,475
Net assets 879,129 881,214
Total equity of the parent entity
Share capital 25 772,172 772,172
Reserves 15,097 13,304
Retained earnings 91,860 95,738
Total equity 879,129 881,214
Parent entity contingencies and commitments
The contingent liabilities of the parent entity as at the end of the reporting period are disclosed in note 28. The directors are of the
opinion that provisions are not required in respect of these matters, as it is not probable that a future sacrifi ce of economic benefi ts will
be required or the amount is not capable of reliable measurement.
The parent entity did not have any capital or expenditure commitments as at end of the reporting period.
Parent entity guarantees in respect of debts of its subsidiaries
The parent entity has entered into a Deed of Cross Guarantee with the effect that the Company guarantees debts in respect of its
subsidiaries. Further details of the Deed of Cross Guarantee and the subsidiaries subject to the deed, are disclosed in note 34.

110 AWE LIMITED ANNUAL REPORT 2014
F I N A N C I A L S T A T E M E N T S
34. Deed of cross guarantee
Closed group
2014
$’000
2013
$’000
Summarised statement of fi nancial position
Current assets
Cash and cash equivalents 29,700 31,789
Trade and other receivables 239,756 144,821
Held for sale assets 84,301 -
Inventory 8,710 3,500
Total current assets 362,467 180,110
Non-current assets
Investments 64,448 47,386
Exploration and evaluation assets 87,039 87,557
Oil and gas assets 465,565 589,323
Other property, plant and equipment 1,601 1,573
Intangible assets 348 52
Deferred tax assets 66,019 54,741
Total non-current assets 685,020 780,632
Total assets 1,047,487 960,742
Current liabilities
Trade and other payables 48,910 26,410
Employee benefi ts 2,079 839
Liabilities assiciated with assets held for sale 11,702 -
Provisions 16,229 18,286
Taxation payable 1,180 11,499
Total current liabilities 80,100 57,034
Non-current liabilities
Employee benefi ts 614 1,045
Provisions 104,639 104,326
Total non-current liabilities 105,253 105,371
Total liabilities 185,353 162,405
Net assets 862,134 798,337
Equity
Issued capital 772,172 772,172
Reserves 14,862 13,177
Retained earnings 75,100 12,988
Total equity 862,134 798,337
Summarised consolidated income
statement
Profi t / (loss) before tax 52,117 39,365
Income tax (expense)/benefi t 9,995 (20,120)
Net profi t /(loss) after tax for the year 62,112 19,245
Retained earnings at the beginning of the
year
12,988 (6,257)
Retained earnings at the end of the year 75,100 12,988
35. Events subsequent to balance date
Subsequent to year end, the Company completed
the drilling of the Oi-1/2 exploration well. The well
intersected the primary target Kapuni F10 sands,
however no signifi cant oil shows were encountered and
the well was subsequently plugged and abandoned.
The Company has recognised the full cost of the drilling
expenditure incurred up to the end of the fi nancial
year of $11.5 million in the 2013/14 fi nancial year,
and a further $5.3 million is expected to be incurred
subsequent to year end.
The Company entered into a farm-in agreement with
ROC Oil Company Limited on 8 August 2014 for a 40%
participating interest in exploration Block 09/05 in the
Bohai Bay area, People’s Republic of China.
In the opinion of the directors, no other matter or
circumstance has arisen since 30 June 2014 that has
signifi cantly affected, or may signifi cantly affect:
a. the consolidated entity’s operations in future
fi nancial years, or
b. the results of those operations in future fi nancial
years, or
c. the consolidated entity’s state of affairs in future
fi nancial years.

111AWE LIMITED ANNUAL REPORT 2014
D I R E C T O R S ' D E C L A R A T I O N
Directors’ declaration
In the opinion of the directors of AWE Limited:
a. the fi nancial statements and accompanying notes, and
the Remuneration Report in the Directors’ Report, are in
accordance with the Corporations Act 2001, including:
ii. giving a true and fair view of the fi nancial position of
the consolidated entity as at 30 June 2014 and of its
performance for the fi nancial year ended on that date;
and
iii. complying with Australian Accounting Standards
(including the Australian Accounting Interpretations) and
the Corporations Regulations 2001; and
b. the fi nancial statements also comply with International
Financial Reporting Standards as disclosed in note 1(a); and
c. there are reasonable grounds to believe that the Company
will be able to pay its debts as and when they become due and
payable; and
d. there are reasonable grounds to believe that the Company and
the group entities identifi ed in Note 30 will be able to meet
any obligations or liabilities to which they are or may become
subject to by virtue of the Deed of Cross Guarantee between
the Company and those group entities pursuant to ASIC Class
Order 98/1418.
The directors have been given the declarations required by Section
295A of the Corporations Act 2001 from the Managing Director and
Chief Financial Offi cer for the fi nancial year ended 30 June 2014.
Signed in accordance with a resolution of the directors:
B. J. Phillips
Chairman
B. F. W. Clement
Managing Director
Dated at Sydney this 26th day of August 2014

112 AWE LIMITED ANNUAL REPORT 2014
I N D E P E N D E N T A U D I T O R ' S R E P O R T

113AWE LIMITED ANNUAL REPORT 2014

F I N A N C I A L S T A T E M E N T S
114 AWE LIMITED ANNUAL REPORT 2014
t
ADDITIONALINFORMATION

115AWE LIMITED ANNUAL REPORT 2014
R E S E R V E S A N D R E S O U R C E S
R E S E R V E S A N D R E S O U R C E SGeographical Area Proved (1P) Reserves at Evaluation Date 30 June 2014
Developed Undeveloped Total
Sa
les G
as (
PJ)
LP
G (
K t
on
ne
s)
Co
nd
en
sa
te
(mil
lio
n b
bls
)
Oil
(m
illi
on
bb
ls)
All
Pro
du
cts
(m
illi
on
BO
E)
Sa
les G
as (
PJ)
LP
G (
K t
on
ne
s)
Co
nd
en
sa
te
(mil
lio
n b
bls
)
Oil
(m
illi
on
bb
ls)
All
Pro
du
cts
(m
illi
on
BO
E)
Sa
les G
as (
PJ)
LP
G (
K t
on
ne
s)
Co
nd
en
sa
te
(mil
lio
n b
bls
)
Oil
(m
illi
on
bb
ls)
All
Pro
du
cts
(m
illi
on
BO
E)
New Zealand
Taranaki Basin 0.0 0.0 0.0 1.8 1.8 0.0 0.0 0.0 0.7 0.7 0.0 0.0 0.0 2.5 2.5
South East Australia
Bass Basin 5.9 12.4 0.2 0.0 1.3 53.9 179.8 2.0 0.1 13.1 59.8 192.1 2.1 0.1 14.4
Otway Basin 14.8 0.0 0.0 0.0 2.5 31.9 0.0 0.0 0.0 5.3 46.7 0.0 0.0 0.0 7.8
Western Australia
Offshore Perth Basin 0.0 0.0 0.0 1.5 1.5 0.0 0.0 0.0 0.0 0.0 0.0 0.0 0.0 1.5 1.5
Onshore Perth Basin 8.4 0.0 0.0 0.0 1.4 0.0 0.0 0.0 0.0 0.0 8.4 0.0 0.0 0.0 1.4
United States of America
Sugarloaf AMI 6.4 62.4 1.5 0.0 3.3 20.8 170.8 3.3 0.0 8.8 27.2 233.1 4.9 0.0 12.1
Indonesia
North West Natuna PSC 0.0 0.0 0.0 0.0 0.0 0.0 0.0 0.0 17.4 17.4 0.0 0.0 0.0 17.4 17.4
AWE Aggregated 35.5 74.8 1.7 3.3 11.8 106.6 350.5 5.3 18.2 45.3 142.1 425.3 7.0 21.5 57.2
Proportion of Total Proved (1P ) Reserves that are unconventional 21%
Geographical Area Proved Plus Probable (2P) Reserves at Evaluation Date 30 June 2014
Developed Undeveloped Total
Sa
les G
as (
PJ)
LP
G (
K t
on
ne
s)
Co
nd
en
sa
te
(mil
lio
n b
bls
)
Oil
(m
illi
on
bb
ls)
All
Pro
du
cts
(m
illi
on
BO
E)
Sa
les G
as (
PJ)
LP
G (
K t
on
ne
s)
Co
nd
en
sa
te
(mil
lio
n b
bls
)
Oil
(m
illi
on
bb
ls)
All
Pro
du
cts
(m
illi
on
BO
E)
Sa
les G
as (
PJ)
LP
G (
K t
on
ne
s)
Co
nd
en
sa
te
(mil
lio
n b
bls
)
Oil
(m
illi
on
bb
ls)
All
Pro
du
cts
(m
illi
on
BO
E)
New Zealand
Taranaki Basin 0.0 0.0 0.0 2.6 2.6 0.0 0.0 0.0 1.0 1.0 0.0 0.0 0.0 3.6 3.6
South East Australia
Bass Basin 10.1 20.4 0.3 0.0 2.2 98.1 329.4 3.5 0.1 23.8 108.2 349.8 3.8 0.1 26.0
Otway Basin 20.2 0.0 0.0 0.0 3.4 38.0 0.0 0.0 0.0 6.4 58.3 0.0 0.0 0.0 9.7
Western Australia
Offshore Perth Basin 0.0 0.0 0.0 2.6 2.6 0.0 0.0 0.0 0.0 0.0 0.0 0.0 0.0 2.6 2.6
Onshore Perth Basin 12.7 0.0 0.0 0.0 2.1 0.0 0.0 0.0 0.0 0.0 12.7 0.0 0.0 0.0 2.1
United States of America
Sugarloaf AMI 7.7 74.1 1.8 0.0 4.0 47.0 404.6 7.4 0.0 19.9 54.7 478.7 9.2 0.0 23.9
Indonesia
North West Natuna PSC 0.0 0.0 0.0 0.0 0.0 0.0 0.0 0.0 23.2 23.2 0.0 0.0 0.0 23.2 23.2
AWE Aggregated 50.7 94.5 2.1 5.2 16.8 183.1 734.0 10.9 24.3 74.2 233.8 828.5 13.0 29.4 91.0
Proportion of Total Proved (1P ) Reserves that are unconventional 26%

116 AWE LIMITED ANNUAL REPORT 2014
Products Reserves Reconciliation (million BOE)
Proved (1P) Reserves Proved Plus Probable (2P) Reserves
Eva
lua
tio
n D
ate
3
0 J
un
e 2
01
3
Re
visio
n a
nd
R
ecla
ssifi
ca
tio
n
Ext
en
sio
ns a
nd
D
isco
veri
es
Acq
uis
itio
ns a
nd
D
ive
stm
en
ts
An
nu
al
Pro
du
cti
on
Eva
lua
tio
n D
ate
3
0 J
un
e 2
01
4
Eva
lua
tio
n D
ate
3
0 J
un
e 2
01
3
Re
visio
n a
nd
R
ecla
ssifi
ca
tio
n
Ext
en
sio
ns a
nd
D
isco
veri
es
Acq
uis
itio
ns a
nd
D
ive
stm
en
ts
An
nu
al
Pro
du
cti
on
Eva
lua
tio
n D
ate
3
0 J
un
e 2
01
4
Sales Gas (PJ) 131.8 29.6 0.0 0.0 (19.3) 142.1 222.5 30.6 0.0 0.0 (19.3) 233.8
LPG (K tonnes) 288.8 178.5 0.0 0.0 (42.0) 425.3 677.9 192.6 0.0 0.0 (42.0) 828.5
Condensate (million bbls) 4.3 3.5 0.0 0.0 (0.8) 7.0 10.5 3.3 0.0 0.0 (0.8) 13.0
Oil (million bbls) 38.5 1.0 0.0 (16.9) (1.1) 21.5 54.9 (2.2) 0.0 (22.2) (1.1) 29.4
All Products (million BOE) 68.2 11.5 0.0 (16.9) (5.6) 57.2 110.4 8.4 0.0 (22.2) (5.6) 91.0
Geographical Area 2C Contingent Resources
All
Pro
du
cts
(m
illi
on
B
OE
) 3
0 J
un
e 2
01
3
Re
visio
ns (
mil
lio
n B
OE
)
Tra
nsfe
rs t
o P
etr
ole
um
R
ese
rve
s (
mil
lio
n B
OE
)
Ext
en
sio
ns a
nd
D
isco
veri
es (
mil
lio
nB
OE
)
Acq
uis
itio
ns a
nd
D
ive
stm
en
ts
(mil
lio
n B
OE
)
All
Pro
du
cts
(m
illi
on
B
OE
) 3
0 J
un
e 2
01
4
Sa
les G
as (
PJ)
30
Ju
ne
2
01
4
LP
G (
K t
on
ne
s)
30
Ju
ne
2
01
4
Co
nd
en
sa
te (
mil
lio
n
bb
ls)
30
Ju
ne
20
14
Oil
(m
illi
on
bb
ls)
at
30
Ju
ne
20
14
New Zealand
Taranaki Basin 1.7 (1.1) (0.5) 0.0 0.0 0.0 0.0 0.0 0.0 0.0
South East Australia
Bass Basin 36.0 0.0 0.0 0.0 0.0 36.0 131.8 286.5 6.4 4.3
Otway Basin 1.8 0.0 0.0 0.0 0.0 1.8 10.9 0.0 0.0 0.0
Western Australia
Offshore Perth Basin 0.6 0.0 0.0 0.0 0.0 0.6 0.0 0.0 0.0 0.6
Onshore Perth Basin 7.1 0.0 0.0 0.0 0.0 7.1 40.6 0.0 0.3 0.0
United States of America
Sugarloaf AMI 5.0 10.1 (2.0) 0.0 0.0 13.2 33.4 341.6 3.7 0.0
Indonesia
North West Natuna PSC 14.8 2.0 0.0 0.0 (8.4) 8.4 0.0 0.0 0.0 8.4
Other Indonesia 29.1 (19.7) 0.0 0.0 0.0 9.5 56.8 0.0 0.0 0.0
AWE Aggregated 96.2 (8.7) (2.5) 0.0 (8.4) 76.6 273.6 628.1 10.4 13.3

117AWE LIMITED ANNUAL REPORT 2014
Notes:1. The reserves and contingent resource statement:
a. is based on and fairly represents information and supporting
documentation prepared by and under the supervision of qualifi ed
petroleum reserves and resource evaluators: Ian Palmer (AWE
General Manager, Development) and Neil Tupper (AWE General
Manager, Exploration and Geoscience). Mr Palmer, a member
of Society of Petroleum Engineers, holds a Bachelor Degree in
Engineering and has 33 years’ experience in the practice of Petroleum
Engineering. Mr Tupper, a member of Society of Petroleum Engineers
and American Association of Petroleum Geologists, holds MSc in
Sedimentology and its Applications and BSc (Hons) in Geology.
Mr Tupper has over 30 years of industry experience with specifi c
expertise in strategic planning, portfolio analysis, prospect evaluation,
technical due diligence and peer review, reserves and resource
assessment, unitisation and business development. Both qualifi ed
petroleum reserves and resource evaluators have consented in
writing to the inclusion of this information in the form and context in
which it appears.
b. as a whole, has been approved by the qualifi ed petroleum reserves
and resource evaluators referred to in note 1.a.
c. has been issued with the prior consent of the qualifi ed petroleum
reserves and resource evaluators referred to in note 1.a as to the
form and context in which the estimated petroleum reserves and
contingent resources and the supporting information appear in the
annual report.
2. The AWE reserves and contingent resource report as at 30 June 2014
was prepared in accordance with the SPE/AAPG/WPC/SPEE Petroleum
Resources Management System guidelines of November 2011.
3. To ensure accuracy and compliance of reserves and resource
estimations, AWE has put in place a robust process which incorporates
the following governance arrangements and internal controls:
a. AWE Technical Reserves Review Panel carries out an in-depth
technical and economic review of all proposed reserves and
resources. The Panel consisting of the Group Reserves Coordinator,
two qualifi ed Petroleum Reserves and Resource Evaluators and
Group Planning and Treasury Manager meets as a minimum every six
months or when any material changes trigger an ASX announcement
triggered by the continuous disclosure requirements.
b. Governed by the AWE Reserves Committee Charter, which is formally
reviewed and adopted by the Board, the AWE Reserves Committee
reviews and endorses reserves and resource proposal by the
Technical Reserves Review Committee. The Committee meets as a
minimum every six months or when any material changes trigger
an ASX announcement triggered by the continuous disclosure
requirements. An independent non-executive director, who is a
member of the AWE Audit and Governance Committee and who
has an extensive international experience in petroleum geoscience,
attends the AWE Reserves Committee. Any material changes to
previously publicly reported reserves endorsed by the AWE Reserves
Committee will be immediately reported to the Managing Director for
consideration for disclosure to ASX under the continuous disclosure
requirements of the ASX Listing Rules.
c. The endorsed reserves and resource evaluations are reported to the
AWE Audit and Governance Committee and form an integral part of
the half-year and annual fi nancial reporting.
d. The AWE practice is to initiate independent audits for those assets
with signifi cant reserves and/or resource potential on a semi-regular
basis, typically at least once every two years subject to the materiality
of the asset, complexity of the fi eld and amount of new data that has
become available. The purpose is to ensure that AWE reserve and
resource assessments receive external and independent challenge
with respect to methodology, technical validity and commercial rigour.
4. The company intends to develop any material concentrations of
undeveloped petroleum reserves in material oil and gas projects. AWE
actively supports the required engineering and commercial work to
achieve fi nal investment decisions for material undeveloped reserves in
Bass basin, Otway basin, Sugarloaf AMI and North West Natuna PSC.
5. Unless stated otherwise, all petroleum reserves and 2C contingent
resource quantities represent AWE net economic share, which may
differ from the percentage interest outlined in the AWE Tenements table
(reference), as per terms and conditions of Production Sharing Contracts
and/or other contractual arrangements, such as overriding royalties.
6. Deterministic method of reserve estimation was applied for all assets.
7. Note that the aggregated 1P reserves volumes may be a very
conservative estimate due to the portfolio effects of the arithmetic
summation.
8. Contingent resources reported are un-risked and it is not certain that
these resources will be commercially viable to produce;
9. Taranaki basin: excluding production, movements in the total 1P and
2P reserves result from an acquisition of additional 15% interest (ASX
announcements of October 3, 2013 and December 6, 2013) and the
transfers from contingent resources related to development drilling in
Pateke fi eld (ASX announcements of March-May 2014). Uncommercial
contingent resources are written-off due to no intent of further
development drilling.
10. Otway basin: no material changes revisions to 1P and 2P reserves; small
revisions are driven by latest fi eld performance.
11. Offshore Perth Basin: revisions to 1P and 2P reserves stem from
improved production performance trend following a change in the water
injection distribution.
12. Onshore Perth basin: revisions to 1P and 2P reserves are performance based.
13. 100% of AWE unconventional reserves are attributed to the Sugarloaf
Area of Mutual Interest (AMI) project with wells completed in the Eagle
Ford Shale and Austin Chalk formations.
14. Sugarloaf AMI: material 1P and 2P reserves revisions and reclassifi cations
are a consequence of development drilling and completion of new wells
(in line with the ASX announcement of May 20, 2014). Material changes in
the 2C contingent resources are associated with the potential large-scale
development drilling of the Austin Chalk, subject to the results of the on-
going appraisal drilling and advise of the Operator.
15. North West Natuna: material changes are the result of a 50% interest
share divestment (ASX announcement of November 25, 2013).
16. Other Indonesia: negative revisions to the 2C contingent resources are
the result of a write-off of Anambas 2C contingent resources and a
revision to the Lengo fi eld (Bulu PSC) recovery estimate. The company is
in the process of applying for the relinquishment of Anambas production
sharing contract.
17. Independent reserves and contingent resource reviews as at 31st
December 2013 were carried out for the following assets: Sugarloaf AMI
by DeGolyer and MacNaughton, Casino-Henry-Netherby fi elds (Otway
basin) by Gaffney-Cline and Associates and Cliff Head fi eld (North Perth
basin) by Resource Investment Strategy Consultants.
18. Numbers may not add due to rounding.
19. Conversion factors used:
a. Sales Gas: 6 PJ = 1 million BOE
b. LPG: 1 tonne =11.6 BOE
c. Oil: 1 barrel =1 BOE
d. Condensate: 1 barrel =1 BOE

118 AWE LIMITED ANNUAL REPORT 2014
P R O D U C T I O N A N D E X P L O R A T I O N P E R M I T S
PRODUCTION AND EXPLORATION PERMITS As at 30 June 2014
Production Geographical Area
Joint Venture Interest
Australia
Offshore Perth Basin WA-31-L Cliff Head 57.5%
Onshore Perth Pasin L1/L2 Dongara
& Yardarino
100%
L1/L2 Hovea & Eremia 50%
L1/L2 Corybas 50%
L4/L5 Woodada 100%
L7 Mt Horner 100%
L11 Beharra Springs,
Redback
33%
L14 Jingemia 44.14%
Bass Basin T/L1 Yolla 46.25%
Otway Basin VIC/L24 Casino 25%
VIC/L30 Henry, Netherby 25%
New Zealand
Taranaki Basin1 PMP38158 Tui 57.5%
USA
Karnes County, Texas Sugarloaf AMI2 10%
Exploration Geographical Area
Joint Venture Interest
Australia
Onshore Peth Basin EP320 33%
EP413 44.25%
EP455 81.50%
Carnarvon Basin WA497P 100%
Bass Basin T/18P 44.75%
Otway Basin VIC/RL11 25%
VIC/RL12 25%
VIC/P44 25%
VIC/P67 60%
New Zealand
Taranaki Basin1 PEP55768 51%
Indonesia
Java Sea Bulu PSC 42.50%
East Muriah PSC 50%
North Madura PSC 50%
Terumbu PSC 100%
Titan PSC 40%
Natuna Sea Northwest Natuna PSC 50%
Anambas PSC 100%
Yemen
Masilah Basin Block 74 29.75%
Shabwa Basin Block 7 19.25%
1. Subject to a Net Cash Interest payable to the previous owners of a subsidiary of the company (AWE Taranaki Limited, previously New Zealand Overseas Petroleum Limited), if returns from the Tui Area oil project in PMP 38158 exceed certain benchmark levels.
2. The Sugarloaf AMI is subject to landowner royalties. These royalties are approximately 25%.
3. The company is also entitled to a Net Profi ts Royalty at rates varying from 7.5% to 8.3% from the Tintaburra fi eld in ATP 299P. This royalty will be received when gross revenues from the permit exceed the sum of total expenditures from the permit.

119AWE LIMITED ANNUAL REPORT 2014
S T O C K E X C H A N G E A N D S H A R E H O L D E R I N F O R M A T I O N
STOCK EXCHANGE AND SHAREHOLDER INFORMATIONAs at 19 September 2014
Issued capital
The Company had 522,696,385 fully paid ordinary
shares on issue.
Voting rights
Article 14 of the Company’s Constitution details the
voting rights of members. This Article provides that, on
a show of hands, every member present in person or by
proxy shall have one vote and, upon a poll, shall have
one vote for each share held.
Share rights
The Company had on issue 10,170,976 share rights
under the Long Term Performance Benefi t Plan.
Distribution of equity security holders
Number of ordinary
shareholders
1 – 1,000 4,906
1,001 – 5,000 7,939
5,001 – 10,000 3,128
10,001 – 100,000 2,850
100,001 – Over 126
18,949
There were 1,228 shareholders with less than a
marketable parcel of 254 shares.
On-market buy-back
There is no current on-market buy-back.
Other information
AWE Limited, incorporated and domiciled in Australia,
is a publicly listed company limited by shares.
Twenty largest quoted equity security holders
The twenty largest shareholders were:
Shareholder Number
Ellerston Capital 56,296,179
Norges Bank 33,361,515
Dimensional Fund Advisors 31,415,596
Vinva Investment Management 31,388,293
AMP Limited 28,042,584
CBA 26,286,707
Substantial shareholders
The number of shares held by substantial shareholders and their associates
are set out below:
Shareholder Number
HeldPercentage of Issued Capital
JP Morgan Nominees Australia Limited 143,792,590 27.51
HSBC Custody Nominees (Australia) Limited 63,061,429 12.06
National Nominees Limited 62,172,745 11.89
Citicorp Nominees Pty Limited 54,580,639 10.44
BNP Paribas Noms Pty Ltd 20,807,143 3.98
AMP Life Limited 7,149,714 1.37
Citicorp Nominees Pty Limited 6,676,824 1.28
Key Resource Analysts Ltd 2,812,042 0.54
Mirrabooka Investments Limited 2,264,028 0.43
QIC Limited 2,234,809 0.43
Forsyth Barr Custodians Ltd 1,875,932 0.36
HSBC Custody Nominees (Australia) Limited 1,749,661 0.33
Catholic Church Insurance Limited 1,385,000 0.26
UBS Nominees Pty Ltd 1,236,472 0.24
Neweconomy COM AU Nominees Pty Limited 996,388 0.19
Mr Bruce Phillips 983,700 0.19
UBS Wealth Management Australia Nominees Pty Ltd 901,538 0.17
Brispot Nominees Pty Ltd 899,546 0.17
Bruce J Phillips Pty Limited 890,000 0.17
Navigator Australia Ltd 872,435 0.17
Total 377,342,635 72.19
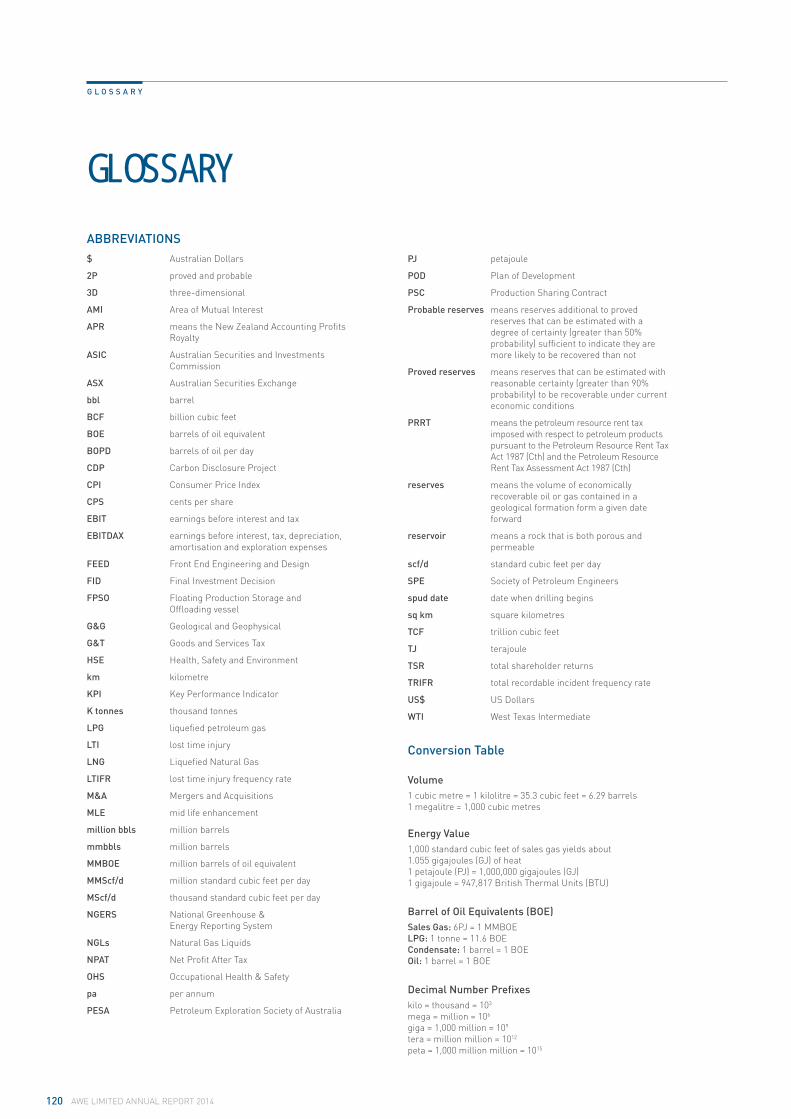
120 AWE LIMITED ANNUAL REPORT 2014
G L O S S A R Y
GLOSSARY
ABBREVIATIONS
$ Australian Dollars
2P proved and probable
3D three-dimensional
AMI Area of Mutual Interest
APR means the New Zealand Accounting Profi ts
Royalty
ASIC Australian Securities and Investments
Commission
ASX Australian Securities Exchange
bbl barrel
BCF billion cubic feet
BOE barrels of oil equivalent
BOPD barrels of oil per day
CDP Carbon Disclosure Project
CPI Consumer Price Index
CPS cents per share
EBIT earnings before interest and tax
EBITDAX earnings before interest, tax, depreciation,
amortisation and exploration expenses
FEED Front End Engineering and Design
FID Final Investment Decision
FPSO Floating Production Storage and
Offl oading vessel
G&G Geological and Geophysical
G&T Goods and Services Tax
HSE Health, Safety and Environment
km kilometre
KPI Key Performance Indicator
K tonnes thousand tonnes
LPG liquefi ed petroleum gas
LTI lost time injury
LNG Liquefi ed Natural Gas
LTIFR lost time injury frequency rate
M&A Mergers and Acquisitions
MLE mid life enhancement
million bbls million barrels
mmbbls million barrels
MMBOE million barrels of oil equivalent
MMScf/d million standard cubic feet per day
MScf/d thousand standard cubic feet per day
NGERS National Greenhouse &
Energy Reporting System
NGLs Natural Gas Liquids
NPAT Net Profi t After Tax
OHS Occupational Health & Safety
pa per annum
PESA Petroleum Exploration Society of Australia
PJ petajoule
POD Plan of Development
PSC Production Sharing Contract
Probable reserves means reserves additional to proved
reserves that can be estimated with a
degree of certainty (greater than 50%
probability) suffi cient to indicate they are
more likely to be recovered than not
Proved reserves means reserves that can be estimated with
reasonable certainty (greater than 90%
probability) to be recoverable under current
economic conditions
PRRT means the petroleum resource rent tax
imposed with respect to petroleum products
pursuant to the Petroleum Resource Rent Tax
Act 1987 (Cth) and the Petroleum Resource
Rent Tax Assessment Act 1987 (Cth)
reserves means the volume of economically
recoverable oil or gas contained in a
geological formation form a given date
forward
reservoir means a rock that is both porous and
permeable
scf/d standard cubic feet per day
SPE Society of Petroleum Engineers
spud date date when drilling begins
sq km square kilometres
TCF trillion cubic feet
TJ terajoule
TSR total shareholder returns
TRIFR total recordable incident frequency rate
US$ US Dollars
WTI West Texas Intermediate
Conversion Table
Volume
1 cubic metre = 1 kilolitre = 35.3 cubic feet = 6.29 barrels
1 megalitre = 1,000 cubic metres
Energy Value
1,000 standard cubic feet of sales gas yields about
1.055 gigajoules (GJ) of heat
1 petajoule (PJ) = 1,000,000 gigajoules (GJ)
1 gigajoule = 947,817 British Thermal Units (BTU)
Barrel of Oil Equivalents (BOE)
Sales Gas: 6PJ = 1 MMBOE
LPG: 1 tonne = 11.6 BOE
Condensate: 1 barrel = 1 BOE
Oil: 1 barrel = 1 BOE
Decimal Number Prefi xes
kilo = thousand = 103
mega = million = 106
giga = 1,000 million = 109
tera = million million = 1012
peta = 1,000 million million = 1015

121AWE LIMITED ANNUAL REPORT 2014
F I V E Y E A R F I N A N C I A L S U M M A R Y
FIVE YEAR FINANCIALSUMMARY
Year to June (All fi gures in $000’s) 2014 2013 2012 2011 2010
Summary Profi t and Loss
Revenue 329,291 301,774 299,727 306,071 355,158
Amortisation (117,575) (105,020) (80,538) (102,556) (96,219)
Results from operating activities 106,513 60,881 (58,854) (147,020) (13,379)
Net fi nance (cost)/benefi t (10,090) (9,420) (4,282) (13,515) (10,513)
Profi t/(loss) before tax 96,423 51,431 (63,136) (160,535) (23,892)
Tax (expense)/benefi t (33,923) (31,394) (3,360) 42,980 (5,038)
Profi t/(loss) for the year 62,500 20,037 (66,496) (117,555) (28,930)
Summary Balance Sheet
Total current assets 178,293 103,381 92,790 180,624 215,853
Total non-current assets 1,024,250 1,078,128 969,218 934,774 1,101,233
Total assets 1,202,543 1,181,509 1,062,008 1,115,398 1,317,086
Total current liabilities 121,855 91,175 88,575 64,550 93,921
Total non-current liabilities 139,513 201,363 118,411 99,922 125,346
Total liabilities 261,368 292,538 206,986 164,472 219,267
Total shareholders equity 941,175 888,971 855,022 950,926 1,097,819
Summary Cashfl ows
Net cash provided by operating activities 123,686 118,190 123,868 139,853 108,068
Net cash used in investing activities (45,555) (175,780) (187,555) (157,746) (307,465)
Net cash provided by / (used in) fi nancing activities 77,834 56,274 (15,387) 9,645 1,827
Cash at end of fi nancial year 42,144 41,131 42,759 117,168 135,322

122 AWE LIMITED ANNUAL REPORT 2014
C O R P O R A T E D I R E C T O R Y
CORPORATE DIRECTORY
AWE Limited
ABN 70 077 897 440
PO Box 733, North Sydney NSW 2059
Place of Incorporation
New South Wales, Australia
Board of Directors
B.J. Phillips (Chairman)
B.F.W. Clement (Managing Director)
R.J. Betros
V. Braach-Maksvytis
D.I. McEvoy
K.L.C. Penrose
K.G. Williams
Company Secretary
N.F. Kelly
Registered offi ce and Principal Business Offi ce
Level 16, 40 Mount Street
North Sydney NSW 2060
Australia
Telephone: +61-2-8912 8000
Facsimile: +61-2-9460 0176
Email: [email protected]
Website: www.awexplore.com
Share Register
Computershare Investor Services Pty Limited
Level 3, 60 Carrington Street
Sydney NSW 2000 Australia
Telephone: +61-2-8234 5000
Facsimile: +61-2-8234 5050
Auditor
Ernst & Young
680 George Street
Sydney NSW 2000
Legal Advisers
Piper Alderman Lawyers
Level 23, Governor Macquarie Tower
1 Farrer Place
Sydney NSW 2000
Bankers
Westpac
Level 3, Westpac Place
275 Kent Street
Sydney NSW 2000
Stock Exchange
Australian Securities Exchange (Sydney) ASX Code: AWE

AWE is a dynamic Australian energy company focused on upstream oil and gas and related energy opportunities. Its diverse portfolio of exploration, development and production assets in Australia, New Zealand, Indonesia, China and the USA provides strong production and cash fl ow and signifi cant growth opportunities.
Established in 1997, the company employs over 100 people and has its head offi ce in Sydney and regional offi ces in Perth, New Plymouth and Jakarta. With strong technical and commercial foundations, AWE will continue to pursue exploration and development growth opportunities, primarily in Australasia and Asia.
The company is focused on achieving ambitious growth targets that will create substantial shareholder value. AWE is aiming to double production to 10 million BOE and triple Field EBITDAX to more than $500 million from its existing portfolio of assets by the end of 2018.
ascender.com.au

F I N A N C I A L S T A T E M E N T S
124 AWE LIMITED ANNUAL REPORT 2014
AWEXPLORE.COM
Related Documents