1 ANNOUNCEMENT OF FINAL RESULTS FOR THE YEAR ENDED 30 JUNE 2007 FINANCIAL HIGHLIGHTS Revenue : HK$15,047.1 million Profit attributable to shareholders : HK$2,005.4 million Earnings per share - basic : HK$1.01 Proposed final dividend per share : HK$0.30 RESULTS The board of directors (the “Board”) of NWS Holdings Limited (the “Company”) is pleased to announce the audited consolidated income statement of the Company and its subsidiary companies (collectively, the “Group”) for the year ended 30 June 2007 (“FY2007”) and the consolidated balance sheet of the Group as at 30 June 2007, together with comparative figures for the year ended 30 June 2006 (“FY2006”), as follows:

Welcome message from author
This document is posted to help you gain knowledge. Please leave a comment to let me know what you think about it! Share it to your friends and learn new things together.
Transcript
1
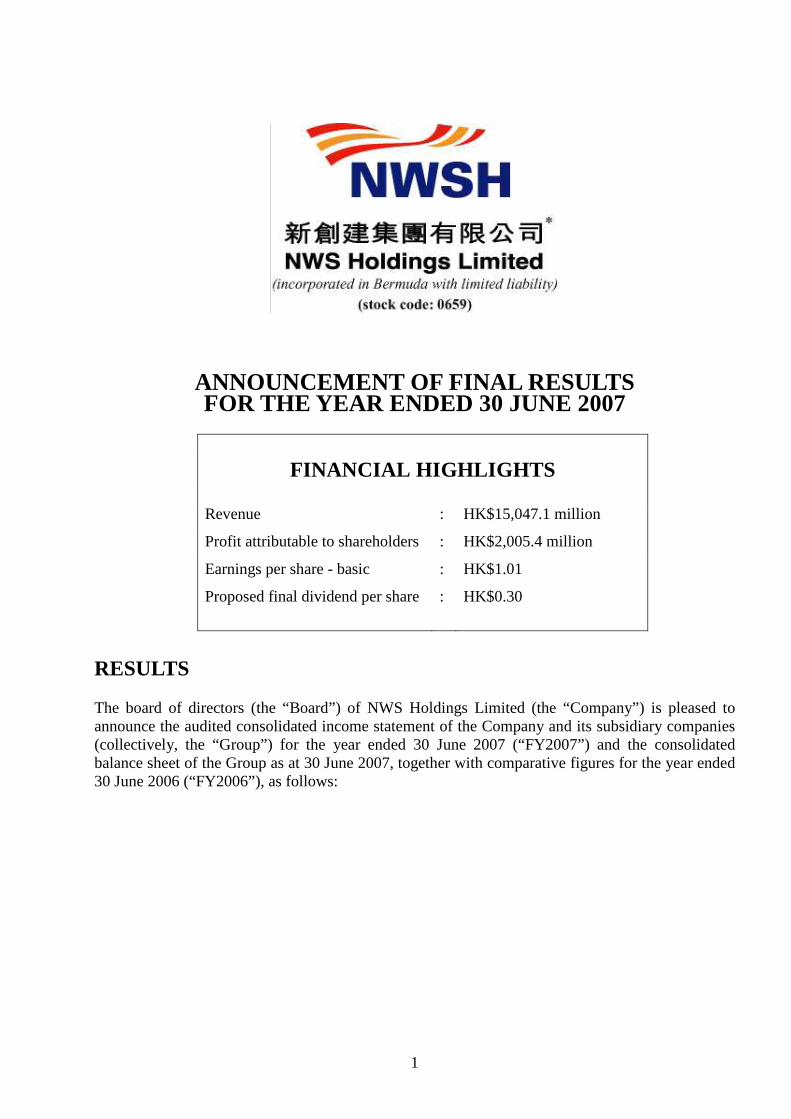
ANNOUNCEMENT OF FINAL RESULTS FOR THE YEAR ENDED 30 JUNE 2007
FINANCIAL HIGHLIGHTS Revenue : HK$15,047.1 million
Profit attributable to shareholders : HK$2,005.4 million
Earnings per share - basic : HK$1.01
Proposed final dividend per share : HK$0.30
RESULTS The board of directors (the “Board”) of NWS Holdings Limited (the “Company”) is pleased to announce the audited consolidated income statement of the Company and its subsidiary companies (collectively, the “Group”) for the year ended 30 June 2007 (“FY2007”) and the consolidated balance sheet of the Group as at 30 June 2007, together with comparative figures for the year ended 30 June 2006 (“FY2006”), as follows:
2
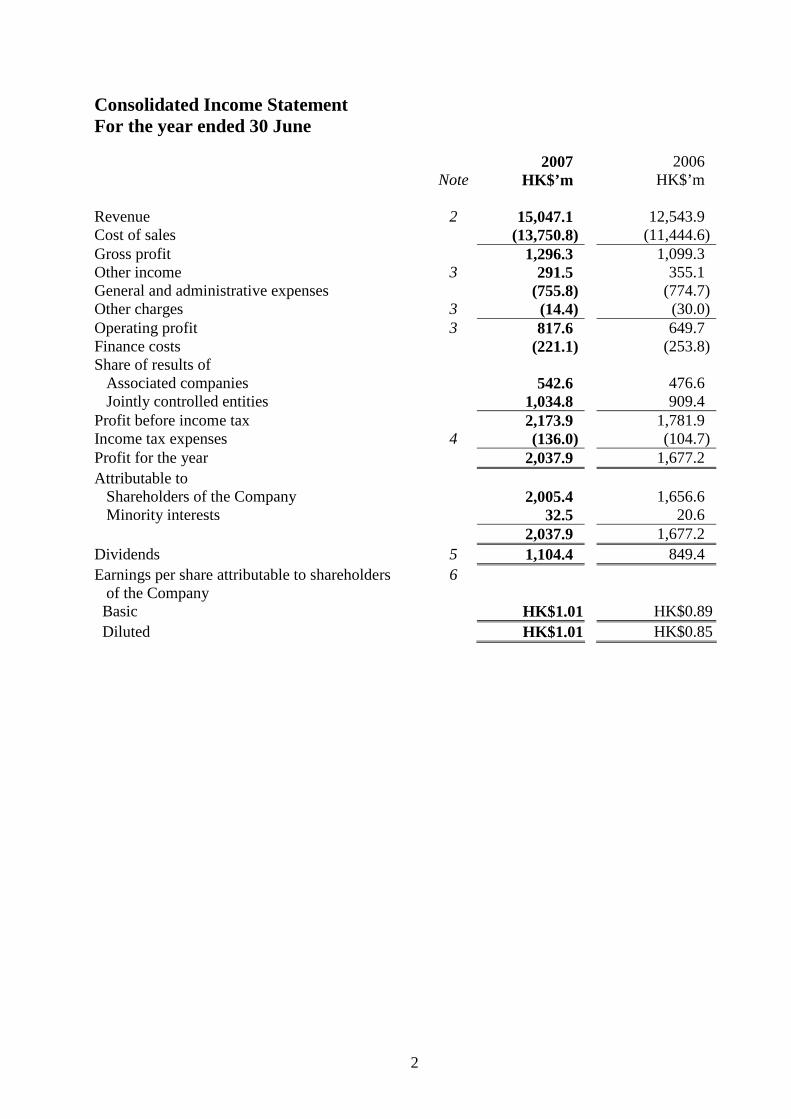
Consolidated Income Statement For the year ended 30 June
Note 2007
HK$’m
2006 HK$’m
Revenue 2 15,047.1 12,543.9 Cost of sales (13,750.8) (11,444.6) Gross profit 1,296.3 1,099.3 Other income 3 291.5 355.1 General and administrative expenses (755.8) (774.7) Other charges 3 (14.4) (30.0) Operating profit 3 817.6 649.7 Finance costs (221.1) (253.8) Share of results of Associated companies 542.6 476.6 Jointly controlled entities 1,034.8 909.4 Profit before income tax 2,173.9 1,781.9 Income tax expenses 4 (136.0) (104.7) Profit for the year 2,037.9 1,677.2 Attributable to
Shareholders of the Company 2,005.4 1,656.6 Minority interests 32.5 20.6
2,037.9 1,677.2 Dividends 5 1,104.4 849.4 Earnings per share attributable to shareholders
of the Company 6
Basic HK$1.01 HK$0.89 Diluted HK$1.01 HK$0.85
3
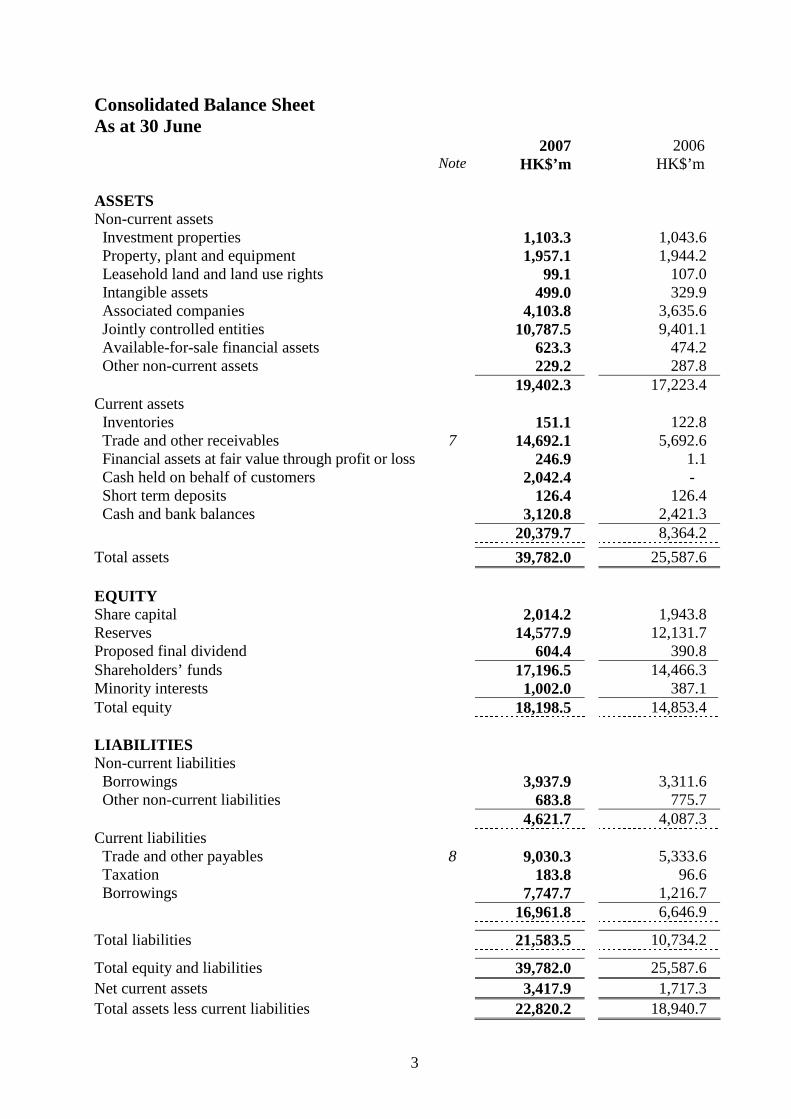
Consolidated Balance Sheet As at 30 June 2007 2006 Note HK$’m HK$’m ASSETS Non-current assets Investment properties 1,103.3 1,043.6 Property, plant and equipment 1,957.1 1,944.2 Leasehold land and land use rights 99.1 107.0 Intangible assets 499.0 329.9 Associated companies 4,103.8 3,635.6 Jointly controlled entities 10,787.5 9,401.1 Available-for-sale financial assets 623.3 474.2 Other non-current assets 229.2 287.8 19,402.3 17,223.4 Current assets Inventories 151.1 122.8 Trade and other receivables 7 14,692.1 5,692.6 Financial assets at fair value through profit or loss 246.9 1.1 Cash held on behalf of customers 2,042.4 - Short term deposits 126.4 126.4 Cash and bank balances 3,120.8 2,421.3 20,379.7 8,364.2 Total assets 39,782.0 25,587.6 EQUITY Share capital 2,014.2 1,943.8 Reserves 14,577.9 12,131.7 Proposed final dividend 604.4 390.8 Shareholders’ funds 17,196.5 14,466.3 Minority interests 1,002.0 387.1 Total equity 18,198.5 14,853.4 LIABILITIES Non-current liabilities Borrowings 3,937.9 3,311.6 Other non-current liabilities 683.8 775.7 4,621.7 4,087.3 Current liabilities Trade and other payables 8 9,030.3 5,333.6 Taxation 183.8 96.6 Borrowings 7,747.7 1,216.7 16,961.8 6,646.9 Total liabilities 21,583.5 10,734.2 Total equity and liabilities 39,782.0 25,587.6 Net current assets 3,417.9 1,717.3 Total assets less current liabilities 22,820.2 18,940.7
4
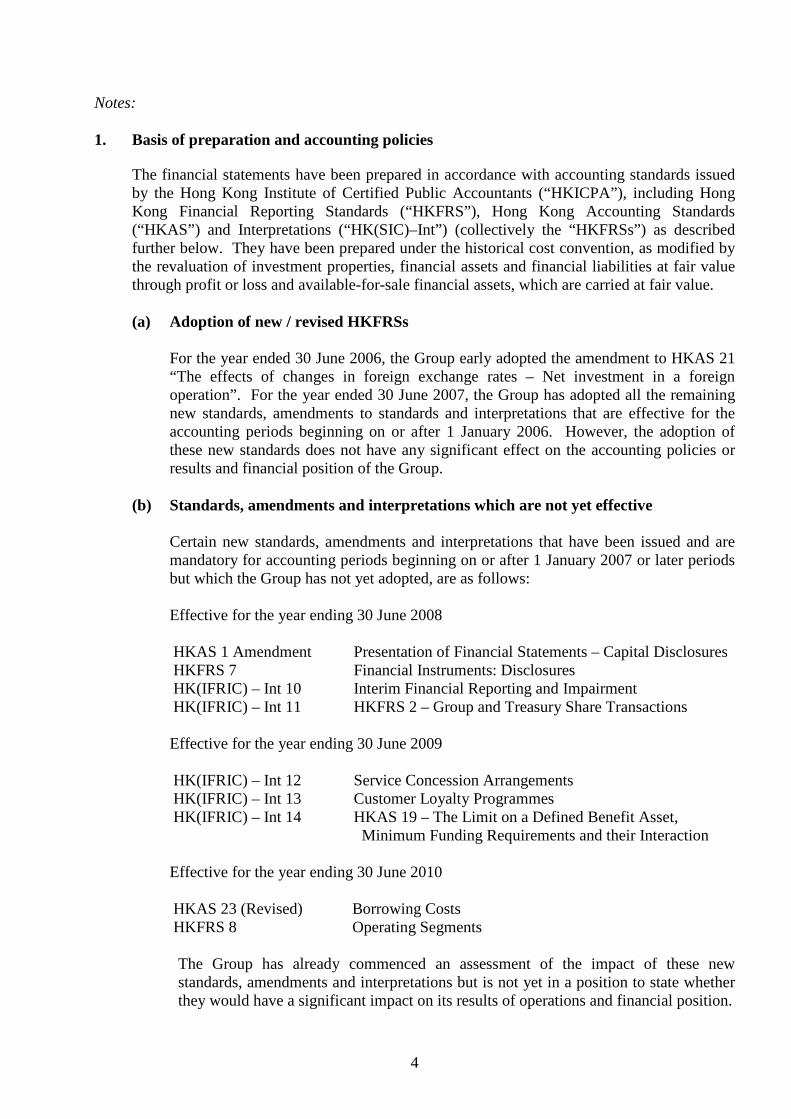
Notes: 1. Basis of preparation and accounting policies The financial statements have been prepared in accordance with accounting standards issued
by the Hong Kong Institute of Certified Public Accountants (“HKICPA”), including Hong Kong Financial Reporting Standards (“HKFRS”), Hong Kong Accounting Standards (“HKAS”) and Interpretations (“HK(SIC)–Int”) (collectively the “HKFRSs”) as described further below. They have been prepared under the historical cost convention, as modified by the revaluation of investment properties, financial assets and financial liabilities at fair value through profit or loss and available-for-sale financial assets, which are carried at fair value.
(a) Adoption of new / revised HKFRSs
For the year ended 30 June 2006, the Group early adopted the amendment to HKAS 21
“The effects of changes in foreign exchange rates – Net investment in a foreign operation”. For the year ended 30 June 2007, the Group has adopted all the remaining new standards, amendments to standards and interpretations that are effective for the accounting periods beginning on or after 1 January 2006. However, the adoption of these new standards does not have any significant effect on the accounting policies or results and financial position of the Group.
(b) Standards, amendments and interpretations which are not yet effective
Certain new standards, amendments and interpretations that have been issued and are
mandatory for accounting periods beginning on or after 1 January 2007 or later periods but which the Group has not yet adopted, are as follows:
Effective for the year ending 30 June 2008
HKAS 1 Amendment Presentation of Financial Statements – Capital Disclosures HKFRS 7 Financial Instruments: Disclosures HK(IFRIC) – Int 10 Interim Financial Reporting and Impairment HK(IFRIC) – Int 11 HKFRS 2 – Group and Treasury Share Transactions
Effective for the year ending 30 June 2009
HK(IFRIC) – Int 12 Service Concession Arrangements HK(IFRIC) – Int 13 Customer Loyalty Programmes HK(IFRIC) – Int 14 HKAS 19 – The Limit on a Defined Benefit Asset,
Minimum Funding Requirements and their Interaction
Effective for the year ending 30 June 2010
HKAS 23 (Revised) Borrowing Costs HKFRS 8 Operating Segments The Group has already commenced an assessment of the impact of these new standards, amendments and interpretations but is not yet in a position to state whether they would have a significant impact on its results of operations and financial position.
5
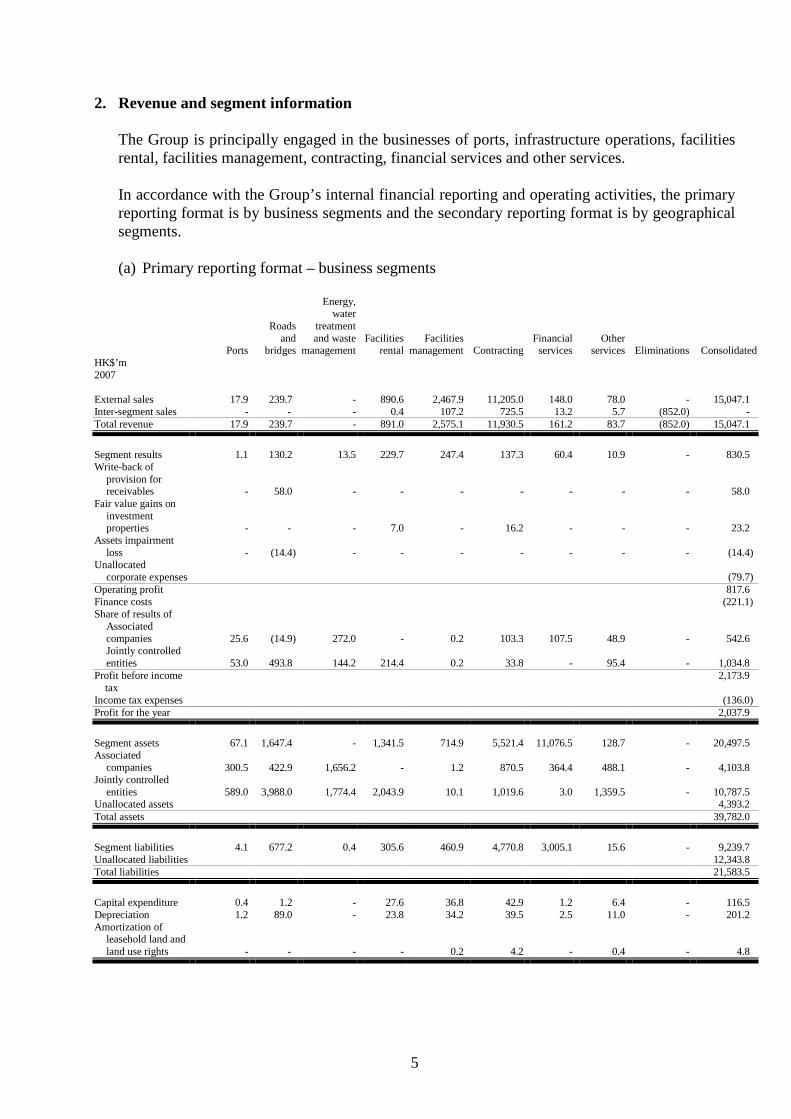
2. Revenue and segment information The Group is principally engaged in the businesses of ports, infrastructure operations, facilities rental, facilities management, contracting, financial services and other services. In accordance with the Group’s internal financial reporting and operating activities, the primary reporting format is by business segments and the secondary reporting format is by geographical segments.
(a) Primary reporting format – business segments
Energy, water Roads treatment and and waste Facilities Facilities Financial Other Ports bridges management rental management Contracting services services Eliminations Consolidated HK$’m 2007 External sales 17.9 239.7 - 890.6 2,467.9 11,205.0 148.0 78.0 - 15,047.1 Inter-segment sales - - - 0.4 107.2 725.5 13.2 5.7 (852.0) - Total revenue 17.9 239.7 - 891.0 2,575.1 11,930.5 161.2 83.7 (852.0) 15,047.1 Segment results 1.1 130.2 13.5 229.7 247.4 137.3 60.4 10.9 - 830.5 Write-back of
provision for receivables - 58.0 - - - - - - - 58.0
Fair value gains on investment properties - - - 7.0 - 16.2 - - - 23.2
Assets impairment loss - (14.4) - - - - - - - (14.4)
Unallocated corporate expenses
(79.7)
Operating profit 817.6 Finance costs (221.1) Share of results of
Associated companies 25.6 (14.9) 272.0 - 0.2 103.3 107.5 48.9 - 542.6 Jointly controlled entities 53.0 493.8 144.2 214.4 0.2 33.8 - 95.4 - 1,034.8
Profit before income tax
2,173.9
Income tax expenses (136.0) Profit for the year 2,037.9 Segment assets 67.1 1,647.4 - 1,341.5 714.9 5,521.4 11,076.5 128.7 - 20,497.5 Associated
companies 300.5 422.9 1,656.2 - 1.2 870.5 364.4 488.1 - 4,103.8 Jointly controlled
entities 589.0 3,988.0 1,774.4 2,043.9 10.1 1,019.6 3.0 1,359.5 - 10,787.5 Unallocated assets 4,393.2 Total assets 39,782.0 Segment liabilities 4.1 677.2 0.4 305.6 460.9 4,770.8 3,005.1 15.6 - 9,239.7 Unallocated liabilities 12,343.8 Total liabilities 21,583.5 Capital expenditure 0.4 1.2 - 27.6 36.8 42.9 1.2 6.4 - 116.5 Depreciation 1.2 89.0 - 23.8 34.2 39.5 2.5 11.0 - 201.2 Amortization of
leasehold land and land use rights - - - - 0.2 4.2 - 0.4 - 4.8
6
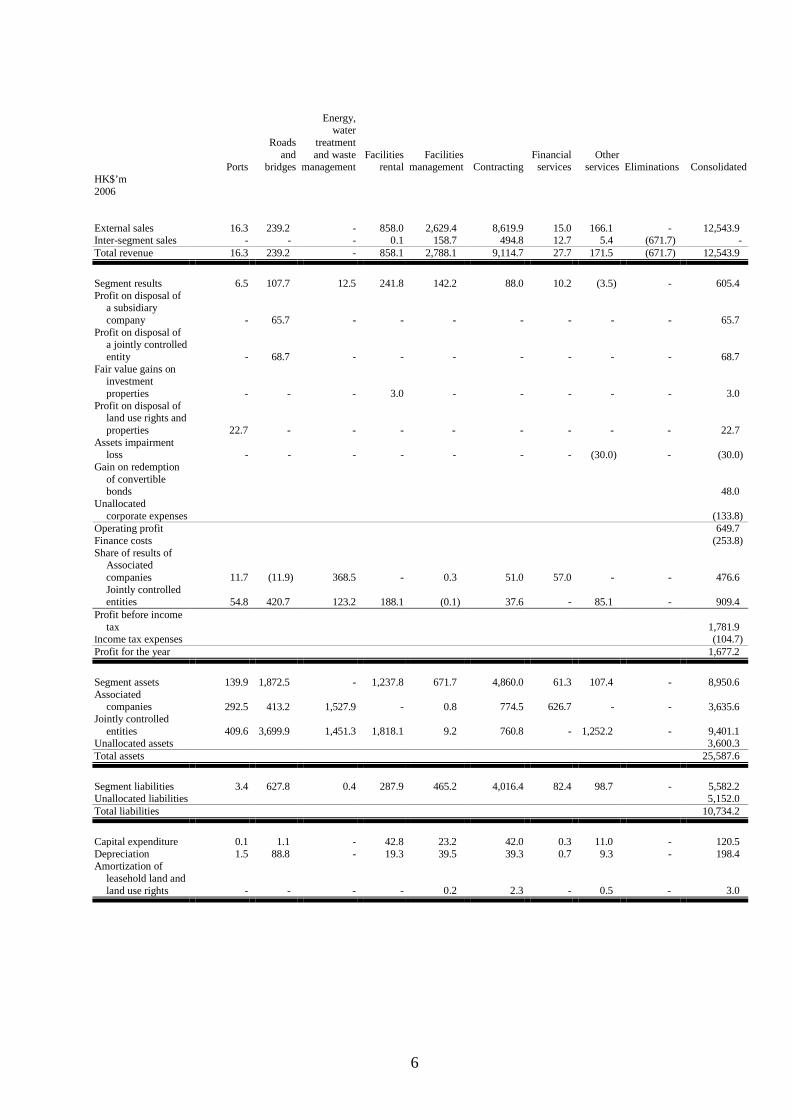
Energy, water Roads treatment and and waste Facilities Facilities Financial Other Ports bridges management rental management Contracting services services Eliminations Consolidated HK$’m 2006 External sales 16.3 239.2 - 858.0 2,629.4 8,619.9 15.0 166.1 - 12,543.9 Inter-segment sales - - - 0.1 158.7 494.8 12.7 5.4 (671.7) - Total revenue 16.3 239.2 - 858.1 2,788.1 9,114.7 27.7 171.5 (671.7) 12,543.9
Segment results 6.5 107.7 12.5 241.8 142.2 88.0 10.2 (3.5) - 605.4 Profit on disposal of
a subsidiary company - 65.7 - - - -
- - - 65.7 Profit on disposal of
a jointly controlled entity - 68.7 - - - -
- - - 68.7 Fair value gains on
investment properties - - - 3.0 - -
- - - 3.0 Profit on disposal of
land use rights and properties 22.7 - -
- - -
- - - 22.7 Assets impairment
loss - - -
- - -
- (30.0) - (30.0) Gain on redemption
of convertible bonds
48.0 Unallocated
corporate expenses
(133.8) Operating profit 649.7 Finance costs (253.8) Share of results of
Associated companies 11.7 (11.9) 368.5
- 0.3 51.0
57.0 - - 476.6
Jointly controlled entities 54.8 420.7 123.2 188.1 (0.1) 37.6
- 85.1 - 909.4
Profit before income tax
1,781.9
Income tax expenses (104.7) Profit for the year 1,677.2
Segment assets 139.9 1,872.5 - 1,237.8 671.7 4,860.0 61.3 107.4 - 8,950.6 Associated
companies 292.5 413.2 1,527.9 - 0.8 774.5
626.7 - - 3,635.6 Jointly controlled
entities 409.6 3,699.9 1,451.3 1,818.1 9.2 760.8
- 1,252.2 - 9,401.1 Unallocated assets 3,600.3 Total assets 25,587.6
Segment liabilities 3.4 627.8 0.4 287.9 465.2 4,016.4 82.4 98.7 - 5,582.2 Unallocated liabilities 5,152.0 Total liabilities 10,734.2
Capital expenditure 0.1 1.1 - 42.8 23.2 42.0 0.3 11.0 - 120.5 Depreciation 1.5 88.8 - 19.3 39.5 39.3 0.7 9.3 - 198.4 Amortization of
leasehold land and land use rights - - -
- 0.2 2.3
- 0.5 - 3.0
7
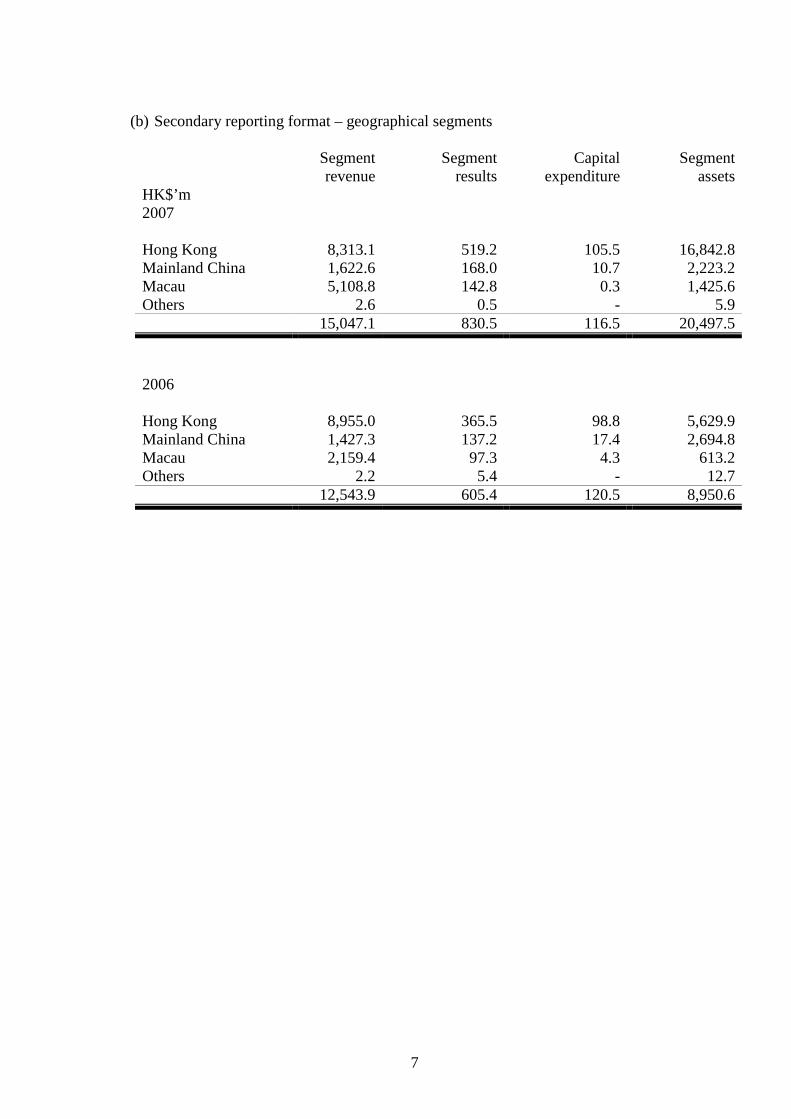
(b) Secondary reporting format – geographical segments
Segment Segment Capital Segment revenue results expenditure assets HK$’m 2007 Hong Kong 8,313.1 519.2 105.5 16,842.8 Mainland China 1,622.6 168.0 10.7 2,223.2 Macau 5,108.8 142.8 0.3 1,425.6 Others 2.6 0.5 - 5.9 15,047.1 830.5 116.5 20,497.5
2006 Hong Kong 8,955.0 365.5 98.8 5,629.9 Mainland China 1,427.3 137.2 17.4 2,694.8 Macau 2,159.4 97.3 4.3 613.2 Others 2.2 5.4 - 12.7 12,543.9 605.4 120.5 8,950.6
8
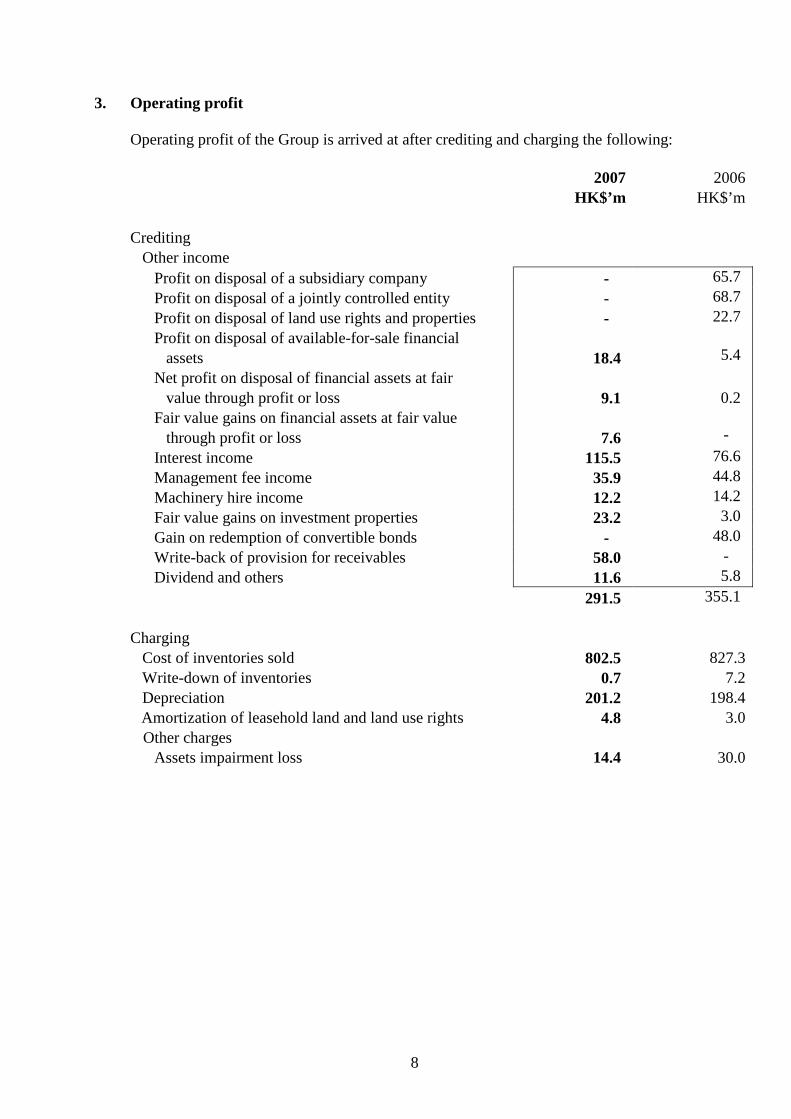
3. Operating profit
Operating profit of the Group is arrived at after crediting and charging the following: 2007 2006 HK$’m HK$’m Crediting Other income Profit on disposal of a subsidiary company - 65.7 Profit on disposal of a jointly controlled entity - 68.7 Profit on disposal of land use rights and properties - 22.7 Profit on disposal of available-for-sale financial
assets
18.4
5.4
Net profit on disposal of financial assets at fair value through profit or loss
9.1
0.2
Fair value gains on financial assets at fair value through profit or loss 7.6
-
Interest income 115.5 76.6 Management fee income 35.9 44.8 Machinery hire income 12.2 14.2 Fair value gains on investment properties 23.2 3.0 Gain on redemption of convertible bonds - 48.0 Write-back of provision for receivables 58.0 - Dividend and others 11.6 5.8 291.5 355.1 Charging Cost of inventories sold 802.5 827.3 Write-down of inventories 0.7 7.2 Depreciation 201.2 198.4 Amortization of leasehold land and land use rights 4.8 3.0 Other charges Assets impairment loss 14.4 30.0
9
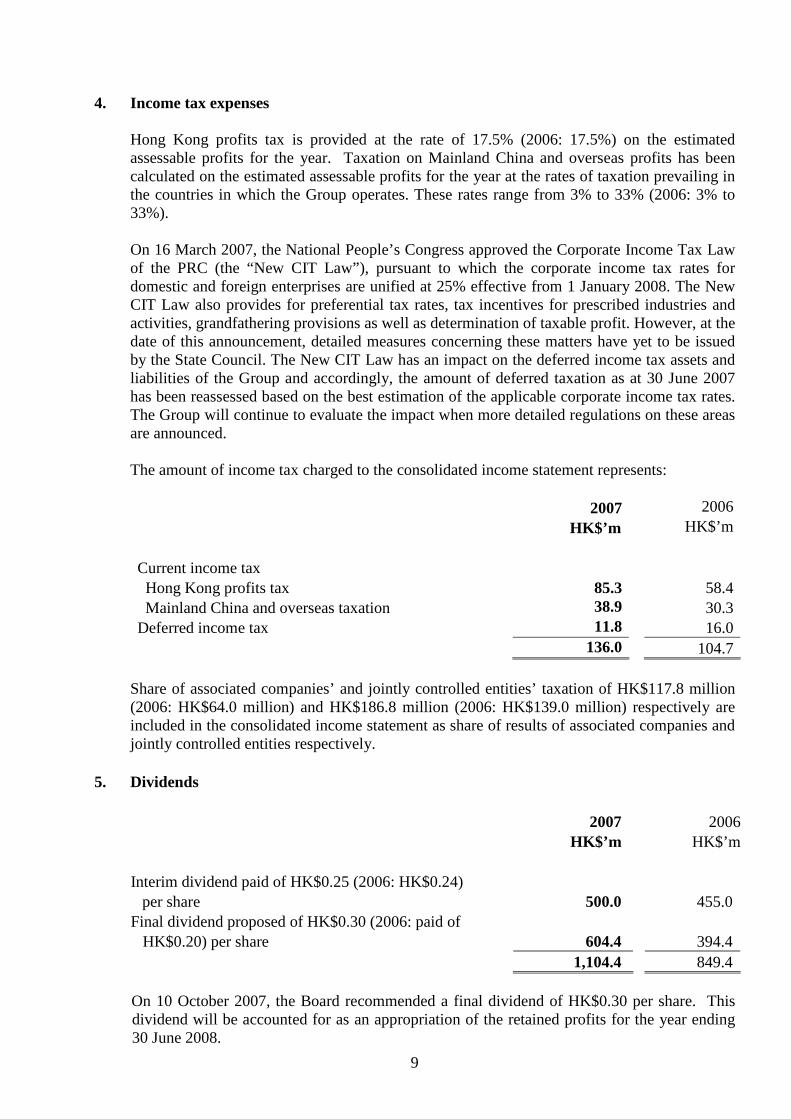
4. Income tax expenses
Hong Kong profits tax is provided at the rate of 17.5% (2006: 17.5%) on the estimated assessable profits for the year. Taxation on Mainland China and overseas profits has been calculated on the estimated assessable profits for the year at the rates of taxation prevailing in the countries in which the Group operates. These rates range from 3% to 33% (2006: 3% to 33%). On 16 March 2007, the National People’s Congress approved the Corporate Income Tax Law of the PRC (the “New CIT Law”), pursuant to which the corporate income tax rates for domestic and foreign enterprises are unified at 25% effective from 1 January 2008. The New CIT Law also provides for preferential tax rates, tax incentives for prescribed industries and activities, grandfathering provisions as well as determination of taxable profit. However, at the date of this announcement, detailed measures concerning these matters have yet to be issued by the State Council. The New CIT Law has an impact on the deferred income tax assets and liabilities of the Group and accordingly, the amount of deferred taxation as at 30 June 2007 has been reassessed based on the best estimation of the applicable corporate income tax rates. The Group will continue to evaluate the impact when more detailed regulations on these areas are announced. The amount of income tax charged to the consolidated income statement represents:
2007 2006 HK$’m HK$’m Current income tax Hong Kong profits tax 85.3 58.4 Mainland China and overseas taxation 38.9 30.3 Deferred income tax 11.8 16.0 136.0 104.7
Share of associated companies’ and jointly controlled entities’ taxation of HK$117.8 million (2006: HK$64.0 million) and HK$186.8 million (2006: HK$139.0 million) respectively are included in the consolidated income statement as share of results of associated companies and jointly controlled entities respectively.
5. Dividends
2007 2006 HK$’m HK$’m Interim dividend paid of HK$0.25 (2006: HK$0.24)
per share
500.0
455.0 Final dividend proposed of HK$0.30 (2006: paid of
HK$0.20) per share
604.4
394.4 1,104.4 849.4
On 10 October 2007, the Board recommended a final dividend of HK$0.30 per share. This dividend will be accounted for as an appropriation of the retained profits for the year ending 30 June 2008.
10
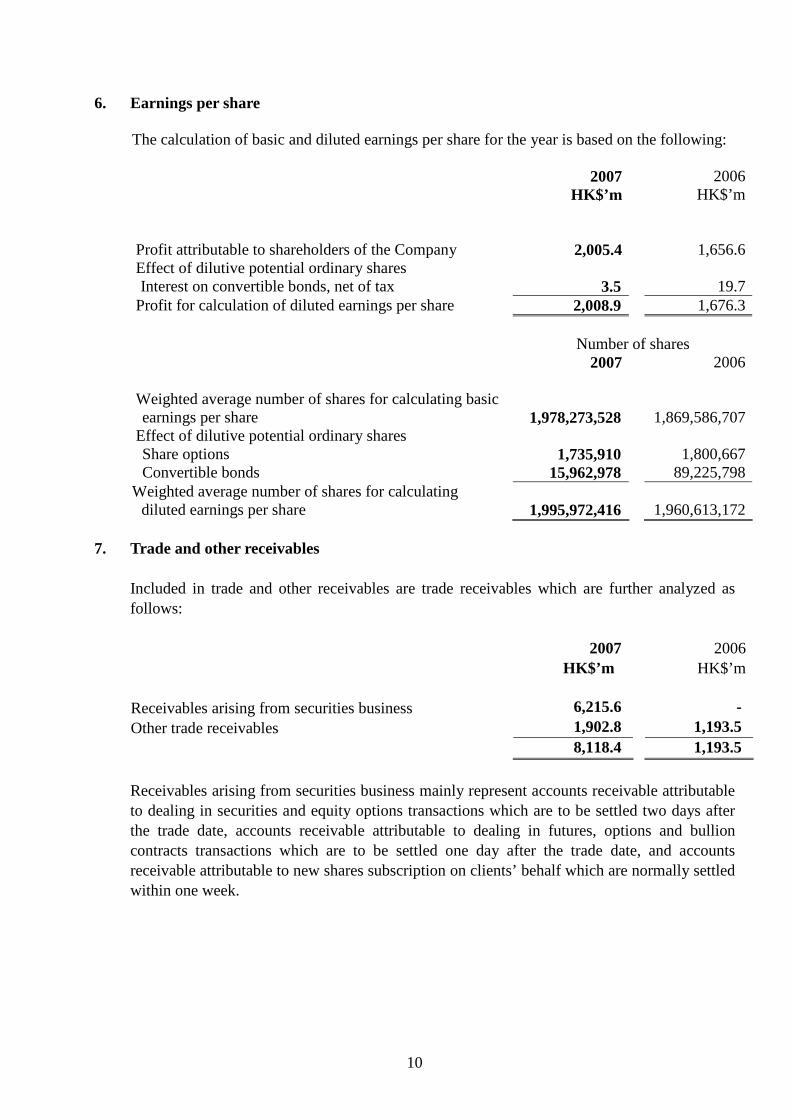
6. Earnings per share
The calculation of basic and diluted earnings per share for the year is based on the following:
2007 2006 HK$’m HK$’m Profit attributable to shareholders of the Company 2,005.4 1,656.6 Effect of dilutive potential ordinary shares Interest on convertible bonds, net of tax 3.5 19.7 Profit for calculation of diluted earnings per share 2,008.9 1,676.3 Number of shares 2007 2006 Weighted average number of shares for calculating basic
earnings per share
1,978,273,528
1,869,586,707 Effect of dilutive potential ordinary shares Share options 1,735,910 1,800,667 Convertible bonds 15,962,978 89,225,798 Weighted average number of shares for calculating
diluted earnings per share
1,995,972,416 1,960,613,172
7. Trade and other receivables
Included in trade and other receivables are trade receivables which are further analyzed as follows:
2007 2006 HK$’m HK$’m Receivables arising from securities business 6,215.6 - Other trade receivables 1,902.8 1,193.5 8,118.4 1,193.5
Receivables arising from securities business mainly represent accounts receivable attributable to dealing in securities and equity options transactions which are to be settled two days after the trade date, accounts receivable attributable to dealing in futures, options and bullion contracts transactions which are to be settled one day after the trade date, and accounts receivable attributable to new shares subscription on clients’ behalf which are normally settled within one week.
11
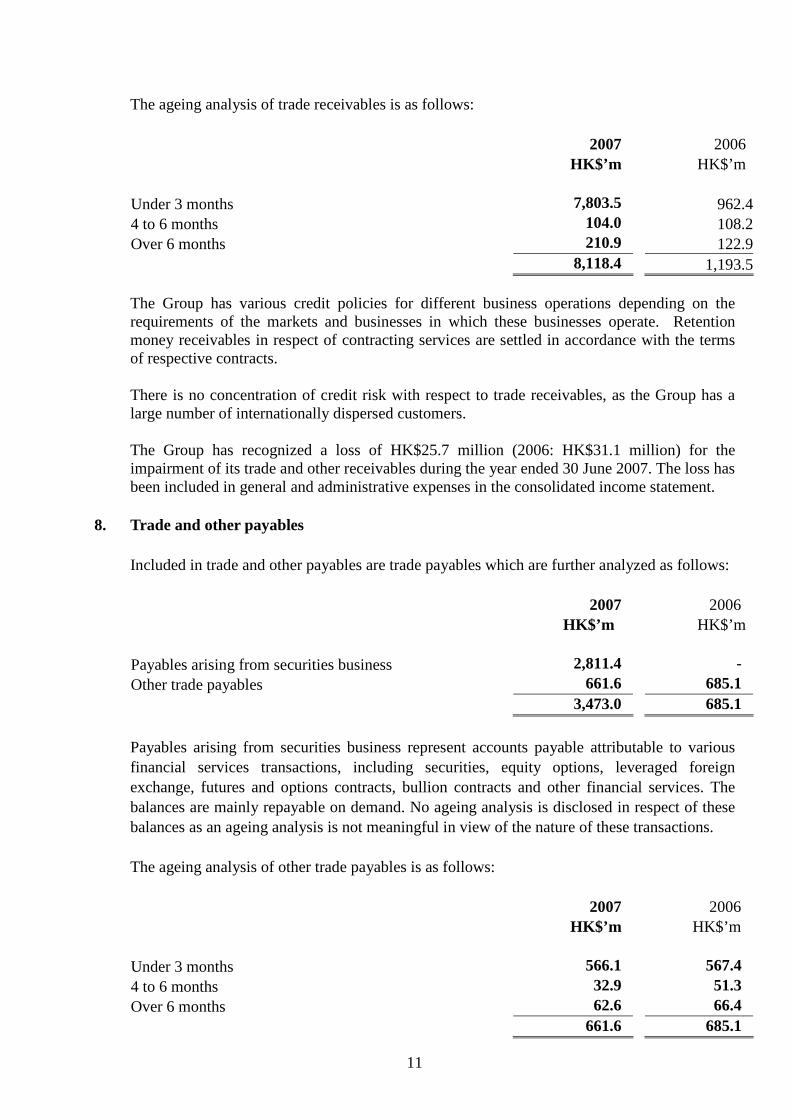
The ageing analysis of trade receivables is as follows:
2007 2006 HK$’m HK$’m Under 3 months 7,803.5 962.4 4 to 6 months 104.0 108.2 Over 6 months 210.9 122.9 8,118.4 1,193.5
The Group has various credit policies for different business operations depending on the requirements of the markets and businesses in which these businesses operate. Retention money receivables in respect of contracting services are settled in accordance with the terms of respective contracts.
There is no concentration of credit risk with respect to trade receivables, as the Group has a large number of internationally dispersed customers.
The Group has recognized a loss of HK$25.7 million (2006: HK$31.1 million) for the impairment of its trade and other receivables during the year ended 30 June 2007. The loss has been included in general and administrative expenses in the consolidated income statement.
8. Trade and other payables
Included in trade and other payables are trade payables which are further analyzed as follows:
2007 2006 HK$’m HK$’m Payables arising from securities business 2,811.4 - Other trade payables 661.6 685.1 3,473.0 685.1
Payables arising from securities business represent accounts payable attributable to various financial services transactions, including securities, equity options, leveraged foreign exchange, futures and options contracts, bullion contracts and other financial services. The balances are mainly repayable on demand. No ageing analysis is disclosed in respect of these balances as an ageing analysis is not meaningful in view of the nature of these transactions. The ageing analysis of other trade payables is as follows:
2007 2006 HK$’m HK$’m Under 3 months 566.1 567.4 4 to 6 months 32.9 51.3 Over 6 months 62.6 66.4 661.6 685.1
12
9. Comparative figures Certain comparative figures have been restated or reclassified to conform with current year’s presentation.
FINAL DIVIDEND The Board has resolved to recommend a final dividend for the year ended 30 June 2007 in scrip form equivalent to HK$0.30 per share (2006: HK$0.20 per share) with a cash option to shareholders registered on 26 November 2007. Together with the interim dividend of HK$0.25 per share (2006: HK$0.24 per share) paid in June 2007, total distributions for the year ended 30 June 2007 will thus be HK$0.55 per share (2006: HK$0.44 per share). Subject to the Listing Committee of The Stock Exchange of Hong Kong Limited (the “Hong Kong Stock Exchange”) granting the listing of and permission to deal in the new shares, each shareholder will be allotted fully paid shares having an aggregate market value equal to the total amount which such shareholder could elect to receive in cash and they will be given the option to elect to receive payment in cash of HK$0.30 per share instead of the allotment of shares. Full details of the final scrip dividend will be set out in a circular to be sent to shareholders together with a form of election for cash on or about 26 November 2007. The register of members of the Company will be closed from Wednesday, 21 November 2007 to Monday, 26 November 2007, both dates inclusive, during which period no transfer of shares will be registered. In order to qualify for the proposed final dividend, all properly completed transfer forms accompanied by the relevant share certificates must be lodged with Tricor Standard Limited, the Company’s branch share registrars in Hong Kong, at 26/F, Tesbury Centre, 28 Queen’s Road East, Hong Kong not later than 4:00 p.m. on Tuesday, 20 November 2007.
13
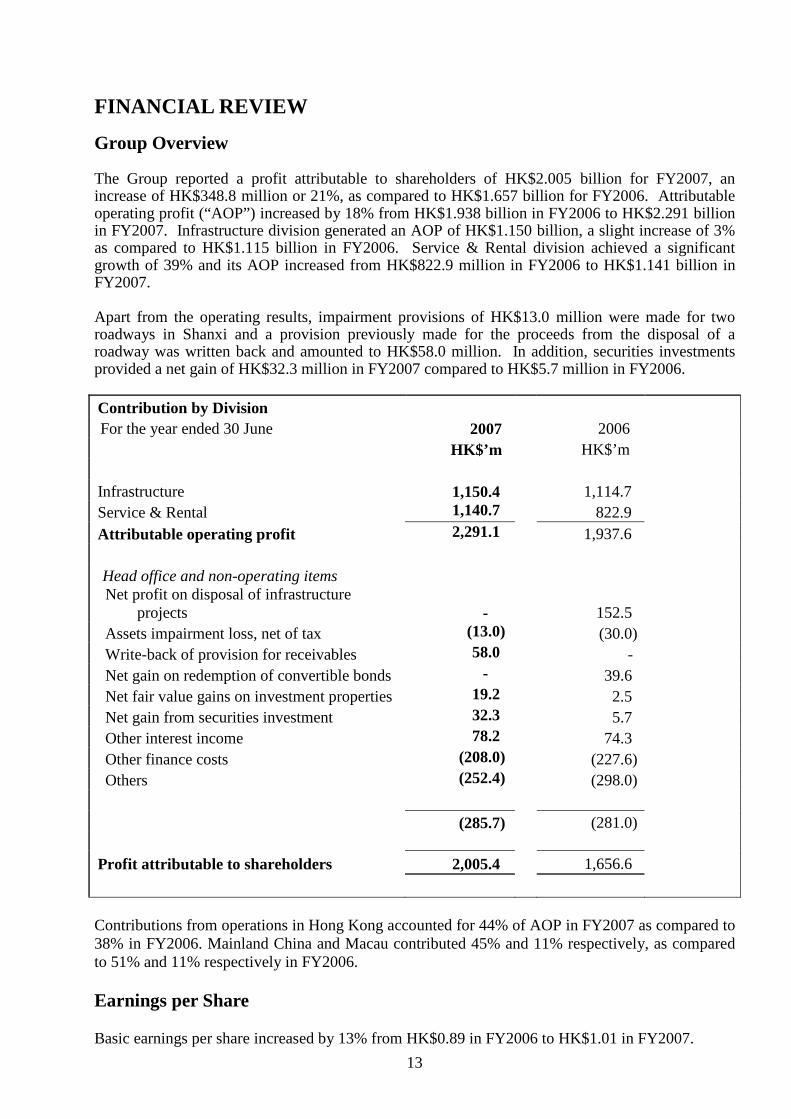
FINANCIAL REVIEW Group Overview The Group reported a profit attributable to shareholders of HK$2.005 billion for FY2007, an increase of HK$348.8 million or 21%, as compared to HK$1.657 billion for FY2006. Attributable operating profit (“AOP”) increased by 18% from HK$1.938 billion in FY2006 to HK$2.291 billion in FY2007. Infrastructure division generated an AOP of HK$1.150 billion, a slight increase of 3% as compared to HK$1.115 billion in FY2006. Service & Rental division achieved a significant growth of 39% and its AOP increased from HK$822.9 million in FY2006 to HK$1.141 billion in FY2007. Apart from the operating results, impairment provisions of HK$13.0 million were made for two roadways in Shanxi and a provision previously made for the proceeds from the disposal of a roadway was written back and amounted to HK$58.0 million. In addition, securities investments provided a net gain of HK$32.3 million in FY2007 compared to HK$5.7 million in FY2006. Contribution by Division For the year ended 30 June 2007 2006 HK$’m HK$’m Infrastructure 1,150.4 1,114.7 Service & Rental 1,140.7 822.9 Attributable operating profit 2,291.1 1,937.6 Head office and non-operating items Net profit on disposal of infrastructure
projects - 152.5 Assets impairment loss, net of tax (13.0) (30.0) Write-back of provision for receivables 58.0 - Net gain on redemption of convertible bonds - 39.6 Net fair value gains on investment properties 19.2 2.5 Net gain from securities investment 32.3 5.7 Other interest income 78.2 74.3 Other finance costs (208.0) (227.6) Others (252.4) (298.0)
(285.7) (281.0)
Profit attributable to shareholders 2,005.4 1,656.6
Contributions from operations in Hong Kong accounted for 44% of AOP in FY2007 as compared to 38% in FY2006. Mainland China and Macau contributed 45% and 11% respectively, as compared to 51% and 11% respectively in FY2006. Earnings per Share Basic earnings per share increased by 13% from HK$0.89 in FY2006 to HK$1.01 in FY2007.
14
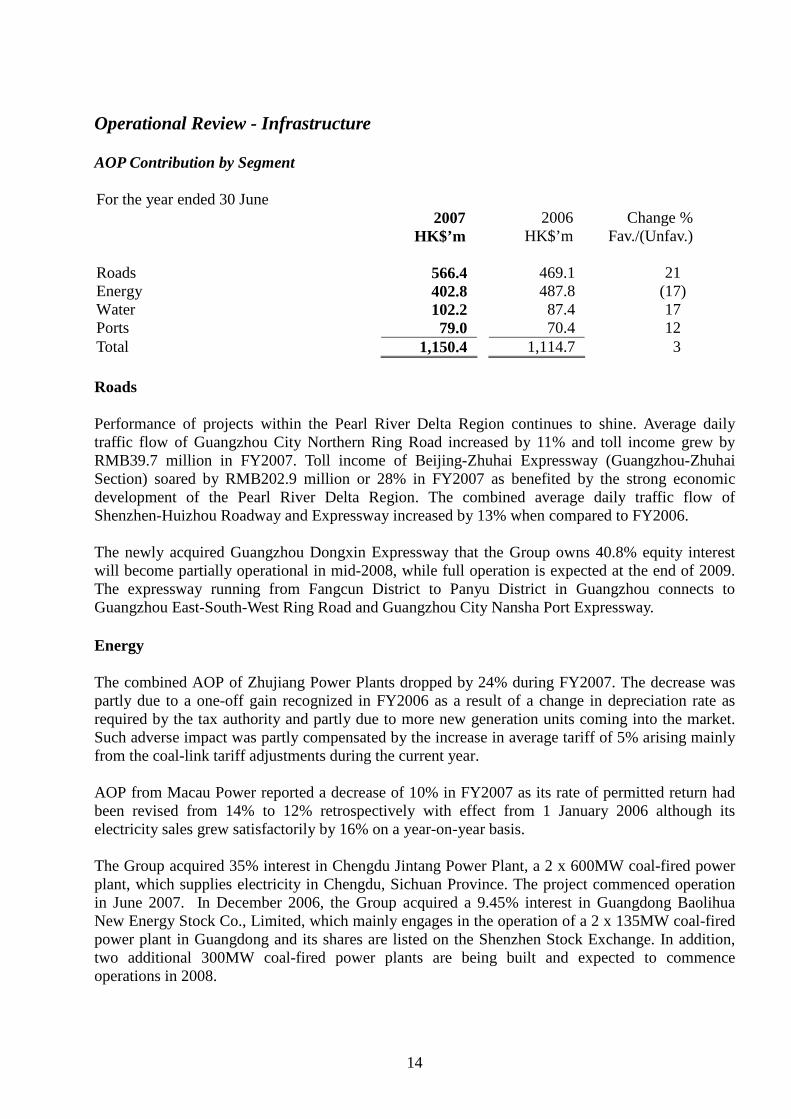
Operational Review - Infrastructure AOP Contribution by Segment For the year ended 30 June 2007 2006 Change % HK$’m HK$’m Fav./(Unfav.) Roads 566.4 469.1 21 Energy 402.8 487.8 (17) Water 102.2 87.4 17 Ports 79.0 70.4 12 Total 1,150.4 1,114.7 3 Roads Performance of projects within the Pearl River Delta Region continues to shine. Average daily traffic flow of Guangzhou City Northern Ring Road increased by 11% and toll income grew by RMB39.7 million in FY2007. Toll income of Beijing-Zhuhai Expressway (Guangzhou-Zhuhai Section) soared by RMB202.9 million or 28% in FY2007 as benefited by the strong economic development of the Pearl River Delta Region. The combined average daily traffic flow of Shenzhen-Huizhou Roadway and Expressway increased by 13% when compared to FY2006. The newly acquired Guangzhou Dongxin Expressway that the Group owns 40.8% equity interest will become partially operational in mid-2008, while full operation is expected at the end of 2009. The expressway running from Fangcun District to Panyu District in Guangzhou connects to Guangzhou East-South-West Ring Road and Guangzhou City Nansha Port Expressway. Energy The combined AOP of Zhujiang Power Plants dropped by 24% during FY2007. The decrease was partly due to a one-off gain recognized in FY2006 as a result of a change in depreciation rate as required by the tax authority and partly due to more new generation units coming into the market. Such adverse impact was partly compensated by the increase in average tariff of 5% arising mainly from the coal-link tariff adjustments during the current year. AOP from Macau Power reported a decrease of 10% in FY2007 as its rate of permitted return had been revised from 14% to 12% retrospectively with effect from 1 January 2006 although its electricity sales grew satisfactorily by 16% on a year-on-year basis. The Group acquired 35% interest in Chengdu Jintang Power Plant, a 2 x 600MW coal-fired power plant, which supplies electricity in Chengdu, Sichuan Province. The project commenced operation in June 2007. In December 2006, the Group acquired a 9.45% interest in Guangdong Baolihua New Energy Stock Co., Limited, which mainly engages in the operation of a 2 x 135MW coal-fired power plant in Guangdong and its shares are listed on the Shenzhen Stock Exchange. In addition, two additional 300MW coal-fired power plants are being built and expected to commence operations in 2008.
15
Water Macau Water Plant reported a 10% increase in average daily water sales volume while performance of water projects in Mainland China is promising. Water sales revenue of Tanggu Water Plant in Tianjin increased as its tariff has been raised since April 2006. The Chongqing Water Plant and Shanghai SCIP Water Treatment Plants had an impressive growth of 19% and 47% respectively in water sales volume. The newly acquired Changshu Water Plant and Chongqing Tangjiatuo Waste Water Plant have also contributed to the increase in profit during the year.
Ports Xiamen New World Xiangyu Terminals Co., Ltd. reported an 8% volume growth to 794,000 TEUs in FY2007. Throughput of Tianjin Orient Container Terminals Co., Ltd. decreased slightly by 1% to 1,136,000 TEUs while there was an increase in average revenue per TEU as a result of more foreign cargo volume. Tianjin Five Continents International Container Terminal Co., Ltd., in which interest was acquired in November 2005, produced positive AOP contribution to this segment and handled 1,988,000 TEUs during FY2007. In August 2006, the Group acquired 55% interest in Wenzhou Zhuangyuan Ao New World International Terminals Company Limited, which operates two multi-purpose berths in Zhuangyuanao, Zhejiang Province. The project is expected to be operational by 2008. Operational Review - Service & Rental After the further acquisition of Taifook Securities Group Limited’s (“Taifook Securities”) shareholding, the management decided to reclassify the business of Service & Rental division into four segments, namely “Facilities Rental”, “Contracting”, “Financial Services” and “Other Services” to facilitate a better analysis of the performance of different business segments under this division. AOP Contribution by Segment For the year ended 30 June 2007 2006 Change % HK$’m HK$’m Fav./(Unfav.) Facilities Rental 404.2 392.0 3 Contracting 255.9 163.0 57 Financial Services 141.6 65.8 115 Other Services 339.0 202.1 68 Total 1,140.7 822.9 39 Facilities Rental Hong Kong Convention and Exhibition Centre (“HKCEC”) continued to achieve satisfactory result in FY2007 with more than 1,300 events held during the year serving over 4 million guests. AsiaWorld-Expo and other conference and exhibition facilities in Macau, Mainland China and other Asian countries have increased competition in this market. Construction works of the Atrium Link expansion in HKCEC has commenced in August 2006 and is due for completion in 2009. The new 19,400 square metre expansion will increase its available space for lease up to a total of 83,400 square metre. ATL Logistics Centre (“ATL”) recorded a steady profit with average occupancy rate reaching 98% in FY2007. It has benefited from the growth of the local economy and the Mainland China market. The Group expects that ATL will continue to deliver stable profits as a result of the continuous growth of Hong Kong economy, increase in domestic consumption, improving job market and the buoyant stock market, which continued to fuel the strong growth in the warehousing business in Hong Kong.
16
Contracting The significant improvement in operating results of the contracting segment is due to a combination of factors including effective cost control measures and increase in volume of works. Leveraging its proven expertise in managing mega-sized and high quality construction projects and following the recent recovery of the private property development sector, Hip Hing Construction Company Limited (“Hip Hing”) has secured contracts of substantial size with a total contract sum of approximately HK$30.8 billion as at 30 June 2007. It was also among the most competitive and successful specialist builder in Macau’s rapidly expanding construction market. Notable among the number of large-scale projects for which Hip Hing secured in Macau were the Grand Lisboa Hotel, the MGM Casino projects and One Central Macau. Performance of the Group’s engineering business remained satisfactory during FY2007. Overall, the mechanical and electrical engineering industry remained competitive due to the financial risks arising from material price fluctuation and subcontractors’ repudiation. Contracts on hand as at 30 June 2007 amounted to HK$5.1 billion, while the contracts awarded for FY2007 amounted to HK$1.6 billion of which 59% was secured in Mainland China and Macau. Financial Services The Financial Services segment mainly comprises the results of Taifook Securities and Tricor Holdings Limited (“Tricor”). The contribution attributable to this segment has become more significant after the further acquisition of Taifook Securities and the benefit of buoyant stock market. In view of Taifook Securities’ enviable reputation in the financial services business and satisfactory growth history, the Group increased its shareholding in Taifook Securities to 61.29% on 8 June 2007 and thereafter Taifook Securities became a subsidiary company of the Group. Taifook Securities achieved excellent results in FY2007. Its major businesses were benefited from buoyant activities across different investment markets, including equities and their derivatives, foreign exchange, bullion and other commodities. Also benefited from the booming stock market, Tricor achieved excellent results with a growth of 31% during FY2007. Tricor has successfully expanded into Mainland China and Singapore markets following the opening of offices in Shanghai and Beijing and the acquisition of Singapore business. Other Services The Group’s transport business achieved an AOP of HK$101.4 million in FY2007, an 18% increase as compared with FY2006. The increase was mainly attributed to a rise in patronage in the local bus businesses and the investment in Kwoon Chung Bus Holdings Limited. Although the gains from the growth of bus patronage were eroded by the rising operating costs such as fuel costs, staff wages and insurance payments, this was compensated by the reduction in interest expenses resulting from repayment of borrowings and a decrease in asset depreciation charges. Despite the 5% growth in fare revenue, the local ferry business recorded a loss mainly due to the rising staff costs and higher fuel prices. The Macau ferry services achieved a satisfactory growth of 14% in patronage but, also due to the high fuel costs, were unable to exceed the guaranteed profit from Chow Tai Fook Enterprises Limited under the current vessel leasing arrangement.
17
Free Duty engaged in retail business selling duty free tobacco and liquor at Hong Kong International Airport and the ferry terminals in China Hong Kong City and Shun Tak Centre. Robust patronage arising from the rebound in Hong Kong’s tourism sector made a major contribution to the company’s excellent performance during FY2007. Following the increasing trend in spending per passenger and the opening of its new retail outlets totaling approximately 28,000 square feet at the Lok Ma Chau KCRC Station in August 2007, it is expected that Free Duty will continually deliver steady revenue for the Group. The property management business contributed a stable profit to the Group despite tough market competitions and maintained a clientele of over 134,000 residential units under management. The Group continued to explore new market opportunities in Mainland China.
BUSINESS OUTLOOK Infrastructure Under the national highway network plan of total length of 85,000 km, the total mileage of expressways in Mainland China will be increased by approximately 3,000 km annually up to 2010. This situation will create immense investment opportunities for road investors. Mainland China economic prosperity leads to more frequent passenger and cargo flows which in turn generate enormous traffic demand. Sustained economic development has led to growth in personal income and purchasing new cars has become a major spending hotspot. Despite high oil prices, car ownership rate continues to surge which is advantageous to road business. Adoption of toll-by-weight policy for goods-carrying vehicles in some provinces or municipal cities has proved to be successful in reducing traffic accidents and damage to roadways caused by over-loaded trucks. Toll revenue will generally increase under this new mode of toll calculation. The policy has become more popular and is another growth momentum for road business. The operating environment for power industry in Mainland China remains challenging. Although the power producers are compensated by tariff increments in May 2005 and July 2006, utilization is under pressure across the country. Contract coal price is rising thereby narrowing its gap with spot price to reflect the higher regulatory costs in coal market during the course of liberalization. At present, almost 24% of Mainland China’s thermal power is generated by small coal-fired units of capacity below 100MW. The National Development and Reform Commission planned to shut down small thermal power plants of 40GW from 2006 to 2010 and will allocate more on-grid quota to highly efficient and low emission units. Therefore, investment opportunities still exist for sizeable, low emission coal-fired power plants, although renewable energy continues to be accorded with favourable policy treatment by the Central Government.
The development in the Shanghai Chemical Industry Park (the “Park”) is optimistic as most projects have commenced their commercial operations. The return from our water treatment project in the Park exceeded expectation. Due to large demand in the waste water treatment service in the Park, the waste water treatment plant had almost achieved its capacity at the end of 2006. With the completion of the Zhuhai Ping Gang Project in December 2006, the seasonal salinity problem in Macau has been temporarily resolved. In addition, to cope with the increasing water demand, Macau Water Plant has contracted to expand its existing treatment capacity and is to be completed by mid 2008.
18
A 14.4% growth in container throughput was reported in Xiamen which reached 2.20 million TEUs in the first half of 2007. A 21% growth in container throughput was reported in Tianjin which reached 3.36 million TEUs in the first half of 2007. Tianjin speeds up its port development in the Eleventh Five-Year Plan by increasing the total investment from RMB36.7 billion to RMB45.0 billion. Service & Rental Benefiting from the steady growth in the local economy, the Facilities Rental segment is expected to deliver consistently stable contributions as a result of HKCEC’s and ATL’s market leadership positions across the region. To consolidate its position as Asia’s foremost international exhibition centre and Hong Kong’s premier venue of choice, HKCEC will continue to enhance its service quality, facilities and equipment. The overall operating environment of the Contracting segment has improved during FY2007. Although the recovery of the construction industry in Hong Kong is still lagging behind, it has showed clear signs of bottom-out. In Mainland China, we are still cautious and selective in tendering new projects and the contribution thereof is stable. The business in Macau is very encouraging with contracts awarded or to be tendered are usually of mega size. In addition to the Macau market, the Group also expand its contracting business to the Middle East. The Group will continue to strengthen Financial Services business. Both market activity and Taifook Securities’ overall business showed a rising trend. The impending influx of capital from Mainland China will certainly be a driver for local market activity. Mainland China has expanded the scope of overseas investments by its qualified institutional investors, which are expected to target mainly on Hong Kong equities initially, and individual investors will be allowed to invest directly into Hong Kong equities. Taifook Securities has solidly established its platforms in the past several years, focusing primarily on the Mainland China market, enabling us to capture future opportunities that come forth. For the transport business, the overall business environment continues to be volatile and challenging. The lingering high fuel prices, the impending merger of MTR Corporation Limited and Kowloon-Canton Railway Corporation, the proposed new rail lines on Hong Kong Island and the bus fleet replacement programme are some of the major issues which the management has to contend with in the next few years. Therefore, further streamlining in bus utilization through route rationalization programmes and greater overall cost control will continue.
19
FINANCIAL RESOURCES Treasury Management and Cash Funding The Group’s funding and treasury policy is designed to maintain a comprehensively diversified and balanced debt profile to minimize the Group’s financial risks. Management of the Group’s financing and treasury activities are centralised at the corporate level. The Group’s treasury function regularly reviews the funding requirements in order to enhance the cost-efficiency of funding initiatives. With adequate cash deposit and available banking facilities, the Group maintains strong liquidity position to provide sufficient financial resources to finance its operations and potential investment. Liquidity As at 30 June 2007, the Group’s total cash and bank balances amounted to HK$3.247 billion, as compared to HK$2.548 billion as at 30 June 2006. The increase was mainly attributable to the consolidation of the balance sheet of Taifook Securities following the further acquisition of approximately 40% interests in Taifook Securities in June 2007. Net Debt increased from HK$1.981 billion as at 30 June 2006 to HK$8.438 billion as at 30 June 2007. The sharp increase of Net Debt was resulted from the provision of financing on certain IPO issues by Taifook Securities to clients at the end of June 2007 amounting to HK$5.644 billion. The Group’s Gearing Ratio, as a result, also increased from 13% as at 30 June 2006 to 46% as at 30 June 2007. The aforesaid IPO loans were borrowed back-to-back from banks and were repaid in early July 2007 following the allotment of the corresponding new issues. Taking out these short-lived IPO loans, the Gearing Ratio would be only 15%. The capital structure of the Group was 39% debt and 61% equity as at 30 June 2007, as compared to 23% debt and 77% equity as at 30 June 2006. Debt Profile and Maturity As at 30 June 2007, the Group’s total debt increased to HK$11.686 billion from HK$4.528 billion as at 30 June 2006. Long-term bank loans and borrowings increased from HK$2.792 billion as at 30 June 2006 to HK$3.938 billion as at 30 June 2007, with HK$950.1 million maturing in the second year and the remaining in the third to fifth year. The zero coupon guaranteed convertible bonds due 2009 were fully converted in February 2007. Secured bank loans and overdrafts amounted to HK$629.6 million as at 30 June 2007 and were secured by the listed shares held by the Group as security for advances to securities customers. All bank loans were denominated in Hong Kong dollars and were bearing interest at floating rate. The Group did not have any material exposure in exchange risk other than RMB during FY2007. No property, plant and equipment, investment properties nor leasehold land and land use rights were pledged as at 30 June 2007. Commitments The Group’s commitments for capital expenditure were HK$1.665 billion as at 30 June 2007 as compared to HK$1.214 billion as at 30 June 2006. This represented commitment for capital contributions in certain associated companies and jointly controlled entities and other projects of HK$1.451 billion as at 30 June 2007 as compared to HK$928.1 million as at 30 June 2006, and commitments for properties and equipment of HK$213.8 million as at 30 June 2007 as compared to HK286.3 million as at 30 June 2006. The share of commitments for capital expenditure committed by jointly controlled entities was HK$1.055 billion as at 30 June 2007 as compared to HK$1.303 billion as at 30 June 2006. Sources of funding for capital expenditure are internally generated resources and banking facilities.
20
CONTINGENT LIABILITIES Contingent liabilities of the Group were HK$1.107 billion as at 30 June 2007 as compared to HK$1.141 billion as at 30 June 2006. These were composed of guarantees for credit facilities granted to associated companies, jointly controlled entities and a related company of HK$11.9 million, HK$1.041 billion and HK$55.0 million as at 30 June 2007 as compared to HK$11.9 million, HK$1.074 billion and HK$55.0 million respectively as at 30 June 2006. The share of contingent liabilities of jointly controlled entities was HK$70.6 million as at 30 June 2007 as compared to HK$65.0 million as at 30 June 2006.
EMPLOYEES AND REMUNERATION POLICIES As at 30 June 2007, over 42,000 staff were employed by entities under the Group’s management of which some 23,000 were employed in Hong Kong. Total staff related costs, excluding directors’ remunerations, were HK$2.249 billion, of which provident funds and staff bonuses were included, as compared to HK$2.190 billion for FY2006. Remuneration packages including salaries, bonuses and share options are granted to employees according to individual performance and are reviewed according to general market conditions every year. Structured training programmes are provided to employees on an ongoing basis.
REVIEW OF ANNUAL RESULTS The Audit Committee has reviewed the accounting principles and practices adopted by the Group and the audited financial statements of the Company for the year ended 30 June 2007.
PURCHASE, SALE OR REDEMPTION OF LISTED SECURITIES During the year, Financial Concepts Investment Limited, an indirect wholly owned subsidiary company of the Company, sold 55,000 shares of the Company at HK$21.62 per share. Such shares were received by Financial Concepts Investment Limited due to the distribution of shares of the Company under its reorganization in 2003. Save as disclosed above, neither the Company nor any of its subsidiary companies has purchased, sold or redeemed any of the Company’s listed securities during the year.
21
CODE ON CORPORATE GOVERNANCE PRACTICES Same as the status as reported by the Company in its last interim report, the Company has complied with all the code provisions as set out in the Code on Corporate Governance Practices (the “CG Code”) contained in Appendix 14 of the Rules Governing the Listing of Securities on the Hong Kong Stock Exchange during the year except for the deviation from the code provision A.5.4 as described below. As required under code provision A.5.4 of the CG Code, the Board should establish written guidelines on no less exacting terms than the Model Code for Securities Transactions by Directors (the “Model Code”) for relevant employees in respect of their dealing in the securities of the Company. The Board has established guidelines for employees in respect of their dealing in the Company’s securities as set out in the handbook for “Corporate Policy on Staff Responsibility” but they are not on no less exacting terms than the Model Code. The deviation is mainly due to the fact that the Company currently has over 42,000 employees and operates diversified businesses, it will cause immense administrative burden for processing written notifications from the relevant employees by the Company.
PUBLICATION OF RESULTS ANNOUNCEMENT AND ANNUAL REPORT This announcement is published on the websites of the Company (www.nwsh.com.hk) and the Hong Kong Stock Exchange (www.hkex.com.hk). The 2007 annual report will be dispatched to shareholders and available on the above websites on or about 31 October 2007.
THE BOARD As at the date of this announcement: (a) the executive directors of the Company are Dr. Cheng Kar Shun, Henry, Mr. Doo Wai Hoi, William, Mr. Chan Kam Ling, Mr. Tsang Yam Pui, Mr. Wong Kwok Kin, Andrew, Mr. Lam Wai Hon, Patrick, Mr. Cheung Chin Cheung and Mr. William Junior Guilherme Doo; (b) the non-executive directors of the Company are Mr. Wilfried Ernst Kaffenberger (alternate Director to Mr. Wilfried Ernst Kaffenberger: Mr. Yeung Kun Wah, David), Mr. To Hin Tsun, Gerald and Mr. Dominic Lai; and (c) the independent non-executive directors of the Company are Mr. Kwong Che Keung, Gordon, Mr. Cheng Wai Chee, Christopher and The Honourable Shek Lai Him, Abraham.
Dr. Cheng Kar Shun, Henry Chairman Hong Kong, 10 October 2007 * For identification purposes only
Related Documents