1 1. Update to Adobe Acrobat Reader DC The screen images in this document were captured on a Windows PC running Adobe Acrobat Reader DC. Upgrading to the newest version is not always necessary, but it is preferable, and these instructions apply only to Adobe Acrobat Reader DC. You can also create annotations using any version of Adobe Acrobat. Adobe Acrobat Reader DC can be downloaded at no cost from http://get.adobe.com/reader/ 2. What are eProofs? eProof files are self-contained PDF documents for viewing on-screen and for printing. They contain all appropriate formatting and fonts to ensure correct rendering on-screen and when printing hardcopy. SJS sends eProofs that can be viewed, anno- tated, and printed using either Adobe Acrobat Reader or Adobe Acrobat. 3. Show the Comment Toolbar The Comment toolbar isn’t displayed by default. To display it, choose View > Tools > Comment > Open. Pilgrim Five, Suite 5 5 Pilgrim Park Road Waterbury, VT 05676 Annotating PDFs using Adobe Acrobat Reader DC Version 1.7 June 27, 2016 Refer to Page 2 for annotation examples. 4. Using the PDF Comments menu To insert new text, place your cursor where you would like to insert the new text, and type the desired text. To replace text, highlight the text you would like to replace, and type the desired replacement text. To delete text, highlight the text you would like to delete and press the Delete key. Acrobat and Reader will display a pop-up note based on the modification (e.g., inserted text, replacement text, etc.). To format text in pop-up notes, highlight the text, right click, select Text Style, and then choose a style. A pop-up note can be minimized by selecting the X button inside it. When inserting or replacing text, a symbol indicates where your comment was inserted, and the comment is shown in the Comments List. If you do not see the comments list, you are editing the live text instead of adding comments, and your changes are not being tracked. Please make certain to use the Comments feature instead. 5. Inserting symbols or special characters An insert symbol feature is not available for annotations, and copying and pasting symbols or non-keyboard characters from Microsoft Word does not always work. Use angle brackets < > to indicate these special characters (e.g., <alpha>, <beta>). 6. Editing near watermarks and hyperlinked text eProof documents often contain watermarks and hyperlinked text. Selecting characters near these items can be difficult using the mouse. To edit an eProof which contains text in these areas, do the following: • Without selecting the watermark or hyperlink, place the cursor near the area for editing. • Use the arrow keys to move the cursor beside the text to be edited. • Hold down the shift key while simultaneously using arrow keys to select the block of text, if necessary. • Insert, replace, or delete text, as needed. 7. Reviewing changes To review all changes, open the Comment menu and the Comment List is displayed. Note: Selecting a correction in the list highlights the corresponding item in the document, and vice versa. 8. Still have questions? Try viewing our brief training video at https://authorcenter.dartmouthjournals.com/Article/PdfAnnotation

Welcome message from author
This document is posted to help you gain knowledge. Please leave a comment to let me know what you think about it! Share it to your friends and learn new things together.
Transcript

1
1. Update to Adobe Acrobat Reader DCThe screen images in this document were captured on a Windows PC running Adobe Acrobat Reader DC. Upgrading to the newest version is not always necessary, but it is preferable, and these instructions apply only to Adobe Acrobat Reader DC. You can also create annotations using any version of Adobe Acrobat. Adobe Acrobat Reader DC can be downloaded at no cost from http://get.adobe.com/reader/
2. What are eProofs?eProof files are self-contained PDF documents for viewing on-screen and for printing. They contain all appropriate formatting and fonts to ensure correct rendering on-screen and when printing hardcopy. SJS sends eProofs that can be viewed, anno-tated, and printed using either Adobe Acrobat Reader or Adobe Acrobat.
3. Show the Comment ToolbarThe Comment toolbar isn’t displayed by default. To display it, choose View > Tools > Comment > Open.
Pilgrim Five, Suite 55 Pilgrim Park Road
Waterbury, VT 05676
Annotating PDFs using Adobe Acrobat Reader DCVersion 1.7 June 27, 2016
Refer to Page 2 for annotation examples.
4. Using the PDF Comments menuTo insert new text, place your cursor where you would like to insert the new text, and type the desired text. To replace text, highlight the text you would like to replace, and type the desired replacement text. To delete text, highlight the text you would like to delete and press the Delete key.
Acrobat and Reader will display a pop-up note based on the modification (e.g., inserted text, replacement text, etc.). To format text in pop-up notes, highlight the text, right click, select Text Style, and then choose a style. A pop-up note can be minimized by selecting the X button inside it. When inserting or replacing text, a symbol indicates where your comment was inserted, and the comment is shown in the Comments List. If you do not see the comments list, you are editing the live text instead of adding comments, and your changes are not being tracked. Please make certain to use the Comments feature instead.
5. Inserting symbols or special charactersAn insert symbol feature is not available for annotations, and copying and pasting symbols or non-keyboard characters from Microsoft Word does not always work. Use angle brackets < > to indicate these special characters (e.g., <alpha>, <beta>).
6. Editing near watermarks and hyperlinked texteProof documents often contain watermarks and hyperlinked text. Selecting characters near these items can be difficult using the mouse. To edit an eProof which contains text in these areas, do the following:
• Without selecting the watermark or hyperlink, place the cursor near the area for editing.
• Use the arrow keys to move the cursor beside the text to be edited.• Hold down the shift key while simultaneously using arrow keys to select the
block of text, if necessary.• Insert, replace, or delete text, as needed.
7. Reviewing changesTo review all changes, open the Comment menu and the Comment List is displayed. Note: Selecting a correction in the list highlights the corresponding item in the document, and vice versa.
8. Still have questions?Try viewing our brief training video at https://authorcenter.dartmouthjournals.com/Article/PdfAnnotation

2
A. Inserted text
B. Replaced text
C. Deleted text
D. Sticky Note
B
C
D
A

A M E R I C A N J O U R N A L O F B OTA NY 104 (12): 1 – 12 , 2017; http://www.amjbot.org/ © 2017 Botanical Society of America • 1
A M E R I C A N J O U R N A L O F B O T A N Y
R E S E A R C H A R T I C L E
GALLEY PROOF — AJBD1700175
Gaps are relatively open areas within stands of dominant vegeta-tion and are a key structural and functional attribute of many ecosystems ( Pickett and White, 1985 ). Gaps may provide higher levels of resources such as light and moisture ( Canham et al., 1990 ; Burton et al., 2014 ) and are essential microhabitats for subordinate ( Petru and Menges, 2003 ; Delong and Gibson, 2012 ; Burton et al., 2014 ) and dominant plant species ( Muscolo et al., 2014 ; Zhu et al., 2014 ).
Individual gaps display what is essentially a demographic pro-cess. Gaps are “born” as a result of the death or partial removal of dominant individuals ( Schliemann and Bockheim, 2011 ; Richards and Hart, 2012 ; Karki and Hallgren, 2015 ), oft en from an ecological disturbance. Gaps “survive” for a time, and then they “die” (or
become “dormant”) as a result of closure of the vegetation from the sides or below ( Belsky and Canham, 1994 ; Vepakomma et al., 2011 ). Th ese dynamics can aff ect both community and population structure ( Brokaw and Busing, 2000 ; Burton et al., 2014 ). Within individual species, subpopulations in gaps may have diff erent life histories than subpopulations in the matrix ( Abe et al., 2008 ).
Gap size is a fundamental property aff ecting community struc-ture and population dynamics. Species richness is highest in larger ( Hubbell et al., 1999 ; Schnitzer and Carson, 2001 ; Burton et al., 2014 ) or midsized ( Kern et al., 2014 ) gaps. Larger gaps support diff erent species assemblages than smaller gaps ( Anderson and Leopold, 2002 ; Muscolo et al., 2014 ) and can support higher seed-ling survival ( Pearson et al., 2003 ) and faster seedling growth ( Huth and Wagner, 2006 ). Th e distribution of obligate seeding species (as compared to resprouters) in California chaparral was strongly predicted by the size of postdisturbance gaps ( Keeley et al., 2016 ).
Despite the widespread occurrence and predominance of fi re ( Bond and Keeley, 2005 ), its eff ects on gap dynamics are little stud-ied. While fire can cause gaps, large-scale fire disturbances are
1 Manuscript received 12 May 2017; revision accepted 17 October 2017.
2 Plant Ecology Program, Archbold Biological Station, Venus, Florida, USA;
3 North Carolina Forest Service, Raleigh, North Carolina, USA; and
4 Department of Biology, University of Central Florida, Orlando, Florida, USA
5 Author for correspondence (e-mail: [email protected])
https://doi.org/10.3732/ajb.1700175
Dynamics of gaps, vegetation, and plant species with and without fi re 1 Eric S. Menges 2,5 , Sarah J. H. Crate 3 , and Pedro F. Quintana-Ascencio 4
PREMISE OF THE STUDY: Areas lacking dominant plants, or gaps, can support high diversity and specialist species. Previous chronosequence research in
Florida rosemary scrub showed indistinct gap area patterns with fi re and the dependence of certain species on gaps. We hypothesized that fi re and gap
size would aff ect extinction, colonization, diversity, and vegetation composition.
METHODS: In 2011–12, we revisited gaps fi rst sampled in 2003, recording vascular plant and ground lichen occurrence by species, gap area, and burn his-
tory. We analyzed gap, vegetation, and species dynamics using linear mixed models, with Florida rosemary scrub patch as a random factor.
KEY RESULTS: Gap areas declined quickly during the fi rst 10 yr postfi re and then stabilized. Between 2003 and 2011–12, unburned gaps usually remained
extant or split, whereas burned gaps usually merged. Unburned gaps tended to shrink, whereas burned gaps became larger. Species richness was posi-
tively related to gap area, fi re, and their interaction. Over time, richness declined in unburned gaps and increased in burned gaps. Local extinction and
colonization of individual species were related to fi re between 2003 and 2011–12. In burned gaps, ground lichens disappeared, but many herbaceous
species, including those killed by fi re, increased occupancy. Colonization of most species was favored by burning, large gaps, or both.
CONCLUSIONS: In Florida rosemary scrub, fi re and increasing gap size increased species richness and many individual species occurrences, reduced local
extinctions, and increased colonizations. Therefore, land management activities that encourage the creation and maintenance of large gaps will promote
biodiversity in this system.
KEY WORDS colonization; extinction; Florida scrub; land management; species richness; time-since-fi re

2 • A M E R I C A N J O U R N A L O F B OTA NY
GALLEY PROOF — AJBD1700175
contrast gap and plant dynamics in gaps that were either burned or unburned. Our predictions were as follows: (1) Gap area should decrease with time-since-fi re and increase
when fi re occurs. (2) Species richness should be highest in larger gaps and in recently
burned areas, because of lower competition with dominant spe-cies and higher heterogeneity.
(3) Most individual species should show greater occupancy, less local extinction, and more local colonization into larger and more recently burned gaps. However, these patterns will be condi-tioned on species’ life histories, particularly their responses to fi re.
(4) Plant community composition should be aff ected both by gap area and time-since-fi re.
MATERIALS AND METHODS
Study system — Th e study was conducted in Florida rosemary scrub at Archbold Biological Station, in south-central Florida, USA (27 ° 10 ′ N, 81 ° 21 ′ W), during 2003 and 2011–12. Rosemary scrub (rosemary phase of sand pine scrub; Abrahamson et al., 1984 ) is a shrubland dominated by Florida rosemary ( Ceratiola ericoides ), re-sprouting scrub oaks ( Quercus spp.), and palmettos ( Serenoa re-pens , Sabal etonia ). Rosemary scrub occurs on xeric white sands and is characterized by open gaps usually covering 10–40% of the ground area ( Menges and Hawkes, 1998 ; Menges, 1999 ). Th ese gaps are rich in endemic plant species ( Menges et al., 2008 ). Rose-mary scrub is oft en distributed as islands (patches) of habitat em-bedded within other vegetation (e.g., scrubby fl atwoods) that are dominated by scrub oaks, palmettos, and other shrubs ( Quintana-Ascencio and Menges, 1996 ; Miller et al., 2012 ) with canopy heights usually <2 m.
Th e fi re regime is characterized by high-intensity crown fi res moving through shrub canopies, historically ignited by lightning fi res occurring during the growing season, especially in late spring ( Menges et al., 2017 ). Th e fi res are oft en patchy in rosemary scrub. Unlike co-occurring shrubs that are strong resprouters ( Maguire and Menges, 2011 ; Schafer and Mack, 2014 ), Florida rosemary is killed by fi re and recovers by recruiting from a soil seedbank ( Johnson, 1982 ). Because Florida rosemary seedlings grow more slowly than the resprouting shrubs, gaps oft en persist in rosemary scrub for several years following fi re. Th e fi re return interval for rosemary scrub tends to be longer (15–25 yr) than fi re return in-tervals for scrub dominated by resprouting shrubs ( Menges, 2007 ; Menges et al., 2017 ). Florida rosemary produces allelochemicals ( Williamson et al., 1992 ) that suppress seed germination of co-occurring plants ( Hunter and Menges, 2002 ; Hewitt and Menges, 2008 ). However, aft er fi res that remove Florida rosemary, many species will recruit seedlings ( Menges and Quintana-Ascencio, 2004 ).
Data collection — Following Menges et al. (2008) , we defi ned gaps as openings among canopies of dominant shrubs that were at least 1 m long and 1 m wide. Gaps are largely free of woody vegetation; the matrix is dominated by taller, more continuous woody vegeta-tion. Th e gap boundaries were defi ned by dominant shrubs ≥ 50 cm tall. Subshrubs, herbaceous plants, and ground lichens can occur within gaps.
Initial sampling (2003) was detailed in Menges et al. (2008) . In short, we chose 28 rosemary scrub patches initially stratifi ed by
usually distinguished from local gap formation (e.g., Pham et al., 2004 ; McEwan et al., 2014 ). Although most work describing the ef-fect of gaps on plants has been done in forests (recent examples include Sharma et al., 2016 ; Després et al., 2017 ; Nagel et al., 2017 ), gaps are also key features in habitats such as grasslands ( Tozer et al., 2008 ; Franzese et al., 2009 ), shrublands ( Dickinson et al., 1993 ; Lloret et al., 2005 ), woodlands ( Pecot et al., 2007 ), and savannas ( Rebertus and Burns, 1997 ). Few studies have explicitly looked at the eff ects of fi re on gap dynamics in shrublands (but see Menges and Hawkes, 1998 ; Menges et al., 2008 ; Franzese et al., 2009 ).
Here, we explore gap dynamics in a fi re-aff ected shrubland, Florida scrub, where gaps are important features in the landscape ( Menges et al., 2008 ). Herbaceous species (e.g., Eryngium cuneifo-lium , Hypericum cumulicola ) and woody subshrubs (e.g., Diceran-dra frutescens ) are among the species that are gap specialists and are most abundant in the fi rst decade aft er fi re ( Hawkes and Menges, 1996 ; Quintana-Ascencio et al., 2003 ; Menges and Quintana-Ascencio, 2004 ; Menges et al., 2006 ). Gap area is potentially impor-tant in Florida scrub, because some species have greater occurrence, survival, and recruitment in larger than in smaller gaps ( Menges and Kimmich, 1996 ; Menges et al., 2008 ; Schafer et al., 2010 , 2013 ), and species richness is typically highest in larger gaps ( Menges et al., 2008 ; Dee and Menges, 2014 ). Florida scrub is a hot spot for endemism ( Christman and Judd, 1990 ; Dobson et al., 1997 ; Estill and Cruzan, 2001 ), with most endemics occurring in Florida rosemary scrub and many endemic species preferring gaps, so that understanding gap dynamics is important to conservation. Gap closure can be rapid in some types of Florida scrub, leading to declines in rare plants (P. A. Schmalzer and T. E. Foster, unpub-lished data).
Landscape and population dynamics of many species occurring in the Florida rosemary scrub can be conceptualized at two scales: open gaps, at the scale of meters (hereaft er “gaps”); and larger rose-mary scrub habitat patches, at the scale of 10 m to kilometers (here-aft er “patches”), where metapopulation dynamics occur. At this larger scale, patch occupancy was higher for some species in larger, less isolated patches ( Quintana-Ascencio and Menges, 1996 ), al-though observed extinctions and recolonizations at the patch level, while related to fi re and life history, were not associated with patch size or isolation ( Miller et al., 2012 ).
In a prior study ( Menges et al., 2008 ), we considered a snapshot of gap properties based on 805 gaps in Florida rosemary scrub, sampled in 2003. We found that gap areas had a lognormal distri-bution and were smallest in long-unburned patches, but otherwise there was no evidence of gap area variation associated with time-since-fi re. Species diversity and herbaceous plant diversity were highest in larger gaps, and herbaceous diversity decreased with time-since-fi re. Larger gaps were refugia for several species, while long-unburned gaps were important for ground lichen species. Th e prior study ( Menges et al., 2008 ) used a chronosequence approach (a space for time substitution) for inferences about time-since-fi re; this assumes that spatial and temporal variation are equivalent ( Pickett, 1989 ), and therefore it can lead to erroneous conclusions (e.g., Freestone et al., 2015 ). Here, by following changes over time with and without fi re, we provide an approach that minimizes chronosequence issues.
In the present study, we resampled 480 of these gaps 7–8 yr later. We focus on the dynamics of gaps, species richness, species occur-rence, and community composition between 2003 and 2011–12. Many gaps burned during this intervening period, allowing us to
D E C E M B E R 2017 , V O LU M E 104 • • 3
GALLEY PROOF — AJBD1700175
Analytical methods — We conducted statistical analyses using SPSS version 22 and R version 3.0.2 ( R Core Team, 2013 ). Gap area was natural log-transformed for all analyses to normalize re-siduals and control heteroscedasticity. Gap fates were related to burn status and 2003 time-since-fi re class (1–9, 10–19, 20+ years-since-fi re) using chi-square tests; and to gap areas using one-way analyses of variance. We used linear mixed models (with normal errors and identity link) to analyze species richness in relation to burn status and gap area. Using Akaike’s information criterion (AIC) corrected for small sample sizes (AIC
c ), we evaluated the
relative evidence for eff ects of each variable. We found no evi-dence that other variables (change in gap area, dominant shrub vegetation along gap edges, time-since-fi re in 2003) had eff ects on species richness (AIC weights < 0.001; Appendix S1; see Supple-mental Data with this article). We included random eff ects of patch because gaps were nested within patches. Th is approach ac-counts for common variation among gaps within a focal patch. We fi rst evaluated the most informative confi guration for either random eff ects on the intercept or both the intercept and the slope on the model with saturated fi xed confi guration and then assessed how likely the fi xed eff ects (gap area, time-since-fi re, and their interaction) were in predicting species richness (for code, see Appendix S2).
We also analyzed species occurrence patterns using generalized linear mixed models (with binomial errors, logit link, and random eff ects by patch) to predict both extinction and colonization, using all predictor variables initially, but later using burn status between 2003 and 2011–12, the natural log of gap area, and the time-since-fi re in 2003 as predictors (fi xed eff ects), because other variables were not important predictors of extinction or colonization. We considered the 54 most common species (i.e., those that had ≥ 10 occurrences in both 2003 and 2011–12). Data were adequate for models for extinction or colonization for 27 of these species. To estimate model fi t, we used the lme4 R package ( Bates et al., 2013 ) and r 2 for generalized linear mixed models ( Nakagawa and Schielzeth, 2013 ).
We used nonmetric multidimensional scaling (NMDS; Vegan library; Oksanen et al., 2015 ) ordinations to interpret species occur-rence patterns in relation to time-since-fi re and gap area. Rarefac-tion curves (Vegan library; Oksanen et al., 2015 ) based on 2011–12 data showed clear asymptotes, indicating that our sampling well characterized the overall plant community. We used linear mixed models to assess the association of scores on major ordination axes to time-since-fi re (2011–12) and gap area. Results are presented as means ± SE.
RESULTS
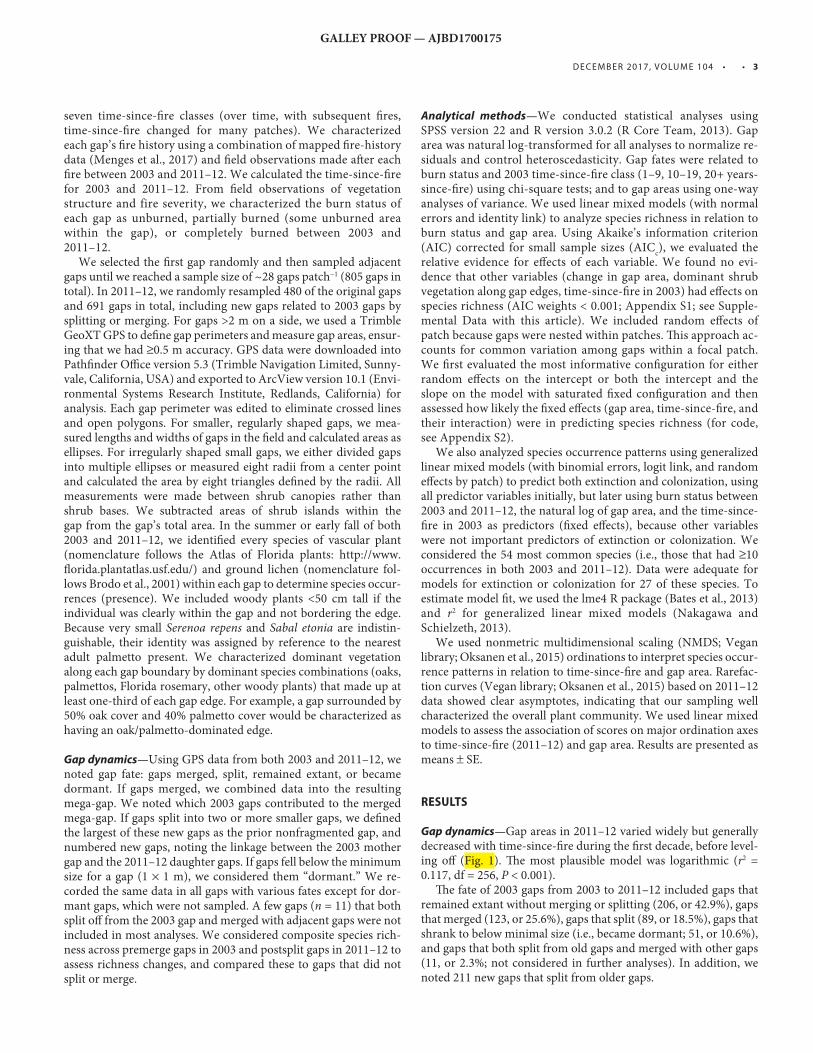
Gap dynamics — Gap areas in 2011–12 varied widely but generally decreased with time-since-fi re during the fi rst decade, before level-ing off ( Fig. 1 ). Th e most plausible model was logarithmic ( r 2 = 0.117, df = 256, P < 0.001).
Th e fate of 2003 gaps from 2003 to 2011–12 included gaps that remained extant without merging or splitting (206, or 42.9%), gaps that merged (123, or 25.6%), gaps that split (89, or 18.5%), gaps that shrank to below minimal size (i.e., became dormant; 51, or 10.6%), and gaps that both split from old gaps and merged with other gaps (11, or 2.3%; not considered in further analyses). In addition, we noted 211 new gaps that split from older gaps.
seven time-since-fi re classes (over time, with subsequent fi res, time-since-fi re changed for many patches). We characterized each gap’s fi re history using a combination of mapped fi re-history data ( Menges et al., 2017 ) and fi eld observations made aft er each fi re between 2003 and 2011–12. We calculated the time-since-fi re for 2003 and 2011–12. From fi eld observations of vegetation structure and fire severity, we characterized the burn status of each gap as unburned, partially burned (some unburned area within the gap), or completely burned between 2003 and 2011–12.
We selected the fi rst gap randomly and then sampled adjacent gaps until we reached a sample size of ~28 gaps patch −1 (805 gaps in total). In 2011–12, we randomly resampled 480 of the original gaps and 691 gaps in total, including new gaps related to 2003 gaps by splitting or merging. For gaps >2 m on a side, we used a Trimble GeoXT GPS to defi ne gap perimeters and measure gap areas, ensur-ing that we had ≥ 0.5 m accuracy. GPS data were downloaded into Pathfi nder Offi ce version 5.3 (Trimble Navigation Limited, Sunny-vale, California, USA) and exported to ArcView version 10.1 (Envi-ronmental Systems Research Institute, Redlands, California) for analysis. Each gap perimeter was edited to eliminate crossed lines and open polygons. For smaller, regularly shaped gaps, we mea-sured lengths and widths of gaps in the fi eld and calculated areas as ellipses. For irregularly shaped small gaps, we either divided gaps into multiple ellipses or measured eight radii from a center point and calculated the area by eight triangles defi ned by the radii. All measurements were made between shrub canopies rather than shrub bases. We subtracted areas of shrub islands within the gap from the gap’s total area. In the summer or early fall of both 2003 and 2011–12, we identifi ed every species of vascular plant (nomenclature follows the Atlas of Florida plants: http://www.fl orida.plantatlas.usf.edu/ ) and ground lichen (nomenclature fol-lows Brodo et al., 2001 ) within each gap to determine species occur-rences (presence). We included woody plants <50 cm tall if the individual was clearly within the gap and not bordering the edge. Because very small Serenoa repens and Sabal etonia are indistin-guishable, their identity was assigned by reference to the nearest adult palmetto present. We characterized dominant vegetation along each gap boundary by dominant species combinations (oaks, palmettos, Florida rosemary, other woody plants) that made up at least one-third of each gap edge. For example, a gap surrounded by 50% oak cover and 40% palmetto cover would be characterized as having an oak/palmetto-dominated edge.
Gap dynamics — Using GPS data from both 2003 and 2011–12, we noted gap fate: gaps merged, split, remained extant, or became dormant. If gaps merged, we combined data into the resulting mega-gap. We noted which 2003 gaps contributed to the merged mega-gap. If gaps split into two or more smaller gaps, we defi ned the largest of these new gaps as the prior nonfragmented gap, and numbered new gaps, noting the linkage between the 2003 mother gap and the 2011–12 daughter gaps. If gaps fell below the minimum size for a gap (1 × 1 m), we considered them “dormant.” We re-corded the same data in all gaps with various fates except for dor-mant gaps, which were not sampled. A few gaps ( n = 11) that both split off from the 2003 gap and merged with adjacent gaps were not included in most analyses. We considered composite species rich-ness across premerge gaps in 2003 and postsplit gaps in 2011–12 to assess richness changes, and compared these to gaps that did not split or merge.

4 • A M E R I C A N J O U R N A L O F B OTA NY
GALLEY PROOF — AJBD1700175
FIGURE 1 Gap area function of time-since-fi re for gaps in 2011–12. Line is
fi t with ln (time-since-fi re); r 2 = 0.12.
FIGURE 2 Fate of gaps that were either unburned, partially burned, or
burned between 2003 and 2011–12, expressed as a percentage of gaps
within each burn category.
FIGURE 3 Gap area in 2011–12 as a function of gap area in 2003, divided
by whether the gap was unburned, partially burned, or completely
burned during the intervening years. See Table 1 for a summary of the
analysis. R 2 for fi xed eff ects was 0.75 and 0.77 for both fi xed and random
eff ects.
Whether gaps burned or not between samples had strong eff ects on gap dynamics ( Fig. 2 ). Burned gaps usually merged (78.7%) while unburned gaps oft en remained extant (56.5%) or split (24.8%). Partially burned gaps were intermediate between burned and unburned gaps but most similar to burned gaps, with the most common fates merging (44.7%) or remaining extant (23.4%). Gap fate was strongly related to burn status ( χ 2 = 282.6, df = 6, P < 0.001). Time-since-fi re in 2003 also aff ected gap fate ( χ 2 = 155.2, df = 18, P < 0.001), with recently burned gaps oft en remaining extant and most classes of long-unburned gaps having many splits. In fact, unburned gaps in all time-since-fi re classes tended to remain extant or split (summing to 67–95% of gaps across 2003 TSF classes), whereas burned gaps in all time-since-fi re classes tended to merge (76–82% across TSF classes). Gap splitting was uncommon (15%) for gaps <10 yr since fi re but occurred at similar rates (30–40%) for longer time-since-fi re.
Gap area in 2011–12 was infl uenced by prior gap area and inter-vening fi re. Unburned gaps tended to shrink (slope <1), whereas
burned gaps increased in size; partially burned gaps were interme-diate and usually increased in size ( Fig. 3 ). Burned gaps had greater increases in size between 2003 and 2011–12 than partially burned or unburned gaps ( Fig. 3 ). A model that included prior gap area, fi re, and their interaction explained 77% of the overall variance in 2011–12 gap area ( Table 1 ).
As one would expect, the change in gap area refl ected gap fates between 2003 and 2011–12. Merged gaps gained a mean of 429.9 ± 185.9 m 2 ; extant and split gaps both shrank in size (losses of 1.7 ± 0.5 m 2 and 17.8 ± 4.0 m 2 , respectively). Gap fate aff ected the natural log of the change in gap area ( F
2, 164 = 78.9, P < 0.001), with pairwise
diff erences ( P < 0.05) showing that gap area change was ordered as merged > extant > split.
Species richness in gaps — Gap dynamics, gap area, and fi re aff ected species richness. Similar numbers of gaps gained richness (44%) as lost richness (41%); fewer maintained the same number of species (15%) between 2003 and 2011–12. Unburned gaps, especially large ones, tended to lose species richness (mean change in richness was −0.76 ± 0.25). Burned gaps (+6.14 ± 1.44) and partially burned gaps (+2.66 ± 1.1) tended to gain species richness ( Table 2 ). Species rich-ness also diff ered among gaps that merged, split, or did not change ( F
2, 312 = 78.2, P < 0.001). Merged gaps had higher richness (27.6 ±
2.17) than split (13.6 ± 0.71) or extant (10.3 ± 0.36) gaps ( P < 0.05 in post hoc tests).
Gap merging had strong positive eff ects on species richness. Gap merging created 24 mega-gaps in 2011–12 from 124 original gaps in 2003. Species richness in merged gaps was related to rich-ness in the composite of gaps in 2003 that later merged ( r 2 = 0.774, df = 23, P < 0.001). Two-thirds (16 of 24) of merged gaps increased

D E C E M B E R 2017 , V O LU M E 104 • • 5
GALLEY PROOF — AJBD1700175
Dynamics in gaps — Individual species occupancy varied widely by species in 2003 and 2011–12, at both the site and gap scales ( Table 3 ). Th e most common species in rosemary scrub gaps in-cluded forbs ( Cnidoscolus stimulosus , Paronychia chartacea , Stipu-licida setacea , Lechea deckertii ), ground lichens ( Cladonia leporina , C. prostrata , Cladina subtenuis ), a grass ( Aristida gyrans ), a club-moss ( Selaginella arenicola ), a subshrub ( Licania michauxii ), and small palmettos ( Serenoa repens ). Typically, 10–30% of gaps showed changes in occupancy between sampling years ( Table 3 ). Small sample sizes, lack of change in occupancy, or lack of diversity in burn histories meant that not all species could be modeled for ef-fects of burn history between years, time-since-fi re in 2003, and gap area on occupancy dynamics.
Extinction was aff ected primarily by whether gaps burned be-tween 2003 and 2011–12, and secondarily by gap area ( Table 4 ). For all ground lichen species that were successfully modeled, extinction was more likely if the gap was burned (positive coeffi cients for Cla-donia and Cladina species in Table 4 ). For two forbs ( Lechea deck-ertii , Paronychia chartacea ), extinction was less likely if the gap was burned (negative coeffi cients in Table 4 ). Gap area had negative ef-fects on extinction in four species, including the obligate seeder P. chartacea ( Table 4 ). Time-since-fi re in 2003 never had any signifi -cant eff ects on extinction ( Table 4 ).
Colonization was aff ected by burning and by gap area in the ma-jority of species for which models had enough data ( n = 25). Burn-ing increased colonization signifi cantly for 13 species and never had signifi cant negative eff ects on colonization ( Table 4 ). Th e spe-cies whose colonization were favored by burning included fi ve forbs but also included subshrubs ( Vaccinium myrsenites , Polygo-nella polygama , Opuntia humifusa , Palafoxia feayi ), small plants of dominant shrubs ( Ceratiola ericoides , Sabal etonia ), sedges ( Cype-rus spp.), and a vine ( Smilax auriculata ). Likewise, colonization was signifi cantly more likely in larger gaps for 15 species ( Table 4 ). Time-since-fi re in 2003 had minor eff ects overall, increasing the likelihood of colonization for one ground lichen and decreasing this likelihood for two other species.
NMDS ordinations — For 2011–12 data, axis 1 of the NMDS ordina-tion was strongly related to time-since-fi re of 0–20 yr but showed little relationship to longer fi re-free intervals ( β 0 = 0.353 ± 0.054, β 1(tsf) = −0.019 ± 0.004, β 2(tsf 2 ) = 0.0001 ± 0.00005, P < 0.001; Fig. 5 , upper left ) . In contrast, axis 2 (2011–12) was related to gap area ( β 0 = 0.157 ± 0.046, β 02 = −0.099 ± 0.009, P < 0.001; Fig. 5 , lower right) but not to time-since-fi re ( β = 0.0001 ± 0.002, P = 0.971;
in richness, two gaps remained the same, and six became poorer. Th is net gain in richness for merged gaps was greater than for all gaps. Most (20 of 24) mergers happened when the gaps were par-tially or completely burned between 2003 and 2011–12. Among merged gaps, those that were burned gained a median of seven species; partially burned gaps gained three, and unburned mega-gaps lost 1.5.
Species richness patterns in split gaps were more nuanced. Gap splitting resulted in a total of 99 gaps splitting into 311 gaps by 2011–12. Species richness in the composite of split gaps in 2011–12 was related to richness in the mother gaps in 2003 ( r 2 = 0.829, df = 86, P < 0.001). About one-quarter (24%) decreased in composite richness with splitting, 13% had the same number of species, and 63% gained in richness. Nearly all (86%) cases of splitting occurred without fi re; only three occurred in gaps that were completely burned. Among split gaps, there was little diff erence in species rich-ness change with burning (median + 2 for unburned, + 1 for par-tially or completely burned).
Species richness in 2011–12 increased with initial gap area (in 2003) and was aff ected by whether the gap had burned since 2003. Richness was generally higher in gaps burned between 2003 and 2011–12; in these burned areas, richness increased more rapidly with initial gap area (steeper slopes in Fig. 4A ; Table 2 ) . In analyses considering fi nal gap area (2011–12), richness also increased with gap area, but whether gaps had burned since 2003 was associated with diff erent richness patterns ( Fig. 4B and Table 2 ). Diff erences among gaps burned and not burned were smaller ( Fig. 4B ). When considering fi nal gap area, partially burned, large gaps had more species than large gaps with other burn histories.
TABLE 1. Generalized linear mixed model results showing eff ects of initial gap
area (log transformed), burn status, and their two-way interactions on fi nal
(2011–12) gap area. R 2 for fi xed eff ects was 0.75 and 0.77 for both fi xed and
random eff ects. See also Fig. 3 .
Predictor df Estimate SE t P
Intercept 141 −0.589 0.172 −3.430 0.0008Gap area (2003) 141 0.902 0.071 12.713 <0.001Partial burn 141 1.567 0.727 2.156 0.033All burned 141 0.075 0.438 0.172 0.864Size*partial 141 −0.158 0.232 −0.681 0.497Size*all Burned 141 −0.680 0.156 4.349 <0.001Random eff ects of patch SD (intercept) 0.21 Residual 0.76
TABLE 2. Mixed model results showing fi xed eff ects of initial and fi nal (2011–12) gap areas (ln transformed), partial burn, unburned, and their two-way
interactions on species richness in 2011–12. R 2 for fi xed eff ects in the model with initial area was 0.58 and 0.70 for both fi xed and random eff ects. R 2 for fi xed
eff ects in the model with fi nal area was 0.81 and 0.87 for both fi xed and random eff ects. See also Fig. 4 .
Area 2003 Area 2011–12
Predictor df β SE t P df β SE t P
Intercept 292 3.42 0.85 4.03 <0.01 140 −1.02 2.69 −0.38 0.71Gap area 292 3.60 0.28 12.54 <0.01 140 6.82 0.76 8.96 <0.01Partial burn 292 0.84 2.75 0.30 0.76 140 7.55 2.75 2.75 0.01All burned 292 −3.88 1.86 −2.08 0.04 140 5.11 2.80 1.82 0.07Size*partial 292 1.39 0.91 1.54 0.12 140 −3.03 0.80 −3.77 <0.01Size*all burned 292 4.67 0.68 6.86 <0.01 140 −1.91 0.79 −2.41 0.02Random eff ects of patch SD (intercept) 2.58 1.87 Residual 4.01 2.85

6 • A M E R I C A N J O U R N A L O F B OTA NY
GALLEY PROOF — AJBD1700175
gaps in Florida scrub, we found that gap area distributions were lognormal, with many small gaps and fewer large gaps. A lognormal (or similar) pattern has been found in prior studies in temperate, boreal, and tropical forests ( Runkle, 1982 ; Kneeshaw and Bergeron, 1998 ; Myers et al., 2000 ). In one spruce–fi r forest, a negative expo-nential gap-size distribution was fi t ( Foster and Reiners, 1986 ). Th e present study and Menges et al. (2008) are among the fi rst papers to report a gap-size distribution for a nonforested ecosystem.
Gap areas in 2011–12 decreased logarithmically with time-since-fi re in the present study, with most of the change in area occurring during the fi rst decade postfi re. Th is pattern contrasts with results from the chronosequence in 2003 ( Menges et al., 2008 ), which sug-gested little change in gap area with time-since-fi re except for a patch not burned in >40 yr. Th is inconsistency highlights weak-nesses of the chronosequence approach, which makes inferences on long-term ecological trends by contemporaneous comparisons among sites diff ering in age or time-since-disturbance ( Pickett, 1989 ; Freestone et al., 2015 ). Th e present study, by emphasizing gap dynamics over time within the same locations, was not subject to this weakness.
Gap dynamics were strongly aff ected by fi re. Unburned gaps got smaller over time, and gaps unburned for >10 yr oft en split into smaller gaps. Gap closure (“dormancy”) also occurred when areas were unburned. In contrast, burned gaps oft en merged together into larger gaps. Th ese gap dynamics had profound impacts on spe-cies and vegetation dynamics.
Individual species responses — Fire had large eff ects on the dy-namics of individual species in Florida rosemary scrub gaps. In the present study, observed extinctions were lowest with recent fi re for two herbaceous perennials, and colonization was higher with
Fig. 5 , upper right). An ordination of 2003 data showed that axis 1 of the NMDS ordination was related as a quadratic response to time-since-fi re and gap area ( β 0 = −0.366 ± 0.043, β 1(tsf) = 0.041 ± 0.004, β 2(tsf 2 ) = −0.0004 ± 0.00005, β 3(log area) = −0.042 ± 0.009, P < 0.001). In contrast, axis 2 was not related to time-since-fi re ( β = −0.002 ± 0.003, P < 0.359) but was related to gap area ( β = 0.124 ± 0.009, P < 0.001). Individual species correlations to ordination axes were consistent with the individual species analyses reported above. For example, ground lichens had signifi cant negative correlations with axis 1, being favored in gaps with longer time-since-fi re. Her-baceous species whose colonization was increased and extinction was decreased by fi re (e.g., Lechea cernua ) showed strong correla-tions with axis 1, being favored in patches that were recently burned.
DISCUSSION
In Florida rosemary scrub, fire affected landscape structure (as measured by gap areas and dynamics) and the responses of plants were affected by both the gap dynamics and recent fire history. Species richness, species composition, and individual species occurrence patterns responded to gap area and fire. In general, richness and most species’ occurrences were favored by larger gaps and recent fires. In addition, local extinction and colonization of plants and lichens over 8 yr were strongly af-fected by fire and gap area, with extinction tending to occur in unburned and smaller gaps, and colonization more likely in larger and burned gaps.
Gap dynamics — Gap area distributions commonly include many small gaps and fewer large gaps ( Denslow, 1980 ). In this study of
FIGURE 4 Number of species per gap in 2011–12 as a function of gap area grouped by burn status of gap between (A) 2003 and (B) 2011.

D E C E M B E R 2017 , V O LU M E 104 • • 7
GALLEY PROOF — AJBD1700175
TABLE 3. Sample sizes for each of the 54 most common vascular plant and ground lichen species in this study: number of patches present in 2003 (of 28),
number of patches present in 2011–12 (of 28), number of gaps present in 2003 (of 805) and 2011–12 (of 691), and percentage of gaps with changes in
occupancy for that species. For taxa aggregated to the genus level, we also list the predominant species in our samples.
SpeciesNumber of patches
present, 2003Number of patches present, 2011–12
Number gaps present, 2003
Number of gaps present, 2011–12
Percentage of gaps with changes in occupancy
Andropogon spp. ( A. fl oridanus ) 16 13 52 28 7.1 Aristida gyrans 28 28 555 367 33.6 Asclepias spp. ( A. curtissii ) 23 23 103 76 15.7 Balduina angustifolia 15 14 130 45 10.4 Bulbostylis spp. ( B. ciliatifolia ) 19 20 84 50 11.3 Calamintha ashei 13 14 110 99 11.3 Callisia ( Tradescantia ) rosea 17 10 73 20 7.8 Ceratiola ericoides 23 23 184 52 18.6 Chapmannia fl oridana 20 20 133 87 12.4 Cladina evansii 17 20 223 169 20.6 Cladina subtenuius 16 23 306 237 26.3 Cladonia leporina 22 28 483 416 40.3 Cladonia pachycladodes 17 19 106 122 20.0 Cladonia perforata 1 1 29 50 2.8 Cladonia prostrata 21 21 308 265 22.5 Cladonia subsetacea 15 15 145 131 16.2 Cnidoscolus stimulosus 28 28 342 254 32.2 Commelina erecta 21 17 58 27 8.7 Crocanthemum ( Helianthemum ) nashii 14 13 58 31 3.9 Cyperus spp. ( C. ovatus ) 28 23 197 82 20.9 Eryngium cuneifolium 3 3 10 12 2.1 Euphorbia rosescens 5 6 35 29 3.1 Galactia regularis 24 18 80 47 13.1 Gaylussacia dumosa 9 7 75 27 4.9 Hypericum cumulicola 13 11 37 27 3.3 Lechea cernua 15 13 119 91 10.8 Lechea deckertii 28 27 353 251 31.7 Liatris ohlingerae 14 12 49 23 7.3 Licania michauxii 28 28 463 316 21.6 Opuntia humifusa 20 17 194 123 14.6 Palafoxia feayi 27 26 198 121 25.5 Paronychia chartacea 28 28 492 338 35.0 Pinus clausa 4 10 14 22 5.2 Polanisia tenuifolia 13 8 64 23 7.3 Polygonella basiramia 21 15 131 97 11.7 Polygonella polygama 24 26 126 110 20.6 Polygonella robusta 8 7 28 29 3.8 Quercus chapmanii 26 26 127 88 16.9 Quercus geminata 27 28 252 159 18.7 Quercus inopina 28 27 175 85 20.0 Rhynchospora megalocarpa 18 15 54 26 4.2 Sabal etonia 27 25 114 69 12.4 Schizachyrium niveum 6 6 24 16 1.9 Selaginella arenicola 28 28 714 483 31.7 Serenoa repens 28 27 446 108 33.1 Sideroxylon tenax 20 18 103 56 10.3 Sisyrinchium xerophyllum 8 12 23 23 4.9 Smilax auriculata 25 24 103 76 18.5 Stipulicida setacea 27 27 350 221 24.4 Stylisma abdita 25 19 101 102 12.0 Trichostemum dichotomum 12 9 28 23 4.5 Vaccinium darrowii 9 6 33 17 4.2 Vaccinium myrsenites 27 26 216 129 14.5 Ximenia americana 22 15 63 34 9.9
burning for 13 species, including six herbaceous perennials. Two species with lower extinction and higher colonization with burning were the short-lived herbaceous perennials Lechea deckertii and Paronychia chartacea . Th eir distributions were also correlated with fi re along the major axis of an NMDS ordination. Th ese species’ patterns are consistent with past research showing increases in
these two species in the decade aft er fi re ( Johnson and Abraham-son, 1990 ) and that they are gap specialists ( Maliakal-Witt et al., 2005 ; Menges et al., 2008 ; Schafer et al., 2010 ), so that their postfi re dynamics are probably mediated by gap dynamics. More generally, many herbaceous perennials in Florida scrub show decreasing oc-currences with time-since-fi re ( Menges and Kohfeldt, 1995 ). Fire

8 • A M E R I C A N J O U R N A L O F B OTA NY
GALLEY PROOF — AJBD1700175
fi re killing the dominant shrub, Florida rosemary, and temporarily reducing competition with resprouting shrubs. Recruitment of a new generation of Florida rosemary from seeds is a slow process. First, emergence of seedlings generally happens beginning the sec-ond winter aft er fi re ( Johnson, 1982 ; E. S. Menges, unpublished data) and seedling growth is quite slow (E. S. Menges, unpublished data). As seedlings grow, eventually gaps begin to shrink and merge. Other dominant shrubs such as oaks and palmettos resprout more or less in place ( Menges and Kohfeldt, 1995 ) and therefore contribute less to gap dynamics, although their growth between fi res will contribute to gap shrinkage. In Florida scrub dominated by oaks (e.g., scrubby fl atwoods), gaps are small, less spatially dy-namic, and more ephemeral than in rosemary scrub ( Menges and Hawkes, 1998 ; Young and Menges, 1999 ).
Our fi nding that species richness is positively associated with gap area is consistent with ecological literature based mainly on forests. Species richness either peaks in larger gaps ( Hubbell et al., 1999 ; Schnitzer and Carson, 2001 ; Burton et al., 2014 ) or is greatest in intermediate-sized gaps ( Kern et al., 2014 ). Larger gaps support diff erent species assemblages than smaller gaps ( Anderson and Leopold, 2002 ; Muscolo et al., 2014 ), consistent with our fi nding that certain species are found mainly in larger gaps.
Fire also had strong eff ects on species richness, increasing rich-ness patterns with gap area in 2003. Data from 2011–12 showed a weaker eff ect of fi re on richness. Th is may be due to the fact that gap areas in 2011–12 refl ect the strong eff ects of fi re between 2003 and 2011–12 on gap area, with areas increasing and gaps merging in burned areas. Th is is evidence that the eff ects of fi re on richness are due in part to the eff ects of fi re on gap size. Interestingly, partially
reduced extinction rates of rosemary scrub specialists at a larger spatial scale, the rosemary scrub patch ( Miller et al., 2012 ). In many other pyrogenic systems, abundances of herbaceous species in-crease strongly aft er fi re (e.g., Barney and Frischknecht, 1974 ; Moreno and Oechel, 1991 ; Glitzenstein et al., 2003 ; Turner et al., 2003 ).
In contrast, all ground lichen species showed higher extinction, but no change in colonization, with fi re. Fire in Florida scrub kills ground lichens ( Yahr, 2000 ) and they are slow to recolonize, so many were not present when burned areas were resampled in 2011–12. Over longer chronosequences, ground lichen occurrences increase with time-since-fi re ( Menges and Kohfeldt, 1995 ).
Nearly all of the 27 modeled species responded positively to gap area. Four species had lower extinction and 15 species had higher colonization with larger gap areas. Th ese dynamics are consistent with occupancy patterns at the gap scale reported by Menges et al. (2008 ; 14 species had positive eff ects of gap area on occupancy). The tendency of many species to do well in gap area is consis-tent with increasing densities of many species (especially obligate seeding herbaceous plants) with the amount of open space at the patch level ( Hawkes and Menges, 1996 ; Menges and Hawkes, 1998 ). Th is consistency suggests that, to a great extent, patterns of species changes with fi re or fi re suppression are mediated by their responses to gaps, which are aff ected by fi re.
Vegetation responses to fi re and gap area — Gap dynamics had strong eff ects on species richness and composition patterns in Flor-ida scrub, and these dynamics were largely controlled by fi re. Fire expanded gaps and merged adjacent gaps. Th is was probably due to
TABLE 4. Results of mixed model analysis for the subset of species for which we could evaluate the eff ects of patch identity ln gap area in 2003 (A), time-since-
fi re in 2003 (T), and burn status during 2003–11 (B), aff ecting loss of presence (“extinction”) or gain of presence (“colonization”) in a gap. ID = insuffi cient data
to form a model with these variables. Variables signifi cant at P < 0.05 are in bold; those with P < 0.1 are italicized. Obligate seeding species (after Menges and
Kohfeldt, 1995 ) are in bold.
Species Variables aff ecting extinction SD patch Variables aff ecting colonization SD patch
Aristida gyrans − 1.3 − (0.9*B) + (0.01*T) − (0.1*A) 0.31 −1.5 + (0.7*B) − (0.01*T) + (0.4*A) 0.63 Asclepias spp. ID −4.2 + (1.1*B) − (0.01*T) + (0.7*A) 0.98 Calamintha ashei −0.8 − (0.2*B) + (0.06*T) + (0.04*A) 0.69 ID Ceratiola ericoides +5.4 − (4.0*B) − (−0.07*B) − (0.5*A) 2.08 −6.3 + (2.2*B) + (0.02*T) + (1.2*A) 1.18 Cladina evansii −0.0 + (3.2*B) − (0.02*T) − (0.7*A) 2.23 −3.8 + (0.9*B) − (0.03*T) + (0.5*A) 0.59 Cladina subtenuius −1.4 + (2.1*B) + (0.01*T) − (0.4*A) 0.16 −3.1 − (0.8*B) + (0.04*T) + (0.7*A) 1.05 Cladonia leporina −1.1 + (2.3*B) − (0.01*T) − (1.0*A) 1.41 −1.3 + (0.1*B) − (0.00*T) + (0.9*A) 0.55 C. pachycladoides ID −5.2 − (0.9*B) + (0.04*T) + (1.0*A) 1.66 Cladonia prostrata −1.7 + (2.6*B) − (0.00*T) − (0.9*A) 1.94 −3.6 + (0.5*B) − (0.00*T) + (0.5*A) 2.24 Cladonia subsetacea +3.4 + (2.7*B) − (0.13*T) − (1.0*A) 0.59 −3.4 − (0.6*B) + (0.02*T) + (0.2*A) 1.08 Cnidoscolus stimulosus ID −2.4 + (2.2*B) – (0.02*T) + (0.7*A) 0.93 Cyperus spp. ID −2.6 + (2.3*B) – (0.00*T) + (0.0*A) 0.56 Gaylussasia dumosa ID −4.9 + (1.0*B) + (0.01*T) − (0.0*A) 0.87 Lechea cernua +0.2 − (0.3*B) − (0.06*T) − (0.6*A) 0.23 −5.2 + (1.2*B) – (0.02*T) + (0.6*A) 2.04 Lechea deckertii −1.4 − (3.0*B) − (0.00*T) + (0.1*A) 1.18 −2.5 + (1.5*B) – (0.01*T) + (0.7*A) 1.22 Opuntia humifusa +0.1 + (0.0*B) − (0.01*T) − (0.4*A) 1.29 −5.5 + (2.1*B) + (0.01*T) + (0.5*A) 1.83 Palafoxia feayi ID −5.1 + (2.1*B ) + (0.00*T) + (1.3*A) 1.45 Paronychia chartacea +0.1 − (2.3*B) + (0.00*T) − (0.8*A) 1.41 −1.6 + (3.3*B) – (0.03*T) + (0.6*A) 0.36 Polygonella basiramia ID 0.49 −3.0 − (0.5*B) – (0.05*T) + (0.3*A) 1.52 Polygonella polygama +0.5 − (0.7*B) − (0.00*T) − (0.2*A) 0.41 −2.9 + (2.1*B) – (0.05*T) + (0.5*A) 0.61 Sabal etonia ID −3.7 + (1.6*B) – (0.02*T) + (0.5*A) 0.47 Serenoa repens +1.7 − (0.2*B) + (0.00*T) − (0.4*A) 0.51 ID Smilax auriculata ID −4.4 + (1.9*B) – (0.01*T) + (0.8*A) 0.43 Stipulicida setacea −0.7 − (0.7*B) + (0.01*T) − (0.3*A) 0.71 −1.7 + (1.0*B) − (0.04*T) + (0.4*A) 1.36 Stylisma abdita −2.1 + (1.7*B) − (0.07*T) + (0.2*A) 2.08 −5.6 + (1.5*B) – (0.01*T) + (1.1*A) 0.56 Trichostemum dichotomum ID −7.8 + (2.5*B) + (0.03*T) + (0.8*A) 1.89 Vaccinium myrsenites +2.3 − (0.8*B) + (0.03*T) + (0.4*A) 0.30 −5.3 + (2.9*B) + (0.01*T) + (0.7*A) 0.67

D E C E M B E R 2017 , V O LU M E 104 • • 9
GALLEY PROOF — AJBD1700175
and metapopulation theory both predict greater species richness on larger patches ( Kohn and Walsh, 1994 ; Hanski, 2004 ). However, patch quality also plays an important role. In Florida scrub, both gap area and time-since-fi re (which may indicate patch quality for many species) had eff ects on diversity and on individual species oc-cupancy. Th is is consistent with previous fi ndings ( Menges and Hawkes, 1998 ; Menges et al., 2008 ; Dee and Menges, 2014 ). In other ecosystems, richness generally increases with patch size, but pat-terns in relation to fi re frequency or time-since-fi re vary. In Wis-consin remnant prairies, diversity was also greater in larger and more recently burned sites ( Alstad and Damschen, 2016 ). How-ever, large and more severely burned patches tended to have lower diversity following the 1988 Yellowstone fi res ( Turner et al., 1997 ). In South African fynbos, species richness was highest at frequently and infrequently burned sites, compared to intermediate fi re fre-quencies ( Schwilk et al., 1997 ).
Although our results have focused on the interaction of fi re with gap dynamics, most ecological literature linking distur-bances with gaps is related to disturbances other than fi re. In other ecosystems, disturbances may create gaps that allow for gap-specialist species to colonize and may increase diversity. Gaps caused by animals such as prairie dogs ( Archer et al., 1987 ), badgers ( Platt and Weis, 1977 ), and gopher tortoises ( Kaczor and Hartnett, 1990 ) create openings in perennial-dominated vegeta-tion (gaps) that can change plant species composition, favor cer-tain life-history traits, and provide niches for fugitive species. Windfalls also create small gaps that may support specialist spe-cies and increase diversity ( Denslow, 1995 ). In forest gaps created by wind and ice, trees on the edge of gaps may be at greater risks of dying and of gradually increasing gap size ( Sprugel, 1976 ).
burned large gaps supported high species richness in 2011–12. Th is may refl ect the fact that such gaps can support species that prefer postfi re conditions (in burned parts) and ground lichens that are more abundant in unburned microsites.
Fire and gap area both aff ected species composition patterns, as revealed by NMDS ordinations. In the case of 2011–12 data, the ordination emphasized some independent eff ects of these two variables, as each were correlated with diff erent ordination axes. Fire was the predominant driver, being strongly tied to the domi-nant ordination axis, especially over a time-since-fi re range of 0–20 yr, when strong compositional changes occur. Th e 2003 analysis, on the other hand, showed that gap size had stronger ef-fects (being correlated with each of the fi rst two axes) and that time-since-fi re and gap size were both correlated with one of the same axes. Th e stronger fi re eff ects on vegetation composition in 2011–12 (compared to 2003) parallels the stronger pattern of gap size with time-since fi re in 2011–12 than in 2003 (the latter dis-cussed in Menges et al., 2008 ). Between these 2 yr, many gaps were burned and created a better distribution of time-since-fi re values, possibly giving a stronger signal in 2011–12. One interpre-tation is that fi re is a primary driver of vegetation composition in Florida rosemary scrub, but that fi re acts mainly through an inter-mediary variable, gap size.
Scattered gaps in a landscape can be conceptualized as islands in a “sea” of more dominant vegetation, although these islands may have a temporary existence. Th ey can also be considered as suitable habitats for species that cannot compete with more dominant veg-etation. Th e fi elds of island biogeography and metapopulation the-ory make predictions of how scattered islands or populations may aff ect community and population properties. Island biogeography
FIGURE 5 Relationships of time-since-fi re (2011–12) and gap area (ln scale) to axis 1 and axis 2 scores in NMDS ordination. The lines represent the
models using the coeffi cients of the fi xed eff ects. (A) Axis 1 with time-since-fi re. (B) Axis 2 with time-since-fi re. (C) Axis 1 with ln (area). (D) Axis 2 with
ln (area).

10 • A M E R I C A N J O U R N A L O F B OTA NY
GALLEY PROOF — AJBD1700175
Because gaps may close laterally (from branch growth) or verti-cally (from growth of understory individuals), gap closure in forests is a complex process ( Ogden et al., 1991 ).
Although it is perhaps the predominant disturbance worldwide ( Bond and Keeley, 2005 ), fi re is not usually credited with creating gaps, and gap closure between fi res is little studied. Th is may be because many fi res occur over larger areas and create a coarser-grained spatial pattern of burned and unburned areas than is typi-cal of other gap-producing disturbances. Alternatively, in areas with low-intensity fi res, disturbances other than fi re may be re-sponsible for most gap-creating events ( King and Muzika, 2014 ; McEwan et al., 2014 ). Nonetheless, fi res can be patchy and create complex mosaics of unburned, lightly burned, and intensely burned patches that aff ect plant regeneration ( Turner et al., 1994 ).
Management implications — Because fi re can be managed by hu-mans, through prescribed burning or fi re suppression, the possibil-ity exists that land managers can control gap structure and thereby richness and species occupancy. In Florida scrub, land managers and scientists are using innovative techniques to create and main-tain gaps providing habitat for certain plant species (P. A. Schmalzer and T. E. Foster, unpublished data). Large gaps promote richness and provide opportunities for species that are particularly poor competitors with dominant shrubs. In Florida rosemary scrub, these include many species listed as endangered or threatened by the U.S. Fish and Wildlife Service or the state of Florida. Managing for larger gaps will be a challenge but may involve attempting fi res during drier periods when more complete and hotter fi res are pos-sible ( Slocum et al., 2003 ; Platt et al., 2015 ). Because gap dynamics may ultimately drive species and vegetation dynamics with fi re, understanding how fi re aff ects gap dynamics is a useful link between fi re and biotic responses.
ACKNOWLEDGEMENTS
Th e authors thank A. Craddock, A. Ritenour, C. Ficken, C. Kellman, C. Weekley, E. Batzer, J. Kupinea, J. Benning, J. Salo, J. Gehring, J. Dee, K. Carmen, K. Peterson, K. Rahmanian, M. LaFave, L. Patino, M. Trager, R. King, R. Zinthefer, S. Watts, S. Smith, S. McAllister, S. Morowski, and T. Simpson for assistance with fi eldwork; R. Pickert for assistance with GIS databases and analyses; and S. Smith, O. Boyle, S. Maliakal-Witt, M. Petru, and J. Schafer for helpful discussions and coordination in the fi eld. Th e paper was much improved by anonymous reviews. Th is work was supported by the National Science Foundation (DEB98-15370, DEB-0233899, DEB80812717, DEB1347843).
LITERATURE CITED
Abe , S. , H. Motai , H. Tanaka , M. Shibata , Y. Kominani , and T. Nakashizuka .
2008 . Population maintenance of the short-lived shrub Sambucus in a de-
ciduous forest. Ecology 89 : 1155 – 1167 .
Abrahamson , W. G. , A. F. Johnson , J. N. Layne , and P. A. Peroni . 1984 .
Vegetation of the Archbold Biological Station, Florida: An example of the
southern Lake Wales Ridge. Florida Scientist 47 : 209 – 251 .
Alstad , A. O. , and E. I. Damschen . 2016 . Fire may mediate eff ects of landscape
connectivity on plant community richness in prairie remnants. Ecography
39 : 36 – 42 .
Anderson , K. L. , and D. J. Leopold . 2002 . Th e role of canopy gaps in maintain-
ing vascular plant diversity at a forested wetland in New York State. Th e
Journal of the Torrey Botanical Society 129 : 238 – 250 .
Archer , S. , M. G. Garrett , and J. K. Detling . 1987 . Rates of vegetation change
associated with prairie dog ( Cynomys ludovicianus ) grazing in North
American mixed-grass prairie. Vegetatio 72 : 159 – 166 .
Barney , M. O. , and N. C. Frischknecht . 1974 . Vegetation changes follow-
ing fi re in the pinyon-juniper type of west-central Utah. Journal of Range
Management 27 : 91 – 96 .
Bates , D. , M. Maechler , and B. Bolker . 2013 . lme4: Linear mixed-eff ects models
using S4 classes. R Package. https://cran.r-project.org/web/packages/lme4/ .
Belsky , A. J. , and C. D. Canham . 1994 . Forest gaps and isolated savanna trees:
An application of patch dynamics in two ecosystems. Bioscience 44 : 77 – 84 .
Bond , W. J. , and J. E. Keeley . 2005 . Fire as a global ‘herbivore’: Th e ecology
and evolution of fl ammable ecosystems. Trends in Ecology & Evolution 20 :
387 – 394 .
Brodo , I. M. , S. D. Sharnoff , and S. Sharnoff . 2001 . Lichens of North America.
Yale University Press, New Haven, Connecticut, USA.
Brokaw , N. , and R. T. Busing . 2000 . Niche versus chance and tree diversity in
forest gaps. Trends in Ecology & Evolution 15 : 183 – 188 .
Burton , J. I. , D. J. Mladenoff , J. A. Forrester , and M. K. Clayton . 2014 .
Experimentally linking disturbance, resources, and productivity to di-
versity in forest ground-layer plant communities. Journal of Ecology 102 :
1634 – 1648 .
Canham , C. D. , J. S. Denslow , W. J. Platt , J. R. Runkle , T. A. Spies , and P. S.
White . 1990 . Light regimes beneath closed canopies and tree-fall gaps in
temperate and tropical forests. Canadian Journal of Forest Research 20 :
620 – 631 .
Christman , S. P. , and W. S. Judd . 1990 . Notes on plants endemic to Florida
scrub. Florida Scientist 53 : 52 – 73 .
Dee , J. R. , and E. S. Menges . 2014 . Gap ecology in Florida scrubby fl atwoods:
Eff ects of time-since-fi re, gap area, gap aggregation and microhabitat on gap
species diversity. Journal of Vegetation Science 25 : 1235 – 1246 .
Delong , M. K. , and D. J. Gibson . 2012 . What determines “suitable habitat” for
metapopulations studies? An analysis of environmental gradients and spe-
cies assemblages in xeric forest openings. American Journal of Botany 99 :
46 – 54 .
Denslow , J. S. 1980 . Gap portioning among tropical rainforest trees. Biotropica
12 : 47 – 55 .
Denslow , J. S. 1995 . Disturbance and diversity in tropical rain forests; the den-
sity eff ect. Ecological Applications 5 : 962 – 968 .
Després , T. , H. Asselin , F. Doyon , I. Drobyshev , and Y. Bergeron . 2017 . Gap
dynamics of late successional sugar maple—yellow birch forests at their
northern range limit. Journal of Vegetation Science 28 : 368 – 378 .
Dickinson , M. B. , F. E. Putz , and C. D. Canham . 1993 . Canopy gap closure
in thickets of the clonal shrub Cornus racemosa. Bulletin of the Torrey
Botanical Club 120 : 439 – 444 .
Dobson , A. P. , J. P. Rodriguez , W. M. Roberts , and D. S. Wilcove . 1997 .
Geographic distribution of endangered species in the United States. Science
275 : 550 – 553 .
Estill , J. C. , and M. B. Cruzan . 2001 . Phytogeography of rare plant species en-
demic to the southeastern United States. Castanea 66 : 3 – 23 .
Foster , J. R. , and W. A. Reiners . 1986 . Size distribution and expansion of
canopy gaps in a northern Appalachian spruce-fi r forest. Vegetatio 68 :
109 – 114 .
Franzese , J. , L. Ghermandi , and D. Bran . 2009 . Post-fi re shrub recruitment in
a semi-arid grassland: Th e role of microsites. Journal of Vegetation Science
20 : 251 – 259 .
Freestone , M. , T. J. Wills , and J. Read . 2015 . Post-fi re succession during the
long-term absence of fi re in coastal heathland and a test of the chronose-
quence survey method. Australian Journal of Botany 63 : 572 – 580 .
Glitzenstein , J. S. , D. R. Streng , and D. D. Wade . 2003 . Fire frequency eff ects
on longleaf pine ( Pinus palustris P. Miller) vegetation in South Carolina and
northeast Florida, USA. Natural Areas Journal 23 : 22 – 37 .
Hanski , I. 2004 . Metapopulation theory, its use and misuse . Basic and Applied
Ecology 5 : 225 – 229 .
Hawkes , C. V. , and E. S. Menges . 1996 . Th e relationship between open space
and fi re for species in a xeric Florida shrubland. Bulletin of the Torrey
Botanical Club 123 : 81 – 92 .

D E C E M B E R 2017 , V O LU M E 104 • • 11
GALLEY PROOF — AJBD1700175
Menges , E. S. , P. F. Quintana-Ascencio , C. W. Weekley , and O. G. Gaoue . 2006 .
Population viability analysis and fi re return intervals for an endemic Florida
scrub mint. Biological Conservation 127 : 115 – 127 .
Menges , E. S. , A. Wally , J. Salo , R. Zinthefer , and C. W. Weekley . 2008 . Gap
ecology in Florida scrub: Species occurrence, diversity, and gap properties.
Journal of Vegetation Science 19 : 503 – 514 .
Miller , T. , P. F. Quintana-Ascencio , S. Maliakal-Witt , and E. S. Menges .
2012 . Metacommunity dynamics over 16 years in a pyrogenic shrubland.
Conservation Biology 26 : 357 – 366 .
Moreno , J. M. , and W. C. Oechel . 1991 . Fire intensity eff ects on germina-
tion of shrubs and herbs in southern California chaparral. Ecology 72 :
1993 – 2004 .
Muscolo , A. , S. Bagnato , M. Sidari , and R. Mercurio . 2014 . A review of the roles
of forest canopy gaps. Journal of Forestry Research 25 : 725 – 736 .
Myers , G. P. , A. C. Newton , and O. Melgarejo . 2000 . Th e infl uence of canopy
gap size on natural regeneration of Brazil nut ( Bertholletia excels ) in Bolivia.
Forest Ecology and Management 127 : 119 – 128 .
Nagel , T. A. , S. Mikac , M. Dolinar , M. Klopcic , S. Keren , M. Svoboda , J. Diaci ,
A. Boncina , and V. Paulic . 2017 . Th e natural disturbance regime in for-
ests of the Dinaric Mountains: A synthesis of evidence. Forest Ecology and
Management 388 : 29 – 42 .
Nakagawa , S. , and H. Schielzeth . 2013 . A general and simple method for ob-
taining R 2 from generalized linear mixed-eff ects models. Methods in Ecology
and Evolution 4 : 133 – 142 .
Ogden , J. , R. A. Fordham , S. Pilkington , and R. G. Serra . 1991 . Forest gap
formation and closure along an altitudinal gradient in Tongariro National
Park, New Zealand. Journal of Vegetation Science 2 : 165 – 172 .
Oksanen , J. F. , G. Blanchet , R. Kindt , P. Legendre , P. R. Minchin , R. B. O’Hara ,
G. L. Simpson , et al. 2015 . Vegan: Community Ecology Package. R package
version 2.3-0. http://CRAN.R-project.org/package=vegan .
Pearson , T. R. H. , D. F. R. P. Burslem , R. E. Goeriz , and J. W. Dalling . 2003 .
Interactions of gap size and herbivory on establishment, growth, and sur-
vival of three species of neotropical pioneer trees. Journal of Ecology 91 :
785 – 796 .
Pecot , S. D. , R. J. Mitchell , B. J. Palik , E. B. Moser , and J. K. Hiers . 2007 .
Competitive responses of seedlings and understory plants in longleaf
pine woodlands: separating canopy infl uences above and below ground.
Canadian Journal of Forest Research 37 : 634 – 648 .
Petru , M. , and E. S. Menges . 2003 . Seedling establishment in natural and ex-
perimental Florida scrub gaps. Th e Journal of the Torrey Botanical Society
130 : 89 – 100 .
Pham , A. T. , L. DeGrandpre , S. Gaulthier , and Y. Bergeron . 2004 . Gap dynam-
ics and replacement patterns in gaps of the northeastern boreal forest of
Quebec. Canadian Journal of Forest Research 34 : 353 – 364 .
Pickett , S. T. A. 1989 . Space-for-time substitution as an alternative to long-term
studies. In G. E. Likens [ed.], Long-term studies in ecology: Approaches and
alternatives, 110–135. Springer Verlag, New York, New York, USA.
Pickett , S. T. A. , and P. S. White . 1985 . Th e ecology of natural disturbance and
patch dynamics. Academic Press, New York, New York, USA.
Platt , W. J. , S. L. Orzell , and M. G. Slocum . 2015 . Seasonality of fi re weather
strongly infl uences fi re regimes in south Florida savanna-grassland land-
scapes. PLoS One 10 : e0116952 .
Platt , W. J. , and I. M. Weis . 1977 . Resource partitioning and competition
within a guild of fugitive prairie plants. American Naturalist 111 : 479 – 513 .
Quintana-Ascencio , P. F. , and E. S. Menges . 1996 . Inferring metapopulation
dynamics from patch-level incidence of Florida scrub plants. Conservation
Biology 10 : 1210 – 1219 .
Quintana-Ascencio , P. F. , E. S. Menges , and C. W. Weekley . 2003 . A fi re-ex-
plicit population viability analysis of Hypericum cumulicola in Florida rose-
mary scrub. Conservation Biology 17 : 433 – 449 .
R Core Team . 2013 . R: A language and environment for statistical computing.
R Foundation for Statistical Computing, Vienna, Austria. http://www.R-
project.org/ .
Rebertus , A. J. , and B. R. Burns . 1997 . Th e importance of gap processes in the
development and maintenance of oak savannas and dry forests. Journal of
Ecology 85 : 635 – 645 .
Hewitt , R. E. , and E. S. Menges . 2008 . Allelopathic eff ects of Ceratiola ericoi-
des (Empetraceae) on germination and survival of six Florida scrub species.
Plant Ecology 198 : 47 – 59 .
Hubbell , S. P. , R. B. Foster , S. T. O’Brien , K. E. Harms , R. Condit , B. Wechsler ,
S. B. Wright , and S. Loo de Loo . 1999 . Light-gap disturbances, recruit-
ment limitation, and tree diversity in a neotropical forest. Science 283 :
554 – 557 .
Hunter , M. E. , and E. S. Menges . 2002 . Allelopathic eff ects and root distribu-
tion of Ceratiola ericoides (Empetraceae) on seven rosemary scrub species.
American Journal of Botany 89 : 1113 – 1118 .
Huth , F. , and S. Wagner . 2006 . Gap structure and establishment of silver birch
regeneration ( Betula pendula Roth.) in Norway spruce stands ( Picea abies L.
Karst.). Forest Ecology and Management 229 : 314 – 324 .
Johnson , A. F. 1982 . Some demographic characteristics of the Florida rosemary
Ceratiola ericoides Michx. American Midland Naturalist 108 : 170 – 174 .
Johnson , A. F. , and W. G. Abrahamson . 1990 . A note on the fi re responses
of species in rosemary scrubs on the southern Lake Wales Ridge. Florida
Scientist 53 : 138 – 143 .
Kaczor , S. A. , and D. C. Hartnett . 1990 . Gopher tortoise ( Gopherus Polyphemus )
eff ects on soils and vegetation in a Florida sandhill community. American
Midland Naturalist 123 : 100 – 111 .
Karki , L. , and S. W. Hallgren . 2015 . Tree-fall gaps and regeneration in old-
growth cross timbers forests. Natural Areas Journal 35 : 533 – 541 .
Keeley , J. E. , V. T. Parker , and M. C. Vasey . 2016 . Resprouting and seeding hy-
potheses: A test of the gap-dependent model using resprouting and obligate
seeding subspecies of Arctostaphylos. Plant Ecology 217 : 743 – 750 .
Kern , C. C. , R. A. Montgomery , P. B. Reich , and T. F. Strong . 2014 . Harvest-
created canopy gaps increase species and functional trait diversity of the for-
est ground-layer community. Forest Science 60 : 335 – 344 .
King , C. B. , and R.-M. Muzika . 2014 . Historic fi re and canopy disturbance
dynamics in an oak–pine ( Quercus – Pinus ) forest of the Missouri Ozarks
(1624–2010). Castanea 79 : 78 – 87 .
Kneeshaw , D. D. , and Y. Bergeron . 1998 . Canopy gap characteristics and tree
replacement in the southeastern boreal forest. Ecology 79 : 783 – 794 .
Kohn , D. D. , and D. M. Walsh . 1994 . Plant species richness—the eff ect of is-
land size and habitat diversity. Journal of Ecology 82 : 367 – 377 .
Lloret , F. , J. Penuelas , and M. Estiarte . 2005 . Eff ects of vegetation canopy and
climate on seedling establishment in Mediterranean shrubland. Journal of
Vegetation Science 16 : 67 – 76 .
Maguire , A. J. , and E. S. Menges . 2011 . Post-fi re growth strategies of resprout-
ing Florida scrub species. Fire Ecology 7 : 12 – 25 .
Maliakal-Witt , S. M. , E. S. Menges , and J. S. Denslow . 2005 . Microhabitat dis-
tribution of two Florida scrub endemic plants in comparison to their habi-
tat-generalist congeners. American Journal of Botany 92 : 411 – 421 .
McEwan , R. W. , N. Pederson , A. Cooper , J. Taylor , R. Watts , and A. Hruska .
2014 . Fire and gap dynamics over 300 years in an old-growth temperate
forest. Applied Vegetation Science 17 : 312 – 322 .
Menges , E. S. 1999 . Ecology and conservation of Florida scrub. In R. C.
Anderson, J. S. Fralish, and J. Baskin [eds.], Th e savanna, barren, and rock
outcrop communities of North America, 7–22. Cambridge University Press,
Cambridge, UK.
Menges , E. S. 2007 . Integrating demography and fi re management: An exam-
ple from Florida scrub. Australian Journal of Botany 55 : 261 – 272 .
Menges , E. S. , and C. V. Hawkes . 1998 . Interactive eff ects of fi re and micro-
habitat on plants of Florida scrub. Ecological Applications 8 : 935 – 946 .
Menges , E. S. , and J. Kimmich . 1996 . Microhabitat and time since fi re: Eff ects
on demography of Eryngium cuneifolium (Apiaceae), a Florida scrub en-
demic plant. American Journal of Botany 83 : 185 – 191 .
Menges , E. S. , and N. M. Kohfeldt . 1995 . Life history strategies of Florida scrub
plants in relation to fi re. Bulletin of the Torrey Botanical Club 122 : 282 – 297 .
Menges , E. S. , K. N. Main , R. L. Pickert , and K. Ewing . 2017 . Evaluation of a
fi re management plan for fi re regime goals in a Florida landscape. Natural
Areas Journal 37 : 212 – 227 .
Menges , E. S. , and P. F. Quintana-Ascencio . 2004 . Population viability with
fi re in Eryngium cuneifolium : Deciphering a decade of demographic data.
Ecological Monographs 74 : 79 – 99 .

12 • A M E R I C A N J O U R N A L O F B OTA NY
GALLEY PROOF — AJBD1700175
Richards , J. D. , and J. L. Hart . 2012 . Canopy gap dynamics and development
patterns in secondary Quercus stands on the Cumberland Plateau, Alabama,
USA. Acta Oecologica 38 : 33 – 40 .
Runkle , J. R. 1982 . Patterns of disturbance in some old-growth mesic forests of
eastern North America. Ecology 63 : 1533 – 1546 .
Schafer , J. L. , and M. C. Mack . 2014 . Growth, biomass, and allometry of
resprouting shrubs aft er fi re in scrubby fl atwoods. American Midland
Naturalist 172 : 266 – 284 .
Schafer , J. L. , E. S. Menges , P. F. Quintana-Ascencio , and C. W. Weekley . 2010 .
Eff ects of time-since-fi re and microhabitat on the occurrence and density of
the endemic Paronychia chartacea ssp. chartacea in Florida scrub and along
roadsides. American Midland Naturalist 163 : 294 – 310 .
Schafer , J. L. , L. L. Sullivan , C. W. Weekley , and E. S. Menges . 2013 . Eff ects
of habitat and time-since-fi re on recruitment, survival, and reproduction
of Paronychia chartacea ssp. chartacea , a short-lived Florida scrub endemic
herb. Th e Journal of the Torrey Botanical Society 140 : 181 – 195 .
Schliemann , S. A. , and J. G. Bockheim . 2011 . Methods for studying treefall
gaps: A review. Forest Ecology and Management 261 : 1143 – 1151 .
Schnitzer , S. A. , and W. P. Carson . 2001 . Treefall gaps and the maintenance of
species diversity in a tropical forest. Ecology 82 : 913 – 919 .
Schwilk , D. , J. Keeley , and W. Bond . 1997 . Th e intermediate disturbance hy-
pothesis does not explain fi re and diversity patterns in fynbos. Plant Ecology
132 : 77 – 84 .
Sharma , L. N. , J.-A. Grytnes , I. E. Maren , and O. R. Vetaas . 2016 . Do compo-
sition and richness of woody plants vary between gaps and close canopy
patches in subtropical forests? Journal of Vegetation Science 27 : 1129 – 1139 .
Slocum , M. G. , W. J. Platt , and H. C. Cooley . 2003 . Eff ects of diff erences in
prescribed fi re regimes on patchiness and intensity of fi res in subtropical sa-
vannas of Everglades National Park, Florida. Restoration Ecology 11 : 91 – 102 .
Sprugel , D. G. 1976 . Dynamic structure of wave-regenerated Abies balsamea
forests in the northeastern United States. Journal of Ecology 64 : 889 – 911 .
Tozer , K. N. , D. F. Quigley , P. E. Dowling , P. M. Cousens , R. D. Kearney , G. A.
Sedcole , and J. Richard . 2008 . Controlling invasive annual grasses in grazed
pastures: Population dynamics and critical gap sizes. Journal of Applied
Ecology 45 : 1152 – 1159 .
Turner , M. G. , W. W. Hargrove , R. H. Gardner , and W. H. Romme . 1994 .
Eff ects of fi re on landscape heterogeneity in Yellowstone National Park,
Wyoming. Journal of Vegetation Science 5 : 731 – 742 .
Turner , M. G. , W. H. Romme , W. W. Hargrove , and R. H. Gardner . 1997 .
Eff ects of fi re size and pattern on early succession in Yellowstone National
Park. Ecological Monographs 67 : 411 – 433 .
Turner , M. G. , W. H. Romme , and D. B. Tinker . 2003 . Surprises and lessons
from the 1988 Yellowstone fi res. Frontiers in Ecology and the Environment
1 : 351 – 358 .
Vepakomma , U. , B. St-Onge , and D. Kneeshaw . 2011 . Response of a boreal for-
est to canopy opening: Assessing vertical and lateral tree growth with multi-
temporal lidar data. Ecological Applications 21 : 99 – 121 .
Williamson , G. B. , E. M. Obee , and J. D. Weidenhamer . 1992 . Inhibition of
Schizachyrium scoparium (Poaceae) by the allelochemical hydrocinnamic
acid. Journal of Chemical Ecology 18 : 2095 – 2105 .
Yahr , R. 2000 . Ecology and post-fi re recovery of Cladonia perforata , an en-
dangered Florida-scrub lichen. Forest Snow and Landscape Research 75 :
339 – 356 .
Young , C. C. , and E. S. Menges . 1999 . Gap-phase dynamics and microhabitat
specialization: Post-fi re regeneration of scrubby fl atwoods communities on
the Lake Wales Ridge. Florida Scientist 62 : 1 – 10 .
Zhu , J. , D. Lu , and W. Zhang . 2014 . Eff ects of gaps on regeneration of woody
plants: A meta-analysis. Journal of Forestry Research 25 : 501 – 510 .

Author: Read proofs carefully. This is your ONLY opportunity to make changes. NO further alterations will be allowed after this point.
Author Queries
There are no queries in this article.
GALLEY PROOF — AJBD1700175Q
Related Documents