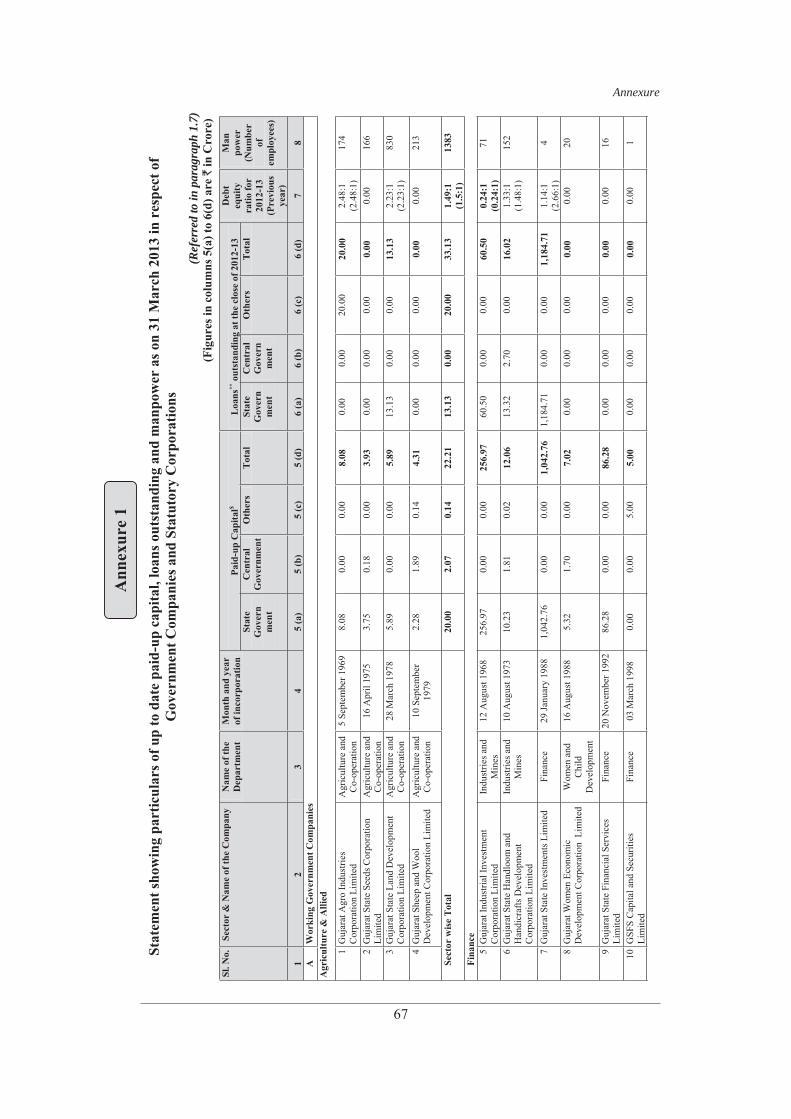
Annexure 67 Statement showing particulars of up to date paid-up capital, loans outstanding and manpower as on 31 March 2013 in respect of Government Companies and Statutory Corporations (Referred to in paragraph 1.7) (Figures in columns 5(a) to 6(d) are ` in Crore) Sl. No. Sector & Name of the Company Name of the Department Month and year of incorporation Paid-up Capital $ Loans ** outstanding at the close of 2012-13 Debt equity ratio for 2012-13 (Previous year) Man power (Number of employees) State Govern ment Central Government Others Total State Govern ment Central Govern ment Others Total 1 2 3 4 5 (a) 5 (b) 5 (c) 5 (d) 6 (a) 6 (b) 6 (c) 6 (d) 7 8 A Working Government Companies Agriculture & Allied 1 Gujarat Agro Industries Corporation Limited Agriculture and Co-operation 5 September 1969 8.08 0.00 0.00 8.08 0.00 0.00 20.00 20.00 2.48:1 (2.48:1) 174 2 Gujarat State Seeds Corporation Limited Agriculture and Co-operation 16 April 1975 3.75 0.18 0.00 3.93 0.00 0.00 0.00 0.00 0.00 166 3 Gujarat State Land Development Corporation Limited Agriculture and Co-operation 28 March 1978 5.89 0.00 0.00 5.89 13.13 0.00 0.00 13.13 2.23:1 (2.23:1) 830 4 Gujarat Sheep and Wool Development Corporation Limited Agriculture and Co-operation 10 September 1979 2.28 1.89 0.14 4.31 0.00 0.00 0.00 0.00 0.00 213 Sector wise Total 20.00 2.07 0.14 22.21 13.13 0.00 20.00 33.13 1.49:1 (1.5:1) 1383 Finance 5 Gujarat Industrial Investment Corporation Limited Industries and Mines 12 August 1968 256.97 0.00 0.00 256.97 60.50 0.00 0.00 60.50 0.24:1 (0.24:1) 71 6 Gujarat State Handloom and Handicrafts Development Corporation Limited Industries and Mines 10 August 1973 10.23 1.81 0.02 12.06 13.32 2.70 0.00 16.02 1.33:1 (1.48:1) 152 7 Gujarat State Investments Limited Finance 29 January 1988 1,042.76 0.00 0.00 1,042.76 1,184.71 0.00 0.00 1,184.71 1.14:1 (2.66:1) 4 8 Gujarat Women Economic Development Corporation Limited Women and Child Development 16 August 1988 5.32 1.70 0.00 7.02 0.00 0.00 0.00 0.00 0.00 20 9 Gujarat State Financial Services Limited Finance 20 November 1992 86.28 0.00 0.00 86.28 0.00 0.00 0.00 0.00 0.00 16 10 GSFS Capital and Securities Limited Finance 03 March 1998 0.00 0.00 5.00 5.00 0.00 0.00 0.00 0.00 0.00 1 Annexure 1

Welcome message from author
This document is posted to help you gain knowledge. Please leave a comment to let me know what you think about it! Share it to your friends and learn new things together.
Transcript
Annexure
67
Stat
emen
t sho
win
g pa
rtic
ular
s of u
p to
dat
e pa
id-u
p ca
pita
l, lo
ans o
utst
andi
ng a
nd m
anpo
wer
as o
n 31
Mar
ch 2
013
in r
espe
ct o
f G
over
nmen
t Com
pani
es a
nd S
tatu
tory
Cor
pora
tions
(R
efer
red
to in
par
agra
ph 1
.7)
(Fig
ures
in c
olum
ns 5
(a) t
o 6(
d) a
re `
in C
rore
)Sl
. No.
Se
ctor
& N
ame
of th
e C
ompa
ny
Nam
e of
the
Dep
artm
ent
Mon
th a
nd y
ear
of in
corp
orat
ion
Paid
-up
Cap
ital$
Loa
ns**
out
stan
ding
at t
he c
lose
of 2
012-
13
Deb
teq
uity
ratio
for
2012
-13
(Pre
viou
sye
ar)
Man
pow
er
(Num
ber
ofem
ploy
ees)
Stat
eG
over
nm
ent
Cen
tral
Gov
ernm
ent
Oth
ers
Tot
alSt
ate
Gov
ern
men
t
Cen
tral
Gov
ern
men
t
Oth
ers
Tot
al
12
34
5 (a
) 5
(b)
5 (c
) 5
(d)
6 (a
) 6
(b)
6 (c
) 6
(d)
78
A
Wor
king
Gov
ernm
ent C
ompa
nies
A
gric
ultu
re &
Alli
ed
1 G
ujar
at A
gro
Indu
strie
s C
orpo
ratio
n Li
mite
d A
gric
ultu
re a
nd
Co-
oper
atio
n5
Sept
embe
r 196
9 8.
08
0.00
0.
00
8.08
0.00
0.
00
20.0
0 20
.00
2.48
:1
(2.4
8:1)
174
2 G
ujar
at S
tate
See
ds C
orpo
ratio
n Li
mite
d A
gric
ultu
re a
nd
Co-
oper
atio
n16
Apr
il 19
75
3.75
0.
18
0.00
3.
930.
00
0.00
0.
00
0.00
0.00
16
6
3 G
ujar
at S
tate
Lan
d D
evel
opm
ent
Cor
pora
tion
Lim
ited
Agr
icul
ture
and
C
o-op
erat
ion
28 M
arch
197
8 5.
89
0.00
0.
00
5.89
13.1
3 0.
00
0.00
13
.13
2.23
:1(2
.23:
1)83
0
4 G
ujar
at S
heep
and
Woo
l D
evel
opm
ent C
orpo
ratio
n Li
mite
d A
gric
ultu
re a
nd
Co-
oper
atio
n10
Sep
tem
ber
1979
2.
28
1.89
0.
14
4.31
0.00
0.
00
0.00
0.
000.
00
213
S
ecto
r w
ise
Tot
al
20.0
0 2.
07
0.14
22
.21
13.1
3 0.
00
20.0
0 33
.13
1.49
:1
(1.5
:1)
1383
F
inan
ce
5 G
ujar
at In
dust
rial I
nves
tmen
t C
orpo
ratio
n Li
mite
d In
dust
ries a
nd
Min
es12
Aug
ust 1
968
256.
97
0.00
0.
00
256.
97
60.5
0 0.
00
0.00
60
.50
0.24
:1
(0.2
4:1)
71
6 G
ujar
at S
tate
Han
dloo
m a
nd
Han
dicr
afts
Dev
elop
men
t C
orpo
ratio
n Li
mite
d
Indu
strie
s and
M
ines
10 A
ugus
t 197
3 10
.23
1.81
0.
02
12.0
613
.32
2.70
0.
00
16.0
21.
33:1
(1.4
8:1)
152
7 G
ujar
at S
tate
Inve
stm
ents
Lim
ited
Fina
nce
29 Ja
nuar
y 19
88
1,04
2.76
0.
00
0.00
1,
042.
761,
184.
71
0.00
0.
00
1,18
4.71
1.14
:1(2
.66:
1)4
8 G
ujar
at W
omen
Eco
nom
ic
Dev
elop
men
t Cor
pora
tion
Lim
ited
Wom
en a
nd
Chi
ldD
evel
opm
ent
16 A
ugus
t 198
8 5.
32
1.70
0.
00
7.02
0.00
0.
00
0.00
0.
000.
00
20
9 G
ujar
at S
tate
Fin
anci
al S
ervi
ces
Lim
ited
Fina
nce
20 N
ovem
ber 1
992
86.2
8 0.
00
0.00
86
.28
0.00
0.
00
0.00
0.
000.
00
16
10 G
SFS
Cap
ital a
nd S
ecur
ities
Li
mite
d Fi
nanc
e 03
Mar
ch 1
998
0.00
0.
00
5.00
5.
000.
00
0.00
0.
00
0.00
0.00
1
Ann
exur
e 1
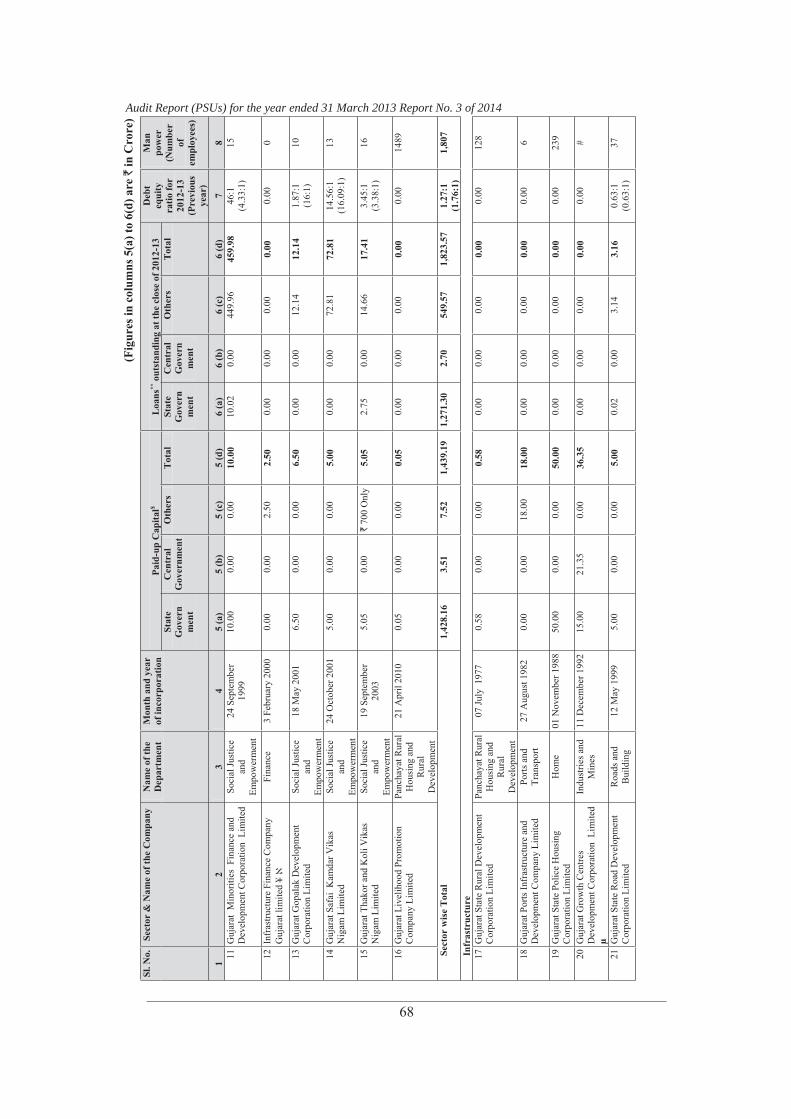
Audit Report (PSUs) for the year ended 31 March 2013 Report No. 3 of 2014
68
(Fig
ures
in c
olum
ns 5
(a) t
o 6(
d) a
re `
in C
rore
)Sl
. No.
Se
ctor
& N
ame
of th
e C
ompa
ny
Nam
e of
the
Dep
artm
ent
Mon
th a
nd y
ear
of in
corp
orat
ion
Paid
-up
Cap
ital$
Loa
ns**
out
stan
ding
at t
he c
lose
of 2
012-
13
Deb
teq
uity
ratio
for
2012
-13
(Pre
viou
sye
ar)
Man
pow
er
(Num
ber
ofem
ploy
ees)
Stat
eG
over
nm
ent
Cen
tral
Gov
ernm
ent
Oth
ers
Tot
alSt
ate
Gov
ern
men
t
Cen
tral
Gov
ern
men
t
Oth
ers
Tot
al
12
34
5 (a
) 5
(b)
5 (c
) 5
(d)
6 (a
) 6
(b)
6 (c
) 6
(d)
78
11 G
ujar
at M
inor
ities
Fin
ance
and
D
evel
opm
ent C
orpo
ratio
n L
imite
d So
cial
Just
ice
and
Empo
wer
men
t
24 S
epte
mbe
r 19
99
10.0
0 0.
00
0.00
10
.00
10.0
2 0.
00
449.
96
459.
9846
:1(4
.33:
1)15
12 I
nfra
stru
ctur
e Fi
nanc
e C
ompa
ny
Guj
arat
lim
ited
¥ Fi
nanc
e 3
Febr
uary
200
0 0.
00
0.00
2.
50
2.50
0.00
0.
00
0.00
0.
000.
00
0
13 G
ujar
at G
opal
ak D
evel
opm
ent
Cor
pora
tion
Lim
ited
Soci
al Ju
stic
e an
dEm
pow
erm
ent
18 M
ay 2
001
6.50
0.
00
0.00
6.
500.
00
0.00
12
.14
12.1
41.
87:1
(16:
1)10
14 G
ujar
at S
afai
Kam
dar V
ikas
N
igam
Lim
ited
Soci
al Ju
stic
e an
dEm
pow
erm
ent
24 O
ctob
er 2
001
5.00
0.
00
0.00
5.
000.
00
0.00
72
.81
72.8
114
.56:
1(1
6.09
:1)
13
15 G
ujar
at T
hako
r and
Kol
i Vik
as
Nig
am L
imite
d So
cial
Just
ice
and
Empo
wer
men
t
19 S
epte
mbe
r 20
03
5.05
0.
00
` 7
00 O
nly
5.05
2.75
0.
00
14.6
6 17
.41
3.45
:1(3
.38:
1)16
16 G
ujar
at L
ivel
ihoo
d Pr
omot
ion
Com
pany
Lim
ited
Panc
haya
t Rur
al
Hou
sing
and
R
ural
Dev
elop
men
t
21 A
pril
2010
0.
05
0.00
0.
00
0.05
0.00
0.
00
0.00
0.
000.
00
1489
Se
ctor
wis
e T
otal
1,
428.
16
3.51
7.
52
1,43
9.19
1,
271.
30
2.70
54
9.57
1,
823.
57
1.27
:1
(1.7
6:1)
1,80
7
In
fras
truc
ture
17
Guj
arat
Sta
te R
ural
Dev
elop
men
t C
orpo
ratio
n Li
mite
d Pa
ncha
yat R
ural
H
ousi
ng a
nd
Rur
alD
evel
opm
ent
07 Ju
ly 1
977
0.58
0.
00
0.00
0.
580.
00
0.00
0.
00
0.00
0.00
12
8
18 G
ujar
at P
orts
Infr
astru
ctur
e an
d D
evel
opm
ent C
ompa
ny L
imite
d Po
rts a
nd
Tran
spor
t27
Aug
ust 1
982
0.00
0.
00
18.0
0 18
.00
0.00
0.
00
0.00
0.
000.
00
6
19 G
ujar
at S
tate
Pol
ice
Hou
sing
C
orpo
ratio
n Li
mite
d H
ome
01 N
ovem
ber 1
988
50.0
0 0.
00
0.00
50
.00
0.00
0.
00
0.00
0.
000.
00
239
20 G
ujar
at G
row
th C
entre
s D
evel
opm
ent C
orpo
ratio
n L
imite
d μ
Indu
strie
s and
M
ines
11 D
ecem
ber 1
992
15.0
0 21
.35
0.00
36
.35
0.00
0.
00
0.00
0.
000.
00
#
21 G
ujar
at S
tate
Roa
d D
evel
opm
ent
Cor
pora
tion
Lim
ited
Roa
ds a
nd
Bui
ldin
g12
May
199
9 5.
00
0.00
0.
00
5.00
0.02
0.
00
3.14
3.
160.
63:1
(0.6
3:1)
37
Annexure
69
(Fig
ures
in c
olum
ns 5
(a) t
o 6(
d) a
re `
in C
rore
)Sl
. No.
Se
ctor
& N
ame
of th
e C
ompa
ny
Nam
e of
the
Dep
artm
ent
Mon
th a
nd y
ear
of in
corp
orat
ion
Paid
-up
Cap
ital$
Loa
ns**
out
stan
ding
at t
he c
lose
of 2
012-
13
Deb
teq
uity
ratio
for
2012
-13
(Pre
viou
sye
ar)
Man
pow
er
(Num
ber
ofem
ploy
ees)
Stat
eG
over
nm
ent
Cen
tral
Gov
ernm
ent
Oth
ers
Tot
alSt
ate
Gov
ern
men
t
Cen
tral
Gov
ern
men
t
Oth
ers
Tot
al
12
34
5 (a
) 5
(b)
5 (c
) 5
(d)
6 (a
) 6
(b)
6 (c
) 6
(d)
78
22 G
ujar
at U
rban
Dev
elop
men
t C
ompa
ny L
imite
d U
rban
Dev
elop
men
t an
d U
rban
H
ousi
ng
27 M
ay 1
999
26.0
0 0.
00
0.00
26
.00
0.00
0.
00
0.00
0.
000.
00
46
23 G
ujar
at In
dust
rial C
orrid
or
Cor
pora
tion
Lim
ited
Indu
strie
s and
M
ines
30 M
arch
200
9 10
.00
0.00
0.
00
10.0
00.
00
0.00
0.
00
0.00
0.00
2
24 M
etro
Lin
k Ex
pres
s for
G
andh
inag
ar a
nd A
hmed
abad
(M
EGA
) Com
pany
Lim
ited
Urb
anD
evel
opm
ent
and
Urb
an
Hou
sing
04 F
ebru
ary
201
0 55
0.00
0.
00
0.00
55
0.00
0.00
0.
00
250.
00
250.
000.
45:1
(0.0
0)77
25 G
ujar
at S
tate
Avi
atio
n In
fras
truct
ure
Com
pany
Lim
ited
Indu
strie
s and
M
ines
07 Ju
ly 2
010
0.05
0.
00
0.00
0.
050.
00
0.00
0.
00
0.00
0.00
6
26 D
hole
ra In
tern
atio
nal A
irpor
t C
ompa
ny L
imite
d In
dust
ries a
nd
Min
es20
Janu
ary
2012
35
.00
0.00
2.
35
37.3
50.
00
0.00
0.
00
0.00
0.00
0
S
ecto
r w
ise
Tot
al
691.
63
21.3
5 20
.35
733.
33
0.02
0.
00
253.
14
253.
16
0.35
:1
(0.0
2:1)
541
M
anuf
actu
re
27 G
ujar
at M
iner
al D
evel
opm
ent
Cor
pora
tion
Lim
ited
Indu
strie
s and
M
ines
15 M
ay 1
963
47.0
6 0.
00
16.5
4 63
.60
0.00
0.
00
0.00
0.
000.
00(0
.00)
19
20
28 G
ujar
at S
tate
Pet
role
um
Cor
pora
tion
Lim
ited
Ener
gy a
nd
Petro
chem
ical
s 29
Janu
ary
1978
20
6.89
0.
00
428.
89
635.
780.
00
0.00
11
,151
.84
11,1
51.8
4 17
.54:
1(2
5.84
:1)
350
29 G
SPC
Mar
gina
l Fie
lds L
imite
d En
ergy
and
Pe
troch
emic
als
21 F
ebru
ary
2012
0.
00
0.00
5.
01
5.01
0.00
0.
00
0.00
0.
000.
00
0
30 A
lcoc
k A
shdo
wn
(Guj
arat
) Li
mite
d In
dust
ries a
nd
Min
es5
Sept
embe
r 199
4 15
.50
0.00
35
.50
51.0
093
.00
0.00
0.
00
93.0
01.
82:1
(1.8
2:1)
169
31 G
SPC
(JPD
A) L
imite
d En
ergy
and
Pe
troch
emic
als
13 O
ctob
er 2
006
0.00
0.
00
90.7
1 90
.71
0.00
0.
00
0.00
0.
000.
00
0
32 G
SPC
LN
G L
imite
d En
ergy
and
Pe
troch
emic
als
27 F
ebru
ary
2007
0.
00
0.00
52
.43
52.4
30.
00
0.00
0.
00
0.00
0.00
9
33 N
aini
Coa
l Com
pany
Lim
ited
Indu
strie
s and
M
ines
09 O
ctob
er 2
009
0.00
0.
00
0.05
0.
050.
00
0.00
0.
00
0.00
0.00
0
34 G
ujar
at S
tate
Min
ing
and
Res
ourc
es C
orpo
ratio
n Li
mite
d In
dust
ries a
nd
Min
es19
Apr
il 20
10
0.00
0.
00
0.05
0.
050.
00
0.00
0.
00
0.00
0.00
0
Sec
tor
wis
e T
otal
26
9.45
0.
00
629.
18
898.
63
93.0
0 0.
00
11,1
51.8
4 11
,244
.84
12.5
1:1
(1
2.47
:1)
2,44
8
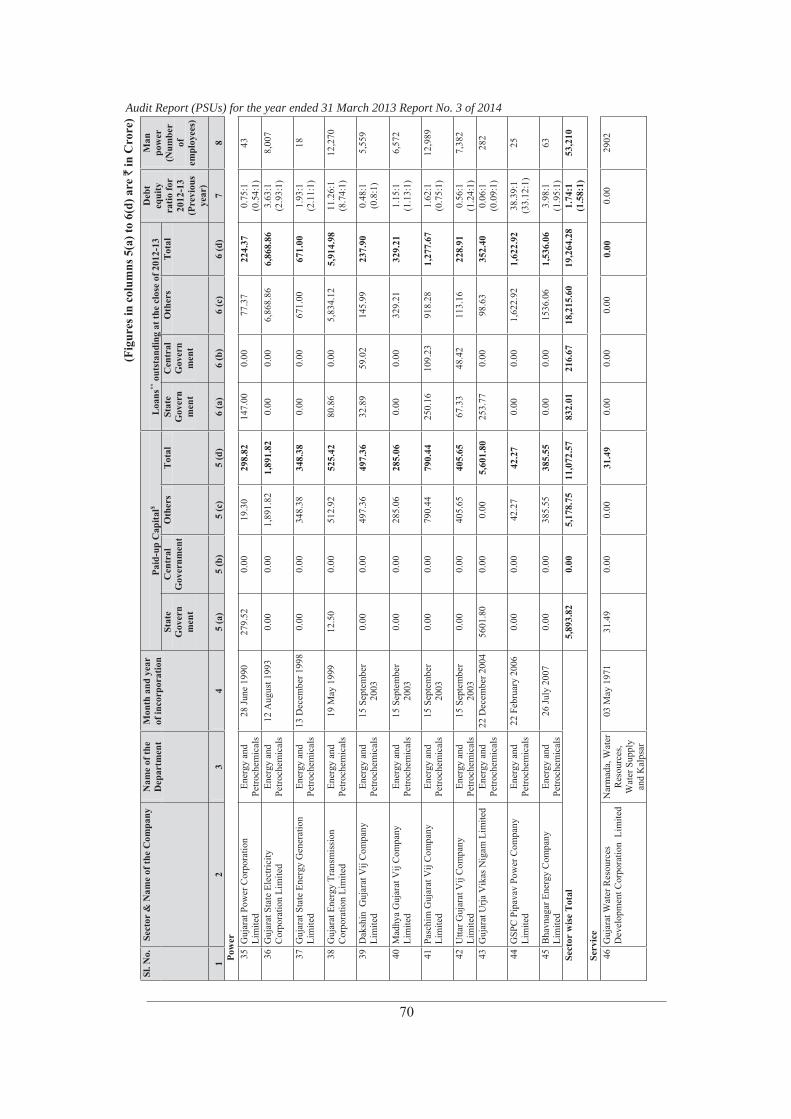
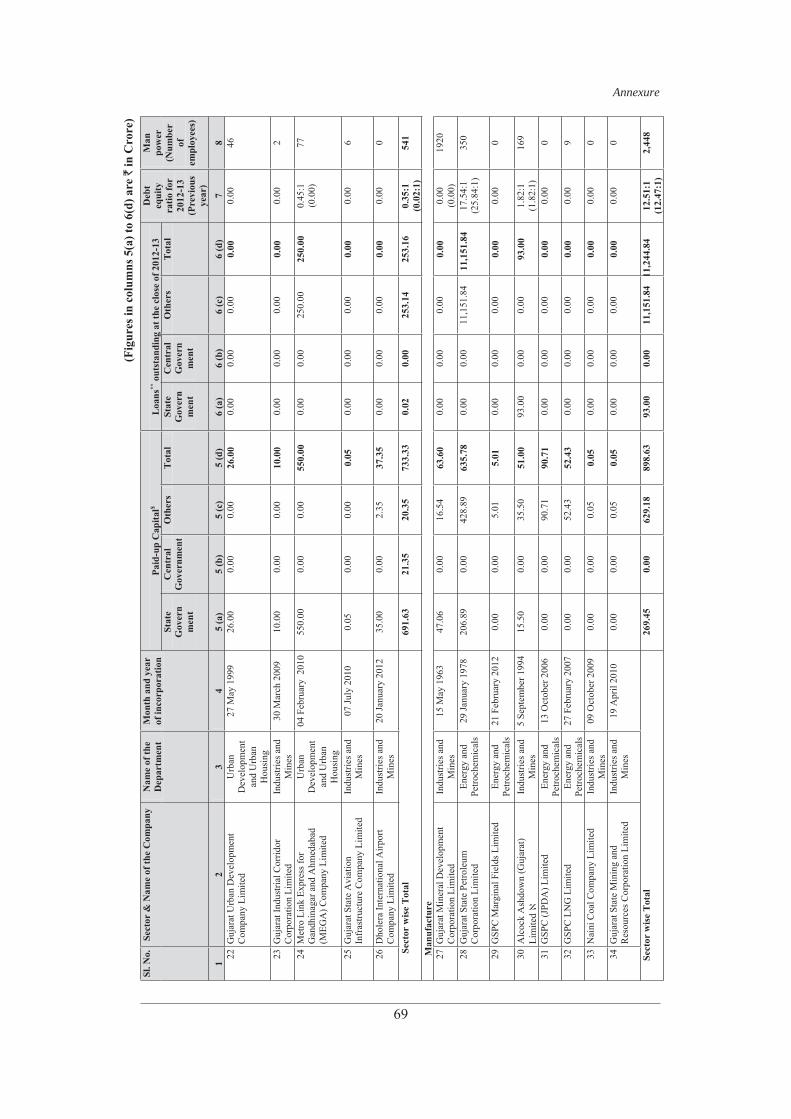
Audit Report (PSUs) for the year ended 31 March 2013 Report No. 3 of 2014
70
(Fig
ures
in c
olum
ns 5
(a) t
o 6(
d) a
re `
in C
rore
)Sl
. No.
Se
ctor
& N
ame
of th
e C
ompa
ny
Nam
e of
the
Dep
artm
ent
Mon
th a
nd y
ear
of in
corp
orat
ion
Paid
-up
Cap
ital$
Loa
ns**
out
stan
ding
at t
he c
lose
of 2
012-
13
Deb
teq
uity
ratio
for
2012
-13
(Pre
viou
sye
ar)
Man
pow
er
(Num
ber
ofem
ploy
ees)
Stat
eG
over
nm
ent
Cen
tral
Gov
ernm
ent
Oth
ers
Tot
alSt
ate
Gov
ern
men
t
Cen
tral
Gov
ern
men
t
Oth
ers
Tot
al
12
34
5 (a
) 5
(b)
5 (c
) 5
(d)
6 (a
) 6
(b)
6 (c
) 6
(d)
78
Pow
er
35 G
ujar
at P
ower
Cor
pora
tion
Lim
ited
Ener
gy a
nd
Petro
chem
ical
s 28
June
199
0 27
9.52
0.
00
19.3
0 29
8.82
147.
00
0.00
77
.37
224.
370.
75:1
(0.5
4:1)
43
36 G
ujar
at S
tate
Ele
ctric
ity
Cor
pora
tion
Lim
ited
Ener
gy a
nd
Petro
chem
ical
s 12
Aug
ust 1
993
0.00
0.
00
1,89
1.82
1,
891.
820.
00
0.00
6,
868.
86
6,86
8.86
3.63
:1(2
.93:
1)8,
007
37 G
ujar
at S
tate
Ene
rgy
Gen
erat
ion
Lim
ited
Ener
gy a
nd
Petro
chem
ical
s 13
Dec
embe
r 199
8 0.
00
0.00
34
8.38
34
8.38
0.00
0.
00
671.
00
671.
001.
93:1
(2.1
1:1)
18
38 G
ujar
at E
nerg
y Tr
ansm
issi
on
Cor
pora
tion
Lim
ited
Ener
gy a
nd
Petro
chem
ical
s 19
May
199
9 12
.50
0.00
51
2.92
52
5.42
80.8
6 0.
00
5,83
4.12
5,
914.
9811
.26:
1(8
.74:
1)12
,270
39 D
aksh
in G
ujar
at V
ij C
ompa
ny
Lim
ited
Ener
gy a
nd
Petro
chem
ical
s 15
Sep
tem
ber
2003
0.
00
0.00
49
7.36
49
7.36
32.8
9 59
.02
145.
99
237.
900.
48:1
(0.8
:1)
5,55
9
40 M
adhy
a G
ujar
at V
ij C
ompa
ny
Lim
ited
Ener
gy a
nd
Petro
chem
ical
s 15
Sep
tem
ber
2003
0.
00
0.00
28
5.06
28
5.06
0.00
0.
00
329.
21
329.
211.
15:1
(1.1
3:1)
6,57
2
41 P
asch
im G
ujar
at V
ij C
ompa
ny
Lim
ited
Ener
gy a
nd
Petro
chem
ical
s 15
Sep
tem
ber
2003
0.
00
0.00
79
0.44
79
0.44
250.
16
109.
23
918.
28
1,27
7.67
1.62
:1(0
.75:
1)12
,989
42 U
ttar G
ujar
at V
ij C
ompa
ny
Lim
ited
Ener
gy a
nd
Petro
chem
ical
s 15
Sep
tem
ber
2003
0.
00
0.00
40
5.65
40
5.65
67.3
3 48
.42
113.
16
228.
910.
56:1
(1.2
4:1)
7,38
2
43 G
ujar
at U
rja V
ikas
Nig
am L
imite
d En
ergy
and
Pe
troch
emic
als
22 D
ecem
ber 2
004
5601
.80
0.00
0.
00
5,60
1.80
253.
77
0.00
98
.63
352.
400.
06:1
(0.0
9:1)
282
44 G
SPC
Pip
avav
Pow
er C
ompa
ny
Lim
ited
Ener
gy a
nd
Petro
chem
ical
s 22
Feb
ruar
y 20
06
0.00
0.
00
42.2
7 42
.27
0.00
0.
00
1,62
2.92
1,
622.
9238
.39:
1(3
3.12
:1)
25
45 B
havn
agar
Ene
rgy
Com
pany
Li
mite
d En
ergy
and
Pe
troch
emic
als
26 Ju
ly 2
007
0.00
0.
00
385.
55
385.
550.
00
0.00
15
36.0
6 1,
536.
063.
98:1
(1.9
5:1)
63
Sec
tor
wis
e T
otal
5,
893.
82
0.00
5,
178.
75
11,0
72.5
7 83
2.01
21
6.67
18
,215
.60
19,2
64.2
8 1.
74:1
(1.5
8:1)
53,2
10
Ser
vice
46
Guj
arat
Wat
er R
esou
rces
D
evel
opm
ent C
orpo
ratio
n L
imite
d N
arm
ada,
Wat
er
Res
ourc
es,
Wat
er S
uppl
y an
d K
alps
ar
03 M
ay 1
971
31.4
9 0.
00
0.00
31
.49
0.00
0.
00
0.00
0.
000.
00
2902
Annexure
71
(Fig
ures
in c
olum
ns 5
(a) t
o 6(
d) a
re `
in C
rore
)Sl
. No.
Se
ctor
& N
ame
of th
e C
ompa
ny
Nam
e of
the
Dep
artm
ent
Mon
th a
nd y
ear
of in
corp
orat
ion
Paid
-up
Cap
ital$
Loa
ns**
out
stan
ding
at t
he c
lose
of 2
012-
13
Deb
teq
uity
ratio
for
2012
-13
(Pre
viou
sye
ar)
Man
pow
er
(Num
ber
ofem
ploy
ees)
Stat
eG
over
nm
ent
Cen
tral
Gov
ernm
ent
Oth
ers
Tot
alSt
ate
Gov
ern
men
t
Cen
tral
Gov
ern
men
t
Oth
ers
Tot
al
12
34
5 (a
) 5
(b)
5 (c
) 5
(d)
6 (a
) 6
(b)
6 (c
) 6
(d)
78
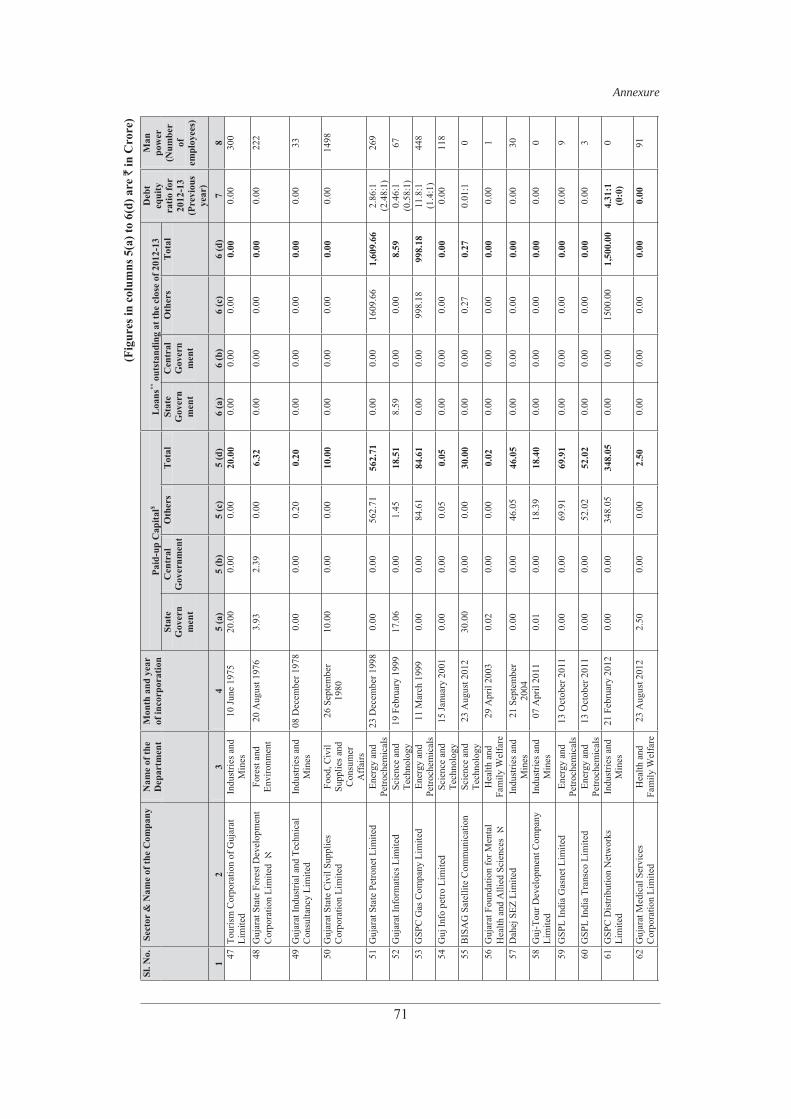
47 T
ouris
m C
orpo
ratio
n of
Guj
arat
Li
mite
d In
dust
ries a
nd
Min
es10
June
197
5 20
.00
0.00
0.
00
20.0
00.
00
0.00
0.
00
0.00
0.00
30
0
48 G
ujar
at S
tate
For
est D
evel
opm
ent
Cor
pora
tion
Lim
ited
Fore
st a
nd
Envi
ronm
ent
20 A
ugus
t 197
6 3.
93
2.39
0.
00
6.32
0.00
0.
00
0.00
0.
000.
00
222
49 G
ujar
at In
dust
rial a
nd T
echn
ical
C
onsu
ltanc
y Li
mite
d In
dust
ries a
nd
Min
es08
Dec
embe
r 197
8 0.
00
0.00
0.
20
0.20
0.00
0.
00
0.00
0.
000.
00
33
50 G
ujar
at S
tate
Civ
il Su
pplie
s C
orpo
ratio
n Li
mite
d Fo
od, C
ivil
Supp
lies a
nd
Con
sum
er
Aff
airs
26 S
epte
mbe
r 19
80
10.0
0 0.
00
0.00
10
.00
0.00
0.
00
0.00
0.
000.
00
1498
51 G
ujar
at S
tate
Pet
rone
t Lim
ited
Ener
gy a
nd
Petro
chem
ical
s 23
Dec
embe
r 199
8 0.
00
0.00
56
2.71
56
2.71
0.00
0.
00
1609
.66
1,60
9.66
2.86
:1(2
.48:
1)26
9
52 G
ujar
at In
form
atic
s Lim
ited
Scie
nce
and
Te
chno
logy
19 F
ebru
ary
1999
17
.06
0.00
1.
45
18.5
18.
59
0.00
0.
00
8.59
0.46
:1(0
.58:
1)67
53 G
SPC
Gas
Com
pany
Lim
ited
Ener
gy a
nd
Petro
chem
ical
s 11
Mar
ch 1
999
0.00
0.
00
84.6
1 84
.61
0.00
0.
00
998.
18
998.
1811
.8:1
(1.4
:1)
448
54 G
uj In
fo p
etro
Lim
ited
Scie
nce
and
Te
chno
logy
15 Ja
nuar
y 20
01
0.00
0.
00
0.05
0.
050.
00
0.00
0.
00
0.00
0.00
11
8
55 B
ISA
G S
atel
lite
Com
mun
icat
ion
Scie
nce
and
Te
chno
logy
23 A
ugus
t 201
2 30
.00
0.00
0.
00
30.0
00.
00
0.00
0.
27
0.27
0.01
:1
0
56 G
ujar
at F
ound
atio
n fo
r Men
tal
Hea
lth a
nd A
llied
Sci
ence
s H
ealth
and
Fa
mily
Wel
fare
29
Apr
il 20
03
0.02
0.
00
0.00
0.
020.
00
0.00
0.
00
0.00
0.00
1
57 D
ahej
SEZ
Lim
ited
Indu
strie
s and
M
ines
21 S
epte
mbe
r 20
04
0.00
0.
00
46.0
5 46
.05
0.00
0.
00
0.00
0.
000.
00
30
58 G
uj-T
our D
evel
opm
ent C
ompa
ny
Lim
ited
Indu
strie
s and
M
ines
07 A
pril
2011
0.
01
0.00
18
.39
18.4
00.
00
0.00
0.
00
0.00
0.00
0
59 G
SPL
Indi
a G
asne
t Lim
ited
Ener
gy a
nd
Petro
chem
ical
s 13
Oct
ober
201
1 0.
00
0.00
69
.91
69.9
10.
00
0.00
0.
00
0.00
0.00
9
60 G
SPL
Indi
a Tr
ansc
o Li
mite
d En
ergy
and
Pe
troch
emic
als
13 O
ctob
er 2
011
0.00
0.
00
52.0
2 52
.02
0.00
0.
00
0.00
0.
000.
00
3
61 G
SPC
Dis
tribu
tion
Net
wor
ks
Lim
ited
Indu
strie
s and
M
ines
21 F
ebru
ary
2012
0.
00
0.00
34
8.05
34
8.05
0.00
0.
00
1500
.00
1,50
0.00
4.
31:1
(0:0
) 0
62 G
ujar
at M
edic
al S
ervi
ces
Cor
pora
tion
Lim
ited
Hea
lth a
nd
Fam
ily W
elfa
re
23 A
ugus
t 201
2 2.
50
0.00
0.
00
2.50
0.00
0.
00
0.00
0.
00
0.00
91
Audit Report (PSUs) for the year ended 31 March 2013 Report No. 3 of 2014
72
(Fig
ures
in c
olum
ns 5
(a) t
o 6(
d) a
re `
in C
rore
)Sl
. No.
Se
ctor
& N
ame
of th
e C
ompa
ny
Nam
e of
the
Dep
artm
ent
Mon
th a
nd y
ear
of in
corp
orat
ion
Paid
-up
Cap
ital$
Loa
ns**
out
stan
ding
at t
he c
lose
of 2
012-
13
Deb
teq
uity
ratio
for
2012
-13
(Pre
viou
sye
ar)
Man
pow
er
(Num
ber
ofem
ploy
ees)
Stat
eG
over
nm
ent
Cen
tral
Gov
ernm
ent
Oth
ers
Tot
alSt
ate
Gov
ern
men
t
Cen
tral
Gov
ern
men
t
Oth
ers
Tot
al
12
34
5 (a
) 5
(b)
5 (c
) 5
(d)
6 (a
) 6
(b)
6 (c
) 6
(d)
78
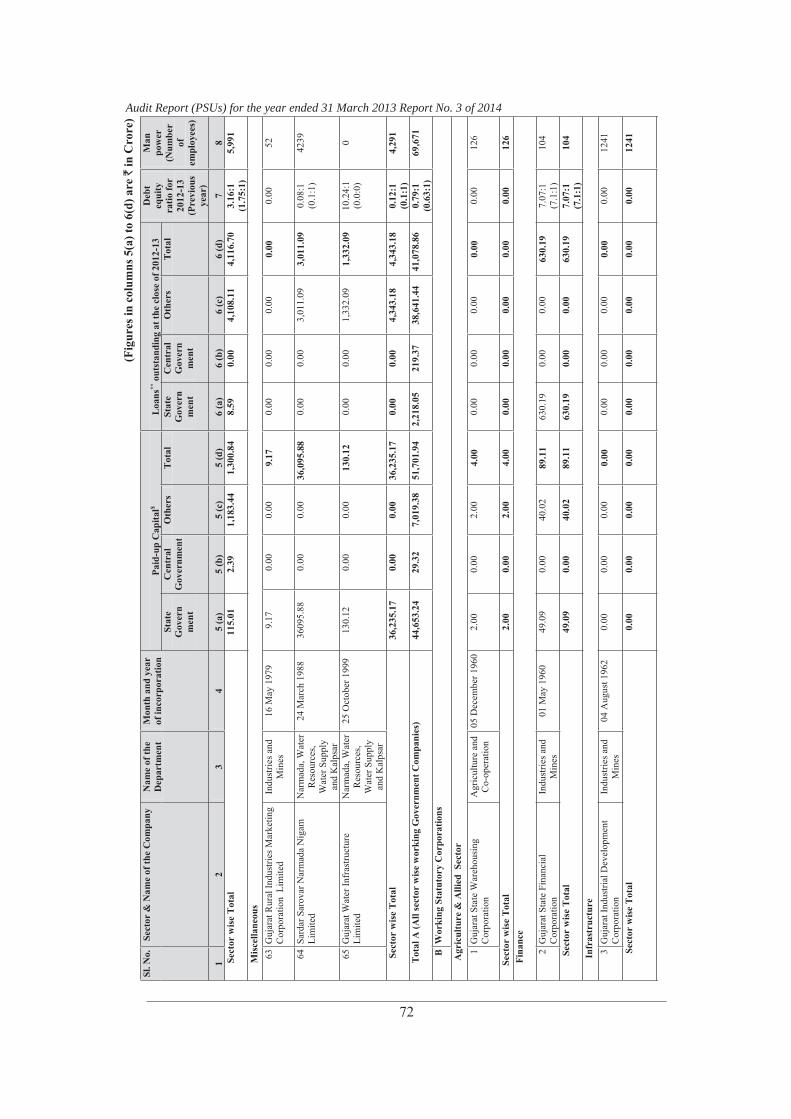
Sect
or w
ise
Tot
al
115.
01
2.39
1,
183.
44
1,30
0.84
8.
59
0.00
4,
108.
11
4,11
6.70
3.
16:1
(1.7
5:1)
5,99
1
Mis
cella
neou
s 63
Guj
arat
Rur
al In
dust
ries M
arke
ting
Cor
pora
tion
Lim
ited
Indu
strie
s and
M
ines
16 M
ay 1
979
9.17
0.
00
0.00
9.
170.
00
0.00
0.
00
0.00
0.00
52
64 S
arda
r Sar
ovar
Nar
mad
a N
igam
Li
mite
d N
arm
ada,
Wat
er
Res
ourc
es,
Wat
er S
uppl
y an
d K
alps
ar
24 M
arch
198
8 36
095.
88
0.00
0.
00
36,0
95.8
8 0.
00
0.00
3,
011.
09
3,01
1.09
0.08
:1(0
.1:1
)42
39
65 G
ujar
at W
ater
Infr
astru
ctur
e Li
mite
d N
arm
ada,
Wat
er
Res
ourc
es,
Wat
er S
uppl
y an
d K
alps
ar
25 O
ctob
er 1
999
130.
12
0.00
0.
00
130.
120.
00
0.00
1,
332.
09
1,33
2.09
10.2
4:1
(0.0
:0)
0
Sec
tor
wis
e T
otal
36
,235
.17
0.00
0.
00
36,2
35.1
7 0.
00
0.00
4,
343.
18
4,34
3.18
0.
12:1
(0.1
:1)
4,29
1
Tot
al A
(All
sect
or w
ise
wor
king
Gov
ernm
ent C
ompa
nies
) 44
,653
.24
29.3
2 7,
019.
38
51,7
01.9
4 2,
218.
05
219.
37
38,6
41.4
4 41
,078
.86
0.79
:1
(0
.63:
1)69
,671
B W
orki
ng S
tatu
tory
Cor
pora
tions
Agr
icul
ture
& A
llied
Sec
tor
1 G
ujar
at S
tate
War
ehou
sing
C
orpo
ratio
nA
gric
ultu
re a
nd
Co-
oper
atio
n05
Dec
embe
r 196
0 2.
00
0.00
2.
00
4.00
0.00
0.
00
0.00
0.
000.
00
126
S
ecto
r w
ise
Tot
al
2.00
0.
00
2.00
4.
00
0.00
0.
00
0.00
0.
00
0.00
12
6
Fi
nanc
e
2
Guj
arat
Sta
te F
inan
cial
C
orpo
ratio
nIn
dust
ries a
nd
Min
es01
May
196
0 49
.09
0.00
40
.02
89.1
163
0.19
0.
00
0.00
63
0.19
7.07
:1(7
.1:1
)10
4
Se
ctor
wis
e T
otal
49
.09
0.00
40
.02
89.1
1 63
0.19
0.
00
0.00
63
0.19
7.
07:1
(7.1
:1)
104
Inf
rast
ruct
ure
3 G
ujar
at In
dust
rial D
evel
opm
ent
Cor
pora
tion
Indu
strie
s and
M
ines
04 A
ugus
t 196
2 0.
00
0.00
0.
00
0.00
0.00
0.
00
0.00
0.
000.
00
1241
S
ecto
r w
ise
Tot
al
0.00
0.
00
0.00
0.
00
0.00
0.
00
0.00
0.
00
0.00
12
41
Annexure
73
(Fig
ures
in c
olum
ns 5
(a) t
o 6(
d) a
re `
in C
rore
)Sl
. No.
Se
ctor
& N
ame
of th
e C
ompa
ny
Nam
e of
the
Dep
artm
ent
Mon
th a
nd y
ear
of in
corp
orat
ion
Paid
-up
Cap
ital$
Loa
ns**
out
stan
ding
at t
he c
lose
of 2
012-
13
Deb
teq
uity
ratio
for
2012
-13
(Pre
viou
sye
ar)
Man
pow
er
(Num
ber
ofem
ploy
ees)
Stat
eG
over
nm
ent
Cen
tral
Gov
ernm
ent
Oth
ers
Tot
alSt
ate
Gov
ern
men
t
Cen
tral
Gov
ern
men
t
Oth
ers
Tot
al
12
34
5 (a
) 5
(b)
5 (c
) 5
(d)
6 (a
) 6
(b)
6 (c
) 6
(d)
78
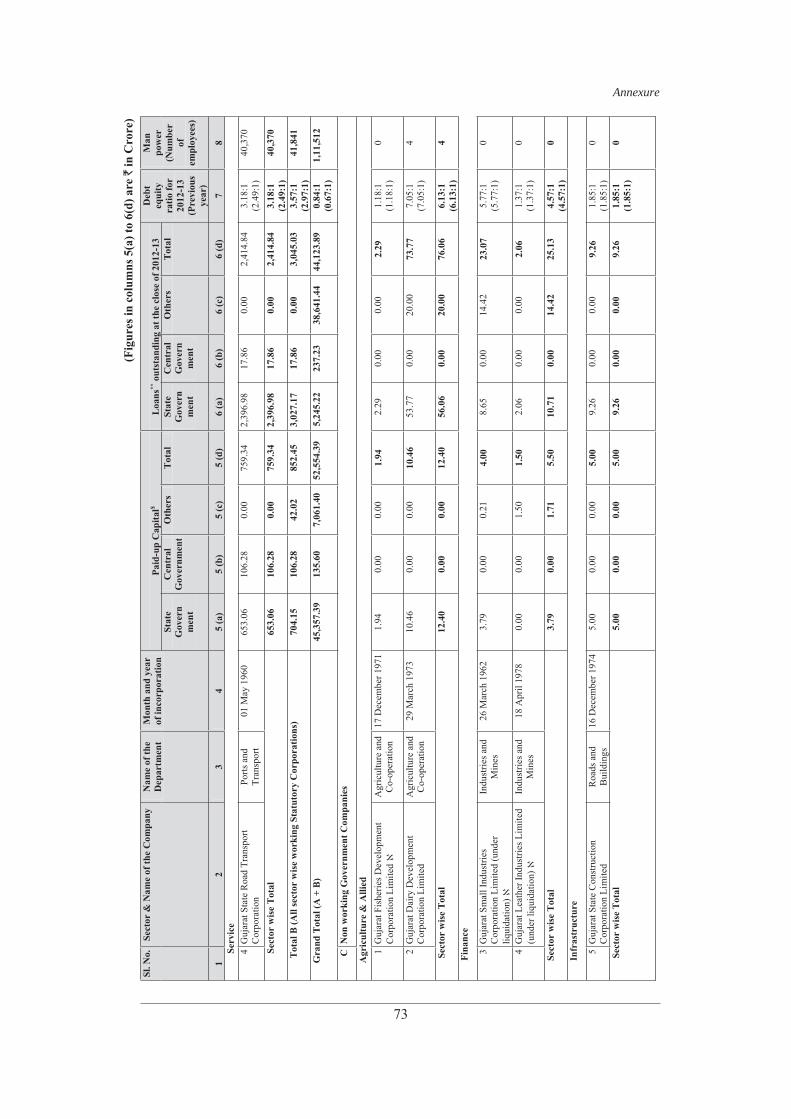
S
ervi
ce
4 G
ujar
at S
tate
Roa
d Tr
ansp
ort
Cor
pora
tion
Ports
and
Tr
ansp
ort
01 M
ay 1
960
653.
06
106.
28
0.00
75
9.34
2,
396.
98
17.8
6 0.
00
2,41
4.84
3.
18:1
(2.4
9:1)
40,3
70
S
ecto
r w
ise
Tot
al
653.
06
106.
28
0.00
75
9.34
2,
396.
98
17.8
6 0.
00
2,41
4.84
3.
18:1
(2.4
9:1)
40,3
70
Tot
al B
(All
sect
or w
ise
wor
king
Sta
tuto
ry C
orpo
ratio
ns)
704.
15
106.
28
42.0
2 85
2.45
3,
027.
17
17.8
6 0.
00
3,04
5.03
3.
57:1
(2.9
7:1)
41,8
41
Gra
nd T
otal
(A +
B)
45,3
57.3
9 13
5.60
7,
061.
40
52,5
54.3
9 5,
245.
22
237.
23
38,6
41.4
4 44
,123
.89
0.84
:1
(0
.67:
1)1,
11,5
12
C N
on w
orki
ng G
over
nmen
t Com
pani
es
Agr
icul
ture
& A
llied
1
Guj
arat
Fis
herie
s Dev
elop
men
t C
orpo
ratio
n Li
mite
d A
gric
ultu
re a
nd
Co-
oper
atio
n17
Dec
embe
r 197
1 1.
94
0.00
0.
00
1.94
2.29
0.
00
0.00
2.
291.
18:1
(1.1
8:1)
0
2 G
ujar
at D
airy
Dev
elop
men
t C
orpo
ratio
n Li
mite
d
Agr
icul
ture
and
C
o-op
erat
ion
29 M
arch
197
3 10
.46
0.00
0.
00
10.4
653
.77
0.00
20
.00
73.7
77.
05:1
(7.0
5:1)
4
Sec
tor
wis
e T
otal
12
.40
0.00
0.
00
12.4
0 56
.06
0.00
20
.00
76.0
6 6.
13:1
(6.1
3:1)
4
Fin
ance
3 G
ujar
at S
mal
l Ind
ustri
es
Cor
pora
tion
Lim
ited
(und
er
liqui
datio
n)
Indu
strie
s and
M
ines
26 M
arch
196
2 3.
79
0.00
0.
21
4.00
8.65
0.
00
14.4
2 23
.07
5.77
:1(5
.77:
1)0
4 G
ujar
at L
eath
er In
dust
ries L
imite
d (u
nder
liqu
idat
ion)
In
dust
ries a
nd
Min
es18
Apr
il 19
78
0.00
0.
00
1.50
1.
502.
06
0.00
0.
00
2.06
1.37
:1(1
.37:
1)0
Sec
tor
wis
e T
otal
3.
79
0.00
1.
71
5.50
10
.71
0.00
14
.42
25.1
3 4.
57:1
(4.5
7:1)
0
Infr
astr
uctu
re
5 G
ujar
at S
tate
Con
stru
ctio
n C
orpo
ratio
n Li
mite
d R
oads
and
B
uild
ings
16 D
ecem
ber 1
974
5.00
0.
00
0.00
5.
009.
26
0.00
0.
00
9.26
1.85
:1(1
.85:
1)0
Sec
tor
wis
e T
otal
5.
00
0.00
0.
00
5.00
9.
26
0.00
0.
00
9.26
1.
85:1
(1.8
5:1)
0
Audit Report (PSUs) for the year ended 31 March 2013 Report No. 3 of 2014
74
(Fig
ures
in c
olum
ns 5
(a) t
o 6(
d) a
re `
in C
rore
)Sl
. No.
Se
ctor
& N
ame
of th
e C
ompa
ny
Nam
e of
the
Dep
artm
ent
Mon
th a
nd y
ear
of in
corp
orat
ion
Paid
-up
Cap
ital$
Loa
ns**
out
stan
ding
at t
he c
lose
of 2
012-
13
Deb
teq
uity
ratio
for
2012
-13
(Pre
viou
sye
ar)
Man
pow
er
(Num
ber
ofem
ploy
ees)
Stat
eG
over
nm
ent
Cen
tral
Gov
ernm
ent
Oth
ers
Tot
alSt
ate
Gov
ern
men
t
Cen
tral
Gov
ern
men
t
Oth
ers
Tot
al
12
34
5 (a
) 5
(b)
5 (c
) 5
(d)
6 (a
) 6
(b)
6 (c
) 6
(d)
78
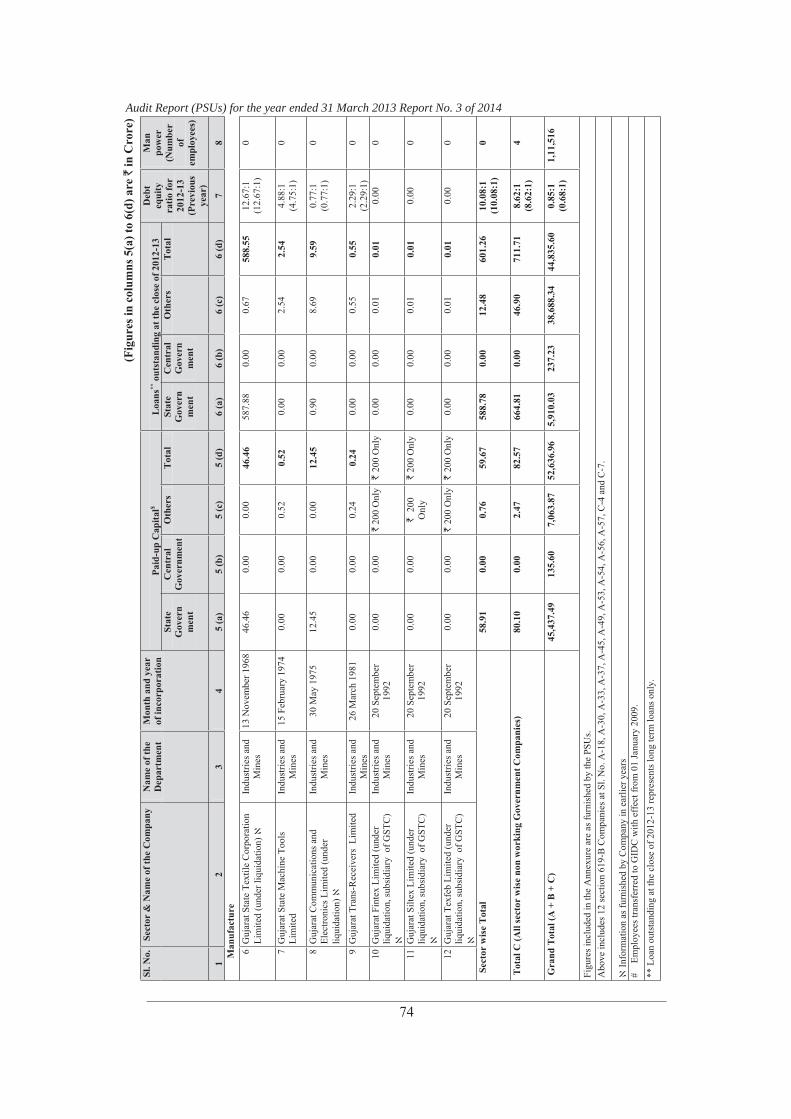
Man
ufac
ture
6
Guj
arat
Sta
te T
extil
e C
orpo
ratio
n Li
mite
d (u
nder
liqu
idat
ion)
In
dust
ries a
nd
Min
es13
Nov
embe
r 196
8 46
.46
0.00
0.
00
46.4
658
7.88
0.
00
0.67
58
8.55
12.6
7:1
(12.
67:1
) 0
7 G
ujar
at S
tate
Mac
hine
Too
ls
Lim
ited
Indu
strie
s and
M
ines
15 F
ebru
ary
1974
0.
00
0.00
0.
52
0.52
0.00
0.
00
2.54
2.
544.
88:1
(4.7
5:1)
0
8 G
ujar
at C
omm
unic
atio
ns a
nd
Elec
troni
cs L
imite
d (u
nder
liq
uida
tion)
Indu
strie
s and
M
ines
30 M
ay 1
975
12.4
5 0.
00
0.00
12
.45
0.90
0.
00
8.69
9.
590.
77:1
(0.7
7:1)
0
9 G
ujar
at T
rans
-Rec
eive
rs L
imite
d In
dust
ries a
nd
Min
es26
Mar
ch 1
981
0.00
0.
00
0.24
0.
240.
00
0.00
0.
55
0.55
2.29
:1(2
.29:
1)0
10 G
ujar
at F
inte
x Li
mite
d (u
nder
liq
uida
tion,
subs
idia
ry o
f GST
C)
Indu
strie
s and
M
ines
20 S
epte
mbe
r 19
92
0.00
0.
00
` 2
00 O
nly
` 2
00 O
nly
0.00
0.
00
0.01
0.
010.
00
0
11 G
ujar
at S
iltex
Lim
ited
(und
er
liqui
datio
n, su
bsid
iary
of G
STC
) In
dust
ries a
nd
Min
es20
Sep
tem
ber
1992
0.
00
0.00
` 2
00
Onl
y`
200
Onl
y0.
00
0.00
0.
01
0.01
0.00
0
12 G
ujar
at T
exfe
b Li
mite
d (u
nder
liq
uida
tion,
subs
idia
ry o
f GST
C)
Indu
strie
s and
M
ines
20 S
epte
mbe
r 19
92
0.00
0.
00
` 2
00 O
nly
` 2
00 O
nly
0.00
0.
00
0.01
0.
010.
00
0
Sec
tor
wis
e T
otal
58
.91
0.00
0.
76
59.6
7 58
8.78
0.
00
12.4
8 60
1.26
10
.08:
1
(10.
08:1
)0
Tot
al C
(All
sect
or w
ise
non
wor
king
Gov
ernm
ent C
ompa
nies
) 80
.10
0.00
2.
47
82.5
7 66
4.81
0.
00
46.9
0 71
1.71
8.
62:1
(8.6
2:1)
4
Gra
nd T
otal
(A +
B +
C)
45,4
37.4
9 13
5.60
7,
063.
87
52,6
36.9
6 5,
910.
03
237.
23
38,6
88.3
4 44
,835
.60
0.85
:1
(0
.68:
1)1,
11,5
16
Figu
res i
nclu
ded
in th
e A
nnex
ure
are
as fu
rnis
hed
by th
e PS
Us.
A
bove
incl
udes
12
sect
ion
619-
B C
ompa
nies
at S
l. N
o. A
-18,
A-3
0, A
-33,
A-3
7, A
-45,
A-4
9, A
-53,
A-5
4, A
-56,
A-5
7, C
-4 a
nd C
-7.
Info
rmat
ion
as fu
rnis
hed
by C
ompa
ny in
ear
lier y
ears
#
Em
ploy
ees t
rans
ferr
ed to
GID
C w
ith e
ffec
t fro
m 0
1 Ja
nuar
y 20
09.
** L
oan
outs
tand
ing
at th
e cl
ose
of 2
012-
13 re
pres
ents
long
term
loan
s onl
y.
Annexure
75
(Fig
ures
in c
olum
ns 5
(a) t
o 6(
d) a
re `
in C
rore
)Sl
. No.
Se
ctor
& N
ame
of th
e C
ompa
ny
Nam
e of
the
Dep
artm
ent
Mon
th a
nd y
ear
of in
corp
orat
ion
Paid
-up
Cap
ital$
Loa
ns**
out
stan
ding
at t
he c
lose
of 2
012-
13
Deb
teq
uity
ratio
for
2012
-13
(Pre
viou
sye
ar)
Man
pow
er
(Num
ber
ofem
ploy
ees)
Stat
eG
over
nm
ent
Cen
tral
Gov
ernm
ent
Oth
ers
Tot
alSt
ate
Gov
ern
men
t
Cen
tral
Gov
ern
men
t
Oth
ers
Tot
al
12
34
5 (a
) 5
(b)
5 (c
) 5
(d)
6 (a
) 6
(b)
6 (c
) 6
(d)
78
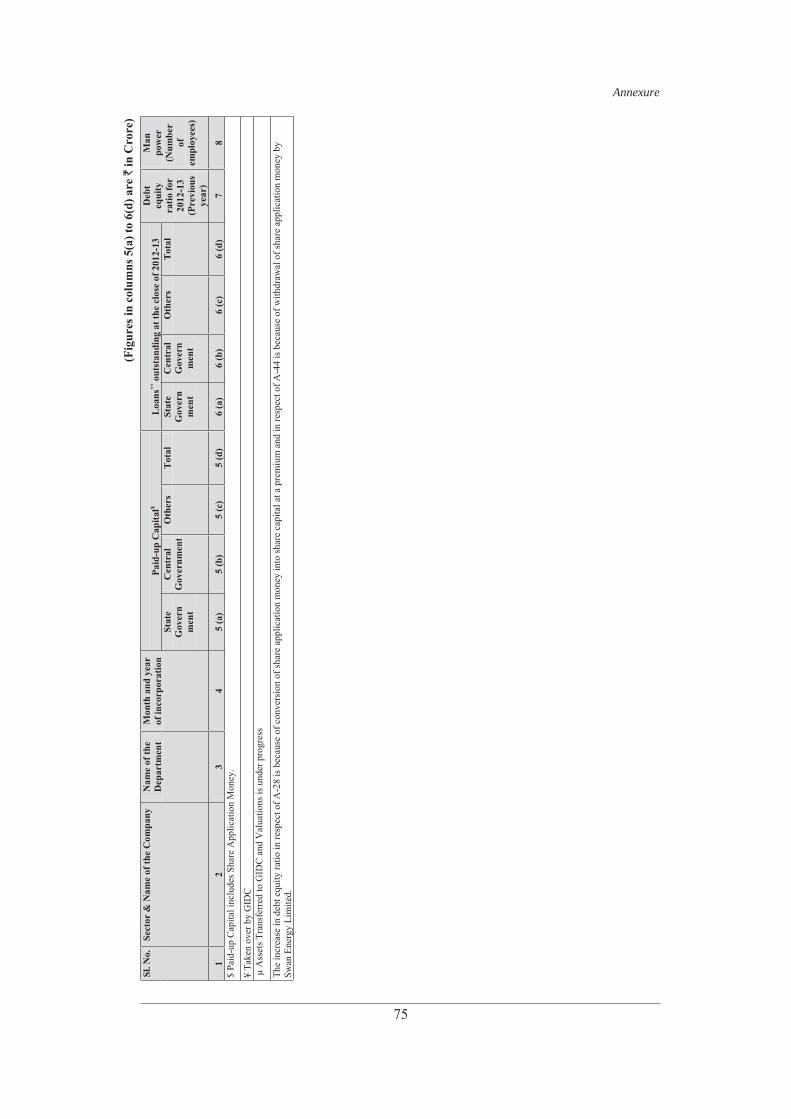
$ Pa
id-u
p C
apita
l inc
lude
s Sha
re A
pplic
atio
n M
oney
.
¥ Ta
ken
over
by
GID
C
μ A
sset
s Tra
nsfe
rred
to G
IDC
and
Val
uatio
ns is
und
er p
rogr
ess
The
incr
ease
in d
ebt e
quity
ratio
in re
spec
t of A
-28
is b
ecau
se o
f con
vers
ion
of sh
are
appl
icat
ion
mon
ey in
to sh
are
capi
tal a
t a p
rem
ium
and
in re
spec
t of A
-44
is b
ecau
se o
f with
draw
al o
f sha
re a
pplic
atio
n m
oney
by
Swan
Ene
rgy
Lim
ited.
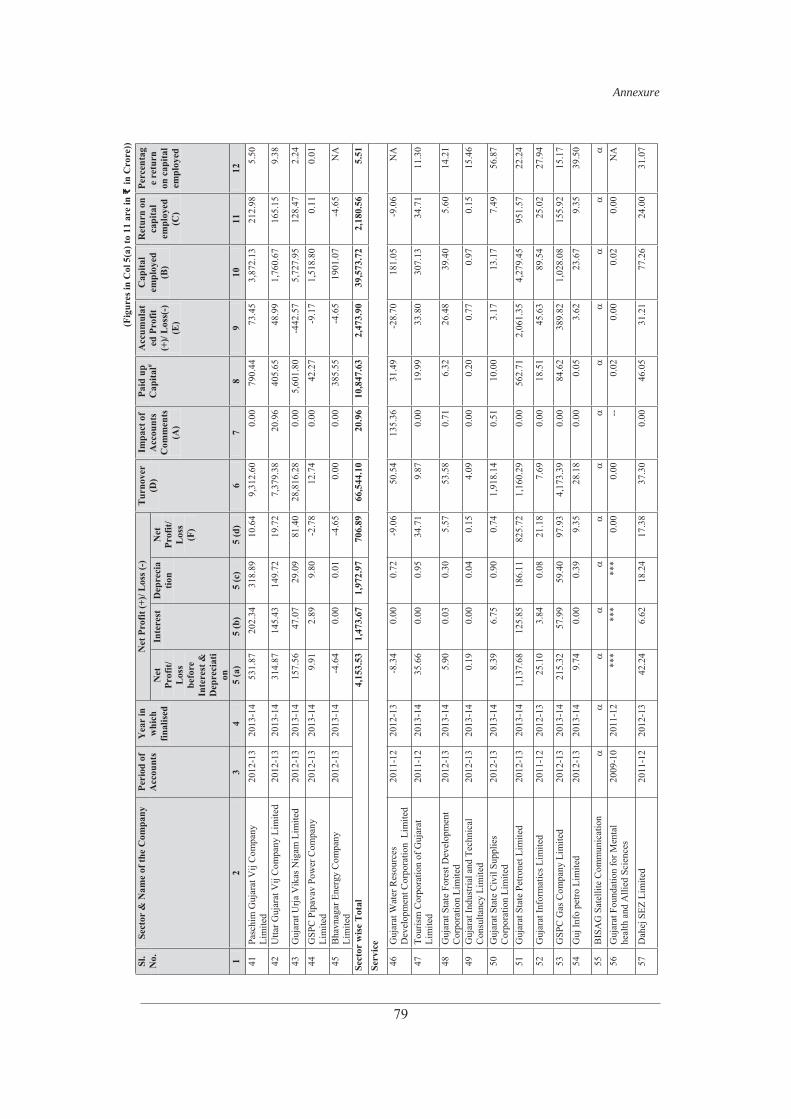
Audit Report (PSUs) for the year ended 31 March 2013 Report No. 3 of 2014
76
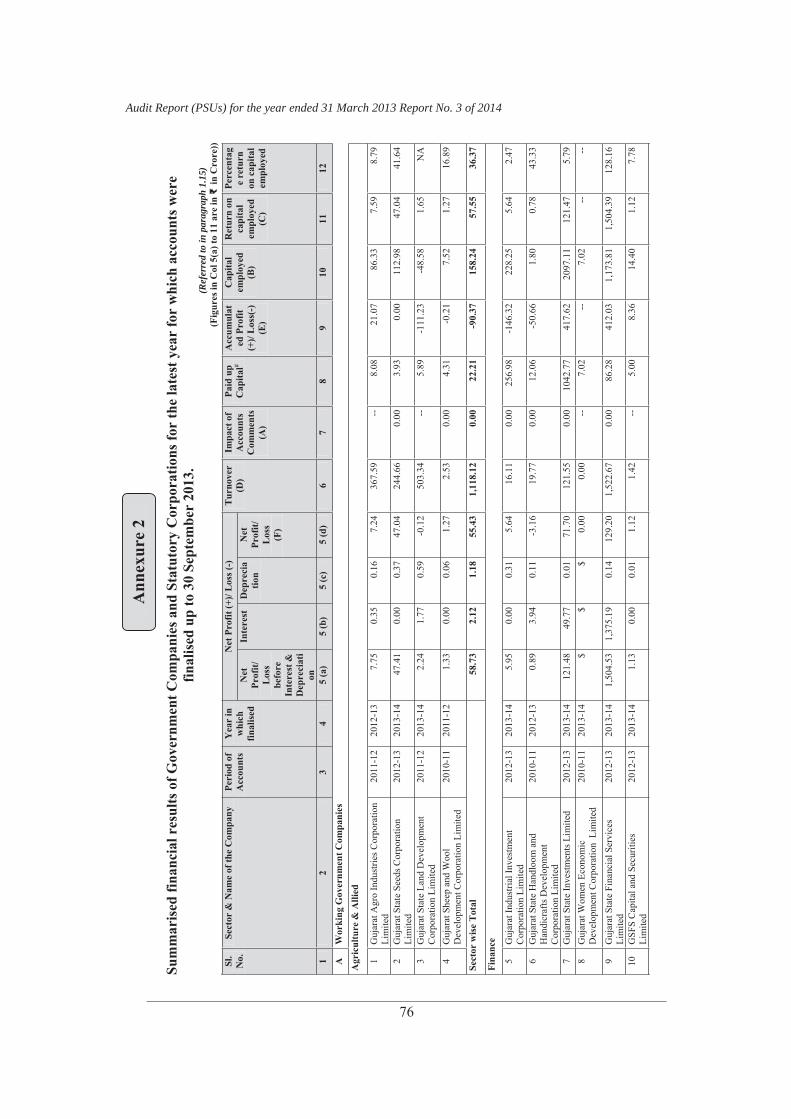
Sum
mar
ised
fina
ncia
l res
ults
of G
over
nmen
t Com
pani
es a
nd S
tatu
tory
Cor
pora
tions
for
the
late
st y
ear
for
whi
ch a
ccou
nts w
ere
final
ised
up
to 3
0 Se
ptem
ber
2013
. (R
efer
red
to in
par
agra
ph 1
.15)
(F
igur
es in
Col
5(a
) to
11 a
re in
in
Cro
re))
Sl.
No.
Sect
or &
Nam
e of
the
Com
pany
Pe
riod
of
Acc
ount
s Y
ear
in
whi
ch
final
ised
Net
Pro
fit (+
)/ L
oss (
-)
Tur
nove
r(D
)Im
pact
of
Acc
ount
sC
omm
ents
(A
)
Paid
up
Cap
ital#
Acc
umul
ated
Pro
fit
(+)/
Los
s(-)
(E
)
Cap
ital
empl
oyed
(B
)
Ret
urn
on
capi
tal
empl
oyed
(C
)
Perc
enta
ge
retu
rn
on c
apita
l em
ploy
ed
Net
Prof
it/L
oss
befo
reIn
tere
st &
D
epre
ciat
ion
Inte
rest
D
epre
cia
tion
Net
Prof
it/L
oss
(F)
12
34
5 (a
) 5
(b)
5 (c
) 5
(d)
67
89
10
11
12
A
Wor
king
Gov
ernm
ent C
ompa
nies
Agr
icul
ture
& A
llied
1 G
ujar
at A
gro
Indu
strie
s Cor
pora
tion
Lim
ited
2011
-12
2012
-13
7.75
0.
35
0.16
7.
24
367.
59 --
8.
08
21.0
7 86
.33
7.59
8.
79
2 G
ujar
at S
tate
See
ds C
orpo
ratio
n Li
mite
d 20
12-1
3 20
13-1
4 47
.41
0.00
0.
37
47.0
4 24
4.66
0.00
3.
93
0.00
11
2.98
47
.04
41.6
4
3 G
ujar
at S
tate
Lan
d D
evel
opm
ent
Cor
pora
tion
Lim
ited
2011
-12
2013
-14
2.24
1.
77
0.59
-0
.12
503.
34 --
5.
89
-111
.23
-48.
58
1.65
N
A
4 G
ujar
at S
heep
and
Woo
l D
evel
opm
ent C
orpo
ratio
n Li
mite
d 20
10-1
1 20
11-1
2 1.
33
0.00
0.
06
1.27
2.
530.
00
4.31
-0
.21
7.52
1.
27
16.8
9
Sect
or w
ise
Tot
al
58.7
3 2.
12
1.18
55
.43
1,11
8.12
0.00
22
.21
-90.
37
158.
24
57.5
5 36
.37
Fina
nce
5 G
ujar
at In
dust
rial I
nves
tmen
t C
orpo
ratio
n Li
mite
d 20
12-1
3 20
13-1
4 5.
95
0.00
0.
31
5.64
16
.11
0.00
25
6.98
-1
46.3
2 22
8.25
5.
64
2.47
6 G
ujar
at S
tate
Han
dloo
m a
nd
Han
dicr
afts
Dev
elop
men
t C
orpo
ratio
n Li
mite
d
2010
-11
2012
-13
0.89
3.
94
0.11
-3
.16
19.7
70.
00
12.0
6 -5
0.66
1.
80
0.78
43
.33
7 G
ujar
at S
tate
Inve
stm
ents
Lim
ited
2012
-13
2013
-14
121.
48
49.7
7 0.
01
71.7
0 12
1.55
0.00
10
42.7
7 41
7.62
20
97.1
1 12
1.47
5.
79
8 G
ujar
at W
omen
Eco
nom
ic
Dev
elop
men
t Cor
pora
tion
Lim
ited
2010
-11
2013
-14
$ $
$ 0.
00
0.00
--
7.02
--
7.
02
--
--
9 G
ujar
at S
tate
Fin
anci
al S
ervi
ces
Lim
ited
2012
-13
2013
-14
1,50
4.53
1,
375.
19
0.14
12
9.20
1,
522.
670.
00
86.2
8 41
2.03
1,
173.
81
1,50
4.39
12
8.16
10
GSF
S C
apita
l and
Sec
uriti
es
Lim
ited
2012
-13
2013
-14
1.13
0.
00
0.01
1.
12
1.42
--
5.00
8.
36
14.4
0 1.
12
7.78
Ann
exur
e 2
Annexure
77
(Fig
ures
in C
ol 5
(a) t
o 11
are
in
in C
rore
))Sl
.N
o.Se
ctor
& N
ame
of th
e C
ompa
ny
Peri
od o
f A
ccou
nts
Yea
r in
w
hich
fin
alis
ed
Net
Pro
fit (+
)/ L
oss (
-)
Tur
nove
r(D
)Im
pact
of
Acc
ount
sC
omm
ents
(A
)
Paid
up
Cap
ital#
Acc
umul
ated
Pro
fit
(+)/
Los
s(-)
(E
)
Cap
ital
empl
oyed
(B
)
Ret
urn
on
capi
tal
empl
oyed
(C
)
Perc
enta
ge
retu
rn
on c
apita
l em
ploy
ed
Net
Prof
it/L
oss
befo
reIn
tere
st &
D
epre
ciat
ion
Inte
rest
D
epre
cia
tion
Net
Prof
it/L
oss
(F)
12
34
5 (a
) 5
(b)
5 (c
) 5
(d)
67
89
10
11
12
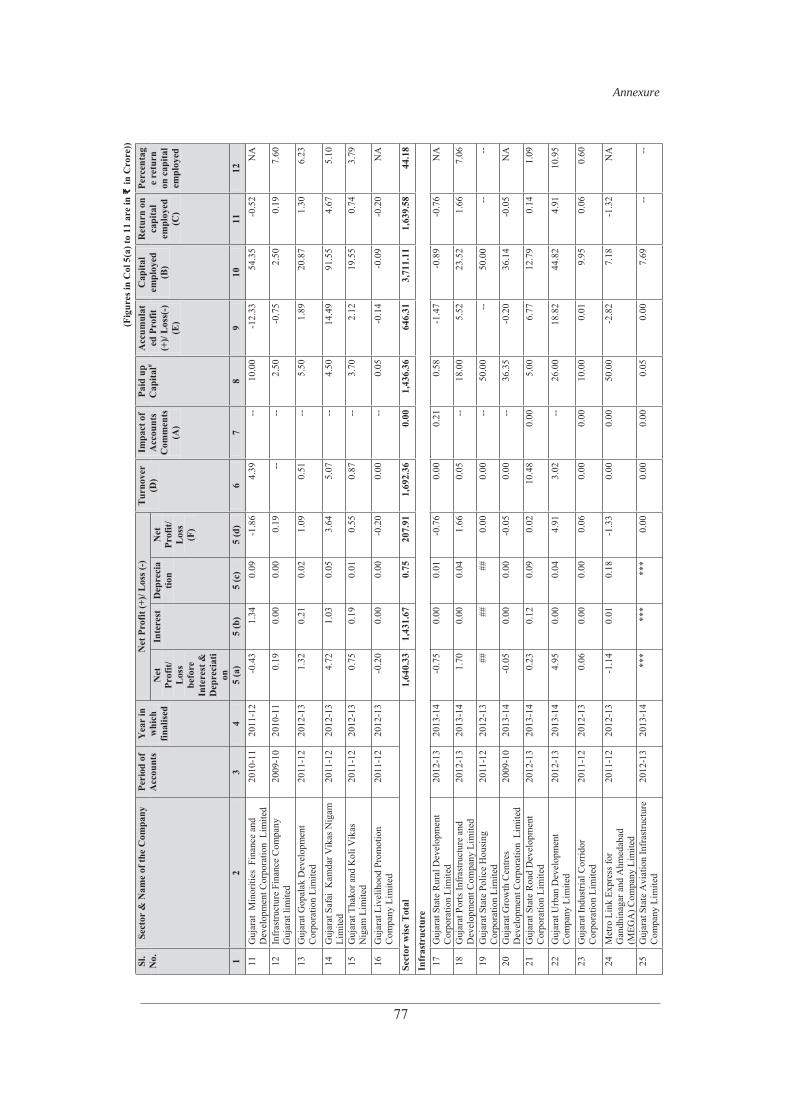
11
Guj
arat
Min
oriti
es F
inan
ce a
nd
Dev
elop
men
t Cor
pora
tion
Lim
ited
2010
-11
2011
-12
-0.4
3 1.
34
0.09
-1
.86
4.39
--
10.0
0 -1
2.33
54
.35
-0.5
2 N
A
12
Infr
astru
ctur
e Fi
nanc
e C
ompa
ny
Guj
arat
lim
ited
2009
-10
2010
-11
0.19
0.
00
0.00
0.
19
--
--
2.50
-0
.75
2.50
0.
19
7.60
13
Guj
arat
Gop
alak
Dev
elop
men
t C
orpo
ratio
n Li
mite
d 20
11-1
2 20
12-1
3 1.
32
0.21
0.
02
1.09
0.
51 --
5.
50
1.89
20
.87
1.30
6.
23
14
Guj
arat
Saf
ai K
amda
r Vik
as N
igam
Li
mite
d 20
11-1
2 20
12-1
3 4.
72
1.03
0.
05
3.64
5.
07 --
4.
50
14.4
9 91
.55
4.67
5.
10
15
Guj
arat
Tha
kor a
nd K
oli V
ikas
N
igam
Lim
ited
2011
-12
2012
-13
0.75
0.
19
0.01
0.
55
0.87
--
3.70
2.
12
19.5
5 0.
74
3.79
16
Guj
arat
Liv
elih
ood
Prom
otio
n C
ompa
ny L
imite
d 20
11-1
2 20
12-1
3 -0
.20
0.00
0.
00
-0.2
0 0.
00 --
0.
05
-0.1
4 -0
.09
-0.2
0 N
A
Sect
or w
ise
Tot
al
1,64
0.33
1,
431.
67
0.75
20
7.91
1,
692.
360.
00
1,43
6.36
64
6.31
3,
711.
11
1,63
9.58
44
.18
Infr
astr
uctu
re
17
Guj
arat
Sta
te R
ural
Dev
elop
men
t C
orpo
ratio
n Li
mite
d 20
12-1
3 20
13-1
4 -0
.75
0.00
0.
01
-0.7
6 0.
000.
21
0.58
-1
.47
-0.8
9 -0
.76
NA
18
Guj
arat
Por
ts In
fras
truct
ure
and
Dev
elop
men
t Com
pany
Lim
ited
2012
-13
2013
-14
1.70
0.
00
0.04
1.
66
0.05
--
18.0
0 5.
52
23.5
2 1.
66
7.06
19
Guj
arat
Sta
te P
olic
e H
ousi
ng
Cor
pora
tion
Lim
ited
2011
-12
2012
-13
##
##
##
0.00
0.
00 --
50
.00
--
50.0
0 --
--
20
Guj
arat
Gro
wth
Cen
tres
Dev
elop
men
t Cor
pora
tion
Lim
ited
2009
-10
2013
-14
-0.0
5 0.
00
0.00
-0
.05
0.00
--
36.3
5 -0
.20
36.1
4 -0
.05
NA
21
Guj
arat
Sta
te R
oad
Dev
elop
men
t C
orpo
ratio
n Li
mite
d 20
12-1
3 20
13-1
4 0.
23
0.12
0.
09
0.02
10
.48
0.00
5.
00
6.77
12
.79
0.14
1.
09
22
Guj
arat
Urb
an D
evel
opm
ent
Com
pany
Lim
ited
2012
-13
2013
-14
4.95
0.
00
0.04
4.
91
3.02
--
26.0
0 18
.82
44.8
2 4.
91
10.9
5
23
Guj
arat
Indu
stria
l Cor
ridor
C
orpo
ratio
n Li
mite
d 20
11-1
2 20
12-1
3 0.
06
0.00
0.
00
0.06
0.
000.
00
10.0
0 0.
01
9.95
0.
06
0.60
24
Met
ro L
ink
Expr
ess f
or
Gan
dhin
agar
and
Ahm
edab
ad
(MEG
A) C
ompa
ny L
imite
d
2011
-12
2012
-13
-1.1
4 0.
01
0.18
-1
.33
0.00
0.00
50
.00
-2.8
2 7.
18
-1.3
2 N
A
25
Guj
arat
Sta
te A
viat
ion
Infr
astru
ctur
e C
ompa
ny L
imite
d 20
12-1
3 20
13-1
4 **
* **
* **
* 0.
00
0.00
0.00
0.
05
0.00
7.
69
--
--
Audit Report (PSUs) for the year ended 31 March 2013 Report No. 3 of 2014
78
(Fig
ures
in C
ol 5
(a) t
o 11
are
in
in C
rore
))Sl
.N
o.Se
ctor
& N
ame
of th
e C
ompa
ny
Peri
od o
f A
ccou
nts
Yea
r in
w
hich
fin
alis
ed
Net
Pro
fit (+
)/ L
oss (
-)
Tur
nove
r(D
)Im
pact
of
Acc
ount
sC
omm
ents
(A
)
Paid
up
Cap
ital#
Acc
umul
ated
Pro
fit
(+)/
Los
s(-)
(E
)
Cap
ital
empl
oyed
(B
)
Ret
urn
on
capi
tal
empl
oyed
(C
)
Perc
enta
ge
retu
rn
on c
apita
l em
ploy
ed
Net
Prof
it/L
oss
befo
reIn
tere
st &
D
epre
ciat
ion
Inte
rest
D
epre
cia
tion
Net
Prof
it/L
oss
(F)
12
34
5 (a
) 5
(b)
5 (c
) 5
(d)
67
89
10
11
12
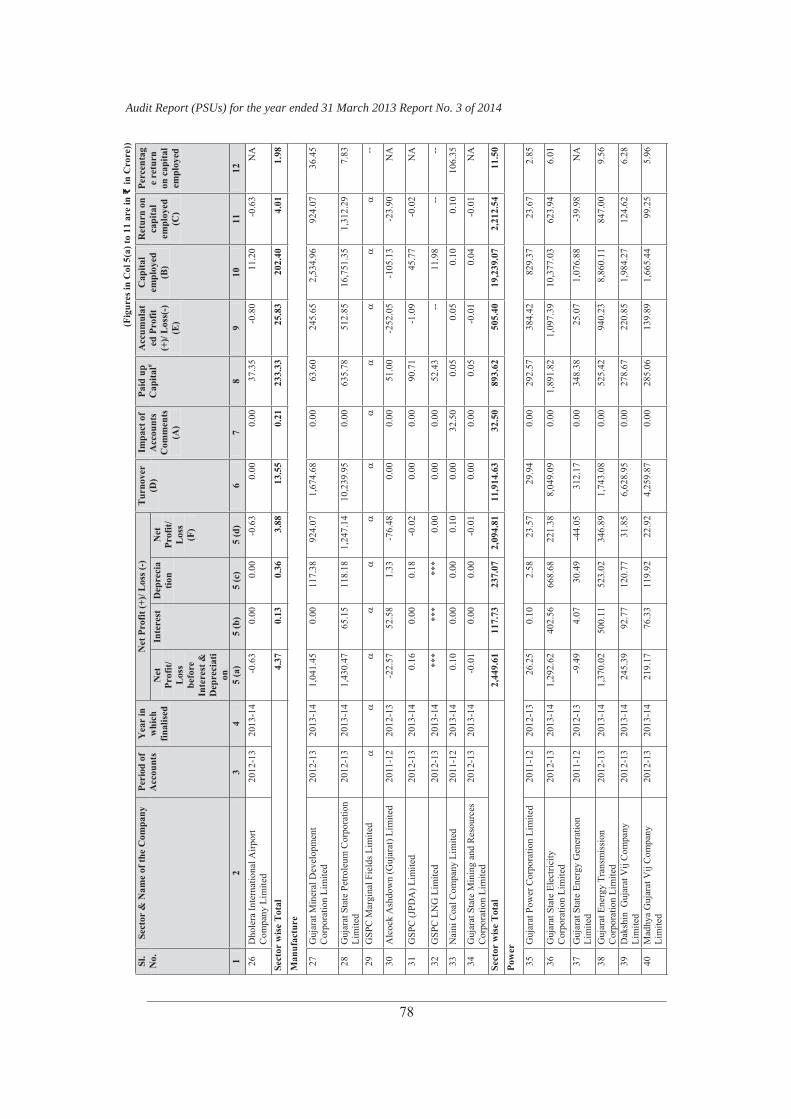
26
Dho
lera
Inte
rnat
iona
l Airp
ort
Com
pany
Lim
ited
2012
-13
2013
-14
-0.6
3 0.
00
0.00
-0
.63
0.00
0.00
37
.35
-0.8
0 11
.20
-0.6
3 N
A
Sect
or w
ise
Tot
al
4.37
0.
13
0.36
3.
88
13.5
50.
21
233.
33
25.8
3 20
2.40
4.
01
1.98
Man
ufac
ture
27
Guj
arat
Min
eral
Dev
elop
men
t C
orpo
ratio
n Li
mite
d 20
12-1
3 20
13-1
4 1,
041.
45
0.00
11
7.38
92
4.07
1,
674.
680.
00
63.6
0 24
5.65
2,
534.
96
924.
07
36.4
5
28
Guj
arat
Sta
te P
etro
leum
Cor
pora
tion
Lim
ited
2012
-13
2013
-14
1,43
0.47
65
.15
118.
18
1,24
7.14
10
,239
.95
0.00
63
5.78
51
2.85
16
,751
.35
1,31
2.29
7.
83
29
GSP
C M
argi
nal F
ield
s Lim
ited
--
30
Alc
ock
Ash
dow
n (G
ujar
at) L
imite
d 20
11-1
2 20
12-1
3 -2
2.57
52
.58
1.33
-7
6.48
0.
000.
00
51.0
0 -2
52.0
5 -1
05.1
3 -2
3.90
N
A
31
GSP
C (J
PDA
) Lim
ited
2012
-13
2013
-14
0.16
0.
00
0.18
-0
.02
0.00
0.00
90
.71
-1.0
9 45
.77
-0.0
2 N
A
32
GSP
C L
NG
Lim
ited
2012
-13
2013
-14
***
***
***
0.00
0.
000.
00
52.4
3 --
11
.98
--
--
33
Nai
ni C
oal C
ompa
ny L
imite
d 20
11-1
2 20
13-1
4 0.
10
0.00
0.
00
0.10
0.
0032
.50
0.05
0.
05
0.10
0.
10
106.
35
34
Guj
arat
Sta
te M
inin
g an
d R
esou
rces
C
orpo
ratio
n Li
mite
d 20
12-1
3 20
13-1
4 -0
.01
0.00
0.
00
-0.0
1 0.
000.
00
0.05
-0
.01
0.04
-0
.01
NA
Sect
or w
ise
Tot
al
2,44
9.61
11
7.73
23
7.07
2,
094.
81
11,9
14.6
3 32
.50
893.
62
505.
40
19,2
39.0
7 2,
212.
54
11.5
0
Pow
er
35
Guj
arat
Pow
er C
orpo
ratio
n Li
mite
d 20
11-1
2 20
12-1
3 26
.25
0.10
2.
58
23.5
7 29
.94
0.00
29
2.57
38
4.42
82
9.37
23
.67
2.85
36
Guj
arat
Sta
te E
lect
ricity
C
orpo
ratio
n Li
mite
d 20
12-1
3 20
13-1
4 1,
292.
62
402.
56
668.
68
221.
38
8,04
9.09
0.00
1,
891.
82
1,09
7.39
10
,377
.03
623.
94
6.01
37
Guj
arat
Sta
te E
nerg
y G
ener
atio
n Li
mite
d 20
11-1
2 20
12-1
3 -9
.49
4.07
30
.49
-44.
05
312.
170.
00
348.
38
25.0
7 1,
076.
88
-39.
98
NA
38
Guj
arat
Ene
rgy
Tran
smis
sion
C
orpo
ratio
n Li
mite
d 20
12-1
3 20
13-1
4 1,
370.
02
500.
11
523.
02
346.
89
1,74
3.08
0.00
52
5.42
94
0.23
8,
860.
11
847.
00
9.56
39
Dak
shin
Guj
arat
Vij
Com
pany
Li
mite
d 20
12-1
3 20
13-1
4 24
5.39
92
.77
120.
77
31.8
5 6,
628.
950.
00
278.
67
220.
85
1,98
4.27
12
4.62
6.
28
40
Mad
hya
Guj
arat
Vij
Com
pany
Li
mite
d 20
12-1
3 20
13-1
4 21
9.17
76
.33
119.
92
22.9
2 4,
259.
870.
00
285.
06
139.
89
1,66
5.44
99
.25
5.96
Annexure
79
(Fig
ures
in C
ol 5
(a) t
o 11
are
in
in C
rore
))Sl
.N
o.Se
ctor
& N
ame
of th
e C
ompa
ny
Peri
od o
f A
ccou
nts
Yea
r in
w
hich
fin
alis
ed
Net
Pro
fit (+
)/ L
oss (
-)
Tur
nove
r(D
)Im
pact
of
Acc
ount
sC
omm
ents
(A
)
Paid
up
Cap
ital#
Acc
umul
ated
Pro
fit
(+)/
Los
s(-)
(E
)
Cap
ital
empl
oyed
(B
)
Ret
urn
on
capi
tal
empl
oyed
(C
)
Perc
enta
ge
retu
rn
on c
apita
l em
ploy
ed
Net
Prof
it/L
oss
befo
reIn
tere
st &
D
epre
ciat
ion
Inte
rest
D
epre
cia
tion
Net
Prof
it/L
oss
(F)
12
34
5 (a
) 5
(b)
5 (c
) 5
(d)
67
89
10
11
12
41
Pasc
him
Guj
arat
Vij
Com
pany
Li
mite
d 20
12-1
3 20
13-1
4 53
1.87
20
2.34
31
8.89
10
.64
9,31
2.60
0.00
79
0.44
73
.45
3,87
2.13
21
2.98
5.
50
42
Utta
r Guj
arat
Vij
Com
pany
Lim
ited
2012
-13
2013
-14
314.
87
145.
43
149.
72
19.7
2 7,
379.
3820
.96
405.
65
48.9
9 1,
760.
67
165.
15
9.38
43
Guj
arat
Urja
Vik
as N
igam
Lim
ited
2012
-13
2013
-14
157.
56
47.0
7 29
.09
81.4
0 28
,816
.28
0.00
5,
601.
80
-442
.57
5,72
7.95
12
8.47
2.
24
44
GSP
C P
ipav
av P
ower
Com
pany
Li
mite
d 20
12-1
3 20
13-1
4 9.
91
2.89
9.
80
-2.7
8 12
.74
0.00
42
.27
-9.1
7 1,
518.
80
0.11
0.
01
45
Bha
vnag
ar E
nerg
y C
ompa
ny
Lim
ited
2012
-13
2013
-14
-4.6
4 0.
00
0.01
-4
.65
0.00
0.00
38
5.55
-4
.65
1901
.07
-4.6
5 N
A
Sect
or w
ise
Tot
al
4,15
3.53
1,
473.
67
1,97
2.97
70
6.89
66
,544
.10
20.9
6 10
,847
.63
2,47
3.90
39
,573
.72
2,18
0.56
5.
51
Serv
ice
46
Guj
arat
Wat
er R
esou
rces
D
evel
opm
ent C
orpo
ratio
n L
imite
d 20
11-1
2 20
12-1
3 -8
.34
0.00
0.
72
-9.0
6 50
.54
135.
36
31.4
9 -2
8.70
18
1.05
-9
.06
NA
47
Tour
ism
Cor
pora
tion
of G
ujar
at
Lim
ited
2011
-12
2013
-14
35.6
6 0.
00
0.95
34
.71
9.87
0.00
19
.99
33.8
0 30
7.13
34
.71
11.3
0
48
Guj
arat
Sta
te F
ores
t Dev
elop
men
t C
orpo
ratio
n Li
mite
d 20
12-1
3 20
13-1
4 5.
90
0.03
0.
30
5.57
53
.58
0.71
6.
32
26.4
8 39
.40
5.60
14
.21
49
Guj
arat
Indu
stria
l and
Tec
hnic
al
Con
sulta
ncy
Lim
ited
2012
-13
2013
-14
0.19
0.
00
0.04
0.
15
4.09
0.00
0.
20
0.77
0.
97
0.15
15
.46
50
Guj
arat
Sta
te C
ivil
Supp
lies
Cor
pora
tion
Lim
ited
2012
-13
2013
-14
8.39
6.
75
0.90
0.
74
1,91
8.14
0.51
10
.00
3.17
13
.17
7.49
56
.87
51
Guj
arat
Sta
te P
etro
net L
imite
d 20
12-1
3 20
13-1
4 1,
137.
68
125.
85
186.
11
825.
72
1,16
0.29
0.00
56
2.71
2,
061.
35
4,27
9.45
95
1.57
22
.24
52
Guj
arat
Info
rmat
ics L
imite
d 20
11-1
2 20
12-1
3 25
.10
3.84
0.
08
21.1
8 7.
690.
00
18.5
1 45
.63
89.5
4 25
.02
27.9
4
53
GSP
C G
as C
ompa
ny L
imite
d 20
12-1
3 20
13-1
4 21
5.32
57
.99
59.4
0 97
.93
4,17
3.39
0.00
84
.62
389.
82
1,02
8.08
15
5.92
15
.17
54
Guj
Info
pet
ro L
imite
d 20
12-1
3 20
13-1
4 9.
74
0.00
0.
39
9.35
28
.18
0.00
0.
05
3.62
23
.67
9.35
39
.50
55
BIS
AG
Sat
ellit
e C
omm
unic
atio
n 56
G
ujar
at F
ound
atio
n fo
r Men
tal
heal
th a
nd A
llied
Sci
ence
s 20
09-1
0 20
11-1
2 **
* **
* **
* 0.
00
0.00
--
0.02
0.
00
0.02
0.
00
NA
57
Dah
ej S
EZ L
imite
d 20
11-1
2 20
12-1
3 42
.24
6.62
18
.24
17.3
8 37
.30
0.00
46
.05
31.2
1 77
.26
24.0
0 31
.07
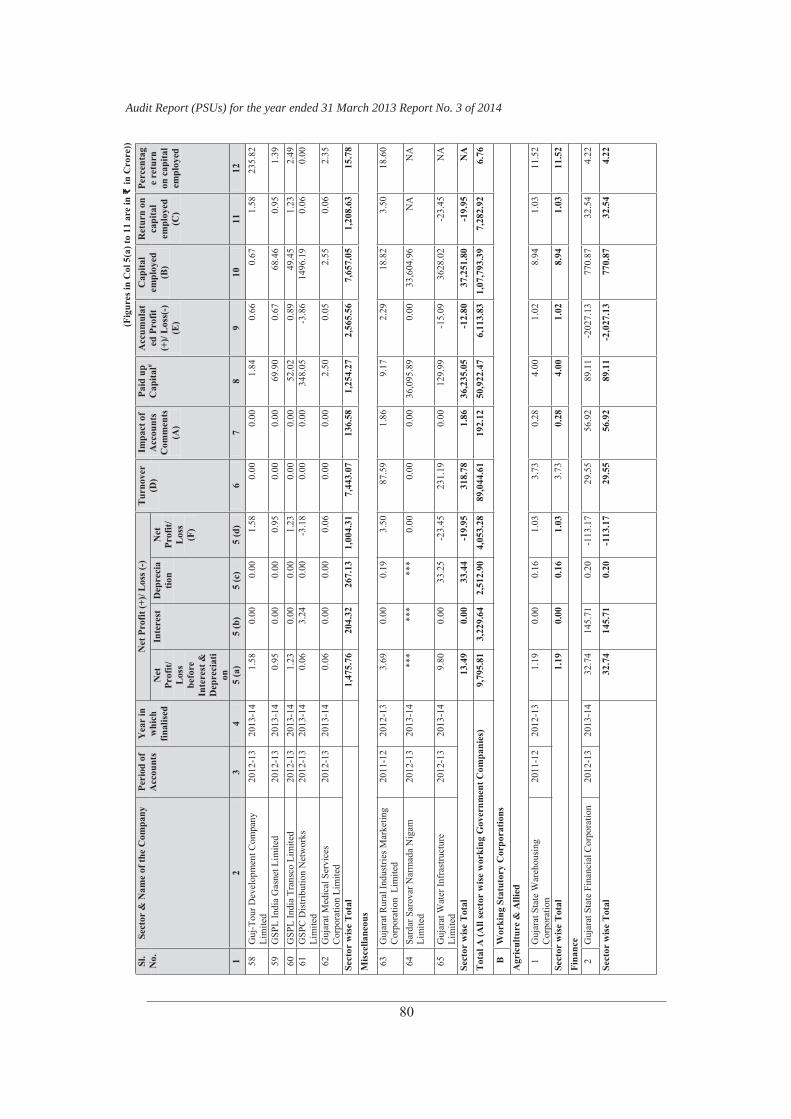
Audit Report (PSUs) for the year ended 31 March 2013 Report No. 3 of 2014
80
(Fig
ures
in C
ol 5
(a) t
o 11
are
in
in C
rore
))Sl
.N
o.Se
ctor
& N
ame
of th
e C
ompa
ny
Peri
od o
f A
ccou
nts
Yea
r in
w
hich
fin
alis
ed
Net
Pro
fit (+
)/ L
oss (
-)
Tur
nove
r(D
)Im
pact
of
Acc
ount
sC
omm
ents
(A
)
Paid
up
Cap
ital#
Acc
umul
ated
Pro
fit
(+)/
Los
s(-)
(E
)
Cap
ital
empl
oyed
(B
)
Ret
urn
on
capi
tal
empl
oyed
(C
)
Perc
enta
ge
retu
rn
on c
apita
l em
ploy
ed
Net
Prof
it/L
oss
befo
reIn
tere
st &
D
epre
ciat
ion
Inte
rest
D
epre
cia
tion
Net
Prof
it/L
oss
(F)
12
34
5 (a
) 5
(b)
5 (c
) 5
(d)
67
89
10
11
12
58
Guj
-Tou
r Dev
elop
men
t Com
pany
Li
mite
d 20
12-1
3 20
13-1
4 1.
58
0.00
0.
00
1.58
0.
000.
00
1.84
0.
66
0.67
1.
58
235.
82
59
GSP
L In
dia
Gas
net L
imite
d 20
12-1
3 20
13-1
4 0.
95
0.00
0.
00
0.95
0.
000.
00
69.9
0 0.
67
68.4
6 0.
95
1.39
60
G
SPL
Indi
a Tr
ansc
o Li
mite
d 20
12-1
3 20
13-1
4 1.
23
0.00
0.
00
1.23
0.
000.
00
52.0
2 0.
89
49.4
5 1.
23
2.49
61
G
SPC
Dis
tribu
tion
Net
wor
ks
Lim
ited
2012
-13
2013
-14
0.06
3.
24
0.00
-3
.18
0.00
0.00
34
8.05
-3
.86
1496
.19
0.06
0.
00
62
Guj
arat
Med
ical
Ser
vice
s C
orpo
ratio
n Li
mite
d 20
12-1
3 20
13-1
4 0.
06
0.00
0.
00
0.06
0.
000.
00
2.50
0.
05
2.55
0.
06
2.35
Sect
or w
ise
Tot
al
1,
475.
76
204.
32
267.
13
1,00
4.31
7,
443.
0713
6.58
1,
254.
27
2,56
5.56
7,
657.
05
1,20
8.63
15
.78
Mis
cella
neou
s
63
Guj
arat
Rur
al In
dust
ries M
arke
ting
Cor
pora
tion
Lim
ited
2011
-12
2012
-13
3.69
0.
00
0.19
3.
50
87.5
91.
86
9.17
2.
29
18.8
2 3.
50
18.6
0
64
Sard
ar S
arov
ar N
arm
ada
Nig
am
Lim
ited
2012
-13
2013
-14
***
***
***
0.00
0.
000.
00
36,0
95.8
9 0.
00
33,6
04.9
6 N
A
NA
65
Guj
arat
Wat
er In
fras
truct
ure
Lim
ited
2012
-13
2013
-14
9.80
0.
00
33.2
5 -2
3.45
23
1.19
0.00
12
9.99
-1
5.09
36
28.0
2 -2
3.45
N
A
Sect
or w
ise
Tot
al
13.4
9 0.
00
33.4
4 -1
9.95
31
8.78
1.86
36
,235
.05
-12.
80
37,2
51.8
0 -1
9.95
N
A
Tot
al A
(All
sect
or w
ise
wor
king
Gov
ernm
ent C
ompa
nies
) 9,
795.
81
3,22
9.64
2,
512.
90
4,05
3.28
89
,044
.61
192.
12
50,9
22.4
7 6,
113.
83
1,07
,793
.39
7,28
2.92
6.
76
B
Wor
king
Sta
tuto
ry C
orpo
ratio
ns
Agr
icul
ture
& A
llied
1 G
ujar
at S
tate
War
ehou
sing
C
orpo
ratio
n20
11-1
2 20
12-1
3 1.
19
0.00
0.
16
1.03
3.
730.
28
4.00
1.
02
8.94
1.
03
11.5
2
Sect
or w
ise
Tot
al
1.19
0.
00
0.16
1.
03
3.73
0.28
4.
00
1.02
8.
94
1.03
11
.52
Fina
nce
2 G
ujar
at S
tate
Fin
anci
al C
orpo
ratio
n 20
12-1
3 20
13-1
4 32
.74
145.
71
0.20
-1
13.1
7 29
.55
56.9
2 89
.11
-202
7.13
77
0.87
32
.54
4.22
Sect
or w
ise
Tot
al
32.7
4 14
5.71
0.
20
-113
.17
29.5
556
.92
89.1
1 -2
,027
.13
770.
87
32.5
4 4.
22
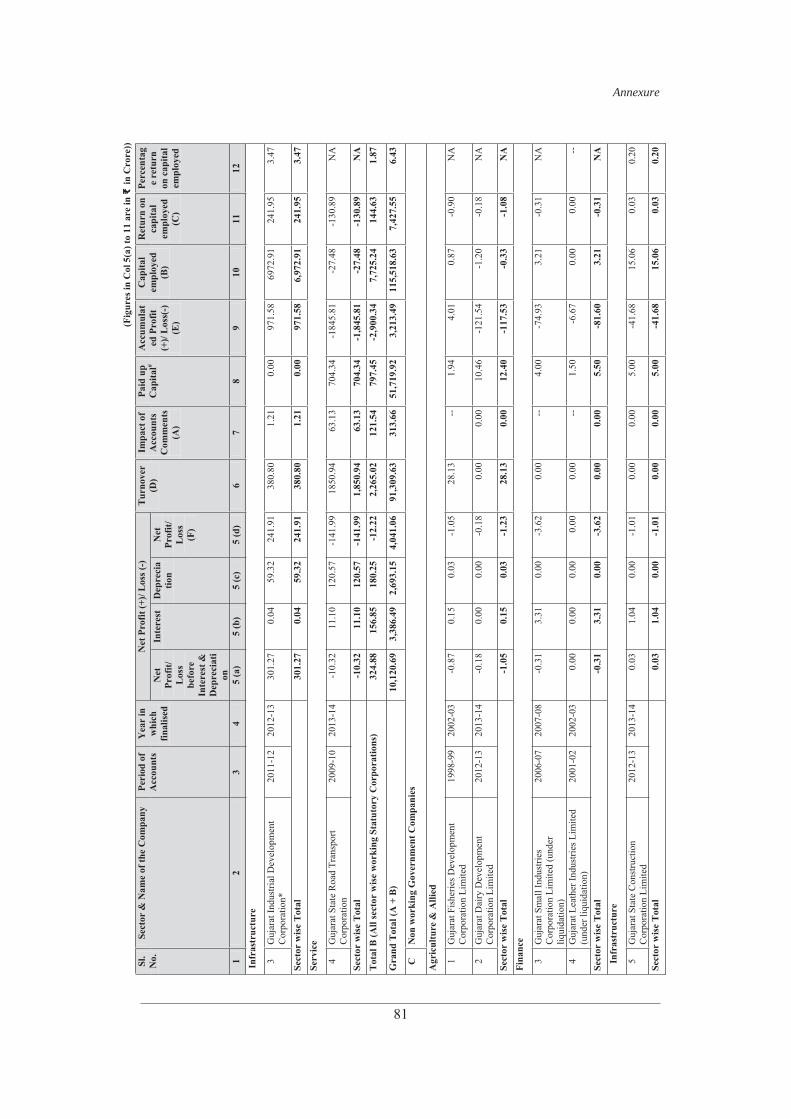
Annexure
81
(Fig
ures
in C
ol 5
(a) t
o 11
are
in
in C
rore
))Sl
.N
o.Se
ctor
& N
ame
of th
e C
ompa
ny
Peri
od o
f A
ccou
nts
Yea
r in
w
hich
fin
alis
ed
Net
Pro
fit (+
)/ L
oss (
-)
Tur
nove
r(D
)Im
pact
of
Acc
ount
sC
omm
ents
(A
)
Paid
up
Cap
ital#
Acc
umul
ated
Pro
fit
(+)/
Los
s(-)
(E
)
Cap
ital
empl
oyed
(B
)
Ret
urn
on
capi
tal
empl
oyed
(C
)
Perc
enta
ge
retu
rn
on c
apita
l em
ploy
ed
Net
Prof
it/L
oss
befo
reIn
tere
st &
D
epre
ciat
ion
Inte
rest
D
epre
cia
tion
Net
Prof
it/L
oss
(F)
12
34
5 (a
) 5
(b)
5 (c
) 5
(d)
67
89
10
11
12
Infr
astr
uctu
re
3 G
ujar
at In
dust
rial D
evel
opm
ent
Cor
pora
tion*
20
11-1
2 20
12-1
3 30
1.27
0.
04
59.3
2 24
1.91
38
0.80
1.21
0.
00
971.
58
6972
.91
241.
95
3.47
Sect
or w
ise
Tot
al
301.
27
0.04
59
.32
241.
91
380.
801.
21
0.00
97
1.58
6,
972.
91
241.
95
3.47
Serv
ice
4 G
ujar
at S
tate
Roa
d Tr
ansp
ort
Cor
pora
tion
2009
-10
2013
-14
-10.
32
11.1
0 12
0.57
-1
41.9
9 18
50.9
4 63
.13
704.
34
-184
5.81
-2
7.48
-1
30.8
9 N
A
Sect
or w
ise
Tot
al
-10.
32
11.1
0 12
0.57
-1
41.9
9 1,
850.
9463
.13
704.
34
-1,8
45.8
1 -2
7.48
-1
30.8
9 N
A
Tot
al B
(All
sect
or w
ise
wor
king
Sta
tuto
ry C
orpo
ratio
ns)
324.
88
156.
85
180.
25
-12.
22
2,26
5.02
121.
54
797.
45
-2,9
00.3
4 7,
725.
24
144.
63
1.87
Gra
nd T
otal
(A +
B)
10,1
20.6
9 3,
386.
49
2,69
3.15
4,
041.
06
91,3
09.6
3 31
3.66
51
,719
.92
3,21
3.49
11
5,51
8.63
7,
427.
55
6.43
C
Non
wor
king
Gov
ernm
ent C
ompa
nies
Agr
icul
ture
& A
llied
1 G
ujar
at F
ishe
ries D
evel
opm
ent
Cor
pora
tion
Lim
ited
1998
-99
2002
-03
-0.8
7 0.
15
0.03
-1
.05
28.1
3--
1.
94
4.01
0.
87
-0.9
0 N
A
2 G
ujar
at D
airy
Dev
elop
men
t C
orpo
ratio
n Li
mite
d 20
12-1
3 20
13-1
4 -0
.18
0.00
0.
00
-0.1
8 0.
000.
00
10.4
6 -1
21.5
4 -1
.20
-0.1
8 N
A
Sect
or w
ise
Tot
al
-1.0
5 0.
15
0.03
-1
.23
28.1
30.
00
12.4
0 -1
17.5
3 -0
.33
-1.0
8 N
A
Fina
nce
3 G
ujar
at S
mal
l Ind
ustri
es
Cor
pora
tion
Lim
ited
(und
er
liqui
datio
n)
2006
-07
2007
-08
-0.3
1 3.
31
0.00
-3
.62
0.00
--
4.00
-7
4.93
3.
21
-0.3
1 N
A
4 G
ujar
at L
eath
er In
dust
ries L
imite
d (u
nder
liqu
idat
ion)
20
01-0
2 20
02-0
3 0.
00
0.00
0.
00
0.00
0.
00--
1.
50
-6.6
7 0.
00
0.00
--
Sect
or w
ise
Tot
al
-0.3
1 3.
31
0.00
-3
.62
0.00
0.00
5.
50
-81.
60
3.21
-0
.31
NA
In
fras
truc
ture
5 G
ujar
at S
tate
Con
stru
ctio
n C
orpo
ratio
n Li
mite
d 20
12-1
3 20
13-1
4 0.
03
1.04
0.
00
-1.0
1 0.
000.
00
5.00
-4
1.68
15
.06
0.03
0.
20
Sect
or w
ise
Tot
al
0.03
1.
04
0.00
-1
.01
0.00
0.00
5.
00
-41.
68
15.0
6 0.
03
0.20
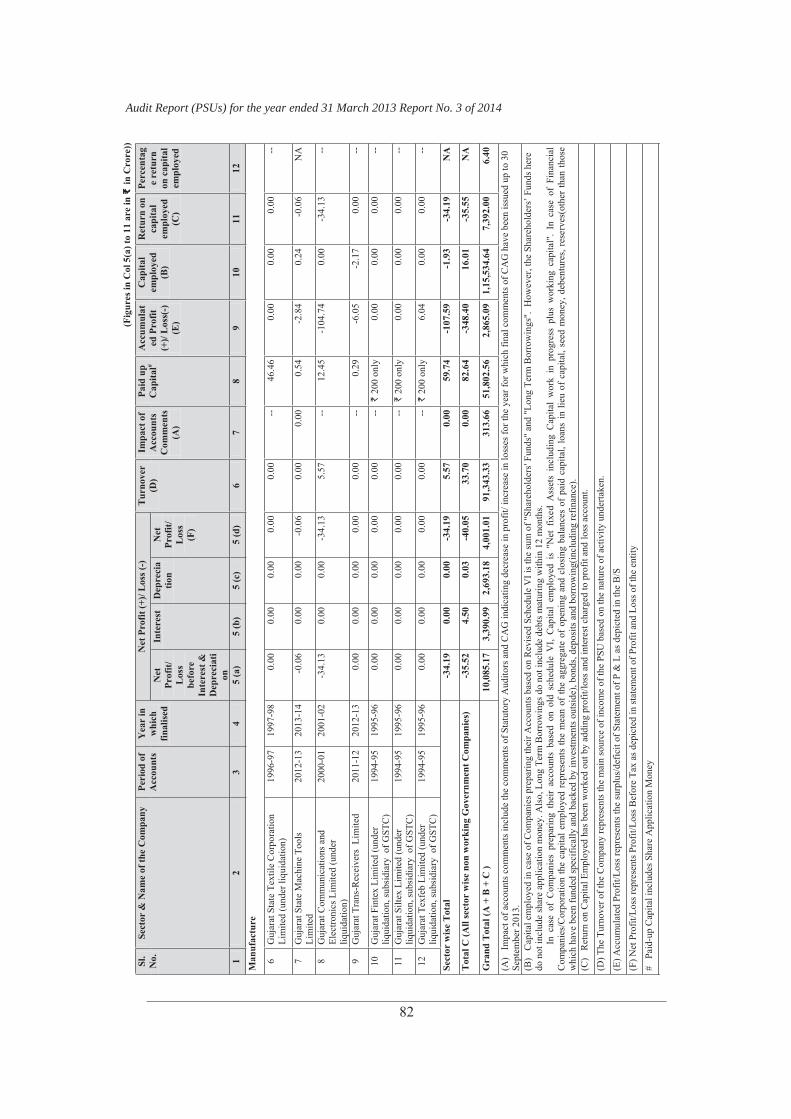
Audit Report (PSUs) for the year ended 31 March 2013 Report No. 3 of 2014
82
(Fig
ures
in C
ol 5
(a) t
o 11
are
in
in C
rore
))Sl
.N
o.Se
ctor
& N
ame
of th
e C
ompa
ny
Peri
od o
f A
ccou
nts
Yea
r in
w
hich
fin
alis
ed
Net
Pro
fit (+
)/ L
oss (
-)
Tur
nove
r(D
)Im
pact
of
Acc
ount
sC
omm
ents
(A
)
Paid
up
Cap
ital#
Acc
umul
ated
Pro
fit
(+)/
Los
s(-)
(E
)
Cap
ital
empl
oyed
(B
)
Ret
urn
on
capi
tal
empl
oyed
(C
)
Perc
enta
ge
retu
rn
on c
apita
l em
ploy
ed
Net
Prof
it/L
oss
befo
reIn
tere
st &
D
epre
ciat
ion
Inte
rest
D
epre
cia
tion
Net
Prof
it/L
oss
(F)
12
34
5 (a
) 5
(b)
5 (c
) 5
(d)
67
89
10
11
12
Man
ufac
ture
6 G
ujar
at S
tate
Tex
tile
Cor
pora
tion
Lim
ited
(und
er li
quid
atio
n)
1996
-97
1997
-98
0.00
0.
00
0.00
0.
00
0.00
--
46.4
6 0.
00
0.00
0.
00
--
7 G
ujar
at S
tate
Mac
hine
Too
ls
Lim
ited
2012
-13
2013
-14
-0.0
6 0.
00
0.00
-0
.06
0.00
0.00
0.
54
-2.8
4 0.
24
-0.0
6 N
A
8 G
ujar
at C
omm
unic
atio
ns a
nd
Elec
troni
cs L
imite
d (u
nder
liq
uida
tion)
2000
-01
2001
-02
-34.
13
0.00
0.
00
-34.
13
5.57
--
12.4
5 -1
04.7
4 0.
00
-34.
13
--
9 G
ujar
at T
rans
-Rec
eive
rs L
imite
d 20
11-1
2 20
12-1
3 0.
00
0.00
0.
00
0.00
0.
00--
0.
29
-6.0
5 -2
.17
0.00
--
10
Guj
arat
Fin
tex
Lim
ited
(und
er
liqui
datio
n, su
bsid
iary
of G
STC
) 19
94-9
5 19
95-9
6 0.
00
0.00
0.
00
0.00
0.
00--
` 2
00 o
nly
0.00
0.
00
0.00
--
11
Guj
arat
Silt
ex L
imite
d (u
nder
liq
uida
tion,
subs
idia
ry o
f GST
C)
1994
-95
1995
-96
0.00
0.
00
0.00
0.
00
0.00
--
` 2
00 o
nly
0.00
0.
00
0.00
--
12
Guj
arat
Tex
feb
Lim
ited
(und
er
liqui
datio
n, su
bsid
iary
of G
STC
) 19
94-9
5 19
95-9
6 0.
00
0.00
0.
00
0.00
0.
00--
` 2
00 o
nly
6.04
0.
00
0.00
--
Sect
or w
ise
Tot
al
-34.
19
0.00
0.
00
-34.
19
5.57
0.00
59
.74
-107
.59
-1.9
3 -3
4.19
N
A
Tot
al C
(All
sect
or w
ise
non
wor
king
Gov
ernm
ent C
ompa
nies
) -3
5.52
4.
50
0.03
-4
0.05
33
.70
0.00
82
.64
-348
.40
16.0
1 -3
5.55
N
A
Gra
nd T
otal
(A +
B +
C )
10,0
85.1
7 3,
390.
99
2,69
3.18
4,
001.
01
91,3
43.3
3 31
3.66
51
,802
.56
2,86
5.09
1,
15,5
34.6
4 7,
392.
00
6.40
(A)
Impa
ct o
f acc
ount
s com
men
ts in
clud
e th
e co
mm
ents
of S
tatu
tory
Aud
itors
and
CA
G in
dica
ting
decr
ease
in p
rofit
/ inc
reas
e in
loss
es fo
r the
yea
r for
whi
ch fi
nal c
omm
ents
of C
AG
hav
e be
en is
sued
up
to 3
0 Se
ptem
ber 2
013.
(B
) C
apita
l em
ploy
ed in
cas
e of
Com
pani
es p
repa
ring
thei
r Acc
ount
s bas
ed o
n R
evis
ed S
ched
ule
VI i
s the
sum
of "
Shar
ehol
ders
' Fun
ds"
and
"Lon
g Te
rm B
orro
win
gs".
How
ever
, the
Sha
reho
lder
s F
unds
her
e do
not
incl
ude
shar
e ap
plic
atio
n m
oney
. Als
o, L
ong
Term
Bor
row
ings
do
not i
nclu
de d
ebts
mat
urin
g w
ithin
12
mon
ths.
In c
ase
of C
ompa
nies
pre
parin
g th
eir
acco
unts
bas
ed o
n ol
d sc
hedu
le V
I, C
apita
l em
ploy
ed i
s "N
et f
ixed
Ass
ets
incl
udin
g C
apita
l w
ork
in p
rogr
ess
plus
wor
king
cap
ital"
. In
cas
e of
Fin
anci
al
Com
pani
es/C
orpo
ratio
n th
e ca
pita
l em
ploy
ed r
epre
sent
s th
e m
ean
of th
e ag
greg
ate
of o
peni
ng a
nd c
losi
ng b
alan
ces
of p
aid
capi
tal,
loan
s in
lieu
of
capi
tal,
seed
mon
ey, d
eben
ture
s, re
serv
es(o
ther
than
thos
e w
hich
hav
e be
en fu
nded
spec
ifica
lly a
nd b
acke
d by
inve
stm
ents
out
side
), bo
nds,
depo
sits
and
bor
row
ing(
incl
udin
g re
finan
ce).
(C)
Ret
urn
on C
apita
l Em
ploy
ed h
as b
een
wor
ked
out b
y ad
ding
pro
fit/lo
ss a
nd in
tere
st c
harg
ed to
pro
fit a
nd lo
ss a
ccou
nt.
(D) T
he T
urno
ver o
f the
Com
pany
repr
esen
ts th
e m
ain
sour
ce o
f inc
ome
of th
e PS
U b
ased
on
the
natu
re o
f act
ivity
und
erta
ken.
(E) A
ccum
ulat
ed P
rofit
/Los
s rep
rese
nts t
he su
rplu
s/de
ficit
of S
tate
men
t of P
& L
as d
epic
ted
in th
e B
/S
(F) N
et P
rofit
/Los
s rep
rese
nts P
rofit
/Los
s Bef
ore
Tax
as d
epic
ted
in st
atem
ent o
f Pro
fit a
nd L
oss o
f the
ent
ity
# P
aid-
up C
apita
l inc
lude
s Sha
re A
pplic
atio
n M
oney
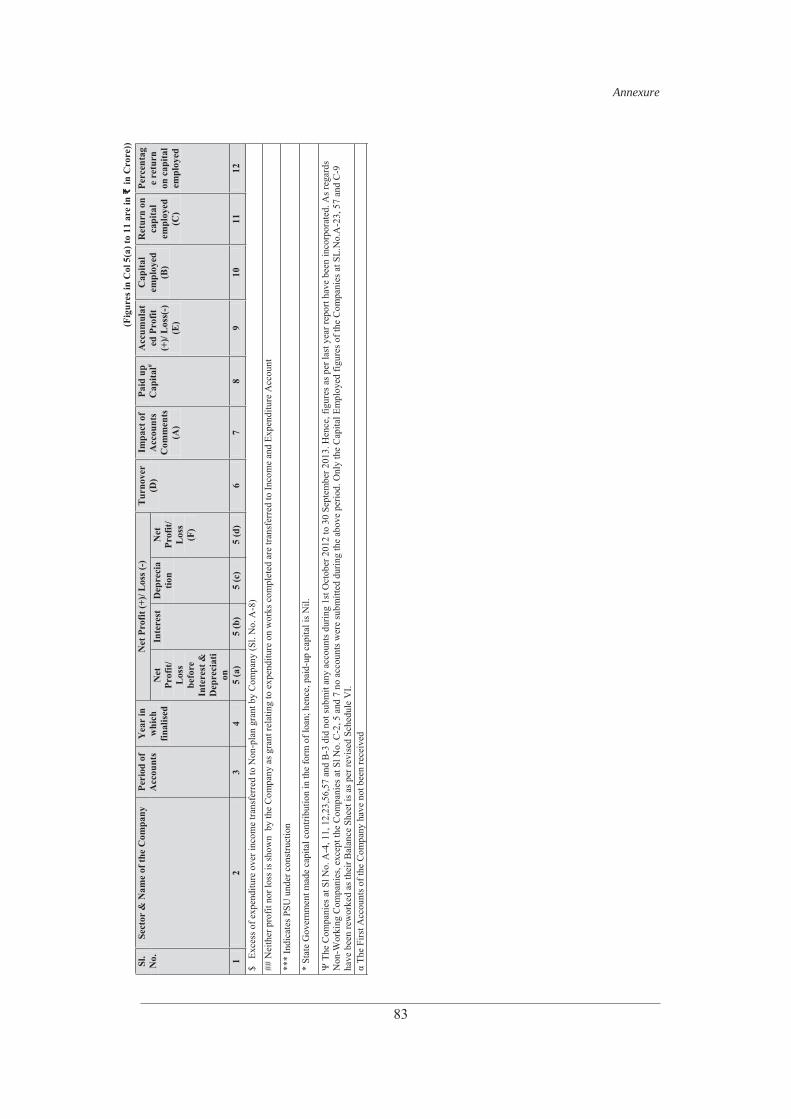
Annexure
83
(Fig
ures
in C
ol 5
(a) t
o 11
are
in
in C
rore
))Sl
.N
o.Se
ctor
& N
ame
of th
e C
ompa
ny
Peri
od o
f A
ccou
nts
Yea
r in
w
hich
fin
alis
ed
Net
Pro
fit (+
)/ L
oss (
-)
Tur
nove
r(D
)Im
pact
of
Acc
ount
sC
omm
ents
(A
)
Paid
up
Cap
ital#
Acc
umul
ated
Pro
fit
(+)/
Los
s(-)
(E
)
Cap
ital
empl
oyed
(B
)
Ret
urn
on
capi
tal
empl
oyed
(C
)
Perc
enta
ge
retu
rn
on c
apita
l em
ploy
ed
Net
Prof
it/L
oss
befo
reIn
tere
st &
D
epre
ciat
ion
Inte
rest
D
epre
cia
tion
Net
Prof
it/L
oss
(F)
12
34
5 (a
) 5
(b)
5 (c
) 5
(d)
67
89
10
11
12
$ E
xces
s of e
xpen
ditu
re o
ver i
ncom
e tra
nsfe
rred
to N
on-p
lan
gran
t by
Com
pany
(Sl.
No.
A-8
)
## N
eith
er p
rofit
nor
loss
is sh
own
by
the
Com
pany
as g
rant
rela
ting
to e
xpen
ditu
re o
n w
orks
com
plet
ed a
re tr
ansf
erre
d to
Inco
me
and
Expe
nditu
re A
ccou
nt
***
Indi
cate
s PSU
und
er c
onst
ruct
ion
* St
ate
Gov
ernm
ent m
ade
capi
tal c
ontri
butio
n in
the
form
of l
oan;
hen
ce, p
aid-
up c
apita
l is N
il.
The
Com
pani
es a
t Sl N
o. A
-4, 1
1, 1
2,23
,56,
57 a
nd B
-3 d
id n
ot su
bmit
any
acco
unts
dur
ing
1st O
ctob
er 2
012
to 3
0 Se
ptem
ber 2
013.
Hen
ce, f
igur
es a
s per
last
yea
r rep
ort h
ave
been
inco
rpor
ated
. As r
egar
ds
Non
-Wor
king
Com
pani
es, e
xcep
t the
Com
pani
es a
t Sl N
o. C
-2, 5
and
7 n
o ac
coun
ts w
ere
subm
itted
dur
ing
the
abov
e pe
riod.
Onl
y th
e C
apita
l Em
ploy
ed fi
gure
s of t
he C
ompa
nies
at S
L.N
o.A
-23,
57
and
C-9
ha
ve b
een
rew
orke
d as
thei
r Bal
ance
She
et is
as p
er re
vise
d Sc
hedu
le V
I. e
not b
een
rece
ived
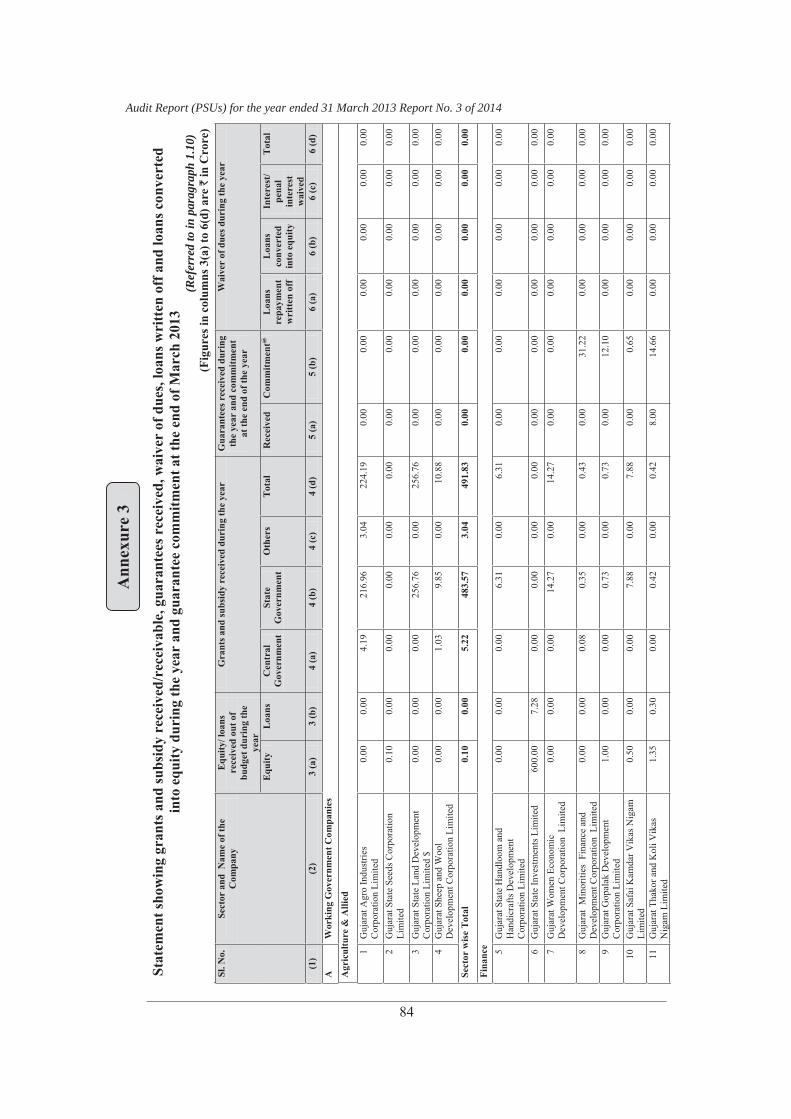
Audit Report (PSUs) for the year ended 31 March 2013 Report No. 3 of 2014
84
Stat
emen
t sho
win
g gr
ants
and
subs
idy
rece
ived
/rec
eiva
ble,
gua
rant
ees r
ecei
ved,
wai
ver
of d
ues,
loan
s wri
tten
off
and
loan
s con
vert
edin
to e
quity
dur
ing
the
year
and
gua
rant
ee c
omm
itmen
t at t
he e
nd o
f Mar
ch 2
013
(Ref
erre
d to
in p
arag
raph
1.1
0)
(Fig
ures
in c
olum
ns 3
(a) t
o 6(
d) a
re `
in C
rore
) Sl
. No.
Se
ctor
and
Nam
e of
the
Com
pany
E
quity
/ loa
ns
rece
ived
out
of
budg
et d
urin
g th
e ye
ar
Gra
nts a
nd su
bsid
y re
ceiv
ed d
urin
g th
e ye
ar
Gua
rant
ees r
ecei
ved
duri
ng
the
year
and
com
mitm
ent
at th
e en
d of
the
year
Wai
ver
of d
ues d
urin
g th
e ye
ar
Equ
ityL
oans
Cen
tral
Gov
ernm
ent
Stat
eG
over
nmen
t O
ther
sT
otal
Rec
eive
d C
omm
itmen
t@L
oans
repa
ymen
t w
ritt
en o
ff
Loa
nsco
nver
ted
into
equ
ity
Inte
rest
/ pe
nal
inte
rest
wai
ved
Tot
al
(1)
(2)
3 (a
) 3
(b)
4 (a
) 4
(b)
4 (c
) 4
(d)
5 (a
) 5
(b)
6 (a
) 6
(b)
6 (c
) 6
(d)
A
Wor
king
Gov
ernm
ent C
ompa
nies
Agr
icul
ture
& A
llied
1 G
ujar
at A
gro
Indu
strie
s C
orpo
ratio
n Li
mite
d 0.
000.
00
4.19
21
6.96
3.
04
224.
19
0.00
0.
00
0.00
0.
00
0.00
0.
00
2 G
ujar
at S
tate
See
ds C
orpo
ratio
n Li
mite
d 0.
100.
00
0.00
0.
00
0.00
0.
00
0.00
0.
00
0.00
0.
00
0.00
0.
00
3 G
ujar
at S
tate
Lan
d D
evel
opm
ent
Cor
pora
tion
Lim
ited
$ 0.
000.
00
0.00
25
6.76
0.
00
256.
76
0.00
0.
00
0.00
0.
00
0.00
0.
00
4 G
ujar
at S
heep
and
Woo
l D
evel
opm
ent C
orpo
ratio
n Li
mite
d 0.
000.
00
1.03
9.
85
0.00
10
.88
0.00
0.
00
0.00
0.
00
0.00
0.
00
Sect
or w
ise
Tot
al
0.10
0.00
5.
22
483.
57
3.04
49
1.83
0.
00
0.00
0.
00
0.00
0.
00
0.00
Fina
nce 5
Guj
arat
Sta
te H
andl
oom
and
H
andi
craf
ts D
evel
opm
ent
Cor
pora
tion
Lim
ited
0.00
0.00
0.
00
6.31
0.
00
6.31
0.
00
0.00
0.
00
0.00
0.
00
0.00
6 G
ujar
at S
tate
Inve
stm
ents
Lim
ited
600.
007.
28
0.00
0.
00
0.00
0.
00
0.00
0.
00
0.00
0.
00
0.00
0.
00
7 G
ujar
at W
omen
Eco
nom
ic
Dev
elop
men
t Cor
pora
tion
Lim
ited
0.00
0.00
0.
00
14.2
7 0.
00
14.2
7 0.
00
0.00
0.
00
0.00
0.
00
0.00
8 G
ujar
at M
inor
ities
Fin
ance
and
D
evel
opm
ent C
orpo
ratio
n L
imite
d 0.
000.
00
0.08
0.
35
0.00
0.
43
0.00
31
.22
0.00
0.
00
0.00
0.
00
9 G
ujar
at G
opal
ak D
evel
opm
ent
Cor
pora
tion
Lim
ited
1.00
0.00
0.
00
0.73
0.
00
0.73
0.
00
12.1
0 0.
00
0.00
0.
00
0.00
10
Guj
arat
Saf
ai K
amda
r Vik
as N
igam
Li
mite
d 0.
500.
00
0.00
7.
88
0.00
7.
88
0.00
0.
65
0.00
0.
00
0.00
0.
00
11
Guj
arat
Tha
kor a
nd K
oli V
ikas
N
igam
Lim
ited
1.35
0.30
0.
00
0.42
0.
00
0.42
8.
00
14.6
6 0.
00
0.00
0.
00
0.00
Ann
exur
e 3
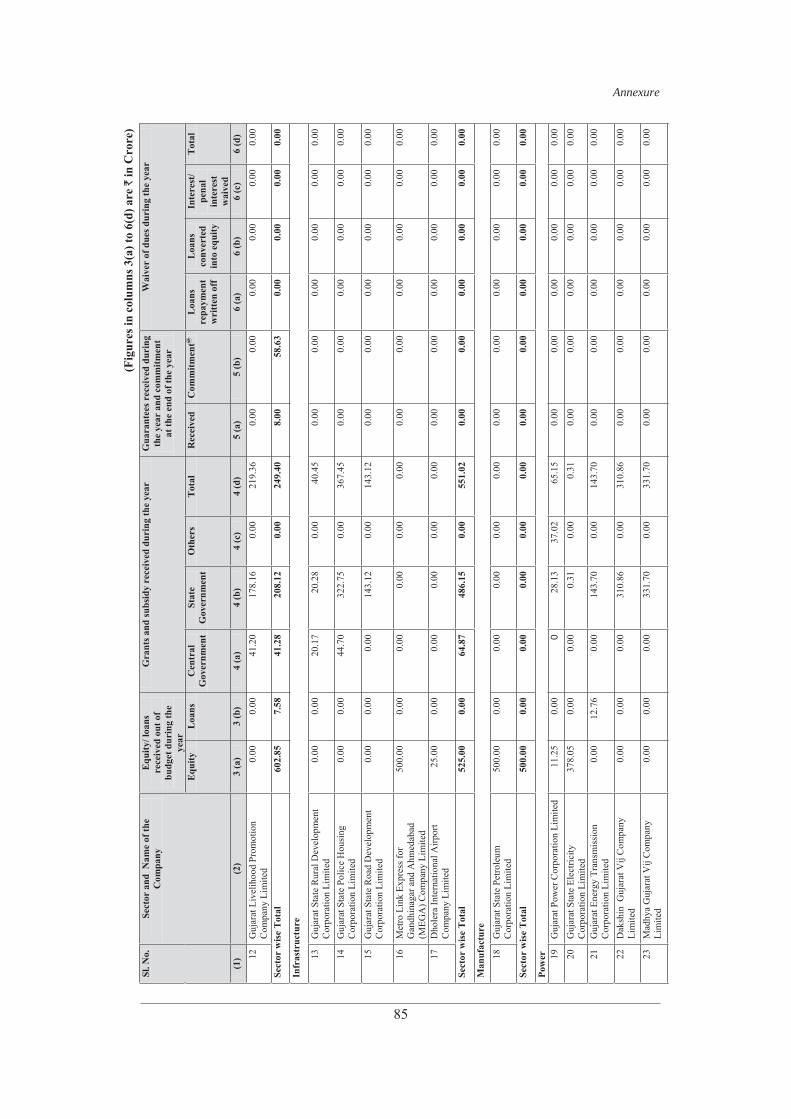
Annexure
85
(Fig
ures
in c
olum
ns 3
(a) t
o 6(
d) a
re `
in C
rore
) Sl
. No.
Se
ctor
and
Nam
e of
the
Com
pany
E
quity
/ loa
ns
rece
ived
out
of
budg
et d
urin
g th
e ye
ar
Gra
nts a
nd su
bsid
y re
ceiv
ed d
urin
g th
e ye
ar
Gua
rant
ees r
ecei
ved
duri
ng
the
year
and
com
mitm
ent
at th
e en
d of
the
year
Wai
ver
of d
ues d
urin
g th
e ye
ar
Equ
ityL
oans
Cen
tral
Gov
ernm
ent
Stat
eG
over
nmen
t O
ther
sT
otal
Rec
eive
d C
omm
itmen
t@L
oans
repa
ymen
t w
ritt
en o
ff
Loa
nsco
nver
ted
into
equ
ity
Inte
rest
/ pe
nal
inte
rest
wai
ved
Tot
al
(1)
(2)
3 (a
) 3
(b)
4 (a
) 4
(b)
4 (c
) 4
(d)
5 (a
) 5
(b)
6 (a
) 6
(b)
6 (c
) 6
(d)
12
Guj
arat
Liv
elih
ood
Prom
otio
n C
ompa
ny L
imite
d 0.
000.
00
41.2
0 17
8.16
0.
00
219.
36
0.00
0.
00
0.00
0.
00
0.00
0.
00
Sect
or w
ise
Tot
al
602.
857.
58
41.2
8 20
8.12
0.
00
249.
40
8.00
58
.63
0.00
0.
00
0.00
0.
00
Infr
astr
uctu
re
13
Guj
arat
Sta
te R
ural
Dev
elop
men
t C
orpo
ratio
n Li
mite
d 0.
000.
00
20.1
7 20
.28
0.00
40
.45
0.00
0.
00
0.00
0.
00
0.00
0.
00
14
Guj
arat
Sta
te P
olic
e H
ousi
ng
Cor
pora
tion
Lim
ited
0.00
0.00
44
.70
322.
75
0.00
36
7.45
0.
00
0.00
0.
00
0.00
0.
00
0.00
15
Guj
arat
Sta
te R
oad
Dev
elop
men
t C
orpo
ratio
n Li
mite
d 0.
000.
00
0.00
14
3.12
0.
00
143.
12
0.00
0.
00
0.00
0.
00
0.00
0.
00
16
Met
ro L
ink
Expr
ess f
or
Gan
dhin
agar
and
Ahm
edab
ad
(MEG
A) C
ompa
ny L
imite
d
500.
000.
00
0.00
0.
00
0.00
0.
00
0.00
0.
00
0.00
0.
00
0.00
0.
00
17
Dho
lera
Inte
rnat
iona
l Airp
ort
Com
pany
Lim
ited
25.0
00.
00
0.00
0.
00
0.00
0.
00
0.00
0.
00
0.00
0.
00
0.00
0.
00
Sect
or w
ise
Tot
al
525.
000.
00
64.8
7 48
6.15
0.
00
551.
02
0.00
0.
00
0.00
0.
00
0.00
0.
00
Man
ufac
ture
18
G
ujar
at S
tate
Pet
role
um
Cor
pora
tion
Lim
ited
500.
000.
00
0.00
0.
00
0.00
0.
00
0.00
0.
00
0.00
0.
00
0.00
0.
00
Sect
or w
ise
Tot
al
500.
000.
00
0.00
0.
00
0.00
0.
00
0.00
0.
00
0.00
0.
00
0.00
0.
00
Pow
er
19
Guj
arat
Pow
er C
orpo
ratio
n Li
mite
d 11
.25
0.00
028
.13
37.0
2 65
.15
0.00
0.
00
0.00
0.
00
0.00
0.
00
20
Guj
arat
Sta
te E
lect
ricity
C
orpo
ratio
n Li
mite
d 37
8.05
0.00
0.
00
0.31
0.
00
0.31
0.
00
0.00
0.
00
0.00
0.
00
0.00
21
Guj
arat
Ene
rgy
Tran
smis
sion
C
orpo
ratio
n Li
mite
d 0.
0012
.76
0.00
14
3.70
0.
00
143.
70
0.00
0.
00
0.00
0.
00
0.00
0.
00
22
Dak
shin
Guj
arat
Vij
Com
pany
Li
mite
d 0.
000.
00
0.00
31
0.86
0.
00
310.
86
0.00
0.
00
0.00
0.
00
0.00
0.
00
23
Mad
hya
Guj
arat
Vij
Com
pany
Li
mite
d 0.
000.
00
0.00
33
1.70
0.
00
331.
70
0.00
0.
00
0.00
0.
00
0.00
0.
00
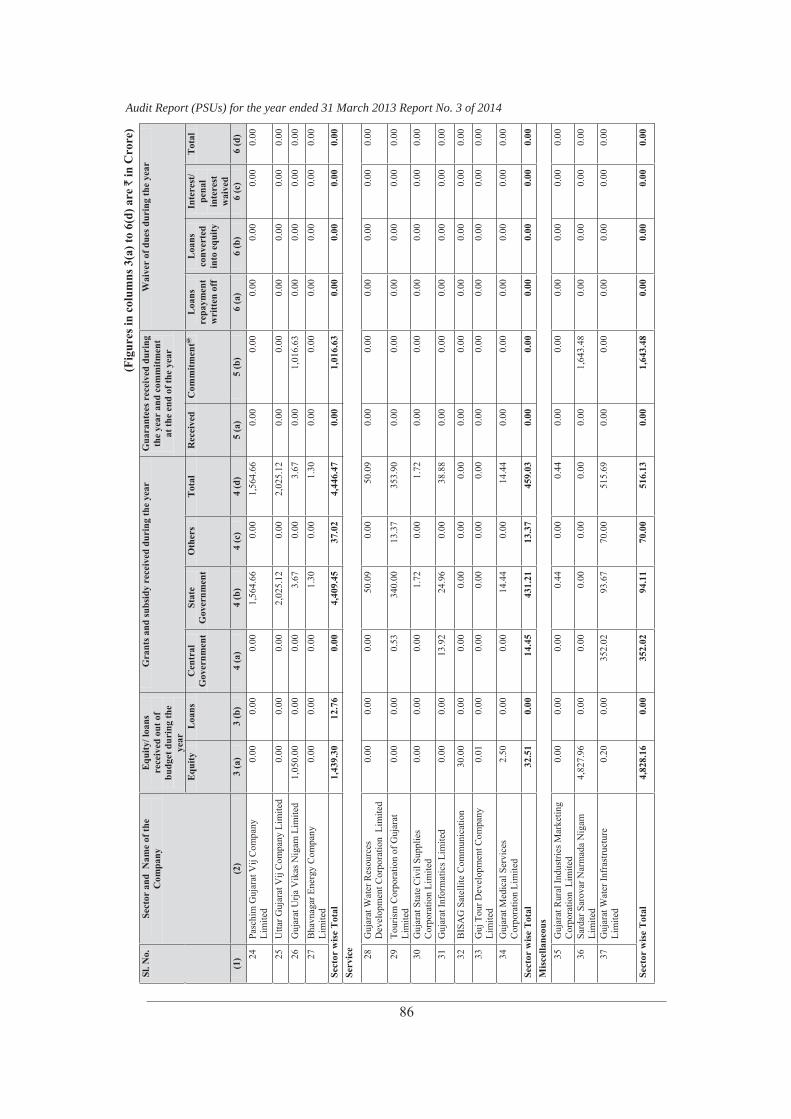
Audit Report (PSUs) for the year ended 31 March 2013 Report No. 3 of 2014
86
(Fig
ures
in c
olum
ns 3
(a) t
o 6(
d) a
re `
in C
rore
) Sl
. No.
Se
ctor
and
Nam
e of
the
Com
pany
E
quity
/ loa
ns
rece
ived
out
of
budg
et d
urin
g th
e ye
ar
Gra
nts a
nd su
bsid
y re
ceiv
ed d
urin
g th
e ye
ar
Gua
rant
ees r
ecei
ved
duri
ng
the
year
and
com
mitm
ent
at th
e en
d of
the
year
Wai
ver
of d
ues d
urin
g th
e ye
ar
Equ
ityL
oans
Cen
tral
Gov
ernm
ent
Stat
eG
over
nmen
t O
ther
sT
otal
Rec
eive
d C
omm
itmen
t@L
oans
repa
ymen
t w
ritt
en o
ff
Loa
nsco
nver
ted
into
equ
ity
Inte
rest
/ pe
nal
inte
rest
wai
ved
Tot
al
(1)
(2)
3 (a
) 3
(b)
4 (a
) 4
(b)
4 (c
) 4
(d)
5 (a
) 5
(b)
6 (a
) 6
(b)
6 (c
) 6
(d)
24
Pasc
him
Guj
arat
Vij
Com
pany
Li
mite
d 0.
000.
00
0.00
1,
564.
66
0.00
1,
564.
66
0.00
0.
00
0.00
0.
00
0.00
0.
00
25
Utta
r Guj
arat
Vij
Com
pany
Lim
ited
0.00
0.00
0.
00
2,02
5.12
0.
00
2,02
5.12
0.
00
0.00
0.
00
0.00
0.
00
0.00
26
Guj
arat
Urja
Vik
as N
igam
Lim
ited
1,05
0.00
0.00
0.
00
3.67
0.
00
3.67
0.
00
1,01
6.63
0.
00
0.00
0.
00
0.00
27
Bha
vnag
ar E
nerg
y C
ompa
ny
Lim
ited
0.00
0.00
0.
00
1.30
0.
00
1.30
0.
00
0.00
0.
00
0.00
0.
00
0.00
Sect
or w
ise
Tot
al
1,43
9.30
12.7
6 0.
00
4,40
9.45
37
.02
4,44
6.47
0.
00
1,01
6.63
0.
00
0.00
0.
00
0.00
Se
rvic
e
28
Guj
arat
Wat
er R
esou
rces
D
evel
opm
ent C
orpo
ratio
n L
imite
d 0.
000.
00
0.00
50
.09
0.00
50
.09
0.00
0.
00
0.00
0.
00
0.00
0.
00
29
Tour
ism
Cor
pora
tion
of G
ujar
at
Lim
ited
0.00
0.00
0.
53
340.
00
13.3
7 35
3.90
0.
00
0.00
0.
00
0.00
0.
00
0.00
30
Guj
arat
Sta
te C
ivil
Supp
lies
Cor
pora
tion
Lim
ited
0.00
0.00
0.
00
1.72
0.
00
1.72
0.
00
0.00
0.
00
0.00
0.
00
0.00
31
Guj
arat
Info
rmat
ics L
imite
d 0.
000.
00
13.9
2 24
.96
0.00
38
.88
0.00
0.
00
0.00
0.
00
0.00
0.
00
32
BIS
AG
Sat
ellit
e C
omm
unic
atio
n 30
.00
0.00
0.
00
0.00
0.
00
0.00
0.
00
0.00
0.
00
0.00
0.
00
0.00
33
Guj
Tou
r Dev
elop
men
t Com
pany
Li
mite
d 0.
010.
00
0.00
0.
00
0.00
0.
00
0.00
0.
00
0.00
0.
00
0.00
0.
00
34
Guj
arat
Med
ical
Ser
vice
s C
orpo
ratio
n Li
mite
d 2.
500.
00
0.00
14
.44
0.00
14
.44
0.00
0.
00
0.00
0.
00
0.00
0.
00
Sect
or w
ise
Tot
al
32.5
10.
00
14.4
5 43
1.21
13
.37
459.
03
0.00
0.
00
0.00
0.
00
0.00
0.
00
Mis
cella
neou
s35
G
ujar
at R
ural
Indu
strie
s Mar
ketin
g C
orpo
ratio
n L
imite
d 0.
000.
00
0.00
0.
44
0.00
0.
44
0.00
0.
00
0.00
0.
00
0.00
0.
00
36
Sard
ar S
arov
ar N
arm
ada
Nig
am
Lim
ited
4,82
7.96
0.00
0.
00
0.00
0.
00
0.00
0.
00
1,64
3.48
0.
00
0.00
0.
00
0.00
37
Guj
arat
Wat
er In
fras
truct
ure
Lim
ited
0.20
0.00
35
2.02
93
.67
70.0
0 51
5.69
0.
00
0.00
0.
00
0.00
0.
00
0.00
Sect
or w
ise
Tot
al
4,82
8.16
0.00
35
2.02
94
.11
70.0
0 51
6.13
0.
00
1,64
3.48
0.
00
0.00
0.
00
0.00
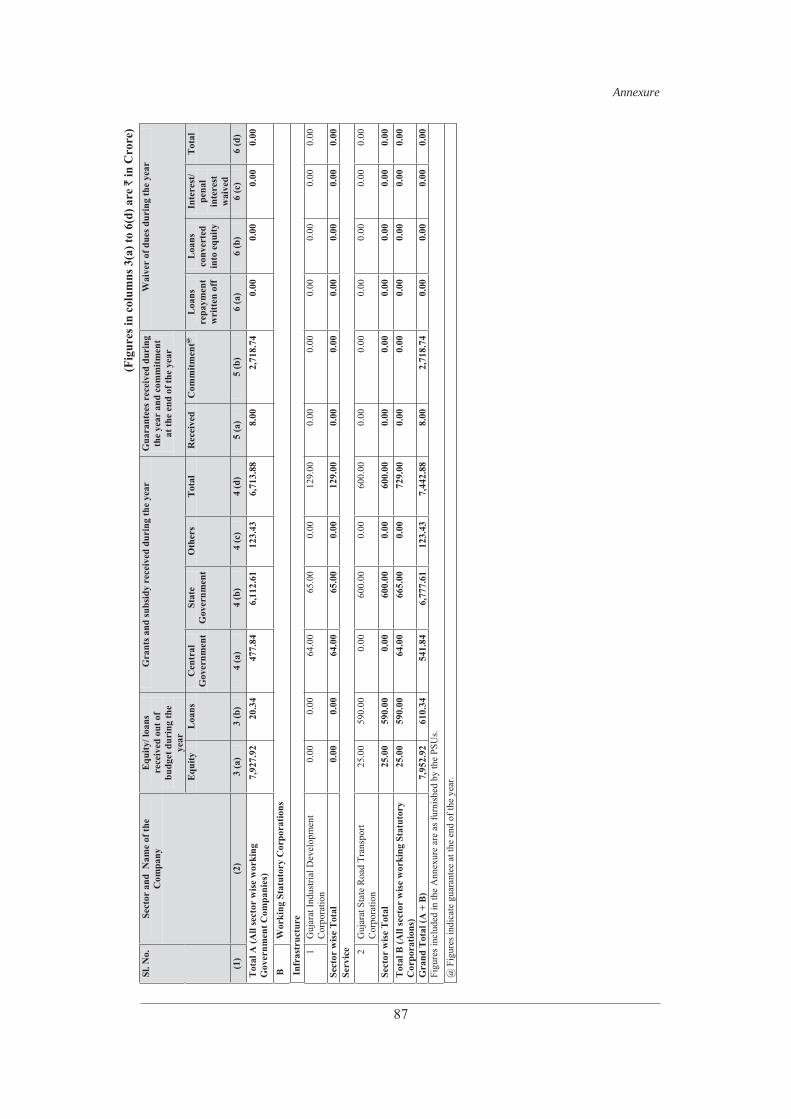
Annexure
87
(Fig
ures
in c
olum
ns 3
(a) t
o 6(
d) a
re `
in C
rore
) Sl
. No.
Se
ctor
and
Nam
e of
the
Com
pany
E
quity
/ loa
ns
rece
ived
out
of
budg
et d
urin
g th
e ye
ar
Gra
nts a
nd su
bsid
y re
ceiv
ed d
urin
g th
e ye
ar
Gua
rant
ees r
ecei
ved
duri
ng
the
year
and
com
mitm
ent
at th
e en
d of
the
year
Wai
ver
of d
ues d
urin
g th
e ye
ar
Equ
ityL
oans
Cen
tral
Gov
ernm
ent
Stat
eG
over
nmen
t O
ther
sT
otal
Rec
eive
d C
omm
itmen
t@L
oans
repa
ymen
t w
ritt
en o
ff
Loa
nsco
nver
ted
into
equ
ity
Inte
rest
/ pe
nal
inte
rest
wai
ved
Tot
al
(1)
(2)
3 (a
) 3
(b)
4 (a
) 4
(b)
4 (c
) 4
(d)
5 (a
) 5
(b)
6 (a
) 6
(b)
6 (c
) 6
(d)
Tot
al A
(All
sect
or w
ise
wor
king
G
over
nmen
t Com
pani
es)
7,92
7.92
20
.34
477.
84
6,11
2.61
12
3.43
6,
713.
88
8.00
2,
718.
74
0.00
0.
00
0.00
0.
00
B
Wor
king
Sta
tuto
ry C
orpo
ratio
ns
Infr
astr
uctu
re
1 G
ujar
at In
dust
rial D
evel
opm
ent
Cor
pora
tion
0.00
0.00
64
.00
65.0
0 0.
00
129.
00
0.00
0.
00
0.00
0.
00
0.00
0.
00
Sect
or w
ise
Tot
al
0.00
0.00
64
.00
65.0
0 0.
00
129.
00
0.00
0.
00
0.00
0.
00
0.00
0.
00
Serv
ice 2
Guj
arat
Sta
te R
oad
Tran
spor
t C
orpo
ratio
n25
.00
590.
00
0.00
60
0.00
0.
00
600.
00
0.00
0.
00
0.00
0.
00
0.00
0.
00
Sect
or w
ise
Tot
al
25.0
059
0.00
0.
00
600.
00
0.00
60
0.00
0.
00
0.00
0.
00
0.00
0.
00
0.00
T
otal
B (A
ll se
ctor
wis
e w
orki
ng S
tatu
tory
C
orpo
ratio
ns)
25.0
059
0.00
64
.00
665.
00
0.00
72
9.00
0.
00
0.00
0.
00
0.00
0.
00
0.00
Gra
nd T
otal
(A +
B)
7,95
2.92
61
0.34
54
1.84
6,
777.
61
123.
43
7,44
2.88
8.
00
2,71
8.74
0.
00
0.00
0.
00
0.00
Fi
gure
s inc
lude
d in
the
Ann
exur
e ar
e as
furn
ishe
d by
the
PSU
s.
@ F
igur
es in
dica
te g
uara
ntee
at t
he e
nd o
f the
yea
r.
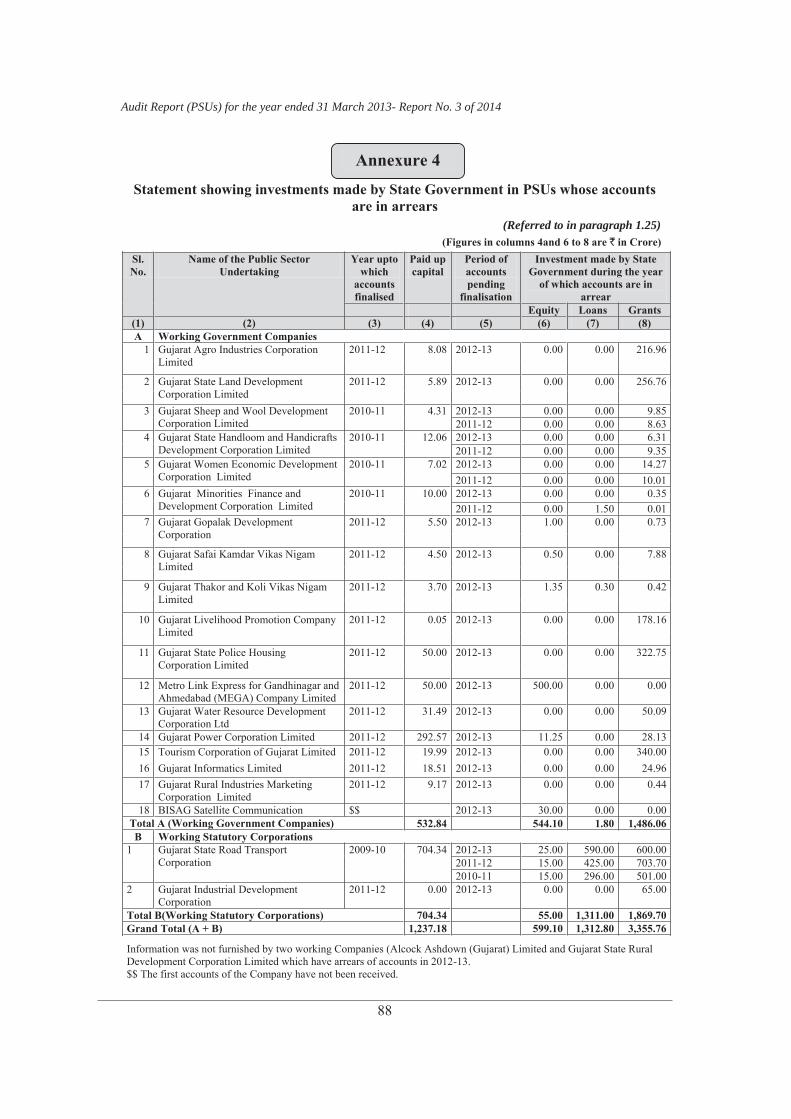
Audit Report (PSUs) for the year ended 31 March 2013- Report No. 3 of 2014
88
Statement showing investments made by State Government in PSUs whose accounts are in arrears
(Referred to in paragraph 1.25) (Figures in columns 4and 6 to 8 are ` in Crore)
Sl.No.
Name of the Public Sector Undertaking
Year upto which
accountsfinalised
Paid up capital
Period of accountspending
finalisation
Investment made by State Government during the year
of which accounts are in arrear
Equity Loans Grants(1) (2) (3) (4) (5) (6) (7) (8)A Working Government Companies
1 Gujarat Agro Industries Corporation Limited
2011-12 8.08 2012-13 0.00 0.00 216.96
2 Gujarat State Land Development Corporation Limited
2011-12 5.89 2012-13 0.00 0.00 256.76
3 Gujarat Sheep and Wool Development Corporation Limited
2010-11 4.31 2012-13 0.00 0.00 9.85 2011-12 0.00 0.00 8.63
4 Gujarat State Handloom and Handicrafts Development Corporation Limited
2010-11 12.06 2012-13 0.00 0.00 6.31 2011-12 0.00 0.00 9.35
5 Gujarat Women Economic Development Corporation Limited
2010-11 7.02 2012-13 0.00 0.00 14.27 2011-12 0.00 0.00 10.01
6 Gujarat Minorities Finance and Development Corporation Limited
2010-11 10.00 2012-13 0.00 0.00 0.35 2011-12 0.00 1.50 0.01
7 Gujarat Gopalak Development Corporation
2011-12 5.50 2012-13 1.00 0.00 0.73
8 Gujarat Safai Kamdar Vikas Nigam Limited
2011-12 4.50 2012-13 0.50 0.00 7.88
9 Gujarat Thakor and Koli Vikas Nigam Limited
2011-12 3.70 2012-13 1.35 0.30 0.42
10 Gujarat Livelihood Promotion Company Limited
2011-12 0.05 2012-13 0.00 0.00 178.16
11 Gujarat State Police Housing Corporation Limited
2011-12 50.00 2012-13 0.00 0.00 322.75
12 Metro Link Express for Gandhinagar and Ahmedabad (MEGA) Company Limited
2011-12 50.00 2012-13 500.00 0.00 0.00
13 Gujarat Water Resource Development Corporation Ltd
2011-12 31.49 2012-13 0.00 0.00 50.09
14 Gujarat Power Corporation Limited 2011-12 292.57 2012-13 11.25 0.00 28.13 15 Tourism Corporation of Gujarat Limited 2011-12 19.99 2012-13 0.00 0.00 340.00 16 Gujarat Informatics Limited 2011-12 18.51 2012-13 0.00 0.00 24.96 17 Gujarat Rural Industries Marketing
Corporation Limited 2011-12 9.17 2012-13 0.00 0.00 0.44
18 BISAG Satellite Communication $$ 2012-13 30.00 0.00 0.00 Total A (Working Government Companies) 532.84 544.10 1.80 1,486.06 B Working Statutory Corporations
1 Gujarat State Road Transport Corporation
2009-10 704.34 2012-13 25.00 590.00 600.00 2011-12 15.00 425.00 703.70 2010-11 15.00 296.00 501.00
2 Gujarat Industrial Development Corporation
2011-12 0.00 2012-13 0.00 0.00 65.00
Total B(Working Statutory Corporations) 704.34 55.00 1,311.00 1,869.70 Grand Total (A + B) 1,237.18 599.10 1,312.80 3,355.76
Information was not furnished by two working Companies (Alcock Ashdown (Gujarat) Limited and Gujarat State Rural Development Corporation Limited which have arrears of accounts in 2012-13. $$ The first accounts of the Company have not been received.
Annexure 4
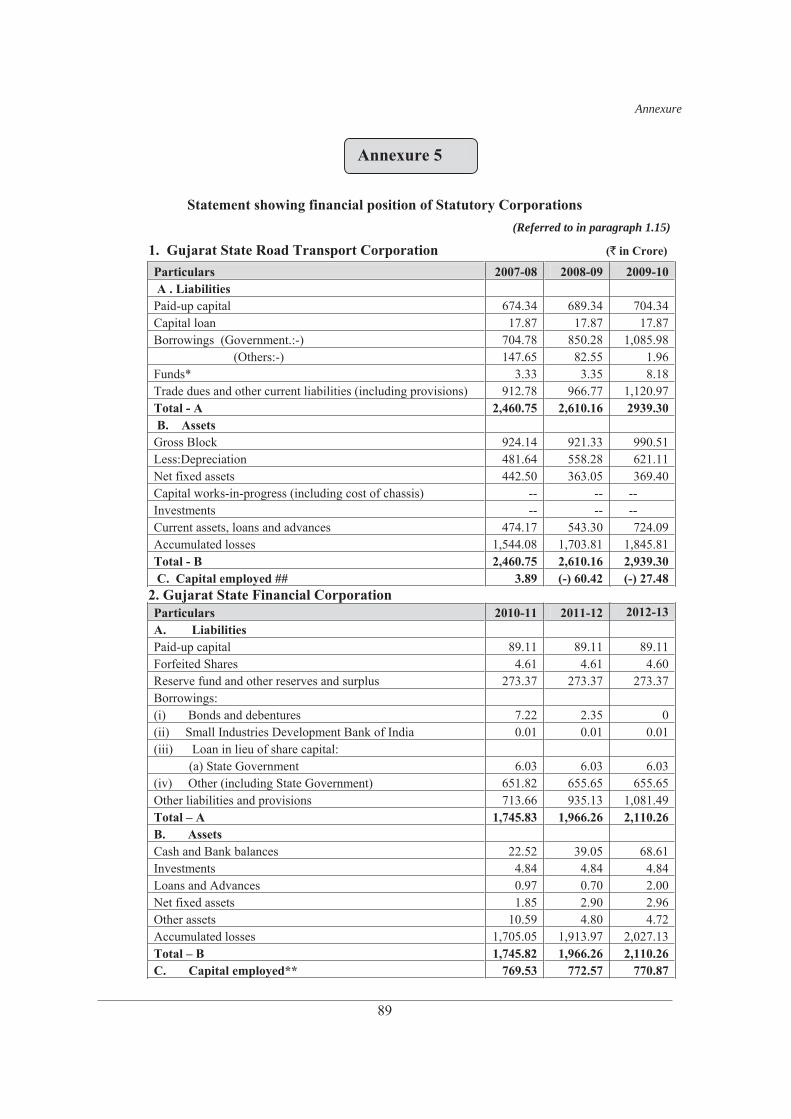
89
Annexure
Statement showing financial position of Statutory Corporations (Referred to in paragraph 1.15)
1. Gujarat State Road Transport Corporation (` in Crore)
Particulars 2007-08 2008-09 2009-10 A . LiabilitiesPaid-up capital 674.34 689.34 704.34Capital loan 17.87 17.87 17.87Borrowings (Government.:-) 704.78 850.28 1,085.98 (Others:-) 147.65 82.55 1.96Funds* 3.33 3.35 8.18Trade dues and other current liabilities (including provisions) 912.78 966.77 1,120.97Total - A 2,460.75 2,610.16 2939.30 B. AssetsGross Block 924.14 921.33 990.51Less:Depreciation 481.64 558.28 621.11Net fixed assets 442.50 363.05 369.40Capital works-in-progress (including cost of chassis) -- -- -- Investments -- -- -- Current assets, loans and advances 474.17 543.30 724.09Accumulated losses 1,544.08 1,703.81 1,845.81Total - B 2,460.75 2,610.16 2,939.30 C. Capital employed ## 3.89 (-) 60.42 (-) 27.48
2. Gujarat State Financial CorporationParticulars 2010-11 2011-12 2012-13 A. Liabilities Paid-up capital 89.11 89.11 89.11Forfeited Shares 4.61 4.61 4.60Reserve fund and other reserves and surplus 273.37 273.37 273.37Borrowings:(i) Bonds and debentures 7.22 2.35 0(ii) Small Industries Development Bank of India 0.01 0.01 0.01(iii) Loan in lieu of share capital: (a) State Government 6.03 6.03 6.03(iv) Other (including State Government) 651.82 655.65 655.65Other liabilities and provisions 713.66 935.13 1,081.49Total A 1,745.83 1,966.26 2,110.26B. Assets Cash and Bank balances 22.52 39.05 68.61Investments 4.84 4.84 4.84Loans and Advances 0.97 0.70 2.00Net fixed assets 1.85 2.90 2.96Other assets 10.59 4.80 4.72Accumulated losses 1,705.05 1,913.97 2,027.13Total B 1,745.82 1,966.26 2,110.26C. Capital employed** 769.53 772.57 770.87
Annexure 5
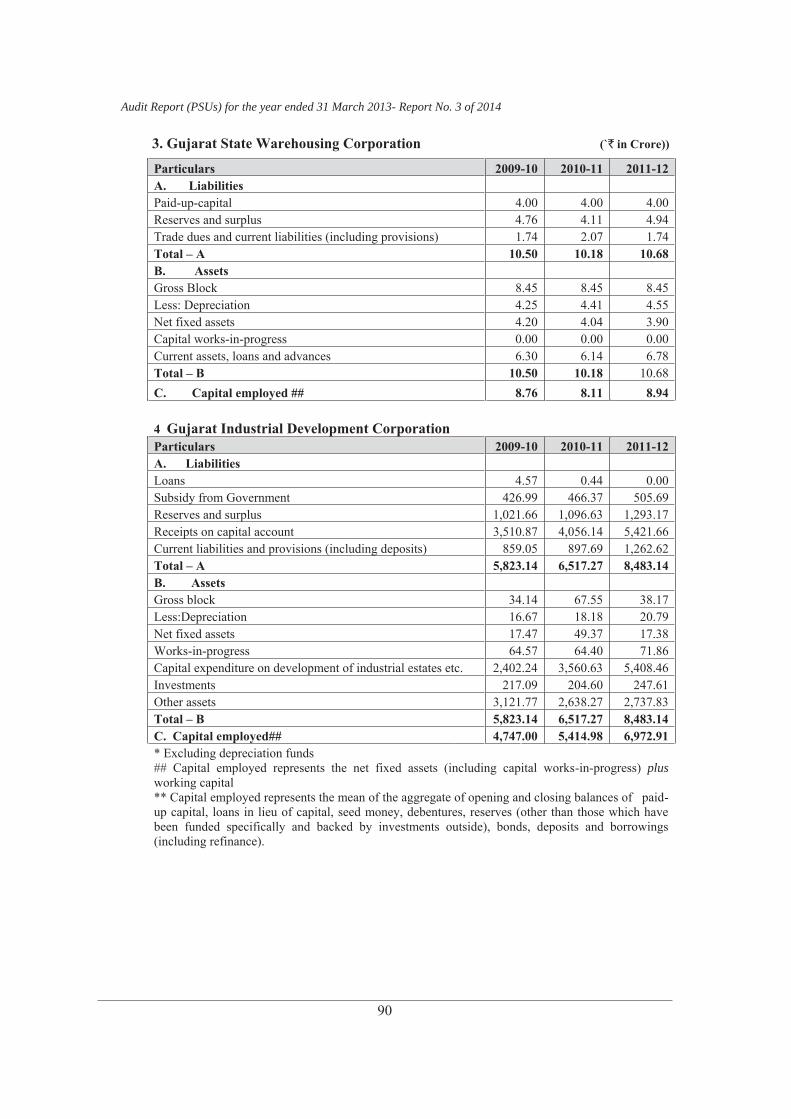
Audit Report (PSUs) for the year ended 31 March 2013- Report No. 3 of 2014
90
3. Gujarat State Warehousing Corporation (`` in Crore))
Particulars 2009-10 2010-11 2011-12 A. Liabilities Paid-up-capital 4.00 4.00 4.00 Reserves and surplus 4.76 4.11 4.94 Trade dues and current liabilities (including provisions) 1.74 2.07 1.74 Total A 10.50 10.18 10.68 B. Assets Gross Block 8.45 8.45 8.45 Less: Depreciation 4.25 4.41 4.55 Net fixed assets 4.20 4.04 3.90 Capital works-in-progress 0.00 0.00 0.00 Current assets, loans and advances 6.30 6.14 6.78 Total B 10.50 10.18 10.68C. Capital employed ## 8.76 8.11 8.94 4 Gujarat Industrial Development CorporationParticulars 2009-10 2010-11 2011-12 A. Liabilities Loans 4.57 0.44 0.00 Subsidy from Government 426.99 466.37 505.69 Reserves and surplus 1,021.66 1,096.63 1,293.17 Receipts on capital account 3,510.87 4,056.14 5,421.66 Current liabilities and provisions (including deposits) 859.05 897.69 1,262.62 Total A 5,823.14 6,517.27 8,483.14 B. Assets Gross block 34.14 67.55 38.17 Less:Depreciation 16.67 18.18 20.79 Net fixed assets 17.47 49.37 17.38 Works-in-progress 64.57 64.40 71.86 Capital expenditure on development of industrial estates etc. 2,402.24 3,560.63 5,408.46 Investments 217.09 204.60 247.61 Other assets 3,121.77 2,638.27 2,737.83 Total B 5,823.14 6,517.27 8,483.14 C. Capital employed## 4,747.00 5,414.98 6,972.91 * Excluding depreciation funds ## Capital employed represents the net fixed assets (including capital works-in-progress) plusworking capital ** Capital employed represents the mean of the aggregate of opening and closing balances of paid-up capital, loans in lieu of capital, seed money, debentures, reserves (other than those which have been funded specifically and backed by investments outside), bonds, deposits and borrowings (including refinance).
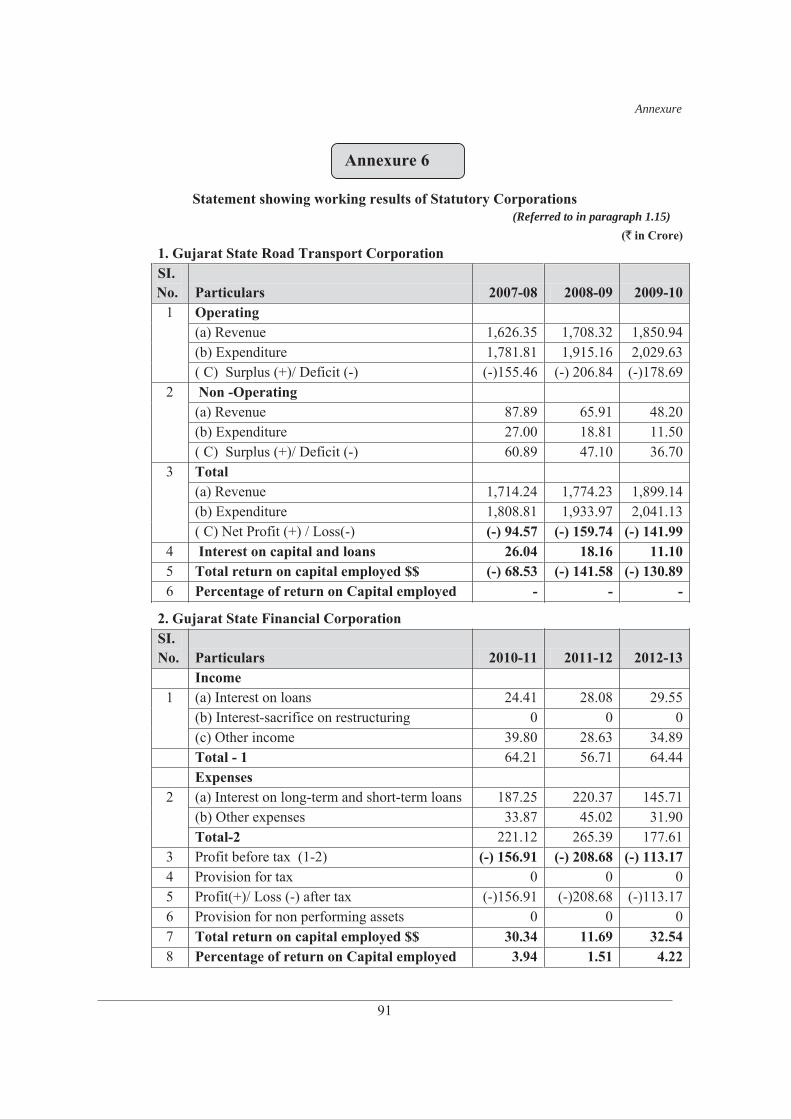
91
Annexure
Statement showing working results of Statutory Corporations (Referred to in paragraph 1.15)
(` in Crore) 1. Gujarat State Road Transport Corporation SI.No. Particulars 2007-08 2008-09 2009-10
1 Operating(a) Revenue 1,626.35 1,708.32 1,850.94 (b) Expenditure 1,781.81 1,915.16 2,029.63 ( C) Surplus (+)/ Deficit (-) (-)155.46 (-) 206.84 (-)178.69
2 Non -Operating(a) Revenue 87.89 65.91 48.20 (b) Expenditure 27.00 18.81 11.50 ( C) Surplus (+)/ Deficit (-) 60.89 47.10 36.70
3 Total(a) Revenue 1,714.24 1,774.23 1,899.14 (b) Expenditure 1,808.81 1,933.97 2,041.13 ( C) Net Profit (+) / Loss(-) (-) 94.57 (-) 159.74 (-) 141.99
4 Interest on capital and loans 26.04 18.16 11.10 5 Total return on capital employed $$ (-) 68.53 (-) 141.58 (-) 130.89 6 Percentage of return on Capital employed - - -
2. Gujarat State Financial CorporationSI.No. Particulars 2010-11 2011-12 2012-13
Income1 (a) Interest on loans 24.41 28.08 29.55
(b) Interest-sacrifice on restructuring 0 0 0 (c) Other income 39.80 28.63 34.89 Total - 1 64.21 56.71 64.44 Expenses
2 (a) Interest on long-term and short-term loans 187.25 220.37 145.71 (b) Other expenses 33.87 45.02 31.90 Total-2 221.12 265.39 177.61
3 Profit before tax (1-2) (-) 156.91 (-) 208.68 (-) 113.17 4 Provision for tax 0 0 0 5 Profit(+)/ Loss (-) after tax (-)156.91 (-)208.68 (-)113.17 6 Provision for non performing assets 0 0 0 7 Total return on capital employed $$ 30.34 11.69 32.54 8 Percentage of return on Capital employed 3.94 1.51 4.22
Annexure 6
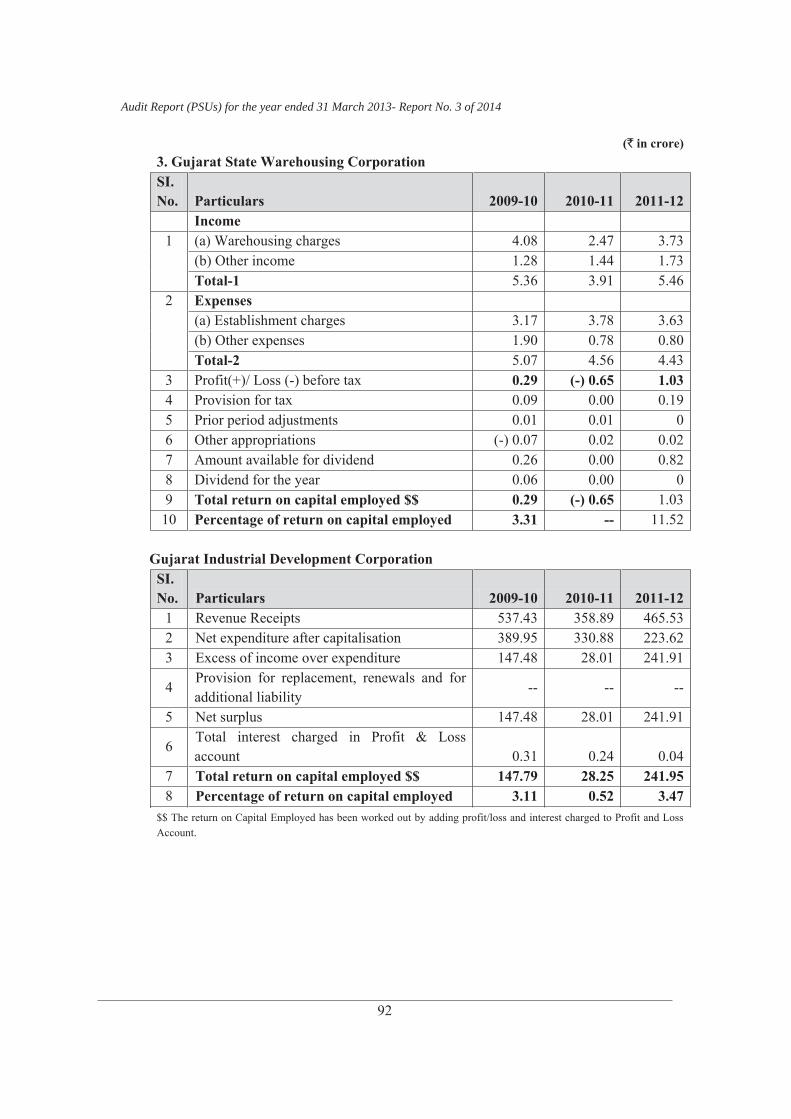
Audit Report (PSUs) for the year ended 31 March 2013- Report No. 3 of 2014
92
(` in crore)3. Gujarat State Warehousing CorporationSI.No. Particulars 2009-10 2010-11 2011-12
Income1 (a) Warehousing charges 4.08 2.47 3.73
(b) Other income 1.28 1.44 1.73 Total-1 5.36 3.91 5.46
2 Expenses(a) Establishment charges 3.17 3.78 3.63 (b) Other expenses 1.90 0.78 0.80 Total-2 5.07 4.56 4.43
3 Profit(+)/ Loss (-) before tax 0.29 (-) 0.65 1.03 4 Provision for tax 0.09 0.00 0.19 5 Prior period adjustments 0.01 0.01 0 6 Other appropriations (-) 0.07 0.02 0.02 7 Amount available for dividend 0.26 0.00 0.82 8 Dividend for the year 0.06 0.00 0 9 Total return on capital employed $$ 0.29 (-) 0.65 1.03
10 Percentage of return on capital employed 3.31 -- 11.52
Gujarat Industrial Development Corporation SI.No. Particulars 2009-10 2010-11 2011-12
1 Revenue Receipts 537.43 358.89 465.53 2 Net expenditure after capitalisation 389.95 330.88 223.62 3 Excess of income over expenditure 147.48 28.01 241.91
4Provision for replacement, renewals and for additional liability
-- -- --
5 Net surplus 147.48 28.01 241.91
6Total interest charged in Profit & Loss account 0.31 0.24 0.04
7 Total return on capital employed $$ 147.79 28.25 241.95 8 Percentage of return on capital employed 3.11 0.52 3.47
$$ The return on Capital Employed has been worked out by adding profit/loss and interest charged to Profit and Loss Account.
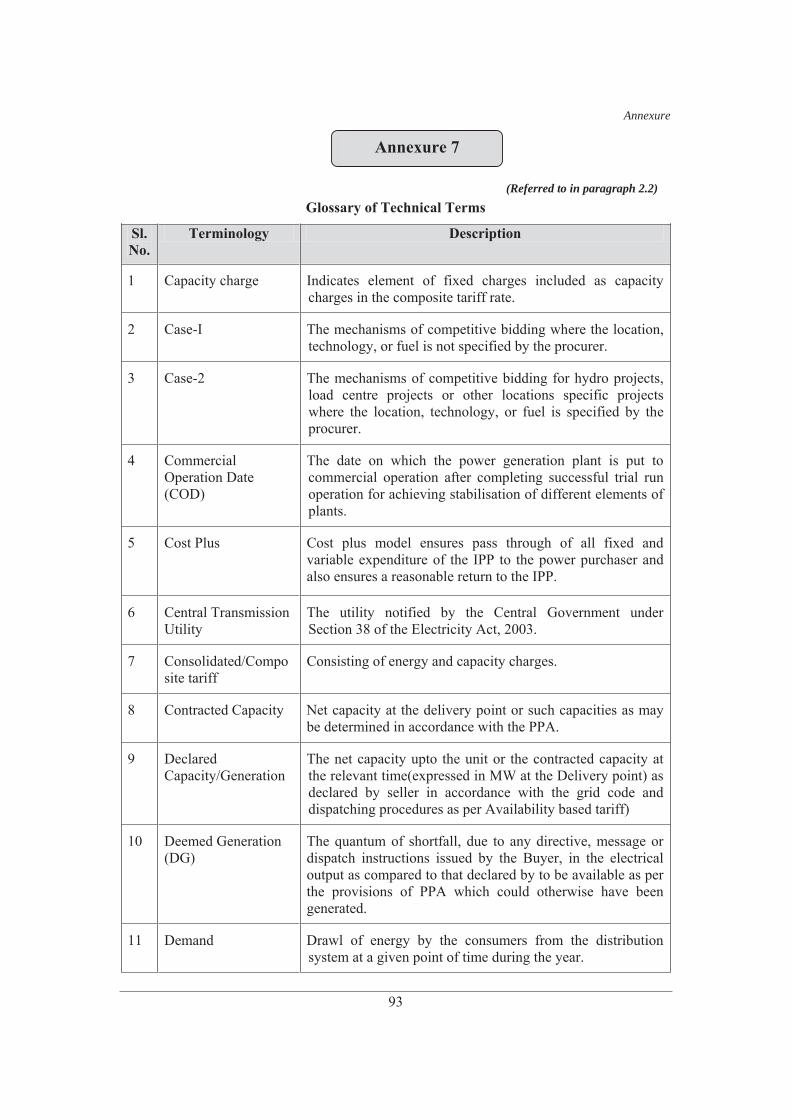
Annexure
93
(Referred to in paragraph 2.2) Glossary of Technical Terms
Sl.No.
Terminology Description
1 Capacity charge Indicates element of fixed charges included as capacity charges in the composite tariff rate.
2 Case-I The mechanisms of competitive bidding where the location, technology, or fuel is not specified by the procurer.
3 Case-2 The mechanisms of competitive bidding for hydro projects, load centre projects or other locations specific projects where the location, technology, or fuel is specified by the procurer.
4 Commercial Operation Date (COD)
The date on which the power generation plant is put to commercial operation after completing successful trial run operation for achieving stabilisation of different elements of plants.
5 Cost Plus Cost plus model ensures pass through of all fixed and variable expenditure of the IPP to the power purchaser and also ensures a reasonable return to the IPP.
6 Central Transmission Utility
The utility notified by the Central Government under Section 38 of the Electricity Act, 2003.
7 Consolidated/Composite tariff
Consisting of energy and capacity charges.
8 Contracted Capacity Net capacity at the delivery point or such capacities as may be determined in accordance with the PPA.
9 Declared Capacity/Generation
The net capacity upto the unit or the contracted capacity at the relevant time(expressed in MW at the Delivery point) as declared by seller in accordance with the grid code and dispatching procedures as per Availability based tariff)
10 Deemed Generation (DG)
The quantum of shortfall, due to any directive, message or dispatch instructions issued by the Buyer, in the electrical output as compared to that declared by to be available as per the provisions of PPA which could otherwise have been generated.
11 Demand Drawl of energy by the consumers from the distribution system at a given point of time during the year.
Annexure 7
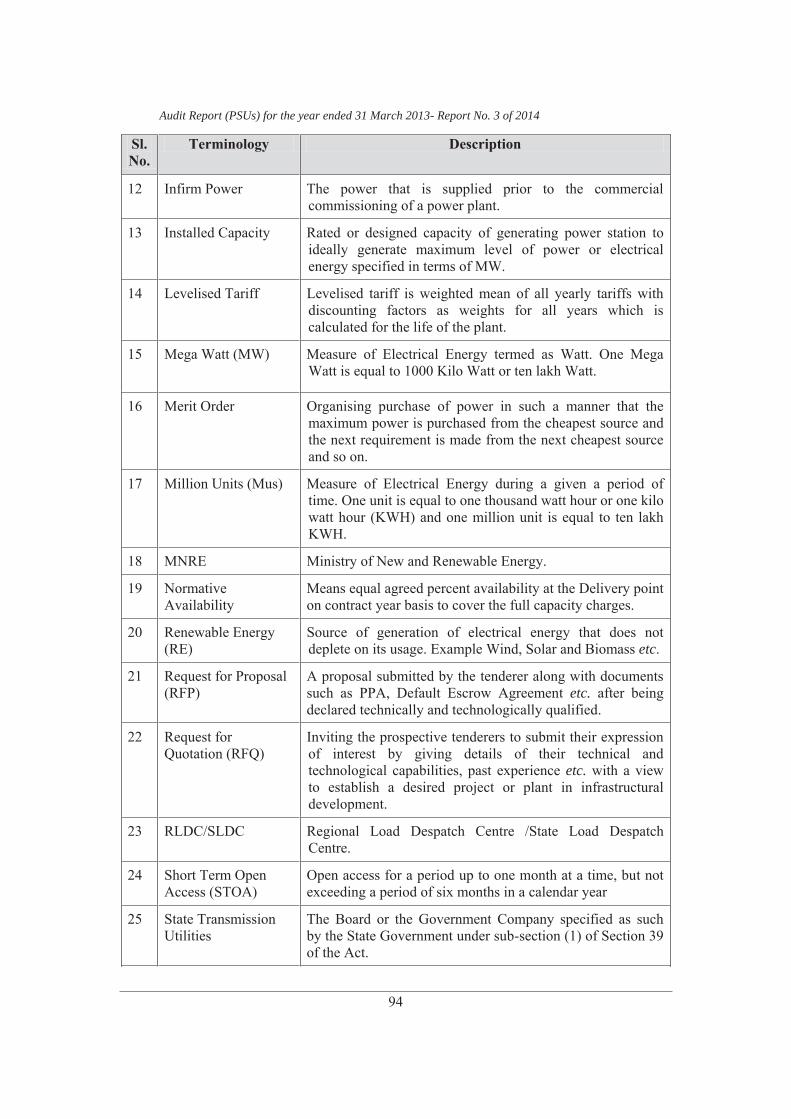
Audit Report (PSUs) for the year ended 31 March 2013- Report No. 3 of 2014
94
Sl.No.
Terminology Description
12 Infirm Power The power that is supplied prior to the commercial commissioning of a power plant.
13 Installed Capacity Rated or designed capacity of generating power station to ideally generate maximum level of power or electrical energy specified in terms of MW.
14 Levelised Tariff Levelised tariff is weighted mean of all yearly tariffs with discounting factors as weights for all years which is calculated for the life of the plant.
15 Mega Watt (MW) Measure of Electrical Energy termed as Watt. One Mega Watt is equal to 1000 Kilo Watt or ten lakh Watt.
16 Merit Order Organising purchase of power in such a manner that the maximum power is purchased from the cheapest source and the next requirement is made from the next cheapest source and so on.
17 Million Units (Mus) Measure of Electrical Energy during a given a period of time. One unit is equal to one thousand watt hour or one kilo watt hour (KWH) and one million unit is equal to ten lakh KWH.
18 MNRE Ministry of New and Renewable Energy.
19 Normative Availability
Means equal agreed percent availability at the Delivery point on contract year basis to cover the full capacity charges.
20 Renewable Energy (RE)
Source of generation of electrical energy that does not deplete on its usage. Example Wind, Solar and Biomass etc.
21 Request for Proposal (RFP)
A proposal submitted by the tenderer along with documents such as PPA, Default Escrow Agreement etc. after being declared technically and technologically qualified.
22 Request for Quotation (RFQ)
Inviting the prospective tenderers to submit their expression of interest by giving details of their technical and technological capabilities, past experience etc. with a view to establish a desired project or plant in infrastructural development.
23 RLDC/SLDC Regional Load Despatch Centre /State Load Despatch Centre.
24 Short Term Open Access (STOA)
Open access for a period up to one month at a time, but not exceeding a period of six months in a calendar year
25 State Transmission Utilities
The Board or the Government Company specified as such by the State Government under sub-section (1) of Section 39 of the Act.
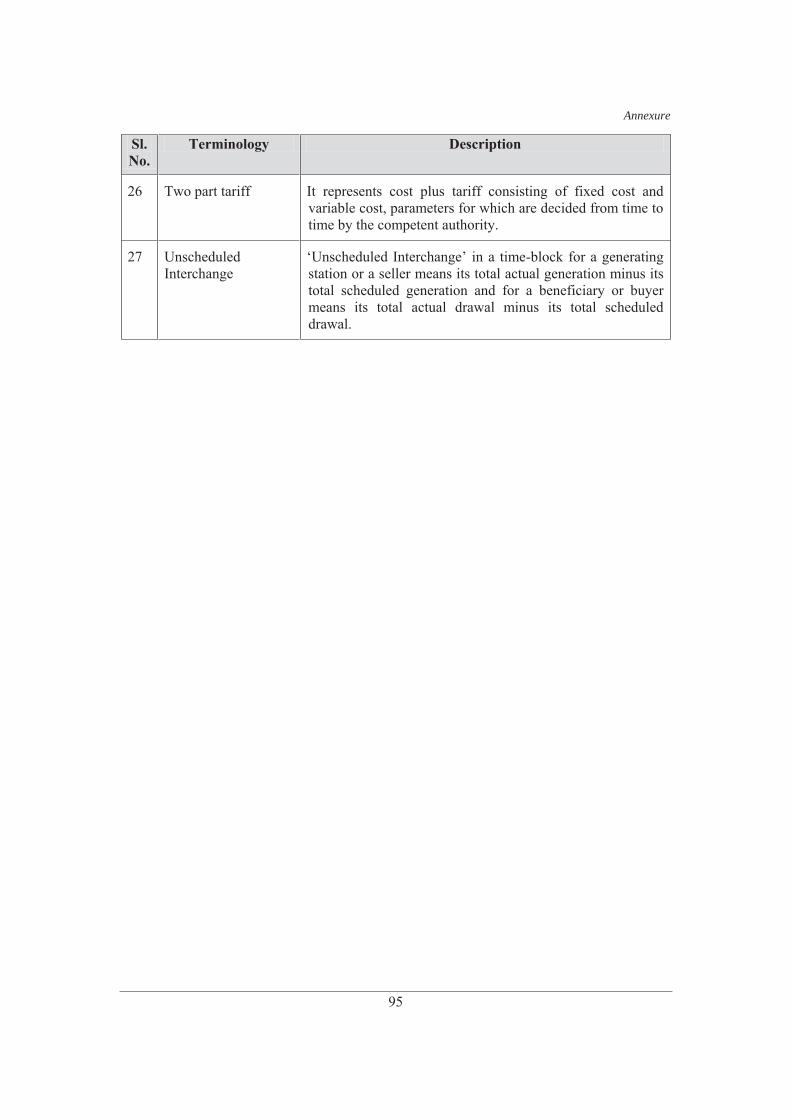
Annexure
95
Sl.No.
Terminology Description
26 Two part tariff It represents cost plus tariff consisting of fixed cost and variable cost, parameters for which are decided from time to time by the competent authority.
27 Unscheduled Interchange
-block for a generating station or a seller means its total actual generation minus its total scheduled generation and for a beneficiary or buyer means its total actual drawal minus its total scheduled drawal.
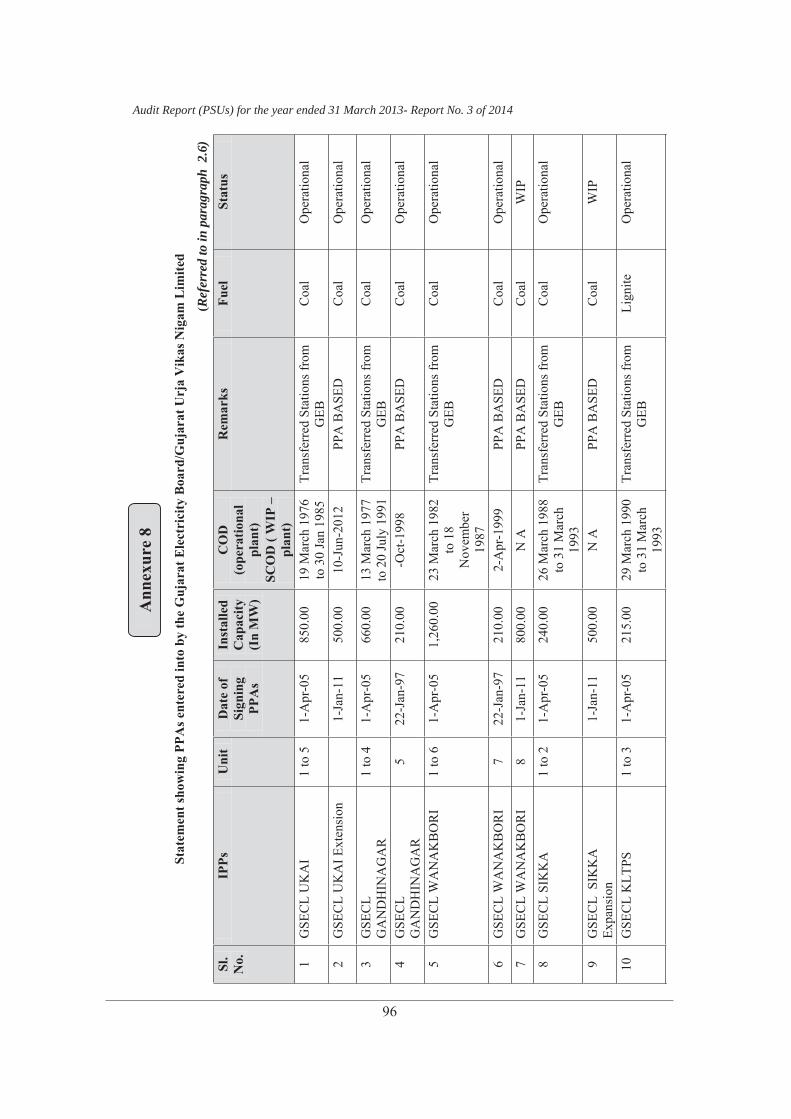
96
Audit Report (PSUs) for the year ended 31 March 2013- Report No. 3 of 2014
Stat
emen
t sho
win
g PP
As e
nter
ed in
to b
y th
e G
ujar
at E
lect
rici
ty B
oard
/Guj
arat
Urj
a V
ikas
Nig
am L
imite
d
(Ref
erre
d to
in p
arag
raph
2.6
)Sl
.N
o.IP
PsU
nit
Dat
e of
Si
gnin
gPP
As
Inst
alle
dC
apac
ity(I
n M
W)
CO
D(o
pera
tiona
lpl
ant)
SCO
D (
WIP
pl
ant)
Rem
arks
Fuel
Stat
us
1G
SEC
L U
KA
I1
to 5
1-A
pr-0
585
0.00
19 M
arch
197
6 to
30
Jan
1985
Tran
sfer
red
Stat
ions
from
G
EBC
oal
Ope
ratio
nal
2G
SEC
L U
KA
I Ext
ensi
on1-
Jan-
1150
0.00
10-J
un-2
012
PPA
BA
SED
Coa
lO
pera
tiona
l
3G
SEC
LG
AN
DH
INA
GA
R1
to 4
1-A
pr-0
566
0.00
13 M
arch
197
7 to
20
July
199
1Tr
ansf
erre
d St
atio
ns fr
om
GEB
Coa
lO
pera
tiona
l
4G
SEC
LG
AN
DH
INA
GA
R5
22-J
an-9
721
0.00
-Oct
-199
8PP
A B
ASE
DC
oal
Ope
ratio
nal
5G
SEC
L W
AN
AK
BO
RI
1 to
61-
Apr
-05
1,26
0.00
23 M
arch
198
2 to
18
Nov
embe
r 19
87
Tran
sfer
red
Stat
ions
from
G
EBC
oal
Ope
ratio
nal
6G
SEC
L W
AN
AK
BO
RI
722
-Jan
-97
210.
002-
Apr
-199
9PP
A B
ASE
DC
oal
Ope
ratio
nal
7G
SEC
L W
AN
AK
BO
RI
81-
Jan-
1180
0.00
N A
PPA
BA
SED
Coa
lW
IP
8G
SEC
L SI
KK
A1
to 2
1-A
pr-0
524
0.00
26 M
arch
198
8 to
31
Mar
ch
1993
Tran
sfer
red
Stat
ions
from
G
EBC
oal
Ope
ratio
nal
9G
SEC
L S
IKK
AEx
pans
ion
1-Ja
n-11
500.
00N
APP
A B
ASE
DC
oal
WIP
10G
SEC
L K
LTPS
1 to
31-
Apr
-05
215.
0029
Mar
ch 1
990
to 3
1 M
arch
19
93
Tran
sfer
red
Stat
ions
from
G
EBLi
gnite
Ope
ratio
nal
Ann
exur
e 8
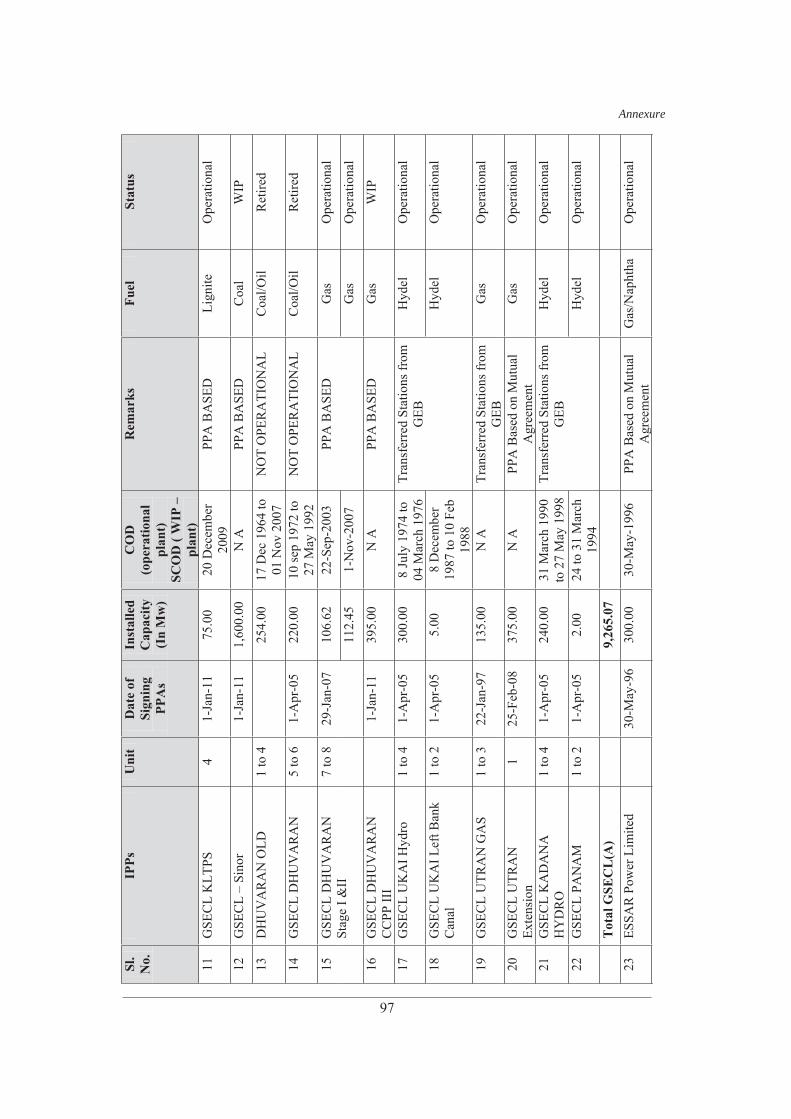
Annexure
97
Sl.
No.
IPPs
Uni
tD
ate
of
Sign
ing
PPA
s
Inst
alle
dC
apac
ity(I
n M
w)
CO
D(o
pera
tiona
lpl
ant)
SCO
D (
WIP
pl
ant)
Rem
arks
Fuel
Stat
us
11G
SEC
L K
LTPS
41-
Jan-
1175
.00
20 D
ecem
ber
2009
PPA
BA
SED
Lign
iteO
pera
tiona
l
12G
SEC
L S
inor
1-Ja
n-11
1,60
0.00
N A
PPA
BA
SED
Coa
lW
IP
13D
HU
VA
RA
N O
LD1
to 4
254.
0017
Dec
196
4 to
01
Nov
200
7N
OT
OPE
RA
TIO
NA
LC
oal/O
ilR
etire
d
14G
SEC
L D
HU
VA
RA
N5
to 6
1-A
pr-0
522
0.00
10 se
p 19
72 to
27
May
199
2N
OT
OPE
RA
TIO
NA
LC
oal/O
ilR
etire
d
15G
SEC
L D
HU
VA
RA
N
Stag
e I &
II7
to 8
29-J
an-0
710
6.62
22-S
ep-2
003
PPA
BA
SED
Gas
Ope
ratio
nal
112.
451-
Nov
-200
7G
asO
pera
tiona
l
16G
SEC
L D
HU
VA
RA
N
CC
PP II
I1-
Jan-
1139
5.00
N A
PPA
BA
SED
Gas
WIP
17G
SEC
L U
KA
I Hyd
ro1
to 4
1-A
pr-0
530
0.00
8 Ju
ly 1
974
to
04 M
arch
197
6Tr
ansf
erre
d St
atio
ns fr
om
GEB
Hyd
elO
pera
tiona
l
18G
SEC
L U
KA
I Lef
t Ban
k C
anal
1 to
21-
Apr
-05
5.00
8 D
ecem
ber
1987
to 1
0 Fe
b 19
88
Hyd
elO
pera
tiona
l
19G
SEC
L U
TRA
N G
AS
1 to
322
-Jan
-97
135.
00N
ATr
ansf
erre
d St
atio
ns fr
om
GEB
Gas
Ope
ratio
nal
20G
SEC
L U
TRA
N
Exte
nsio
n1
25-F
eb-0
837
5.00
N A
PPA
Bas
ed o
n M
utua
l A
gree
men
tG
asO
pera
tiona
l
21G
SEC
L K
AD
AN
A
HY
DR
O1
to 4
1-A
pr-0
524
0.00
31 M
arch
199
0 to
27
May
199
8Tr
ansf
erre
d St
atio
ns fr
om
GEB
Hyd
elO
pera
tiona
l
22G
SEC
L PA
NA
M1
to 2
1-A
pr-0
52.
0024
to 3
1 M
arch
19
94H
ydel
Ope
ratio
nal
Tot
al G
SEC
L(A
)9,
265.
0723
ESSA
R P
ower
Lim
ited
30-M
ay-9
630
0.00
30-M
ay-1
996
PPA
Bas
ed o
n M
utua
l A
gree
men
tG
as/N
apht
haO
pera
tiona
l
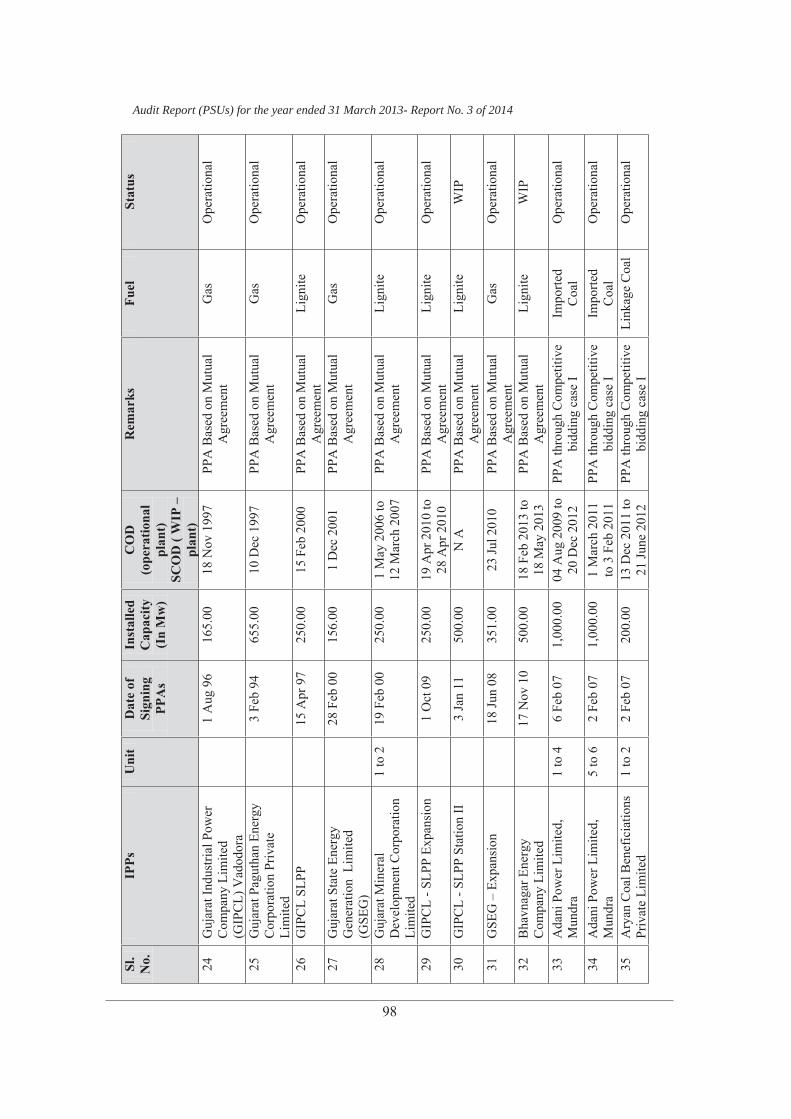
98
Audit Report (PSUs) for the year ended 31 March 2013- Report No. 3 of 2014Sl
.N
o.IP
PsU
nit
Dat
e of
Si
gnin
gPP
As
Inst
alle
dC
apac
ity(I
n M
w)
CO
D(o
pera
tiona
lpl
ant)
SCO
D (
WIP
pl
ant)
Rem
arks
Fuel
Stat
us
24G
ujar
at In
dust
rial P
ower
Com
pany
Lim
ited
(GIP
CL)
Vad
odor
a
1 A
ug 9
616
5.00
18N
ov19
97PP
A B
ased
on
Mut
ual
Agr
eem
ent
Gas
Ope
ratio
nal
25G
ujar
at P
agut
han
Ener
gy
Cor
pora
tion
Priv
ate
Lim
ited
3 Fe
b 94
655.
0010
Dec
199
7PP
A B
ased
on
Mut
ual
Agr
eem
ent
Gas
Ope
ratio
nal
26G
IPC
LSL
PP15
Apr
97
250.
0015
Feb
200
0PP
A B
ased
on
Mut
ual
Agr
eem
ent
Lign
iteO
pera
tiona
l
27G
ujar
at S
tate
Ene
rgy
Gen
erat
ion
Lim
ited
(GSE
G)
28 F
eb 0
015
6.00
1D
ec20
01PP
A B
ased
on
Mut
ual
Agr
eem
ent
Gas
Ope
ratio
nal
28G
ujar
at M
iner
al
Dev
elop
men
t Cor
pora
tion
Lim
ited
1 to
219
Feb
0025
0.00
1 M
ay 2
006
to
12 M
arch
200
7PP
A B
ased
on
Mut
ual
Agr
eem
ent
Lign
iteO
pera
tiona
l
29G
IPC
L-S
LPP
Expa
nsio
n1
Oct
09
250.
0019
Apr
201
0 to
28
Apr
2010
PPA
Bas
ed o
n M
utua
l A
gree
men
tLi
gnite
Ope
ratio
nal
30G
IPC
L-S
LPP
Stat
ion
II3
Jan
1150
0.00
N A
PPA
Bas
ed o
n M
utua
l A
gree
men
tLi
gnite
WIP
31G
SEG
Expa
nsio
n18
Jun
0835
1.00
23 Ju
l 201
0PP
A B
ased
on
Mut
ual
Agr
eem
ent
Gas
Ope
ratio
nal
32B
havn
agar
Ene
rgy
Com
pany
Lim
ited
17 N
ov 1
050
0.00
18 F
eb 2
013
to
18 M
ay 2
013
PPA
Bas
ed o
n M
utua
l A
gree
men
tLi
gnite
WIP
33A
dani
Pow
er L
imite
d,
Mun
dra
1 to
46
Feb
071,
000.
0004
Aug
200
9 to
20
Dec
201
2PP
A th
roug
h C
ompe
titiv
e bi
ddin
g ca
se I
Impo
rted
Coa
lO
pera
tiona
l
34A
dani
Pow
er L
imite
d,
Mun
dra
5 to
62
Feb
071,
000.
001
Mar
ch 2
011
to 3
Feb
201
1PP
A th
roug
hC
ompe
titiv
e bi
ddin
g ca
se I
Impo
rted
Coa
lO
pera
tiona
l
35A
ryan
Coa
l Ben
efic
iatio
ns
Priv
ate
Lim
ited
1 to
22
Feb
0720
0.00
13 D
ec 2
011
to
21 Ju
ne 2
012
PPA
thro
ugh
Com
petit
ive
bidd
ing
case
ILi
nkag
e C
oal
Ope
ratio
nal
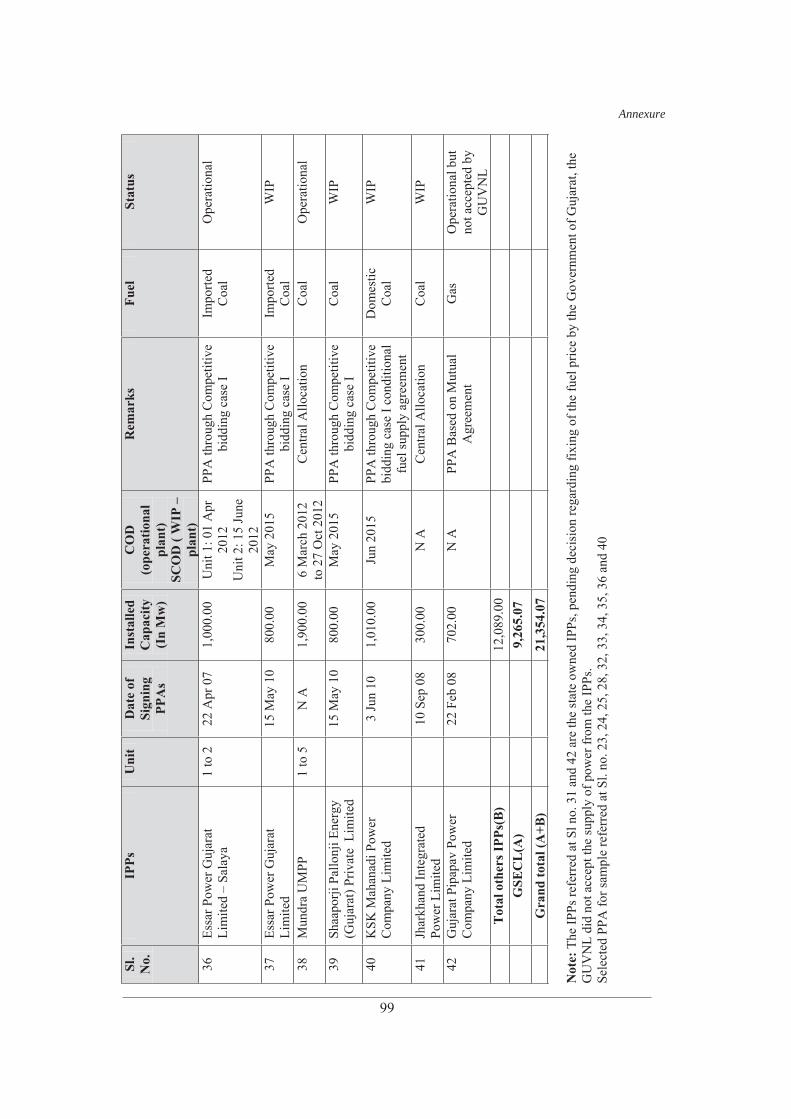
Annexure
99
Sl.
No.
IPPs
Uni
tD
ate
of
Sign
ing
PPA
s
Inst
alle
dC
apac
ity(I
n M
w)
CO
D(o
pera
tiona
lpl
ant)
SCO
D (
WIP
pl
ant)
Rem
arks
Fuel
Stat
us
36Es
sar P
ower
Guj
arat
Li
mite
d S
alay
a1
to 2
22 A
pr 0
71,
000.
00U
nit 1
: 01
Apr
20
12
Uni
t 2: 1
5 Ju
ne
2012
PPA
thro
ugh
Com
petit
ive
bidd
ing
case
IIm
porte
d C
oal
Ope
ratio
nal
37Es
sar P
ower
Guj
arat
Li
mite
d15
May
10
800.
00M
ay 2
015
PPA
thro
ugh
Com
petit
ive
bidd
ing
case
IIm
porte
d C
oal
WIP
38M
undr
a U
MPP
1 to
5N
A1,
900.
006
Mar
ch 2
012
to 2
7 O
ct 2
012
Cen
tral A
lloca
tion
Coa
lO
pera
tiona
l
39Sh
aapo
rji P
allo
nji E
nerg
y (G
ujar
at) P
rivat
e L
imite
d15
May
10
800.
00M
ay 2
015
PPA
thro
ugh
Com
petit
ive
bidd
ing
case
IC
oal
WIP
40K
SK M
ahan
adi P
ower
C
ompa
ny L
imite
d3
Jun
101,
010.
00Ju
n 20
15PP
A th
roug
h C
ompe
titiv
e bi
ddin
g ca
se I
cond
ition
al
fuel
supp
ly a
gree
men
t
Dom
estic
C
oal
WIP
41Jh
arkh
and
Inte
grat
ed
Pow
er L
imite
d10
Sep
08
300.
00N
AC
entra
l Allo
catio
nC
oal
WIP
42G
ujar
at P
ipap
av P
ower
C
ompa
ny L
imite
d22
Feb
08
702.
00N
APP
A B
ased
on
Mut
ual
Agr
eem
ent
Gas
Ope
ratio
nal b
ut
not a
ccep
ted
by
GU
VN
LT
otal
oth
ers I
PPs(
B)
12,0
89.0
0
G
SEC
L(A
)9,
265.
07
G
rand
tota
l (A
+B)
21,3
54.0
7
Not
e: T
he IP
Ps re
ferr
ed a
t Sl n
o. 3
1 an
d 42
are
the
stat
e ow
ned
IPPs
, pen
ding
dec
isio
n re
gard
ing
fixin
g of
the
fuel
pric
e by
the
Gov
ernm
ent o
f Guj
arat
, the
G
UV
NL
did
not a
ccep
t the
supp
ly o
f pow
er fr
om th
e IP
Ps.
Sele
cted
PPA
for s
ampl
e re
ferr
ed a
t Sl.
no. 2
3, 2
4, 2
5, 2
8, 3
2, 3
3, 3
4, 3
5, 3
6 an
d 40
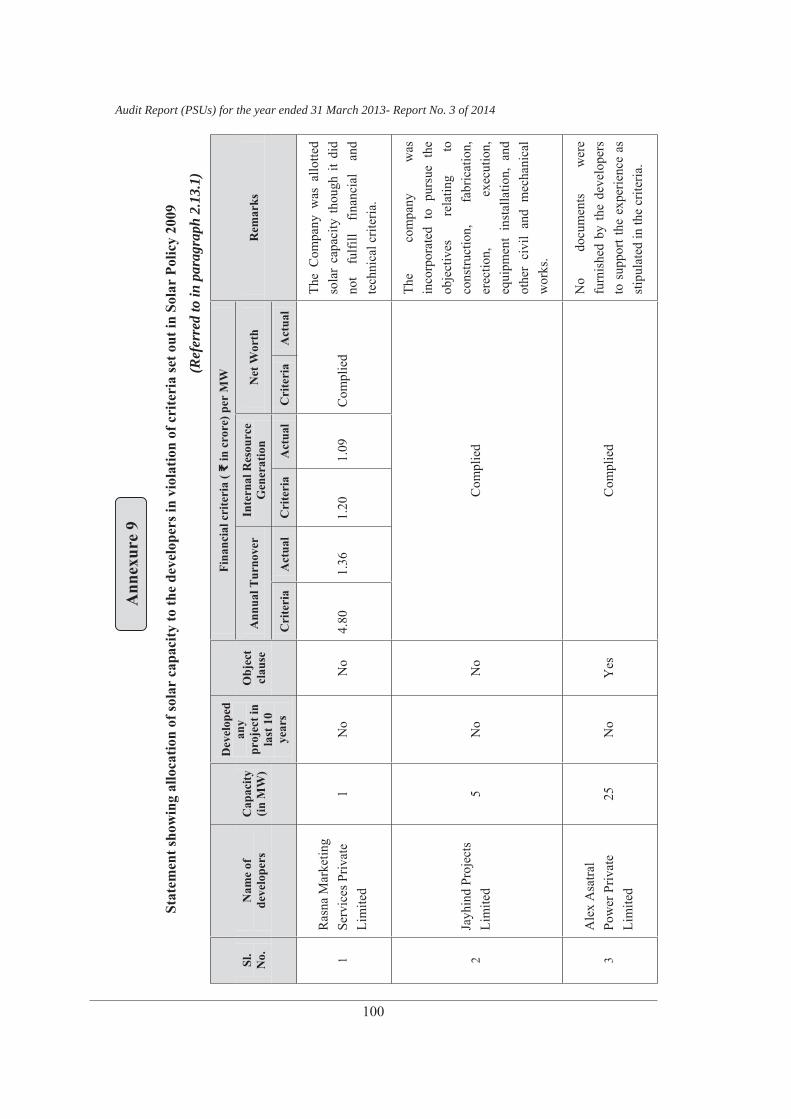
100
Audit Report (PSUs) for the year ended 31 March 2013- Report No. 3 of 2014
Stat
emen
t sho
win
g al
loca
tion
of so
lar
capa
city
to th
e de
velo
pers
in v
iola
tion
of c
rite
ria
set o
ut in
Sol
ar P
olic
y 20
09
(Ref
erre
d to
in p
arag
raph
2.1
3.1)
Sl.
No.
Nam
e of
de
velo
pers
Cap
acity
(in
MW
)
Dev
elop
ed
any
proj
ect i
n la
st 1
0 ye
ars
Obj
ect
clau
se
Fina
ncia
l cri
teri
a (
in c
rore
) per
MW
Rem
arks
Ann
ual T
urno
ver
Inte
rnal
Res
ourc
e G
ener
atio
nN
et W
orth
Cri
teri
aA
ctua
lC
rite
ria
Act
ual
Cri
teri
aA
ctua
l
1R
asna
Mar
ketin
g Se
rvic
es P
rivat
eLi
mite
d1
No
No
4.80
1.36
1.20
1.09
Com
plie
d
The
Com
pany
was
allo
tted
sola
r ca
paci
ty t
houg
h it
did
not
fulfi
ll fin
anci
al
and
tech
nica
l crit
eria
.
2Ja
yhin
d Pr
ojec
ts
Lim
ited
5
No
No
Com
plie
d
The
com
pany
w
as
inco
rpor
ated
to
purs
ue t
he
obje
ctiv
es
rela
ting
to
cons
truct
ion,
fa
bric
atio
n,
erec
tion,
ex
ecut
ion,
eq
uipm
ent
inst
alla
tion,
and
ot
her
civi
l an
d m
echa
nica
l w
orks
.
3A
lex
Asa
tral
Pow
er P
rivat
eLi
mite
d25
No
Yes
Com
plie
d
No
docu
men
ts
wer
e fu
rnis
hed
by th
e de
velo
pers
to
sup
port
the
expe
rienc
e as
st
ipul
ated
in th
e cr
iteria
.
Ann
exur
e9
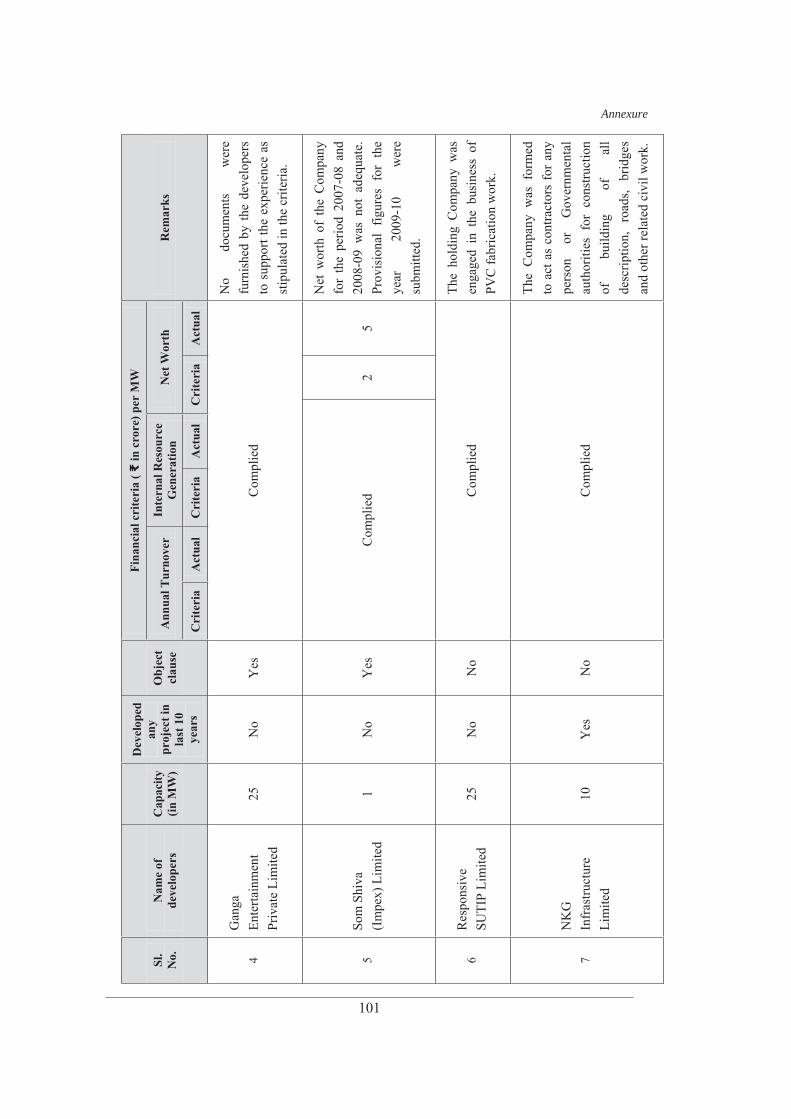
Annexure
101
Sl.
No.
Nam
e of
de
velo
pers
C
apac
ity
(in M
W)
Dev
elop
ed
any
proj
ect i
n la
st 1
0 ye
ars
Obj
ect
clau
se
Fina
ncia
l cri
teri
a (
in c
rore
) per
MW
Rem
arks
Ann
ual T
urno
ver
Inte
rnal
Res
ourc
e G
ener
atio
n N
et W
orth
Cri
teri
a A
ctua
lC
rite
ria
Act
ual
Cri
teri
a A
ctua
l
4G
anga
Ente
rtain
men
t Pr
ivat
e Li
mite
d 25
N
o Y
es
Com
plie
d
No
docu
men
ts
wer
e fu
rnis
hed
by th
e de
velo
pers
to
sup
port
the
expe
rienc
e as
st
ipul
ated
in th
e cr
iteria
.
5So
m S
hiva
(I
mpe
x) L
imite
d 1
No
Yes
C
ompl
ied
2 5
Net
wor
th o
f th
e C
ompa
ny
for
the
perio
d 20
07-0
8 an
d 20
08-0
9 w
as n
ot a
dequ
ate.
Pr
ovis
iona
l fig
ures
for
the
ye
ar
2009
-10
wer
e su
bmitt
ed.
6R
espo
nsiv
eSU
TIP
Lim
ited
25
No
No
Com
plie
d Th
e ho
ldin
g C
ompa
ny w
as
enga
ged
in t
he b
usin
ess
of
PVC
fabr
icat
ion
wor
k.
7N
KG
Infr
astru
ctur
eLi
mite
d 10
Y
es
No
Com
plie
d
The
Com
pany
was
for
med
to
act
as
cont
ract
ors
for a
ny
pers
on
or
Gov
ernm
enta
l au
thor
ities
for
con
stru
ctio
n of
bu
ildin
g of
al
l de
scrip
tion,
ro
ads,
brid
ges
and
othe
r rel
ated
civ
il w
ork.
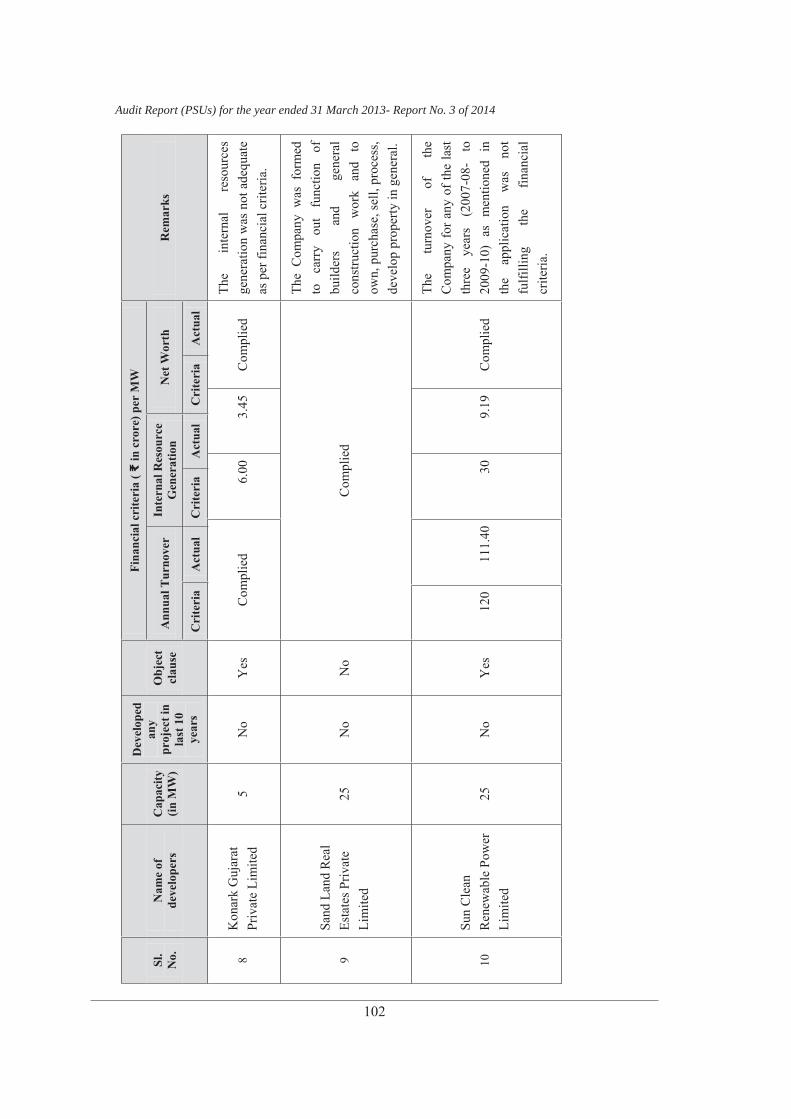
102
Audit Report (PSUs) for the year ended 31 March 2013- Report No. 3 of 2014
Sl.
No.
Nam
e of
de
velo
pers
Cap
acity
(in
MW
)
Dev
elop
ed
any
proj
ect i
n la
st 1
0 ye
ars
Obj
ect
clau
se
Fina
ncia
l cri
teri
a (
in c
rore
) per
MW
Rem
arks
Ann
ual T
urno
ver
Inte
rnal
Res
ourc
e G
ener
atio
nN
et W
orth
Cri
teri
aA
ctua
lC
rite
ria
Act
ual
Cri
teri
aA
ctua
l
8K
onar
k G
ujar
at
Priv
ate
Lim
ited
5N
oY
esC
ompl
ied
6.00
3.45
Com
plie
dTh
e in
tern
al
reso
urce
s ge
nera
tion
was
not
ade
quat
e as
per
fina
ncia
l crit
eria
.
9Sa
nd L
and
Rea
l Es
tate
s Priv
ate
Lim
ited
25N
oN
oC
ompl
ied
The
Com
pany
was
for
med
to
ca
rry
out
func
tion
of
build
ers
and
gene
ral
cons
truct
ion
wor
k an
d to
ow
n, p
urch
ase,
sell,
pro
cess
, de
velo
p pr
oper
ty in
gen
eral
.
10Su
n C
lean
R
enew
able
Pow
er
Lim
ited
25N
oY
es12
011
1.40
309.
19C
ompl
ied
The
turn
over
of
th
e C
ompa
ny fo
r any
of t
he la
st
thre
e ye
ars
(200
7-08
-to
2009
-10)
as
men
tione
d in
th
e ap
plic
atio
n w
as
not
fulfi
lling
th
e fin
anci
al
crite
ria.
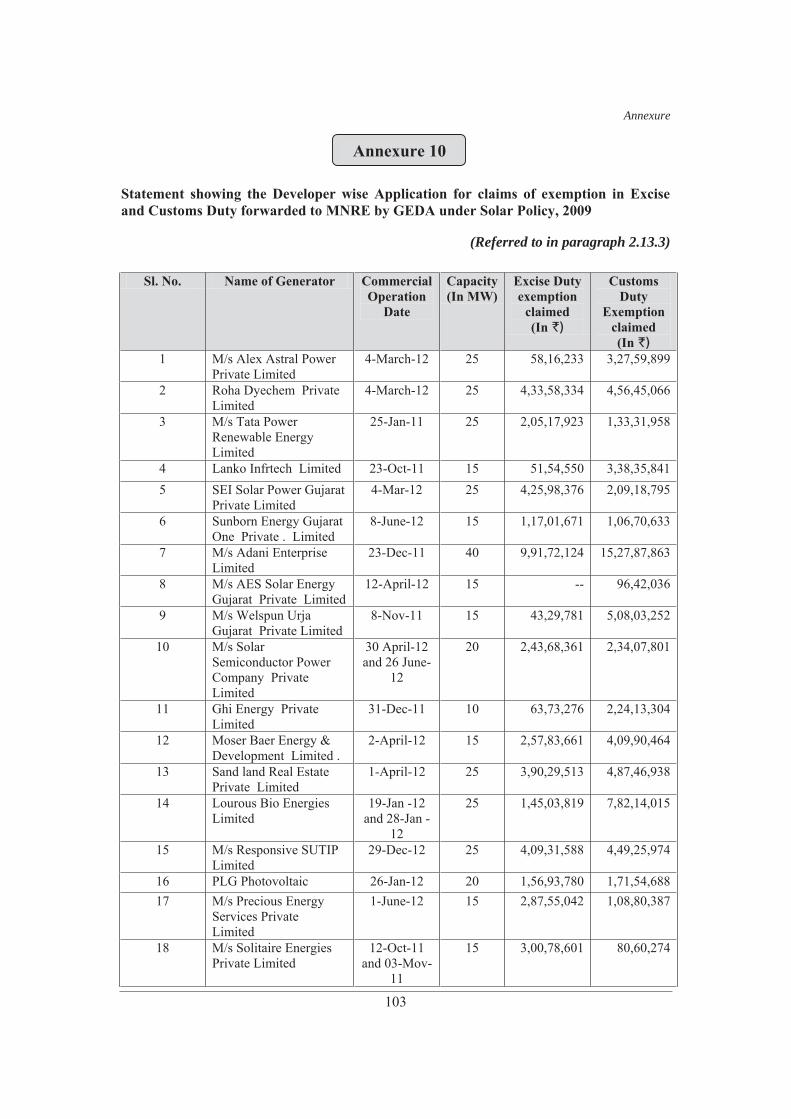
Annexure
103
Statement showing the Developer wise Application for claims of exemption in Excise and Customs Duty forwarded to MNRE by GEDA under Solar Policy, 2009
(Referred to in paragraph 2.13.3)
Sl. No. Name of Generator CommercialOperation
Date
Capacity(In MW)
Excise Duty exemption
claimed(In `)
CustomsDuty
Exemptionclaimed(In `)
1 M/s Alex Astral Power Private Limited
4-March-12 25 58,16,233 3,27,59,899
2 Roha Dyechem Private Limited
4-March-12 25 4,33,58,334 4,56,45,066
3 M/s Tata Power Renewable Energy Limited
25-Jan-11 25 2,05,17,923 1,33,31,958
4 Lanko Infrtech Limited 23-Oct-11 15 51,54,550 3,38,35,8415 SEI Solar Power Gujarat
Private Limited4-Mar-12 25 4,25,98,376 2,09,18,795
6 Sunborn Energy Gujarat One Private . Limited
8-June-12 15 1,17,01,671 1,06,70,633
7 M/s Adani EnterpriseLimited
23-Dec-11 40 9,91,72,124 15,27,87,863
8 M/s AES Solar Energy Gujarat Private Limited
12-April-12 15 -- 96,42,036
9 M/s Welspun Urja Gujarat Private Limited
8-Nov-11 15 43,29,781 5,08,03,252
10 M/s Solar Semiconductor Power Company Private Limited
30 April-12 and 26 June-
12
20 2,43,68,361 2,34,07,801
11 Ghi Energy Private Limited
31-Dec-11 10 63,73,276 2,24,13,304
12 Moser Baer Energy & Development Limited .
2-April-12 15 2,57,83,661 4,09,90,464
13 Sand land Real EstatePrivate Limited
1-April-12 25 3,90,29,513 4,87,46,938
14 Lourous Bio Energies Limited
19-Jan -12 and 28-Jan -
12
25 1,45,03,819 7,82,14,015
15 M/s Responsive SUTIP Limited
29-Dec-12 25 4,09,31,588 4,49,25,974
16 PLG Photovoltaic 26-Jan-12 20 1,56,93,780 1,71,54,68817 M/s Precious Energy
Services PrivateLimited
1-June-12 15 2,87,55,042 1,08,80,387
18 M/s Solitaire EnergiesPrivate Limited
12-Oct-11and 03-Mov-
11
15 3,00,78,601 80,60,274
Annexure 10
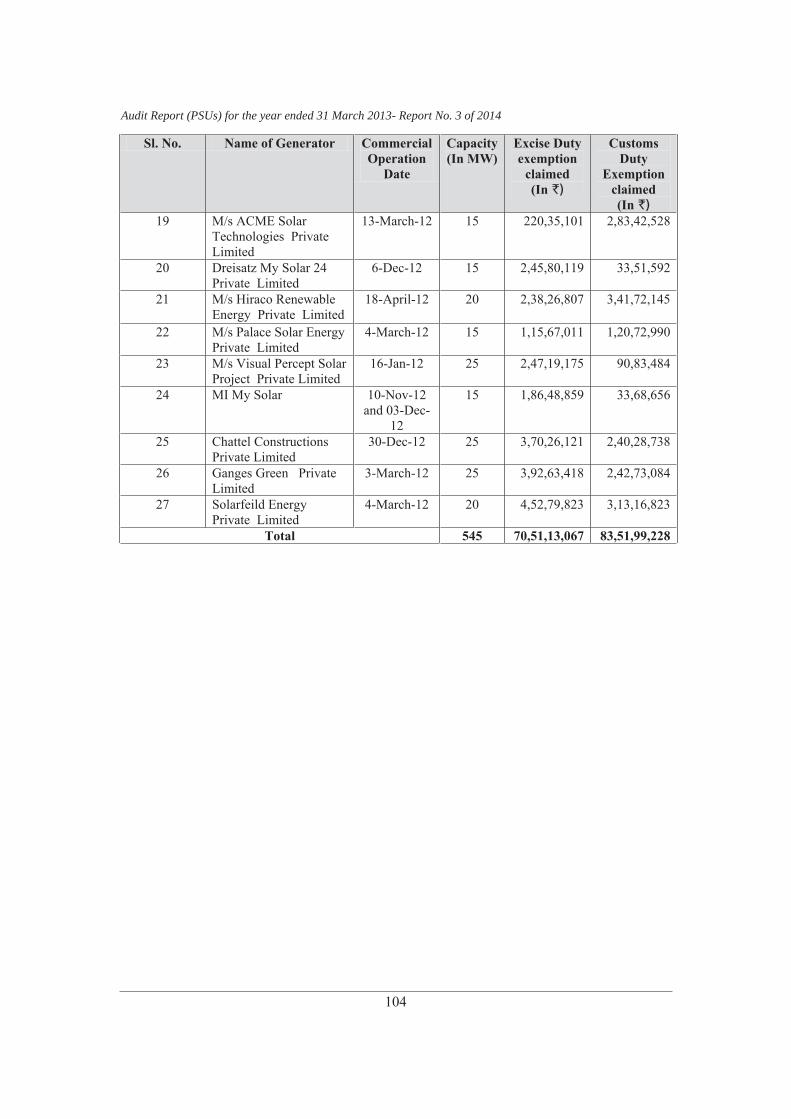
Audit Report (PSUs) for the year ended 31 March 2013- Report No. 3 of 2014
104
Sl. No. Name of Generator CommercialOperation
Date
Capacity(In MW)
Excise Duty exemption
claimed(In `)
CustomsDuty
Exemptionclaimed(In `)
19 M/s ACME Solar Technologies Private Limited
13-March-12 15 220,35,101 2,83,42,528
20 Dreisatz My Solar 24 Private Limited
6-Dec-12 15 2,45,80,119 33,51,592
21 M/s Hiraco Renewable Energy Private Limited
18-April-12 20 2,38,26,807 3,41,72,145
22 M/s Palace Solar Energy Private Limited
4-March-12 15 1,15,67,011 1,20,72,990
23 M/s Visual Percept Solar Project Private Limited
16-Jan-12 25 2,47,19,175 90,83,484
24 MI My Solar 10-Nov-12and 03-Dec-
12
15 1,86,48,859 33,68,656
25 Chattel ConstructionsPrivate Limited
30-Dec-12 25 3,70,26,121 2,40,28,738
26 Ganges Green Private Limited
3-March-12 25 3,92,63,418 2,42,73,084
27 Solarfeild Energy Private Limited
4-March-12 20 4,52,79,823 3,13,16,823
Total 545 70,51,13,067 83,51,99,228
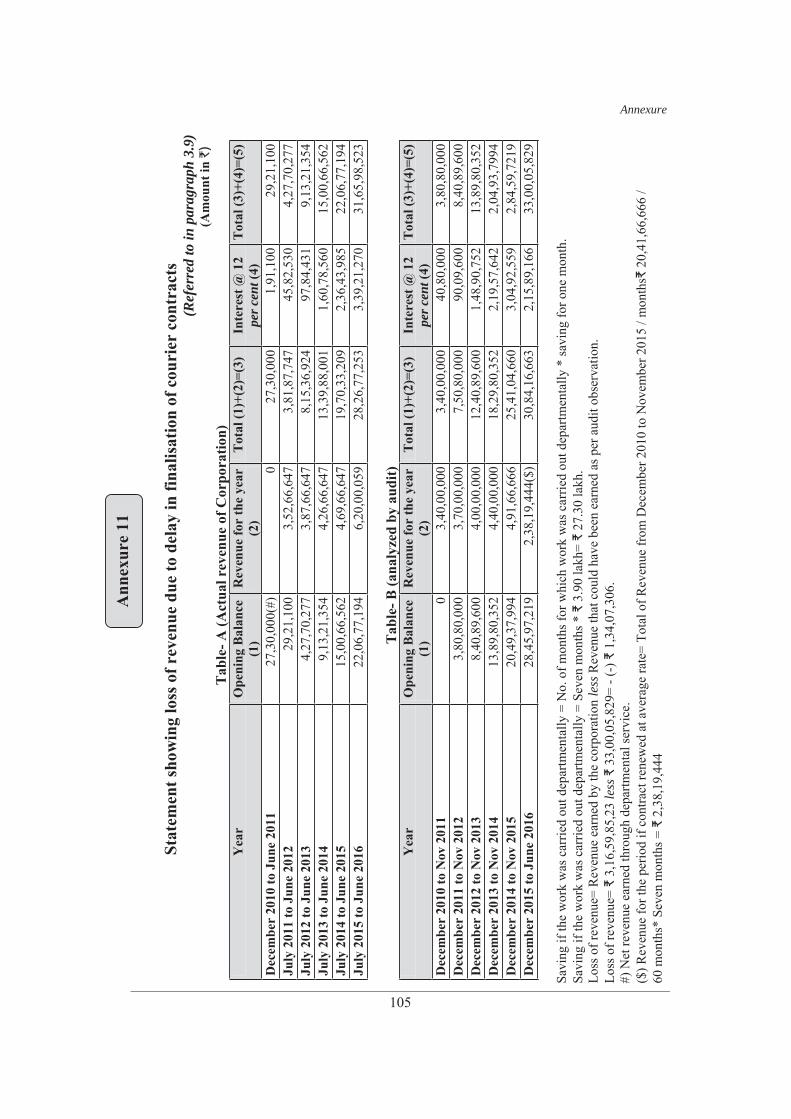
105
Stat
emen
t sho
win
g lo
ss o
f rev
enue
due
to d
elay
in fi
nalis
atio
n of
cou
rier
con
trac
ts(R
efer
red
to in
par
agra
ph 3
.9)
(Am
ount
in `
)
Tab
le- A
(Act
ual r
even
ue o
f Cor
pora
tion)
Yea
rO
peni
ng B
alan
ce
(1)
Rev
enue
for
the
year
(2
)T
otal
(1)+
(2)=
(3)
Inte
rest
@ 1
2 pe
r cen
t(4)
Tot
al (3
)+(4
)=(5
)
Dec
embe
r20
10 to
Jun
e 20
1127
,30,
000(
#)0
27,3
0,00
01,
91,1
0029
,21,
100
July
201
1 to
Jun
e 20
1229
,21,
100
3,52
,66,
647
3,81
,87,
747
45,8
2,53
04,
27,7
0,27
7Ju
ly 2
012
to J
une
2013
4,27
,70,
277
3,87
,66,
647
8,15
,36,
924
97,8
4,43
19,
13,2
1,35
4Ju
ly 2
013
to J
une
2014
9,13
,21,
354
4,26
,66,
647
13,3
9,88
,001
1,60
,78,
560
15,0
0,66
,562
July
201
4 to
Jun
e 20
1515
,00,
66,5
624,
69,6
6,64
719
,70,
33,2
092,
36,4
3,98
522
,06,
77,1
94Ju
ly 2
015
to J
une
2016
22,0
6,77
,194
6,20
,00,
059
28,2
6,77
,253
3,39
,21,
270
31,6
5,98
,523
Tab
le- B
(ana
lyze
d by
aud
it)Y
ear
Ope
ning
Bal
ance
(1
)R
even
ue fo
r th
e ye
ar
(2)
Tot
al (1
)+(2
)=(3
)In
tere
st @
12
per c
ent(
4)T
otal
(3)+
(4)=
(5)
Dec
embe
r20
10 to
Nov
201
10
3,40
,00,
000
3,40
,00,
000
40,8
0,00
03,
80,8
0,00
0D
ecem
ber
2011
to N
ov 2
012
3,80
,80,
000
3,70
,00,
000
7,50
,80,
000
90,0
9,60
08,
40,8
9,60
0D
ecem
ber
2012
to N
ov 2
013
8,40
,89,
600
4,00
,00,
000
12,4
0,89
,600
1,48
,90,
752
13,8
9,80
,352
Dec
embe
r20
13 to
Nov
201
413
,89,
80,3
524,
40,0
0,00
018
,29,
80,3
522,
19,5
7,64
22,
04,9
3,79
94D
ecem
ber
2014
to N
ov 2
015
20,4
9,37
,994
4,91
,66,
666
25,4
1,04
,660
3,04
,92,
559
2,84
,59,
7219
Dec
embe
r20
15 to
Jun
e 20
1628
,45,
97,2
192,
38,1
9,44
4($)
30,8
4,16
,663
2,15
,89,
166
33,0
0,05
,829
Savi
ng if
the
wor
k w
as c
arrie
d ou
t dep
artm
enta
lly =
No.
of m
onth
s for
whi
ch w
ork
was
car
ried
out d
epar
tmen
tally
* sa
ving
for o
ne m
onth
. Sa
ving
if th
e w
ork
was
car
ried
out d
epar
tmen
tally
= S
even
mon
ths *
3
.90
lakh
= 2
7.30
lakh
.Lo
ss o
f rev
enue
= R
even
ue e
arne
d by
the
corp
orat
ion
less
Rev
enue
that
cou
ld h
ave
been
ear
ned
as p
er a
udit
obse
rvat
ion.
Lo
ss o
f rev
enue
= 3
,16,
59,8
5,23
less
33,0
0,05
,829
= - (
-)
1,3
4,07
,306
. #)
Net
reve
nue
earn
ed th
roug
h de
partm
enta
l ser
vice
. ($
) Rev
enue
for t
he p
erio
d if
cont
ract
rene
wed
at a
vera
ge ra
te=
Tota
l of R
even
ue fr
om D
ecem
ber 2
010
to N
ovem
ber 2
015
/ mon
ths
20,4
1,66
,666
/ 60
mon
ths*
Sev
en m
onth
s =
2,3
8,19
,444
Ann
exur
e 11
Annexure
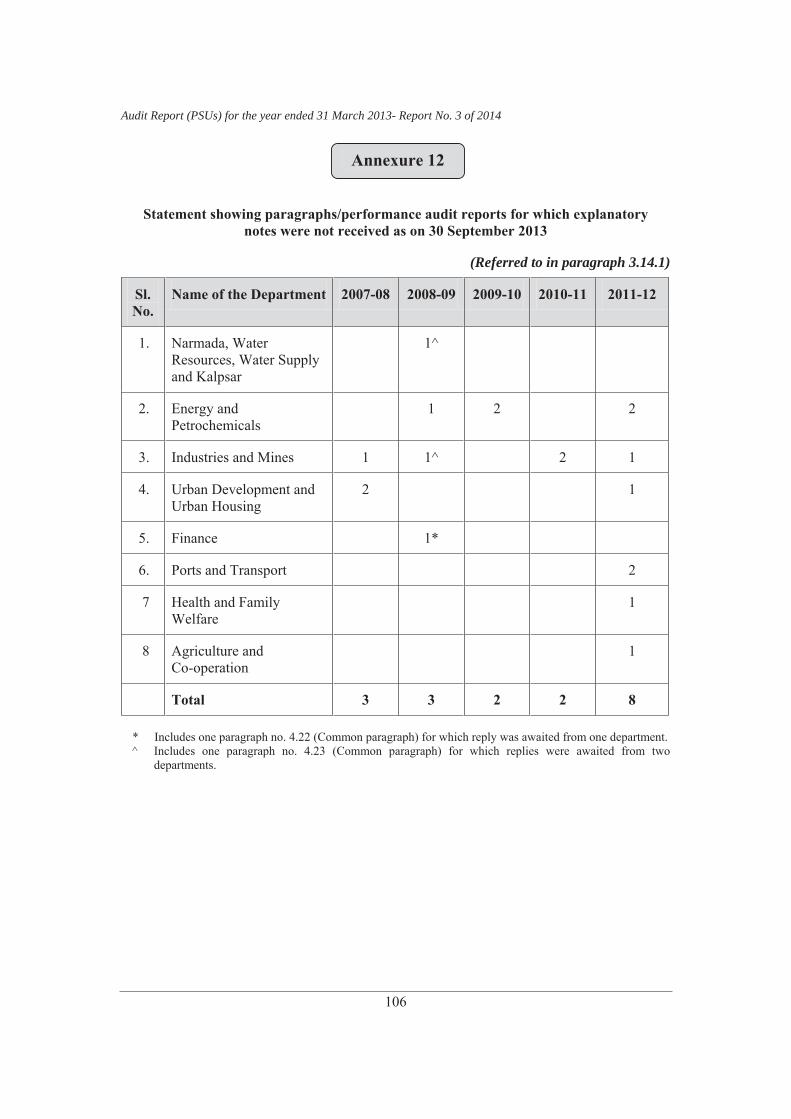
Audit Report (PSUs) for the year ended 31 March 2013- Report No. 3 of 2014
106
Statement showing paragraphs/performance audit reports for which explanatory notes were not received as on 30 September 2013
(Referred to in paragraph 3.14.1)
Sl.No.
Name of the Department 2007-08 2008-09 2009-10 2010-11 2011-12
1. Narmada, Water Resources, Water Supply and Kalpsar
1^
2. Energy and Petrochemicals
1 2 2
3. Industries and Mines 1 1^ 2 1
4. Urban Development and Urban Housing
2 1
5. Finance 1*
6. Ports and Transport 2
7 Health and Family Welfare
1
8 Agriculture and Co-operation
1
Total 3 3 2 2 8
* Includes one paragraph no. 4.22 (Common paragraph) for which reply was awaited from one department. ^ Includes one paragraph no. 4.23 (Common paragraph) for which replies were awaited from two
departments.
Annexure 12
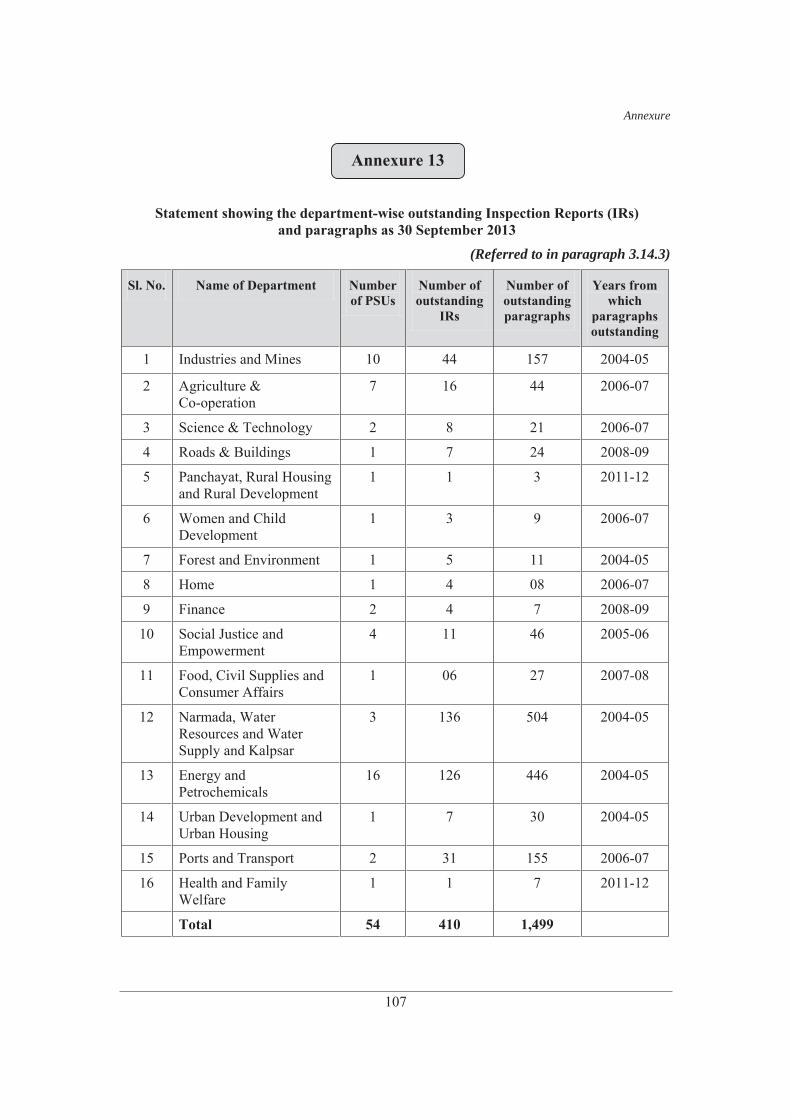
Annexure
107
Statement showing the department-wise outstanding Inspection Reports (IRs) and paragraphs as 30 September 2013
(Referred to in paragraph 3.14.3)
Sl. No. Name of Department Numberof PSUs
Number of outstanding
IRs
Number of outstandingparagraphs
Years from which
paragraphsoutstanding
1 Industries and Mines 10 44 157 2004-05
2 Agriculture & Co-operation
7 16 44 2006-07
3 Science & Technology 2 8 21 2006-07
4 Roads & Buildings 1 7 24 2008-09
5 Panchayat, Rural Housing and Rural Development
1 1 3 2011-12
6 Women and Child Development
1 3 9 2006-07
7 Forest and Environment 1 5 11 2004-05
8 Home 1 4 08 2006-07
9 Finance 2 4 7 2008-09
10 Social Justice and Empowerment
4 11 46 2005-06
11 Food, Civil Supplies and Consumer Affairs
1 06 27 2007-08
12 Narmada, Water Resources and Water Supply and Kalpsar
3 136 504 2004-05
13 Energy and Petrochemicals
16 126 446 2004-05
14 Urban Development and Urban Housing
1 7 30 2004-05
15 Ports and Transport 2 31 155 2006-07
16 Health and Family Welfare
1 1 7 2011-12
Total 54 410 1,499
Annexure 13
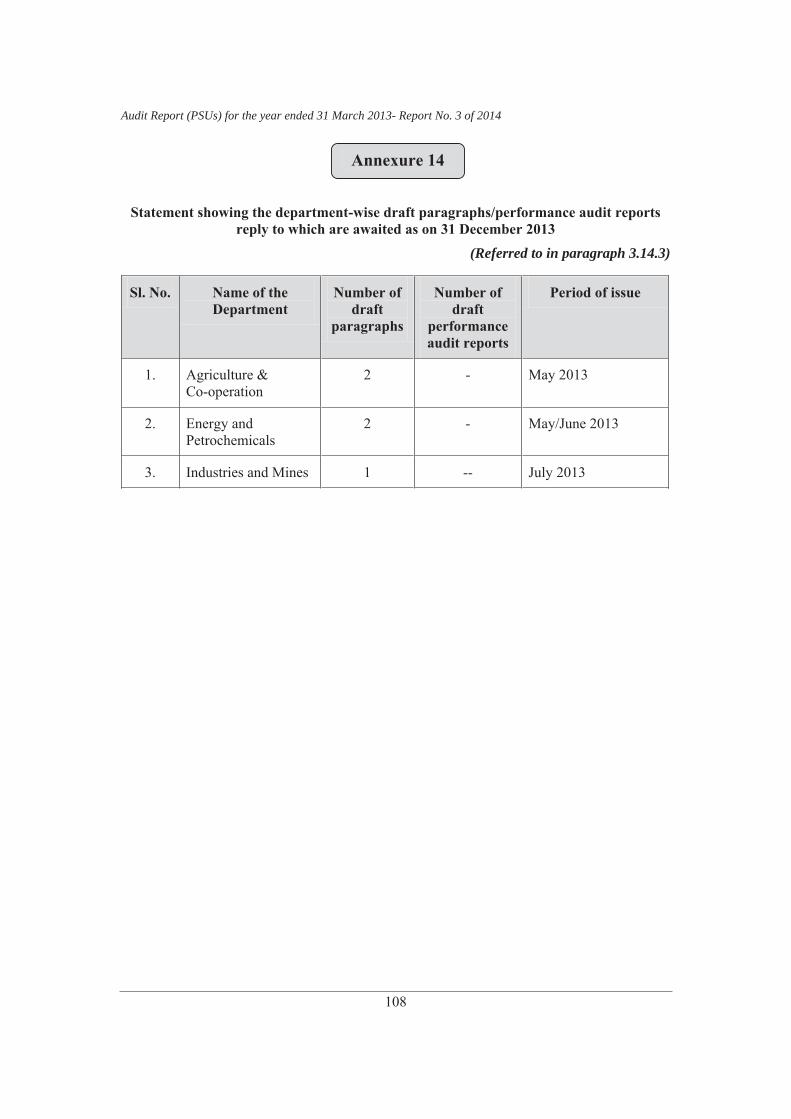
Audit Report (PSUs) for the year ended 31 March 2013- Report No. 3 of 2014
108
Statement showing the department-wise draft paragraphs/performance audit reports reply to which are awaited as on 31 December 2013
(Referred to in paragraph 3.14.3)
Sl. No. Name of the Department
Number of draft
paragraphs
Number of draft
performanceaudit reports
Period of issue
1. Agriculture & Co-operation
2 - May 2013
2. Energy and Petrochemicals
2 - May/June 2013
3. Industries and Mines 1 -- July 2013
Annexure 14
Related Documents