ANNEX II Page i ANNEX II.doc ANNEX II: RISK ASSESSMENT – LARGE PASSENGER SHIPS - NAVIGATION * 1 SUMMARY ................................................................................................................. 1 2 INTRODUCTION ....................................................................................................... 3 2.1 Objective 3 2.2 Scope of work 3 2.3 Limitations 3 2.4 Abbreviations 4 3 METHODOLOGY....................................................................................................... 4 3.1 Introduction 4 3.2 Bayesian network method for modelling 4 3.2.1 General 4 3.2.2 Bayesian theory 5 3.2.3 HUGIN 6 3.3 Data sources 6 4 THE RISK MODELS .................................................................................................. 7 4.1 General 7 4.2 Trade and waters sailed by cruise ships 7 4.3 The grounding scenario 8 4.4 The collision scenario 10 5 RESULTS .................................................................................................................. 12 5.1 Grounding 12 5.2 Collision 13 6 REFERENCES........................................................................................................... 14 APPENDICES Appendix A Grounding model – Bayesian Network with probability input Appendix B Collision Model – Bayesian Network with probability input Appendix C Node Description Appendix D Risk Exposure – Estimation of number of critical situations Appendix E Expert Judgements * This Annex is an edited version of DNV Report no 2003-0277

Welcome message from author
This document is posted to help you gain knowledge. Please leave a comment to let me know what you think about it! Share it to your friends and learn new things together.
Transcript

ANNEX II
Page i
ANNEX II.doc
ANNEX II: RISK ASSESSMENT – LARGE PASSENGER SHIPS - NAVIGATION*
1 SUMMARY ................................................................................................................. 1
2 INTRODUCTION ....................................................................................................... 3 2.1 Objective 3 2.2 Scope of work 3 2.3 Limitations 3 2.4 Abbreviations 4
3 METHODOLOGY....................................................................................................... 4 3.1 Introduction 4 3.2 Bayesian network method for modelling 4 3.2.1 General 4 3.2.2 Bayesian theory 5 3.2.3 HUGIN 6 3.3 Data sources 6
4 THE RISK MODELS .................................................................................................. 7 4.1 General 7 4.2 Trade and waters sailed by cruise ships 7 4.3 The grounding scenario 8 4.4 The collision scenario 10
5 RESULTS .................................................................................................................. 12 5.1 Grounding 12 5.2 Collision 13
6 REFERENCES........................................................................................................... 14
APPENDICES Appendix A Grounding model – Bayesian Network with probability input
Appendix B Collision Model – Bayesian Network with probability input
Appendix C Node Description
Appendix D Risk Exposure – Estimation of number of critical situations
Appendix E Expert Judgements
* This Annex is an edited version of DNV Report no 2003-0277
ANNEX II
Page 1
ANNEX II.doc
1 SUMMARY
The risk modelling is an essential part of the full Formal Safety Assessment (FSA) of cruise navigation to be undertaken. A risk screening, where available statistics were identified is reported in ANNEX I, and a hazard identification has already been carried out ant reported in NAV49/INF.2. Both theses report are important input to the risk modelling.
There are two ways to quantify risk, through statistics and through models. The disadvantage of using statistics is that statistics will only represent the past, and not take into account recent developments or new requirements. Risk modelling is the proactive approach, where risks are assessed before the accident take place. This is opposite to the maritime history, where regulations are adopted after catastrophic accidents.
The modern vessels are less likely to ground or collide due to technical failure than older, conventional vessels are. This will again put more focus on human and organisational factors in general, and the navigators’ attention, competence and performance in particular. The importance of human elements can be well reflected in a model, however, difficult to reveal through statistics.
The most valuable output from a model is not the overall risk level that is predicted by the model, but the structure itself and all the contributing factors that enables an understanding of the failure mechanisms and gives a quantified result whenever one of the input parameters is altered. Bayesian reliability theory and Bayesian networks were assessed to be ideal for this purpose.
It is quite easy to express an opinion about risk, the challenge is to quantify this risk in a consistent model. In the work process to establish probability input to the models, various experts and data sources were used to ensure a solid foundation for the dependencies and figures entered into the model. Statistical data were used where available. If statistical data were not available, experts were interviewed or directly involved in the modelling process.
The failure mechanisms for grounding and collisions are quite similar, and the accident models have most of the structure and nodes (contributors) in common.
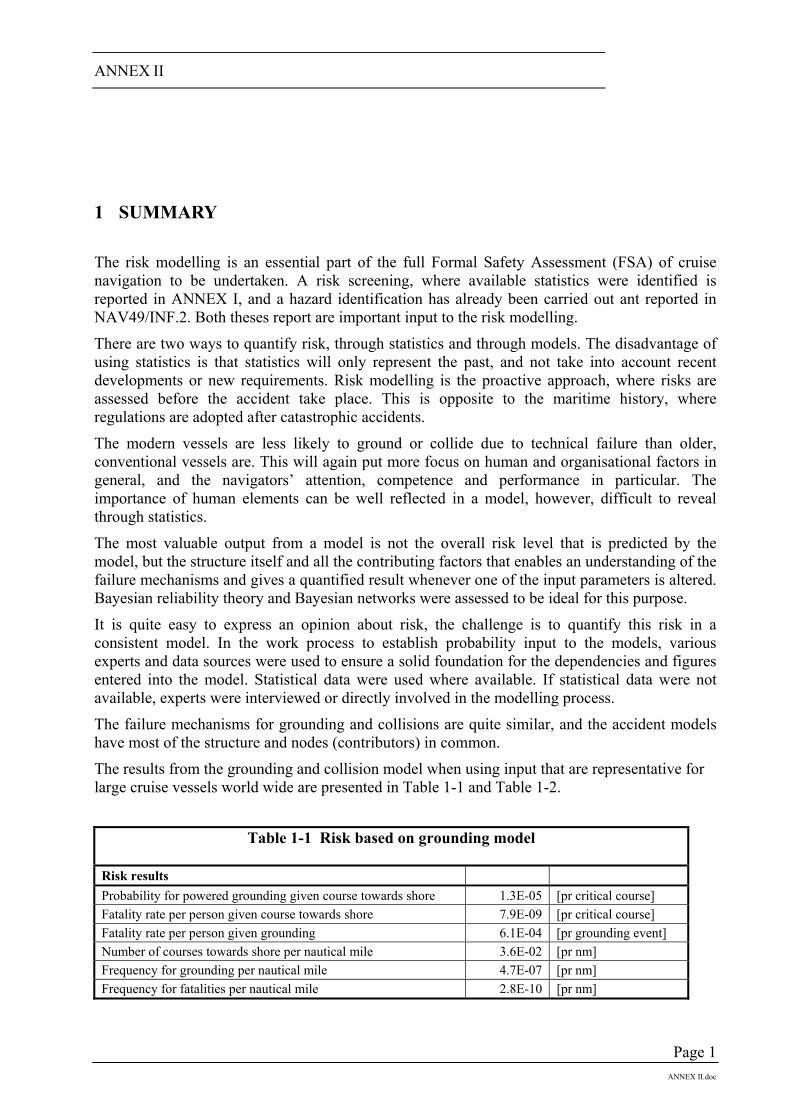
The results from the grounding and collision model when using input that are representative for large cruise vessels world wide are presented in Table 1-1 and Table 1-2.
Table 1-1 Risk based on grounding model
Risk results Probability for powered grounding given course towards shore 1.3E-05 [pr critical course] Fatality rate per person given course towards shore 7.9E-09 [pr critical course] Fatality rate per person given grounding 6.1E-04 [pr grounding event] Number of courses towards shore per nautical mile 3.6E-02 [pr nm] Frequency for grounding per nautical mile 4.7E-07 [pr nm] Frequency for fatalities per nautical mile 2.8E-10 [pr nm]

ANNEX II
Page 2
ANNEX II.doc
Table 1-2 Risk based on collision model
Risk results Probability for collision given collision course 8.6E-06 [pr critical course] Fatality rate per person given collision course 4.6E-08 [pr critical course] Fatality rate per person given collision 5.4E-03 [pr collision event] Number of collision courses per nautical mile 4.4E-03 [pr nm] Frequency for collision per nautical mile 3.8E-08 [pr nm] Frequency for fatalities per nautical mile 2.0E-10 [pr nm]
The results are somewhat lower than the figures in the accident statistics, ref. ANNEX I. This is reasonable due to the fact that the statistics show a continuously declining accident trend. The main reasons are the improved vessel manoeuvrability and modern navigational equipment, which will ensure reduced accident frequency. However, the poor damage stability makes the cruise vessel vulnerable to hull damage, and therefore the consequences of both collision and grounding are considered to be severe. This is taken into account in the risk model.
The model results show that powered grounding represents 40% higher risk for loss of lives than collision. This is due to a higher accident frequency for grounding than for collision. Due to the high proportion of non-serious groundings, a collision is nine times as dangerous for people onboard as a grounding accident.
No fatal grounding accidents have occurred so far. However, the individual risk in this model shows a fatality frequency of 2.2E-05 per person year, i.e. with 2,000 people onboard, this means a fatality frequency of 0.044 per ship year (1 fatality every 23 years per ship). The model shows also that the potential risk for a catastrophic grounding accident with more than 100 people killed is 2.4E-04 per ship year, i.e. every 3,900 years per vessel in the fleet.
The corresponding figure for collision is an individual risk of 1.6E-05 per person year, which is in the same order as what the statistics show. A vessel in a typical trade with 2000 people on board has then a fatality frequency of 3.1E-02 per ship year due to collision (1 fatality every 32 years per ship). The potential risk for a catastrophic collision accident is 3.9E-05 per ship year, i.e. every 25,600 years per vessel in the fleet.
The most important experience from the project is the understanding of the relation between the influencing factors that contribute to grounding and collision. The most important use of the models will be as a tool to evaluate the effect of risk control options or new regulations. The models will thus be used in the next step of the FSA, which is the cost-benefit analysis of identified risk control options.
ANNEX II
Page 3
ANNEX II.doc
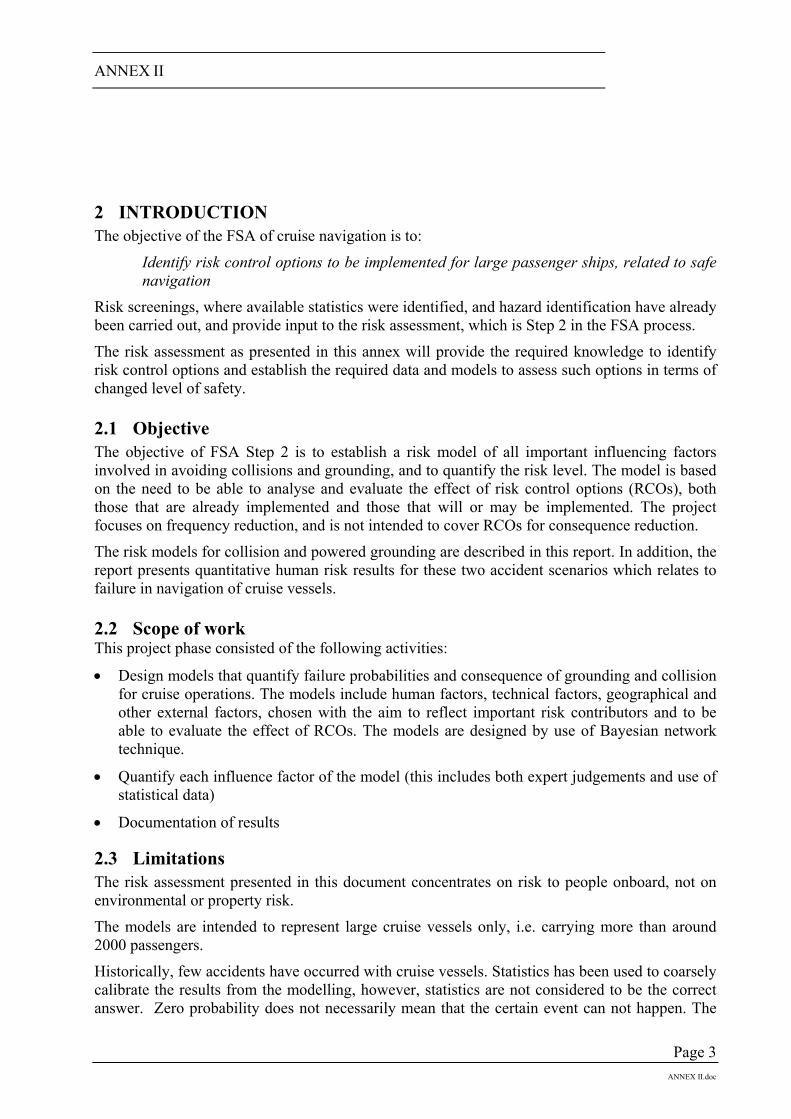
2 INTRODUCTION The objective of the FSA of cruise navigation is to:
Identify risk control options to be implemented for large passenger ships, related to safe navigation
Risk screenings, where available statistics were identified, and hazard identification have already been carried out, and provide input to the risk assessment, which is Step 2 in the FSA process.
The risk assessment as presented in this annex will provide the required knowledge to identify risk control options and establish the required data and models to assess such options in terms of changed level of safety.
2.1 Objective The objective of FSA Step 2 is to establish a risk model of all important influencing factors involved in avoiding collisions and grounding, and to quantify the risk level. The model is based on the need to be able to analyse and evaluate the effect of risk control options (RCOs), both those that are already implemented and those that will or may be implemented. The project focuses on frequency reduction, and is not intended to cover RCOs for consequence reduction.
The risk models for collision and powered grounding are described in this report. In addition, the report presents quantitative human risk results for these two accident scenarios which relates to failure in navigation of cruise vessels.
2.2 Scope of work This project phase consisted of the following activities:
• Design models that quantify failure probabilities and consequence of grounding and collision for cruise operations. The models include human factors, technical factors, geographical and other external factors, chosen with the aim to reflect important risk contributors and to be able to evaluate the effect of RCOs. The models are designed by use of Bayesian network technique.
• Quantify each influence factor of the model (this includes both expert judgements and use of statistical data)
• Documentation of results
2.3 Limitations The risk assessment presented in this document concentrates on risk to people onboard, not on environmental or property risk.
The models are intended to represent large cruise vessels only, i.e. carrying more than around 2000 passengers.
Historically, few accidents have occurred with cruise vessels. Statistics has been used to coarsely calibrate the results from the modelling, however, statistics are not considered to be the correct answer. Zero probability does not necessarily mean that the certain event can not happen. The

ANNEX II
Page 4
ANNEX II.doc
result from the modelling is therefore the best estimate on what is the actual risk level for collision and grounding of cruise vessels.
The risk includes only fatalities on own vessel, i.e. the cruise vessel, and not fatalities on the other vessel in case of collision. A cruise vessel may also pose risk to others through collisions; however, this is not included. Thus, leisure crafts are not included in the study, as they are a minor danger for cruise vessels.
2.4 Abbreviations CPT Conditional Probability Table DNV Det Norske Veritas OOW Officer On Watch RCO Risk Control Option VTS Vessel Traffic Service
3 METHODOLOGY
3.1 Introduction The objective of this task is to design a model that quantifies failure frequencies and consequences of collision and grounding for cruise vessel operations.
The models for collision and grounding are based on previous work carried out by DNV. DNV has extensive experience with risk modelling, e.g. ref. /5/; however, risk models for cruise vessels did not exist prior to the study. A considerable amount of work has therefore been put into designing credible models tailored for cruise operations.
A Bayesian network methodology is used to model the risk for collision and grounding. This method is considered as the best method to reveal dependencies between the contributing factors and the importance of the individual contributors. The model is thus excellent to evaluate the effect of risk reducing measures, including evaluating the effect of possible new regulations.
As a Bayesian network only calculates the probability of “failure” given a critical situation, this is combined with an Excel model that estimates the frequency or exposure. The failure frequencies for collision and grounding are estimated by combining the frequencies of critical situations with the probability of failure from the Bayesian network.
3.2 Bayesian network method for modelling 3.2.1 General A Bayesian network is a causal network that enables a graphical representation of causal relations between different parameters. The network consists of a set of nodes representing random variables and a set of links connecting these nodes, illustrated by arrows.
The model reveals explicitly the probabilistic dependence between the set of variables. Each variable could have a number of states, and has assigned a function that describes how the states of the node depend on the parents of the node, i.e. a conditional probability table (abbreviated CPT). This is illustrated in Figure 3.1, together with the network.

ANNEX II
Page 5
ANNEX II.doc
A CPT quantifies the effects that the parent nodes have on the child node. Each numeric value in the CPT is the probability of being in the state found in the left-most column in the actual row - when the parents (if any) are in the states found in the top of the actual column. Thus, the number of cells in a CPT for a discrete node equals the product of the number of possible states for the node and the product of the number of possible states for the parent nodes.
The values in this table are set manually. The basis for the conditional probabilities in a Bayesian network has background from well-founding theory and statistics as well as subjective estimates and expert judgements.
Figure 3-1 Example of Bayesian network and conditional probability table (CPT)
3.2.2 Bayesian theory
The Bayesian calculus, which is part of classical probability calculus, is based upon the theorem of Thomas Bayes, which states that:
P H e P e H P HP e
( | ) ( | ) ( )( )
=
where e : Event/Observation
H : Hypothesis
P(H|e) : Posterior probability
P(e|H) : Likelihood function

ANNEX II
Page 6
ANNEX II.doc
P(H) : Prior probability
A conditional probability statement is of the following kind:
Given the event e, the probability of the event H is x. The notation for this statement is P(H | e) = x. It should be noted that P(H | e) = x does not mean that whenever e is true, then the probability for H is x. It means that if e is true, and everything else known is irrelevant for H, then P(H) = x.
This is the basic method for establishing the conditional probability tables and calculation of the network as mentioned earlier.
3.2.3 HUGIN HUGIN is the project’s Bayesian network tool. The user interface contains a graphical editor, a compiler and a runtime system for construction, maintenance and usage of knowledge bases based on Bayesian network technology.
3.3 Data sources In the work process to establish the failure models for collision and grounding, various experts and data sources were used to ensure a solid foundation for the dependencies and figures entered into the model. Statistical data were used where available. Statistical data from other ship types was used where such data was transferable to cruise navigation without to much difficulties. If statistical data was not available, experts were interviewed or directly involved in the modelling process.
The persons involved during the project process in addition to the project team, are presented in Appendix E of ANNEX II.
The structure of the Bayesian network was extensively examined by navigators to ensure a logical model that included the important factors relevant for navigational performance, ref. Appendix E of ANNEX II.
Statistical probability input is used if available. This is typically for nodes concerning reliability of technical equipment/systems and some input on human factors. The sources used are presented in the node description in Appendix C of ANNEX II.
For nodes where no statistical information was available, expert workshops have been arranged. Important probabilities of each node related to causes of grounding and collision were discussed and verified. More on the process and the people involved in this workshop is presented in Appendix E. References to these workshops are made in the node description in Appendix C.
The project team has also been on a field trip sailing with the Coastal Express M/S “Finnmarken”, ref. /4/, a Ro-Ro/Passenger vessel which is trading on the Norwegian coast from Bergen to Kirkenes. Navigation of this vessel is considered to be very similar to navigation of a cruise vessel and the vessel is equipped with the latest within navigation, communication, and safety equipment. The project team spent most of the time onboard on the bridge together with the navigators, both during day and night. The navigators gave valuable input to the project, both regarding navigation in general and improvement areas in particular.
ANNEX II
Page 7
ANNEX II.doc
4 THE RISK MODELS
4.1 General The accident scenarios collision and grounding have been modelled as relying on accident statistics is not possible. Statistics present events in the past and may exclude severe scenarios that have not yet happened, especially if the data foundation is poor. In addition, the quality and sensitivity of the results are quite dependent on the extent of data. If accident statistics only are including few cases representing an accident scenario, one additional serious accident can dramatically change the results. For cruise vessels, the statistical foundation is limited compared to most other vessel types, due to relatively small fleet.
When modelling a scenario, all important parameters that influence the frequency and the consequence of the event are included, regardless of whether similar accidents have happened. This cause analysis enables an effective evaluation of introducing risk control options (RCOs).
The model is based on the need to be able to analyse and evaluate the effect of RCOs, both those that are already implemented and those that will be implemented shortly. The models are, however, not intended to cover RCOs for consequence reduction.
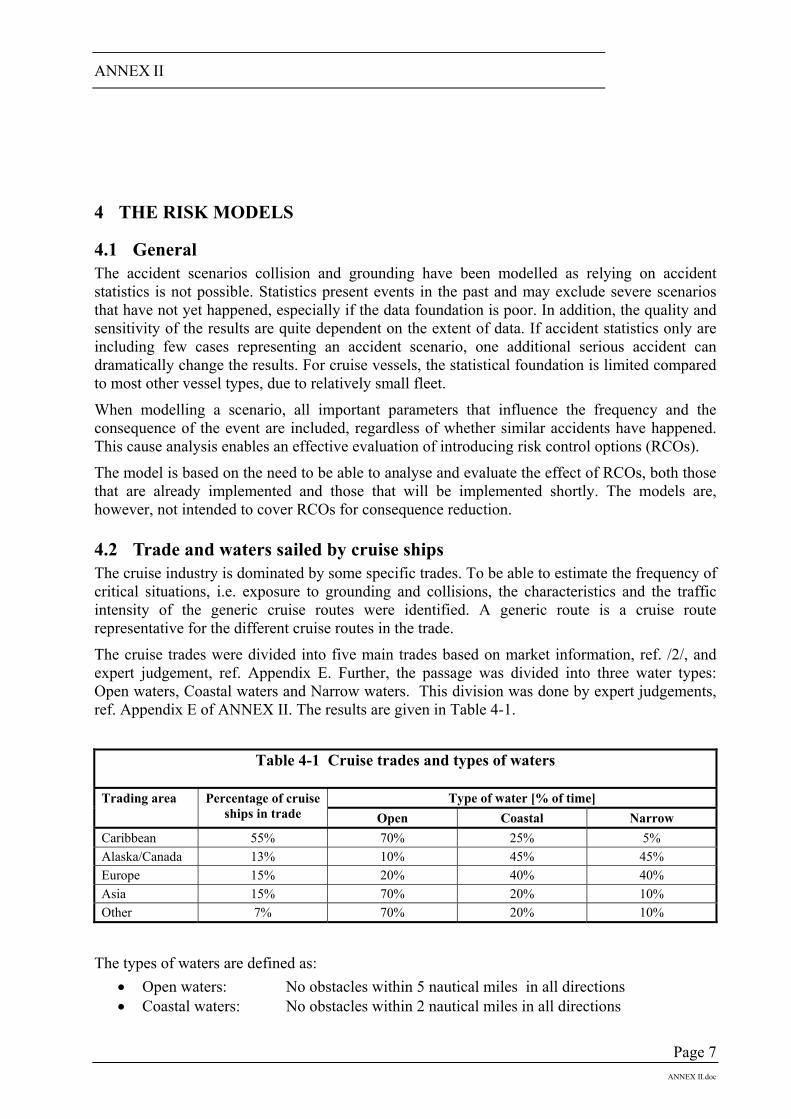
4.2 Trade and waters sailed by cruise ships The cruise industry is dominated by some specific trades. To be able to estimate the frequency of critical situations, i.e. exposure to grounding and collisions, the characteristics and the traffic intensity of the generic cruise routes were identified. A generic route is a cruise route representative for the different cruise routes in the trade.
The cruise trades were divided into five main trades based on market information, ref. /2/, and expert judgement, ref. Appendix E. Further, the passage was divided into three water types: Open waters, Coastal waters and Narrow waters. This division was done by expert judgements, ref. Appendix E of ANNEX II. The results are given in Table 4-1.
Table 4-1 Cruise trades and types of waters
Type of water [% of time] Trading area Percentage of cruise
ships in trade Open Coastal Narrow Caribbean 55% 70% 25% 5% Alaska/Canada 13% 10% 45% 45% Europe 15% 20% 40% 40% Asia 15% 70% 20% 10% Other 7% 70% 20% 10%
The types of waters are defined as: • Open waters: No obstacles within 5 nautical miles in all directions • Coastal waters: No obstacles within 2 nautical miles in all directions

ANNEX II
Page 8
ANNEX II.doc
• Narrow waters: No obstacles within 0.5 nautical miles in any direction The division into water types enable a calculation of the frequency of critical courses towards shore and the number of collision courses a cruise vessel is likely to encounter. E.g. a cruise vessel will have more critical courses in coastal waters and a meeting situation in narrow waters is more likely to give a collision course than a meeting situation in open waters.
4.3 The grounding scenario It is distinguished between powered grounding and drift grounding, defined as follows:
Powered grounding – An event in which grounding occurs because a vessel proceeds down an unsafe track, even though it is able to follow a safe track, due to errors related to human or technical failure.
Drift grounding - An event in which grounding occurs because the vessel is unable to follow a safe track due to mechanical failure, adverse environmental conditions, anchor failure, and assistance failure.
Only powered grounding is considered to be navigation related. Drift grounding is therefore not considered in this study. ‘Grounding’ in this report is thus equivalent with ‘Powered grounding’.
Figure 4-1 gives a brief overview of the risk model developed by Bayesian network for grounding. The nodes are only illustrative and are not the nodes used in the actual model, which has a far higher level of detail and is enclosed in Appendix A.
GROUNDING
Course towards shore Vessel loose control Technical
Human performance
Safety Culture
Management factorsPersonnel factorsWork conditions
No/insufficient action
Vigilance
Vessel damage
Fatalities
1
23 4
5
Figure 4-1 Overview of Bayesian grounding model
ANNEX II
Page 9
ANNEX II.doc
Briefly explained, the left side of the figure illustrates the level of grounding risk that the vessel is exposed to, while the right side indicates how well the ship handles this risk. The lower part of the diagram illustrates the consequences.
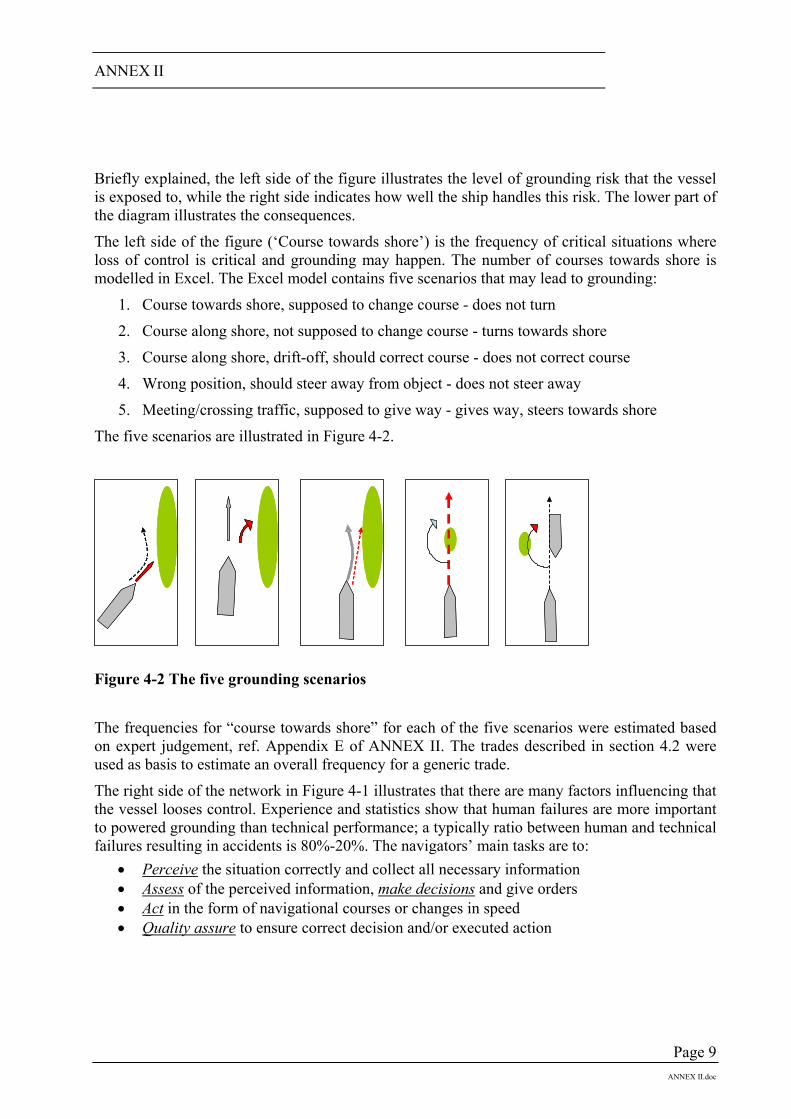
The left side of the figure (‘Course towards shore’) is the frequency of critical situations where loss of control is critical and grounding may happen. The number of courses towards shore is modelled in Excel. The Excel model contains five scenarios that may lead to grounding:
1. Course towards shore, supposed to change course - does not turn
2. Course along shore, not supposed to change course - turns towards shore
3. Course along shore, drift-off, should correct course - does not correct course
4. Wrong position, should steer away from object - does not steer away
5. Meeting/crossing traffic, supposed to give way - gives way, steers towards shore
The five scenarios are illustrated in Figure 4-2.
Figure 4-2 The five grounding scenarios
The frequencies for “course towards shore” for each of the five scenarios were estimated based on expert judgement, ref. Appendix E of ANNEX II. The trades described in section 4.2 were used as basis to estimate an overall frequency for a generic trade.
The right side of the network in Figure 4-1 illustrates that there are many factors influencing that the vessel looses control. Experience and statistics show that human failures are more important to powered grounding than technical performance; a typically ratio between human and technical failures resulting in accidents is 80%-20%. The navigators’ main tasks are to:
• Perceive the situation correctly and collect all necessary information • Assess of the perceived information, make decisions and give orders • Act in the form of navigational courses or changes in speed • Quality assure to ensure correct decision and/or executed action

ANNEX II
Page 10
ANNEX II.doc
The ability to perform the tasks with high attention and under an acceptable stress level is influenced by several factors:
• Management factors – training of personnel, planning routines, checklists before start-up, evacuation drills, etc.
• Working conditions: - Internal: hours on watch, responsibilities, bridge design, distraction level, etc. - External: weather, visibility, marking of lane, day/night, etc.
• Personal factors - the physical and mental state of the officer on watch (tired, stress level, intoxicated, etc.)
If the OOW is not able to react or has not discovered the dangerous course, it is taken into account in the model that there may be some sort of vigilance onboard the vessel (e.g. OOW no. 2 or pilot) or externally (VTS).
Also the technical performance of the ship is important to avoid grounding. However, loss of propulsion resulting in drift grounding is not considered in this project. Failure of steering is, however, modelled as this is necessary to avoid the danger.
Both human and technical performance is influenced by the company’s safety culture, i.e. how well the vessel operating company deals with safety issues and how well the company promotes a good safety mindset among its employees.
The combination of a critical course and no avoiding action (human or technical) is represented as the vessel has lost control. Grounding is then the result.
The degree of severity in vessel damage and internal and external circumstances will influence the probability of fatality per person on board, i.e. individual risk.
Due to the complexity and the extent of the model, the model is not included in full in the main report. The complete model may be found in Appendix A. Included in this appendix is also the probability input to the grounding network.
The nodes from the grounding network are described in Appendix C of ANNEX II. The Excel model describing the exposure is included in Appendix D of ANNEX II.
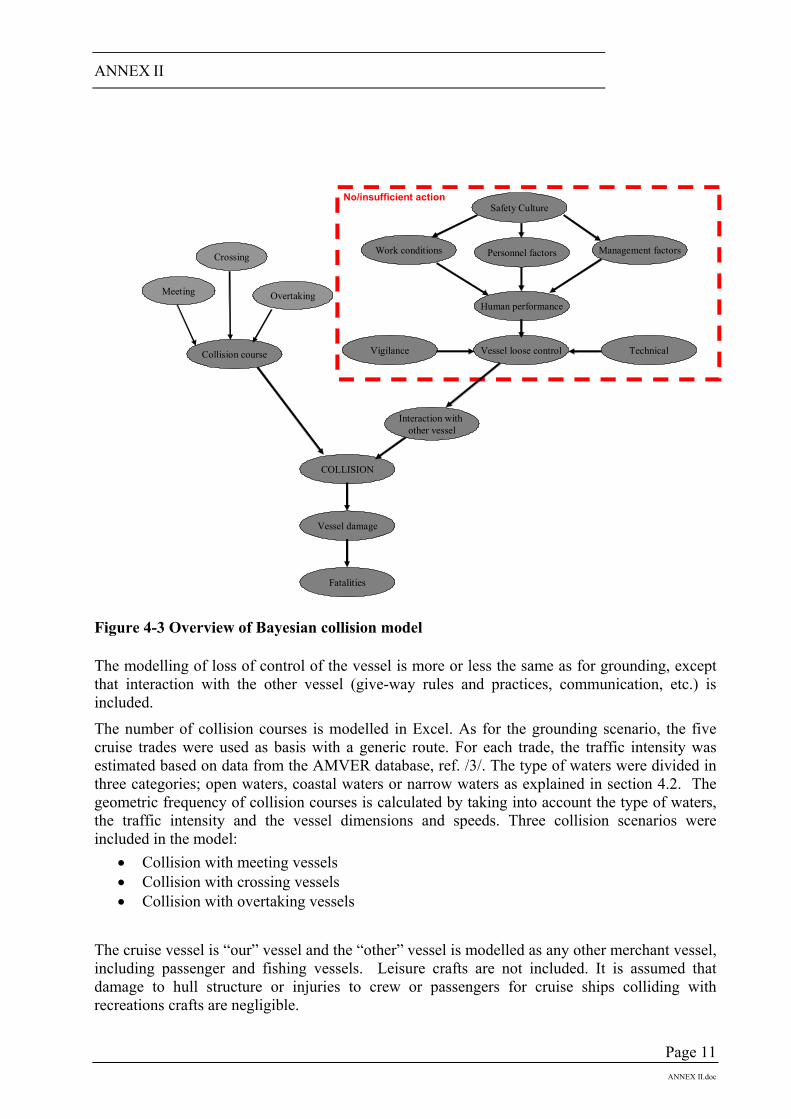
4.4 The collision scenario Collision is in this study defined as one vessel hitting another vessel. Navigational or technical failures, which cause loss of control on one of the vessels, will cause collision if the other vessel is not able to prevent the collision. The two vessels are addressed as own vessel and other vessel. Figure 4-3 gives an overview of the risk model developed in the Bayesian network for collision.
Collision is based on the same model as grounding, taking into account the following differences:
• collision with an object that moves • the object’s exact position can not be planned on beforehand • collision is with an object that can react to the situation • unpredictable reactions from other object are possible
ANNEX II
Page 11
ANNEX II.doc
COLLISION
Collision course Vessel loose control Technical
Human performance
Safety Culture
Management factorsPersonnel factorsWork conditions
No/insufficient action
Vigilance
Vessel damage
Fatalities
Meeting
Crossing
Overtaking
Interaction with other vessel
Figure 4-3 Overview of Bayesian collision model
The modelling of loss of control of the vessel is more or less the same as for grounding, except that interaction with the other vessel (give-way rules and practices, communication, etc.) is included.
The number of collision courses is modelled in Excel. As for the grounding scenario, the five cruise trades were used as basis with a generic route. For each trade, the traffic intensity was estimated based on data from the AMVER database, ref. /3/. The type of waters were divided in three categories; open waters, coastal waters or narrow waters as explained in section 4.2. The geometric frequency of collision courses is calculated by taking into account the type of waters, the traffic intensity and the vessel dimensions and speeds. Three collision scenarios were included in the model:
• Collision with meeting vessels • Collision with crossing vessels • Collision with overtaking vessels
The cruise vessel is “our” vessel and the “other” vessel is modelled as any other merchant vessel, including passenger and fishing vessels. Leisure crafts are not included. It is assumed that damage to hull structure or injuries to crew or passengers for cruise ships colliding with recreations crafts are negligible.
ANNEX II
Page 12
ANNEX II.doc
Due to the complexity and the extent of the model, the model is not included in full in the main part of ANNEX II. The complete model may be found in Appendix B of ANNEX II. Included in this appendix is also the probability input to the grounding network.
The nodes from the collision network are described in Appendix C of ANNEX II. The Excel model describing the exposure is included in Appendix D of ANNEX II.
5 RESULTS This section presents the results from the grounding and collision models as described in section 4, as well as generic accident frequencies for the other accident scenarios.
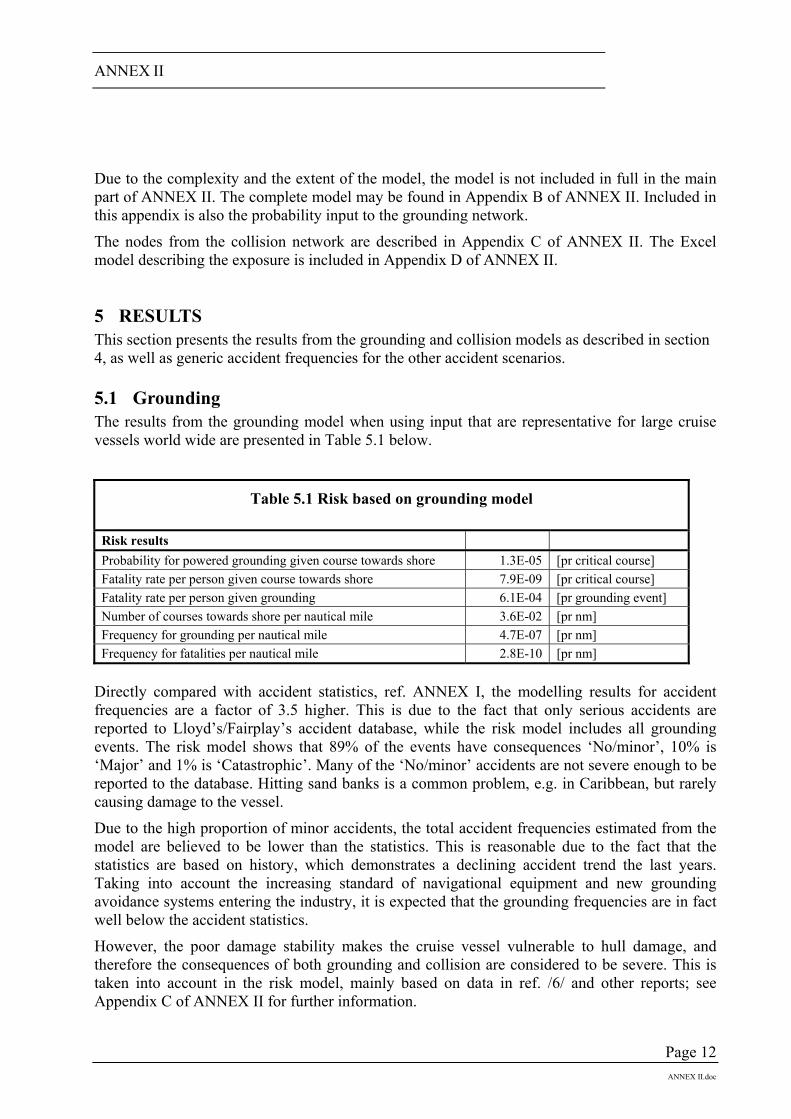
5.1 Grounding The results from the grounding model when using input that are representative for large cruise vessels world wide are presented in Table 5.1 below.
Table 5.1 Risk based on grounding model
Risk results Probability for powered grounding given course towards shore 1.3E-05 [pr critical course] Fatality rate per person given course towards shore 7.9E-09 [pr critical course] Fatality rate per person given grounding 6.1E-04 [pr grounding event] Number of courses towards shore per nautical mile 3.6E-02 [pr nm] Frequency for grounding per nautical mile 4.7E-07 [pr nm] Frequency for fatalities per nautical mile 2.8E-10 [pr nm]
Directly compared with accident statistics, ref. ANNEX I, the modelling results for accident frequencies are a factor of 3.5 higher. This is due to the fact that only serious accidents are reported to Lloyd’s/Fairplay’s accident database, while the risk model includes all grounding events. The risk model shows that 89% of the events have consequences ‘No/minor’, 10% is ‘Major’ and 1% is ‘Catastrophic’. Many of the ‘No/minor’ accidents are not severe enough to be reported to the database. Hitting sand banks is a common problem, e.g. in Caribbean, but rarely causing damage to the vessel.
Due to the high proportion of minor accidents, the total accident frequencies estimated from the model are believed to be lower than the statistics. This is reasonable due to the fact that the statistics are based on history, which demonstrates a declining accident trend the last years. Taking into account the increasing standard of navigational equipment and new grounding avoidance systems entering the industry, it is expected that the grounding frequencies are in fact well below the accident statistics.
However, the poor damage stability makes the cruise vessel vulnerable to hull damage, and therefore the consequences of both grounding and collision are considered to be severe. This is taken into account in the risk model, mainly based on data in ref. /6/ and other reports; see Appendix C of ANNEX II for further information.
ANNEX II
Page 13
ANNEX II.doc
No fatal grounding accidents have occurred so far for cruise vessels according to the statistics. Ref. ANNEX I shows therefore zero frequency for fatal outcome. The individual risk in this model shows a frequency of 2.8E-10 per nm, i.e. 2.2E-05 per person year with a typically weekly trade of 1500 nm. This means that a cruise vessel trading with 2,000 people onboard has a fatality frequency of 0.044 per ship year due to grounding (1 fatality every 23 years).
The model shows that the potential risk for a catastrophic grounding accident with more than 100 people killed is 2.4E-04 per ship year, i.e. every 3,900 years per vessel in the fleet.
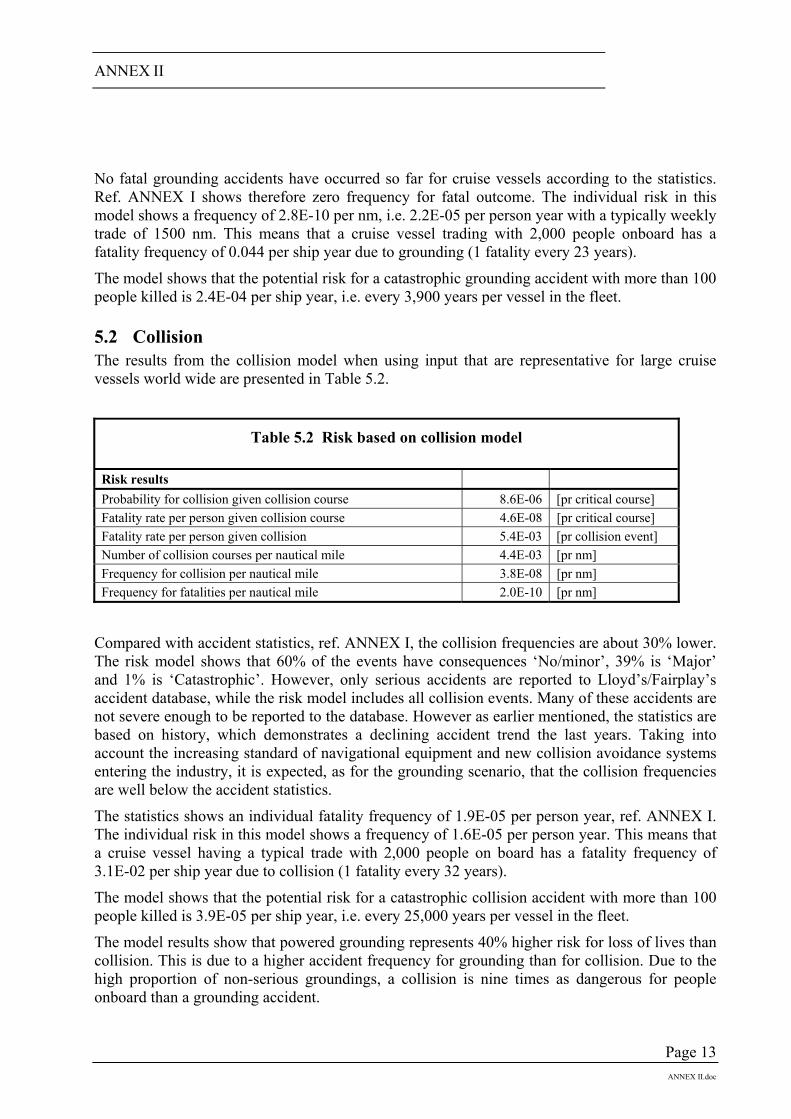
5.2 Collision The results from the collision model when using input that are representative for large cruise vessels world wide are presented in Table 5.2.
Table 5.2 Risk based on collision model
Risk results Probability for collision given collision course 8.6E-06 [pr critical course] Fatality rate per person given collision course 4.6E-08 [pr critical course] Fatality rate per person given collision 5.4E-03 [pr collision event] Number of collision courses per nautical mile 4.4E-03 [pr nm] Frequency for collision per nautical mile 3.8E-08 [pr nm] Frequency for fatalities per nautical mile 2.0E-10 [pr nm]
Compared with accident statistics, ref. ANNEX I, the collision frequencies are about 30% lower. The risk model shows that 60% of the events have consequences ‘No/minor’, 39% is ‘Major’ and 1% is ‘Catastrophic’. However, only serious accidents are reported to Lloyd’s/Fairplay’s accident database, while the risk model includes all collision events. Many of these accidents are not severe enough to be reported to the database. However as earlier mentioned, the statistics are based on history, which demonstrates a declining accident trend the last years. Taking into account the increasing standard of navigational equipment and new collision avoidance systems entering the industry, it is expected, as for the grounding scenario, that the collision frequencies are well below the accident statistics.
The statistics shows an individual fatality frequency of 1.9E-05 per person year, ref. ANNEX I. The individual risk in this model shows a frequency of 1.6E-05 per person year. This means that a cruise vessel having a typical trade with 2,000 people on board has a fatality frequency of 3.1E-02 per ship year due to collision (1 fatality every 32 years).
The model shows that the potential risk for a catastrophic collision accident with more than 100 people killed is 3.9E-05 per ship year, i.e. every 25,000 years per vessel in the fleet.
The model results show that powered grounding represents 40% higher risk for loss of lives than collision. This is due to a higher accident frequency for grounding than for collision. Due to the high proportion of non-serious groundings, a collision is nine times as dangerous for people onboard than a grounding accident.

ANNEX II
Page 14
ANNEX II.doc
6 REFERENCES
/1/ MSC 72/21
/2/
Maryland Port Administration Cruise Market Study and Economic Assessment, Bermello, Ajamil and Partners, February 2002. Information from CLIA (Cruise Lines International Association Marketing Edition 2001 and Cruise Industry News Annual 2001.
/3/
AMVER, Annually reporting frequency for the AMVER vessels, received for 2001, provided by Carroll, E., US Coast Guard, 2002.
http://www.amver.com/
/4/ Link to more information on M/S “Finnmarken”: http://www.hurtigruten.com/uk/msfinnma.html
/5/ SPIN WP 3.3 Risk modelling report, November 2002
/6/ SLF 46/INF 5, June 2003
- o0o -
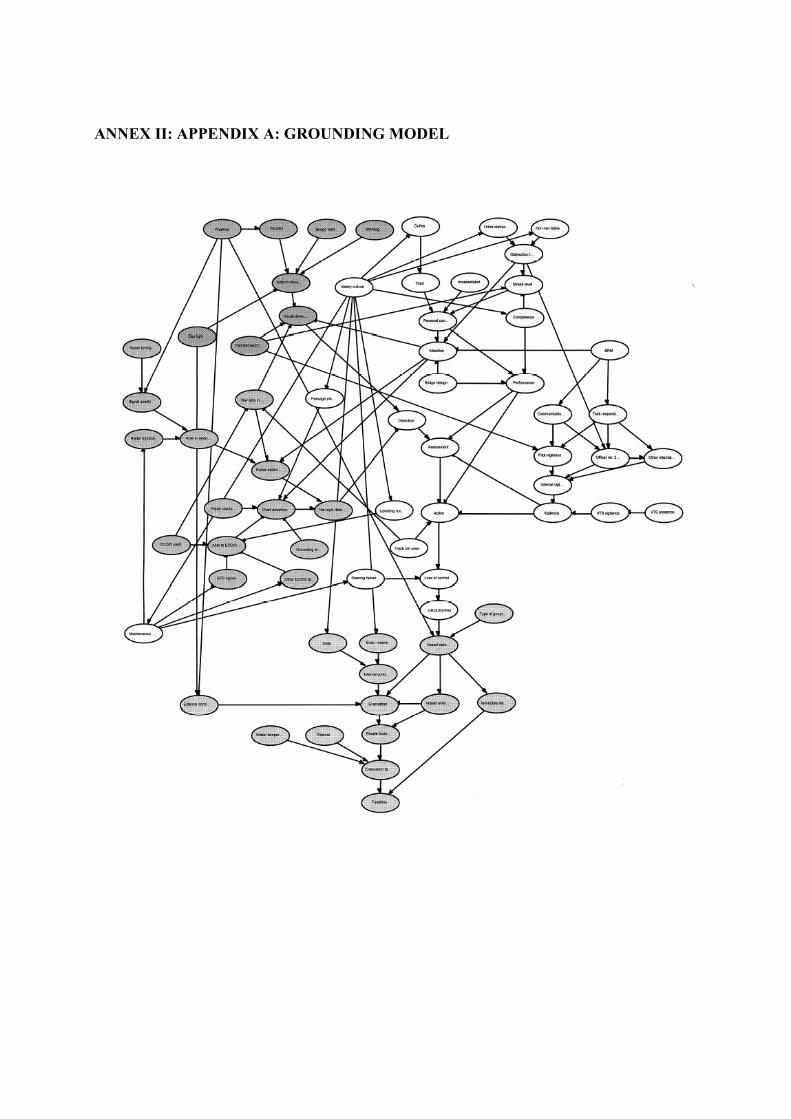
ANNEX II: APPENDIX A: GROUNDING MODEL


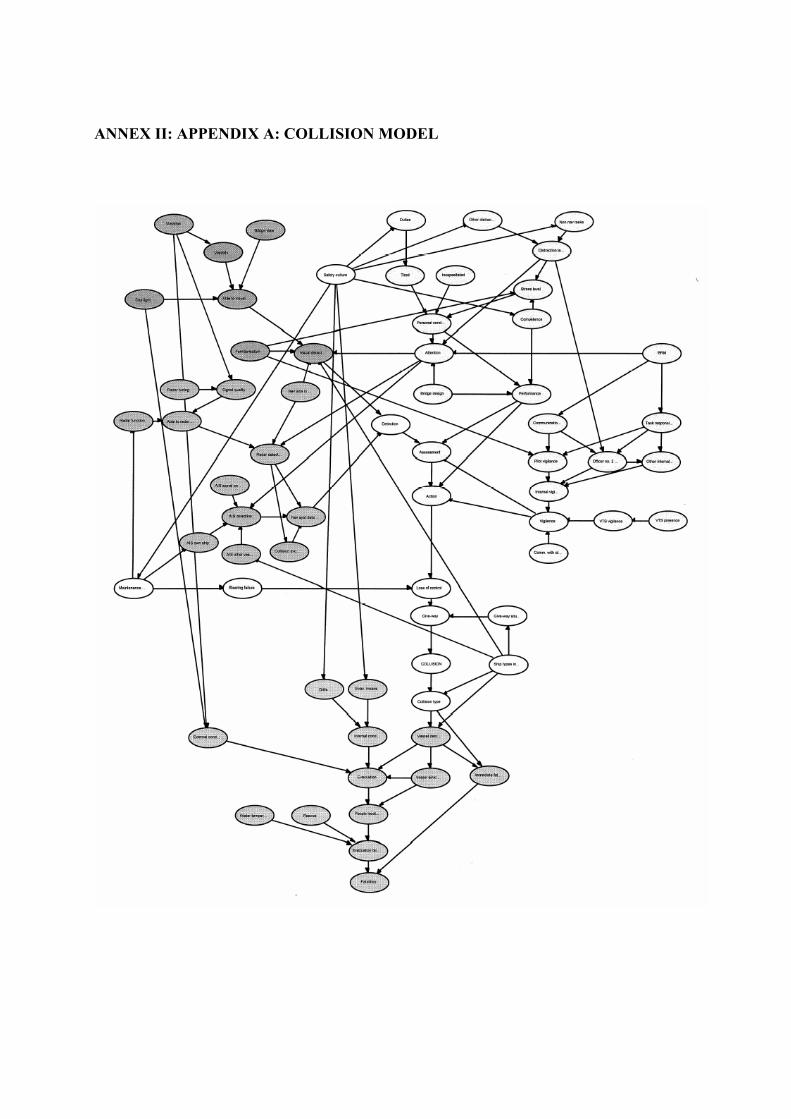
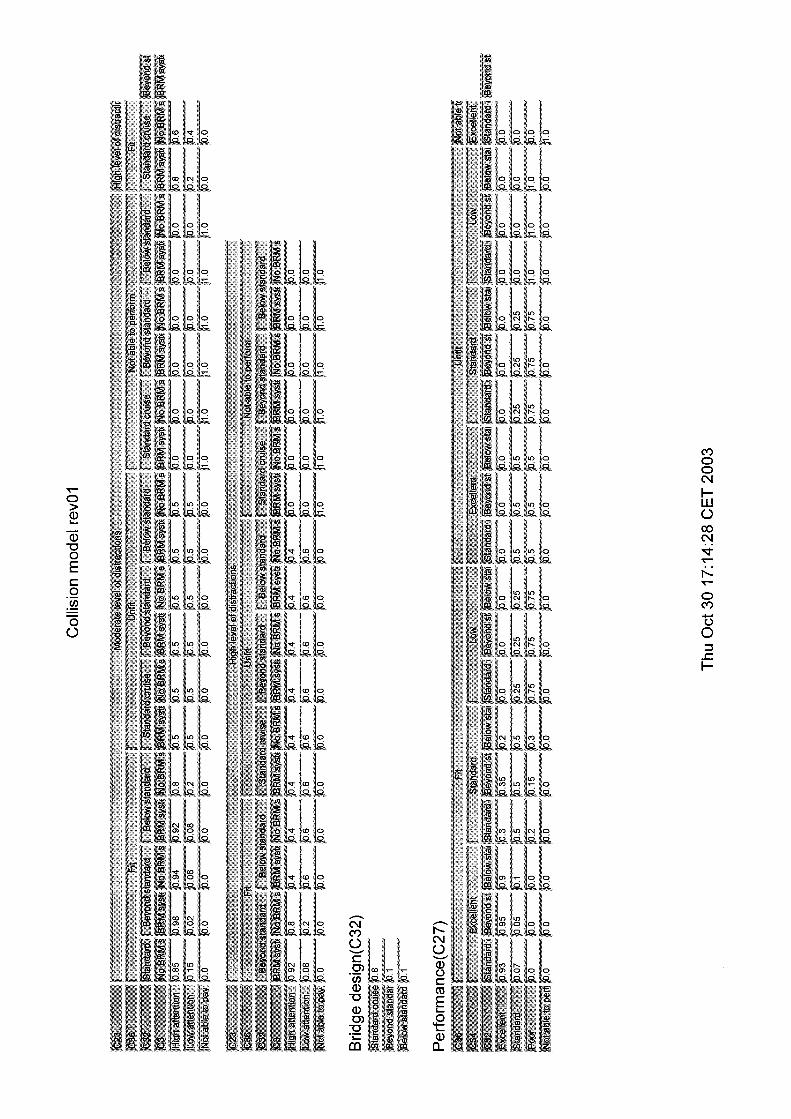
ANNEX II: APPENDIX A: COLLISION MODEL


ANNEX II, APPENDIX C
Page 1 /annex ii - appendix c.doc
ANNEX II: APPENDIX C: NODE DESCRIPTION C1 INTRODUCTION ....................................................................................................... 1
C2 ABBREVIATIONS ..................................................................................................... 2
C3 GROUNDING MODEL .............................................................................................. 3 C3.1 Visual detection 3 C3.2 Navigational aid detection 5 C3.3 Management factors 8 C3.4 Human factors 8 C3.5 Technical reliability 11 C3.6 Support 12 C3.7 Overall 13 C3.8 Consequences 14
C4 COLLISION MODEL ............................................................................................... 16 C4.1 Identical nodes 16 C4.2 Collision specific nodes 18
C5 REFERENCES........................................................................................................... 21
C1 INTRODUCTION
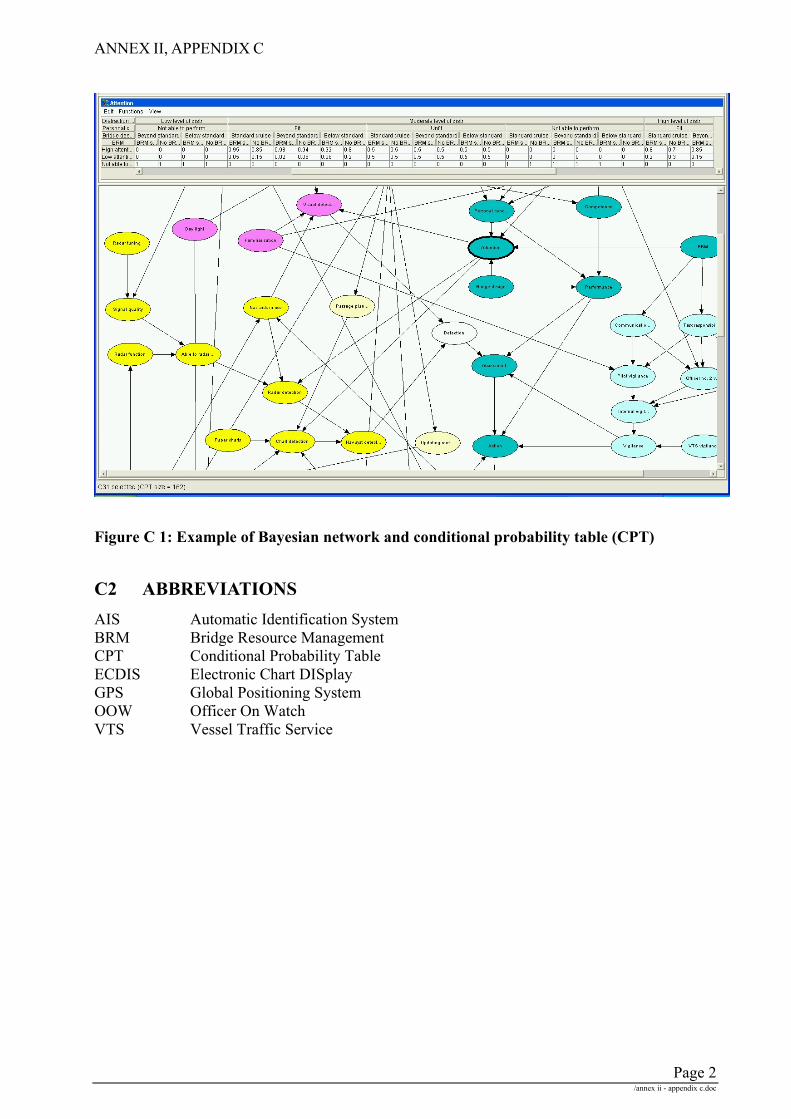
In a Bayesian Network the node represents a discrete random variable with a number of states. Each node in the Bayesian network is assigned a conditional probability table (abbreviated CPT). The values in this table are set manually, see figure Figure C 1.
Each numerical value in the CPT is the probability being in the state found in the leftmost column in the actual row - when the parents (if any) are in the states found in the top of the actual column.
All nodes, states and probability values are defined by the project. In the following, a short description of each node is given, together with a list of states. The CPTs are included in Appendix A and B of ANNEX II. It is recommended to have the printout of the model structure in Appendix A and B available when reading the node description.
ANNEX II, APPENDIX C
Page 2 /annex ii - appendix c.doc
Figure C 1: Example of Bayesian network and conditional probability table (CPT)
C2 ABBREVIATIONS AIS Automatic Identification System BRM Bridge Resource Management CPT Conditional Probability Table ECDIS Electronic Chart DISplay GPS Global Positioning System OOW Officer On Watch VTS Vessel Traffic Service
ANNEX II, APPENDIX C
Page 3 /annex ii - appendix c.doc
C3 GROUNDING MODEL
In the following, nodes used in the grounding model are briefly described.
C3.1 Visual detection
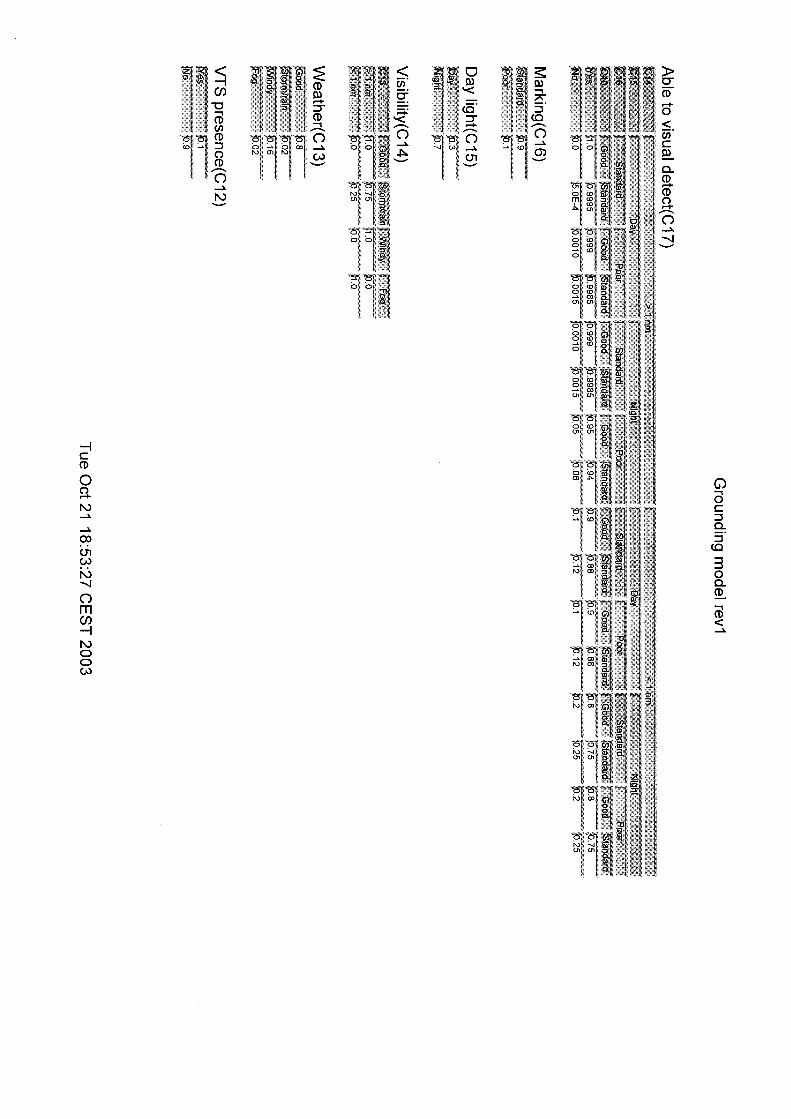
Weather The node describes the most important weather conditions relevant for the operation of a large passenger vessel. The states defined for this node are the following: States: - Good (typically good visibility and no critical wind speeds)
- Storm/rain (strong winds including good to significantly reduced visibility) - Windy (strong winds, no reduced visibility) - Fog (significantly reduced visibility)
The sum of the probabilities for all states is 1.
The probability distribution of the different weather states is based on judgement and data on geographical areas for cruise trades, ref. Table D.1 in Appendix D of ANNEX II. Visibility The node defines the probability distribution for the visibility, conditional on the weather. The states defined for this node are the following: States: - > 1 nm
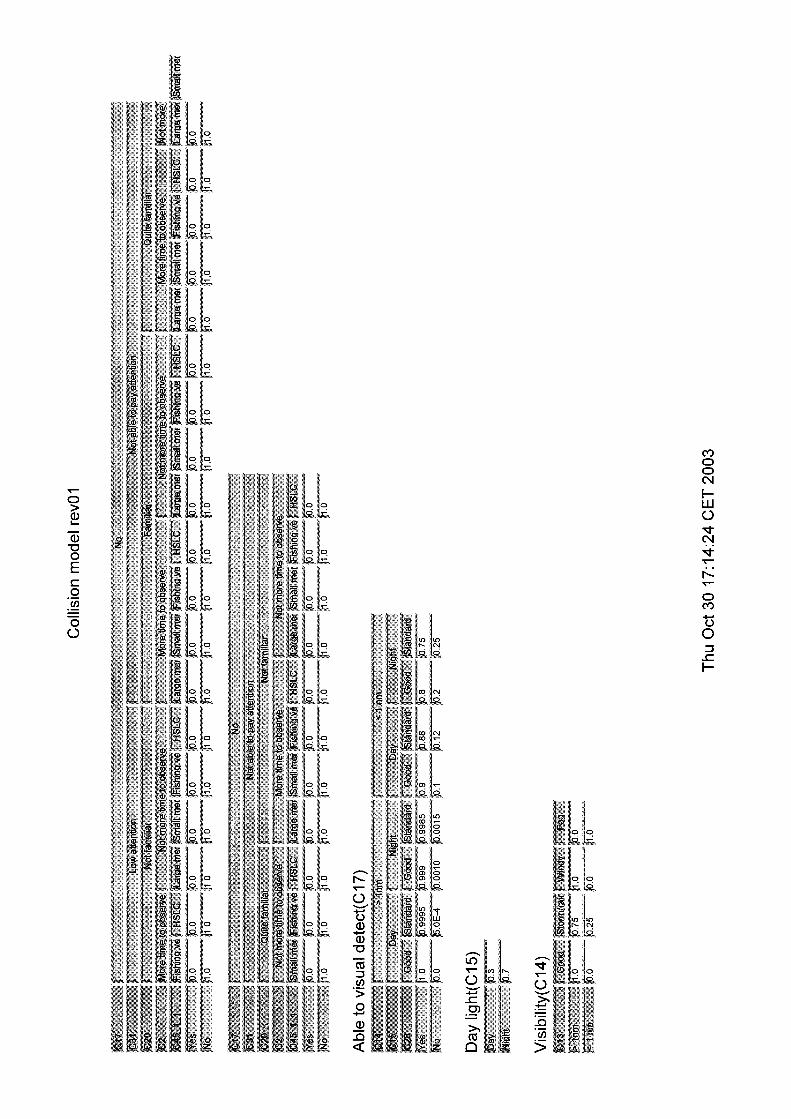
- < 1 nm The conditional probabilities in this node are based on ref. /1/. Good weather equivalents good visibility (> 1 nm), while fog is defined as poor visibility (< 1 nm). Storm/rain reduces the visibility > 1 nm by 25%. Daylight The node shows the probability distribution for day/night when the vessel is in operation. State “night” is given a higher probability due to the fact that. On average, large passenger vessels operate more during the night than in the day. The states defined for this node are the following: States: - Day
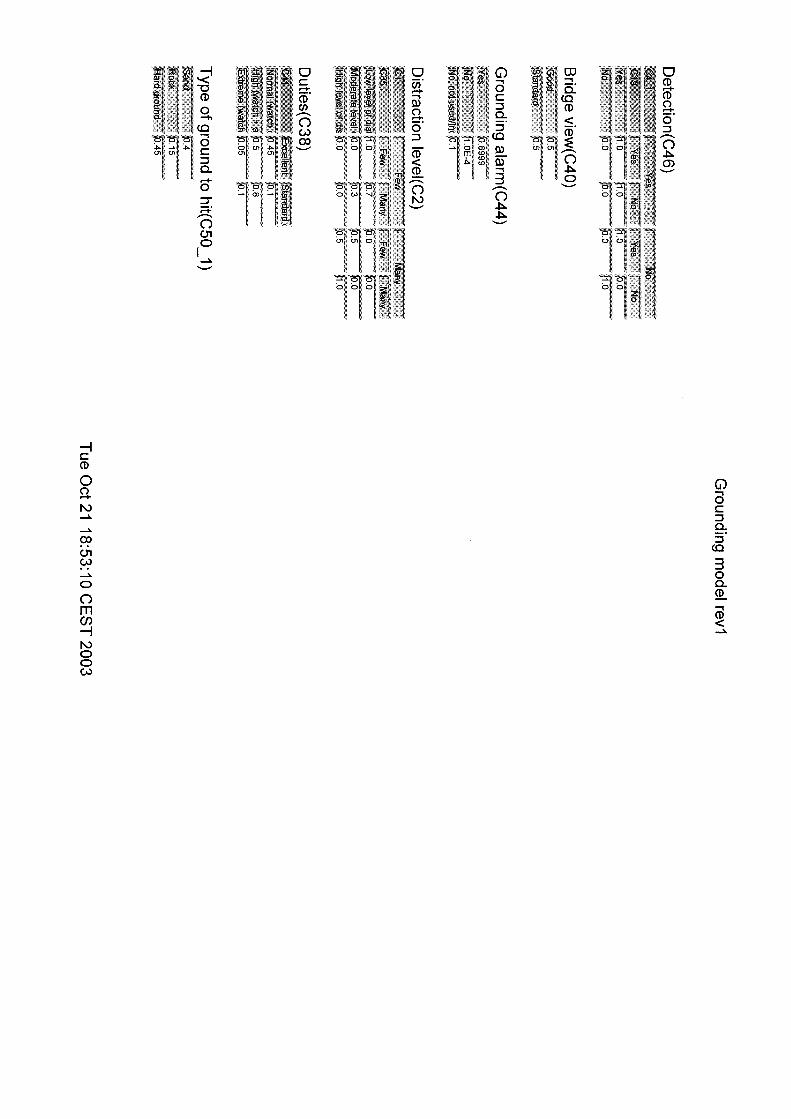
- Night The conditional probabilities in this node are based on ref. /1/. Bridge view The node describes the view from the bridge. The view is influenced by the window design, window dividers, windscreen wiper, salt on window, etc. The states defined for this node are the following: States: - Good
- Standard The conditional probabilities in this node are based on ref. /1/. Marking
ANNEX II, APPENDIX C
Page 4 /annex ii - appendix c.doc
This node describes the status of the nautical marking as a weighted average world wide for the areas where cruise ships trade. States: - Standard (i.e. sufficient marking)
- Poor (i.e. not sufficient marking) The conditional probabilities in this node are based on ref. /1/. Able to visual detect This node describes whether the external environment and conditions makes it possible to visually detect an approaching object in time. States: - Yes
- No The conditional probabilities in this node are based on ref. /1/. The figures are based on a probability of 0.0005 (1 out of 2,000 times) that the officer on watch (OOW) is not to be able to visually detect the danger in good visibility with standard marking and bridge view in day light. The other probabilities in the node’s CPT are an adjustment of this figure, performed by the project team. Familiarisation The node describes whether the OOW has experience in sailing in the area. States: - Familiar, i.e. sails in regular trade/route in the area
- Quite familiar, i.e. sails enough to get a fairway certificate
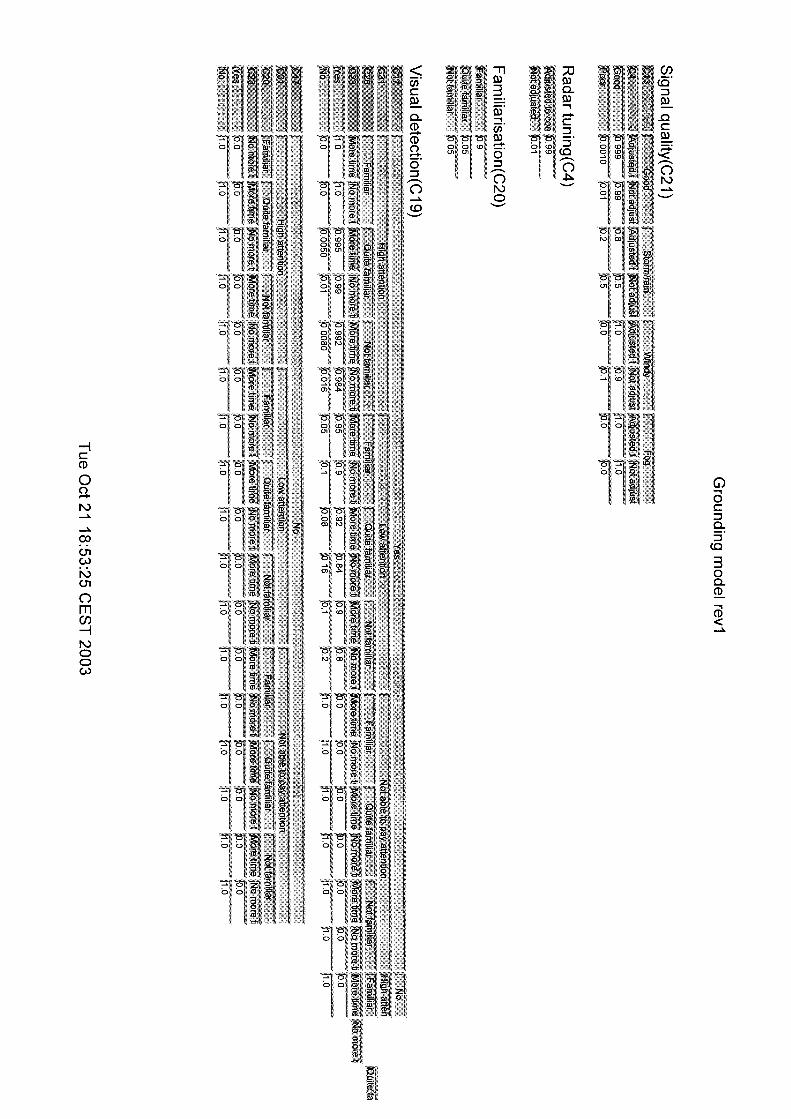
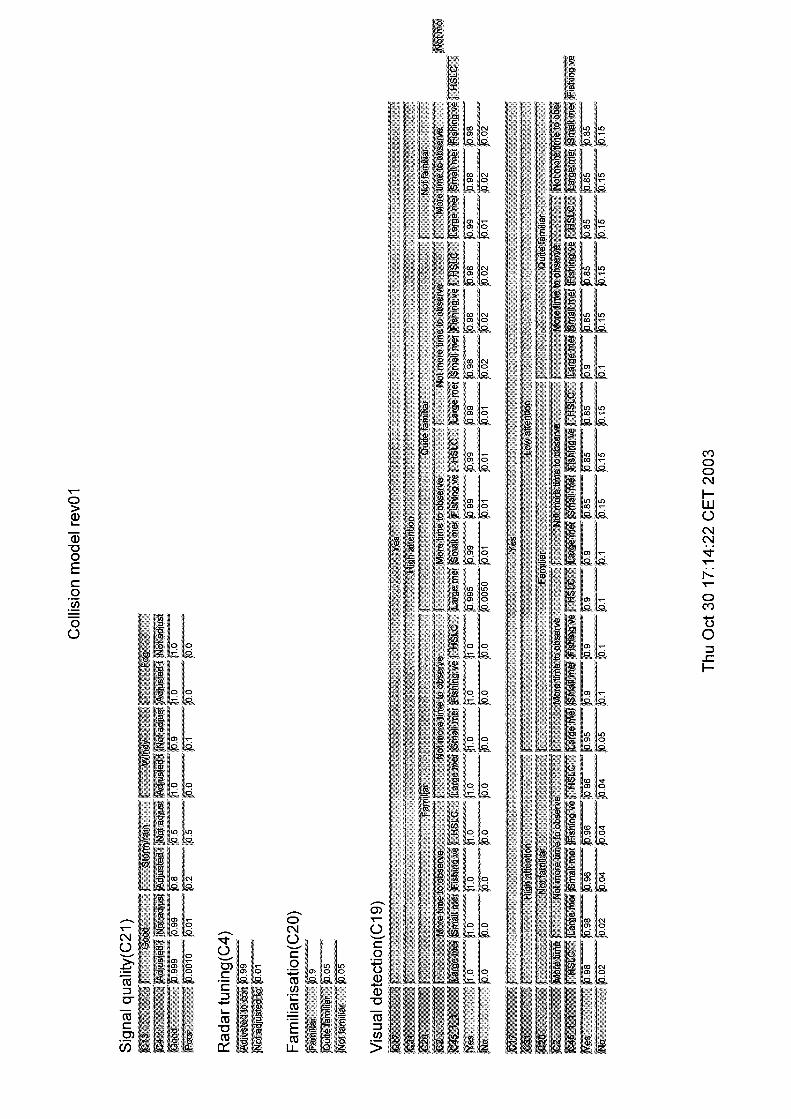
- Not familiar (i.e. needs pilot onboard) The conditional probabilities in this node are based on ref. /1/. Visual detection
Visual detection indicates whether the OOW visually detects the danger. For the collision scenario, the danger is to fail to detect an approaching vessel, and for grounding, the danger is to fail to detect that the vessel is heading towards shore, rocks, etc.
The ability depends of course on whether it is physically possible to see the danger. However, also the attention, how familiar the area is and whether navigational aids are used, will influence this node. Navigational aids are ECDIS and track control, as such instruments will liberate time to danger detection. States: - Yes
- No
The conditional probabilities in this node are based on ref. /1/. The figures are based on a probability of 1 that the danger is detected with an OOW with high attention who is familiar in the area. If the OOW is only quite familiar in the area, the probability for visually detection is reduced by 0.5% to 0.995.
The other probabilities in the node’s CPT are an adjustment of this figure, performed by the project team.
ANNEX II, APPENDIX C
Page 5 /annex ii - appendix c.doc
C3.2 Navigational aid detection
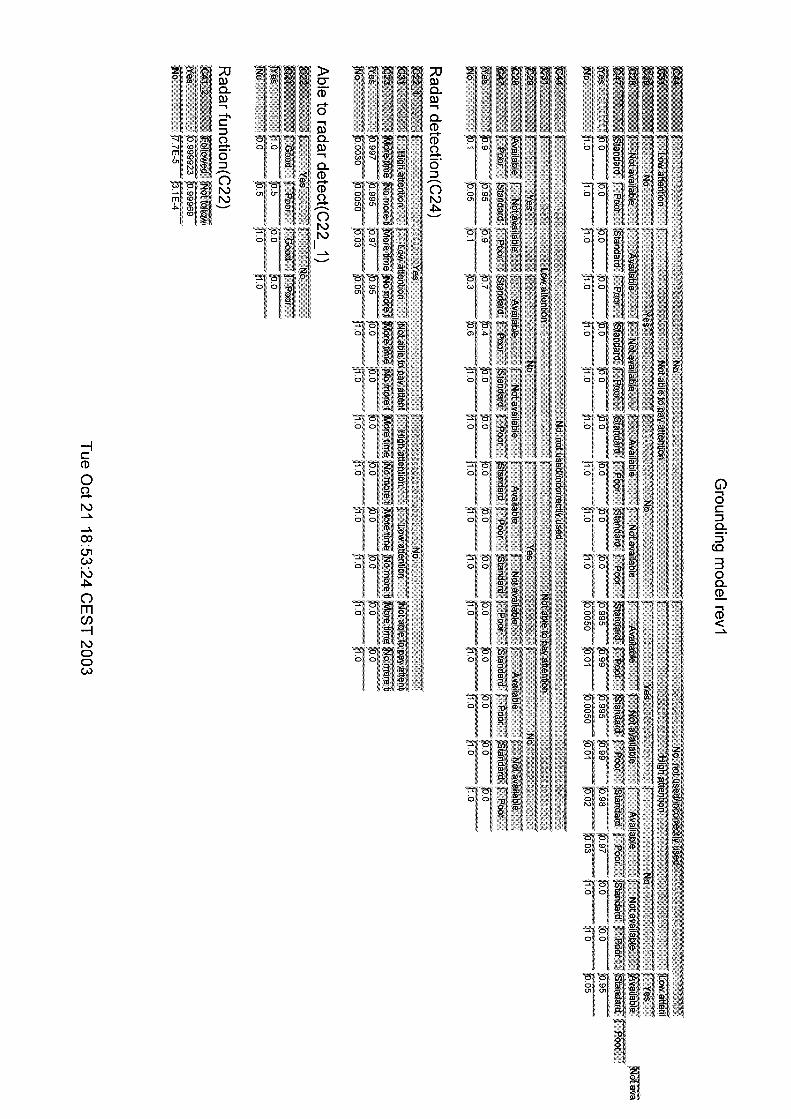
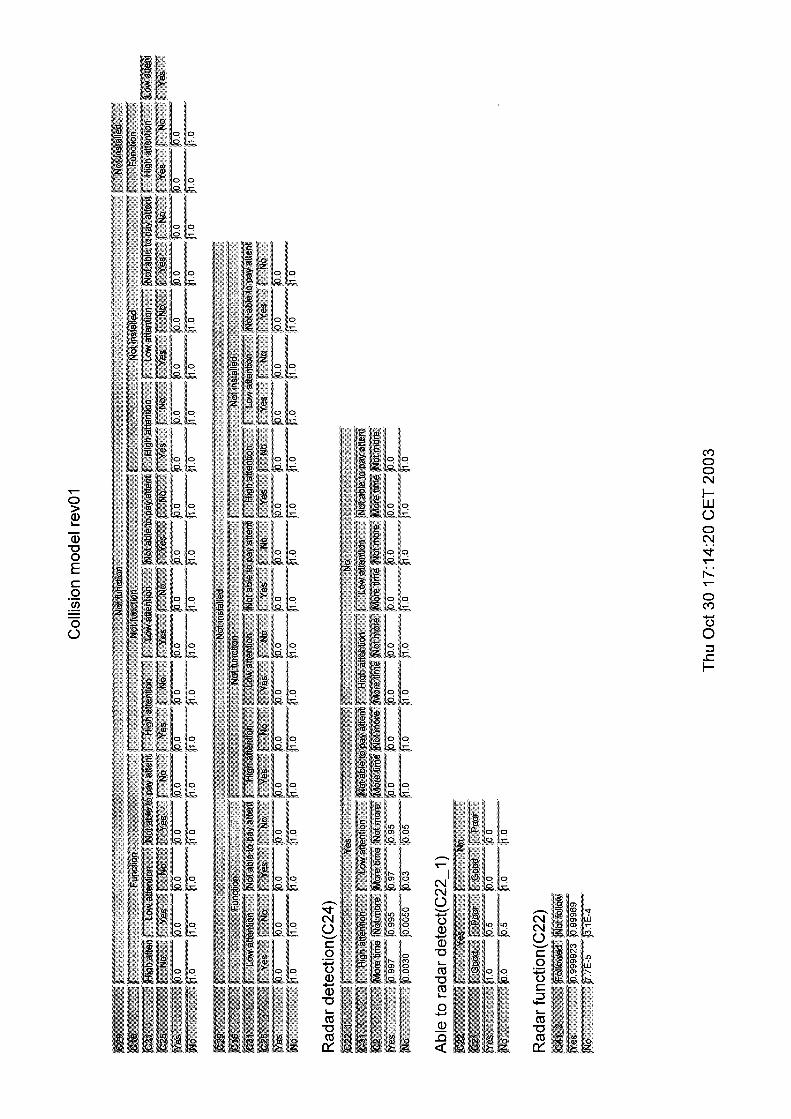
Radar function The node describes if the radar system is functioning. This is influenced by the maintenance routines. States: - Yes
- No
The failure probabilities for the radar are based on ref. /3/. The adjustment for influence from maintenance routines is based on ref. /1/. Radar tuning This node states whether the radar is tuned correctly according to the external conditions (weather, wave conditions, etc.). It also describes whether the radar is adjusted to the optimum range. States: - Adjusted to conditions
- Not adjusted
The conditional probabilities in this node are based on ref. /1/.
Signal quality The signal quality on the radar display is influenced by the weather conditions and the tuning of the radar system. States: - Good
- Poor The conditional probabilities in this node are based on ref. /1/. It is assessed that 1 of 1,000 times the radar is displaying poor signal quality in good weather and with the radar tuned to the conditions. Poor signal quality means that it may not be possible to detect the danger on the radar.
The other probabilities in the node’s CPT are an adjustment of this figure, performed by the project team.
Able to radar detection Depending on the radar reliability and signal quality, this node defines the possibility to detect dangers on the radar in time. States: - Yes
- No The conditional probabilities in this node are based on ref. /1/. If the radar is functioning and the signal quality is poor, there is a probability of 0.5 that the danger will not be detected on the radar screen.
Navigational aids in use The node describes that use of ECDIS and track control will liberate more time to visual and radar detection. States: - More time to detection
- No more time to detection This node is made in order to gather the nodes ‘ECDIS used’ and ‘Track control used’ in one node. This approach is a software trick to reduce the amount of probability input. If the number

ANNEX II, APPENDIX C
Page 6 /annex ii - appendix c.doc
of arrows onto the subsequent node is reduced, the size and the complexity of the CPTs also reduced. The node has only logical probability input, i.e. probabilities are 1 or 0.
Radar detection Radar detection defines whether the OOW is able to detect the danger on the radar. His ability is of course depending on whether it is physically possible to see the danger on the radar. However, also the attention and whether the navigational aids are used, will influence this node. Navigational aids are here meant as ECDIS and track control, as such instruments will liberate time to danger detection. States: - Yes
- No The conditional probabilities in this node are based on ref. /1/. The figures are based on a probability of 0.005 (1 out of 200 times) that the danger is not detected by means of radar for an OOW with high attention. The other probabilities in the node’s CPT are an adjustment of this figure, performed by the project team. For example, if navigational aids (ECDIS and track control) are not in use/not installed, the failure probability is reduced by 40% to 0.003.
ECDIS used The node describes whether the ECDIS is in use or not. States: - Yes
- No The conditional probabilities in this node are based on ref. /1/.
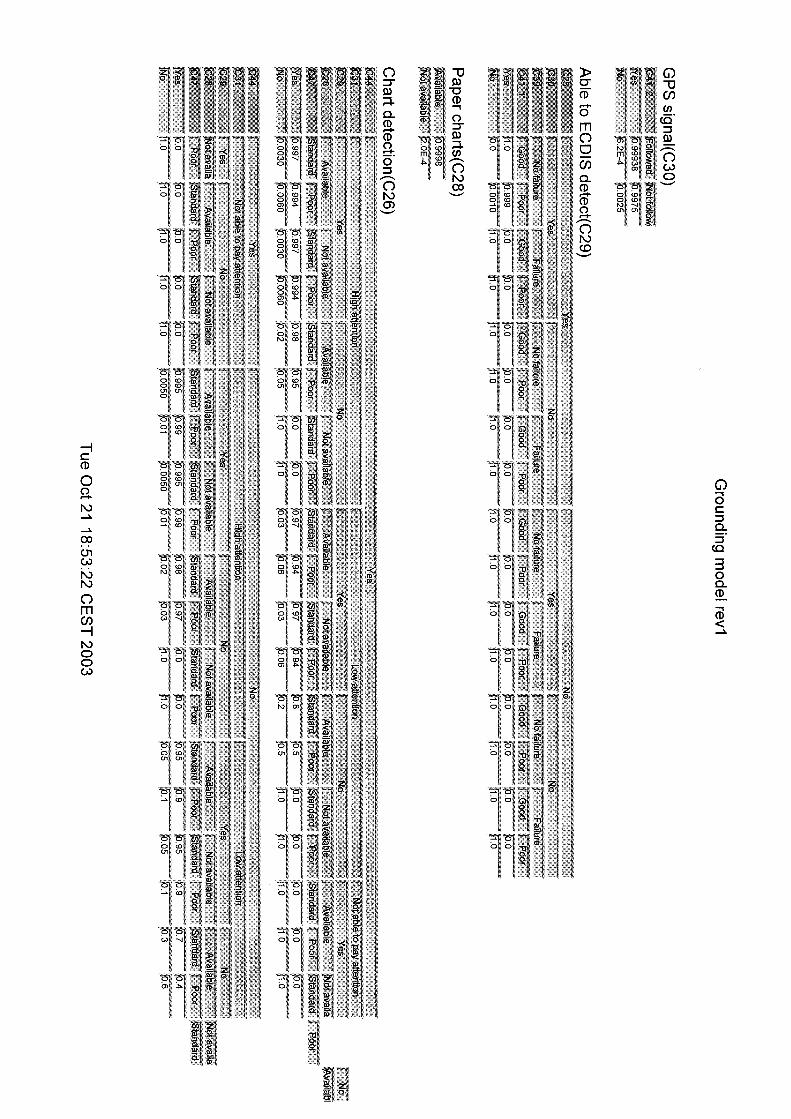
GPS signal The node describes the functionality of the GPS signal. This is influenced by the maintenance routines. States: - Yes
- No The failure probabilities for the GPS are based on ref. /3/. The adjustment for influence from maintenance routines is based on ref. /1/.
Other ECDIS failure The node describes the reliability of the ECDIS system (software, etc.), excluding GPS failures. This is influenced by the maintenance routines. States: - No failure
- Failure
The failure probabilities for the ECDIS failures are based on ref. /3/. The adjustment for influence from maintenance routines is based on ref. /1/. Able to ECDIS detection
Depending on electronic chart updating routines and the ECDIS use and reliability, this node describes whether it is technically possible to detect dangers on the ECDIS in time. States: - Yes
- No
The conditional probabilities in this node are based on ref. /1/. If the ECDIS is functioning, but the chart updating routines are poor, there is a probability of 0.001 (1 out of 1000 times) that the danger will not be detected on the electronic chart.
ANNEX II, APPENDIX C
Page 7 /annex ii - appendix c.doc
Paper charts This node indicates whether there are paper charts available on board. States: - Available
- Not available The conditional probabilities in this node are based on ref. /1/.
Grounding alarm The node describes whether a grounding alarm helps the OOW detect the danger. States: - Yes
- No The conditional probabilities in this node are based on ref. /1/. Failure on demand (Availability) for the grounding alarm is set to 1E-05.
Chart detection Chart detection defines whether the OOW discovers that the vessel is moving towards shore, rock, etc by using the charts. His ability is depending on his attention, the quality of the passage planning and on whether the charts are functional and updated. States: - Yes
- No The conditional probabilities in this node are based on ref. /1/. The figures are based on a probability of 0.005 (1 of 200 times) that the danger is not detected by means of the charts for an OOW with high attention. If the grounding alarm sounds, the failure probability is assumed to be reduced by 40% to 0.003.
Navigation system detection The node describes whether the OOW has detected the danger on either the charts, the radar or because of a grounding alarm. States: - Yes
- No This node is made in order to gather the nodes for detection of the danger on the radar, ECDIS and grounding alarm (radar, AIS and collision avoidance alarm for the collision model). This approach is a software trick to reduce the amount of probability input. If the number of arrows onto the subsequent node is reduced, the size and the complexity of the CPTs also reduced. The node has only logical probability input, i.e. probabilities are 1 or 0.
Detection The node joins the nodes ‘Visual detection’ and ‘Navigation system detection’, and describes whether the OOW has detected the danger, either by visual means or by use of navigational equipment. States: - Yes
- No This node is made in order to gather the nodes ‘Visual detection’ and ‘Navigation system detection’ in one node. This approach is a software trick to reduce the amount of probability input. If the number of arrows onto the subsequent node is reduced, the size and the complexity of the CPTs also reduced. The node has only logical probability input, i.e. probabilities are 1 or 0.

ANNEX II, APPENDIX C
Page 8 /annex ii - appendix c.doc
C3.3 Management factors
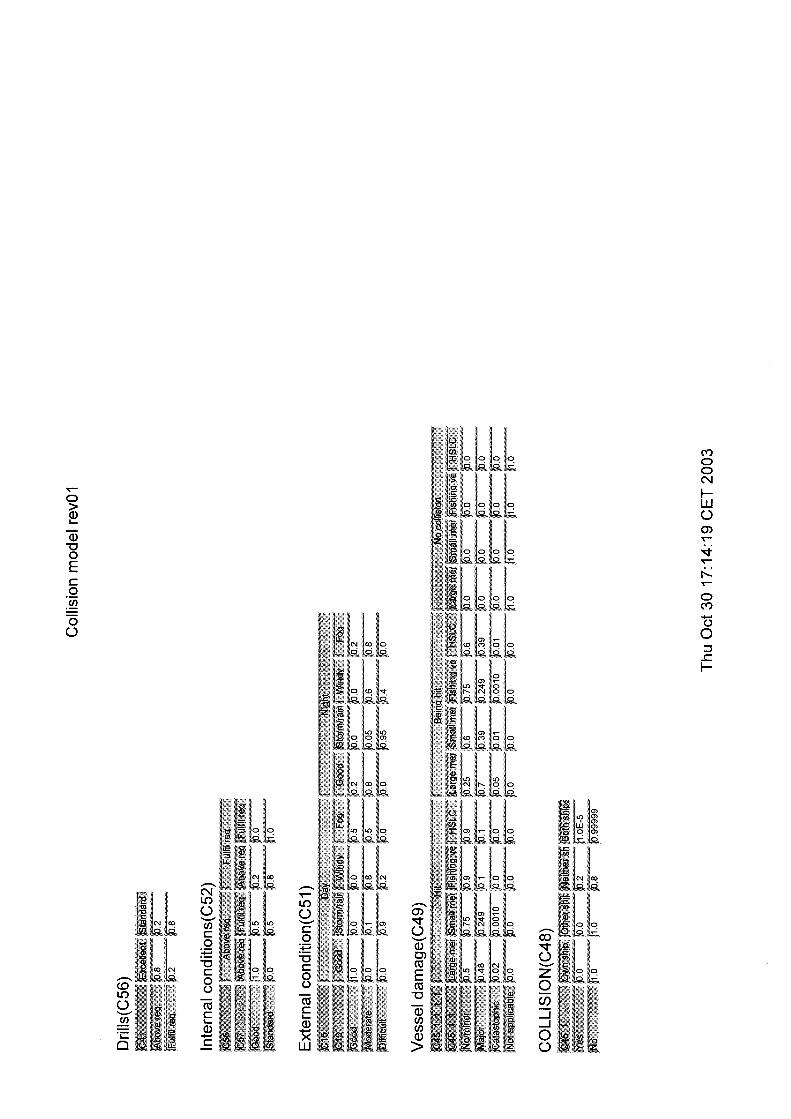
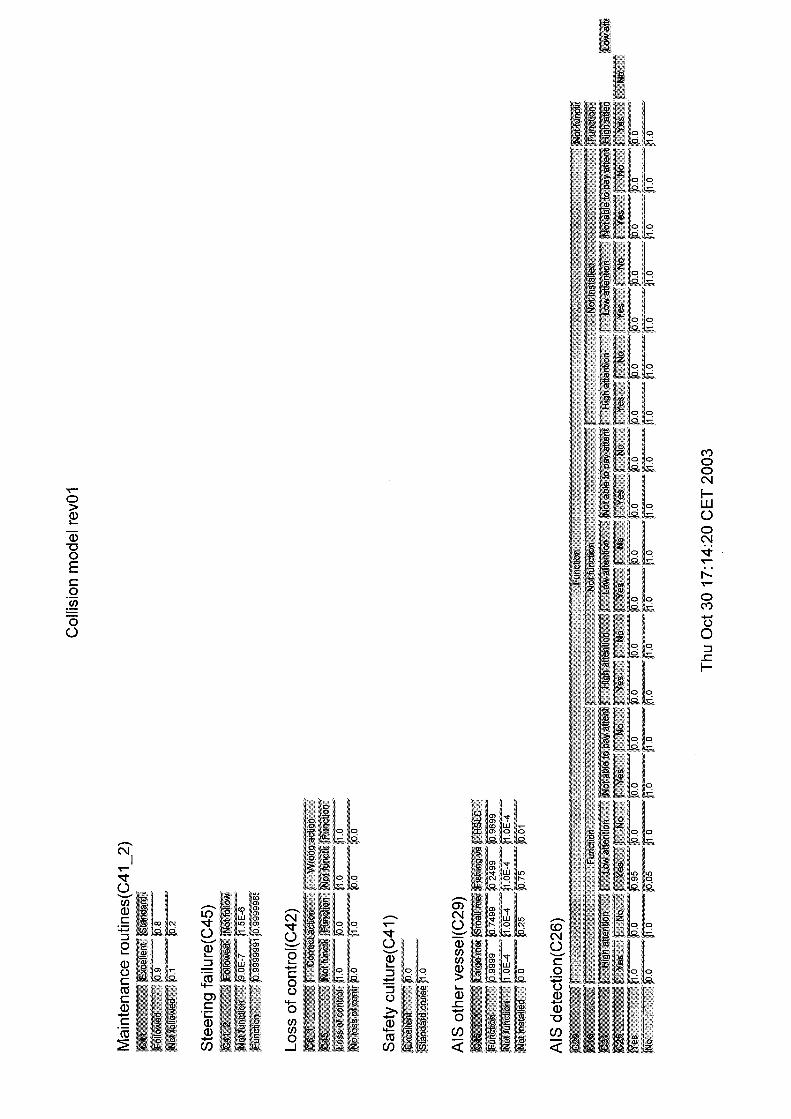
Safety culture The node describes how well the vessel operator deals with safety issues and how well the operator promotes a good safety mindset among its employees. By safety issues it is meant both technical safety onboard the vessel (e.g. standard of life saving equipment) and vessel design, in addition to work procedures/instructions, working conditions, training, drills, attitude, etc. States: - Excellent
- Standard cruise As one of the states is ‘standard cruise’. This is expected to represent the average of the industry and therefore a possibility of 1 is set for this state. The cruise industry is considered to have generally good safety culture. The purpose of this node is however to be able to model the effect on navigation of a possible improvement of the safety culture to ‘Excellent’.
Maintenance routines This node describes whether the maintenance routines of technical systems onboard the vessel are followed. States: - Followed
- Not followed The conditional probabilities in this node are based on ref. /1/.
Update routines Influenced by the company’s safety culture, this node is mainly aimed at updating routines for charts (updating frequency, quality, etc.). States: - Good
- Poor The conditional probabilities in this node are based on ref. /1/.
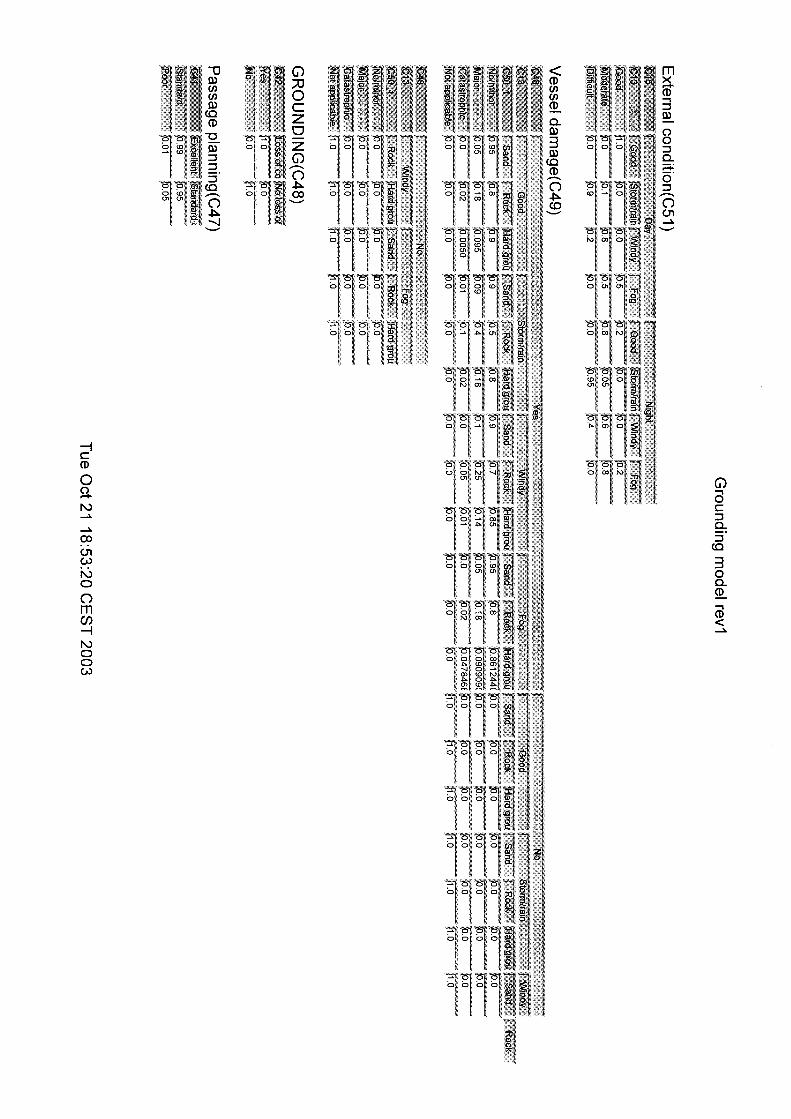
Passage planning This node describes the quality of the passage planning. “Poor” means that the trade is not sufficiently planned or that the planned route exposes the vessel to a higher risk than necessary. The node also reflects the ability to detect unknown hazards in the route. States: - Standard
- Poor The conditional probabilities in this node are based on ref. /1/.
C3.4 Human factors
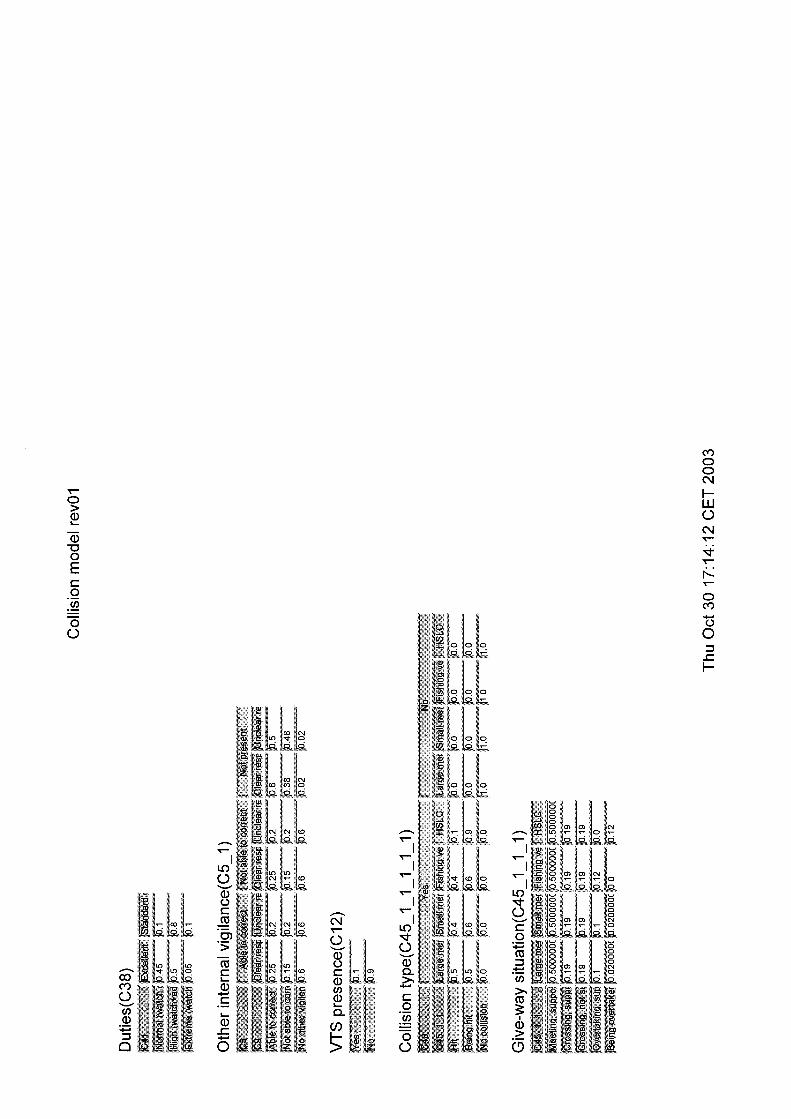
Duties The node indicates the duties for which the OOW is responsible. States: - Normal (watch)
- High (watch + administration)
- Extreme (watch + administration + representation) The conditional probabilities in this node are based on ref. /1/.
ANNEX II, APPENDIX C
Page 9 /annex ii - appendix c.doc
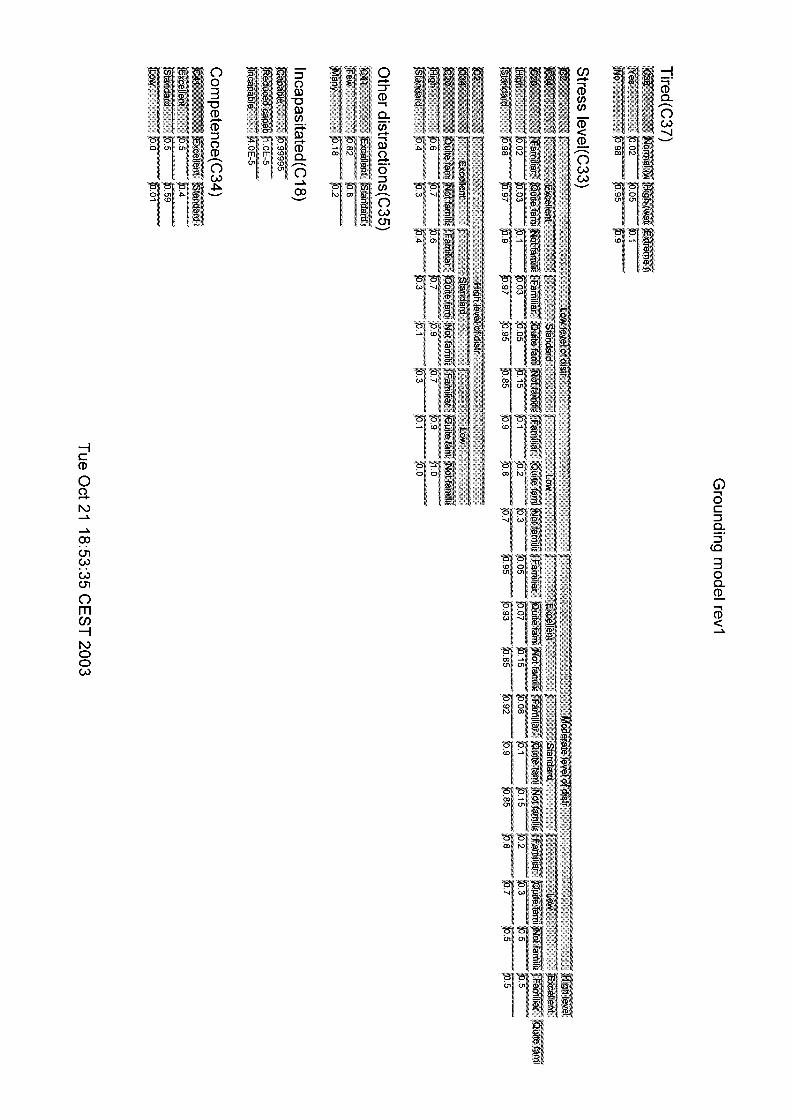
Tired Depending on the number of duties, this node describes whether the OOW is tired. States: - Yes
- No The conditional probabilities in this node are based on ref. /1/. The assumption is a 2% probability that the OOW will be tired during his watch, if watch-keeping is his only duty onboard.
Other distractions The node describes whether the OOW is exposed to many or few distractions, e.g. mobile phones, troublesome situations on board and persons on bridge that will take his attention away from his dedicated tasks as a navigator. States: - Few
- Many The conditional probabilities in this node are based on ref. /1/.
Non navigational tasks The node describes the amount of non-navigational working tasks, e.g. alarms, dedicated to the officer(s) on watch. These tasks, that will take attention away from the dedicated navigator tasks are not related to navigation and can therefore be taken away from the bridge. States: - Few
- Many The conditional probabilities in this node are based on ref. /1/.
Distraction level The node describes the total level of distractions. States: - Low level of distractions
- Moderate level of distractions - High level of distraction
The conditional probabilities in this node are based on ref. /1/. Few non-navigational tasks and other distractions is defined as ‘low level of distractions’, and many non-navigational tasks and other distractions is defined as ‘high level of distractions’.
Stress level The node indicates the stress level of the OOW, mainly influenced by the degree of familiarization in the water, the competence and the number of distractions that take the attention away from the tasks the OOW is set to perform. States: - High
- Standard The conditional probabilities in this node are based on ref. /1/. With moderate level of distractions and sailing in a quite familiar area, it is assumed in ref. /1/ that the probability for high stress level is 10%. Incapacitated The node describes the OOW’s physical capability. The capability is assessed to be reduced if the OOW is e.g. intoxicated or affected by an illness, and incapable if the OOW is asleep, not present, dead, etc. States: - Capable
- Reduced capability
ANNEX II, APPENDIX C
Page 10 /annex ii - appendix c.doc
- Incapable The probabilities in this node are based on ref. /2/. The incapacitation probabilities in the reference are valid for merchant ships, typically tankers. However, the probabilities for incapacitation for the cruise industry are expected to be lower. Due to lack of further information, it has therefore been assumed to reduce the probabilities by a factor of 2.
Personal condition The node describes the OOW’s physical and mental condition, and indicates whether he is fit to perform his tasks as navigator of the vessel. The node is dependent on the nodes ‘Stress level’, ‘Tired’ and ‘Incapacitated’. States: - Fit
- Unfit
- Not able to perform The conditional probabilities in this node are based on ref. /1/. It is stated that the OOW is 100% fit if he is not incapacitated, has standard stress level and is not tired. If the OOW is tired or has high stress level, the fitness is reduced by 10%. Competence Competence is a combination of knowledge, skills and attitude. The node reflects the OOW’s knowledge, the level of training, the way he uses his knowledge and the attitude he has towards the tasks he is set to perform, e.g. to follow procedures and work instructions. This also reflects the technical competence on use of equipment. States: - Excellent
- Standard
- Low The conditional probabilities in this node are based on ref. /1/.
Bridge design This node describes whether the bridge is designed to enable the OOW to perform his tasks properly. The node reflects user interface, the design of the work station (ergonomic conditions) and bridge arrangement. States: - Standard cruise
- Beyond standard
- Below standard The probabilities in this node are based on ref. /1/.
BRM The node describes the existence of a Bridge Resource Management (BRM) system. The BRM node covers optimisation of human resources on the bridge given the technical system and bridge design. An optimisation of the human resources is strongly related to communication and task responsibilities. The existence of a BRM system means that the system is developed and implemented, as well as maintained according to the intensions. States: - BRM system exists
- No BRM system The conditional probabilities in this node are based on ref. /1/.
ANNEX II, APPENDIX C
Page 11 /annex ii - appendix c.doc
Attention This node describes the OOW’s level of attention when performing his tasks. The attention is affected by his physical working place (i.e. bridge design), organisation of work (BRM system) and his personal condition. States: - High attention
- Low attention
- Not able to pay attention The conditional probabilities in this node are based on ref. /1/. With moderate level of distractions, standard cruise bridge design and implemented BRM system, the probability for low attention is set to 0.05. With no BRM system, the probability for low attention is assumed to be increased by a factor of 3.
Performance The node describes how well the OOW performs his tasks. It includes personal condition, bridge design and competence. States: - Excellent
- Standard
- Poor The conditional probabilities in this node are based on ref. /1/. As the cruise industry has traditionally had a strong focus on safety using competent personnel, it is assumed that there is an 80% probability for excellent, 20% for standard and 0% for poor performance with standard competence and bridge design.
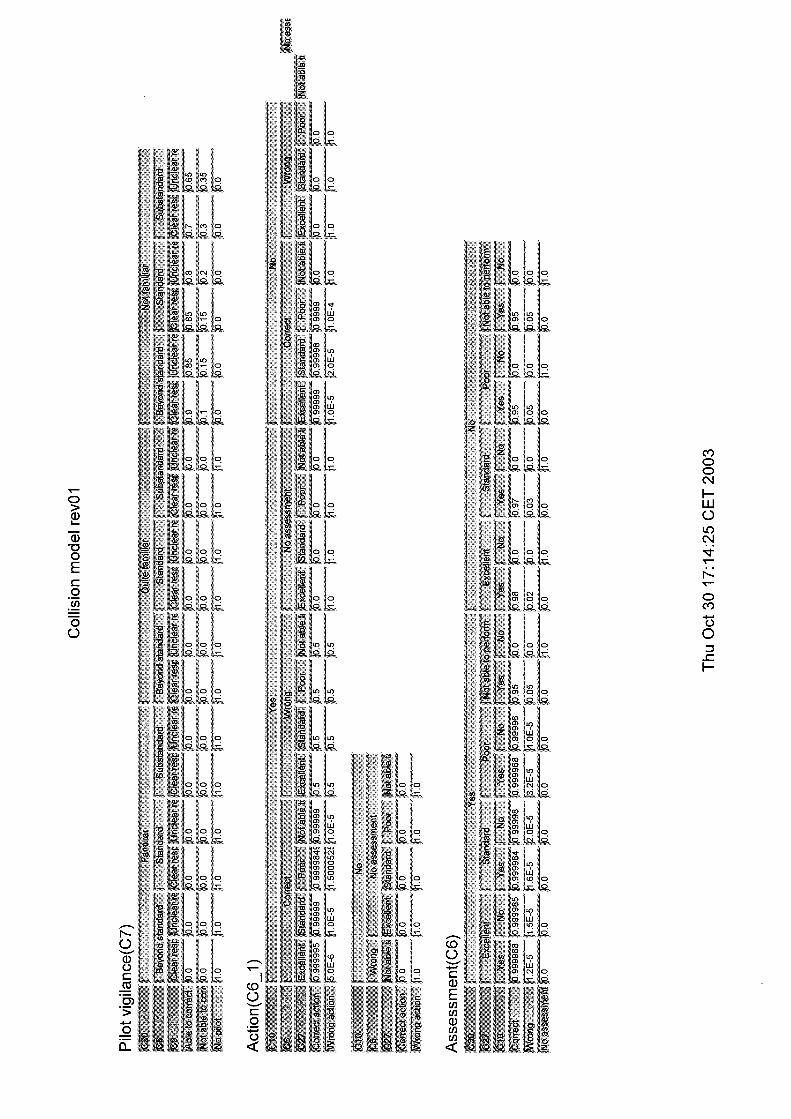
Assessment This node describes whether the OOW is making the correct assessment of the situation based on his observations. States: - Correct
- Wrong
- No assessment The conditional probabilities in this node are based on ref. /4/. If the danger is detected there is a probability of 2E-05 that the situation will not be assessed correctly given no vigilance.
Action The node defines whether the OOW, given he or someone else has discovered the danger, acts correctly to avoid an accident. States: - Correct action
- Wrong action The conditional probabilities in this node are based on ref. /4/. If the situation is assessed correctly there is still a probability of 2E-05 for wrong action given no vigilance and no track control.
C3.5 Technical reliability
Steering failure The node indicates the reliability of the steering system (based on statistics/generic data). States: - Function
- Not function
ANNEX II, APPENDIX C
Page 12 /annex ii - appendix c.doc
The probabilities in this node are based on ref. /2/.
Track control used The node describes the percentage of the time the vessel is steered by track control and not manually by the navigators. The track control is of category C, i.e. full track control on straight legs and turns. States: - Yes
- No The probability for ‘Yes’, i.e. track control in use and functioning, is set to 0.85, based on ref. /1/.
C3.6 Support
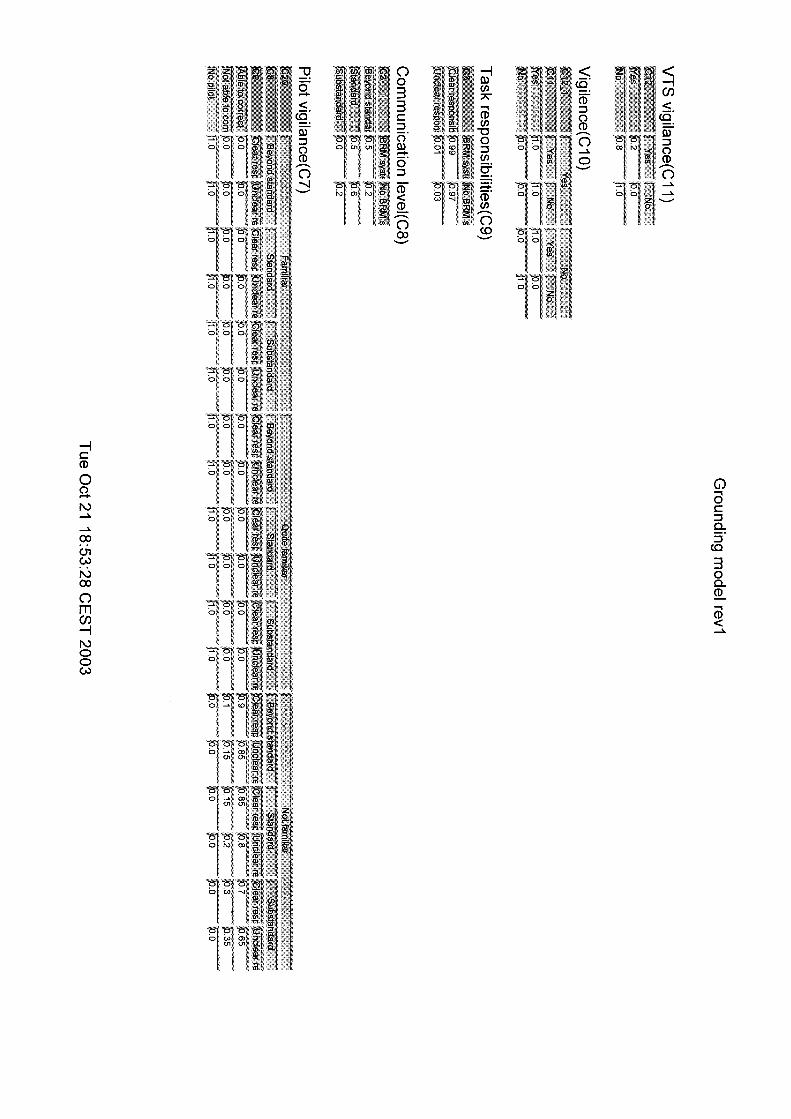
Communication level Depending on the existence of a Bridge Resource Management system, the node describes the level and the quality of the communication between the bridge personnel. States: - Beyond standard
- Standard
- Substandard The conditional probabilities in this node are based on ref. /1/.
Task responsibilities Depending on the existence of a Bridge Resource Management system, the node describes whether there exist clear task responsibilities between the bridge personnel. States: - Clear responsibility
- Unclear responsibility The conditional probabilities in this node are based on ref. /1/.
Pilot vigilance Influenced by the task responsibilities and the communication level between the bridge personnel and the pilot, this node shows the effect of having a pilot present to correct a critical course. States: - Able to correct
- Not able to correct
- No pilot
The conditional probabilities in this node are based on ref. /1/. Officer no. 2 vigilance
The node describes whether the other navigator is present, discovers the danger and is able to correct a critical course. States: - Able to correct
- Not able to correct
- Not present
The conditional probabilities in this node are based on ref. /1/.
ANNEX II, APPENDIX C
Page 13 /annex ii - appendix c.doc
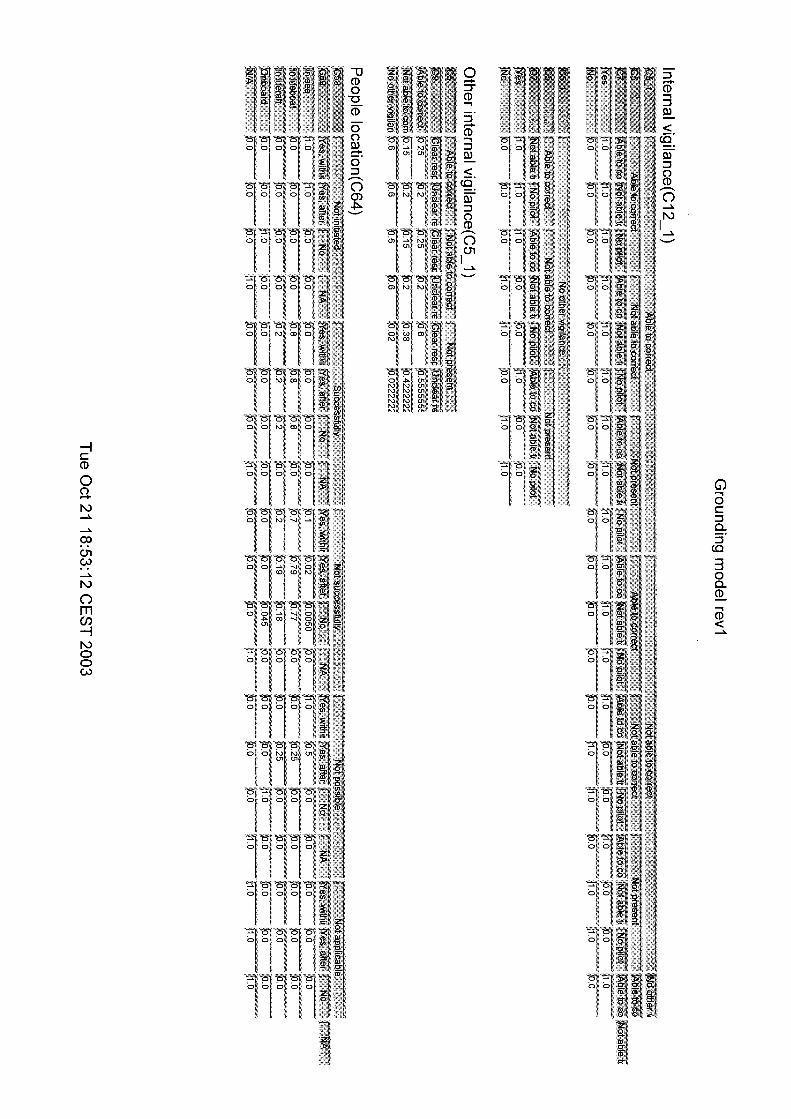
Internal vigilance The node describes if there is any internal vigilance that can help to warn the OOW of possible danger. States: - Yes
- No This node has only logical probability input, i.e. probabilities are 1 or 0.
Other internal vigilance The node describes whether there is another person on the bridge, e.g. a lookout, which is able to correct a critical course by informing the OOW so that the necessary action is carried out in time. The other person may be able to act in the OOW’s place by interfering. This is especially important if OOW is incapacitated. States: - Able to correct
- Not able to correct
- No other vigilance
The conditional probabilities in this node are based on ref. /1/.
VTS presence The node shows the probability of that a Vessel Traffic Service (VTS) is surveying the ship traffic in the area. States: - Yes
- No
The probabilities in this node are based on ref. /1/. VTS vigilance This node describes whether the VTS observes the danger and warn the OOW so that he can act in time. States: - Yes
- No
The conditional probabilities in this node are based on ref. /1/. Vigilance
This is the overall node showing if there is any internal or external vigilance that can help to warn the OOW of dangers. States: - Yes
- No This node has only logical probability input, i.e. probabilities are 1 or 0.
C3.7 Overall
Loss of control The node describes the probability for loss of control of the ship, either due to technical failures or due to human errors. If the control is lost, nothing can prevent the ship from continuing towards the danger, i.e. towards shore (grounding scenario) and towards another vessel (collision scenario). States: - Loss of control

ANNEX II, APPENDIX C
Page 14 /annex ii - appendix c.doc
- No loss of control This node has only logical probability input, i.e. probabilities are 1 or 0. If correct action is carried out and the steering system is functioning, the probability for loss of control is 0.
Grounding The node states the probability for grounding. States: - Yes
- No This node has only logical probability input, i.e. probabilities are 1 or 0.
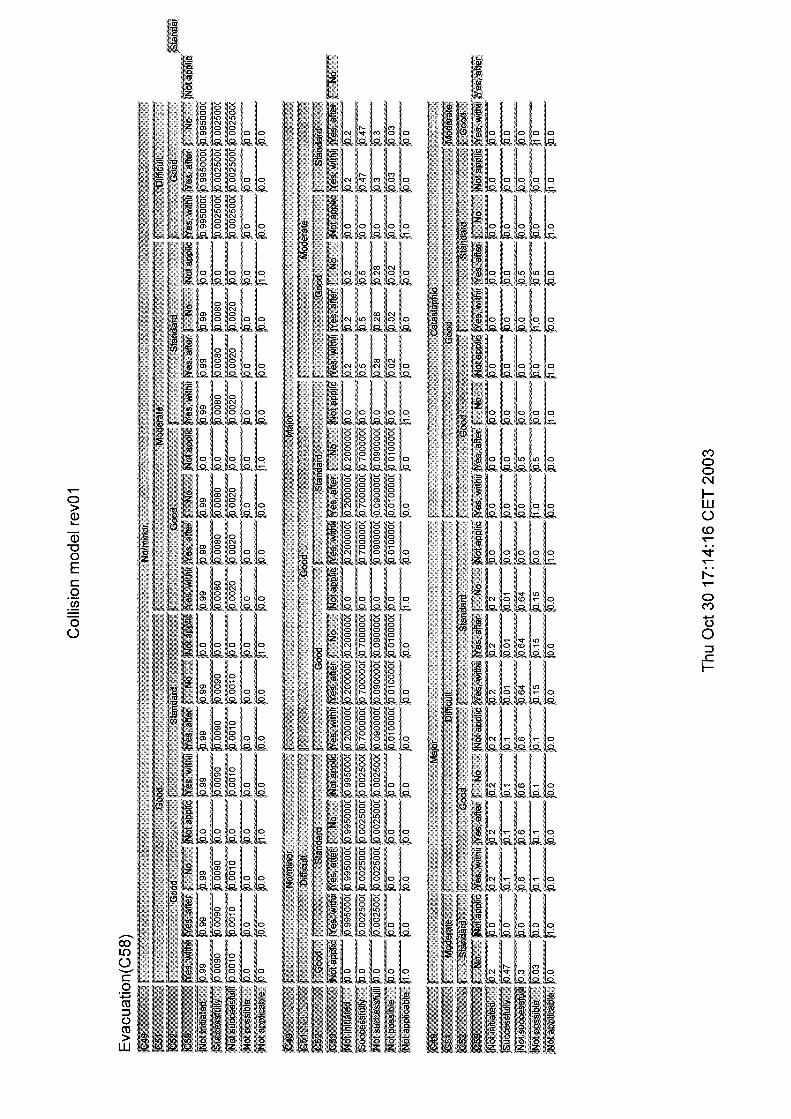
C3.8 Consequences
The node probabilities for the consequences of collision and grounding are based on workshops with cruise expertise within DNV, ref. Appendix E.
Type of ground hit Describes the type of ground hit in the incident. States: - Sand
- Rock
Vessel damage This node describes what effect the grounding had on the vessel. The probability of each state is depending on the weather and the type of ground hit. States: - No/minor (i.e. all events that is collision or grounding, however not being categorised as ‘Major’ or
‘Catastrophic’)
- Major (i.e. event resulting in the ship being towed or requiring assistance from ashore; flooding of any compartment; or structural of mechanical damage requiring repairs before the ship can continue trading. Not including ‘Catastrophic’.)
- Catastrophic (i.e. events where ship ceases to exist after a casualty, either due to it being irrecoverable or due to is subsequently being broken up)
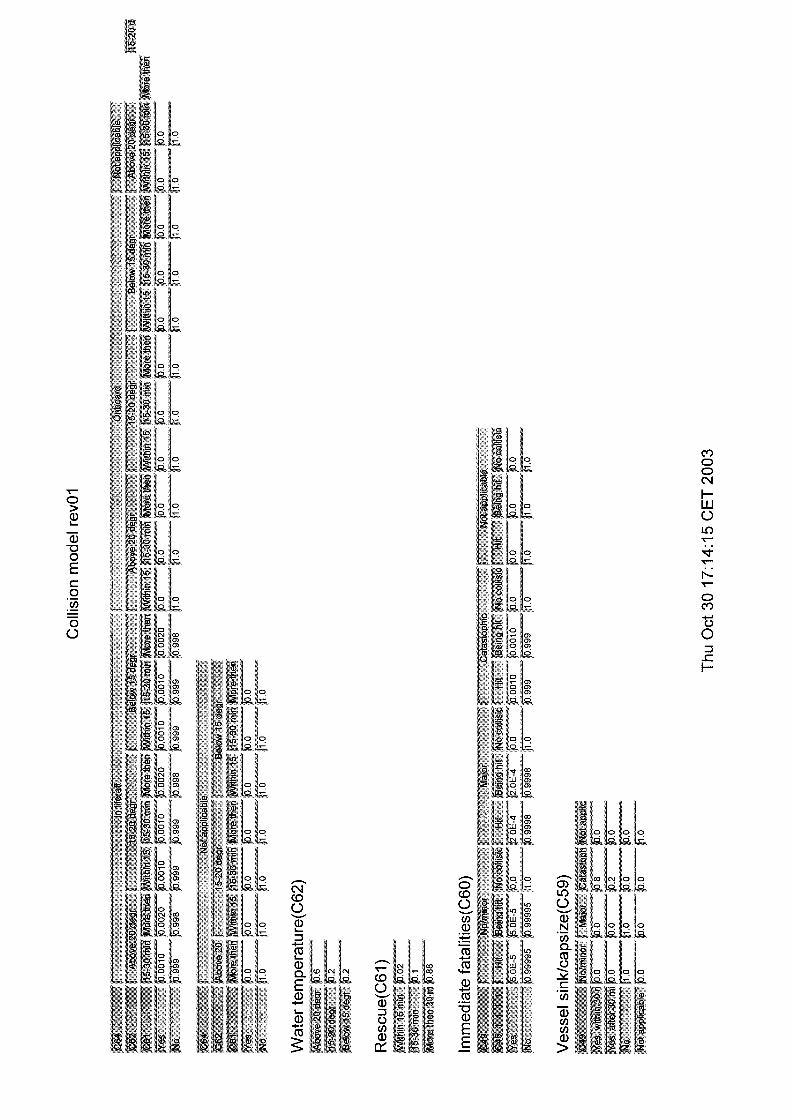
- No grounding
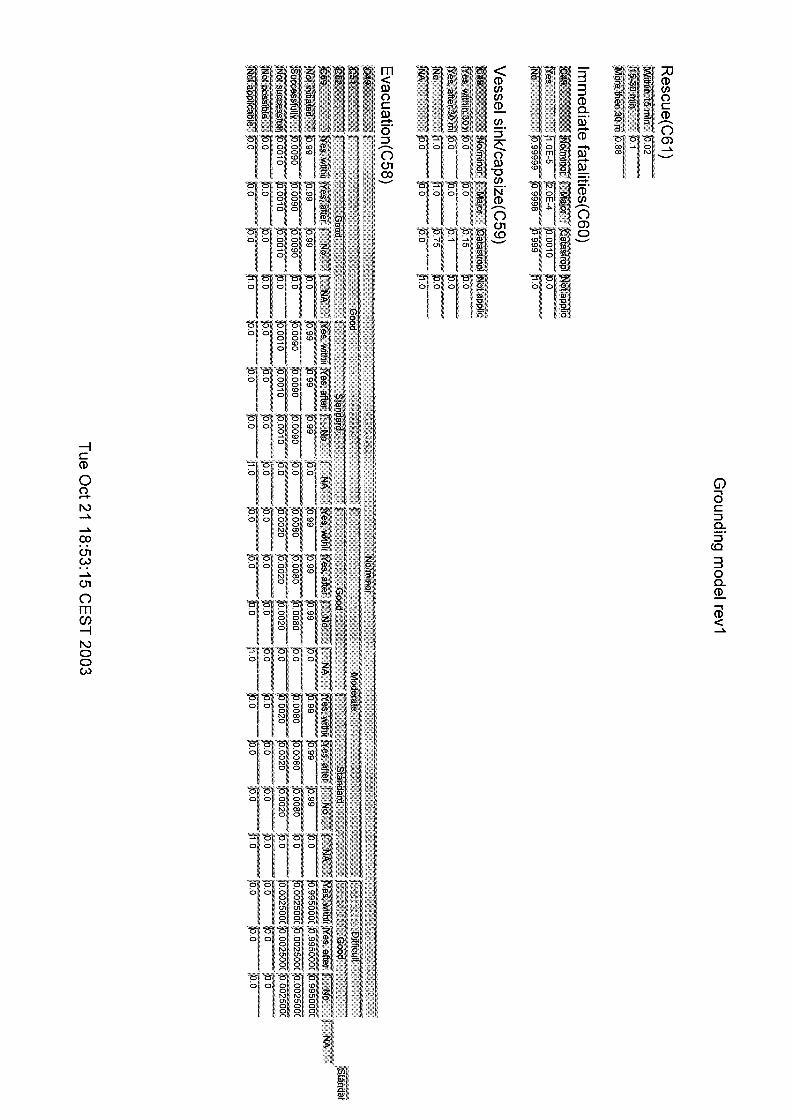
Vessel sink Given the type of vessel damage, this node shows whether the vessel sinks immediately, after some time or not at all. States: - Yes, within 30 min
- Yes, after 30 min
- No
- N/A (i.e. not relevant if no accident)
Given serious vessel damage, the probability of sinking is estimated to 1.6%, ref. /9/. Sinking is here denoted as both capsizing and “graceful” sinking. Based on the distribution of degree of severity of the vessel damage (from the risk model: 89.3% No/minor, 10% Major and 0.7% Catastrophic), the probability of sinking given grounding is 0.17% for all events.
Based on information from the expert workshop on consequence estimation, see Appendix E, the probability of sinking within 30 min given sinking is 60%. The fatality rate for sinking within 30 minutes is 33% and after 30 minutes 9%.
ANNEX II, APPENDIX C
Page 15 /annex ii - appendix c.doc
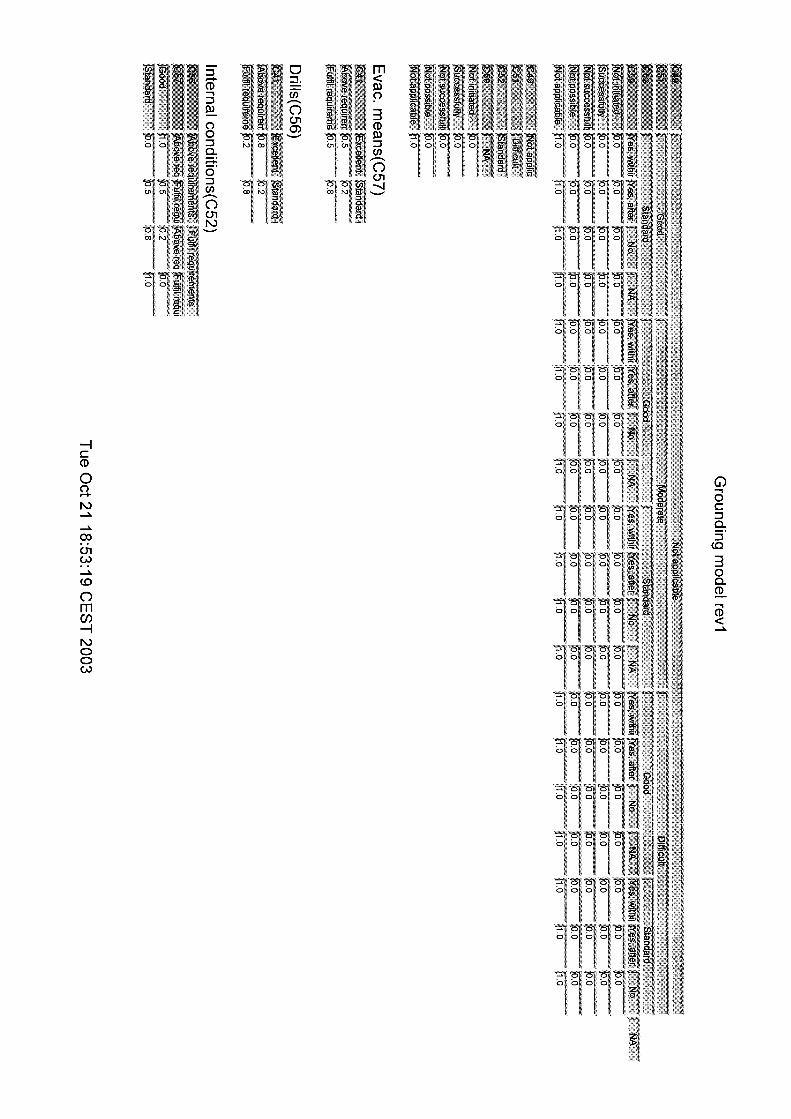
External conditions The node describes the external conditions given an accident, in terms of level of difficulty to evacuate. The node is dependent on the weather conditions and whether it is day or night. States: - Good
- Moderate
- Difficult
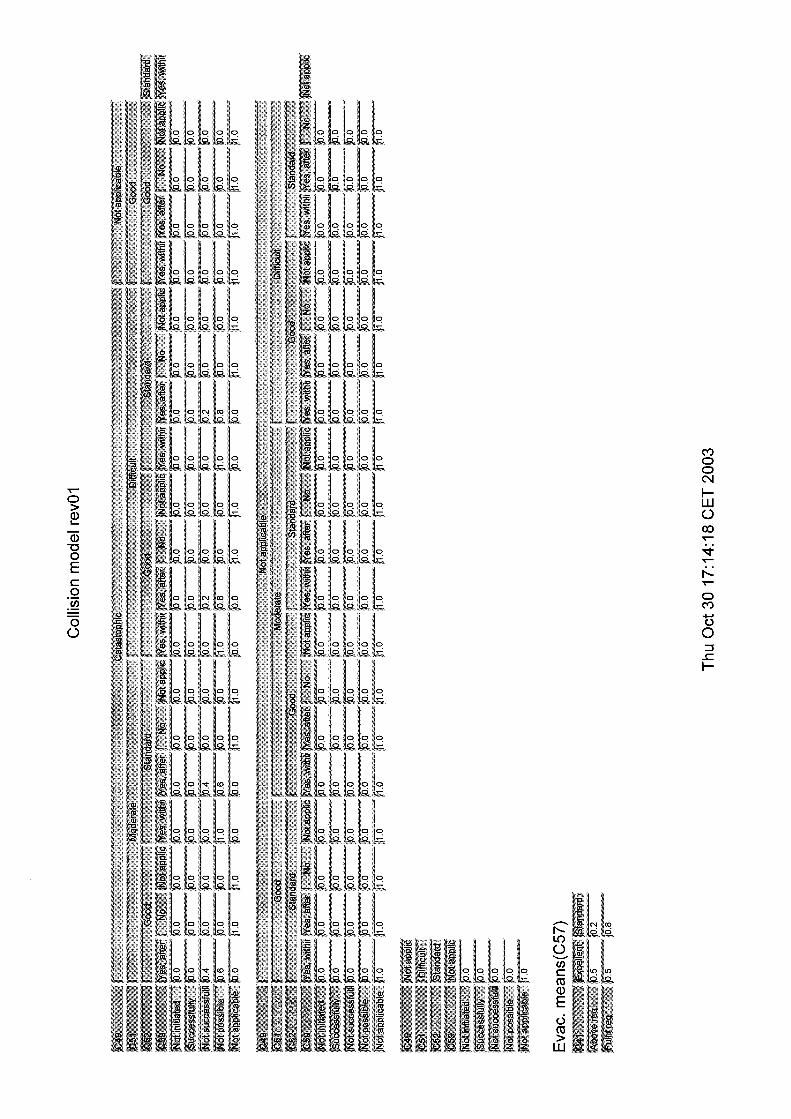
Evacuation means The node describes the standard and location of the life saving equipment. States: - Above requirements
- Fulfil requirements
Drills The node describes evacuation drills and how they are carried out. States: - Above requirements
- Fulfil requirements
Internal conditions This node describes the frame conditions for how well the vessel and its crew are prepared for an evacuation. States: - Good
- Average
Evacuation This node shows how successfully the evacuation is carried out, if evacuation is initiated. States: - Not initiated (i.e. evacuation is not found necessary to initiate)
- Successfully (i.e. all people are evacuated without fatalities)
- Not successfully (i.e. people are evacuated, but some fatalities occur)
- Not possible (i.e. evacuation is not possible to initiate due to e.g. evacuation means failures)
- Not applicable (i.e. not relevant if no accident)
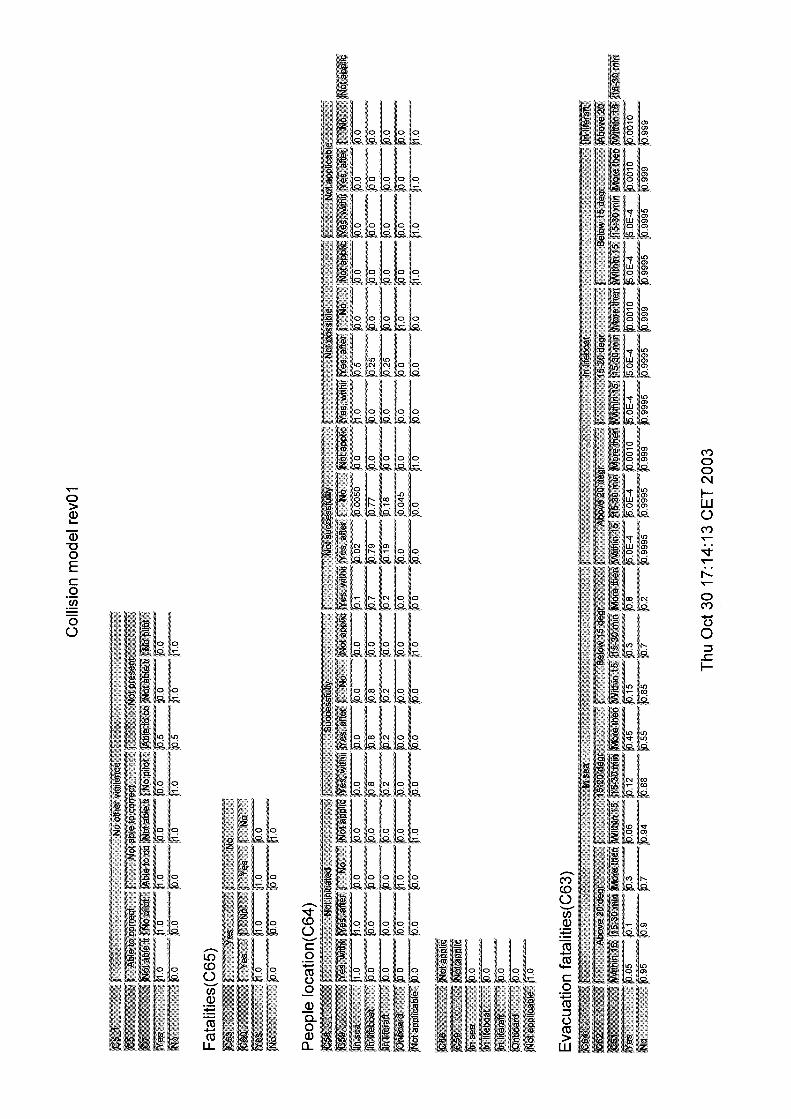
People location This node indicates the location of the people after the grounding, depending on whether an evacuation has been carried out or whether the vessel sinks. States: - In sea
- In lifeboat
- In liferaft
- Onboard
- N/A (i.e. not relevant if no accident)
Rescue The node describes how fast other vessels are expected to arrive to help with the rescue. States: - Within 15 min
- 15-30 min
- More than 30 min
ANNEX II, APPENDIX C
Page 16 /annex ii - appendix c.doc
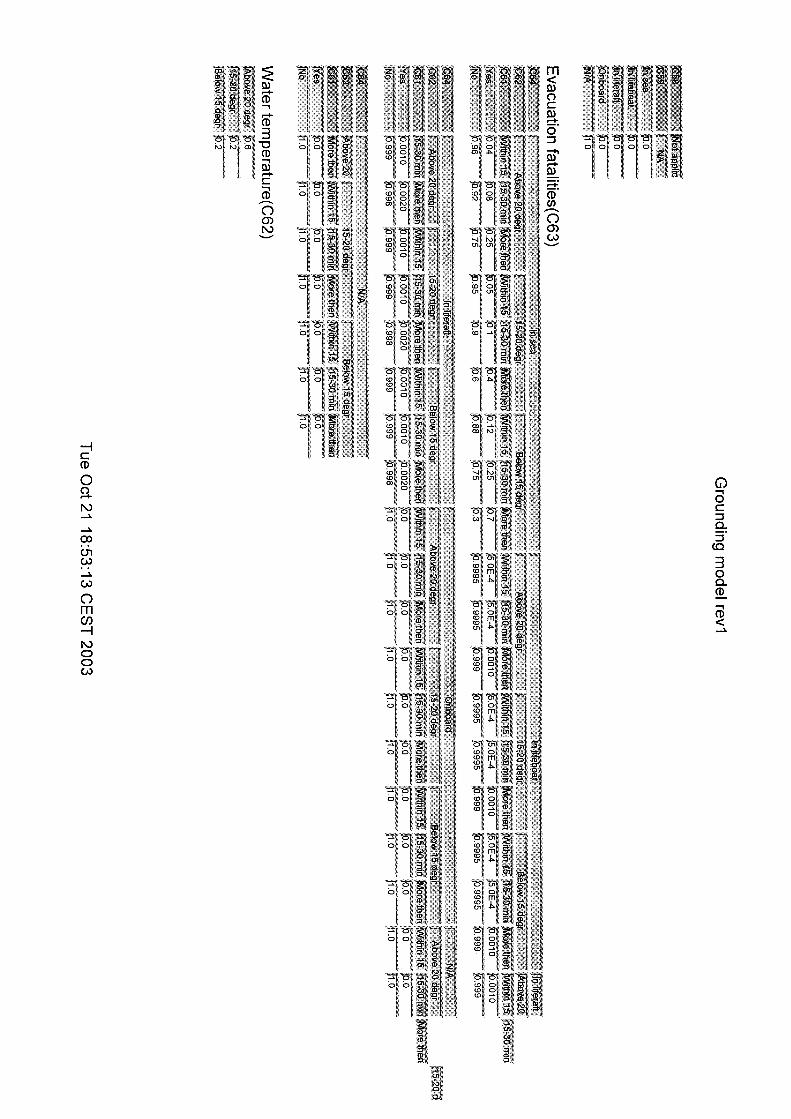
Water temperature The node describes the probability distribution for the expected water temperature at the accident location. States: - Below 15°C
- 15 – 20°C
- Above 20°C
Evacuation fatalities The node indicates whether a person is killed during evacuation following the accident, influenced by the water temperature and probability for getting external assistance. States: - Yes
- No
Immediate fatalities The node indicates whether a person is killed immediately, given the type of damage on the vessel. States: - Yes
- No
Fatalities Summing up both the immediate fatalities and the evacuation fatalities, this node indicates whether a person is killed onboard a large cruise ship due to the accident scenario, i.e. the total individual risk per person. States: - Yes
- No
C4 COLLISION MODEL
Most of the nodes in the collision model are identical to the nodes used in the grounding model. However, there are some differences and these are described in the following. It is important to emphasize that although the definition of the nodes and the states are the same for collision and grounding, the probability distribution on the different states, i.e. the values in the conditional probability tables, might be different in the two models. For more detail on these differences, see Appendix A and B.
C4.1 Identical nodes
These nodes are similar to the grounding model, and the description can be found in section C2:
Visual detection: • Weather • Visibility • Daylight • Bridge outlook • Able to visual detection • Familiarisation • Visual detection

ANNEX II, APPENDIX C
Page 17 /annex ii - appendix c.doc
• Bridge outlook Navigational aid detection:
• Radar tuning • Signal quality • Able radar detection • Radar detection • Radar function • Navigation system detection • Navigational aids in use • Detection
Management factors: • Safety culture • Checklist
Human factors: • Duties • Non navigational task • Other distractions • Distraction level • Tired • Stress level • Incapacitated • Personal condition • Competence • Performance • Bridge design • BRM • Attention • Assessment • Action
Technical reliability: • Steering failure
Support: • Communication level • Task responsibilities • Pilot vigilance • Officer no. 2 vigilance • Other internal vigilance • Internal vigilance • VTS presence • VTS vigilance • Vigilance
Overall: • Loss of control
Consequences: • Vessel damage
ANNEX II, APPENDIX C
Page 18 /annex ii - appendix c.doc
• Vessel sink • External conditions • Evacuation means • Drills • Internal conditions • Evacuation • People location • External assistance • Water temperature • Evacuation fatalities • Immediate fatalities • Fatalities
C4.2 Collision specific nodes
The following nodes are not included in the grounding model and therefore described here. AIS own ship (category: Navigational aid detection) The node describes whether an Automatic Identification System (AIS) is installed onboard own ship and if yes, the system’s reliability is indicated. States: - Function
- Not function - Not installed
The probability for whether AIS is installed is based on ref. /1/. The reliability (i.e. state ‘Not function’) is based on ref. /3/.
AIS other vessel (category: Navigational aid detection) The node describes whether an Automatic Identification System (AIS) is installed onboard the other vessel and if yes, the system’s reliability is indicated. States: - Function
- Not function
- Not installed AIS signal on radar screen (category: Navigational aid detection)
The node indicates whether the AIS signals are displayed on the radar screen or not. States: - Yes
- No The conditional probabilities in this node are based on ref. /1/.
AIS detection (category: Navigational aid detection)
AIS detection defines whether the OOW detects the other vessel on the AIS. The OOW’s ability to detect is depending on his attention and on the AIS reliability. States: - Yes
- No The conditional probabilities in this node are based on ref. /1/.
Collision avoidance alarms (category: Navigational aid detection)
ANNEX II, APPENDIX C
Page 19 /annex ii - appendix c.doc
The node describes whether a collision alarm helps the OOW to detect the other vessel. States: - Yes
- No The probabilities in this node are based on ref. /1/. Failure on demand (availability) for the collision alarm is set to 1E-05.
Communication with other vessel (category: Vigilance) The node indicates whether the OOW receives a warning call from the vessel on collision course, e.g. on the VHF. States: - Yes
- No The probabilities in this node are based on ref. /1/.
Give way situations The node describes the give-way situations that the cruise vessel can experience, and indicates the give-way rules for the different situations. States: - Meeting, supposed to give way
- Crossing, supposed to give way
- Crossing, not supposed to give way
- Overtaking, supposed to give way
- Being overtaken, not supposed to give way The conditional probabilities in this node are based on ref. /1/ and the results from the Excel-modelling of number of critical collision courses, see Appendix D.
Give way Depending on the type of give way situation, this node describes which vessel(s) that actually gives way. States: - Own ship changes course
- Other ship changes course
- Neither ship change course
- Both ships change course The conditional probabilities in this node are based on ref. /1/. If a vessel has to give way and has not lost control over the vessel, it is assessed that there still is a probability of 2E-04 that the vessel will not change course.
Ship types in lane The node describes the probabilities for which type of traffic that the vessel is likely to meet. States: - Large merchant vessels
- Small merchant vessels
- Fishing vessels
- HSLC (High Speed Light Craft) The probabilities in this node are based on ref. /1/.
Collision
ANNEX II, APPENDIX C
Page 20 /annex ii - appendix c.doc
The node describes whether there will be a collision or not. States: - Yes
- No The conditional probabilities in this node are based on ref. /1/. Even though none of the vessels change course, there is still a probability of 20% that collision is avoided as not all the courses that are defined as critical, are geometrical collision courses. However, if both ships change course, there is still a probability of 1E-05 that the situation still will result in collision.
Collision type (category: Consequence) The node describes the type of collision the cruise vessel has been involved in. This is important for the consequence analysis. States: - Hit (the other vessel)
- Being hit (by the other vessel)
- No collision The conditional probabilities in this node are based on ref. /1/. As a basis, 50% of the collisions are ‘Hit’ and 50% is ‘Being hit’. However, this depends on what type of ship the cruise vessel is in a collision situation with.
Vessel sink (category: Consequence) Given the type of vessel damage, this node shows whether the vessel sinks immediately, after some time or not at all. States: - Yes, within 30 min
- Yes, after 30 min
- No
- N/A (i.e. not relevant if no accident)
The figures in this node for collision are different from grounding. This is mainly due to possible differences in type of vessel damage, waters, distance to shore, etc. for the two types of accidents. The probabilities used are described in the following.
Based on study of ref. /5/ and results and recommendations from the HARDER project*, the probability for flooding given a collision is in the order of 35%. Further, based on ref. /8/ the survivability after a collision resulting in flooding is recommended to 90%. In this study it has been assumed that this recommendation is followed. This means that, after new damage stability regulations have been enforced, 3.5% of all serious events are expected to result in sinking. Based on the distribution of degree of severity of the vessel damage (from the risk model: No/minor 59.1%, Major 39.5% and Catastrophic 1.4%), the probability of sinking given collision is 1.4% for all collision events as included herein.
Based on information from the expert workshop on consequence estimation, see Appendix E, the probability of sinking within 30 min given sinking is 80%. The fatality rate for sinking within 30 minutes is assumed to be 40% and after 30 minutes 12%.
* HARDER Project Results are Reported and Reviewed my IMO SLF
ANNEX II, APPENDIX C
Page 21 /annex ii - appendix c.doc
C5 REFERENCES
/1/
Workshop on estimation of probabilities for nodes related to causes of grounding and collision, arranged 10th and 12th of March 2003 with the following participants: Arve Lepsøe, Emil Aall Dahle, Bernt Hofset, Benedikte Wentworth, Sverre Alvik and Linn Kathrin Sæther.
More information on the participants is presented in Appendix E.
/2/
DNV, Safety Analysis Handbook, December 2001
/3/
Technical memo on failure probabilities of navigation equipment, DNV’s department for Nautical Safety and Communication Systems, March 2003
/4/
Managing the risks of organizational accidents, James Reason, 1997
/5/ The formal safety assessment methodology applied to the survival capability of passenger ships, Odd Olufsen (DNV Norway), John Spouge (DNV UK), Liv Hovem (DNV Norway), RINA 2003
/6/ FSA-Evacuation From Large Passenger Ships, DNV Research Report No. 2003-1208. Consequence Estimation for Grounding Events from meeting 25.06.2003, DNV Research
/7/ FSA-Evacuation From Large Passenger Ships, DNV Research Report No. 2003-1208. Consequence Estimation for Collision Events from meeting 25.06.2003, DNV Strategic Research
/8/ SLF 46 / INF.5
/9/ FSA-Evacuation From Large Passenger Ships, DNV Research Report No. 2003-1208. Grounding frequencies
- o0o -
ANNEX II - APPENDIX D
Page i annex ii - appendix d.doc
ANNEX II: APPENDIX D: RISK EXPOSURE
D Risk exposure ii D1 INTRODUCTION ................................................................................................... D-1
D2 GROUNDING MODEL .......................................................................................... D-2 D2.1 General D-2 D2.1.1 Results D-2 D2.1.2 Input data D-2 D2.1.3 Scenarios D-3
D3 COLLISION MODEL ............................................................................................. D-5 D3.1 General D-5 D3.2 Description of spreadsheet D-5 D3.2.1 Results D-5 D3.2.2 Input data D-5

ANNEX II - APPENDIX D
Page D-1 Report No. 2003-0277, rev. 01
ANNEX II - Appendix D.doc
D1 INTRODUCTION
The cruise industry is dominated by five specific trades. To be able to estimate the frequency of critical situations i.e. exposure to grounding and collisions, the characteristics and the traffic intensity of the generic cruise routes were identified. A generic route is a cruise route representative for the different cruise routes in the trade.
The cruise trades were divided into five main trades based on market information and expert judgment, ref. main report, as given in Table D-1.
Table D-1 Distribution of ship traffic in the five main cruise trades
Trade Ships in trade Caribbean 55% Alaska/Canada 13% Europe 15% Asia 15% Other 7%
Further, the passage was divided into three types of waters: ‘Open waters’, ‘Coastal waters’ and ‘Narrow waters’.
The types of waters are defined as:
• Open waters: No obstacles within 30 minutes in all directions • Coastal waters: No obstacles within 30-10 min in all directions • Narrow waters: Obstacles within less than 10 min in any direction
The distribution of sailing distance for a generic cruise route in each type of waters is given in the table below.
Table D-2 Relative sailing distance for a generic cruise route in open, coastal and narrow waters Type of waters Distance sailed Open waters 60% Coastal waters 25% Narrow waters 15%
The results are used further in an Excel model to estimate the exposure for dangerous situations for grounding and collision.
ANNEX II - APPENDIX D
Page D-2
ANNEX II - Appendix D.doc
D2 GROUNDING MODEL
D2.1 General
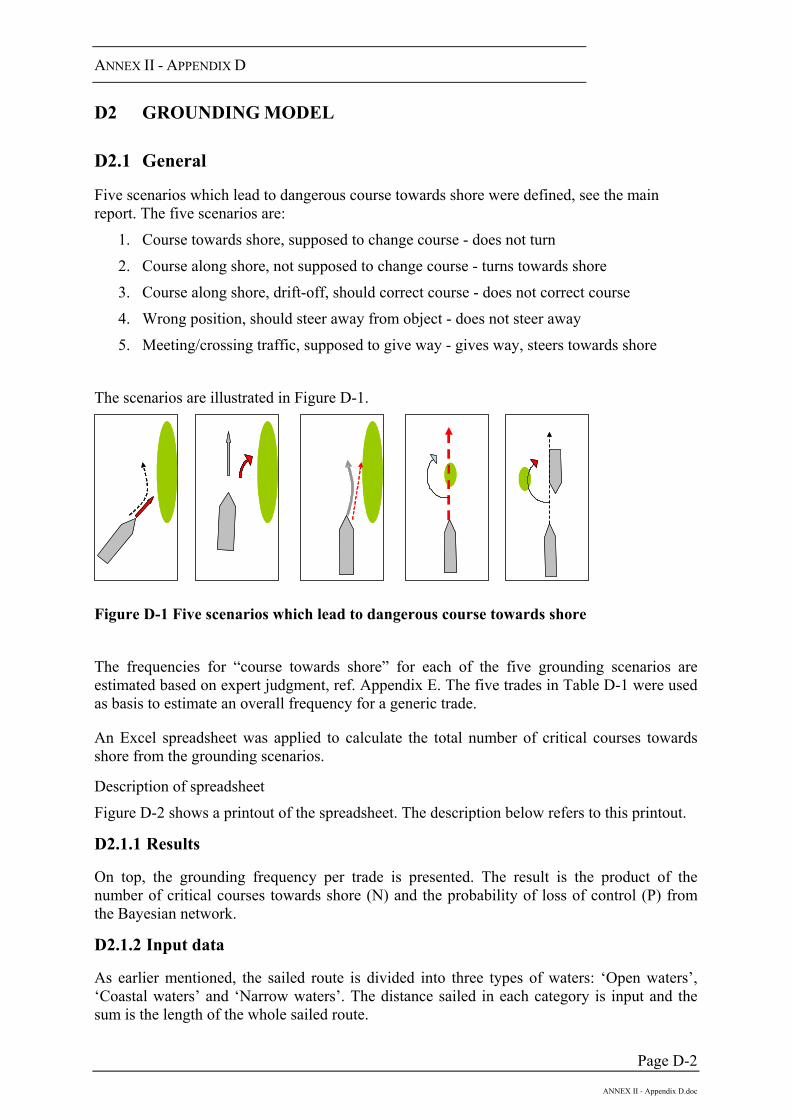
Five scenarios which lead to dangerous course towards shore were defined, see the main report. The five scenarios are:
1. Course towards shore, supposed to change course - does not turn
2. Course along shore, not supposed to change course - turns towards shore
3. Course along shore, drift-off, should correct course - does not correct course
4. Wrong position, should steer away from object - does not steer away
5. Meeting/crossing traffic, supposed to give way - gives way, steers towards shore
The scenarios are illustrated in Figure D-1.
Figure D-1 Five scenarios which lead to dangerous course towards shore
The frequencies for “course towards shore” for each of the five grounding scenarios are estimated based on expert judgment, ref. Appendix E. The five trades in Table D-1 were used as basis to estimate an overall frequency for a generic trade.
An Excel spreadsheet was applied to calculate the total number of critical courses towards shore from the grounding scenarios.
Description of spreadsheet
Figure D-2 shows a printout of the spreadsheet. The description below refers to this printout.
D2.1.1 Results
On top, the grounding frequency per trade is presented. The result is the product of the number of critical courses towards shore (N) and the probability of loss of control (P) from the Bayesian network.
D2.1.2 Input data
As earlier mentioned, the sailed route is divided into three types of waters: ‘Open waters’, ‘Coastal waters’ and ‘Narrow waters’. The distance sailed in each category is input and the sum is the length of the whole sailed route.

ANNEX II - APPENDIX D
Page D-3
ANNEX II - Appendix D.doc
The traffic intensity is divided in three groups: ‘High’, ‘Medium’ and ‘Low’. The probability for high, medium and low traffic intensity is input for each type of waters. Further, the environmental forces (wind, current), are divided in three groups, ‘Strong’, ‘Moderate’ and ‘Benign’. The probability for strong, moderate or benign environmental forces is input for each type of waters.
The spreadsheet has included the possibility to adjust for speed reduction and safety culture level in company, but this has not been done in this study.
D2.1.3 Scenarios
From Scenario 1 to Scenario 5 the number of events for each scenario is estimated per nautical mile in each type of waters. Then the probability or ratio of this event being critical is estimated. The sum of the two figures gives the number of critical courses towards shore for each scenario. The results are summarized in the bottom of the spreadsheet.
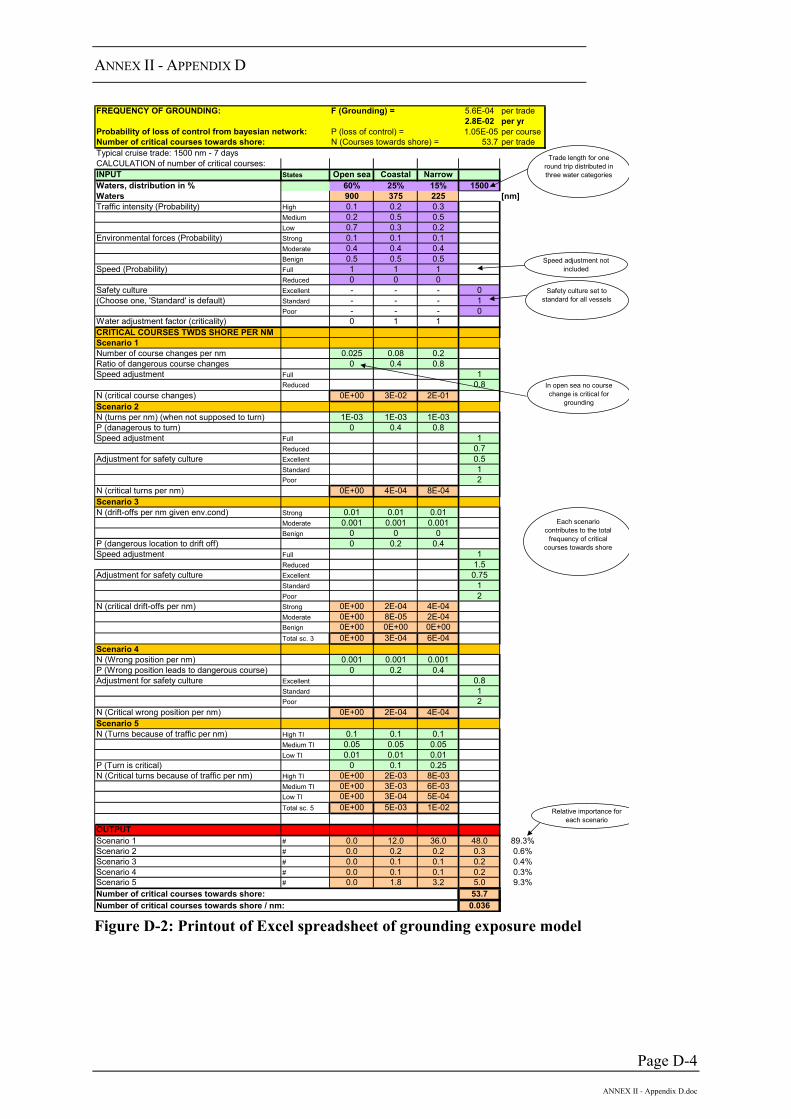
ANNEX II - APPENDIX D
Page D-4
ANNEX II - Appendix D.doc
FREQUENCY OF GROUNDING: F (Grounding) = 5.6E-04 per trade2.8E-02 per yr
Probability of loss of control from bayesian network: P (loss of control) = 1.05E-05 per courseNumber of critical courses towards shore: N (Courses towards shore) = 53.7 per tradeTypical cruise trade: 1500 nm - 7 daysCALCULATION of number of critical courses:INPUT States Open sea Coastal Narrow Waters, distribution in % 60% 25% 15% 1500Waters 900 375 225 [nm]Traffic intensity (Probability) High 0.1 0.2 0.3
Medium 0.2 0.5 0.5Low 0.7 0.3 0.2
Environmental forces (Probability) Strong 0.1 0.1 0.1Moderate 0.4 0.4 0.4Benign 0.5 0.5 0.5
Speed (Probability) Full 1 1 1Reduced 0 0 0
Safety culture Excellent - - - 0(Choose one, 'Standard' is default) Standard - - - 1
Poor - - - 0Water adjustment factor (criticality) 0 1 1CRITICAL COURSES TWDS SHORE PER NMScenario 1Number of course changes per nm 0.025 0.08 0.2Ratio of dangerous course changes 0 0.4 0.8Speed adjustment Full 1
Reduced 0.8N (critical course changes) 0E+00 3E-02 2E-01Scenario 2N (turns per nm) (when not supposed to turn) 1E-03 1E-03 1E-03P (danagerous to turn) 0 0.4 0.8Speed adjustment Full 1
Reduced 0.7Adjustment for safety culture Excellent 0.5
Standard 1Poor 2
N (critical turns per nm) 0E+00 4E-04 8E-04Scenario 3N (drift-offs per nm given env.cond) Strong 0.01 0.01 0.01
Moderate 0.001 0.001 0.001Benign 0 0 0
P (dangerous location to drift off) 0 0.2 0.4Speed adjustment Full 1
Reduced 1.5Adjustment for safety culture Excellent 0.75
Standard 1Poor 2
N (critical drift-offs per nm) Strong 0E+00 2E-04 4E-04Moderate 0E+00 8E-05 2E-04Benign 0E+00 0E+00 0E+00Total sc. 3 0E+00 3E-04 6E-04
Scenario 4N (Wrong position per nm) 0.001 0.001 0.001P (Wrong position leads to dangerous course) 0 0.2 0.4Adjustment for safety culture Excellent 0.8
Standard 1Poor 2
N (Critical wrong position per nm) 0E+00 2E-04 4E-04Scenario 5N (Turns because of traffic per nm) High TI 0.1 0.1 0.1
Medium TI 0.05 0.05 0.05Low TI 0.01 0.01 0.01
P (Turn is critical) 0 0.1 0.25N (Critical turns because of traffic per nm) High TI 0E+00 2E-03 8E-03
Medium TI 0E+00 3E-03 6E-03Low TI 0E+00 3E-04 5E-04Total sc. 5 0E+00 5E-03 1E-02
OUTPUTScenario 1 # 0.0 12.0 36.0 48.0 89.3%Scenario 2 # 0.0 0.2 0.2 0.3 0.6%Scenario 3 # 0.0 0.1 0.1 0.2 0.4%Scenario 4 # 0.0 0.1 0.1 0.2 0.3%Scenario 5 # 0.0 1.8 3.2 5.0 9.3%Number of critical courses towards shore: 53.7Number of critical courses towards shore / nm: 0.036
Trade length for one round trip distributed in three water categories
Speed adjustment not included
Safety culture set to standard for all vessels
Each scenario contributes to the total
frequency of critical courses towards shore
Relative importance for each scenario
In open sea no course change is critical for
grounding
Figure D-2: Printout of Excel spreadsheet of grounding exposure model
ANNEX II - APPENDIX D
Page D-5
ANNEX II - Appendix D.doc
D3 COLLISION MODEL
D3.1 General
The number of collision courses is modelled in Excel and uses the same structure as the grounding model. The five cruise trades with a generic route were used as basis, and the three types of waters are the same as for the grounding calculation. For each trade, the traffic intensity was estimated based on data from the AMVER database, see the main report. The geometric frequency of collision courses is calculated by taking into account the type of waters, the traffic intensity and the vessel dimensions and speeds. Three collision scenarios were included in the model:
• Collision with meeting vessels • Collision with crossing vessels • Collision with overtaking vessel
D3.2 Description of spreadsheet
Figure D-5 shows a printout of the spreadsheet. The description below refers to this printout.
D3.2.1 Results
On top, the collision frequency per year is presented. The result is the product of the number of critical courses towards shore (N) and the probability of loss of control (P) from the Bayesian network (N * P).
D3.2.2 Input data
The distance the ship is exposed to crossing and meeting traffic in each category is input and the sum is the total distance the ship is exposed to collision risk during one roundtrip. The model has been built up like this as most of the meeting and crossing traffic occur in high traffic intensity areas (hotspots), where the ship sails a short amount of time compared to the whole sailing. For a specific route with uniform distribution of traffic, the whole sailing should be included.
Next line is the number of trades or sailings each year. The number of crossings and meetings in one year are data based on the AMVER database, ref. the main report. The number of crossing ships in the trade is the total number of vessels crossing the passage of the vessel during one year. The number of meeting vessels in the trade is the number of vessels with a meeting course in the passage of the vessel during one year.
The percentage of the sailing with lane separation and Vessel Traffic Service (VTS) is input. Lane separation is modelled to decrease the critical meeting situation frequency. The presence of VTS will decrease both critical meeting and crossing situations.
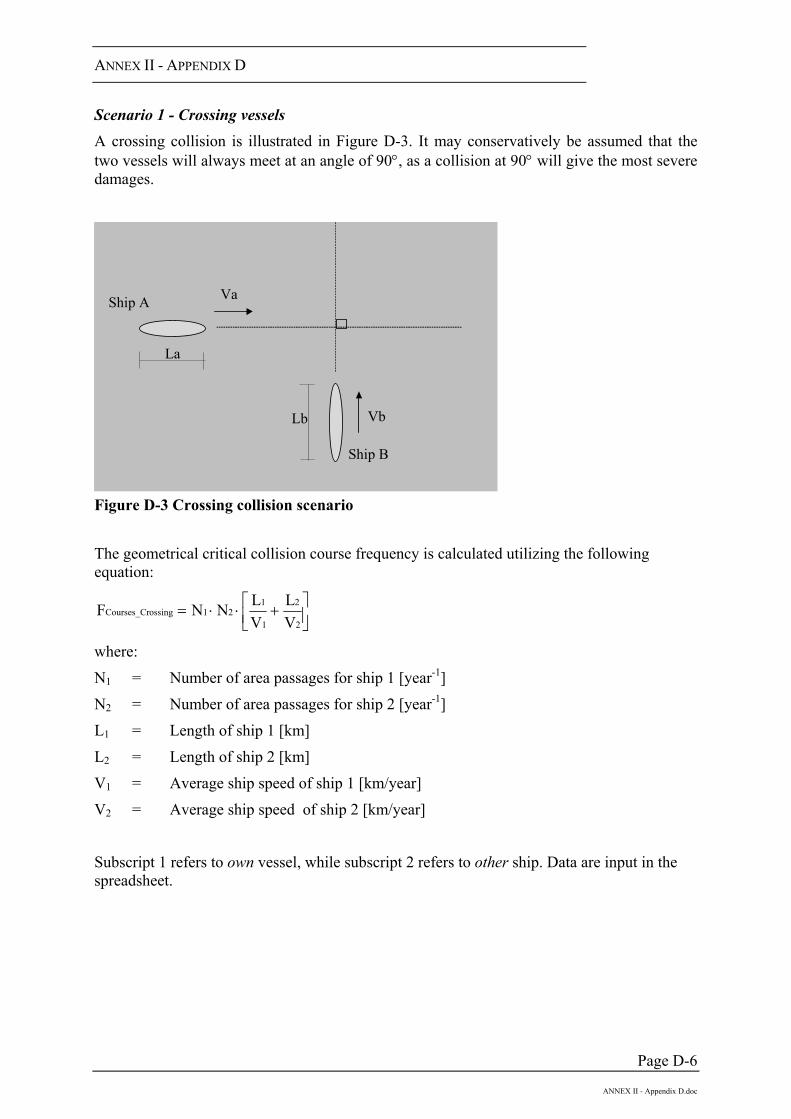
ANNEX II - APPENDIX D
Page D-6
ANNEX II - Appendix D.doc
Scenario 1 - Crossing vessels A crossing collision is illustrated in Figure D-3. It may conservatively be assumed that the two vessels will always meet at an angle of 90°, as a collision at 90° will give the most severe damages.
Ship A Va
Vb
Ship B
La
Lb
Figure D-3 Crossing collision scenario The geometrical critical collision course frequency is calculated utilizing the following equation:
+⋅⋅=
2
2
1
121ossingCourses_Cr
VL
VLNNF
where:
N1 = Number of area passages for ship 1 [year-1]
N2 = Number of area passages for ship 2 [year-1]
L1 = Length of ship 1 [km]
L2 = Length of ship 2 [km]
V1 = Average ship speed of ship 1 [km/year]
V2 = Average ship speed of ship 2 [km/year]
Subscript 1 refers to own vessel, while subscript 2 refers to other ship. Data are input in the spreadsheet.
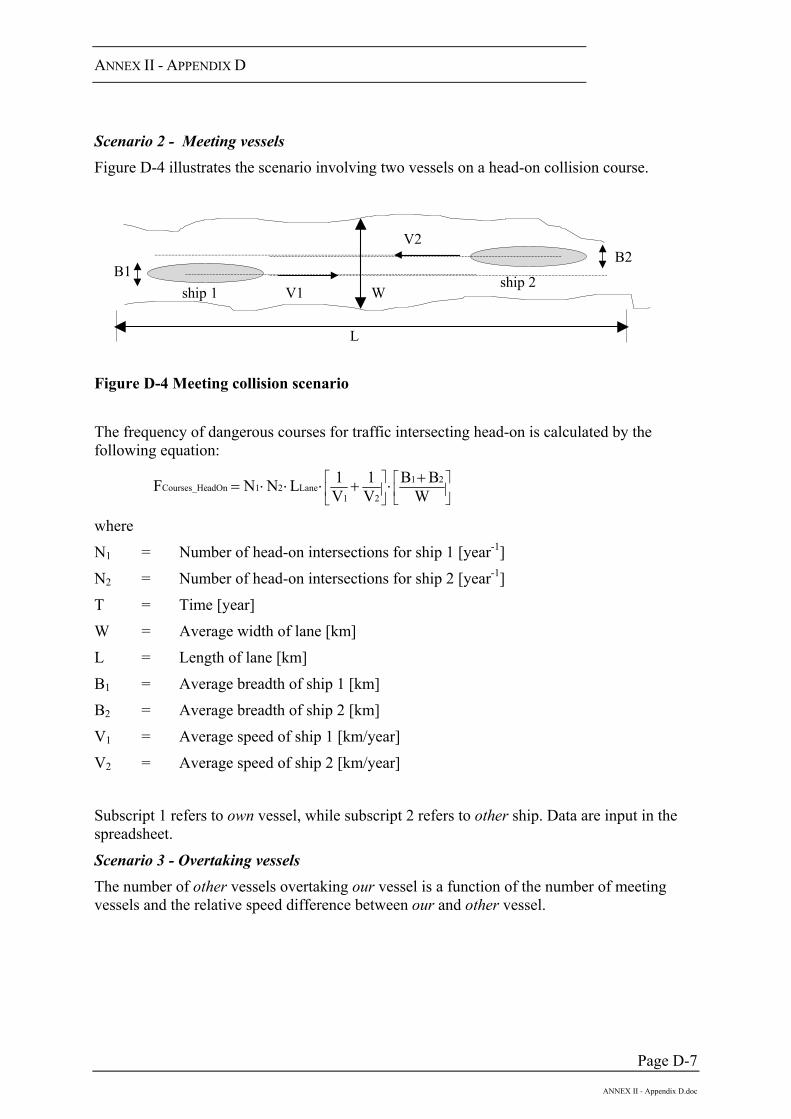
ANNEX II - APPENDIX D
Page D-7
ANNEX II - Appendix D.doc
Scenario 2 - Meeting vessels Figure D-4 illustrates the scenario involving two vessels on a head-on collision course.
ship 1ship 2
V1
V2
B1B2
W
L
Figure D-4 Meeting collision scenario
The frequency of dangerous courses for traffic intersecting head-on is calculated by the following equation:
+⋅+⋅⋅⋅= WBB
V1
V1LNNF 21
21Lane21adOnCourses_He
where
N1 = Number of head-on intersections for ship 1 [year-1]
N2 = Number of head-on intersections for ship 2 [year-1]
T = Time [year]
W = Average width of lane [km]
L = Length of lane [km]
B1 = Average breadth of ship 1 [km]
B2 = Average breadth of ship 2 [km]
V1 = Average speed of ship 1 [km/year]
V2 = Average speed of ship 2 [km/year]
Subscript 1 refers to own vessel, while subscript 2 refers to other ship. Data are input in the spreadsheet.
Scenario 3 - Overtaking vessels The number of other vessels overtaking our vessel is a function of the number of meeting vessels and the relative speed difference between our and other vessel.
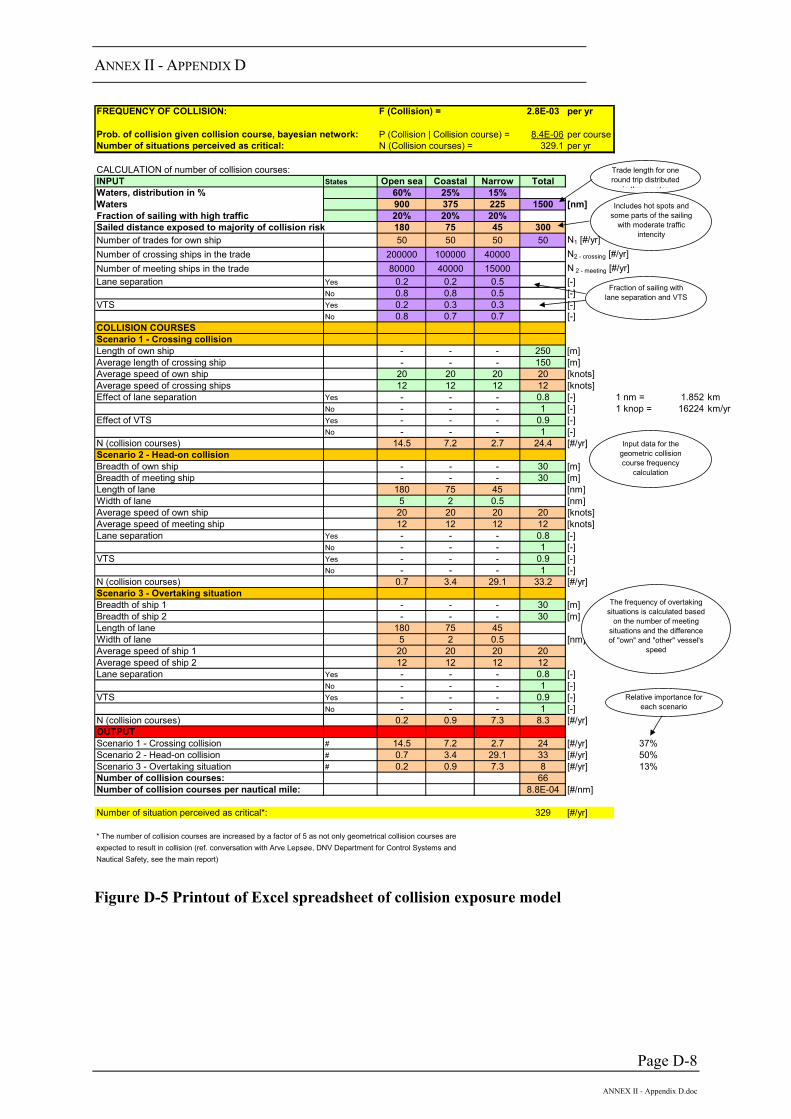
ANNEX II - APPENDIX D
Page D-8
ANNEX II - Appendix D.doc
FREQUENCY OF COLLISION: F (Collision) = 2.8E-03 per yr
Prob. of collision given collision course, bayesian network: P (Collision | Collision course) = 8.4E-06 per courseNumber of situations perceived as critical: N (Collision courses) = 329.1 per yr
CALCULATION of number of collision courses:INPUT States Open sea Coastal Narrow Total Waters, distribution in % 60% 25% 15%Waters 900 375 225 1500 [nm]Fraction of sailing with high traffic 20% 20% 20%Sailed distance exposed to majority of collision risk 180 75 45 300Number of trades for own ship 50 50 50 50 N1 [#/yr]Number of crossing ships in the trade 200000 100000 40000 N2 - crossing [#/yr]Number of meeting ships in the trade 80000 40000 15000 N 2 - meeting [#/yr]Lane separation Yes 0.2 0.2 0.5 [-]
No 0.8 0.8 0.5 [-]VTS Yes 0.2 0.3 0.3 [-]
No 0.8 0.7 0.7 [-]COLLISION COURSESScenario 1 - Crossing collisionLength of own ship - - - 250 [m]Average length of crossing ship - - - 150 [m]Average speed of own ship 20 20 20 20 [knots]Average speed of crossing ships 12 12 12 12 [knots]Effect of lane separation Yes - - - 0.8 [-] 1 nm = 1.852 km
No - - - 1 [-] 1 knop = 16224 km/yrEffect of VTS Yes - - - 0.9 [-]
No - - - 1 [-]N (collision courses) 14.5 7.2 2.7 24.4 [#/yr]Scenario 2 - Head-on collisionBreadth of own ship - - - 30 [m]Breadth of meeting ship - - - 30 [m]Length of lane 180 75 45 [nm]Width of lane 5 2 0.5 [nm]Average speed of own ship 20 20 20 20 [knots]Average speed of meeting ship 12 12 12 12 [knots]Lane separation Yes - - - 0.8 [-]
No - - - 1 [-]VTS Yes - - - 0.9 [-]
No - - - 1 [-]N (collision courses) 0.7 3.4 29.1 33.2 [#/yr]Scenario 3 - Overtaking situationBreadth of ship 1 - - - 30 [m]Breadth of ship 2 - - - 30 [m]Length of lane 180 75 45Width of lane 5 2 0.5 [nm]Average speed of ship 1 20 20 20 20Average speed of ship 2 12 12 12 12Lane separation Yes - - - 0.8 [-]
No - - - 1 [-]VTS Yes - - - 0.9 [-]
No - - - 1 [-]N (collision courses) 0.2 0.9 7.3 8.3 [#/yr]OUTPUTScenario 1 - Crossing collision # 14.5 7.2 2.7 24 [#/yr] 37%Scenario 2 - Head-on collision # 0.7 3.4 29.1 33 [#/yr] 50%Scenario 3 - Overtaking situation # 0.2 0.9 7.3 8 [#/yr] 13%Number of collision courses: 66Number of collision courses per nautical mile: 8.8E-04 [#/nm]
Number of situation perceived as critical*: 329 [#/yr]
* The number of collision courses are increased by a factor of 5 as not only geometrical collision courses are expected to result in collision (ref. conversation with Arve Lepsøe, DNV Department for Control Systems and Nautical Safety, see the main report)
Trade length for one round trip distributed
in three water
Includes hot spots and some parts of the sailing
with moderate traffic intencity
Fraction of sailing with lane separation and VTS
Input data for the geometric collision course frequency
calculation
The frequency of overtaking situations is calculated based
on the number of meeting situations and the difference of "own" and "other" vessel's
speed
Relative importance for each scenario
Figure D-5 Printout of Excel spreadsheet of collision exposure model
ANNEX II - APPENDIX E
Page i /ANNEX II - Appendix E.doc
ANNEX II: APPENDIX E: EXPERT JUDGEMENTS
E Expert Judgements ii E1 THE EXPERT JUDGEMENT PROCESS AND PEOPLE INVOLVED ................E-1 E1.1 Project team E-1 E1.2 Expert judgements E-2
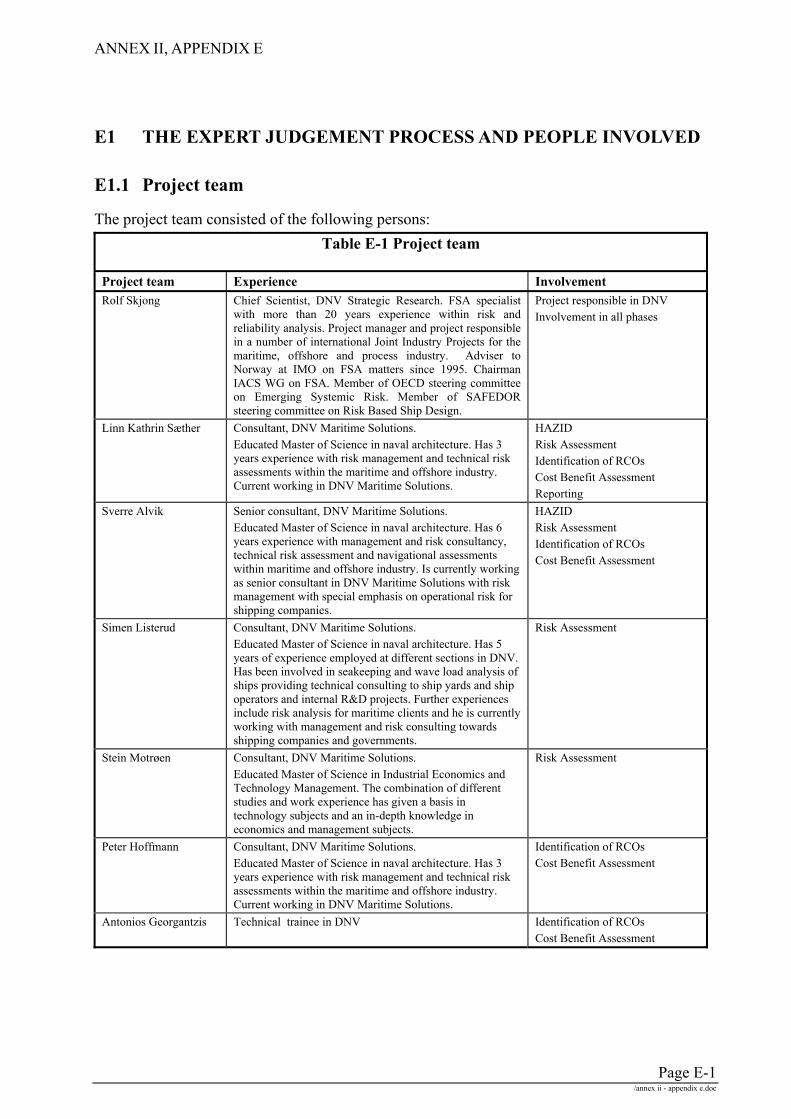
ANNEX II, APPENDIX E
Page E-1 /annex ii - appendix e.doc
E1 THE EXPERT JUDGEMENT PROCESS AND PEOPLE INVOLVED
E1.1 Project team
The project team consisted of the following persons: Table E-1 Project team
Project team Experience Involvement Rolf Skjong Chief Scientist, DNV Strategic Research. FSA specialist
with more than 20 years experience within risk and reliability analysis. Project manager and project responsible in a number of international Joint Industry Projects for the maritime, offshore and process industry. Adviser to Norway at IMO on FSA matters since 1995. Chairman IACS WG on FSA. Member of OECD steering committee on Emerging Systemic Risk. Member of SAFEDOR steering committee on Risk Based Ship Design.
Project responsible in DNV Involvement in all phases
Linn Kathrin Sæther Consultant, DNV Maritime Solutions. Educated Master of Science in naval architecture. Has 3 years experience with risk management and technical risk assessments within the maritime and offshore industry. Current working in DNV Maritime Solutions.
HAZID Risk Assessment Identification of RCOs Cost Benefit Assessment Reporting
Sverre Alvik Senior consultant, DNV Maritime Solutions. Educated Master of Science in naval architecture. Has 6 years experience with management and risk consultancy, technical risk assessment and navigational assessments within maritime and offshore industry. Is currently working as senior consultant in DNV Maritime Solutions with risk management with special emphasis on operational risk for shipping companies.
HAZID Risk Assessment Identification of RCOs Cost Benefit Assessment
Simen Listerud Consultant, DNV Maritime Solutions. Educated Master of Science in naval architecture. Has 5 years of experience employed at different sections in DNV. Has been involved in seakeeping and wave load analysis of ships providing technical consulting to ship yards and ship operators and internal R&D projects. Further experiences include risk analysis for maritime clients and he is currently working with management and risk consulting towards shipping companies and governments.
Risk Assessment
Stein Motrøen Consultant, DNV Maritime Solutions. Educated Master of Science in Industrial Economics and Technology Management. The combination of different studies and work experience has given a basis in technology subjects and an in-depth knowledge in economics and management subjects.
Risk Assessment
Peter Hoffmann Consultant, DNV Maritime Solutions. Educated Master of Science in naval architecture. Has 3 years experience with risk management and technical risk assessments within the maritime and offshore industry. Current working in DNV Maritime Solutions.
Identification of RCOs Cost Benefit Assessment
Antonios Georgantzis Technical trainee in DNV Identification of RCOs Cost Benefit Assessment
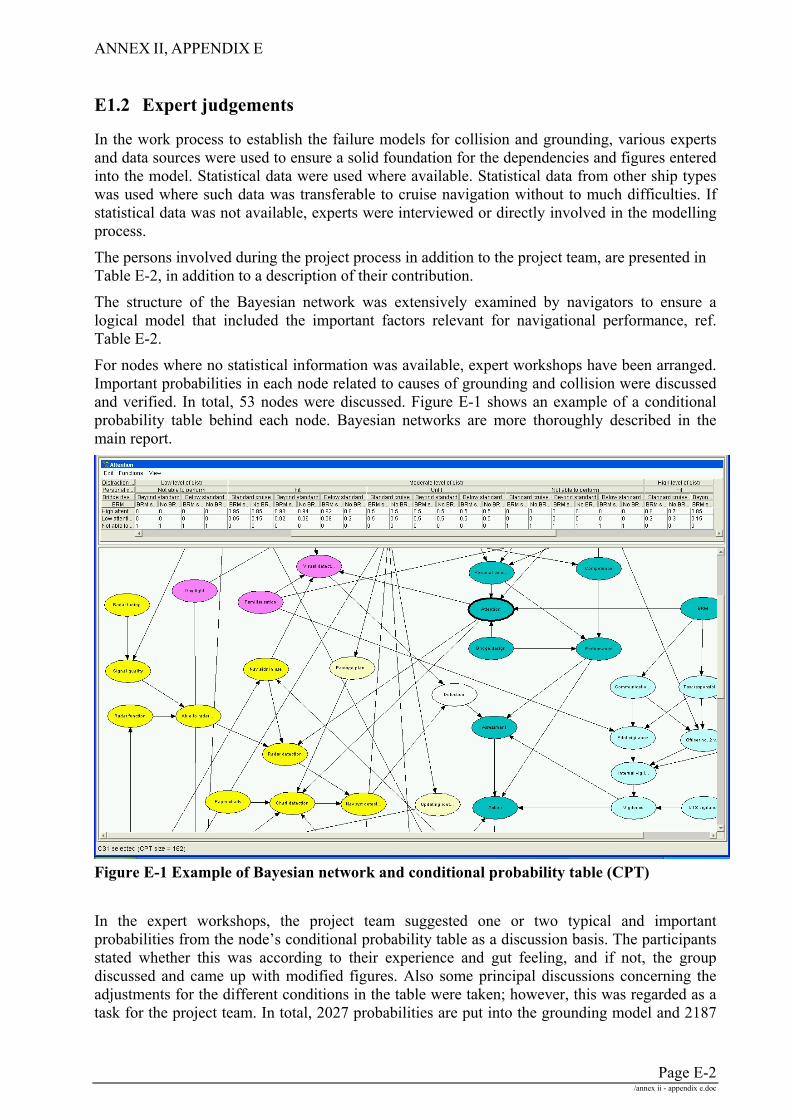
ANNEX II, APPENDIX E
Page E-2 /annex ii - appendix e.doc
E1.2 Expert judgements
In the work process to establish the failure models for collision and grounding, various experts and data sources were used to ensure a solid foundation for the dependencies and figures entered into the model. Statistical data were used where available. Statistical data from other ship types was used where such data was transferable to cruise navigation without to much difficulties. If statistical data was not available, experts were interviewed or directly involved in the modelling process.
The persons involved during the project process in addition to the project team, are presented in Table E-2, in addition to a description of their contribution.
The structure of the Bayesian network was extensively examined by navigators to ensure a logical model that included the important factors relevant for navigational performance, ref. Table E-2.
For nodes where no statistical information was available, expert workshops have been arranged. Important probabilities in each node related to causes of grounding and collision were discussed and verified. In total, 53 nodes were discussed. Figure E-1 shows an example of a conditional probability table behind each node. Bayesian networks are more thoroughly described in the main report.
Figure E-1 Example of Bayesian network and conditional probability table (CPT) In the expert workshops, the project team suggested one or two typical and important probabilities from the node’s conditional probability table as a discussion basis. The participants stated whether this was according to their experience and gut feeling, and if not, the group discussed and came up with modified figures. Also some principal discussions concerning the adjustments for the different conditions in the table were taken; however, this was regarded as a task for the project team. In total, 2027 probabilities are put into the grounding model and 2187
ANNEX II, APPENDIX E
Page E-3 /annex ii - appendix e.doc
probabilities into the collision model. Many of those figures are of course identical; however, to discuss every numbers in a workshop is a too extensive scope.
References to these workshops are made in the node description in Appendix C. The experts participating in the sessions the 10th and 12th of March 2003 were: • Arve Lepsøe • Emil Aall Dahle • Bernt Hofset • Benedikte Wentworth in addition to members of the project team. For more information on the participants and their expertise, see Table E-2.
For nodes related to consequences of grounding and collision, a meeting was arranged on the 14th of March with Mads Magnussen, ref. Table E-2, in DNV’s Passenger Ship Department. In this meeting, a course assessment of vessel damage, evacuation process and human impact was carried out.
In addition, two workshops (Delphi sessions) with DNV experts within stability was held for consequence estimation for both collision and grounding events. The workshops focused on determining probabilities for the speed of sinking and the fatality rates given that the vessel sinks.
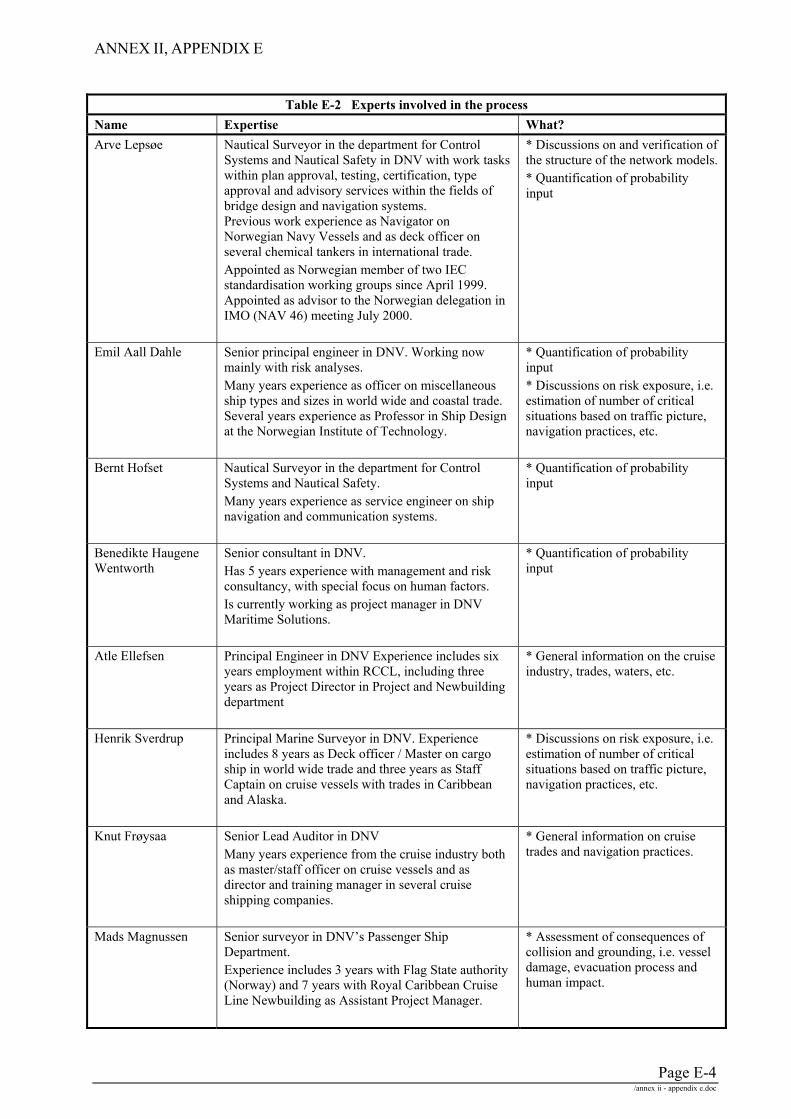
ANNEX II, APPENDIX E
Page E-4 /annex ii - appendix e.doc
Table E-2 Experts involved in the process Name Expertise What? Arve Lepsøe Nautical Surveyor in the department for Control
Systems and Nautical Safety in DNV with work tasks within plan approval, testing, certification, type approval and advisory services within the fields of bridge design and navigation systems. Previous work experience as Navigator on Norwegian Navy Vessels and as deck officer on several chemical tankers in international trade. Appointed as Norwegian member of two IEC standardisation working groups since April 1999. Appointed as advisor to the Norwegian delegation in IMO (NAV 46) meeting July 2000.
* Discussions on and verification of the structure of the network models. * Quantification of probability input
Emil Aall Dahle Senior principal engineer in DNV. Working now mainly with risk analyses. Many years experience as officer on miscellaneous ship types and sizes in world wide and coastal trade. Several years experience as Professor in Ship Design at the Norwegian Institute of Technology.
* Quantification of probability input * Discussions on risk exposure, i.e. estimation of number of critical situations based on traffic picture, navigation practices, etc.
Bernt Hofset Nautical Surveyor in the department for Control Systems and Nautical Safety. Many years experience as service engineer on ship navigation and communication systems.
* Quantification of probability input
Benedikte Haugene Wentworth
Senior consultant in DNV. Has 5 years experience with management and risk consultancy, with special focus on human factors. Is currently working as project manager in DNV Maritime Solutions.
* Quantification of probability input
Atle Ellefsen Principal Engineer in DNV Experience includes six years employment within RCCL, including three years as Project Director in Project and Newbuilding department
* General information on the cruise industry, trades, waters, etc.
Henrik Sverdrup Principal Marine Surveyor in DNV. Experience includes 8 years as Deck officer / Master on cargo ship in world wide trade and three years as Staff Captain on cruise vessels with trades in Caribbean and Alaska.
* Discussions on risk exposure, i.e. estimation of number of critical situations based on traffic picture, navigation practices, etc.
Knut Frøysaa Senior Lead Auditor in DNV Many years experience from the cruise industry both as master/staff officer on cruise vessels and as director and training manager in several cruise shipping companies.
* General information on cruise trades and navigation practices.
Mads Magnussen Senior surveyor in DNV’s Passenger Ship Department. Experience includes 3 years with Flag State authority (Norway) and 7 years with Royal Caribbean Cruise Line Newbuilding as Assistant Project Manager.
* Assessment of consequences of collision and grounding, i.e. vessel damage, evacuation process and human impact.

ANNEX II, APPENDIX E
Page E-5 /annex ii - appendix e.doc
Sigmund Rusås Damage stability expert, Adviser to Norway at SLF. Project Manager of HARDER
* Consequence estimation for both grounding and collision
Odd Olufsen Damage stability expert * Consequence estimation for both grounding and collision
Edith Vistung Damage stability expert * Consequence estimation for collision
Gunnar Hjort Damage stability expert. Adviser for Norway at SLF * Consequence estimation for grounding
Related Documents