1 Annex 5: Subsidy level indicators for the case studies ‘Environmentally Harmful Subsidies: Identification and Assessment’ A study led by IEEP, with Ecologic, IVM and Claudia Dias Soares for the European Commission, DG Environment Results of Task 3a 1 CASE STUDIES IN THE TRANSPORT SECTOR ......................................... 2 1.1 Fuel tax differentiation ..................................................................................... 2 1.2 Company car taxation in the Netherlands ...................................................... 6 2 CASE STUDIES IN THE ENERGY SECTOR ............................................... 13 2.1 VAT reduction for domestic energy in the UK ............................................ 13 2.2 Fuel tax exemption for biofuels in Germany ................................................ 16 3 CASE STUDIES IN THE WATER SECTOR ................................................. 19 3.1 Irrigation subsidies in Spain .......................................................................... 19

Welcome message from author
This document is posted to help you gain knowledge. Please leave a comment to let me know what you think about it! Share it to your friends and learn new things together.
Transcript

1
Annex 5: Subsidy level indicators for the case studies
‘Environmentally Harmful Subsidies: Identification and Assessment’
A study led by IEEP, with Ecologic, IVM and Claudia Dias Soares for the European
Commission, DG Environment
Results of Task 3a
1 CASE STUDIES IN THE TRANSPORT SECTOR .........................................2
1.1 Fuel tax differentiation .....................................................................................2
1.2 Company car taxation in the Netherlands......................................................6
2 CASE STUDIES IN THE ENERGY SECTOR...............................................13
2.1 VAT reduction for domestic energy in the UK ............................................13
2.2 Fuel tax exemption for biofuels in Germany................................................16
3 CASE STUDIES IN THE WATER SECTOR.................................................19
3.1 Irrigation subsidies in Spain ..........................................................................19

2
1 CASE STUDIES IN THE TRANSPORT SECTOR
1.1 Fuel tax differentiation
1.1.1 Value indicators
Tax expenditure
Conversion factors used:
Kilograms of motor fuel per litre
kg/cu.m kg/l
Petrol 737,22 0,737
Diesel 850,00 0,850
Source http://www.simetric.co.uk/si_liquids.htm
Ktoe per kilogram of motor fuel
kg kgoe ktoe
Petrol 1 1,051 0,000001051
Diesel 1 1,010 0,000001010
Source: DG Energy and Transport. 2009. EU Energy and Transport In Figures. p. 23.
http://ec.europa.eu/energy/publications/statistics/doc/2009_energy_transport_figures.pdf
ktoe kg litres
Petrol 1 951.475 1.291.011
Diesel 1 990.099 1.164.822
CO2 emissions per litre of diesel burned (kg) = 2,67
CO2 emissions from a gallon of diesel = 2,778 grams x 0.99 x (44/12) = 10,084 grams = 10.1
kg/gallon = 22.2 pounds/gallon
Source: U.S. Environmental Protection Agency. Emission Facts: Average Carbon Dioxide
Emissions Resulting from Gasoline and Diesel Fuel.
http://www.epa.gov/otaq/climate/420f05001.htm#calculating
1 gallon [US, liquid] = 3.785 411 784 liter
source: http://www.onlineconversion.com/volume.htm
Diesel prices, fuel excise taxes and non-commercial diesel subsidy
EUR per litre
Total price (diesel) Excise tax Diesel subsidy
Country Petrol Diesel
UK 1,17 0,66 0,66 -
Austria (AT) 0,95 0,46 0,36 0,10
Netherlands (NL) 1,04 0,70 0,42 0,28
Fuel price source: AA Ireland (2009). International Petrol Prices: May 2009.
http://www.aaireland.ie/petrolprices/
Excise tax source: DG TAXUD Excise Tax Tables

3
Diesel fuel sales in Austria, the Netherlands and the UK, 2006
Diesel
sales 2006
(ktoe)
% of sales that
are non-
commercial
Non-commercial
sales (ktoe)
kg litres
conversion
factors 1 990,099 1,164,822
AT 4,523 25% 1,131 1,119,554,455 1,317,122,889
NL 6,950 25% 1,738 1,720,297,030 2,023,878,858
UK 22,369 25% 5,592 5,536,881,188 6,513,977,868
Sources:
Fuel sales figures from DG Energy and Transport. 2009. p. 219. EU Energy and Transport In Figures.
http://ec.europa.eu/energy/publications/statistics/doc/2009_energy_transport_figures.pdf
Non-commercial %-of-sales assumption based on Kohlhaas, M., K. Schumacher, J. Diekmann, M.
Cames and D. Schumacher. 2004. Economic, Environmental and International Trade Effects of the
EU Directive on Energy Tax Harmonization. DIW Berlin, German Institute for Economic Research.
Discussion Paper 462.
a) Revenue foregone method
Austria Netherlands UK
(medium case) (high case) (low case)
Baseline tax rate (petrol; EUR per litre in 2009)
0.46 .70 .66
Reduced tax rate (diesel; EUR per litre in 2009)
0.36 .42 .66
Value of non-commercial diesel consumption (2006 sales volume times 2009 prices; in EUR)
1,251,266,744 2,104,834,013 7,621,354,106
Revenue foregone (EUR) 128,419,482 571,179,091 0
b) Revenue gain method:
- Elasticity of demand:
Volume of fuel consumed: -0.25 within a year; -0.6 in about 5 years1
Austria (AT) Netherlands (NL) UK
% change in diesel price with removal of subsidy 10.3% 27.1% 0%
Short-term elasticity (1 year) - 0.25 - 0.25 - 0.25
Longer-term elasticity (5 year) - 0.60 - 0.60 - 0.60
Short-term % reduction in diesel consumption -2.6% -6.8% 0.0%
1 Goodwin, Dargay and Hanly (2004) found the following price effects: If the real price of fuel rises by
10% and stays at that level, the result is a dynamic process of adjustment such that the following
occur: (a) Volume of traffic will fall by roundly 1% within about a year, building up to a reduction of
about 3% in the longer run (about 5 years or so).; (b) Volume of fuel consumed will fall by about
2.5% within a year, building up to a reduction of over 6% in the longer run.

4
Longer-term % reduction in diesel consumption -6.2% -16.3% 0.0%
Litres of subsidised diesel sold 1,317,122,889 2,023,878,858 6,513,977,868
Litres of unsubsidised diesel sold (short-term) 1,283,328,288 1,886,576,192 6,513,977,868
Litres of unsubsidised diesel sold (longer-term) 1,236,015,848 1,694,352,460 6,513,977,868
Diesel subsidy per litre 0.10 0.28 -
Revenue gain (short-term) 125,124,508 532,429,533 -
Revenue gain (longer-term) 120,511,545 478,180,151 -
c) Marginal social cost
Several negative externalities are associated with vehicle travel. However, many are
dependent on the type and weight of vehicle as well as the specific area of travel (e.g.
rural, urban, motorway). Due to these complexities, external costs other than costs of
climate change will be left out of the analysis. Costs of climate change are a direct
function of fuel consumption and are independent of place of emission.
The IMPACT study recommends values for the external costs of climate change as 7
EUR (lower value), 25 (middle value), and 45 (upper value) EUR per tonne of CO2
emitted.
Burning a litre of diesel produces about 2.62 kg of CO2
Austria Netherlands
Marginal litres of diesel consumed per year (short-term) 33,794,600 137,302,666
Marginal litres of diesel consumed per year (longer-term) 81,107,041 329,526,399
Marginal kilograms of CO2 consumed per year (short-term) 90,168,648 366,342,424
Marginal kilograms of CO2 consumed per year (longer-term) 216,404,756 879,221,818
Short-term external costs of CO2 (~1 year; in EUR at 2006 consumption levels)
Climate change costs - low 631,181 2,564,397
Climate change costs - med 2,254,216 9,158,561
Climate change costs - high 4,057,589 16,485,409
Longer-term external costs of CO2 (~5 years; in EUR, at 2006 consumption levels)
Climate change costs - low 1,514,833 6,154,553
Climate change costs - med 5,410,119 21,980,545
Climate change costs - high 9,738,214 39,564,982
Summary Table (All figures in EUR)
Austria Netherlands UK
(medium case) (high case) (low
case)
Revenue foregone 128,419,482 571,179,091 0
Revenue gain (short-term) 125,124,508 532,429,533 0
Revenue gain (longer-term) 120,511,545 478,180,151 0
Short-term external costs of CO2 (~1 year; in EUR at 2006 consumption levels)
Climate change costs - low 631,181 2,564,397 0

5
Climate change costs - med 2,254,216 9,158,561 0
Climate change costs - high 4,057,589 16,485,409 0
Longer-term external costs of CO2 (~5 years; in EUR, at 2006 consumption levels)
Climate change costs - low 1,514,833 6,154,553 0
Climate change costs - med 5,410,119 21,980,545 0
Climate change costs - high 9,738,214 39,564,982 0
d) Total annual subsidy value
- With revenue foregone method: €128 million for Austria; EUR €571 million
for the Netherlands
- With revenue gain method: €125 million over the short term for Austria (€120
million over the longer term); €532 million over the short term for the
Netherlands (€478 million over the longer term)
- Climate-change costs via MSC method (short term): an additional €630,000 to
€4.1 million for Austria; an additional €2.6 million to €16.5 million for the
Netherlands
- Climate-change costs via MSC method (longer term): an additional €1.5
million to €9.8 million for Austria; an additional €6.1 million to €40 million
for the Netherlands
1.1.2 Percentage indicators
The following percentage indicators show the total diesel subsidy as a percentage of
total annual diesel consumption and as a percentage of total excise revenues collected
at present (i.e. with the subsidy in place). The figures show the lowest scenario
(revenue gain method and lowest climate-cost scenario over the longer term) and the
highest scenario (revenue foregone method and highest climate-cost scenario over the
longer term).
Austria The Netherlands
lowest Highest lowest highest
Subsidy as % of total annual
diesel cost (also includes
climate costs) 9,8% 11% 23,0% 29%
Subsidy as % of total excise
revenues (not including
climate costs) 25,3% 27% 56,5% 67%
Summary of assessing the level of subsidization of diesel excise tax subsidies
Austria
The total value of annual tax-expenditure subsidies to drivers of diesel vehicles in
Austria is estimated to be between €129 million and €138 million, including the
costs of climate change. Of this, €128 million is due to foregone tax revenue and
€630,000 to €9.8 million is due to climate-change costs associated with subsidy-
induced driving behaviour. Removing the diesel excise-tax subsidy would on average
increase the cost of driving a diesel vehicle in Austria by 10% and increase diesel
fuel-tax revenue by about 26%.
6
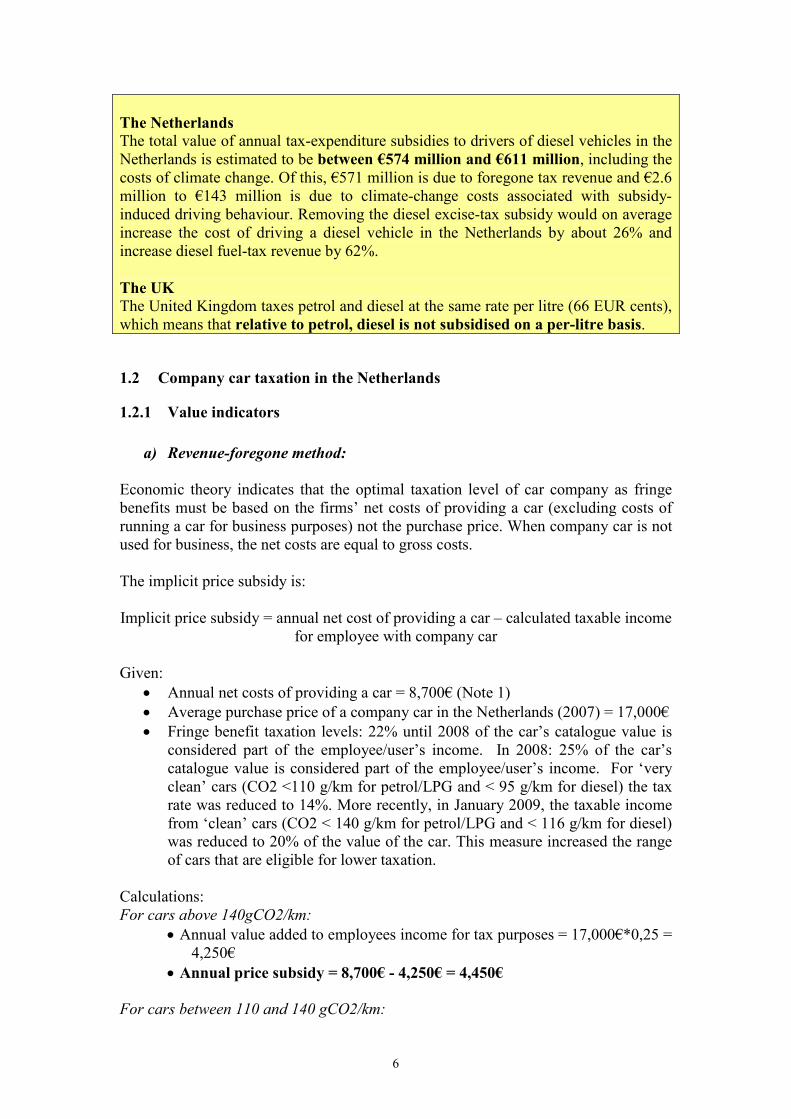
The Netherlands
The total value of annual tax-expenditure subsidies to drivers of diesel vehicles in the
Netherlands is estimated to be between €574 million and €611 million, including the
costs of climate change. Of this, €571 million is due to foregone tax revenue and €2.6
million to €143 million is due to climate-change costs associated with subsidy-
induced driving behaviour. Removing the diesel excise-tax subsidy would on average
increase the cost of driving a diesel vehicle in the Netherlands by about 26% and
increase diesel fuel-tax revenue by 62%.
The UK
The United Kingdom taxes petrol and diesel at the same rate per litre (66 EUR cents),
which means that relative to petrol, diesel is not subsidised on a per-litre basis.
1.2 Company car taxation in the Netherlands
1.2.1 Value indicators
a) Revenue-foregone method:
Economic theory indicates that the optimal taxation level of car company as fringe
benefits must be based on the firms’ net costs of providing a car (excluding costs of
running a car for business purposes) not the purchase price. When company car is not
used for business, the net costs are equal to gross costs.
The implicit price subsidy is:
Implicit price subsidy = annual net cost of providing a car – calculated taxable income
for employee with company car
Given:
• Annual net costs of providing a car = 8,700€ (Note 1)
• Average purchase price of a company car in the Netherlands (2007) = 17,000€
• Fringe benefit taxation levels: 22% until 2008 of the car’s catalogue value is
considered part of the employee/user’s income. In 2008: 25% of the car’s
catalogue value is considered part of the employee/user’s income. For ‘very
clean’ cars (CO2 <110 g/km for petrol/LPG and < 95 g/km for diesel) the tax
rate was reduced to 14%. More recently, in January 2009, the taxable income
from ‘clean’ cars (CO2 < 140 g/km for petrol/LPG and < 116 g/km for diesel)
was reduced to 20% of the value of the car. This measure increased the range
of cars that are eligible for lower taxation.
Calculations:
For cars above 140gCO2/km:
• Annual value added to employees income for tax purposes = 17,000€*0,25 =
4,250€
• Annual price subsidy = 8,700€ - 4,250€ = 4,450€
For cars between 110 and 140 gCO2/km:

7
Note: we assume the average price for cleaner cars is the same as average.
• Annual value added to employees income for tax purposes = 17,000€*0,20 =
3,400€
• Annual price subsidy = 8,700€ - 3,400€ = 5,300€
For cars below 110gCO2/km:
Note: we assume the average price for cleaner cars is the same as average.
• Annual value added to employees income for tax purposes = 17,000€*0,14 =
2,380€
• Annual price subsidy = 8,700€ - 2,380€ = 6,320€
The implicit price subsidy given to employees is equal to 4,450€ annually for
company cars above 140gCO2/km, 5,300€ for ‘clean’ cars and 6,320€ for ‘very
clean’ cars.
The annual net costs of owning a car is about double than what the employee pays
for under the current taxation scheme (for (very) clean cars employees get a greater
discount).
The non distortionary percentage of car value that should be considered as taxable
income is 51% (8,700/17,000), much higher than 25%.
Notes:
(1) The annual net cost used is based on the following assumptions: the car is leased
(more that 70% of company cars in the NL). The costs are calculated on the
assumption that the car is not used for business purposes (purchase and costs would
be slightly higher) (this is the case for 78% of company cars in the NL). This implies
an average purchase price of €17,000. The annual cost include: a) annual lease price
of the car is €3,700; b) on average, company-car owners drive about 17,000 private
kilometres per year; c) the sum of the fuel and depreciation costs per kilometre of a
representative company car is estimated to be about €0.15, consequently the variable
private costs are estimated to be €2,550 (that is, €0.15 × 17,000 km); the insurance
premium is annual, €1,700; d) free road assistance is rather negligible, at €69.50; e)
the vehicle user tax, which reflects the costs of road usage, is dependent on residence
province and on weight, an on average amounts to €2,500 annually. Therefore the
total costs are €8,700 (that is, €3,700 + €2,550 + €2,500). (Taken from Gutierrez-i-
Puigarnau and van Ommeren (2009). NB: G&O seem to have omitted the € 1,700
insurance premium from their calculation, so the actual costs may be even higher.
b) The taxes foregone for the income tax advantage:
Value of annual tax foregone per company car = Implicit price subsidy * marginal
income tax
Given:
• Marginal income tax brackets: 42% (income from EUR 32,127 to EUR
54,776) ; above that: 52 %.
• Annual price subsidy for ownership of a car = 4,450€ (for cars above
140gCO2/km)
• Annual price subsidy = 5,300€ (for cars between 110 and 140 gCO2/km)
8
• Annual price subsidy = 6,320€ (for cars below 110gCO2/km)
Calculations:
a) For cars above 140gCO2/km:
• Value of tax foregone = 4,450€*0,42 = 1,869€ (middle income tax bracket)
• Value of tax foregone = 4,450€*0,52 = 2,314€ tax foregone (higher income
tax bracket)
b) For cars between 110 and 140 gCO2/km:
• Value of tax foregone = 5,300€*0,42 = 2,226€ (middle income tax bracket)
• Value of tax foregone = 5,300€*0,52 = 2,756€ tax foregone (higher income
tax bracket)
c) For cars below 110gCO2/km :
• Value of tax foregone = 6,320€*0,42 = 2,654€ (middle income tax
bracket)
• Value of tax foregone = 6,320€*0,52 = 3,286€ tax foregone (higher
income tax bracket)
For ‘standard’ cars the value of taxes foregone is between 21.48% (1869€) and
26.59% (2314€) of total net annual cost of ownership due to the level of taxation of
company cars as a fringe benefit. For ‘cleaner’ cars the revenue foregone is higher.
c) The tax foregone (including VAT on purchase and repairs (which the
company car users do not pay for)
Annual value of VAT on purchase and repairs = annual net cost of car
ownership*(VAT rate* share of purchase and repairs in total net cost
Given:
• Standard VAT = 19%
• Cost of purchase and repairs = 40% of total annual costs of owning a car
Calculations:
(8,700€*0,19*0,40) = 661€ is the annual VAT tax advantage = 8% of annual costs
of owning a car
a) For cars above 140gCO2/km:
• 1,869€ + (8,700€*0,19*0,40) = 1,869€+661€ = 2,530€ Total value of tax
foregone, including non payment of VAT for purchase and repairs (middle
income tax bracket)
• 2,314€ + (8,700€*0,19*0,40) = 2,314€+661€ = 2,975€ Total value of tax
foregone, including non payment of VAT for purchase and repairs (higher
income tax bracket)
Considering therefore, in addition to the income tax advantage, the non payment of
VAT for purchase and repairs, results in a total value of tax foregone between 2,530€
(29% of annual cost of owning a car) and 3,191€ (37% of annual cost of owning a
car).

9
b) For cars between 110 and 140 gCO2/km:
• 2,226€ + (8,700€*0,19*0,40) = 2,226€+661€ = 2,887€ Total value of tax
foregone, including non payment of VAT for purchase and repairs (middle
income tax bracket)
• 2,756€ + (8,700€*0,19*0,40) = 2,756€+661€ = 3,417€ Total value of tax
foregone, including non payment of VAT for purchase and repairs (higher
income tax bracket)
c) For cars below 110gCO2/km:
• Value of tax foregone = 2,654€ + 661€ = 3,315€ , including non payment
of VAT for purchase and repairs (middle income tax bracket)
• Value of tax foregone = 3,286€ + 661€ = 3,947€ , including non payment
of VAT for purchase and repairs (higher income tax bracket)
The total tax foregone by the government Given:
873, 091 = number of company cars in the NL in 2008
12,100 = number of very clean cars registered in 2008 (1.3% of total fleet)
If all company cars were taxed at the same rate (25%), the tax revenue foregone
would be between:
• 2,530€ * 873, 091 = 2,208,920,230 € and
• 2,975€ * 873, 091 = 2,597,445,725 €.
Assuming that 10% of the company car fleet is ‘clean’ and 5% is ‘very clean’, the
revenue foregone is between:
• (2,530€ * 0.85 + 2,887 * 0.10 + 3,315 * 0.05) * 873, 091 = 2,274,358,400
€ and
• (2,975€ * 0.85 + 3,417 * 0.10 + 3,947 * 0.05) * 873, 091 = 2,678,468,570
€.
The additional tax loss attributable to the introduction of discounts for cleaner cars is
between 65 and 81 million €.
d) Marginal social cost
The impacts on the environment of the special tax treatment of company cars is due to
the following impacts compared to the counterfactual situation (in which employees
do not receive a company car for private use and commuting but receive a higher
wage):
a) Drivers drive longer distances than they would if no company car was
provided
b) Drivers drive a larger car than they would otherwise
c) There are more cars around that there would be otherwise

10
Additional kilometres driven
• Business travel: For the purposes of this assessment, we assume that travel by
company car for business purposes is the most effective way of getting to
destination.
• Private travel: We assume that the impact on private mileage is very little as a
reduction in variable costs for higher income groups has a smaller impact:
Gutierrez-i-Puigarnau and van Ommeren (2009) find no impact on work days
travel an only a small impact (330km/year) on weekend days.
• Commuting: There is instead an impact on commuting distances. Data on this
vary. Graus W. and Worrel E. (2008) review of the data for 2005 reveal that
on average, a company car travels an additional 7,100 km/year for commuting,
almost double the distance travelled for the same purpose by private cars. The
impact in terms of CO2 of this average additional mileage is around 1,14 tCO2
per company car (average gCO2/km 160), or around 0,9 MtCO2 if we spread
the number to all company cars (873,091, CBS 2008). The effects of company
car taxation on an increase in commuting distances is estimated by Guttierez
and van Ommeren (2009) to be limited to 1,200 km per year with respect to
the counterfactual. Additional travel for private and commuting purposes are
estimated to account for a welfare loss of 200€ per year per company car (of
which 100€ for the externalities).
The effects of company car taxation on an increase in commuting distances are:
� 174,618,200€ per year in welfare losses of which 87,309,100€ in external
costs (using € 0.08/km for external costs as used in Small and Verhoef, 2007 –
used in Gutierrez-i-Puigarnau and van Ommeren (2009)).
� Using the IMPACT project values to calculate the externalities linked to the
additional commuting by car (0.367€/km peak time for urban areas;
0.133€/km peak time for interurban areas), we calculate the impact of additional
commuting in rush hours (1,200km * external cost factor) to be between 159.6€
(interurban areas) and 440.4€ (urban areas) per company car per year. In total,
the costs for the whole company car fleet are between 139,345,324 € and
384,509,276€ per year.
Table: External cost per unit Euro cent/vkm for Germany
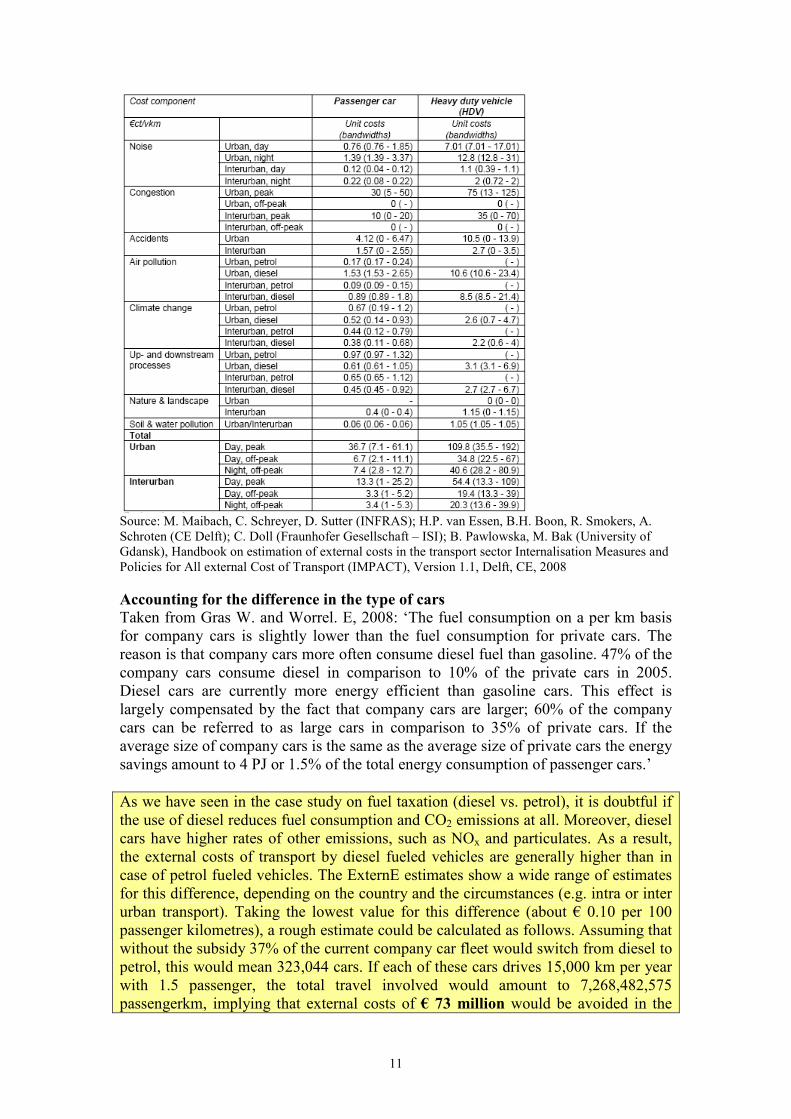
11
Source: M. Maibach, C. Schreyer, D. Sutter (INFRAS); H.P. van Essen, B.H. Boon, R. Smokers, A.
Schroten (CE Delft); C. Doll (Fraunhofer Gesellschaft – ISI); B. Pawlowska, M. Bak (University of
Gdansk), Handbook on estimation of external costs in the transport sector Internalisation Measures and
Policies for All external Cost of Transport (IMPACT), Version 1.1, Delft, CE, 2008
Accounting for the difference in the type of cars
Taken from Gras W. and Worrel. E, 2008: ‘The fuel consumption on a per km basis
for company cars is slightly lower than the fuel consumption for private cars. The
reason is that company cars more often consume diesel fuel than gasoline. 47% of the
company cars consume diesel in comparison to 10% of the private cars in 2005.
Diesel cars are currently more energy efficient than gasoline cars. This effect is
largely compensated by the fact that company cars are larger; 60% of the company
cars can be referred to as large cars in comparison to 35% of private cars. If the
average size of company cars is the same as the average size of private cars the energy
savings amount to 4 PJ or 1.5% of the total energy consumption of passenger cars.’
As we have seen in the case study on fuel taxation (diesel vs. petrol), it is doubtful if
the use of diesel reduces fuel consumption and CO2 emissions at all. Moreover, diesel
cars have higher rates of other emissions, such as NOx and particulates. As a result,
the external costs of transport by diesel fueled vehicles are generally higher than in
case of petrol fueled vehicles. The ExternE estimates show a wide range of estimates
for this difference, depending on the country and the circumstances (e.g. intra or inter
urban transport). Taking the lowest value for this difference (about € 0.10 per 100
passenger kilometres), a rough estimate could be calculated as follows. Assuming that
without the subsidy 37% of the current company car fleet would switch from diesel to
petrol, this would mean 323,044 cars. If each of these cars drives 15,000 km per year
with 1.5 passenger, the total travel involved would amount to 7,268,482,575
passengerkm, implying that external costs of € 73 million would be avoided in the

12
counterfactual case.
There are more cars around that there would be otherwise
Impact on numbers of cars in households: Gutierrez-i-Puigarnau and van Ommeren
(2009) consider the (long-run) fuel price elasticity of ownership, which is around –
0.25 (Goodwin et al., 2004; Brons et al., 2006). This suggests that the presence of a
company car may increase the number of cars through free fuel only by, on average,
25% (–100 × –0.25), if all company car owners receive free fuel for private travel.
The (long-run) car price elasticity of ownership is estimated to be between –0.1 and –
0.5 (Johansson and Schipper, 1997; Dargay and Vythoulkas, 1999; Goodwin et al.,
2004; Ubbels, 2006), whereas the more elastic estimate is more common and
plausible (Trandel, 1991). Using a logit model and a conditional maximum likelihood
estimation method, the authors that company car taxation increases the number of cars
in the households by a marginal effect of 0.48. The results of the above quoted
studies find that company car taxation strongly increases the number of cars in the
household.
The main external costs of increased car ownership are those of additional distance
driven. Presumably, these are already covered by the figures under point a) above.
There are no readily available estimates of the marginal social costs of car ownership
as such (in terms of resource use, emissions in car production, end of life disposal
etc.).

13
2 CASE STUDIES IN THE ENERGY SECTOR
2.1 VAT reduction for domestic energy in the UK
2.1.1 Value indicators
a) Revenue foregone method:
- Definition and identification: See task 2 output.
- Baseline tax rate: 17.5% (see note 1).
- Reduced tax rate: 5%.
- Value of subsidized activity: EUR 31.4 billion (excl. VAT) (see note 2).
- Revenue foregone: EUR 3.9 billion (see note 3).
b) Revenue gain method:
- Elasticity of demand: -0.30 for electricity; -0.35 for gas, oil and coal (see note
4).
- Value of unsubsidized activity: EUR 30.1 billion (excl. VAT) (see note 5).
- Revenue foregone: EUR 3.8 billion (see note 6).
c) Marginal social cost - Main elements of marginal social (=external) cost: related to emissions of
CO2, PM and SO2.
- Quantification method: for electricity: direct (EUR per kWh); for gas, oil and
coal: indirect (EUR per tonne of emissions) (see note 7).
- Calculated external cost: EUR 144 million (see note 8).
d) Total subsidy value
- With revenue foregone method: EUR 4.0 billion.
- With revenue gain method: EUR 3.9 billion.
2.1.2 Percentage indicators
Subsidy as % of total annual energy cost for households: 11.9 (see note 9).
Subsidy as % of total VAT revenues: 3.0 (see note 10)
Summary
Annual implicit subsidies by reduced VAT for domestic energy users can be estimated
at a total €3.9 billion to €4.0 billion. Of this, €3.8 billion to €3.9 billion is due to
foregone tax revenue and €144 million is due to externalities associated with external
costs due to subsidy-induced energy consumption. Removing the subsidy would on
average increase the cost of residential energy consumption in the UK by almost 12%.

14
Notes:
(1) The current standard VAT rate is reduced to 15%, but this is a temporary measure,
part of the UK’s economic stimulus package and due to end by the end of 2009.
(2) Residential electricity consumption: 116.4 TWh in 2006 (IEA, 2008a).
Average electricity price for households in 2006 (excl. VAT): GBP 0.0964
per kWh (IEA, 2009) = EUR 0.14 per kWh (using average exchange rate for
2006).
Value of subsidized electricity use: 116.4*0.14 = EUR 16.3 billion (excl.
VAT).
Residential gas consumption: 28.2 Mtoe in 2006 (IEA, 2008a).
Average gas price for households in 2006 (excl. VAT): GBP 332.93 per 107
kcal (IEA, 2009) = EUR 482.75 per toe (using average exchange rate for
2006; 1 toe = 107 kcal).
Value of subsidized gas use: 28.2*0.48275 = EUR 13.6 billion (excl. VAT).
Residential oil consumption: 3.03 Mtoe in 2006 (IEA, 2008a).
Average oil price for households in 2006 (excl. VAT): GBP 0.34915 per litre
(IEA, 2009) = EUR 430 per toe (using average exchange rate for 2006; 1 toe =
1180 litres of light fuel oil).
Value of subsidized oil use: 3.03*0.43 = EUR 1.3 billion (excl. VAT).
Residential coal consumption: 0.53 Mtoe in 2006 (IEA, 2008a).
Average coal price for households in 2006 (excl. VAT): GBP 0.1865 per kg
(IEA, 2009) = EUR 386 per toe (using average exchange rate for 2006; 1 toe =
1429 kg of coal).
Value of subsidized coal use: 0.53*0.386 = EUR 0.2 billion (excl. VAT).
Total value of subsidized residential energy use: EUR 31.4 billion (excl.
VAT).
(3) (17.5 – 5 =) 12.5% of EUR 31.4 billion.
(4) Source: Department of Trade and Industry (cited in Oosterhuis et al., 2008).
Elasticity for oil and coal assumed equal to that of gas. Long term elasticities may be
higher (in absolute terms).
(5) Unsubsidized demand for electricity is 0.3*12.5 = 3.75 % lower; value of
unsubsidized electricity use is 0.9625*16.3 = EUR 15.7 billion. Unsubsidized
demand for gas, oil and coal is 0.35*12.5 = 4.375% lower; value of unsubsidized use
of these fuels is 0.95625*(13.6+1.3+0.2) = EUR 14.4 billion.
Total value of (counterfactual) unsubsidized residential energy use: EUR 30.1 billion
(excl. VAT).
(6) (17.5 – 5 =) 12.5% of EUR 30.1 billion.
(7) The average external cost for electricity, EUR 0.026 per kWh, has been
calculated as a weighted average, using the ExternE estimates for the UK and the
share of energy sources in the UK’s electricity production in 2006. See table below.

15
Source for electricity
production
External cost in EUR per
kWh (average ExternE
figures for UK)
Share (in %) in UK
electricity production,
2006 (IEA, 2006)
Nuclear 0.0025 20.3
Coal 0.055 34.1
Oil 0.04 1.2
Gas 0.015 40.6
Combustible renewables
and waste
0.01 * 2.0
Other renewables 0.005 ** 1.8
* Refers to biomass only.
** Estimate based on ExternE figures for hydro, PV and wind in various countries.
(8) Additional demand for electricity due to the subsidy is 3.75% of total residential
electricity demand (see note 5). Total residential use was 116.4 TWh in 2006 (IEA,
2008a), of which 4.365 TWh can be attributed to the subsidy. Marginal external cost
is 0.026*4,365 = EUR 116 million. Additional demand for gas due to the subsidy is
4.375% of total residential gas demand (see note 5). Total residential use was 33
billion m3 in 2006 (IEA, 2008b); additional gas demand due to the reduced VAT was
therefore 1.44 billion m3. Using an emission factor of 1.96 kg CO2 per m
3 gas, this
means an additional amount of 2.8 million tonnes of CO2 emissions. Estimates of the
marginal external cost of CO2 emissions differ widely. According to Tol (2005) they
are unlikely to exceed USD 50 per tonne C (and probably much smaller), which is
equal to EUR 10 per tonne of CO2 (given an exchange rate of USD 1.35 per EUR; and
given that 1 tonne C equals 0.27 tonnes of CO2). The marginal external cost of
additional CO2 emissions due to reduced VAT on residential natural gas in the UK
can thus be estimated at 10*2.8 = EUR 28 million. Other external costs (other
emissions from natural gas as well as emissions from residential use of oil and coal)
are probably negligible.
(9) Calculated as the difference between the standard VAT rate (17.5%) and the
reduced rate (5%), divided by the energy costs including VAT (105%).
(10) Total VAT revenues in the UK were EUR 129 billion in 2006 (Eurostat, 2008).
Issues:
The net loss of public revenue may be somewhat lower than the calculated amounts if
one takes into account the reduced need for social assistance to households in ‘fuel
poverty’ (defined in the UK as households that need to spend more than 10% of their
household income on all domestic fuel use including appliances to heat their home to
an adequate level of warmth).

16
2.2 Fuel tax exemption for biofuels in Germany
2.2.1 Total-value indicators
a) Revenue-foregone method:
1. Definition of the subsidy
The focus of this case study is Germany’s 2004 fuel tax exemption for pure
and blended biofuels. The tax exemption is an output linked off-budget
support mechanism that grants preferential tax treatment for producers of
biofuels relative to producers of competing fuels in the economy. Tax
exemptions have been used to promote the use of biofuels in Germany since
the 1990’s but the 2004 exemption expanded the application of this tool from
pure biofuels to include blended fuels. See Task 2 for further details.
2. Identification of the tax expenditure programmes: Identify relevant subsidy
programmes (including all government levels (national and sub-national
levels), ministries and financing instruments. The following steps must be
carried out for each tax expenditure item being evaluated.
The 2004 fuel tax exemption for pure and blended biofuels represented an
amendment to the German Mineral Oil Tax Act (Mineralölsteuergesetz) which
is regulated at the Federal level.
3. Identification of the baseline tax rate -- Identify the relevant baseline tax
rate (e.g. standard VAT) on comparable activities
The following excise duties for mineral oils applied:
€470.40 per 1000 l for diesel used as propellant
€654.50 per 1000 l for petrol used as propellant
Source: European Commission, (2006)
4. Identification of the reduced tax rate – Identify the tax rate for the
subsidised activity of interest (e.g. reduced VAT)
Under the scheme, pure biofuels are fully exempt from the mineral oil duty, ie,
a full reimbursement of excise duty applies to biodiesel (€470.40 per 1000 l),
vegetable oil (€470.40 per 1000 l) and bioethanol (€654.50 per 1000 l).
For biofuels blended with fossil fuels, the percentage of blended biofuels
derived from biomass sources is fully exempt from the mineral oil duty.
Source: European Commission, (2006)
5. Identification of the value of subsidised activity – Identify the total value of
the subsidised activity

17
Total value = Total consumption x Price
Biodiesel
Total consumption = 1,200,000 litres (2004)
Of which, 70% (840,000 l) used in pure form and 30% (360,000 l) used in
blended form
Price pure biodiesel = €0.76/l (average 2004 price)
Price blended biodiesel = €0.71/l (average 2004 price)
Total value = € 638,400 + 255,600
= € 894,000
Bioethanol
Total consumption = 82,380 litres (2004)
Price = €0.55 (average 2004-2005 market price)
Total value = € 45,309
Total value of subsidised activity = € 939,309
Source: Federal Government (2005), European Commission (2004), Fachagentur
Nachwachsende Rohstoffe e.V. (FNR), (2006),
6. Calculation of the revenue foregone – Multiply the total value of the
subsidised activity times the tax differential (e.g. standard VAT minus reduced
VAT)—this is the so-called “revenue foregone”.
Revenue forgone = Total consumption x Mineral Oil Duty
Biodiesel
Revenue forgone = 1,200,000 l x 470.4 EUR per l
= €564,480,000
Bioethanol
Revenue forgone = 82,380 l x 654.5 EUR per l
= €53,917,710
Total revenue forgone = €618,397,710 (in 2004)
Source: Federal Government (2005), European Commission, (2006), European Commission
(2004),
7. Calculate total subsidy – Convert currency into standardised terms using
exchange rates and correcting for inflation, as appropriate.
Total subsidy = Total revenue forgone = €618,397,710 in 2004
b) Value of marginal social costs (i.e. un-internalised externalities)

18
There are no readily available estimates or valuation tools for the external costs of
biofuels. These costs largely depend on assumptions regarding the type of feedstocks
used, the cultivation technique employed, production and distribution processes, and
the type of engine in which biofuels are used. Depending on the processes and
feedstocks used, social and environmental externalities could range from being
significantly negative to positive - a key conundrum related to the use of biofuels.
Due to these complexities, the calculation of the marginal social cost of biofuels in
Germany was not undertaken for this case study.
2.2.2 Percentage-value indicators
Subsidy as an average % of the price per litre of fuel
Biodiesel = €0.4704/€0.76 = 62%
Bioethanol = €0.6545/€0.55 = 119%
Subsidy as a % of relevant tax collections in 2004
Total revenue from energy excise duties in Germany in 2004 was
€41,705,000,000 (Source: European Commission, 2009)
= Total revenue forgone / Total revenue from energy excise duties
= 618,397,710 / 41,705,000,000
= 1.48%

19
3 CASE STUDIES IN THE WATER SECTOR
3.1 Irrigation subsidies in Spain
3.1.1 Total-value indicators (annual; in constant currency units in cases of time and country comparisons): Value of specified subsidy
a) Key attributes of the subsidy: see task 2
b) Value/price of water:
o Current water pricing to farmers (as in 2003) in the Community of Irrigators of the Pisuerga Channel (Duero Valley) €60.59 /ha, equivalent to
a volumetric tariff of 0.010 /m3 (from Gómez-Limón and Riesgo, 2004).
o National level: the average payment for irrigation water services (surface
and underground water) in Spain as estimated by the Spanish Ministry of the
Environment (2007b) is about 0.05 €/m3
o ‘Medium’ price of 0.04 €/m3 that would cover the financial costs of water
supply. (theoreticalfrom Gómez-Limón and Riesgo, 2004).
o ‘Full Cost Recovery (FCR)’ price of 0.06 €/m3 which would be a tough
application of full-cost-recovery principle, including a provision for
environmental costs. (from Gómez-Limón and Riesgo, 2004).
Identification of the total revenue from sales of the resource
Total revenue = water price to farmers (€/m
3) * yearly water consumption (m
3) for irrigation
Local level: the Pisuerga Channel area
Water consumption: about 70 Mm3/year (based on data from Gómez-Limón and Riesgo,
2004).
0.01 €/m3* 70 Mm3/year = 0.7 M€/year
National level: order of magnitude in Spain
Water consumption: about 16,500 Mm3/year (Ministry of Environment, 2007)
0.05€/m3 * 16,500 Mm3/year = 8,250 M€/year
Determining the subsidy value by subtracting total revenue from total MVP
If no elasticity is considered – i.e. assuming the water consumed remains on average
the same, disregarding the change in water pricing, the subsidy can be calculated as
follow:
Subsidy = (water value – water price to farmers) * yearly water consumption (m
3) for
irrigation
Local level: the Pisuerga Channel area

20
Assuming medium price: (0.04 €/m
3 – 0.01 €/m
3) * 70 Mm
3/year = 2.1 M€
Assuming FCR: (0.06 €/m3 – 0.01 €/m
3) * 70 Mm
3/year = 3.5 M€
National level: order of magnitude in Spain
Assuming FCR: (0.06€/m
3-0.05€/m
3) * 16,500 Mm
3/year = 165 M€/year
Sources
Gómez-Limón, J.A. and Riesgo, L. 2004. Irrigation water pricing: differential
impacts on irrigated farms. Agricultural Economics 31 (2004) 47–66
Ministerio de Medio Ambiente (Ministry of Environment). 2007. Perfil Ambiental de
España 2007. Informe basado en indicadores.
And own calculations (explained in the text)
Methodological note: Please note that, at local level, calculations are based on data for a
small portion of the Spanish territory (the Community of irrigators in the Pisuerga Channel)
as estimated by Gómez-Limón and Riesgo (2004).
At national level, it should be noted that the average price of irrigation water in Spain is
above the water price in the Pisuerga Channel and also above the financial cost recovery
estimated by Gómez-Limón and Riesgo (2004). No estimate was found on the actual financial
cost of water for the whole Spain, nor for the full cost recovery price. Hence the FCR price
used for the Pisuerga Channel has been used as a lower bound to estimate the level of subsidy
in the whole country. This is meant to provide an order of magnitude rather than an exact size
of the subsidy, and should be taken as a minimum value.
Value of marginal social costs
This can be calculated using the FCR price (as above)
Local, Assuming FCR: (0.06 €/m
3 – 0.01 €/m
3) * 70 Mm
3/year = 3.5 M€
National, Assuming FCR: (0.06€/m
3-0.05€/m
3) * 16,500 Mm
3/year = 165 M€/year
Total subsidy value (explicit and implicit subsidies) (as above)
Local, Assuming medium price: (0.04 €/m
3 – 0.01 €/m
3) * 70 Mm
3/year = 2.1 M€
Local, Assuming FCR: (0.06 €/m3 – 0.01 €/m
3) * 70 Mm
3/year = 3.5 M€
National, Assuming FCR: (0.06€/m
3-0.05€/m
3) * 16,500 Mm
3/year = 165 M€/year
National, Assuming FCR, per ha: 165 M€/year: 3Mha = 55 €/ha
Where: irrigated hectares in Spain = 3Mha (Min Env, 2007)

21
For a more accurate calculations using elasticity see below.
Range estimates of the above where uncertainty exists (e.g. elasticity
assumptions)
Gómez-Limón and Riesgo, 2004 also assed the likely changes in water abstraction in
the Community of irrigators in the Pisuerga Channel if the water price were to raise to
0.04 (medium price) and 0.06 €/m3 (FCR price) respectively.
Given the difficulty to translate these results at national level we will calculate the
effects of elasticity only in the Pisuerga Channel area:
Water
price
(€/m3)
% change in
water
consumption
(weighted average
– see below)
Consumption
(2003) (Mm3)
public
revenue
(M€) (water
price *
consumption)
Subsidy (M€)
(new public
revenues -
revenues at
current price)
Current price 0.01 - 70 0.7
Medium price 0.04 50.90% 34 1.4 0.7
FCR price 0.06 62.30% 26 1.6 0.9
Where subsidy is equal to:
Current price* current consumption – (new water price * new level of water
consumption)
i.e. Revenues from new water price – revenues from current water price
Using the ‘medium’ price as a reference value for the unsubsidised price of water, the
amount of the subsidy is about 0.7 M€/year in the Pisuerga Channel area
If externalities are taken into account (‘FCR’ price) the subsidy is about 0.9 €/m3
The percentage change in water consumption was calculated as a weighted average of the changes for 3
cluster groups of farmers (see case study task 2 for details on the 3 clusters). Different weights are
based on the percentage of land farmed by each cluster in the Community of irrigators in the Pisuerga
Channel. The weighted average was calculated as follow:
% change in consumption Cluster Weight (%)
based on % area covered At 0.04 €/m3 At 0.06 €/m
3
cluster 1 34.5 23.4 43.2
cluster 2 51.9 70 74
cluster 3 13.7 47.8 66.2
Weighted average 50.9 62.3
Weighted average at pricei = ∑ change in consumptioncluster x * weightcluster x/ ∑ weightcluster x
3.1.2 Percentage-value indicators

22
1. (Estimated) total subsidy for Spain as a percentage of current costs for irrigation
water distribution: 12.8%
Where:
• Subsidy calculated as above point 4 for ‘FCR’ at national level: 16,500
Mm3/year = 165 M€/year
• Current costs for irrigation water distribution = 1,285 M€/year (Min Env,
2007)
2. (Estimated) total subsidy for Spain as a percentage of 2001 net margin from
irrigated agriculture (excl subsidies) (M€1881/ha, according to Min Env, 2007):
2.9%
Where:
• Subsidy calculated as above point 4 for ‘FCR’ at national level: 16,500
Mm3/year = 165 M€/year
• Net margin from irrigated agriculture (excluding subsidies) = 1,881 M€/ha
(Min Env, 2007)

23
Subsidy case Issues Value Indicators Percentage Indicators Narrative text
1. Fuel-tax differentiation
(petrol versus diesel
excise taxes; UK-low,
Austria-med,
Netherlands-high)
Type of subsidy:
Off-budget, tax
exemptions and rebates
Methodology:
Programme aggregation
(revenue foregone and
revenue gain methods)
An equivalent tax base is difficult
to define (diesel and petrol have
differing external effects and
different energy content per litre;
since UK is defined as “no
subsidy” because tax levels are
the same per litre, this definition
will be used.
The net loss of public revenue
may be somewhat lower than the
calculated amounts if one takes
into account the reduced need for
social assistance to households in
‘fuel poverty’ (defined in the UK
as households that need to spend
more than 10% of their household
income on all domestic fuel use
including appliances to heat their
home to an adequate level of
warmth).
Annual value of foregone taxes
Austria = € 688,235,294
Netherlands = € 2,111,287,820
UK= € 0
Revenue gain method:
Austria = € 645.854.489 and €
670.576.625 (longer term)
The Netherlands = €
1.767.529.561 (short-term)
and € 1.968.055.212 (longer-
term)
Marginal social costs:
- Climate-change costs via
MSC method (short term): an
additional € 3.3 million to €
21.4 million for Austria; an
additional € 9.3 million to 60
million for the Netherlands
- Climate-change costs via
MSC method (longer term):
an additional €8.0 million to
51.2 million for Austria; an
additional € 22.3 million to
144 million for the
Netherlands
Subsidy as average % of total
annual fuel cost
Austria = 9.8 - 11%
Netherlands = 23 – 29%
Total subsidy as % of total fuel-
tax collections
Austria = 25.3 – 27%
Netherlands = 56.5 – 67%
Assessing the level of subsidization—diesel
excise tax subsidies in Austria
The total value of annual tax-expenditure subsidies
to drivers of diesel vehicles in Austria is estimated
to be between 691 and 739 € million, including the
costs of climate change. Of this, € 688 million is
due to foregone tax revenue and € 3 to 51 million
is due to climate-change costs associated with
subsidy-induced driving behaviour. Removing the
diesel excise-tax subsidy would on average
increase the cost of driving a diesel vehicle in
Austria by 10% and increase fuel-tax revenue by
27%.
Assessing the level of subsidization—diesel
excise tax subsidies in the Netherlands
The total value of annual tax-expenditure subsidies
to drivers of diesel vehicles in Austria is estimated
to be between € 2.1 and 2.25 billion, including the
costs of climate change. Of this, € 2.1 billion is
due to foregone tax revenue and € 9 to 143 million
is due to climate-change costs associated with
subsidy-induced driving behaviour. Removing the
diesel excise-tax subsidy would on average
increase the cost of driving a diesel vehicle in the
Netherlands by 27% and increase fuel-tax revenue
by 67 %.
Assessing the level of subsidization—diesel
excise tax subsidies in the UK
The United Kingdom taxes petrol and diesel at the
same rate per litre (66 €cents), which means that
relative to petrol, diesel is not subsidised.
1 TABLE 1: SUMMARY OF RESULTS OF THE APPLICATION OF LEVEL
INDICATORS TO THECASE STUDIES
24
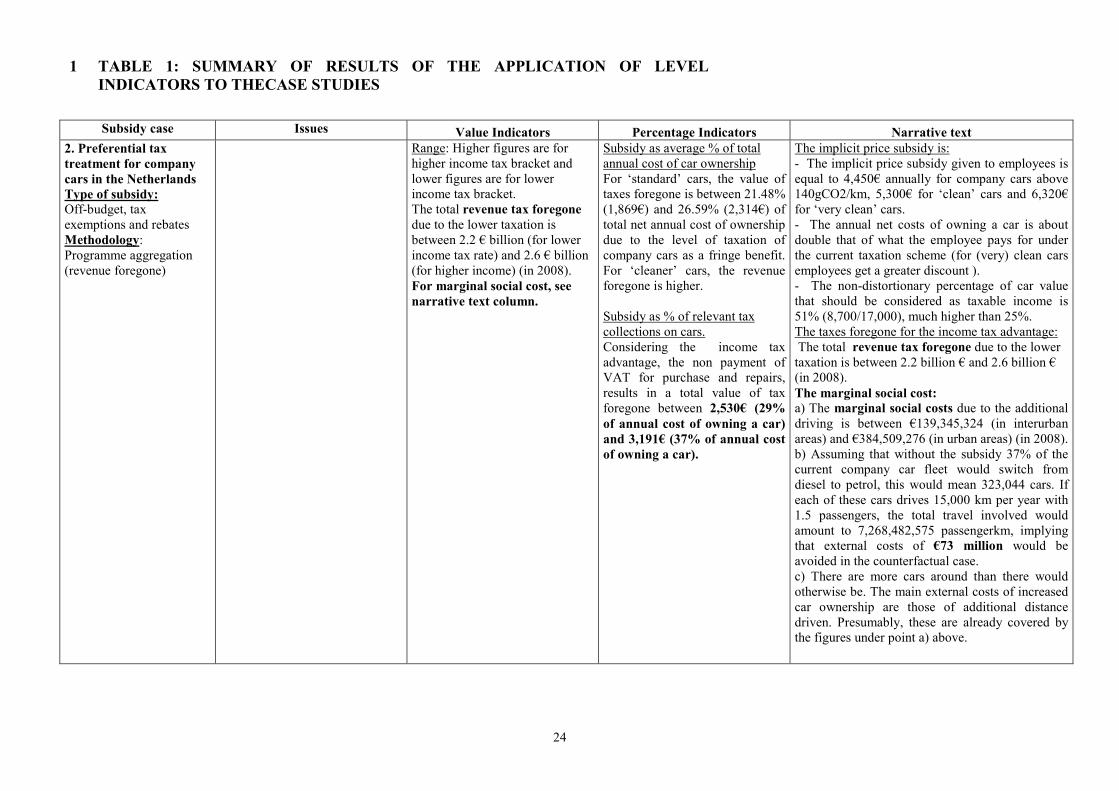
Subsidy case Issues Value Indicators Percentage Indicators Narrative text
2. Preferential tax
treatment for company
cars in the Netherlands
Type of subsidy:
Off-budget, tax
exemptions and rebates
Methodology:
Programme aggregation
(revenue foregone)
Range: Higher figures are for
higher income tax bracket and
lower figures are for lower
income tax bracket.
The total revenue tax foregone
due to the lower taxation is
between 2.2 € billion (for lower
income tax rate) and 2.6 € billion
(for higher income) (in 2008).
For marginal social cost, see
narrative text column.
Subsidy as average % of total
annual cost of car ownership
For ‘standard’ cars, the value of
taxes foregone is between 21.48%
(1,869€) and 26.59% (2,314€) of
total net annual cost of ownership
due to the level of taxation of
company cars as a fringe benefit.
For ‘cleaner’ cars, the revenue
foregone is higher.
Subsidy as % of relevant tax
collections on cars.
Considering the income tax
advantage, the non payment of
VAT for purchase and repairs,
results in a total value of tax
foregone between 2,530€ (29%
of annual cost of owning a car)
and 3,191€ (37% of annual cost
of owning a car).
The implicit price subsidy is:
- The implicit price subsidy given to employees is
equal to 4,450€ annually for company cars above
140gCO2/km, 5,300€ for ‘clean’ cars and 6,320€
for ‘very clean’ cars.
- The annual net costs of owning a car is about
double that of what the employee pays for under
the current taxation scheme (for (very) clean cars
employees get a greater discount ).
- The non-distortionary percentage of car value
that should be considered as taxable income is
51% (8,700/17,000), much higher than 25%.
The taxes foregone for the income tax advantage:
The total revenue tax foregone due to the lower
taxation is between 2.2 billion € and 2.6 billion €
(in 2008).
The marginal social cost:
a) The marginal social costs due to the additional
driving is between €139,345,324 (in interurban
areas) and €384,509,276 (in urban areas) (in 2008).
b) Assuming that without the subsidy 37% of the
current company car fleet would switch from
diesel to petrol, this would mean 323,044 cars. If
each of these cars drives 15,000 km per year with
1.5 passengers, the total travel involved would
amount to 7,268,482,575 passengerkm, implying
that external costs of €73 million would be
avoided in the counterfactual case.
c) There are more cars around than there would
otherwise be. The main external costs of increased
car ownership are those of additional distance
driven. Presumably, these are already covered by
the figures under point a) above.
1 TABLE 1: SUMMARY OF RESULTS OF THE APPLICATION OF LEVEL
INDICATORS TO THECASE STUDIES

25
Subsidy case Issues Value Indicators Percentage Indicators Narrative text
3. Nuclear energy (Germany; tax-deductions for decommissioning funds) As stated in the selection criteria fiche in Annex 1, it was not deemed feasible to carry out a comprehensive
assessment of nuclear subsidies in Germany in the project duration.
4. Reduced VAT for
domestic energy use (UK)
Type of subsidy:
Off-budget, tax
exemptions and rebates
Methodology:
Programme aggregation
(revenue foregone and
revenue gain methods)
The net loss of public revenue
may be somewhat lower than the
calculated amounts if one takes
into account the reduced need for
social assistance to households in
‘fuel poverty’ (defined in the UK
as households that need to spend
more than 10% of their
household income on all
domestic fuel use including
appliances to heat their home to
an adequate level of warmth)
Annual value of foregone taxes:
Revenue foregone method
= € 3.9 billion
Revenue gain method
= € 3.8 billion
Marginal social cost:
= € 144 million
Total sum:
With revenue foregone method: €
4.0 billion
With revenue gain method:
= € 3.9 billion
Subsidy as average % of total
annual energy cost
= 11.9 %
Total subsidy as % of total VAT
collections on energy
= 3 %
Annual implicit subsidies by reduced VAT for
domestic energy users can be estimated at a total
EUR 3.9 to 4.0 billion. Of this, EUR 3.8 to 3.9
billion is due to foregone tax revenue and EUR
144 million is due to externalities associated with
external costs due to subsidy-induced energy
consumption. Removing the subsidy would on
average increase the cost of residential energy
consumption in the UK by almost 12%.
5. Biofuels (Germany)
Type of subsidy:
Off-budget, tax
exemptions and rebates
Methodology:
Programme aggregation
(revenue foregone and
revenue gain methods)
There are no readily available
estimates or valuation tools for
the external costs of biofuels.
These costs largely depend on
assumptions regarding the type
of feedstocks used, the
cultivation technique employed,
production and distribution
processes, and the type of engine
in which biofuels are used. – See
range estimate in next column.
Annual value of foregone taxes in
2004:
Biodiesel = € 559,776,000
Bioethanol = € 53,917,710
Sum = € 613,693,710
Subsidy as an average % of the
price per litre of fuel
Biodiesel = €0.4704/€0.76 = 62%
Bioethanol=€0.6545/€0.55=119%
Subsidy as % of total fuel tax
collections in 2004
= 1.47 %
Annual subsidies to biofuels in 2004 were € 0.61
billion due to foregone tax revenue. Removing the
subsidy would on average increase the price of
biodiesel in Germany by 62% and the price of
bioethanol in Germany by 119%, and increase tax
revenue by 1.47%.
1 TABLE 1: SUMMARY OF RESULTS OF THE APPLICATION OF LEVEL
INDICATORS TO THECASE STUDIES

26
Subsidy case Issues Value Indicators Percentage Indicators Narrative text
6. Subsidies to irrigation
(Spain)
Type of subsidy:
Off-budget, price paid for
water below full economic
rent
Methodology:
Resource rent
Wide differences in prices across
region exist, depending on local
conditions. Data exist for some
specific areas, but broad
assumptions need to be made to
assess the level of subsidies at
national level. It is also difficult
to assess what the cost of
externalities is (here it was based
on assumptions found in the
literature)
In the Pisuerga Channel – using
the medium price(0.04€/m3) and
the FCR price(0.06 €/m3) as
proxies of the ‘true’price of water
Medium price: M€ 2.1 /year
FCR price= M€ 3.5 /year
In the whole Spain - using the
FCR price (0.06€/m3) as a proxy
of the ‘true’ price of water,
total size of subsidy = M€ 165
/year
(estimated) total subsidy for
Spain over irrigated hectares
(3Mha, according to Min Env,
2007): 55 €/ha
(estimated) total subsidy for
Spain as a percentage of current
costs for irrigation water
distribution (M€1,285, according
to Min Env, 2007): 12.8%
(estimated) total subsidy for
Spain as a percentage of 2001 net
margin from irrigated agriculture
(excl subsidies) (M€1881/ha,
according to Min Env, 2007):
2.9%
The size of water subsidy for irrigation in the
Pisuerga Channel ranges between 2.1 M€/year (if
we use, as a benchmark, a ‘real’ price of water of
0.04€/m3 based on financial cost recovery) and
M€3.5/year (considering Full Cost Recovery
(FCR) price of 0.06€/ha).
Considering an average water price of 0.05€/ha for
the whole Spain, and comparing it to the FCR
price of 0.06€/ha, the overall size of subsidies in
Spain can be estimated to be about 165 M€/year.
1 TABLE 1: SUMMARY OF RESULTS OF THE APPLICATION OF LEVEL
INDICATORS TO THECASE STUDIES
Related Documents


