Ann Arbor ASA ‘Up and Running’ Series: The SAS System Sponsored by The Department of Statistics and the Ann Arbor Chapter of American Statistical Association,

Ann Arbor ASA ‘Up and Running’ Series: The SAS System
Jan 02, 2016
Ann Arbor ASA ‘Up and Running’ Series: The SAS System. Sponsored by The Department of Statistics and the Ann Arbor Chapter of American Statistical Association,. Contents. Starting SAS User Interface Libraries Syntax Getting Data into SAS Examining Data Manipulating Data - PowerPoint PPT Presentation
Welcome message from author
This document is posted to help you gain knowledge. Please leave a comment to let me know what you think about it! Share it to your friends and learn new things together.
Transcript
Ann Arbor ASA‘Up and Running’ Series:
The SAS System
Sponsored by The Department of Statistics and the
Ann Arbor Chapter of American Statistical Association,
Contents• Starting SAS• User Interface• Libraries• Syntax• Getting Data into SAS• Examining Data• Manipulating Data• Descriptive Statistics• Graphing Data• Statistics in SAS

Starting SAS
Start=>All Programs=>
Math & Statistics=>SAS
=>SAS 9.2 (32) English

User Interface
Program Editor:
Write and submit commands
Log
Comments, warnings, etc.
Explorer/Results Output (not seen)
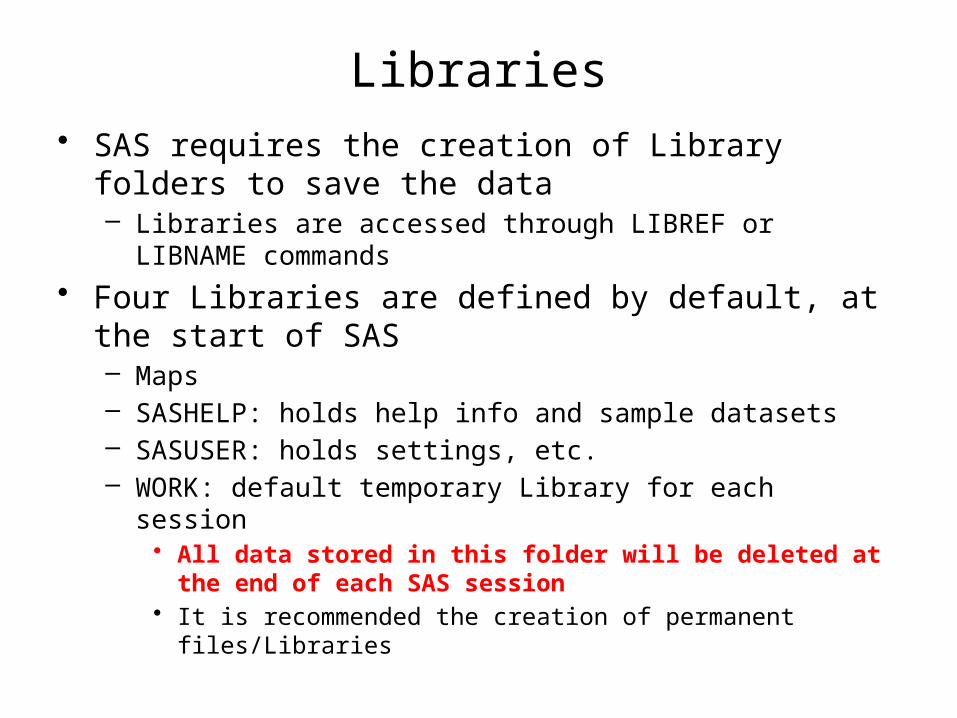
Libraries• SAS requires the creation of Library folders to save the
data– Libraries are accessed through LIBREF or LIBNAME commands
• Four Libraries are defined by default, at the start of SAS– Maps– SASHELP: holds help info and sample datasets– SASUSER: holds settings, etc.– WORK: default temporary Library for each session
• All data stored in this folder will be deleted at the end of each SAS session
• It is recommended the creation of permanent files/Libraries
Libraries
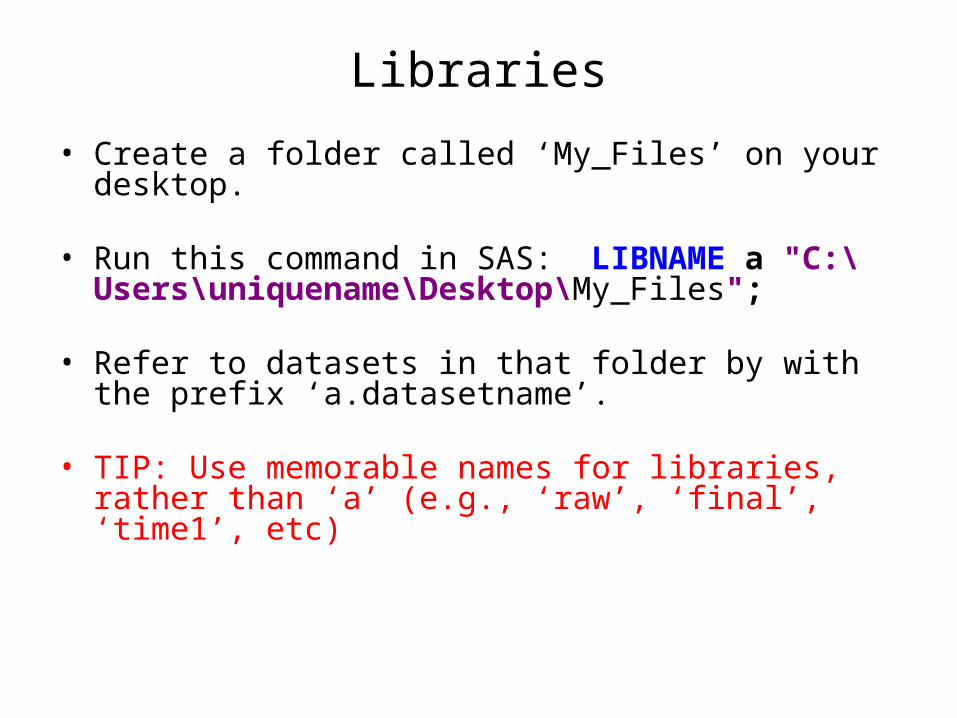
• Create a folder called ‘My_Files’ on your desktop.
• Run this command in SAS: LIBNAME a "C:\Users\uniquename\Desktop\My_Files";
• Refer to datasets in that folder by with the prefix ‘a.datasetname’.
• TIP: Use memorable names for libraries, rather than ‘a’ (e.g., ‘raw’, ‘final’, ‘time1’, etc)
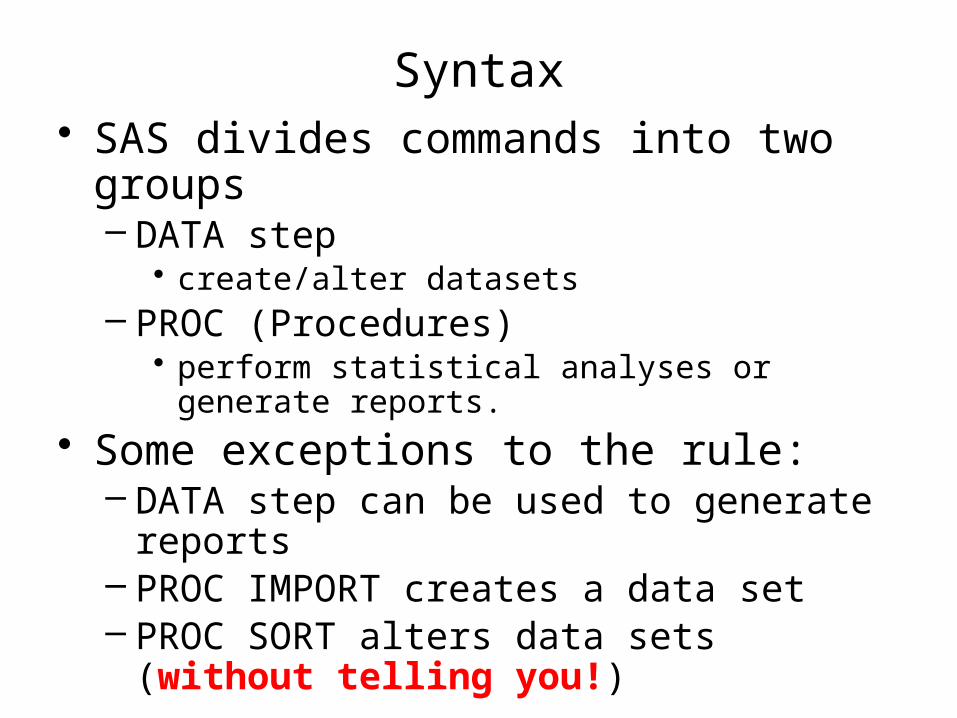
Syntax• SAS divides commands into two groups
– DATA step• create/alter datasets
– PROC (Procedures)• perform statistical analyses or generate reports.
• Some exceptions to the rule:– DATA step can be used to generate reports– PROC IMPORT creates a data set– PROC SORT alters data sets (without telling
you!)
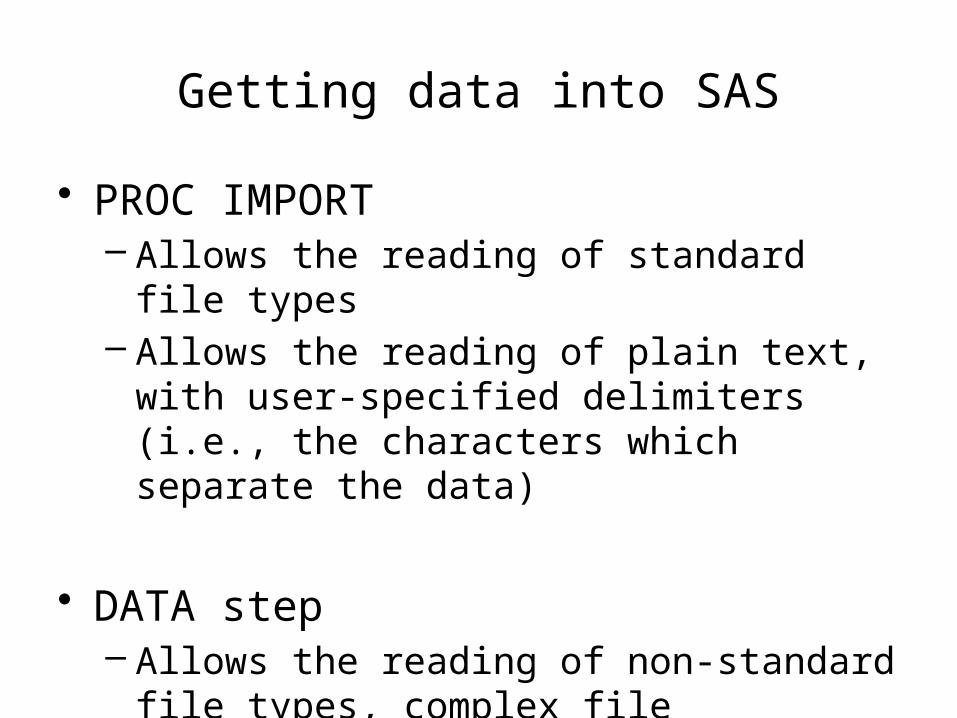
• PROC IMPORT– Allows the reading of standard file types– Allows the reading of plain text, with user-
specified delimiters (i.e., the characters which separate the data)
• DATA step– Allows the reading of non-standard file types,
complex file structures, and unusual delimiters.
Getting data into SAS

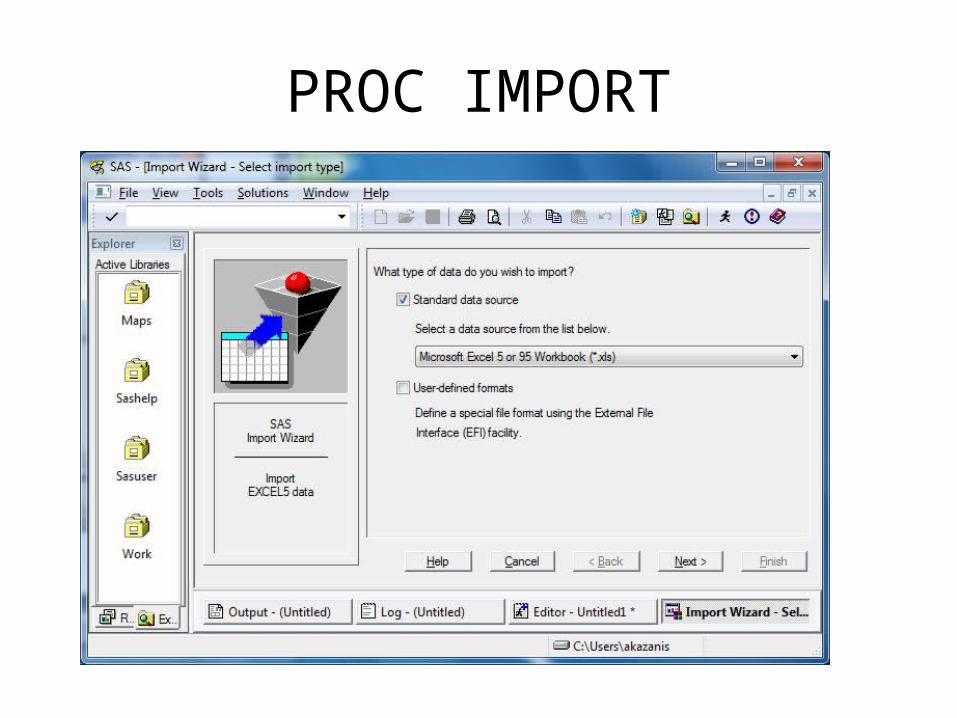
PROC IMPORT
• Place pointer in Editor window– In Menu Bar: File Import data– Follow the wizard– When asked if you want SAS to save the syntax to a file,
click “Browse...” and give a filename
• SAS will generate and run the syntax
• Examine Log for errors
PROC IMPORT

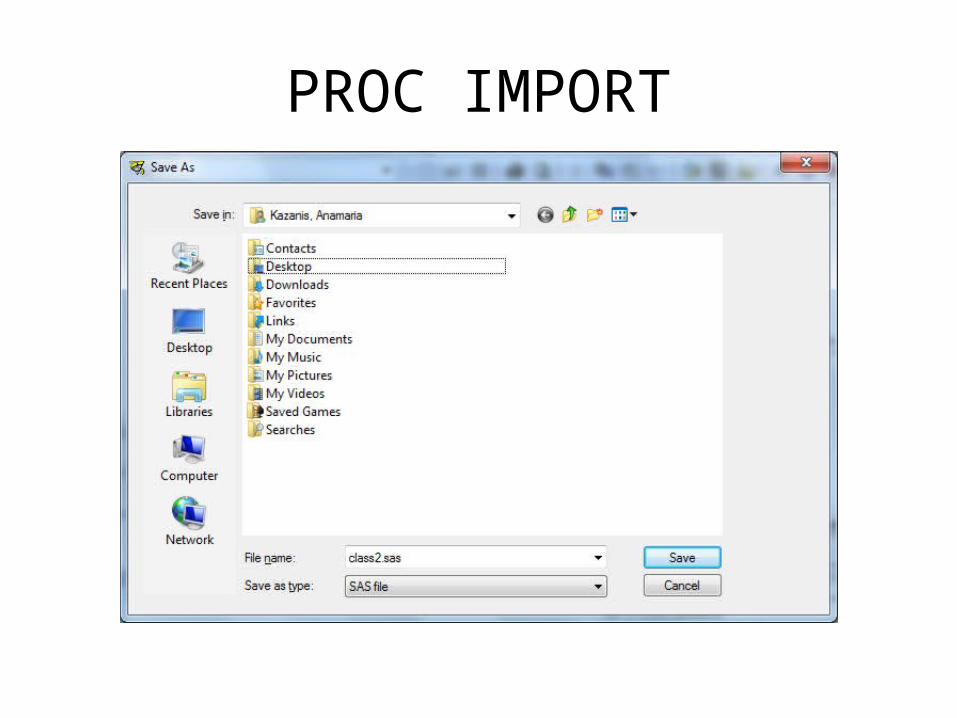
PROC IMPORT• When asked if you want SAS to save the syntax to a file,
click “Browse...” and give a filename
PROC IMPORT
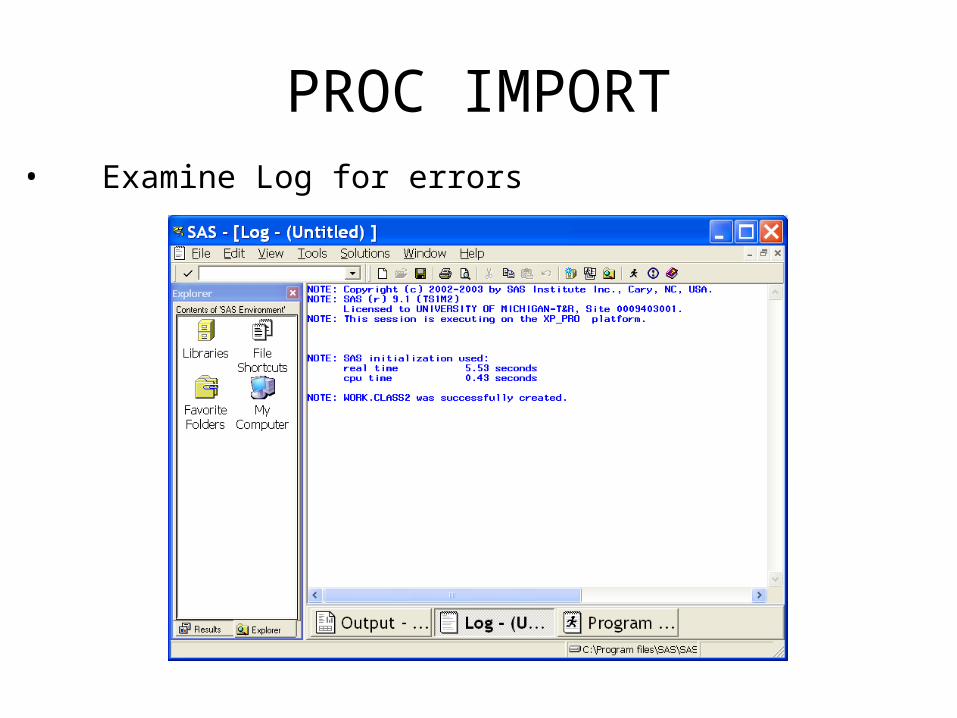
PROC IMPORT• Examine Log for errors

PROC IMPORT
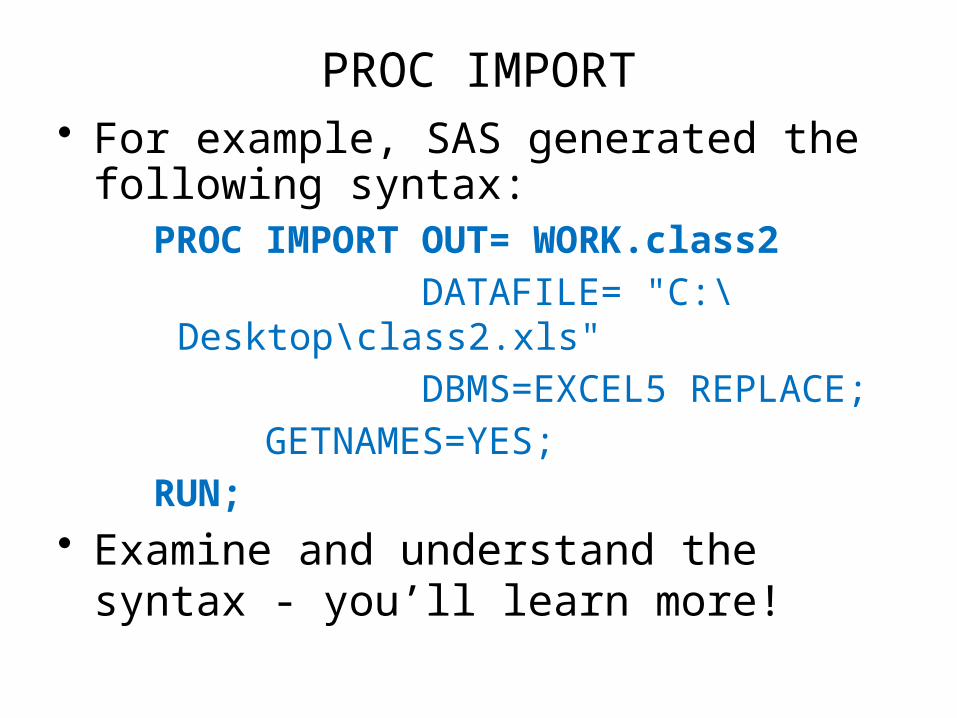
PROC IMPORT• For example, SAS generated the following
syntax:PROC IMPORT OUT= WORK.class2
DATAFILE= "C:\Desktop\class2.xls"
DBMS=EXCEL5 REPLACE;
GETNAMES=YES;
RUN;• Examine and understand the syntax -
you’ll learn more!
DATA step
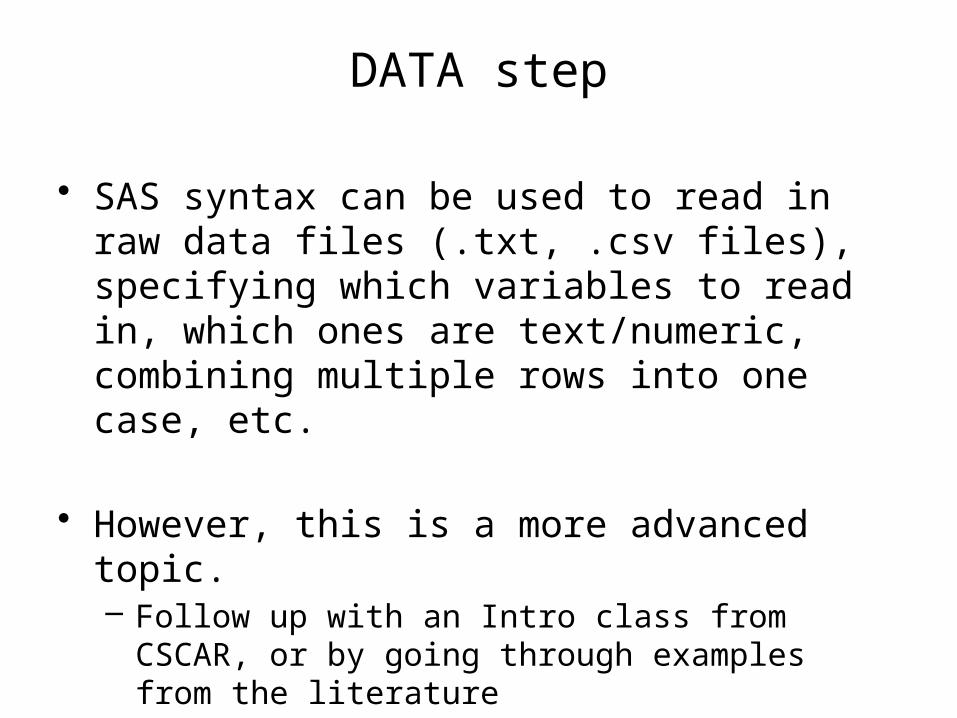
• SAS syntax can be used to read in raw data files (.txt, .csv files), specifying which variables to read in, which ones are text/numeric, combining multiple rows into one case, etc.
• However, this is a more advanced topic.– Follow up with an Intro class from CSCAR, or by
going through examples from the literature
(e.g., ‘The Little SAS Book’).

Examining Data
• VIEWTABLE Window– Select dataset icon in Explorer
• PROC CONTENTS– Produces a listing of data set information, including
the variables and their properties
• PROC PRINT– Prints a subset of variables or cases to the output
window
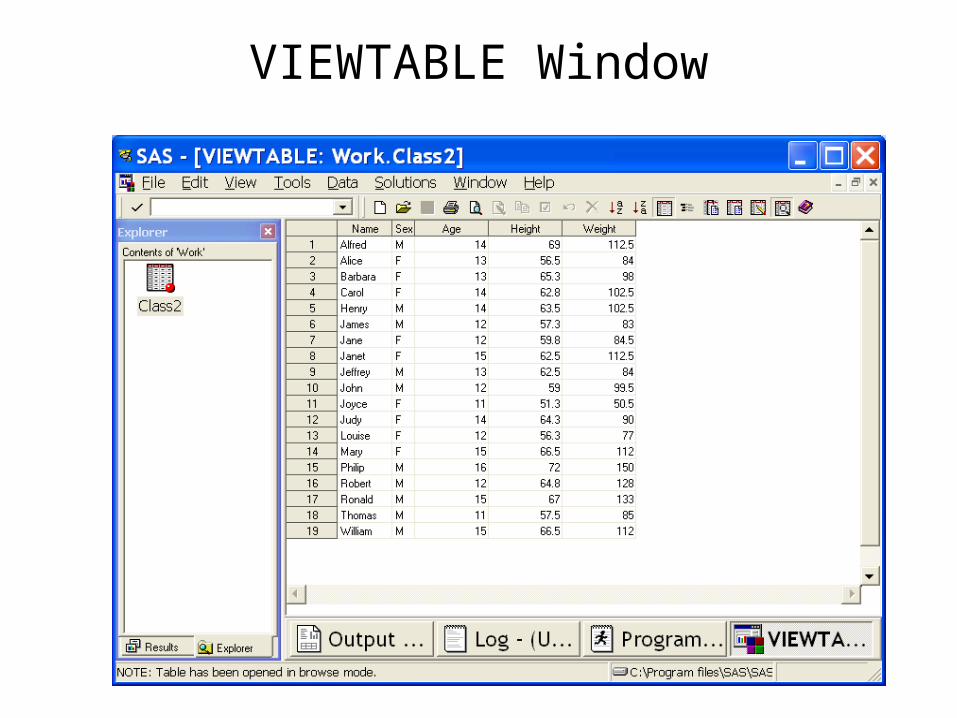
VIEWTABLE Window
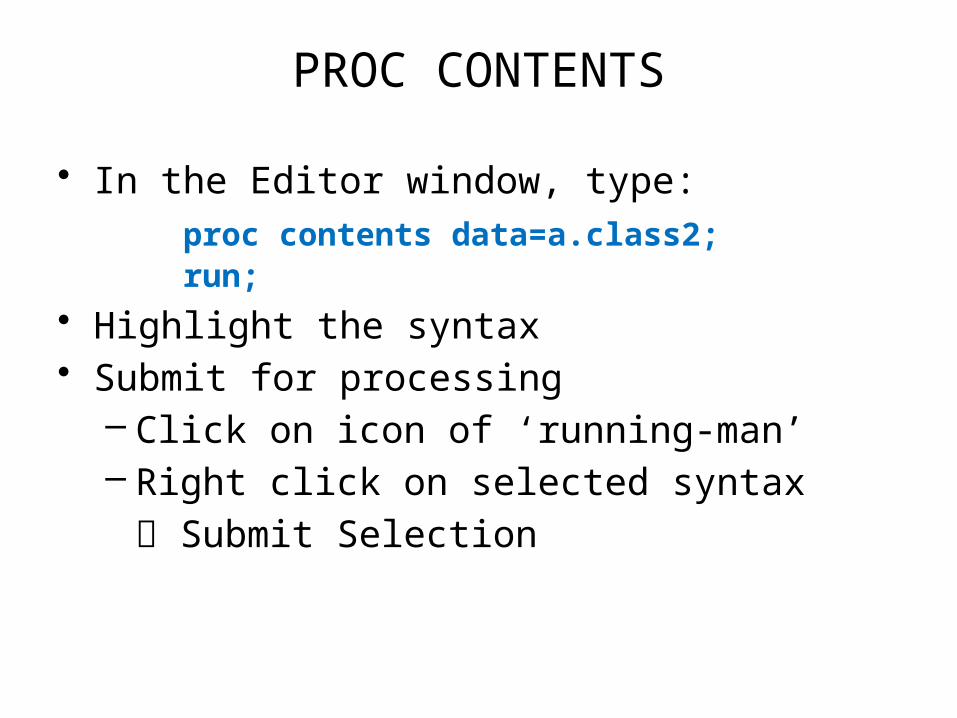
PROC CONTENTS
• In the Editor window, type:
proc contents data=a.class2;run;
• Highlight the syntax• Submit for processing
– Click on icon of ‘running-man’– Right click on selected syntax
Submit Selection

PROC CONTENTS
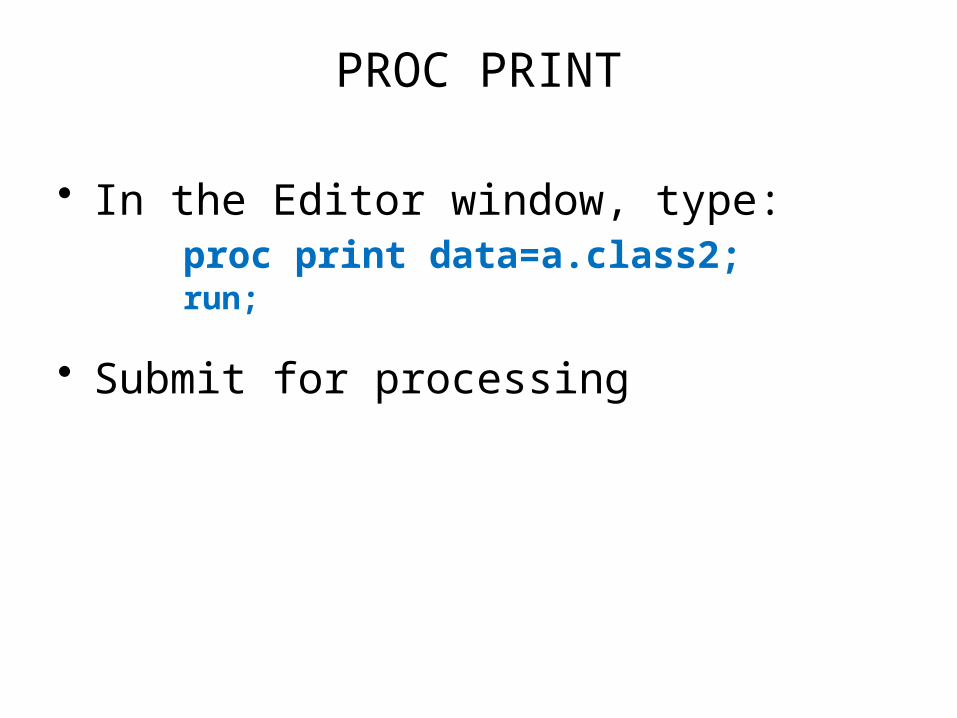
PROC PRINT
• In the Editor window, type:proc print data=a.class2;run;
• Submit for processing

PROC PRINT

Manipulating Data
• Usually done within a data step– Match data sets using a shared key variable– Create new variables, or drop/rename existing
variables– Take one or more subsets of the data– Sort the data by specific variable(s).
• Overwrite existing or create new datasets– PROC SORT– Adding/Removing variables– Merging Datasets
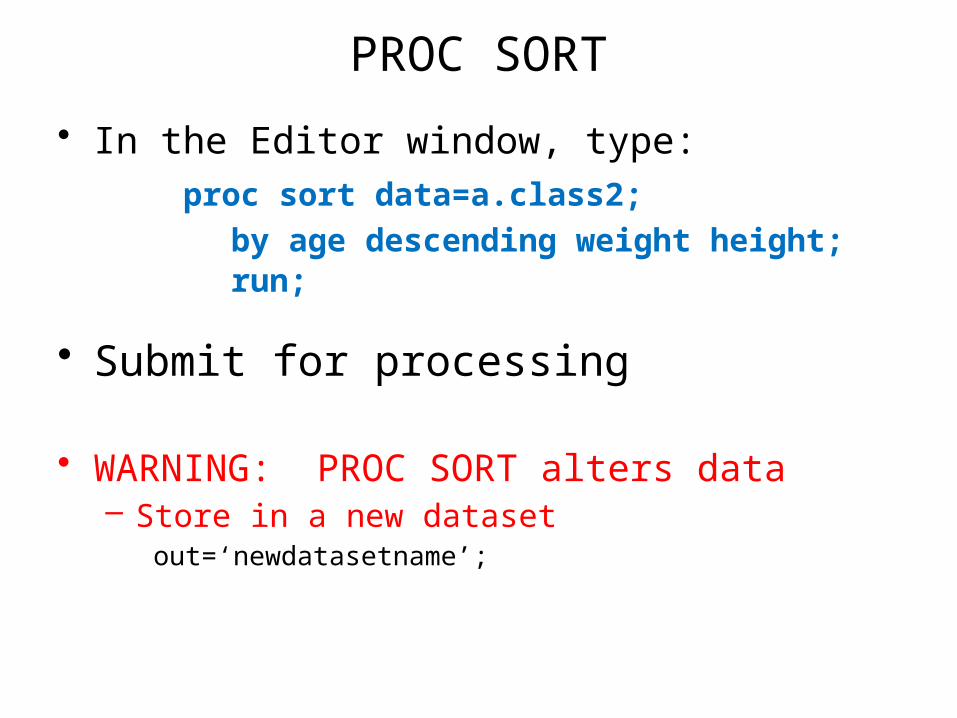
PROC SORT
• In the Editor window, type:
proc sort data=a.class2;
by age descending weight height;run;
• Submit for processing
• WARNING: PROC SORT alters data– Store in a new dataset
out=‘newdatasetname’;
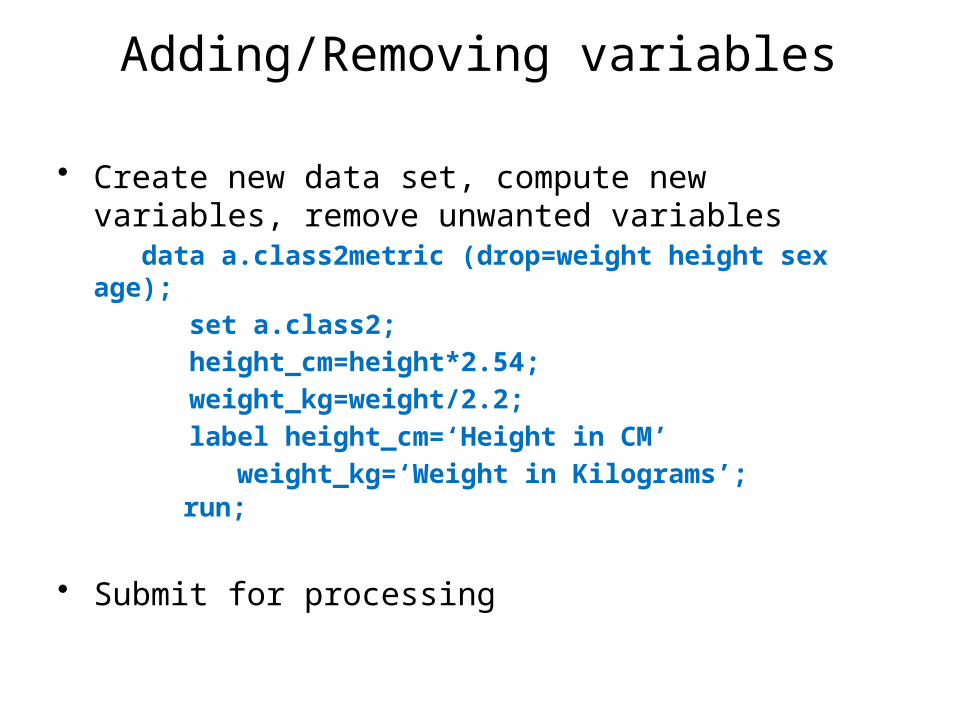
Adding/Removing variables
• Create new data set, compute new variables, remove unwanted variables
data a.class2metric (drop=weight height sex age);
set a.class2;
height_cm=height*2.54;
weight_kg=weight/2.2;
label height_cm=‘Height in CM’
weight_kg=‘Weight in Kilograms’;run;
• Submit for processing

Merging Datasets
• Data sets must be sorted by the same key variable(s)
proc sort data=a.class2;
by name;
proc sort data=a.class2metric;
by name;
data a.classmerged;
merge a.class2 a.class2metric;
by name;run;
• Submit for processing
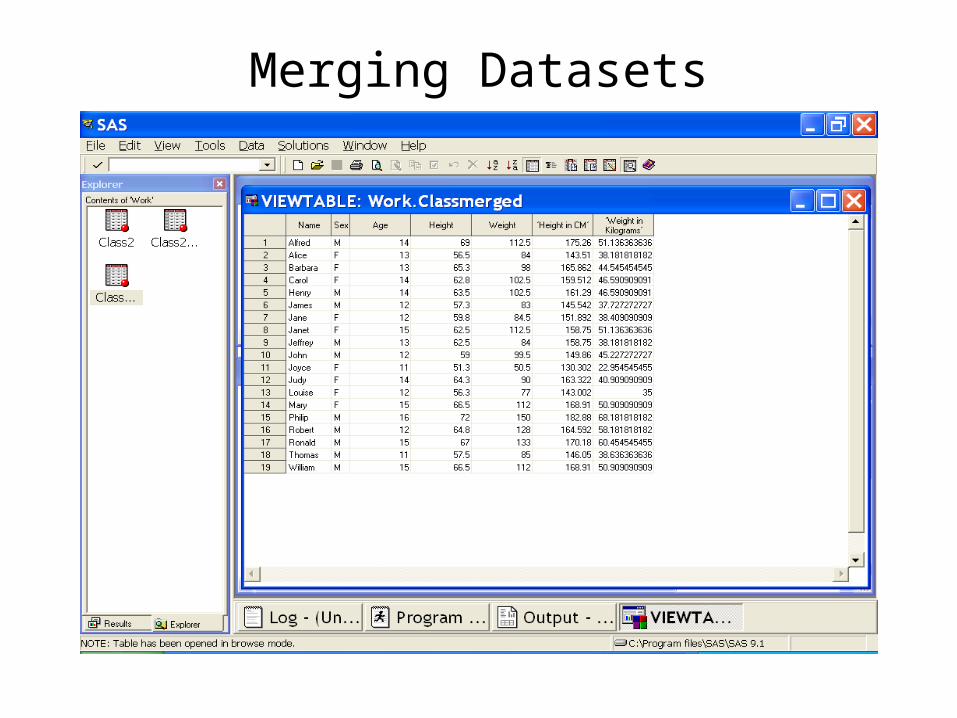
Merging Datasets
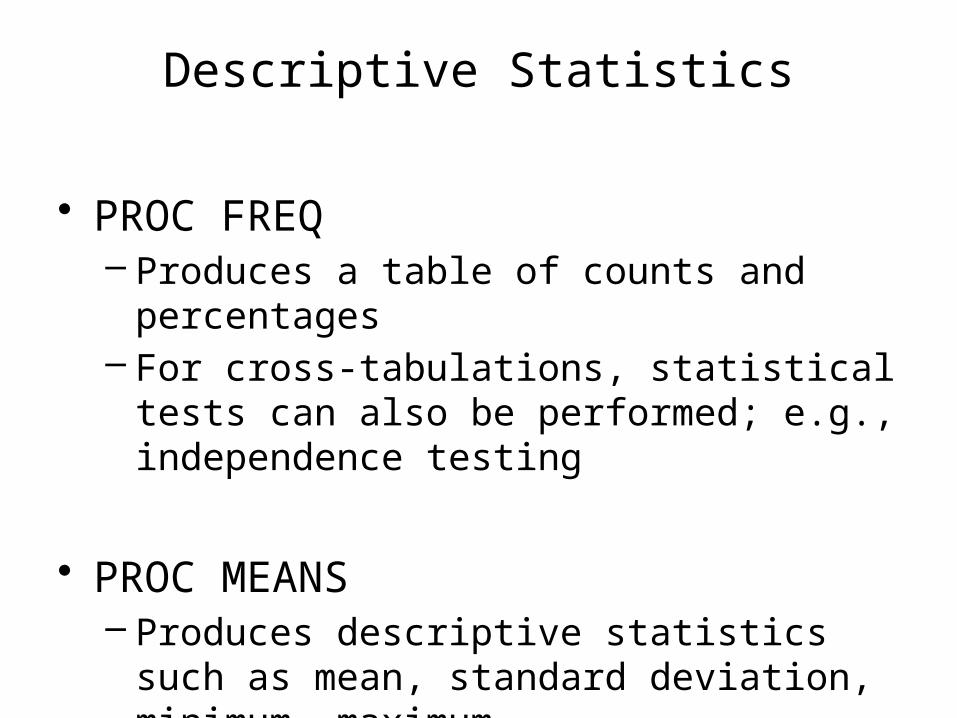
Descriptive Statistics
• PROC FREQ– Produces a table of counts and percentages– For cross-tabulations, statistical tests can also
be performed; e.g., independence testing
• PROC MEANS– Produces descriptive statistics such as mean,
standard deviation, minimum, maximum
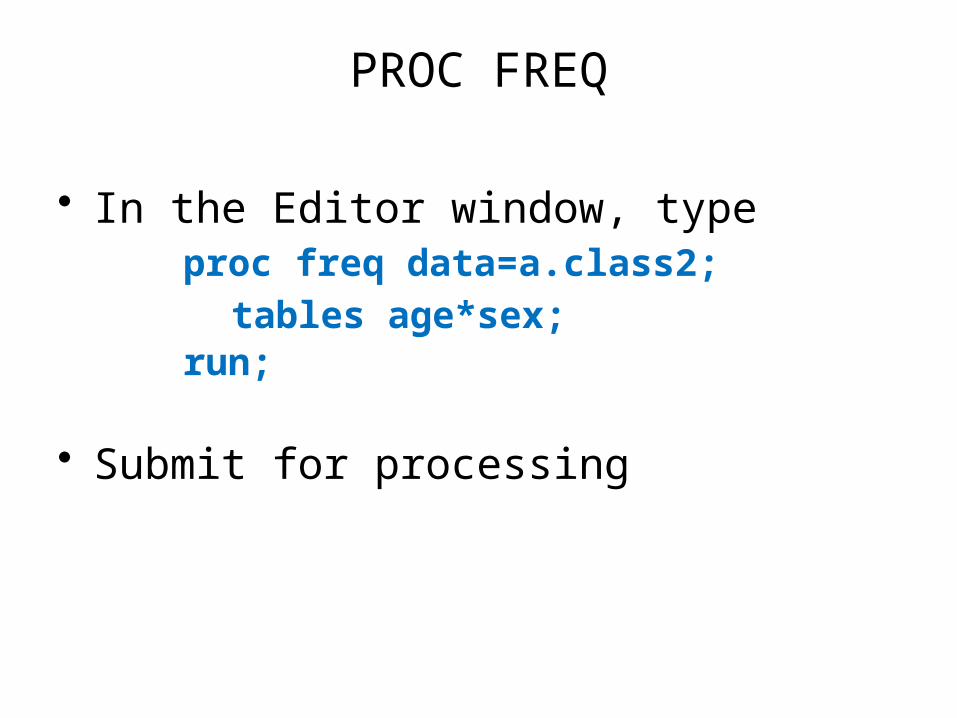
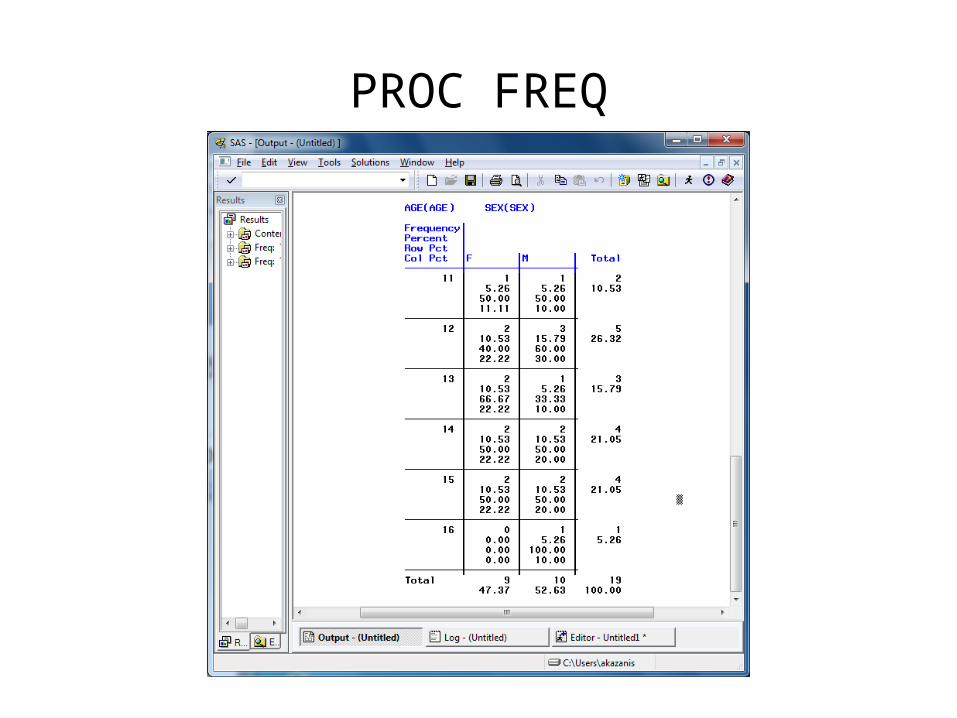
PROC FREQ
• In the Editor window, type proc freq data=a.class2;
tables age*sex;run;
• Submit for processing
PROC FREQ

PROC MEANS
• In the Editor window, type proc means data=a.class2;
var age weight height;
run;
• Submit for processing

PROC MEANS

Graphing DataPROC GPLOT
• Simple bivariate scatterplot• Separate lines• Multiple variables scatterplot• Options

PROC GPLOT
• Simple bivariate scatterplot:proc gplot data=a.class2;
symbol1 value=dot interpol=rl;plot weight*height;
run;
• Submit for processing

PROC GPLOT

• To graph separate lines for each level of a categorical variable, type:
proc gplot data=a.class2;
symbol1 value=dot interpol=rl;
plot weight*height = sex;
run;
• Submit for processing
PROC GPLOT

PROC GPLOT

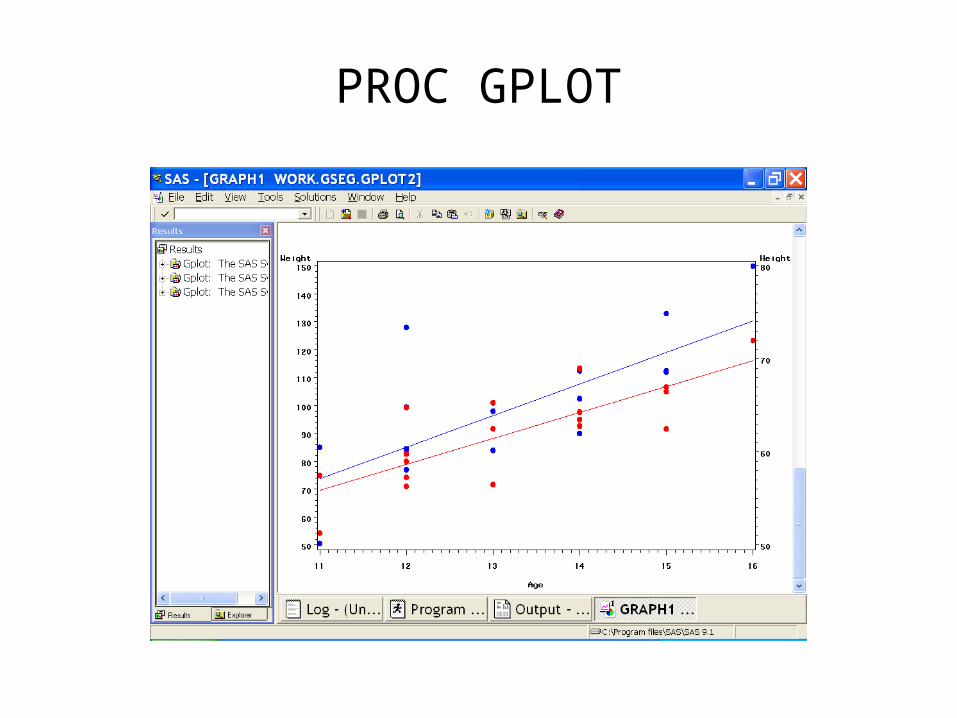
• Multiple variables on the same graph:proc gplot data=a.class2;
symbol1 value=dot interpol=rl color=blue;
symbol2 value=dot interpol=rl color=red;
plot weight * age;plot2 height * age;
run; quit;
• Submit for processing
PROC GPLOT
PROC GPLOT

value=___
• Any character enclosed in single quotes
• Special characters– dot– plus sign– star– square– ...and many others
interpol=___
• RL / RQ / RC– linear– quadratic – cubic – regression curves
• JOIN– connects consecutive
points (line graph)• BOX
PROC GPLOT

Statistics in SAS
• PROC CORR– Correlational analyses
• PROC REG– Statistical Regression
• PROC UNIVARIATE– To assess normality of regression residuals
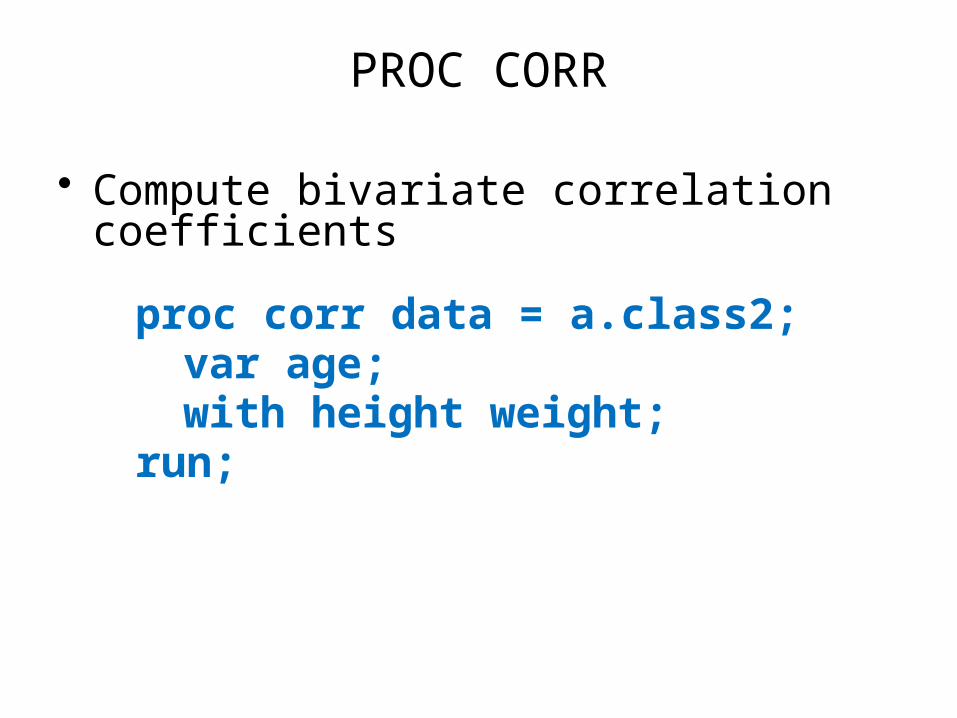
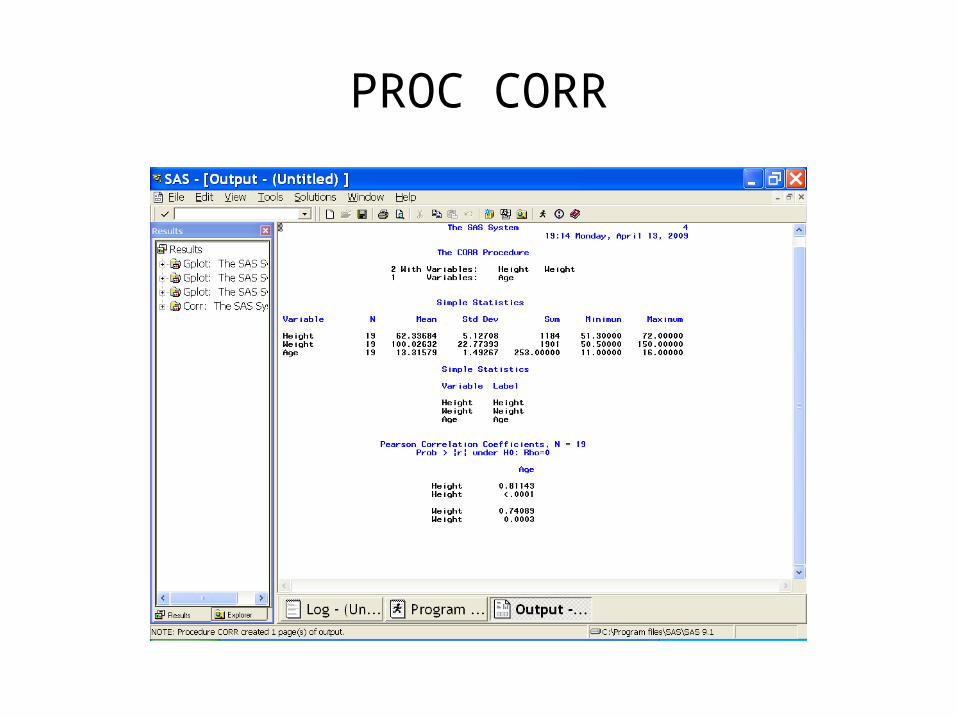
PROC CORR
• Compute bivariate correlation coefficients
proc corr data = a.class2;var age;with height weight;
run;
PROC CORR
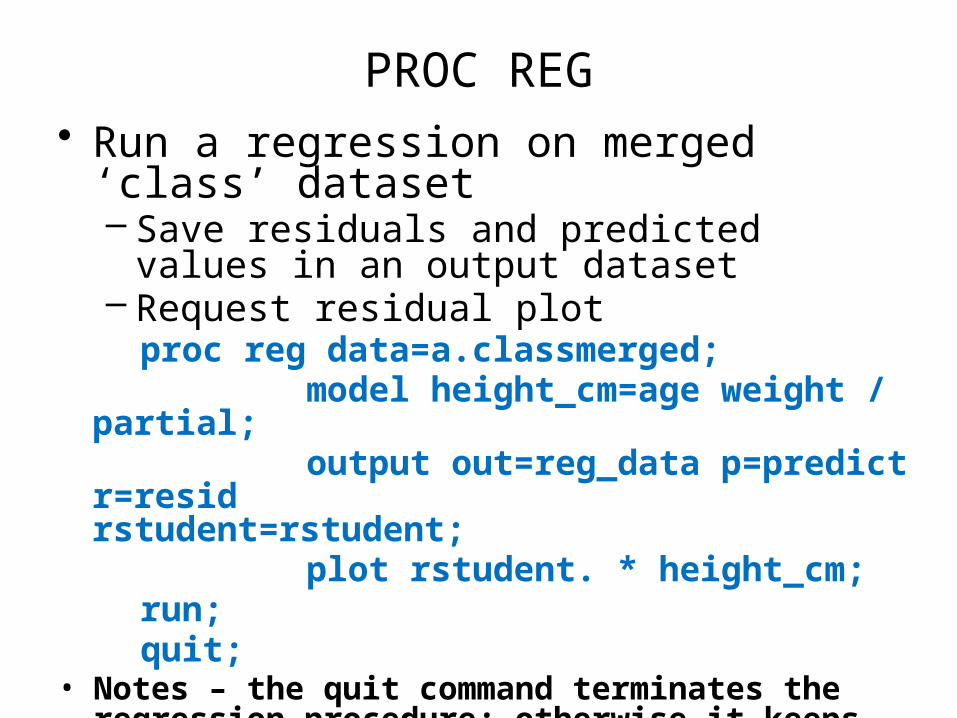
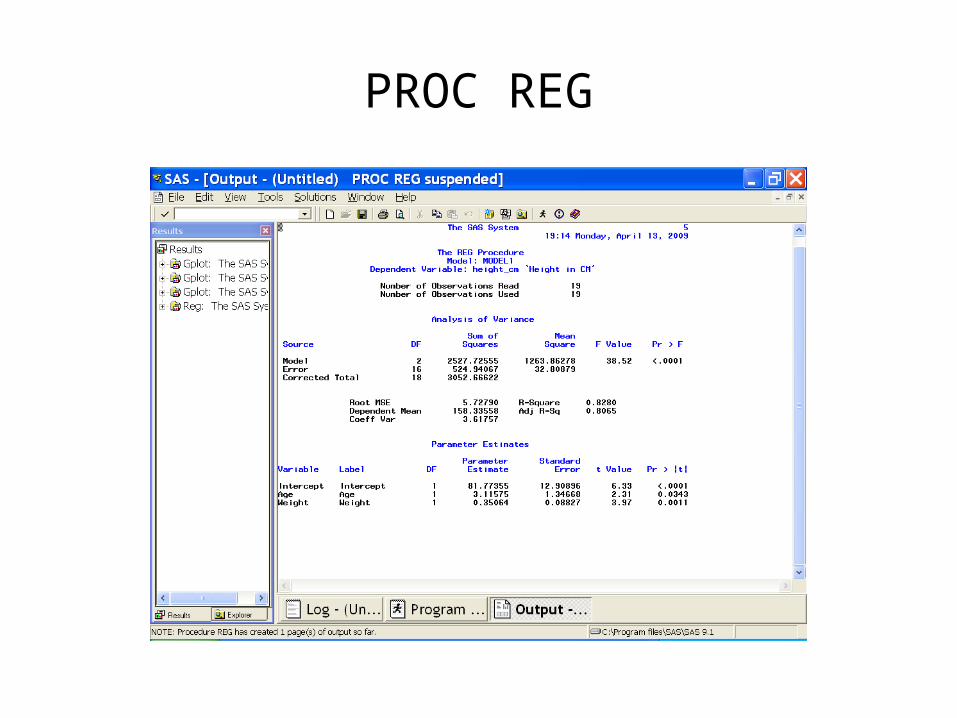
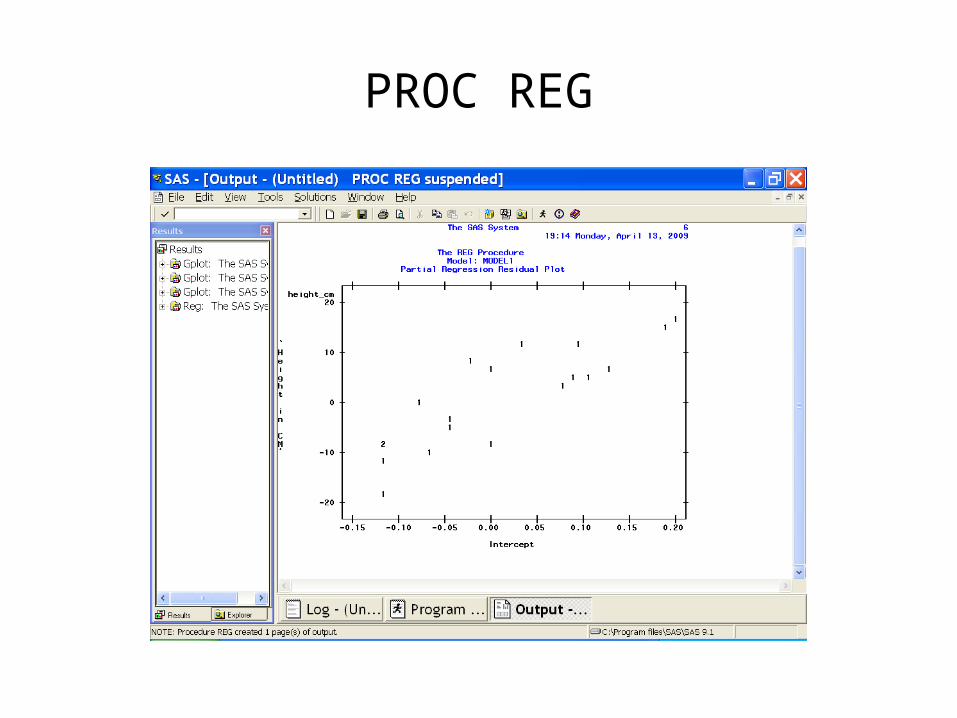
PROC REG• Run a regression on merged ‘class’ dataset
– Save residuals and predicted values in an output dataset
– Request residual plotproc reg data=a.classmerged;
model height_cm=age weight / partial; output out=reg_data p=predict r=resid
rstudent=rstudent; plot rstudent. * height_cm;
run;quit;
• Notes – the quit command terminates the regression procedure; otherwise it keeps running; the output data set will be in the work library, since no library was specified.
PROC REG
PROC REG
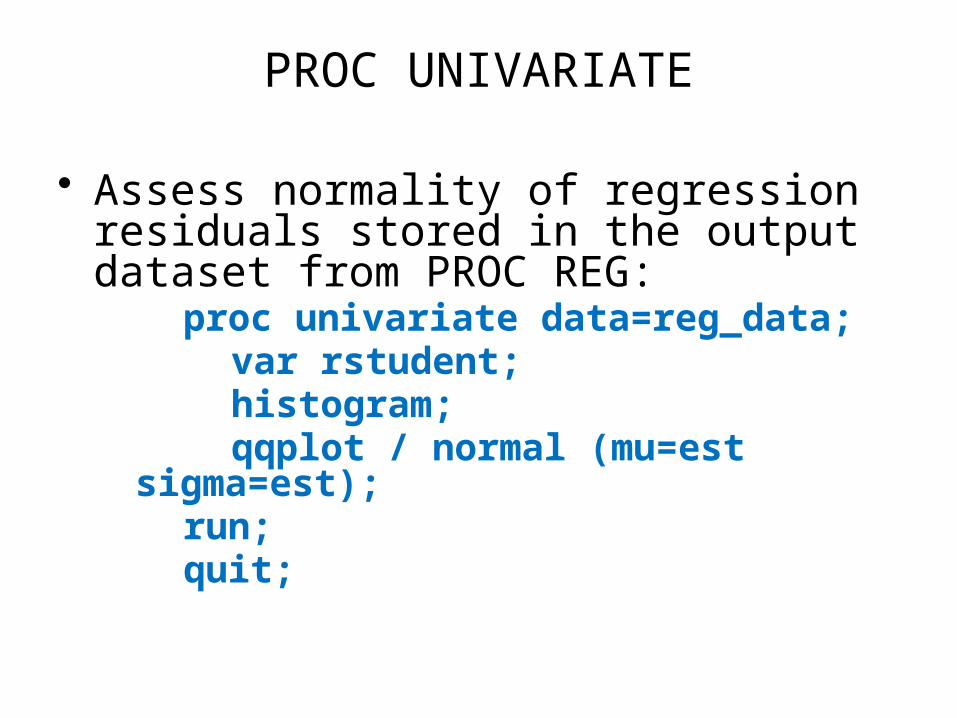
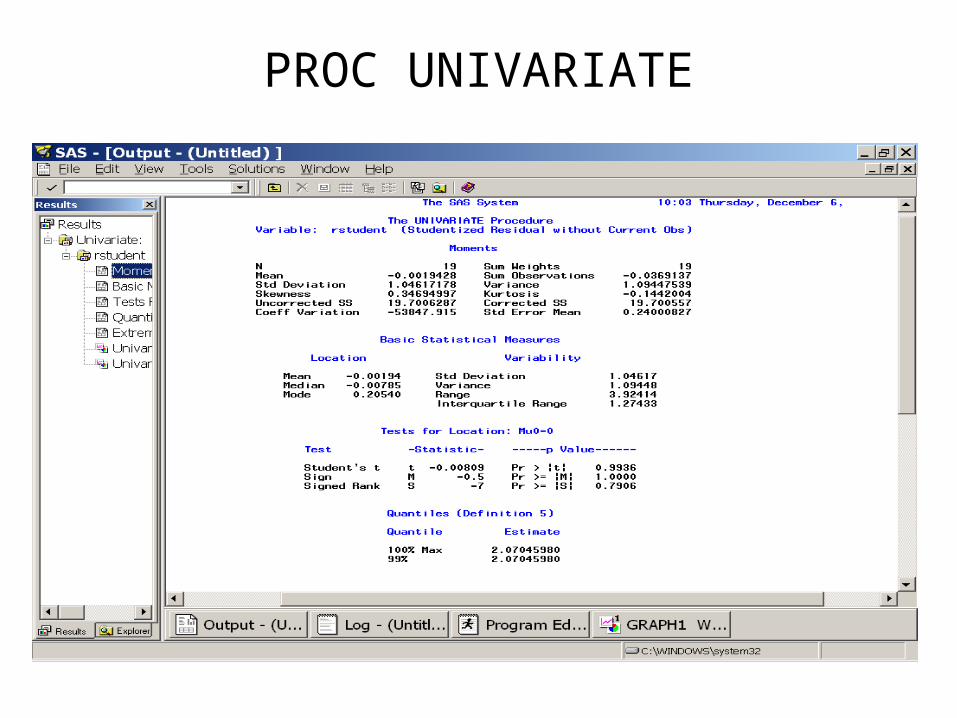
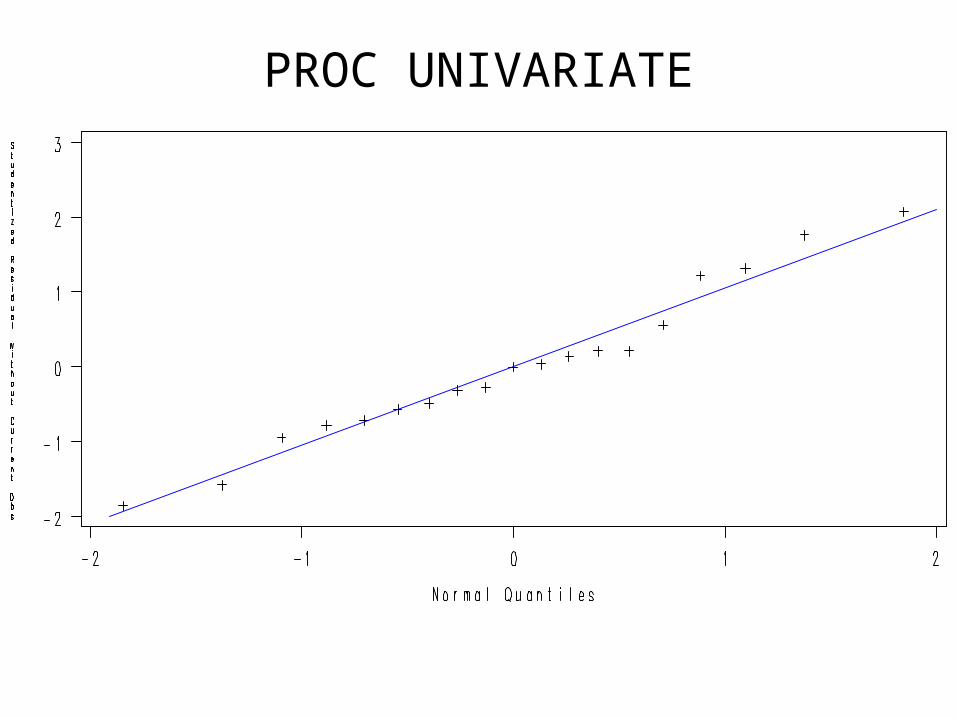
PROC UNIVARIATE
• Assess normality of regression residuals stored in the output dataset from PROC REG:
proc univariate data=reg_data;var rstudent;histogram;qqplot / normal (mu=est
sigma=est);run;quit;
PROC UNIVARIATE
PROC UNIVARIATE

QUESTIONS
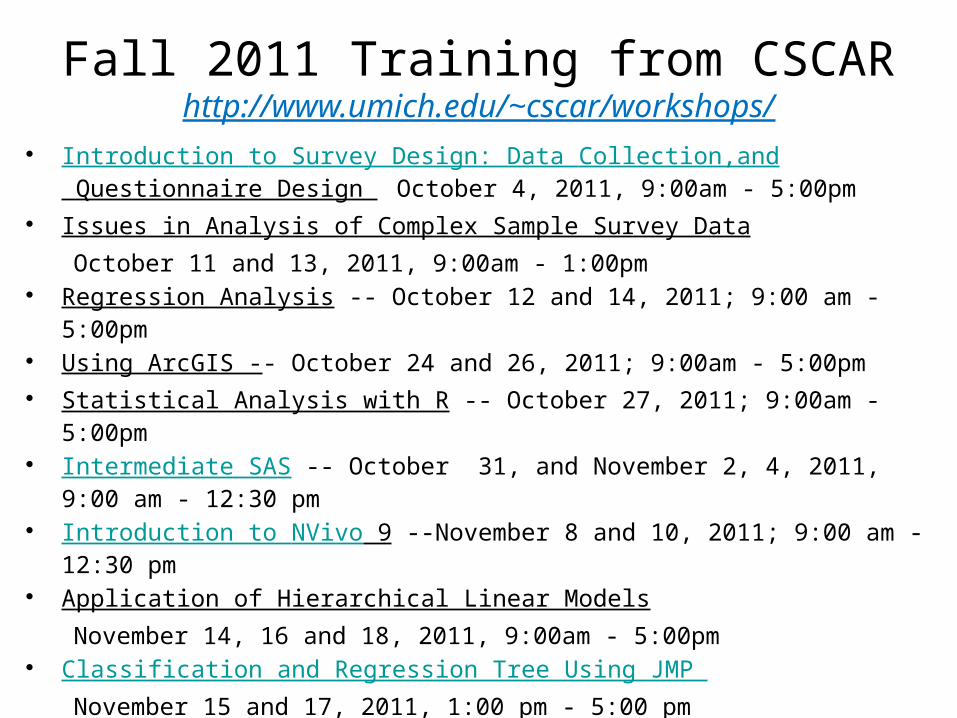
• Introduction to Survey Design: Data Collection,and Questionnaire Design October 4, 2011, 9:00am - 5:00pm
• Issues in Analysis of Complex Sample Survey Data
October 11 and 13, 2011, 9:00am - 1:00pm• Regression Analysis -- October 12 and 14, 2011; 9:00 am - 5:00pm• Using ArcGIS -- October 24 and 26, 2011; 9:00am - 5:00pm• Statistical Analysis with R -- October 27, 2011; 9:00am - 5:00pm• Intermediate SAS -- October 31, and November 2, 4, 2011,
9:00 am - 12:30 pm• Introduction to NVivo 9 --November 8 and 10, 2011; 9:00 am - 12:30 pm• Application of Hierarchical Linear Models
November 14, 16 and 18, 2011, 9:00am - 5:00pm • Classification and Regression Tree Using JMP
November 15 and 17, 2011, 1:00 pm - 5:00 pm• Applied Structural Equation Modeling --November 28-30, 2011; 9:00am - 5:00pm
Fall 2011 Training from CSCARhttp://www.umich.edu/~cscar/workshops/
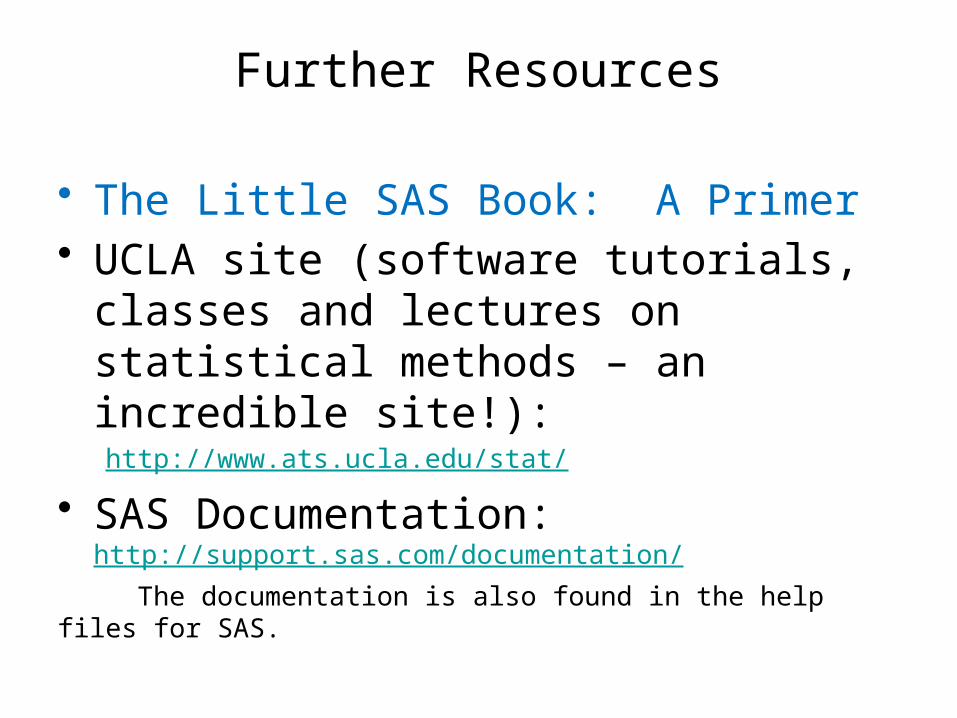
Further Resources
• The Little SAS Book: A Primer• UCLA site (software tutorials, classes and
lectures on statistical methods – an incredible site!): http://www.ats.ucla.edu/stat/
• SAS Documentation: http://support.sas.com/documentation/
The documentation is also found in the help files for SAS.
53
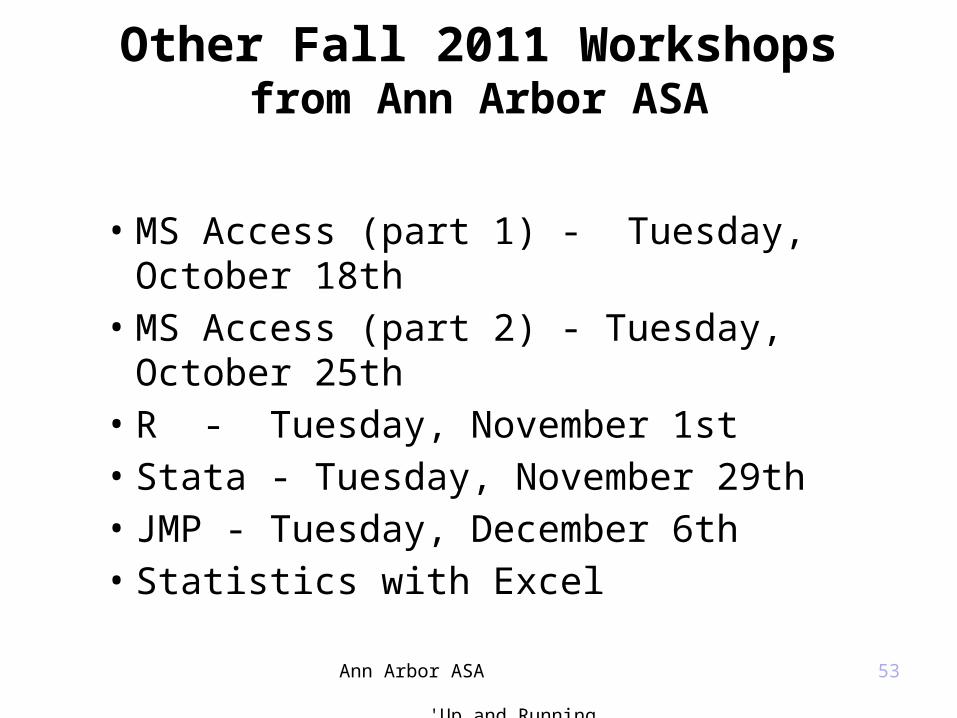
Other Fall 2011 Workshopsfrom Ann Arbor ASA
• MS Access (part 1) - Tuesday, October 18th• MS Access (part 2) - Tuesday, October 25th• R - Tuesday, November 1st• Stata - Tuesday, November 29th• JMP - Tuesday, December 6th• Statistics with Excel
Ann Arbor ASA 'Up and Running Series':
SPSS
Related Documents