Pure appl. geophys. 151 (1998) 443–462 0033 – 4553/98/040443–20 $ 1.50 +0.20/0 Anisotropy of the Yellowstone Hot Spot Wake, Eastern Snake River Plain, Idaho DEREK SCHUTT, 1 EUGENE D. HUMPHREYS 1 and KEN DUEKER 2 Abstract —Over the last 10 million years, the Yellowstone hot spot has passed beneath the eastern Snake River Plain, both magmatically modifying the Snake River Plain crust and creating a wider, wake-like ‘‘tectonic parabola’’ of seismicity and uplift. Analysis of SKS arrivals to a line array of 55 mostly broadband stations, distribution across the tectonic parabola, reveals a nearly uniform orienta- tion of anisotropy, with an average fast axis orientation of N64E. The back azimuth of null splitting events is parallel to the measured fast axis, suggesting that anisotropic material consists of a single layer. Splitting parameters are independent of backazimuth, suggesting that anisotropy is constant beneath each station. Thus station-averaged split parameters are representative of the anisotropy beneath the station. Station-averaged split times range from 0.6 – 1.5 s, and define a pronounced depression in split times centered about 80 km southeast of the axis of the Snake River Plain. Assuming the degree of anisotropy (averaged over the ray path) to be no more than 10%, the split times are far too great for the anisotropy to be confined solely to the lithosphere. The simplest way to explain the observed anisotropy structure is to attribute it to simple shear strain caused by the absolute motion of North America. Because anisotropy is different in nearby Colorado and Nevada, we hypothesize that fossil anisotropy created in past orogens and continent-building events in the Snake River Plain area has been reset or erased by the passage of the hot spot, and that subsequent strain of the hot spot-related asthenospheric wake created a uniformly oriented fast axis. If this is true, then our array constrains the minimum of the hot spot’s asthenospheric wake. Key words: Shear wave splitting, hot spot, mantle plume, anisotropy, yellowstone, shear wave anisotropy, SKS splitting. Introduction Several observations suggest the hot spot currently exciting Yellowstone mag- matism has passed beneath the eastern Snake River Plain (eSRP) of southern Idaho. These include: 1) a series of time progressive rhyolitic calderas younging from the southwest to the northeast (SMITH and BRAILE, 1994); 2) a seismically inferred mid-crustal basaltic sill beneath the rhyolitic calderas (SPARLIN et al., 1982); 3) a geoid high centered on Yellowstone that is thought to be caused by a deep low density anomaly (MILBERT, 1991); 4) He 3 /He 4 values indicative of 1 Department of Geological Sciences, 1272 University of Oregon; Eugene, OR 97403-1272, U.S.A. e-mail: [email protected]. 2 CIRES, University of Colorado at Boulder, Boulder, CO 80309-0449, U.S.A.

Welcome message from author
This document is posted to help you gain knowledge. Please leave a comment to let me know what you think about it! Share it to your friends and learn new things together.
Transcript
Pure appl. geophys. 151 (1998) 443–4620033–4553/98/040443–20 $ 1.50+0.20/0
Anisotropy of the Yellowstone Hot Spot Wake, Eastern SnakeRiver Plain, Idaho
DEREK SCHUTT,1 EUGENE D. HUMPHREYS1 and KEN DUEKER2
Abstract—Over the last 10 million years, the Yellowstone hot spot has passed beneath the easternSnake River Plain, both magmatically modifying the Snake River Plain crust and creating a wider,wake-like ‘‘tectonic parabola’’ of seismicity and uplift. Analysis of SKS arrivals to a line array of 55mostly broadband stations, distribution across the tectonic parabola, reveals a nearly uniform orienta-tion of anisotropy, with an average fast axis orientation of N64E. The back azimuth of null splittingevents is parallel to the measured fast axis, suggesting that anisotropic material consists of a single layer.Splitting parameters are independent of backazimuth, suggesting that anisotropy is constant beneatheach station. Thus station-averaged split parameters are representative of the anisotropy beneath thestation. Station-averaged split times range from 0.6–1.5 s, and define a pronounced depression in splittimes centered about 80 km southeast of the axis of the Snake River Plain.
Assuming the degree of anisotropy (averaged over the ray path) to be no more than 10%, the splittimes are far too great for the anisotropy to be confined solely to the lithosphere. The simplest way toexplain the observed anisotropy structure is to attribute it to simple shear strain caused by the absolutemotion of North America. Because anisotropy is different in nearby Colorado and Nevada, wehypothesize that fossil anisotropy created in past orogens and continent-building events in the SnakeRiver Plain area has been reset or erased by the passage of the hot spot, and that subsequent strain ofthe hot spot-related asthenospheric wake created a uniformly oriented fast axis. If this is true, then ourarray constrains the minimum of the hot spot’s asthenospheric wake.
Key words: Shear wave splitting, hot spot, mantle plume, anisotropy, yellowstone, shear waveanisotropy, SKS splitting.
Introduction
Several observations suggest the hot spot currently exciting Yellowstone mag-matism has passed beneath the eastern Snake River Plain (eSRP) of southernIdaho. These include: 1) a series of time progressive rhyolitic calderas youngingfrom the southwest to the northeast (SMITH and BRAILE, 1994); 2) a seismicallyinferred mid-crustal basaltic sill beneath the rhyolitic calderas (SPARLIN et al.,1982); 3) a geoid high centered on Yellowstone that is thought to be caused by adeep low density anomaly (MILBERT, 1991); 4) He3/He4 values indicative of
1Department of Geological Sciences, 1272 University of Oregon; Eugene, OR 97403-1272, U.S.A.e-mail: [email protected].
2CIRES, University of Colorado at Boulder, Boulder, CO 80309-0449, U.S.A.
Derek Schutt et al.444 Pure appl. geophys.,
degassing primitive mantle (HEARN et al., 1990); and 5) a parabolic-shaped regionof heightened elevation, seismicity, and faulting, which is thought to have formedas hot spot mantle buoyantly flattened beneath North America (ANDERS andSLEEP, 1992; PIERCE and MORGAN, 1992; RIBE and CHRISTENSEN; SMITH andBRAILE, 1994).
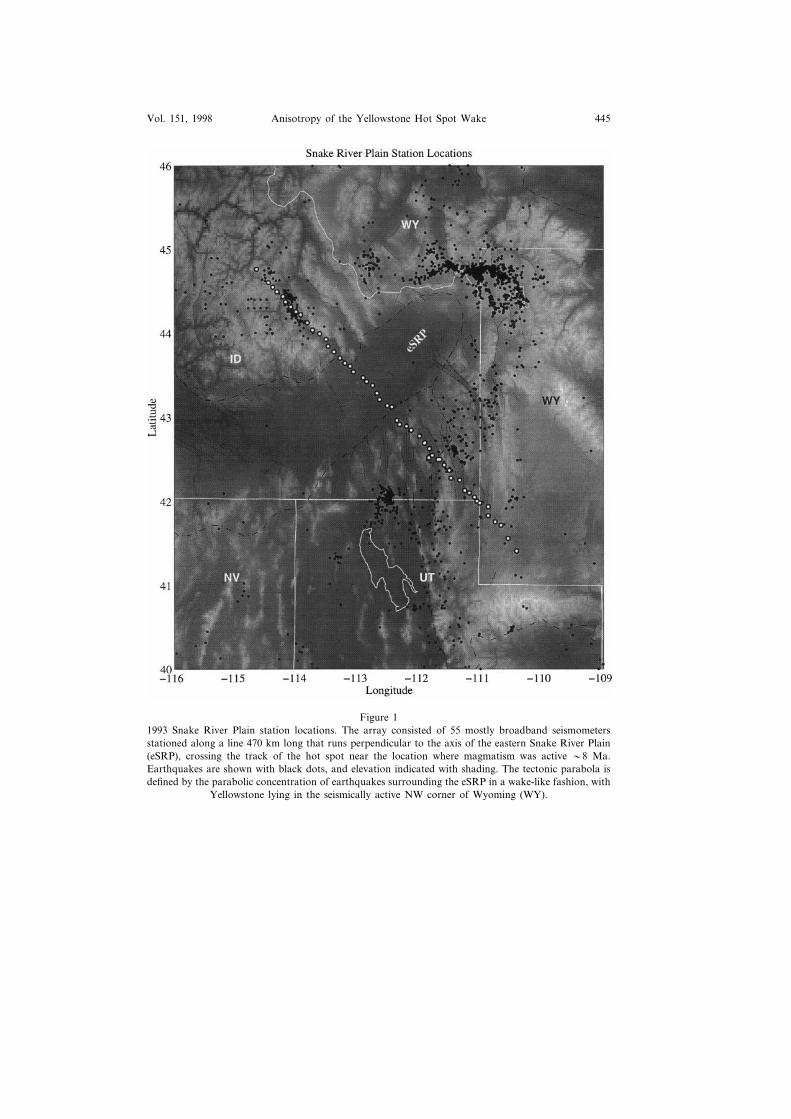
To address the mantle structure and dynamics of this system, the Program forthe Array Seismic Studies of the Continental Lithosphere (PASSCAL) supportedthe deployment of a 470 km long SW-trending line array of 55 mostly broadbandstations across the width of the tectonic parabola in a line perpendicular to the pathof the hot spot, crossing the eSRP at the location where the hot spot was activeabout 8 Ma (PIERCE and MORGAN, 1992; Fig. 1). These stations collected about375 teleseismic events, which were used for an inte-grated P wave and S wave, andreceiver function study of the upper mantle and crust in this area. Informationabout the mantle structure below this region can provide clues to understanding themechanisms driving the hot spot, as well as giving insight into how variations in thephysical state of the mantle have created the topography in the eSRP. This paperwill be concentrated on the S-wave splitting component of our studies, which maybe especially useful in providing information on the strain evolution of this hot spotasthenosphere.
Shear-wa�e Splitting Results
Data and Method
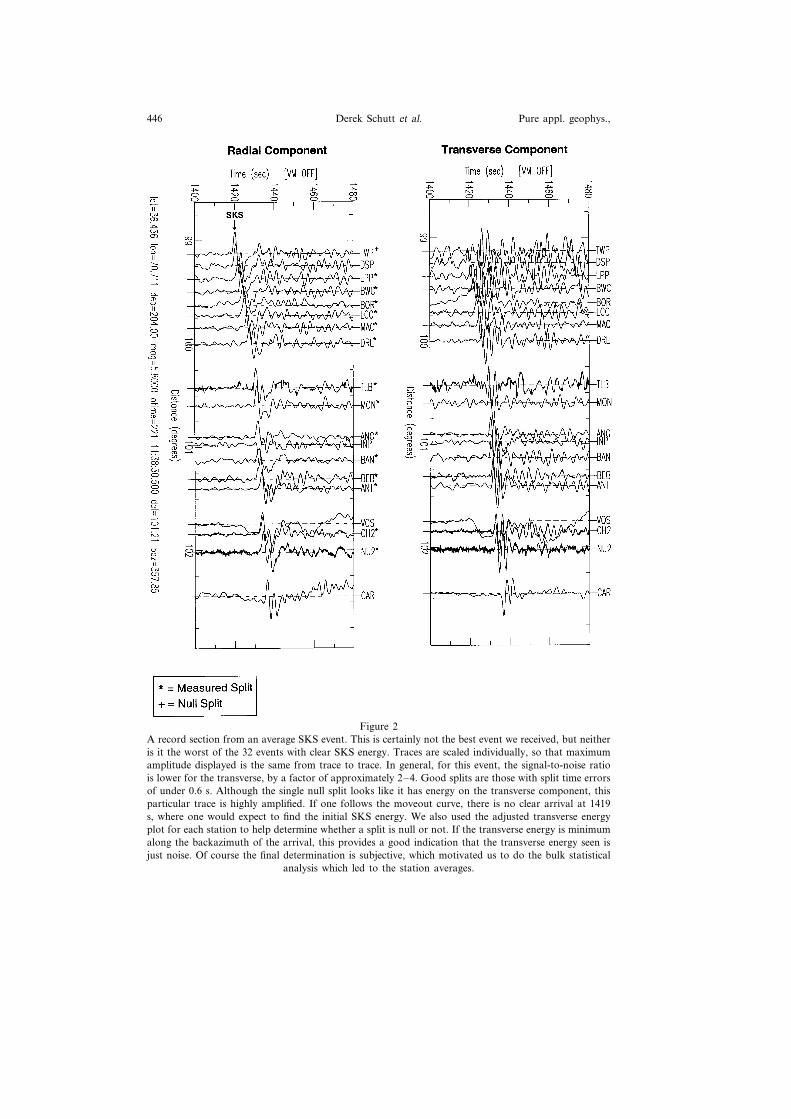
Over the 200-day life of the experiment, 59 shear-wave events were recorded. Ofthese, 32 had significant radial SKS energy that was not polluted by other phases.A record section of one of these SKS events is shown in Figure 2. In this case SKSphase is the first arriving, although we also measured splits on events where thiswas not the case.
We measured 141 sets of SKS split parameters. In addition, 30 events came infrom backazimuths that produced no SH energy. These ‘‘null splitting’’ eventsoccur when the ray travels along the fast or slow axes; these null events alsoconstrain the orientation of the axes, although they do not provide any informationon the split time.
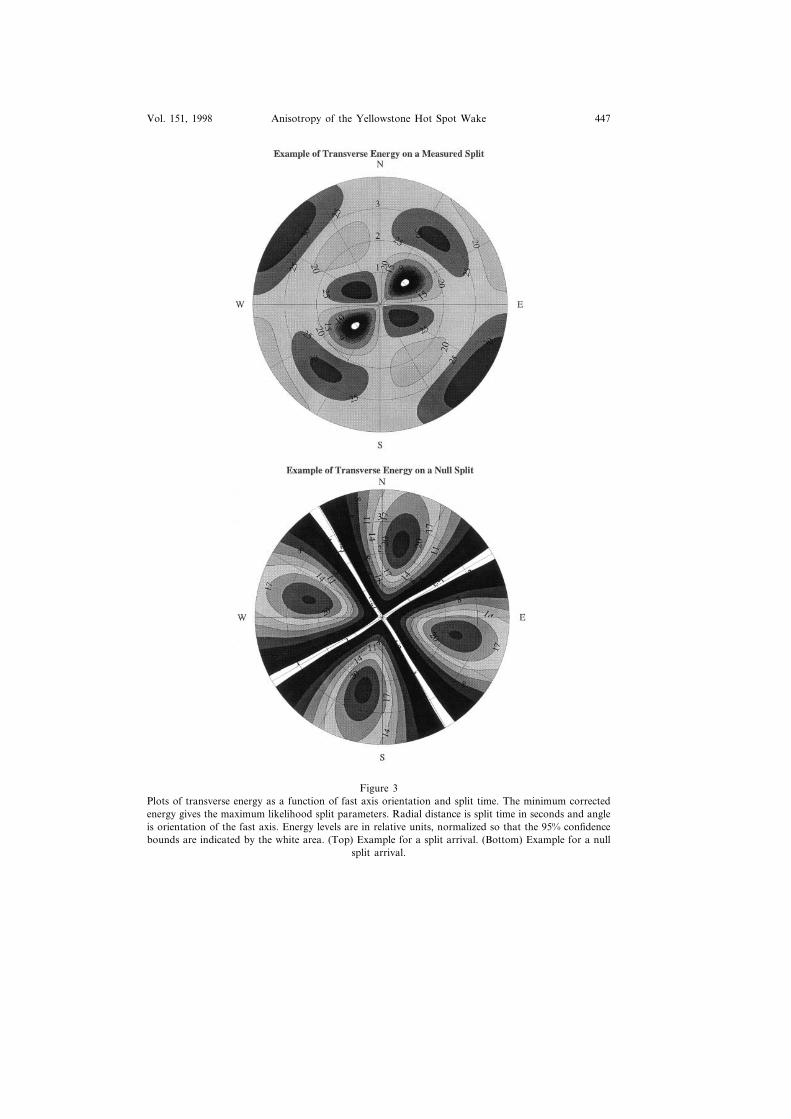
We estimate anisotropy beneath our array by applying the tangential energyminimization technique of SILVER and CHAN (1991) to SKS arrivals. This methoddetermines splitting parameters (split time and the horizontal projection of fastaxis orientation) for each split observation by seeking transverse energyminima (Fig. 3—Top). As is standard in this analysis, transverse anisotropy andhexagonal symmetry are assumed. We show below that these assumptions arereasonable.
Anisotropy of the Yellowstone Hot Spot Wake 445Vol. 151, 1998
Figure 11993 Snake River Plain station locations. The array consisted of 55 mostly broadband seismometersstationed along a line 470 km long that runs perpendicular to the axis of the eastern Snake River Plain(eSRP), crossing the track of the hot spot near the location where magmatism was active �8 Ma.Earthquakes are shown with black dots, and elevation indicated with shading. The tectonic parabola isdefined by the parabolic concentration of earthquakes surrounding the eSRP in a wake-like fashion, with
Yellowstone lying in the seismically active NW corner of Wyoming (WY).
Derek Schutt et al.446 Pure appl. geophys.,
Figure 2A record section from an average SKS event. This is certainly not the best event we received, but neitheris it the worst of the 32 events with clear SKS energy. Traces are scaled individually, so that maximumamplitude displayed is the same from trace to trace. In general, for this event, the signal-to-noise ratiois lower for the transverse, by a factor of approximately 2–4. Good splits are those with split time errorsof under 0.6 s. Although the single null split looks like it has energy on the transverse component, thisparticular trace is highly amplified. If one follows the moveout curve, there is no clear arrival at 1419s, where one would expect to find the initial SKS energy. We also used the adjusted transverse energyplot for each station to help determine whether a split is null or not. If the transverse energy is minimumalong the backazimuth of the arrival, this provides a good indication that the transverse energy seen isjust noise. Of course the final determination is subjective, which motivated us to do the bulk statistical
analysis which led to the station averages.
Anisotropy of the Yellowstone Hot Spot Wake 447Vol. 151, 1998
Figure 3Plots of transverse energy as a function of fast axis orientation and split time. The minimum correctedenergy gives the maximum likelihood split parameters. Radial distance is split time in seconds and angleis orientation of the fast axis. Energy levels are in relative units, normalized so that the 95% confidencebounds are indicated by the white area. (Top) Example for a split arrival. (Bottom) Example for a null
split arrival.
Derek Schutt et al.448 Pure appl. geophys.,
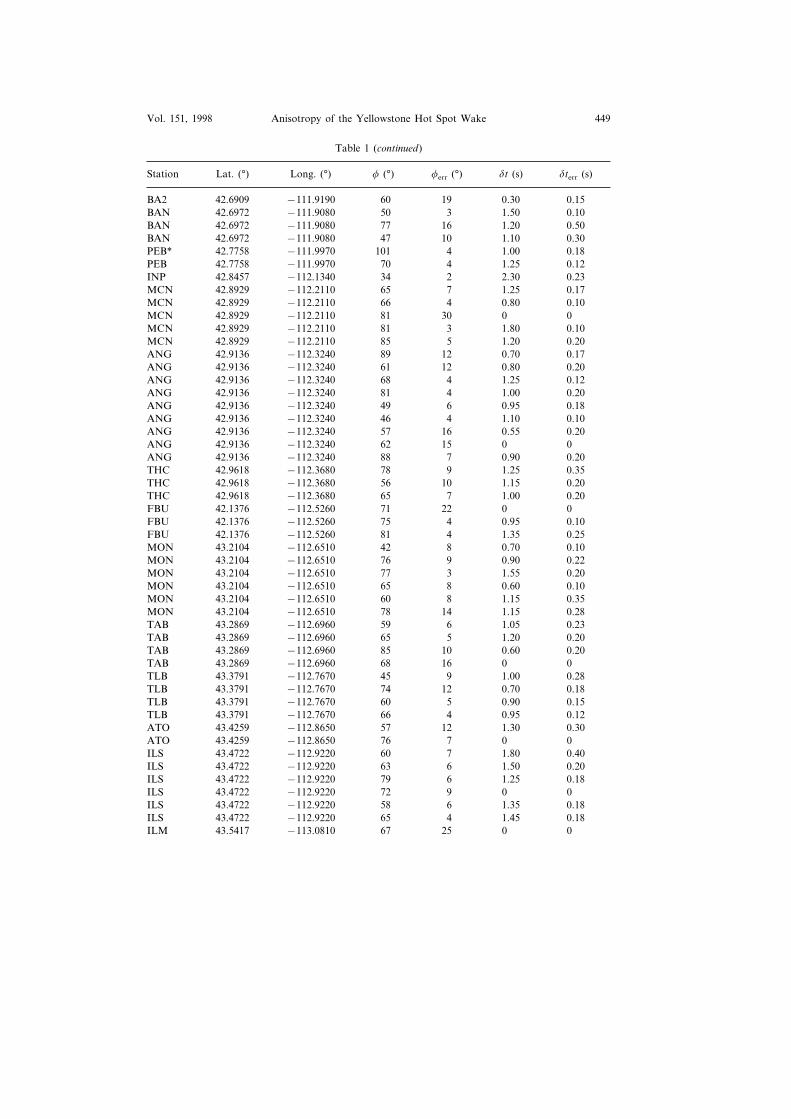
Table 1
Raw SKS splitting data
Station Lat. (°) Long. (°) � (°) �err (°) �t (s) �terr (s)
CAV 41.7170 −110.6650 53 20 0 0CAV 41.7170 −110.6650 62 16 0.70 0.20NUG 41.8311 −110.8740 57 25 0 0NU2 41.8319 −110.8740 50 10 1.15 0.25LDC 41.9375 −110.8730 98 2 1.60 0.30CH2* 42.0058 −111.0570 82 22 0.25 0.32CH2 42.0058 −111.0570 34 8 1.05 0.12CH2 42.0058 −111.0570 49 2 1.05 0.07CH2 42.0058 −111.0570 41 2 1.85 0.25DAH 42.0522 −111.0960 42 10 1.20 0.35DAH 42.0522 −111.0960 67 9 0 0VOS 42.1030 −111.1800 59 6 1.05 0.18VOS 42.1030 −111.1800 66 9 0.90 0.10VOS 42.1030 −111.1800 56 10 0.90 0.28VOS 42.1030 −111.1800 70 30 0 0MEM 42.1317 −111.2560 45 2 1.40 0.10MEM 42.1317 −111.2560 65 11 0.65 0.12AIR 42.2541 −111.3390 77 12 0.95 0.28AIR 42.2541 −111.3390 58 18 1.25 0.50MIC 42.2784 −111.4820 57 7 1.45 0.28MIC 42.2784 −111.4820 49 5 1.05 0.13MIC* 42.2784 −111.4820 123 2 2.30 0.23MIC 42.2784 −111.4820 66 2 1.20 0.18MIC 42.2784 −111.4820 44 5 1.30 0.30MIC 42.2784 −111.4820 42 4 1.30 0.20MIC 42.2784 −111.4820 41 8 0.80 0.15MIC 42.2784 −111.4820 69 16 0 0EMC 42.3694 −111.5090 41 6 1.30 0.30EMC 42.3694 −111.5090 47 4 1.40 0.45EMC 42.3694 −111.5090 47 7 1.40 0.30EMC 42.3694 −111.5090 70 30 0 0ANT 42.4340 −111.5930 63 4 1.30 0.40ANT 42.4340 −111.5930 63 2 1.35 0.10ANT 42.4340 −111.5930 69 8 1.20 0.38ANT 42.4340 −111.5930 68 2 1.50 0.10ANT 42.4340 −111.5930 68 11 1.15 0.25ANT 42.4340 −111.5930 46 6 1.40 0.35ANT 42.4340 −111.5930 55 8 1.10 0.20ANT 42.4340 −111.5930 73 12 1.10 0.35ANT 42.4340 −111.5930 74 4 1.60 0.28NIT 42.4987 −111.6950 73 7 1.10 0.20NIT 42.4987 −111.6950 73 6 1.30 0.40NIT 42.4987 −111.6950 67 3 1.80 0.20NIT 42.4987 −111.6950 70 10 0.90 0.20NI2 42.4991 −111.6620 62 22 0 0BEB 42.5201 −111.8450 49 4 1.50 0.18BUC 42.6277 −111.8360 72 15 0 0BUC 42.6277 −111.8360 68 6 1.00 0.10BUC 42.6277 −111.8360 1 4 2.35 0.20
Anisotropy of the Yellowstone Hot Spot Wake 449Vol. 151, 1998
Table 1 (continued)
Station Lat. (°) Long. (°) � (°) �err (°) �t (s) �terr (s)
BA2 42.6909 −111.9190 60 19 0.30 0.15BAN 42.6972 −111.9080 50 3 1.50 0.10BAN 42.6972 −111.9080 77 16 1.20 0.50BAN 42.6972 −111.9080 47 10 1.10 0.30PEB* 42.7758 −111.9970 101 4 1.00 0.18PEB 42.7758 −111.9970 70 4 1.25 0.12INP 42.8457 −112.1340 34 2 2.30 0.23MCN 42.8929 −112.2110 65 7 1.25 0.17MCN 42.8929 −112.2110 66 4 0.80 0.10MCN 42.8929 −112.2110 81 30 0 0MCN 42.8929 −112.2110 81 3 1.80 0.10MCN 42.8929 −112.2110 85 5 1.20 0.20ANG 42.9136 −112.3240 89 12 0.70 0.17ANG 42.9136 −112.3240 61 12 0.80 0.20ANG 42.9136 −112.3240 68 4 1.25 0.12ANG 42.9136 −112.3240 81 4 1.00 0.20ANG 42.9136 −112.3240 49 6 0.95 0.18ANG 42.9136 −112.3240 46 4 1.10 0.10ANG 42.9136 −112.3240 57 16 0.55 0.20ANG 42.9136 −112.3240 62 15 0 0ANG 42.9136 −112.3240 88 7 0.90 0.20THC 42.9618 −112.3680 78 9 1.25 0.35THC 42.9618 −112.3680 56 10 1.15 0.20THC 42.9618 −112.3680 65 7 1.00 0.20FBU 42.1376 −112.5260 71 22 0 0FBU 42.1376 −112.5260 75 4 0.95 0.10FBU 42.1376 −112.5260 81 4 1.35 0.25MON 43.2104 −112.6510 42 8 0.70 0.10MON 43.2104 −112.6510 76 9 0.90 0.22MON 43.2104 −112.6510 77 3 1.55 0.20MON 43.2104 −112.6510 65 8 0.60 0.10MON 43.2104 −112.6510 60 8 1.15 0.35MON 43.2104 −112.6510 78 14 1.15 0.28TAB 43.2869 −112.6960 59 6 1.05 0.23TAB 43.2869 −112.6960 65 5 1.20 0.20TAB 43.2869 −112.6960 85 10 0.60 0.20TAB 43.2869 −112.6960 68 16 0 0TLB 43.3791 −112.7670 45 9 1.00 0.28TLB 43.3791 −112.7670 74 12 0.70 0.18TLB 43.3791 −112.7670 60 5 0.90 0.15TLB 43.3791 −112.7670 66 4 0.95 0.12ATO 43.4259 −112.8650 57 12 1.30 0.30ATO 43.4259 −112.8650 76 7 0 0ILS 43.4722 −112.9220 60 7 1.80 0.40ILS 43.4722 −112.9220 63 6 1.50 0.20ILS 43.4722 −112.9220 79 6 1.25 0.18ILS 43.4722 −112.9220 72 9 0 0ILS 43.4722 −112.9220 58 6 1.35 0.18ILS 43.4722 −112.9220 65 4 1.45 0.18ILM 43.5417 −113.0810 67 25 0 0
Derek Schutt et al.450 Pure appl. geophys.,
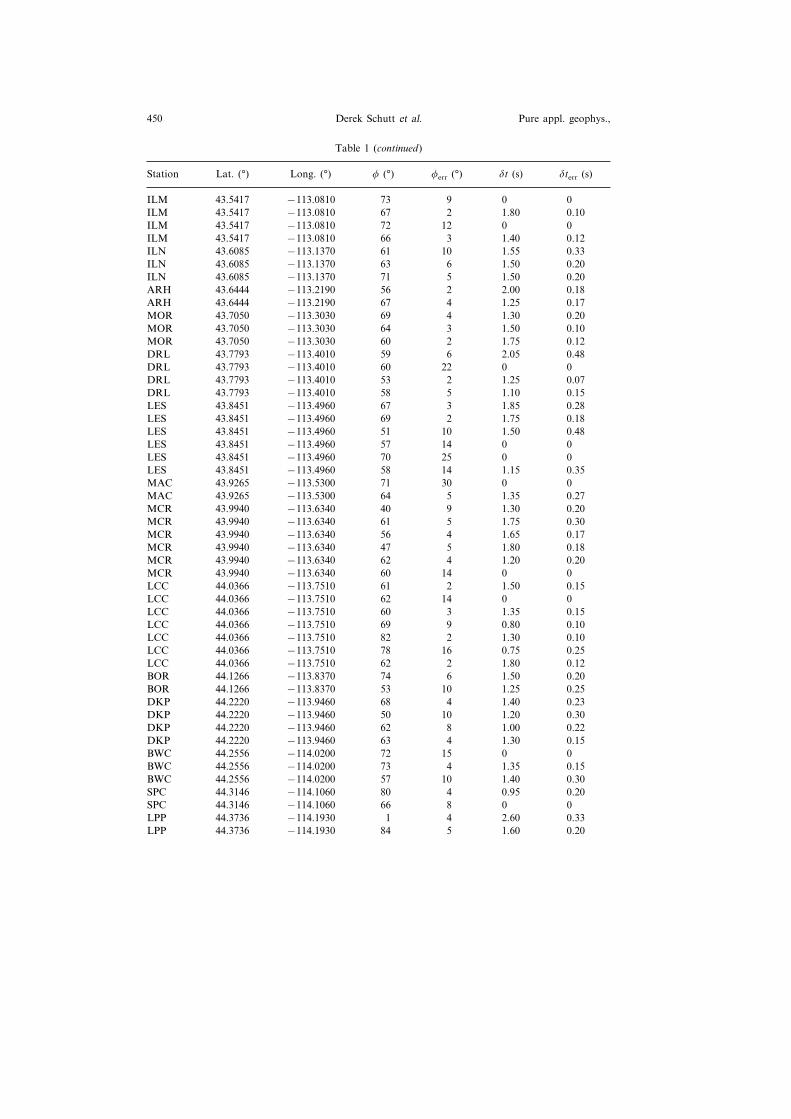
Table 1 (continued)
Station Lat. (°) Long. (°) � (°) �err (°) �t (s) �terr (s)
ILM 43.5417 −113.0810 73 9 0 0ILM 43.5417 −113.0810 67 2 1.80 0.10ILM 43.5417 −113.0810 72 12 0 0ILM 43.5417 −113.0810 66 3 1.40 0.12ILN 43.6085 −113.1370 61 10 1.55 0.33ILN 43.6085 −113.1370 63 6 1.50 0.20ILN 43.6085 −113.1370 71 5 1.50 0.20ARH 43.6444 −113.2190 56 2 2.00 0.18ARH 43.6444 −113.2190 67 4 1.25 0.17MOR 43.7050 −113.3030 69 4 1.30 0.20MOR 43.7050 −113.3030 64 3 1.50 0.10MOR 43.7050 −113.3030 60 2 1.75 0.12DRL 43.7793 −113.4010 59 6 2.05 0.48DRL 43.7793 −113.4010 60 22 0 0DRL 43.7793 −113.4010 53 2 1.25 0.07DRL 43.7793 −113.4010 58 5 1.10 0.15LES 43.8451 −113.4960 67 3 1.85 0.28LES 43.8451 −113.4960 69 2 1.75 0.18LES 43.8451 −113.4960 51 10 1.50 0.48LES 43.8451 −113.4960 57 14 0 0LES 43.8451 −113.4960 70 25 0 0LES 43.8451 −113.4960 58 14 1.15 0.35MAC 43.9265 −113.5300 71 30 0 0MAC 43.9265 −113.5300 64 5 1.35 0.27MCR 43.9940 −113.6340 40 9 1.30 0.20MCR 43.9940 −113.6340 61 5 1.75 0.30MCR 43.9940 −113.6340 56 4 1.65 0.17MCR 43.9940 −113.6340 47 5 1.80 0.18MCR 43.9940 −113.6340 62 4 1.20 0.20MCR 43.9940 −113.6340 60 14 0 0LCC 44.0366 −113.7510 61 2 1.50 0.15LCC 44.0366 −113.7510 62 14 0 0LCC 44.0366 −113.7510 60 3 1.35 0.15LCC 44.0366 −113.7510 69 9 0.80 0.10LCC 44.0366 −113.7510 82 2 1.30 0.10LCC 44.0366 −113.7510 78 16 0.75 0.25LCC 44.0366 −113.7510 62 2 1.80 0.12BOR 44.1266 −113.8370 74 6 1.50 0.20BOR 44.1266 −113.8370 53 10 1.25 0.25DKP 44.2220 −113.9460 68 4 1.40 0.23DKP 44.2220 −113.9460 50 10 1.20 0.30DKP 44.2220 −113.9460 62 8 1.00 0.22DKP 44.2220 −113.9460 63 4 1.30 0.15BWC 44.2556 −114.0200 72 15 0 0BWC 44.2556 −114.0200 73 4 1.35 0.15BWC 44.2556 −114.0200 57 10 1.40 0.30SPC 44.3146 −114.1060 80 4 0.95 0.20SPC 44.3146 −114.1060 66 8 0 0LPP 44.3736 −114.1930 1 4 2.60 0.33LPP 44.3736 −114.1930 84 5 1.60 0.20
Anisotropy of the Yellowstone Hot Spot Wake 451Vol. 151, 1998
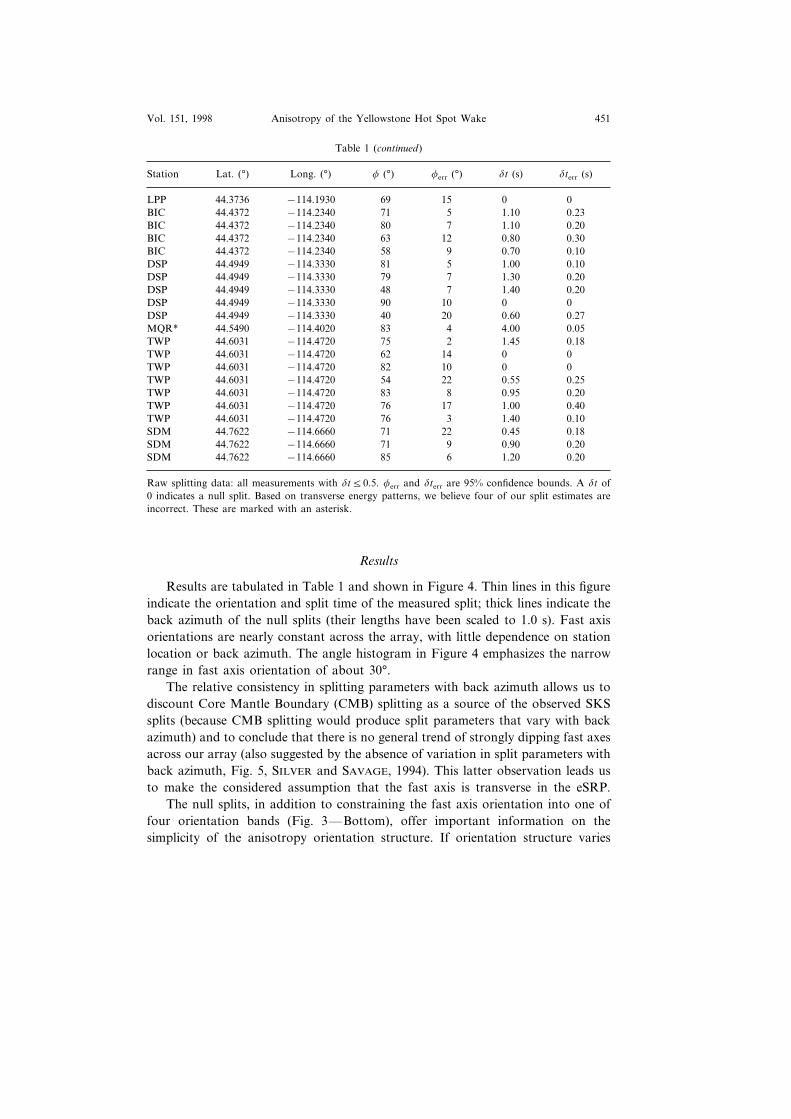
Table 1 (continued)
Station Lat. (°) Long. (°) � (°) �err (°) �t (s) �terr (s)
LPP 44.3736 −114.1930 69 15 0 0BIC 44.4372 −114.2340 71 5 1.10 0.23BIC 44.4372 −114.2340 80 7 1.10 0.20BIC 44.4372 −114.2340 63 12 0.80 0.30BIC 44.4372 −114.2340 58 9 0.70 0.10DSP 44.4949 −114.3330 81 5 1.00 0.10DSP 44.4949 −114.3330 79 7 1.30 0.20DSP 44.4949 −114.3330 48 7 1.40 0.20DSP 44.4949 −114.3330 90 10 0 0DSP 44.4949 −114.3330 40 20 0.60 0.27MQR* 44.5490 −114.4020 83 4 4.00 0.05TWP 44.6031 −114.4720 75 2 1.45 0.18TWP 44.6031 −114.4720 62 14 0 0TWP 44.6031 −114.4720 82 10 0 0TWP 44.6031 −114.4720 54 22 0.55 0.25TWP 44.6031 −114.4720 83 8 0.95 0.20TWP 44.6031 −114.4720 76 17 1.00 0.40TWP 44.6031 −114.4720 76 3 1.40 0.10SDM 44.7622 −114.6660 71 22 0.45 0.18SDM 44.7622 −114.6660 71 9 0.90 0.20SDM 44.7622 −114.6660 85 6 1.20 0.20
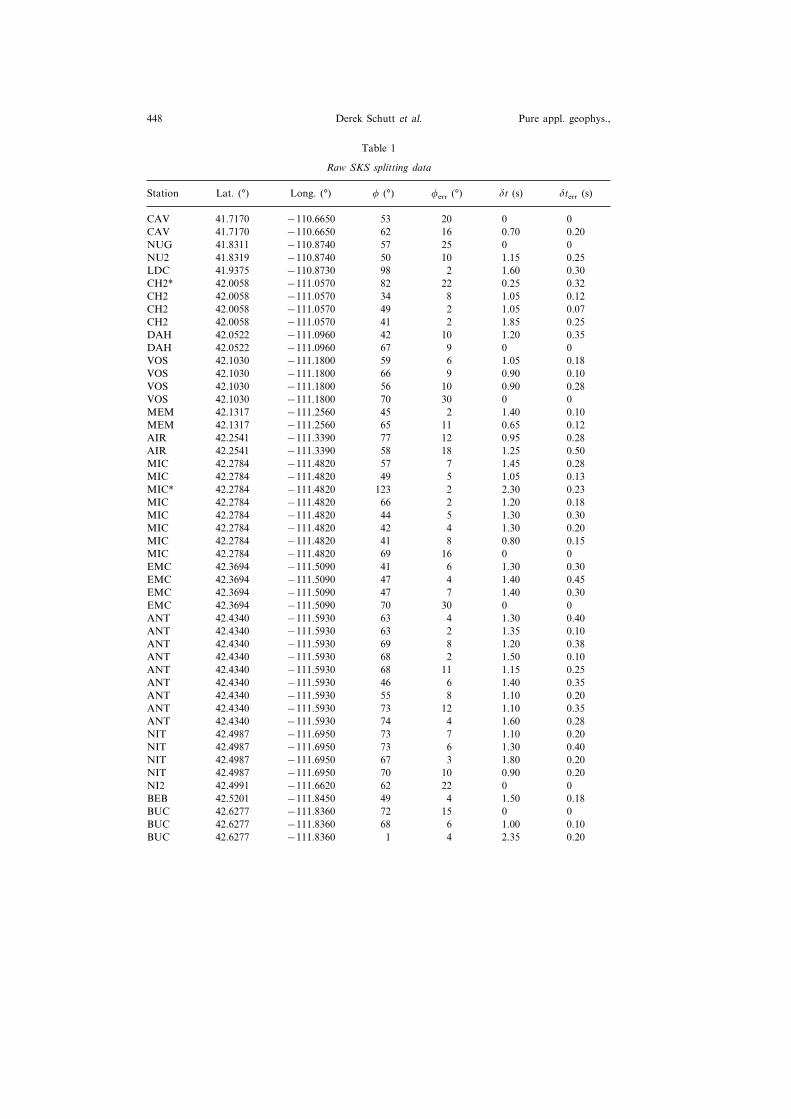
Raw splitting data: all measurements with �t�0.5. �err and �terr are 95% confidence bounds. A �t of0 indicates a null split. Based on transverse energy patterns, we believe four of our split estimates areincorrect. These are marked with an asterisk.
Results
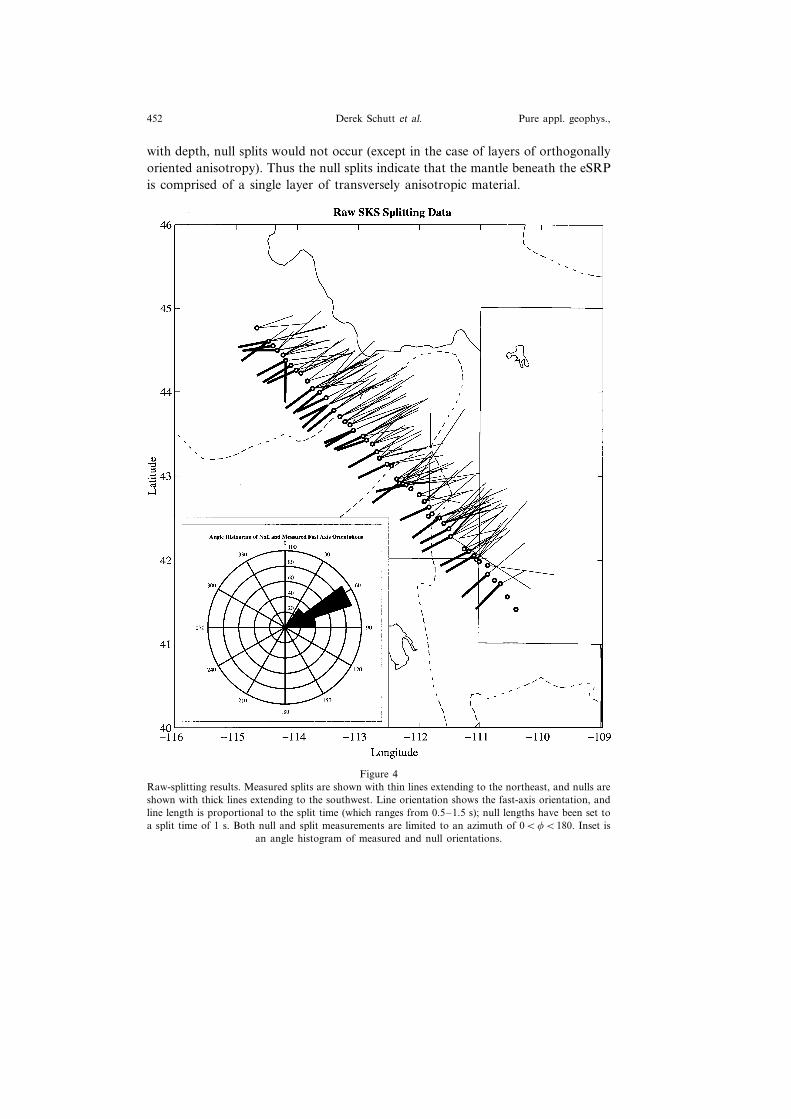
Results are tabulated in Table 1 and shown in Figure 4. Thin lines in this figureindicate the orientation and split time of the measured split; thick lines indicate theback azimuth of the null splits (their lengths have been scaled to 1.0 s). Fast axisorientations are nearly constant across the array, with little dependence on stationlocation or back azimuth. The angle histogram in Figure 4 emphasizes the narrowrange in fast axis orientation of about 30°.
The relative consistency in splitting parameters with back azimuth allows us todiscount Core Mantle Boundary (CMB) splitting as a source of the observed SKSsplits (because CMB splitting would produce split parameters that vary with backazimuth) and to conclude that there is no general trend of strongly dipping fast axesacross our array (also suggested by the absence of variation in split parameters withback azimuth, Fig. 5, SILVER and SAVAGE, 1994). This latter observation leads usto make the considered assumption that the fast axis is transverse in the eSRP.
The null splits, in addition to constraining the fast axis orientation into one offour orientation bands (Fig. 3—Bottom), offer important information on thesimplicity of the anisotropy orientation structure. If orientation structure varies
Derek Schutt et al.452 Pure appl. geophys.,
with depth, null splits would not occur (except in the case of layers of orthogonallyoriented anisotropy). Thus the null splits indicate that the mantle beneath the eSRPis comprised of a single layer of transversely anisotropic material.
Figure 4Raw-splitting results. Measured splits are shown with thin lines extending to the northeast, and nulls areshown with thick lines extending to the southwest. Line orientation shows the fast-axis orientation, andline length is proportional to the split time (which ranges from 0.5–1.5 s); null lengths have been set toa split time of 1 s. Both null and split measurements are limited to an azimuth of 0���180. Inset is
an angle histogram of measured and null orientations.
Anisotropy of the Yellowstone Hot Spot Wake 453Vol. 151, 1998
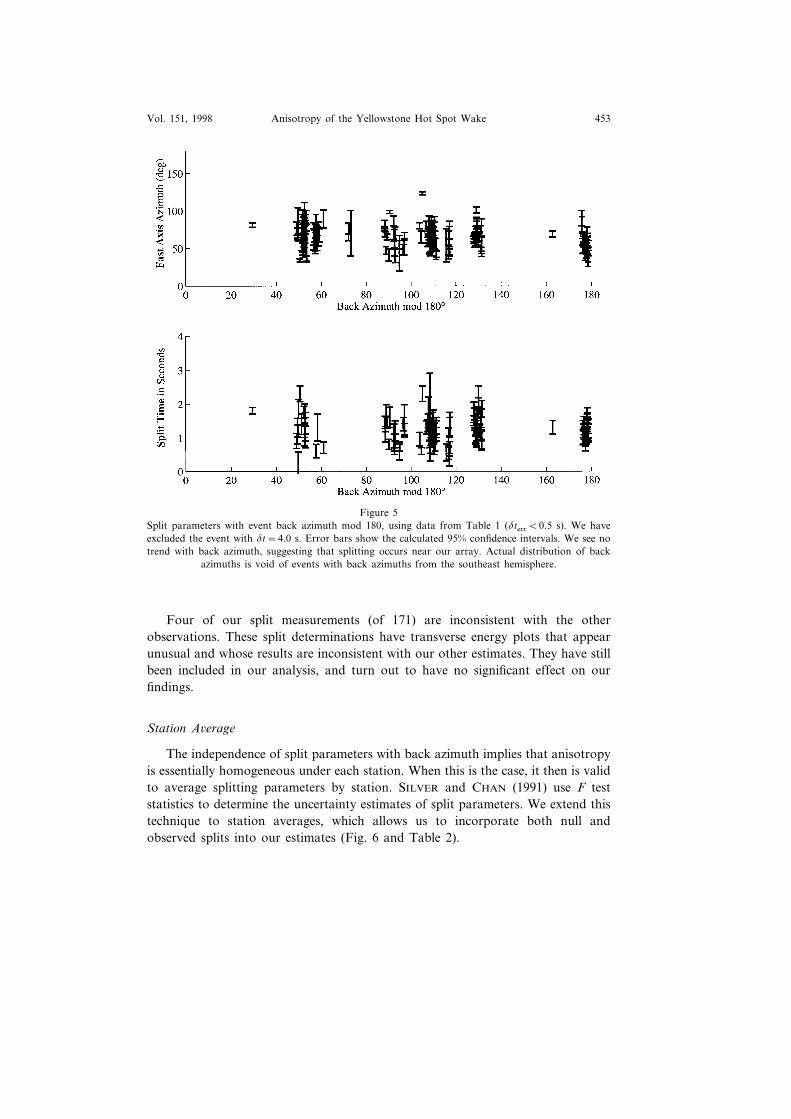
Figure 5Split parameters with event back azimuth mod 180, using data from Table 1 (�terr�0.5 s). We haveexcluded the event with �t=4.0 s. Error bars show the calculated 95% confidence intervals. We see notrend with back azimuth, suggesting that splitting occurs near our array. Actual distribution of back
azimuths is void of events with back azimuths from the southeast hemisphere.
Four of our split measurements (of 171) are inconsistent with the otherobservations. These split determinations have transverse energy plots that appearunusual and whose results are inconsistent with our other estimates. They have stillbeen included in our analysis, and turn out to have no significant effect on ourfindings.
Station A�erage
The independence of split parameters with back azimuth implies that anisotropyis essentially homogeneous under each station. When this is the case, it then is validto average splitting parameters by station. SILVER and CHAN (1991) use F teststatistics to determine the uncertainty estimates of split parameters. We extend thistechnique to station averages, which allows us to incorporate both null andobserved splits into our estimates (Fig. 6 and Table 2).
Derek Schutt et al.454 Pure appl. geophys.,
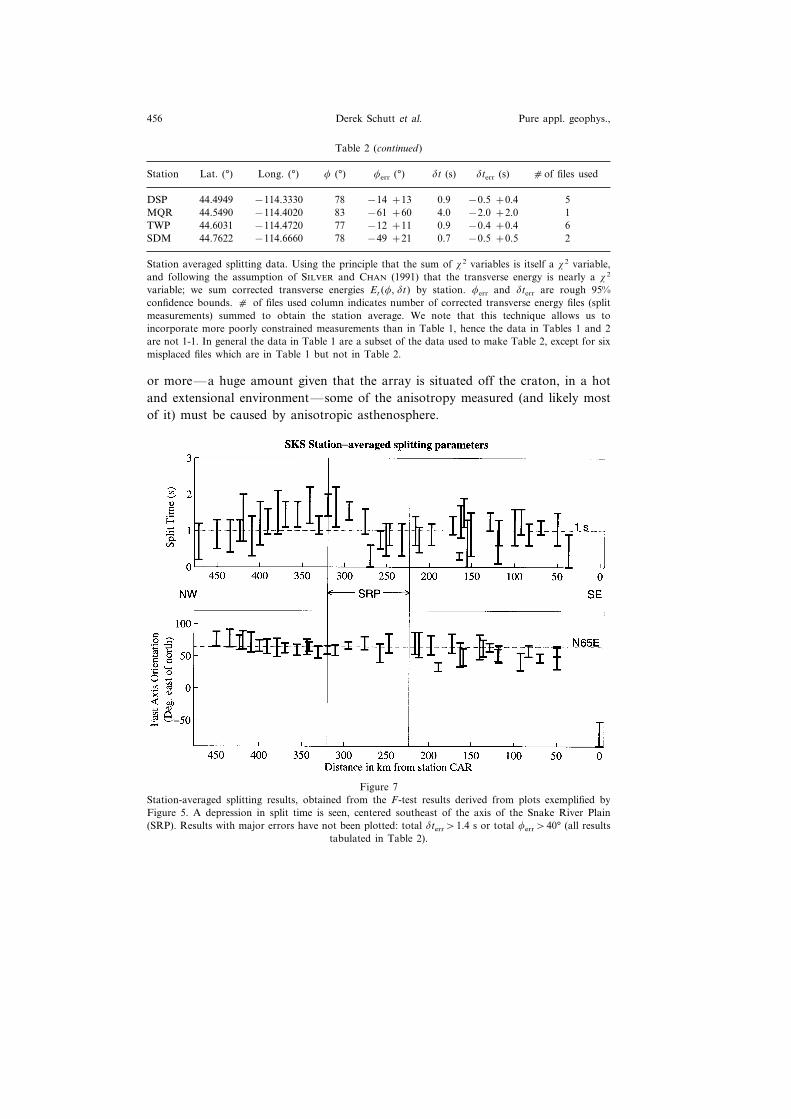
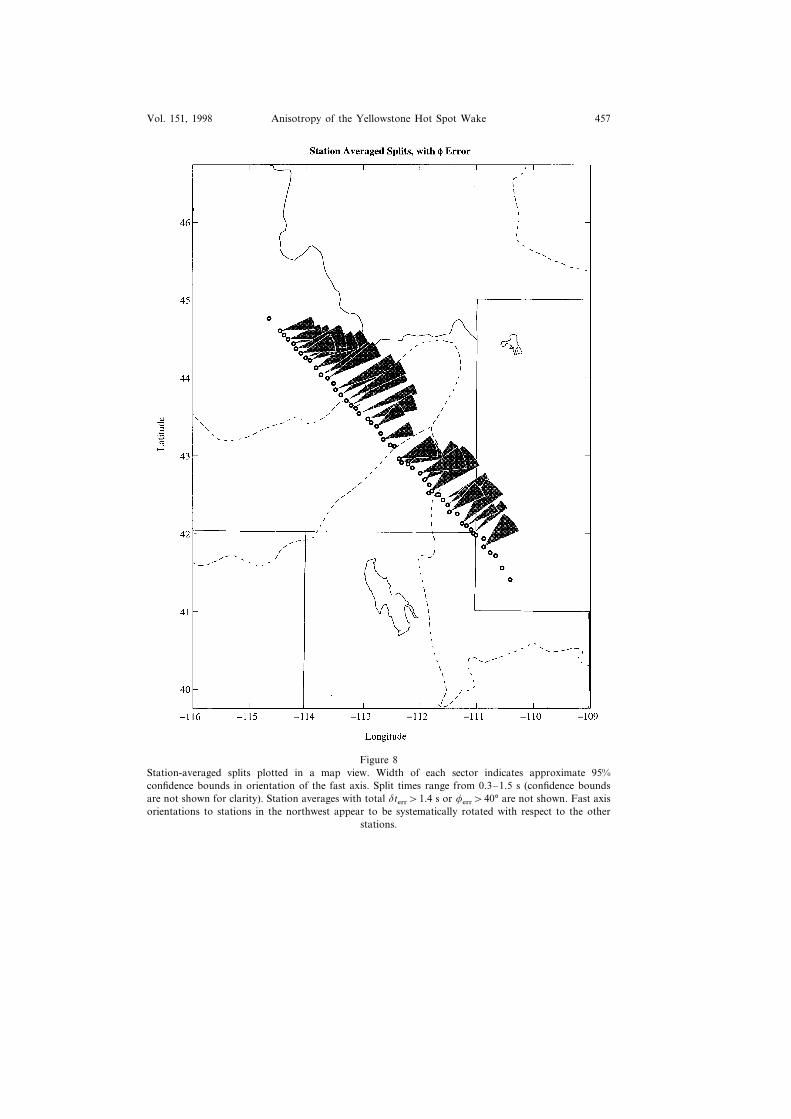
Figure 7 shows station averaged split parameters. Split time averages vary from0.5–1.5 s across the array, implying significant changes in either anisotropymagnitude or layer thickness across the array. In contrast, the orientations are quiteuniform, although the northernmost stations differ in orientation by a small butresolvable amount (Fig. 8).
Discussion
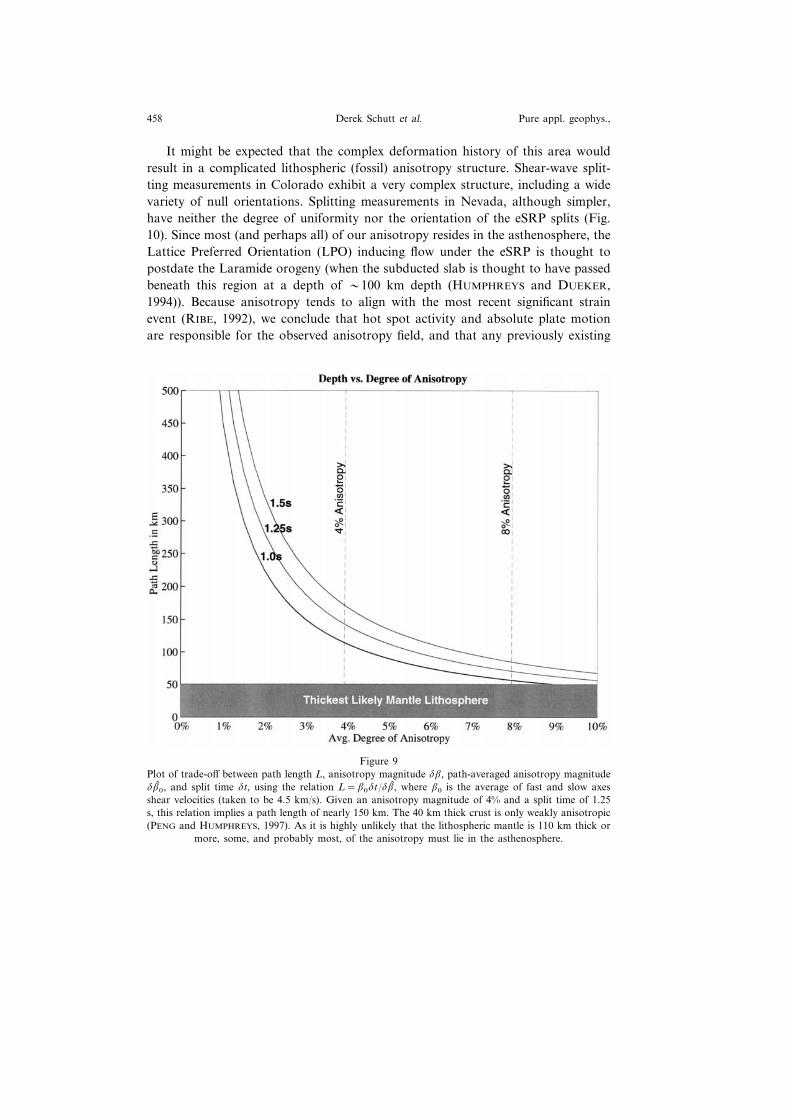
By considering the trade-off between path length through anisotropic materialand degree of anisotropy, we conclude that at least some of the observed anisotropyresides in the asthenosphere. For instance, an average anisotropy magnitude of 4%and a split time of 1.25 s implies a path length of nearly 150 km (Fig. 9). Usingreceiver functions, PENG and HUMPHREYS (1997) find the crust to be about 40 kmthick and not strongly anisotropic. Unless the lithospheric mantle is 110 km thick
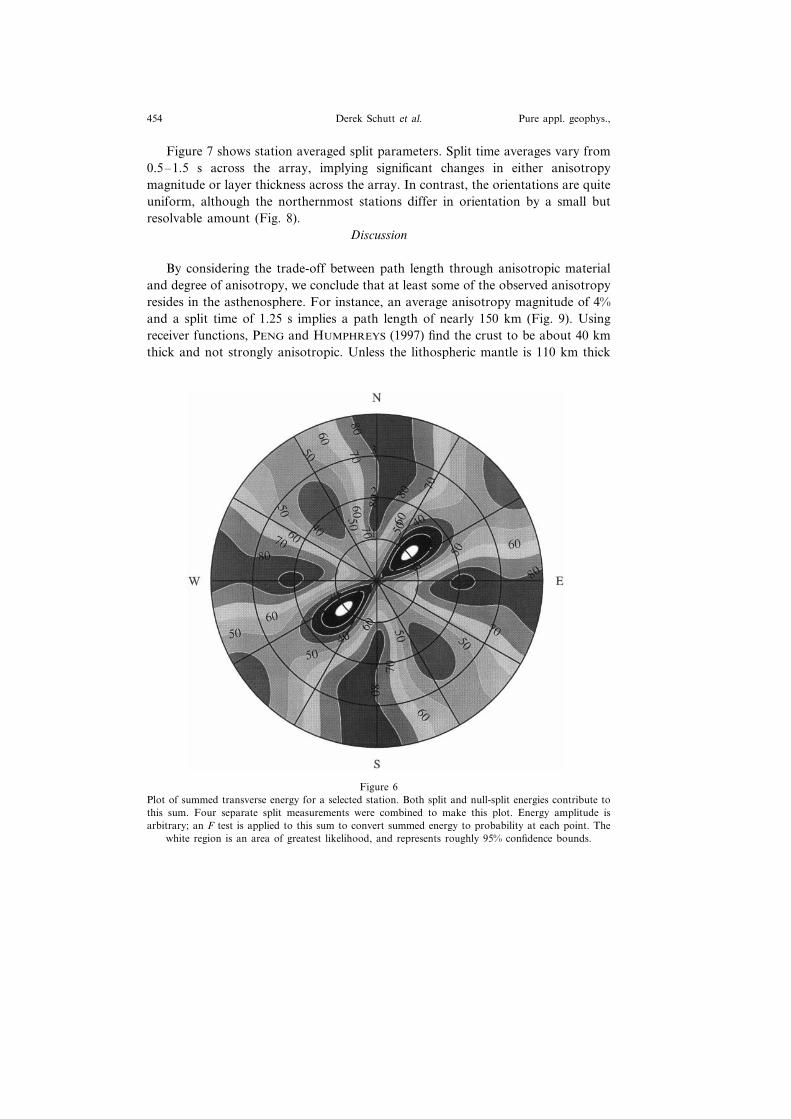
Figure 6Plot of summed transverse energy for a selected station. Both split and null-split energies contribute tothis sum. Four separate split measurements were combined to make this plot. Energy amplitude isarbitrary; an F test is applied to this sum to convert summed energy to probability at each point. The
white region is an area of greatest likelihood, and represents roughly 95% confidence bounds.
Anisotropy of the Yellowstone Hot Spot Wake 455Vol. 151, 1998
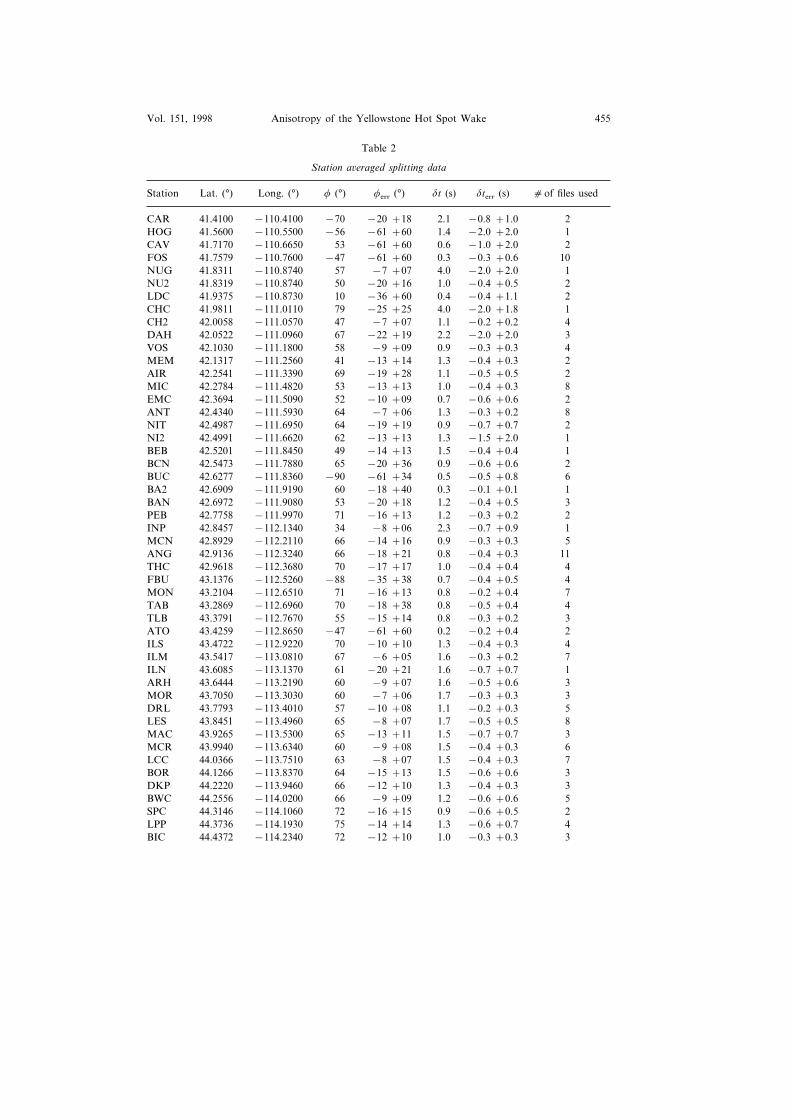
Table 2
Station a�eraged splitting data
Station Lat. (°) Long. (°) � (°) �err (°) �t (s) �terr (s) cof files used
CAR 41.4100 −110.4100 −70 −20 +18 2.1 −0.8 +1.0 2HOG 41.5600 −110.5500 −56 −61 +60 1.4 −2.0 +2.0 1CAV 41.7170 −110.6650 53 −61 +60 0.6 −1.0 +2.0 2FOS 41.7579 −110.7600 −47 −61 +60 0.3 −0.3 +0.6 10NUG 41.8311 −110.8740 57 −7 +07 4.0 −2.0 +2.0 1NU2 41.8319 −110.8740 50 −20 +16 1.0 −0.4 +0.5 2LDC 41.9375 −110.8730 10 −36 +60 0.4 −0.4 +1.1 2CHC 41.9811 −111.0110 79 −25 +25 4.0 −2.0 +1.8 1CH2 42.0058 −111.0570 47 −7 +07 1.1 −0.2 +0.2 4DAH 42.0522 −111.0960 67 −22 +19 2.2 −2.0 +2.0 3VOS 42.1030 −111.1800 58 −9 +09 0.9 −0.3 +0.3 4MEM 42.1317 −111.2560 41 −13 +14 1.3 −0.4 +0.3 2AIR 42.2541 −111.3390 69 −19 +28 1.1 −0.5 +0.5 2MIC 42.2784 −111.4820 53 −13 +13 1.0 −0.4 +0.3 8EMC 42.3694 −111.5090 52 −10 +09 0.7 −0.6 +0.6 2ANT 42.4340 −111.5930 64 −7 +06 1.3 −0.3 +0.2 8NIT 42.4987 −111.6950 64 −19 +19 0.9 −0.7 +0.7 2NI2 42.4991 −111.6620 62 −13 +13 1.3 −1.5 +2.0 1BEB 42.5201 −111.8450 49 −14 +13 1.5 −0.4 +0.4 1BCN 42.5473 −111.7880 65 −20 +36 0.9 −0.6 +0.6 2BUC 42.6277 −111.8360 −90 −61 +34 0.5 −0.5 +0.8 6BA2 42.6909 −111.9190 60 −18 +40 0.3 −0.1 +0.1 1BAN 42.6972 −111.9080 53 −20 +18 1.2 −0.4 +0.5 3PEB 42.7758 −111.9970 71 −16 +13 1.2 −0.3 +0.2 2INP 42.8457 −112.1340 34 −8 +06 2.3 −0.7 +0.9 1MCN 42.8929 −112.2110 66 −14 +16 0.9 −0.3 +0.3 5ANG 42.9136 −112.3240 66 −18 +21 0.8 −0.4 +0.3 11THC 42.9618 −112.3680 70 −17 +17 1.0 −0.4 +0.4 4FBU 43.1376 −112.5260 −88 −35 +38 0.7 −0.4 +0.5 4MON 43.2104 −112.6510 71 −16 +13 0.8 −0.2 +0.4 7TAB 43.2869 −112.6960 70 −18 +38 0.8 −0.5 +0.4 4TLB 43.3791 −112.7670 55 −15 +14 0.8 −0.3 +0.2 3ATO 43.4259 −112.8650 −47 −61 +60 0.2 −0.2 +0.4 2ILS 43.4722 −112.9220 70 −10 +10 1.3 −0.4 +0.3 4ILM 43.5417 −113.0810 67 −6 +05 1.6 −0.3 +0.2 7ILN 43.6085 −113.1370 61 −20 +21 1.6 −0.7 +0.7 1ARH 43.6444 −113.2190 60 −9 +07 1.6 −0.5 +0.6 3MOR 43.7050 −113.3030 60 −7 +06 1.7 −0.3 +0.3 3DRL 43.7793 −113.4010 57 −10 +08 1.1 −0.2 +0.3 5LES 43.8451 −113.4960 65 −8 +07 1.7 −0.5 +0.5 8MAC 43.9265 −113.5300 65 −13 +11 1.5 −0.7 +0.7 3MCR 43.9940 −113.6340 60 −9 +08 1.5 −0.4 +0.3 6LCC 44.0366 −113.7510 63 −8 +07 1.5 −0.4 +0.3 7BOR 44.1266 −113.8370 64 −15 +13 1.5 −0.6 +0.6 3DKP 44.2220 −113.9460 66 −12 +10 1.3 −0.4 +0.3 3BWC 44.2556 −114.0200 66 −9 +09 1.2 −0.6 +0.6 5SPC 44.3146 −114.1060 72 −16 +15 0.9 −0.6 +0.5 2LPP 44.3736 −114.1930 75 −14 +14 1.3 −0.6 +0.7 4BIC 44.4372 −114.2340 72 −12 +10 1.0 −0.3 +0.3 3
Derek Schutt et al.456 Pure appl. geophys.,
Table 2 (continued)
Station Lat. (°) Long. (°) � (°) �err (°) �t (s) �terr (s) cof files used
DSP 44.4949 −114.3330 78 −14 +13 0.9 −0.5 +0.4 5MQR 44.5490 −114.4020 83 −61 +60 4.0 −2.0 +2.0 1TWP 44.6031 −114.4720 77 −12 +11 0.9 −0.4 +0.4 6SDM 44.7622 −114.6660 78 −49 +21 0.7 −0.5 +0.5 2
Station averaged splitting data. Using the principle that the sum of �2 variables is itself a �2 variable,and following the assumption of SILVER and CHAN (1991) that the transverse energy is nearly a �2
variable; we sum corrected transverse energies Et (�, �t) by station. �err and �terr are rough 95%confidence bounds. c of files used column indicates number of corrected transverse energy files (splitmeasurements) summed to obtain the station average. We note that this technique allows us toincorporate more poorly constrained measurements than in Table 1, hence the data in Tables 1 and 2are not 1-1. In general the data in Table 1 are a subset of the data used to make Table 2, except for sixmisplaced files which are in Table 1 but not in Table 2.
or more—a huge amount given that the array is situated off the craton, in a hotand extensional environment—some of the anisotropy measured (and likely mostof it) must be caused by anisotropic asthenosphere.
Figure 7Station-averaged splitting results, obtained from the F-test results derived from plots exemplified byFigure 5. A depression in split time is seen, centered southeast of the axis of the Snake River Plain(SRP). Results with major errors have not been plotted: total �terr�1.4 s or total �err�40° (all results
tabulated in Table 2).
Anisotropy of the Yellowstone Hot Spot Wake 457Vol. 151, 1998
Figure 8Station-averaged splits plotted in a map view. Width of each sector indicates approximate 95%confidence bounds in orientation of the fast axis. Split times range from 0.3–1.5 s (confidence boundsare not shown for clarity). Station averages with total �terr�1.4 s or �err�40° are not shown. Fast axisorientations to stations in the northwest appear to be systematically rotated with respect to the other
stations.
Derek Schutt et al.458 Pure appl. geophys.,
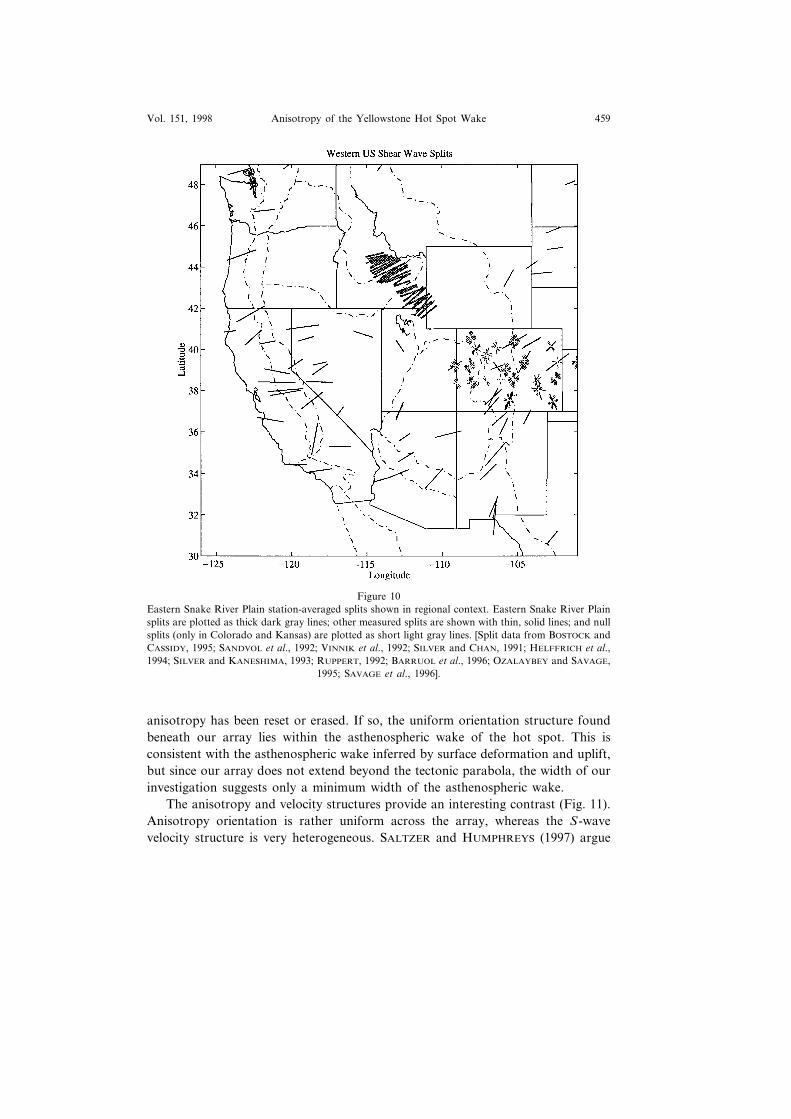
It might be expected that the complex deformation history of this area wouldresult in a complicated lithospheric (fossil) anisotropy structure. Shear-wave split-ting measurements in Colorado exhibit a very complex structure, including a widevariety of null orientations. Splitting measurements in Nevada, although simpler,have neither the degree of uniformity nor the orientation of the eSRP splits (Fig.10). Since most (and perhaps all) of our anisotropy resides in the asthenosphere, theLattice Preferred Orientation (LPO) inducing flow under the eSRP is thought topostdate the Laramide orogeny (when the subducted slab is thought to have passedbeneath this region at a depth of �100 km depth (HUMPHREYS and DUEKER,1994)). Because anisotropy tends to align with the most recent significant strainevent (RIBE, 1992), we conclude that hot spot activity and absolute plate motionare responsible for the observed anisotropy field, and that any previously existing
Figure 9Plot of trade-off between path length L, anisotropy magnitude ��, path-averaged anisotropy magnitude��� 0, and split time �t, using the relation L=�0�t/��� , where �0 is the average of fast and slow axesshear velocities (taken to be 4.5 km/s). Given an anisotropy magnitude of 4% and a split time of 1.25s, this relation implies a path length of nearly 150 km. The 40 km thick crust is only weakly anisotropic(PENG and HUMPHREYS, 1997). As it is highly unlikely that the lithospheric mantle is 110 km thick or
more, some, and probably most, of the anisotropy must lie in the asthenosphere.
Anisotropy of the Yellowstone Hot Spot Wake 459Vol. 151, 1998
Figure 10Eastern Snake River Plain station-averaged splits shown in regional context. Eastern Snake River Plainsplits are plotted as thick dark gray lines; other measured splits are shown with thin, solid lines; and nullsplits (only in Colorado and Kansas) are plotted as short light gray lines. [Split data from BOSTOCK andCASSIDY, 1995; SANDVOL et al., 1992; VINNIK et al., 1992; SILVER and CHAN, 1991; HELFFRICH et al.,1994; SILVER and KANESHIMA, 1993; RUPPERT, 1992; BARRUOL et al., 1996; OZALAYBEY and SAVAGE,
1995; SAVAGE et al., 1996].
anisotropy has been reset or erased. If so, the uniform orientation structure foundbeneath our array lies within the asthenospheric wake of the hot spot. This isconsistent with the asthenospheric wake inferred by surface deformation and uplift,but since our array does not extend beyond the tectonic parabola, the width of ourinvestigation suggests only a minimum width of the asthenospheric wake.
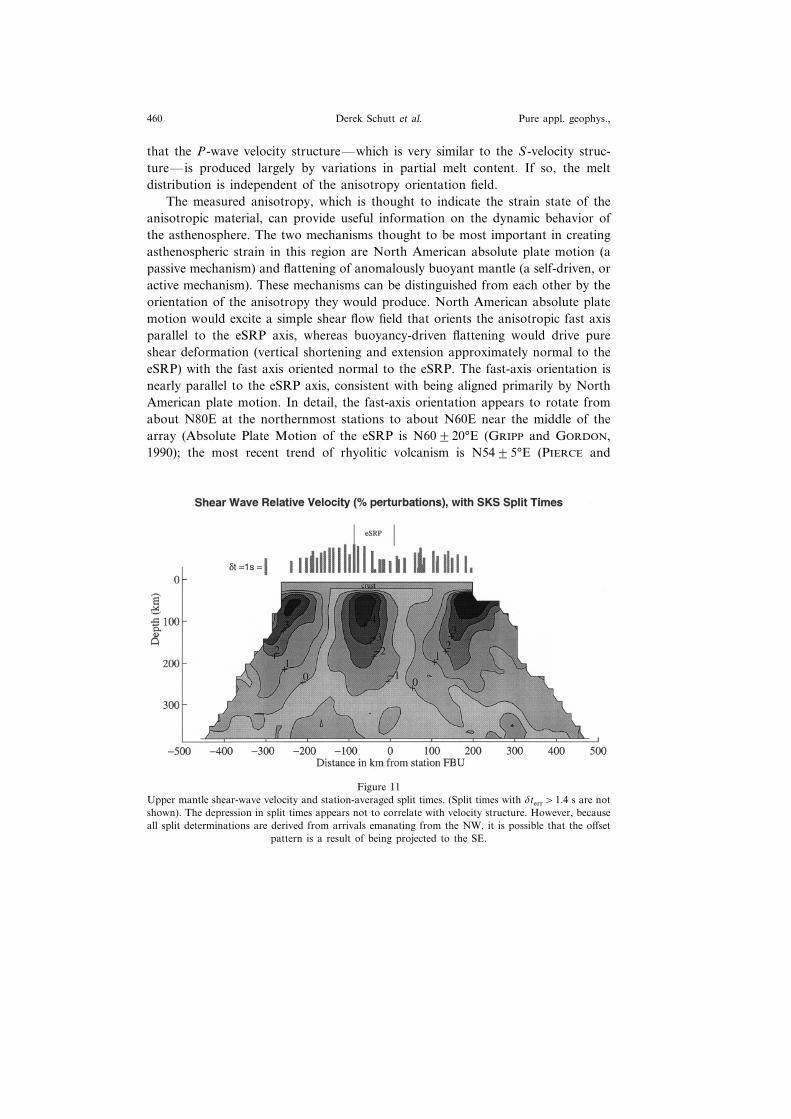
The anisotropy and velocity structures provide an interesting contrast (Fig. 11).Anisotropy orientation is rather uniform across the array, whereas the S-wavevelocity structure is very heterogeneous. SALTZER and HUMPHREYS (1997) argue
Derek Schutt et al.460 Pure appl. geophys.,
that the P-wave velocity structure—which is very similar to the S-velocity struc-ture—is produced largely by variations in partial melt content. If so, the meltdistribution is independent of the anisotropy orientation field.
The measured anisotropy, which is thought to indicate the strain state of theanisotropic material, can provide useful information on the dynamic behavior ofthe asthenosphere. The two mechanisms thought to be most important in creatingasthenospheric strain in this region are North American absolute plate motion (apassive mechanism) and flattening of anomalously buoyant mantle (a self-driven, oractive mechanism). These mechanisms can be distinguished from each other by theorientation of the anisotropy they would produce. North American absolute platemotion would excite a simple shear flow field that orients the anisotropic fast axisparallel to the eSRP axis, whereas buoyancy-driven flattening would drive pureshear deformation (vertical shortening and extension approximately normal to theeSRP) with the fast axis oriented normal to the eSRP. The fast-axis orientation isnearly parallel to the eSRP axis, consistent with being aligned primarily by NorthAmerican plate motion. In detail, the fast-axis orientation appears to rotate fromabout N80E at the northernmost stations to about N60E near the middle of thearray (Absolute Plate Motion of the eSRP is N60�20°E (GRIPP and GORDON,1990); the most recent trend of rhyolitic volcanism is N54�5°E (PIERCE and
Figure 11Upper mantle shear-wave velocity and station-averaged split times. (Split times with �terr�1.4 s are notshown). The depression in split times appears not to correlate with velocity structure. However, becauseall split determinations are derived from arrivals emanating from the NW, it is possible that the offset
pattern is a result of being projected to the SE.
Anisotropy of the Yellowstone Hot Spot Wake 461Vol. 151, 1998
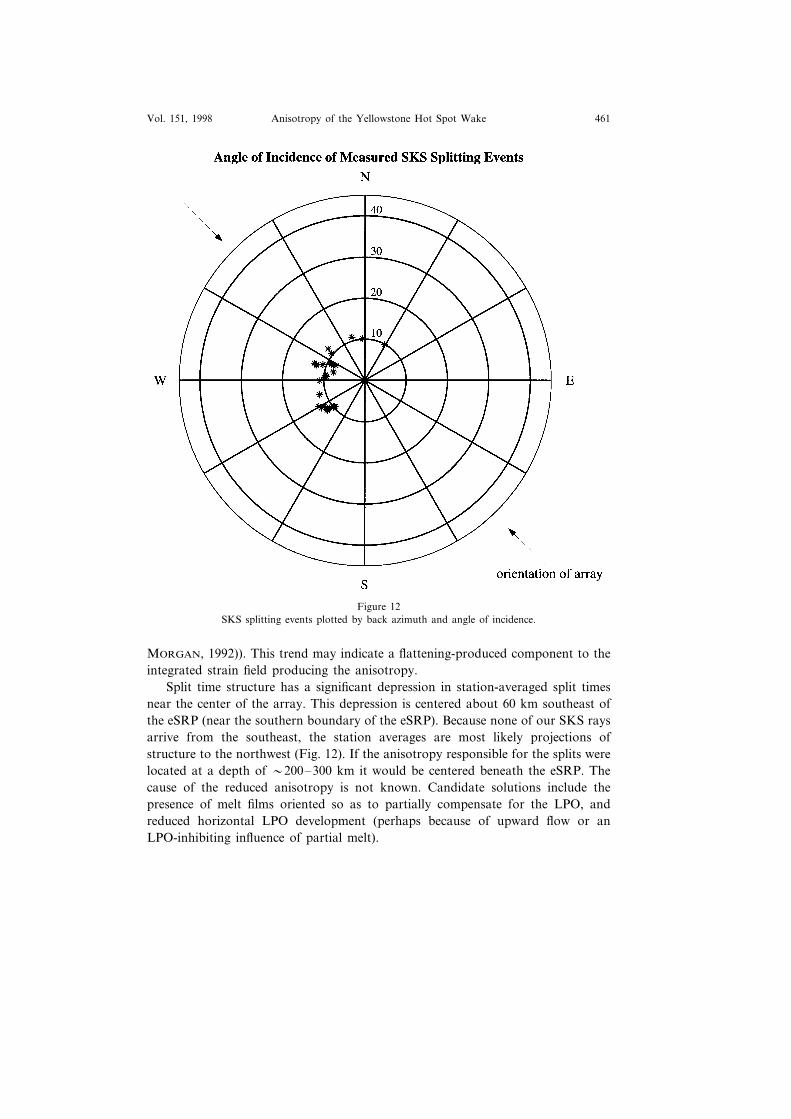
Figure 12SKS splitting events plotted by back azimuth and angle of incidence.
MORGAN, 1992)). This trend may indicate a flattening-produced component to theintegrated strain field producing the anisotropy.
Split time structure has a significant depression in station-averaged split timesnear the center of the array. This depression is centered about 60 km southeast ofthe eSRP (near the southern boundary of the eSRP). Because none of our SKS raysarrive from the southeast, the station averages are most likely projections ofstructure to the northwest (Fig. 12). If the anisotropy responsible for the splits werelocated at a depth of �200–300 km it would be centered beneath the eSRP. Thecause of the reduced anisotropy is not known. Candidate solutions include thepresence of melt films oriented so as to partially compensate for the LPO, andreduced horizontal LPO development (perhaps because of upward flow or anLPO-inhibiting influence of partial melt).
Derek Schutt et al.462 Pure appl. geophys.,
REFERENCES
ANDERS, M. H., and SLEEP, N. M. (1992), Lithospheric Strengthening by Magmatic Intrusion, Thermaland Mechanical Effects of the Yellowstone Hotspot, J. Geophys. Res. 97, 15,379–15,394.
BARRUOL, G., SILVER, P. G., and VAUCHEZ, A. (1996), Seismic Anisotropy in the Eastern United States;Deep Structure of a Complex Continental Plate, J. Geophys. Res. 102, 8329–8348.
BOSTOCK, M. G., and CASSIDY, J. F. (1995), Variations in SKS Splitting Across the Canadian NationalSeismic Network, Geophys. Res. Lett. 22, 5–8.
GRIPP, A. E., and GORDON, R. G. (1990), Current Plate Velocities Relati�e to the Hotspots Incorporatingthe NUVEL-1 Global Plate Motion Model, Geophys. Res. Lett. 17, 1109–1112.
HEARN, E. H., KENNEDY, B. M., and TREUSDELL, A. H. (1990), Coupled Variations in Helium Isotopesand Fluid Chemistry: Shoshone Geyser Basin, Yellowstone, Geochimica et Cosmochemica Acta 54,3103–3113.
HELFFRICH, G., SILVER, P. G., and GIVEN, H. (1994), Shear-wa�e Splitting Variation o�er Short SpatialScales on Continents, Geophys. J. Int. 119, 561–573.
HUMPHREYS, E. D., and DUEKER, K. G. (1994), Physical State of the Western US Upper Mantle, J.Geophys. Res. 99, 9635–9650.
MILBERT, D. G. (1991), GEOID90: A High-resolution Geoid for the United States, EOS, Trans. Am.Geophys. Union 72, 49.
OZALAYBEY, S., and SAVAGE, M. K. (1995), Shear-wa�e Splitting beneath Western United States inRelation to Plate Tectonics, J. Geophys. Res. 100, 18,135–18,149.
PENG, X., and HUMPHREYS, E. (1997), Crustal Velocity Structure of the Eastern Snake Ri�er Plain, J.Geophys. Res., in press.
PIERCE, K. L., and MORGAN, L. A. (1992), The Track of the Yellowstone Hot Spot: Volcanism, Faulting,and Uplift, Memoir-Geological Soc. Am. 179, 1–53.
RIBE, N. M. (1992), On the Relation between Seismic Anisotropy and Finite Strain, J. Geophys. Res. 97,8737–8747.
RIBE, N. M., and CHRISTENSEN, U. (1994), Dynamical Modeling of Plume-lithosphere Interaction, J.Geophys. Res. 99, 669–682.
RUPPERT, S. (1992), Tectonics of Western North America: A Teleseismic View, Ph.D. Thesis, StanfordUniv., 216 pp.
SALTZER, R. and HUMPHREYS, E. (1997), Upper Mantle P-wa�e Velocity Structure of the Eastern SnakeRi�er Plain and its Relationship to Geodynamics Models of the Region, J. Geophys. Res. 102,11829–11842.
SANDVOL, E., NI, J., OZALAYBEY, S., and SCHUE, J. (1992), Shear-wa�e Splitting in the Rio Grande Rift,Geophys. Res. Lett. 2 19, 2337–2340.
SAVAGE, M. K., SHEEHAN, A. F., and LERNER-LAM, A. (1996), Shear-wa�e Splitting across the RockyMountain Front, Geophys. Res. Lett. 23, 2267–2270.
SILVER, P. G., and CHAN, W. W. (1991), Shear-wa�e Splitting and Subcontinental Mantle Deformation,J. Geophys. Res. 96, 16429–16454.
SILVER, P. G., and KANESHIMA, S. (1993), Constraints on Mantle Anisotropy beneath Precambrian NorthAmerica from a Transportable Teleseismic Experiment, Geophys. Res. Lett. 20, 1127–1130.
SILVER, P. G., and SAVAGE, M. K. (1994), The Interpretation of Shear-wa�e Splitting Parameters in thePresence of Two Anisotropic Layers, Geophys. J. Int. 119, 949–963.
SMITH, R. B., and BRAILE, L. W. (1994), The Yellowstone Hotspot, J. Volc. Geotherm. Res. 61,121–188.
SPARLIN, M. A., BRAILE, L. W., and SMITH, R. B. (1982), Crustal Structure of the Eastern Snake Ri�erPlain Determined from Ray Trace Modeling of Seismic Refraction Data (Idaho), J. Geophys. Res. 87,2619–2633.
VINNIK, L. P., MAKEYEVA, L. I., MILEV, A., and USENKO, Y. (1992), Global Patterns of AzimuthalAnisotropy and Deformation in the Continental Mantle, Geophys. J. Int. 111, 433–447.
(Received October 14, 1996, revised April 29, 1997, accepted June 18, 1997)
Related Documents