Animated fan chart for GDP growth: August 2010 • As a part of his March 2010 speech to the Royal Society , the Governor showed an animated version of the February 2010 inflation fan chart. • This slideshow presents the equivalent animation for the August 2010 projection for GDP growth conditioned on market interest rate expectations and £200 billion of asset purchases. • Press any key to begin the animation.

Animated fan chart for GDP growth: August 2010 As a part of his March 2010 speech to the Royal Society, the Governor showed an animated version of the.
Dec 22, 2015
Welcome message from author
This document is posted to help you gain knowledge. Please leave a comment to let me know what you think about it! Share it to your friends and learn new things together.
Transcript
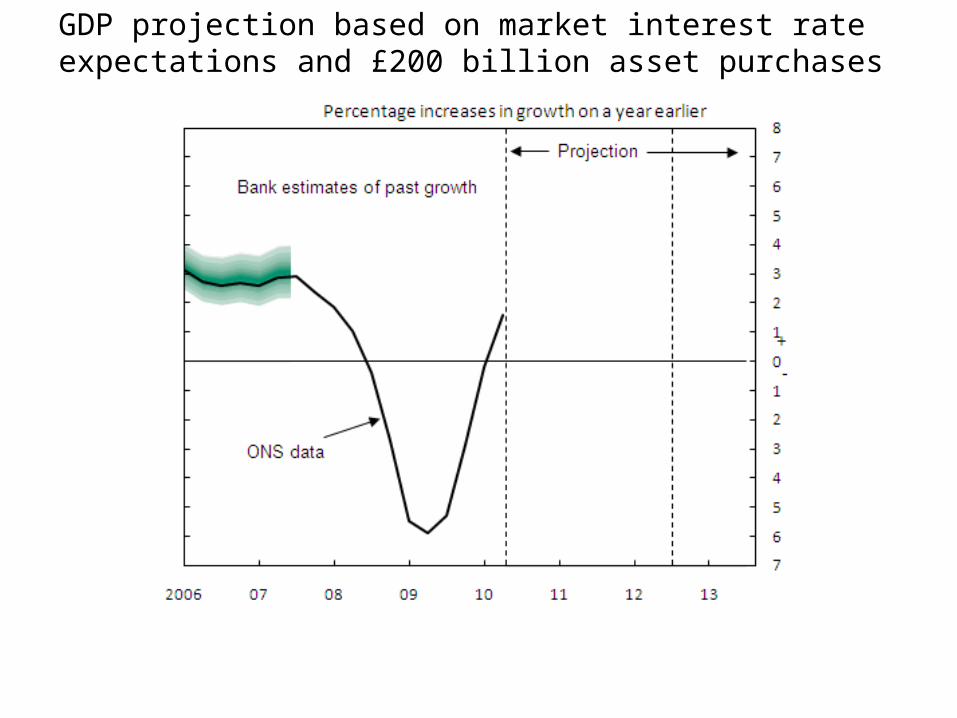
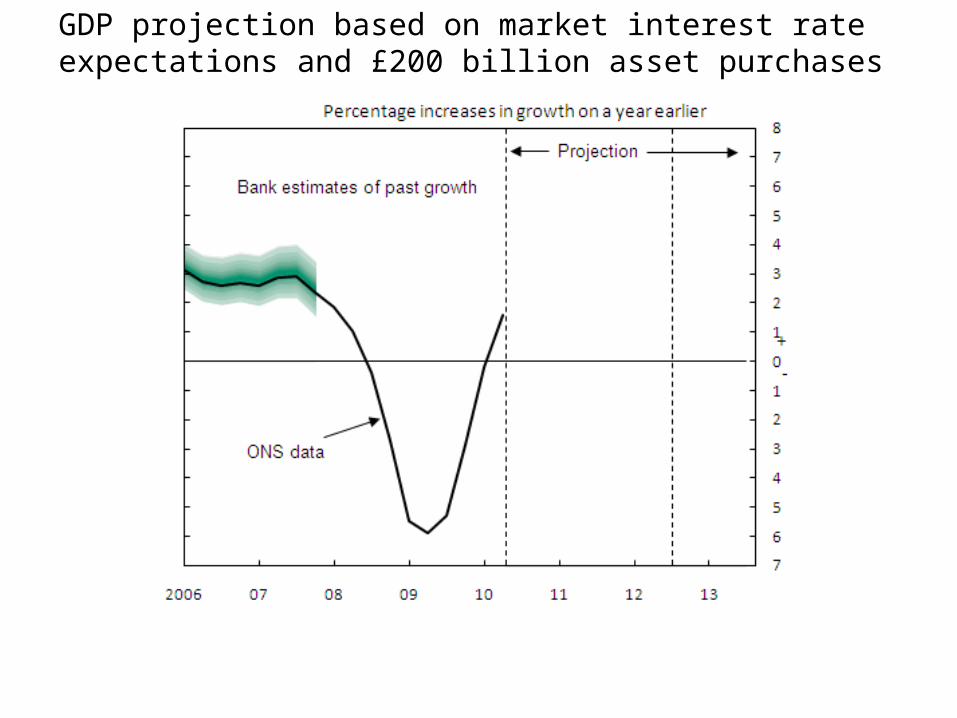
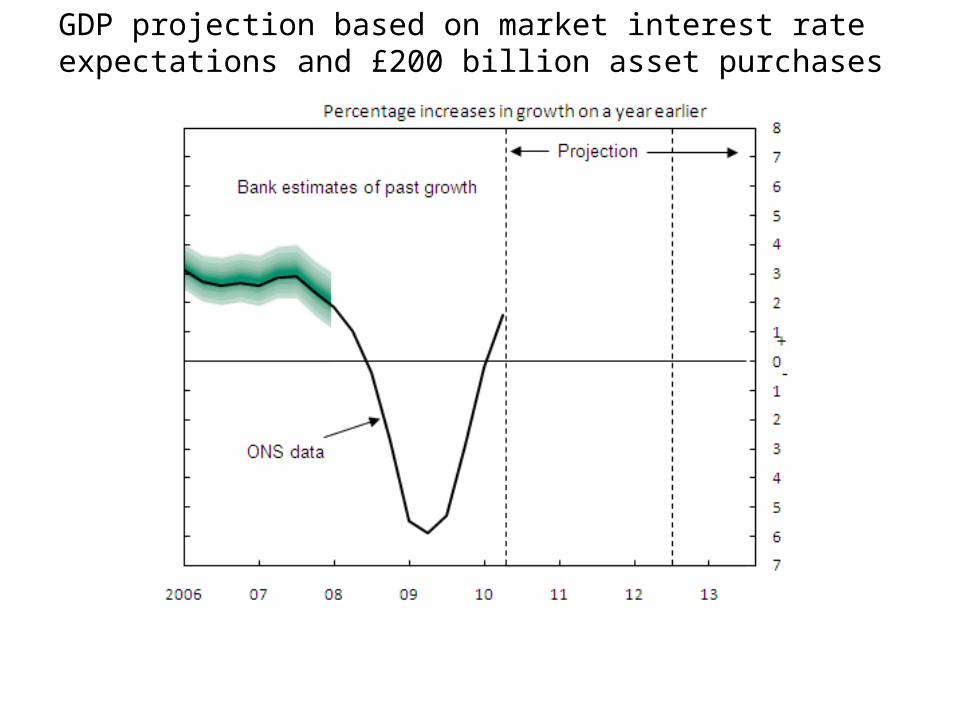
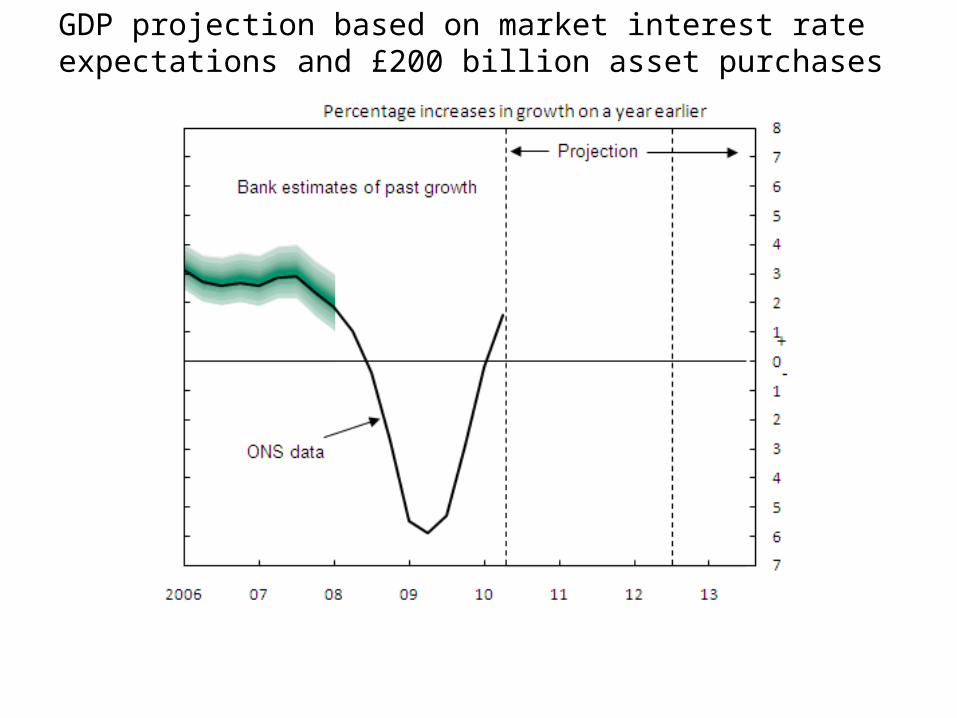
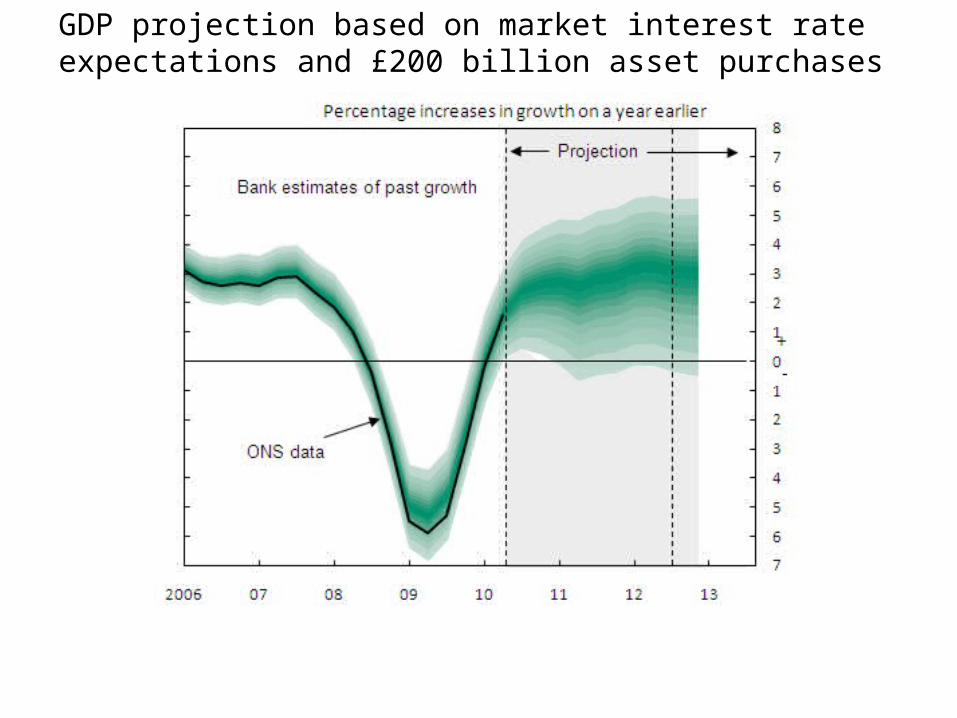
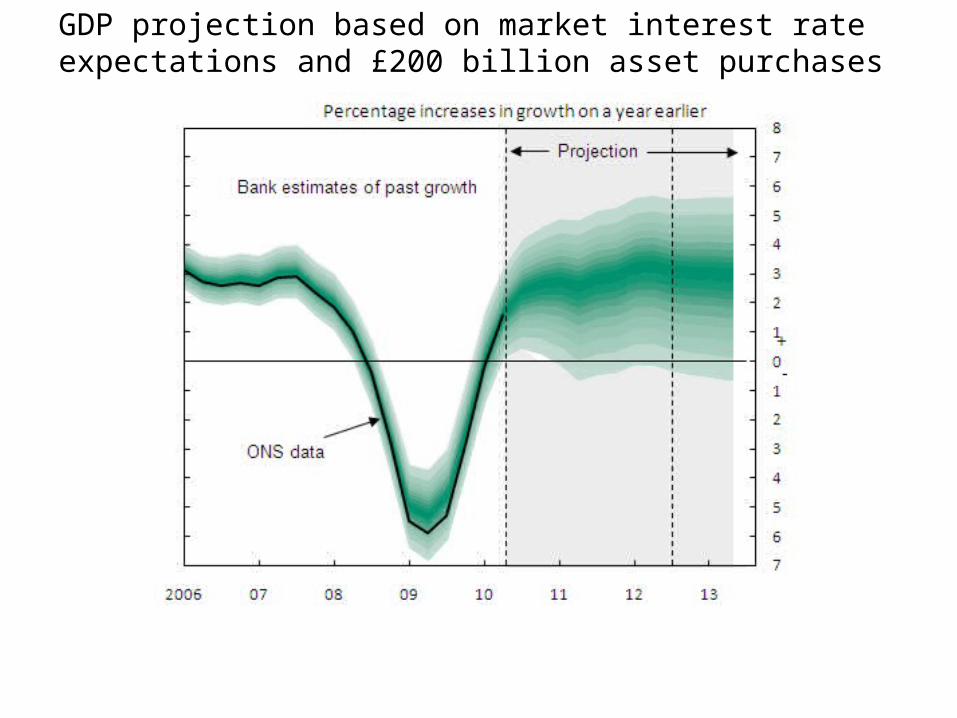
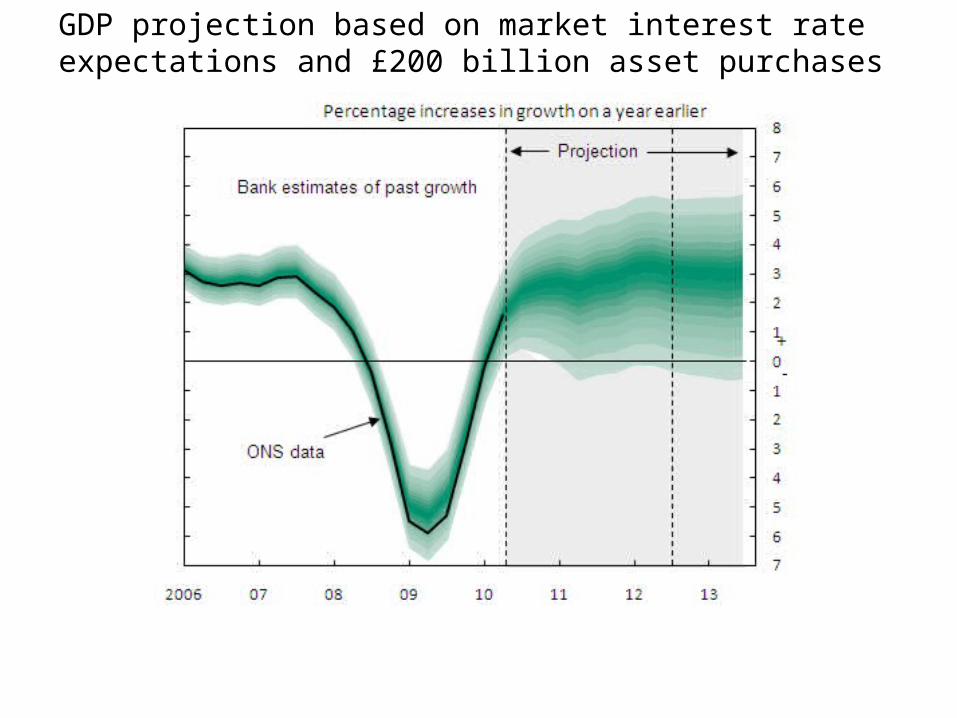
Animated fan chart for GDP growth: August 2010
• As a part of his March 2010 speech to the Royal Society, the Governor showed an animated
version of the February 2010 inflation fan chart.
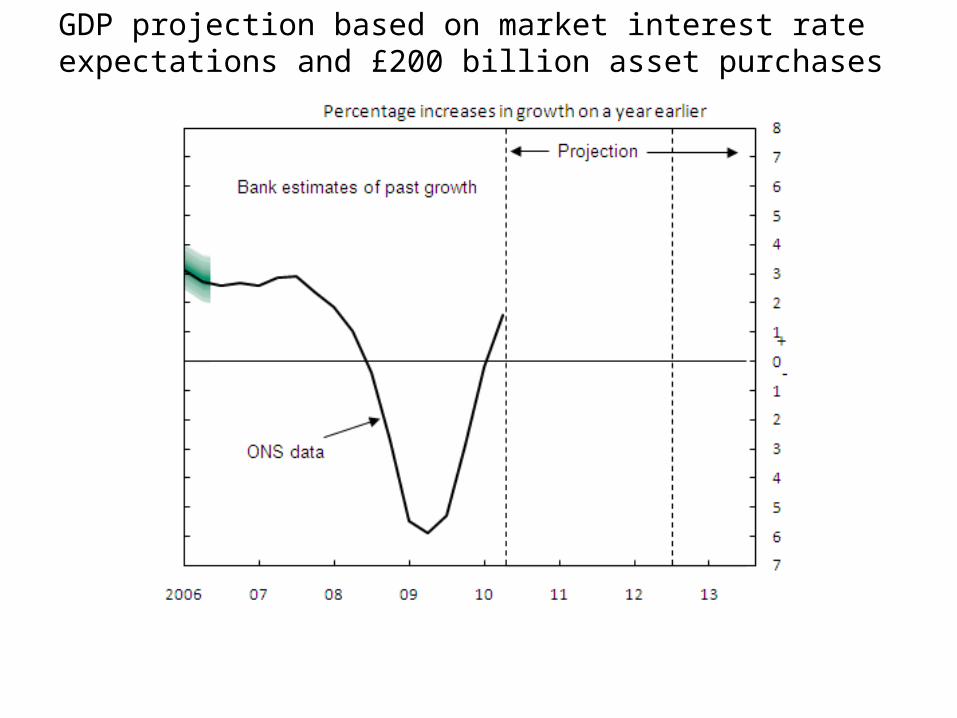
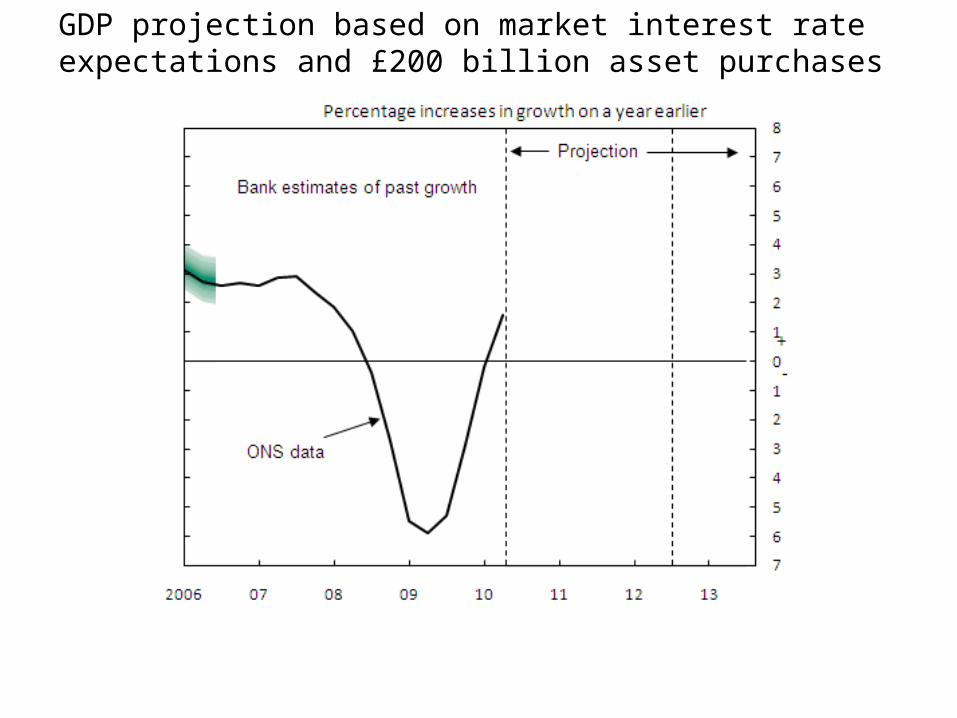
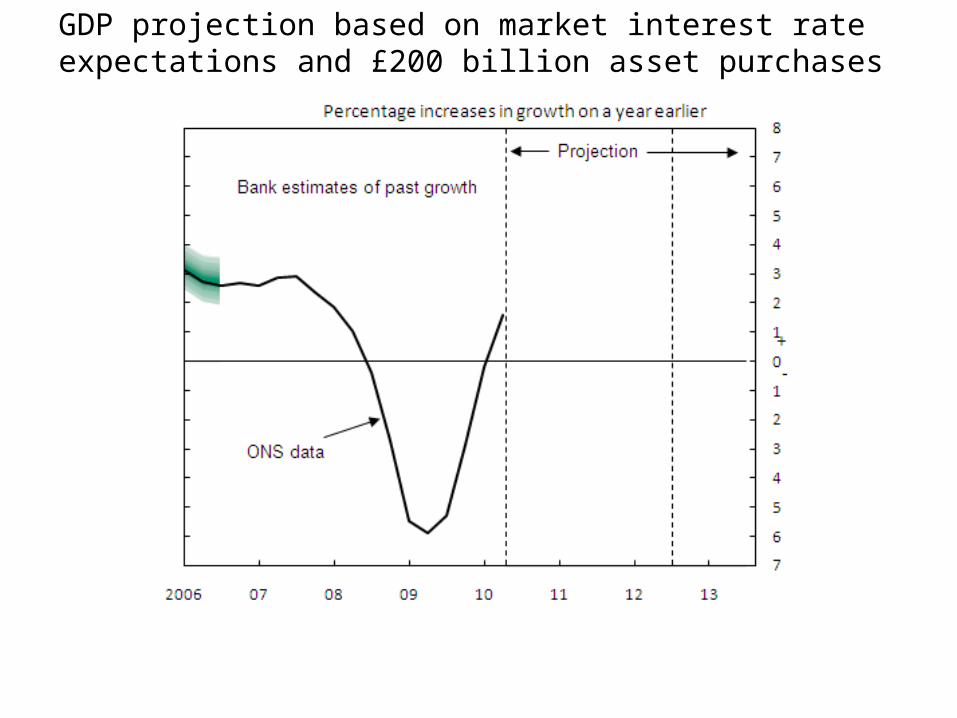
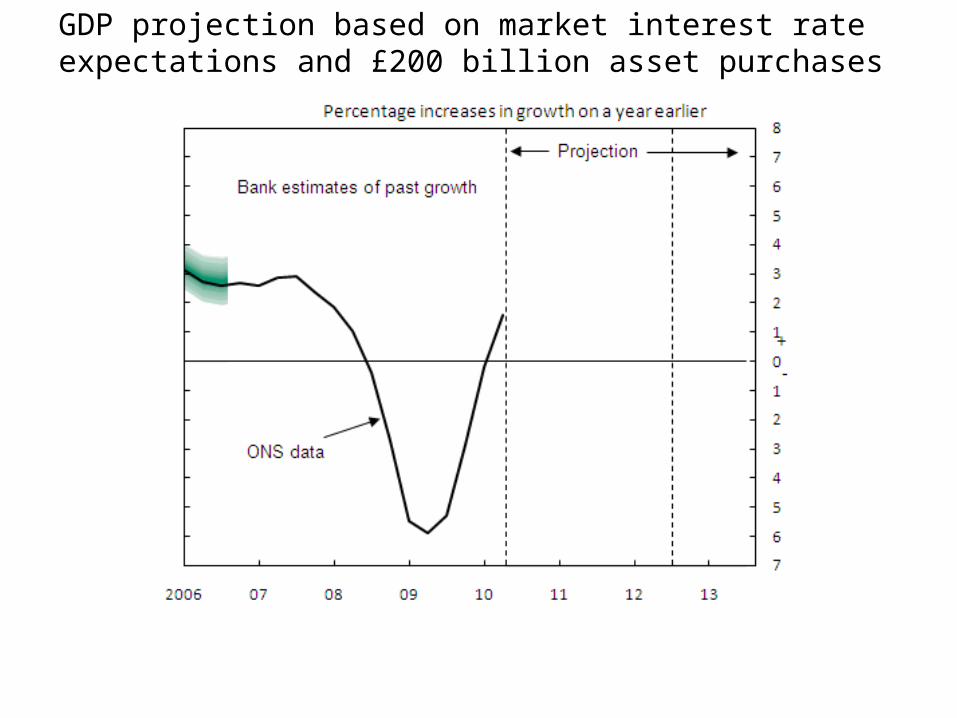
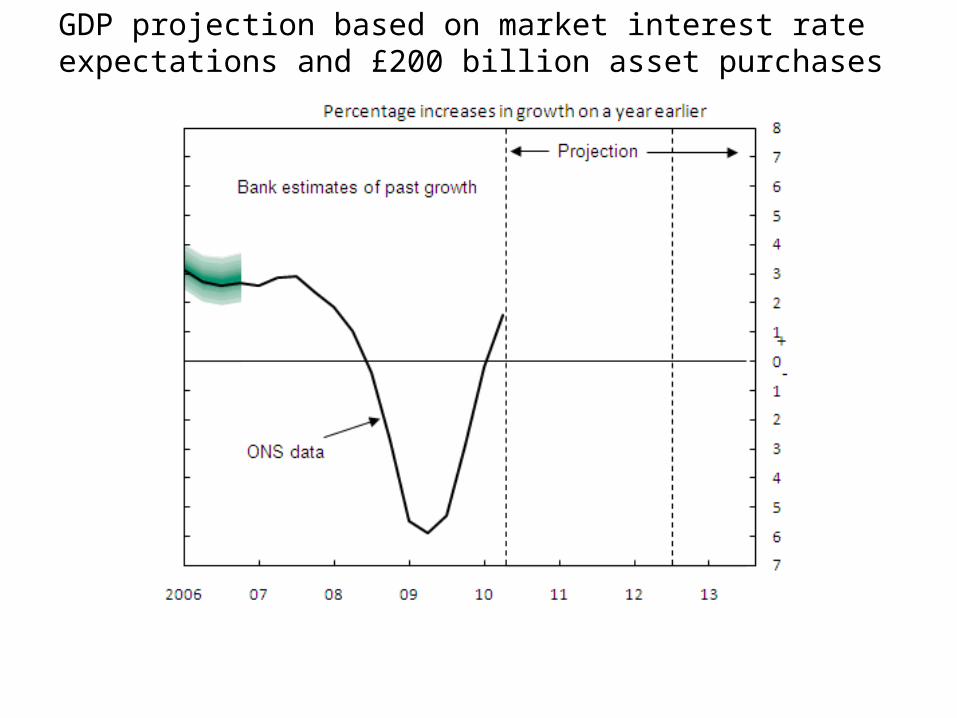
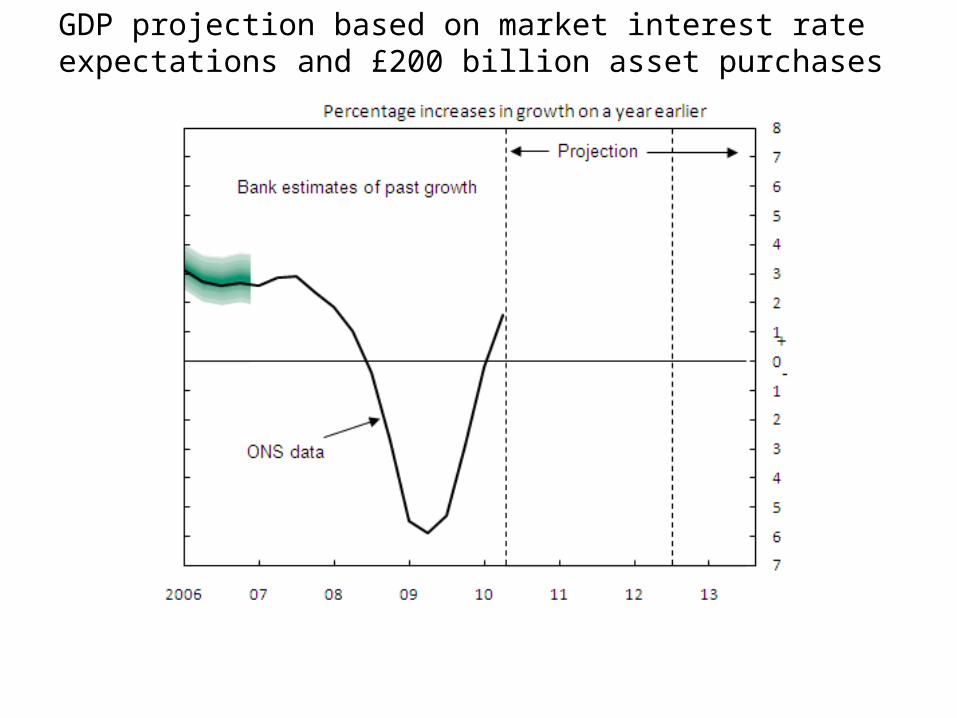
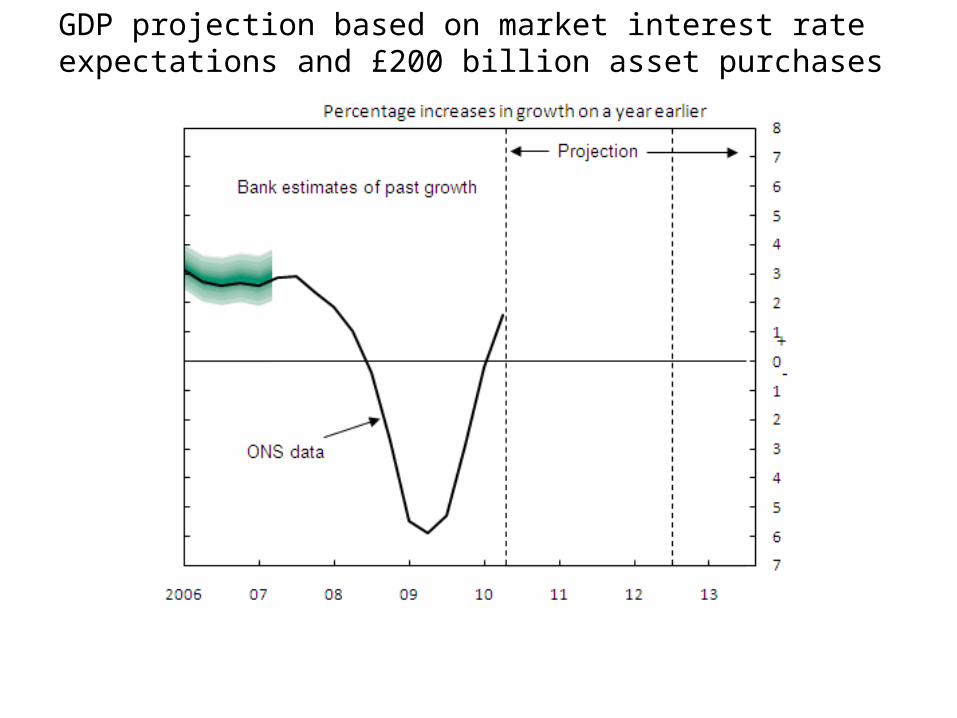
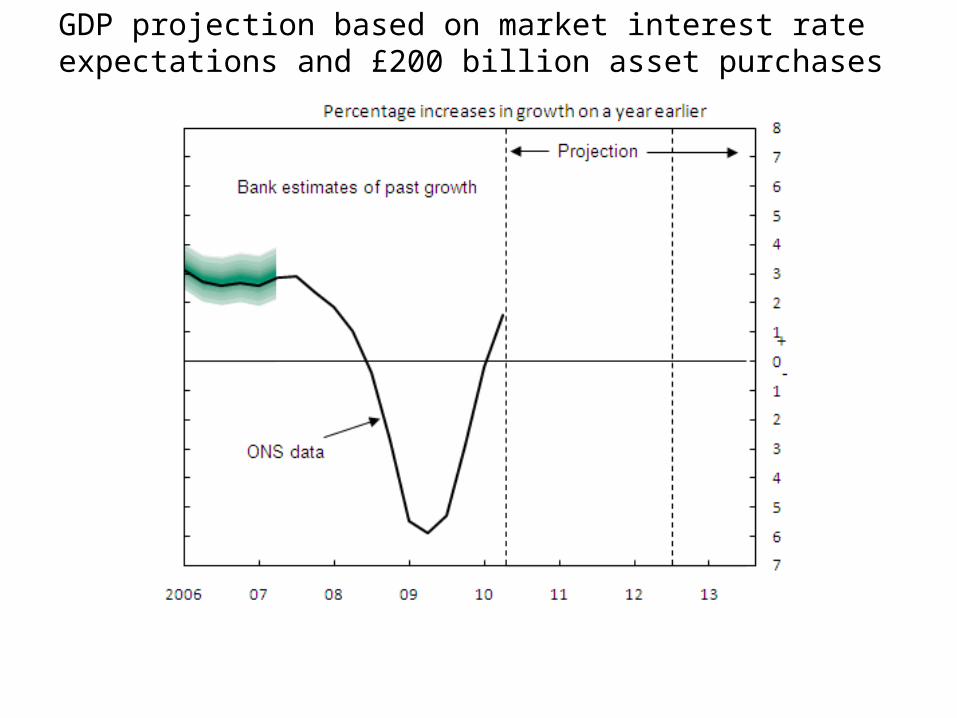
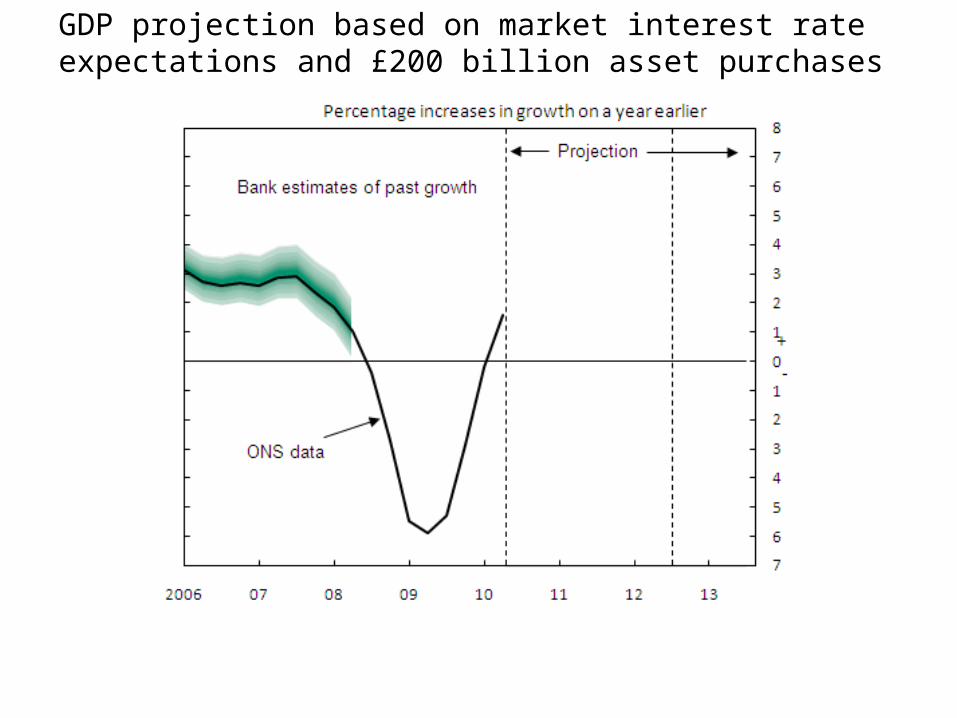
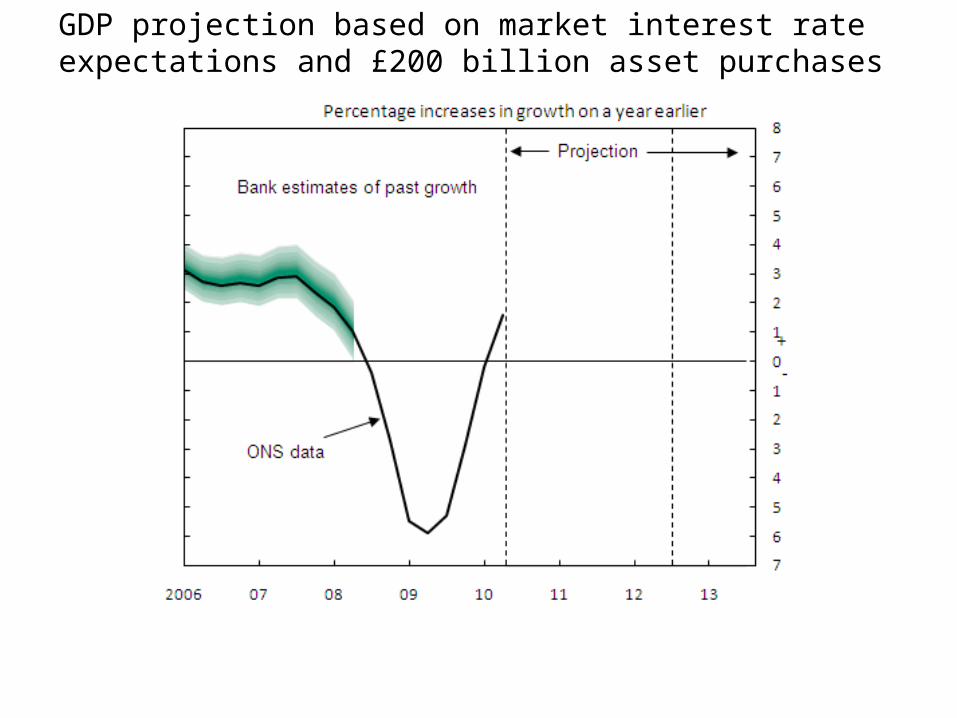
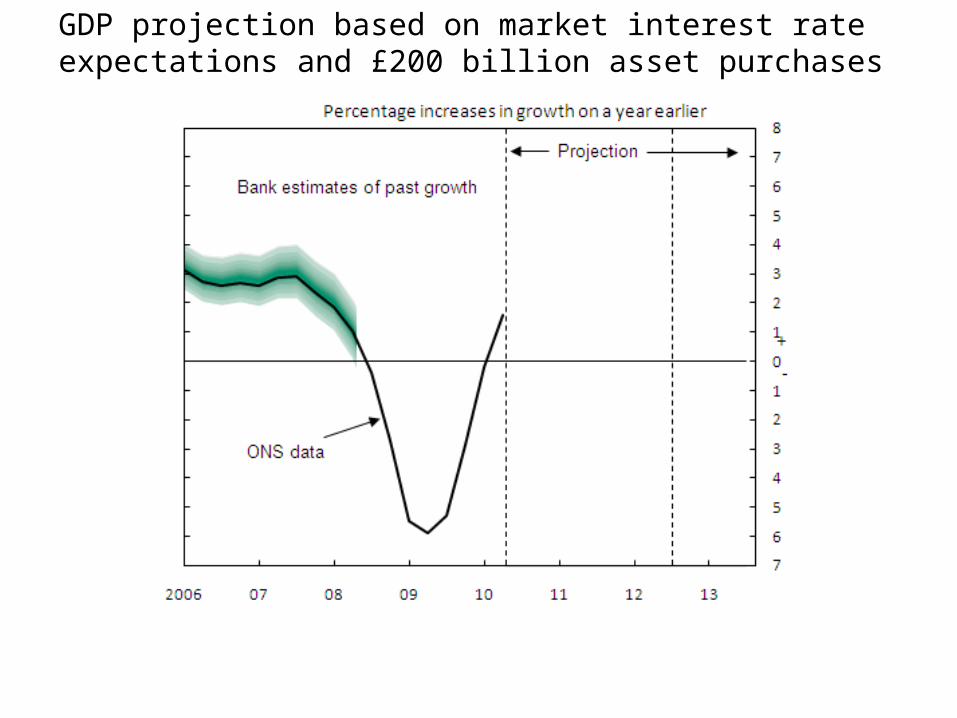
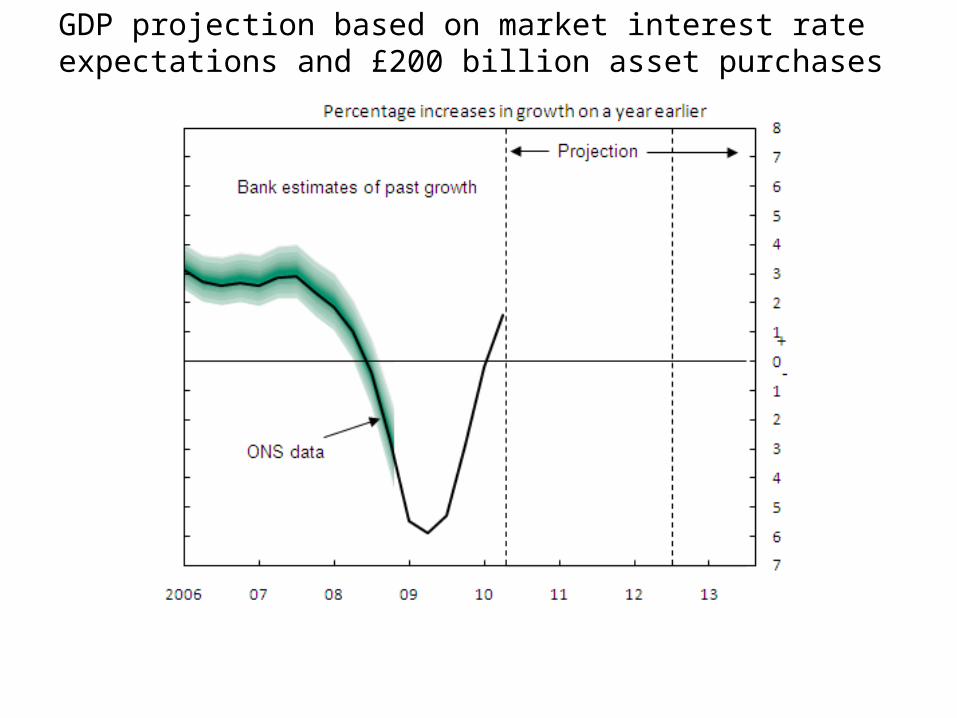
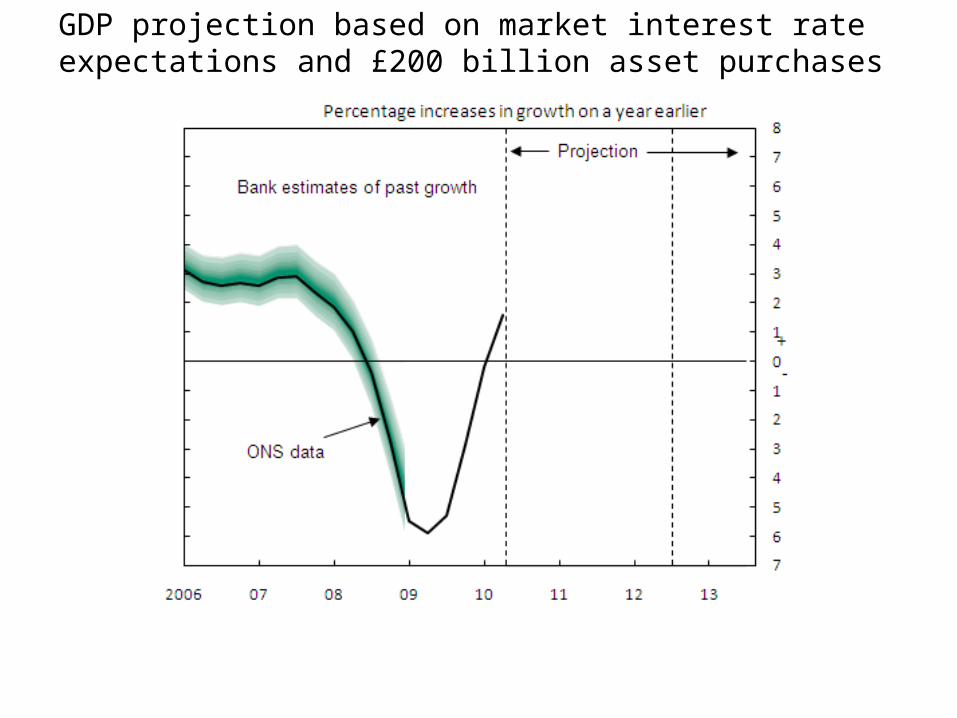
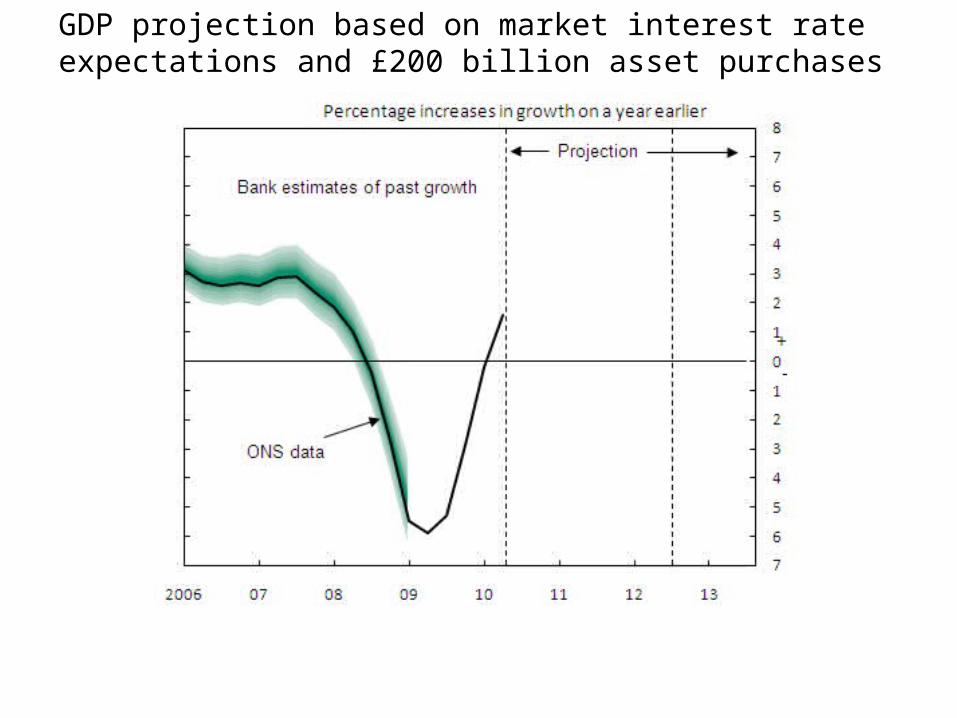
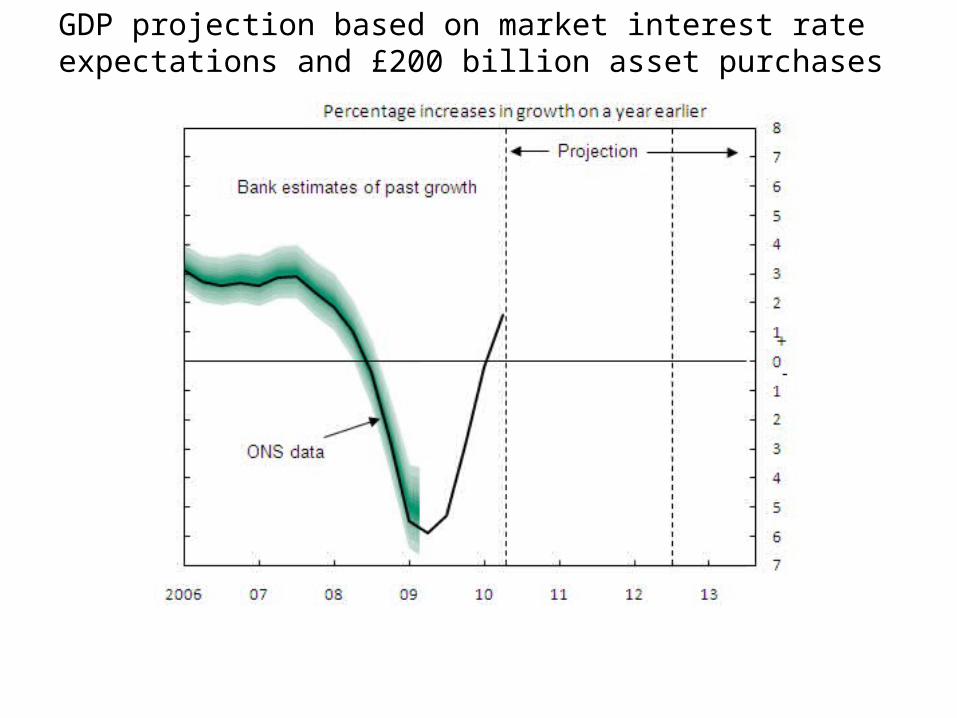
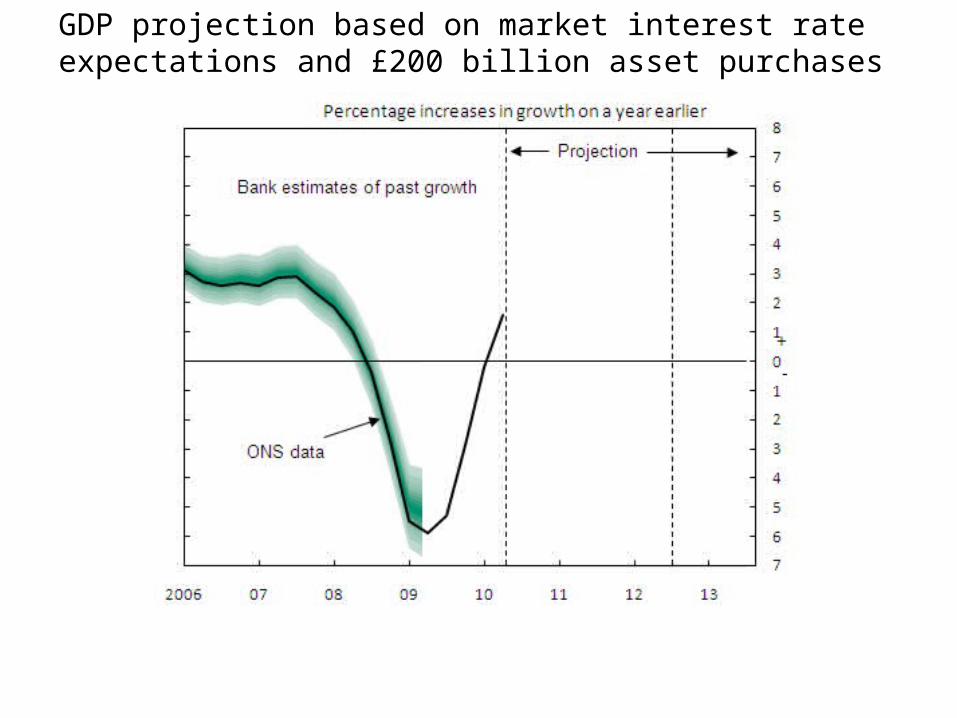
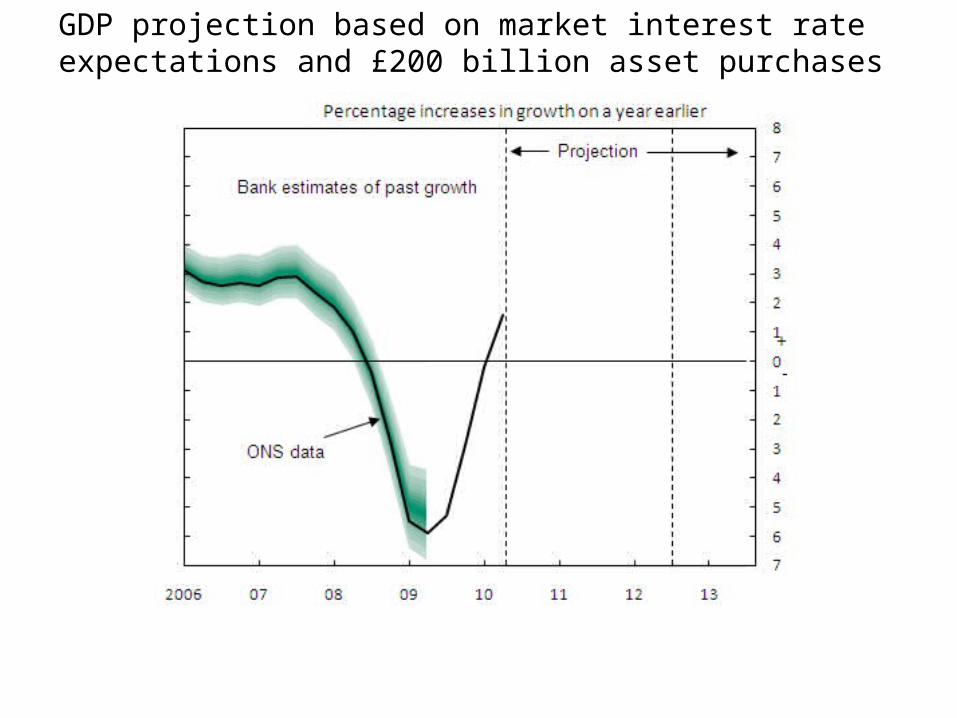
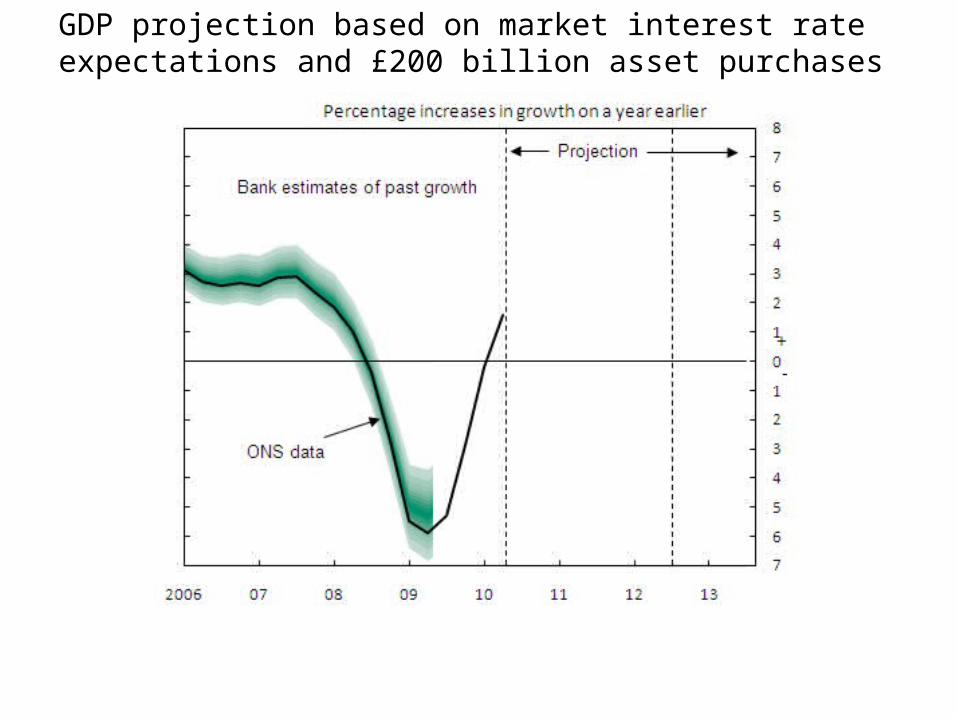
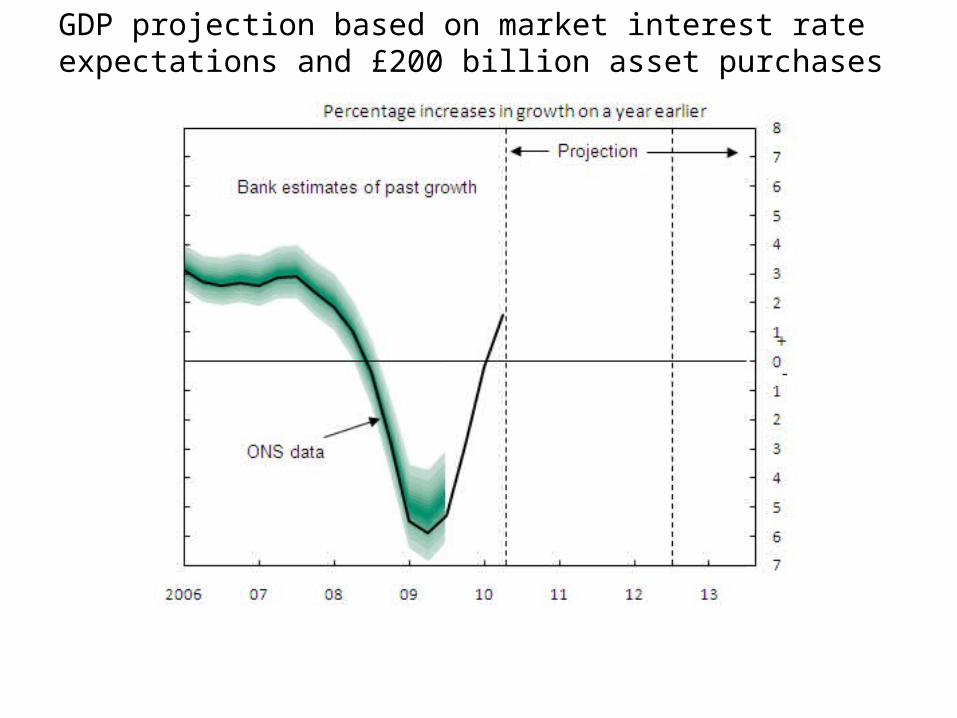
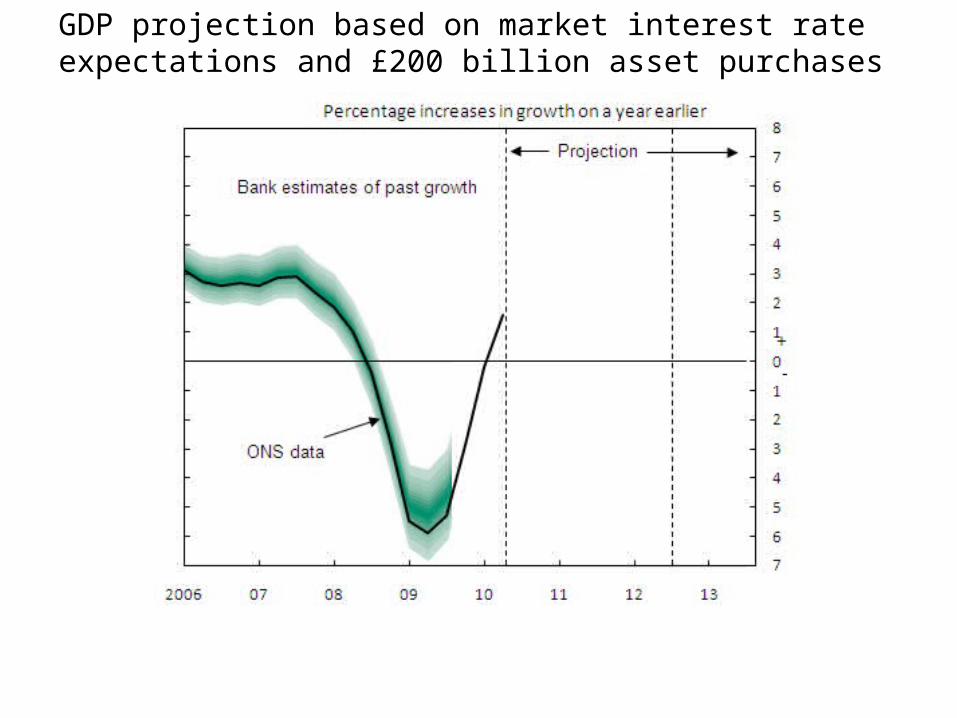
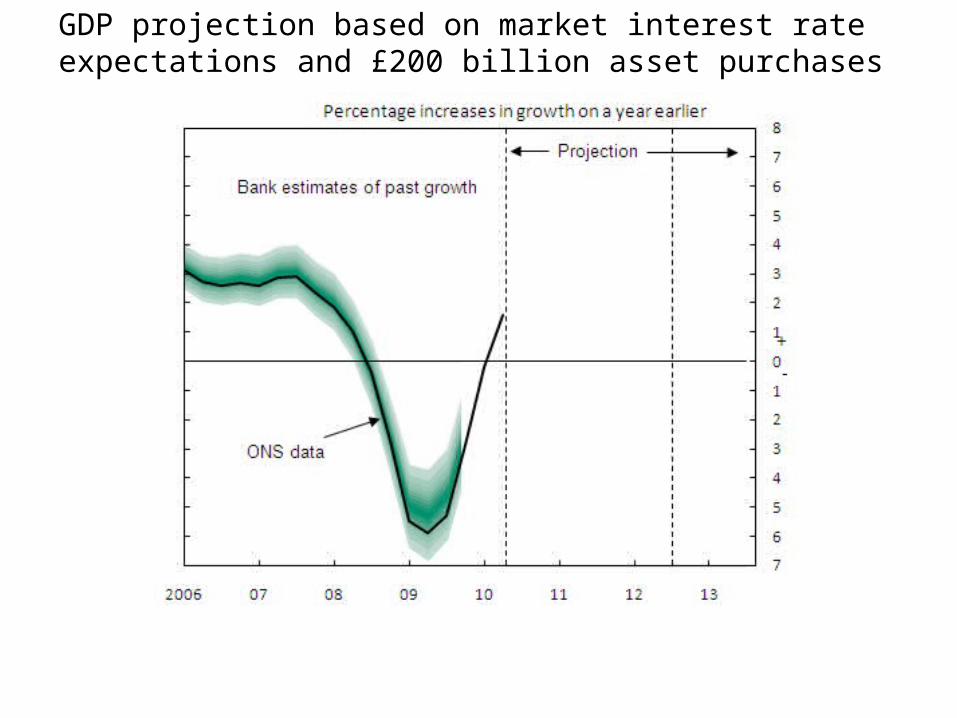
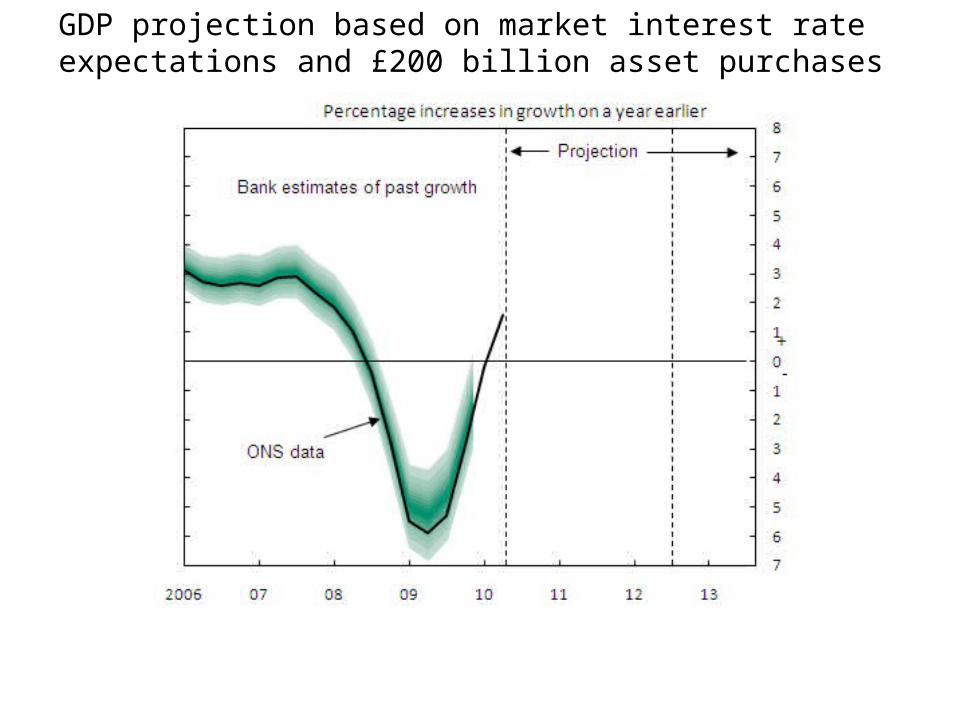
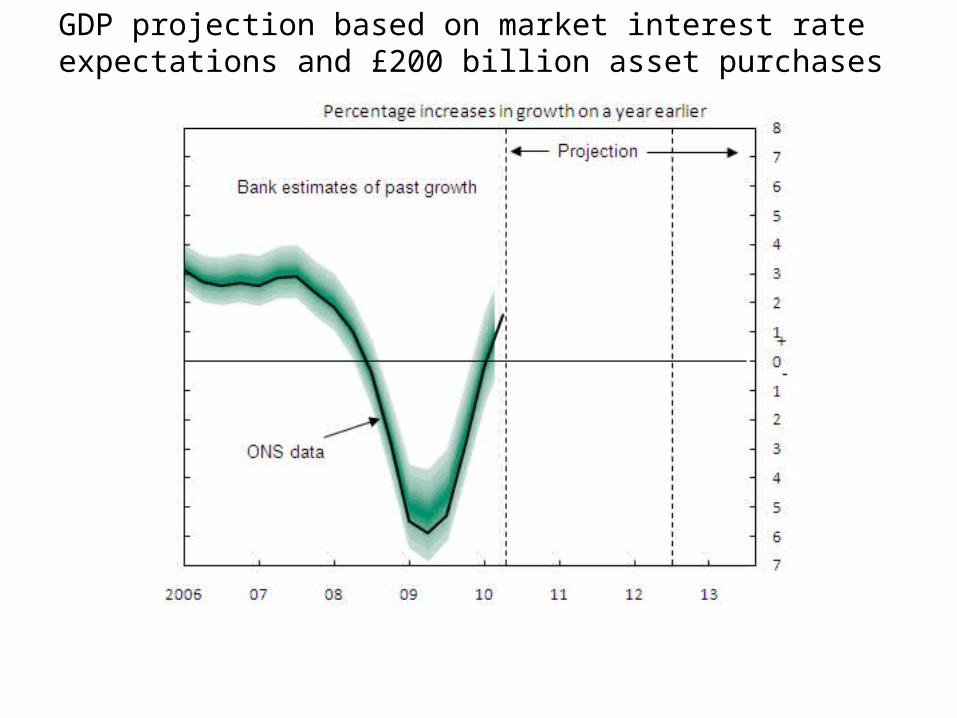
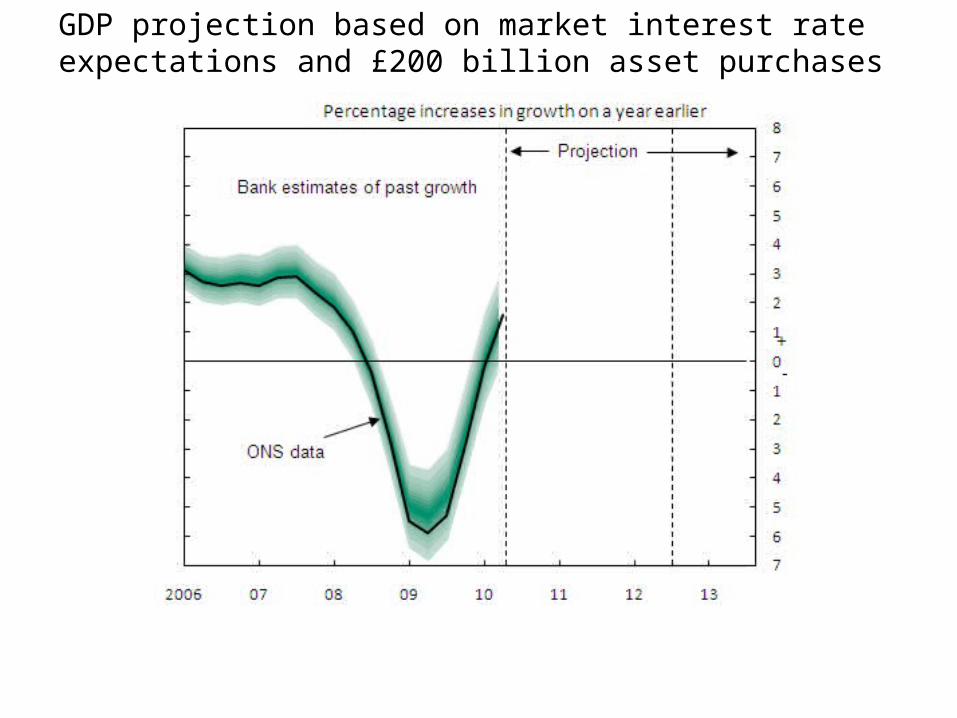
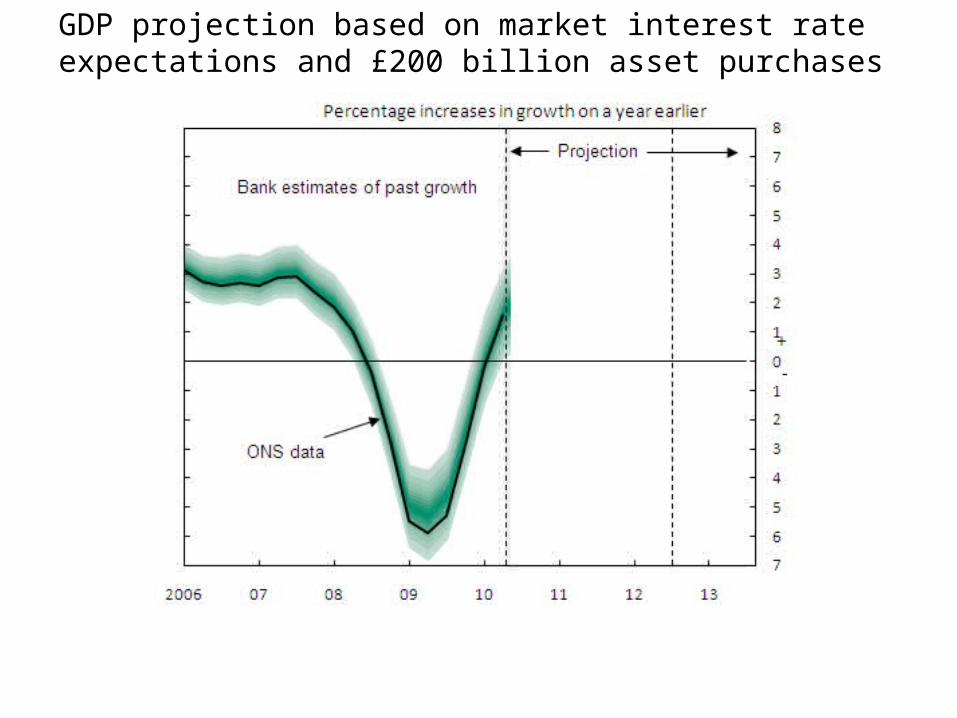
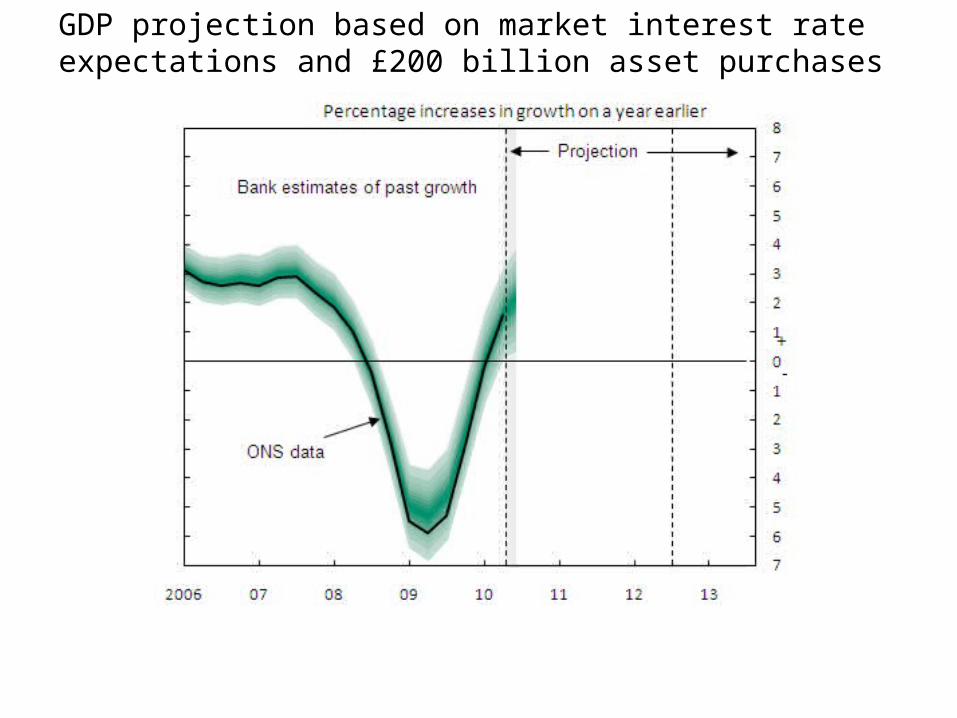
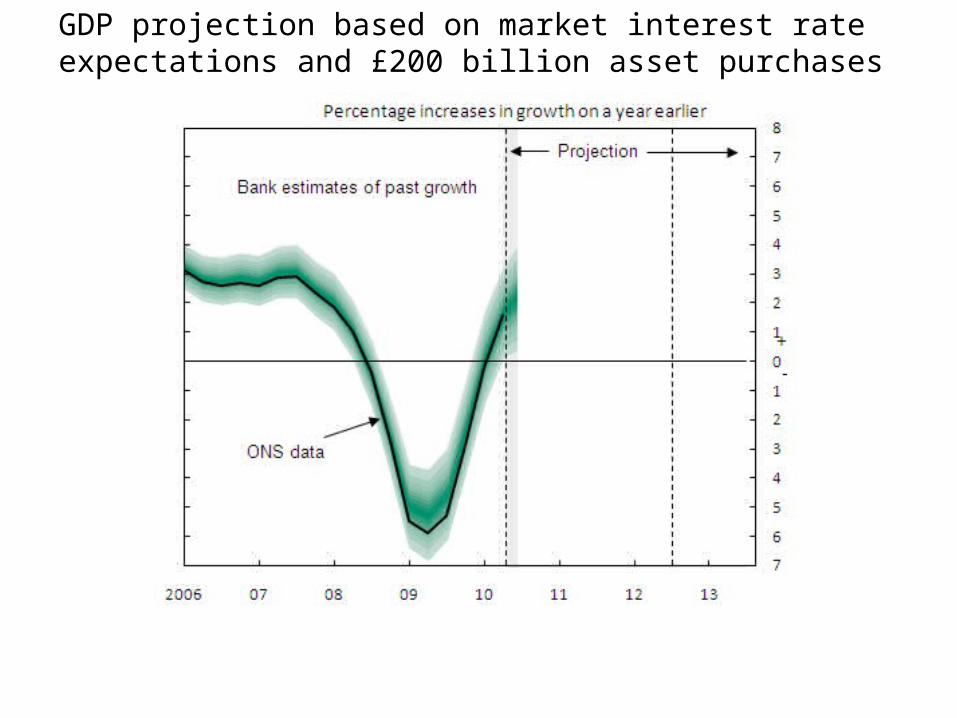
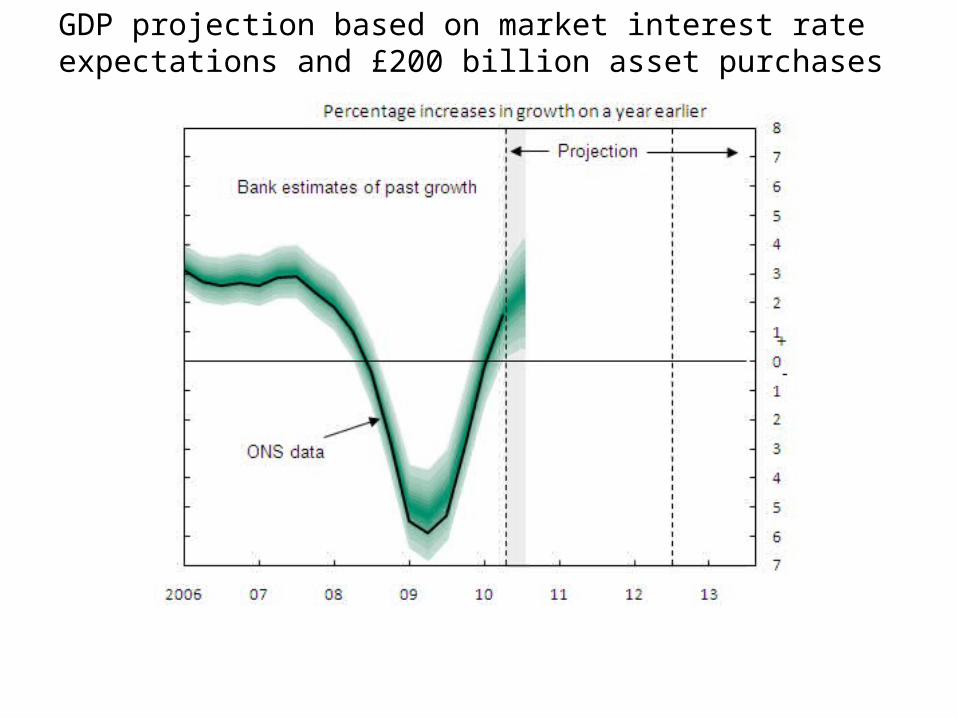
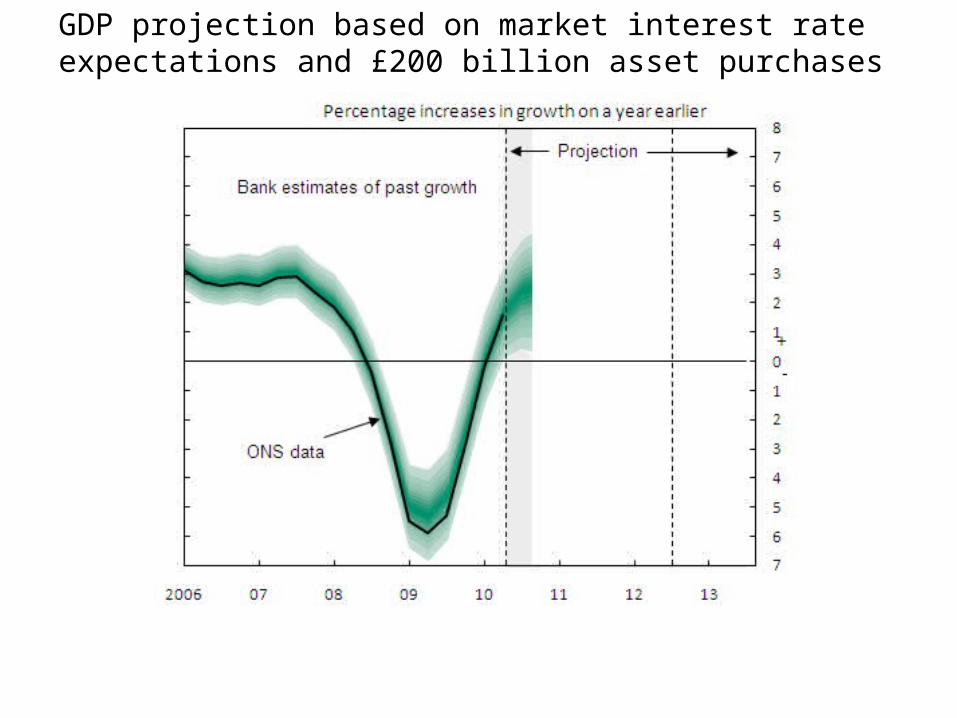
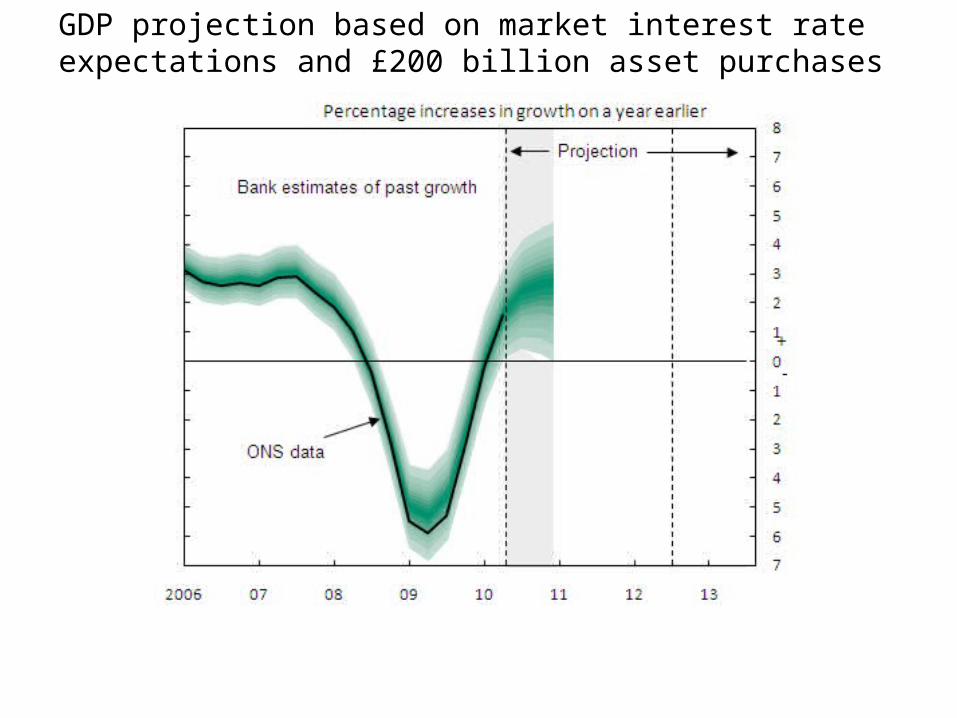
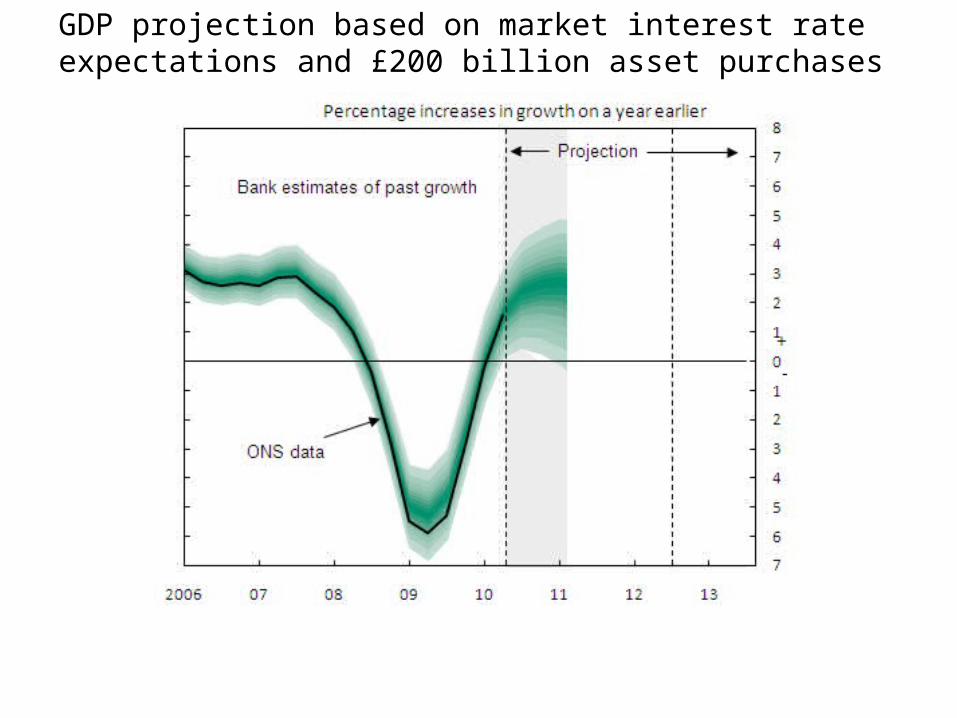
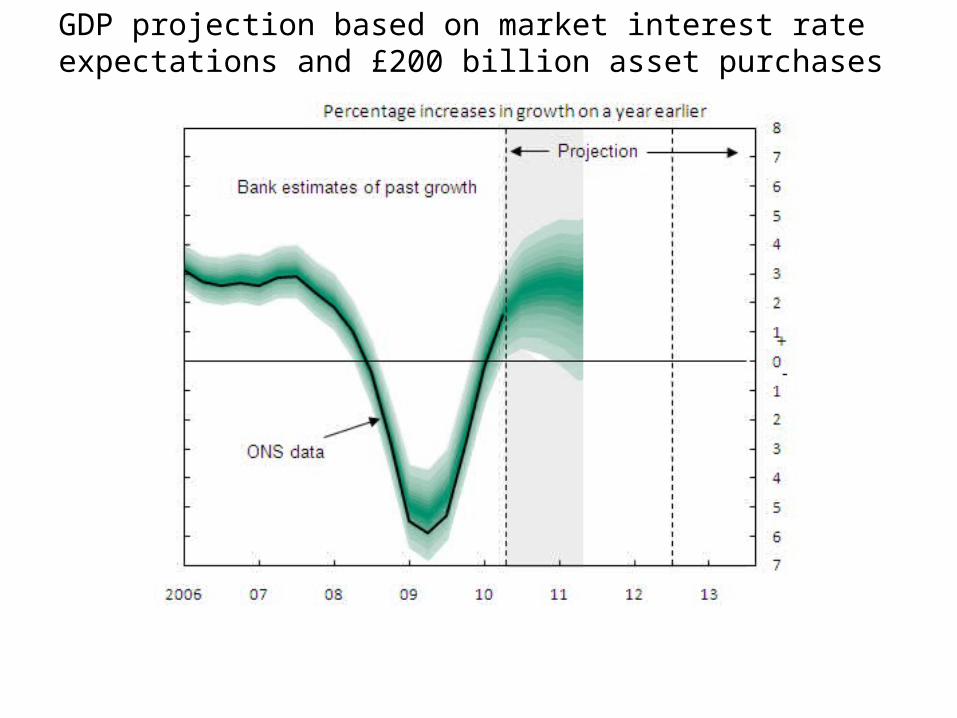
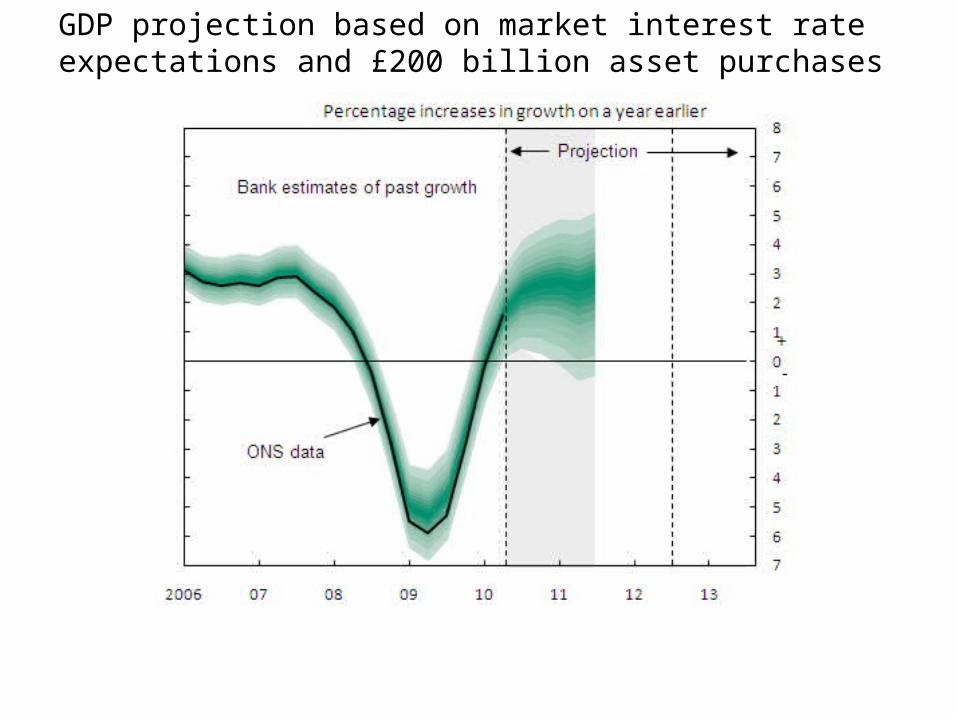
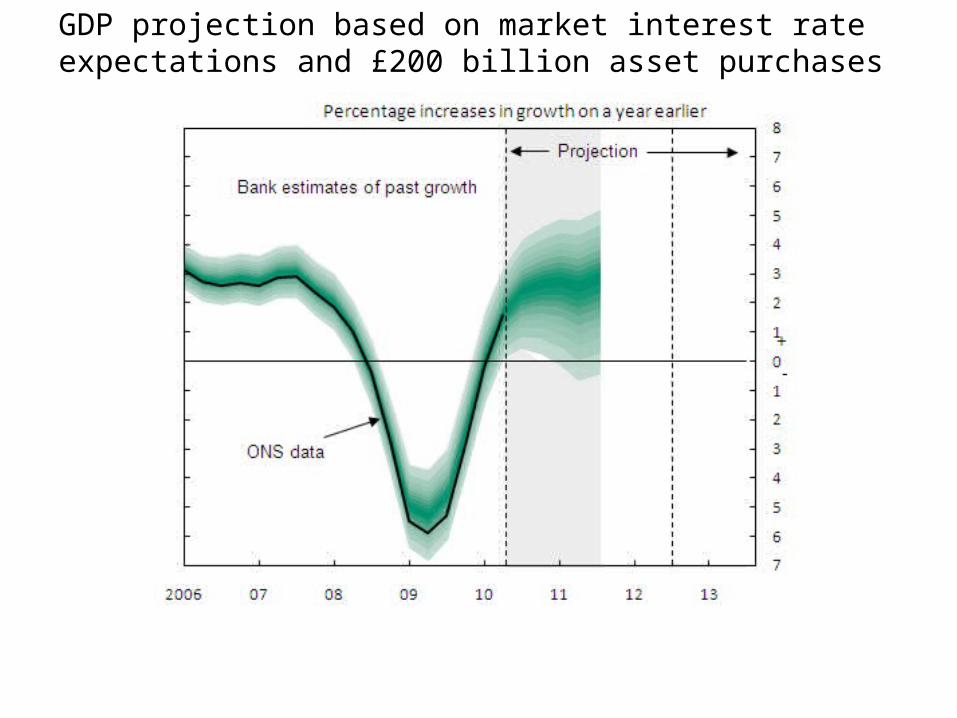
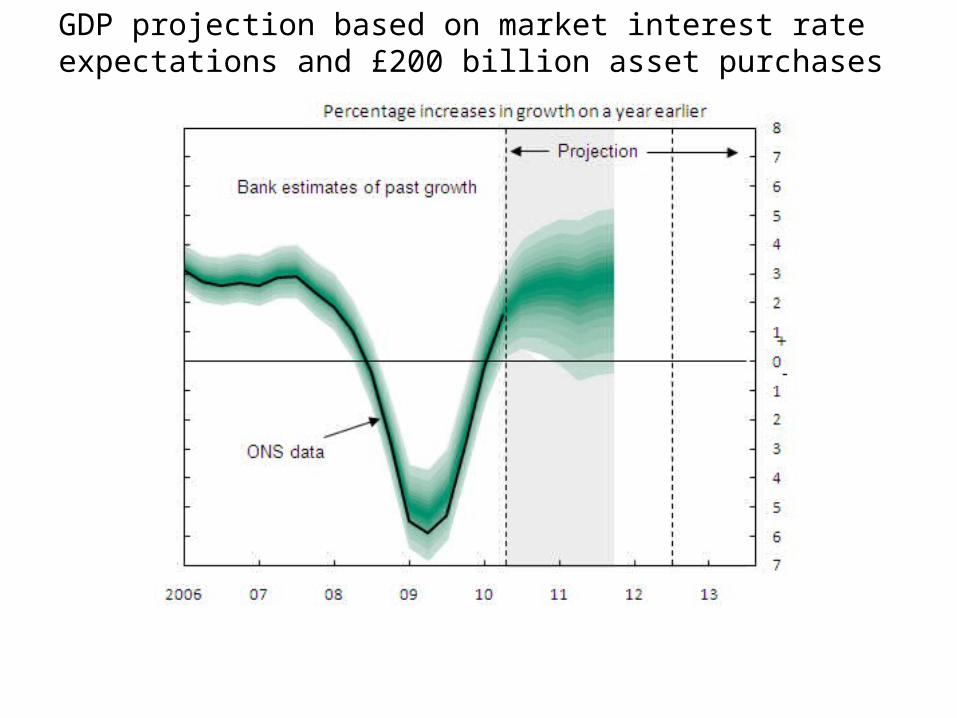
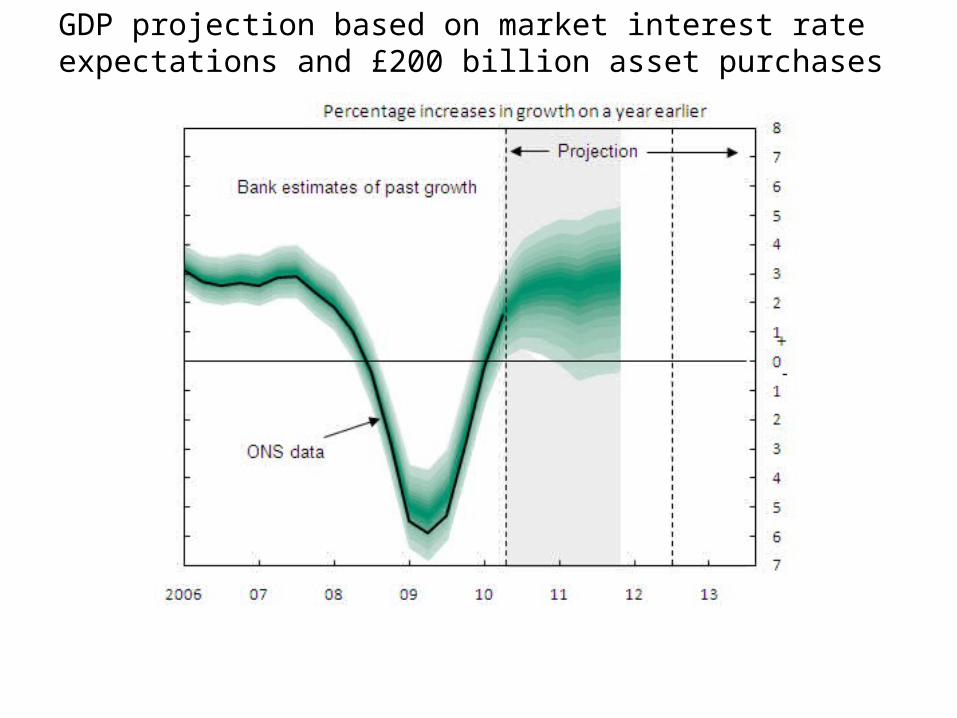
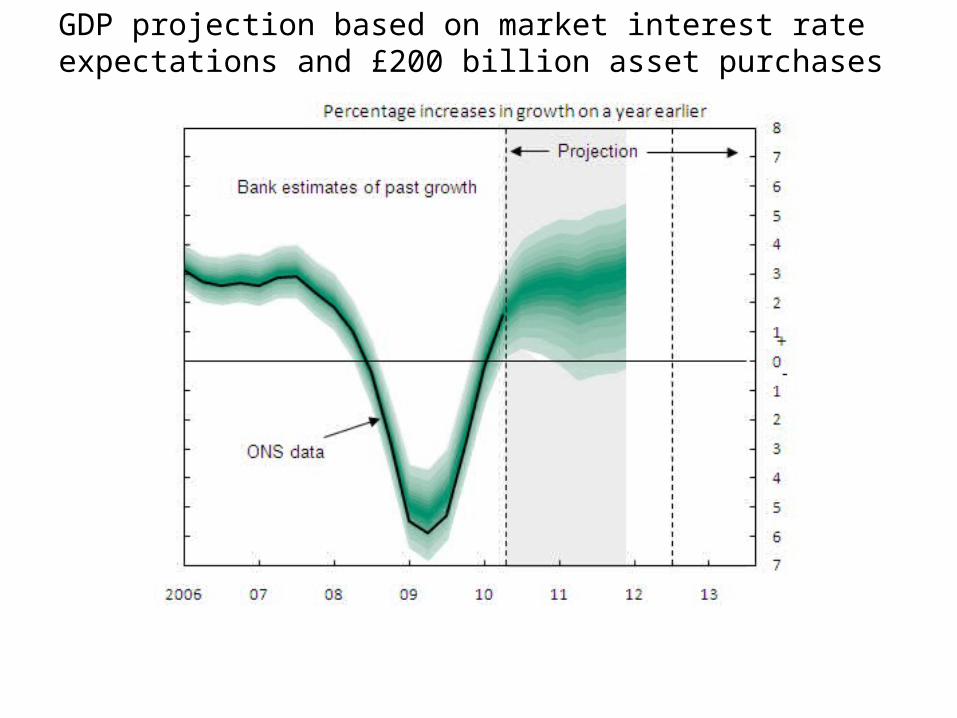
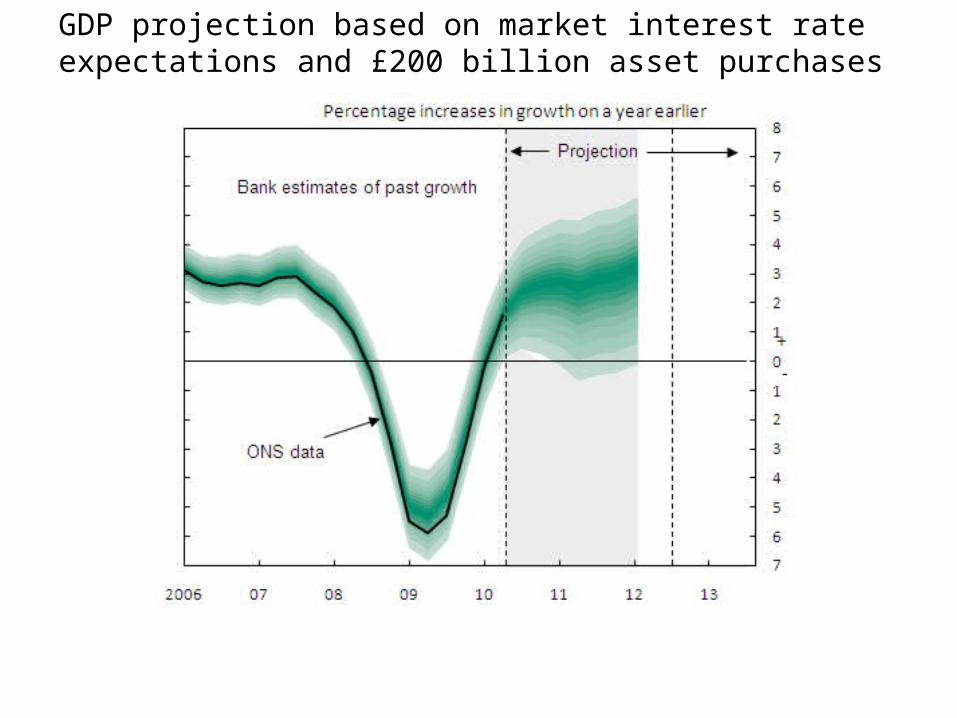
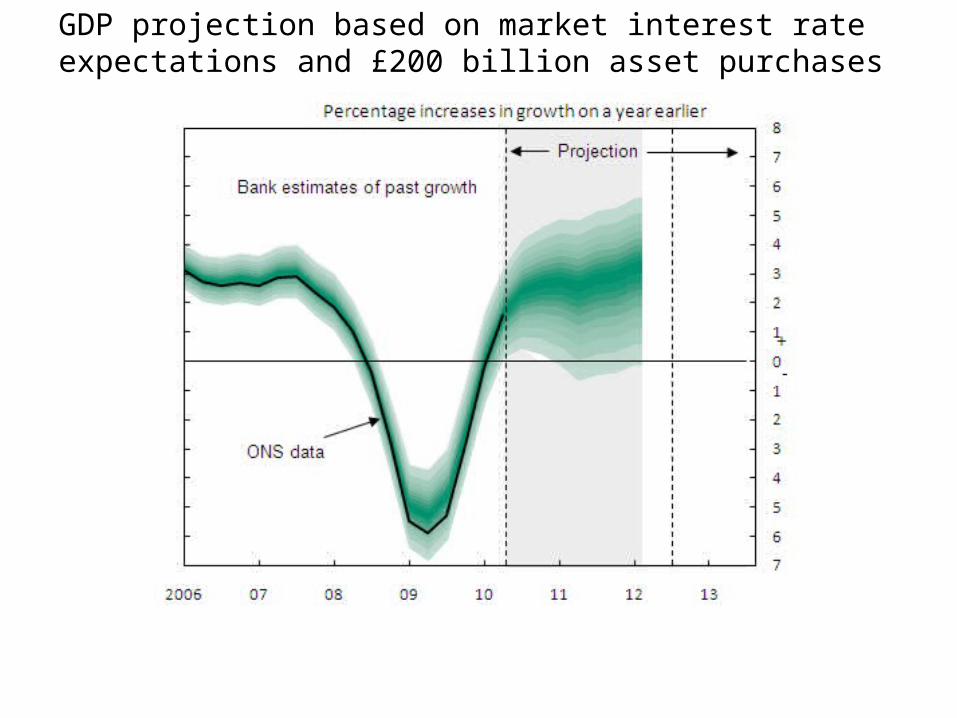
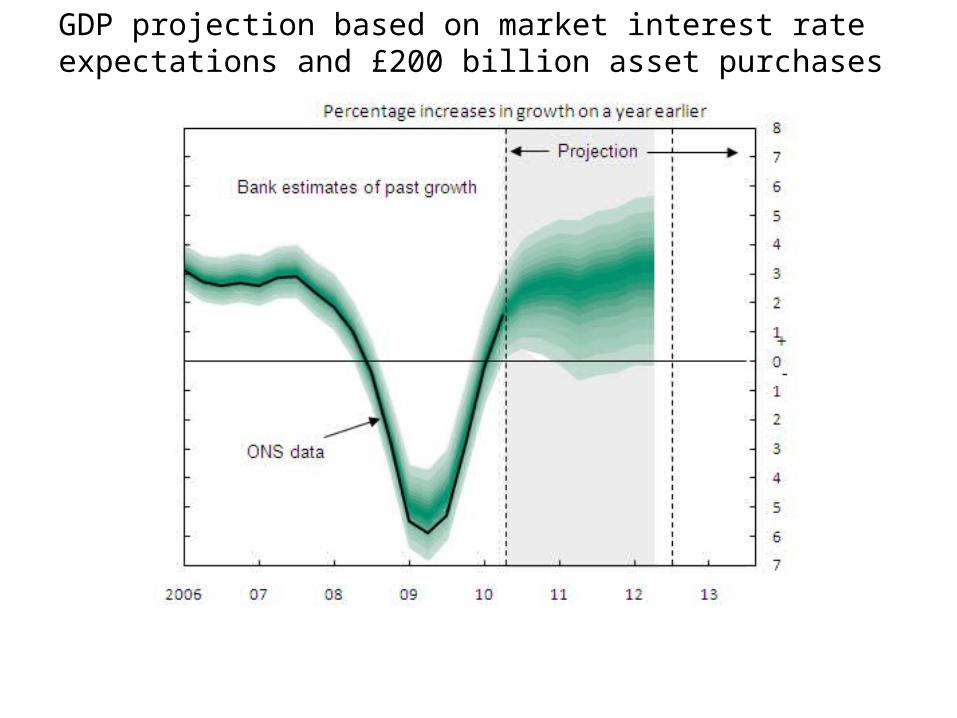
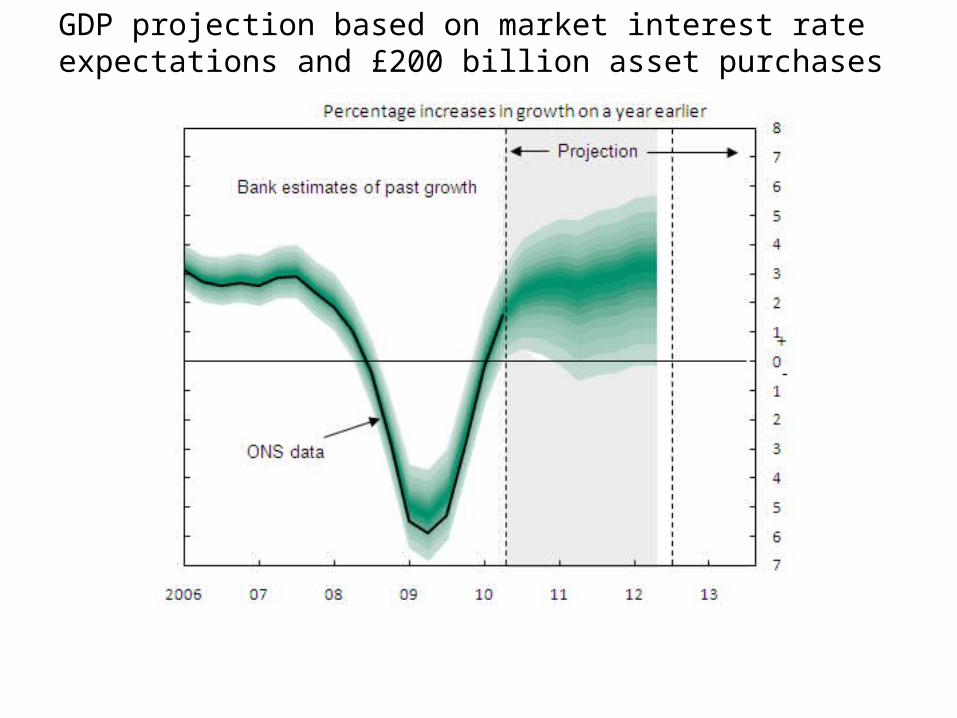
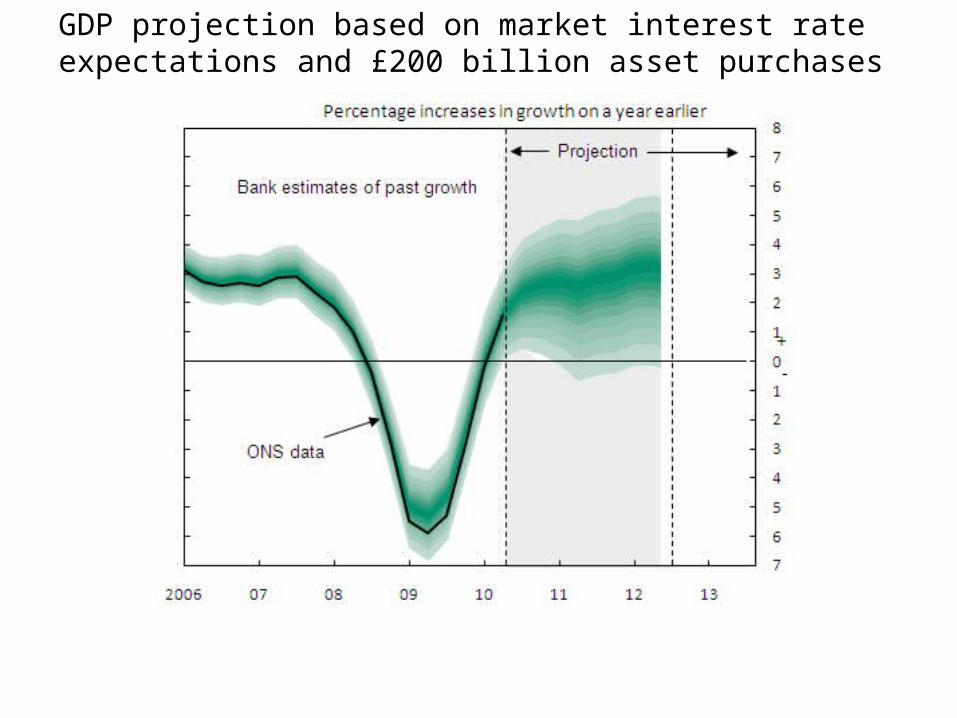
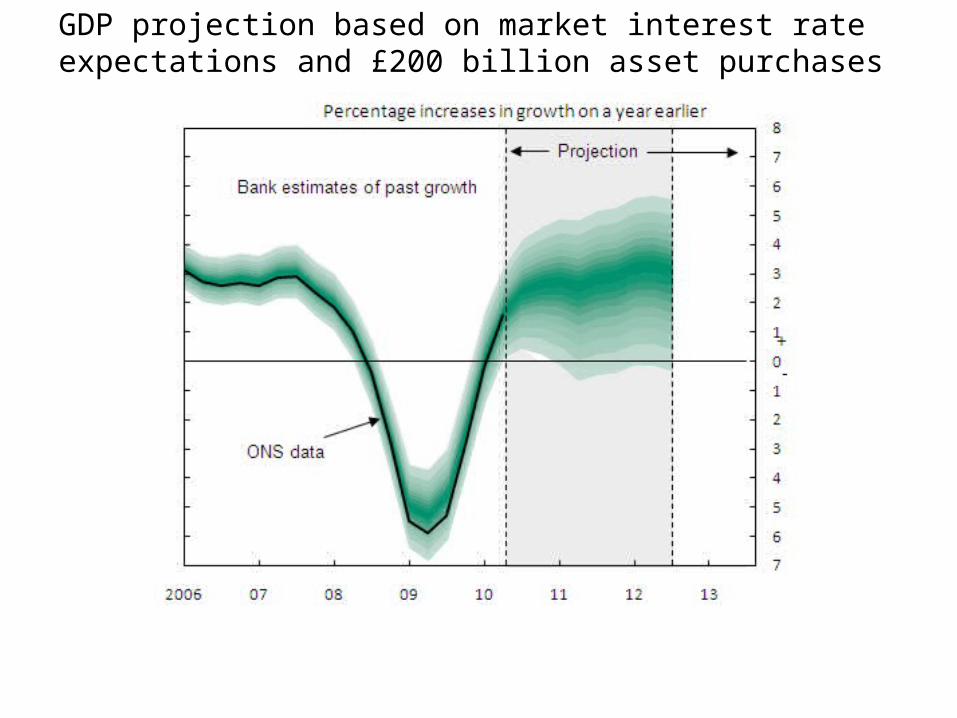
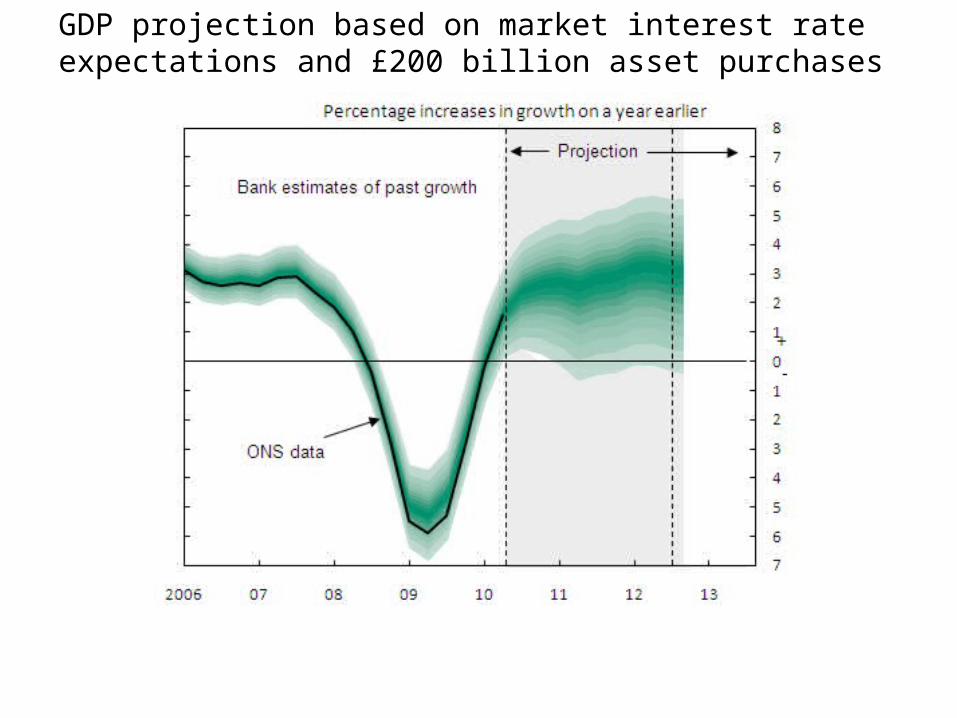
• This slideshow presents the equivalent animation for the August 2010 projection for GDP
growth conditioned on market interest rate expectations and £200 billion of asset purchases.
• Press any key to begin the animation.
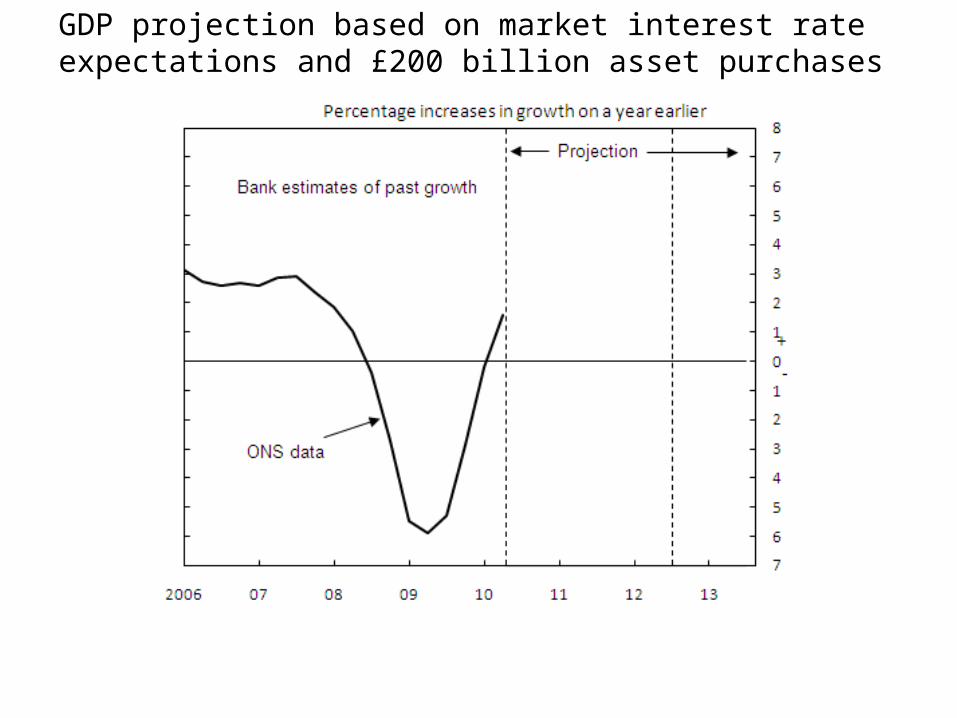
GDP projection based on market interest rate expectations and £200 billion asset purchases
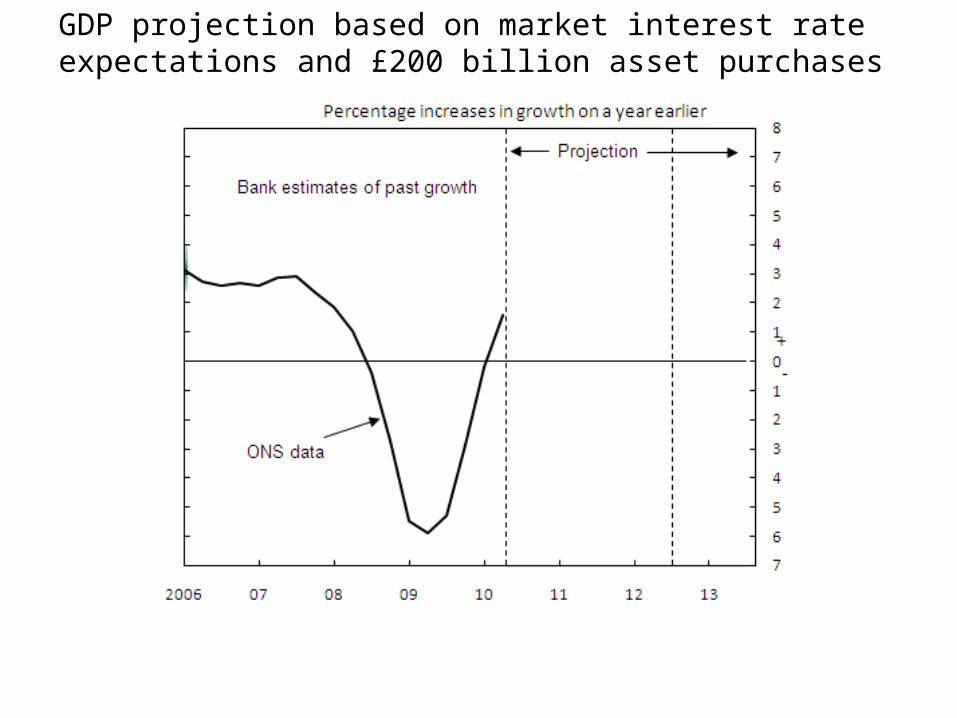
GDP projection based on market interest rate expectations and £200 billion asset purchases

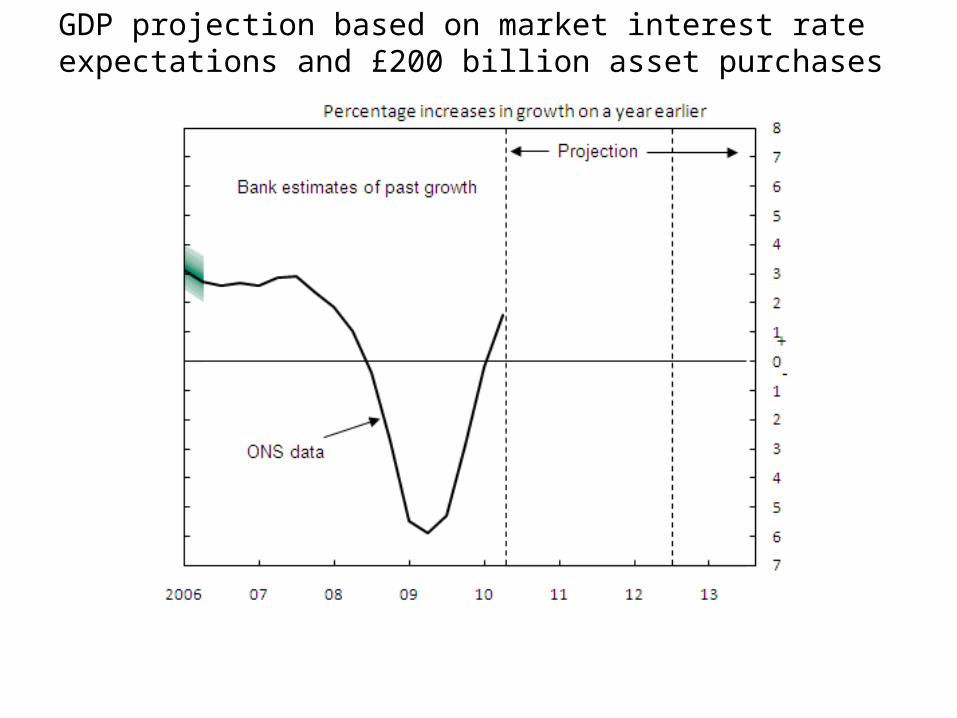
GDP projection based on market interest rate expectations and £200 billion asset purchases

GDP projection based on market interest rate expectations and £200 billion asset purchases

GDP projection based on market interest rate expectations and £200 billion asset purchases

GDP projection based on market interest rate expectations and £200 billion asset purchases

GDP projection based on market interest rate expectations and £200 billion asset purchases

GDP projection based on market interest rate expectations and £200 billion asset purchases
GDP projection based on market interest rate expectations and £200 billion asset purchases

GDP projection based on market interest rate expectations and £200 billion asset purchases

GDP projection based on market interest rate expectations and £200 billion asset purchases
GDP projection based on market interest rate expectations and £200 billion asset purchases

GDP projection based on market interest rate expectations and £200 billion asset purchases
GDP projection based on market interest rate expectations and £200 billion asset purchases

GDP projection based on market interest rate expectations and £200 billion asset purchases
GDP projection based on market interest rate expectations and £200 billion asset purchases

GDP projection based on market interest rate expectations and £200 billion asset purchases

GDP projection based on market interest rate expectations and £200 billion asset purchases
GDP projection based on market interest rate expectations and £200 billion asset purchases

GDP projection based on market interest rate expectations and £200 billion asset purchases

GDP projection based on market interest rate expectations and £200 billion asset purchases

GDP projection based on market interest rate expectations and £200 billion asset purchases

GDP projection based on market interest rate expectations and £200 billion asset purchases

GDP projection based on market interest rate expectations and £200 billion asset purchases
GDP projection based on market interest rate expectations and £200 billion asset purchases

GDP projection based on market interest rate expectations and £200 billion asset purchases

GDP projection based on market interest rate expectations and £200 billion asset purchases

GDP projection based on market interest rate expectations and £200 billion asset purchases
GDP projection based on market interest rate expectations and £200 billion asset purchases

GDP projection based on market interest rate expectations and £200 billion asset purchases

GDP projection based on market interest rate expectations and £200 billion asset purchases

GDP projection based on market interest rate expectations and £200 billion asset purchases

GDP projection based on market interest rate expectations and £200 billion asset purchases

GDP projection based on market interest rate expectations and £200 billion asset purchases

GDP projection based on market interest rate expectations and £200 billion asset purchases

GDP projection based on market interest rate expectations and £200 billion asset purchases

GDP projection based on market interest rate expectations and £200 billion asset purchases
GDP projection based on market interest rate expectations and £200 billion asset purchases

GDP projection based on market interest rate expectations and £200 billion asset purchases
GDP projection based on market interest rate expectations and £200 billion asset purchases

GDP projection based on market interest rate expectations and £200 billion asset purchases

GDP projection based on market interest rate expectations and £200 billion asset purchases

GDP projection based on market interest rate expectations and £200 billion asset purchases

GDP projection based on market interest rate expectations and £200 billion asset purchases

GDP projection based on market interest rate expectations and £200 billion asset purchases
GDP projection based on market interest rate expectations and £200 billion asset purchases

GDP projection based on market interest rate expectations and £200 billion asset purchases

GDP projection based on market interest rate expectations and £200 billion asset purchases

GDP projection based on market interest rate expectations and £200 billion asset purchases

GDP projection based on market interest rate expectations and £200 billion asset purchases

GDP projection based on market interest rate expectations and £200 billion asset purchases

GDP projection based on market interest rate expectations and £200 billion asset purchases

GDP projection based on market interest rate expectations and £200 billion asset purchases

GDP projection based on market interest rate expectations and £200 billion asset purchases

GDP projection based on market interest rate expectations and £200 billion asset purchases

GDP projection based on market interest rate expectations and £200 billion asset purchases
GDP projection based on market interest rate expectations and £200 billion asset purchases

GDP projection based on market interest rate expectations and £200 billion asset purchases

GDP projection based on market interest rate expectations and £200 billion asset purchases

GDP projection based on market interest rate expectations and £200 billion asset purchases

GDP projection based on market interest rate expectations and £200 billion asset purchases

GDP projection based on market interest rate expectations and £200 billion asset purchases
GDP projection based on market interest rate expectations and £200 billion asset purchases

GDP projection based on market interest rate expectations and £200 billion asset purchases
GDP projection based on market interest rate expectations and £200 billion asset purchases

GDP projection based on market interest rate expectations and £200 billion asset purchases

GDP projection based on market interest rate expectations and £200 billion asset purchases

GDP projection based on market interest rate expectations and £200 billion asset purchases

GDP projection based on market interest rate expectations and £200 billion asset purchases

GDP projection based on market interest rate expectations and £200 billion asset purchases

GDP projection based on market interest rate expectations and £200 billion asset purchases
GDP projection based on market interest rate expectations and £200 billion asset purchases
GDP projection based on market interest rate expectations and £200 billion asset purchases
GDP projection based on market interest rate expectations and £200 billion asset purchases

GDP projection based on market interest rate expectations and £200 billion asset purchases

GDP projection based on market interest rate expectations and £200 billion asset purchases

GDP projection based on market interest rate expectations and £200 billion asset purchases

GDP projection based on market interest rate expectations and £200 billion asset purchases

GDP projection based on market interest rate expectations and £200 billion asset purchases

GDP projection based on market interest rate expectations and £200 billion asset purchases

GDP projection based on market interest rate expectations and £200 billion asset purchases

GDP projection based on market interest rate expectations and £200 billion asset purchases

GDP projection based on market interest rate expectations and £200 billion asset purchases

GDP projection based on market interest rate expectations and £200 billion asset purchases

GDP projection based on market interest rate expectations and £200 billion asset purchases

GDP projection based on market interest rate expectations and £200 billion asset purchases

GDP projection based on market interest rate expectations and £200 billion asset purchases

GDP projection based on market interest rate expectations and £200 billion asset purchases

GDP projection based on market interest rate expectations and £200 billion asset purchases
GDP projection based on market interest rate expectations and £200 billion asset purchases

GDP projection based on market interest rate expectations and £200 billion asset purchases

GDP projection based on market interest rate expectations and £200 billion asset purchases

GDP projection based on market interest rate expectations and £200 billion asset purchases

GDP projection based on market interest rate expectations and £200 billion asset purchases
GDP projection based on market interest rate expectations and £200 billion asset purchases
GDP projection based on market interest rate expectations and £200 billion asset purchases

GDP projection based on market interest rate expectations and £200 billion asset purchases

GDP projection based on market interest rate expectations and £200 billion asset purchases

GDP projection based on market interest rate expectations and £200 billion asset purchases

GDP projection based on market interest rate expectations and £200 billion asset purchases
GDP projection based on market interest rate expectations and £200 billion asset purchases
GDP projection based on market interest rate expectations and £200 billion asset purchases

GDP projection based on market interest rate expectations and £200 billion asset purchases
GDP projection based on market interest rate expectations and £200 billion asset purchases

GDP projection based on market interest rate expectations and £200 billion asset purchases

GDP projection based on market interest rate expectations and £200 billion asset purchases
GDP projection based on market interest rate expectations and £200 billion asset purchases

GDP projection based on market interest rate expectations and £200 billion asset purchases

GDP projection based on market interest rate expectations and £200 billion asset purchases

GDP projection based on market interest rate expectations and £200 billion asset purchases

GDP projection based on market interest rate expectations and £200 billion asset purchases
GDP projection based on market interest rate expectations and £200 billion asset purchases

GDP projection based on market interest rate expectations and £200 billion asset purchases

GDP projection based on market interest rate expectations and £200 billion asset purchases
GDP projection based on market interest rate expectations and £200 billion asset purchases

GDP projection based on market interest rate expectations and £200 billion asset purchases

GDP projection based on market interest rate expectations and £200 billion asset purchases

GDP projection based on market interest rate expectations and £200 billion asset purchases
GDP projection based on market interest rate expectations and £200 billion asset purchases

GDP projection based on market interest rate expectations and £200 billion asset purchases

GDP projection based on market interest rate expectations and £200 billion asset purchases

GDP projection based on market interest rate expectations and £200 billion asset purchases

GDP projection based on market interest rate expectations and £200 billion asset purchases
GDP projection based on market interest rate expectations and £200 billion asset purchases

GDP projection based on market interest rate expectations and £200 billion asset purchases

GDP projection based on market interest rate expectations and £200 billion asset purchases

GDP projection based on market interest rate expectations and £200 billion asset purchases

GDP projection based on market interest rate expectations and £200 billion asset purchases

GDP projection based on market interest rate expectations and £200 billion asset purchases

GDP projection based on market interest rate expectations and £200 billion asset purchases

GDP projection based on market interest rate expectations and £200 billion asset purchases

GDP projection based on market interest rate expectations and £200 billion asset purchases
GDP projection based on market interest rate expectations and £200 billion asset purchases

GDP projection based on market interest rate expectations and £200 billion asset purchases
GDP projection based on market interest rate expectations and £200 billion asset purchases

GDP projection based on market interest rate expectations and £200 billion asset purchases

GDP projection based on market interest rate expectations and £200 billion asset purchases

GDP projection based on market interest rate expectations and £200 billion asset purchases

GDP projection based on market interest rate expectations and £200 billion asset purchases
GDP projection based on market interest rate expectations and £200 billion asset purchases

GDP projection based on market interest rate expectations and £200 billion asset purchases
GDP projection based on market interest rate expectations and £200 billion asset purchases
GDP projection based on market interest rate expectations and £200 billion asset purchases

GDP projection based on market interest rate expectations and £200 billion asset purchases

GDP projection based on market interest rate expectations and £200 billion asset purchases
GDP projection based on market interest rate expectations and £200 billion asset purchases

GDP projection based on market interest rate expectations and £200 billion asset purchases

GDP projection based on market interest rate expectations and £200 billion asset purchases
GDP projection based on market interest rate expectations and £200 billion asset purchases

GDP projection based on market interest rate expectations and £200 billion asset purchases

GDP projection based on market interest rate expectations and £200 billion asset purchases

GDP projection based on market interest rate expectations and £200 billion asset purchases

GDP projection based on market interest rate expectations and £200 billion asset purchases

GDP projection based on market interest rate expectations and £200 billion asset purchases

GDP projection based on market interest rate expectations and £200 billion asset purchases

GDP projection based on market interest rate expectations and £200 billion asset purchases

GDP projection based on market interest rate expectations and £200 billion asset purchases
GDP projection based on market interest rate expectations and £200 billion asset purchases

GDP projection based on market interest rate expectations and £200 billion asset purchases

GDP projection based on market interest rate expectations and £200 billion asset purchases

GDP projection based on market interest rate expectations and £200 billion asset purchases

GDP projection based on market interest rate expectations and £200 billion asset purchases

GDP projection based on market interest rate expectations and £200 billion asset purchases
GDP projection based on market interest rate expectations and £200 billion asset purchases

GDP projection based on market interest rate expectations and £200 billion asset purchases

GDP projection based on market interest rate expectations and £200 billion asset purchases

GDP projection based on market interest rate expectations and £200 billion asset purchases

GDP projection based on market interest rate expectations and £200 billion asset purchases

GDP projection based on market interest rate expectations and £200 billion asset purchases

GDP projection based on market interest rate expectations and £200 billion asset purchases
GDP projection based on market interest rate expectations and £200 billion asset purchases

GDP projection based on market interest rate expectations and £200 billion asset purchases

GDP projection based on market interest rate expectations and £200 billion asset purchases

GDP projection based on market interest rate expectations and £200 billion asset purchases

GDP projection based on market interest rate expectations and £200 billion asset purchases
GDP projection based on market interest rate expectations and £200 billion asset purchases

GDP projection based on market interest rate expectations and £200 billion asset purchases
GDP projection based on market interest rate expectations and £200 billion asset purchases

GDP projection based on market interest rate expectations and £200 billion asset purchases

GDP projection based on market interest rate expectations and £200 billion asset purchases

GDP projection based on market interest rate expectations and £200 billion asset purchases

GDP projection based on market interest rate expectations and £200 billion asset purchases

GDP projection based on market interest rate expectations and £200 billion asset purchases
GDP projection based on market interest rate expectations and £200 billion asset purchases

GDP projection based on market interest rate expectations and £200 billion asset purchases

GDP projection based on market interest rate expectations and £200 billion asset purchases
GDP projection based on market interest rate expectations and £200 billion asset purchases

GDP projection based on market interest rate expectations and £200 billion asset purchases
GDP projection based on market interest rate expectations and £200 billion asset purchases

GDP projection based on market interest rate expectations and £200 billion asset purchases

GDP projection based on market interest rate expectations and £200 billion asset purchases

GDP projection based on market interest rate expectations and £200 billion asset purchases

GDP projection based on market interest rate expectations and £200 billion asset purchases
GDP projection based on market interest rate expectations and £200 billion asset purchases

GDP projection based on market interest rate expectations and £200 billion asset purchases
GDP projection based on market interest rate expectations and £200 billion asset purchases

GDP projection based on market interest rate expectations and £200 billion asset purchases

GDP projection based on market interest rate expectations and £200 billion asset purchases

GDP projection based on market interest rate expectations and £200 billion asset purchases

GDP projection based on market interest rate expectations and £200 billion asset purchases
GDP projection based on market interest rate expectations and £200 billion asset purchases
GDP projection based on market interest rate expectations and £200 billion asset purchases

GDP projection based on market interest rate expectations and £200 billion asset purchases
GDP projection based on market interest rate expectations and £200 billion asset purchases

GDP projection based on market interest rate expectations and £200 billion asset purchases

GDP projection based on market interest rate expectations and £200 billion asset purchases

GDP projection based on market interest rate expectations and £200 billion asset purchases

GDP projection based on market interest rate expectations and £200 billion asset purchases
GDP projection based on market interest rate expectations and £200 billion asset purchases

GDP projection based on market interest rate expectations and £200 billion asset purchases

GDP projection based on market interest rate expectations and £200 billion asset purchases

GDP projection based on market interest rate expectations and £200 billion asset purchases

GDP projection based on market interest rate expectations and £200 billion asset purchases
GDP projection based on market interest rate expectations and £200 billion asset purchases

GDP projection based on market interest rate expectations and £200 billion asset purchases

GDP projection based on market interest rate expectations and £200 billion asset purchases

GDP projection based on market interest rate expectations and £200 billion asset purchases

GDP projection based on market interest rate expectations and £200 billion asset purchases

GDP projection based on market interest rate expectations and £200 billion asset purchases
GDP projection based on market interest rate expectations and £200 billion asset purchases

GDP projection based on market interest rate expectations and £200 billion asset purchases

GDP projection based on market interest rate expectations and £200 billion asset purchases

GDP projection based on market interest rate expectations and £200 billion asset purchases

GDP projection based on market interest rate expectations and £200 billion asset purchases

GDP projection based on market interest rate expectations and £200 billion asset purchases

GDP projection based on market interest rate expectations and £200 billion asset purchases

GDP projection based on market interest rate expectations and £200 billion asset purchases

GDP projection based on market interest rate expectations and £200 billion asset purchases

GDP projection based on market interest rate expectations and £200 billion asset purchases

GDP projection based on market interest rate expectations and £200 billion asset purchases

GDP projection based on market interest rate expectations and £200 billion asset purchases

GDP projection based on market interest rate expectations and £200 billion asset purchases

GDP projection based on market interest rate expectations and £200 billion asset purchases

GDP projection based on market interest rate expectations and £200 billion asset purchases
GDP projection based on market interest rate expectations and £200 billion asset purchases

GDP projection based on market interest rate expectations and £200 billion asset purchases

GDP projection based on market interest rate expectations and £200 billion asset purchases

GDP projection based on market interest rate expectations and £200 billion asset purchases
GDP projection based on market interest rate expectations and £200 billion asset purchases

GDP projection based on market interest rate expectations and £200 billion asset purchases

GDP projection based on market interest rate expectations and £200 billion asset purchases
Related Documents