Angular Leaf Spot of Phaseolus Beans: Relationships Between Disease, Healthy Leaf Area, and Yield A. Bergamin Filho, S. M. T. P. G. Carneiro, C. V. Godoy, L. Amorim, R. D. Berger, and B. Hau First, third, and fourth authors: Departamento de Fitopatologia, Escola Superior de Agricultura "Luiz de Queiroz," Universidade de São Paulo, 13418-90a Piracicaba, SP, Brazil; second author: Instituto Agronômico do Paraná, IAPAR, 86001-970 Londrina, PR, Brazil; fifth author: Plant Pathology Department, University of Florida, Gainesville 32611-0680; sixth author: Institut ftir Pflanzenkrankheiten und Pflanzenschutz, Universität Hannover, 30419 Hannover, Germany. Accepted for publication 7 February 1997. ABSTRACT Bergamin Filho, A., Carneiro, S. M. T. P. G., Godoy, C. V., Amorim, L., Berger, R. D., and Hau, B. 1997. Angular leaf spot of Phaseolus beans: Relationships between disease, healthy leaf area, and yield. Phytopathol- ogy 87:506-515. Five field experiments were conducted to investigate the relationship between the severity of visible disease (X), area under the disease prog- ress curve (AUDPC), healthy leaf area index on any given day (HLAI), radiation intercepted by healthy leaf area on any given day (HRI), healthy leaf area duration (HAD), total healthy leaf area absorption (HAA), and yield of Phaseolus beans, cultivars Rosinha and Carioca, inoculated with Phaeoisariopsis griseola at several doses. In general, yield was not re- lated to disease severity (X) or AUDPC. In contrast, the highest yields were always related to the highest values of HAD and HAA. The rela- tionship between yield and HAD was linear in each of five trials (29.9 < R 2 < 70.2%, P < 0.001). The relationship between yield and HAA was linear in four of the trials (52.3 < R 2 < 70.3%, P < 0.001) and exponen- tial in one of them (in which the plant canopy was the largest). Single- point models using HRI to estimate yield at various times during the crop season were developed. The slope of the yield-HRI relationship proved to be stable (26.8 ± 2.4 g MJ¯ 1 ), regardless of cultivar, locale, planting date, and bean growth stage (from R5 to R8). The yield-HLAI relationship proved to be less consistent. HRI is proposed as a key explanatory vari- able for a transportable system of disease management; it may be useful in producing precise recommendations at the farm level. Additional keywords: decision making, defoliation, disease assessment, radiation use efficiency, yield loss modeling. Angular leaf spot of beans (Phaseolus vulgaris L.), caused by Phaeoisariopsis griseola (Sacc.) Ferraris, is a disease of world- wide occurrence (16). The disease has recently become one of the main problems of bean crops in Brazil (48). The pathogen causes lesions on leaves, pods, branches, and petioles and may cause severe defoliation. In the absence of adequate control, yield re- ductions of 45% in Brazil (48) and 80% in Colômbia (49) have been reported. A disease management system that is transportable in time and in space is urgently needed in Latin America. The development and implementation of integrated pest and disease management systems require precise and accurate infor- mation on the damage caused by pests and pathogens. Damage is defined as any reduction in the quantity and quality of yield that results from injury (41). Injury is any visible or measurable symp- toms and signs caused by pathogens or pests (41). Historically, to ascertain the effect of a disease on a crop, the single-point, multi- ple-point, and integral models (30) have been widely used to de- scribe the relationship of disease severity to crop yield. Single- point and multiple-point models usually relate yield to disease se- verity at a single growth stage of the crop or at multiple growth stages, respectively. Integral models usually relate yield to the area under the disease progress curve (AUDPC). However, these models have not always been useful for predicting future damage. The lack of transportability of the models to other seasons and locales is due primarily to the great variation in the base yield of a disease-free crop and to the weak or indirect relationship between yield and disease. Corresponding author: A. Bergamin Filho E- mail address: [email protected] Publication no. P-1997-0314-01R © 1997 The American Phytopathological Society Yield (Y, g m¯ 2 ), as suggested by Watson (55), is a function of the leaf area of a crop or its leaf area index (LAI) at a particular time: Y=ƒ[LAI(t)]- More precisely, yield can be expressed as a function of LAI integrated over the growing season: Y= ƒ(LAD), in which LAD is the leaf area duration (days) (55). Monteith (35) refined Watson's concept (55), suggesting that yield (or dry mat- ter) is a function of radiation intercepted (RI, MJ m¯ 2 ) by the crop canopy at a particular time: Y=f[RI(t)]. More precisely, yield can be expressed as a function of RI integrated over the growing sea- son: y=f(LAA), in which LAA is the leaf area absorption (MJ m¯ 2 ) (35). Radiation interception and radiation absorption, al- though conceptually different, have sufficiently close values and may be employed indifferently for practical purposes (36). Waggoner and Berger (54) adapted Watson's (55) and Mon- teith's (35) concepts in a plant pathological context, taking into account only the healthy leaf area index (HLAI) on any given day: HLAI = LAI(1 - X), in which X is proportion disease severity; and they defined healthy leaf area duration (HAD, days) and healthy leaf area absorption (HAA, MJ m¯ 2 ). Thus, yield (or dry matter) relates to HLAI integrated over the growing season (y=ƒ(HAD)) and to the radiation intercepted by the healthy leaf area on any given day (HRI, in which HRI = RI(1 -X)) integrated over the growing season (Y=ƒ(HAA)). This last relationship may also be described as in which RUE(t) (g MJ¯ 1 ) is radiation use efficiency, or else as if RUE is constant during the season. RI can be estimated as the product of the incident solar radiation (I, MJ m¯ 2 ) and the pro- 506 PHYTOPATHOLOGY

Welcome message from author
This document is posted to help you gain knowledge. Please leave a comment to let me know what you think about it! Share it to your friends and learn new things together.
Transcript
Angular Leaf Spot of Phaseolus Beans: Relationships Between Disease, Healthy Leaf Area, and Yield
A. Bergamin Filho, S. M. T. P. G. Carneiro, C. V. Godoy, L. Amorim, R. D. Berger, and B. Hau
First, third, and fourth authors: Departamento de Fitopatologia, Escola Superior de Agricultura "Luiz de Queiroz," Universidade de São Paulo, 13418-90a Piracicaba, SP, Brazil; second author: Instituto Agronômico do Paraná, IAPAR, 86001-970 Londrina, PR, Brazil; fifth author: Plant Pathology Department, University of Florida, Gainesville 32611-0680; sixth author: Institut ftir Pflanzenkrankheiten und Pflanzenschutz, Universität Hannover, 30419 Hannover, Germany.
Accepted for publication 7 February 1997.
ABSTRACT
Bergamin Filho, A., Carneiro, S. M. T. P. G., Godoy, C. V., Amorim, L., Berger, R. D., and Hau, B. 1997. Angular leaf spot of Phaseolus beans: Relationships between disease, healthy leaf area, and yield. Phytopathol-ogy 87:506-515.
Five field experiments were conducted to investigate the relationship between the severity of visible disease (X), area under the disease prog-ress curve (AUDPC), healthy leaf area index on any given day (HLAI), radiation intercepted by healthy leaf area on any given day (HRI), healthy leaf area duration (HAD), total healthy leaf area absorption (HAA), and yield of Phaseolus beans, cultivars Rosinha and Carioca, inoculated with Phaeoisariopsis griseola at several doses. In general, yield was not re-lated to disease severity (X) or AUDPC. In contrast, the highest yields were always related to the highest values of HAD and HAA. The rela-
tionship between yield and HAD was linear in each of five trials (29.9 < R2 < 70.2%, P < 0.001). The relationship between yield and HAA was linear in four of the trials (52.3 < R2 < 70.3%, P < 0.001) and exponen-tial in one of them (in which the plant canopy was the largest). Single-point models using HRI to estimate yield at various times during the crop season were developed. The slope of the yield-HRI relationship proved to be stable (26.8 ± 2.4 g MJ¯1), regardless of cultivar, locale, planting date, and bean growth stage (from R5 to R8). The yield-HLAI relationship proved to be less consistent. HRI is proposed as a key explanatory vari-able for a transportable system of disease management; it may be useful in producing precise recommendations at the farm level.
Additional keywords: decision making, defoliation, disease assessment, radiation use efficiency, yield loss modeling.
Angular leaf spot of beans (Phaseolus vulgaris L.), caused by Phaeoisariopsis griseola (Sacc.) Ferraris, is a disease of world-wide occurrence (16). The disease has recently become one of the main problems of bean crops in Brazil (48). The pathogen causes lesions on leaves, pods, branches, and petioles and may cause severe defoliation. In the absence of adequate control, yield re-ductions of 45% in Brazil (48) and 80% in Colômbia (49) have been reported. A disease management system that is transportable in time and in space is urgently needed in Latin America.
The development and implementation of integrated pest and disease management systems require precise and accurate infor-mation on the damage caused by pests and pathogens. Damage is defined as any reduction in the quantity and quality of yield that results from injury (41). Injury is any visible or measurable symp-toms and signs caused by pathogens or pests (41). Historically, to ascertain the effect of a disease on a crop, the single-point, multi-ple-point, and integral models (30) have been widely used to de-scribe the relationship of disease severity to crop yield. Single-point and multiple-point models usually relate yield to disease se-verity at a single growth stage of the crop or at multiple growth stages, respectively. Integral models usually relate yield to the area under the disease progress curve (AUDPC). However, these models have not always been useful for predicting future damage. The lack of transportability of the models to other seasons and locales is due primarily to the great variation in the base yield of a disease-free crop and to the weak or indirect relationship between yield and disease.
Corresponding author: A. Bergamin Filho E-mail address: [email protected]
Publication no. P-1997-0314-01R © 1997 The American Phytopathological Society
Yield (Y, g m¯2), as suggested by Watson (55), is a function of the leaf area of a crop or its leaf area index (LAI) at a particular time: Y=ƒ[LAI(t)]- More precisely, yield can be expressed as a function of LAI integrated over the growing season: Y= ƒ(LAD), in which LAD is the leaf area duration (days) (55). Monteith (35) refined Watson's concept (55), suggesting that yield (or dry mat-ter) is a function of radiation intercepted (RI, MJ m¯2) by the crop canopy at a particular time: Y=f[RI(t)]. More precisely, yield can be expressed as a function of RI integrated over the growing sea-son: y=f(LAA), in which LAA is the leaf area absorption (MJ m¯2) (35). Radiation interception and radiation absorption, al-though conceptually different, have sufficiently close values and may be employed indifferently for practical purposes (36).
Waggoner and Berger (54) adapted Watson's (55) and Mon-teith's (35) concepts in a plant pathological context, taking into account only the healthy leaf area index (HLAI) on any given day: HLAI = LAI(1 - X), in which X is proportion disease severity; and they defined healthy leaf area duration (HAD, days) and healthy leaf area absorption (HAA, MJ m¯2). Thus, yield (or dry matter) relates to HLAI integrated over the growing season (y=ƒ(HAD)) and to the radiation intercepted by the healthy leaf area on any given day (HRI, in which HRI = RI(1 -X)) integrated over the growing season (Y=ƒ(HAA)). This last relationship may also be described as
in which RUE(t) (g MJ¯1) is radiation use efficiency, or else as
if RUE is constant during the season. RI can be estimated as the product of the incident solar radiation (I, MJ m¯2) and the pro-
506 PHYTOPATHOLOGY
In the approach described herein, yield is related directly to the variables HLAI (and HAD) and HRI (and HAA), rather than in-directly only to disease quantified on a proportional scale (30). Recently, a book (8), several review articles (9,19,20,29-32), and research papers (2,5-7,13,17,25,33,40,43,45,57) using these concepts have been published.
The objective of this study was to compare the approach based on the radiation captured by healthy leaf area on a given day or as integrated over the crop season and its relationship to yield versus the approach* based on the relationship of disease sevérity to yield. Secondarily, based on our results with angular leaf spot of bean, we propòse using HRI as a variable on which to base decision making to manage disease.
MATERIALS AND METHODS
Field experimente. Five experiments were carried out in 1993 and 1994 with cultivars Rosinha and Carioca: two in Piracicaba, São Paulo, SP (22°S, 47°W, elevation 540 m), and three in Lon-drina, Paraná, PR (23°S, 51°W, elevation 585 m). In the Piraci-caba trials, Rosinha was sown on 5 March 1993, and Carioca on 14 April 1994. These trials will be referred to hereafter as Rosinha SP/March and Carioca SP/April, respectively. In the Londrina trials, Rosinha and Carioca were sown on 18 May 1993, and Cari-oca on 30 August 1993. These trials will be referred to hereafter as Rosinha PR/May, Carioca PR/May, and Carioca PR/August, respectively. Ali trials followed the same experimental design, with 16 plots. Each plot (10 m2) consisted of six rows, 4 m long, spaced 0.5 m apart. Twelve seeds were sown and 10 plants were allowed to grow per linear meter of row. The plots were main-tained with the conventional cultural practices used in commercial fields, including planting and topdressing fertilization, insecticide (methamidophos) sprays, weeding, and, when necessary, overhead irrigation. The trials were planted in areas intensively utilized for éxperimentation with bean crops, except for one of the Piracicaba trials, in which cultivar Rosinha was planted in virgin soil.
To establish several treatments varying in amount of disease, the plots were inoculated, always at nightfall, with P. griseola at inoculum concentrations of 0, 102, 104, or 106 conidia ml¯1. For this, the fields were divided into four strips vertically and four strips horizontally (four plots per strip). The fields were inocu-lated in one direction one time and in the perpendicular direction the next time, with an interval of 7 to 10 days between inocula-tions. By this procedure, one of the 16 plots was never inoculated (0 concentration), one plot always received 106 conidia ml¯1 at each inoculation, and 14 plots were inoculated with the various intermediate combinations of concentrations. Inoculations were initiated at the V2-V3 growth stage (52). The number of inocula-tions varied from two to five. The plot which did not receive in-oculum was sprayed weekly with benomyl or with fentin hydrox-ide, with the objective of obtaining entirely healthy plants. After each inoculation, the plots were covered with black plastic sup-ported by an iron frame until the next morning to provide adequate conditions for infection.
Crop growth, disease severity, and yield. Crop growth, dis-ease sevérity, and yield were evaluated in the two central rows of each plot (disregarding 0.5 m at each end of the row). The single-plant approach was adopted (27), in which six plants in each plot were marked with plastic tape, and thus a total of 96 plants per trial were assessed routinely. The plants were marked after the
appearance of the first trifoliolate leaf, and individual plants of similar height and vigor were selected.
portion of radiation that is intercepted by the canopy (37). Based on Beer's law (37), this proportion is a function of LAI, so that RI = I(1 - exp(-k LAI)), in which k (extinction coefficient) is a dimen-sionless constant. Thus, if RUE is considered constant and (1 - X) is the proportion of healthy leaf area, yield can be related to RI as (54)
The leaf area (LA, cm2) of ali leaves on each marked plant was estimated weekly, starting from the appearance of the first tri-foliolate leaf. For this, the maximum width of the central leaflet of each leaf (L, cm) was measured with a ruler. LA was estimated for both cultivars from the empirical relationship (22)
Assessment of the sevérity of angular leaf spot was simultane-
ous with the evaluation of leaf area, with the aid of a diagram-matic scale (9), with which the mean sevérity (percent) for the three leaflets of ali leaves on ali marked plants was estimated. Even though defoliation was observed, it was not quantified. The cultivars Carioca and Rosinha have indeterminate, polybrachiate growth habits, and it was difficult to identify specific leaves in sequential assessments. Thus, the number, area, and original at-tachment of fallen leaves were not determined. At each evalua-tion, the host growth stage was determined, according to the de-scriptive scale of van Schoonhoven and Pastor-Corrales (52): V0 = germination; VI = emergence; V2 = primary leaves open; V3 = first trifoliolate leaf; V4 = third trifoliolate leaf; R5 = pre-flower-ing; R6 = flowering; R7 = pod formation; R8 = pod filling; and R9 = physiological maturity.
Yield was determined for each marked plant at the end of the crop cycle by weighing the seeds (with 12% moisture). The results were expressed in g m¯2. In the two trials in Piracicaba, Carioca was harvested 80 days after sowing, and Rosinha at 84 days. In the three trials in Londrina, Rosinha was harvested 108 days after sowing, and Carioca at 118 days after the May planting and 86 days after the August planting.
Integral variables. The AUDPC value for each plant was cal-culated by trapezoidal integration (e.g., 17):
in which Xi = X(ti), n is the number of assessments, X is disease se-verity (percent) and (ti+1 - t i ) is the interval between two con-secutive assessments.
The LAI values were obtained by dividing the total leaf area of each plant on each day of assessment by the area occupied per plant (0.05 m2). HAD (days) for each plant or group of plants was calculated as
in which LAI, = LAI(ti). The HLAI value for each evaluation date was calculated as HLAI = LAI(1 - X). The RI, values (MJ m¯2) were given by
in which 7, is the average incident solar radiation (MJ m¯2) in the period (ti+1-ti), and k is the extinction coefficient; £ = 0.7 for both cultivars (34). The HAA value (MJ m¯2) for each plant was calculated as
The HRI value (MJ m¯2) for each assessment date was calculated from the formula HRI = RI(1-X). Incident solar radiation (7) was measured at meteorological stations located less than 500 m from each trial.
Data analysis. The relationship of yield to HAD and to HAA was examined by linear regression performed by STATISTICA software (StatSoft, Tulsa, OK). The relationship of yield to HLAI
Vol. 87, No. 5, 1997 507
and HRI was examined by linear regression forced through the origin, also performed by STATISTICA. The relationship of the slope coefficients from the latter analyses and growth stages was examined by nonlinear regression with PlotlT software for Win-dows (Scientific Programming Enterprises, Haslett, MI).
RESULTS
Solar radiation, disease, and yield. The mean values for daily solar radiation during each trial period ranged from 11.0 MJ m¯2
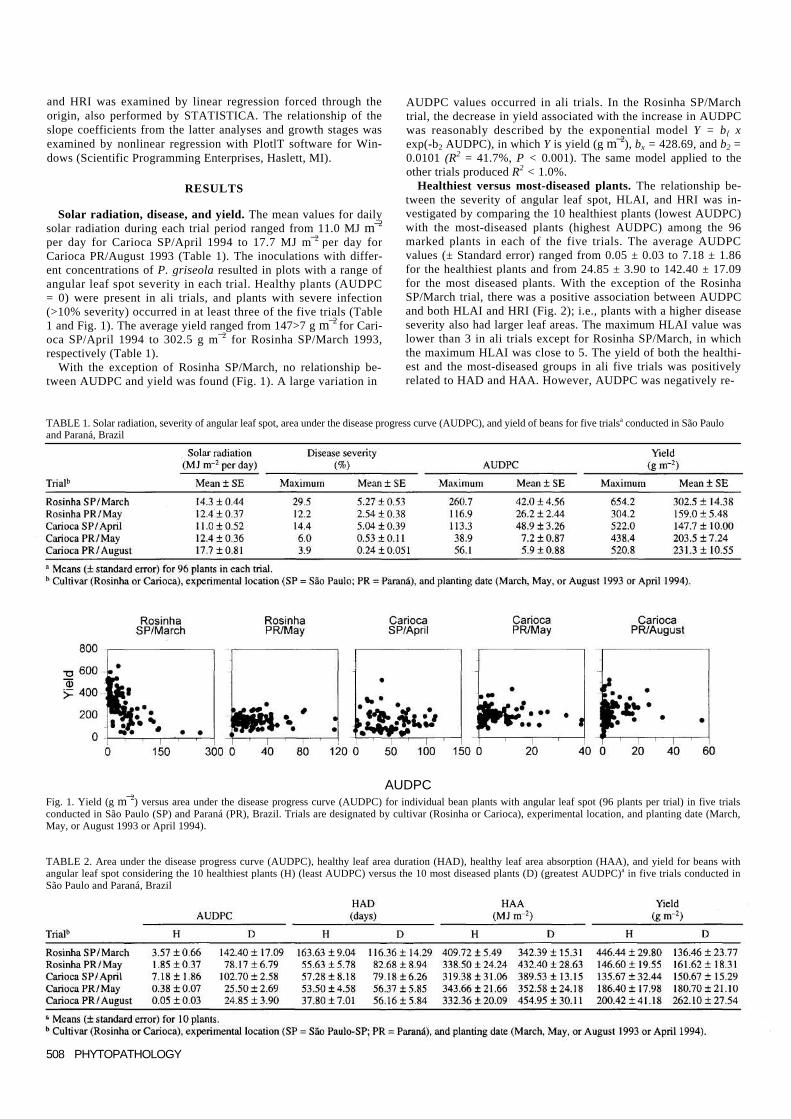
per day for Carioca SP/April 1994 to 17.7 MJ m¯2 per day for Carioca PR/August 1993 (Table 1). The inoculations with differ-ent concentrations of P. griseola resulted in plots with a range of angular leaf spot severity in each trial. Healthy plants (AUDPC = 0) were present in ali trials, and plants with severe infection (>10% severity) occurred in at least three of the five trials (Table 1 and Fig. 1). The average yield ranged from 147>7 g m¯2 for Cari-oca SP/April 1994 to 302.5 g m¯2 for Rosinha SP/March 1993, respectively (Table 1).
With the exception of Rosinha SP/March, no relationship be-tween AUDPC and yield was found (Fig. 1). A large variation in
AUDPC values occurred in ali trials. In the Rosinha SP/March trial, the decrease in yield associated with the increase in AUDPC was reasonably described by the exponential model Y = b{ x exp(-b2 AUDPC), in which Y is yield (g m¯2), bx = 428.69, and b2 = 0.0101 (R2 = 41.7%, P < 0.001). The same model applied to the other trials produced R2 < 1.0%.
Healthiest versus most-diseased plants. The relationship be-tween the severity of angular leaf spot, HLAI, and HRI was in-vestigated by comparing the 10 healthiest plants (lowest AUDPC) with the most-diseased plants (highest AUDPC) among the 96 marked plants in each of the five trials. The average AUDPC values (± Standard error) ranged from 0.05 ± 0.03 to 7.18 ± 1.86 for the healthiest plants and from 24.85 ± 3.90 to 142.40 ± 17.09 for the most diseased plants. With the exception of the Rosinha SP/March trial, there was a positive association between AUDPC and both HLAI and HRI (Fig. 2); i.e., plants with a higher disease severity also had larger leaf areas. The maximum HLAI value was lower than 3 in ali trials except for Rosinha SP/March, in which the maximum HLAI was close to 5. The yield of both the healthi-est and the most-diseased groups in ali five trials was positively related to HAD and HAA. However, AUDPC was negatively re-
TABLE 1. Solar radiation, severity of angular leaf spot, area under the disease progress curve (AUDPC), and yield of beans for five trialsa conducted in São Paulo and Paraná, Brazil
AUDPC Fig. 1. Yield (g m¯2) versus area under the disease progress curve (AUDPC) for individual bean plants with angular leaf spot (96 plants per trial) in five trials conducted in São Paulo (SP) and Paraná (PR), Brazil. Trials are designated by cultivar (Rosinha or Carioca), experimental location, and planting date (March, May, or August 1993 or April 1994).
TABLE 2. Area under the disease progress curve (AUDPC), healthy leaf area duration (HAD), healthy leaf area absorption (HAA), and yield for beans with angular leaf spot considering the 10 healthiest plants (H) (least AUDPC) versus the 10 most diseased plants (D) (greatest AUDPC)a in five trials conducted in São Paulo and Paraná, Brazil
508 PHYTOPATHOLOGY
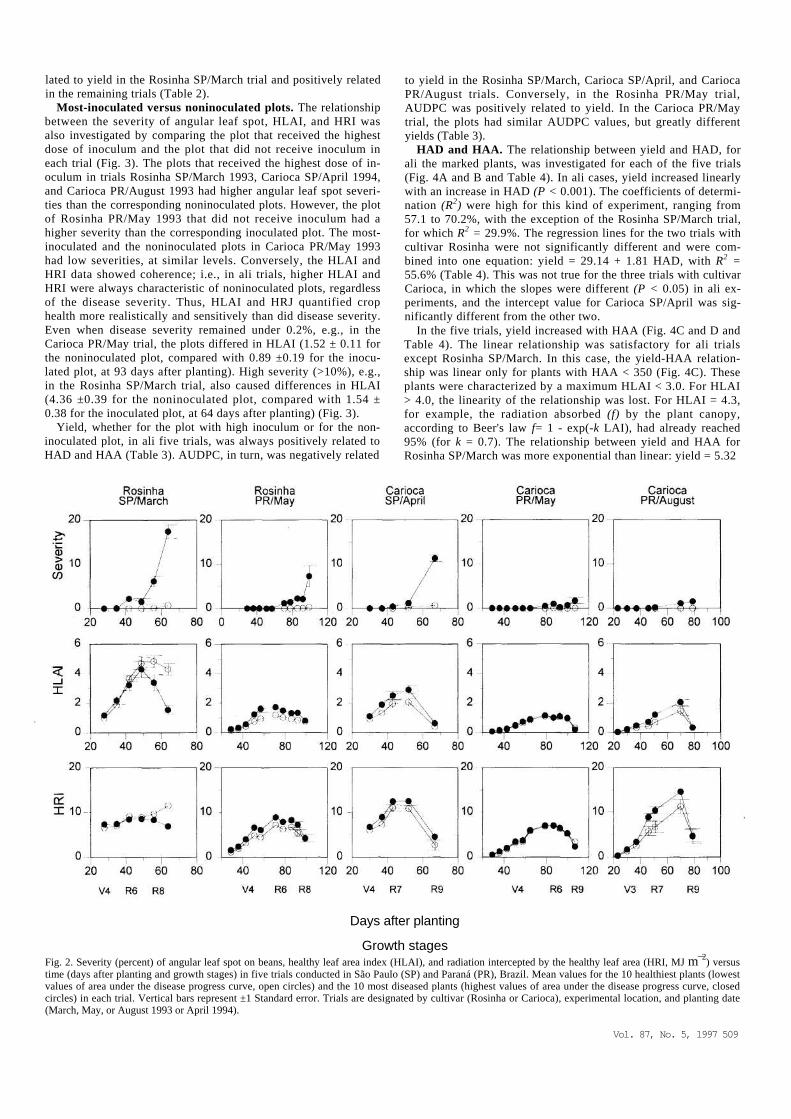
lated to yield in the Rosinha SP/March trial and positively related in the remaining trials (Table 2).
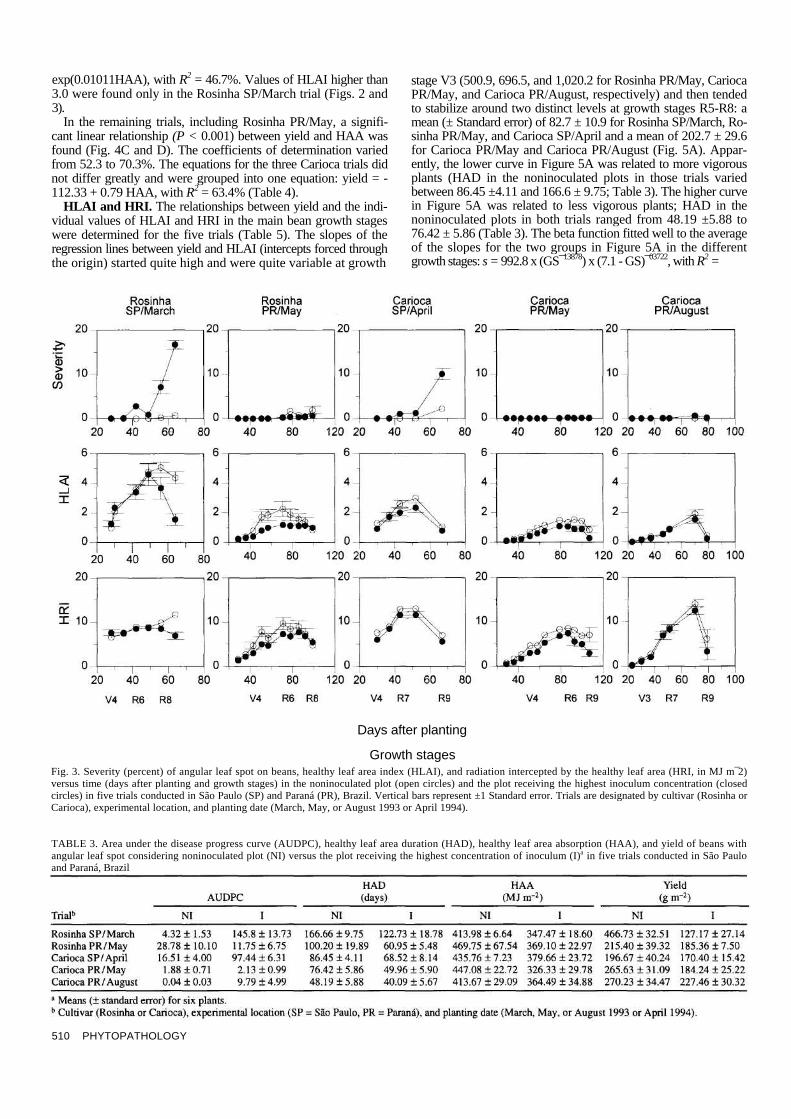
Most-inoculated versus noninoculated plots. The relationship between the severity of angular leaf spot, HLAI, and HRI was also investigated by comparing the plot that received the highest dose of inoculum and the plot that did not receive inoculum in each trial (Fig. 3). The plots that received the highest dose of in-oculum in trials Rosinha SP/March 1993, Carioca SP/April 1994, and Carioca PR/August 1993 had higher angular leaf spot severi-ties than the corresponding noninoculated plots. However, the plot of Rosinha PR/May 1993 that did not receive inoculum had a higher severity than the corresponding inoculated plot. The most-inoculated and the noninoculated plots in Carioca PR/May 1993 had low severities, at similar levels. Conversely, the HLAI and HRI data showed coherence; i.e., in ali trials, higher HLAI and HRI were always characteristic of noninoculated plots, regardless of the disease severity. Thus, HLAI and HRJ quantified crop health more realistically and sensitively than did disease severity. Even when disease severity remained under 0.2%, e.g., in the Carioca PR/May trial, the plots differed in HLAI (1.52 ± 0.11 for the noninoculated plot, compared with 0.89 ±0.19 for the inocu-lated plot, at 93 days after planting). High severity (>10%), e.g., in the Rosinha SP/March trial, also caused differences in HLAI (4.36 ±0.39 for the noninoculated plot, compared with 1.54 ± 0.38 for the inoculated plot, at 64 days after planting) (Fig. 3).
Yield, whether for the plot with high inoculum or for the non-inoculated plot, in ali five trials, was always positively related to HAD and HAA (Table 3). AUDPC, in turn, was negatively related
to yield in the Rosinha SP/March, Carioca SP/April, and Carioca PR/August trials. Conversely, in the Rosinha PR/May trial, AUDPC was positively related to yield. In the Carioca PR/May trial, the plots had similar AUDPC values, but greatly different yields (Table 3).
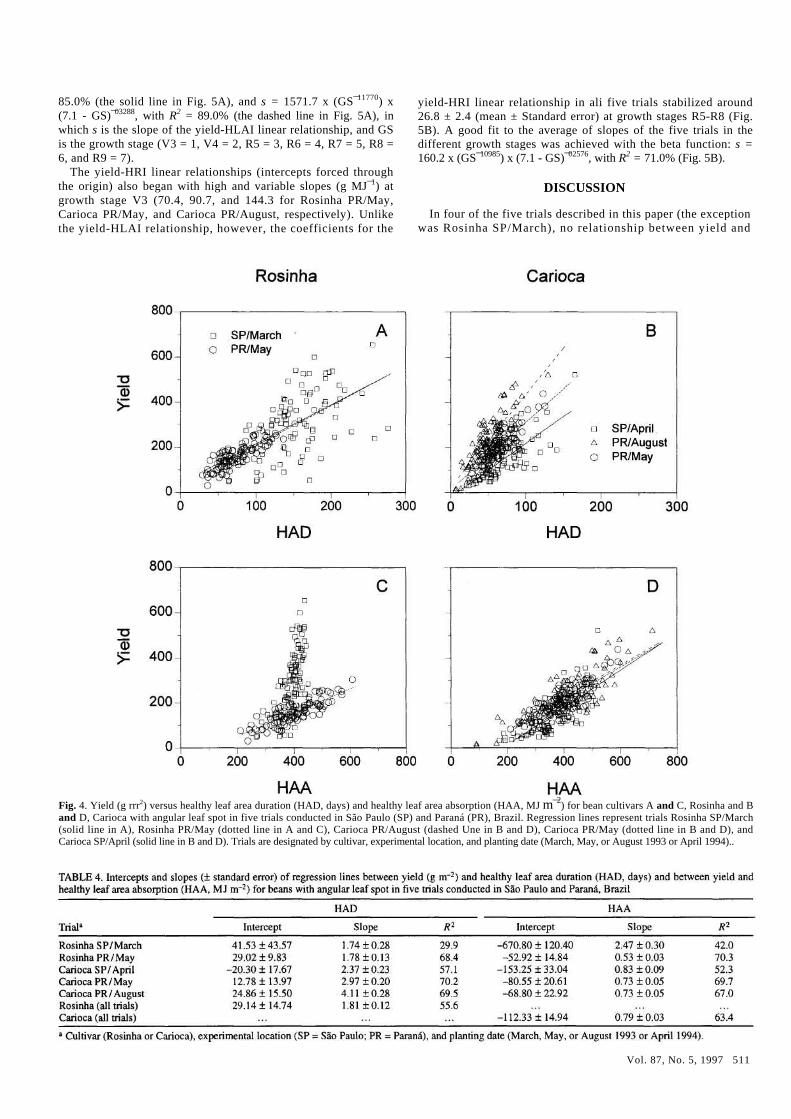
HAD and HAA. The relationship between yield and HAD, for ali the marked plants, was investigated for each of the five trials (Fig. 4A and B and Table 4). In ali cases, yield increased linearly with an increase in HAD (P < 0.001). The coefficients of determi-nation (R2) were high for this kind of experiment, ranging from 57.1 to 70.2%, with the exception of the Rosinha SP/March trial, for which R2 = 29.9%. The regression lines for the two trials with cultivar Rosinha were not significantly different and were com-bined into one equation: yield = 29.14 + 1.81 HAD, with R2 = 55.6% (Table 4). This was not true for the three trials with cultivar Carioca, in which the slopes were different (P < 0.05) in ali ex-periments, and the intercept value for Carioca SP/April was sig-nificantly different from the other two.
In the five trials, yield increased with HAA (Fig. 4C and D and Table 4). The linear relationship was satisfactory for ali trials except Rosinha SP/March. In this case, the yield-HAA relation-ship was linear only for plants with HAA < 350 (Fig. 4C). These plants were characterized by a maximum HLAI < 3.0. For HLAI > 4.0, the linearity of the relationship was lost. For HLAI = 4.3, for example, the radiation absorbed (f) by the plant canopy, according to Beer's law f= 1 - exp(-k LAI), had already reached 95% (for k = 0.7). The relationship between yield and HAA for Rosinha SP/March was more exponential than linear: yield = 5.32
Days after planting
Growth stages Fig. 2. Severity (percent) of angular leaf spot on beans, healthy leaf area index (HLAI), and radiation intercepted by the healthy leaf area (HRI, MJ m¯2) versus time (days after planting and growth stages) in five trials conducted in São Paulo (SP) and Paraná (PR), Brazil. Mean values for the 10 healthiest plants (lowest values of area under the disease progress curve, open circles) and the 10 most diseased plants (highest values of area under the disease progress curve, closed circles) in each trial. Vertical bars represent ±1 Standard error. Trials are designated by cultivar (Rosinha or Carioca), experimental location, and planting date (March, May, or August 1993 or April 1994).
Vol. 87, No. 5, 1997 509
exp(0.01011HAA), with R2 = 46.7%. Values of HLAI higher than 3.0 were found only in the Rosinha SP/March trial (Figs. 2 and 3).
In the remaining trials, including Rosinha PR/May, a signifi-cant linear relationship (P < 0.001) between yield and HAA was found (Fig. 4C and D). The coefficients of determination varied from 52.3 to 70.3%. The equations for the three Carioca trials did not differ greatly and were grouped into one equation: yield = -112.33 + 0.79 HAA, with R2 = 63.4% (Table 4).
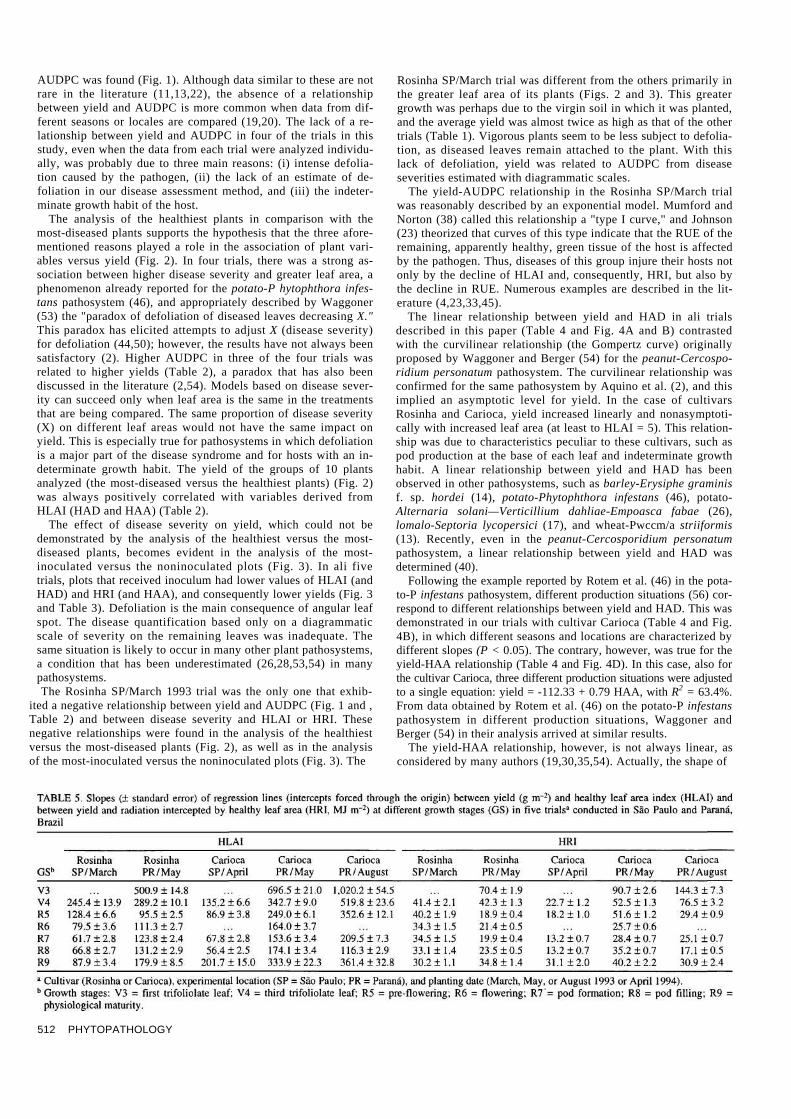
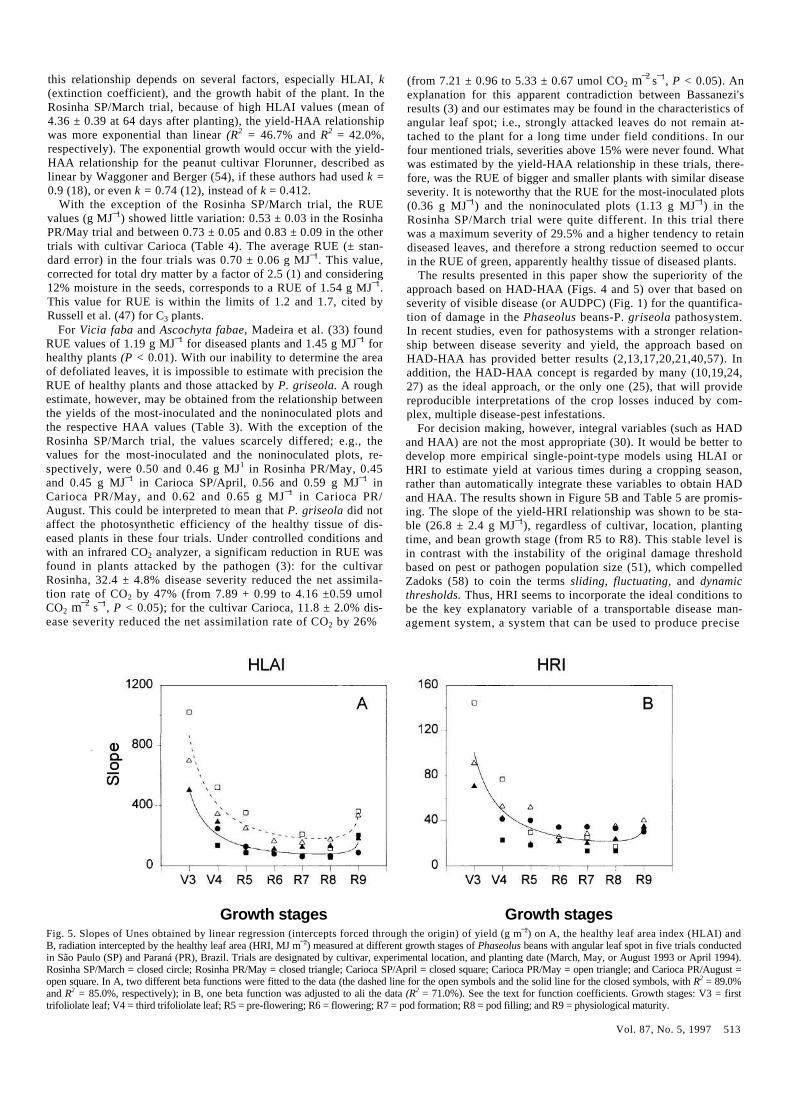
HLAI and HRI. The relationships between yield and the indi-vidual values of HLAI and HRI in the main bean growth stages were determined for the five trials (Table 5). The slopes of the regression lines between yield and HLAI (intercepts forced through the origin) started quite high and were quite variable at growth
stage V3 (500.9, 696.5, and 1,020.2 for Rosinha PR/May, Carioca PR/May, and Carioca PR/August, respectively) and then tended to stabilize around two distinct levels at growth stages R5-R8: a mean (± Standard error) of 82.7 ± 10.9 for Rosinha SP/March, Ro-sinha PR/May, and Carioca SP/April and a mean of 202.7 ± 29.6 for Carioca PR/May and Carioca PR/August (Fig. 5A). Appar-ently, the lower curve in Figure 5A was related to more vigorous plants (HAD in the noninoculated plots in those trials varied between 86.45 ±4.11 and 166.6 ± 9.75; Table 3). The higher curve in Figure 5A was related to less vigorous plants; HAD in the noninoculated plots in both trials ranged from 48.19 ±5.88 to 76.42 ± 5.86 (Table 3). The beta function fitted well to the average of the slopes for the two groups in Figure 5A in the different growth stages: s = 992.8 x (GS¯13878) x (7.1 - GS)¯03722, with R2 =
Days after planting
Growth stages Fig. 3. Severity (percent) of angular leaf spot on beans, healthy leaf area index (HLAI), and radiation intercepted by the healthy leaf area (HRI, in MJ m¯2) versus time (days after planting and growth stages) in the noninoculated plot (open circles) and the plot receiving the highest inoculum concentration (closed circles) in five trials conducted in São Paulo (SP) and Paraná (PR), Brazil. Vertical bars represent ±1 Standard error. Trials are designated by cultivar (Rosinha or Carioca), experimental location, and planting date (March, May, or August 1993 or April 1994).
TABLE 3. Area under the disease progress curve (AUDPC), healthy leaf area duration (HAD), healthy leaf area absorption (HAA), and yield of beans with angular leaf spot considering noninoculated plot (NI) versus the plot receiving the highest concentration of inoculum (I)a in five trials conducted in São Paulo and Paraná, Brazil
510 PHYTOPATHOLOGY
85.0% (the solid line in Fig. 5A), and s = 1571.7 x (GS¯11770) x (7.1 - GS)¯03288, with R2 = 89.0% (the dashed line in Fig. 5A), in which s is the slope of the yield-HLAI linear relationship, and GS is the growth stage (V3 = 1, V4 = 2, R5 = 3, R6 = 4, R7 = 5, R8 = 6, and R9 = 7).
The yield-HRI linear relationships (intercepts forced through the origin) also began with high and variable slopes (g MJ¯1) at growth stage V3 (70.4, 90.7, and 144.3 for Rosinha PR/May, Carioca PR/May, and Carioca PR/August, respectively). Unlike the yield-HLAI relationship, however, the coefficients for the
yield-HRI linear relationship in ali five trials stabilized around 26.8 ± 2.4 (mean ± Standard error) at growth stages R5-R8 (Fig. 5B). A good fit to the average of slopes of the five trials in the different growth stages was achieved with the beta function: s = 160.2 x (GS¯10985) x (7.1 - GS)¯02576, with R2 = 71.0% (Fig. 5B).
DISCUSSION
In four of the five trials described in this paper (the exception was Rosinha SP/March), no relationship between yield and
Fig. 4. Yield (g rrr2) versus healthy leaf area duration (HAD, days) and healthy leaf area absorption (HAA, MJ m¯2) for bean cultivars A and C, Rosinha and B and D, Carioca with angular leaf spot in five trials conducted in São Paulo (SP) and Paraná (PR), Brazil. Regression lines represent trials Rosinha SP/March (solid line in A), Rosinha PR/May (dotted line in A and C), Carioca PR/August (dashed Une in B and D), Carioca PR/May (dotted line in B and D), and Carioca SP/April (solid line in B and D). Trials are designated by cultivar, experimental location, and planting date (March, May, or August 1993 or April 1994)..
Vol. 87, No. 5, 1997 511
AUDPC was found (Fig. 1). Although data similar to these are not rare in the literature (11,13,22), the absence of a relationship between yield and AUDPC is more common when data from dif-ferent seasons or locales are compared (19,20). The lack of a re-lationship between yield and AUDPC in four of the trials in this study, even when the data from each trial were analyzed individu-ally, was probably due to three main reasons: (i) intense defolia-tion caused by the pathogen, (ii) the lack of an estimate of de-foliation in our disease assessment method, and (iii) the indeter-minate growth habit of the host.
The analysis of the healthiest plants in comparison with the most-diseased plants supports the hypothesis that the three afore-mentioned reasons played a role in the association of plant vari-ables versus yield (Fig. 2). In four trials, there was a strong as-sociation between higher disease severity and greater leaf area, a phenomenon already reported for the potato-P hytophthora infes-tans pathosystem (46), and appropriately described by Waggoner (53) the "paradox of defoliation of diseased leaves decreasing X." This paradox has elicited attempts to adjust X (disease severity) for defoliation (44,50); however, the results have not always been satisfactory (2). Higher AUDPC in three of the four trials was related to higher yields (Table 2), a paradox that has also been discussed in the literature (2,54). Models based on disease sever-ity can succeed only when leaf area is the same in the treatments that are being compared. The same proportion of disease severity (X) on different leaf areas would not have the same impact on yield. This is especially true for pathosystems in which defoliation is a major part of the disease syndrome and for hosts with an in-determinate growth habit. The yield of the groups of 10 plants analyzed (the most-diseased versus the healthiest plants) (Fig. 2) was always positively correlated with variables derived from HLAI (HAD and HAA) (Table 2).
The effect of disease severity on yield, which could not be demonstrated by the analysis of the healthiest versus the most-diseased plants, becomes evident in the analysis of the most-inoculated versus the noninoculated plots (Fig. 3). In ali five trials, plots that received inoculum had lower values of HLAI (and HAD) and HRI (and HAA), and consequently lower yields (Fig. 3 and Table 3). Defoliation is the main consequence of angular leaf spot. The disease quantification based only on a diagrammatic scale of severity on the remaining leaves was inadequate. The same situation is likely to occur in many other plant pathosystems, a condition that has been underestimated (26,28,53,54) in many pathosystems. The Rosinha SP/March 1993 trial was the only one that exhib-
ited a negative relationship between yield and AUDPC (Fig. 1 and , Table 2) and between disease severity and HLAI or HRI. These negative relationships were found in the analysis of the healthiest versus the most-diseased plants (Fig. 2), as well as in the analysis of the most-inoculated versus the noninoculated plots (Fig. 3). The
Rosinha SP/March trial was different from the others primarily in the greater leaf area of its plants (Figs. 2 and 3). This greater growth was perhaps due to the virgin soil in which it was planted, and the average yield was almost twice as high as that of the other trials (Table 1). Vigorous plants seem to be less subject to defolia-tion, as diseased leaves remain attached to the plant. With this lack of defoliation, yield was related to AUDPC from disease severities estimated with diagrammatic scales.
The yield-AUDPC relationship in the Rosinha SP/March trial was reasonably described by an exponential model. Mumford and Norton (38) called this relationship a "type I curve," and Johnson (23) theorized that curves of this type indicate that the RUE of the remaining, apparently healthy, green tissue of the host is affected by the pathogen. Thus, diseases of this group injure their hosts not only by the decline of HLAI and, consequently, HRI, but also by the decline in RUE. Numerous examples are described in the lit-erature (4,23,33,45).
The linear relationship between yield and HAD in ali trials described in this paper (Table 4 and Fig. 4A and B) contrasted with the curvilinear relationship (the Gompertz curve) originally proposed by Waggoner and Berger (54) for the peanut-Cercospo-ridium personatum pathosystem. The curvilinear relationship was confirmed for the same pathosystem by Aquino et al. (2), and this implied an asymptotic level for yield. In the case of cultivars Rosinha and Carioca, yield increased linearly and nonasymptoti-cally with increased leaf area (at least to HLAI = 5). This relation-ship was due to characteristics peculiar to these cultivars, such as pod production at the base of each leaf and indeterminate growth habit. A linear relationship between yield and HAD has been observed in other pathosystems, such as barley-Erysiphe graminis f. sp. hordei (14), potato-Phytophthora infestans (46), potato-Alternaria solani—Verticillium dahliae-Empoasca fabae (26), lomalo-Septoria lycopersici (17), and wheat-Pwccm/a striiformis (13). Recently, even in the peanut-Cercosporidium personatum pathosystem, a linear relationship between yield and HAD was determined (40).
Following the example reported by Rotem et al. (46) in the pota-to-P infestans pathosystem, different production situations (56) cor-respond to different relationships between yield and HAD. This was demonstrated in our trials with cultivar Carioca (Table 4 and Fig. 4B), in which different seasons and locations are characterized by different slopes (P < 0.05). The contrary, however, was true for the yield-HAA relationship (Table 4 and Fig. 4D). In this case, also for the cultivar Carioca, three different production situations were adjusted to a single equation: yield = -112.33 + 0.79 HAA, with R2 = 63.4%. From data obtained by Rotem et al. (46) on the potato-P infestans pathosystem in different production situations, Waggoner and Berger (54) in their analysis arrived at similar results.
The yield-HAA relationship, however, is not always linear, as considered by many authors (19,30,35,54). Actually, the shape of
512 PHYTOPATHOLOGY
this relationship depends on several factors, especially HLAI, k (extinction coefficient), and the growth habit of the plant. In the Rosinha SP/March trial, because of high HLAI values (mean of 4.36 ± 0.39 at 64 days after planting), the yield-HAA relationship was more exponential than linear (R2 = 46.7% and R2 = 42.0%, respectively). The exponential growth would occur with the yield-HAA relationship for the peanut cultivar Florunner, described as linear by Waggoner and Berger (54), if these authors had used k = 0.9 (18), or even k = 0.74 (12), instead of k = 0.412.
With the exception of the Rosinha SP/March trial, the RUE values (g MJ¯1) showed little variation: 0.53 ± 0.03 in the Rosinha PR/May trial and between 0.73 ± 0.05 and 0.83 ± 0.09 in the other trials with cultivar Carioca (Table 4). The average RUE (± stan-dard error) in the four trials was 0.70 ± 0.06 g MJ¯1. This value, corrected for total dry matter by a factor of 2.5 (1) and considering 12% moisture in the seeds, corresponds to a RUE of 1.54 g MJ¯1. This value for RUE is within the limits of 1.2 and 1.7, cited by Russell et al. (47) for C3 plants.
For Vicia faba and Ascochyta fabae, Madeira et al. (33) found RUE values of 1.19 g MJ¯1 for diseased plants and 1.45 g MJ¯1 for healthy plants (P < 0.01). With our inability to determine the area of defoliated leaves, it is impossible to estimate with precision the RUE of healthy plants and those attacked by P. griseola. A rough estimate, however, may be obtained from the relationship between the yields of the most-inoculated and the noninoculated plots and the respective HAA values (Table 3). With the exception of the Rosinha SP/March trial, the values scarcely differed; e.g., the values for the most-inoculated and the noninoculated plots, re-spectively, were 0.50 and 0.46 g MJ1 in Rosinha PR/May, 0.45 and 0.45 g MJ¯1 in Carioca SP/April, 0.56 and 0.59 g MJ¯1 in Carioca PR/May, and 0.62 and 0.65 g MJ¯1 in Carioca PR/ August. This could be interpreted to mean that P. griseola did not affect the photosynthetic efficiency of the healthy tissue of dis-eased plants in these four trials. Under controlled conditions and with an infrared CO2 analyzer, a significam reduction in RUE was found in plants attacked by the pathogen (3): for the cultivar Rosinha, 32.4 ± 4.8% disease severity reduced the net assimila-tion rate of CO2 by 47% (from 7.89 + 0.99 to 4.16 ±0.59 umol CO2 m¯2 s¯1, P < 0.05); for the cultivar Carioca, 11.8 ± 2.0% dis-ease severity reduced the net assimilation rate of CO2 by 26%
(from 7.21 ± 0.96 to 5.33 ± 0.67 umol CO2 m¯2 s¯1, P < 0.05). An explanation for this apparent contradiction between Bassanezi's results (3) and our estimates may be found in the characteristics of angular leaf spot; i.e., strongly attacked leaves do not remain at-tached to the plant for a long time under field conditions. In our four mentioned trials, severities above 15% were never found. What was estimated by the yield-HAA relationship in these trials, there-fore, was the RUE of bigger and smaller plants with similar disease severity. It is noteworthy that the RUE for the most-inoculated plots (0.36 g MJ¯1) and the noninoculated plots (1.13 g MJ¯1) in the Rosinha SP/March trial were quite different. In this trial there was a maximum severity of 29.5% and a higher tendency to retain diseased leaves, and therefore a strong reduction seemed to occur in the RUE of green, apparently healthy tissue of diseased plants.
The results presented in this paper show the superiority of the approach based on HAD-HAA (Figs. 4 and 5) over that based on severity of visible disease (or AUDPC) (Fig. 1) for the quantifica-tion of damage in the Phaseolus beans-P. griseola pathosystem. In recent studies, even for pathosystems with a stronger relation-ship between disease severity and yield, the approach based on HAD-HAA has provided better results (2,13,17,20,21,40,57). In addition, the HAD-HAA concept is regarded by many (10,19,24, 27) as the ideal approach, or the only one (25), that will provide reproducible interpretations of the crop losses induced by com-plex, multiple disease-pest infestations.
For decision making, however, integral variables (such as HAD and HAA) are not the most appropriate (30). It would be better to develop more empirical single-point-type models using HLAI or HRI to estimate yield at various times during a cropping season, rather than automatically integrate these variables to obtain HAD and HAA. The results shown in Figure 5B and Table 5 are promis-ing. The slope of the yield-HRI relationship was shown to be sta-ble (26.8 ± 2.4 g MJ¯1), regardless of cultivar, location, planting time, and bean growth stage (from R5 to R8). This stable level is in contrast with the instability of the original damage threshold based on pest or pathogen population size (51), which compelled Zadoks (58) to coin the terms sliding, fluctuating, and dynamic thresholds. Thus, HRI seems to incorporate the ideal conditions to be the key explanatory variable of a transportable disease man-agement system, a system that can be used to produce precise
Growth stages Growth stages Fig. 5. Slopes of Unes obtained by linear regression (intercepts forced through the origin) of yield (g m¯2) on A, the healthy leaf area index (HLAI) and B, radiation intercepted by the healthy leaf area (HRI, MJ m¯2) measured at different growth stages of Phaseolus beans with angular leaf spot in five trials conducted in São Paulo (SP) and Paraná (PR), Brazil. Trials are designated by cultivar, experimental location, and planting date (March, May, or August 1993 or April 1994). Rosinha SP/March = closed circle; Rosinha PR/May = closed triangle; Carioca SP/April = closed square; Carioca PR/May = open triangle; and Carioca PR/August = open square. In A, two different beta functions were fitted to the data (the dashed line for the open symbols and the solid line for the closed symbols, with R2 = 89.0% and R2 = 85.0%, respectively); in B, one beta function was adjusted to ali the data (R2 = 71.0%). See the text for function coefficients. Growth stages: V3 = first trifoliolate leaf; V4 = third trifoliolate leaf; R5 = pre-flowering; R6 = flowering; R7 = pod formation; R8 = pod filling; and R9 = physiological maturity.
Vol. 87, No. 5, 1997 513
recommendations at the farm level. For this, Lopes et al. (29) pro-posed the adoption, for each production situation (56), of a dis-ease-free "control plot." Each production situation should be the most homogeneous possible with regard to factors influencing yield, such as soil, microclimate, cultural practices, and cultivar. Based on the yield-HRI relationship and using information on the efficiency of the possible control measures and on the costs involved, a concep-tually new damage threshold is determined. The threshold is no longer expressed in insects per plant or severity of visible disease, both of uncertain relationship with yield (54), but in units of HRI (MJ m¯2). Thus, control measures will only be recommended when the difference between the HRI of the control plot and the HRI of the crop is equal to, or higher than, the damage threshold (29).
Despite the nonexistence of data on the control effect in HRI for angular leaf spot, an approximate calculation may be on the de-gree of sensitivity with which the HRI should be determined in the decision making process. The slope of 26.8 g MJ¯1 (in growth stages R5-R8) means that each unit of HRI represents a yield increase of 268 kg ha¯1 (on the assumption of 200,000 plants ha ¯1). If $40 ha¯1 is considered the control cost of P. griseola (equivalem to approximately 96 kg of beans), we come to the required accu-racy of 96/268 = 0.36, or approximately 1/3 of a unit of HRI, which is also a rough estimate of the damage threshold based on HRI for the conditions in southeastern Brazil. This means, in terms of HLAI, which is the variable really quantified in the field, an accuracy in the order of 1/20 unit of HLAI for bean crops with HLAI of 0.2, 1/10 for 1.2, 1/5 for 2.2, 1/3 for 2.9, 1/2.5 for 3.2, 1/2 for 3.5, and 1/1 for 4.5 (values calculated for mean radiation of /= 12.0 MJ m¯2 and k = 0.7). Similar results can be obtained with the employment of HLAI instead of HRI (Fig. 5A and Table 5). Compared with the HRI, HLAI has the disadvantage of being influenced by the production situation.
To satisfy the requirements for decision making based on the HLAI-HRI approach, new demands are placed on the scientist and on the farmer in the assessment of the crop during the season. They must assess, as usual, the proportion of total leaf area that is affected by disease. The assessment of disease is facilitated by pictorial and diagrammatic keys. In addition, the leaf area (to es-timate LAI) must be determined at frequent intervals. To assess the leaf area of a plant, diagrammatic scales for the sizes of leaves or the sizes of whole plants are helpful assessment tools (42). Such methods, however, may not have the required accuracy to permit decision making. The determination of the width of the central leaflet of each leaf on marked plants, as in this study, has the required accuracy and is inexpensive and nondestructive. However, this method involves a tremendous amount of field work, which makes its large-scale implementation infeasible. Re-cently, several electronic instruments, such as a sun-fleck cep-tometer (15) and a multispectral radiometer (39,40), have been tested to estimate leaf area and LAI, with promising results for both research studies and precision farming systems (20).
ACKNOWLEDGMENTS Research conducted by S. M. T. P. G. Carneiro and C. V. Godoy in par-
tial fulfillment of the requirements for their M.Sc. degrees, Escola Su-perior de Agricultura "Luiz de Queiroz," Universidade de São Paulo, São Paulo, Brazil. This research was partially supported by the European Com-mission (projects TS3-CT92-0094 and ERB3514PL950224), FAPESP (project 95/4521-5), DAAD-CAPES (project Probral 008/94), and CNPq (projects 301293/85-6 and 300124/93-7).
LITERATURE CITED
1. Almeida, A. A. F, Lopes, N. F, Oliva, N. A., and Barros, R. S. 1988. Desenvolvimento e partição de assimilados em Phaseolus vulgaris sub metido a três doses de nitrogênio e três níveis de luz. Pesqui. Agropecu. Bras. 23:837-847.
2. Aquino, V. M., Shokes, F. M., Berger, R. D., Gorbet, D. W., and
514 PHYTOPATHOLOGY
Kucharek, T. A. 1992. Relationships among late leafspot, healthy leaf area duration, canopy reflectance, and pod yield of peanut. Phytopathol-ogy 82:546-552.
3. Bassanezi, R. B. 1995. Interações entre o mosaico-em-desenho do feijoeiro e duas doenças fúngicas, ferrugem e mancha angular, em plan tas de feijoeiro. M.Sc. dissertation. Escola Superior de Agricultura "Luiz de Queiroz," Piracicaba, SP, Brazil.
4. Bastiaans, L. 1991. Ratio between virtual and visual lesion size as a measure to describe reduction in leaf photosynthesis of rice due to leaf blast. Phytopathology 81:611-615.
5. Bastiaans, L. 1993. Effects of leaf blast on growth and production of a rice crop. 2. Analysis of the reduction in dry matter production, using two models with different complexity. Neth. J. Plant Pathol. 99:19-28.
6. Bastiaans, L., and Kropff, M. J. 1993. Effects of leaf blast on photosyn thesis of rice. 2. Canopy photosynthesis. Neth. J. Plant Pathol. 99(Suppl. 3):205-217.
7. Bastiaans, L., Rabbinge, R., and Zadoks, J. C. 1994. Understanding and modeling leaf blast effects on crop physiology and yield. Pages 357-380 in: Rice Blast Disease. R. S. Zeigler, S. A. Leong, and P. S. Teng, eds. C.A.B. International, Wallingford, England.
8. Bergamin Filho, A., and Amorim, L. 1996. Doenças de Plantas Tropi cais: Epidemiologia e Controle Econômico. Ceres, São Paulo, Brazil.
9. Bergamin Filho, A., Lopes, D. B., Amorim, L., Godoy, C. V., and Berger, R. D. 1995. Avaliação de danos causados por doenças de plantas. Rev. Anu. Patol. Plantas 3:133-184.
10. Berger, R. D. 1988. Measuring disease intensity. Biol. Cult. Tests Con- trol Plant Dis.3:1-4.
11. Bissonnette, S. M., D'Arcy, C. J., and Pedersen, W. L. 1994. Yield loss in two spring oat cultivars due to Puccinia coronata f. sp. avenae in the presence or absence of barley yellow dwarf virus. Phytopathology 84: 363-371.
12. Bourgeois, G., and Boote, K. J. 1992. Leaflet and canopy photosynthesis of peanut affected by late leafspot. Agron. J. 84:359-366.
13. Bryson, R. J., Sylvester-Bradley, R., Scott, R. K., and Paveley, N. D. 1995. Reconciling the effects of yellow rust on yield of winter wheat through measurements of green leaf area and radiation interception. Pages 9-18 in: Physiological Responses of Plants to Pathogens. R. D. Walters, J. D. Scholes, R. J. Bryson, N. D. Paul, and N. McRoberts, eds. Association of Applied Biologists, Wellesbourne, Warwick, England.
14. Carver, T. L. W., and Griffiths, E. 1981. Relationship between powdery mildew infection, green leaf area and grain yield of barley. Ann. Appl. Biol. 99:255-266.
15. Chason, J. W., Baldocchi, D. D., and Huston, M. A. 1991. A comparison of direct and indirect methods for estimating forest canopy leaf area. Agric. For. Meteorol. 57:107-128.
16. Corrêa-Victoria, F. J., Pastor-Corrales, M. A., and Saettler, A. W. 1989. Angular leaf spot. Pages 59-75 in: Bean Production Problems in the Tropics, 2nd. ed. H. F. Schwartz and M. A. Pastor-Corrales, eds. CIAT (International Center of Tropical Agriculture), Cali, Colômbia.
17. Ferrandino, F. J., and Elmer, W. H. 1992. Reduction in tomato yield due to Septoria leafspot. Plant Dis. 76:208-211.
18. Gardner, F. P, and Auma, E. O. 1989. Canopy structure, light inter ception, and yield and market quality of peanut genotypes as influenced by planting pattern and planting date. Field Crops Res. 20:13-29.
19. Gaunt, R. E. 1995. The relationship between plant disease severity and yield. Annu. Rev. Phytopathol. 33:119-144.
20. Gaunt, R. E., and Bryson, R. J. 1995. Plant and crop yield potential and response to disease. Pages 1-7 in: Physiological Responses of Plants to Pathogens. R. D. Walters, J. D. Scholes, R. J. Bryson, N. D. Paul, and N. McRoberts, eds. Association of Applied Biologists, Wellesbourne, War wick, England.
21. Hartman, G. L., and Sinclair, J. B. 1996. Red leaf blotch (Dactuliochaeta glycines) of soybeans (Glycine max) and its relationship to yield. Plant • Pathol. 45:332-343.
22. Iamauti, M. T. 1995. Avaliação de danos causados por Uromyces appen- diculatus no feijoeiro. Ph.D. dissertation. Escola Superior de Agricultura "Luiz de Queiroz," Piracicaba, SP, Brazil.
23. Johnson, K. B. 1987. Defoliation, disease, and growth: A reply. Phyto pathology 77:1495-1497.
24. Johnson, K. B. 1990. Assessing multiple pest populations and their ef fects on crop yield. Pages 203-214 in: Crop Loss Assessment in Rice. P. S. Teng, ed. International Rice Research Institute, Manila, Philippines.
25. Johnson, K. B. 1992. Evaluation of a mechanistic model that describes potato crop losses caused by multiple pests. Phytopathology 82:363-369.
26. Johnson, K. B., Teng, P. S., and Radcliffe, E. B. 1987. Analysis of potato foliage losses caused by interacting infestations of early blight, Verticil- lium wilt, and potato leafhopper; and the relationship to yield. J. Plant Dis. Prot. 94:22-33.
27. Kranz, J., and Jõrg, E. 1989. The synecological approach in plant disease epidemiology; Rev. Trop. Plant Pathol. 6:27-38.
28. Lim, L. G., and Gaunt, R. E. 1981. Leaf area as a factor in disease as- sessment. J. Agric. Sei. 97:481-483.
29. Lopes, D. B., Berger, R. D., and Bergamin Filho, A. 1994. Absorção da area foliar sadia (HAA): Uma nova abordagem para a quantificação de dano e para o manejo integrado de doença. Summa Phytopathol. 20:143-151.
30. Madden L. V, and Nutter, F. W., Jr. 1995. Modeling crop losses at the field scale. Can. J. Plant Pathol. 17:124-137.
31. Madeira, A. C, and Clark, J. A. 1994. Disease and resource capture. Pages 167-188 in: Resource Capture by Crops. J. L. Monteith, R. K. Scott, and M. H. Unsworth, eds. Nottingham University Press, Lough- borough, Leicestershire, England.
32. Madeira, A. C, and Clark, J. A. 1995. The principies of resource capture in relation to necrotrophic infection. Pages 19-31 in: Physiological Re sponses of Plants to Pathogens. R. D. Walters, J. D. Scholes, R. J. Bryson, N. D. Paul, and N. McRoberts, eds. Association of Applied Bi- ologists, Wellesbourne, Warwick, England.
33. Madeira, A. C, Clark, J. A., and Rossall, S. 1994. Growth and light interception in field bean (Vicia faba) infected by Ascochyta fabae. J. Agric. Sei. 123:225-232.
34. Miglioranza, E. 1992. Modelo matemático-fisiológico para simular o crescimento e a produtividade da cultura do feijão (Phaseolus vulgaris L.). Ph.D. dissertation. UFV, Viçosa.
35. Monteith, J. L. 1977. Climate and the efficiency of crop produetion in Britain. Philos. Trans. R. Soe. London 281:277-294.
36. Monteith, J. L. 1981. Does light limit crop produetion? Pages 23-28 in: Physiological Processes Limiting Plant Productivity. C. B. Johnson, ed. Butterworths, London.
37. Monteith, J. L., and Unsworth, M. 1990. Principies of Environmental Physics. Arnold, New York.
38. Mumford, J. D., and Norton, G. A. 1987. Economics of integrated pest control. Pages 191-200 in: Crop Loss Assessment and Pest Management. P. S. Teng, ed. The American Phytopathological Society, St. Paul, MN.
39. Nilsson, H.-E. 1995. Remote sensing and image analysis in plant pathol- ogy. Can. J. Plant Pathol. 17:154-166.
40. Nutter, F. W., Jr., and Littrell, R. H. 1996. Relationships between defoli- ation, canopy reflectance and pod yield in the peanut-late leafspot patho- system. Crop Prot. 15:135-142.
41. Nutter, F. W., Jr., Teng, P. S., and Royer, M. H. 1993. Terms and con- cepts for yield, crop loss, and disease thresholds. Plant Dis. 77:211-215.
42. Owen, P. C. 1968. A measuring scale for areas of cereal leaves. Exp. Agric. 4:275-278.
43. Pinnschmidt, H. O., Teng, P. S., and Young, L. 1994. Methodology for quantifying rice yield effects of blast. Pages 381-408 in: Rice Blast Dis ease. R. S. Zeigler, S. A. Leong, and P. S. Teng, eds. C.A.B. Inter-
national, Wallingford, Warwick, England. 44. Plaut, J. L., and Berger, R. D. 1980. Development of Cercosporidium
personatum in three peanut canopy layers. Peanut Sei. 7:46-49. 45. Rossing, W. A. H., van Oijen, M., van der Werf, W., Bastiaans, L., and
Rabbinge, R. 1992. Modelling the effects of foliar pests and pathogens on light interception, photosynthesis, growth rate and yield of field crops. Pages 161-180 in: Pests and Pathogens—Plant Responses to Foliar At- tack. P. G. Ayres, ed. Bios Scientific Publishers, Oxford.
46. Rotem, J., Bashi, E., and Kranz, J. 1983. Studies of crop loss in potato blight caused by Phytophthora infestam. Plant Pathol. 32:117-122.
47. Russell, G., Jarvis, P. G., and Monteith, J. L. 1989. Absorption of radia- tion by canopies and stand growth. Pages 21-39 in: Plant Canopies: Their Growth, Form and Function. G. Russell, B. Marshall, and P. G. Jarvis, eds. Cambridge University Press, Cambridge.
48. Sartorato, A., and Rava, C. A. 1992. Influência da cultivar e do número de inoculações na severidade da mancha angular (Isariopsis griseola) e nas perdas na produção do feijoeiro comum (Phaseolus vulgaris). Fito- patol. Bras. 17:247-251.
49. Schwartz, H. F, Corrêa V, F, Pineda D., P. A., Otoya, M. M., and Kath- erman, M. J. 1981. Dry bean yield losses caused by Ascochyta, angular, and white leaf spots in Colômbia. Plant Dis. 65:494-496.
50. Shokes, F. M., Berger, R. D., Smith, D. H., and Rasp, J. M. 1987. Re- liability of disease assessment procedures: A case study with late leaf spot of peanut. Oleagineux 42:245-251.
51. Stern, V. M., Smith, R. F, van den Bosch. R., and Hagen, K. S. 1959. The integrated control concept. Hilgardia 28:81-101.
52. van Schoonhoven, A., and Pastor-Corrales, M. A. 1987. Sistema Están- dar para Ia Evaluación de Germoplasma de Frijol. CIAT (International Center of Tropical Agriculture), Cali, Colômbia.
53. Waggoner, P. E. 1990. Assembling and using models of epidemies. Pages 230-260 in: Epidemies of Plant Diseases: Mathematical Analysis and Modeling. J. Kranz, ed. Springer, Berlin.
54. Waggoner, P. E., and Berger, R. D. 1987. Defoliation, disease, and growth. Phytopathology 77:393-398.
55. Watson, D. J. 1947. Comparative physiological studies on the growth of field crops. I. Variation in net assimilation rate and leaf area between species and varieties, and within and between years. Ann. Bot. 11:41-76.
56. Wit, C. T, and Penning de Vries, F W. T. 1982. Uanalyse des systèmes de produetion primaire. Pages 20-27 in: La Productivité des Pâturages Sahéliens. F W. T. Penning de Vries and M. A. Djiteye, eds. Pudoc, Wageningen, Netherlands.
57. Wright, A. C, and Gaunt, R. E. 1992. Disease-yield relationships in barley. I. Yield, dry matter accumulation and yield loss models. Plant Pathol. 41:676-687.
58. Zadoks, J. C. 1985. On the conceptual basis of crop loss assessment: The threshold theory. Annu. Rev. Phytopathol. 23:455-473.
Related Documents