Anesthesia Machine, Monitoring L.Dadák ARK FNUSA & LF MU

Welcome message from author
This document is posted to help you gain knowledge. Please leave a comment to let me know what you think about it! Share it to your friends and learn new things together.
Transcript

Anesthesia Machine,Monitoring
L.Dadák
ARK FNUSA & LF MU

O2
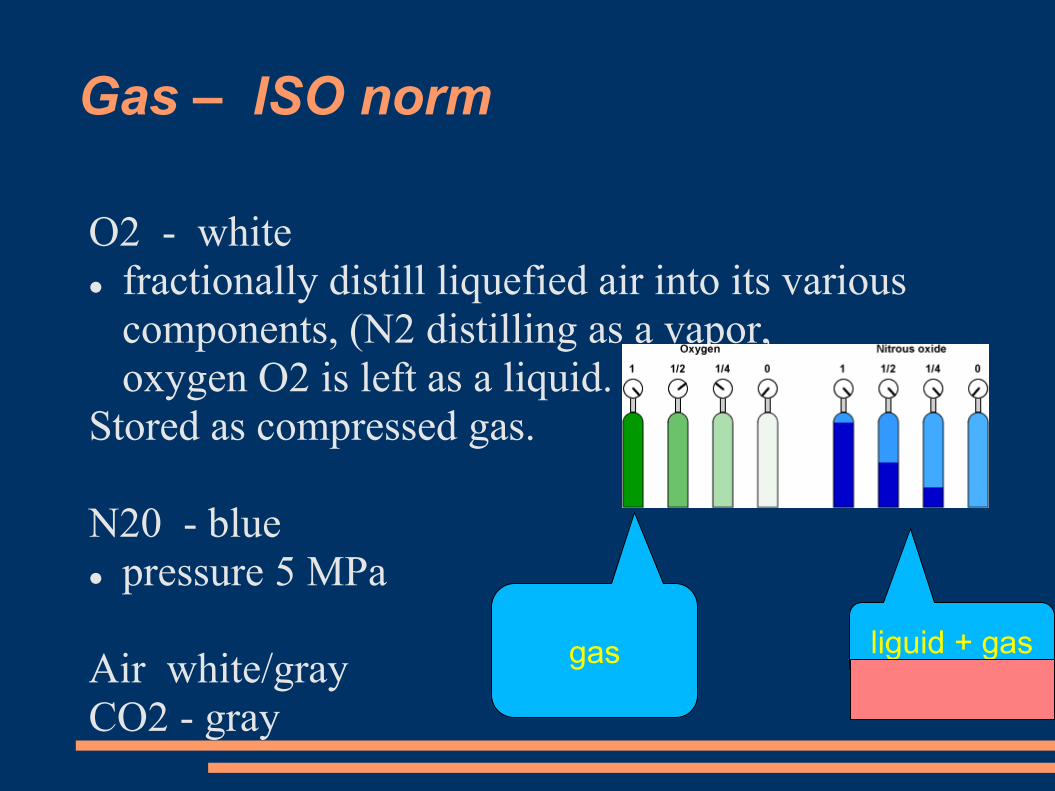
Gas – ISO norm
O2 - white
fractionally distill liquefied air into its various
components, (N2 distilling as a vapor,
oxygen O2 is left as a liquid.
Stored as compressed gas.
N20 - blue
pressure 5 MPa
Air white/gray
CO2 - gray
gas liguid + gas

N2O

Anesthesia Machine
is able to ventilate the patient by defined mixture of gasses
Parts: 1.High pressure system2.Low pressure system3.Breathing circuit – in/expiratory part4.Ventilation systems (manual and mechanical)5.Scavenging system
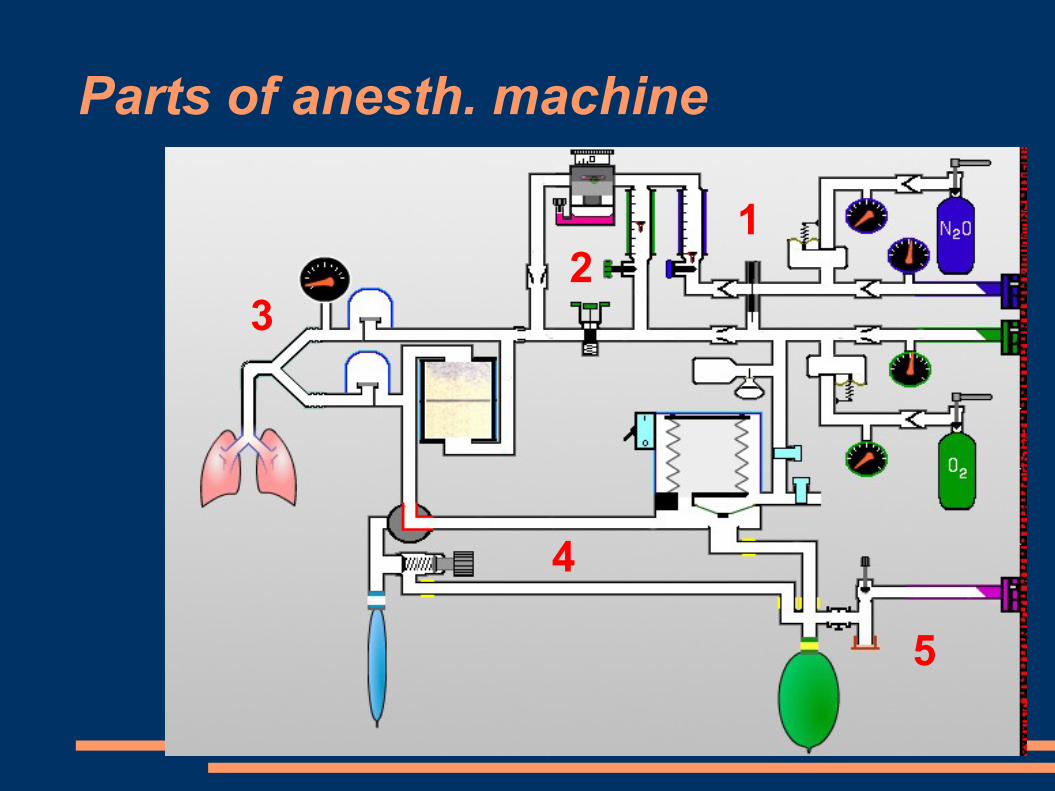
Parts of anesth. machine
12
3
4
5
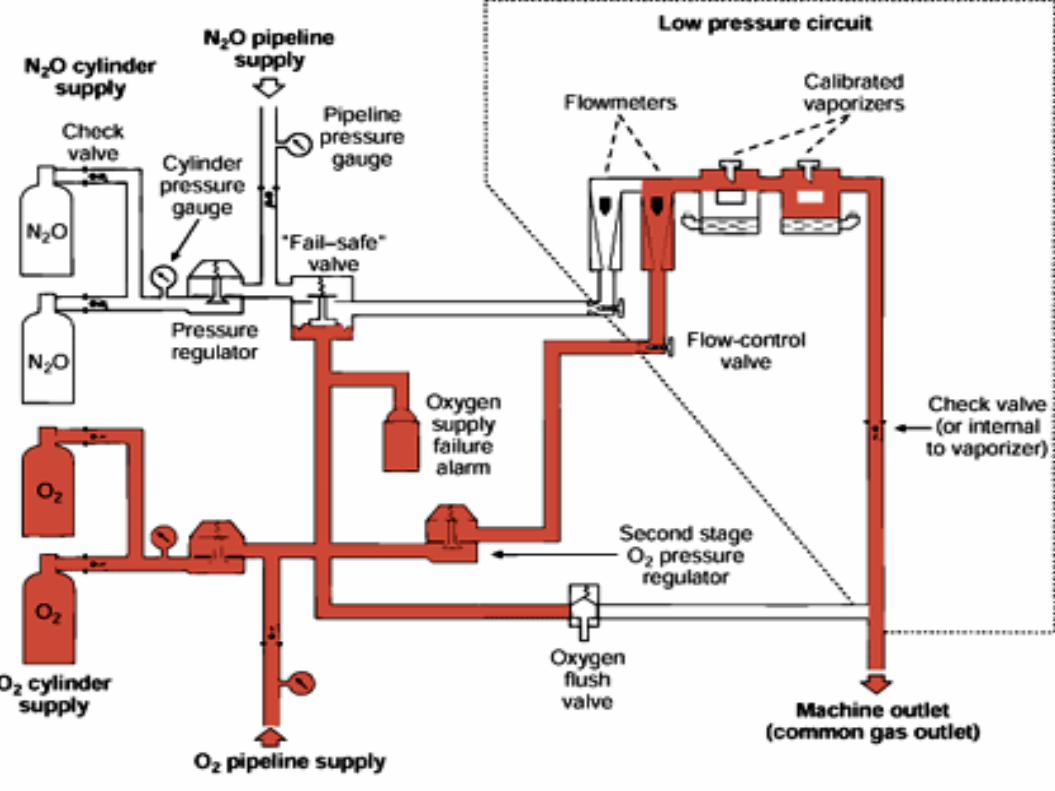
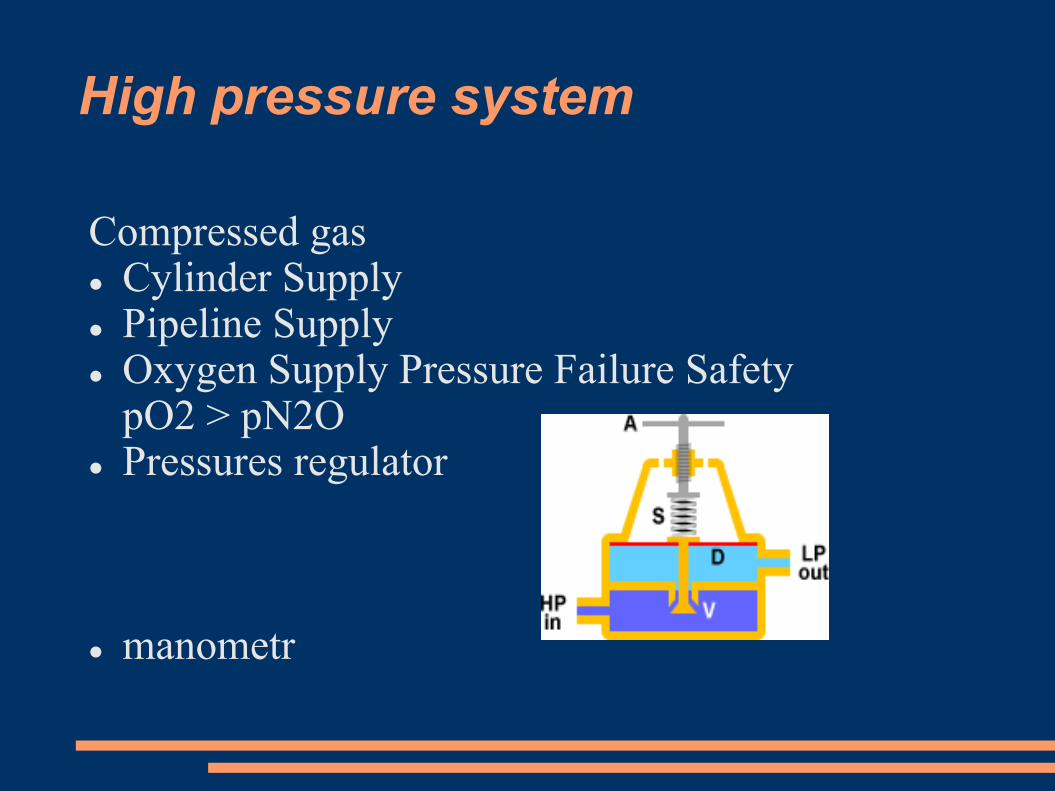
High pressure system
Compressed gas Cylinder Supply Pipeline Supply Oxygen Supply Pressure Failure Safety
pO2 > pN2O Pressures regulator
manometr

Low pressure system
flowmeter O2, AIR, N2O Oxygen flush valve
= Bypass, Vaporizer APL valve
to deliver appropriate concentration, flow
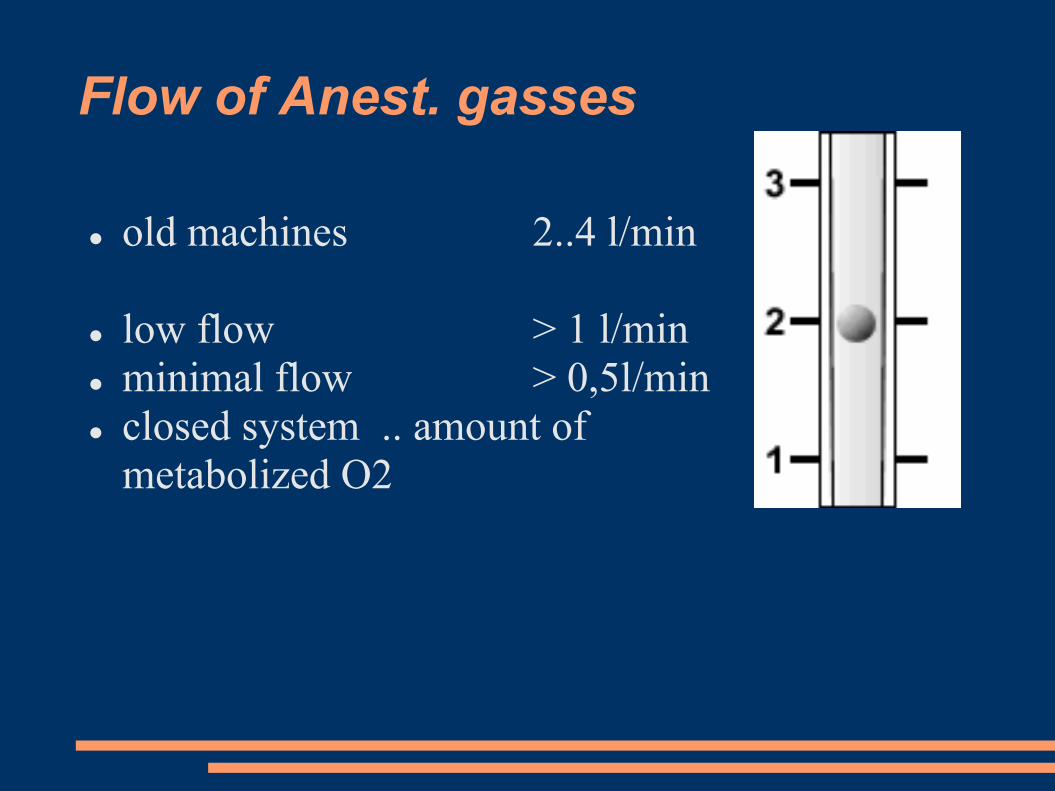
Flow of Anest. gasses
old machines 2..4 l/min
low flow > 1 l/min
minimal flow > 0,5l/min
closed system .. amount of
metabolized O2

Vaporizer – easy model
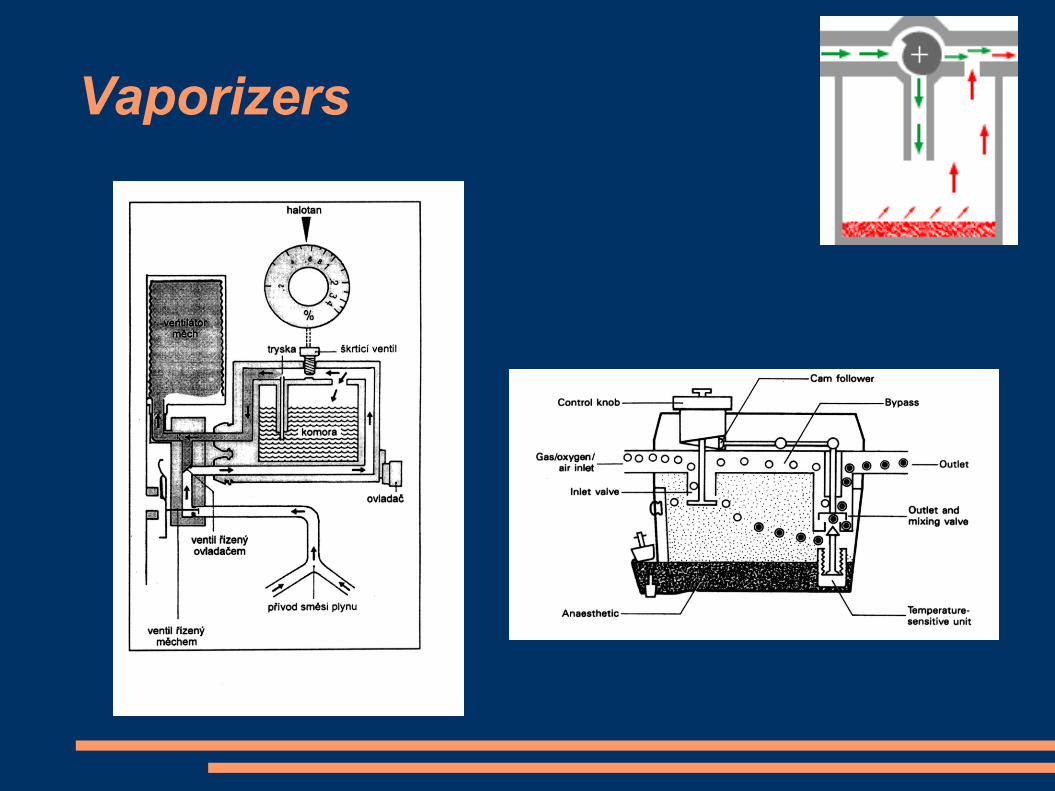
Vaporizers

Totaly different one … Desfluran
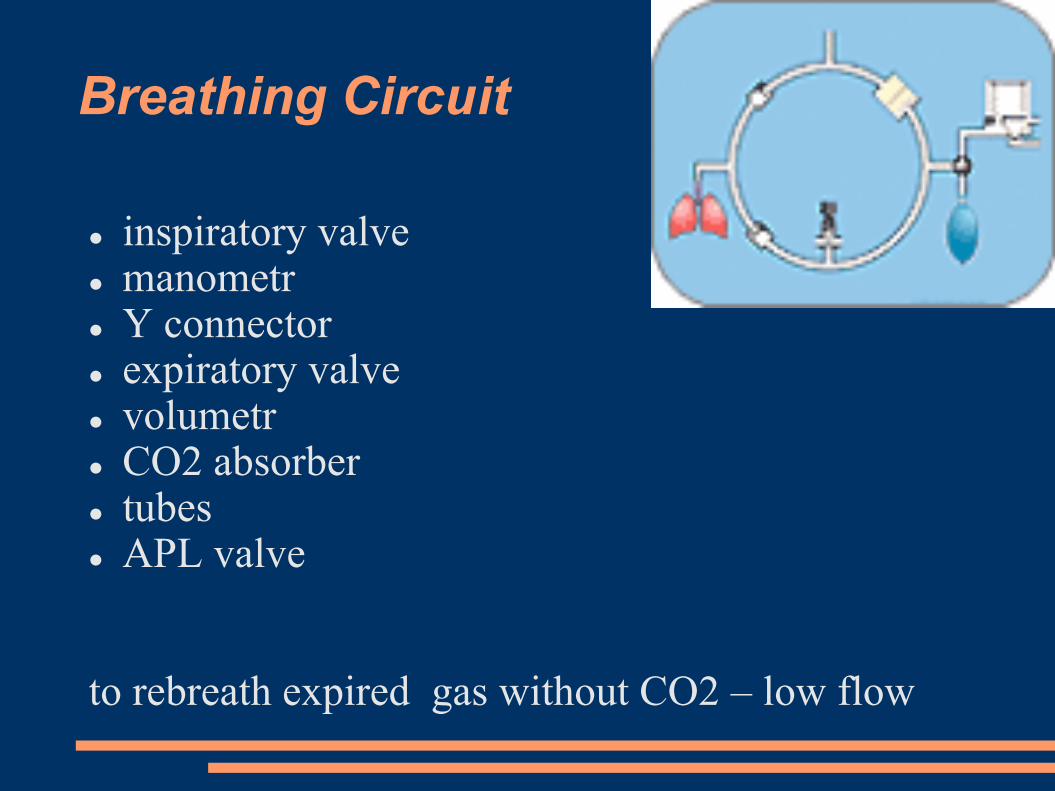
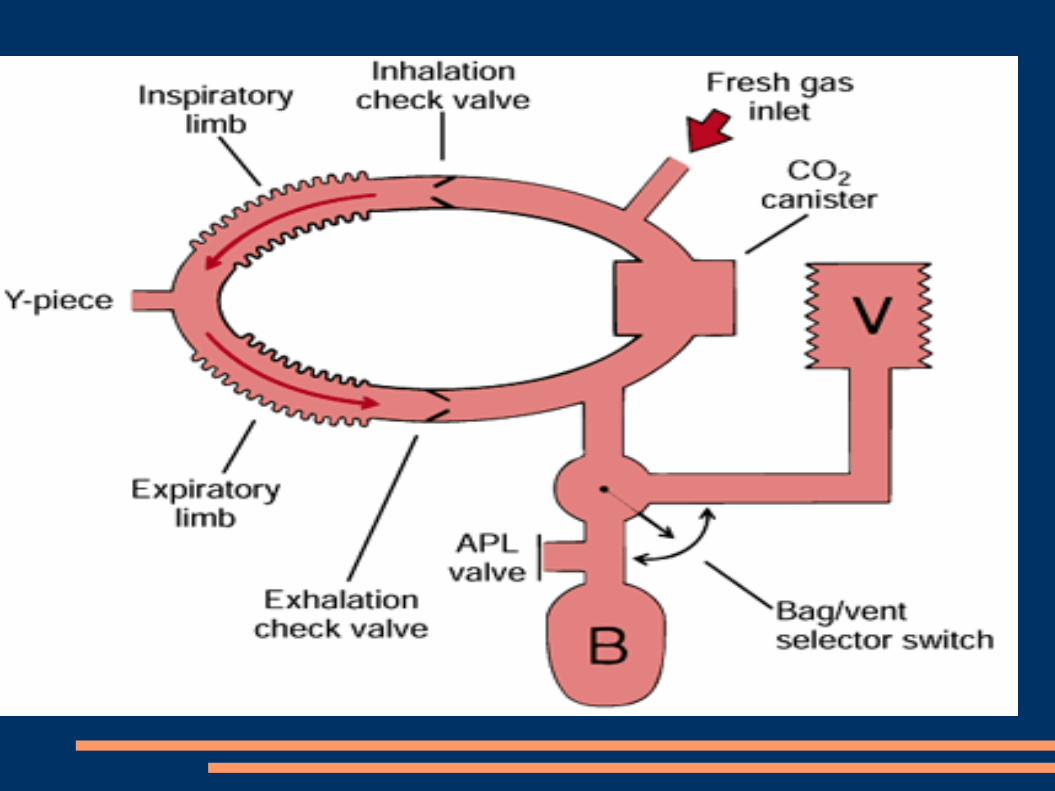
Breathing Circuit
inspiratory valve manometr Y connector expiratory valve volumetr CO2 absorber tubes APL valve
to rebreath expired gas without CO2 – low flow
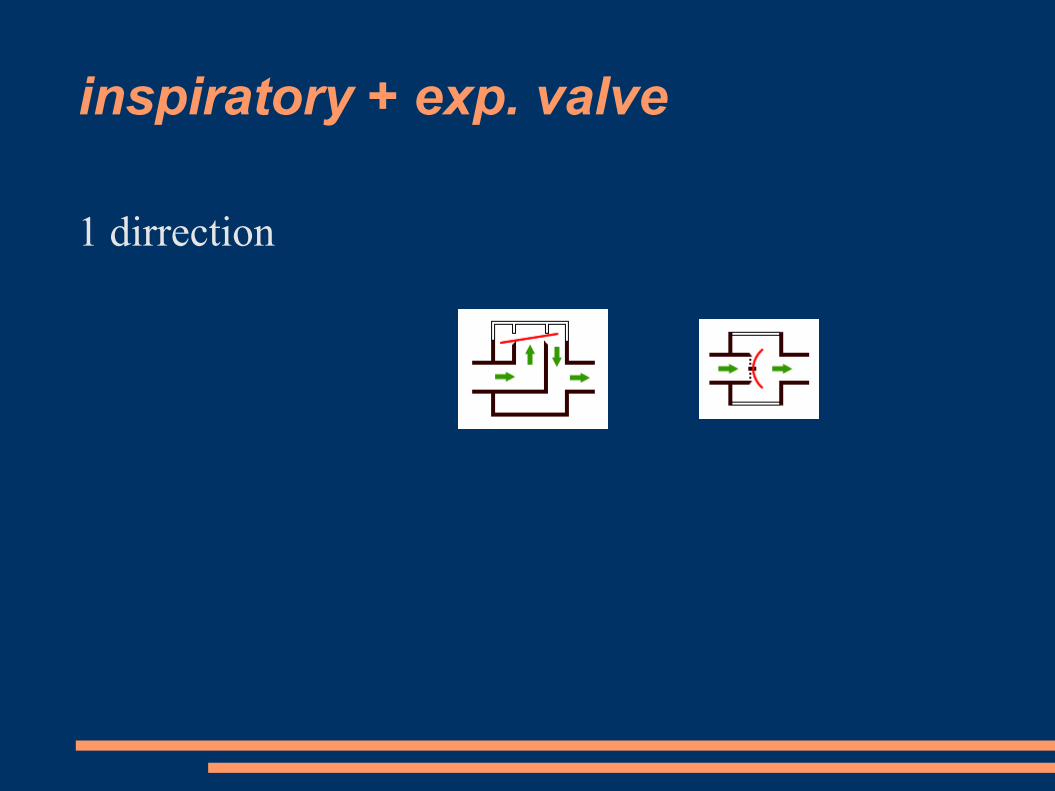
inspiratory + exp. valve
1 dirrection

manometr

Y connector, filter, tubing
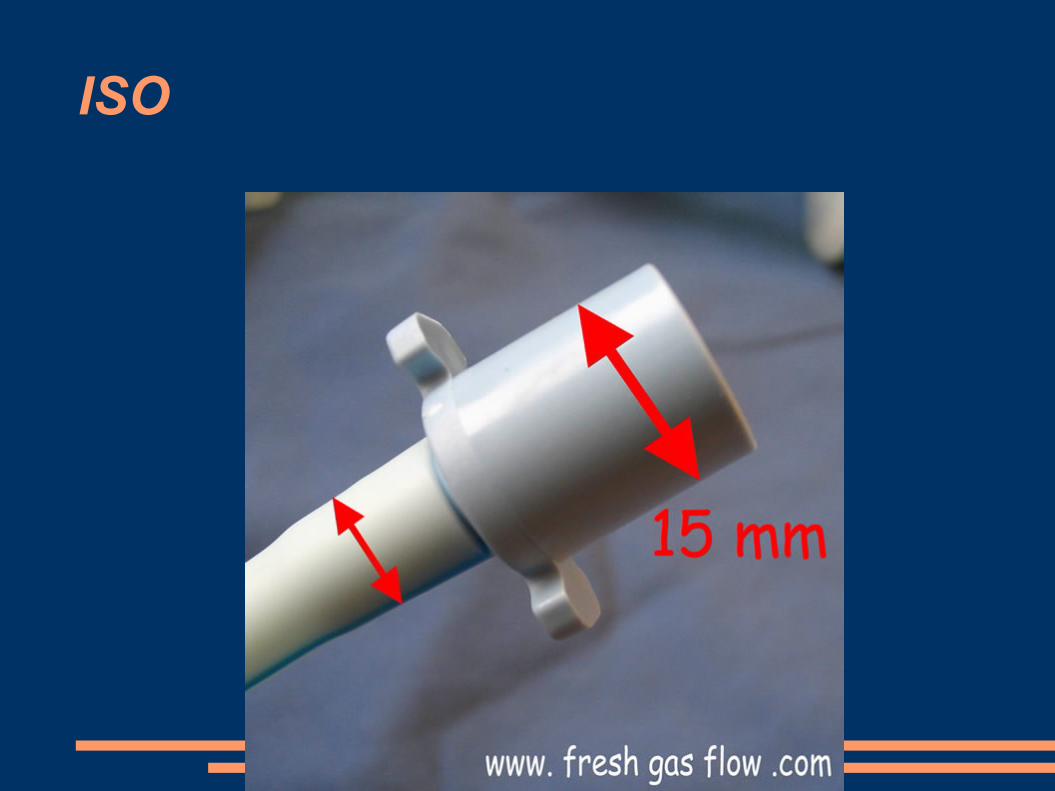
ISO

volumetr

CO2 absorber
Neutralizační reakce:
CO2 + H2O H2CO3H2CO3 + 2 NaOH Na2CO3 + 2 H2O + teplo
Na2CO3 + Ca(OH)2 CaCO3 + 2 NaOH + teplo
kapacita: (teoreticky26l) reálně15-20l CO2/100 g

tubing
Adjustable Pressure Limiting valve
(APL, "pop-off" valve)
is located at a position such that it is in pneumatic conection with
the breathing circuit only during manual ventilation
limits the amount of pressure buildup that can occur during manual
ventilation. When the user adjusts the APL valve to trap more gas
inside the breathing circuit, a spring inside the APL valve is
compressed according to how much the user turns the APL valve.
The degree of spring compression exerts a proportional force on a
sealing diaphragm in the APL valve. The pressure inside the
breathing circuit must generate a force that exceeds the spring
compression force for the APL valve to open. As pressure continues
to build from the combination of fresh gas flow and manual
compression of the breathing bag, the opening pressure of the APL
valve will be exceeded and excess gas will be vented to the
scavenging system.
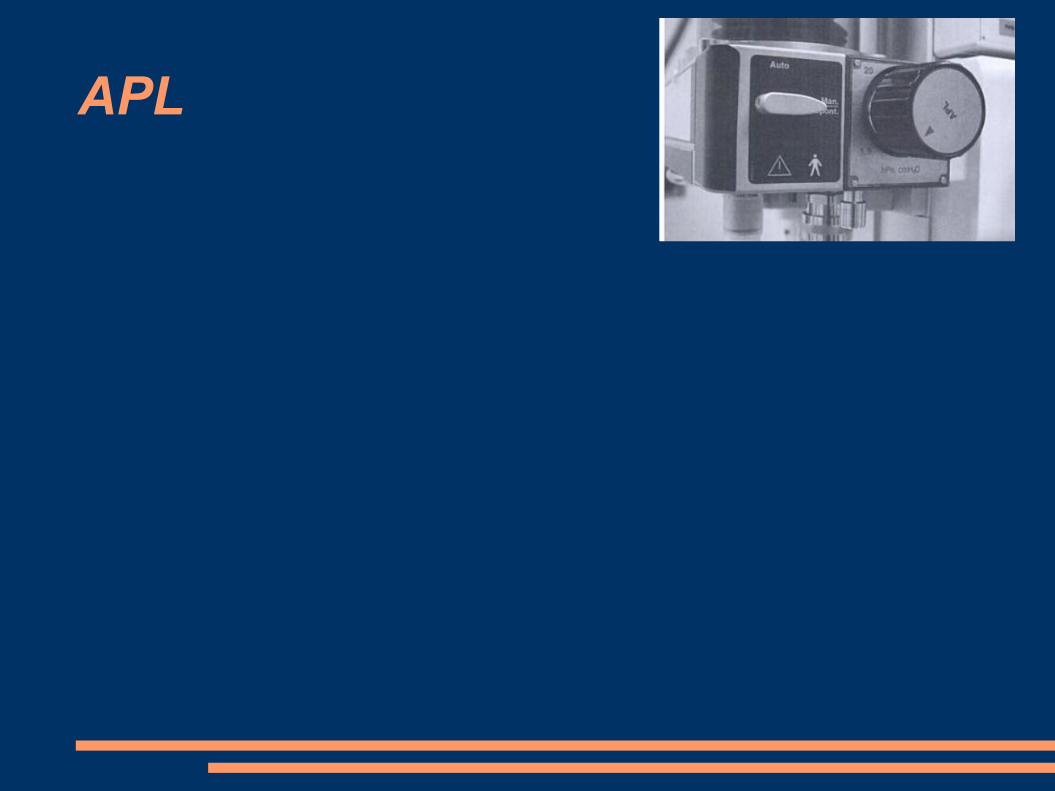
APL

Breathing Circuit

Manometr
Pressure in tr.tube/TS kanyla
< 20 cm H2O
Pressure in LM
< 40 cm H2O
Ventilation system
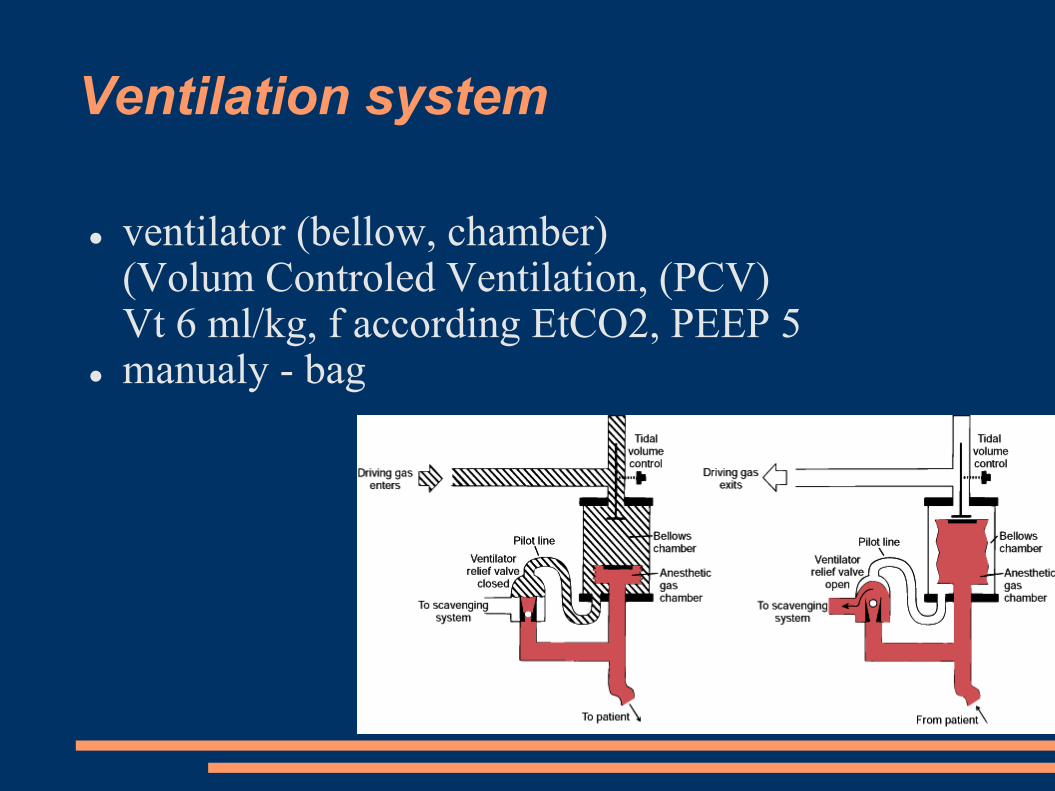
ventilator (bellow, chamber)(Volum Controled Ventilation, (PCV)Vt 6 ml/kg, f according EtCO2, PEEP 5
manualy - bag

Ventilation system
power sorcegas
electricity
both
Drive Mechanism, Circuit degigndouble-circuit ventilator (patient and drive gas)


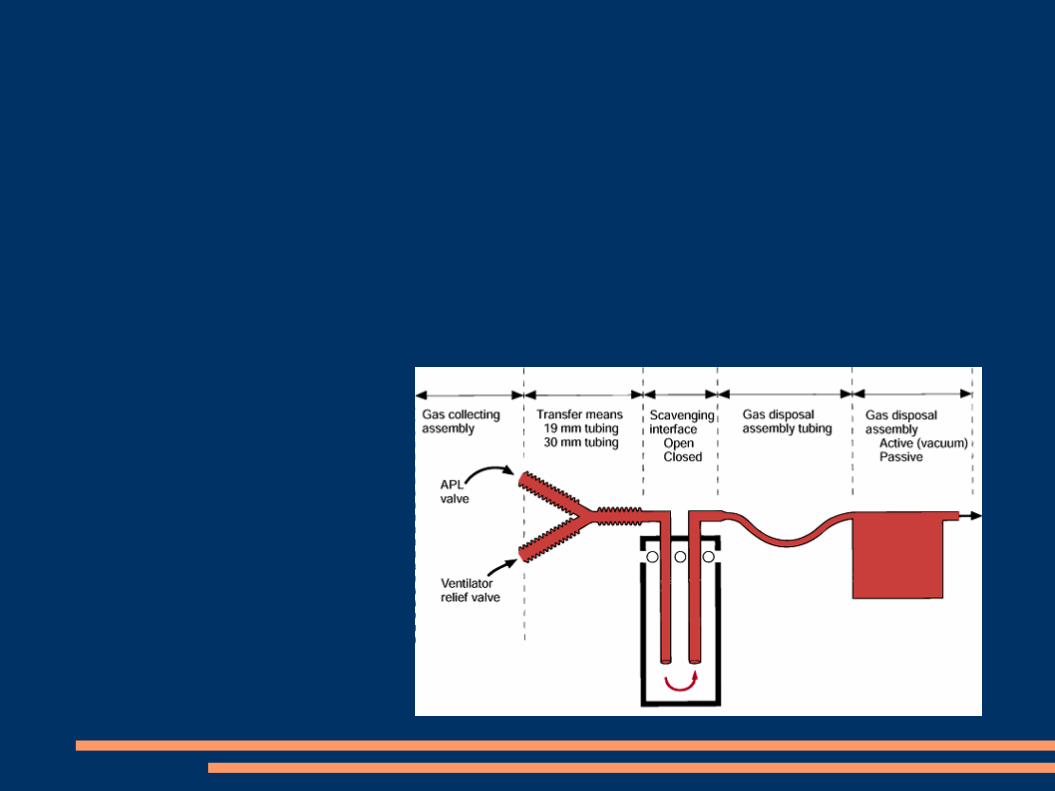
Scavenging system
Keep clean OR atmosphere

Monitoring system
monere, "to warn"
systematic control
Patient monitoring has been a key aspect of anesthesiology since its beginnings as a medical specialty.

Figure 30-1 Optical illusions. We perceive the circles to be different sizes because we infer the size by relative dimensions. The closeness of the smaller circles makes the inner circle appear smaller, and vice versa. The lines appear to be different sizes because we use straight-line perspective to estimate size and distance. This illusion
reportedly does not work in cultures where straight lines are not used. Therefore, our internal perceptions lead us to err in estimating size and length. In the same way, the internal programming of our monitors can lead us to misinterpret results.
Downloaded from: Miller's Anesthesia (on 12 March 2009 08:22 PM)
© 2007 Elsevier
Optical illusions
… it is not possible without eye
Monitoring
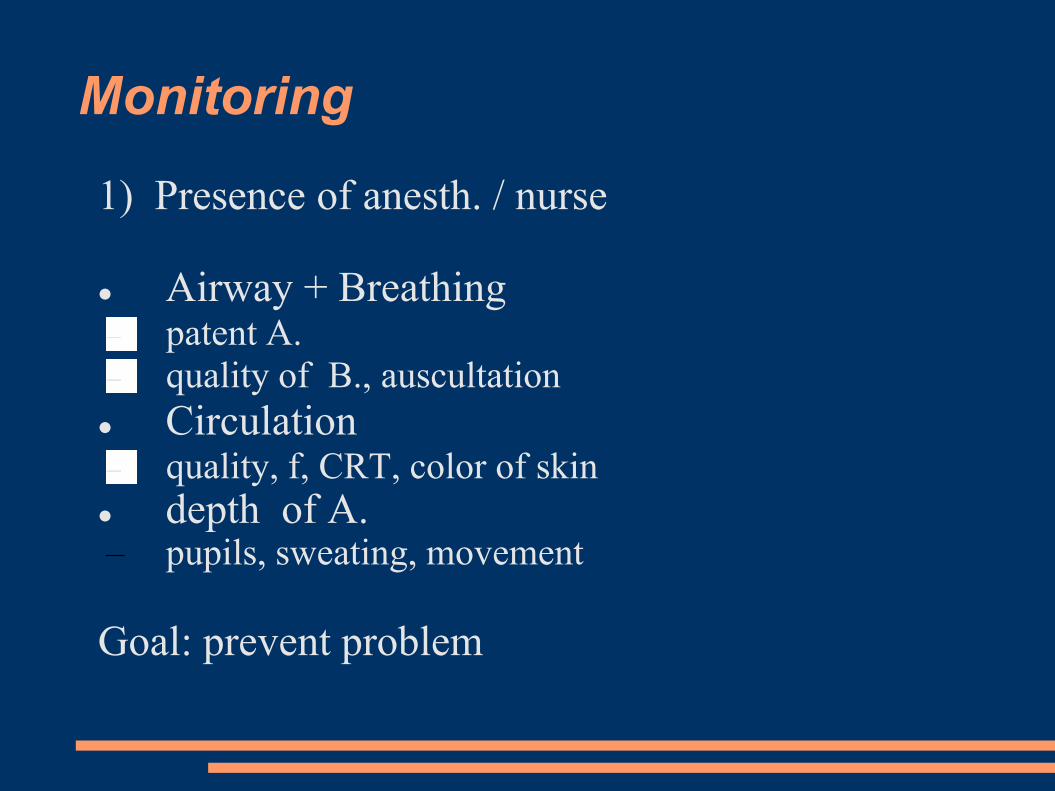
1) Presence of anesth. / nurse
Airway + Breathingpatent A.
quality of B., auscultation
Circulationquality, f, CRT, color of skin
depth of A.– pupils, sweating, movement
Goal: prevent problem
>>>> Alarm <<<<
< ?? What should I do ??>noticeinterpret reaction = change something alarm off? change limits of alarm?

Auscultator
+ available
ventilatory problem (bronchospasm, laryngospasm - LM)
- SpO2, EtCO2 a ECG detect problem easer than continual auscultation.
Basic monitoring in case of Fail of Anest. Machine

ECG
Heart Frequency
rhytm
extrasystols
ST
- ischemia

FIGURE 28–30 Why the ECG is so small. Multiple resistances and
capacitances in the body decrease the potential and distort the waveform
before the EMF reaches the surface.

Positioning of electrodes
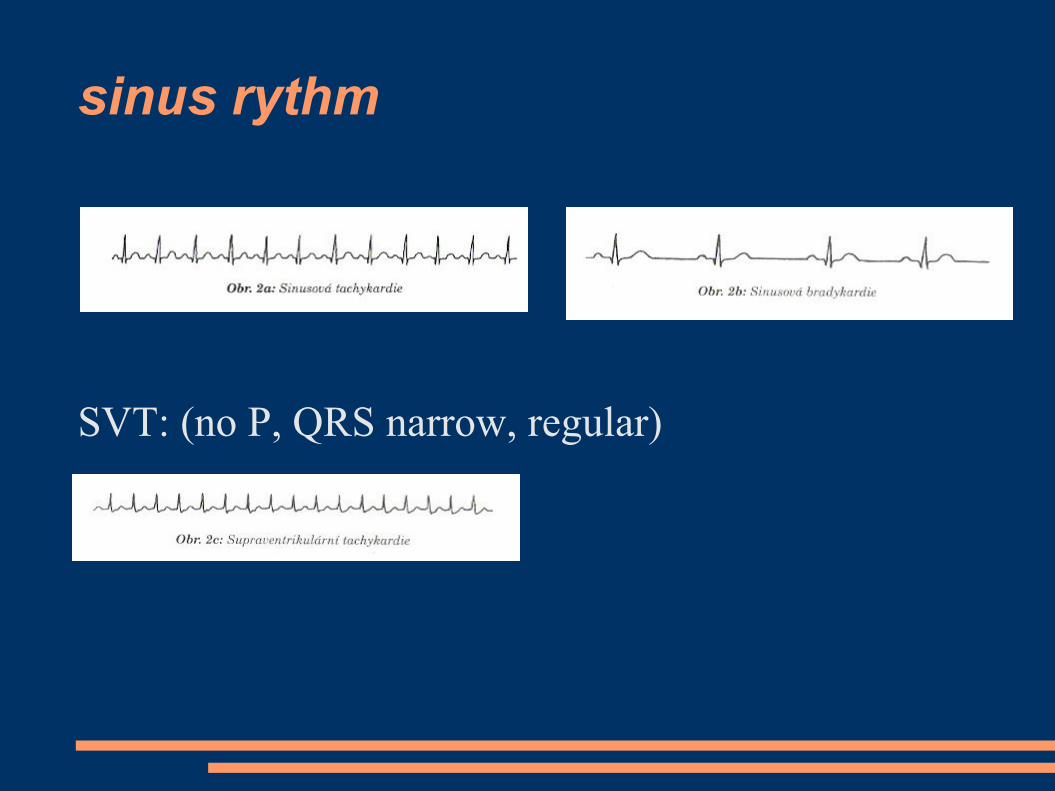
sinus rythm
SVT: (no P, QRS narrow, regular)

Fibrilation of Atrii
irregular , QRS narrow
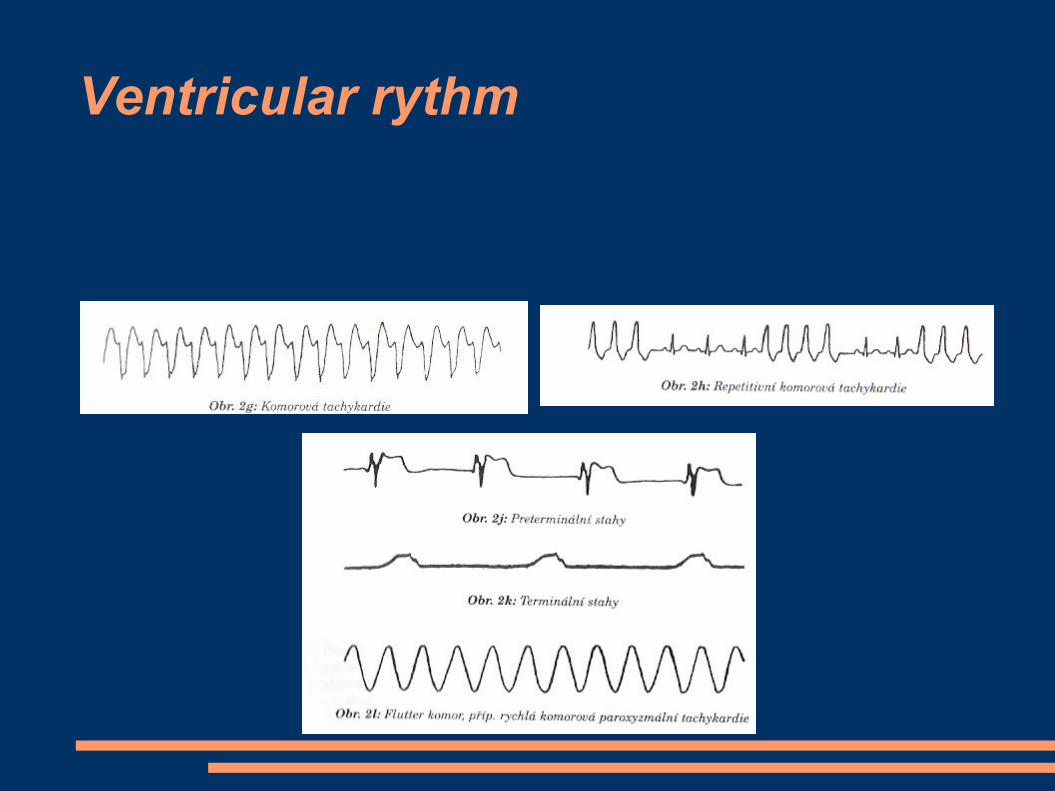
Ventricular rythm
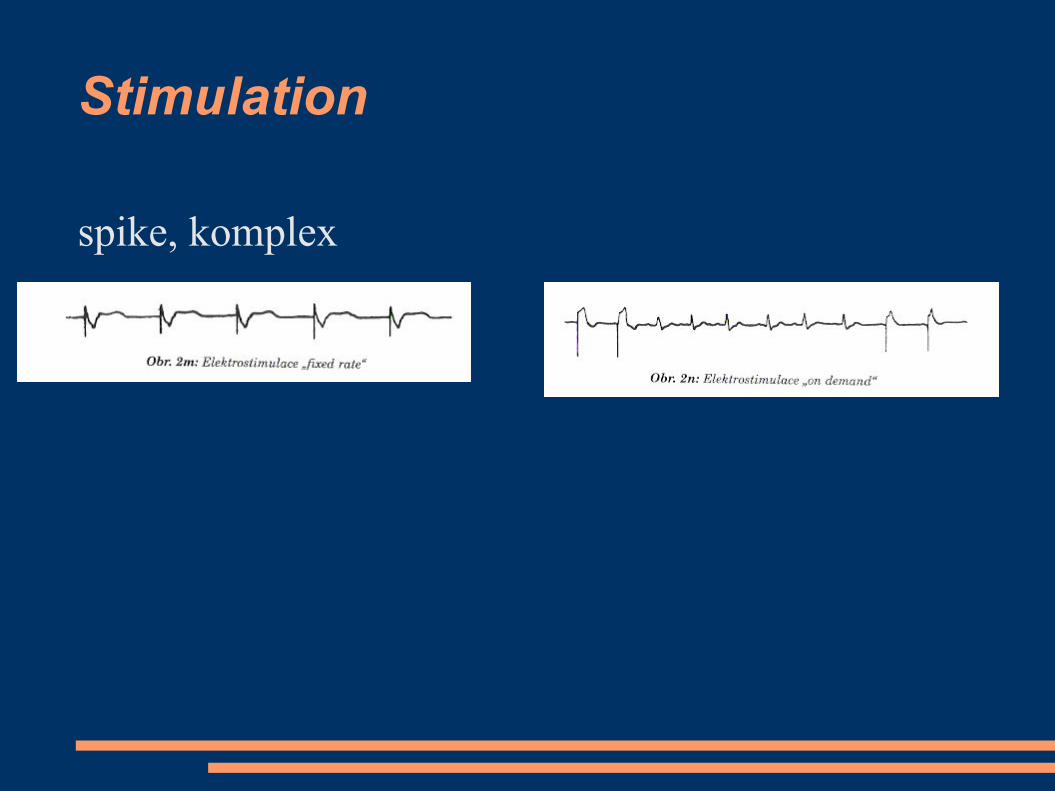
Stimulation
spike, komplex

ECG … Heart frequency
45/min or 150/min or ??
Amann et al. BioMedical Engineering OnLine 2005 4:60 doi:10.1186/1475-925X-4-60

ECG – complication of monitoring
elektric interference ()
50Hz coross ECG cabel
cabel as anntena (loop)
no signal 10s after defibrilation

Figure 32-2 Effect of cuff size on manual blood pressure measurement. An inappropriately small blood pressure cuff yields erroneously high values for blood pressure because the pressure within the cuff is incompletely transmitted to the underlying artery.
Downloaded from: Miller's Anesthesia (on 12 March 2009 08:22 PM)
© 2007 Elsevier
NIBP – effect of cuff size

Figure 32-3 Comparison of blood pressure measurements by Korotkoff sounds and oscillometry. Oscillometric systolic blood pressure is recorded at the point where cuff pressure oscillations begin to increase, mean pressure corresponds to the point of maximal oscillations, and diastolic pressure is measured when the oscillations become attenuated. Note the correspondence between these measurements and the Korotkoff sounds that determine auscultatory systolic and diastolic pressure. (Redrawn from
Geddes LA: Cardiovascular Devices and Their Applications. New York John Wiley, 1984, Fig 34-2. Reprinted by permission of John Wiley & Sons, Inc.)
Downloaded from: Miller's Anesthesia (on 12 March 2009 08:22 PM)
© 2007 Elsevier
NIBP
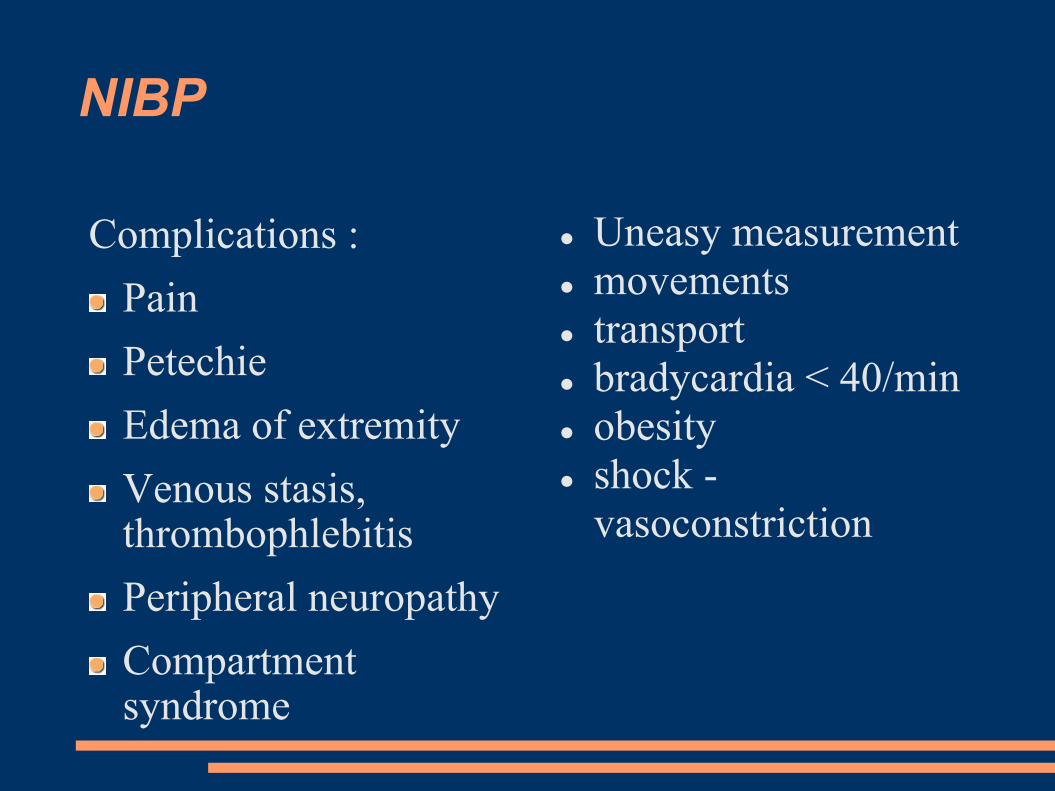
Complications :
Pain
Petechie
Edema of extremity
Venous stasis, thrombophlebitis
Peripheral neuropathy
Compartment syndrome
Uneasy measurement
movements
transport
bradycardia < 40/min
obesity
shock -
vasoconstriction
IBP, Canylation of artery
real-time, beat to beat
rapid changes - drugs / mechanic
repeated bload samples [BGasses]
failure of NIBP
additional information from puls curve
• Pulse Pressure Variation

Figure 32-4 Percutaneous radial artery cannulation. A, The wrist is positioned and the artery identified by palpation. B, The catheter-over-needle assembly is introduced through the skin and advanced toward the artery. C, Entry of the needle tip into the artery is identified by the flash of arterial blood in the needle hub reservoir. D, The
needle-catheter assembly is advanced at a lower angle to ensure entry of the catheter tip into the vessel. E, If blood flow continues into the needle reservoir, the catheter is advanced gently over the needle into the artery. F, The catheter is attached to pressure monitoring tubing while maintaining proximal occlusive pressure on the artery.
Downloaded from: Miller's Anesthesia (on 12 March 2009 08:22 PM)
© 2007 Elsevier

Invasive Pressure
a. radialis / a. femoralis / a. brachialis
arterie – hose – cell – infusion (cont. flush of
cannyla ml/h)
fluid is not compressible X air
cloat of blood / cranking increase ressistance

!!Alarm!! Low BP
Figure 32-1 Digital heart rate (HR) displays may fail to warn of dangerous bradyarrhythmias. Direct observation of the electrocardiogram (ECG) and the arterial blood pressure traces reveals complete heart block and a 4-second period of asystole, whereas the digital display reports an HR of 49 beats/min. Note that the ECG filter
(arrow) corrects the baseline drift so that the trace remains on the recording screen. (From Mark JB: Atlas of Cardiovascular Monitoring. New York, Churchill Livingstone, 1998, Fig. 13-2.)

HR: 49/min, ECG: AV blok III

Figure 36-1 Oxygen transport cascade. A schematic view of the steps in oxygen transport from the atmosphere to the site of utilization in the mitochondrion is shown here. Approximate Po2 values are shown for each step in the cascade, and factors determining those partial pressures are shown within the square brackets. There is a distribution of tissue Po2 values depending on local capillary blood flow, tissue oxygen consumption, and diffusion distances. Mitochondrial Po2 values are depicted as a
range because reported levels vary widely. (Adapted from Nunn JF: Nunn's Applied Respiratory Physiology, 4th ed. Boston, Butterworth-Heinemann, 1993.)
Downloaded from: Miller's Anesthesia (on 12 March 2009 08:46 PM)© 2007 Elsevier
O2 in the body

Oxygenation of tissues
monitoring of inspired O2
SpO2
Arterial blood gasses low cardiac output and good oxygention function of
lung
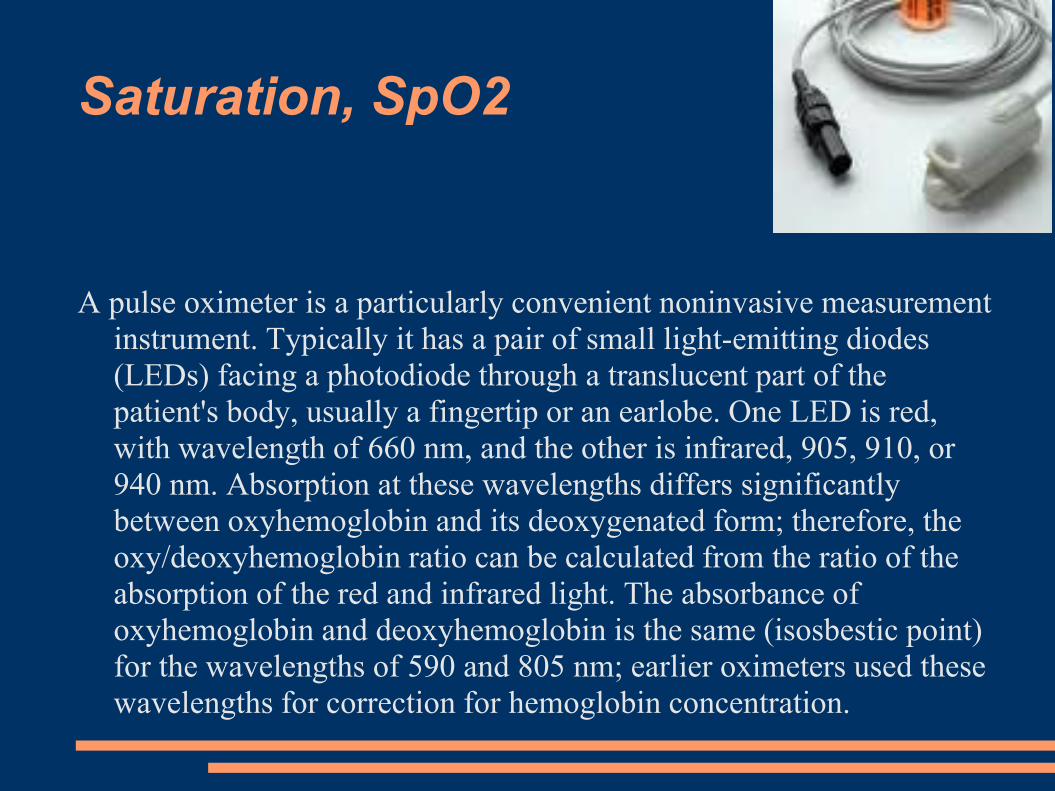
Saturation, SpO2
A pulse oximeter is a particularly convenient noninvasive measurement
instrument. Typically it has a pair of small light-emitting diodes
(LEDs) facing a photodiode through a translucent part of the
patient's body, usually a fingertip or an earlobe. One LED is red,
with wavelength of 660 nm, and the other is infrared, 905, 910, or
940 nm. Absorption at these wavelengths differs significantly
between oxyhemoglobin and its deoxygenated form; therefore, the
oxy/deoxyhemoglobin ratio can be calculated from the ratio of the
absorption of the red and infrared light. The absorbance of
oxyhemoglobin and deoxyhemoglobin is the same (isosbestic point)
for the wavelengths of 590 and 805 nm; earlier oximeters used these
wavelengths for correction for hemoglobin concentration.
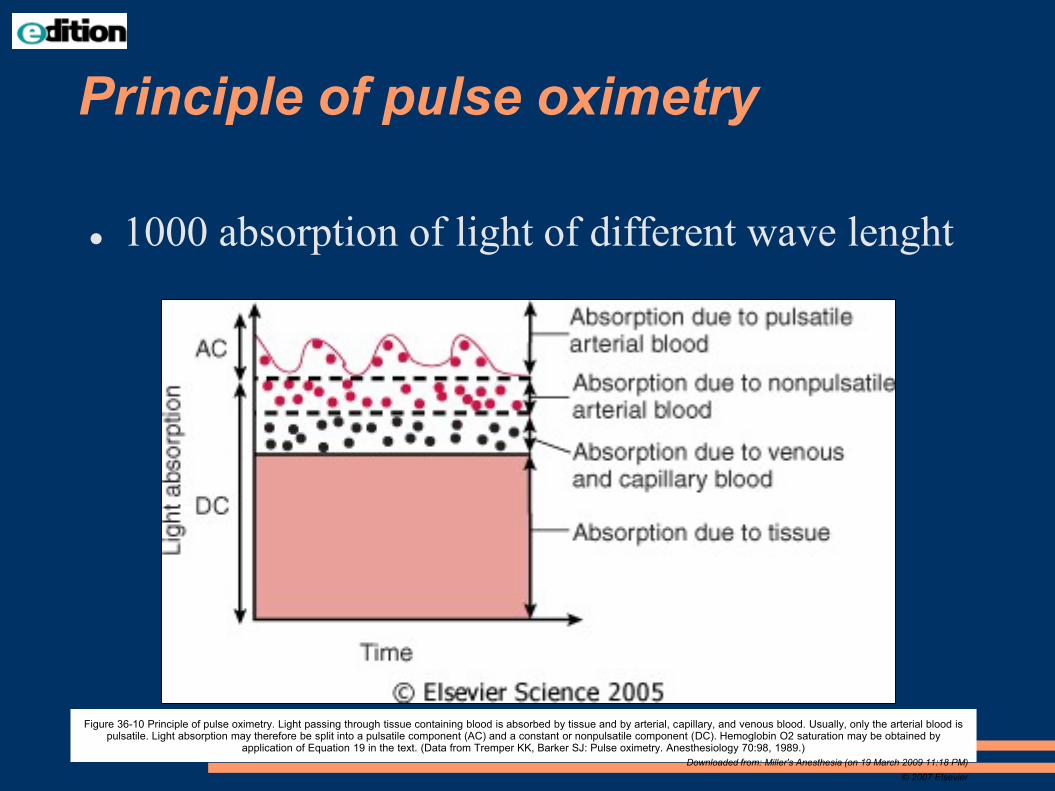
Figure 36-10 Principle of pulse oximetry. Light passing through tissue containing blood is absorbed by tissue and by arterial, capillary, and venous blood. Usually, only the arterial blood is pulsatile. Light absorption may therefore be split into a pulsatile component (AC) and a constant or nonpulsatile component (DC). Hemoglobin O2 saturation may be obtained by
application of Equation 19 in the text. (Data from Tremper KK, Barker SJ: Pulse oximetry. Anesthesiology 70:98, 1989.)
Downloaded from: Miller's Anesthesia (on 19 March 2009 11:18 PM)
© 2007 Elsevier
Principle of pulse oximetry
1000 absorption of light of different wave lenght

Figure 30-34 Hemoglobin extinction curves. Pulse oximetry uses the wavelengths of 660 and 940 nm because they are available in solid-state emitters (not all wavelengths are able to be emitted from diodes). Unfortunately, HbCO and HbO2 absorb equally at 660 nm. Therefore, HbCO and HbO2 both read as Sao2 to a conventional pulse oximeter. In addition, Hbmet and
reduced Hb share absorption at 660 nm and interfere with correct Sao2 measurement. (Courtesy of Susan Manson, Biox/Ohmeda, Boulder, Colorado, 1986.)
Downloaded from: Miller's Anesthesia (on 20 March 2009 08:47 AM)© 2007 Elsevier
2 vlnové délky, 2absorbce pro Hb a HbO2
AC660
/ DC660
S = ---------------- aprox. % HBO/(HB+HBO)
AC940
/ DC940

SpO2 – HbO2 - O2 ve tkáni
oxygenation, not ventilation,
inaccuracy 5%
Falsely low readings:
hypoperfusion
incorrect sensor application;
highly calloused skin
movement (such as shivering)
Falsely high:
carbon monoxide poisoning
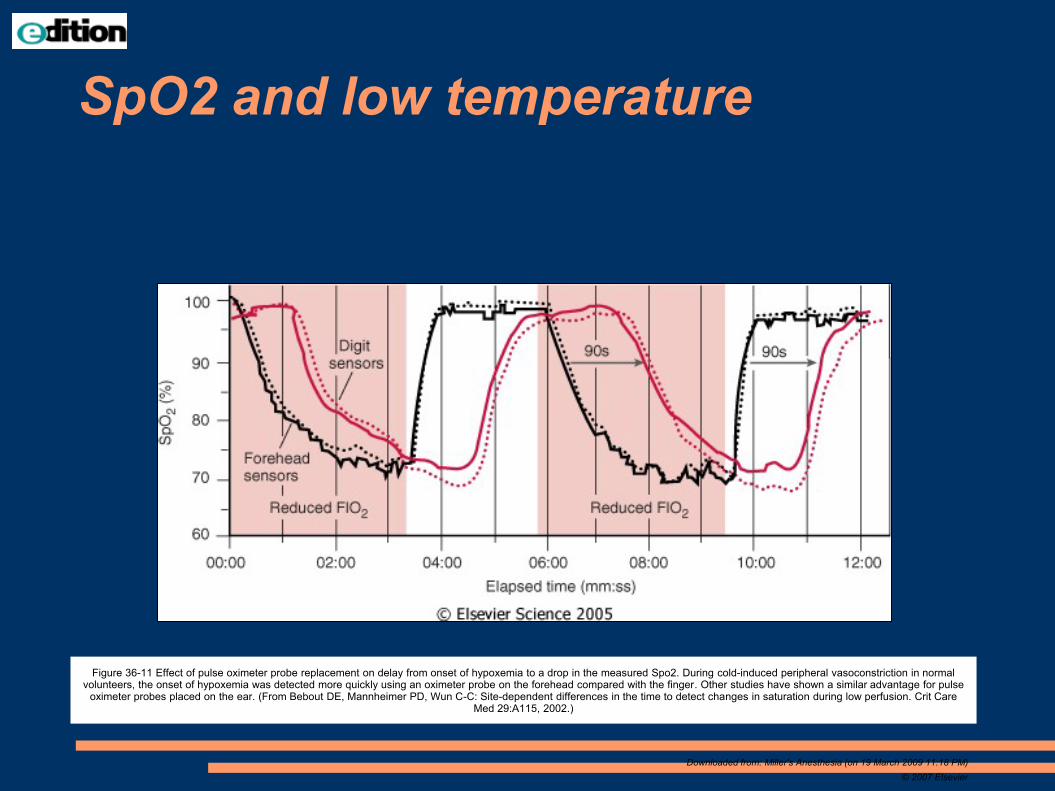
Figure 36-11 Effect of pulse oximeter probe replacement on delay from onset of hypoxemia to a drop in the measured Spo2. During cold-induced peripheral vasoconstriction in normal volunteers, the onset of hypoxemia was detected more quickly using an oximeter probe on the forehead compared with the finger. Other studies have shown a similar advantage for pulse
oximeter probes placed on the ear. (From Bebout DE, Mannheimer PD, Wun C-C: Site-dependent differences in the time to detect changes in saturation during low perfusion. Crit Care Med 29:A115, 2002.)
Downloaded from: Miller's Anesthesia (on 19 March 2009 11:18 PM)
© 2007 Elsevier
SpO2 and low temperature
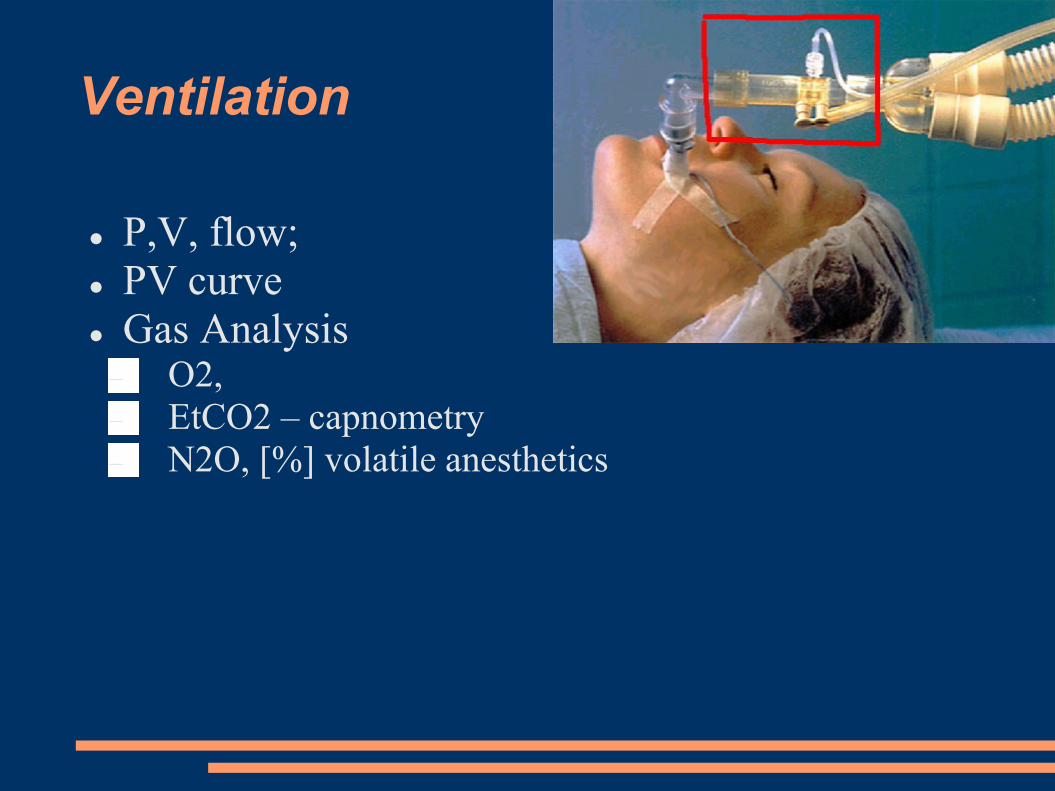
Ventilation
P,V, flow;
PV curve
Gas AnalysisO2,
EtCO2 – capnometry
N2O, [%] volatile anesthetics

Flow

Figure 36-24 Flow (ordinate) versus volume (abscissa). A, Closed-chest positive-pressure ventilation under general anesthesia in a patient with severe airways obstruction and hyperinflation before surgery to reduce lung volume. The flow-volume curve shows inspiratory (negative) and expiratory (positive) flow on the ordinate, plotted clockwise from zero volume on the abscissa. Expiratory flow started with a sharp upward peak and then fell immediately to a low flow rate with convexity toward the volume axis, suggesting expiratory flow limitation.
expiratory flow rate was so low that inflation of the next positive-pressure breath was initiated before expiratory flow reached zero. Because expiratory flow continued up to this point, there must have been intrinsic positive end-expiratory pressure (PEEPi). B, A similar closed-check flow-volume curve after lung resection shows that the characteristic pattern of expiratory flow
limitation has disappeared and that expiratory flow rate fell to zero before inflation started for the next breath (i.e., no suggestion of PEEPi). (Adapted from Dueck R: Assessment and monitoring of flow limitation and other parameters from flow/volume loops. J Clin Monit Comput 16:425, 2000.)
Downloaded from: Miller's Anesthesia (on 19 March 2009 11:18 PM)
© 2007 Elsevier
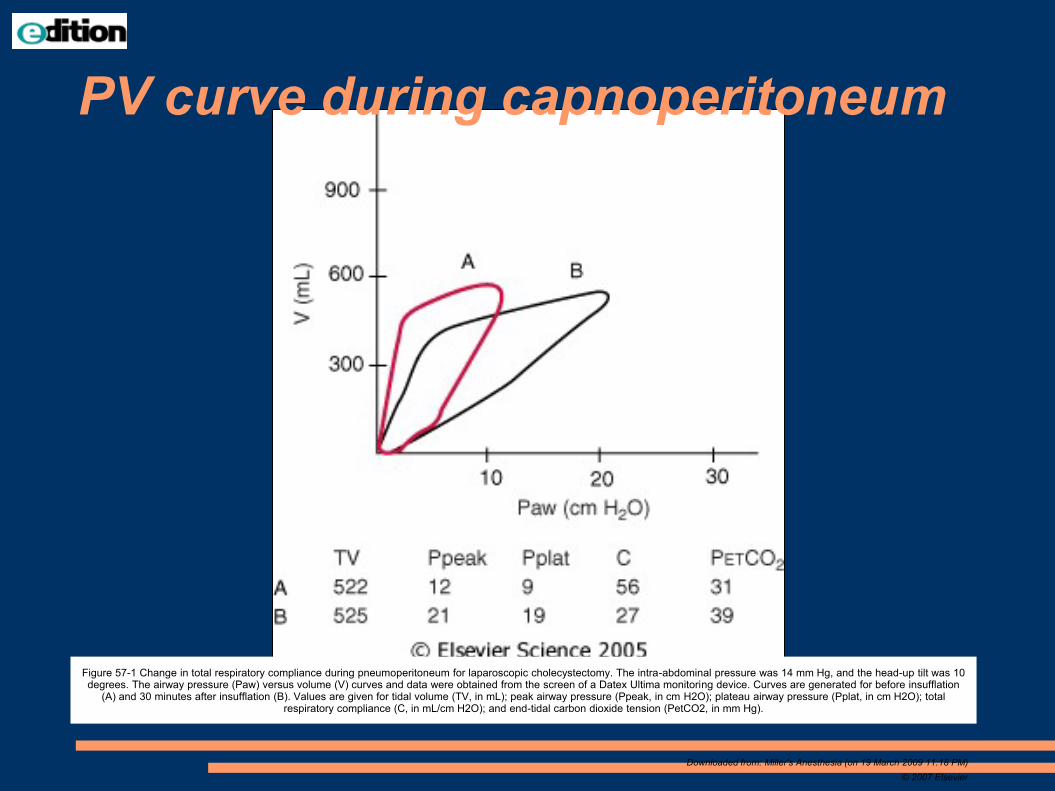
Figure 57-1 Change in total respiratory compliance during pneumoperitoneum for laparoscopic cholecystectomy. The intra-abdominal pressure was 14 mm Hg, and the head-up tilt was 10 degrees. The airway pressure (Paw) versus volume (V) curves and data were obtained from the screen of a Datex Ultima monitoring device. Curves are generated for before insufflation
(A) and 30 minutes after insufflation (B). Values are given for tidal volume (TV, in mL); peak airway pressure (Ppeak, in cm H2O); plateau airway pressure (Pplat, in cm H2O); total respiratory compliance (C, in mL/cm H2O); and end-tidal carbon dioxide tension (PetCO2, in mm Hg).
Downloaded from: Miller's Anesthesia (on 19 March 2009 11:18 PM)
© 2007 Elsevier
PV curve during capnoperitoneum

Gas analyzers
Main-stream Side-
stream
only CO2, méně přesné zpoždění
light
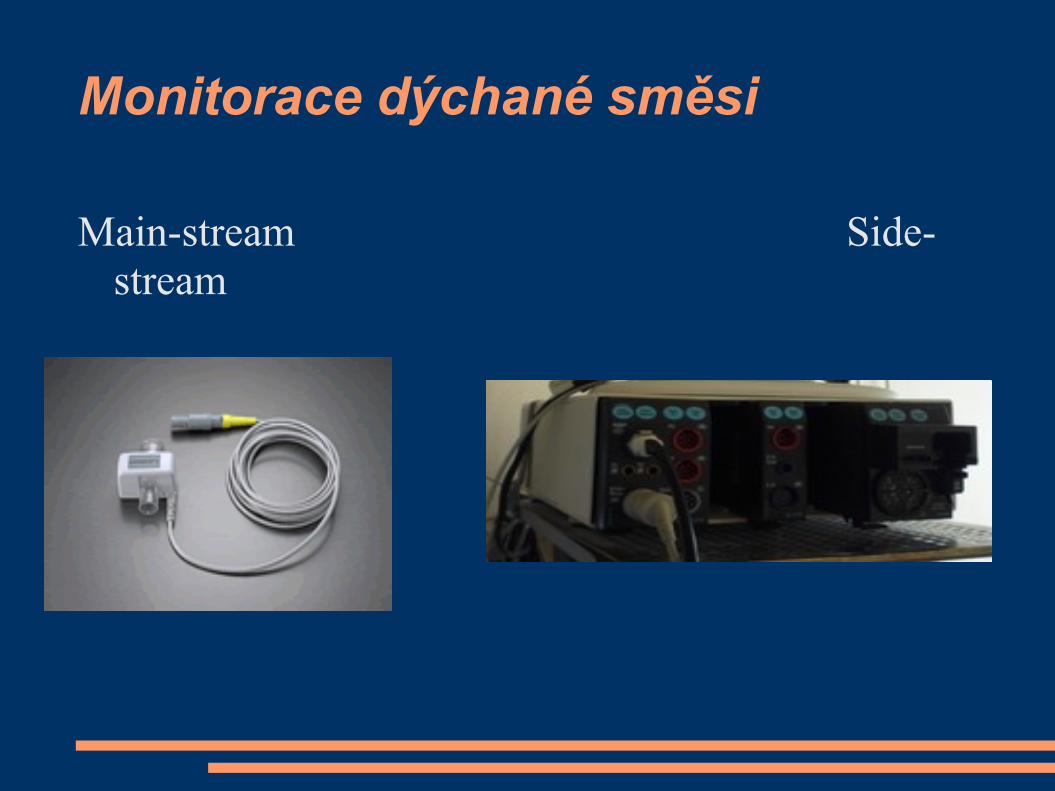
Monitorace dýchané směsi
Main-stream Side-
stream
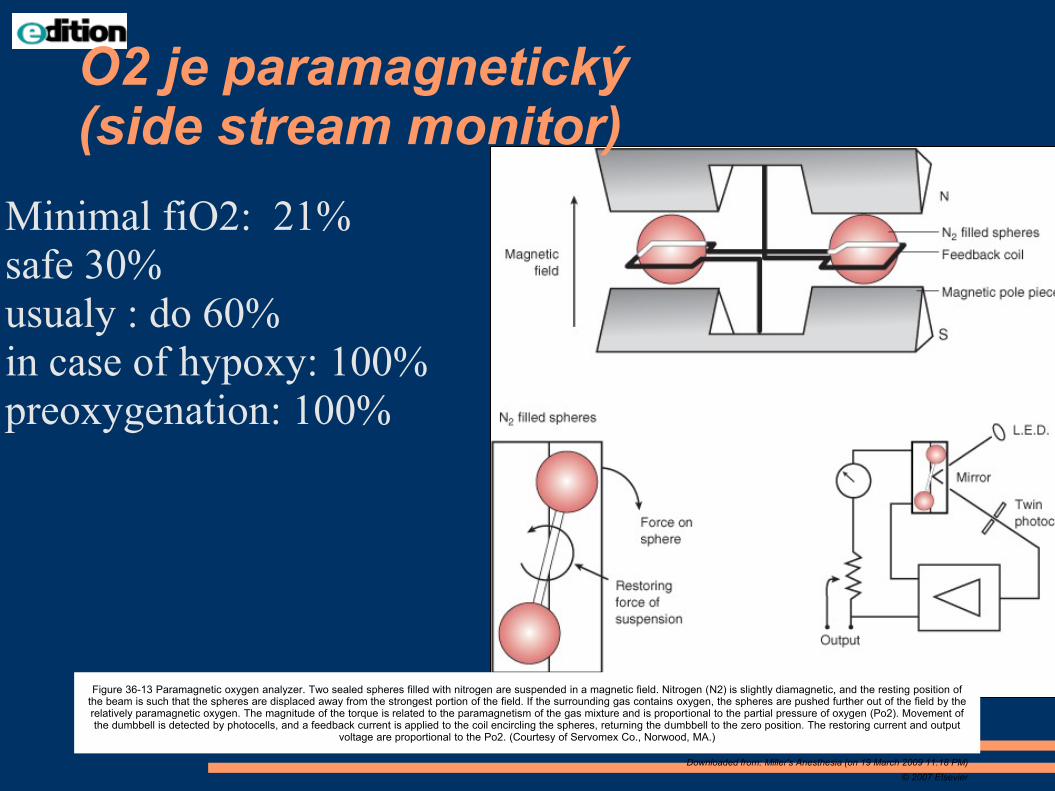
Figure 36-13 Paramagnetic oxygen analyzer. Two sealed spheres filled with nitrogen are suspended in a magnetic field. Nitrogen (N2) is slightly diamagnetic, and the resting position of the beam is such that the spheres are displaced away from the strongest portion of the field. If the surrounding gas contains oxygen, the spheres are pushed further out of the field by the relatively paramagnetic oxygen. The magnitude of the torque is related to the paramagnetism of the gas mixture and is proportional to the partial pressure of oxygen (Po2). Movement of the dumbbell is detected by photocells, and a feedback current is applied to the coil encircling the spheres, returning the dumbbell to the zero position. The restoring current and output
voltage are proportional to the Po2. (Courtesy of Servomex Co., Norwood, MA.)
Downloaded from: Miller's Anesthesia (on 19 March 2009 11:18 PM)
© 2007 Elsevier
O2 je paramagnetický (side stream monitor)
Minimal fiO2: 21%
safe 30%
usualy : do 60%
in case of hypoxy: 100%
preoxygenation: 100%
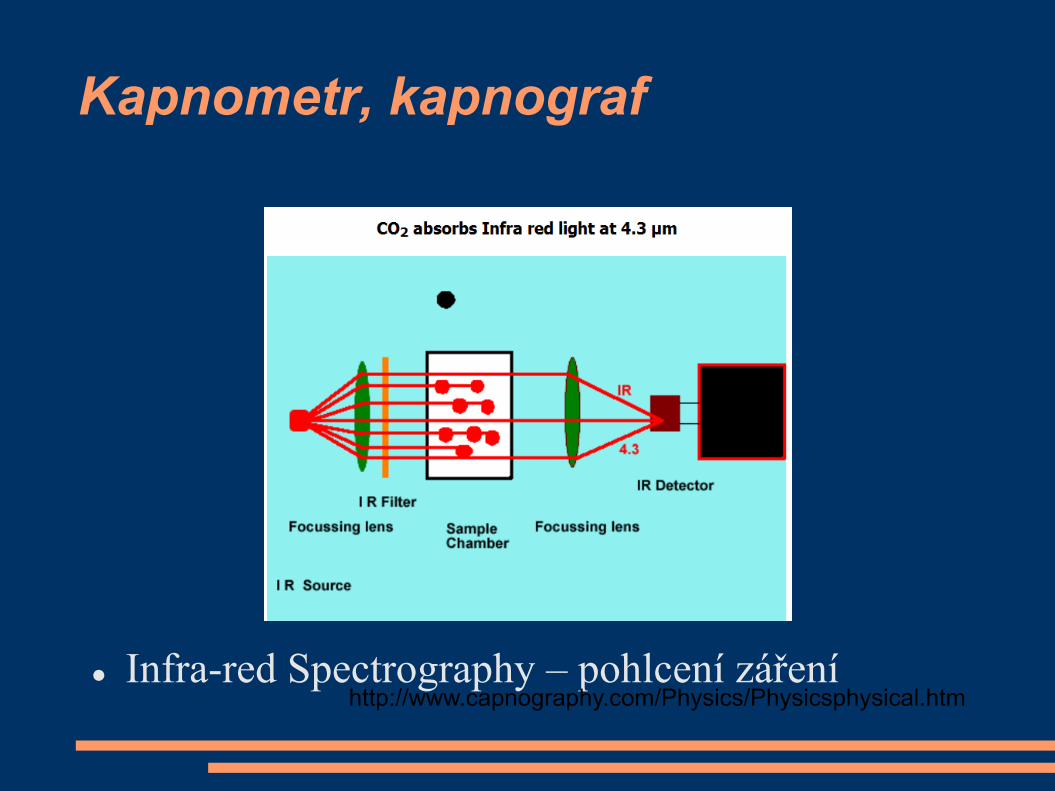
Kapnometr, kapnograf
Infra-red Spectrography – pohlcení zářeníhttp://www.capnography.com/Physics/Physicsphysical.htm


CO2 emits IR radiation

Figure 36-18 Examples of capnograph waves. A, Normal spontaneous breathing. B, Normal mechanical ventilation. C, Prolonged exhalation during spontaneous breathing. As CO2 diffuses from the mixed venous blood into the alveoli, its concentration progressively rises (see Fig. 36-19). D, Increased slope of phase III in a mechanically ventilated patient with
emphysema. E, Added dead space during spontaneous ventilation. F, Dual plateau (i.e. tails-up pattern) caused by a leak in the sample line.325 The alveolar plateau is artifactually low because of dilution of exhaled gas with air leaking inward. During each mechanical breath, the leak is reduced because of higher pressure within the airway and tubing, explaining the rise
in the CO2 concentration at the end of the alveolar plateau. This pattern is not seen during spontaneous ventilation because the required increase in airway pressure is absent. G, Exhausted CO2 absorbent produces an inhaled CO2 concentration greater than zero. H, Double peak for a patient with a single lung transplant. The first peak represents CO2 from the transplanted (normal) lung. CO2 exhalation from the remaining (obstructed) lung is delayed, producing the second peak. I, Inspiratory valve stuck open during spontaneous breathing.
Some backflow into the inspired limb of the circuit causes a rise in the level of inspired CO2. J, Inspiratory valve stuck open during mechanical ventilation. The "slurred" downslope during inspiration represents a small amount of inspired CO2 in the inspired limb of the circuit. K and L, Expiratory valve stuck open during spontaneous breathing or mechanical ventilation.
Inhalation of exhaled gas causes an increase in inspired CO2. M, Cardiogenic oscillations, when seen, usually occur with sidestream capnographs for spontaneously breathing patients at the end of each exhalation. Cardiac action causes to-and-fro movement of the interface between exhaled and fresh gas. The CO2 concentration in gas entering the sampling line therefore alternates between high and low values. N, Electrical noise resulting from a malfunctioning component. The seemingly random nature of the signal perturbations (about three per second)
implies a nonbiologic cause. Downloaded from: Miller's Anesthesia (on 19 March 2009 11:18 PM)
© 2007 Elsevier

Downloaded from: Miller's Anesthesia (on 19 March 2009 11:18 PM)
© 2007 Elsevier
Normal ventilation spont. mandatory

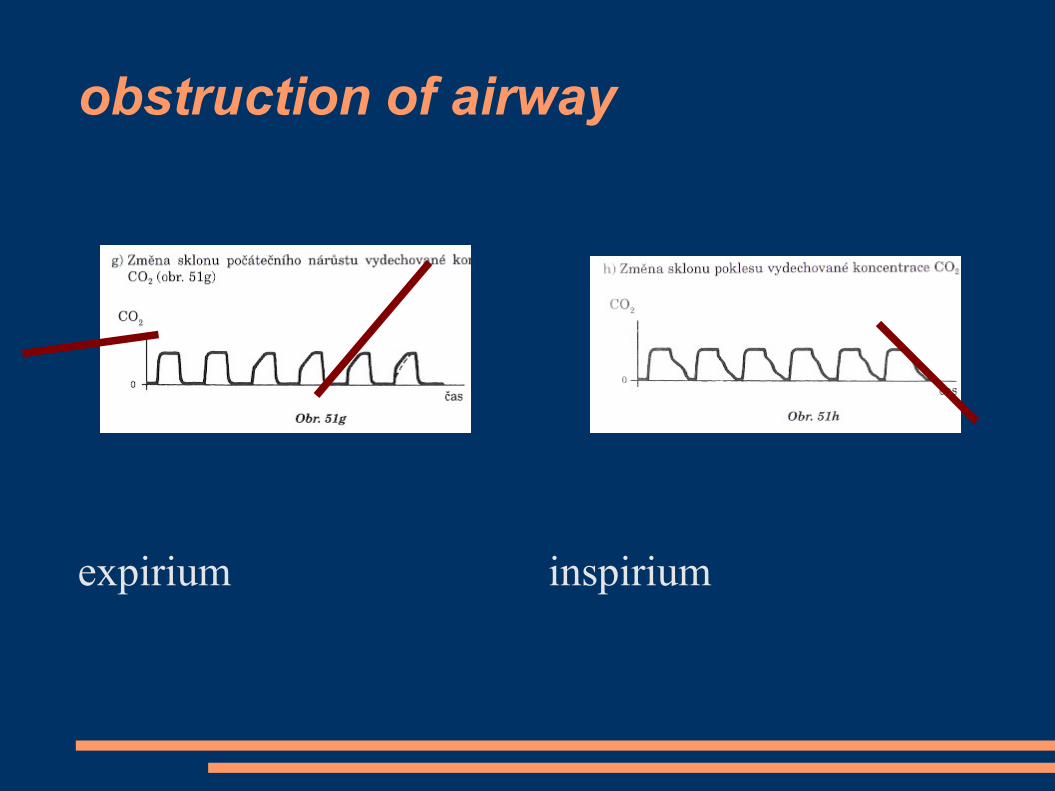
obstruction of airway
expirium inspirium

Figure 36-19 Mechanisms of airways obstruction producing an upsloping phase III capnogram. In a normal, healthy person (upper panel), there is a narrow range of [Vdot]a/[Qdot] ratios with values close to 1. Gas exchange units therefore have similar Pco2 and tend to empty synchronously, and the expired Pco2 remains relatively constant. During the course of
exhalation, the alveolar Pco2 slowly rises as CO2 continuously diffuses from the blood. This causes a slight increase in Pco2 toward the end of expiration, and this increase can be pronounced if the exhalation is prolonged (see Fig. 36-18C). In a patient with diffuse airways obstruction (lower panel), the airway pathology is heterogeneous, with gas exchange units having a wide range of [Vdot]a/[Qdot] ratios. Well-ventilated gas exchange units, with gas containing a lower Pco2, empty first; poorly ventilated units, with a higher Pco2, empty last. In
addition to the continuous rise in Pco2 mentioned previously, there is a progressive increase caused by asynchronous exhalation.
Downloaded from: Miller's Anesthesia (on 19 March 2009 11:18 PM)
© 2007 Elsevier

Figure 57-2 Ventilatory changes (pH, Paco2, and PetCO2) during CO2 pneumoperitoneum for laparoscopic
cholecystectomy. For 13 American Society of Anesthesiologists (ASA) class I and II patients, minute ventilation was kept constant at 100 mL/kg/min with a respiratory rate of 12 per minute during the study. Intra-abdominal pressure was 14 mm Hg. Data are given as the mean ± SEM.*, P .05 compared with time 0.
Downloaded from: Miller's Anesthesia (on 19 March 2009 11:18 PM)
© 2007 Elsevier
CO2 during Capnoperitoneum

Figure 36-20 The effect ofNaHCO3- administration on end-tidal Pco2. A continuous tracing of end-tidal Pco2 is shown as a function of time. Intravenous administration of
50 mEq followed by 30 mEq of NaHCO3 results in an abrupt increase in expired CO2 because of neutralization of bicarbonate by hydrogen ions.
Downloaded from: Miller's Anesthesia (on 19 March 2009 11:18 PM)
© 2007 Elsevier

Capnograph
Sudden fall to 0:
no ventilation - obstruction
error
gradual decrease:
partial obstruction
hyperventilation
decrease of metabolism
decrease of perfusion of the lung
0 etCO2
intubation to oesophagus

Body temperature
> 60 minut in anesthesia
children
aktive warming – bed, warm air
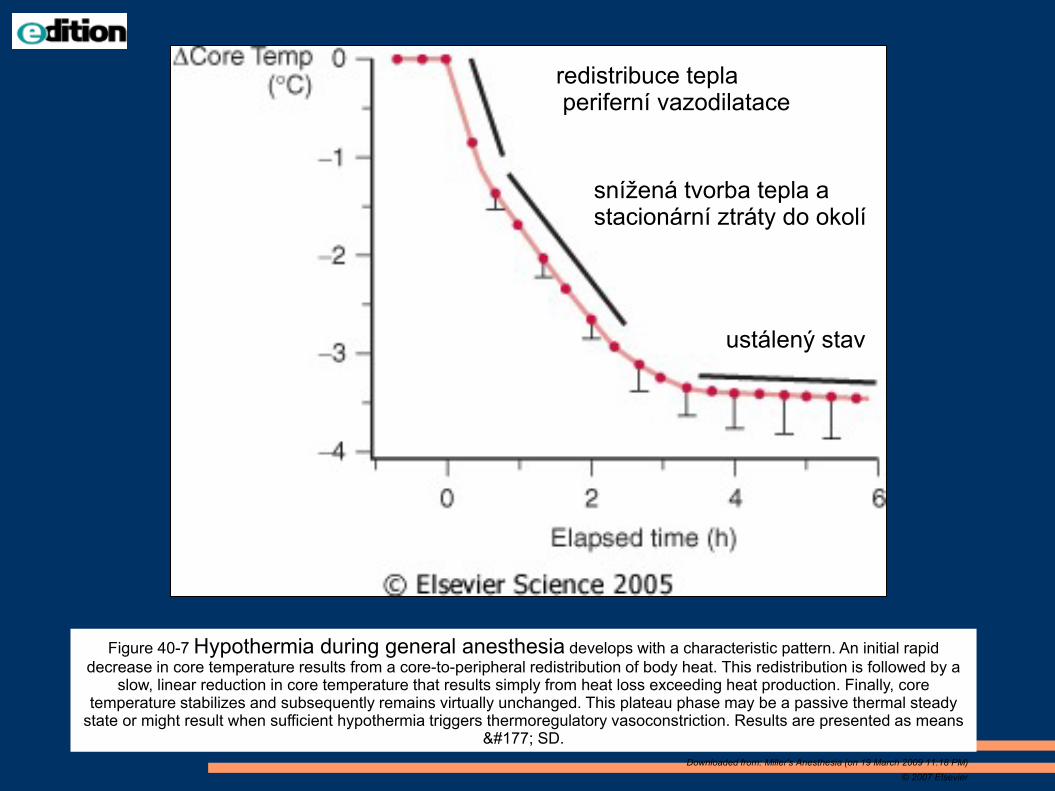
Figure 40-7 Hypothermia during general anesthesia develops with a characteristic pattern. An initial rapid
decrease in core temperature results from a core-to-peripheral redistribution of body heat. This redistribution is followed by aslow, linear reduction in core temperature that results simply from heat loss exceeding heat production. Finally, core
temperature stabilizes and subsequently remains virtually unchanged. This plateau phase may be a passive thermal steady state or might result when sufficient hypothermia triggers thermoregulatory vasoconstriction. Results are presented as means
± SD.
Downloaded from: Miller's Anesthesia (on 19 March 2009 11:18 PM)
© 2007 Elsevier
redistribuce tepla periferní vazodilatace
snížená tvorba tepla astacionární ztráty do okolí
ustálený stav
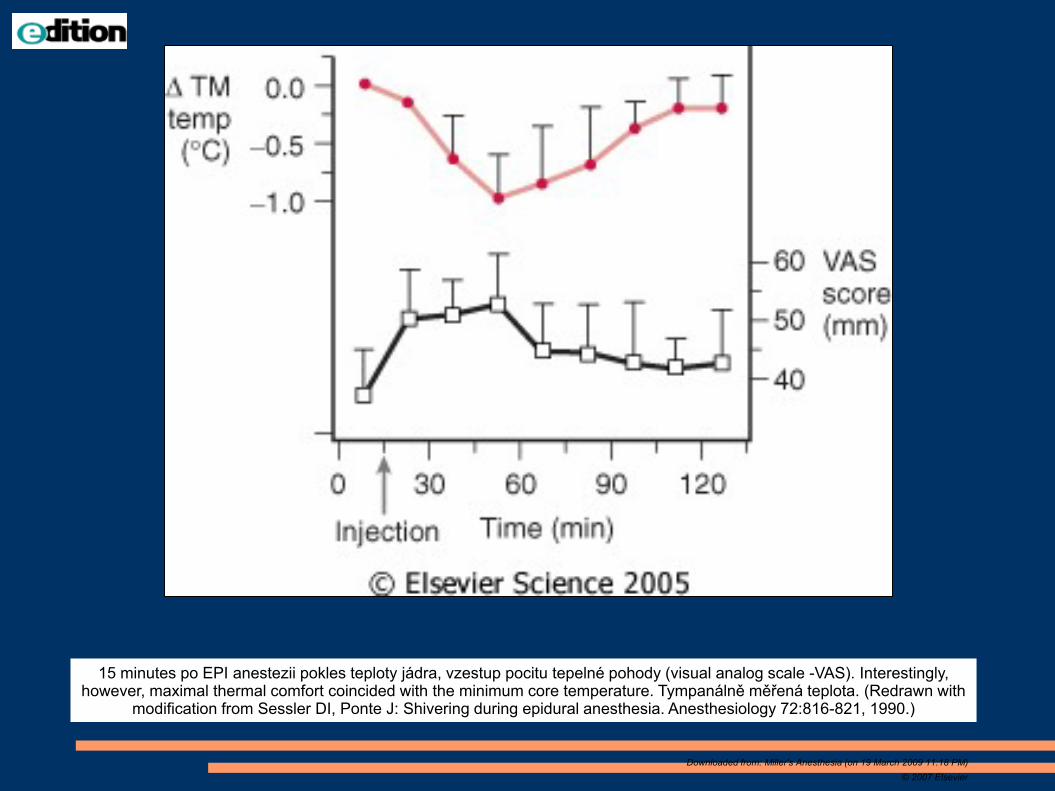
15 minutes po EPI anestezii pokles teploty jádra, vzestup pocitu tepelné pohody (visual analog scale -VAS). Interestingly, however, maximal thermal comfort coincided with the minimum core temperature. Tympanálně měřená teplota. (Redrawn with
modification from Sessler DI, Ponte J: Shivering during epidural anesthesia. Anesthesiology 72:816-821, 1990.)
Downloaded from: Miller's Anesthesia (on 19 March 2009 11:18 PM)
© 2007 Elsevier
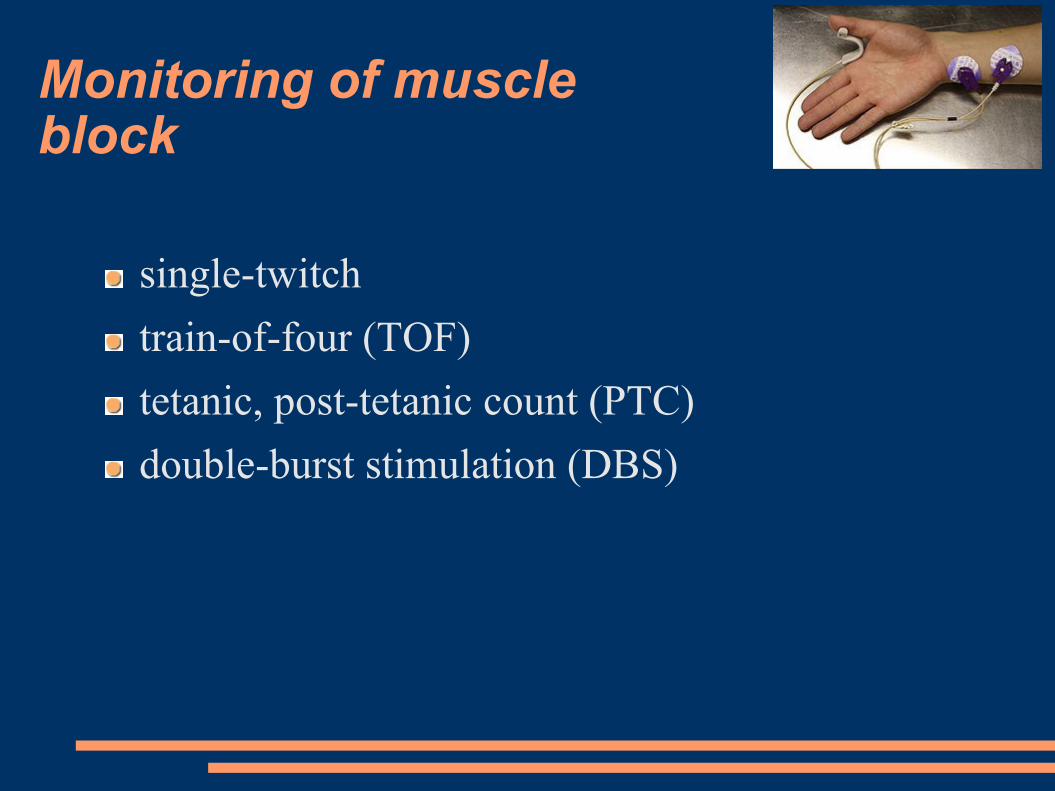
Monitoring of muscle block
single-twitch
train-of-four (TOF)
tetanic, post-tetanic count (PTC)
double-burst stimulation (DBS)
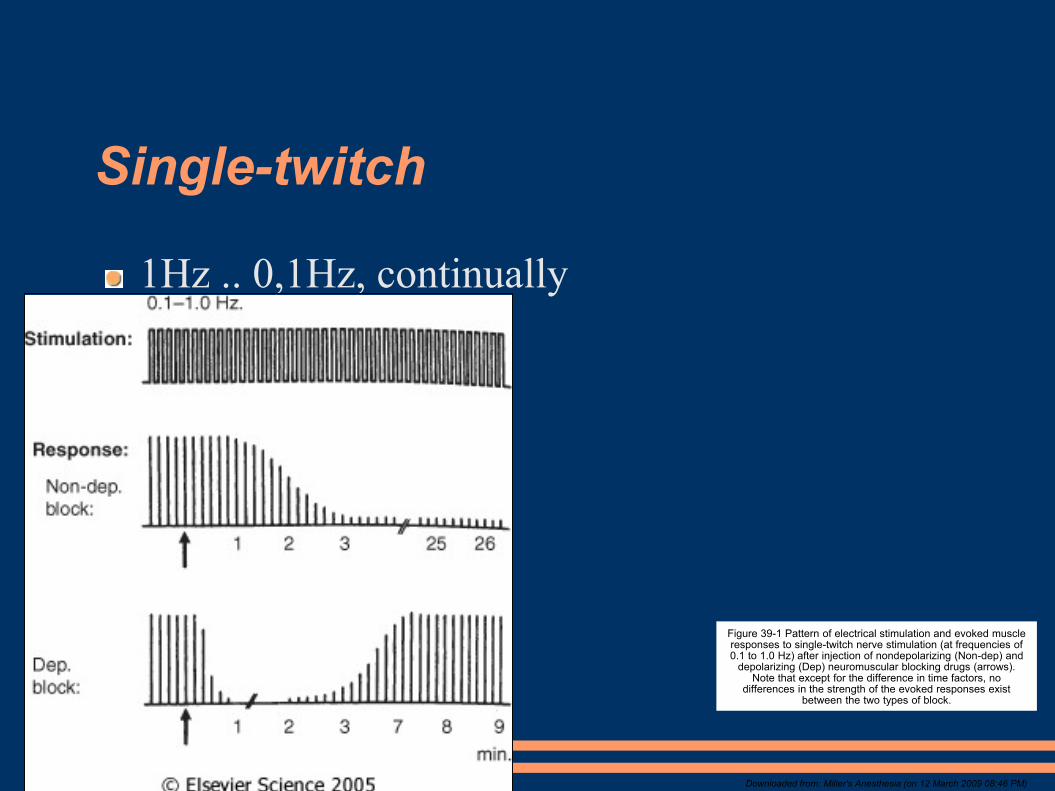
Single-twitch
1Hz .. 0,1Hz, continually
Figure 39-1 Pattern of electrical stimulation and evoked muscle responses to single-twitch nerve stimulation (at frequencies of 0.1 to 1.0 Hz) after injection of nondepolarizing (Non-dep) and
depolarizing (Dep) neuromuscular blocking drugs (arrows). Note that except for the difference in time factors, no
differences in the strength of the evoked responses exist between the two types of block.
Downloaded from: Miller's Anesthesia (on 12 March 2009 08:46 PM)

TOF
4 stimuls á 0,5s (2Hz)
Downloaded from: Miller's Anesthesia (on 12 March 2009 08:46 PM)
Figure 39-2 Pattern of electrical stimulation and evoked muscle responses to TOF nerve stimulation before and after injection of
nondepolarizing (Non-dep) and depolarizing (Dep) neuromuscular blocking drugs (arrows).

Tetanic stimulation
painfull;
50Hz na 5s
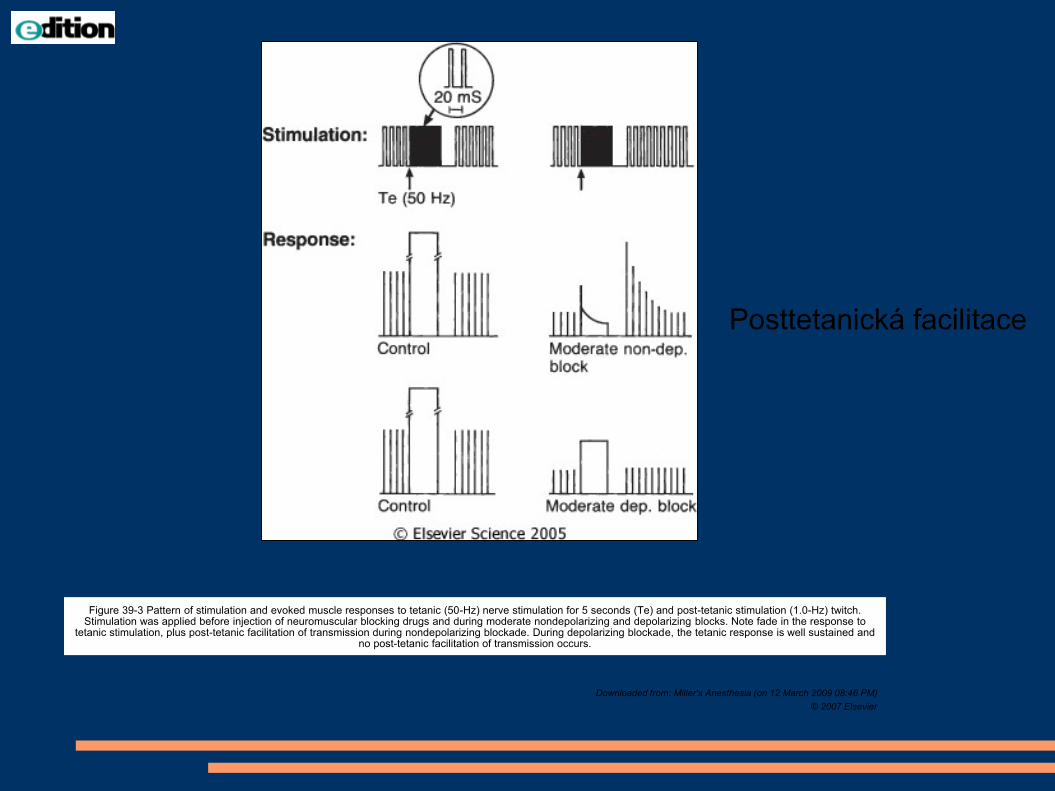
Figure 39-3 Pattern of stimulation and evoked muscle responses to tetanic (50-Hz) nerve stimulation for 5 seconds (Te) and post-tetanic stimulation (1.0-Hz) twitch. Stimulation was applied before injection of neuromuscular blocking drugs and during moderate nondepolarizing and depolarizing blocks. Note fade in the response to
tetanic stimulation, plus post-tetanic facilitation of transmission during nondepolarizing blockade. During depolarizing blockade, the tetanic response is well sustained and no post-tetanic facilitation of transmission occurs.
Downloaded from: Miller's Anesthesia (on 12 March 2009 08:46 PM)
© 2007 Elsevier
Posttetanická facilitace
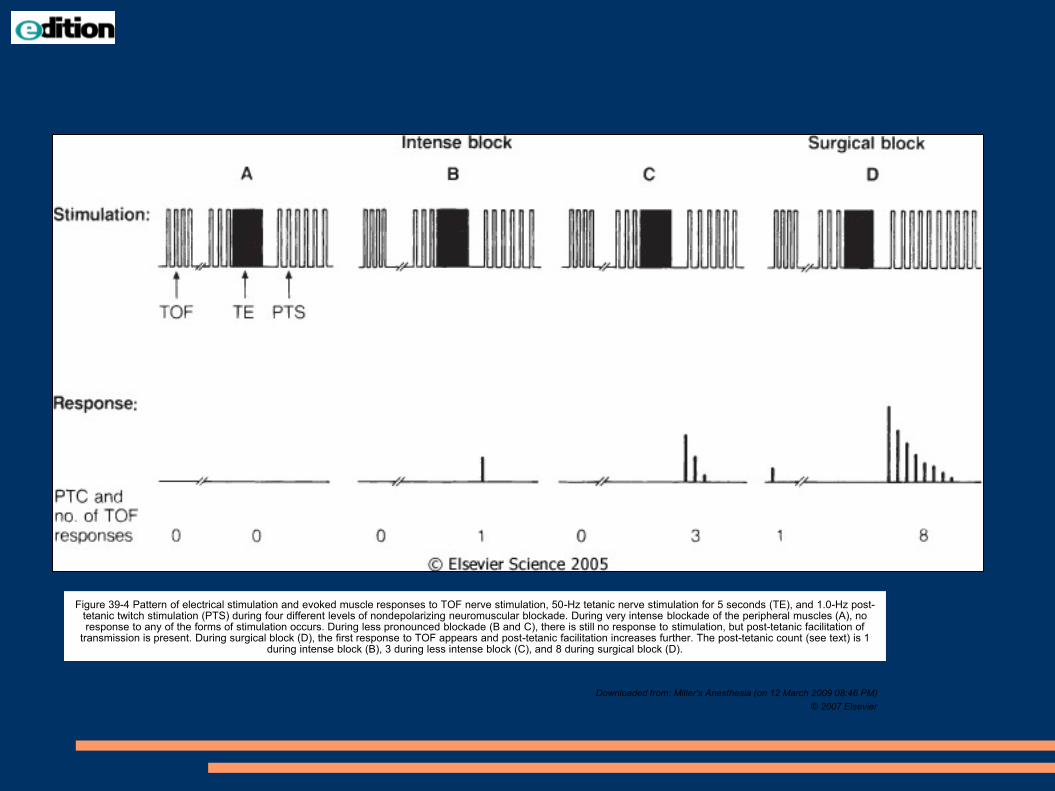
Figure 39-4 Pattern of electrical stimulation and evoked muscle responses to TOF nerve stimulation, 50-Hz tetanic nerve stimulation for 5 seconds (TE), and 1.0-Hz post-tetanic twitch stimulation (PTS) during four different levels of nondepolarizing neuromuscular blockade. During very intense blockade of the peripheral muscles (A), no response to any of the forms of stimulation occurs. During less pronounced blockade (B and C), there is still no response to stimulation, but post-tetanic facilitation of
transmission is present. During surgical block (D), the first response to TOF appears and post-tetanic facilitation increases further. The post-tetanic count (see text) is 1 during intense block (B), 3 during less intense block (C), and 8 during surgical block (D).
Downloaded from: Miller's Anesthesia (on 12 March 2009 08:46 PM)
© 2007 Elsevier

Double-burst stimulation
2 short sequences of 50-Hz tetanic stimulation, separated by 750 ms pause
nonrelaxed muscle – 2 equal contractions
patialy relaxed m. – 2nd contr. is weaker

Figure 39-7 Pattern of electrical stimulation and evoked muscle responses to TOF nerve stimulation and double-burst nerve stimulation (i.e., three impulses in each of two tetanic bursts, DBS3,3) before injection of muscle relaxants (control) and during recovery from nondepolarizing neuromuscular blockade. TOF ratio is the amplitude
of the fourth response to TOF divided by the amplitude of the first response. DBS3,3 ratio is the amplitude of the second response to DBS3,3 divided by the amplitude of the first response. (See text for further explanation.)
Downloaded from: Miller's Anesthesia (on 12 March 2009 09:47 PM)
© 2007 Elsevier
Everythink else
pressure in pipelines
ventilation (bellows is going up with „click“)
Awarrenes during GA
to remember moments of GA
0,1 – 0,2% population (1:800)Extracorporal circulation
Caesarean operation
trauma
report: filling of weakness, unable to move
conversation
anxiety, pain, powerlessness

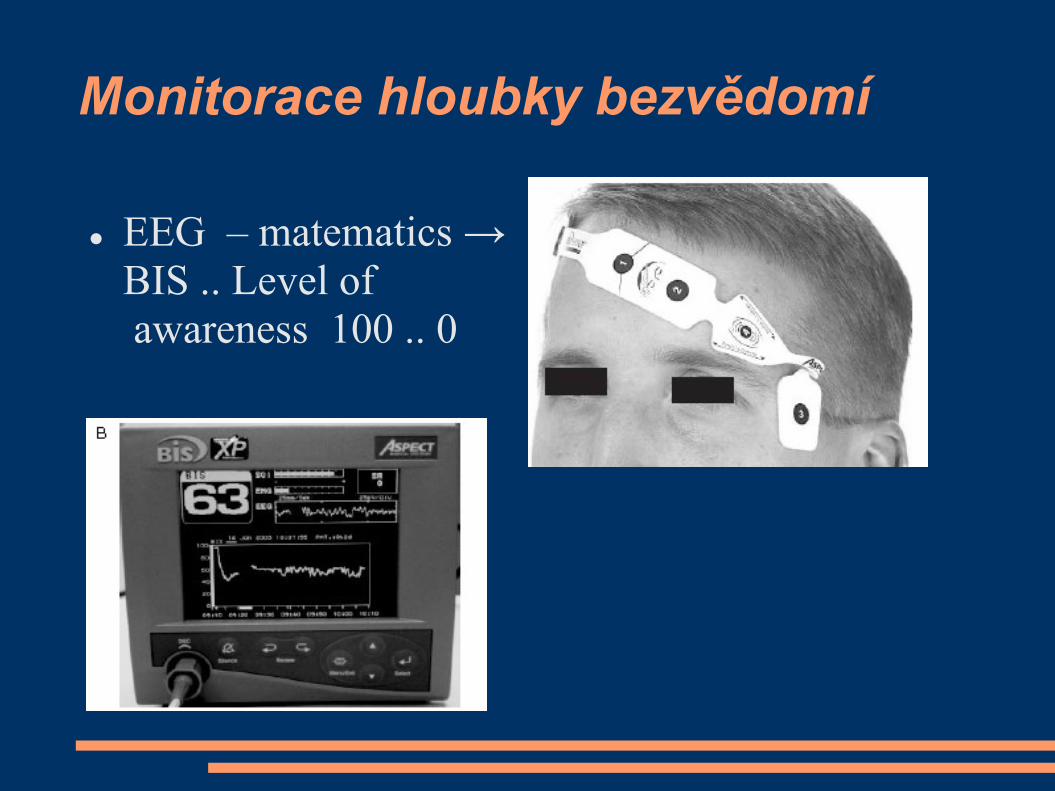
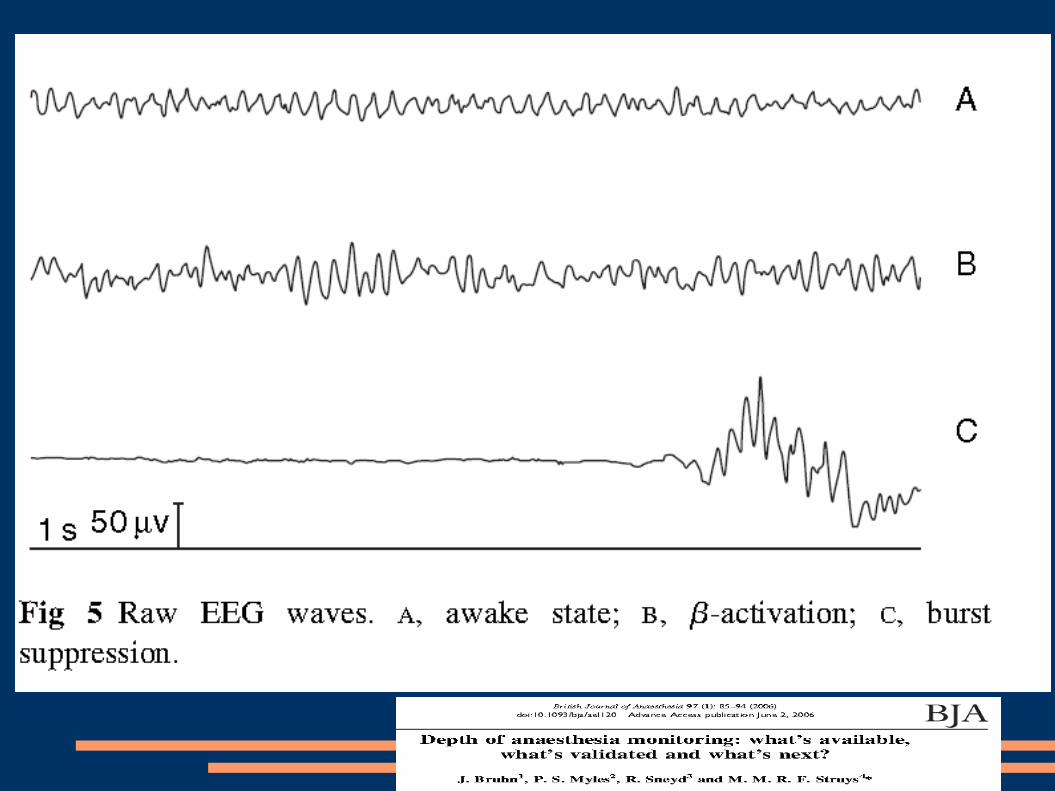
Monitorace hloubky bezvědomí
EEG – matematics →
BIS .. Level of
awareness 100 .. 0

Next? ... farmakology
Related Documents