Anemia in Hemodialysis Patients: Variables Affecting this Outcome Predictor FRANOIS MADORE,* EDMUND 0. LOWRIE,11 CARLO BRUGNARA, NANCY L. LEW,11 J. MICHAEL LAZARUS,1 KENNETH BRIDGES, and WILLIAM F. OWENt *Ce,z(re de Recherche, H#{244}pital du Sacr#{233}-Coeur, Universit#{233}de Montreal, Montreal, Quebec, Canada; RenaI Division and tHematologvOncology Division, Department of Medicine, Brigham and Women ‘s Hospital. Boston, Massachusetts; Department of Lxiboratorv Medicine, Children ‘s Hospital, Boston, Massachusetts; and “National Medical Care, Inc., Waltham, Massachusetts. Abstract. Despite the prevalent use of recombinant human erythropoietin (rhEPO), anemia is a frequent finding in hemo- dialysis patients. The goal of this study was to evaluate the impact of anemia on patient survival and characterize the determinants of hematopoiesis that may be amenable to ther- apeutic manipulation to enhance rhEPO responsiveness and reduce death risk. Patient characteristics and laboratory data were collected for 2 1.899 patients receiving hemodialysis three times per week in dialysis centers throughout the United States in 1993. Hemoglobin concentrations (Hb) 80 g/L were asso- ciated with a twofold increase in the odds of death (odds ratio = 2.01; P 0.001) when compared with Hb 100 to 110 g/L. No improvement in the odds of death was afforded for Hb > 1 10 g/L. Using multiple linear regression, variables of rhEPO administration (rhEPO dose and percentage of treat- ments that rhEPO was administered), variables of iron status (serum iron, transferrmn saturation, and ferritin), variables of nutritional status (serum albumin and creatinine concentra- tion), and the dose of dialysis (urea reduction ratio) were found to be significantly associated with hemoglobin concentration (P < 0.001 ). Age, race, and gender were also found to be significantly associated with hemoglobin concentrations (P < 0.001). From this report, the following conclusions may be made. (1) Anemia may be predictive of an increased risk of mortality in some hemodialysis patients. (2) Hemoglobin con- centrations > I 10 g/L are not associated with further improve- ments in the odds of death. (3) Laboratory surrogates of iron stores, nutritional status, and the delivered dose of dialysis are predictive of hemoglobin concentration. Whether manipulation of the factors that improve anemia will also enhance the survival of patients on hemodialysis is unknown and should be evaluated by prospective, interventional studies. (J Am Soc Nephrol 8: 1921-1929. 1997) Several routine laboratory variables have been identified as predictors of survival in patients undergoing maintenance he- modialysis ( 1-3). On the basis of logistic regression models of outcome, surrogates of nutrition (such as the serum albumin and creatinine concentrations) and measures of delivered dose of dialysis (such as the fractional reduction of urea, or urea reduction ratio [URR]) are the principal predictors of survival for dialysis patients ( 1-3). Other factors have also been de- scribed but have received less attention because they were found to have a less significant statistical impact on patient survival. However, these other variables may be more amena- ble to interventions and, as a result, merit scrutiny. Anemia is one of these factors. Dialysis patients with a hematocrit level of <20% have a probability of death that is one and a half to three Received December 17, 1996. Accepted May 27, 1997. Correspondence to Dr. William F. Owen, Dialysis Administrative Office, Brigham and Women’s Hospital. 75 Francis Street, Boston, MA 021 15. 1046-6673/0801 2-192 1$03.00/0 Journal of the American Society of Nephrology Copyright P 1997 by the American Society of Nephrology times greater than patients with a normal hematocnit level (2.3). The correction of the anemia may be a relatively simple means of improving the probability of survival for dialysis patients. The clinical introduction of recombinant human erythropoi- etin (rhEPO) in the last 6 yr has allowed therapeutic manipu- lation of the hematocrit level in hemodialysis patients. How- ever, despite the prevalent use of rhEPO, anemia remains a common finding in hemodialysis patients. As reported by the U.S. Renal Data System for patients on hemodialysis in 1993, the mean hematocrit was 30.5% despite a mean rhEPO dose of 3923 U three times weekly (4). Treatment with rhEPO is expensive, adding approximately 30% to the cost of a dialysis treatment. Therefore, strategies have been proposed to enhance the erythropoietic response to rhEPO. These strategies include subcutaneous instead of intravenous rhEPO administration (5), the routine administration of parenteral iron supplements (6), or both. Despite the reported efficacy of these interventions, they have not been widely implemented because of patient and physician unacceptance, and fear and intolerance of their side effects. Clinical practice guidelines for the management of anemia in dialysis patients will soon be released that may have a favorable impact on physician behavior and clinical manage- ment strategies. An example of such evidence-based practice

Welcome message from author
This document is posted to help you gain knowledge. Please leave a comment to let me know what you think about it! Share it to your friends and learn new things together.
Transcript

Anemia in Hemodialysis Patients: Variables Affecting this
Outcome Predictor
FRAN�OIS MADORE,* EDMUND 0. LOWRIE,11 CARLO BRUGNARA,�
NANCY L. LEW,11 J. MICHAEL LAZARUS,�1 KENNETH BRIDGES,� and
WILLIAM F. OWENt*Ce,z(re de Recherche, H#{244}pitaldu Sacr#{233}-Coeur, Universit#{233}de Montreal, Montreal, Quebec, Canada; �RenaI
Division and tHematologv�Oncology Division, Department of Medicine, Brigham and Women ‘s Hospital.
Boston, Massachusetts; �Department of Lxiboratorv Medicine, Children ‘s Hospital, Boston, Massachusetts;
and “National Medical Care, Inc., Waltham, Massachusetts.
Abstract. Despite the prevalent use of recombinant human
erythropoietin (rhEPO), anemia is a frequent finding in hemo-
dialysis patients. The goal of this study was to evaluate the
impact of anemia on patient survival and characterize the
determinants of hematopoiesis that may be amenable to ther-
apeutic manipulation to enhance rhEPO responsiveness and
reduce death risk. Patient characteristics and laboratory data
were collected for 2 1 .899 patients receiving hemodialysis three
times per week in dialysis centers throughout the United States
in 1993. Hemoglobin concentrations (Hb) �80 g/L were asso-
ciated with a twofold increase in the odds of death (odds
ratio = 2.01; P 0.001) when compared with Hb 100 to 110
g/L. No improvement in the odds of death was afforded for Hb
> 1 10 g/L. Using multiple linear regression, variables of
rhEPO administration (rhEPO dose and percentage of treat-
ments that rhEPO was administered), variables of iron status
(serum iron, transferrmn saturation, and ferritin), variables of
nutritional status (serum albumin and creatinine concentra-
tion), and the dose of dialysis (urea reduction ratio) were found
to be significantly associated with hemoglobin concentration
(P < 0.001 ). Age, race, and gender were also found to be
significantly associated with hemoglobin concentrations (P <
0.001). From this report, the following conclusions may be
made. (1) Anemia may be predictive of an increased risk of
mortality in some hemodialysis patients. (2) Hemoglobin con-
centrations > I 10 g/L are not associated with further improve-
ments in the odds of death. (3) Laboratory surrogates of iron
stores, nutritional status, and the delivered dose of dialysis are
predictive of hemoglobin concentration. Whether manipulation
of the factors that improve anemia will also enhance the
survival of patients on hemodialysis is unknown and should be
evaluated by prospective, interventional studies. (J Am Soc
Nephrol 8: 1921-1929. 1997)
Several routine laboratory variables have been identified as
predictors of survival in patients undergoing maintenance he-
modialysis ( 1-3). On the basis of logistic regression models of
outcome, surrogates of nutrition (such as the serum albumin
and creatinine concentrations) and measures of delivered dose
of dialysis (such as the fractional reduction of urea, or urea
reduction ratio [URR]) are the principal predictors of survival
for dialysis patients ( 1-3). Other factors have also been de-
scribed but have received less attention because they were
found to have a less significant statistical impact on patient
survival. However, these other variables may be more amena-
ble to interventions and, as a result, merit scrutiny. Anemia is
one of these factors. Dialysis patients with a hematocrit level of
<20% have a probability of death that is one and a half to three
Received December 17, 1996. Accepted May 27, 1997.Correspondence to Dr. William F. Owen, Dialysis Administrative Office,
Brigham and Women’s Hospital. 75 Francis Street, Boston, MA 021 15.
1046-6673/0801 2-192 1$03.00/0
Journal of the American Society of NephrologyCopyright P 1997 by the American Society of Nephrology
times greater than patients with a normal hematocnit level (2.3).
The correction of the anemia may be a relatively simple means
of improving the probability of survival for dialysis patients.
The clinical introduction of recombinant human erythropoi-
etin (rhEPO) in the last 6 yr has allowed therapeutic manipu-
lation of the hematocrit level in hemodialysis patients. How-
ever, despite the prevalent use of rhEPO, anemia remains a
common finding in hemodialysis patients. As reported by the
U.S. Renal Data System for patients on hemodialysis in 1993,
the mean hematocrit was 30.5% despite a mean rhEPO dose of
3923 U three times weekly (4). Treatment with rhEPO is
expensive, adding approximately 30% to the cost of a dialysis
treatment. Therefore, strategies have been proposed to enhance
the erythropoietic response to rhEPO. These strategies include
subcutaneous instead of intravenous rhEPO administration (5),
the routine administration of parenteral iron supplements (6),
or both. Despite the reported efficacy of these interventions,
they have not been widely implemented because of patient and
physician unacceptance, and fear and intolerance of their side
effects. Clinical practice guidelines for the management of
anemia in dialysis patients will soon be released that may have
a favorable impact on physician behavior and clinical manage-
ment strategies. An example of such evidence-based practice

1922 Journal of the American Society of Nephrology
guidelines are the National Kidney Foundation’s Dialysis Out-
comes Quality Initiative.
An improved characterization of the determinants of rhEPO-
stimulated erythropoiesis in hemodialysis patients is essential.
Such an analysis may permit the identification of novel areas
for improved processes of anemia management. Pursuant to
this task. a large. rnulticenter, nationally representative data
base was used to examine the relationships between anemia
and patient survival. and to identify the predictors of hemo-
globin concentration.
Materials and MethodsNational Medical Care. Inc. (Waltham, MA). a large provider of
dialysis services in the United States, maintains a clinical data base
that contains selected demographic. laboratory. and outcome informa-
tion about end-stage renal disease (ESRD) patients receiving care in
its dialysis facilities. These data are used to support a quality enhance-
ment system called the Patient Statistical Profile system.
Patient Groups and Data
Patients receiving hemodialysis three times per week in National
Medical Care dialysis units on January 1, 1993, were selected for this
study. That sample included 21,899 patients. Laboratory files were
searched for data acquired between October 1 . 1992, and December
31. 1992. Patients with missing laboratory data were excluded from
further analysis. The laboratory tests included hemoglobin. hemato-crit. red blood cell count, white blood cell count, mean corpuscular
volume (MCV ), mean corpuscular hemoglobin concentration, serum
iron. seruni ferritin, total iron-binding capacity (TIBC), transferrin
saturation. serum albumin concentration, serum creatinine concentra-
tion. and URR. (URR is defined as the predialysis blood urea nitrogen
IBUNI concentration minus the postdialysis BUN divided by thepredialysis BUN multiplied by 100.) Other laboratory data included
serum concentrations of sodium, potassium. chloride, calcium. lactate
dehydrogenase. total bilirubin, total cholesterol. glucose. and uric
acid. All tests were performed by a single clinical laboratory
(LifeChem, Inc., Rockleigh. NJ). The average value of each test for
the 3 mo of observation was calculated for each patient. and this mean
quantity was used for subsequent analysis. Commonly measured
laboratory variables were available for most patients. but TIBC and
ferritin, for instance, were not available for all patients. Thus. the final
sample with complete laboratory data was 14.896.
Age. sex. race, presence of diabetes mellitus. and baseline renal
diagnosis for all participants were extracted from the Patient Statisti-
cal Profile data. Files were also searched for dose and frequency of
rhEPO administration. No information was available in the data base
on parenteral iron administration and on other comorbid conditions. In
addition. no information was available on the patterns of supplemental
folate administration. However, the standard of care is that most
ESRD patients receive folate containing multivitamins.
Statistical Analyses
Simple descriptive statistics were performed for the major variables
of interest. The association between hemoglobin and death was as-
sessed first. The odds ratio (OR). i.e., the odds of death among
patients in a particular category of exposure divided by the corre-
sponding odds in the comparison category, was used as the measure
of association. OR were adjusted simultaneously for potentially con-
founding variables by multiple logistic regression analysis (7). The
variables considered in these models were laboratory test results
(compare with above) and patient-related variables (age, race, gender,
diabetic status, and baseline renal diagnosis). The baseline renal
diagnoses included glomerulonephritis, cystic disease, diabetic ne-
phropathy, hypertension. myeloma. and renal failure of unknown
origin. among others. If diabetes mellitus was reported but was not
listed as the cause of renal failure. it was classified as a patient-related
variable (comorbid condition). Patients with missing data were ex-
cluded; only those patients with complete data were included in these
multivariable analyses (�i = 14,896).
t test and ANOVA or corresponding nonparametric tests were used
to evaluate the relationship between hemoglobin concentration and
dichotomous and categorical variables. Pearson ‘ s correlation coeffi-
cient was used to evaluate the relationship between hemoglobin
concentration and other continuous variables. Bivaniate associations
were evaluated using several transformations of raw data to determine
the form of the association between variables or to normalize the
distribution of variables, or both. Standard mathematical transforma-
tions were attempted (e.g. , log, square, square root, reciprocal, double
reciprocal. multiplicative, exponential), and the association yielding
the best statistical fit (i.e. , largest r� value) was chosen for presenta-
tion. Multiple linear regression was used to adjust simultaneously for
potential confounding variables and to identify independent predictors
of hemoglobin concentration (8). The variables of rhEPO administra-
tion (rhEPO dose and percentage of treatments that rhEPO was
administered) were included first and fixed in the model. Laboratory
and patient-related variables (age, race, gender. diabetic status, and
baseline renal diagnosis) were then added to the model in a stepwise
fashion. An automated stepwise function (proc general linear model)
has been used to select the variables included in the model. No
transformation or interaction among the various predictors has been
examined. Only rhEPO-treated patients and patients with complete
data were included in this analysis (ii = 1 1,863).
All analyses were performed with the statistical package Statistical
Analysis System (The SAS Institute. Cary, NC). Means are shown ±
SD. All probability values are two-tailed.
ResultsPatient and Ervthrocvte Characteristics
Table 1 summarizes major characteristics and selected lab-
oratory findings. Nearly half of the patients were women and
46.6% were white. Virtually all of the non-white patients were
African-American. The median age of patients in 1993 was
62. 1 yr. A clinical diagnosis of diabetes mellitus was made for
8497 patients (38.8%). The characteristics of the study group
were similar to those of the total U.S. hemodialysis population
except for racial distribution. The proportion of non-white
patients (53.4%) was significantly larger in the present sample
than in the general U.S. hemodialysis population (35%) (4).
The mean hemoglobin was 95.2 gIL, and more than 90% of
patients had hemoglobin and hematocnit values below the
lower limit of normal for healthy individuals.
The analysis of red blood cell indices showed a normal
MCV in 85% of patients (mean, 92.36 fi) but a low mean
corpuscular hemoglobin concentration in 96% of the patients
(mean, 308.7 gIL). Thus, an abnormal erythrocyte phenotype
was evident in most patients. Mean iron levels were near the
lower limit of normal, and TIBC levels were below the lower
limit of normal. In contrast, the mean ferritin value of 288.7
ng/mI was elevated compared with normal values. The mean

Anemia in Hemodialysis Patients I 923
Table 1. Descriptive characteristics o f the study populatio&’
.Variable Value
Reference Rangeb.
(units)
Age
median 62.1
mean (±SD) 59.7 (± 14.8)
Race (% white) 46.6
Gender (% male) 49.1
Diabetes (%)C 38.8
Laboratory values
(mean ± SD)
hemoglobin 95.2 (± 13.1) 120 to 170 (g/L)
hematocnit 30.9 (±4.1) 36.1 to 50.3 (%)
RBC 3.4 (±0.5) 4.2 to 6.1 (X 1012/L)
WBC 6.9 (±2.2) 4.8 to 10.8 (X l012/L)
MCV 92.4 (±7.6) 80 to 99 (fl)
MCHC 308.7 (± 12.8) 330 to 370 (gIL)
iron 10.3 (±5.05) 6.6 to 28.3 (pmol/L)
TIBC 43.9 (±9.6) 46.4 to 69.5 (�tmo1/L)
transferrin 23.1 (±10.2) 20 to 50 (%)
saturation
ferritin 288.7 (±485.3) 5 to 179 (ng/ml)
albumin 37 (±4) 35 to 52 (g/L)
creatinine 981.2 (±318.2) 53 to 140 (p.mol/L)
URR 62.9 (±8.4) (%)
a n 21,899. RBC, red blood cell; WBC, white blood cell;
MCV, mean corpuscular volume; MCHC, mean corpuscular
hemoglobin concentration; TIBC, total iron-binding capacity; URR,urea reduction ratio.
b Reference range from LifeChem, Inc. (Rockleigh, NJ).C Present as the principal renal diagnosis or a comorbid
condition.
albumin concentration for this population was 37 g/L (lower
limit of normal), and the URR was 63%.
Eighty percent (80.6%) of patients received rhEPO, and
�90% received it intravenously. The mean rhEPO dose was
3468 U/dose. Mean hemoglobin concentration among patients
who received and who did not receive rhEPO was 95.7 ± 2.46
g/L and 95.1 ± 0.6 g/L, respectively (P = 0.015).
Association Between Hemoglobin and Death
Figure 1 shows the risk profile of death among hemoglobin
categories adjusted for patient demographic variables (i.e. , age,
gender, race, diabetic status, and renal diagnosis), for demo-
graphics and serum albumin, and for demographics, albumin,
and other laboratory variables (labeled case mix, case mix +
albumin, and case mix + laboratory-adjusted, respectively).
The OR for death increased progressively among hemoglobin
categories below 100 g/L. For example, hemoglobin concen-
trations �80 g/L were associated with a twofold increase in the
odds of death (OR 2.01; P = 0.001). Alternatively. hemo-
globin concentrations exceeding I 10 g/L were associated with
no reduction in the OR for death. More than 10% (ii = 2085)
of the patients had hemoglobin concentrations > 1 10 g/L, such
that the lack of survival benefit was not likely because of a
a-error. For hemoglobin concentrations <90 g/L, the OR fordeath were reduced when adjustment was made for serum
albumin concentration. Adjustment for other laboratory van-
ables did not change the results substantially (Figure 1).
Predictors of Hemoglobin Concentration
Table 2 summarizes the results from a multivaniate, step-
wise, linear regression analysis that evaluated the relationship
between selected patient-related variables and laboratory tests
2.2
�2.O(5a)0 1.8UI-0 1.60
(5 1.4
�0
0 1.0
0.8
�80 80-90 90-100 100-110 >110
HGB (gIL)
a Case Mix� Case Mix
�xx� � AlbuminLII Case Mix
. +Lab
Figure 1. Risk of death according to hemoglobin concentration. The odds ratios are adjusted for patient characteristics only (age, gender.
diabetic status, and renal diagnosis; black bars), for patient characteristics plus serum albumin concentration (hatched bars), and for patient
characteristics, serum albumin concentration, and other routine laboratory variables (grey bars). P values are from comparison with the
reference group. The number of patients in each hemoglobin category was: �80, n = 2266; 80 to 90, ii 4087; 90 to 100, n 6071 ; 100
to 110, n = 4283; and >110, n 2085.
1924 Journal of the American Society of Nephrology
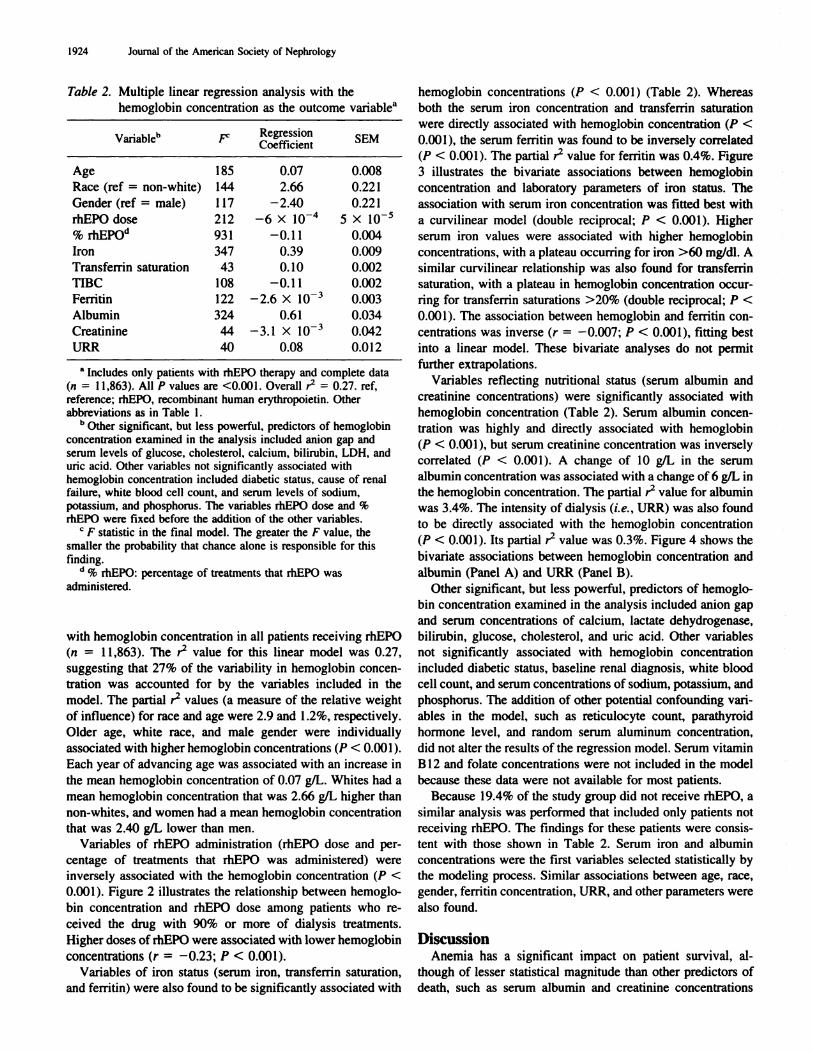
Table 2. Multiple linear regression analysis with the
hemoglobin concentration as the outcome variabl&’
Variableb p: RegressionCoefficient
SEM
Age 185 0.07 0.008
Race (ref = non-white) 144 2.66 0.221
Gender (ref = male) 1 17 -2.40 0.221
rhEPO dose 212 -6 X l0� 5 X l0
% rhEPO” 931 -0.1 1 0.004
Iron 347 0.39 0.009
Transfernin saturation 43 0. 10 0.002
TIBC 108 -0.11 0.002
Ferritin 122 -2.6 X l0� 0.003
Albumin 324 0.61 0.034
Creatinine 44 -3.1 X l0� 0.042
URR 40 0.08 0.012
a Includes only patients with rhEPO therapy and complete data
(�i = I 1.863). All P values are <0.001. Overall r� = 0.27. ref.
reference: rhEPO, recombinant human erythropoietin. Other
abbreviations as in Table 1.
h Other significant. but less powerful. predictors of hemoglobin
concentration examined in the analysis included anion gap andserum levels of glucose. cholesterol. calcium. bilirubin, LDH, anduric acid. Other variables not significantly associated withhemoglobin concentration included diabetic status. cause of renalfailure, white blood cell count, and serum levels of sodium,
potassium. and phosphorus. The variables rhEPO dose and %rhEPO were fixed before the addition of the other variables.
C F statistic in the final model. The greater the F value. the
siiialler the probability that chance alone is responsible for this
finding.(i C/� rhEPO: percentage of treatments that rhEPO was
administered.
with hemoglobin concentration in all patients receiving rhEPO
(a 1 1,863). The r� value for this linear model was 0.27,
suggesting that 27% of the variability in hemoglobin concen-
tration was accounted for by the variables included in the
model. The partial r� values (a measure of the relative weight
of influence) for race and age were 2.9 and 1.2%, respectively.
Older age, white race, and male gender were individually
associated with higher hemoglobin concentrations (P < 0.001).
Each year of advancing age was associated with an increase in
the mean hemoglobin concentration of 0.07 g/L. Whites had a
mean hemoglobin concentration that was 2.66 g/L higher than
non-whites. and women had a mean hemoglobin concentration
that was 2.40 gIL lower than men.
Variables of rhEPO administration (rhEPO dose and per-
centage of treatments that rhEPO was administered) were
inversely associated with the hemoglobin concentration (P <
0.001 ). Figure 2 illustrates the relationship between hemoglo-
bin concentration and rhEPO dose among patients who re-
ceived the drug with 90% or more of dialysis treatments.
Higher doses of rhEPO were associated with lower hemoglobin
concentrations (r = -0.23; P < 0.001).
Variables of iron status (serum iron, transferrmn saturation,
and fernitin) were also found to be significantly associated with
hemoglobin concentrations (P < 0.001 ) (Table 2). Whereas
both the serum iron concentration and transferrin saturation
were directly associated with hemoglobin concentration (P <
0.001 ). the serum ferritin was found to be inversely correlated
(P < 0.001). The partial r� value for ferritin was 0.4%. Figure
3 illustrates the bivaniate associations between hemoglobin
concentration and laboratory parameters of iron status. The
association with serum iron concentration was fitted best with
a curvilinear model (double reciprocal; P < 0.001). Higher
serum iron values were associated with higher hemoglobin
concentrations, with a plateau occurring for iron >60 mg/dl. A
similar curvilinear relationship was also found for transferrmn
saturation, with a plateau in hemoglobin concentration occur-
ring for transferrmn saturations >20% (double reciprocal; P <
0.001). The association between hemoglobin and femtin con-
centrations was inverse (r = -0.007; P < 0.001), fitting best
into a linear model. These bivaniate analyses do not permit
further extrapolations.
Variables reflecting nutritional status (serum albumin and
creatinine concentrations) were significantly associated with
hemoglobin concentration (Table 2). Serum albumin concen-
tration was highly and directly associated with hemoglobin
(P < 0.001). but serum creatinine concentration was inversely
correlated (P < 0.001). A change of 10 g/L in the serum
albumin concentration was associated with a change of6 gIL in
the hemoglobin concentration. The partial r� value for albumin
was 3.4%. The intensity of dialysis (i.e. . URR) was also found
to be directly associated with the hemoglobin concentration
(P < 0.001). Its partial r� value was 0.3%. Figure 4 shows the
bivariate associations between hemoglobin concentration and
albumin (Panel A) and URR (Panel B).
Other significant, but less powerful, predictors of hemoglo-
bin concentration examined in the analysis included anion gap
and serum concentrations of calcium. lactate dehydrogenase,
bilirubin, glucose, cholesterol, and uric acid. Other variables
not significantly associated with hemoglobin concentration
included diabetic status, baseline renal diagnosis, white blood
cell count, and serum concentrations of sodium, potassium, and
phosphorus. The addition of other potential confounding van-
ables in the model, such as reticulocyte count. parathyroid
hormone level, and random serum aluminum concentration,
did not alter the results of the regression model. Serum vitamin
B 12 and folate concentrations were not included in the model
because these data were not available for most patients.
Because 19.4% of the study group did not receive rhEPO, a
similar analysis was performed that included only patients not
receiving rhEPO. The findings for these patients were consis-
tent with those shown in Table 2. Serum iron and albumin
concentrations were the first variables selected statistically by
the modeling process. Similar associations between age, race,
gender. ferritin concentration, URR, and other parameters were
also found.
DiscussionAnemia has a significant impact on patient survival, al-
though of lesser statistical magnitude than other predictors of
death, such as serum albumin and creatinine concentrations

Anemia in 1-lemodialysis Patients 1925
140
120
100
80
60
, � .�.J.. � I-
-..---..-.-,...--.- ‘I�
are shown.
0)
C.000)0EG)
I40
0 0.2 0.4 0.6 0.8 1.0 1.2 1.4 1.6 1.8 2.0
rhEPO Dose (x 10� u/Administration)
Figure 2. Relationship between hemoglobin concentration and dose of recombinant human erythropoietin (rhEPO) for patients who received
rhEPO with >90% of their dialysis treatments (r = -0.23: P < 0.001 ). The regression line, 95% confidence liniits. and 95C% predictive limits
and the delivered dose of hemodialysis (2.3). In the present
study. the relationship between hemoglobin concentration and
survival was examined further to define an optimal concentra-
tion based on the OR for death. It was observed that after
adjustment for other demographic and laboratory predictors of
survival, patients with a hemoglobin concentration <80 g/L
had an approximate 50% increase in the odds of death corn-
pared with patients with a hemoglobin concentration of I 00 to
1 1 0 g/L. Furthermore, hemoglobin concentrations exceeding
I 10 g/L were not associated with further reduction in the odds
of death.
Because of the inability to gather more extensive informa-
tion about patient comorbidity, and to incorporate this into the
statistical constructs, these data demonstrate that dialysis pa-
tients corrected to a hemoglobin of 100 to I 10 g/L had the
lowest mortality. It is possible that patients with the worst
anemia had the greatest comorbid conditions, and the increased
death risk was a result of this confounding effect. This distinc-
tion is critical in clarifying the role of anemia correction to
reduce death risk. The data presented here do not permit any
greater distinction in data interpretation.
Previous studies have attempted to define the optimal con-
centration to which hemoglobin should be corrected during
rhEPO therapy in terms of patient morbidity. quality of life,
and exercise capacity (9-12). Intervention trials with rhEPO
have suggested that most of the quality-of-life benefit from
rhEPO’s correction of anemia was achieved at a hemoglobin
concentration of approximately 105 g/L (9). However. recent
studies have suggested that not only did quality of life benefits
extend beyond this cutoff, but other benefits, such as left
ventricular hypentrophy and improvement in heart function,
may accrue when higher concentrations of hemoglobin were
reached (10-12). Recent studies have also related the hemo-
globin concentration to the development of congestive heart
failure ( 1 3). and all-cause death rates have been shown to be
lower in patients with a mean hematocrit of 32% than in
patients with a mean hematocnit of 26% ( 14). Importantly,
none of the previous studies has attempted to define the opti-
mal hemoglobin concentration in terms of patient mortality.
The current study suggests that for many patients. hemoglobin
levels > 1 10 g/L may not be associated with a significant
benefit in terms of overall patient mortality. Of note. a recent
randomized control trial evaluating the impact of two target
hematocrits (42 and 30%) on the mortality of hemodialysis
patients with cardiac disease was stopped prematurely based on
recommendations of the external monitoring board. A trend
toward greater patient mortality in the high hernatocrit group
(Hct = 42%) compared with the low hematocnit group (Hct
30%) was observed (A. Nissenson, J. Eschbach, personal corn-
munication).
To eventually optimize the hemoglobin concentration, mdc-
pendent predictors of hemoglobin concentration must he iden-
tified. Age. race, and gender were found to be significant
demographic variables associated with hemoglobi n concentra-
tion. Male patients and white patients were found to have
higher hemoglobin values when adjusting for rhEPO dose. iron
and ferritin levels, and albumin concentration. Similar differ-
ences are found in the general population and are not specific
to ESRD patients on hemodialysis (15,16).
Variables of rhEPO administration (rhEPO dose and per-
centage of treatments that rhEPO was administered) were also
identified as independent predictors of hemoglobin concentra-

170 170
160 #{149}- � --� 160
150 �-�- � � � � �- 150
140 � � � � . � �-- 140
130 �. 130� 120 - L� � � � � � � 120; 110 . � � �-- � .� ; 110:� ioo ‘ :� ioo.�) 90 #{149} � � �-- ! 90
� 80 � C � � 80! �o � � �- �-� � � _o:_� I 70
60 �. � � � 6050 � � � � 50
0 20 40 60 80 100 120 140 160 180 200
Serum Iron (pmol/L) Transferrin Saturation (%)
A B
_j �
�) . � ,- . . �
� � ---.0 .--,, �
0 .
0) . -0 -
E � -�
0 . -I
0.5 1.0 1.5 2.0
loglO(Ferritin) (ng/ml)
CFigure 3. Bivariate associations between hemoglobin concentration and serum iron concentration (A). transferrin saturation (B), and serum
ferritin concentration (log-transformed; C). The regression line. 95% confidence limits. and 95% predictive limits are shown and were
constructed using all of the data. Only a 5% random sample of the data points is shown here.
.. . .
U
‘a � �
- ‘dl I : .�--
�---- -.-.-U
S ,S
. uiui�U #{149} --- _$_
- . - #{149}.U
U
� . . . I . . . I . . . � . . . � . . . I . .�. I�. . .1
22 26 30 34 38 42 46 50
Serum Albumin (gIL)
.U
U�
A
U;
!�‘ � , -� -� - �---�----�--, � -� � �
30 35 40 45 50 55 60 65 70 75 80 85 90
URR(%)
B
1926
I 70I 60
I 50�. 140.9 130
� 120.�0 110g’ 100
E 90
I 80
70
60
50
Journal of the American Society of Nephrology
170160150140
130120
110100
90807060
50
I 70
I 60
150
:r 140� 130
� 120.00
g1 iooE 900
I 80
70
60
50
-- --
� � �� � .-� a I
� #{149}U
� - ._-�i�1TT �
--i- �.
Figure 4. Bivariate associations between hemoglobin concentration and serum albumin concentration (A) and urea reduction ratio (B) (P <
0.001). The regression line. 95% confidence limits, and 95% predictive limits are shown and were constructed using all ofthe data. Only a 5%
random sample of the data points is shown here.
tion. Both were inversely associated with the hemoglobin
concentration. This counter-intuitive finding may reflect phy-
sician practice or differential rhEPO responsiveness, or both.
rhEPO is prescribed to improve hemoglobin or hematocrit to
approach the threshold value at which reimbursement from the
Health Care Financing Administration ceases. As that point
Anemia in Hemodialysis Patients 1927
nears, the dose of rhEPO is decreased. Alternatively, if the
hemoglobin fails to improve, the dose of rhEPO is increased. A
similar phenomenon occurs with blood transfusions; severely
anemic patients receive more transfusions than mildly anemic
ones.
The independent positive association of serum iron level and
tnansfemn saturation with hemoglobin concentration is easily
understood and underscores the critical role of iron in achiev-
ing optimal response to rhEPO therapy. The transfemn satu-
ration corresponds to iron that is readily available for erythro-
poiesis and is one of the most widely used and reliable
indicators of iron status (17,18). The curvilinear relationship
between transfemn saturation and hemoglobin concentration
indicates that the hemoglobin concentration reaches a plateau
of 100 to 1 10 gIL at transferrmn saturation �20%. Thus,
whereas some patients may individually benefit from a higher
transfemn saturation, the population as a whole does not
appear to benefit in terms of hemoglobin concentration. With
regard to patient management, until a prospective analysis is
performed. iron replacement should be aimed at maintaining a
transfernin saturation of at least 20%. Further study is needed to
evaluate whether patient subsets exist that may benefit from a
higher transferrmn saturation.
The finding of ferritin as an independent inverse predictor of
hemoglobin concentration may have several explanations.
First, high ferritin levels, observed in association with low
normal serum iron, TIBC, and transferrin saturation, are corn-
monly found in anemic patients with chronic diseases and
suggest impaired iron metabolism (19-2 1). Second, these data
suggest that ferritin concentration in dialysis patients is not a
simple measure of iron stores. Because ferritin synthesis is
enhanced during inflammation, high ferritin levels may be a
consequence of a nonspecific systemic inflammatory process
rather than of increased iron stores. In this circumstance, the
inflammatory process that stimulates ferritin synthesis may
also act to inhibit erythropoiesis. Bone marrow hypoprolifera-
tion may occur because of endogenous inhibitors, such as
tumor necrosis factor-a (TNF-a), interleukin- 1 (IL- 1), and
IL-6. Nude mice injected with transfected cells with TNF-a
develop a marked hypoproliferative anemia associated with a
reduction in erythroid colony-forming units and burst-forming
units (22). In the absence of infection, autoimmune disorders,
and neoplastic diseases, elevated levels of IL-l and TNF-a
have been observed in dialysis patients (23). Furthermore,
elevated levels of IL-6 have been shown to be associated with
impaired erythropoiesis and resistance to rhEPO in dialysis
patients (24). Therefore, the increased serum femtin concen-
tration may be a surrogate of cytokine-dependent inhibition of
erythropoietin.
In addition, inflammation is also associated with a defect in
iron utilization, characterized by reduced iron delivery (25). In
the face of inflammatory blockade, iron stored within reticu-
loendothelial cells is not released to transferrmn. However, the
transfemn-to-erythroid progenitor cell transfer remains intact.
Serum iron and transfernin saturation are typically reduced, and
marrow response to erythropoietin is severely limited by this
relative iron deficiency (25).
Of all the variables examined in this study, albumin was the
most closely associated with hemoglobin concentration; hence,
higher serum albumin concentrations were associated with
greater hemoglobin concentrations. This finding was also ob-
served by others, without comment (26). If albumin is viewed
as a surrogate of visceral protein nutrition, then hypoalbumin-
emia is a marker for visceral protein depletion, which may
contribute to impaired erythropoiesis and anemia. Visceral
protein deficiency could adversely affect heme and erythrocyte
synthesis, as well as iron transport, storage, and utilization
(27). It could also affect erythropoietin production, although
this effect is minimal in the anephric state of ESRD. The
importance of dietary protein in the synthesis of hemoglobin
has been reported in both animal and clinical human studies
(28-30). Anemia is a common feature of patients with kwash-
iorkor secondary to low protein and calorie intake (27,31-34).
A direct correlation between serum protein levels and hemo-
globin concentration has been observed (32,34). Moreover.
several investigators have described complete correction of
anemia in patients with normal renal function and protein
energy malnutrition after treatment with high-protein diets
alone (3 1,35,36).
It is noteworthy that the serum albumin concentration di-
rectly correlated with erythropoiesis, but that the serum creat-
mine concentration correlated inversely. If the nutritional sta-
tus alone were the principal determinant. both of these
laboratory surrogates of nutrition should be directly predictive
of erythropoietic response. Thus, in some patients, the reduc-
tion in albumin concentration may not be a surrogate of low-
protein calorie intake, but a consequence of decreased albumin
synthesis independent of nutritional status (37). Hypoalbumin-
emia without malnutrition has been observed in hernodialysis
patients and has been ascribed to the effect of inflammation on
hepatic albumin synthesis (37). If this mechanism is opera-
tional, hypoalbuminemia and anemia are linked as concurrent
non-nutritional occurrences. Inflammation results in both de-
creased albumin synthesis and anemia. Support for this hy-
pothesis is provided by the observed inverse correlation be-
tween ferritin levels and hemoglobin concentration.
Hemoglobin concentration was also found to be significantly
correlated with URR, a measure of dialysis intensity. Similar
results were reported in which the investigators observed a
positive correlation between hemoglobin concentration and
URR (26). An increase in URR was associated with an mere-
ment in the hematocrit value.
Another novel finding was that the majority of patients had
a severely hypochromic normocytic anemia. These erythro-
cytes are different from the microcytic. hypochromic cells of
iron deficiency and the classical normocytic normochrornic
cells that are seen in patients with chronic diseases but normal
renal function. Similarly, this erythrocyte phenotype is not
observed in chronic renal failure without erythropoietin ther-
apy (38). The precise reasons for this finding are unclear.
However, a kinetic imbalance between rhEPO and iron dcliv-
cry to the bone marrow, rather than an absolute iron deficit,
could explain the finding of erythrocytes of normal size (nor-
mal MCV) with low hemoglobin content (low hemoglobin

1928 Journal of the American Society of Nephrology
concentration). Because high levels of rhEPO are observed
immediately after intravenous injections of the hormone, nor-
moblasts undergo rapid proliferation and hemoglobin synthe-
sis. The resultant hematopoietic demand for iron is so tremen-
dous that hemoglobin synthesis by normoblasts exceeds iron
availability. despite normal or low-normal iron stores, and
relatively poorly hemoglobinized reticulocytes and erythro-
cytes appear in circulation (39-42). However, these erythro-
cytes may lack the microcytosis that is the hallmark of absolute
iron deficiency (43). because rhEPO forces the premature
differentiation and release of less mature, and hence larger,
cells in the erythroid lineage. Thus, although iron-deficient and
hypochromic. these erythrocytes may not be microcytic (44).
By coordinating the administration of rhEPO and iron by
subcutaneous dosing of the former in parallel with routine
maintenance intravenous administration of the latter, the ki-
netic imbalance between rhEPO and iron delivery to the bone
marrow might be minimized.
The cause of anemia in dialysis patients is complex and
multifactorial. Although the predominant reason for the devel-
opment of anemia is the lack of erythropoietin production by
the diseased kidney. this study identified other important con-
tnibuting factors that must be taken into consideration. These
factors, such as protein energy malnutrition, iron deficiency,
and delivered dose of hemodialysis. merit renewed attention
because of their potential significant impact on anemia, rhEPO
responsiveness. and ultimately patient survival. Correction of
anemia through interventions targeting these factors may pro-
vide improved survival for patients on maintenance hemodial-
ysis. Prospective, interventional studies will be required to
validate this hypothesis.
AcknowledgmentsDr. Madore is the recipient of a research fellowship from the
Medical Research Council of Canada. Dr. Owen is the recipient of
National Institutes of Health (NIH) Grants ROI DK45656-Ol and UOI
DK49259-0l . Dr Bridges is the recipient of NIH Grant HL DK 45794.
ReferencesI . Owen W, Lew N. Liu Y, Lowrie E, Lazarus J: The urea reduction
ratio and serum albumin concentration as predictors of mortality
in patients undergoing hemodialysis. N EngI J Med 329: 1001-
l()06, 1993
2. Lowrie E. Lew N: Death risk in hemodialysis patients: The
predictive value of commonly measured variables and an eval-
uation of death rate differences between facilities. Am J Kidney
I)is 15: 458-482. 1990
3. Lowrie E, Lew N: Commonly measured laboratory variables in
hemodialysis patients: Relationships among them and to death
risk. Semin Nephrol 12: 276-283, 1992
4. Held P. Port F. Webb R. Wolfe RA. Bloembergen WE, Turenne
MN. Holzmann E. Ojo AO. Young EW, Mauger EA: Excerpts
from United States Renal Data System 1995 Annual Report.
Am J Kidney Dis 26[Suppl 21: 51-5186, 1995
5. Paganini E, Eschbach J. Lazarus J. van Stone JC. Gimenez LF,Graben SE, Egrie JC. Okamoto DM, Goodkin DA: Intravenous
versus subcutaneous dosing of Epoetin Alfa in hemodialysis
patients. A��i J Kidney Dis 26: 331-340. 1995
6. Fishbane 5, Frei G, Maesaka J: Reduction in recombinant human
erythropoietin doses by the use of chronic intravenous iron
supplementation. Aiii J Kidney Dis 26: 41-46, 1995
7. Hosmer D. Lemeshow 5: Applied L49gistu Regression, New
York, John Wiley & Sons, 1989
8. Kleinbaum D, Kupper L. Muller K: Applied Regression Analysis
and other Multis’ariate Methods. Boston, PWS KENT Publish-
ing. 1988
9. Canadian Erythropoietin Study Group: Association between re-
combinant erythropoietin and quality of life and exercise capac-
ity of patients receiving haemodialysis. Br Med J 300: 573-578,
1990
10. Eschbach J. Glenny R, Robertson T: Normalizing the hematocrit
in hemodialysis patients with rhEPO improves quality of life and
is safe [Abstract]. J Am Soc Nephrol 4: 425, 1993
1 1 . Low-Friedrich I. Grutzmacher P. Marz W, Bergmann M, Scho-
eppe W: Therapy with recombinant erythropoietin reduces car-
diac size and improves cardiac function in chronic hemodialysis
patients. Aiii J Nep/irol I 1 : 54-60. 1991
12. MacDougall I, Lewis N. Saunders M: Long-term cardiorespira-tory effects of amelioration of renal anemia by erythropoietin.
Lancet 335: 489-493, 1990
I 3. Foley RN, Parfrey PS. Harnett JD. Kent GM. Murray DC. Barre
PE: The impact of anemia on cardiomyopathy. morbidity. and
mortality in end-stage renal disease. Am J Kidney Dis 28: 53-61,
I 996
14. Collins A. Ma J. Umen A: Infectious and all-cause death rates are
lower with a mean hematocrit of 32% versus 26% [Abstract].
Proceedings of the International Society of Nephrology Meeting.
Jerusalem, 1993, p 386
15. Perry G, Byers T, Yip R, Margen 5: Iron nutrition does not
account for the hemoglobin differences between blacks and
whites. J Nuir 122: 1417-1424, 1992
16. Meyers L, Habicht J, Johnson C: Components of the differences
in hemoglobin concentration in blood between black and white
women in the United States. Am J Epidemiol 109: 539-549,
I 979
17. VanWyck D. Stivelman J. Ruiz J. Kirlin L. Katz M, Ogden D:
Iron status in patients receiving erythropoietin for dialysis-asso-
ciated anemia. Kidney but 35: 712-716. 1989
18. Muirhead N. Bargman J, Burgess E. Jindal KK, Levin A, Nolin
L, Parfrey P: Evidence-based recommendations for the clinicaluse of recombinant human erythropoietin. Am J Kidney Dis 26:
51-524, 1995
19. Baynes R. Flax H, Bothwell T: Hematologic and iron related
measurements in active pulmonary tuberculosis. Scand J Hema-
tol 36: 280-287, 1986
20. Cash J, Sears D: The anemia of chronic disease: Spectrum of
associated diseases in a series of unselected hospitalized patients.
Am J Med 87: 638-644. 1989
2 1 . Means R. Drantz 5: Progress in understanding the pathogenesis
of the anemia of chronic disease. Blood 80: 1639-1647, 1992
22. Roodman G. Johnson G. Clibon U: Tumor necrosis factor-alpha
and the anemia of chronic disease: Effects of chronic exposure to
TNF on erythropoiesis in vivo. Adi’ Evp Med Biol 27 1 : I 85-196,
I989
23. Pereira J. Shapiro L, King A, Falagas M. Strom J. Dinarello C:
Plasma levels of IL-l�. TNF-a and their specific inhibitors in
undialyzed chronic renal failure. CAPD, and hemodialysis pa-
tients. Kidney hot 45: 890-896. 1994
24. MacDougall I. Allen D, Tucker B. Baker L, Baker A: Serum
interleukin-6 levels are a useful indicator of marrow suppression

Anemia in Hemodialysis Patients 1929
in patients with resistance to erythropoietin due to inflammatorydisease [Abstract]. J Am Soc Nephrol 4: 428, 1993
25. Klciner M, VanWyck D, Kauple C. Kirlin L: The role of iron andother factors in patients unresponsive to erythropoietin therapy.
Semin Dialysis 8: 29-34, 1995
26. Ifudu 0, Feldman J, Friedman EA: The intensity of dialysis andthe response to erythropoietin in patients with end-stage renal
disease. N Engl J Med 334: 420-425, 1996
27. Edozien J, Rahim-Khan M: Anemia in protein malnutrition. Cliii
Sci (Lond) 34: 315-326, 1968
28. Ramalingaswami V. Deo M, Sood 5: Protein Deficiency in the
Rhesus Monkeys, Washington, DC, National Academy of Sci-ence, National Research Council, Publication no. 843, 1961,p 365
29. Whipple G, Hooper C: Blood regeneration after simple anemia:
Curve of regeneration influenced by dietary factors. Am J Phvsiol
45: 573-577, 1918
30. Jencks Z: Studies in the regeneration of blood. Am J Physiol 59:
240-253. 1922
31. Abdel-Salam E, Allah AK, Osman N: Anemia of protein mal-
nutrition. Acta Bin! Med Germ 27: 279-288, 1971
32. Keys A, Brozeck J, Henschel A, Elsen OM, Taylor H: The
Biology of Human Starvation, Minneapolis. University of Mm-
nesota Press, 1950, p 138533. MacDougall L, Moodley G, Eyberg C, Quirk M: Mechanisms of
anemia in protein-energy malnutrition in Johannesburg. A�n J
C/in Nutr 35: 229-235, 1982
34. Leyton G: Effects of slow starvation. Lancet 2: 73-79, 1946
35. Woodruff A: Recent Advances in Human Nutrition, edited by
Brock JF, London, Churchill, 1961
36. Olsen R: The anemia of protein-calorie malnutrition and its
response to dietary protein. Nuir Rer 37: 81-83. 1979
37. Kaysen G. Rathore V. Shearer G. Depner T: Mechanisms of
hypoalbuminemia in hemodialysis patients. Kidney Jut 48: 510-
516, 1995
38. Bunn H: Anemia associated with chronic disorders. In: Princi-
p/es of Internal Medicine, edited by Wilson JD, Braunwald E,
New York, McGraw-Hill, 1991, pp 1529-1531
39. Brugnara C. Colella G. Cremins J: Effects of subcutaneous
recombinant human erythropoietin in normal subjects: Develop-
ment ofdecreased hemoglobin content and iron-deficiency eryth-
ropoiesis. J Lab C/in Med I 23: 660-667. 1994
40. MacDougall I. Cavill I. Hulme B: Detection of functional iron
deficiency during erythropoietin treatment: A new approach. Br
MedJ3O4: 225-226, 1992
41. Goodnough L. Price T, Rudnick 5: Iron-restricted erythropoiesis
as a limitation to autologous blood donation in the erythroid-
stimulated bone marrow. J Lab Cliii Med 1 18: 289-296, 1991
42. Brugnara C, Laufer M, Friedman A, Bridges K. Platt 0: Reticu-
locyte hemoglobin content: Early indicator of iron deficiency and
response to therapy. Blood 83: 3100-3101. 1994
43. Lin C, Lin J, Chen 5, Jiang M, Chiu C: Comparison of hemo-
globin and red blood cell distribution width in the differential
diagnosis of microcytic anemia. Arch Pathol Lab Med I 16:
1030-1032, 1992
44. D’Onofrio G, Chirillo R, Zini G, Caenaro G. Tonimasi M,
Micciulli G: Simultaneous measurement of reticulocytes and red
blood cell indices in healthy subjects and patients with micro-
cytic and macrocytic anemia. Blood 83: 818-823. 1995
Related Documents