The Rising Tide of OTC in Europe Presentation at OTC Conference: “The Enlightened and Well-Informed Consumer” Andy Tisman Senior Principal Consumer Health, IMS Health, Oslo February 2013

Andy tisman how_is_the_otc_market_developing
Aug 14, 2015
Welcome message from author
This document is posted to help you gain knowledge. Please leave a comment to let me know what you think about it! Share it to your friends and learn new things together.
Transcript
The Rising Tide of OTC in Europe Presentation at OTC Conference: “The Enlightened and Well-Informed Consumer”
Andy Tisman Senior Principal Consumer Health, IMS Health, Oslo February 2013

Norway OTC Conference - February 2013
Agenda
• World OTC Context
• Growth Drivers in Europe
• Bringing OTC closer to the consumer
• Focus on the sufferer/consumer and building trust through brands
• Evolution of distribution
• Rx/OTC Switches
• Implications for OTC
2
Norway OTC Conference - February 2013 3
Yes, we do get snow in London too... (...but not as often!)

Norway OTC Conference - February 2013
Definitions - Rx-bound, Semi-ethical OTC & Self-Medication
Non Rx-Bound (“total OTC”) Rx-Bound *
Self-Medication includes
registered and unregistered products
Bought with
Prescription
Bought without
Prescription
Self-Medication
* Prescription (Rx) necessary by law to receive product
Semi-ethical
4
Norway OTC Conference - February 2013
Basis for Figures in this presentation
5
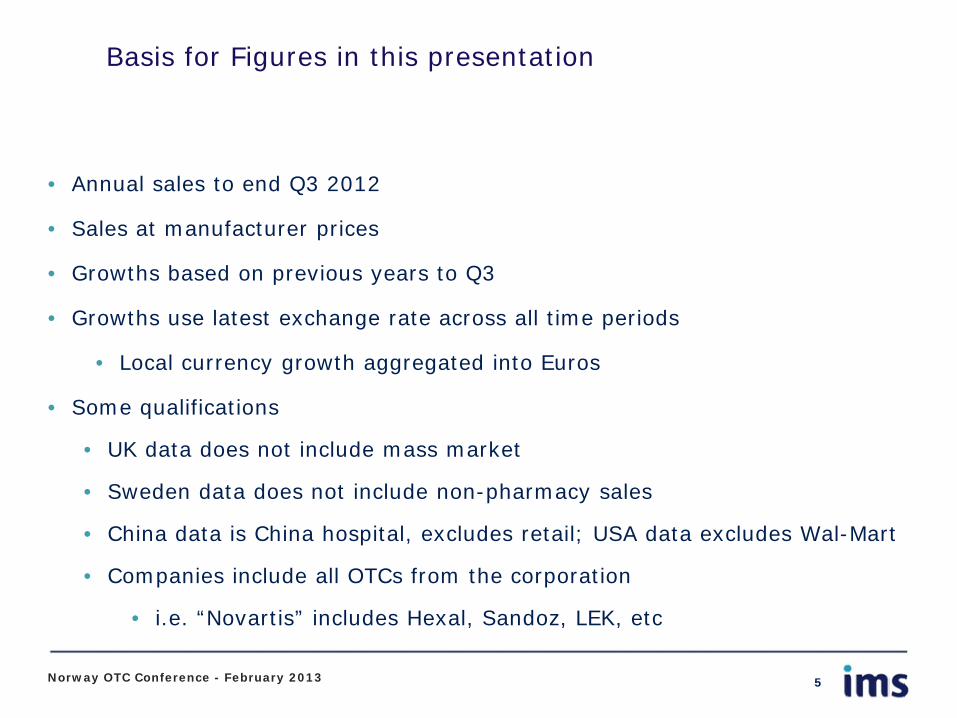
• Annual sales to end Q3 2012
• Sales at manufacturer prices
• Growths based on previous years to Q3
• Growths use latest exchange rate across all time periods
• Local currency growth aggregated into Euros
• Some qualifications
• UK data does not include mass market
• Sweden data does not include non-pharmacy sales
• China data is China hospital, excludes retail; USA data excludes Wal-Mart
• Companies include all OTCs from the corporation
• i.e. “Novartis” includes Hexal, Sandoz, LEK, etc
Norway OTC Conference - February 2013
Agenda
• World OTC Context
• Growth Drivers in Europe
• Bringing OTC closer to the consumer
• Focus on the sufferer/consumer and building trust through brands
• Evolution of distribution
• Rx/OTC Switches
• Implications for OTC
6

11.1
8.2
9.4
7.3
6.46.8
5.25.5
6.2
4.6
3.3
2.2
3.3
4.2
6.0
4.6
5.4
6.37.0 7.0 6.9
4.6
12.2%11.6%
11.1% 10.9% 10.7% 10.6% 10.7% 10.9% 10.9% 11.2% 11.3%
0%
2%
4%
6%
8%
10%
12%
14%
0
2
4
6
8
10
12
14
16
2002 2003 2004 2005 2006 2007 2008 2009 2010 2011 2012
Valu
e G
row
th (
%)
Year on Year Value Growth & OTC Share of Total PharmaMAT Q3 2012
Total Pharma Total OTC OTC Share of Total Pharma
Total Pharma = €740Total OTC = €84
Norway OTC Conference - February 2013 7
Although growth has fallen in the latest year, OTC continues the recent trend of outgrowing Pharma.
Source: IMS OTC Global Analysis
*
* - NB. Trend break due to change in estimation methodology

While Pharma growth experiences a number of constraints, OTC benefits from a range of growth drivers.
Norway OTC Conference - February 2013 8
Top Corps contribution to growth falling rapidly
Low number and quality output from R&D
Generics dominating large therapy areas
Demand constrained by payers
Key players building strong brand identities
Payers keen to promote self medication
Emerging markets have the critical mass to influence growth
Companies seek to exploit switch opportunities
Increasing access through new channels
PHARMA
OTC
Norway OTC Conference - February 2013 9
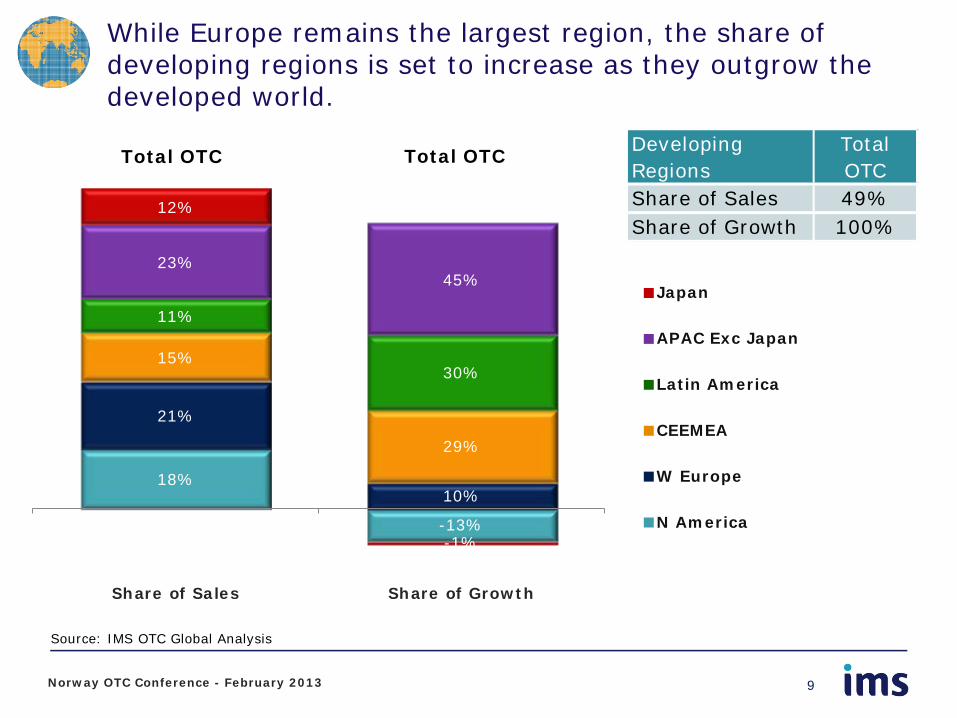
Source: IMS OTC Global Analysis
Japan
APAC Exc Japan
Latin America
CEEMEA
W Europe
N America
Total OTC Total OTC
18%
-13%
21%
10%
15%
29%
11%
30%
23%45%
12%
-1%
Share of Sales Share of Growth
Developing Regions
Total OTC
Share of Sales 49%Share of Growth 100%
While Europe remains the largest region, the share of developing regions is set to increase as they outgrow the developed world.
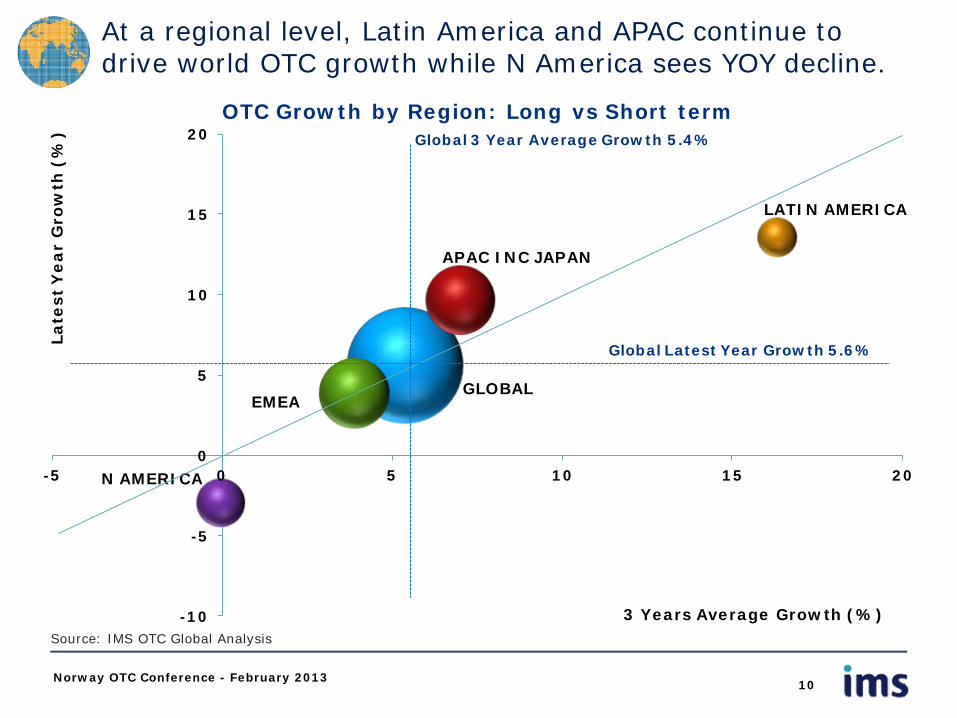
EMEA
APAC INC JAPAN
N AMERICA
LATIN AMERICA
GLOBAL
-10
-5
0
5
10
15
20
-5 0 5 10 15 20
La
test
Ye
ar
Gro
wth
(%
)
3 Years Average Growth (%)
OTC Growth by Region: Long vs Short term
Global Latest Year Growth 5.6%
Global 3 Year Average Growth 5.4%
At a regional level, Latin America and APAC continue to drive world OTC growth while N America sees YOY decline.
10 Norway OTC Conference - February 2013
Source: IMS OTC Global Analysis
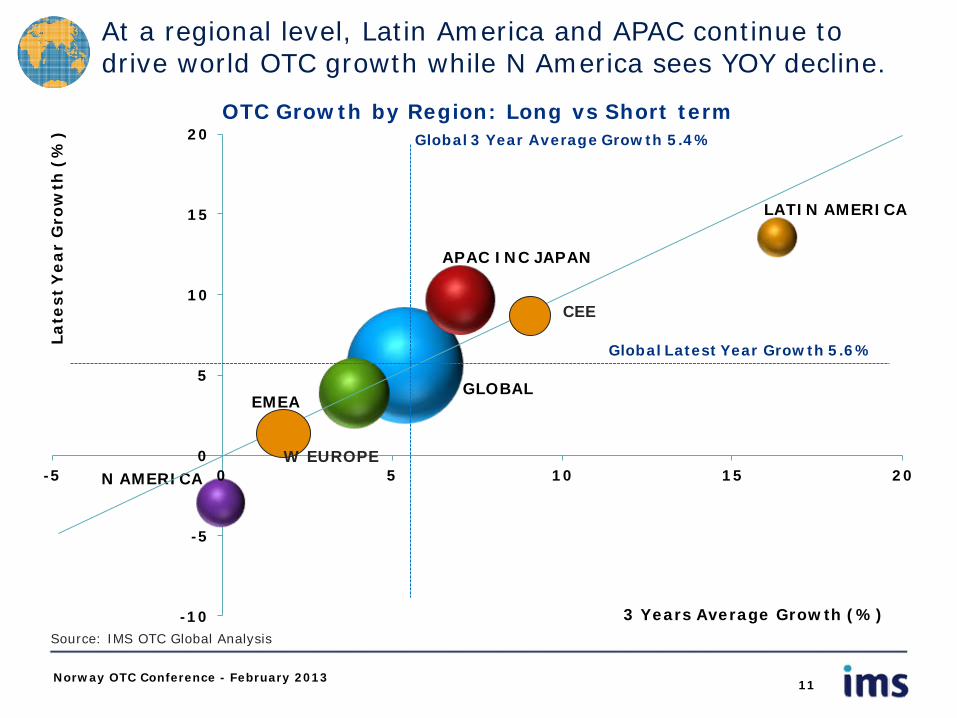
EMEA
APAC INC JAPAN
N AMERICA
LATIN AMERICA
GLOBAL
-10
-5
0
5
10
15
20
-5 0 5 10 15 20
La
test
Ye
ar
Gro
wth
(%
)
3 Years Average Growth (%)
OTC Growth by Region: Long vs Short term
Global Latest Year Growth 5.6%
Global 3 Year Average Growth 5.4%
At a regional level, Latin America and APAC continue to drive world OTC growth while N America sees YOY decline.
11 Norway OTC Conference - February 2013
Source: IMS OTC Global Analysis
W EUROPE
CEE

Developed markets must innovate to drive growth while developing countries also enjoy underlying base sales growth.
Base Value Change
Price Change
New Products
Line Extensions
Total Change
Base Value Change
Price Change
New Products
Line Extensions
Total Change
Global W Europe N America
CEE L America APAC exc Japan
12 Norway OTC Conference - February 2013
Source: IMS OTC Global Analysis
Elements of Growth by Region – 5 Year Cumulative Growth %
38
7
19
12
-1
5
6
12
4
-18
10
-7
15
11
-10
80
15
27
36
2
91
16
22
38
15
119
18
41
5
54

Norway OTC Conference - February 2013
Agenda
• World OTC Context
• Growth Drivers in Europe
• Bringing OTC closer to the consumer
• Focus on the sufferer/consumer and building trust through brands
• Evolution of distribution
• Rx/OTC Switches
• Implications for OTC
13
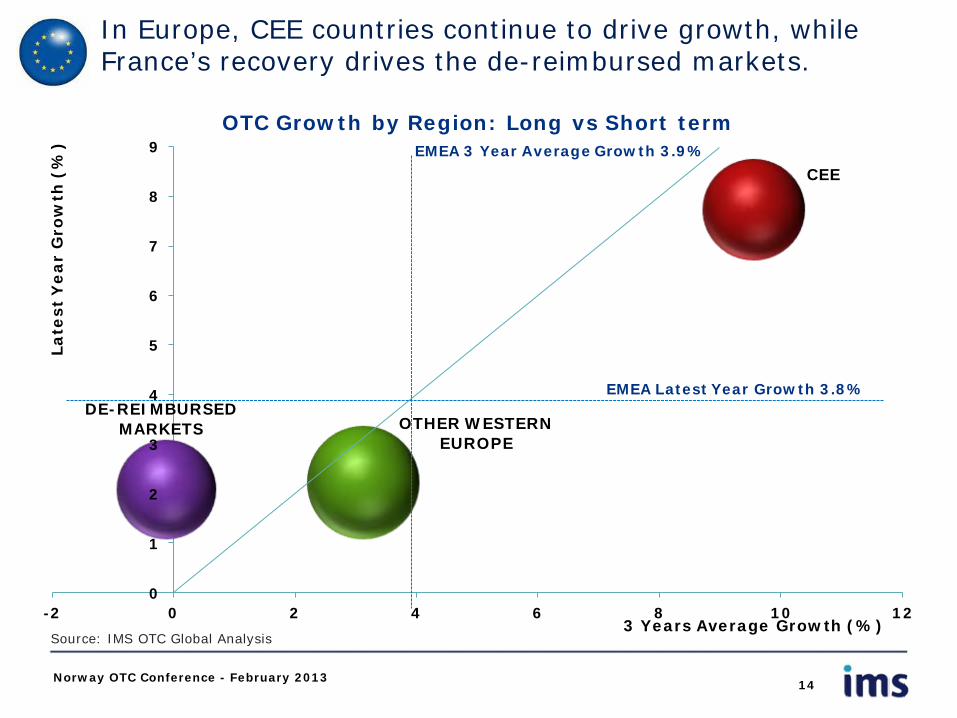
OTHER WESTERN EUROPE
CEE
DE-REIMBURSED MARKETS
0
1
2
3
4
5
6
7
8
9
-2 0 2 4 6 8 10 12
La
test
Ye
ar
Gro
wth
(%
)
3 Years Average Growth (%)
OTC Growth by Region: Long vs Short term
EMEA Latest Year Growth 3.8%
EMEA 3 Year Average Growth 3.9%
In Europe, CEE countries continue to drive growth, while France’s recovery drives the de-reimbursed markets.
14 Norway OTC Conference - February 2013
Source: IMS OTC Global Analysis
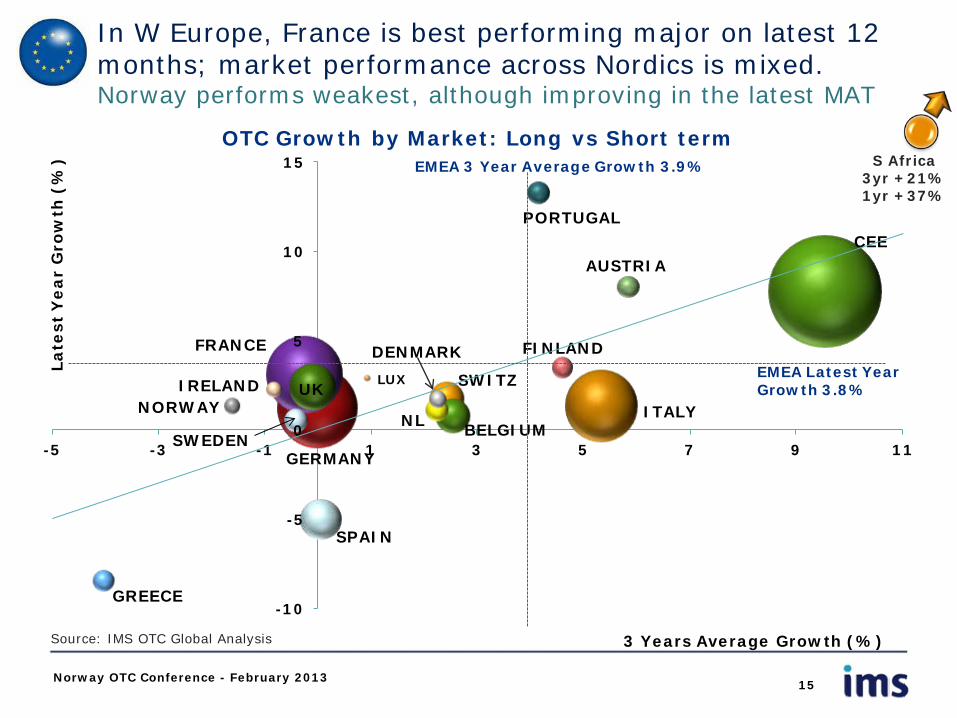
CEE
GERMANY
FRANCE
ITALYUK
SPAIN
SWITZ
BELGIUMSWEDEN
NL
PORTUGAL
AUSTRIA
GREECE
FINLANDDENMARK
NORWAYIRELAND LUX
-10
-5
0
5
10
15
-5 -3 -1 1 3 5 7 9 11
La
test
Ye
ar
Gro
wth
(%
)
3 Years Average Growth (%)
OTC Growth by Market: Long vs Short term
EMEA Latest Year Growth 3.8%
EMEA 3 Year Average Growth 3.9%
In W Europe, France is best performing major on latest 12 months; market performance across Nordics is mixed. Norway performs weakest, although improving in the latest MAT
15 Norway OTC Conference - February 2013
Source: IMS OTC Global Analysis
S Africa 3yr +21% 1yr +37%

GERMANY
ITALY
RUSSIAPOLAND
CZECH REPUBLIC
ROMANIA
HUNGARY
TURKEY
BULGARIA
SLOVAK REPUBLIC
LITHUANIA
LATVIA
ESTONIA
SLOVENIA
CROATIA
-10
-5
0
5
10
15
20
-5 0 5 10 15 20
La
test
Ye
ar
Gro
wth
(%
)
3 Years Average Growth (%)
OTC Growth by Market: Long vs Short term
EMEA Latest Year Growth 3.8%
EMEA 3 Year Average Growth 3.9%
While in the East, there is a wide range of performances, with Russia continuing to drive most of the region’s growth.
16 Norway OTC Conference - February 2013
Source: IMS OTC Global Analysis
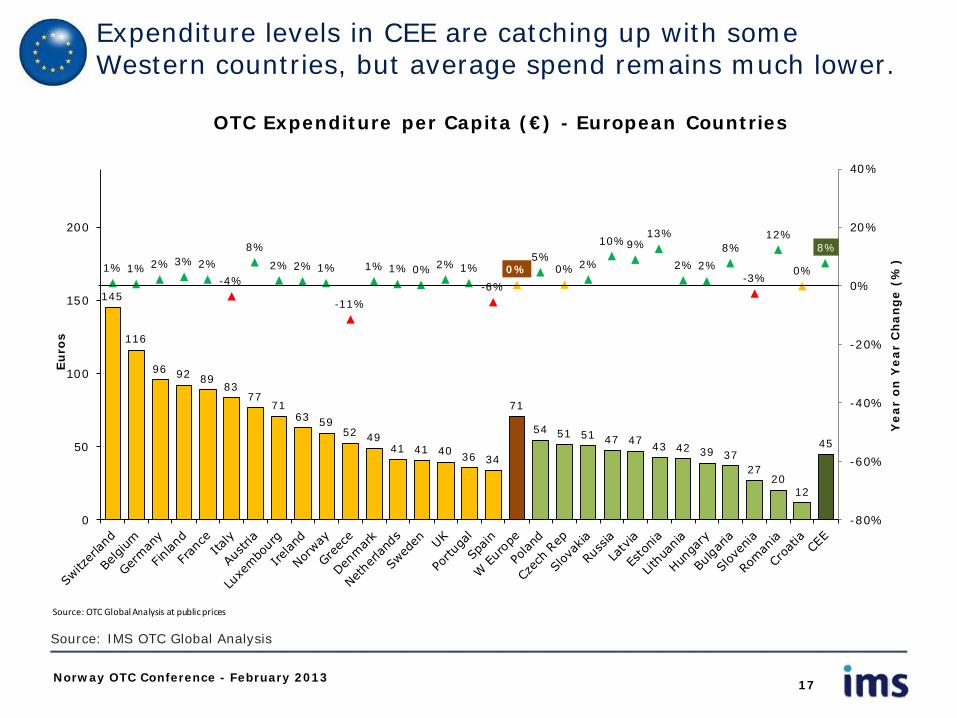
Expenditure levels in CEE are catching up with some Western countries, but average spend remains much lower.
17 Norway OTC Conference - February 2013
Source: IMS OTC Global Analysis
145
116
96 92 8983
7771
63 5952 49
41 41 40 36 34
71
54 51 51 47 47 43 42 39 3727
2012
45
1% 1% 2% 3% 2%
-4%
8%
2% 2% 1%
-11%
1% 1% 0% 2% 1%
-6%
0%5%
0% 2%
10%9%13%
2% 2%
8%
-3%
12%
0%
8%
-80%
-60%
-40%
-20%
0%
20%
40%
0
50
100
150
200
Ye
ar
on
Ye
ar
Ch
an
ge
(%
)
Eu
ros
OTC Expenditure per Capita (€) - European Countries
Source: OTC Global Analysis at public prices
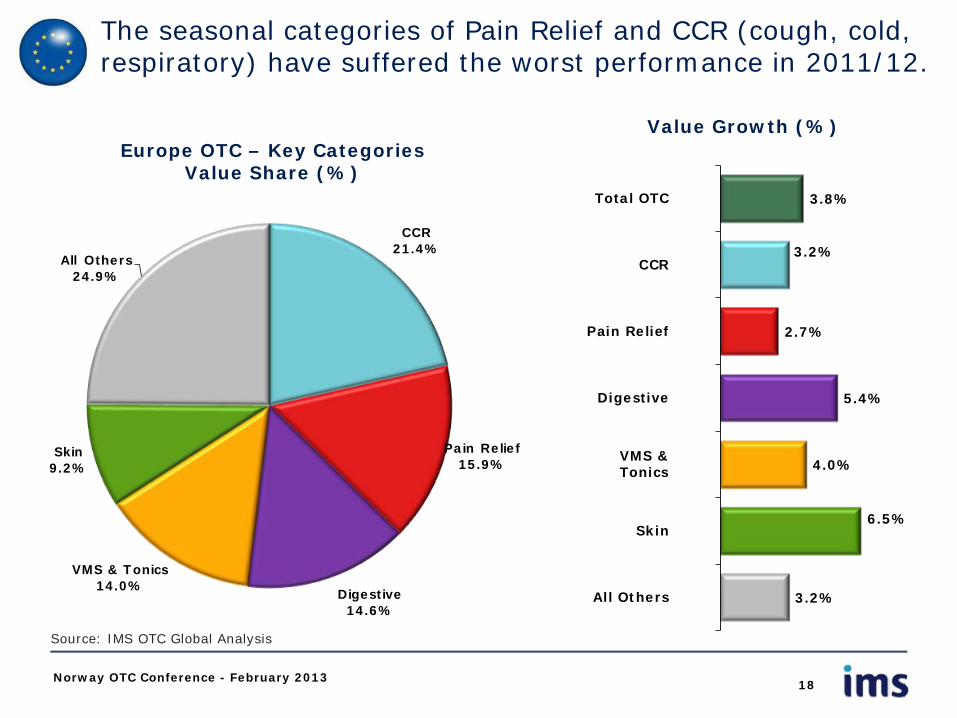
The seasonal categories of Pain Relief and CCR (cough, cold, respiratory) have suffered the worst performance in 2011/12.
Europe OTC – Key Categories Value Share (%)
Value Growth (%)
18 Norway OTC Conference - February 2013
Source: IMS OTC Global Analysis
CCR21.4%
Pain Relief15.9%
Digestive14.6%
VMS & Tonics14.0%
Skin9.2%
All Others24.9%
3.8%
3.2%
2.7%
5.4%
4.0%
6.5%
3.2%
Total OTC
CCR
Pain Relief
Digestive
VMS &Tonics
Skin
All Others

EYE CARE
ANTI-VARICOSE
HABIT
WEIGHT LOSS
ANTI-HAEMORRHOIDS
ANTIFUNGALS (GYN)EAR CARE
OTHER OTC
-15
-10
-5
0
5
10
15
-6 -4 -2 0 2 4 6 8
La
test
Ye
ar
Gro
wth
(%
)
3 Years Average Growth (%)
OTC Growth by Category: Long vs Short term
EMEA Latest Year Growth 3.8%
EMEA 3 Year Average Growth 3.9%
Among “all others”, strong growth performances from some smaller categories while Weight Loss sales fall sharply.
19 Norway OTC Conference - February 2013
Source: IMS OTC Global Analysis
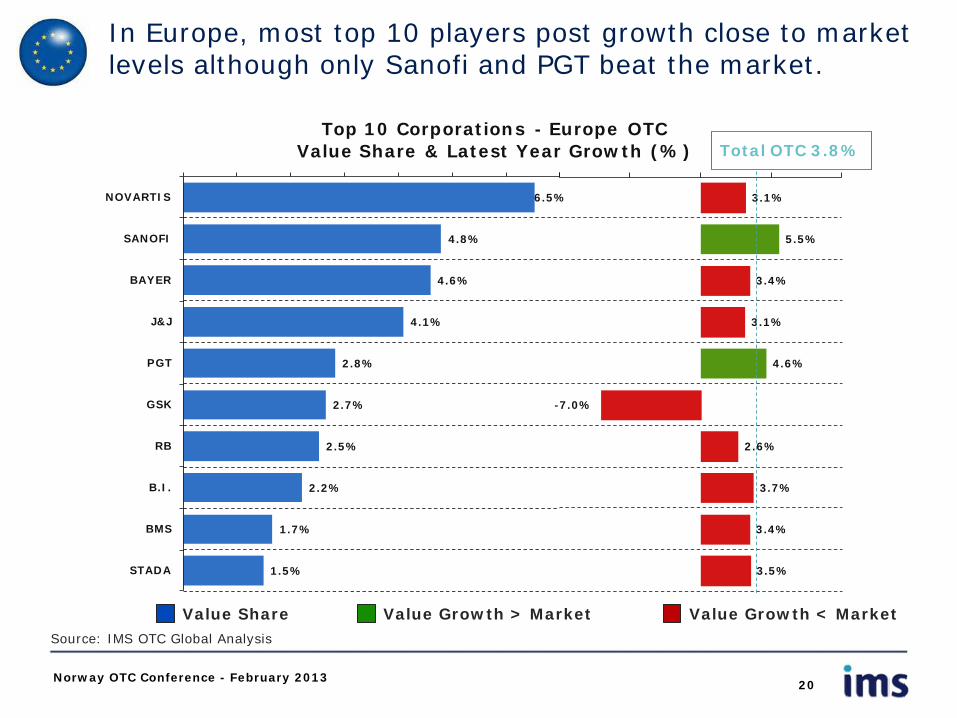
In Europe, most top 10 players post growth close to market levels although only Sanofi and PGT beat the market.
Value Share Value Growth > Market Value Growth < Market
20 Norway OTC Conference - February 2013
Source: IMS OTC Global Analysis
6.5%
4.8%
4.6%
4.1%
2.8%
2.7%
2.5%
2.2%
1.7%
1.5%
NOVARTIS
SANOFI
BAYER
J&J
PGT
GSK
RB
B.I.
BMS
STADA
3.1%
5.5%
3.4%
3.1%
4.6%
-7.0%
2.6%
3.7%
3.4%
3.5%
Top 10 Corporations - Europe OTC Value Share & Latest Year Growth (%) Total OTC 3.8%

Norway OTC Conference - February 2013
Agenda
• World OTC Context
• Growth Drivers in Europe
• Bringing OTC closer to the consumer
• Focus on the sufferer/consumer and building trust through brands
• Evolution of distribution
• Rx/OTC Switches
• Implications for OTC
21
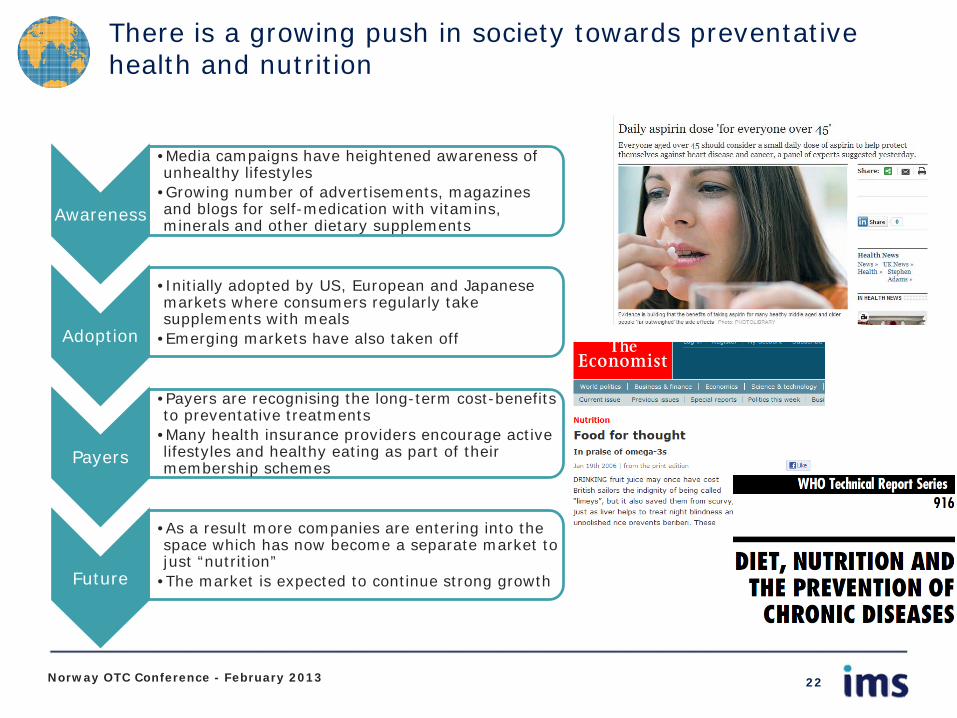
There is a growing push in society towards preventative health and nutrition
Awareness
•Media campaigns have heightened awareness of unhealthy lifestyles
•Growing number of advertisements, magazines and blogs for self-medication with vitamins, minerals and other dietary supplements
Adoption
•Initially adopted by US, European and Japanese markets where consumers regularly take supplements with meals
•Emerging markets have also taken off
Payers
•Payers are recognising the long-term cost-benefits to preventative treatments
•Many health insurance providers encourage active lifestyles and healthy eating as part of their membership schemes
Future
•As a result more companies are entering into the space which has now become a separate market to just “nutrition”
•The market is expected to continue strong growth
Norway OTC Conference - February 2013 22
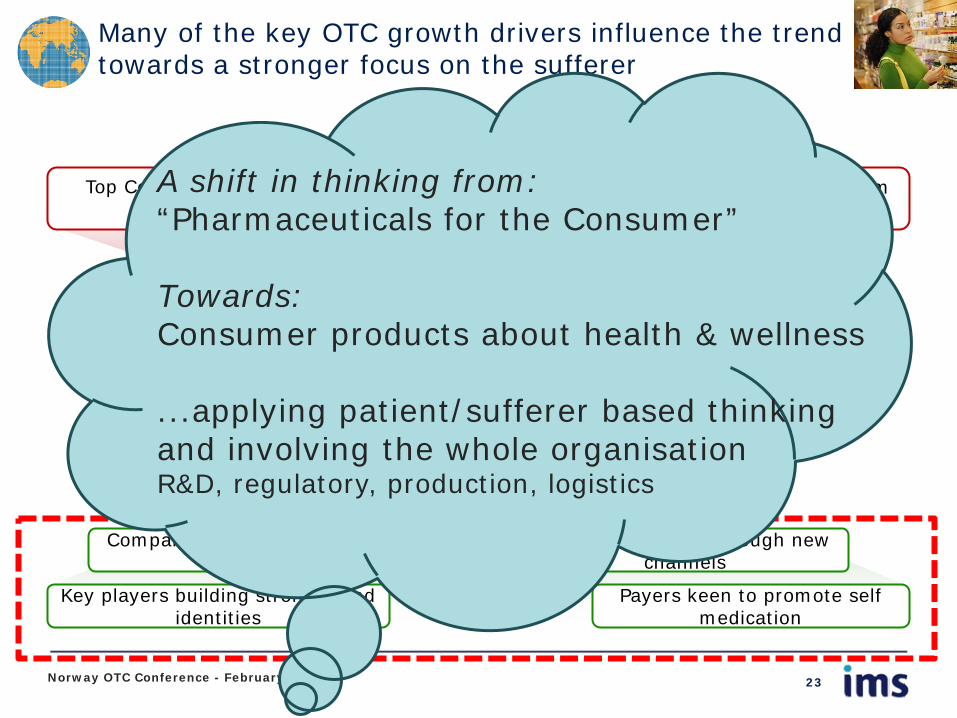
Many of the key OTC growth drivers influence the trend towards a stronger focus on the sufferer
Top Corps contribution to growth falling rapidly
Low number and quality output from R&D
Generics dominating large therapy areas
Demand constrained by payers
Key players building strong brand identities
Payers keen to promote self medication
Emerging markets have the critical mass to influence growth
Companies seek to exploit switch opportunities
Increasing access through new channels
PHARMA
OTC
Norway OTC Conference - February 2013 23
A shift in thinking from: “Pharmaceuticals for the Consumer” Towards: Consumer products about health & wellness ...applying patient/sufferer based thinking and involving the whole organisation R&D, regulatory, production, logistics

24
Focus on the sufferer has always been part of OTC thinking but becomes more “centre stage”
Norway OTC Conference - February 2013
25
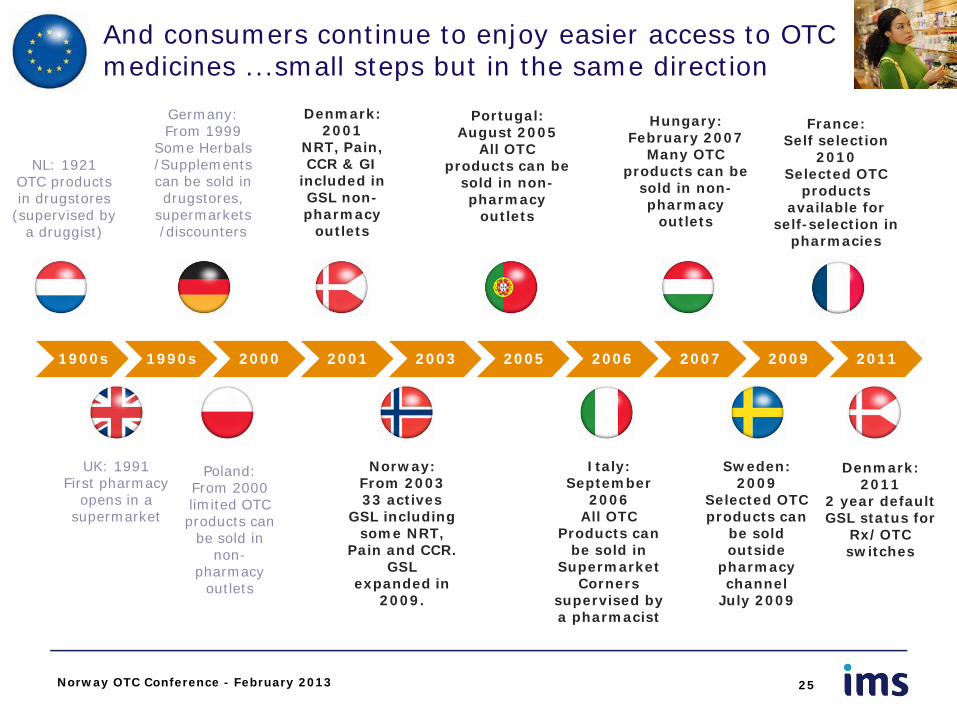
And consumers continue to enjoy easier access to OTC medicines ...small steps but in the same direction
1900s 1990s 2000 2001 2003 2005 2006 2007 2009 2011
NL: 1921 OTC products in drugstores
(supervised by a druggist)
UK: 1991 First pharmacy
opens in a supermarket
Germany: From 1999
Some Herbals /Supplements can be sold in drugstores,
supermarkets /discounters
Poland: From 2000 limited OTC products can
be sold in non-
pharmacy outlets
Portugal: August 2005
All OTC products can be
sold in non-pharmacy
outlets
Italy: September
2006 All OTC
Products can be sold in
Supermarket Corners
supervised by a pharmacist
Hungary: February 2007
Many OTC products can be
sold in non-pharmacy
outlets
Sweden: 2009
Selected OTC products can
be sold outside
pharmacy channel
July 2009
Norway: From 2003 33 actives
GSL including some NRT,
Pain and CCR. GSL
expanded in 2009.
Denmark: 2001
NRT, Pain, CCR & GI
included in GSL non-pharmacy
outlets
Norway OTC Conference - February 2013
France: Self selection
2010 Selected OTC
products available for
self-selection in pharmacies
Denmark: 2011
2 year default GSL status for
Rx/OTC switches

Pharmacy
Mass Market
Mail Order
Mass Market
Pharmacy
Drugstore
Pharmacy
Supermarket
Mass Market
Pharmacy
Pharmacy
Mass Market
Mass Market - New
Pharmacy
-20
-15
-10
-5
0
5
10
15
20
25
0 1 2 3 4 5 6
La
test
Ye
ar
Gro
wth
(%
)
Channel Contribution to OTC & Growth
Germany Italy NL Portugal UK Sweden
Size of Bubble represents
channel share of country sales
Consumer appreciation of convenience is shown by relative growth of non-pharmacy channels
Pharmacy
Mass Market
26 Norway OTC Conference - February 2013
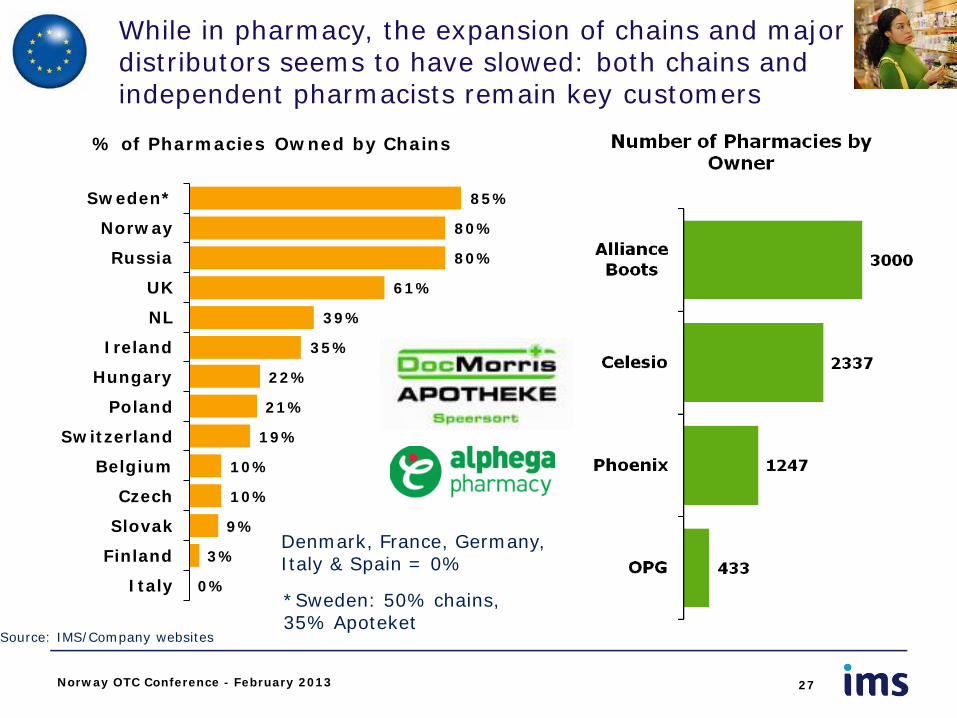
While in pharmacy, the expansion of chains and major distributors seems to have slowed: both chains and independent pharmacists remain key customers
27
Source: IMS/Company websites
85%
80%
80%
61%
39%
35%
22%
21%
19%
10%
10%
9%
3%
0%
Sweden*
Norway
Russia
UK
NL
Ireland
Hungary
Poland
Switzerland
Belgium
Czech
Slovak
Finland
Italy
% of Pharmacies Owned by Chains
Denmark, France, Germany, Italy & Spain = 0%
*Sweden: 50% chains, 35% Apoteket
Norway OTC Conference - February 2013
28
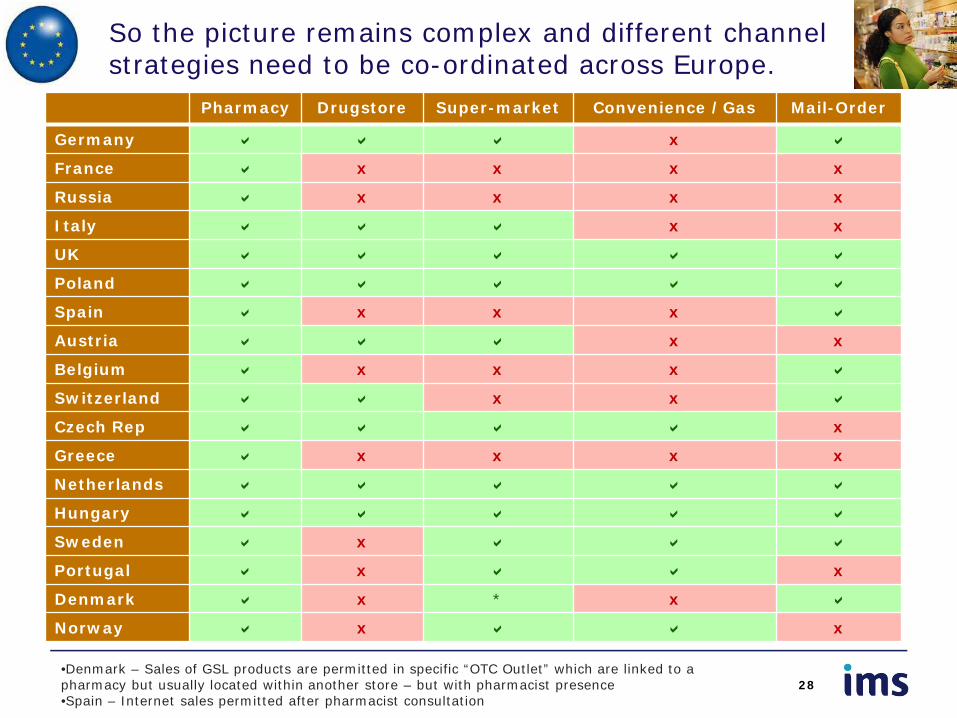
So the picture remains complex and different channel strategies need to be co-ordinated across Europe.
Pharmacy Drugstore Super-market Convenience /Gas Mail-Order
Germany x
France x x x x
Russia x x x x
Italy x x
UK
Poland
Spain x x x
Austria x x
Belgium x x x
Switzerland x x
Czech Rep x
Greece x x x x
Netherlands
Hungary
Sweden x
Portugal x x
Denmark x * x
Norway x x
Norway OTC Conference - February 2013 •Denmark – Sales of GSL products are permitted in specific “OTC Outlet” which are linked to a pharmacy but usually located within another store – but with pharmacist presence •Spain – Internet sales permitted after pharmacist consultation
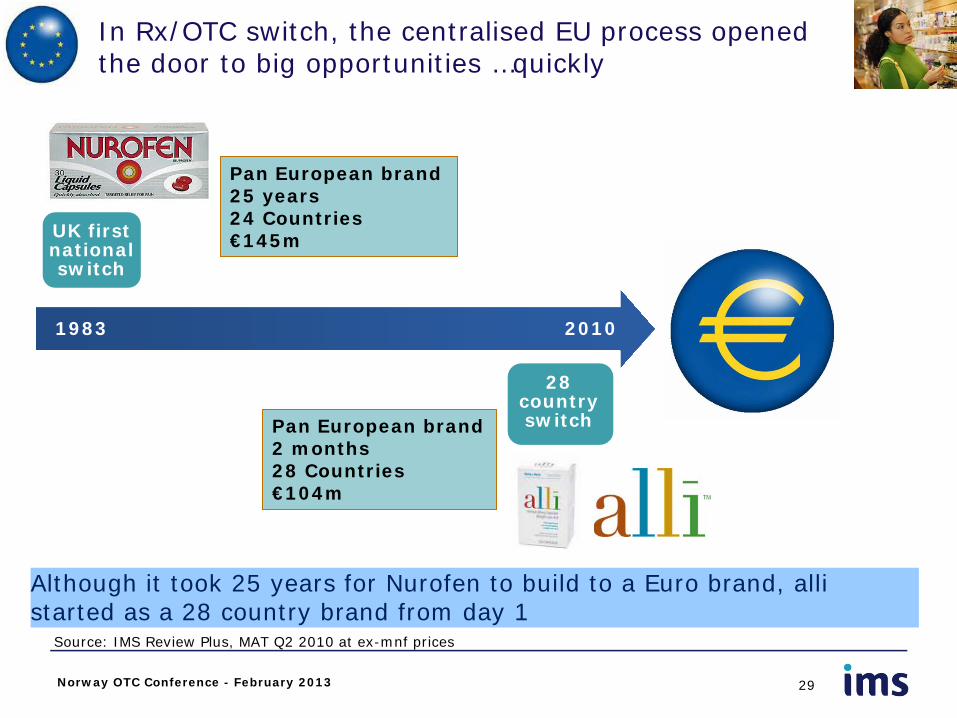
Although it took 25 years for Nurofen to build to a Euro brand, alli started as a 28 country brand from day 1
29
1983 2010
UK first national switch
Pan European brand 25 years 24 Countries €145m
28 country switch Pan European brand
2 months 28 Countries €104m
In Rx/OTC switch, the centralised EU process opened the door to big opportunities …quickly
Source: IMS Review Plus, MAT Q2 2010 at ex-mnf prices
Norway OTC Conference - February 2013

However ...other examples show that success is possible
30
2010
28 country switch
However recent switches have shown that success is not guaranteed or easy to achieve
Norway OTC Conference - February 2013
Complex protocol involving doctor visit/diagnosis
Matching product performance to
consumer expectation
Lack of exclusivity for innovators

CV Derm (Skin) Derm (Hair) GI Gyn Health
Metabolic Men’s Health Neuro/Cog Oral Care Pain
Psych / Dependence
Respiratory Age 50+ Health Sleep Eye, Ear
• Anti-Platelet • Borderline
Hypertension • Oedema • Hypertension • Lipid Management
Acne, Actinic Keratosis, Age Spots,, Chronic Wound Healing, Diaper Rash, Eczema, Onychomycosis, Psoriasis, Ring Worm), Rosacea, Seborrheic Keratosis
• Androgenic Alopecia • Hair Removal
Chronic Constipation, Diarrhoea, Diverticulitis, Heartburn, GERD, IBS, Morning Sickness, Motion Sickness, Peptic Ulcer, Ulcerative Colitis
Bacterial Vaginosis, Endometriosis, FSD, Fibrocystic Breast, Heavy Menstruation, Oral Contraception, PMS, PMDD, UTI, Vaginal Candidiasis
• Impaired Glucose Tolerance
• Obesity
• Male Contraception • Premature Ejaculation
• Adult ADHD • Cognition • Movement Disorders • RLS
Below Gum Tartar, Chronic Halitosis, Cold Sore, Dry Mouth, Gingivitis, Oral Candidiasis, Periodontal Disease, Sensitive Teeth
• Fibromyalgia • General Acute Pain • Migraine • Muscle Relaxant • Neuropathic Pain
(Sciatica) • OA Pain
• Alcohol Dependence • Mood Disorders • Tobacco Dependence
• Allergy • Asthma • COPD • Cough/Cold • Influenza
• BPH • ED • Haemorrhoids • Hormone Replacement • Osteoporosis • Overactive Bladder
• Fatigue/Extreme Sleepiness
• Primary Insomnia • Sleeplessness
Bacterial Conjunctivitis, Chronic Ear Infection, Dry Eye, Eye Allergy (Conjunctivitis), Ocular Inflammation, Glaucoma, Swimmer’s Ear
Norway OTC Conference - February 2013 31
...while many other therapy areas have been considered for potential Rx/OTC switch potential

So both local switches and the centralised EU process are routes for growth that cannot be ignored.
32
• 160,000 pharmacies
• 46m Pharmacy shoppers every day
• Growing pan European wholesalers and retailers
• €23bn OTC market
• Population of 501m
• 1 consistent marketing message
• If you don’t recognise the potential for your molecule in the EU someone else may
Danger
European supply chain European Consumer
Source: IMS OTC Review
Norway OTC Conference - February 2013

But whether the switch is central or local, getting it right at the local level is critical to success.
33
Differing consumer cultures
and habits
Differing advertising regulations
Differing pharmacy needs/ ex-pectations
Differing channel
mix
28 disparate markets
1 process
Norway OTC Conference - February 2013

Norway OTC Conference - February 2013
Agenda
• World OTC Context
• Growth Drivers in Europe
• Bringing OTC closer to the consumer
• Focus on the sufferer/consumer and building trust through brands
• Evolution of distribution
• Rx/OTC Switches
• Implications for OTC
34
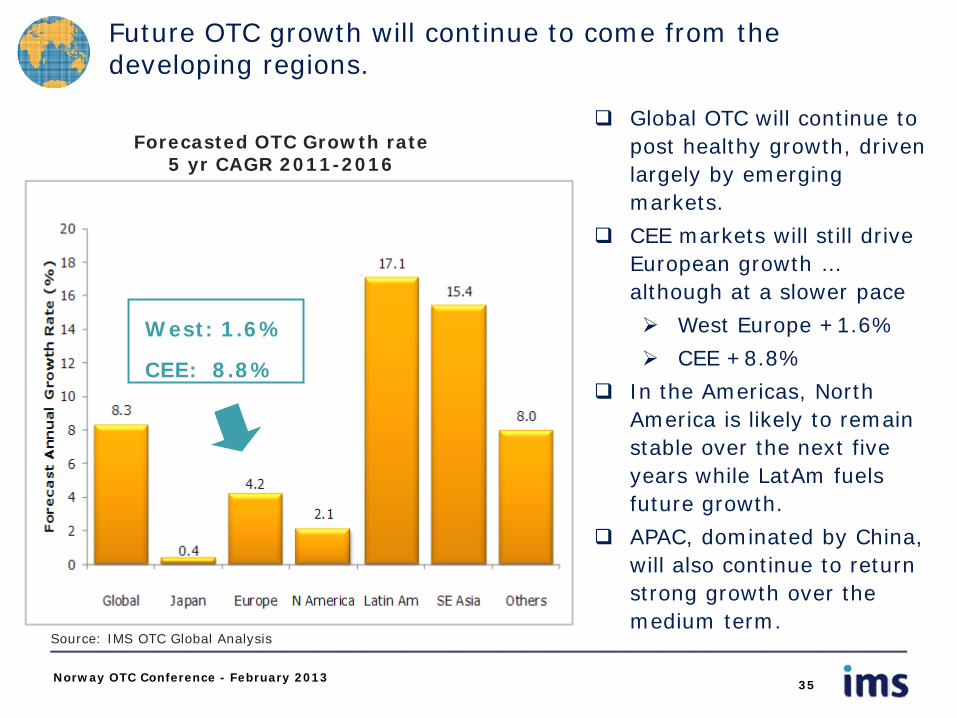
Future OTC growth will continue to come from the developing regions.
Forecasted OTC Growth rate 5 yr CAGR 2011-2016
35 Norway OTC Conference - February 2013
Source: IMS OTC Global Analysis
Global OTC will continue to post healthy growth, driven largely by emerging markets.
CEE markets will still drive European growth … although at a slower pace
West Europe +1.6%
CEE +8.8%
In the Americas, North America is likely to remain stable over the next five years while LatAm fuels future growth.
APAC, dominated by China, will also continue to return strong growth over the medium term.
West: 1.6%
CEE: 8.8%

• OTC remains attractive as it continues to outpace Pharma
• And as a result the market becomes more competitive
• PGT Healthcare ...potentially a major new player with a new model
• Within Europe, West Europe sees a resurgence of growth but the main long-term geo growth opportunities remain in CEE
• And the “fringes” of EMEA: CIS, Middle East, sub-Saharan Africa.
• The increased patient/sufferer focus of the OTC market raises new opportunities ...and new challenges
• How to input real and responsible “consumer-focused thinking”
• Taking advantage of new distribution and “consumer access” opportunities ...without losing the relationship with pharmacy
• Rx/OTC switch: growth opportunities ...how to find ways to make it pay? • Right portfolio; right regulatory strategy; right consumer thinking; right Go-to-
Market
• OTC in Europe offers a “rising tide” ...but as the picture becomes more complex, success requires new thinking and new business models
Conclusions: Market and Industry
Norway OTC Conference - February 2013 36

For contact:
Andy Tisman Senior Principal Consumer Health IMS Health
+44 (0)20 3075 5295
Good luck and great success in this challenging but exciting rising tide of an OTC marketplace in Europe in 2013!
37 Norway OTC Conference - February 2013
Related Documents