Andrew Peller Limited ~ 2012 Annual Report 1

Welcome message from author
This document is posted to help you gain knowledge. Please leave a comment to let me know what you think about it! Share it to your friends and learn new things together.
Transcript

Andrew Peller Limited ~ 2012 Annual Report 1Andrew Peller Limited ~ 2012 Annual Report 1

1 FINANCIAL AND OPERATING HIGHLIGHTS
FINANCIAL AND OPERATING HIGHLIGHTS FOR THE YEARS ENDED MARCH 31 (in thousands of Canadian dollars, except per share amounts)
2012 2011
SALES AND EARNINGS Net sales $ 276,883 $ 265,420 EBITA 32,651 31,544 Net earnings 13,001 11,223
FINANCIAL POSITION Working capital 34,869 27,643 Total assets 285,552 267,996 Shareholders’ equity 120,552 114,297 PER SHARE Net earnings per Class A Share - basic and diluted 0.93 0.78
DIVIDENDS Class A Shares, Non-Voting 0.360 0.330 Class B Shares, Voting 0.314 0.288
SHAREHOLDERS’ EQUITY MARKET VALUE Class A - HIGH 10.30 9.25 Class A - LOW 8.70 8.25 Class B - HIGH 10.70 11.00 Class B - LOW 8.65 9.55
ANALYTICAL INFORMATION Return on average shareholders’ equity 10.9% 9.8%Return on average capital employed 11.4% 11.6% Ratio of current assets to current liabilities 1.3:1 1.3:1
Net Sales Net Earnings Shareholders’ Equity from continuing operations before gains (loses) on �nancial instruments and other expenses
10 11 12 10 11 12 10 11 12
263,
151
265,
420
276,
883
8,4
08
11,6
83
13,6
62
113,
680
114,
297
120,
552
Andrew Peller Limited ~ 2012 Annual Report 2
OveRviewAndrew Peller Limited (“APL” or “the Company”) is a leading producer and marketer of quality wines in Canada. With wineries in British Columbia, Ontario and Nova Scotia, the Company markets wines produced from grapes grown in Ontario’s Niagara Peninsula, British Columbia’s Okanagan, and Similkameen Valleys, and from vineyards around the world. The Company’s award-winning premium and ultra-premium VQA brands include Peller Estates, Trius, Hillebrand, Thirty Bench, Crush, Wayne Gretzky, Sandhill, Calona Vineyards Artist Series, and Red Rooster. Complementing these premium brands are a number of popularly priced varietal wine brands including Peller Estates French Cross in the East, Peller Estates Proprietors Reserve in the West, Copper Moon, XOXO, skinnygrape and Verano. Hochtaler, Domaine D’Or, Schloss Laderheim, Royal, and Sommet are our key value priced wine brands. The Company imports wines from major wine regions around the world to blend with domestic wine to craft these popularly priced and value priced wines. With a focus on serving the needs of all wine consumers, the Company produces and markets premium personal winemaking products through its wholly-owned subsidiary, Global Vintners Inc. (“GVI”), the recognized leader in personal winemaking products. GVI distributes products through over 250 Winexpert and Wine Kitz authorized retailers and franchisees and more than 600 independent retailers across Canada, the United States, the United Kingdom, New Zealand, and Australia. GVI’s award-winning premium and ultra-premium winemaking brands include Selection, Vintners Reserve, Island Mist, Kenridge, Cheeky Monkey, Ultimate Estate Reserve, Traditional Vintage, Cellar Craft, and Artful Winemaker. The Company owns and operates 102 well-positioned independent retail locations in Ontario under the Vineyards Estate Wines, Aisle 43, and WineCountry Vintners store names. The Company also owns Grady Wine Marketing (“GWM”) based in Vancouver and The Small Winemaker’s Collection Inc. (“SWM”) based in Ontario; both of these wine agencies are importers of premium wines from around the world and are marketing agents for these fine wines. The Company has entered into an agreement to produce and market the Wayne Gretzky Estate Winery brands in Canada. The Company’s products are sold predominantly in Canada with a focus on export sales for its icewine and personal winemaking products.
Table of Contents Financial Highlights ............................................................................................................................................1
Report to Shareholders ......................................................................................................................................3
Management’s Discussion and Analysis .............................................................................................................6
Independent Auditors Report ..........................................................................................................................27
Consolidated Financial Statements and Notes ................................................................................................28
Shareholder Information ...................................................................................................................................72

Andrew Peller Limited ~ 2012 Annual Report 43 RePORT TO SHAReHOLDeRS
believe this is a discriminatory tax and, along with other Ontario wine makers, we are working hard to encourage the government to eliminate it. The tax reduced our sales and gross margin by approximately $2.4 million in fiscal 2012 and $2.0 million in fiscal 2011.
Our balance sheet and financial position remained strong with a debt to equity ratio of 0.87:1 at March 31, 2012, shareholders’ equity of $120.6 million or $8.43 per common share, and working capital of $34.9 million. Cash flow from operating activities for the year was approximately $7.0 million, down from the prior year due to higher levels of inventory resulting from the acquisitions completed during the year, a significantly larger grape crop in vintage 2011, and our decision to support forecasts for increased sales once again in fiscal 2013.
Gains in Market Share
Our strong operating performance in fiscal 2012 was also linked to the continued growth and stability of the overall Canadian wine market. In our English Canada markets, wine consumption rose 3.0% during the year following a 3.7% increase in fiscal 2011. More importantly, our share of the total market in English Canada increased to 13.6% from 13.3% last year, while our share of the domestic market rose to 38.2% in fiscal 2012 from 37.2% in the prior year. Of the top-ten wine suppliers to the Canadian market, we are proud to be one of only two producers to have increased market share over the last five years. As Canada’s largest Canadian-owned wine producer, we are proud of our track record of success and look for further market share gains in the years to come.
Prestigious Awards
Once again in fiscal 2012 we were very active competing and winning awards in many of the world’s top wine competitions.
Our VQA brands in Western Canada received a total of 219 medals last year with a number of key awards for our Sandhill, Red Rooster, Peller Estates and Calona Vineyards brands. Of particular note were the best-in-class designations awarded to Red Rooster, including Double Gold for their Riesling 2011 at Riesling du Monde, Double Gold for the Gewürztraminer 2011 at Gewürztraminer du Monde, and Red Wine of the Year for the Syrah 2009 at the BC Wine Awards. Our Sandhill 2010 Chardonnay was the only Canadian wine to win gold at Chardonnay du Monde, while the 2010 Sandhill Sauvignon Blanc won Double Gold Best of Category at the All Canadian Wine Competition. Our Phantom Creek Vineyard has been designated as one of the top-ten single vineyards in the world, winning Best of Class Gold at the Los Angeles International Wine and Spirits Competition. Peller Estates Private Reserve won key awards for its Cabernet Sauvignon 2008 with a Double Gold Best of Class award at the All Canadian Wine Championships while Pinot Gris 2009 won Best in Class at the Pacific Rim International Wine Competition.
In Eastern Canada, our VQA brands including Peller Estates, Trius, Hillebrand, and Crush won a total of 128 awards last year, with Thirty Bench garnering 28 medals, including the prestigious Lieutenant Governor’s Award for Excellence in Ontario Wines. Trius Sauvignon Blanc 2009 won Gold at the All Canadian Wine Championships and the 2010 vintage was awarded best white wine in the LCBO. Trius Red and Trius Brut continued their tradition of winning gold medals with Trius Red 2008 winning Gold at the Grand Harvest Awards in California and Trius Brut winning Gold at Cuvée. Two of our Ontario Peller Estates wines won gold medals: Peller Estates Private Reserve Sauvignon Blanc 2009 at the Grand Harvest Awards in California and Peller Estates Family Series Sauvignon Blanc 2009 at the Tasters Guild International. Hillebrand Showcase Merlot won best Merlot at the Cuvée Ontario Wine Competition while Hillebrand Artist Series Riesling 2009 won a Gold Medal at the Grand Harvest Awards. Finally, our Peller Estates Vidal Icewine 2008 won Wine of the Year at the World Association Wine & Spirits Writers and Journalists Awards as well as Best of Category Double Gold Medal at the All Canadian Wine Championships.
RePORT TO SHAReHOLDeRS
Over the last year we were very proud to mark our 50th Anniversary, celebrating five decades of delivering the highest quality products to wine lovers in Canada and around the world. Fiscal 2012 was also another year of solid growth and strong financial performance. We are confident in our ability to build on this progress and we look forward to delivering value to consumers, our customers, and our shareholders for years to come.
Strong Operating Performance
Sales increased 4.3% in fiscal 2012 to $276.9 million as we continue to experience strong demand for our high quality wines through the majority of our trade channels, including provincial liquor stores, our network of 102 company-owned retailers in Ontario, our award-winning estate wineries, and our export markets. Net earnings rose an impressive 15.8% to $13.0 million or $0.93 per Class A Share for the year, up from $11.2 million or $0.78 per share in fiscal 2011.
New product introductions, including the launch of our new Crush VQA brand in Ontario, made a solid contribution to our growth in fiscal 2012 as Crush First White quickly became a top 25 seller in the LCBO VQA listings. Three additional Crush varietals will be introduced in fiscal 2013 and we expect to experience strong demand for these new wines as well. We recently launched a new, low calorie wine called skinnygrape with approximately 80 calories per serving. This new listing is also off to a very positive start, delivering quality and taste to consumers seeking a lower calorie wine.
Our two largest brands, Peller Estates French Cross – Proprietors Reserve and Copper Moon remain the first and third best-selling brands in the popular-priced segment in English Canada, with Copper Moon volumes more than doubling in Western Canada during the year to become the region’s largest selling wine brand. In the premium and super premium segments, our Sandhill and Red Rooster brands continue to perform well in the west, while our Andrew Peller Signature Series and Thirty Bench VQA wines saw solid growth as a result of key wins at both domestic and international wine competitions. Our Trius Brut remains the top-selling VQA sparkling wine in the LCBO.
Acquisitions completed during the year also added to our growth in fiscal 2012. In November 2011 we entered into a joint venture with Wayne Gretzky to produce and distribute his brand across Canada. The relationship has been going very well and made a solid contribution to our almost 7% increase in sales during the fourth quarter of the year. Established in 2007, Wayne Gretzky, an iconic brand name in Canada, well-known for its quality and value, fits very well with our portfolio. In October 2011 we strengthened our consumer-made wine business with the purchase of Cellar Craft International. Located in Western Canada, Cellar Craft is a leader in the consumer-made wine business utilizing grape skins as well as juice to enhance the quality of their products.
Our export programs proved very effective during the year as we significantly expanded our presence in international duty free and other airport locations around the world. Our export business will benefit from a number of new relationships established during the year including a new partnership to market and sell Peller Estates icewines in China, and the listing of our Peller Estates wines on British Airways flights, at the landmark Burj Al Arab Hotel in Dubai, as well as in the world-class dining rooms on all 11 Celebrity Cruise ships.
Despite strong growth and solid net income, our results in fiscal 2012 were again negatively impacted by the tax levy imposed in July 2010 by the Ontario government on International and Canadian blended wines sold through our retail store network. Imported wines sold through the LCBO are not subject to this levy. We continue to
Andrew Peller Limited ~ 2012 Annual Report 65 RePORT TO SHAReHOLDeRS
MANAGeMeNT’S DiSCUSSiON & ANALYSiSFor the three months and year ended March 31, 2012 The following management’s discussion and analysis (‘MD&A’) provides a review of corporate developments, results of operations and fi nancial position for the three months and year ended March 31, 2012 in comparison with those for the three months and year ended March 31, 2011. This discussion is prepared as of June 20th, 2012 and should be read in conjunction with the audited consolidated fi nancial statements for the years ended March 31, 2012 and 2011 and the accompanying notes contained therein. The fi nancial years ended March 31, 2012, March 31, 2011, and March 31, 2010 are referred to as “fi scal 2012”, “fi scal 2011”, and “fi scal 2010” respectively. All dollar amounts are expressed in Canadian dollars unless otherwise indicated.
FORwARD-LOOKiNG iNFORMATiON
Certain statements in this Management’s Discussion & Analysis may contain “forward-looking statements” within the meaning of applicable securities laws, including the “safe harbour provisions” of the Securities Act (Ontario) with respect to Andrew Peller Limited (‘APL’ or the ‘Company’) and its subsidiaries. Such statements include, but are not limited to, statements about the growth of the business in light of the Company’s recent acquisitions; its launch of new premium wines; sales trends in foreign markets; its supply of domestically grown grapes; and current economic conditions. These statements are subject to certain risks, assumptions and uncertainties that could cause actual results to differ materially from those included in the forward-looking statements. The words “believe”, “plan”, “intend”, “estimate”, “expect”, or “anticipate” and similar expressions, as well as future or conditional verbs such as “will”, “should”, “would”, and “could” often identify forward-looking statements. We have based these forward-looking statements on our current views with respect to future events and fi nancial performance. With respect to forward-looking statements contained in this MD&A, the Company has made assumptions and applied certain factors regarding, among other things: future grape, glass bottle and wine prices; its ability to obtain grapes, imported wine, glass and its ability to obtain other raw materials; fl uctuations in the U.S./Canadian dollar exchange rates; its ability to market products successfully to its anticipated customers; the trade balance within the domestic Canadian wine market; market trends; reliance on key personnel; protection of its intellectual property rights; the economic environment; the regulatory requirements regarding producing, marketing, advertising and labeling of its products; the regulation of liquor distribution and retailing in Ontario; the application of federal and provincial environmental laws; and the impact of increasing competition.
These forward-looking statements are also subject to the risks and uncertainties discussed in the “Risks and Uncertanties” section and elsewhere in this MD&A and other risks detailed from time to time in the publicly fi led disclosure documents of the Company which are available at www.sedar.com. Forward-looking statements are not guarantees of future performance and involve risks, uncertainties, and assumptions which could cause actual results to differ materially from the conclusions, forecasts, or projections anticipated in these forward-looking statements. Because of these risks, uncertainties, and assumptions, one should not place undue reliance on these forward-looking statements. The Company’s forward-looking statements are made only as of the date of this MD&A, and except as required by applicable law, Andrew Peller Limited undertakes no obligation to update or revise these forward-looking statements to refl ect new information, future events or circumstances.
innovative Marketing Programs
To support our high quality, award-winning brands, we continue to utilize unique and innovative marketing programs to build awareness and loyalty among wine connoisseurs. As an example, we were the fi rst Canadian wine company to introduce light-weight glass for a number of our products, an environmentally-friendly and lower-cost packaging solution that has proved very popular.
On the social marketing front, our wineries continue to expand their presence with new You Tube and fl ickr video and photo posts. We also began promoting a Trip Advisor link, allowing consumers to rate their experience at our estate wineries and to see what others have said about their visit. Fiscal 2012 was also Red Rooster’s fi rst year utilizing social media, and with its most recent contest, it experienced a signifi cant increase in web visits. XOXO continues to utilize social marketing for the majority of its promotional activities while our recently-launched Crush brand also used social media programs to help build awareness in its fi rst year on the market. Going forward, we will continue to embrace social marketing as a cost-effective and successful method to attract consumers to our industry-leading brands.
Looking Ahead
The Canadian wine market continues to strengthen, driven by younger consumers who have adopted wine as their beverage of choice, as well as by an aging population that increasingly favours the more sophisticated experience that wine offers. Demand is also supported by the widely reported health benefi ts of moderate wine consumption and an increasing consumer focus on local agricultural products and their sustainability.
To capitalize on these strong industry fundamentals, we will continue to execute the same value-enhancing strategies that have proved so successful over the last fi fty years. Our proven sales and marketing efforts will continue to drive growth through all of our trade channels, including licensed establishments, provincial liquor boards, our network of retail locations in Ontario, and our estate wineries. The launch of new and re-positioned products will also contribute to our growth across all price points in the Canadian wine business. Efforts to increase export sales are proving effective and we expect our personal winemaking business will continue to leverage its strong market presence to build sales in Canada and its export markets.
We will also continue to prudently investigate acquisitions that expand and complement our presence and brand profi le within the Canadian wine market. The additions to our family of brands completed over the last few years have made signifi cant contributions to our growth and performance, and we will seek out additional acquisitions that strengthen our presence and enhance value for our shareholders.
In closing, we want to thank our suppliers and customers for their business and our shareholders for their continued support. We also extend a sincere thanks to all of our employees, both past and present, who have contributed to our growth and success over the last fi fty years. There is no doubt that our Company’s greatest strength is the commitment and dedication of our people and they are why our future has never looked brighter.
Joseph A. Peller John E. PellerChairman President and CEO
Andrew Peller Limited ~ 2012 Annual Report 87 MANAGeMeNT’S DiSCUSSiON & ANALYSiS
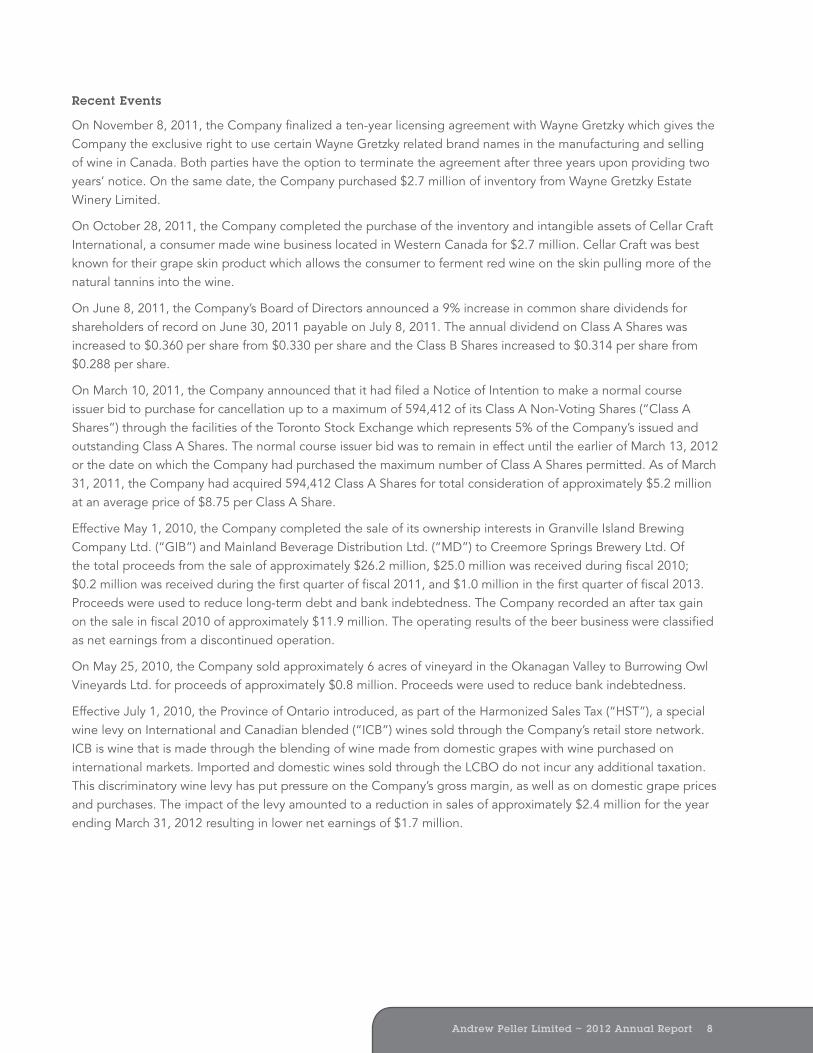
Recent events
On November 8, 2011, the Company finalized a ten-year licensing agreement with Wayne Gretzky which gives the Company the exclusive right to use certain Wayne Gretzky related brand names in the manufacturing and selling of wine in Canada. Both parties have the option to terminate the agreement after three years upon providing two years’ notice. On the same date, the Company purchased $2.7 million of inventory from Wayne Gretzky Estate Winery Limited.
On October 28, 2011, the Company completed the purchase of the inventory and intangible assets of Cellar Craft International, a consumer made wine business located in Western Canada for $2.7 million. Cellar Craft was best known for their grape skin product which allows the consumer to ferment red wine on the skin pulling more of the natural tannins into the wine.
On June 8, 2011, the Company’s Board of Directors announced a 9% increase in common share dividends for shareholders of record on June 30, 2011 payable on July 8, 2011. The annual dividend on Class A Shares was increased to $0.360 per share from $0.330 per share and the Class B Shares increased to $0.314 per share from $0.288 per share.
On March 10, 2011, the Company announced that it had filed a Notice of Intention to make a normal course issuer bid to purchase for cancellation up to a maximum of 594,412 of its Class A Non-Voting Shares (“Class A Shares”) through the facilities of the Toronto Stock Exchange which represents 5% of the Company’s issued and outstanding Class A Shares. The normal course issuer bid was to remain in effect until the earlier of March 13, 2012 or the date on which the Company had purchased the maximum number of Class A Shares permitted. As of March 31, 2011, the Company had acquired 594,412 Class A Shares for total consideration of approximately $5.2 million at an average price of $8.75 per Class A Share.
Effective May 1, 2010, the Company completed the sale of its ownership interests in Granville Island Brewing Company Ltd. (“GIB”) and Mainland Beverage Distribution Ltd. (“MD”) to Creemore Springs Brewery Ltd. Of the total proceeds from the sale of approximately $26.2 million, $25.0 million was received during fiscal 2010; $0.2 million was received during the first quarter of fiscal 2011, and $1.0 million in the first quarter of fiscal 2013. Proceeds were used to reduce long-term debt and bank indebtedness. The Company recorded an after tax gain on the sale in fiscal 2010 of approximately $11.9 million. The operating results of the beer business were classified as net earnings from a discontinued operation.
On May 25, 2010, the Company sold approximately 6 acres of vineyard in the Okanagan Valley to Burrowing Owl Vineyards Ltd. for proceeds of approximately $0.8 million. Proceeds were used to reduce bank indebtedness.
Effective July 1, 2010, the Province of Ontario introduced, as part of the Harmonized Sales Tax (“HST”), a special wine levy on International and Canadian blended (“ICB”) wines sold through the Company’s retail store network. ICB is wine that is made through the blending of wine made from domestic grapes with wine purchased on international markets. Imported and domestic wines sold through the LCBO do not incur any additional taxation. This discriminatory wine levy has put pressure on the Company’s gross margin, as well as on domestic grape prices and purchases. The impact of the levy amounted to a reduction in sales of approximately $2.4 million for the year ending March 31, 2012 resulting in lower net earnings of $1.7 million.
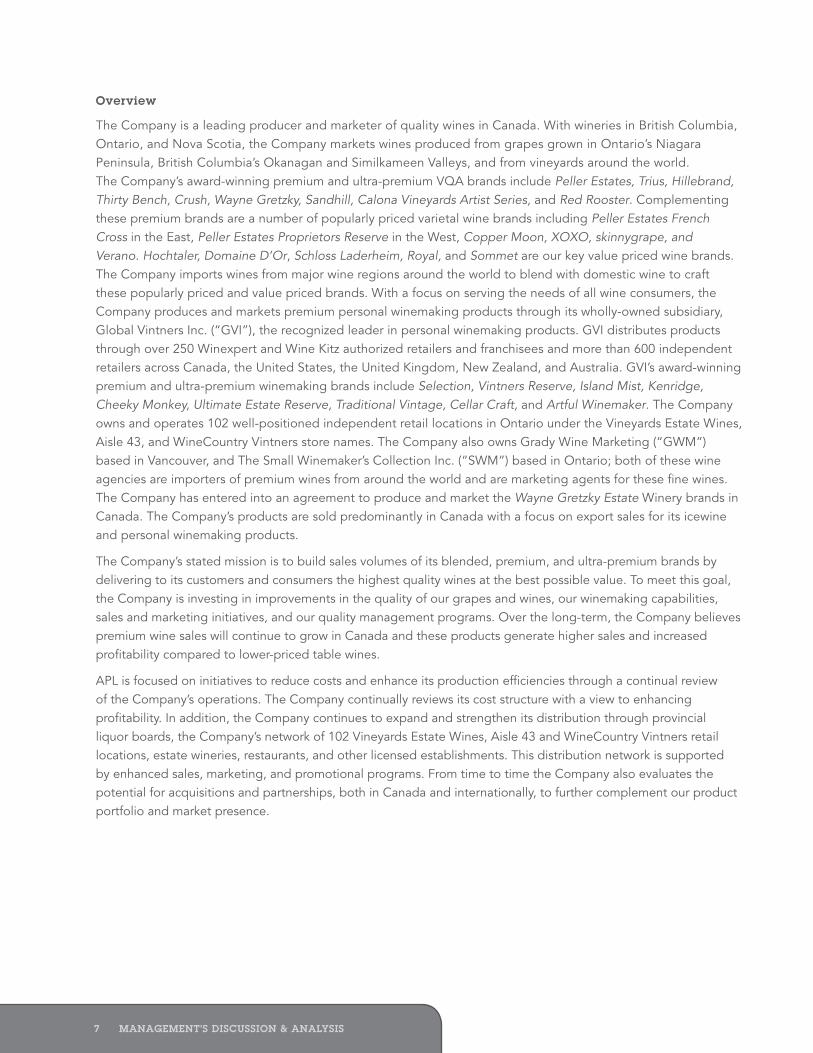
Overview
The Company is a leading producer and marketer of quality wines in Canada. With wineries in British Columbia, Ontario, and Nova Scotia, the Company markets wines produced from grapes grown in Ontario’s Niagara Peninsula, British Columbia’s Okanagan and Similkameen Valleys, and from vineyards around the world. The Company’s award-winning premium and ultra-premium VQA brands include Peller Estates, Trius, Hillebrand, Thirty Bench, Crush, Wayne Gretzky, Sandhill, Calona Vineyards Artist Series, and Red Rooster. Complementing these premium brands are a number of popularly priced varietal wine brands including Peller Estates French Cross in the East, Peller Estates Proprietors Reserve in the West, Copper Moon, XOXO, skinnygrape, and Verano. Hochtaler, Domaine D’Or, Schloss Laderheim, Royal, and Sommet are our key value priced wine brands. The Company imports wines from major wine regions around the world to blend with domestic wine to craft these popularly priced and value priced brands. With a focus on serving the needs of all wine consumers, the Company produces and markets premium personal winemaking products through its wholly-owned subsidiary, Global Vintners Inc. (“GVI”), the recognized leader in personal winemaking products. GVI distributes products through over 250 Winexpert and Wine Kitz authorized retailers and franchisees and more than 600 independent retailers across Canada, the United States, the United Kingdom, New Zealand, and Australia. GVI’s award-winning premium and ultra-premium winemaking brands include Selection, Vintners Reserve, Island Mist, Kenridge, Cheeky Monkey, Ultimate Estate Reserve, Traditional Vintage, Cellar Craft, and Artful Winemaker. The Company owns and operates 102 well-positioned independent retail locations in Ontario under the Vineyards Estate Wines, Aisle 43, and WineCountry Vintners store names. The Company also owns Grady Wine Marketing (“GWM”) based in Vancouver, and The Small Winemaker’s Collection Inc. (“SWM”) based in Ontario; both of these wine agencies are importers of premium wines from around the world and are marketing agents for these fine wines. The Company has entered into an agreement to produce and market the Wayne Gretzky Estate Winery brands in Canada. The Company’s products are sold predominantly in Canada with a focus on export sales for its icewine and personal winemaking products.
The Company’s stated mission is to build sales volumes of its blended, premium, and ultra-premium brands by delivering to its customers and consumers the highest quality wines at the best possible value. To meet this goal, the Company is investing in improvements in the quality of our grapes and wines, our winemaking capabilities, sales and marketing initiatives, and our quality management programs. Over the long-term, the Company believes premium wine sales will continue to grow in Canada and these products generate higher sales and increased profitability compared to lower-priced table wines.
APL is focused on initiatives to reduce costs and enhance its production efficiencies through a continual review of the Company’s operations. The Company continually reviews its cost structure with a view to enhancing profitability. In addition, the Company continues to expand and strengthen its distribution through provincial liquor boards, the Company’s network of 102 Vineyards Estate Wines, Aisle 43 and WineCountry Vintners retail locations, estate wineries, restaurants, and other licensed establishments. This distribution network is supported by enhanced sales, marketing, and promotional programs. From time to time the Company also evaluates the potential for acquisitions and partnerships, both in Canada and internationally, to further complement our product portfolio and market presence.
Andrew Peller Limited ~ 2012 Annual Report 87 MANAGeMeNT’S DiSCUSSiON & ANALYSiS
Recent events
On November 8, 2011, the Company finalized a ten-year licensing agreement with Wayne Gretzky which gives the Company the exclusive right to use certain Wayne Gretzky related brand names in the manufacturing and selling of wine in Canada. Both parties have the option to terminate the agreement after three years upon providing two years’ notice. On the same date, the Company purchased $2.7 million of inventory from Wayne Gretzky Estate Winery Limited.
On October 28, 2011, the Company completed the purchase of the inventory and intangible assets of Cellar Craft International, a consumer made wine business located in Western Canada for $2.7 million. Cellar Craft was best known for their grape skin product which allows the consumer to ferment red wine on the skin pulling more of the natural tannins into the wine.
On June 8, 2011, the Company’s Board of Directors announced a 9% increase in common share dividends for shareholders of record on June 30, 2011 payable on July 8, 2011. The annual dividend on Class A Shares was increased to $0.360 per share from $0.330 per share and the Class B Shares increased to $0.314 per share from $0.288 per share.
On March 10, 2011, the Company announced that it had filed a Notice of Intention to make a normal course issuer bid to purchase for cancellation up to a maximum of 594,412 of its Class A Non-Voting Shares (“Class A Shares”) through the facilities of the Toronto Stock Exchange which represents 5% of the Company’s issued and outstanding Class A Shares. The normal course issuer bid was to remain in effect until the earlier of March 13, 2012 or the date on which the Company had purchased the maximum number of Class A Shares permitted. As of March 31, 2011, the Company had acquired 594,412 Class A Shares for total consideration of approximately $5.2 million at an average price of $8.75 per Class A Share.
Effective May 1, 2010, the Company completed the sale of its ownership interests in Granville Island Brewing Company Ltd. (“GIB”) and Mainland Beverage Distribution Ltd. (“MD”) to Creemore Springs Brewery Ltd. Of the total proceeds from the sale of approximately $26.2 million, $25.0 million was received during fiscal 2010; $0.2 million was received during the first quarter of fiscal 2011, and $1.0 million in the first quarter of fiscal 2013. Proceeds were used to reduce long-term debt and bank indebtedness. The Company recorded an after tax gain on the sale in fiscal 2010 of approximately $11.9 million. The operating results of the beer business were classified as net earnings from a discontinued operation.
On May 25, 2010, the Company sold approximately 6 acres of vineyard in the Okanagan Valley to Burrowing Owl Vineyards Ltd. for proceeds of approximately $0.8 million. Proceeds were used to reduce bank indebtedness.
Effective July 1, 2010, the Province of Ontario introduced, as part of the Harmonized Sales Tax (“HST”), a special wine levy on International and Canadian blended (“ICB”) wines sold through the Company’s retail store network. ICB is wine that is made through the blending of wine made from domestic grapes with wine purchased on international markets. Imported and domestic wines sold through the LCBO do not incur any additional taxation. This discriminatory wine levy has put pressure on the Company’s gross margin, as well as on domestic grape prices and purchases. The impact of the levy amounted to a reduction in sales of approximately $2.4 million for the year ending March 31, 2012 resulting in lower net earnings of $1.7 million.
Overview
The Company is a leading producer and marketer of quality wines in Canada. With wineries in British Columbia, Ontario, and Nova Scotia, the Company markets wines produced from grapes grown in Ontario’s Niagara Peninsula, British Columbia’s Okanagan and Similkameen Valleys, and from vineyards around the world. The Company’s award-winning premium and ultra-premium VQA brands include Peller Estates, Trius, Hillebrand, Thirty Bench, Crush, Wayne Gretzky, Sandhill, Calona Vineyards Artist Series, and Red Rooster. Complementing these premium brands are a number of popularly priced varietal wine brands including Peller Estates French Cross in the East, Peller Estates Proprietors Reserve in the West, Copper Moon, XOXO, skinnygrape, and Verano. Hochtaler, Domaine D’Or, Schloss Laderheim, Royal, and Sommet are our key value priced wine brands. The Company imports wines from major wine regions around the world to blend with domestic wine to craft these popularly priced and value priced brands. With a focus on serving the needs of all wine consumers, the Company produces and markets premium personal winemaking products through its wholly-owned subsidiary, Global Vintners Inc. (“GVI”), the recognized leader in personal winemaking products. GVI distributes products through over 250 Winexpert and Wine Kitz authorized retailers and franchisees and more than 600 independent retailers across Canada, the United States, the United Kingdom, New Zealand, and Australia. GVI’s award-winning premium and ultra-premium winemaking brands include Selection, Vintners Reserve, Island Mist, Kenridge, Cheeky Monkey, Ultimate Estate Reserve, Traditional Vintage, Cellar Craft, and Artful Winemaker. The Company owns and operates 102 well-positioned independent retail locations in Ontario under the Vineyards Estate Wines, Aisle 43, and WineCountry Vintners store names. The Company also owns Grady Wine Marketing (“GWM”) based in Vancouver, and The Small Winemaker’s Collection Inc. (“SWM”) based in Ontario; both of these wine agencies are importers of premium wines from around the world and are marketing agents for these fine wines. The Company has entered into an agreement to produce and market the Wayne Gretzky Estate Winery brands in Canada. The Company’s products are sold predominantly in Canada with a focus on export sales for its icewine and personal winemaking products.
The Company’s stated mission is to build sales volumes of its blended, premium, and ultra-premium brands by delivering to its customers and consumers the highest quality wines at the best possible value. To meet this goal, the Company is investing in improvements in the quality of our grapes and wines, our winemaking capabilities, sales and marketing initiatives, and our quality management programs. Over the long-term, the Company believes premium wine sales will continue to grow in Canada and these products generate higher sales and increased profitability compared to lower-priced table wines.
APL is focused on initiatives to reduce costs and enhance its production efficiencies through a continual review of the Company’s operations. The Company continually reviews its cost structure with a view to enhancing profitability. In addition, the Company continues to expand and strengthen its distribution through provincial liquor boards, the Company’s network of 102 Vineyards Estate Wines, Aisle 43 and WineCountry Vintners retail locations, estate wineries, restaurants, and other licensed establishments. This distribution network is supported by enhanced sales, marketing, and promotional programs. From time to time the Company also evaluates the potential for acquisitions and partnerships, both in Canada and internationally, to further complement our product portfolio and market presence.
Andrew Peller Limited ~ 2012 Annual Report 109 MANAGeMeNT’S DiSCUSSiON & ANALYSiS
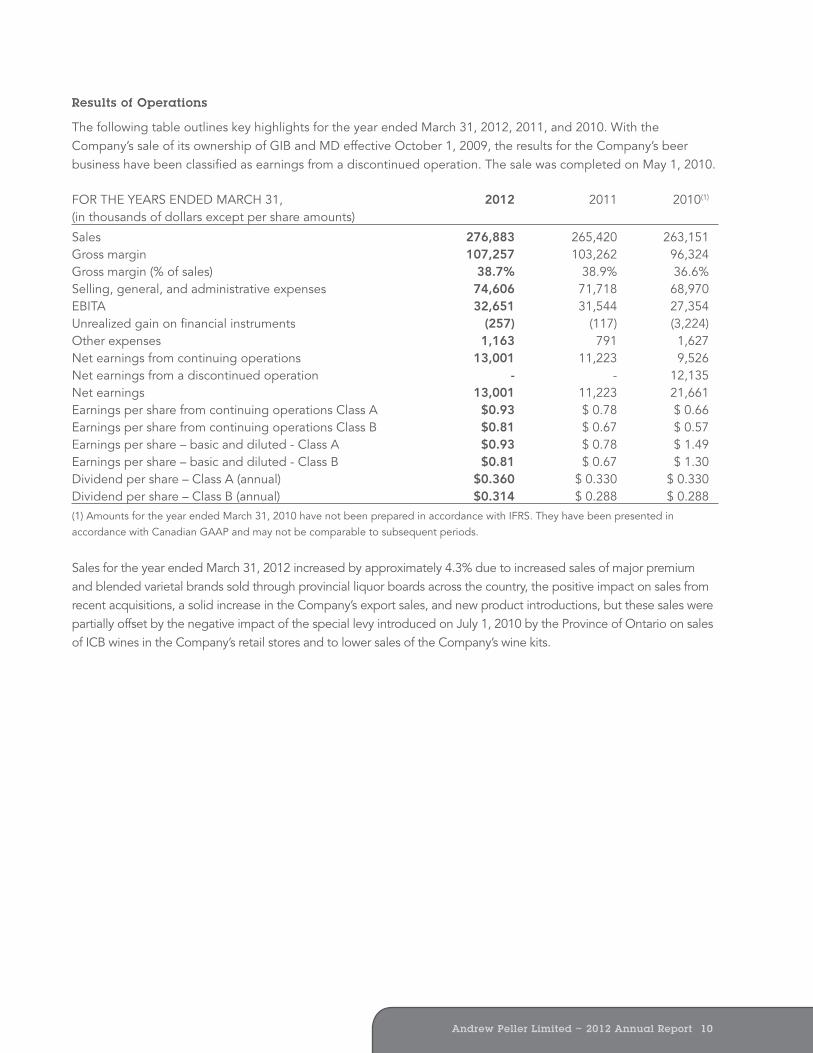
Results of Operations
The following table outlines key highlights for the year ended March 31, 2012, 2011, and 2010. With the Company’s sale of its ownership of GIB and MD effective October 1, 2009, the results for the Company’s beer business have been classified as earnings from a discontinued operation. The sale was completed on May 1, 2010.
FOR THE YEARS ENDED MARCH 31, 2012 2011 2010(1) (in thousands of dollars except per share amounts)
Sales 276,883 265,420 263,151Gross margin 107,257 103,262 96,324Gross margin (% of sales) 38.7% 38.9% 36.6%Selling, general, and administrative expenses 74,606 71,718 68,970EBITA 32,651 31,544 27,354Unrealized gain on financial instruments (257) (117) (3,224)Other expenses 1,163 791 1,627Net earnings from continuing operations 13,001 11,223 9,526Net earnings from a discontinued operation - - 12,135Net earnings 13,001 11,223 21,661Earnings per share from continuing operations Class A $0.93 $ 0.78 $ 0.66Earnings per share from continuing operations Class B $0.81 $ 0.67 $ 0.57Earnings per share – basic and diluted - Class A $0.93 $ 0.78 $ 1.49Earnings per share – basic and diluted - Class B $0.81 $ 0.67 $ 1.30Dividend per share – Class A (annual) $0.360 $ 0.330 $ 0.330Dividend per share – Class B (annual) $0.314 $ 0.288 $ 0.288(1) Amounts for the year ended March 31, 2010 have not been prepared in accordance with IFRS. They have been presented in accordance with Canadian GAAP and may not be comparable to subsequent periods.
Sales for the year ended March 31, 2012 increased by approximately 4.3% due to increased sales of major premium and blended varietal brands sold through provincial liquor boards across the country, the positive impact on sales from recent acquisitions, a solid increase in the Company’s export sales, and new product introductions, but these sales were partially offset by the negative impact of the special levy introduced on July 1, 2010 by the Province of Ontario on sales of ICB wines in the Company’s retail stores and to lower sales of the Company’s wine kits.
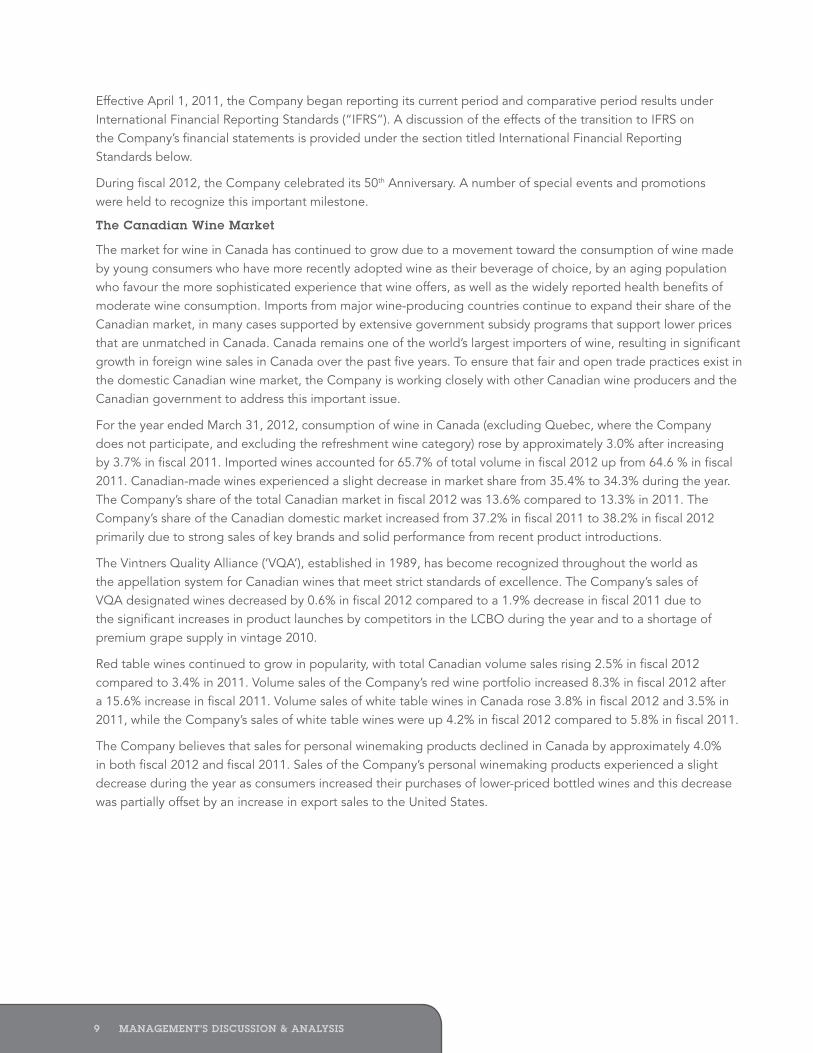
Effective April 1, 2011, the Company began reporting its current period and comparative period results under International Financial Reporting Standards (“IFRS”). A discussion of the effects of the transition to IFRS on the Company’s financial statements is provided under the section titled International Financial Reporting Standards below.
During fiscal 2012, the Company celebrated its 50th Anniversary. A number of special events and promotions were held to recognize this important milestone.
The Canadian wine Market
The market for wine in Canada has continued to grow due to a movement toward the consumption of wine made by young consumers who have more recently adopted wine as their beverage of choice, by an aging population who favour the more sophisticated experience that wine offers, as well as the widely reported health benefits of moderate wine consumption. Imports from major wine-producing countries continue to expand their share of the Canadian market, in many cases supported by extensive government subsidy programs that support lower prices that are unmatched in Canada. Canada remains one of the world’s largest importers of wine, resulting in significant growth in foreign wine sales in Canada over the past five years. To ensure that fair and open trade practices exist in the domestic Canadian wine market, the Company is working closely with other Canadian wine producers and the Canadian government to address this important issue.
For the year ended March 31, 2012, consumption of wine in Canada (excluding Quebec, where the Company does not participate, and excluding the refreshment wine category) rose by approximately 3.0% after increasing by 3.7% in fiscal 2011. Imported wines accounted for 65.7% of total volume in fiscal 2012 up from 64.6 % in fiscal 2011. Canadian-made wines experienced a slight decrease in market share from 35.4% to 34.3% during the year. The Company’s share of the total Canadian market in fiscal 2012 was 13.6% compared to 13.3% in 2011. The Company’s share of the Canadian domestic market increased from 37.2% in fiscal 2011 to 38.2% in fiscal 2012 primarily due to strong sales of key brands and solid performance from recent product introductions.
The Vintners Quality Alliance (‘VQA’), established in 1989, has become recognized throughout the world as the appellation system for Canadian wines that meet strict standards of excellence. The Company’s sales of VQA designated wines decreased by 0.6% in fiscal 2012 compared to a 1.9% decrease in fiscal 2011 due to the significant increases in product launches by competitors in the LCBO during the year and to a shortage of premium grape supply in vintage 2010.
Red table wines continued to grow in popularity, with total Canadian volume sales rising 2.5% in fiscal 2012 compared to 3.4% in 2011. Volume sales of the Company’s red wine portfolio increased 8.3% in fiscal 2012 after a 15.6% increase in fiscal 2011. Volume sales of white table wines in Canada rose 3.8% in fiscal 2012 and 3.5% in 2011, while the Company’s sales of white table wines were up 4.2% in fiscal 2012 compared to 5.8% in fiscal 2011.
The Company believes that sales for personal winemaking products declined in Canada by approximately 4.0% in both fiscal 2012 and fiscal 2011. Sales of the Company’s personal winemaking products experienced a slight decrease during the year as consumers increased their purchases of lower-priced bottled wines and this decrease was partially offset by an increase in export sales to the United States.
Andrew Peller Limited ~ 2012 Annual Report 109 MANAGeMeNT’S DiSCUSSiON & ANALYSiS
Results of Operations
The following table outlines key highlights for the year ended March 31, 2012, 2011, and 2010. With the Company’s sale of its ownership of GIB and MD effective October 1, 2009, the results for the Company’s beer business have been classified as earnings from a discontinued operation. The sale was completed on May 1, 2010.
FOR THE YEARS ENDED MARCH 31, 2012 2011 2010(1) (in thousands of dollars except per share amounts)
Sales 276,883 265,420 263,151Gross margin 107,257 103,262 96,324Gross margin (% of sales) 38.7% 38.9% 36.6%Selling, general, and administrative expenses 74,606 71,718 68,970EBITA 32,651 31,544 27,354Unrealized gain on financial instruments (257) (117) (3,224)Other expenses 1,163 791 1,627Net earnings from continuing operations 13,001 11,223 9,526Net earnings from a discontinued operation - - 12,135Net earnings 13,001 11,223 21,661Earnings per share from continuing operations Class A $0.93 $ 0.78 $ 0.66Earnings per share from continuing operations Class B $0.81 $ 0.67 $ 0.57Earnings per share – basic and diluted - Class A $0.93 $ 0.78 $ 1.49Earnings per share – basic and diluted - Class B $0.81 $ 0.67 $ 1.30Dividend per share – Class A (annual) $0.360 $ 0.330 $ 0.330Dividend per share – Class B (annual) $0.314 $ 0.288 $ 0.288(1) Amounts for the year ended March 31, 2010 have not been prepared in accordance with IFRS. They have been presented in accordance with Canadian GAAP and may not be comparable to subsequent periods.
Sales for the year ended March 31, 2012 increased by approximately 4.3% due to increased sales of major premium and blended varietal brands sold through provincial liquor boards across the country, the positive impact on sales from recent acquisitions, a solid increase in the Company’s export sales, and new product introductions, but these sales were partially offset by the negative impact of the special levy introduced on July 1, 2010 by the Province of Ontario on sales of ICB wines in the Company’s retail stores and to lower sales of the Company’s wine kits.
Effective April 1, 2011, the Company began reporting its current period and comparative period results under International Financial Reporting Standards (“IFRS”). A discussion of the effects of the transition to IFRS on the Company’s financial statements is provided under the section titled International Financial Reporting Standards below.
During fiscal 2012, the Company celebrated its 50th Anniversary. A number of special events and promotions were held to recognize this important milestone.
The Canadian wine Market
The market for wine in Canada has continued to grow due to a movement toward the consumption of wine made by young consumers who have more recently adopted wine as their beverage of choice, by an aging population who favour the more sophisticated experience that wine offers, as well as the widely reported health benefits of moderate wine consumption. Imports from major wine-producing countries continue to expand their share of the Canadian market, in many cases supported by extensive government subsidy programs that support lower prices that are unmatched in Canada. Canada remains one of the world’s largest importers of wine, resulting in significant growth in foreign wine sales in Canada over the past five years. To ensure that fair and open trade practices exist in the domestic Canadian wine market, the Company is working closely with other Canadian wine producers and the Canadian government to address this important issue.
For the year ended March 31, 2012, consumption of wine in Canada (excluding Quebec, where the Company does not participate, and excluding the refreshment wine category) rose by approximately 3.0% after increasing by 3.7% in fiscal 2011. Imported wines accounted for 65.7% of total volume in fiscal 2012 up from 64.6 % in fiscal 2011. Canadian-made wines experienced a slight decrease in market share from 35.4% to 34.3% during the year. The Company’s share of the total Canadian market in fiscal 2012 was 13.6% compared to 13.3% in 2011. The Company’s share of the Canadian domestic market increased from 37.2% in fiscal 2011 to 38.2% in fiscal 2012 primarily due to strong sales of key brands and solid performance from recent product introductions.
The Vintners Quality Alliance (‘VQA’), established in 1989, has become recognized throughout the world as the appellation system for Canadian wines that meet strict standards of excellence. The Company’s sales of VQA designated wines decreased by 0.6% in fiscal 2012 compared to a 1.9% decrease in fiscal 2011 due to the significant increases in product launches by competitors in the LCBO during the year and to a shortage of premium grape supply in vintage 2010.
Red table wines continued to grow in popularity, with total Canadian volume sales rising 2.5% in fiscal 2012 compared to 3.4% in 2011. Volume sales of the Company’s red wine portfolio increased 8.3% in fiscal 2012 after a 15.6% increase in fiscal 2011. Volume sales of white table wines in Canada rose 3.8% in fiscal 2012 and 3.5% in 2011, while the Company’s sales of white table wines were up 4.2% in fiscal 2012 compared to 5.8% in fiscal 2011.
The Company believes that sales for personal winemaking products declined in Canada by approximately 4.0% in both fiscal 2012 and fiscal 2011. Sales of the Company’s personal winemaking products experienced a slight decrease during the year as consumers increased their purchases of lower-priced bottled wines and this decrease was partially offset by an increase in export sales to the United States.

Andrew Peller Limited ~ 2012 Annual Report 1211 MANAGeMeNT’S DiSCUSSiON & ANALYSiS
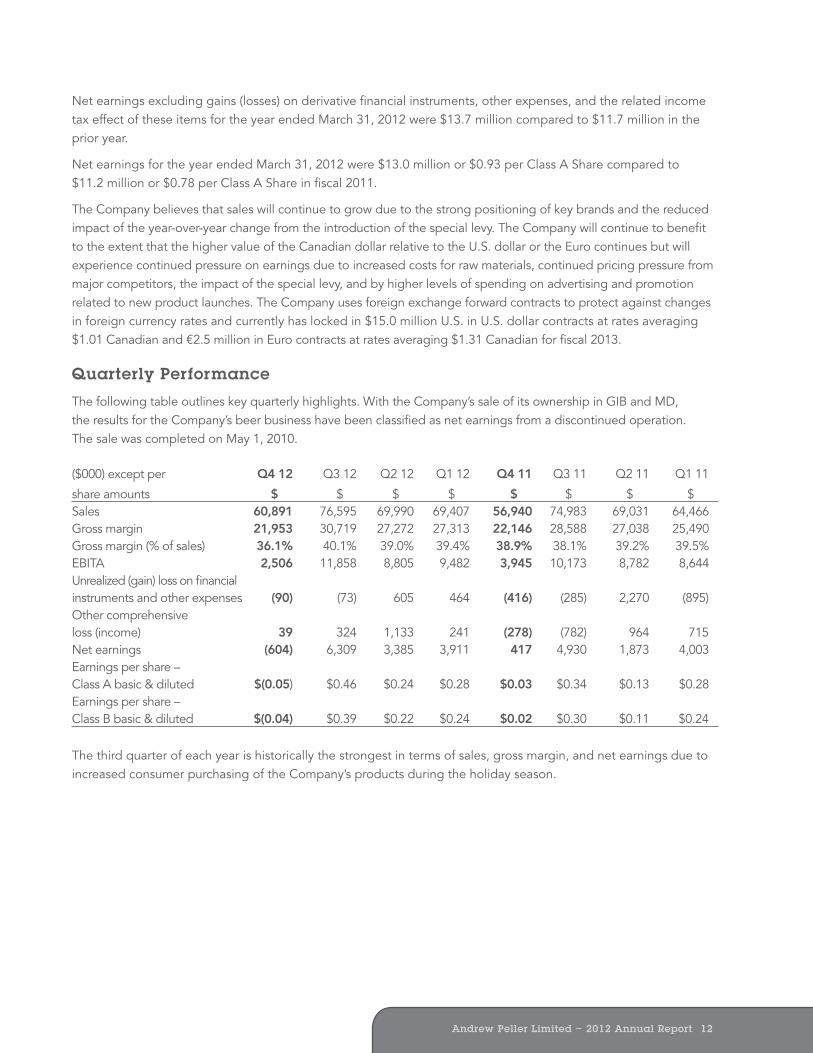
Net earnings excluding gains (losses) on derivative financial instruments, other expenses, and the related income tax effect of these items for the year ended March 31, 2012 were $13.7 million compared to $11.7 million in the prior year.
Net earnings for the year ended March 31, 2012 were $13.0 million or $0.93 per Class A Share compared to $11.2 million or $0.78 per Class A Share in fiscal 2011.
The Company believes that sales will continue to grow due to the strong positioning of key brands and the reduced impact of the year-over-year change from the introduction of the special levy. The Company will continue to benefit to the extent that the higher value of the Canadian dollar relative to the U.S. dollar or the Euro continues but will experience continued pressure on earnings due to increased costs for raw materials, continued pricing pressure from major competitors, the impact of the special levy, and by higher levels of spending on advertising and promotion related to new product launches. The Company uses foreign exchange forward contracts to protect against changes in foreign currency rates and currently has locked in $15.0 million U.S. in U.S. dollar contracts at rates averaging $1.01 Canadian and €2.5 million in Euro contracts at rates averaging $1.31 Canadian for fiscal 2013.
Quarterly Performance
The following table outlines key quarterly highlights. With the Company’s sale of its ownership in GIB and MD, the results for the Company’s beer business have been classified as net earnings from a discontinued operation. The sale was completed on May 1, 2010.
($000) except per Q4 12 Q3 12 Q2 12 Q1 12 Q4 11 Q3 11 Q2 11 Q1 11
share amounts $ $ $ $ $ $ $ $Sales 60,891 76,595 69,990 69,407 56,940 74,983 69,031 64,466 Gross margin 21,953 30,719 27,272 27,313 22,146 28,588 27,038 25,490 Gross margin (% of sales) 36.1% 40.1% 39.0% 39.4% 38.9% 38.1% 39.2% 39.5% EBITA 2,506 11,858 8,805 9,482 3,945 10,173 8,782 8,644 Unrealized (gain) loss on financial instruments and other expenses (90) (73) 605 464 (416) (285) 2,270 (895)Other comprehensive loss (income) 39 324 1,133 241 (278) (782) 964 715Net earnings (604) 6,309 3,385 3,911 417 4,930 1,873 4,003 Earnings per share – Class A basic & diluted $(0.05) $0.46 $0.24 $0.28 $0.03 $0.34 $0.13 $0.28 Earnings per share – Class B basic & diluted $(0.04) $0.39 $0.22 $0.24 $0.02 $0.30 $0.11 $0.24
The third quarter of each year is historically the strongest in terms of sales, gross margin, and net earnings due to increased consumer purchasing of the Company’s products during the holiday season.
The Company defines gross margin as gross profit excluding amortization. Gross margin as a percentage of sales was 38.7% for the year ended March 31, 2012 compared to 38.9% in the prior year. Gross margin percentage was negatively affected by the impact of the additional taxation levied on ICB wines sold through the Company’s retail stores, higher costs for wine purchased on international markets, increased distribution costs, as well as increased price competition in certain markets during the latter half of the fiscal year, but this gross margin percentage was partially offset by sales of higher margin products, the strengthening of the Canadian dollar on world currency markets, and successful cost control initiatives to reduce operating and packaging expenses. The special levy served to reduce sales and gross margin by approximately $2.4 million in fiscal 2012 compared to $2.0 million in fiscal 2011. Management believes gross margin will decline in fiscal 2013 to approximately 37% to 38% due to higher costs for wine purchased on international markets and increased price competition from major competitors across Canada. During fiscal 2011, the Company’s gross margin was negatively impacted by the increased use of higher-priced domestic grapes used to produce ICB wines and an increase in the cost of domestic grapes and of wine purchased on international markets. Management is focused on efforts to enhance production efficiency and productivity to further improve overall profitability.
Selling and administrative expenses rose in fiscal 2012 due to an increase in sales and marketing investments to grow sales volumes of its products through increased advertising and promotional initiatives across all trade channels, investments made to increase tourism at its estate wineries, and certain one-time costs related to the Company’s celebration of its 50th anniversary. As a percentage of sales, selling and administrative expenses for the year ended March 31, 2012 decreased to 26.9% compared to 27.0% in the prior year. The Company is focused on ensuring that selling and administrative expenses are tightly controlled.
Earnings before interest, amortization, unrealized derivative gains (losses), other expenses, income taxes, and net earnings from a discontinued operation (“EBITA”) were $32.7 million for the year ended March 31, 2012 compared to $31.5 million in the prior fiscal year. The increase is primarily due to the higher sales, partially offset by the lower gross margin in fiscal 2012 due to the impact of the special levy on winery retail stores in Ontario and to higher costs for wines purchased on international markets.
Interest expense in fiscal 2012 declined to $5.4 million from $6.7 million last year due to a decrease in short- and long-term interest rates negotiated through the refinancing of the Company’s credit facilities that occurred on September 16, 2011, but this decrease was partially offset by higher debt levels.
Amortization expenses were $7.9 million for the year ended March 31, 2012 a 3.4% increase from the $7.6 million last year due to slightly higher levels of capital spending.
The Company incurred a non-cash gain in fiscal 2012 related to mark-to-market adjustments on an interest rate swap and foreign exchange contracts aggregating approximately $0.3 million compared to $0.1 million in the prior year. The Company has elected not to apply hedge accounting and, accordingly, these financial instruments are reflected in the Company’s financial statements at fair value each reporting period. These instruments are considered to be effective economic hedges and have enabled management to mitigate the volatility of changing costs and interest rates during the year.
Other expenses incurred in fiscal 2012 relate to a $0.4 million fair value adjustment to vines, $0.2 million in maintenance costs for the Company’s Port Moody facility which was closed effective December 31, 2005, and a one-time charge of approximately $0.4 million related to a reassessment of employee payroll taxes from prior periods. In fiscal 2011, other expenses included a net $1.2 million write-down, after proceeds from an insurance claim, in the value of a BC vineyard where vines were damaged by an early and severe frost in the fall of 2009 and $0.2 million in ongoing maintenance costs for the Port Moody facility. These costs were partially offset by a $0.3 million gain on the sale of a portion of an Okanagan vineyard.
Andrew Peller Limited ~ 2012 Annual Report 1211 MANAGeMeNT’S DiSCUSSiON & ANALYSiS
Net earnings excluding gains (losses) on derivative financial instruments, other expenses, and the related income tax effect of these items for the year ended March 31, 2012 were $13.7 million compared to $11.7 million in the prior year.
Net earnings for the year ended March 31, 2012 were $13.0 million or $0.93 per Class A Share compared to $11.2 million or $0.78 per Class A Share in fiscal 2011.
The Company believes that sales will continue to grow due to the strong positioning of key brands and the reduced impact of the year-over-year change from the introduction of the special levy. The Company will continue to benefit to the extent that the higher value of the Canadian dollar relative to the U.S. dollar or the Euro continues but will experience continued pressure on earnings due to increased costs for raw materials, continued pricing pressure from major competitors, the impact of the special levy, and by higher levels of spending on advertising and promotion related to new product launches. The Company uses foreign exchange forward contracts to protect against changes in foreign currency rates and currently has locked in $15.0 million U.S. in U.S. dollar contracts at rates averaging $1.01 Canadian and €2.5 million in Euro contracts at rates averaging $1.31 Canadian for fiscal 2013.
Quarterly Performance
The following table outlines key quarterly highlights. With the Company’s sale of its ownership in GIB and MD, the results for the Company’s beer business have been classified as net earnings from a discontinued operation. The sale was completed on May 1, 2010.
($000) except per Q4 12 Q3 12 Q2 12 Q1 12 Q4 11 Q3 11 Q2 11 Q1 11
share amounts $ $ $ $ $ $ $ $Sales 60,891 76,595 69,990 69,407 56,940 74,983 69,031 64,466 Gross margin 21,953 30,719 27,272 27,313 22,146 28,588 27,038 25,490 Gross margin (% of sales) 36.1% 40.1% 39.0% 39.4% 38.9% 38.1% 39.2% 39.5% EBITA 2,506 11,858 8,805 9,482 3,945 10,173 8,782 8,644 Unrealized (gain) loss on financial instruments and other expenses (90) (73) 605 464 (416) (285) 2,270 (895)Other comprehensive loss (income) 39 324 1,133 241 (278) (782) 964 715Net earnings (604) 6,309 3,385 3,911 417 4,930 1,873 4,003 Earnings per share – Class A basic & diluted $(0.05) $0.46 $0.24 $0.28 $0.03 $0.34 $0.13 $0.28 Earnings per share – Class B basic & diluted $(0.04) $0.39 $0.22 $0.24 $0.02 $0.30 $0.11 $0.24
The third quarter of each year is historically the strongest in terms of sales, gross margin, and net earnings due to increased consumer purchasing of the Company’s products during the holiday season.
The Company defines gross margin as gross profit excluding amortization. Gross margin as a percentage of sales was 38.7% for the year ended March 31, 2012 compared to 38.9% in the prior year. Gross margin percentage was negatively affected by the impact of the additional taxation levied on ICB wines sold through the Company’s retail stores, higher costs for wine purchased on international markets, increased distribution costs, as well as increased price competition in certain markets during the latter half of the fiscal year, but this gross margin percentage was partially offset by sales of higher margin products, the strengthening of the Canadian dollar on world currency markets, and successful cost control initiatives to reduce operating and packaging expenses. The special levy served to reduce sales and gross margin by approximately $2.4 million in fiscal 2012 compared to $2.0 million in fiscal 2011. Management believes gross margin will decline in fiscal 2013 to approximately 37% to 38% due to higher costs for wine purchased on international markets and increased price competition from major competitors across Canada. During fiscal 2011, the Company’s gross margin was negatively impacted by the increased use of higher-priced domestic grapes used to produce ICB wines and an increase in the cost of domestic grapes and of wine purchased on international markets. Management is focused on efforts to enhance production efficiency and productivity to further improve overall profitability.
Selling and administrative expenses rose in fiscal 2012 due to an increase in sales and marketing investments to grow sales volumes of its products through increased advertising and promotional initiatives across all trade channels, investments made to increase tourism at its estate wineries, and certain one-time costs related to the Company’s celebration of its 50th anniversary. As a percentage of sales, selling and administrative expenses for the year ended March 31, 2012 decreased to 26.9% compared to 27.0% in the prior year. The Company is focused on ensuring that selling and administrative expenses are tightly controlled.
Earnings before interest, amortization, unrealized derivative gains (losses), other expenses, income taxes, and net earnings from a discontinued operation (“EBITA”) were $32.7 million for the year ended March 31, 2012 compared to $31.5 million in the prior fiscal year. The increase is primarily due to the higher sales, partially offset by the lower gross margin in fiscal 2012 due to the impact of the special levy on winery retail stores in Ontario and to higher costs for wines purchased on international markets.
Interest expense in fiscal 2012 declined to $5.4 million from $6.7 million last year due to a decrease in short- and long-term interest rates negotiated through the refinancing of the Company’s credit facilities that occurred on September 16, 2011, but this decrease was partially offset by higher debt levels.
Amortization expenses were $7.9 million for the year ended March 31, 2012 a 3.4% increase from the $7.6 million last year due to slightly higher levels of capital spending.
The Company incurred a non-cash gain in fiscal 2012 related to mark-to-market adjustments on an interest rate swap and foreign exchange contracts aggregating approximately $0.3 million compared to $0.1 million in the prior year. The Company has elected not to apply hedge accounting and, accordingly, these financial instruments are reflected in the Company’s financial statements at fair value each reporting period. These instruments are considered to be effective economic hedges and have enabled management to mitigate the volatility of changing costs and interest rates during the year.
Other expenses incurred in fiscal 2012 relate to a $0.4 million fair value adjustment to vines, $0.2 million in maintenance costs for the Company’s Port Moody facility which was closed effective December 31, 2005, and a one-time charge of approximately $0.4 million related to a reassessment of employee payroll taxes from prior periods. In fiscal 2011, other expenses included a net $1.2 million write-down, after proceeds from an insurance claim, in the value of a BC vineyard where vines were damaged by an early and severe frost in the fall of 2009 and $0.2 million in ongoing maintenance costs for the Port Moody facility. These costs were partially offset by a $0.3 million gain on the sale of a portion of an Okanagan vineyard.

Andrew Peller Limited ~ 2012 Annual Report 1413 MANAGeMeNT’S DiSCUSSiON & ANALYSiS
Accounts receivable are predominantly with provincial liquor boards and to a lesser extent licensed establishments and independent retailers of consumer made wine kits. The Company had $13.9 million dollars of accounts receivable with provincial liquor boards at March 31, 2012, all of which is expected to be collectible. The balance of $11.0 million represents amounts due from licensees, export customers, and independent retailers of consumer made wine products. The amount of accounts receivable that is beyond 60 days is $1.0 million at March 31, 2012. Against these amounts, an allowance for doubtful accounts of $0.3 million has been provided which the Company has determined to represent a reasonable estimate of amounts that may not be collectible. During fiscal 2013, the Company received the $1.0 million holdback from Creemore Springs Brewery Ltd. due on May 1, 2012 related to the sale of GIB and MD.
The following table outlines the Company’s contractual obligations, including long-term debt, operating leases, and commitments on short-term forward foreign exchange contracts used to hedge the currency risk on U.S. dollar purchases.
As at March 31, 2012 Total <1 Year 2-3 years 4-5 years >5 years($000) $ $ $ $ $Long-term bank loan and other long-term debt 47,597 5,366 10,732 31,401 98 Swap agreement and loan interest 7,626 2,658 4,359 609 - Operating leases and royalties 23,317 5,157 6,816 3,013 8,331 Plant and equipment purchases 5,411 5,411 - - - Pension obligations 4,093 560 953 811 1,769 Foreign exchange contracts 18,409 18,409 - - - Long-term grape contracts 315,340 24,711 49,774 49,525 191,330Total long-term obligations 421,793 62,272 72,634 85,359 201,528
The ratio of debt to equity was 0.87:1 at March 31, 2012 compared to 0.85:1 at March 31, 2011. At March 31, 2012, the Company had unutilized debt capacity in the amount of $24.2 million on its operating loan facility.
On September 16, 2011, the Company completed a refinancing package with its existing bank group and entered into a new $130.0 million syndicated loan facility maturing on September 16, 2015. The operating loan facility in the amount of $80.0 million matures on September 16, 2015 and bears interest at the one- to six-month Canadian Dealer Offered Rate (“CDOR”) plus 1.75%. The term facility in the amount of $50.0 million matures on September 16, 2015. The Company maintains an interest rate swap on the term facility that effectively fixes the interest rate at 5.73% until August 31, 2015. This loan is repayable in monthly principal payments of $0.444 million.
Management expects to generate sufficient cash flow from operations to meet its debt servicing, principal payment, and working capital requirements over both the short- and the long-term through increased profitability and strong management of working capital and capital expenditures. The Company continually reviews all of its assets to ensure appropriate returns on investment are being achieved and fit with the Company’s long-term strategic objectives.
Sales in the fourth quarter of fiscal 2012 increased by 6.9 % compared to the same quarter of fiscal 2011 due primarily to solid increases in sales through provincial liquor boards and to the positive impact on sales from recent acquisitions, partially offset by weaker sales of the Company’s wine kits. Gross margin for the three months ended March 31, 2012 was 36.1% of sales compared to 38.9% during the prior year period. The decrease was due to higher costs for wine purchased on international markets, increased price competition in certain markets, the unfavourable absorption of overheads in the fourth quarter of fiscal 2012, and increased distribution costs compared to the prior year period. Selling and administrative expenses as a percentage of sales improved to 31.9% in the fourth quarters of fiscal 2012 compared to 32.0% in the fourth quarter of fiscal 2011.
Liquidity and Capital Resources
As at March 31, March 31,($000) 2012 2011 $ $
Current assets 137,412 119,659 Property, plant, & equipment 84,490 84,744 Biological assets 12,556 11,950 Goodwill 37,473 37,473 Intangibles and other assets 13,621 14,170
Total assets 285,552 267,996
Current liabilities 102,543 92,016 Long-term debt 41,456 42,720 Long-term derivative financial instruments 1,943 1,578 Employee future benefits 7,151 5,565 Deferred income tax 11,907 11,820 Shareholders’ equity 120,552 114,297
Total liabilities & shareholders’ equity 285,552 267,996
The changes to the Company’s balance sheet at March 31, 2012 compared to March 31, 2011 are due to increased levels of inventory due to purchases from Wayne Gretzky Estate Winery and Cellar Craft, a larger vintage in 2011, and higher wine inventory to support forecasts for increased sales in fiscal 2013, offset by higher bank indebtedness and increases in accounts payable and accrued liabilities. In the third quarter of fiscal 2011, the Company recorded a net write-down to assets of $1.2 million related to damage to vines at a BC vineyard. Beginning in fiscal 2012, the Company began disclosing its biological assets at fair value, primarily grapes and vines, as required under IFRS.
Total bank indebtedness increased during fiscal 2012 due primarily to an increased investment in inventory partially offset by strong net earnings for the period and higher levels of accounts payable and accrued liabilities.
Inventory at March 31, 2012 was higher compared to March 31, 2011 due to the development of a strategic alliance with Wayne Gretzky Estate Winery and the purchase of inventory from Cellar Craft International, a larger VQA grape crop, and the carrying of higher levels of finished goods to meet future sales demand. Inventory is also dependent on the increased use of domestically grown grapes that are used in the sale of premium and ultra-premiums wines and are held for a longer period than imported wine. These grapes are typically aged for one to three years before they are sold. The cost of domestically grown grapes is also significantly higher than wine purchased on international markets.
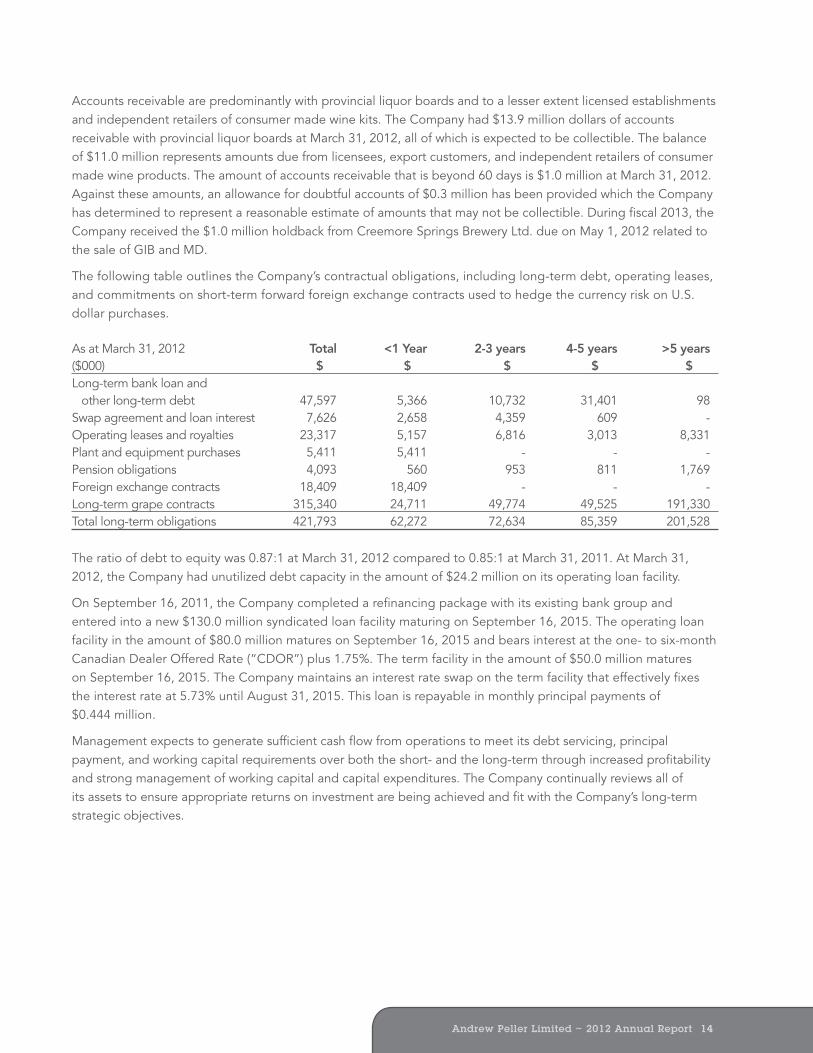
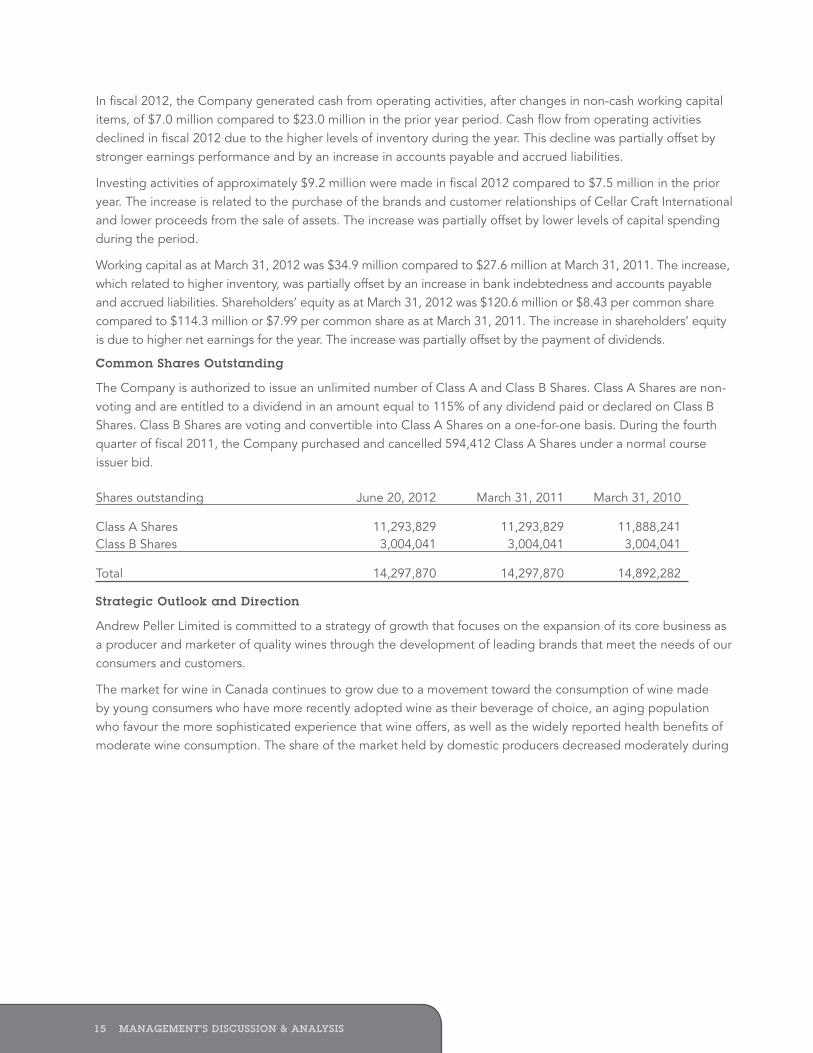
Andrew Peller Limited ~ 2012 Annual Report 1615 MANAGeMeNT’S DiSCUSSiON & ANALYSiS
fiscal 2012. The Company recorded strong growth in its sales through provincial liquor boards, its estate wineries and through export sales but continued to experience slight weakness for its personal winemaking products. Sales increased slightly through the Company’s 102 retail stores in Ontario in spite of the introduction of a special levy on sales of ICB wines through winery retail stores in the province. The Company has focused its product development and sales and marketing initiatives aimed at capitalizing on the trend of increased wine consumption and expects to see continued sales growth. The Company will continue to closely monitor its costs and will react quickly to any further changes in the marketplace. Management expects gross margin to decline to the 37% to 38% level in fiscal 2013 due to increases in the costs of wine and packaging and continued price pressure from key competitors. Gross margin dollars are forecasted to grow by approximately 2% over the year. Earnings are forecasted to increase due to tight controls over spending and investments to improve productivity and efficiency.
The Company will continue to launch new blended varietal and ultra-premium brands in the future and increase its use of unique package formats. The Company will also make packaging design changes that are consistent with its continued move to be more environmentally friendly. Increased focus will be made on expanding distribution through the Company’s direct to home trade channels to provide consumers with more access to its broad brand portfolio. These product launches and directed spending to support key brands through all of the Company’s distribution channels will receive increased marketing and sales support in fiscal 2013.
The Company expects to make additional investments in capital expenditures to increase capacity, to support its ongoing commitment to producing the highest-quality wines, and to improve productivity and efficiencies. Such investments made over the past few years are expected to continue to result in increased sales and improved profitability going forward.
From time to time the Company evaluates investment opportunities, including acquisitions, which could support its strategic direction.
The sale of the Company’s interest in its ownership of GIB and MD completed on May 1, 2010 allowed the Company to more effectively focus on its key strengths and long-term strategies to build its leading portfolio of premium and ultra-premium wines through all its trade channels. The proceeds from the sale were used to reduce bank indebtedness and long-term debt.
With the emergence from the economic slowdown in Canada experienced over the last two years, the Company expects it will generate increased sales while gross margin is expected to decrease moderately. Higher pricing for imported and domestic wine, the Province of Ontario’s introduction of a discriminatory wine levy on ICB wines sold through the Company’s retail store network and pricing pressure from key competitors will have a negative impact on gross margin in fiscal 2013.
The Company’s product portfolio covers the complete spectrum of price levels within the Canadian wine market. While there may be an increase in purchases of ultra-premium wine, this is expected to be offset by a slight decrease in sales of blended varietal wine. In addition, the Company will be accelerating its efforts to generate production efficiencies and reduce overhead costs to enhance its overall profitability.
In fiscal 2012, the Company generated cash from operating activities, after changes in non-cash working capital items, of $7.0 million compared to $23.0 million in the prior year period. Cash flow from operating activities declined in fiscal 2012 due to the higher levels of inventory during the year. This decline was partially offset by stronger earnings performance and by an increase in accounts payable and accrued liabilities.
Investing activities of approximately $9.2 million were made in fiscal 2012 compared to $7.5 million in the prior year. The increase is related to the purchase of the brands and customer relationships of Cellar Craft International and lower proceeds from the sale of assets. The increase was partially offset by lower levels of capital spending during the period.
Working capital as at March 31, 2012 was $34.9 million compared to $27.6 million at March 31, 2011. The increase, which related to higher inventory, was partially offset by an increase in bank indebtedness and accounts payable and accrued liabilities. Shareholders’ equity as at March 31, 2012 was $120.6 million or $8.43 per common share compared to $114.3 million or $7.99 per common share as at March 31, 2011. The increase in shareholders’ equity is due to higher net earnings for the year. The increase was partially offset by the payment of dividends.
Common Shares Outstanding
The Company is authorized to issue an unlimited number of Class A and Class B Shares. Class A Shares are non-voting and are entitled to a dividend in an amount equal to 115% of any dividend paid or declared on Class B Shares. Class B Shares are voting and convertible into Class A Shares on a one-for-one basis. During the fourth quarter of fiscal 2011, the Company purchased and cancelled 594,412 Class A Shares under a normal course issuer bid.
Shares outstanding June 20, 2012 March 31, 2011 March 31, 2010
Class A Shares 11,293,829 11,293,829 11,888,241 Class B Shares 3,004,041 3,004,041 3,004,041
Total 14,297,870 14,297,870 14,892,282
Strategic Outlook and Direction
Andrew Peller Limited is committed to a strategy of growth that focuses on the expansion of its core business as a producer and marketer of quality wines through the development of leading brands that meet the needs of our consumers and customers.
The market for wine in Canada continues to grow due to a movement toward the consumption of wine made by young consumers who have more recently adopted wine as their beverage of choice, an aging population who favour the more sophisticated experience that wine offers, as well as the widely reported health benefits of moderate wine consumption. The share of the market held by domestic producers decreased moderately during

Andrew Peller Limited ~ 2012 Annual Report 1817 MANAGeMeNT’S DiSCUSSiON & ANALYSiS
requirements. APL has entered into a series of foreign exchange contracts as a hedge against movements in U.S. dollar and Euro exchange rates. The Company does not enter into foreign exchange contracts for trading or speculative purposes. These contracts are reviewed periodically. Each one percent change in the value of the U.S. dollar has a $0.2 million impact on the Company’s net earnings. Each one percent change in the value of the Euro has a $0.1 million impact on the Company’s net earnings.
The Company purchases glass, bag-in-the-box, tetra paks, kegs, and other components used in the bottling and packaging of wine. The largest component in the packaging of wine is glass, of which there are few domestic or international suppliers. There is currently only one commercial supplier of glass in Canada and any interruption in supply could have an adverse impact on the Company’s ability to supply its markets. APL has taken steps to reduce its dependence on domestic suppliers through the development of relationships with several international producers of glass and through carrying increased inventory of selected bottles.
The Company operates in a highly regulated industry, with requirements regarding the production, distribution, marketing, advertising, and labelling of wine. These regulatory requirements may inhibit or restrict the Company’s ability to maintain or increase strong consumer support for and recognition of its brands and may adversely affect APL’s business strategies and results of operations. The Company is currently reviewing its labelling on ICB wines. Privatization of liquor distribution and retailing has been implemented in varying degrees across the country. The possibility of privatization in Ontario remains a risk to APL through its impact on the Company’s retail operations. The provincial government has stated that, should it consider privatization, it would engage in a consultation process and would acknowledge the special role of Ontario’s wine industry.
The wine industry and the domestic and international market, in which the Company operates, are consolidating. This has resulted in fewer, but larger, competitors who increase their resources and scale. The increased competition from these larger market participants may affect the Company’s pricing strategies and create margin pressures, resulting in potentially lower revenues. Competition also exerts pressure on existing customer relationships that may affect APL’s ability to retain existing customers and increase the number of new customers. The Company has worked to improve production efficiencies, selectively increase pricing to increase gross margin, and implement a higher level of promotion and advertising activity to combat these initiatives. APL and other wine industry participants also generally compete with other alcoholic beverages like beer and spirits for consumer acceptance, loyalty, and shelf space. No assurance can be given that consumer demand for wine and premium wine products will continue at current levels in the future.
The Company has experienced increases in energy costs and further increases could result in higher transportation, freight, and other operating costs. The Company’s future operating expenses and margins are dependent on its ability to manage the impact of cost increases. APL cannot guarantee that it will be able to pass along increased energy costs to its customers through increased prices.
Federal and provincial governments impose excise and other taxes on beverage alcohol products in varying amounts which have been subject to change. Significant increases in excise and other taxes on beverage alcohol products could materially and adversely affect the Company’s financial condition or results of operations. In addition, federal and provincial governmental agencies extensively regulate the beverage alcohol products industry concerning such matters as licensing, trade practices, permitted and required labelling, advertising, and relations with consumers and retailers. Certain federal and provincial regulations also require warning labels and signage. New or revised regulations, increased licensing fees, or taxes could also have a material adverse effect on the Company’s financial condition or results of operations.
Risks and Uncertainties
The Company’s sales of wine are affected by general economic conditions such as changes in discretionary consumer spending and consumer confidence, in future economic conditions, tax laws, and the prices of its products. A steep and sustained decline in economic growth may cause a lower demand for the Company’s products. Such general economic conditions could impact the Company’s sales through our estate wineries and restaurants, direct sales through licensed establishments, and export sales through Duty Free shops. APL believes that these effects would likely be temporary and would not have a significant impact on financial performance.
The Canadian wine market continues to be the target of low-priced imported wines from regions and countries that subsidize wine production and grape growing as well as providing sizeable export subsidies. Along with other members of the Canadian wine industry, the Company is working with the Canadian government to rectify these unfair trade practices.
The Company operates in a highly competitive industry and the dollar amount and unit volume of sales could be negatively impacted by its inability to maintain or increase prices, changes in geographic or product mix, a general decline in beverage alcohol consumption or the decision of retailers, or consumers to purchase competitive products instead of the Company’s products. Retailer and consumer purchasing decisions are influenced by, among other things, the perceived absolute or relative overall value of the Company’s products, including their quality or pricing, compared to competitive products. Unit volume and dollar sales could also be affected by purchasing, financing, operational, advertising, or promotional decisions made by provincial agencies and retailers which could affect supply of or consumer demand for, the Company’s products. APL could also experience higher than expected selling and administrative expenses if it finds it necessary to increase the number of its personnel, advertising, or promotional expenditures to maintain its competitive position.
APL expects to increase its sales of its premium wines in Canada, principally through the sale of VQA wines, and as a result is dependent on the quality and supply of domestically grown premium quality grapes. If any of the Company’s vineyards or the vineyards of our grape suppliers experience certain weather variations, natural disasters, pestilence, other severe environmental problems, or other occurrences, APL may not be able to secure a sufficient supply of grapes, which could result in a decrease in production of certain products from those regions and/or an increase in costs. In the past, where there has been a significant reduction in domestically sourced grapes, the Government of Ontario, in conjunction with the Ontario Grape Growers Marketing Board, has agreed to temporarily increase the blending of imported wines that would enable the Company to continue to supply products to the market. The inability to secure premium quality grapes could impair the ability of the Company to supply certain wines to its customers. APL has developed programs to ensure it has access to a consistent supply to premium quality grapes and wine. The price of grapes is determined through negotiations with the Ontario Grape Growers Marketing Board in Ontario and with independent growers in British Columbia.
Foreign exchange risk exists on the purchases by the Company of bulk wine and concentrate that are primarily made in United States dollars and Euros. The Company’s strategy is to hedge approximately 50% - 80% of its foreign exchange requirements prior to the beginning of each fiscal quarter and to regularly review its ongoing

Andrew Peller Limited ~ 2012 Annual Report 2019 MANAGeMeNT’S DiSCUSSiON & ANALYSiS
The Company’s future operating results also depend on the ability of its officers and other key employees to continue to implement and improve its operating and financial systems and manage APL’s significant relationships with its suppliers and customers. The Company is also dependent upon the performance of its key senior management personnel. The Company’s success is linked to its ability to identify, hire, train, motivate, promote, and retain highly qualified management. Competition for such employees is intense and there can be no assurances that APL will be able to retain current key employees or attract new key employees.
The Company has defined benefit pension plans. The expense and cash contributions related to these plans depend on the discount rate used to measure the liability to pay future benefits and the market performance of the plan assets set aside to pay these benefits. The Pension Committee reviews the performance of plan assets on a regular basis and has a policy to hold diversified investments. Nevertheless, a decline in long-term interest rates or in asset values could increase the Company’s costs related to funding the deficit in these plans.
The competitive nature of the wine industry internationally has resulted in the discounting of retail prices of wine in key markets such as the United States and the United Kingdom, in part due to an international grape surplus. This international grape surplus could serve to continue the discounting of wine in international markets, including Canada. The Company has responded by increased promotional and advertising spending to strengthen the performance of its brands. APL does not believe that significant price discounting will occur in Canada beyond current levels.
The Company considers its trademarks, particularly certain brand names and product packaging, advertising and promotion design, and artwork to be of significant importance to its business and ascribes a significant value to these intangible assets. APL relies on trademark laws and other arrangements to protect its proprietary rights. There can be no assurance that the steps taken by APL to protect its intellectual property rights will preclude competitors from developing confusingly similar brand names or promotional materials. The Company believes that its proprietary rights do not infringe upon the proprietary rights of fourth parties, but there can be no assurance in this regard.
As an owner and lessor of property, the Company is subject to various federal and provincial laws relating to environmental matters. Such laws provide that APL could be held liable for the cost of removal and remediation of hazardous substances on its properties. The failure to remedy any situation that might arise could lead to claims against the Company. These risks are believed to be limited.
The success of the Company’s brands depends upon the positive image that consumers have of those brands. Contamination of APL’s products, whether arising accidentally or through deliberate third-party action, or other events that harm the integrity or consumer support for those brands, could adversely affect their sales. Contaminants in raw materials purchased from third parties and used in the production of the Company’s products or defects in the fermentation process could lead to low product quality as well as illness among, or injury to, consumers of the products and may result in reduced sales of the affected brand or all of the Company’s brands.
international Financial Reporting Standards
In February 2008, the Canadian Accounting Standards Board (“AcSB”) confirmed that the use of International Financial Reporting Standards (“IFRS”) as issued by the International Accounting Standards Board will be required effective for fiscal years beginning on or after January 1, 2011 (or April 1, 2011 for the Company) for publicly accountable profit oriented enterprises. Accordingly, the Company began preparing its current period and comparative period information under IFRS beginning in the first quarter of fiscal 2012.
The most significant impact of the resulting changes in accounting policies are summarized in the table below.
Area Description of the Change impact on Financial Statements
IAS 41 - Agriculture
• Grape vines are measured at fair value less costs to sell.
• Harvested grapes from vineyards controlled by APL are required to be measured at fair value less costs to sell at the point of harvest, which becomes the cost used in measuring the Company’s inventory of internally grown grapes after harvest.
• Prior to IFRS adoption, vineyards were measured at cost less accumulated amortization and inventory at the lower of cost and net realizable value.
• Note 23 of the Consolidated Notes to the Financial Statements illustrates the impact of this change in accounting policy for the comparative year.
IAS 19 - Employee Benefits
• The Company has chosen to recognize all cumulative actuarial gains and losses in the opening IFRS balance sheet.
• On an ongoing basis, actuarial gains and losses will be recognized immediately in other comprehensive income.
• The Company has recognized a liability for its policy to provide a wine allowance to retirees.
• Note 23 of the Consolidated Notes to the Financial Statements illustrates the impact of this change in accounting policy.
• The Company’s comprehensive income will fluctuate from period to period under IFRS, as a result of recognizing actuarial gains and losses immediately in other comprehensive income.
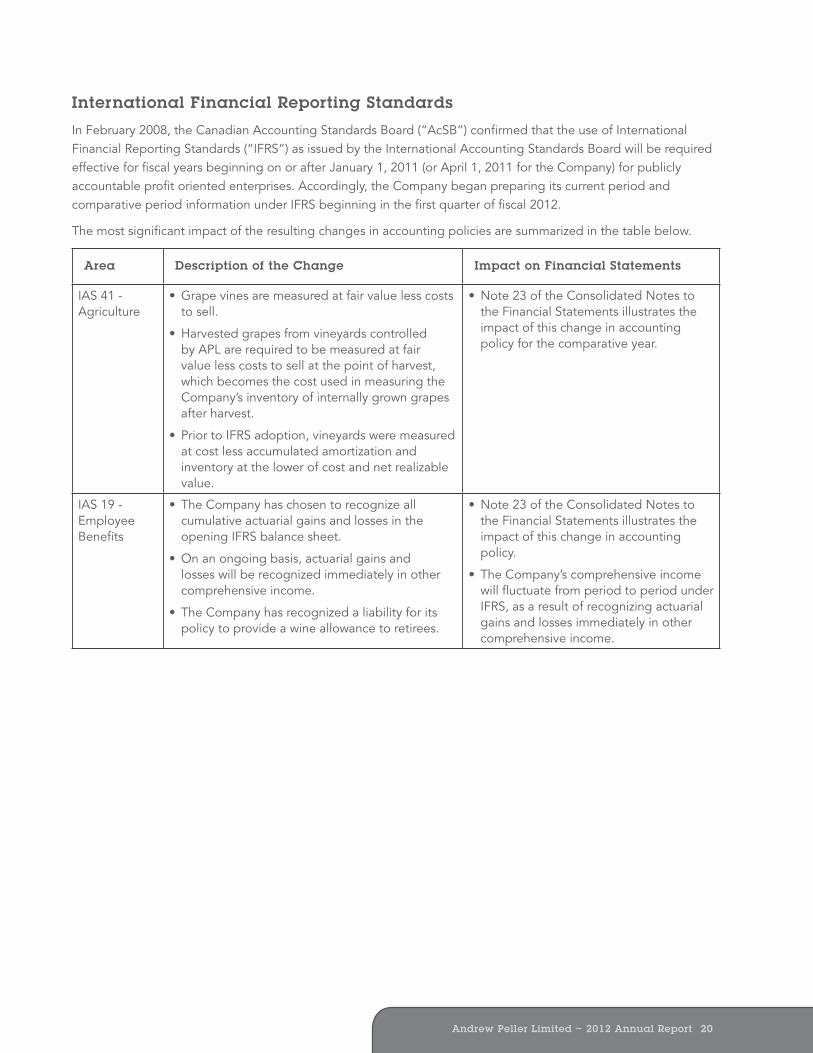
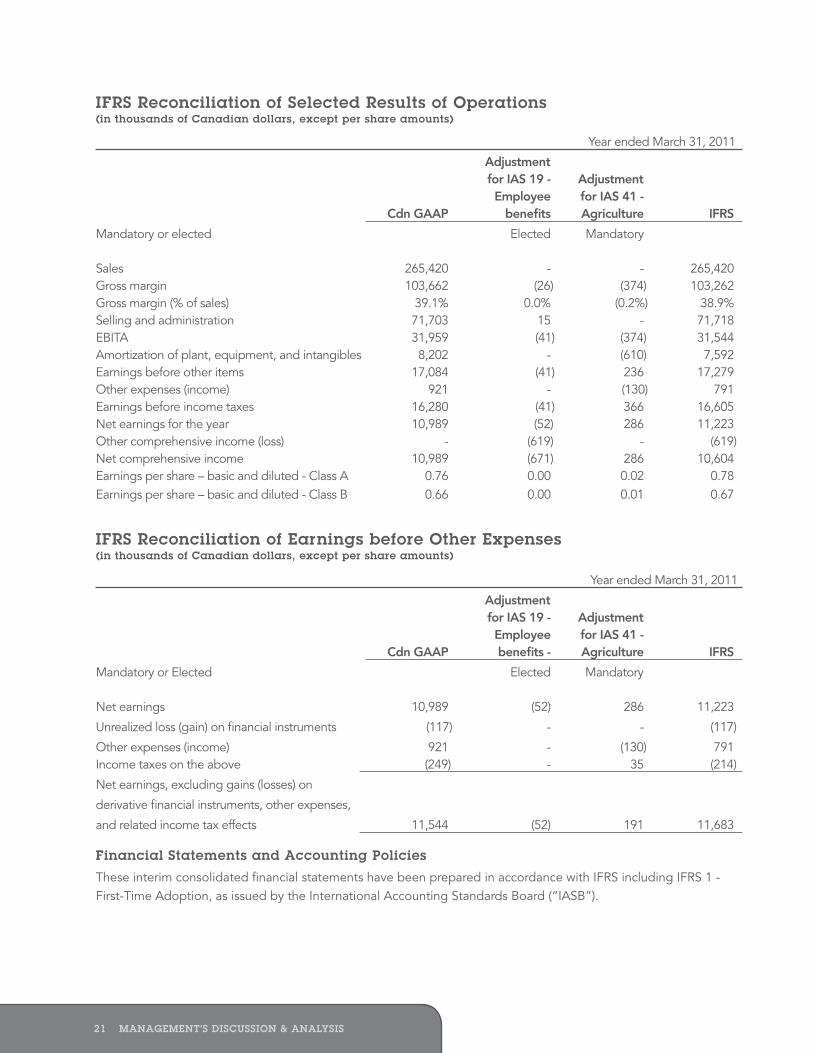
Andrew Peller Limited ~ 2012 Annual Report 2221 MANAGeMeNT’S DiSCUSSiON & ANALYSiS
iFRS Reconciliation of Selected Results of Operations (in thousands of Canadian dollars, except per share amounts)
Year ended March 31, 2011
Adjustment for IAS 19 - Adjustment Employee for IAS 41 - Cdn GAAP benefits Agriculture IFRS
Mandatory or elected Elected Mandatory Sales 265,420 - - 265,420Gross margin 103,662 (26) (374) 103,262Gross margin (% of sales) 39.1% 0.0% (0.2%) 38.9%Selling and administration 71,703 15 - 71,718EBITA 31,959 (41) (374) 31,544Amortization of plant, equipment, and intangibles 8,202 - (610) 7,592Earnings before other items 17,084 (41) 236 17,279Other expenses (income) 921 - (130) 791Earnings before income taxes 16,280 (41) 366 16,605Net earnings for the year 10,989 (52) 286 11,223Other comprehensive income (loss) - (619) - (619)Net comprehensive income 10,989 (671) 286 10,604Earnings per share – basic and diluted - Class A 0.76 0.00 0.02 0.78Earnings per share – basic and diluted - Class B 0.66 0.00 0.01 0.67
iFRS Reconciliation of earnings before Other expenses (in thousands of Canadian dollars, except per share amounts)
Year ended March 31, 2011
Adjustment for IAS 19 - Adjustment Employee for IAS 41 - Cdn GAAP benefits - Agriculture IFRS
Mandatory or Elected Elected Mandatory Net earnings 10,989 (52) 286 11,223
Unrealized loss (gain) on financial instruments (117) - - (117)
Other expenses (income) 921 - (130) 791Income taxes on the above (249) - 35 (214)
Net earnings, excluding gains (losses) on
derivative financial instruments, other expenses,
and related income tax effects 11,544 (52) 191 11,683
Financial Statements and Accounting PoliciesThese interim consolidated financial statements have been prepared in accordance with IFRS including IFRS 1 - First-Time Adoption, as issued by the International Accounting Standards Board (“IASB”).
Non-iFRS Measures
The Company utilizes EBITA (defined as earnings before interest, amortization, unrealized derivative gains (losses), other expenses, and income taxes) to measure its financial performance. EBITA is not a recognized measure under IFRS; however, management believes that EBITA is a useful supplemental measure to net earnings, as it provides readers with an indication of earnings available for investment prior to debt service, capital expenditures, and income taxes.
For the year ended March 31 (in thousands of Canadian dollars) 2012 2011
Net earnings $13,001 $11,223 Add: Interest 5,354 6,673 Provision for income taxes 5,538 5,382 Amortization of plant and equipment used in production 4,826 4,667 Amortization of equipment and intangibles used in selling and administration 3,026 2,925 Net unrealized gains on derivatives (257) (117) Other expenses 1,163 791
EBITA $32,651 $31,544
Readers are cautioned that EBITA should not be construed as an alternative to net earnings determined in accordance with IFRS as an indicator of the Company’s performance or to cash flows from operating, investing, and financing activities as a measure of liquidity and cash flows.
The Company also utilizes gross margin (defined as gross profit excluding amortization) as calculated below.
For the year ended March 31 (in thousands Canadian dollars) 2012 2011
Gross profit $102,431 $98,595 Add: Amortization of plant and equipment used in production 4,826 4,667
Gross margin $107,257 $103,262
Gross margin (% of sales) 38.7% 38.9%
The Company calculates net earnings excluding gains (losses) on derivative financial instruments, other expenses, and the related income tax effect as follows.
Period ended March 31 (in thousands Canadian dollars) 2012 2011
Net earnings $13,001 $11,223
Unrealized gain on financial instruments (257) (117)Other expenses 1,163 791Income tax effect on the above (245) (214)
Net earnings excluding gains (losses) on derivative financial instruments, other expenses, and related income tax effects $13,662 $11,683
The Company’s method of calculating EBITA, gross margin, and net earnings excluding gains (losses) on derivative financial instruments, other expenses, and the related income tax effect may differ from the methods used by other companies and, accordingly, may not be comparable to the corresponding measures used by other companies.
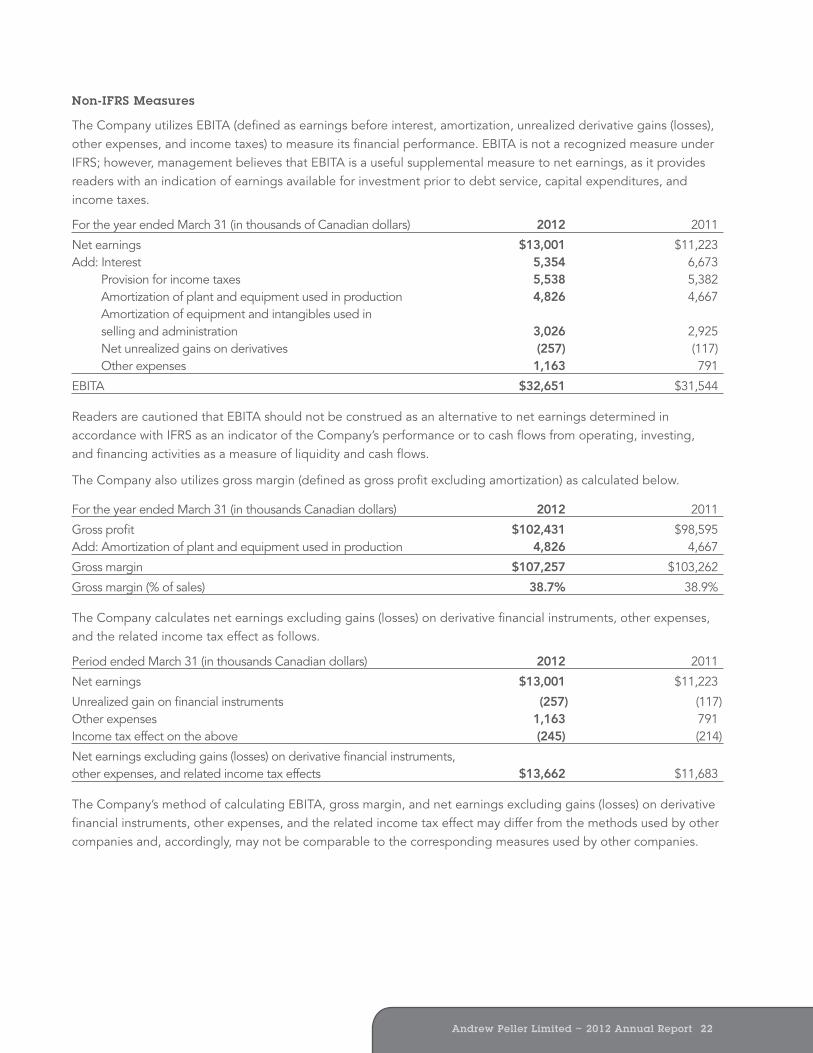

Andrew Peller Limited ~ 2012 Annual Report 2423 MANAGeMeNT’S DiSCUSSiON & ANALYSiS
Critical Accounting estimates
During the year, management is required to make estimates or rely on assumptions that are inherently uncertain. These estimates can vary with respect to the level of judgment involved and ultimately the impact that these estimates may have on the Company’s financial statements. Estimates are deemed to be critical when a different estimate could reasonably be used or where changes are reasonably likely to occur which would materially affect the Company’s financial position or financial performance. The Company’s significant accounting policies are discussed in the Consolidated Notes to the March 31, 2012 Financial Statements. Critical estimates inherent in these accounting policies are set out below.
Accounts Receivable
The Company records an allowance for doubtful accounts to reflect management’s best estimate of losses that may occur on accounts receivable. This allowance was recorded through a charge to earnings and takes into consideration the financial condition and recent payment patterns of customers and the general state of the economy. Management believes that the allowance is sufficient to cover any risk of potential losses. Credit losses were within management’s expectations.
inventory valuation
Inventory is valued at the lower of cost and net realizable value. Cost is determined on an average cost basis. The Company utilizes a weighted average cost calculation to determine the value of ending inventory (bulk wine and finished goods). Average cost is determined separately for import wine and domestic wine and is calculated by varietal and vintage year.
Grapes produced from vineyards controlled by the Company that are part of inventory are measured at their fair value less costs to sell at the point of harvest.
The Company includes borrowing costs in the cost of certain wine inventory that require a substantial period of time to become ready for sale.
All inventory is counted as close as possible to year end without impacting the operations of the Company. Management has provided an allowance for slow moving and obsolete inventory which is considered to be sufficient for potential losses.
Biological Assets
The Company measures biological assets, consisting of grape vines, at fair value less costs to sell. Agricultural produce, consisting of grapes grown on vineyards controlled by the Company, is measured at fair value less costs to sell at the point of harvest and becomes the basis for the cost of inventory after harvest.
Gains or losses arising from a change in fair value less costs to sell are included in the consolidated statement of earnings in the period in which they arise.
Goodwill
Goodwill on the purchase of Hillebrand in 1993, Vineco International Products in 1996, Brew King in 1997, Distrivin and Winexpert in 2004, Wine Not in 2005 and Cascadia, Thirty Bench and Red Rooster in 2006 and World Vintners Inc., Rocky Ridge and SWM in 2009 represents the excess of purchase price of acquired businesses over the fair value of the net assets acquired. The Company determines an impairment of goodwill based on the ability to recover the balance from expected future discounted operating cash flows or the fair value of certain asset groups if necessary.
intangible assets
Intangible assets relate to customer contracts, brands, and customer based relationships that have been acquired through recent acquisitions. Management believes that brands do not have a fixed or determinable life and, consequently, brands are not amortized but are subject to annual impairment tests based on a comparison of the carrying amount to the estimated fair market value of the brands. The amortization periods related to those intangible assets with finite lives are based on the expected duration of the contracts and relationships acquired. These intangible assets will be tested for impairment when events or circumstances arise that indicate an impairment may exist.
Fair value of financial instruments
Accounts receivable, accounts payable and accrued liabilities, and bank indebtedness are reflected in the consolidated financial statements at carrying values, which approximate fair value due to the short-term maturity of these instruments.
Long-term debt has a floating interest rate and its carrying value, as reflected in the consolidated financial statements, approximates fair value. Interest on long-term debt has been fixed through the use of an interest rate swap.
The Company purchases wine and other inventory items throughout the year. These purchases are made in United States dollars and Euros. The Company uses foreign exchange contracts as a hedge against changes in currency values. The Company’s strategy is to hedge approximately 50% - 80% of its foreign exchange requirements prior to the beginning of each fiscal quarter. The Company does not enter into foreign exchange contracts for trading or speculative purposes. Contracts are matched against forecasted purchases of inventory and other purchases in U.S. dollars and Euros.
All financial instruments are initially recorded at fair value which includes the Company’s interest rate swap and foreign exchange contracts. The Company has not designated any of its financial instruments as hedges and, accordingly, changes to the fair value of these instruments are recorded through earnings each period as a net unrealized gain or loss on derivative financial instruments.
employee Future Benefits
The Company provides defined benefit pension plans and other post-employment benefit plans to certain of its employees. The assumptions used to measure the accrued benefit obligations and benefit costs are: discount rate for measuring expenses 5.0%, discount rate for measuring liability 4.5%, expected long-term rate of return on plan assets 4.8-6.3%, and rate of compensation increase 4.0%. To measure the obligation for post-employment medical benefits, it was assumed that the health care inflation rate will be 8% in fiscal 2013 reducing by 1% each year for the next three years. The annual pension expense to provide the above described benefits is approximately $0.5 million. All actuarial gains and losses are recognized immediately in other comprehensive income (“OCI”). The corresponding change in shareholders’ equity is adjusted to retained earnings for the period. The liability recorded represents the estimated deficit position of the plans adjusted for unamortized past service credits.
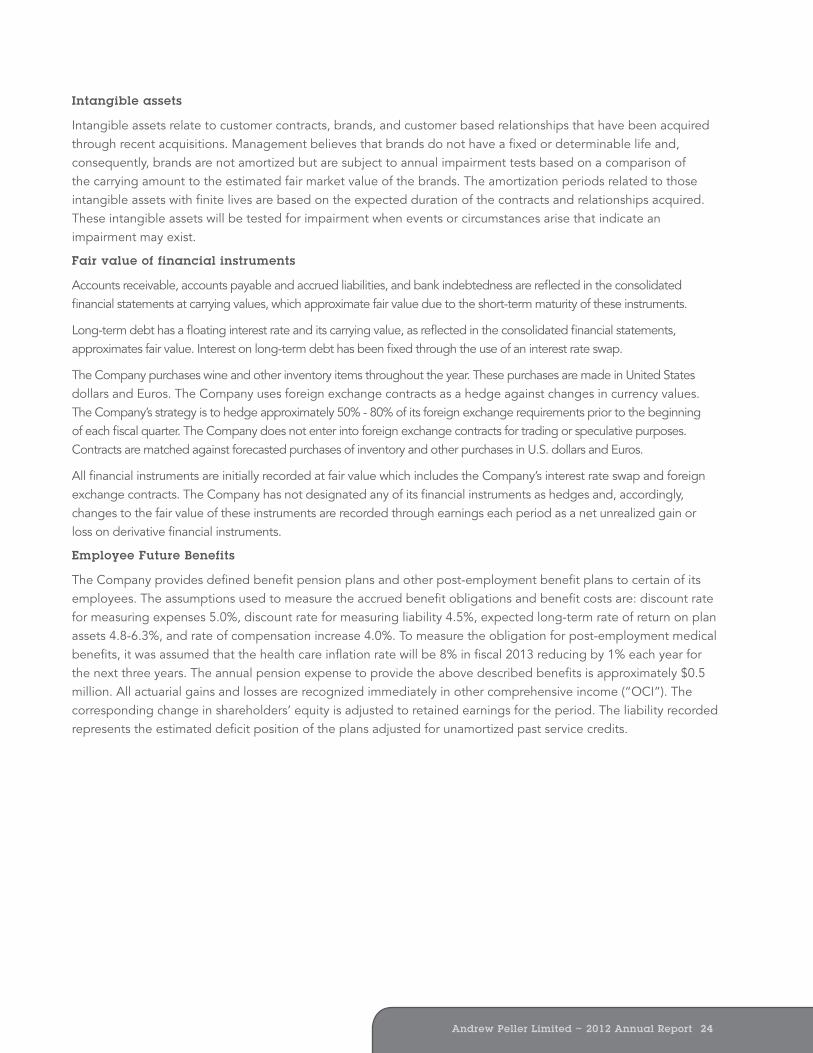

Andrew Peller Limited ~ 2012 Annual Report 2625 MANAGeMeNT’S DiSCUSSiON & ANALYSiS
Recently issued Accounting Pronouncements
In December 2011, the IASB issued amendments to IFRS 7 – Financial Instruments: Disclosures, which increase the disclosure requirements related to the offsetting of financial assets and financial liabilities. The new requirements are effective for annual periods beginning on or after January 1, 2013. The Company is currently evaluating the potential impact of this standard.
In June 2011, the IASB issued amendments to IAS 1 – Financial Statement Presentation, which require changes in the presentation of OCI, including grouping together certain items of OCI that may be reclassified to net earnings. The new requirements are effective for annual periods beginning on or after July 1, 2012. The Company is currently evaluating the potential impact of this standard.
In June 2011, the IASB issued amendments to IAS 19 – Employee Benefits, which requires changes to the recognition and disclosure of defined benefit plans, including eliminating the deferral of actuarial gains and losses, requiring that actuarial gains and losses are included in OCI and increasing disclosures on the characteristics and risks of defined benefit plans. The new requirements are effective for annual periods beginning on or after January 1, 2013. The Company is currently evaluating the potential impact of this standard.
In May 2011, the IASB issued IFRS 13 – Fair Value Measurements, which defines fair value, sets out a framework for measuring fair value and requires disclosures about fair value measurements. The standard applies when another standard requires or permits a fair value measurement. The new requirements are effective for annual periods beginning on or after January 1, 2013. The Company is currently evaluating the potential impact of this standard.
In May 2011, the IASB issued IFRS 10 – Consolidated Financial Statements, IFRS 11 – Joint Arrangements and IFRS 12 – Disclosure of Interests in Other Entities. IFRS 10 provides a single consolidation model that identifies control as the basis for consolidation for all types of entities. IFRS 10 replaces IAS 27 - Consolidated and Separate Financial Statements and SIC-12 – Consolidation - Special Purpose Entities. IFRS 11- Joint Arrangements establishes principles for the financial reporting by parties to a joint arrangement. IFRS 11 supersedes IAS 31 - Interests in Joint Ventures and SIC-13 - Jointly Controlled Entities - Non-Monetary Contributions by Venturers. IFRS 12 changes the disclosure requirements for subsidiaries, joint arrangements, associates and unconsolidated structured entities. As a consequence of these new standards, the IASB also issued amended and retitled versions of IAS 27 - Separate Financial Statements and IAS 28 - Investments in Associates and Joint Ventures. The new requirements are effective for annual periods beginning on or after January 1, 2013, with earlier application permitted. The Company is currently evaluating the potential impact of these standards.
In October 2010, the IASB issued amendments to IFRS 7 – Financial Instruments: Disclosures, which increases disclosure requirements in relation to transferred financial assets. The standard is effective for annual periods beginning on or after July 1, 2011, with earlier adoption permitted. The Company is currently evaluating the potential impact of this standard.
In November 2009, the IASB issued IFRS 9 – Financial Instruments: Classification and Measurement of Financial Assets and Financial Liabilities. In October 2010, it added requirements for financial liabilities. IFRS 9 will replace IAS 39 – Financial Instruments: Recognition and Measurement. The standard uses a single approach to determine whether a financial asset is measured at amortized cost or fair value. The approach is based on how an entity manages its financial instruments (its business model) and the contractual cash flow characteristics of the financial
assets. The new standard also requires a single impairment method to be used. For financial liabilities, the standard requires that for financial liabilities measured at fair value, any changes in an entity’s own credit risk are generally to be presented in OCI instead of net earnings. IFRS 9 is effective for annual periods beginning on or after January 1, 2015. The Company is currently evaluating the potential impact of this standard.
evaluation of Disclosure Controls and Procedures and internal Control over Financial Reporting.
Compliance with National Instrument 52-109 (“NI 52-109”) provided the Company with a review and documentation of the processes and internal controls that were in place within the organization. As a result of the review, the Company found no material weaknesses and will continue to update the review and documentation of processes and internal controls on an ongoing basis.
Disclosure Controls and Procedures
Disclosure controls and procedures are designed to provide reasonable assurance that all relevant information required to be disclosed by the Company in reports filed with or submitted to various securities regulators are recorded, processed, summarized and reported within the time periods specified. This information is gathered and reported to the Company’s management, including the President and Chief Executive Officer (“CEO”) and Chief Financial Officer (“CFO”), on a timely basis so that decisions can be made regarding the Company’s disclosure to the public.
The Company’s management, under the supervision of, and with the participation of the CEO and CFO, have designed and maintain the Company’s disclosure controls and procedures as required in Canada by “National Instrument 52-109 – Certification of Disclosure in Issuers’ Annual and Interim Filings”.
internal Controls over Financial Reporting
Internal controls over financial reporting are procedures designed to provide reasonable assurance that transactions are properly authorized, assets are safeguarded against unauthorized or improper use, and transactions are properly recorded and reported. A control system, no matter how well designed and operated, can provide only reasonable, not absolute, assurance with respect to reliability of financial reporting and financial statement preparation.
Designing, establishing and maintaining adequate internal controls over financial reporting is the responsibility of management. Internal controls over financial reporting is a process designed by, or under the supervision of senior management and effected by the Board of Directors to provide reasonable assurance regarding the reliability of financial reporting and preparation of the Company’s financial statements in accordance with IFRS.
The Company has made changes to its internal control systems related to the ongoing preparation and review of agriculture and post-employment benefits adjustments resulting from its transition to IFRS. For the year ended March 31, 2012, there have been no other material changes in the Company’s internal controls over financial reporting or changes to disclosure controls and procedures that materially affected or were likely to affect, the Company’s internal control systems.
As at June 20, 2012, the CEO and CFO of the Company have evaluated the effectiveness of the Company’s internal controls over financial reporting. Based on these evaluations, the CEO and CFO have concluded that the controls and procedures were operating effectively.
Andrew Peller Limited ~ 2012 Annual Report 2827 iNDePeNDeNT AUDiTOR’S RePORT
iNDePeNDeNT AUDiTOR’S RePORT
To the Shareholders of Andrew Peller Limited
We have audited the accompanying consolidated financial statements of Andrew Peller Limited, which comprise the consolidated balance sheets as at March 31, 2012, March 31, 2011 and April 1, 2010 and the consolidated statements of earnings, comprehensive income, changes in equity and cash flows for the years ended March 31, 2012 and March 31, 2011, and the related notes, which comprise a summary of significant accounting policies.
Management’s responsibility for the consolidated financial statements
Management is responsible for the preparation and fair presentation of these consolidated financial statements in accordance with International Financial Reporting Standards, and for such internal control as management determines is necessary to enable the preparation of consolidated financial statements that are free from material misstatement, whether due to fraud or error.
Auditor’s responsibility
Our responsibility is to express an opinion on these consolidated financial statements based on our audits. We conducted our audits in accordance with Canadian generally accepted auditing standards.Those standards require that we comply with ethical requirements and plan and perform the audits to obtain reasonable assurance about whether the consolidated financial statements are free from material misstatement.
An audit involves performing procedures to obtain audit evidence about the amounts and disclosures in the consolidated financial statements. The procedures selected depend on the auditor’s judgment, including the assessment of the risks of material misstatement of the consolidated financial statements, whether due to fraud or error. In making those risk assessments, the auditor considers internal control relevant to the entity’s preparation and fair presentation of the consolidated financial statements in order to design audit procedures that are appropriate in the circumstances, but not for the purpose of expressing an opinion on the effectiveness of the entity’s internal control. An audit also includes evaluating the appropriateness of accounting policies used and the reasonableness of accounting estimates made by management, as well as evaluating the overall presentation of the consolidated financial statements.
We believe that the audit evidence we have obtained in our audits is sufficient and appropriate to provide a basis for our audit opinion.
Opinion
In our opinion, the consolidated financial statements present fairly, in all material respects, the financial position of Andrew Peller Limited as at March 31, 2012, March 31, 2011 and April 1, 2010 and their financial performance and their cash flows for the years ended March 31, 2012 and March 31, 2011 in accordance with International Financial Reporting Standards.
Chartered Accountants, Licensed Public Accountants
Toronto, Ontario, Canada June 20, 2012
CONSOLiDATeD BALANCe SHeeTS(in thousands of Canadian dollars)
March 31, 2012 March 31, 2011 April 1, 2010
ASSETS
Current assets Accounts receivable (note 19) $ 24,937 $ 23,390 $ 22,902 Inventory (note 4) 110,256 94,692 88,818 Current portion of biological assets (note 6) 881 759 615 Prepaid expenses and other assets 1,338 818 1,818 Income taxes recoverable (note 13) - - 1,327
137,412 119,659 115,480
Property, plant and equipment (note 5) 84,490 84,744 85,133
Biological assets (note 6) 12,556 11,950 12,395
Intangibles (note 7) 13,621 14,170 14,775
Goodwill (note 8) 37,473 37,473 37,473
$ 285,552 $ 267,996 $ 265,256
LIABILITIES
Current liabilities Bank indebtedness (note 10) $ 57,495 $ 48,758 $ 48,877 Accounts payable and accrued liabilities (note 9) 37,118 33,883 28,229 Dividends payable 1,252 1,148 1,197 Income taxes payable (note 13) 40 1,000 - Current portion of derivative financial instruments (note 19) 1,272 1,894 1,922 Current portion of long-term debt (note 11) 5,366 5,333 6,158
102,543 92,016 86,383
Long-term debt (note 11) 41,456 42,720 47,633
Long-term derivative financial instruments (note 19) 1,943 1,578 1,667
Post-employment benefit obligations (note 12) 7,151 5,565 5,414
Other long-term liabilities - - 600
Deferred income taxes (note 13) 11,907 11,820 9,879
165,000 153,699 151,576
ShAREhOLDERS’ EQuITY
Capital stock (note 14) 7,026 7,026 7,375
Retained earnings 113,526 107,271 106,305
120,552 114,297 113,680
$ 285,552 $ 267,996 $ 265,256
Commitments (note 17)
John E. Peller, Director Brian J. Short, Director
The accompanying notes are an integral part of these consolidated financial statements.
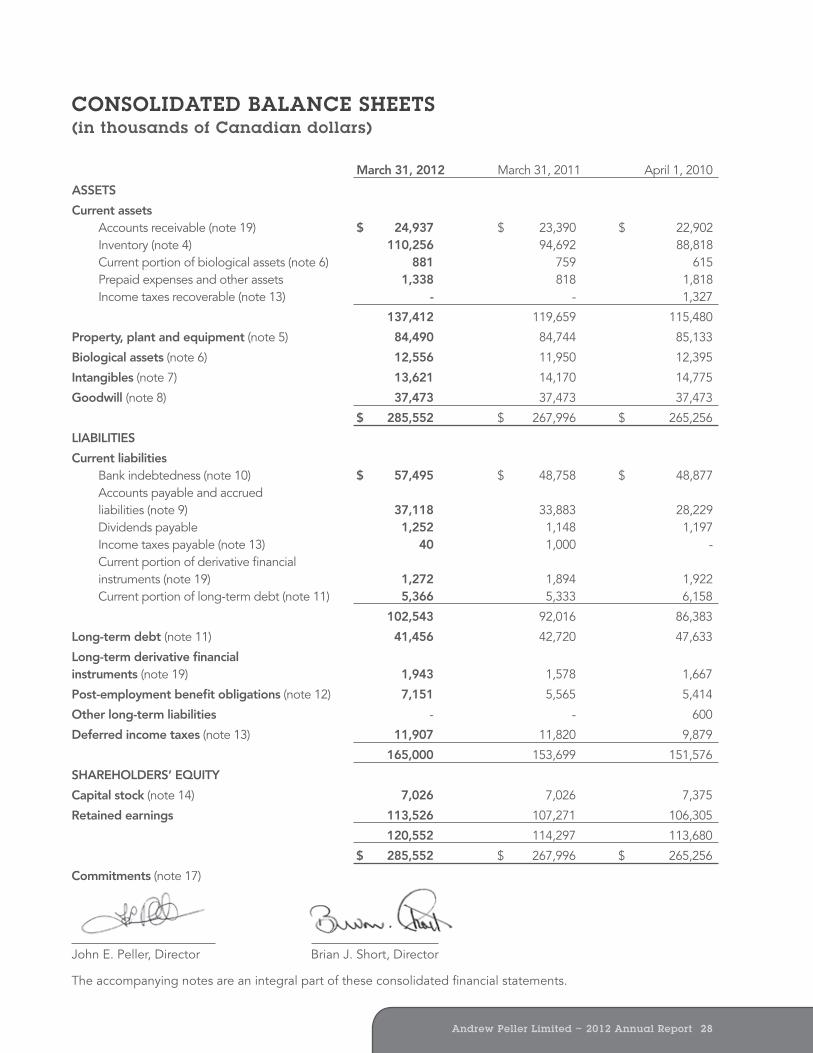

Andrew Peller Limited ~ 2012 Annual Report 3029 CONSOLiDATeD STATeMeNTS OF eARNiNGS
CONSOLiDATeD STATeMeNTS OF eARNiNGSfor the years ended March 31
(in thousands of Canadian dollars, except per share amounts)
2012 2011
Sales $ 276,883 $ 265,420 Cost of goods sold (note 15) 169,626 162,158 Amortization of plant and equipment used in production 4,826 4,667
Gross profit 102,431 98,595 Selling and administration (note 15) 74,606 71,718 Amortization of equipment and intangibles used in selling and administration 3,026 2,925 Interest 5,354 6,673
Operating earnings 19,445 17,279Net unrealized gains on derivative financial instruments (note 19) (257) (117)Other expenses (note 15) 1,163 791
Earnings before income taxes 18,539 16,605
Provision for income taxes (note 13) Current 4,841 3,223 Deferred 697 2,159
5,538 5,382
Net earnings for the year $ 13,001 $ 11,223
Net earnings per share (notes 2 and 16)
Basic and diluted Class A Shares $ 0.93 $ 0.78
Class B Shares $ 0.81 $ 0.67
The accompanying notes are an integral part of these consolidated financial statements.
CONSOLiDATeD STATeMeNTS OF COMPReNHeNSive iNCOMe for the years ended March 31
(in thousands of Canadian dollars)
2012 2011
Net earnings for the year $ 13,001 $ 11,223
Net actuarial losses on post-employment benefit plans (note 12) (2,347) (837)Deferred income taxes (note 13) 610 218
Other comprehensive loss for the year (1,737) (619)
Net comprehensive income for the year $ 11,264 $ 10,604
The accompanying notes are an integral part of these consolidated financial statements.
CONSOLiDATeD STATeMeNTS OF CHANGeS iN eQUiTYfor the years ended March 31, 2012 and 2011
(in thousands of Canadian dollars)
Total Retained shareholders’ Capital stock earnings equity
Balance at April 1, 2010 $ 7,375 $ 106,305 $ 113,680
Net earnings for the year - 11,223 11,223
Net actuarial losses (net of $218 deferred tax recovery) (note 12) - (619) (619)
Net comprehensive income for the year - 10,604 10,604
Issue price of repurchased shares (349) - (349)
Excess of repurchase price over average
per share issue price - (4,900) (4,900)
Dividends (Class A $0.330 per share, Class B $0.288 per share) - (4,738) (4,738)
Balance at March 31, 2011 $ 7,026 $ 107,271 $ 114,297
Balance at April 1, 2011 $ 7,026 $ 107,271 $ 114,297
Net earnings for the year - 13,001 13,001 Net actuarial losses (net of $610 deferred tax recovery) (note 12) - (1,737) (1,737)
Net comprehensive income for the year - 11,264 11,264Dividends (Class A $0.360 per share, Class B $0.314 per share) - (5,009) (5,009)
Balance at March 31, 2012 $ 7,026 $ 113,526 $ 120,552
The accompanying notes are an integral part of these consolidated financial statements.
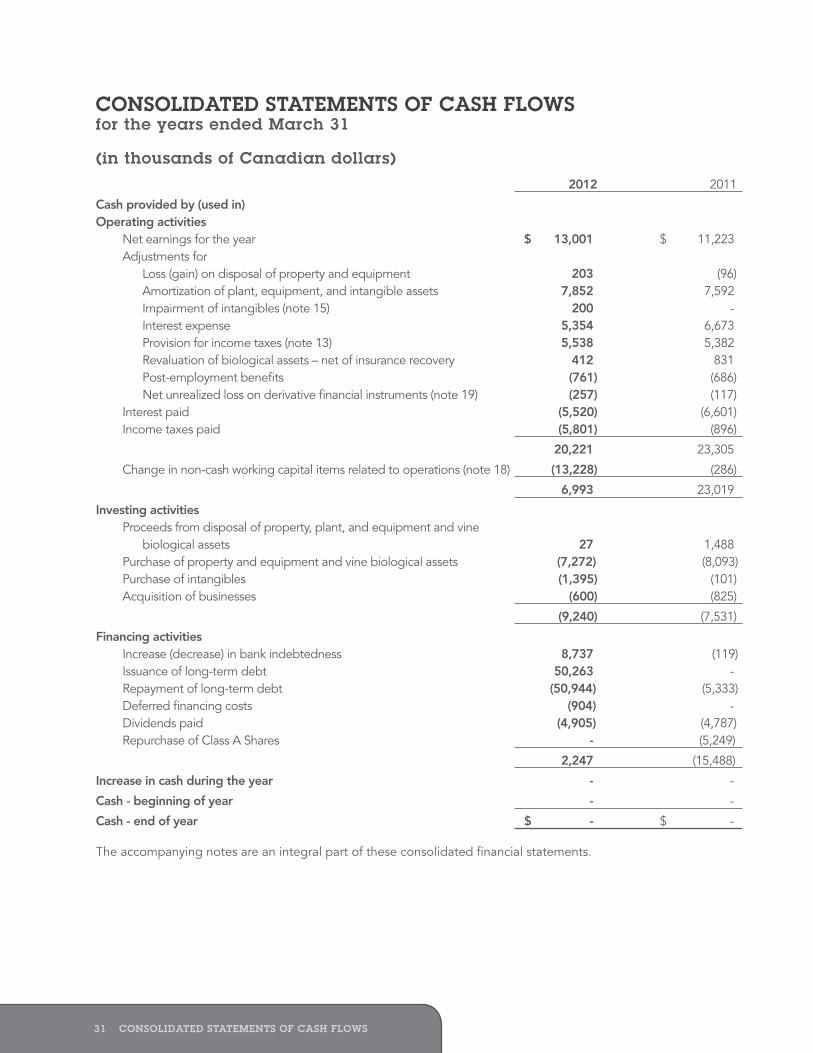
Andrew Peller Limited ~ 2012 Annual Report 3231 CONSOLiDATeD STATeMeNTS OF CASH FLOwS
CONSOLiDATeD STATeMeNTS OF CASH FLOwSfor the years ended March 31
(in thousands of Canadian dollars) 2012 2011
Cash provided by (used in) Operating activities Net earnings for the year $ 13,001 $ 11,223 Adjustments for Loss (gain) on disposal of property and equipment 203 (96) Amortization of plant, equipment, and intangible assets 7,852 7,592 Impairment of intangibles (note 15) 200 - Interest expense 5,354 6,673 Provision for income taxes (note 13) 5,538 5,382 Revaluation of biological assets – net of insurance recovery 412 831 Post-employment benefits (761) (686) Net unrealized loss on derivative financial instruments (note 19) (257) (117) Interest paid (5,520) (6,601) Income taxes paid (5,801) (896)
20,221 23,305
Change in non-cash working capital items related to operations (note 18) (13,228) (286)
6,993 23,019
Investing activities Proceeds from disposal of property, plant, and equipment and vine biological assets 27 1,488 Purchase of property and equipment and vine biological assets (7,272) (8,093) Purchase of intangibles (1,395) (101) Acquisition of businesses (600) (825)
(9,240) (7,531)
Financing activities Increase (decrease) in bank indebtedness 8,737 (119) Issuance of long-term debt 50,263 - Repayment of long-term debt (50,944) (5,333) Deferred financing costs (904) - Dividends paid (4,905) (4,787) Repurchase of Class A Shares - (5,249)
2,247 (15,488)
Increase in cash during the year - -
Cash - beginning of year - -
Cash - end of year $ - $ -
The accompanying notes are an integral part of these consolidated financial statements.
CONSOLiDATeD NOTeS TO FiNANCiAL STATeMeNTS
March 31, 2012 and 2011
(in thousands of Canadian dollars, except per share amounts)
1 Nature of operations
Andrew Peller Limited (the “Company”) produces and markets wine and wine related products. The Company’s products are produced and sold predominantly in Canada. The Company is incorporated under the Canada Business Corporations Act and is domiciled in Canada. The address of its head office is 697 South Service Road, Grimsby, Ontario L3M 4E8.
2 Significant accounting policies(A) Basis of presentation and adoption of iFRS
The Company prepares its consolidated financial statements in accordance with Canadian generally accepted accounting principles as defined in the Handbook of the Canadian Institute of Chartered Accountants (“CICA Handbook”). In 2010, the CICA Handbook was revised to incorporate International Financial Reporting Standards as issued by the International Accounting Standards Board (“IFRS”) and to require publicly accountable enterprises to apply these standards effective for years beginning on or after January 1, 2011. Accordingly, these are the Company’s first annual consolidated financial statements prepared in accordance with IFRS. In these consolidated financial statements, the term “Canadian GAAP” refers to Canadian GAAP before the adoption of IFRS.
The consolidated financial statements have been prepared in compliance with IFRS. Subject to certain transition elections and exceptions disclosed in note 23, the Company has consistently applied the accounting policies used in the preparation of its opening IFRS balance sheet at April 1, 2010 throughout all periods presented, as if these policies had always been in effect. Note 23 discloses the impact of the transition to IFRS on the Company’s reported financial position, financial performance and cash flows, including the nature and effect of significant changes in accounting policies from those used in the Company’s consolidated financial statements for the year ended March 31, 2011 prepared under Canadian GAAP.
These financial statements were approved by the Board of Directors for issue on June 20, 2012.
(B) Basis of measurement
The consolidated financial statements have been prepared under the historical cost convention, except for derivatives, which are measured at fair value and biological assets, which are measured at fair value less costs to sell.
(C) Basis of consolidation
These consolidated financial statements include the accounts of the Company and all subsidiary companies. Subsidiaries are those entities which the Company controls by having the power to govern the financial and operating policies. Subsidiaries are fully consolidated from the date on which control is obtained by the Company and are de-consolidated from the date that control ceases. Intercompany transactions, balances, income and expenses, and profits and losses are eliminated.
Andrew Peller Limited ~ 2012 Annual Report 3433 CONSOLiDATeD NOTeS TO FiNANCiAL STATeMeNTS
(D) Revenue
The Company records a sale when it has transferred the risks and rewards of ownership of the goods to the buyer; the Company has no continuing managerial involvement over the goods; it is probable that the consideration will be received by the Company; and the amount of revenue and costs related to the transaction can be measured reliably. For transactions with provincial liquor boards, licensee retail stores and wine kit retailers, the Company’s terms are “FOB shipping point”. Accordingly, sales are recorded when the product is shipped from the Company’s production facility. Sales to consumers through retail stores, winery restaurants and estate wineries are recorded when the product is purchased.
Excise taxes collected on behalf of the federal government, licensing fees and levies paid on wine sold through the Company’s independent retail stores in Ontario, product returns, breakage and discounts provided to customers are deducted from gross revenue to arrive at sales.
(e) Cost of goods sold, excluding amortization
Cost of goods sold, excluding amortization, includes the cost of finished goods inventory sold during the year, inventory writedowns and revaluations of agricultural produce to fair value less costs to sell at the point of harvest.
(F) inventory
Inventory is valued at the lower of cost and net realizable value. Cost is determined on an average cost basis. The Company utilizes a weighted average cost calculation to determine the value of ending inventory (bulk wine and finished goods). Average cost is determined separately for import wine and domestic wine and is calculated by varietal and vintage year.
Grapes produced from vineyards controlled by the Company that are part of inventory are measured at their fair value less costs to sell at the point of harvest.
The Company includes borrowing costs in the cost of certain wine inventory that requires a substantial period of time to become ready for sale.
(G) Property, plant, and equipment
Property, plant, and equipment are carried at cost less accumulated amortization. Cost includes borrowing costs for assets that require a substantial period of time to become ready for use. Amortization of buildings, vineyard infrastructure, and machinery and equipment is calculated on the straight-line basis in amounts sufficient to amortize the cost of buildings, vineyard infrastructure, and machinery and equipment over their estimated useful lives as follows:
Buildings 2.5% per year Vineyard infrastructure 5% per year Machinery and equipment 2.5% to 20% per year
Vineyard infrastructure amortization commences in the year the vineyard yields a crop that approximates 50% of expected annual production.
(H) Biological assets
The Company measures biological assets, consisting of grape vines, at fair value less costs to sell. Agricultural produce, consisting of grapes grown on vineyards controlled by the Company, is measured at fair value less cost to sell at the point of harvest and becomes the basis for the cost of inventory after harvest.
Gains or losses arising from a change in fair value less costs to sell are included in the consolidated statement of earnings in the period in which they arise.
(i) intangibles
Intangible assets include brands, customer contracts, contract co-packaging arrangements and customer-based relationships. These intangible assets are recorded at their estimated fair value on the date of acquisition.
Amortization Remaining method useful life useful life
Brands N/A Indefinite Indefinite Customer-based Straight-line 10-20 years 11-18 years Contract packaging Straight-line 10 years 7 years
Brands have been assessed as having an indefinite life because the expected usage, period of control, and other factors do not limit the life of these assets. Intangible assets with an indefinite life are not amortized but are tested for impairment at least annually, or more frequently if events or circumstances indicate that the asset might be impaired.
(J) Goodwill
Goodwill represents the cost of a business combination in excess of the fair values of the net tangible and identifiable intangible assets acquired. Goodwill is not amortized but is tested for impairment on an annual basis, or more frequently if circumstances indicate that goodwill may be impaired. The Company assigns goodwill combined with other assets to a cash generating unit (“CGU”) based on certain regions and product lines, which is the lowest level at which the combined assets generate independent cash inflows. To test for impairment the Company primarily compares a CGU’s value in use, determined based on expected future discounted cash flows, to its carrying value. If necessary, a CGU’s fair value is also considered. An impairment charge is recorded to the extent that the carrying value of a CGU exceeds the greater of the CGU’s fair value and its value in use. An impairment loss in respect of goodwill is not reversed. Management has determined that there is no impairment in goodwill for the years ended March 31, 2012 and 2011.
The Company has elected not to restate business combinations that occurred prior to its transition to IFRS. As a result, goodwill in respect of acquisitions prior to April 1, 2010 is measured at the amount recorded under previous Canadian GAAP other than as described in note 23.
Andrew Peller Limited ~ 2012 Annual Report 3635 CONSOLiDATeD NOTeS TO FiNANCiAL STATeMeNTS
(K) Post-employment benefits
The Company sponsors defined contribution pension plans, defined benefit pension plans, post-employment medical benefits plans, and other post-employment benefit plans for certain employees. Contributions to the defined contribution pension plans are recognized as an expense as services are rendered by employees. The costs of the defined benefit plans, the post-employment medical benefit plans and other post-employment benefit plans are actuarially determined and include management’s best estimate of expected plan investment performance, the interest rate on the plan obligation, salary escalation, expected retirement ages, and medical cost escalation. The liability recognized in the balance sheet in respect of these plans is the present value of the defined benefit obligation at the end of the reporting period as determined by the Company’s actuary less the fair value of plan assets adjusted for the unamortized portion of negative past service credits. The current service cost, amortization of past service credits, and the interest cost net of the expected return on plan assets are recognized in earnings in the period they arise. Adjustments arising from actuarially determined gains or losses are recognized in other comprehensive income in the period in which they arise. The corresponding change in shareholders’ equity is adjusted to retained earnings for the period.
(L) Financial instruments and hedge accounting
The Company classifies its financial instruments into the following categories: loans and receivables, liabilities at amortized cost, available-for-sale investments, and financial assets and liabilities at fair value through profit or loss.
The Company has chosen not to apply hedge accounting to any of its derivative financial instruments. As a result of this optional policy, these hedging instruments are recorded initially and subsequently at fair value and the change in the fair value is recorded directly in earnings.
The Company classifies accounts payable and accrued liabilities, dividends payable, bank indebtedness, and long-term debt as liabilities at amortized cost. Accounts payable and accrued liabilities and dividends payable are initially measured at the amount to be paid, which approximates fair value because of the short-term nature of these liabilities. Subsequently, they are measured at amortized cost. Bank indebtedness and long-term debt are measured initially at fair value, net of transaction costs incurred, and subsequently at amortized costs using the effective interest method.
Accounts receivable are classified as loans and receivables. Accounts receivable are primarily amounts due from customers from the sale of goods or the rendering of services. The Company maintains an allowance for doubtful accounts to record an estimate of credit losses. When no recovery of an amount owing is possible, the account receivable is reduced directly.
Transaction costs related to long-term debt are netted against the carrying value of the liability and are then amortized over the expected life of the instrument using the effective interest method. The Company recognizes financial instruments when it becomes a party to the terms of the instrument and has elected to use “trade date” accounting for regular way purchases and sales of financial assets.
Embedded derivatives (elements of contracts whose cash flows move independently from the host contract similar to a stand-alone derivative) are required to be separated and measured at fair values if certain criteria are met. Management reviewed its contracts and determined that the Company does not currently have any embedded derivatives in these contracts that require separate accounting and disclosure.
(M) Leases
Leases in which a significant portion of the risks and rewards of ownership are retained by the lessor are classified as operating leases. Payments made under operating leases are charged to the statement of earnings on a straight-line basis over the period the asset is used under the lease. Leases under which the Company has substantially all the risks and rewards of ownership are classified as finance leases. Finance leases are capitalized at the inception of the lease at the lower of the fair value of the leased property and the present value of the minimum lease payments. Payments on finance leases are allocated to the liability and expense so as to recognize a constant rate of interest on the remaining balance of the liability. Assets acquired under finance leases are depreciated over the shorter of their useful life and the lease term.
(N) impairment of non-financial assets
The Company reviews long-lived assets and definite life intangible assets for impairment when events or circumstances indicate that an asset may be impaired. Assets are assigned to a CGU based on the lowest level at which they generate independent cash inflows. When there is an indication of impairment, an impairment charge is recorded to the extent that the carrying value of a CGU exceeds the greater of the CGU’s fair value less costs to sell and its value in use determined by discounting expected cash flows (“recoverable amount”). An impairment loss is reversed if a CGU’s recoverable amount increases to the extent that the related assets’ carrying amounts are no larger than the amount that would have been determined, net of amortization, had no impairment loss been recorded.
(O) Net earnings per share
Basic net earnings per share has been calculated using the weighted average number of Class A and Class B Shares outstanding during the year. Diluted net earnings (loss) per share has been calculated by considering the impact of any potential ordinary shares that are dilutive on the two classes of shares when considered together.
(P) Dividends
Dividends on Class A and Class B Shares are recognized in the period in which they are formally declared by the Board of Directors.
(Q) Segmented information
The Company produces and markets wine products and other beverages in Canada. A significant portion of the Company’s sales are made to the liquor control boards in each province in which the Company transacts business. Management has concluded that based on the type of products sold and the fact that its customers are similar in nature, the Company operates in a single operating segment. In addition, a substantial portion of the Company’s sales are made in Canada. As a result, management has concluded that the Company operates in one geographic segment.

Andrew Peller Limited ~ 2012 Annual Report 3837 CONSOLiDATeD NOTeS TO FiNANCiAL STATeMeNTS
(R) income taxes
Current income tax is the expected amount of tax payable or recoverable on taxable income or loss during the period. Current income tax may also include adjustments to taxes payable or recoverable in respect of previous periods.
The Company accounts for deferred income taxes based on temporary differences, which are the differences between the carrying amount of an asset or liability and its tax base. Deferred income taxes are provided for all temporary differences between the carrying amount and tax bases of assets and liabilities except for those arising from the initial recognition of goodwill or for those arising from the initial recognition of an asset or liability in a transaction that is not a business combination and has no impact on earnings or taxable income or loss. Deferred income tax assets and liabilities are measured using the enacted or substantially enacted tax rates expected to apply to taxable income in the years in which temporary differences are expected to be recovered or settled. The deferred income tax provision (recovery) recorded in net earnings and other comprehensive income represents the change during the year in deferred income tax assets and deferred income tax liabilities.
(S) Contingencies
In the ordinary course of business activities, the Company may be contingently liable for litigation and claims. Management believes that adequate provisions have been recorded in the accounts where required. Although it is not possible to accurately estimate the extent of potential claims, if any, management believes that the ultimate resolution of such contingencies would not have a material adverse effect on the financial position of the Company.
(T) Comprehensive income (loss)
Comprehensive income (loss) is comprised of net earnings and other comprehensive income (loss) (“OCI”). OCI represents the change in equity for a period that arises from transactions that are required to be or are elected to be recognized outside of net earnings. The Company has chosen to record actuarial gains and losses on defined benefit pension plans and other post-employment benefit plans in OCI in the period incurred.
(U) equity
The Company separately presents changes in equity related to capital stock, retained earnings, and accumulated OCI in the consolidated statements of changes in equity.
(v) Recently issued accounting pronouncements
In December 2011, the IASB issued amendments to IFRS 7 – Financial Instruments: Disclosures, which increase the disclosure requirements related to the offsetting of financial assets and financial liabilities. The new requirements are effective for annual periods beginning on or after January 1, 2013. The Company is currently evaluating the potential impact of this standard.
In June 2011, the IASB issued amendments to IAS 1 – Financial Statement Presentation, which requires changes in the presentation of other comprehensive income (“OCI”) including grouping together certain items of OCI that may be reclassified to net earnings. The new requirements are effective for annual periods beginning on or after July 1, 2012. The Company is currently evaluating the potential impact of this standard.
In June 2011, the IASB issued amendments to IAS 19 – Employee Benefits, which require changes to the recognition and disclosure of defined benefit plans, including eliminating the deferral of actuarial gains and losses, requiring that actuarial gains and losses are included in OCI and increasing disclosures on the characteristics and risks of defined benefit plans. The new requirements are effective for annual periods beginning on or after January 1, 2013. The Company is currently evaluating the potential impact of this standard.
In May 2011, the IASB issued IFRS 13 – Fair Value Measurements, which defines fair value, sets out a framework for measuring fair value and requires disclosures about fair value measurements. The standard applies when another standard requires or permits a fair value measurement. The new requirements are effective for annual periods beginning on or after January 1, 2013. The Company is currently evaluating the potential impact of this standard.
In May 2011, the IASB issued IFRS 10 – Consolidated Financial Statements, IFRS 11 – Joint Arrangements and IFRS 12 – Disclosure of Interests in Other Entities. IFRS 10 provides a single consolidation model that identifies control as the basis for consolidation for all types of entities. IFRS 10 replaces IAS 27 - Consolidated and Separate Financial Statements and SIC-12 – Consolidation - Special Purpose Entities. IFRS 11- Joint Arrangements establishes principles for the financial reporting by parties to a joint arrangement. IFRS 11 supersedes IAS 31 - Interests in Joint Ventures and SIC-13 - Jointly Controlled Entities - Non-Monetary Contributions by Venturers. IFRS 12 changes the disclosure requirements for subsidiaries, joint arrangements, associates and unconsolidated structured entities. As a consequence of these new standards, the IASB also issued amended and retitled versions of IAS 27 - Separate Financial Statements and IAS 28 - Investments in Associates and Joint Ventures. The new requirements are effective for annual periods beginning on or after January 1, 2013, with earlier application permitted. The Company is currently evaluating the potential impact of these standards.
In December 2010, the IASB issued an amendment to IAS 12 – Income Taxes, which introduces an exception to the requirement to measure the deferred tax assets or liabilities arising on an investment property measured at fair value based on its expected manner of recovery. The new requirements are effective for annual periods beginning on or after January 1, 2012. The Company is currently evaluating the potential impact of this standard.
In October 2010, the IASB issued amendments to IFRS 7 – Financial Instruments: Disclosures, which increases disclosure requirements in relation to transferred financial assets. The standard is effective for annual periods beginning on or after July 1, 2011, with earlier adoption permitted. The Company is currently evaluating the potential impact of this standard.
In November 2009, the IASB issued IFRS 9 – Financial Instruments: Classification and Measurement of Financial Assets and Financial Liabilities. In October 2010, it added requirements for financial liabilities. IFRS 9 will replace IAS 39 – Financial Instruments: Recognition and Measurement. The standard uses a single approach to determine whether a financial asset is measured at amortized cost or fair value. The approach is based on how an entity manages its financial instruments (its business model) and the contractual cash flow characteristics of the financial assets. The new standard also requires a single impairment method to be used. For financial liabilities, the standard requires that for financial liabilities measured at fair value, any changes in an entity’s own credit risk are generally to be presented in OCI instead of net earnings. IFRS 9 is effective for annual periods beginning on or after January 1, 2015. The Company is currently evaluating the potential impact of this standard.
Andrew Peller Limited ~ 2012 Annual Report 4039 CONSOLiDATeD NOTeS TO FiNANCiAL STATeMeNTS
3 Critical accounting estimates and judgments
The preparation of consolidated financial statements in accordance with IFRS requires management to make estimates and assumptions that affect the reported amounts of assets and liabilities at the date of the consolidated financial statements, the reported amounts of revenues and expenses during the reporting period, and the extent of and the reported amounts in disclosures. Actual results may vary from current estimates. These estimates are reviewed periodically and, as adjustments become necessary, are recorded in the period in which they change. Specific areas of uncertainty include but are not limited to:
impairment of goodwill
Testing goodwill for impairment at least annually involves estimating the recoverable amount of the CGUs to which goodwill is allocated. This requires making assumptions about future cash flows, growth rates, market conditions, and discount rates which are inherently uncertain.
Post-employment benefits
Measuring the liability for post-employment benefits uses assumptions for the discount rates, increases in compensation, increases in medical costs, and timing of the payment of benefits. Actual amounts could vary significantly from these assumptions.
Fair value of biological assets
Determining the fair value of grape vines involves making assumptions about how market participants assign the value of a vineyard between vines, land, and other assets. The fair value of vineyards at April 1, 2010 was determined by an accredited appraiser and a portion of this fair value was in respect of vines. Changes in the fair value of vines may occur as a result of changes in numerous factors, including, vine health and expected future yields.
To estimate the fair value of controlled vines planted on leased land, discounted cash flows over the estimated remaining life of vines or the remaining lease term, whichever is shorter, were used. The fair value of vines on leased land reduces to $nil as the lease nears its expiration date. Assumptions used include the discount rate, expected yields, grape price trends, and annual growing cost trends.
To estimate the fair value of vines in the middle and later stages of development, the estimated fair value of mature vines was reduced by the net discounted cash outflows necessary to bring the vines to a fully developed state.
Fair value of grapes at the point of harvest
Where possible, the fair value of grapes at the point of harvest is determined by reference to local market prices for grapes of a similar quality and the same varietal. For grapes for which local market prices are not readily available, the average price of similar grapes is used.
4 inventory March 31, March 31, April 1,
2012 2011 2010
Packaging materials and supplies $ 10,624 $ 8,213 $ 8,957 Bulk wine 61,389 50,709 49,912 Finished goods 38,243 35,770 29,949
$ 110,256 $ 94,692 $ 88,818
Interest included in the cost of inventory $ 986 $ 800 $ 941
Inventory write-downs recognized as an expense amounted to $1,663 (2011 - $1,357).
The cost of inventory recognized as an expense and included in cost of goods sold, excluding amortization was $167,963 (2011 - $160,801).
5 Property, plant, and equipment Vineyard
land and Machinery Land infrastructure Buildings and equipment Total
At April 1, 2010 Cost $ 4,807 $ 25,742 $ 39,193 $ 76,032 $ 145,774 Accumulated amortization - (3,257) (11,326) (46,058) (60,641)
Net carrying amount $ 4,807 $ 22,485 $ 27,867 $ 29,974 $ 85,133
Year ended March 31, 2011 Additions $ - $ 127 $ 680 $ 6,258 $ 7,065 Disposals - (458) - (110) (568) Amortization - (531) (1,166) (5,189) (6,886)
Closing net carrying amount $ 4,807 $ 21,623 $ 27,381 $ 30,933 $ 84,744
At March 31, 2011 Cost $ 4,807 $ 25,390 $ 39,872 $ 81,634 $ 151,703 Accumulated amortization - (3,767) (12,491) (50,701) (66,959)
Net carrying amount $ 4,807 $ 21,623 $ 27,381 $ 30,933 $ 84,744
Year ended March 31, 2012 Additions $ - $ 26 $ 600 $ 6,458 $ 7,084 Disposals - (42) - (188) (230) Amortization - (574) (1,131) (5,403) (7,108)
Closing net carrying amount $ 4,807 $ 21,033 $ 26,850 $ 31,800 $ 84,490
At March 31, 2012 Cost $ 4,807 $ 25,361 $ 40,472 $ 87,261 $ 157,901 Accumulated amortization - (4,328) (13,622) (55,461) (73,411)
Net carrying amount $ 4,807 $ 21,033 $ 26,850 $ 31,800 $ 84,490
Included in vineyard infrastructure are assets amounting to $nil (2011 - $nil; April 1, 2010 - $5,661) that are under development and are not being amortized.
Contractual commitments to purchase property, plant, and equipment were $5,411 at March 31, 2012.

Andrew Peller Limited ~ 2012 Annual Report 4241 CONSOLiDATeD NOTeS TO FiNANCiAL STATeMeNTS
6 Biological assets
Biological assets consist of grape vines and grapes prior to harvest that are controlled by the Company. The Company owns and leases land in Ontario and British Columbia to grow grapes in order to secure a supply of quality grapes for the making of wine.
At March 31, 2012, the Company held grape vines planted on 762 acres of land (2011 – 762; April 1, 2010 – 768). During the year ended March 31, 2012, the Company harvested 1,990 tonnes of grapes (2011 – 1,029) valued at $4,521 (2011 - $3,098).
The changes in the carrying amount of biological assets are as follows:
2012 2011 $ $
Carrying amount – beginning of year $ 12,709 $ 13,010
Net increase in fair value less costs to sell due to biological
transformation, prices, and other changes 4,258 1,723 Decrease in fair value less costs to sell of vines on leased land (27) (26) Transferred to inventory upon harvest (4,521) (3,098)
Net gains (losses) from changes in fair value less costs to sell (290) (1,401)
12,419 11,609 Purchases of vines 1,018 1,210 Disposal of vines - (110)
Carrying amount – end of year 13,437 12,709 Current portion of biological assets (881) (759)
Biological assets $ 12,556 $ 11,950
The significant assumptions used to determine the fair value of vines planted on leased land are as follows:
March 31, March 31, April 1, 2012 2011 2010
Yield 3-5 tonnes per acre 3-5 tonnes per acre 3-5 tonnes per acre Discount rate 10 - 12% 10 - 12% 10 - 12% Inflation rate 2.0% 2.0% 2.0% Annual vineyard operating costs $5 to $7 per acre $5 to $7 per acre $5 to $7 per acre
The Company is exposed to financial risk because of the long period of time between the cash outflow required to plant grape vines, cultivate vineyards, and harvest grapes and the cash inflow from selling wine and related products from the harvested grapes. To ensure the Company has access to sufficient cash to meet its obligations, the Company has negotiated sufficient credit facilities to meet its needs. In addition, the Company regularly monitors working capital requirements and cash budgets.
Substantially all of the grapes from owned and leased vineyards are used in the Company’s winemaking processes. Owned and leased vineyards, in combination with supply contracts with grape growers, are used to secure a supply of domestically grown premium quality grapes. These strategies reduce the financial risks associated with changes in grape prices.
7. intangibles Customer- Brands – based indefinite intangible Contract life assets packaging Other Total
At April 1, 2010
Cost $ 3,800 $ 10,259 $ 1,100 $ 2,665 $ 17,824 Accumulated amortization and impairment - (1,884) (192) (973) (3,049)
Net carrying amount $ 3,800 $ 8,375 $ 908 $ 1,692 $ 14,775
Year ended March 31, 2011 Additions $ - $ - $ - $ 101 $ 101 Amortization - (582) (124) - (706)
Closing net carrying amount $ 3,800 $ 7,793 $ 784 $ 1,793 $ 14,170
At March 31, 2011 Cost $ 3,800 $ 10,259 $ 1,100 $ 2,766 $ 17,925 Accumulated amortization and impairment - (2,466) (316) (973) (3,755)
Net carrying amount $ 3,800 $ 7,793 $ 784 $ 1,793 $ 14,170
Year ended March 31, 2012 Additions $ 375 $ 888 $ - $ 132 $ 1,395 Transfer - - - (1,000) (1,000) Impairment (200) - - - (200) Amortization - (634) (110) - (744)
Closing net carrying amount $ 3,975 $ 8,047 $ 674 $ 925 $ 13,621
At March 31, 2012 Cost $ 4,175 $ 11,147 $ 1,100 $ 1,898 $ 18,320 Accumulated amortization and impairment (200) (3,100) (426) (973) (4,699) Net carrying amount $ 3,975 $ 8,047 $ 674 $ 925 $ 13,621

Andrew Peller Limited ~ 2012 Annual Report 4443 CONSOLiDATeD NOTeS TO FiNANCiAL STATeMeNTS
8 Goodwill March 31, March 31, April 1,
2012 2011 2010
Gross amount $ 37,473 $ 37,473 $ 37,608 Accumulated impairment losses - - 135
$ 37,473 $ 37,473 $ 37,473
The change in goodwill during the year ended March 31, 2011 is as a result of the disposal of a subsidiary with goodwill that was fully impaired.
In order to test goodwill for impairment, the Company allocates the carrying value of goodwill to CGUs based on the lowest level that goodwill is monitored for internal management purposes. The aggregate carrying amount of goodwill allocated to each unit is as follows:
March 31, March 31, April 1, 2012 2011 2010
Ontario and Eastern Canadian wine $ 3,134 $ 3,134 $ 3,134 Western Canadian wine 10,530 10,530 10,530 Personal winemaking products 23,809 23,809 23,809
$ 37,473 $ 37,473 37,473
The Company determined the recoverable amount of the related CGUs by estimating their value in use. Key assumptions used are:
March 31, March 31, April 1, 2012 2011 2010
Pre-tax discount rate 10% 11% 11% Period of projected cash flows 5 years 5 years 5 years Growth rate beyond period of projected cash flows 4% 4% 4%
The Company uses past experience and current expectations about future performance in projecting cash flows, which are based on financial budgets for five years. For the period after five years, the Company projects cash flows using an assumed growth rate, which is based on expectations about long-term economic growth in Canada and any known industry specific factors that may influence long-term growth in the Canadian wine industry. The discount rate is estimated by referring to external sources of information about the cost of capital and leverage of companies that operate in a similar industry to the Company and that are of similar size. The rate determined is then adjusted to a pre-tax basis.
9 Accounts payable and accrued liabilities
March 31, March 31, April 1, 2012 2011 2010
Trade payables $ 28,464 $ 23,284 $ 19,110 Accrued liabilities 8,654 10,599 9,119
$ 37,118 $ 33,883 $ 28,229
10 Bank indebtedness
On September 16, 2011, the Company entered into a new operating loan facility. Significant terms of this facility and the previous short-term loan facility are summarized below. The floating rates are stated in relation to the one to six month Canadian Dealer Offered Rate (“CDOR”) and the Bank of Montreal prime rate (“Prime”).
March 31, March 31, April 1, 2012 2011 2010
Bank indebtedness $ 57,495 $ 48,758 $ 48,887
Significant terms
Committed until September 16, 2015 August 26, 2011 November 9, 2010
Borrowing limit $80,000 $75,000 $75,000 Interest rate CDOR + 1.75% Prime + 2.00% Prime + 2.75% Unused amount $24,162 $20,143 $19,409
11 Long-term debt March 31, March 31, April 1,
2012 2011 2010
Term loan, maturing September 16, 2015 $ 47,333 $ - $ - Other 264 - - Term loan, maturing April 30, 2015 - 48,278 53,611 Note payable - - 825
47,597 48,278 54,436 Less: Financing costs 775 225 645
46,822 48,053 53,791 Less: Current portion 5,366 5,333 6,158
$ 41,456 $ 42,720 $ 47,633
On September 16, 2011, the Company entered into a new long-term debt facility. The loan matures on September 16, 2015 and is repayable in monthly principal payments of $444 plus interest prior to maturity. On November 1, 2011, the Company modified its interest rate swap, which effectively fixes the interest rate until August 31, 2015 at 3.98% plus a premium of 1.75%, based on leverage, or 5.73%. The Company and its subsidiaries have provided their assets as security for this loan.
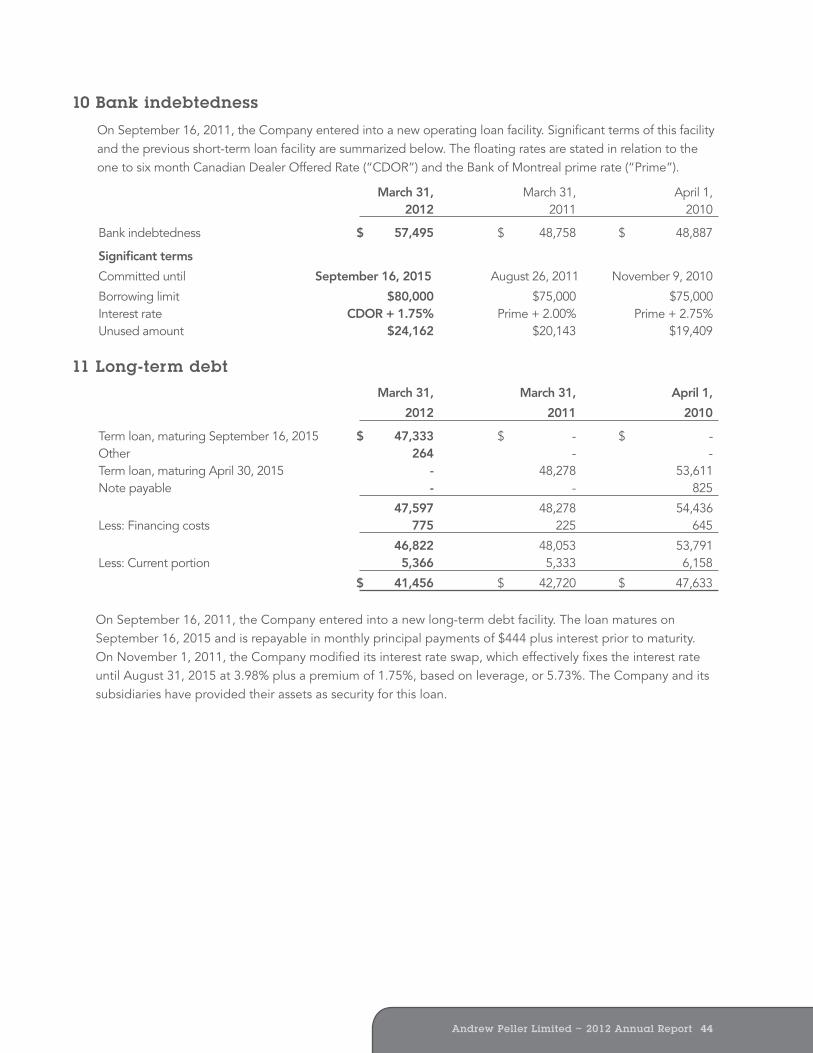
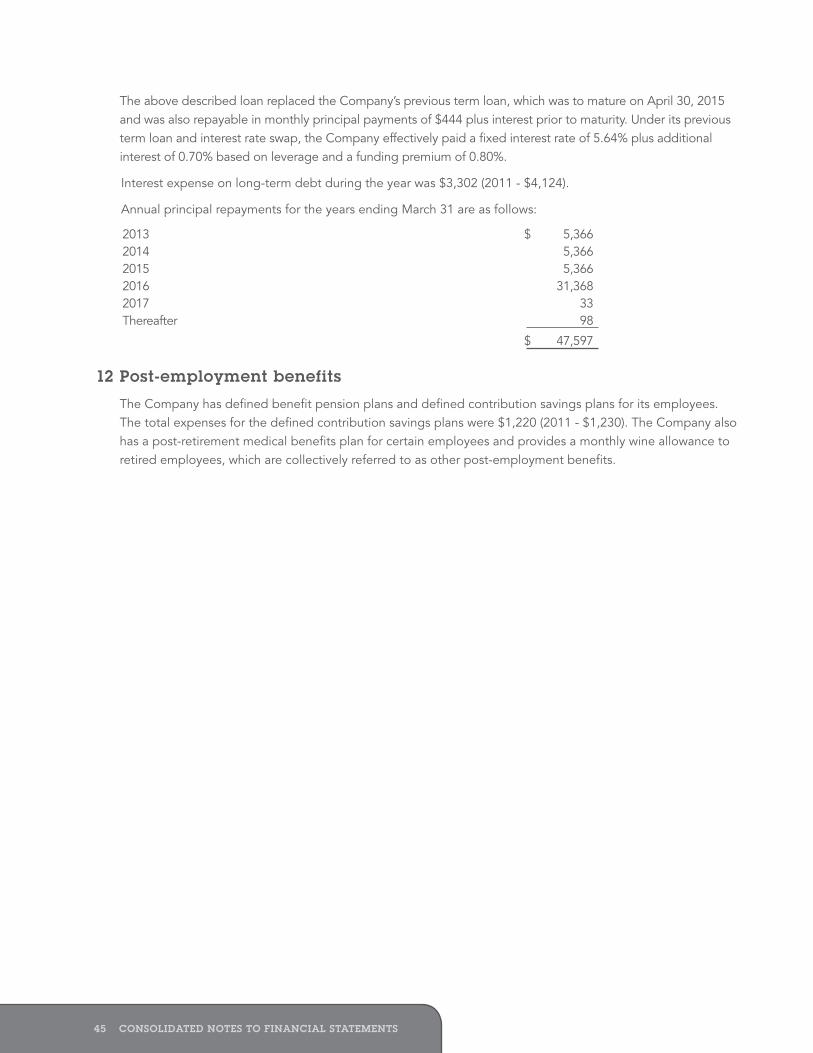
Andrew Peller Limited ~ 2012 Annual Report 4645 CONSOLiDATeD NOTeS TO FiNANCiAL STATeMeNTS
The above described loan replaced the Company’s previous term loan, which was to mature on April 30, 2015 and was also repayable in monthly principal payments of $444 plus interest prior to maturity. Under its previous term loan and interest rate swap, the Company effectively paid a fixed interest rate of 5.64% plus additional interest of 0.70% based on leverage and a funding premium of 0.80%.
Interest expense on long-term debt during the year was $3,302 (2011 - $4,124).
Annual principal repayments for the years ending March 31 are as follows:
2013 $ 5,366 2014 5,366 2015 5,366 2016 31,368 2017 33 Thereafter 98
$ 47,597
12 Post-employment benefits
The Company has defined benefit pension plans and defined contribution savings plans for its employees. The total expenses for the defined contribution savings plans were $1,220 (2011 - $1,230). The Company also has a post-retirement medical benefits plan for certain employees and provides a monthly wine allowance to retired employees, which are collectively referred to as other post-employment benefits.
Information about the funded defined benefit pension plans and the unfunded other post-employment benefits plans is as follows:
2012
Other post- Pension employment benefits benefits Total
Plan assets Fair value - beginning of year $ 16,178 $ - $ 16,178 Expected return on plan assets 977 - 977 Actuarial gains (losses) (1,353) - (1,353) Company’s contributions 1,222 75 1,297 Employees’ contributions 3 - 3 Benefits paid (951) (75) (1,026)
Fair value - end of year $ 16,076 $ - $ 16,076
Plan obligations Accrued benefit obligations - beginning of year $ 19,366 $ 1,810 $ 21,176 Employees’ contributions 3 - 3 Total current service cost 476 58 534 Interest cost 969 91 1,060 Benefits paid (951) (75) (1,026) Actuarial losses (gains) 812 182 994
Accrued benefit obligations - end of year 20,675 2,066 22,741
Funded Status Plan deficits 4,599 2,066 6,665 Unamortized past service credits from amendment to post-employment medical benefits plan - 486 486
Accrued benefit liability $ 4,599 $ 2,552 $ 7,151
Benefit plan expense Current service cost $ 476 $ 58 $ 534 Interest cost 969 91 1,060
Expected return on plan assets (977) - (977) Employees’ contributions (3) - (3) Amortization of past service credits - (81) (81)
Net benefit plan expense $ 465 $ 68 $ 533
Amount recognized in other comprehensive income Net actuarial loss (gain) $ 2,165 $ 182 $ 2,347
Actual return (loss) on plan assets $ (376) $ - $ (376)
Experience adjustments Plan assets $ (1,353) $ - $ (1,353)
Plan liabilities (812) (182) (994)
$ (2,165) $ (182) $ (2,347)
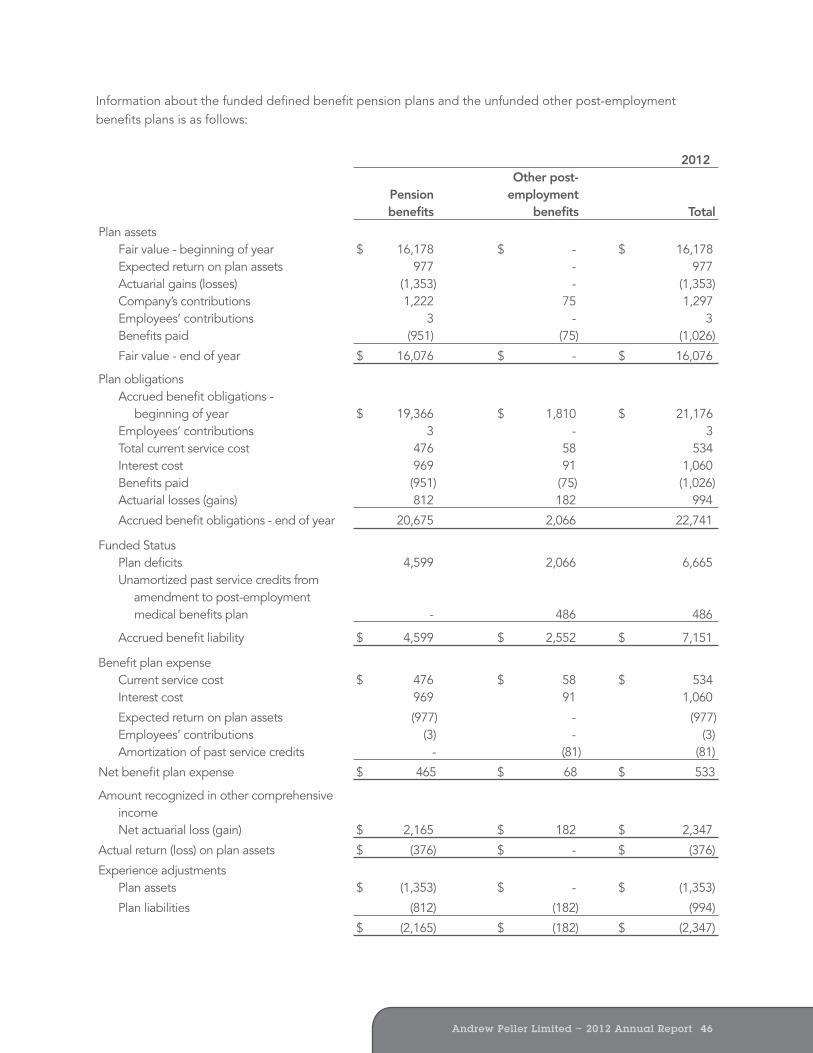
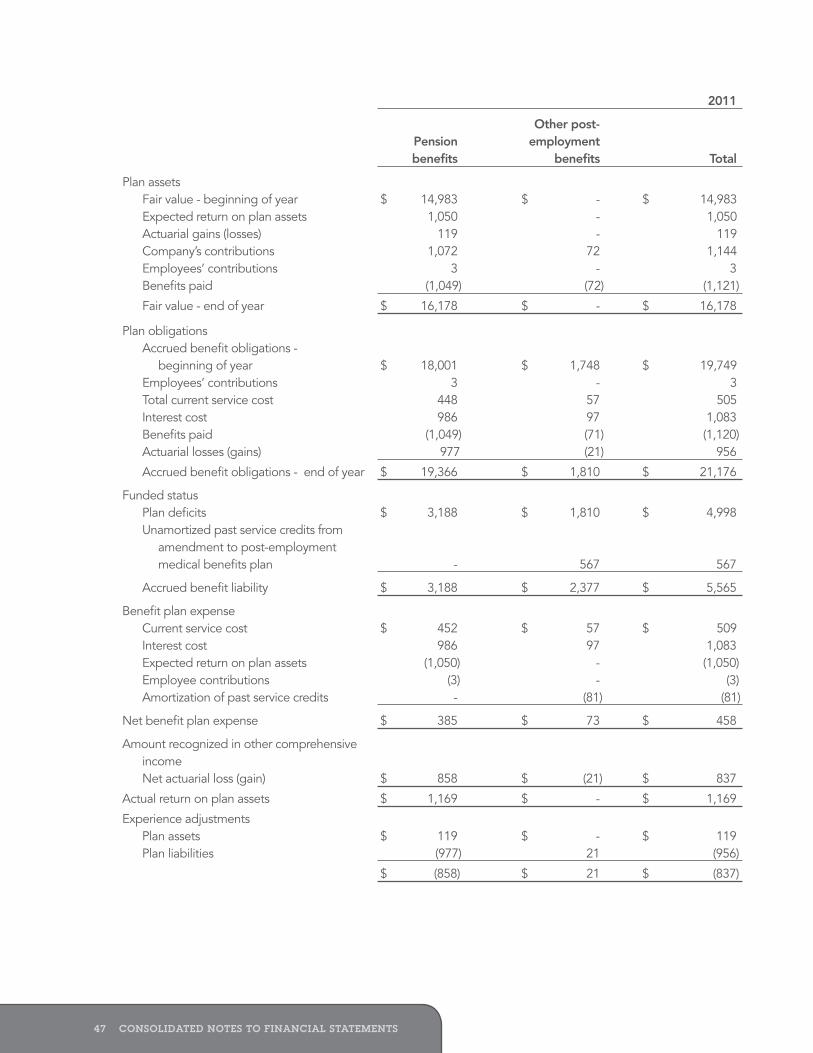
Andrew Peller Limited ~ 2012 Annual Report 4847 CONSOLiDATeD NOTeS TO FiNANCiAL STATeMeNTS
2011
Other post- Pension employment benefits benefits Total
Plan assets Fair value - beginning of year $ 14,983 $ - $ 14,983 Expected return on plan assets 1,050 - 1,050 Actuarial gains (losses) 119 - 119 Company’s contributions 1,072 72 1,144 Employees’ contributions 3 - 3 Benefits paid (1,049) (72) (1,121)
Fair value - end of year $ 16,178 $ - $ 16,178
Plan obligations Accrued benefit obligations - beginning of year $ 18,001 $ 1,748 $ 19,749 Employees’ contributions 3 - 3 Total current service cost 448 57 505 Interest cost 986 97 1,083 Benefits paid (1,049) (71) (1,120) Actuarial losses (gains) 977 (21) 956
Accrued benefit obligations - end of year $ 19,366 $ 1,810 $ 21,176
Funded status Plan deficits $ 3,188 $ 1,810 $ 4,998 Unamortized past service credits from amendment to post-employment medical benefits plan - 567 567
Accrued benefit liability $ 3,188 $ 2,377 $ 5,565
Benefit plan expense Current service cost $ 452 $ 57 $ 509 Interest cost 986 97 1,083 Expected return on plan assets (1,050) - (1,050) Employee contributions (3) - (3) Amortization of past service credits - (81) (81)
Net benefit plan expense $ 385 $ 73 $ 458
Amount recognized in other comprehensive income Net actuarial loss (gain) $ 858 $ (21) $ 837
Actual return on plan assets $ 1,169 $ - $ 1,169
Experience adjustments Plan assets $ 119 $ - $ 119 Plan liabilities (977) 21 (956)
$ (858) $ 21 $ (837)
April 1, 2010
Other post- Pension employment benefits benefits Total
Accrued benefit obligations $ 18,001 $ 1,748 $ 19,749 Plan assets at fair value 14,983 - 14,983 Unamortized past service credits - 648 648
Accrued benefit liability $ 3,018 $ 2,396 $ 5,414
The significant actuarial assumptions adopted in measuring the Company’s accrued benefit obligations and benefits costs are as follows:
March 31, March 31, April 1, 2012 2011 2011
Discount rate for expenses 5.0% 5.5% N/A Discount rate for obligations 4.5% 5.0% 5.5% Expected long-term rate of return on plan assets 4.8 – 6.3% 7.0% N/A Rate of compensation increase 4% 4 – 5% 4 – 5% Rate of medical cost increases 8% decreasing 9% decreasing 10% decreasing to 5% after to 5% after to 5% after 3 years 4 years 5 years Retirement age 60 – 65 years 60 – 65 years 60 – 65 years
To determine the expected long-term rate of return on plan assets, a weighted average of the expected returns of each asset category is used. The calculation is weighted based on the proportion of assets expected to be held by the plans in each asset category.
An increase of one percent in the assumed rate of medical cost increases would lead to an increase in the aggregate of the current service cost and interest cost component of the benefit plan expense of $3 (2011 - $3) and an increase in the accrued benefit obligation of $62 (2011 - $56). A decrease of one percent in the assumed rate of medical cost increases would lead to a decrease in the aggregate of the current service cost and interest cost component of the benefit plan expense of $3 (2011 - $3) and a decrease in the accrued benefit obligation of $55 (2011 - $50).
At March 31, 2012, the accumulated actuarial losses recognized in OCI were $3,184 (2011 - $837).
Plan assets
The plan assets consist of the following:
March 31, March 31, April 1, 2012 2011 2010 % % %
Mutual funds Fixed income 55 - - Equity 20 - - Balanced 25 100 100
100 100 100
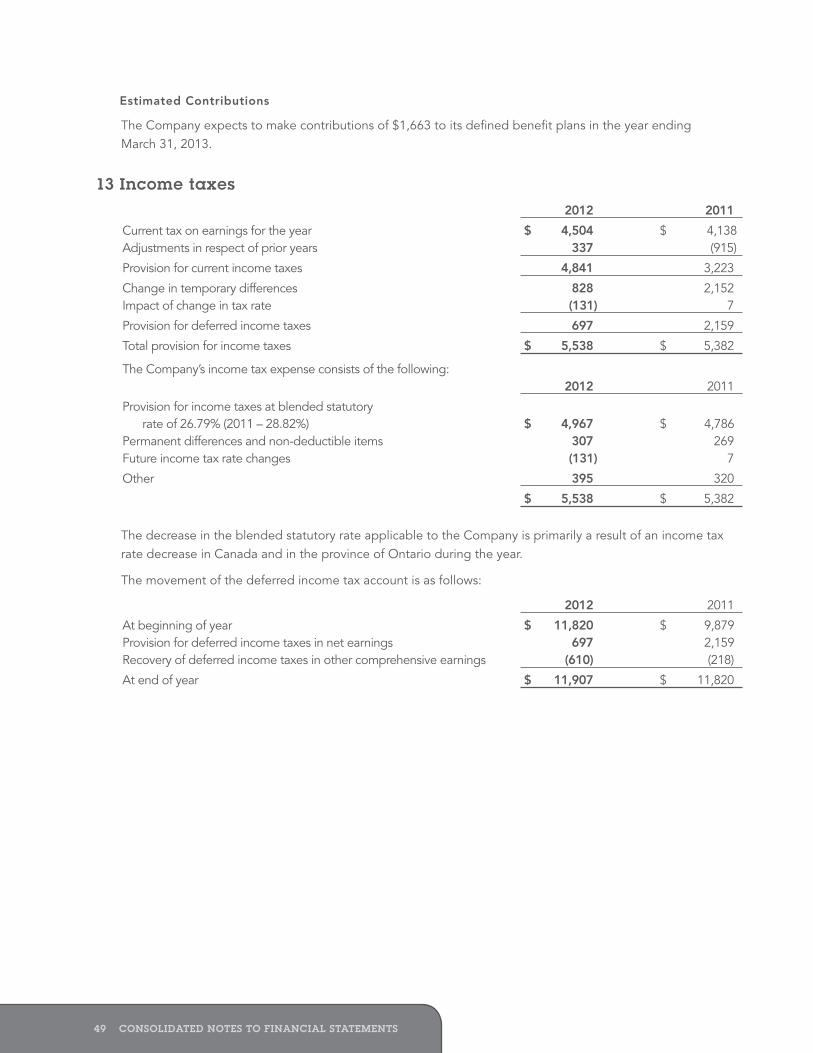
Andrew Peller Limited ~ 2012 Annual Report 5049 CONSOLiDATeD NOTeS TO FiNANCiAL STATeMeNTS
Estimated Contributions
The Company expects to make contributions of $1,663 to its defined benefit plans in the year ending March 31, 2013.
13 income taxes 2012 2011
Current tax on earnings for the year $ 4,504 $ 4,138 Adjustments in respect of prior years 337 (915)
Provision for current income taxes 4,841 3,223
Change in temporary differences 828 2,152 Impact of change in tax rate (131) 7
Provision for deferred income taxes 697 2,159
Total provision for income taxes $ 5,538 $ 5,382
The Company’s income tax expense consists of the following: 2012 2011
Provision for income taxes at blended statutory rate of 26.79% (2011 – 28.82%) $ 4,967 $ 4,786 Permanent differences and non-deductible items 307 269 Future income tax rate changes (131) 7
Other 395 320
$ 5,538 $ 5,382
The decrease in the blended statutory rate applicable to the Company is primarily a result of an income tax rate decrease in Canada and in the province of Ontario during the year.
The movement of the deferred income tax account is as follows:
2012 2011
At beginning of year $ 11,820 $ 9,879 Provision for deferred income taxes in net earnings 697 2,159 Recovery of deferred income taxes in other comprehensive earnings (610) (218)
At end of year $ 11,907 $ 11,820
The significant temporary differences giving rise to the deferred income tax liability are comprised of the following:
Deferred income tax liability
Accelerated tax depreciation and Accelerated deductions tax on property, deductions Tax plant, and Biological on deductions equipment assets intangibles on goodwill Total
April 1, 2010 $ 6,585 $ 2,688 $ 2,975 $ 2,443 $ 14,691 Provision (recovery) in net earnings 177 (251) (174) 170 (78)
March 31, 2011 6,762 2,437 2,801 2,613 14,613 Provision (recovery) in net earnings (42) 353 (217) 186 280
March 31, 2012 $ 6,720 $ 2,790 $ 2,584 $ 2,799 $ 14,893
Deferred income tax asset
Fair value Post- Loss carry change on employment forwards derivatives benefits Other Total April 1, 2010 $ (2,308) $ (949) $ (1,381) $ (174) $ (4,812) Provision (recovery) in net earnings 2,165 60 174 (162) 2,237 Recovery in other comprehensive income - - (218) - (218)
March 31, 2011 (143) (889) (1,425) (336) (2,793) Provision (recovery) in net earnings (8) 77 229 119 417 Recovery in other comprehensive income - - (610) - (610)
March 31, 2012 $ (151) $ (812) $ (1,806) $ (217) $ (2,986)
Changes to statutory income tax rates have been announced in British Columbia and Ontario. The Company estimates that these changes will increase the deferred income tax liability by approximately $600 when the related legislation is introduced.

Andrew Peller Limited ~ 2012 Annual Report 5251 CONSOLiDATeD NOTeS TO FiNANCiAL STATeMeNTS
14 Capital stock March 31, 2012 March 31, 2011 April 1, 2010 Authorized Issued Issued Issued Shares Amount Shares Amount Shares Amount
Class A Shares, non-voting Unlimited 11,293,829 $ 6,626 11,293,829 $ 6,626 11,888,241 $ 6,975 Class B Shares, voting Unlimited 3,004,041 400 3,004,041 400 3,004,041 400
14,297,870 $ 7,026 14,297,870 $ 7,026 14,892,282 $ 7,375
During 2011, the Company repurchased 594,412 Class A Non-Voting Shares through a normal course issuer bid. The repurchase price was first allocated to capital stock based on the average per share carrying amount of Class A Shares. The remaining amount was allocated to retained earnings. A summary of the transaction in Class A Shares is as follows:
2012 2011 Shares Amount Shares Amount Shares outstanding at the beginning of year 11,293,829 $ 6,626 11,888,241 $ 6,975 Repurchase - - (594,412) (5,249) Excess of repurchase price over average per share issue price - - - 4,900 11,293,829 $ 6,626 11,293,829 $ 6,626
All of the issued Class A and Class B Shares are fully paid and have no par value.
Class A Shares are non-voting and are entitled to a dividend in an amount equal to 115% of any dividend paid or declared on Class B Shares. Class B Shares are voting and convertible into Class A Shares on a one-for-one basis.
Quarterly dividends of $0.0900 (previously $0.0825) per Class A Share and $0.0785 (previously $0.0720) per Class B Share were approved by the Board of Directors on June 8, 2011 and are formally declared in each quarter. Dividend payments are reviewed at least annually by the Board of Directors.
The authorized share capital of the Company also consists of an unlimited number of Preference Shares, issuable in one or more series, of which 33,315 are designated as Preference Shares, Series A. As at March 31, 2012 and 2011 and April 1, 2010, there were no Preference Shares issued or outstanding.
Stock purchase plan
The Company’s full-time salaried, certain hourly employees, and directors participate in a Company-sponsored stock purchase plan. Under the terms of the plan, employees can purchase a certain number of Class A Shares on an annual basis. Employees are required to pay 67% of an established market price per Class A Share. Directors can purchase 750 Class A Shares and are required to pay 50% of the cost. The Company is responsible for the remainder of the cost and, during 2012, expensed $219 (2011 - $215) related to this program. Officers of the Company also participate in an Equity Incentive Program, where Class A Shares of the Company are purchased on their behalf from the open market.
15 Nature of expenses
The nature of the expenses included in selling and administration and cost of goods sold, excluding amortization are as follows:
2012 2011
Raw materials and consumables $ 134,213 $ 128,495 Employee compensation and benefits 53,104 51,222 Advertising, promotion, and distribution 27,652 26,581 Occupancy 9,550 9,214 Repairs and maintenance 5,960 5,762 Other external charges 13,753 12,602
$ 244,232 $ 233,876
Other expenses (income) are as follows:
2012 2011
Revaluation of vines (a) $ 411 $ 1,171 Ongoing maintenance costs related to Port Moody winery facility (b) 185 189 Impairment on intangibles (c) 200 - Change in estimated payroll taxes and benefits (d) 367 Change in estimated disposal costs to complete the sale of Granville Island Brewing Company Ltd. and Mainland Beverage Distribution Ltd. (e) - (260) Gain on sale of vineyard (f) - (309)
$ 1,163 $ 791
a) Changes in the fair value less costs to sell of vines included in biological assets are included in the revaluation of vine biological assets shown above. During fiscal 2011, it became evident that approximately 98 acres of vines developed by the Company on leased land in Oliver, British Columbia were damaged. Included in this amount for fiscal 2011 is a loss of $1,062 from this damage.
b) During fiscal 2006, the Company closed its Port Moody winery facility and transferred production to its winery operations in Kelowna, British Columbia. The cost of maintaining this idle facility amounted to $185 in 2012 (2011 - $189).
c) The Company recorded a $200 impairment charge for certain personal winemaking product brand names that will be discontinued.
d) During 2012, the Company recorded an increase in personnel costs for additional estimated payroll taxes and benefits. These additional costs were calculated based on the amount of gratuities that were earned by employees during the years ended March 31, 2007 to March 31, 2011. The additional estimated cost for these periods amounted to $367 and was recorded in other expenses during the year.
e) During 2011, the Company recorded a $260 reduction in its estimate of costs to complete the disposition of Granville Island Brewing Company Ltd. and Mainland Beverage Distribution Ltd.
f) A pre-tax gain in the amount of $309 was recorded related to the sale of a portion of a vineyard on May 25, 2010. The proceeds from the sale were $833.
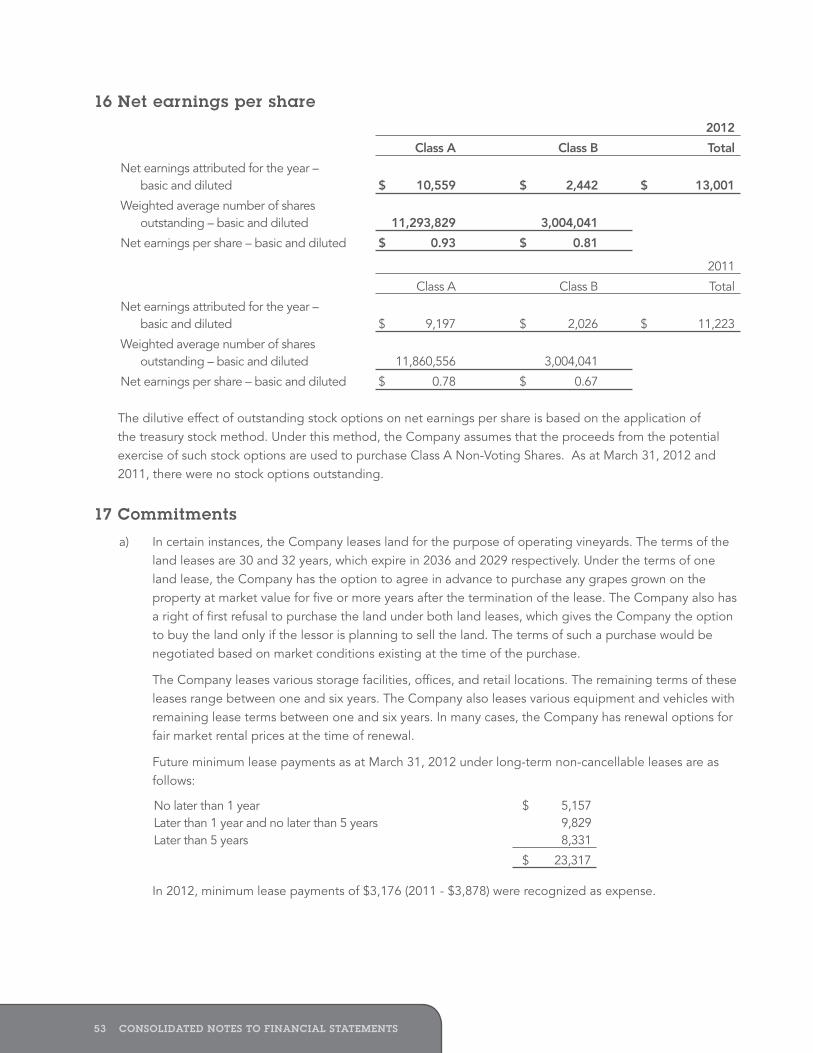
Andrew Peller Limited ~ 2012 Annual Report 5453 CONSOLiDATeD NOTeS TO FiNANCiAL STATeMeNTS
16 Net earnings per share 2012
Class A Class B Total
Net earnings attributed for the year – basic and diluted $ 10,559 $ 2,442 $ 13,001
Weighted average number of shares outstanding – basic and diluted 11,293,829 3,004,041
Net earnings per share – basic and diluted $ 0.93 $ 0.81
2011
Class A Class B Total
Net earnings attributed for the year – basic and diluted $ 9,197 $ 2,026 $ 11,223
Weighted average number of shares outstanding – basic and diluted 11,860,556 3,004,041
Net earnings per share – basic and diluted $ 0.78 $ 0.67
The dilutive effect of outstanding stock options on net earnings per share is based on the application of the treasury stock method. Under this method, the Company assumes that the proceeds from the potential exercise of such stock options are used to purchase Class A Non-Voting Shares. As at March 31, 2012 and 2011, there were no stock options outstanding.
17 Commitments
a) In certain instances, the Company leases land for the purpose of operating vineyards. The terms of the land leases are 30 and 32 years, which expire in 2036 and 2029 respectively. Under the terms of one land lease, the Company has the option to agree in advance to purchase any grapes grown on the property at market value for five or more years after the termination of the lease. The Company also has a right of first refusal to purchase the land under both land leases, which gives the Company the option to buy the land only if the lessor is planning to sell the land. The terms of such a purchase would be negotiated based on market conditions existing at the time of the purchase.
The Company leases various storage facilities, offices, and retail locations. The remaining terms of these leases range between one and six years. The Company also leases various equipment and vehicles with remaining lease terms between one and six years. In many cases, the Company has renewal options for fair market rental prices at the time of renewal.
Future minimum lease payments as at March 31, 2012 under long-term non-cancellable leases are as follows:
No later than 1 year $ 5,157 Later than 1 year and no later than 5 years 9,829 Later than 5 years 8,331
$ 23,317
In 2012, minimum lease payments of $3,176 (2011 - $3,878) were recognized as expense.
b) As at March 31, 2012, the Company held $15,000 in U.S. dollar-denominated foreign exchange forward contracts at rates averaging between $0.99 and $1.03 expiring at various dates to October 2012. The Company also held €2,500 in Euro-denominated foreign exchange contracts at a rate of $1.31 expiring at various dates until June 2012. Management has not elected to designate these contracts as hedges and as a result have recorded the change in fair value of $469 in the statement of earnings (see note 19).
18 Non-cash working capital items
The change in non-cash working capital items related to operations is comprised of the change in the following items:
2012 2011
Accounts receivable $ (547) $ (488) Inventory and current portion of biological assets (15,686) (6,018) Prepaid expenses and other assets (520) 1,000 Accounts payable and accrued liabilities 3,525 5,220
$ (13,228) $ (286)

Andrew Peller Limited ~ 2012 Annual Report 5655 CONSOLiDATeD NOTeS TO FiNANCiAL STATeMeNTS
19 Financial instruments
Classification of financial instruments
The classification and measurement of the financial assets and liabilities, as well as their carrying amounts and fair values are as follows:
March 31, 2012
Carrying Fair amount value Assets/liability Category Measurement $ $
Accounts receivable Loans and receivables Amortized cost 24,937 24,937 Bank indebtedness Other liabilities Amortized cost 57,495 57,495 Accounts payable and accrued liabilities Other liabilities Amortized cost 37,118 37,118 Dividends payable Other liabilities Amortized cost 1,252 1,252 Long-term debt – term loan Other liabilities Amortized cost 46,822 46,822 Interest rate swap liability Derivatives Fair value 3,138 3,138 Foreign exchange forward contracts liability Derivatives Fair value 77 77
March 31, 2011
Carrying Fair amount value Assets/liability Category Measurement $ $
Accounts receivable Loans and receivables Amortized cost 23,390 23,390 Bank indebtedness Other liabilities Amortized cost 48,758 48,758 Accounts payable and accrued liabilities Other liabilities Amortized cost 33,883 33,883 Dividends payable Other liabilities Amortized cost 1,148 1,148 Long-term debt – term loan Other liabilities Amortized cost 48,053 48,053 Interest rate swap liability Derivatives Fair value 2,926 2,926 Foreign exchange forward contracts liability Derivatives Fair value 546 546
April 1, 2010
Carrying Fair amount value Assets/liability Category Measurement $ $
Accounts receivable Loans and receivables Amortized cost 22,902 22,902 Bank indebtedness Other liabilities Amortized cost 48,877 48,877 Accounts payable and accrued liabilities Other liabilities Amortized cost 28,229 28,229 Dividends payable Other liabilities Amortized cost 1,197 1,197 Long-term debt – term loan Other liabilities Amortized cost 53,791 53,791 Interest rate swap liability Derivatives Fair value 3,145 3,145 Foreign exchange forward contracts liability Derivatives Fair value 444 444
The Company’s interest rate swap and foreign exchange contracts are derivatives and are recorded at fair value. As a result, unrealized gains and losses are included each period through earnings which reflect changes in fair value.
Fair value
The fair value of accounts receivable, accounts payable and accrued liabilities and dividends payable approximates their carrying value because of the short-term maturity of these instruments.
The fair value of long-term debt is equivalent to its carrying value because the variable interest rate is comparable to market rates. The fair value of the interest rate swap used to fix this interest rate is included in the current and long-term derivative financial instruments in the balance sheet.
The fair value of the derivative financial instruments generally reflects the estimates of the amounts the Company would receive by way of settlement of favourable contracts or that the Company would pay to terminate unfavourable contracts at the consolidated balance sheet date. The fair value of the interest rate swap and foreign exchange contracts are calculated using the quotes obtained from major financial institutions with adjustment to reflect any changes in the Company’s or the counterparty’s credit risk. Unrealized gains or losses on derivative financial instruments are recorded in the net unrealized gains on derivative financial instruments in the consolidated statement of earnings.
Fair value estimates are made at a specific point in time, using available information about the instrument. These estimates are subjective in nature and often cannot be determined with precision.
The net unrealized gains on derivative financial instruments are comprised of:
2012 2011
Unrealized gains (losses) on foreign exchange forward contracts $ 469 $ (102) Unrealized gains (losses) on the interest rate swap (212) 219
$ 257 $ 117
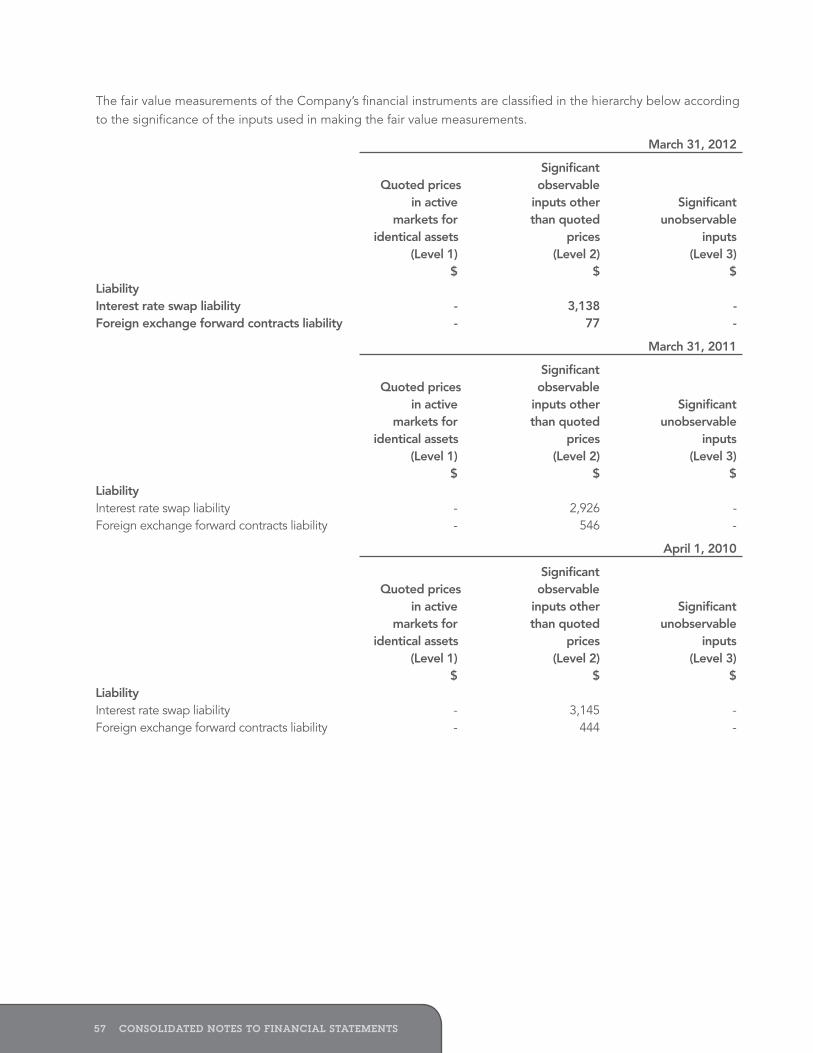
Andrew Peller Limited ~ 2012 Annual Report 5857 CONSOLiDATeD NOTeS TO FiNANCiAL STATeMeNTS
The fair value measurements of the Company’s financial instruments are classified in the hierarchy below according to the significance of the inputs used in making the fair value measurements.
March 31, 2012
Significant Quoted prices observable in active inputs other Significant markets for than quoted unobservable identical assets prices inputs (Level 1) (Level 2) (Level 3) $ $ $ Liability Interest rate swap liability - 3,138 - Foreign exchange forward contracts liability - 77 -
March 31, 2011
Significant Quoted prices observable in active inputs other Significant markets for than quoted unobservable identical assets prices inputs (Level 1) (Level 2) (Level 3) $ $ $ Liability Interest rate swap liability - 2,926 - Foreign exchange forward contracts liability - 546 -
April 1, 2010
Significant Quoted prices observable in active inputs other Significant markets for than quoted unobservable identical assets prices inputs (Level 1) (Level 2) (Level 3) $ $ $ Liability Interest rate swap liability - 3,145 - Foreign exchange forward contracts liability - 444 -
Objectives and policy relating to financial risk management
Interest rate risk
The Company is exposed to interest rate risk as a result of cash balances, floating rate debt, and an interest rate swap. Of these risks, the Company’s principal exposure is that increases in the floating interest rates on its debt, if unmitigated, could lead to decreases in cash flow and earnings. The Company’s objective in managing interest rate risk is to achieve a balance between minimizing borrowing costs over the long-term, ensuring that it meets borrowing covenants, and ensuring that it meets other expectations and requirements of investors. To meet these objectives, the Company’s policy is to effectively fix the rates on long-term debt to match the duration of investments in long-lived assets and to use floating rate funding for short-term borrowing.
The Company has effectively fixed its interest rate on long-term debt until August 2015 by entering into an interest rate swap. The interest rate swap is measured at fair value because the Company has elected not to use hedge accounting. An unrealized loss of $212 (2011 - $219 gain) was recognized on the interest rate swap, which is classified as net unrealized gains on derivative financial instruments in the statements of earnings. As at March 31, 2012, there is one interest rate swap outstanding with a notional amount of $47,333 with a fixed rate of 3.98%. The fair value of the interest rate swap at March 31, 2012 was $3,138.
The Company’s short-term borrowings are funded using a floating interest rate and as such are sensitive to interest rate movements. As at March 31, 2012, with other variables unchanged, a 1% change in interest rates would impact the Company’s net earnings by approximately $420 (2011 - $354), exclusive of the mark-to-market adjustments on the interest rate swap.
Credit risk
Credit risk arises from cash and cash equivalents, derivative financial instruments, and accounts receivable. The Company places its cash and cash equivalents with major Canadian financial institutions of high creditworthiness. Counterparties to derivative contracts are also major Canadian financial institutions of high creditworthiness.
Credit risk for trade receivables is monitored through established credit monitoring activities. Over 55% of the Company’s accounts receivable balance relates to amounts owing from Canadian provincial liquor boards. Excluding accounts receivable from Canadian provincial liquor boards, the Company does not have a significant concentration of credit risk with any single counterparty or group of counterparties. Amounts owing from Canadian provincial liquor boards represents $13,948 of the $24,937 in total accounts receivables for which no allowance has been provided. Of the remaining non-provincial liquor board balances, $771 (2011 - $353) were over thirty days past due as of March 31, 2012. An allowance for doubtful accounts of $269 (2011 - $192) has been provided against these accounts receivable amounts, which the Company has determined to represent a reasonable estimate of amounts that may be uncollectible.
Sales to the Liquor Control Board of Ontario were $45,389 (2011 - $42,576) during the year ended March 31, 2012. Sales to the British Columbia Liquor Distribution Branch were $30,125 (2011 - $29,893) during the year.

Andrew Peller Limited ~ 2012 Annual Report 6059 CONSOLiDATeD NOTeS TO FiNANCiAL STATeMeNTS
An analysis of accounts receivable is as follows:
March 31, March 31, April 1, 2012 2011 2010
Liquor boards $ 13,948 $ 13,653 $ 12,629 Non-liquor boards Current 7,867 7,036 7,255 Past due 0 – 30 days, due on delivery accounts 427 389 593 Past due 0 – 30 days 1,924 1,959 1,478 Past due 31 – 60 days 461 319 482 Past due > 60 days 579 226 753 Allowance for doubtful accounts (269) (192) (288) $ 24,937 $ 23,390 $ 22,902
The change in the allowance for doubtful accounts was as follows:
2012 2011 Balance – Beginning of year $ 192 $ 288 Provision for current year 147 131 Bad debt (70) (227)
Balance – End of year $ 269 $ 192
Liquidity risk
The Company incurs obligations to deliver cash or other financial assets on future dates. Liquidity risk inherently arises from these obligations, which include requirements to repay debt, purchase grape inventory, and make operating lease payments.
The Company manages liquidity risk by maintaining adequate cash and cash equivalent balances and by appropriately utilizing its line of credit. Company management continuously monitors and reviews both actual and forecasted cash flows and matches the maturity profile of financial assets and financial liabilities. Accounts payable are generally due within 30 days.
The following table outlines the Company’s contractual undiscounted obligations. The Company analyzes contractual obligations for financial liabilities in conjunction with other commitments in managing liquidity risk. Contractual obligations include long-term debt, the expected payments under a swap agreement that fixes the Company’s interest rate on long-term debt, operating leases, and commitments on short-term forward foreign exchange contracts used to mitigate the currency risk on U.S. dollar purchases as at March 31, 2012:
< 1 2 – 3 4 – 5 > 5 Total year years years year
Long-term debt $ 47,597 $ 5,366 $ 10,732 $ 31,401 $ 98 Operating leases and royalties 23,317 5,157 6,816 3,013 8,331 Plant and equipment purchases 5,411 5,411 - - - Pension obligations 4,093 560 953 811 1,769 Long-term grape purchase contracts 315,340 24,711 49,774 49,525 191,330
395,758 41,205 68,275 84,750 201,528 Interest rate swap 7,626 2,658 4,359 609 - Foreign exchange forward contracts 18,409 18,409 - - -
Total contractual obligations $ 421,793 $ 62,272 $ 72,634 $ 85,359 $ 201,528
The Company’s obligations under its interest rate swap and foreign exchange forward contracts are stated above on a gross basis rather than net of the corresponding contractual benefits.
Foreign exchange risk
Certain of the Company’s purchases are denominated in U.S. dollars or Euros. Any increases or decreases to the foreign exchange rates could increase or decrease the Company’s earnings. To mitigate the exposure to foreign exchange risk, the Company has entered into forward foreign currency contracts.
The Company’s foreign exchange risk arises on the purchase of bulk wine and concentrate, which are made in U.S. dollars and Euros. The Company’s strategy is to hedge approximately 50% - 80% of its annual foreign exchange requirements prior to the beginning of each fiscal quarter. As at March 31, 2012, the Company has forward foreign currency contracts to buy U.S. $15,000 at rates ranging between $0.99 and $1.03. The Company also held €2,500 in Euro-denominated foreign exchange contracts at a rate of $1.31. These contracts mature at various dates to October 2012. Including the impact of these contracts, a one percent increase or decrease to the exchange rate of the U.S. dollar or the Euro would impact the Company’s net earnings by approximately $123 (2011 - $62) or $93 (2011 - $95), respectively. The Company has elected not to use hedge accounting and as a result, has recognized $469 of unrealized foreign exchange gains (2011 – unrealized losses $102) in the consolidated statement of earnings as a component of net unrealized gains on derivative financial instruments and has recorded the fair value of $77 in current portion of derivative financial instruments in the consolidated balance sheet.
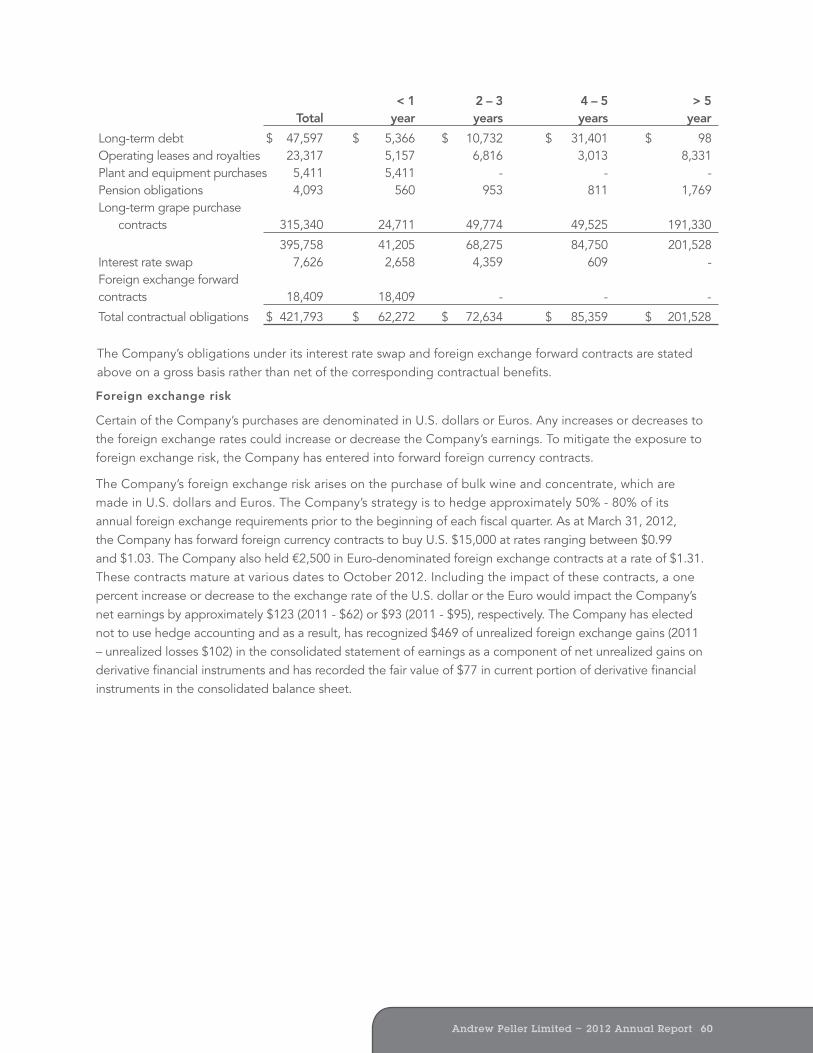
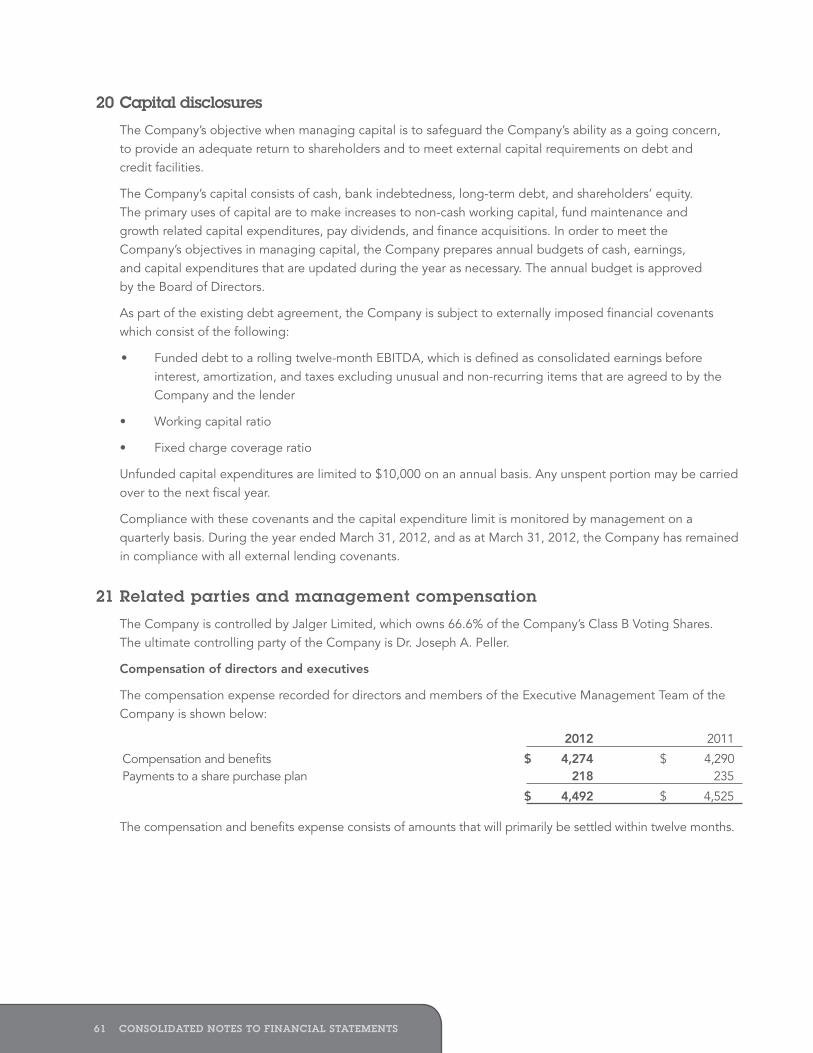
Andrew Peller Limited ~ 2012 Annual Report 6261 CONSOLiDATeD NOTeS TO FiNANCiAL STATeMeNTS
20 Capital disclosures
The Company’s objective when managing capital is to safeguard the Company’s ability as a going concern, to provide an adequate return to shareholders and to meet external capital requirements on debt and credit facilities.
The Company’s capital consists of cash, bank indebtedness, long-term debt, and shareholders’ equity. The primary uses of capital are to make increases to non-cash working capital, fund maintenance and growth related capital expenditures, pay dividends, and finance acquisitions. In order to meet the Company’s objectives in managing capital, the Company prepares annual budgets of cash, earnings, and capital expenditures that are updated during the year as necessary. The annual budget is approved by the Board of Directors.
As part of the existing debt agreement, the Company is subject to externally imposed financial covenants which consist of the following:
• Fundeddebttoarollingtwelve-monthEBITDA,whichisdefinedasconsolidatedearningsbeforeinterest, amortization, and taxes excluding unusual and non-recurring items that are agreed to by the Company and the lender
• Workingcapitalratio
• Fixedchargecoverageratio
Unfunded capital expenditures are limited to $10,000 on an annual basis. Any unspent portion may be carried over to the next fiscal year.
Compliance with these covenants and the capital expenditure limit is monitored by management on a quarterly basis. During the year ended March 31, 2012, and as at March 31, 2012, the Company has remained in compliance with all external lending covenants.
21 Related parties and management compensation
The Company is controlled by Jalger Limited, which owns 66.6% of the Company’s Class B Voting Shares. The ultimate controlling party of the Company is Dr. Joseph A. Peller.
Compensation of directors and executives
The compensation expense recorded for directors and members of the Executive Management Team of the Company is shown below:
2012 2011
Compensation and benefits $ 4,274 $ 4,290 Payments to a share purchase plan 218 235
$ 4,492 $ 4,525
The compensation and benefits expense consists of amounts that will primarily be settled within twelve months.
22 Segmented information
During the year, export sales were $11,222 (2011 - $10,040), primarily in the United States. The remainder of sales occurred in Canada. All of the Company’s assets are located in Canada.
23 Transition to iFRS
The Company has adopted IFRS for the first time in accordance with IFRS 1 – First-time adoption of IFRS. The first date at which the Company applied IFRS was April 1, 2010 (“its Transition Date” or “the Company’s Transition Date”).
IFRS 1 provides certain exemptions and exceptions from the general requirement to retrospectively apply IFRS. The Company has elected to use the following applicable IFRS 1 exemptions at its Transition Date:
Business combinations – The Company has elected not to apply IFRS 3 retrospectively to business combinations prior to its Transition Date.
Share-based payment transactions – The Company has elected to forego the retrospective application of IFRS 2 to its share-based payment transactions that occurred before certain dates. As a result, the Company has maintained its previous accounting policies for equity instruments that vested before the Company’s Transition Date or that were granted on or before November 7, 2002. The Company also maintained its previous accounting policies for liabilities arising from share-based payment transactions that were settled before its Transition Date.
Leases – The Company has elected to apply the transitional provisions in IFRIC 4 – Determining whether an arrangement contains a lease, which allows the Company to consider whether an arrangement existing at its Transition Date contained a lease based on the circumstances existing at that date.
Employee benefits – The Company has elected to recognize all cumulative actuarial gains and losses in opening retained earnings at its Transition Date for all of its defined benefit pensions and other post-employment benefit plans.
Borrowing costs – The Company has elected to apply IAS 23 – Borrowing costs effective the Company’s Transition Date. Prior to transition, the Company had a policy of capitalizing interest on inventory taking a substantial period of time to become ready to sell. As a result of this election, the Company will be required to capitalize certain borrowing costs on all qualifying assets beginning on its Transition Date.
Cumulative translation differences – The Company has elected to deem cumulative translation differences to be zero at its Transition Date. Also, the Company will only include translation differences that arose after its Transition Date in the gain or loss on a disposal of a foreign operation occurring after its Transition Date.
In the reconciliations below, Canadian GAAP information refers to Canadian GAAP prior to the Company’s transition to IFRS and is not prepared in accordance with IFRS. A summary of how the transition from Canadian GAAP to IFRS has impacted the Company’s balance sheets, statements of earnings, statements of comprehensive income, and statements of cash flows is included below.
Certain comparative figures previously reported under Canadian GAAP have been reclassified to conform with the presentation under IFRS.
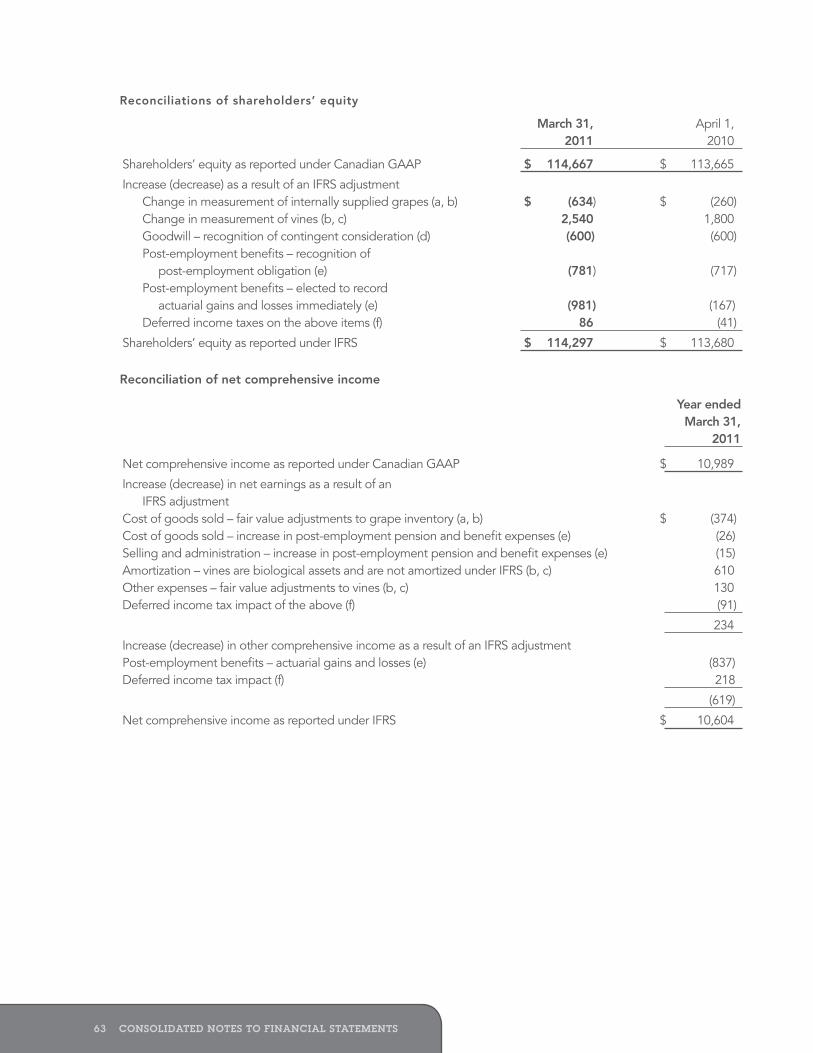
Andrew Peller Limited ~ 2012 Annual Report 6463 CONSOLiDATeD NOTeS TO FiNANCiAL STATeMeNTS
Reconciliations of shareholders’ equity
March 31, April 1, 2011 2010
Shareholders’ equity as reported under Canadian GAAP $ 114,667 $ 113,665
Increase (decrease) as a result of an IFRS adjustment Change in measurement of internally supplied grapes (a, b) $ (634) $ (260) Change in measurement of vines (b, c) 2,540 1,800 Goodwill – recognition of contingent consideration (d) (600) (600) Post-employment benefits – recognition of post-employment obligation (e) (781) (717) Post-employment benefits – elected to record actuarial gains and losses immediately (e) (981) (167) Deferred income taxes on the above items (f) 86 (41)
Shareholders’ equity as reported under IFRS $ 114,297 $ 113,680
Reconciliation of net comprehensive income
Year ended March 31, 2011
Net comprehensive income as reported under Canadian GAAP $ 10,989
Increase (decrease) in net earnings as a result of an IFRS adjustment Cost of goods sold – fair value adjustments to grape inventory (a, b) $ (374) Cost of goods sold – increase in post-employment pension and benefit expenses (e) (26) Selling and administration – increase in post-employment pension and benefit expenses (e) (15) Amortization – vines are biological assets and are not amortized under IFRS (b, c) 610 Other expenses – fair value adjustments to vines (b, c) 130 Deferred income tax impact of the above (f) (91)
234
Increase (decrease) in other comprehensive income as a result of an IFRS adjustment Post-employment benefits – actuarial gains and losses (e) (837) Deferred income tax impact (f) 218
(619)
Net comprehensive income as reported under IFRS $ 10,604
Reconciliations of balance sheets
March 31, 2011
Canadian GAAP Adjustment IFRS Assets Current assets Accounts receivable $ 23,390 $ - $ 23,390 Inventory (a) 96,085 (1,393) 94,692 Current portion of biological assets (a, b) - 759 759 Prepaid expenses and other assets 818 - 818 120,293 (634) 119,659 Property, plant, and equipment (b, c) 94,154 (9,410) 84,744 Biological assets (b, c) - 11,950 11,950 Intangibles and other assets 14,170 - 14,170 Goodwill (d) 38,073 (600) 37,473
$ 266,690 $ 1,306 $ 267,996
Liabilities
Current liabilities Bank indebtedness $ 48,758 $ - $ 48,758 Accounts payable and accrued liabilities (d) 33,883 - 33,883 Dividends payable 1,148 - 1,148 Income taxes payable 1,000 - 1,000 Current portion of derivative financial instruments 1,894 - 1,894 Current portion of long-term debt 5,333 - 5,333 92,016 - 92,016 Long-term debt 42,720 - 42,720 Long-term derivative financial instruments 1,578 - 1,578 Post-employment benefits (e) 3,803 1,762 5,565 Deferred income taxes (f) 11,906 (86) 11,820
152,023 1,676 153,699
Shareholders’ equity
Capital stock 7,026 - 7,026 Retained earnings (g) 107,641 (370) 107,271
114,667 (370) 114,297
$ 266,690 $ 1,306 $ 267,996
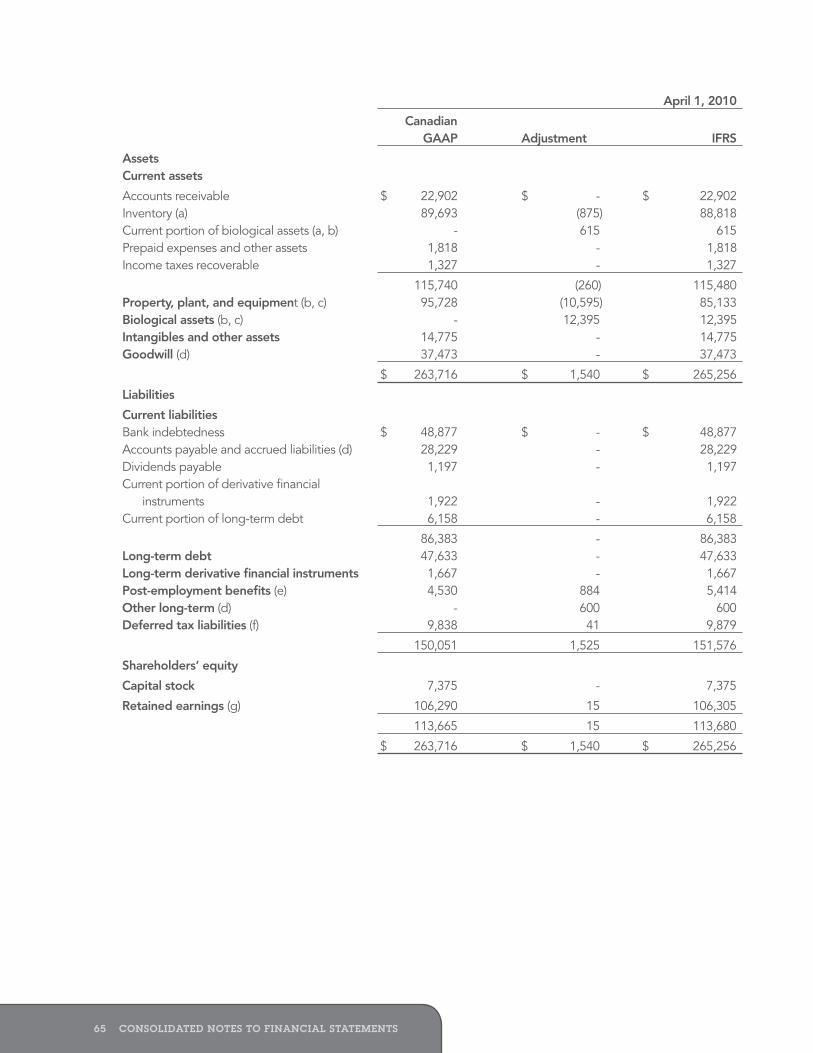
Andrew Peller Limited ~ 2012 Annual Report 6665 CONSOLiDATeD NOTeS TO FiNANCiAL STATeMeNTS
April 1, 2010
Canadian GAAP Adjustment IFRS
Assets Current assets
Accounts receivable $ 22,902 $ - $ 22,902 Inventory (a) 89,693 (875) 88,818 Current portion of biological assets (a, b) - 615 615 Prepaid expenses and other assets 1,818 - 1,818 Income taxes recoverable 1,327 - 1,327
115,740 (260) 115,480 Property, plant, and equipment (b, c) 95,728 (10,595) 85,133 Biological assets (b, c) - 12,395 12,395 Intangibles and other assets 14,775 - 14,775 Goodwill (d) 37,473 - 37,473
$ 263,716 $ 1,540 $ 265,256
Liabilities
Current liabilities Bank indebtedness $ 48,877 $ - $ 48,877 Accounts payable and accrued liabilities (d) 28,229 - 28,229 Dividends payable 1,197 - 1,197 Current portion of derivative financial instruments 1,922 - 1,922 Current portion of long-term debt 6,158 - 6,158
86,383 - 86,383 Long-term debt 47,633 - 47,633 Long-term derivative financial instruments 1,667 - 1,667 Post-employment benefits (e) 4,530 884 5,414 Other long-term (d) - 600 600 Deferred tax liabilities (f) 9,838 41 9,879
150,051 1,525 151,576
Shareholders’ equity
Capital stock 7,375 - 7,375
Retained earnings (g) 106,290 15 106,305
113,665 15 113,680
$ 263,716 $ 1,540 $ 265,256
Reconciliation of statements of earnings and statements of comprehensive income
Year ended March 31, 2011
Canadian GAAP Adjustment IFRS Sales $ 265,420 $ - $ 265,420 Cost of goods sold (a, e) 161,758 400 162,158 Amortization of plant and equipment used in production (b, c) 5,277 (610) 4,667 Gross profit 98,385 210 98,595 Selling and administration (e) 71,703 15 71,718 Amortization of equipment and intangibles used in selling and administration 2,925 - 2,925 Interest 6,673 - 6,673
Operating earnings 17,084 195 17,279 Net unrealized gains on derivative financial instruments (117) - (117) Other expenses (b, c) 921 (130) 791 Earnings before income taxes 16,280 325 16,605
Provision for income taxes Current 3,223 - 3,223 Deferred (f) 2,068 91 2,159
5,291 91 5,382
Net earnings for the period $ 10,989 $ 234 $ 11,223
Other comprehensive income (loss) Net actuarial losses on post-employment benefits) (e) $ - $ (837) $ (837) Deferred income taxes (f) - 218 218
- (619) (619)
Net comprehensive income $ 10,989 $ (385) $ 10,604
a) Grapes sourced from vineyards controlled by the Company are measured at fair value less costs to sell at the point of harvest under IFRS. These grapes are transferred to inventory from biological assets when they are harvested. Under Canadian GAAP, such grape inventory was recorded at the lower of cost and net realizable value and was included in inventory at an earlier date, that is when costs to produce the grapes began.
March 31, April 1, 2011 2010 Resulting increase (decrease) in Inventory $ (1,393) $ (875) Current portion of biological assets 759 615 Net decrease in shareholders’ equity $ (634) $ (260)
Resulting increase in cost of goods sold $ 374
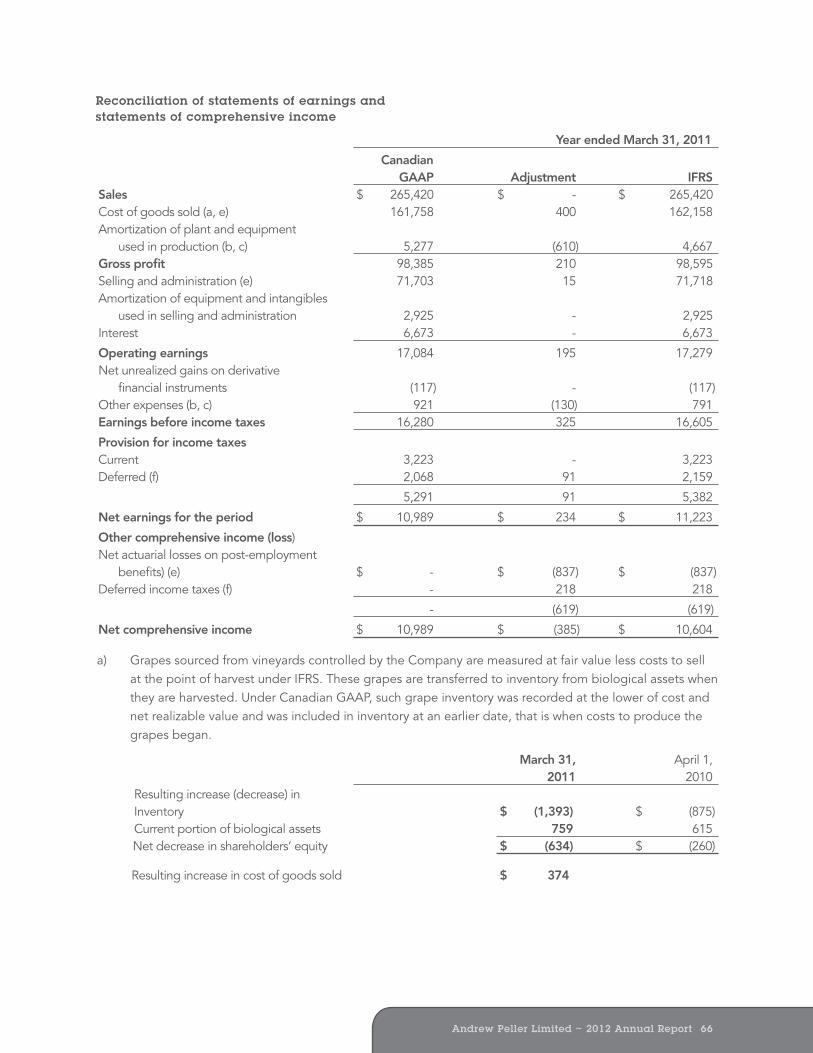
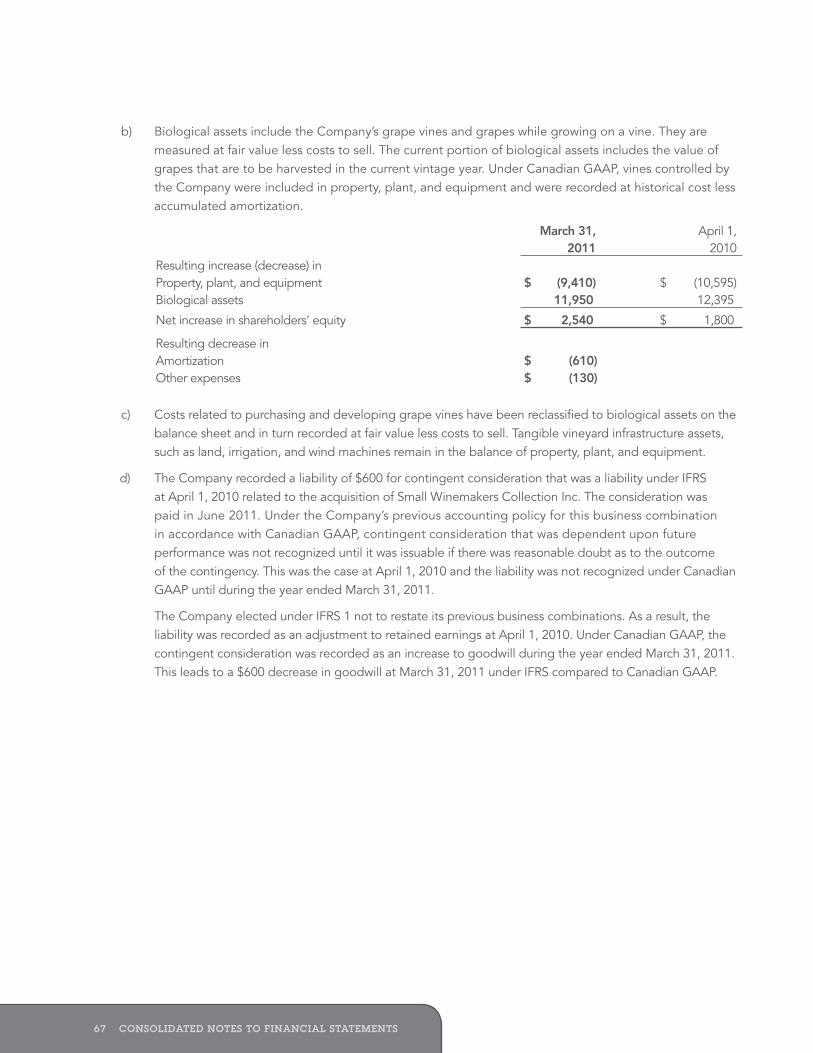
Andrew Peller Limited ~ 2012 Annual Report 6867 CONSOLiDATeD NOTeS TO FiNANCiAL STATeMeNTS
b) Biological assets include the Company’s grape vines and grapes while growing on a vine. They are measured at fair value less costs to sell. The current portion of biological assets includes the value of grapes that are to be harvested in the current vintage year. Under Canadian GAAP, vines controlled by the Company were included in property, plant, and equipment and were recorded at historical cost less accumulated amortization.
March 31, April 1, 2011 2010
Resulting increase (decrease) in Property, plant, and equipment $ (9,410) $ (10,595)Biological assets 11,950 12,395
Net increase in shareholders’ equity $ 2,540 $ 1,800
Resulting decrease in Amortization $ (610) Other expenses $ (130)
c) Costs related to purchasing and developing grape vines have been reclassified to biological assets on the balance sheet and in turn recorded at fair value less costs to sell. Tangible vineyard infrastructure assets, such as land, irrigation, and wind machines remain in the balance of property, plant, and equipment.
d) The Company recorded a liability of $600 for contingent consideration that was a liability under IFRS at April 1, 2010 related to the acquisition of Small Winemakers Collection Inc. The consideration was paid in June 2011. Under the Company’s previous accounting policy for this business combination in accordance with Canadian GAAP, contingent consideration that was dependent upon future performance was not recognized until it was issuable if there was reasonable doubt as to the outcome of the contingency. This was the case at April 1, 2010 and the liability was not recognized under Canadian GAAP until during the year ended March 31, 2011.
The Company elected under IFRS 1 not to restate its previous business combinations. As a result, the liability was recorded as an adjustment to retained earnings at April 1, 2010. Under Canadian GAAP, the contingent consideration was recorded as an increase to goodwill during the year ended March 31, 2011. This leads to a $600 decrease in goodwill at March 31, 2011 under IFRS compared to Canadian GAAP.
e) The Company has elected under IFRS 1 to recognize its cumulative actuarial gains and losses at April 1, 2010. In addition, beyond April 1, 2010, the Company has adopted a policy to record actuarial gains and losses immediately in other comprehensive income under IFRS. Previously, experience gains and losses were deferred and amortized, generally over the remaining service life of employees. The amortization of actuarial gains and losses was included in earnings as part of cost of goods sold and selling and administration expenses. In addition, the Company considers its retiree wine allowance a liability under IFRS. The cost of this policy will now be accrued during an employee’s service period rather than expensed during retirement as the wine allowance is provided.
March 31, April 1, 2011 2010
Post-employment benefits liability under Canadian GAAP $ 3,803 $ 4,530 Change in timing of recording actuarial gains and losses 981 167 Recognition of retiree wine allowance 781 717
Post-employment benefits liability under IFRS $ 5,565 $ 5,414
Resulting increase (decrease) in Cost of goods sold $ 26 Selling and administration $ 15
f) The change in the deferred tax liabilities is primarily a result of the IFRS transition adjustments previously described. The adjustments have changed the carrying amounts used to calculate the temporary difference associated with these balances and the corresponding deferred tax balances, as follows:
March 31, April 1, 2011 2010
Increase (decrease) in deferred income taxes payable resulting from adjustments to Inventory $ (171) $ (245) Property, plant, and equipment and biological assets 543 512 Post-employment benefits (458) (226)
$ (86) $ 41
g) The adjustments to retained earnings are the residual of all of the adjustments previously described.
Changes to the consolidated statements of cash flows
Certain items within operating activities have been classified differently under IFRS when compared to Canadian GAAP. The change in presentation results from the changes in net earnings, as described in the reconciliations of the consolidated statements of earnings, which has a corresponding change in items not affecting cash and changes in non-cash working capital items related to operations. Other than presentation, there was no impact on the cash flow statements as a result of the transition to IFRS.
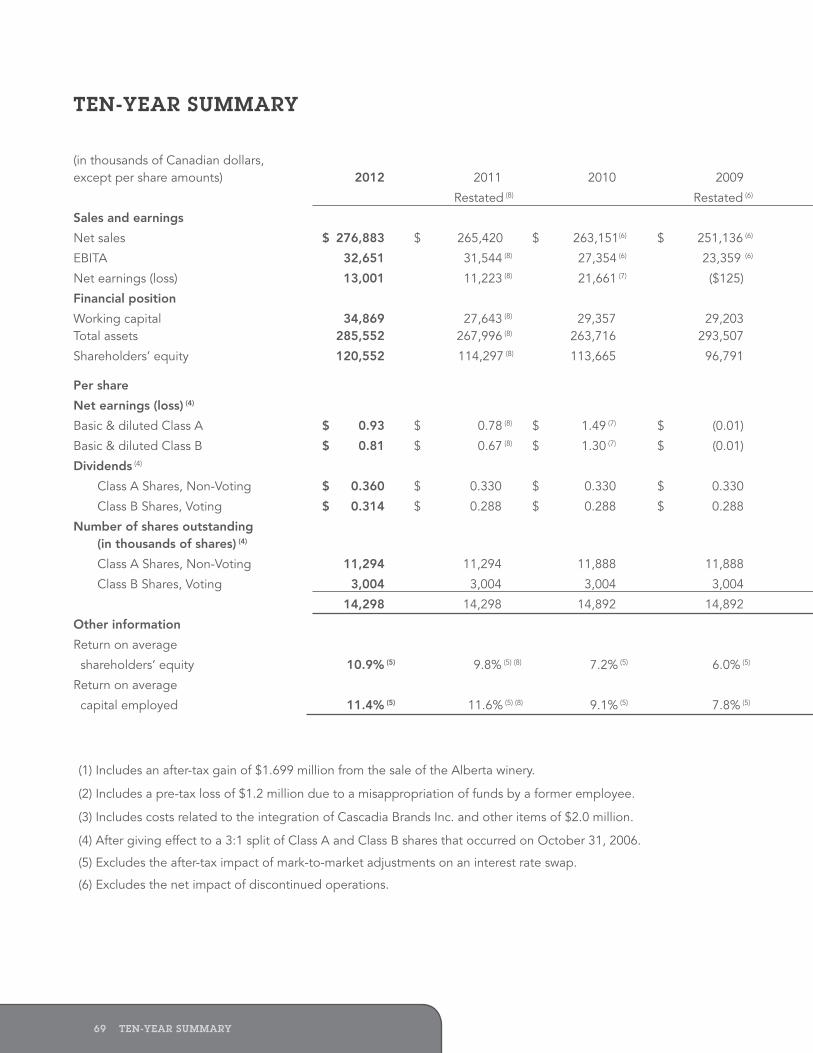
Andrew Peller Limited ~ 2012 Annual Report 7069 TeN-YeAR SUMMARY
TeN-YeAR SUMMARY
(in thousands of Canadian dollars, except per share amounts) 2012 2011 2010 2009 2008 2007 2006 2005 2004 2003
Restated (8) Restated (6) Restated (6) Restated (2) Restated (2)
Sales and earnings
Net sales $ 276,883 $ 265,420 $ 263,151(6) $ 251,136 (6) $ 228,056 (6) $ 228,192 $ 211,775 $ 167,634 $ 155,910 $ 147,856
EBITA 32,651 31,544 (8) 27,354 (6) 23,359 (6) 28,109 (6) 27,665 22,902 21,787 20,661 18,590
Net earnings (loss) 13,001 11,223 (8) 21,661 (7) ($125) 11,381 9,472 6,054 (3) 8,467 (2) 8,977 (1) (2) 6,929
Financial position
Working capital 34,869 27,643 (8) 29,357 29,203 25,413 25,316 26,756 29,410 (2) 29,288 (2) 27,369 Total assets 285,552 267,996 (8) 263,716 293,507 259,744 238,956 222,087 162,155 (2) 146,163 (2) 132,006
Shareholders’ equity 120,552 114,297 (8) 113,665 96,791 102,680 95,522 89,580 86,504 (2) 80,715 (2) 72,521
Per share
Net earnings (loss) (4)
Basic & diluted Class A $ 0.93 $ 0.78 (8) $ 1.49 (7) $ (0.01) $ 0.78 $ 0.65 $ 0.42 (3) $ 0.59 (2) $ 0.63 (1) (2) $ 0.50
Basic & diluted Class B $ 0.81 $ 0.67 (8) $ 1.30 (7) $ (0.01) $ 0.68 $ 0.57 $ 0.36 (3) $ 0.51 (2) $ 0.55 (1) (2) $ 0.43
Dividends (4)
Class A Shares, Non-Voting $ 0.360 $ 0.330 $ 0.330 $ 0.330 $ 0.300 $ 0.0253 $ 0.215 $ 0.215 $ 0.215 $ 0.215
Class B Shares, Voting $ 0.314 $ 0.288 $ 0.288 $ 0.288 $ 0.261 $ 0.0220 $ 0.187 $ 0.187 $ 0.187 $ 0.187
Number of shares outstanding (in thousands of shares) (4)
Class A Shares, Non-Voting 11,294 11,294 11,888 11,888 11,888 11,888 11,888 11,863 11,763 11,223
Class B Shares, Voting 3,004 3,004 3,004 3,004 3,004 3,004 3,004 3,005 3,006 3,009
14,298 14,298 14,892 14,892 14,892 14,892 14,892 14,868 14,769 14,232
Other information
Return on average
shareholders’ equity 10.9% (5) 9.8% (5) (8) 7.2% (5) 6.0% (5) 12.1% (5) 10.2% 6.9% 10.1% 10.2% 9.8%
Return on average
capital employed 11.4% (5) 11.6% (5) (8) 9.1% (5) 7.8% (5) 10.6% (5) 10.3% 9.7% 12.4% 12.3% 12.5%
(1) Includes an after-tax gain of $1.699 million from the sale of the Alberta winery.
(2) Includes a pre-tax loss of $1.2 million due to a misappropriation of funds by a former employee.
(3) Includes costs related to the integration of Cascadia Brands Inc. and other items of $2.0 million.
(4) After giving effect to a 3:1 split of Class A and Class B shares that occurred on October 31, 2006.
(5) Excludes the after-tax impact of mark-to-market adjustments on an interest rate swap.
(6) Excludes the net impact of discontinued operations.
(7) Includes an after-tax gain of $11.9 million for the sale of Granville Island Brewing Company Ltd. and Mainland Beverage Distribution Ltd.
(8) March 31, 2012 amounts have been prepared in accordance with International Financial Reporting Standards (“IFRS”) and as such certain amounts for March 31, 2011 have been restated. Amounts for March 31, 2010 and prior have not been prepared in accordance with IFRS. They have been presented in accordance with Canadian GAAP and may not be comparable to subsequent periods.
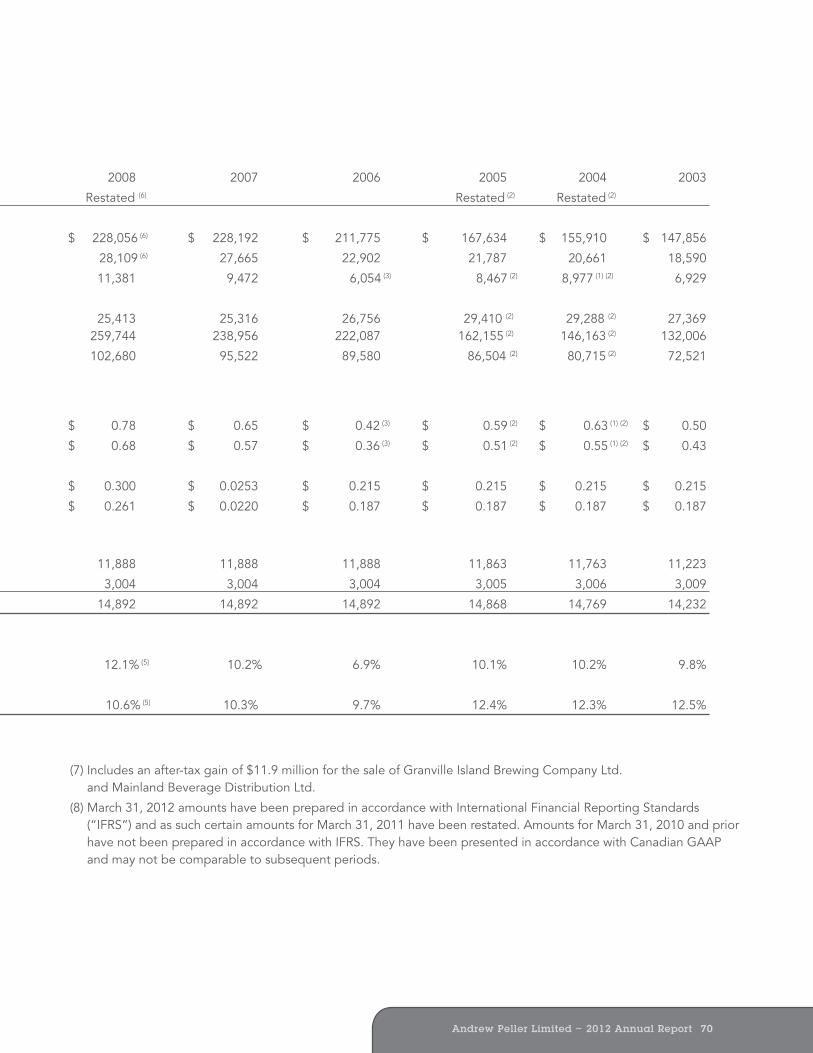

Andrew Peller Limited ~ 2012 Annual Report 7271 DiReCTORS & OFFiCeRS
Head Office
ANDREW PELLER LIMITED 697 South Service Road Grimsby, Ontario L3M 4E8 Tel: (905) 643-4131 Fax: (905) 643-4944
Stock exchange
TORONTO Symbols: ADW.A/ADW.B
Registrar and Transfer Agent
COMPUTERSHARE INVESTOR SERVICES INC.
Auditors
PRICEWATERHOUSECOOPERS LLP
Bankers
BANK OF MONTREAL ROYAL BANK OF CANADA TORONTO DOMINION BANK RABOBANK
Shareholder inquiries
Computershare Investor Services Inc. operates services for inquiries regarding changes of address, stock transfers, registered shareholdings, dividends and lost certificates, which can be reached:
Phone: 1-800-564-6253 toll free North America (International 514-982-7555)
Fax: 1-866-249-7775 toll free North America (International 416-263-9524)
Email: [email protected]
Internet: www.computershare.com – the Investors section offers enrolment for self-service account management for registered shareholders through Investor Centre.
Mail: Computershare Investor Services 100 University Avenue, 9th Floor Toronto, Ontario M5J 2Y1
investor Relations
For additional information regarding the Company’s activities, please contact:
PETER B. PATCHET Chief Financial Officer and Executive Vice-President, Human Resources at the Head Office address or by email at: [email protected]
2012 Annual Shareholders’ Meeting
The 2012 Annual Meeting of Shareholders will be held at:
Trius Winery at Hillebrand Niagara-on-the-Lake, Ontario on Wednesday, September 12, 2012 at 3:00 p.m.
SHAReHOLDeR iNFORMATiON
DirectorsMARK W. COSENS Burlington, Ontario Managing Director Kilbride Capital Partners
LORI C. COVERT Halifax, Nova Scotia Corporate Director
RICHARD D. HOSSACK, PhD Toronto, Ontario President Hossack and Associates Limited
PERRY J. MIELE Burlington, Ontario Chairman and Managing Partner Beringer Capital
A. ANGUS PELLER, M.D. Toronto, Ontario Senior Medical Consultant Medcan Health Management Inc.
JOHN E. PELLER Burlington, Ontario President and Chief Executive Officer Andrew Peller Limited
JOSEPH A. PELLER, M.D. Rockwood, Ontario Chairman of the Board Andrew Peller Limited
RANDY A. POWELL Vancouver, British Columbia President & CEO Armstrong Group
JOHN F. PETCH, Q.C. Toronto, Ontario Barrister & Solicitor Vice Chairman Andrew Peller Limited
BRIAN J. SHORT Ancaster, Ontario Corporate Director
Honorary Directors
C. WILLIAM DANIEL, O.C. Toronto, Ontario
RALPH M. LOGAN Halifax, Nova Scotia
WILLIAM J. WALSH, M.D. Hamilton, Ontario
Officers
JOHN E. PELLER President and Chief Executive Officer
GREGORY J. BERTI Vice-President, Estate Wines and Export
ANTHONY M. BRISTOW Chief Operating Officer
JAMES H. COLE Vice-President, Retail Division
SHARI A. NILES Executive Vice-President, Marketing
PETER B. PATCHET Chief Financial Officer and Executive Vice-President, Human Resources
ROBERT P. VAN WELY President, Global Vintners Inc.
BRENDAN P. WALL Executive Vice-President, Operations
J. CHRISTOPHER ZARAFONITIS Executive Vice-President, Sales
DiReCTORS & OFFiCeRS
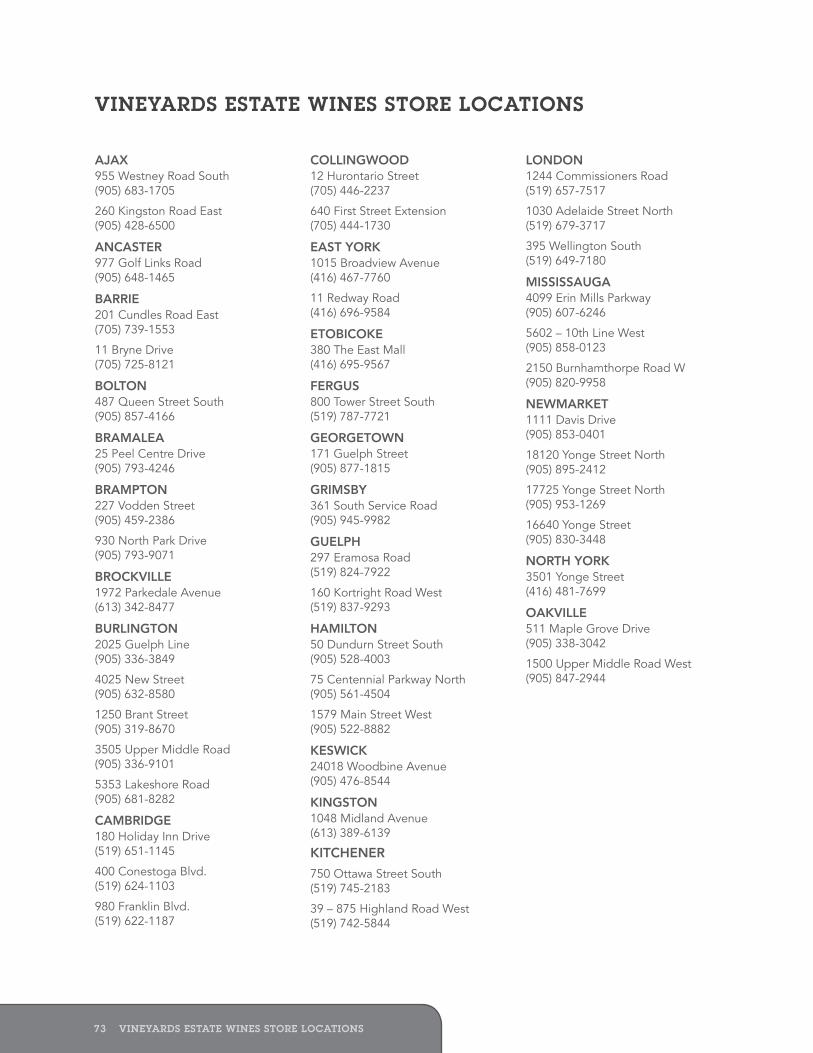
73 viNeYARDS eSTATe wiNeS STORe LOCATiONS
AjAx955 Westney Road South (905) 683-1705
260 Kingston Road East (905) 428-6500
AncAster977 Golf Links Road (905) 648-1465
BArrie201 Cundles Road East (705) 739-1553
11 Bryne Drive (705) 725-8121
Bolton487 Queen Street South (905) 857-4166
BrAmAleA25 Peel Centre Drive (905) 793-4246
BrAmpton227 Vodden Street (905) 459-2386
930 North Park Drive (905) 793-9071
Brockville1972 Parkedale Avenue (613) 342-8477
Burlington2025 Guelph Line (905) 336-3849
4025 New Street (905) 632-8580
1250 Brant Street (905) 319-8670
3505 Upper Middle Road (905) 336-9101
5353 Lakeshore Road (905) 681-8282
cAmBridge180 Holiday Inn Drive (519) 651-1145
400 Conestoga Blvd. (519) 624-1103
980 Franklin Blvd. (519) 622-1187
collingwood12 Hurontario Street (705) 446-2237
640 First Street Extension (705) 444-1730
eAst York1015 Broadview Avenue (416) 467-7760
11 Redway Road (416) 696-9584
etoBicoke380 The East Mall (416) 695-9567
Fergus800 Tower Street South (519) 787-7721
georgetown 171 Guelph Street (905) 877-1815
grimsBY361 South Service Road (905) 945-9982
guelph297 Eramosa Road (519) 824-7922
160 Kortright Road West (519) 837-9293
hAmilton50 Dundurn Street South (905) 528-4003
75 Centennial Parkway North (905) 561-4504
1579 Main Street West (905) 522-8882
keswick24018 Woodbine Avenue (905) 476-8544
kingston1048 Midland Avenue (613) 389-6139
kitchener
750 Ottawa Street South (519) 745-2183
39 – 875 Highland Road West (519) 742-5844
london1244 Commissioners Road (519) 657-7517
1030 Adelaide Street North (519) 679-3717
395 Wellington South (519) 649-7180
mississAugA4099 Erin Mills Parkway (905) 607-6246
5602 – 10th Line West (905) 858-0123
2150 Burnhamthorpe Road W (905) 820-9958
newmArket1111 Davis Drive (905) 853-0401
18120 Yonge Street North (905) 895-2412
17725 Yonge Street North (905) 953-1269
16640 Yonge Street (905) 830-3448
north York3501 Yonge Street (416) 481-7699
oAkville511 Maple Grove Drive (905) 338-3042
1500 Upper Middle Road West (905) 847-2944
viNeYARDS eSTATe wiNeS STORe LOCATiONS
Andrew Peller Limited ~ 2012 Annual Report 74
Orangeville50 – 4th Avenue (519) 942-8752
Oshawa285 Taunton Road East (905) 571-6167
1385 Harmony Road North (905) 438-1800
1300 King Street East Unit # 32 (905) 438-0478
Ottawa2515 Bank Street (613) 523-5837
Ottawa (glOucester)671 River Road (613) 822-3080
Ottawa (nepean)59 Robertson Road (613) 820-7219
Ottawa (stittsville)1251 Main Street (613) 831-3837
Ottawa (vanier)100 McArthur Road (613) 749-9618
Owen sOund1150 Sixteenth Street East (519) 371-8664
richMOnd hill11700 Yonge Street (905) 770-2314
scarbOrOugh3221 Eglinton Avenue East (416) 267-2795
siMcOe470 Norfolk Street South (519) 426-1033
st. catharines318 Ontario Street (905) 685-8898
285 Geneva Street (905) 646-7363
600 Ontario Street (905) 934-7430
st. thOMas1063 Talbot Street (519) 633-6343
stOney creek102 Highway #8 (905) 664-3188
tOrOntO656 Eglinton Avenue East (416) 485-0093
3671 Dundas Street West (416) 762-8635
228 Queens Quay (416) 598-8880
125 The Queensway (416) 201-8221
87 Avenue Road (416) 923-6336
2273 Bloor Street West (416) 766-8654
uxbridge323 Toronto Street South (905) 852-5008
vaughan9200 Bathurst Street (905) 707-6118
waterlOO450 Erb Street West (519) 747-5897
315 Lincoln Road (519) 746-7226
welland821 Niagara Street (905) 714-9521
whitby1615 Dundas Street East (905) 728-4118
200 Taunton Road (905) 668-7568
617 Victoria Street West (905) 430-5314
aisle 4330 Kingston Road West Ajax, Ontario (905) 428-7829
1935 Ravenscroft Rd. Ajax, Ontario (905) 427-0270
10970 Airport Road Brampton, Ontario (905) 793-9531
167 Silver Creek Parkway Guelph, Ontario (519) 837-0540
3040 Wonderland South London, Ontario (519) 668-2224
500 Copper Creek Blvd. Milton, Ontario (905) 693-8850
1079 Maple Ave. Markham, Ontario (905) 471-3602
250 Lakeshore Road West Mississauga, Ontario (905) 274-2280
1460 Merivale Road Nepean, Ontario (613) 723-5507
3090 Bathurst Street North York, Ontario (416) 256-0462
1300 King Street East Oshawa, Ontario (905) 728-3767
769 Borden Avenue Peterborough, Ontario (705) 740-2513
221 Glendale Avenue St. Catharines, Ontario (905) 688-4767
411 Louth Street St. Catharines, Ontario (905) 685-9779
50 Musgrave Street Toronto, Ontario (416) 693-6336
15 York St. Toronto, Ontario (416) 304-0358
22 Fort York Blvd. Toronto, Ontario (416) 623-0793
st. lawrence wine cOuntry Merchant93 Front Street East Toronto Ontario (416) 364-1811wine cOuntry vintners27 Queen Street Niagara-on-the-Lake, Ontario (905) 468-1881

4 FINANCIAL AND OPERATING HIGHLIGHTS 4 FINANCIAL AND OPERATING HIGHLIGHTS
Related Documents