15th April 2010, Airneth Annual Conference, Andrew Gordon Director Market Analysis 15th April 2010, Airneth Annual Conference,

Welcome message from author
This document is posted to help you gain knowledge. Please leave a comment to let me know what you think about it! Share it to your friends and learn new things together.
Transcript
15th April 2010, Airneth Annual Conference,
Andrew GordonDirector Market Analysis
15th April 2010, Airneth Annual Conference,
y

• Where is the industry today?• Economy• Traffic outlook
• Industry drivers
oprie
tary
doc
umen
t.
• Industry drivers
• Airbus GMF, 2009 – 2028
s re
serv
ed. C
onfid
entia
l and
pro Airbus GMF, 2009 2028
• Emerging markets
© A
IRBU
S S.
A.S.
All
right
s

• Where is the industry today?• Economy• Traffic outlook
• Industry drivers
oprie
tary
doc
umen
t.
• Industry drivers
• Airbus GMF, 2009 – 2028
s re
serv
ed. C
onfid
entia
l and
pro Airbus GMF, 2009 2028
• Emerging markets
© A
IRBU
S S.
A.S.
All
right
s
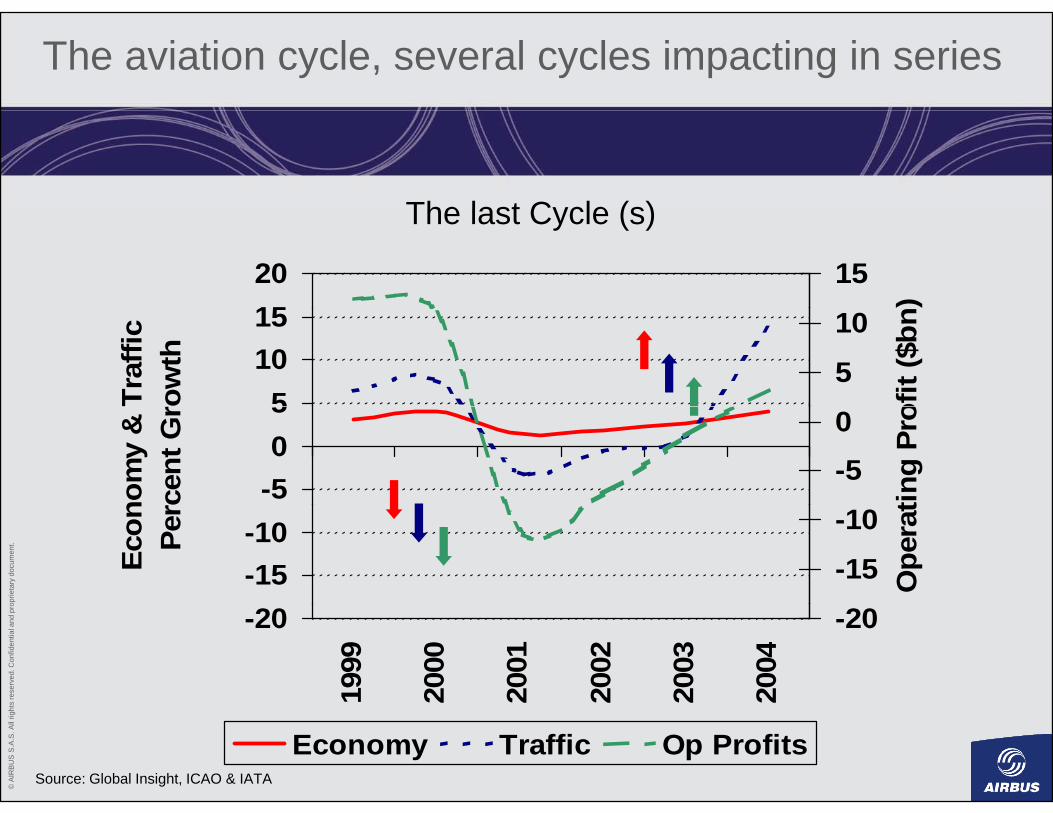
The aviation cycle, several cycles impacting in series
The last Cycle (s)
1520 15
)
The last Cycle (s)
51015
Traf
ficro
wth 5
10
ofit
($bn
-505
nom
y &
rc
ent G
r
-50
ting
Pro
oprie
tary
doc
umen
t.
-15-10
Econ Pe
r
-15
-10
Ope
rat
s re
serv
ed. C
onfid
entia
l and
pro -20
1999
2000
2001
2002
2003
2004
-20
© A
IRBU
S S.
A.S.
All
right
s
Source: Global Insight, ICAO & IATA
2 2 2 2 2Economy Traffic Op Profits

Economists believe recession has bottomed out
Real GDP year over year quarterly evolution (%)
14% World USA Western Europe Japan
Real GDP year-over-year quarterly evolution (%)
6%
10%
-2%
2%
oprie
tary
doc
umen
t.
-6%We are
here
s re
serv
ed. C
onfid
entia
l and
pro
2006 2007 2008 2009 2010 2011St th
-10%Q1 Q2 Q3 Q4 Q1 Q2 Q3 Q4 Q1 Q2 Q3 Q4 Q1 Q2 Q3 Q4 Q1 Q2 Q3 Q4 Q1 Q2 Q3 Q4
here
© A
IRBU
S S.
A.S.
All
right
s Strong growthsince 2004 Slowdown Deep crisis Recovery Complete
recovery
Source: Global Insight (January 2010), Airbus

Economists believe recession has bottomed out
Real GDP year over year quarterly evolution (%)
14% World USA Western Europe Japan Emerging economies
Real GDP year-over-year quarterly evolution (%)
6%
10%
-2%
2%
oprie
tary
doc
umen
t.
-6%We are
here
s re
serv
ed. C
onfid
entia
l and
pro
2006 2007 2008 2009 2010 2011St th
-10%Q1 Q2 Q3 Q4 Q1 Q2 Q3 Q4 Q1 Q2 Q3 Q4 Q1 Q2 Q3 Q4 Q1 Q2 Q3 Q4 Q1 Q2 Q3 Q4
here
© A
IRBU
S S.
A.S.
All
right
s Strong growthsince 2004 Slowdown Deep crisis Recovery Complete
recovery
Source: Global Insight (January 2010), Airbus

Economists believe recession has bottomed out
Real GDP year over year quarterly evolution (%)Real GDP year-over-year quarterly evolution (%)
14%World USA Western EuropeJapan Emerging economies China
6%
10%
-2%
2%
oprie
tary
doc
umen
t.
-6%We are
here
s re
serv
ed. C
onfid
entia
l and
pro
2006 2007 2008 2009 2010 2011St th
-10%Q1 Q2 Q3 Q4 Q1 Q2 Q3 Q4 Q1 Q2 Q3 Q4 Q1 Q2 Q3 Q4 Q1 Q2 Q3 Q4 Q1 Q2 Q3 Q4
here
© A
IRBU
S S.
A.S.
All
right
s Strong growthsince 2004 Slowdown Deep crisis Recovery Complete
recovery
Source: Global Insight (January 2010), Airbus
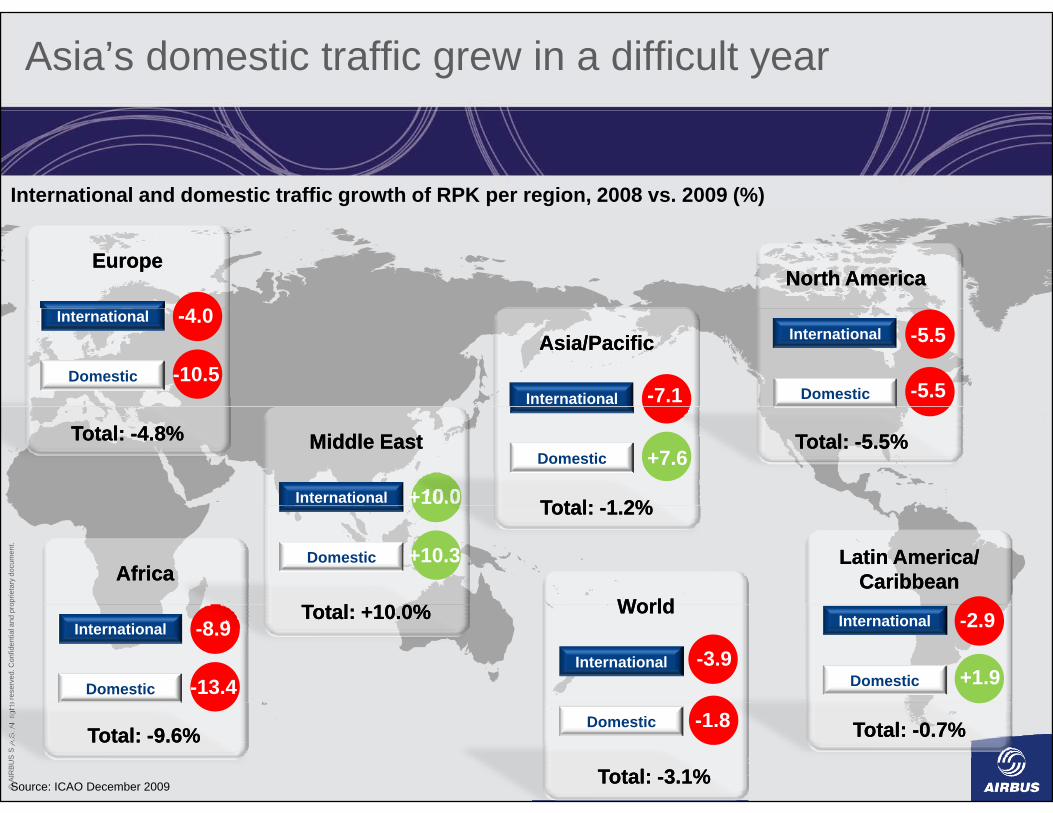
Asia’s domestic traffic grew in a difficult year
International and domestic traffic growth of RPK per region, 2008 vs. 2009 (%)
EuropeEurope
4 0
North AmericaNorth America
International
Domestic
-4.0
-10.5Asia/PacificAsia/Pacific
International -7.1
International
Domestic
-5.5
-5.5
Middle EastMiddle East
International +10.0
Domestic +7.6
Total:Total: 1 2%1 2%
Total: Total: --5.5%5.5%Total: Total: --4.8%4.8%
oprie
tary
doc
umen
t.
AfricaAfricaDomestic +10.3 Latin America/Latin America/
CaribbeanCaribbeanWorldWorld
Total: Total: --1.2%1.2%
%%
s re
serv
ed. C
onfid
entia
l and
pro
International
Domestic
-8.9
-13.4
International
Domestic
-2.9
+1.9
WorldWorld
International -3.9
Total: +10.0%Total: +10.0%
© A
IRBU
S S.
A.S.
All
right
s
Source: ICAO December 2009
Domestic -1.8 Total: Total: --0.7%0.7%Total: Total: --9.6%9.6%
Total: Total: --3.1%3.1%
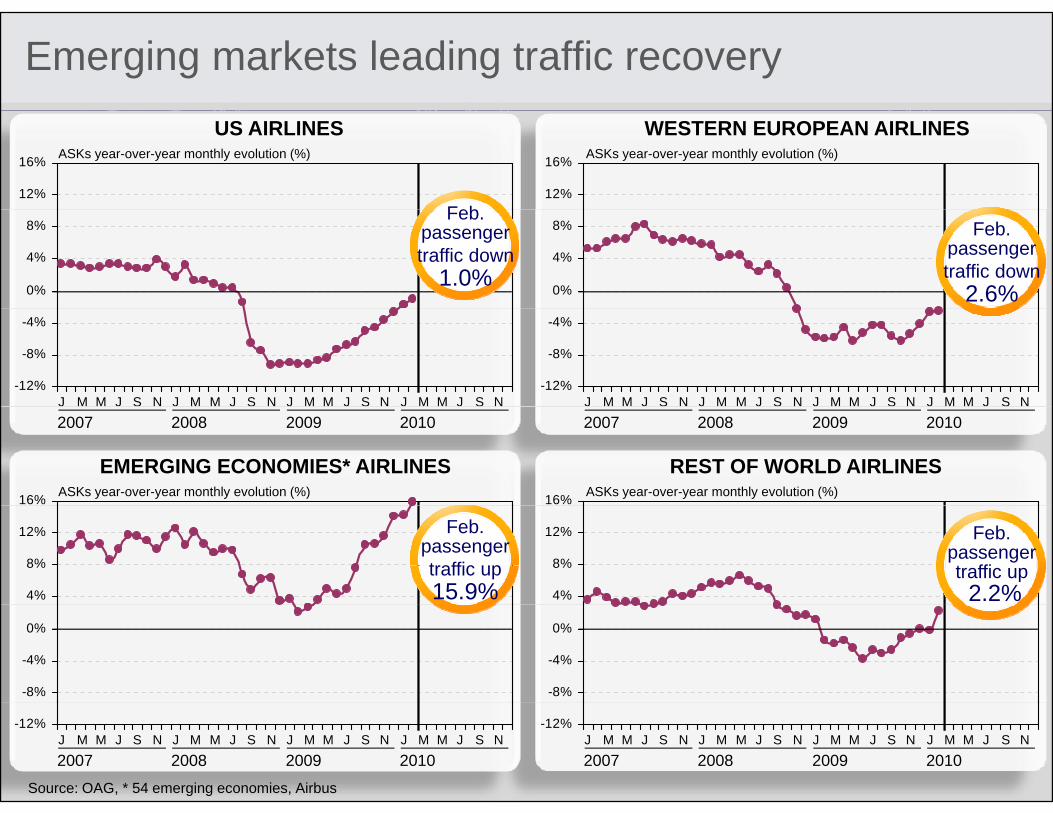
Emerging markets leading traffic recovery
12%
16% ASKs year-over-year monthly evolution (%)
12%
16% ASKs year-over-year monthly evolution (%)
US AIRLINES WESTERN EUROPEAN AIRLINES
Feb
0%
4%
8%
0%
4%
8%Feb.
passenger traffic down
1.0%
Feb. passenger traffic down
2.6%
-12%
-8%
-4%
J M M J S N J M M J S N J M M J S N J M M J S N-12%
-8%
-4%
J M M J S N J M M J S N J M M J S N J M M J S N2007 2008 2009 2010 2007 2008 2009 2010
16% ASKs year-over-year monthly evolution (%) 16% ASKs year-over-year monthly evolution (%)
EMERGING ECONOMIES* AIRLINES REST OF WORLD AIRLINES
oprie
tary
doc
umen
t.
4%
8%
12%
4%
8%
12%Feb. passenger traffic up15.9%
Feb. passenger traffic up2.2%
s re
serv
ed. C
onfid
entia
l and
pro
-8%
-4%
0%
-8%
-4%
0%
© A
IRBU
S S.
A.S.
All
right
s
Source: OAG, * 54 emerging economies, Airbus
-12%J M M J S N J M M J S N J M M J S N J M M J S N
-12%J M M J S N J M M J S N J M M J S N J M M J S N2007 2008 2009 20102007 2008 2009 2010
• Where is the industry today?• Economy• Traffic outlook
• Industry drivers
oprie
tary
doc
umen
t.
• Industry drivers
• Airbus GMF, 2009 – 2028
s re
serv
ed. C
onfid
entia
l and
pro Airbus GMF, 2009 2028
• Emerging markets
© A
IRBU
S S.
A.S.
All
right
s
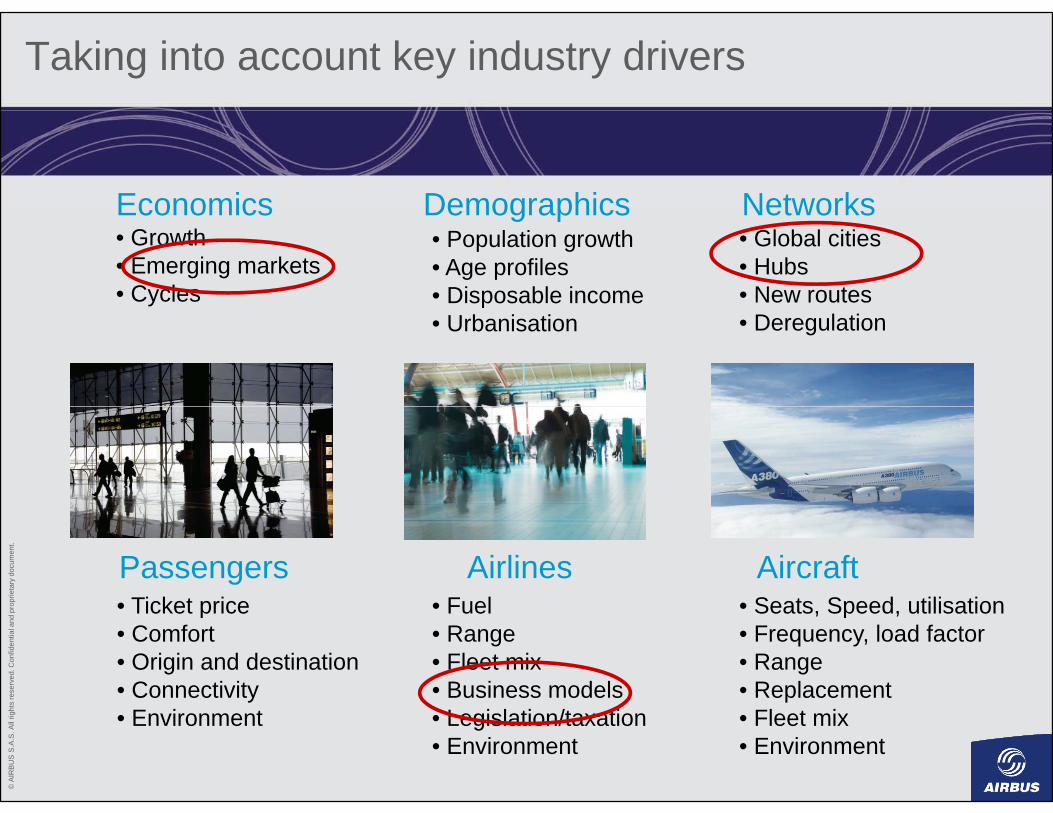
Taking into account key industry drivers
Economics Demographics NetworksEconomics• Growth• Emerging markets• Cycles
Demographics Networks• Population growth• Age profiles• Disposable income
• Global cities• Hubs• New routes
• Urbanisation • Deregulation
oprie
tary
doc
umen
t.
Airlines AircraftPassengers• Ticket price • Fuel • Seats Speed utilisation
s re
serv
ed. C
onfid
entia
l and
pro • Ticket price
• Comfort• Origin and destination• Connectivity
• Fuel• Range• Fleet mix• Business models
• Seats, Speed, utilisation• Frequency, load factor • Range• Replacement
© A
IRBU
S S.
A.S.
All
right
s
• Environment • Legislation/taxation• Environment
• Fleet mix• Environment

The world of 2028 will be very different from today
Ranking of countries by real GDPRanking of countries by real GDP
19881- US
20081- US
20281- US
a g o cou t es by ea Ga g o cou t es by ea G
US
2- Japan
3- Germany
2- Japan
3- China2- China 3- Japan
4- UK
5- France
6- Italy
4- Germany
5- UK
6- France
4- Germany
5- India 6- UK
oprie
tary
doc
umen
t.
7- Russia
8- Canada
9 Spain
7- Italy
8- Spain
9 C d
6 UK
7- France
8- Brazil
s re
serv
ed. C
onfid
entia
l and
pro 9- Spain
10- Brazil
11- Mexico
9- Canada
10- India
11- Brazil
9- Italy
10- Canada
11- South Korea
© A
IRBU
S S.
A.S.
All
right
s
12- China
Source: Global Insight (August 2009), Airbus
12- South Korea 12- Russia
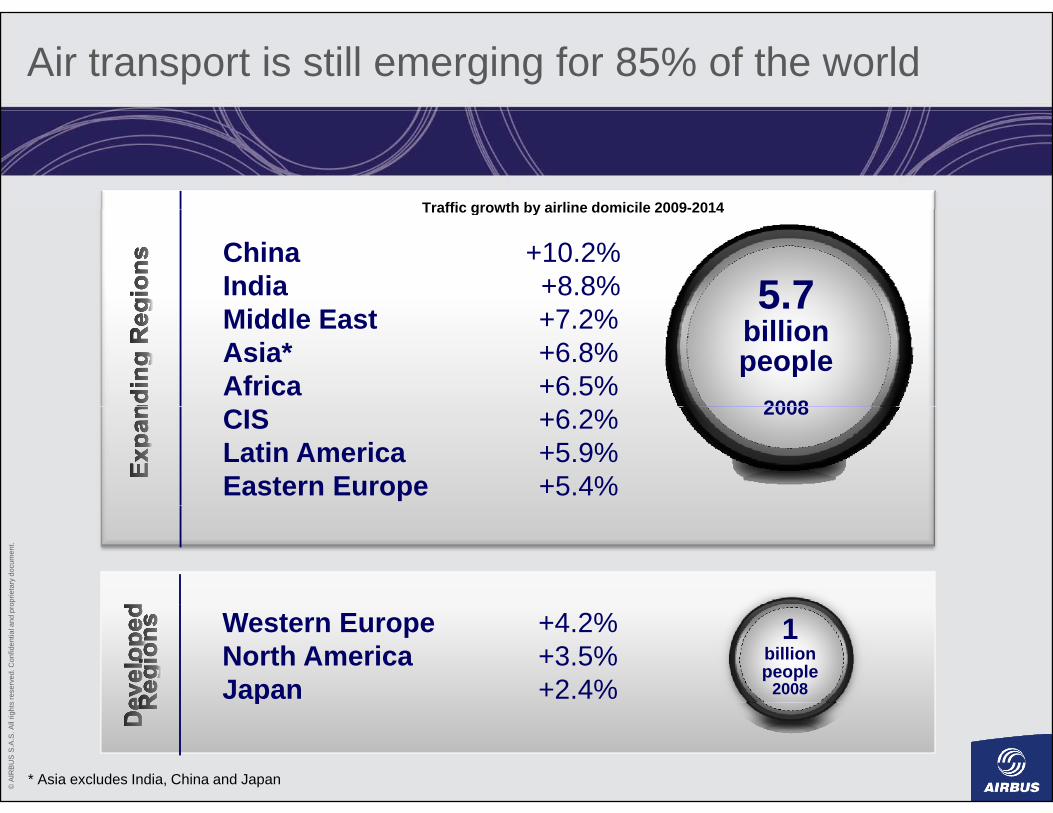
Air transport is still emerging for 85% of the world
Traffic growth by airline domicile 2009-2014
China +10.2%India +8.8% 5.7
Traffic growth by airline domicile 2009-2014
Middle East +7.2%Asia* +6.8%Africa +6.5%
5.7billionpeople
2008CIS +6.2%Latin America +5.9%Eastern Europe +5.4%
2008
oprie
tary
doc
umen
t.s
rese
rved
. Con
fiden
tial a
nd p
ro
Western Europe +4.2%North America +3.5%Japan +2.4%
1billionpeople
2008
© A
IRBU
S S.
A.S.
All
right
s
p
* Asia excludes India, China and Japan

Large potential to increase propensity to travel
10
SwitzerlandDenmark
Ireland
SwedenUKQatarCanada
UAE
Australia
MacaoSingapore
Hong Kong
New Zealand
Spain
Kuwait
Cyprus
Bahamas
Puerto Rico Greece
Malta
Bahrain
Barbados
Seychelles
Maldives
TrinidadFiji
St Lucia
M i i
USA
10
8
2 trips per
capita
Netherlands
Finland
JapanBelgium
France
GermanyItalyBrunei
KuwaitPuerto Rico
PortugalSouth Korea
Slovenia
IsraelTaiwan
Saudi Arabia
Czech Rep.
Estonia
HungarySlovakia
LatviaPanama
Suriname
j
Cape Verde
Samoa
Jordan
Poland
MauritiusMalaysia
Croatia
Mexico
Turkey
RussiaBrazil
1
pita
-20
08
0.11 trip per
World average
Equatorial GuineaBotswana
Bosnia
BrazilChina
India
Algeria
BelarusAngola
Nigeria
0,1
* per
cap
oprie
tary
doc
umen
t.
capita0.05 trip
per capitaIraq
BangladeshLesotho
Afghanistan
ChadNiger
0,01
Trip
s*
s re
serv
ed. C
onfid
entia
l and
pro
0,0010 5 000 10 000 15 000 20 000 25 000 30 000 35 000 40 000 45 000 50 000 55 000
© A
IRBU
S S.
A.S.
All
right
s
Passengers originating from a particular country Note: GDP in 2005 US$
Source: IATA PaxIS, Global Insight, Airbus
2008 Real GDP per Capita

A network of cities : 92% of the long haul traffic is from and/or to 37 “mega-cities”
37 “mega cities” in terms of37 mega-cities in terms of international air traffic demand
oprie
tary
doc
umen
t.s
rese
rved
. Con
fiden
tial a
nd p
ro©
AIR
BUS
S.A.
S. A
ll rig
hts
Destinations with more than 10 000 daily long haul pax

Emerging markets driving World urbanisation
5
6Population (billions)
Urban Population
4
5Today
2
3Rural Population
oprie
tary
doc
umen
t.
0
1Source: UN,Airbus
s re
serv
ed. C
onfid
entia
l and
pro
1980 1985 1990 1995 2000 2005 2010 2015 2020 2025 2030
© A
IRBU
S S.
A.S.
All
right
s

With continuing growth & urbanisation, the number of mega-cities will more than double
82 bi iti h l h l
MoreMega-cities82 big cities where long-haul passengers
will want to fly between in 20 yearsMega-cities
AAA B
A
oprie
tary
doc
umen
t.s
rese
rved
. Con
fiden
tial a
nd p
ro©
AIR
BUS
S.A.
S. A
ll rig
hts
Destinations with more than 10 000 daily long haul pax

Growth in the size and number of mega-cities
Main long haul VLA routes by 2028Main long-haul VLA routes by 2028
AAA B
A
oprie
tary
doc
umen
t.s
rese
rved
. Con
fiden
tial a
nd p
ro©
AIR
BUS
S.A.
S. A
ll rig
hts
Destinations with more than 10 000 daily long haul pax
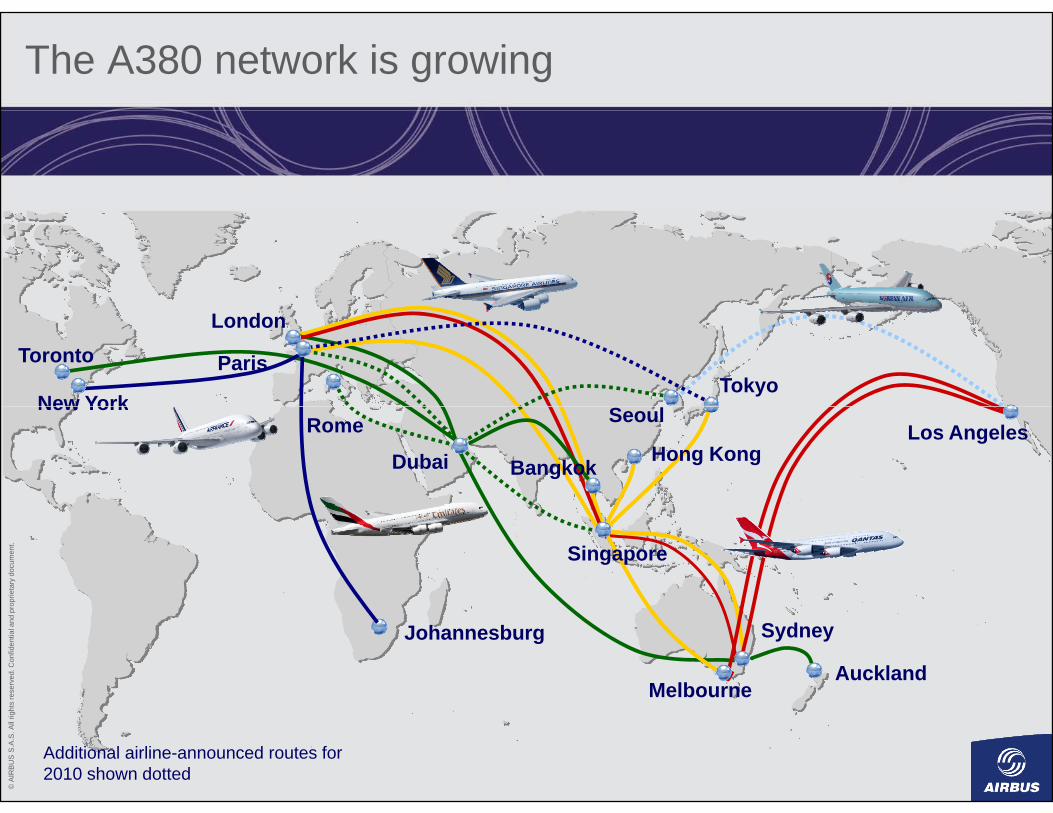
The A380 network is growing
Toronto
New York
London
ParisTokyo
New YorkRome
Dubai
Seoul
Hong KongBangkokLos Angeles
oprie
tary
doc
umen
t. Singapore
s re
serv
ed. C
onfid
entia
l and
pro
Auckland
Sydney
Melbourne
Johannesburg
© A
IRBU
S S.
A.S.
All
right
s
Additional airline-announced routes for 2010 shown dotted
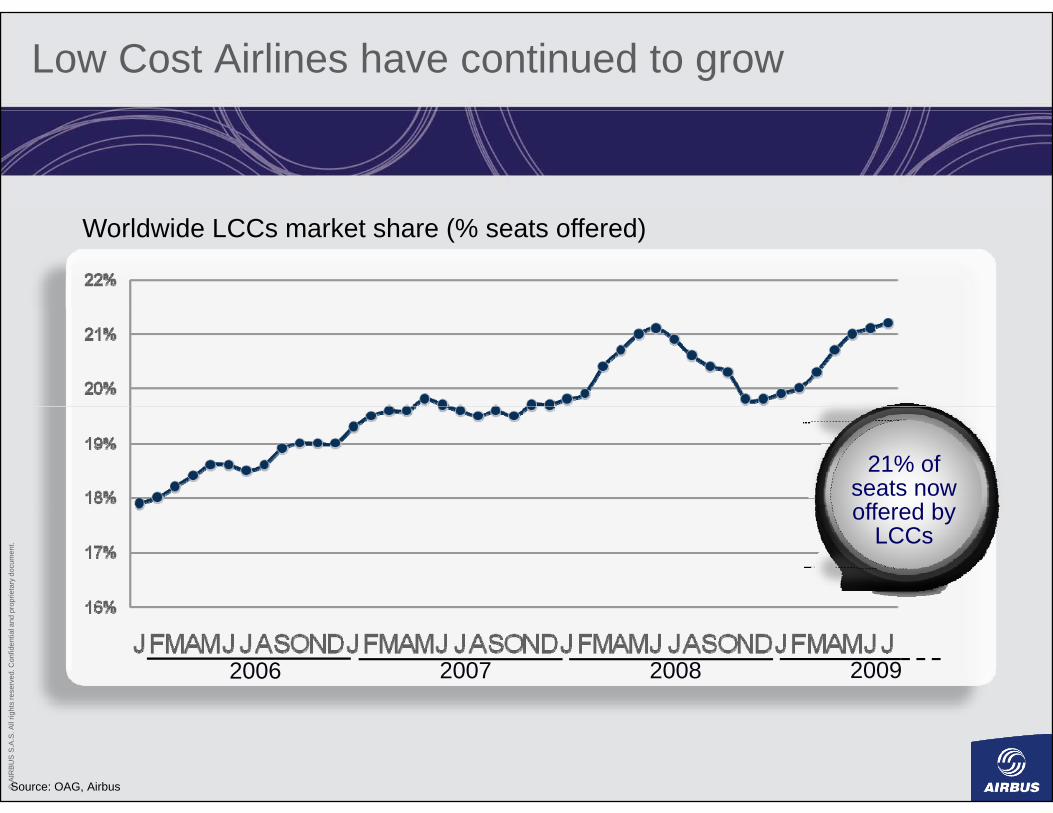
Low Cost Airlines have continued to grow
Worldwide LCCs market share (% seats offered)
21% of seats now
ff d b
oprie
tary
doc
umen
t.
offered by LCCs
s re
serv
ed. C
onfid
entia
l and
pro
2006 2007 2008 2009
© A
IRBU
S S.
A.S.
All
right
s
Source: OAG, Airbus

Low cost traffic as driver of traffic growth
Intra Asian traffic and LCC market share development, 2001 - 2009
6%
Seats (1,000s) LCC market share %Total Intra
Asian traffic
6%yearly growth*
LCC traffic
38%yearly growth*
oprie
tary
doc
umen
t.
LCC 2009
s re
serv
ed. C
onfid
entia
l and
pro
market share
14%
© A
IRBU
S S.
A.S.
All
right
s
Source: OAG (September traffic), Airbus
* Average annual growth rate
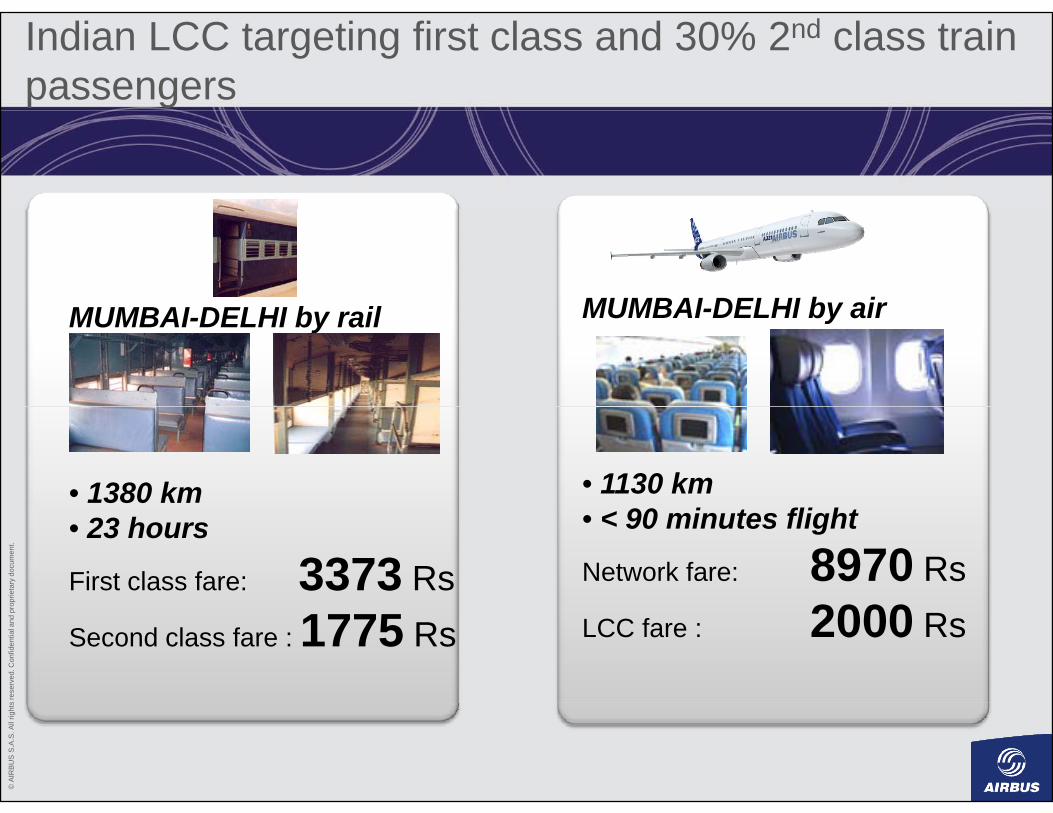
Indian LCC targeting first class and 30% 2nd class train passengers
MUMBAI DELHI b il MUMBAI DELHI by airMUMBAI-DELHI by rail MUMBAI-DELHI by air
• 1380 km • 1130 km
oprie
tary
doc
umen
t.
• 23 hours
First class fare: 3373 Rs
• < 90 minutes flight
Network fare: 8970 Rs2000
s re
serv
ed. C
onfid
entia
l and
pro
Second class fare : 1775 Rs LCC fare : 2000 Rs
© A
IRBU
S S.
A.S.
All
right
s

Low cost carriers spread their wings over Asia
Intra Asian LCC network, 09/2001 vs. 09/2009,
Sep. 2001 Sep. 2009
oprie
tary
doc
umen
t.
48 576Airport Airport
iiAirport Airport
ii
s re
serv
ed. C
onfid
entia
l and
pro 48 576 pairspairs
Average Average flight distanceflight distance
700km
pairspairs
Average Average flight distanceflight distance 1800
km
© A
IRBU
S S.
A.S.
All
right
s gggg km
Source: OAG

• Where is the industry today?• Economy• Traffic outlook
• Industry drivers
oprie
tary
doc
umen
t.
• Industry drivers
• Airbus GMF 2009 – 2028
s re
serv
ed. C
onfid
entia
l and
pro Airbus GMF 2009 2028
• Emerging markets
© A
IRBU
S S.
A.S.
All
right
s
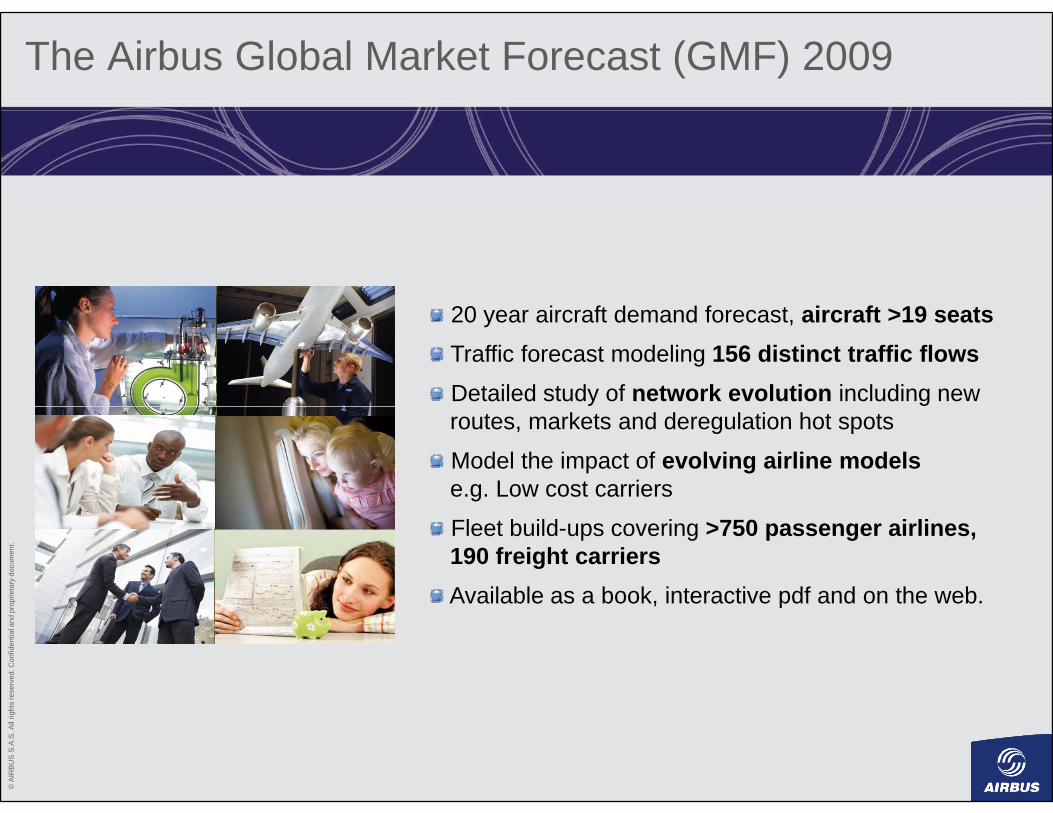
The Airbus Global Market Forecast (GMF) 2009
20 i ft d d f t i ft >19 t20 year aircraft demand forecast, aircraft >19 seatsTraffic forecast modeling 156 distinct traffic flowsDetailed study of network evolution including new routes, markets and deregulation hot spots
Model the impact of evolving airline modelse.g. Low cost carriers
oprie
tary
doc
umen
t.
Fleet build-ups covering >750 passenger airlines, 190 freight carriersAvailable as a book, interactive pdf and on the web.
s re
serv
ed. C
onfid
entia
l and
pro
, p
© A
IRBU
S S.
A.S.
All
right
s

Today’s passenger traffic 38% above 2000 level
RPK growth: 2008 vs. 2000
Europe29%
CIS+121%+29%
North America+7%
Middle East Int’lChina184%
+121%
Middle East Int’l+166%
+184%India
+192%
oprie
tary
doc
umen
t.
Latin America Int’l+40%
Africa Int’l+53%
Asia-Pacific Int’l+29%
192%
s re
serv
ed. C
onfid
entia
l and
pro 40% 53% +29%
© A
IRBU
S S.
A.S.
All
right
s
Source: ATA (North America), AEA (Europe), AAPA Int’l (Asia-Pacific), IATA Gabi (Latin America, Africa & Middle East), CAAC (China)

Air travel remains a growth market
20-year ld l
12
World annual traffic(RPKs - trillions)
ICAO t t l t ffi
AirbusGMF 2009
world annual traffic growth
4.7%
Ai t ffi
10
total traffic GMF 2009
Air trafficwill doublein the next15 years6
8Air traffic
has doubledevery 15 years
oprie
tary
doc
umen
t.
15 years
4
every 15 years
s re
serv
ed. C
onfid
entia
l and
pro
0
2
© A
IRBU
S S.
A.S.
All
right
s
Source: ICAO, Airbus
1970 1980 1990 2000 2010 2020 2030

Asia to lead in world traffic by 2028
20-year world annual traffic growth
Traffic by airline domicile
RPK (billi )
traffic growth4.7%
% of 2028 World RPKs
33%
20-year growth
6 0%
0 500 1,000 1,500 2,000 2,500 3,000 3,500
Asia
RPKs (billions)
2008 traffic 2009-2028 growth
% of 2008 World RPKs
26% 33%
26%
20%
6.0%
4.3%
2.4%
Europe
North America
2008 traffic 2009 2028 growth
28%
31%
oprie
tary
doc
umen
t. 8%
6%
6.9%
5.8%
Middle East
Latin America
5%
4%
s re
serv
ed. C
onfid
entia
l and
pro
4%
3%
5.9%
5.2%
CIS
Africa
3%
3%
© A
IRBU
S S.
A.S.
All
right
s

Flows including Africa, India and China to grow fastest
Domestic Turkey
Top 10 growth markets next 20 years
10.1%
N. Africa - P.R.China
Domestic India
9.4%
10.0%
Drivers:D l tiCIS - P.R.China
Sub S.Africa – P.R. China
9.4%
9.3%
• Deregulation• Economic growth• Population growth
oprie
tary
doc
umen
t. Middle East - S. Africa
Sub S.Africa – N. Africa
9.1%
9.0%
Population growth• Inter regional trade
s re
serv
ed. C
onfid
entia
l and
pro
P.R. China - S. Africa
N.Africa - S. Africa
8.7%
8.6%
© A
IRBU
S S.
A.S.
All
right
s
P.R.China - Russia 8.5%

India will be the fastest growing country for air travel for the next 10 years
RPK growth: annual average 2009RPK growth: annual average 2009--20182018
E rope
g o t a ua a e age 009g o t a ua a e age 009 0 80 8
CISEurope6.2%
North America8 7%
6.4%
Middle East6.1%
8.7%
12.2%
oprie
tary
doc
umen
t.
Asia-Pacific6.8%
Africa7.9%
s re
serv
ed. C
onfid
entia
l and
pro
India World
© A
IRBU
S S.
A.S.
All
right
s
2009-2018 2019-2028 20-year growth
7.9% 6.6% 7.3%
2009-2018 2019-2028 20-year growth
4.6% 4.8% 4.7%
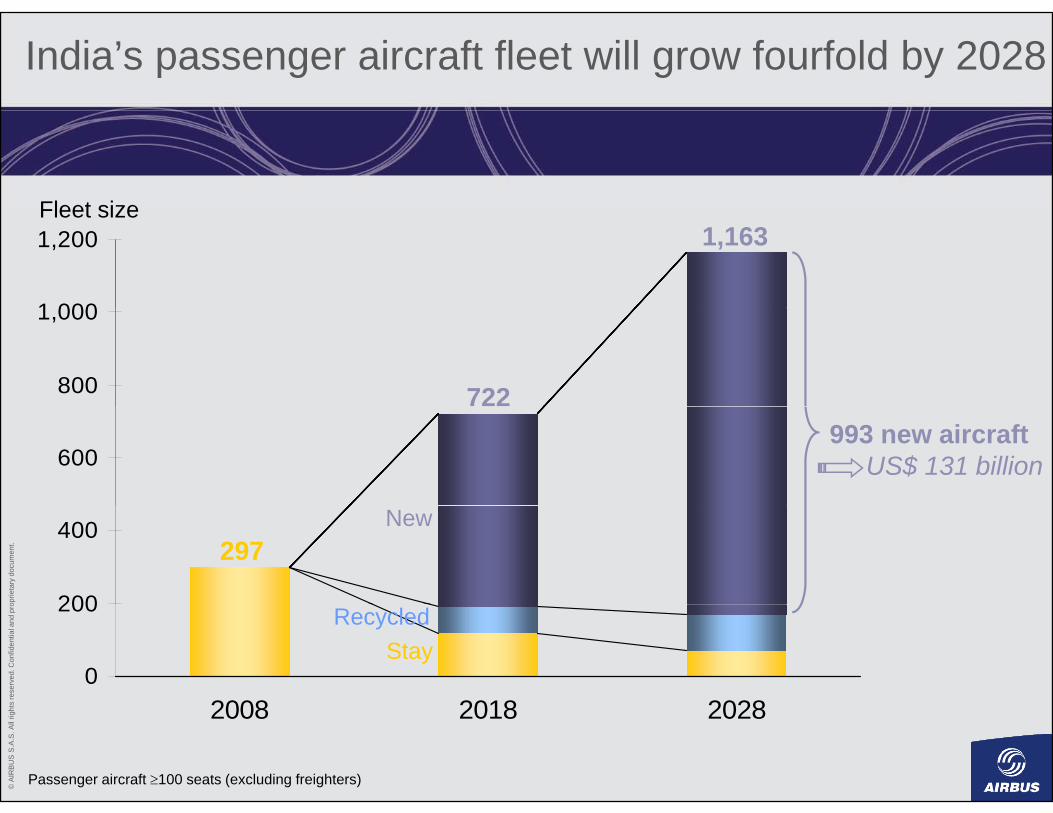
India’s passenger aircraft fleet will grow fourfold by 2028
Fleet size
1 000
1,200Fleet size
1,163
800
1,000
722
600993 new aircraft
US$ 131 billion
oprie
tary
doc
umen
t.
200
400297
New
s re
serv
ed. C
onfid
entia
l and
pro
0
200
2008 2018 2028
RecycledStay
© A
IRBU
S S.
A.S.
All
right
s 2008 2018 2028
Passenger aircraft ≥100 seats (excluding freighters)
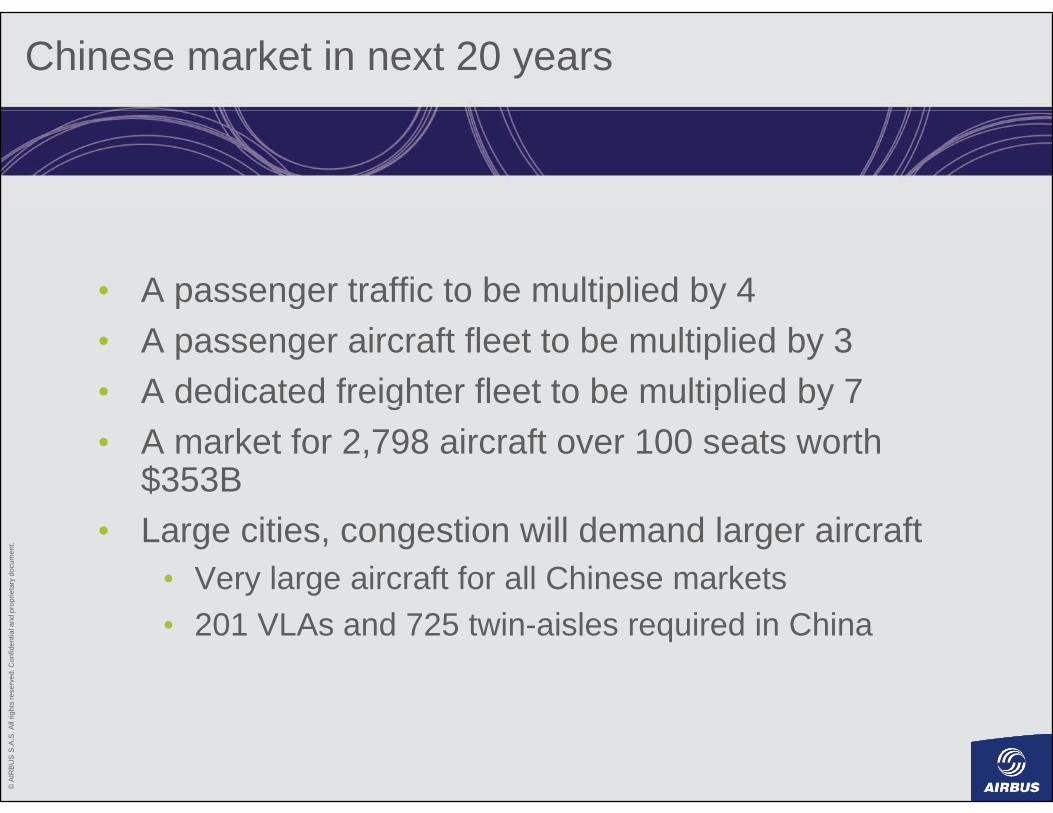
Chinese market in next 20 years
• A passenger traffic to be multiplied by 4 p g p y• A passenger aircraft fleet to be multiplied by 3• A dedicated freighter fleet to be multiplied by 7g p y• A market for 2,798 aircraft over 100 seats worth
$353B
oprie
tary
doc
umen
t. • Large cities, congestion will demand larger aircraft• Very large aircraft for all Chinese markets
s re
serv
ed. C
onfid
entia
l and
pro
• 201 VLAs and 725 twin-aisles required in China
© A
IRBU
S S.
A.S.
All
right
s

Mainland China will need 2,798 new passenger & freighter aircraft over the next 20 years
1,8721,872 single-aisles
725725 twin-aisles725725 twin-aisles
oprie
tary
doc
umen
t.
201201 very large aircraft
s re
serv
ed. C
onfid
entia
l and
pro
y g
© A
IRBU
S S.
A.S.
All
right
s
Market value of $353 billion
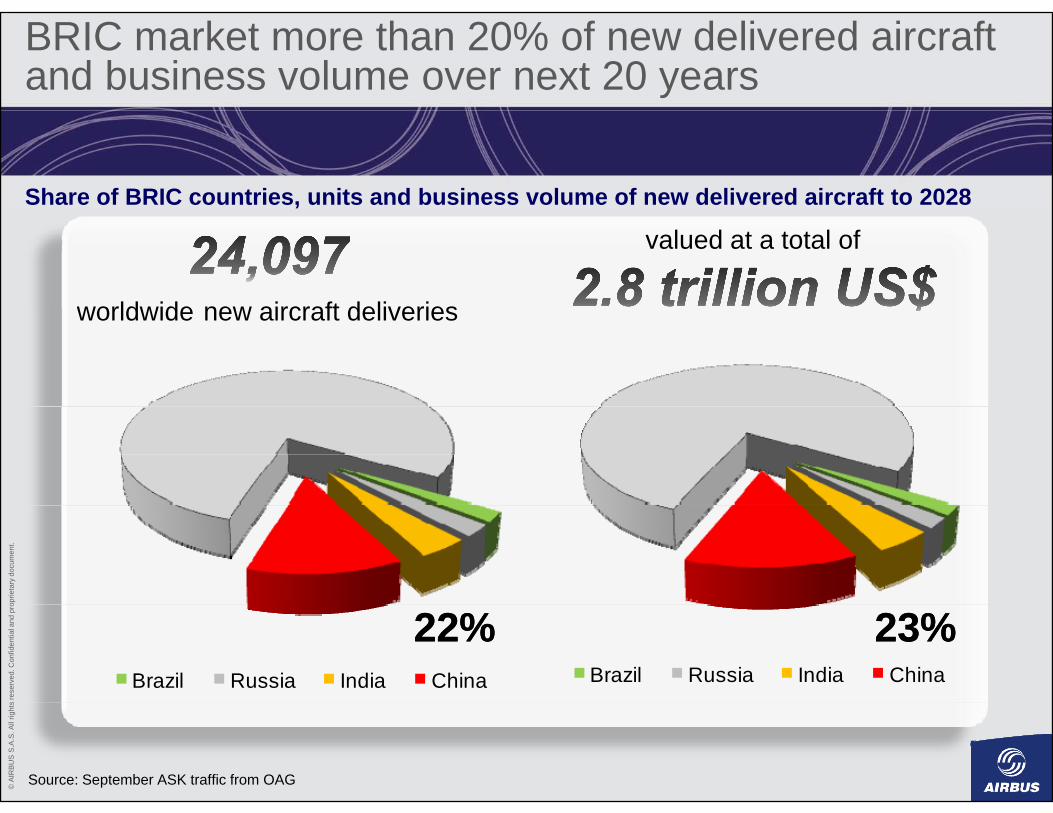
BRIC market more than 20% of new delivered aircraft and business volume over next 20 years
Share of BRIC countries, units and business volume of new delivered aircraft to 2028
worldwide new aircraft deliveries
valued at a total of
worldwide new aircraft deliveries
oprie
tary
doc
umen
t.s
rese
rved
. Con
fiden
tial a
nd p
ro
Brazil Russia India ChinaBrazil Russia India China
22%22% 23%23%
© A
IRBU
S S.
A.S.
All
right
s
Source: September ASK traffic from OAG

Other emerging countries as big as China and India combined
3 000Population (millions)
2,500
3,000
China and India today:
2,000China
more countries to
follow
1,50021 countries
2 billion people
oprie
tary
doc
umen
t.
500
1,000
IndiaBrazilUkraine
R iTurkey
s re
serv
ed. C
onfid
entia
l and
pro
0
500
ArgentinaIndonesiaRussia
© A
IRBU
S S.
A.S.
All
right
s
Emerging countries of tomorrow
Emerging countries of today

Related Documents


![Jianyi Zhang Andrew Gordon Wilson arXiv:1902.03932v2 [cs.LG] … · 2020. 5. 13. · Andrew Gordon Wilson New York University andrewgw@cims.nyu.edu ABSTRACT The posteriors over neural](https://static.cupdf.com/doc/110x72/5ff4ecea7fe9606d0f2a240f/jianyi-zhang-andrew-gordon-wilson-arxiv190203932v2-cslg-2020-5-13-andrew.jpg)