The changing face of global fossil fuel carbon dioxide emissions Robert Andres, Tom Boden Carbon Dioxide Information Analysis Center Oak Ridge National Laboratory U.S.A. [email protected] Common Future, Paris, 2015, 1/15

Welcome message from author
This document is posted to help you gain knowledge. Please leave a comment to let me know what you think about it! Share it to your friends and learn new things together.
Transcript
The changing face of global fossil fuel carbon dioxide emissions
Robert Andres, Tom Boden
Carbon Dioxide Information Analysis Center Oak Ridge National Laboratory
U.S.A.
Common Future, Paris, 2015, 1/15
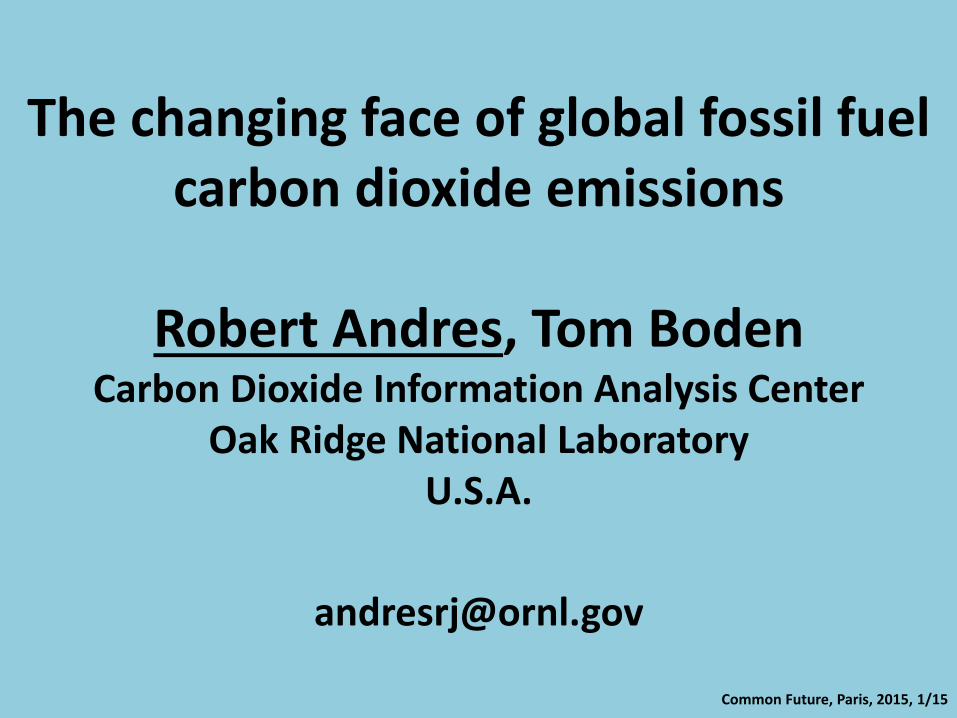
A quantitative view of the carbon cycle
Ciais et al., 2013 Common Future, Paris, 2015, 2/15
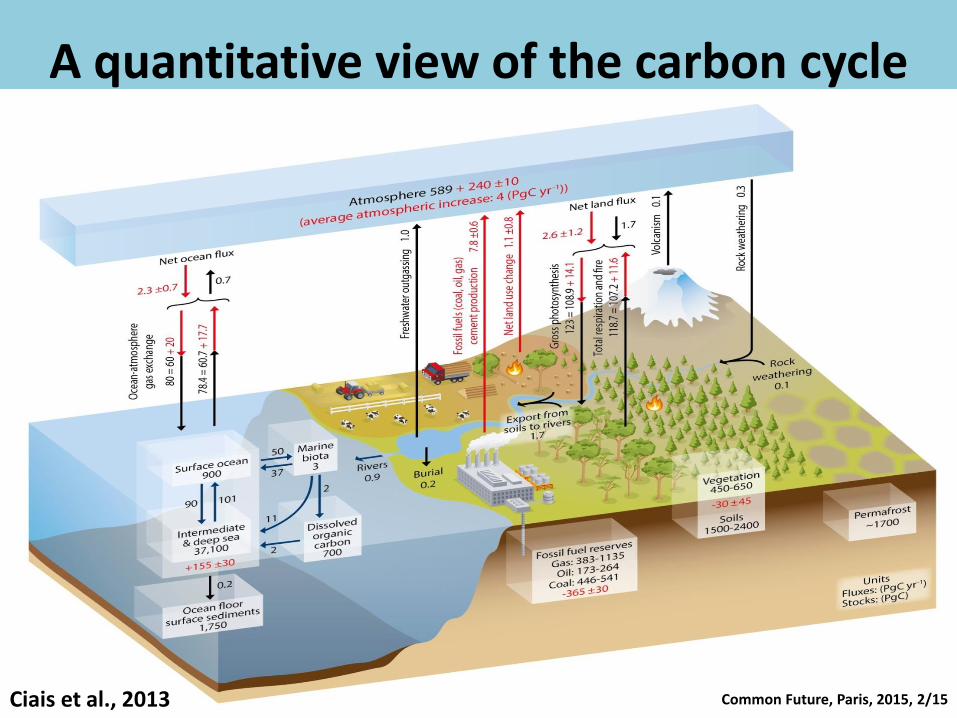
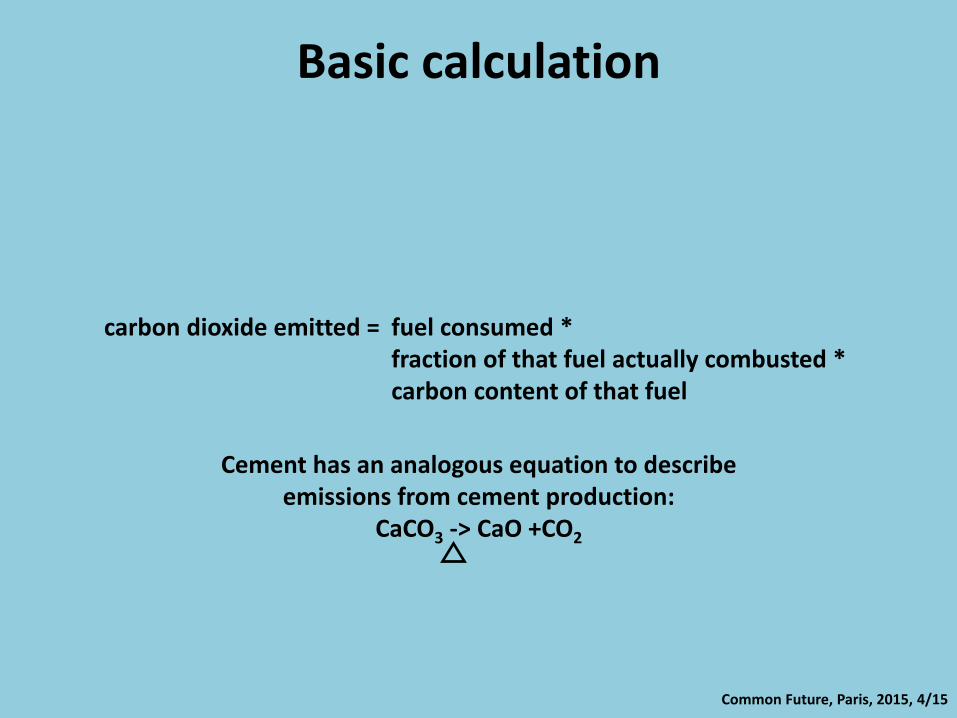
Basic calculation
carbon dioxide emitted = fuel consumed * fraction of that fuel actually combusted * carbon content of that fuel
Common Future, Paris, 2015, 3/15
Basic calculation
carbon dioxide emitted = fuel consumed * fraction of that fuel actually combusted * carbon content of that fuel
Cement has an analogous equation to describe emissions from cement production:
CaCO3 -> CaO +CO2
Common Future, Paris, 2015, 4/15
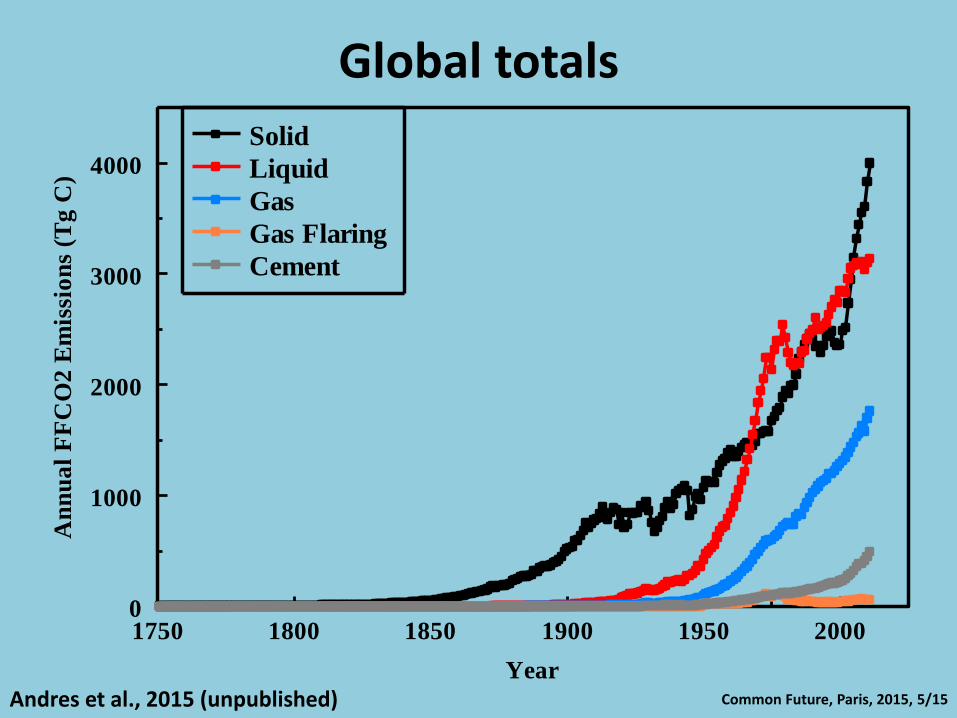
Global totals
Andres et al., 2015 (unpublished) Year
1750 1800 1850 1900 1950 2000
An
nu
al
FF
CO
2 E
mis
sio
ns
(Tg
C)
0
1000
2000
3000
4000
Solid
Liquid
Gas
Gas Flaring
Cement
Common Future, Paris, 2015, 5/15
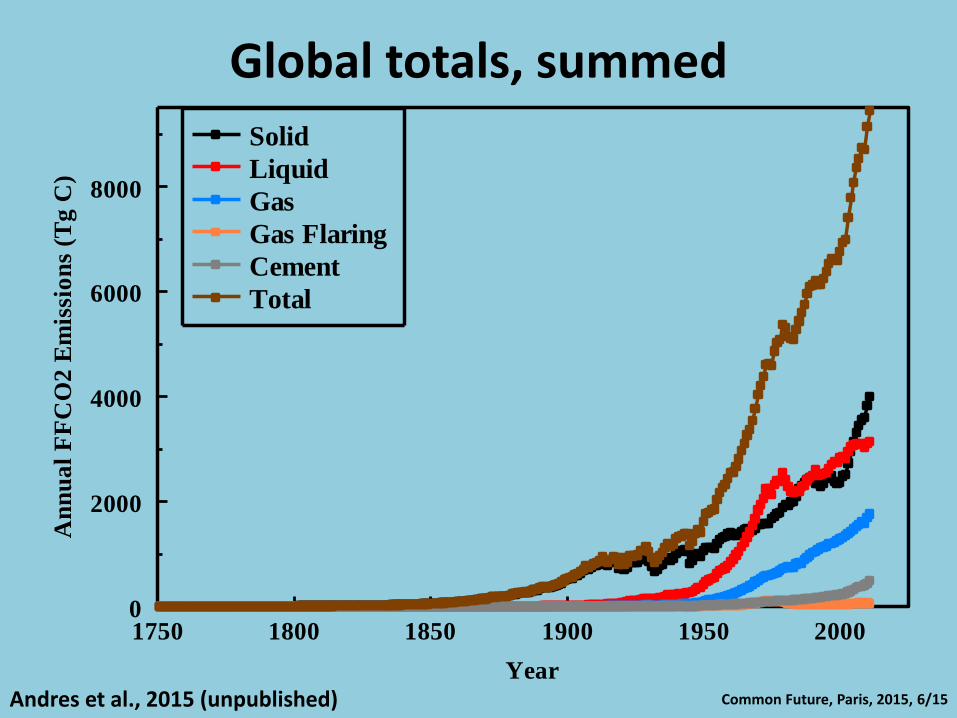
Global totals, summed
Andres et al., 2015 (unpublished) Year
1750 1800 1850 1900 1950 2000
An
nu
al
FF
CO
2 E
mis
sio
ns
(Tg
C)
0
2000
4000
6000
8000
Solid
Liquid
Gas
Gas Flaring
Cement
Total
Common Future, Paris, 2015, 6/15
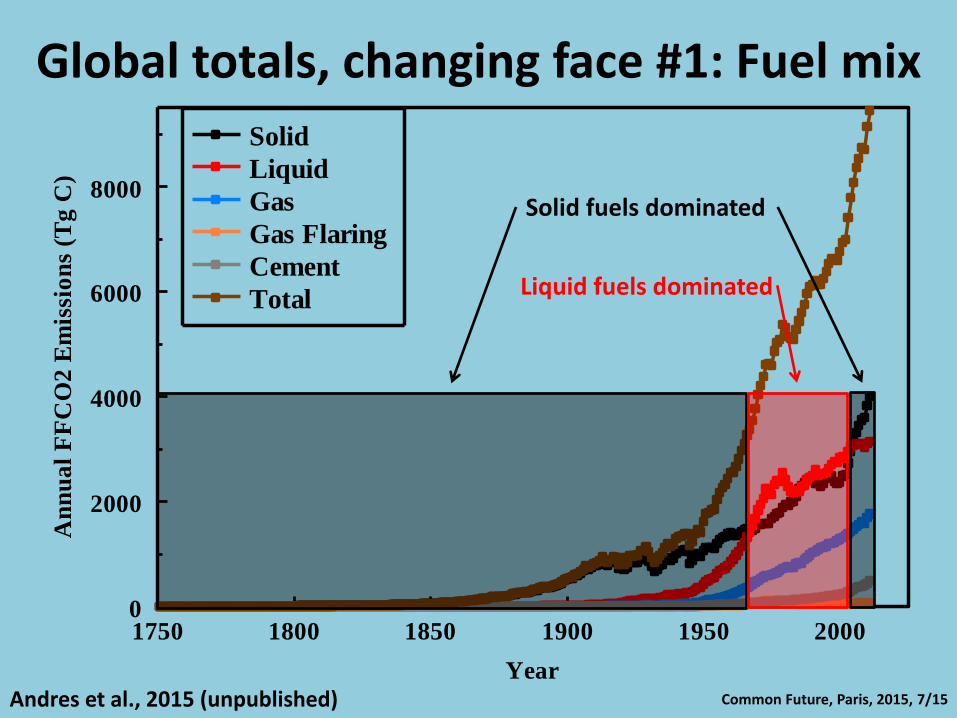
Global totals, changing face #1: Fuel mix
Andres et al., 2015 (unpublished) Year
1750 1800 1850 1900 1950 2000
An
nu
al
FF
CO
2 E
mis
sio
ns
(Tg
C)
0
2000
4000
6000
8000
Solid
Liquid
Gas
Gas Flaring
Cement
Total
Solid fuels dominated
Liquid fuels dominated
Common Future, Paris, 2015, 7/15
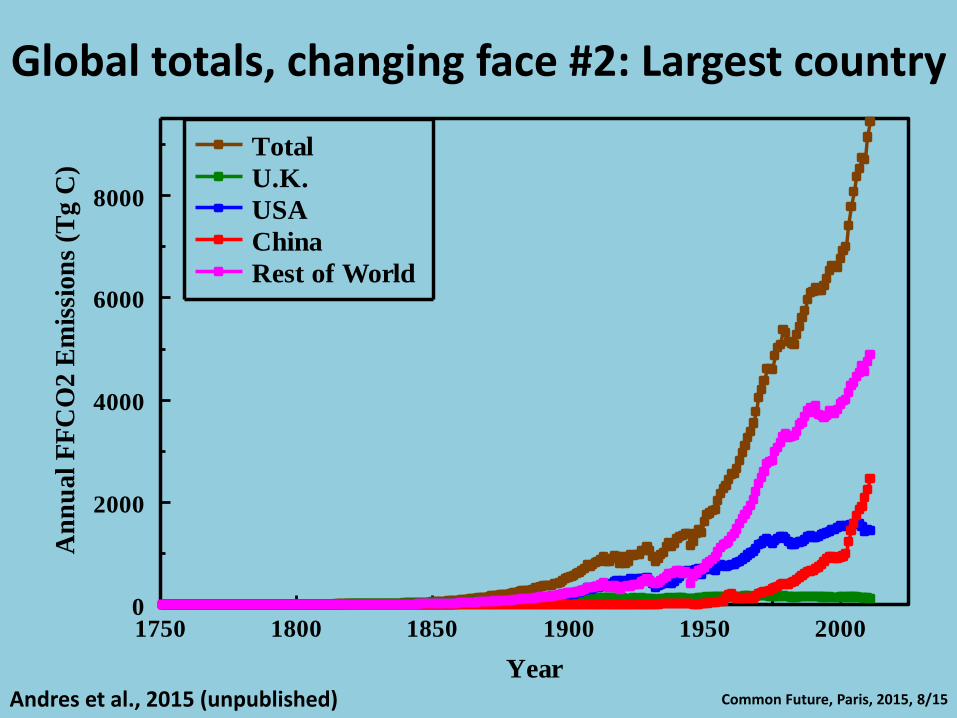
Global totals, changing face #2: Largest country
Andres et al., 2015 (unpublished) Year
1750 1800 1850 1900 1950 2000
An
nu
al
FF
CO
2 E
mis
sion
s (T
g C
)
0
2000
4000
6000
8000
Total
U.K.
USA
China
Rest of World
Common Future, Paris, 2015, 8/15
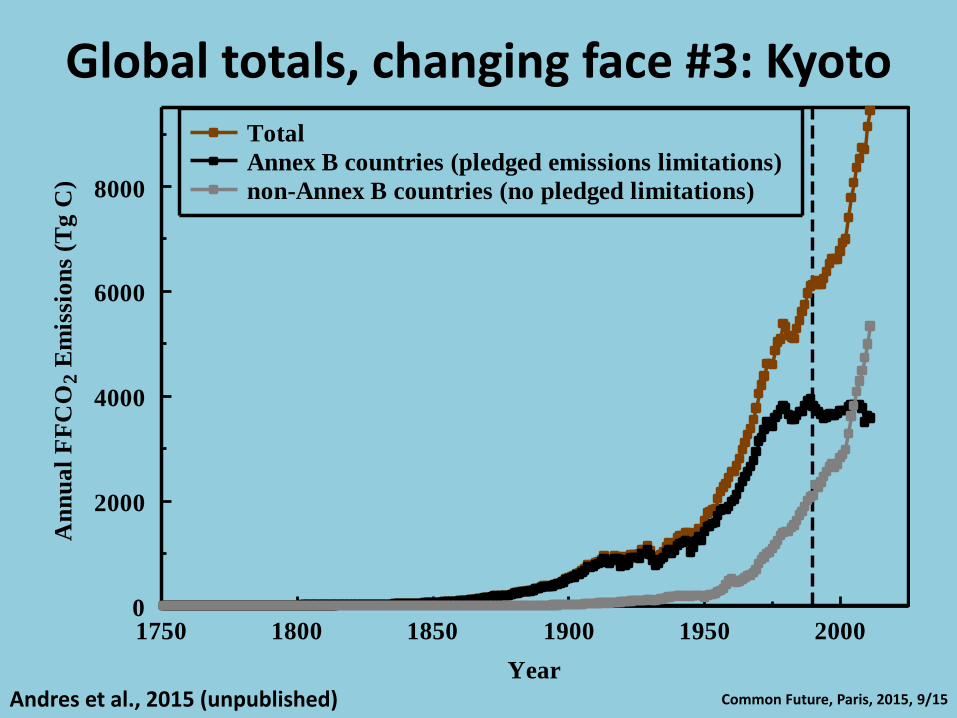
Global totals, changing face #3: Kyoto
Andres et al., 2015 (unpublished) Year
1750 1800 1850 1900 1950 2000
An
nu
al
FF
CO
2 E
mis
sio
ns
(Tg
C)
0
2000
4000
6000
8000
Total
Annex B countries (pledged emissions limitations)
non-Annex B countries (no pledged limitations)
Common Future, Paris, 2015, 9/15
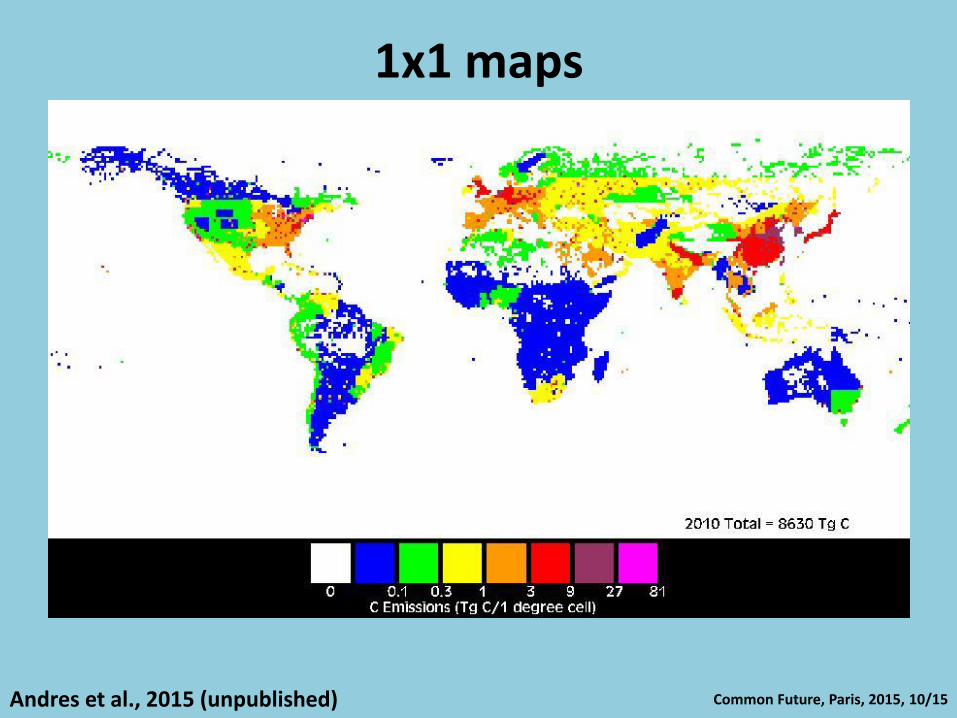
1x1 maps
Andres et al., 2015 (unpublished) Common Future, Paris, 2015, 10/15
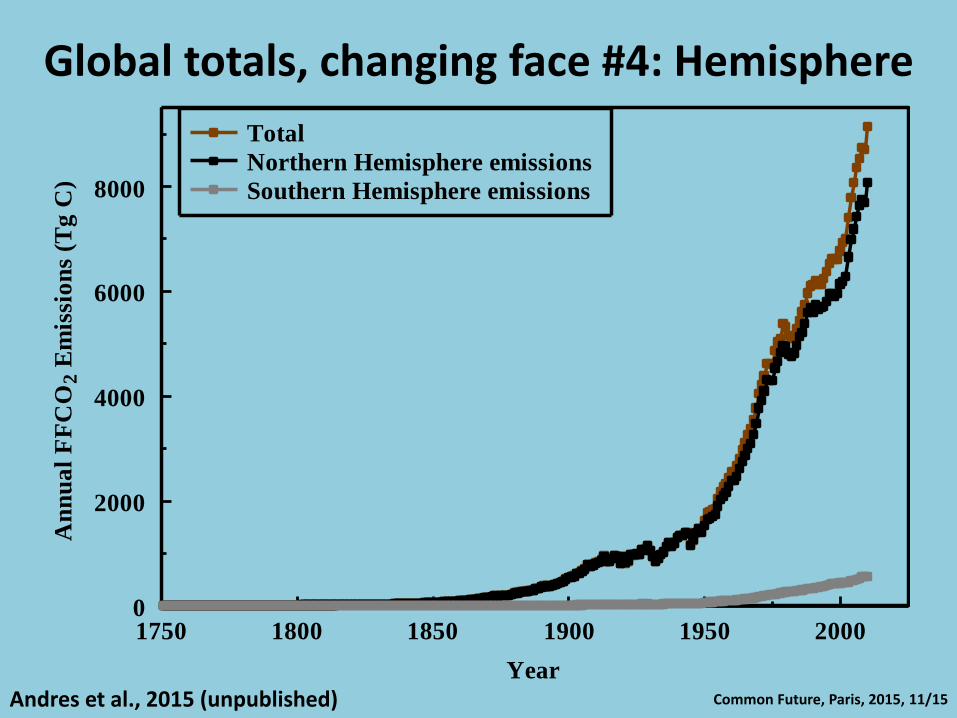
Global totals, changing face #4: Hemisphere
Andres et al., 2015 (unpublished) Common Future, Paris, 2015, 11/15
Year
1750 1800 1850 1900 1950 2000
An
nu
al
FF
CO
2 E
mis
sio
ns
(Tg
C)
0
2000
4000
6000
8000
Total
Northern Hemisphere emissions
Southern Hemisphere emissions
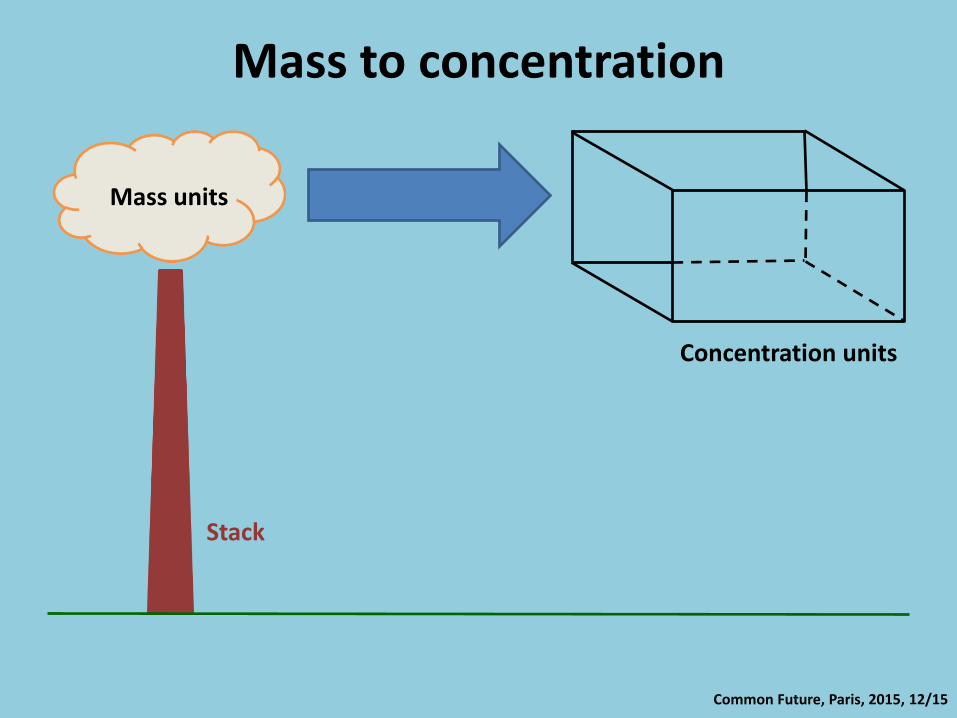
Mass to concentration
Mass units
Concentration units
Stack
Common Future, Paris, 2015, 12/15
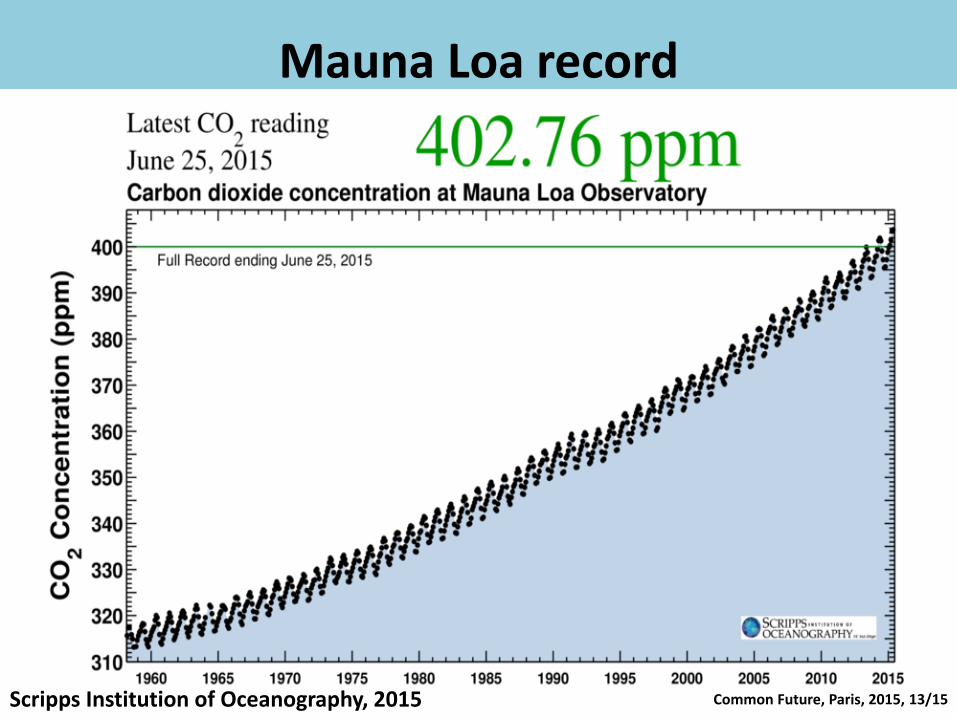
Mauna Loa record
Scripps Institution of Oceanography, 2015 Common Future, Paris, 2015, 13/15
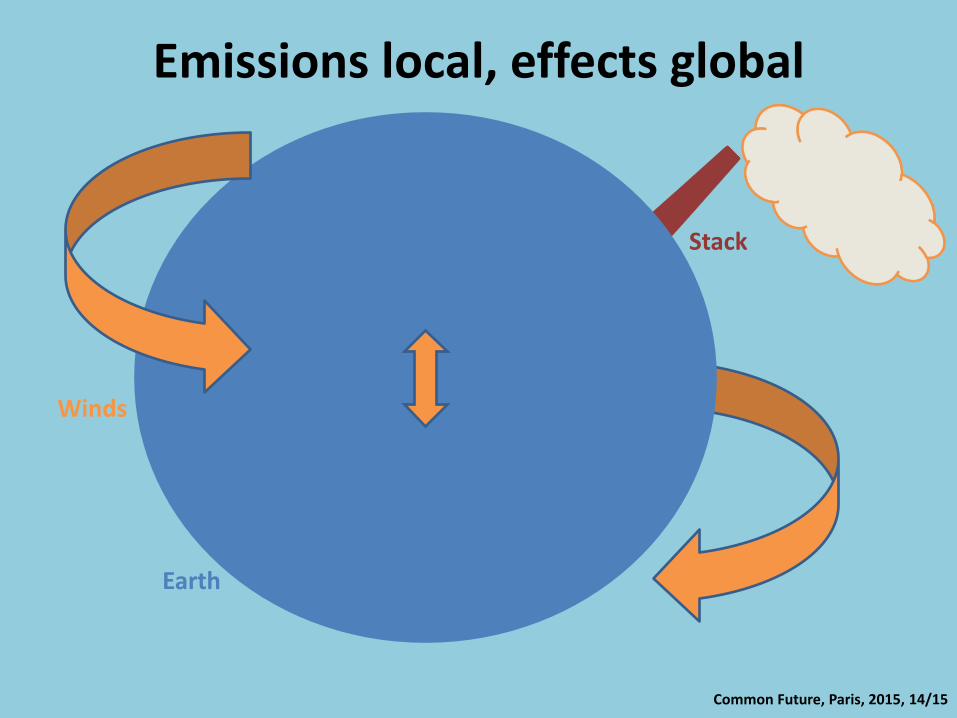
Emissions local, effects global
Stack
Earth
Winds
Common Future, Paris, 2015, 14/15
Conclusions/Implications
1. FFCO2 emissions are a primary driver of the atmospheric disequilibrium impacting and changing other components in the global carbon cycle upon which modern day concerns of climate change are based.
2. FFCO2 emissions can be characterized in a variety of ways (e.g., fuel type, national totals, Kyoto Protocol status, geography, …).
3. In terms of global climate change concerns, it does not matter from which individual country emissions originated. It is the total quantity of CO2 in the atmosphere that is of ultimate concern to climate change processes.
Common Future, Paris, 2015, 15/15

Global carbon cycle context
a
Year
1960 1970 1980 1990 2000 2010
Co
mp
on
ent
Ch
an
ge
(Pg
C/y
r)
-2
0
2
4
6
8
10fossil fuelsland useatmospheric growthoceanic uptaketerrestrial biosphere
Year
1960 1970 1980 1990 2000 2010
Co
mp
on
ent
Un
cert
ain
ty (
Pg
C/y
r)
0.0
0.3
0.6
0.9
b
Year
1960 1970 1980 1990 2000 2010
Com
pon
ent
Un
cert
ain
ty (
% o
f co
mp
on
ent)
0
10
20
30
40
50
60
70
80
c d
Year
1960 1970 1980 1990 2000 2010Com
pon
ent
Un
cert
ain
ty (
% o
f co
mp
on
ent
sum
)
0
2
4
6
8
10
12fossil fuels, 1-D dependentfossil fuels, 3-Dland useatmospheric growthoceanic uptaketerrestrial biosphere
Common Future, Paris, 2015, 16/15 Andres et al., 2014
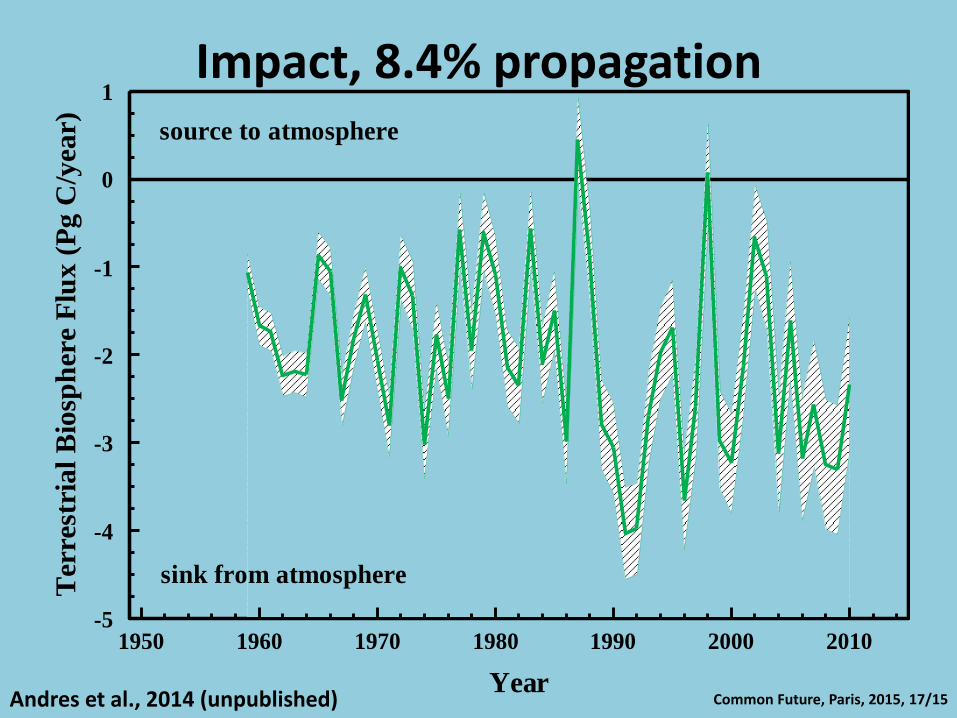
Impact, 8.4% propagation source to atmosphere
Ter
rest
rial
Bio
sph
ere
Flu
x (
Pg C
/yea
r)
-5
-4
-3
-2
-1
0
1
Year
1950 1960 1970 1980 1990 2000 2010
sink from atmosphere
Common Future, Paris, 2015, 17/15 Andres et al., 2014 (unpublished)
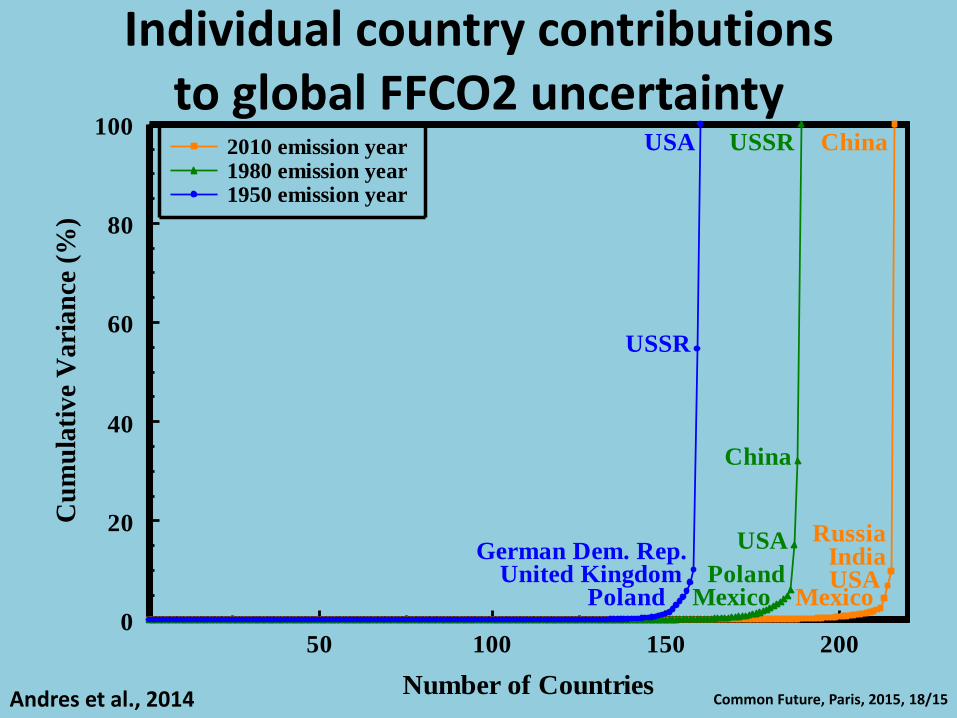
Individual country contributions to global FFCO2 uncertainty
Russia
China
IndiaUSA
Mexico
USA
Poland
China
Mexico
USSR
United KingdomGerman Dem. Rep.
USA
Poland
USSR
Number of Countries
50 100 150 200
Cu
mu
lati
ve
Vari
an
ce (
%)
0
20
40
60
80
1002010 emission year1980 emission year1950 emission year
Common Future, Paris, 2015, 18/15 Andres et al., 2014
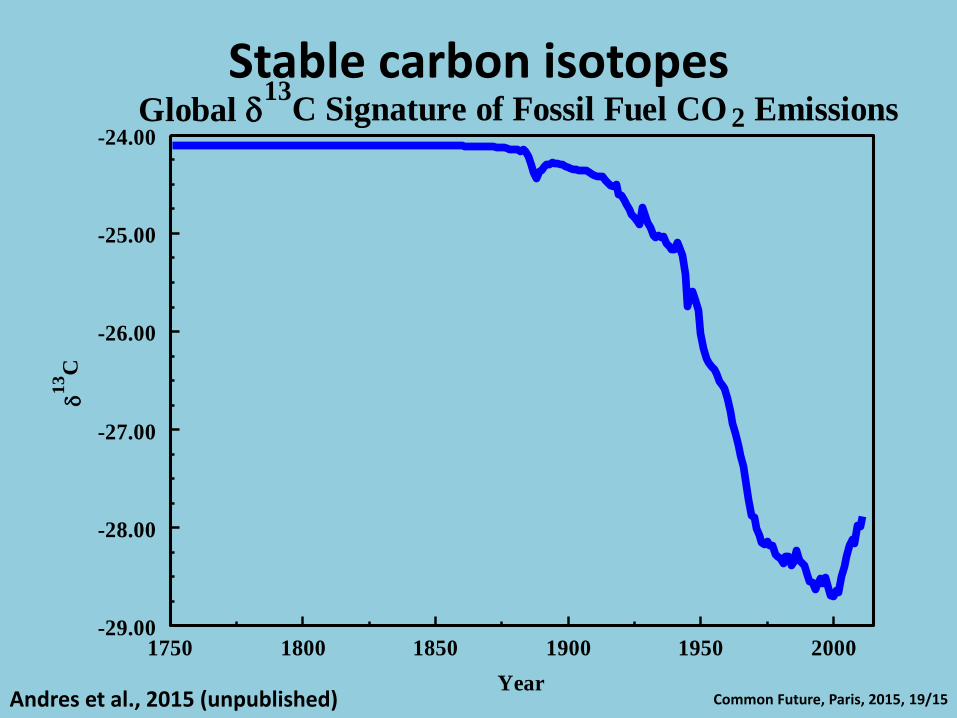
Stable carbon isotopes
Common Future, Paris, 2015, 19/15 Year
1750 1800 1850 1900 1950 2000
1
3C
-29.00
-28.00
-27.00
-26.00
-25.00
-24.00Global
13C Signature of Fossil Fuel CO 2 Emissions
Andres et al., 2015 (unpublished)
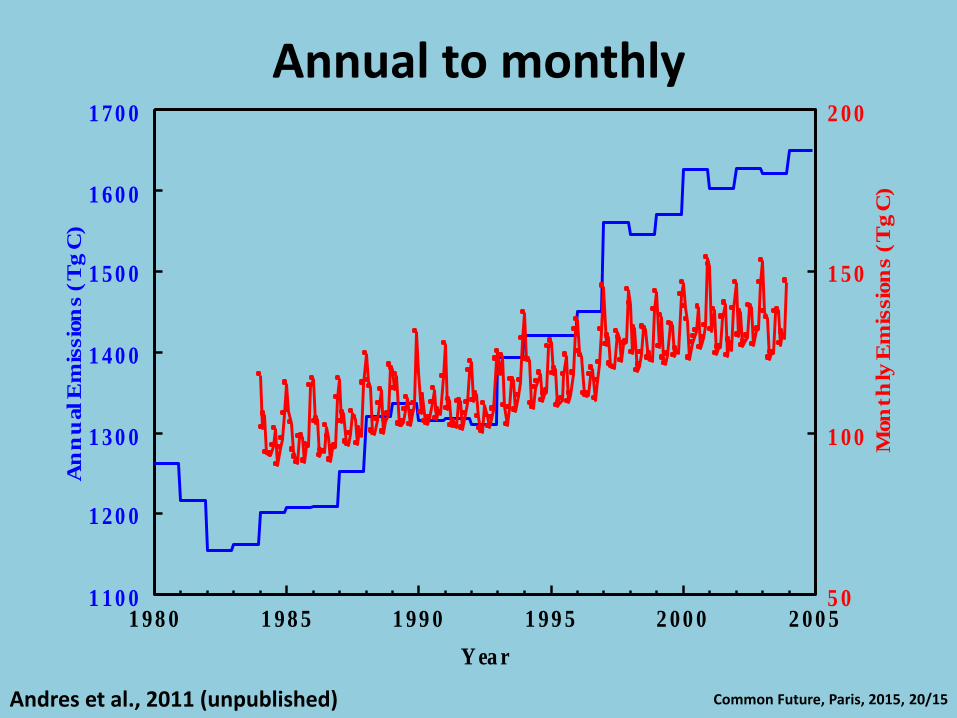
Annual to monthly
Y ea r
1 98 0 1 98 5 1 99 0 1 99 5 2 00 0 2 00 5
An
nu
al E
mis
sio
ns (
Tg C
)
1 10 0
1 20 0
1 30 0
1 40 0
1 50 0
1 60 0
1 70 0
Mon
th
ly E
mis
sio
ns (
Tg C
)
5 0
1 00
1 50
2 00
Common Future, Paris, 2015, 20/15 Andres et al., 2011 (unpublished)
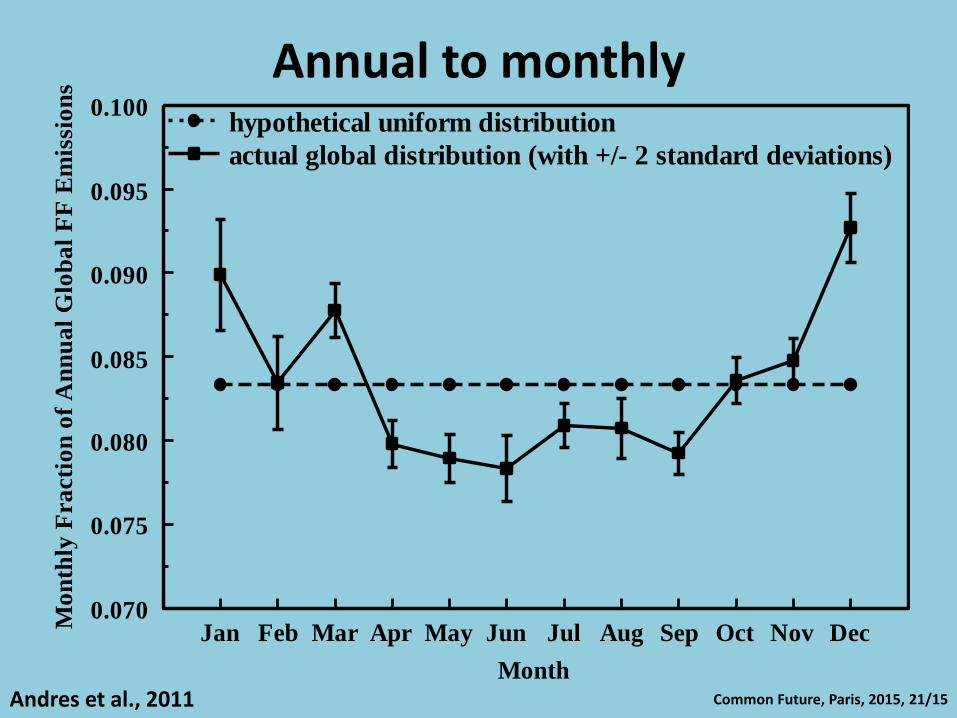
Annual to monthly
Month
Jan Feb Mar Apr May Jun Jul Aug Sep Oct Nov Dec
Mo
nth
ly F
ra
cti
on
of
An
nu
al
Glo
ba
l F
F E
mis
sio
ns
0.070
0.075
0.080
0.085
0.090
0.095
0.100hypothetical uniform distribution
actual global distribution (with +/- 2 standard deviations)
Common Future, Paris, 2015, 21/15 Andres et al., 2011
Related Documents