2010 Report on the Estuary ander Maten udy V Lower Columbia River Estuary Partnership : J Photo Investing for Results O ur 2010 Report on the Estuary is a five-year assessment of our progress to improve the overall health of the lower Columbia River. It gives us the opportunity to take a broad look at the state of the river so we can focus future investments where they can be most effective. We track five measures: pollutant levels, land cover trends, citizen engagement, habitat restoration and endangered species. The Estuary Partnership is involved with all these efforts, sometimes supporting existing entities and sometimes leading implementation. We have made progress since 2005. Regional partners have restored 16,235 acres of habitat, achieving the Estuary Partnership 1999 Management Plan goal of restoring 16,000 acres by 2010. We completed three years of toxics monitoring. Estuary Partnership applied learning programs reached 84,545 students and adults. The States have invested in toxics reduction within their waters; and with NOAA they have completed recovery plans for threatened and endangered salmonids. EPA, USGS and NOAA completed several one-time studies that improve our understanding of contaminants. EPA designated the Columbia Basin a Great Water Body. In February, Congressman Blumenauer and Senator Merkley introduced the Columbia River Restoration Act of 2010 to formally raise the stature of the Columbia to that of the Chesapeake Bay and other great water bodies. There have been challenges. Investment in the Columbia lags far behind other major water bodies and the river remains degraded. The 16,000 acres of restored habitat returns less than half the acres lost since 1880 and on-going habitat loss is not being measured. Only one site along the lower 146 miles is monitored regularly for contaminants. Land use changes and their impact are not tracked. As existing problems are addressed, we aren’t sure what new ones we may be creating. The road ahead is clearer. We must institute and sustain a monitoring program that measures what is in the system, contaminant sources, and impacts on wildlife and human health to direct actions to reduce contamination. Investment in habitat restoration needs to include all aspects of projects and link to toxics reduction. We need to acknowledge that results come slowly; earth systems measure time in thousands of years, not a human lifetime and certainly not two or four year cycles. Results may come from one or two large actions; more likely it will be the accumulation of many actions. The degradation did not occur in one or two places from one or two actions. We need to talk about the impacts of not taking action. We need to remember that the decisions we make today are better than those we made five years ago and we hope not as good as the ones we will make in 2015. The region has made progress and has shown unprecedented ability to work together, learn more and adapt to changing conditions and needs. The problems we are addressing, we created. They are solvable. What’s Inside: Water Quality Pollutant Level Trends 2 Land Use Land Cover Trends 6 Stewardship Education Program Trends 8 Citizen Volunteering Trends 9 Reference Lower Columbia River Map 10 Habitat Restoration Trends 12 Endangered Species Recovery Trends 16 Status Report From the Executive Director 20 www.lcrep.org

Welcome message from author
This document is posted to help you gain knowledge. Please leave a comment to let me know what you think about it! Share it to your friends and learn new things together.
Transcript
2010Report on the Estuary
ande
r Mat
enud
y V
Lower Columbia River Estuary Partnership : JPh
oto
Investing for Results
Our 2010 Report on the Estuary
is a five-year assessment of our progress to improve the
overall health of the lower Columbia River. It gives us the opportunity to take a broad look at the state of the river so we can focus future investments where they can be most effective.
We track five measures: pollutant levels, land cover trends, citizen engagement, habitat restoration and endangered species. The Estuary Partnership is involved with all these efforts, sometimes supporting existing entities and sometimes leading implementation.
We have made progress since 2005.
Regional partners have restored 16,235 acres of habitat, achieving the Estuary Partnership 1999 Management Plan goal of restoring 16,000 acres by 2010. We completed three years of toxics monitoring. Estuary Partnership applied learning programs reached 84,545 students and adults. The States have invested in toxics reduction within their waters; and with NOAA they have completed recovery plans
for threatened and endangered salmonids. EPA, USGS and NOAA completed several one-time studies that improve our understanding of contaminants. EPA designated the Columbia Basin a Great Water Body. In February, Congressman Blumenauer and Senator Merkley introduced the Columbia River Restoration Act of 2010 to formally raise the stature of the Columbia to that of the Chesapeake Bay and other great water bodies.
There have been challenges.
Investment in the Columbia lags far behind other major water bodies and the river remains degraded. The 16,000 acres of restored habitat returns less than half the acres lost since 1880 and on-going habitat loss is not being measured. Only one site along the lower 146 miles is monitored regularly for contaminants. Land use changes and their impact are not tracked. As existing problems are addressed, we aren’t sure what new ones we may be creating.
The road ahead is clearer.
We must institute and sustain a monitoring program that measures
what is in the system, contaminant sources, and impacts on wildlife and human health to direct actions to reduce contamination. Investment in habitat restoration needs to include all aspects of projects and link to toxics reduction.
We need to acknowledge that results come slowly; earth systems measure time in thousands of years, not a human lifetime and certainly not two or four year cycles. Results may come from one or two large actions; more likely it will be the accumulation of many actions. The degradation did not occur in one or two places from one or two actions. We need to talk about the impacts of not taking action. We need to remember that the decisions we make today are better than those we made five years ago and we hope not as good as the ones we will make in 2015.
The region has made progress and has shown unprecedented ability to work together, learn more and adapt to changing conditions and needs. The problems we are addressing, we created. They are solvable.
What’s Inside:
Water QualityPollutant Level Trends . . . . . . . . 2
Land UseLand Cover Trends . . . . . . . . . . . 6
StewardshipEducation Program Trends . . . . 8Citizen Volunteering Trends . . . . 9
ReferenceLower Columbia River Map . . . 10
HabitatRestoration Trends . . . . . . . . . . 12
Endangered SpeciesRecovery Trends . . . . . . . . . . . . 16
Status ReportFrom the Executive Director . . . 20
www.lcrep.org
2 Lower Columbia River Estuary Partnership
Water Quality
Estuary Partnership Goals: Protect the ecosystem and species • Reduce toxic and conventional pollution • Provide information about the river to a range of audiences
Are pollutant levels in the lower Columbia River increasing or decreasing?
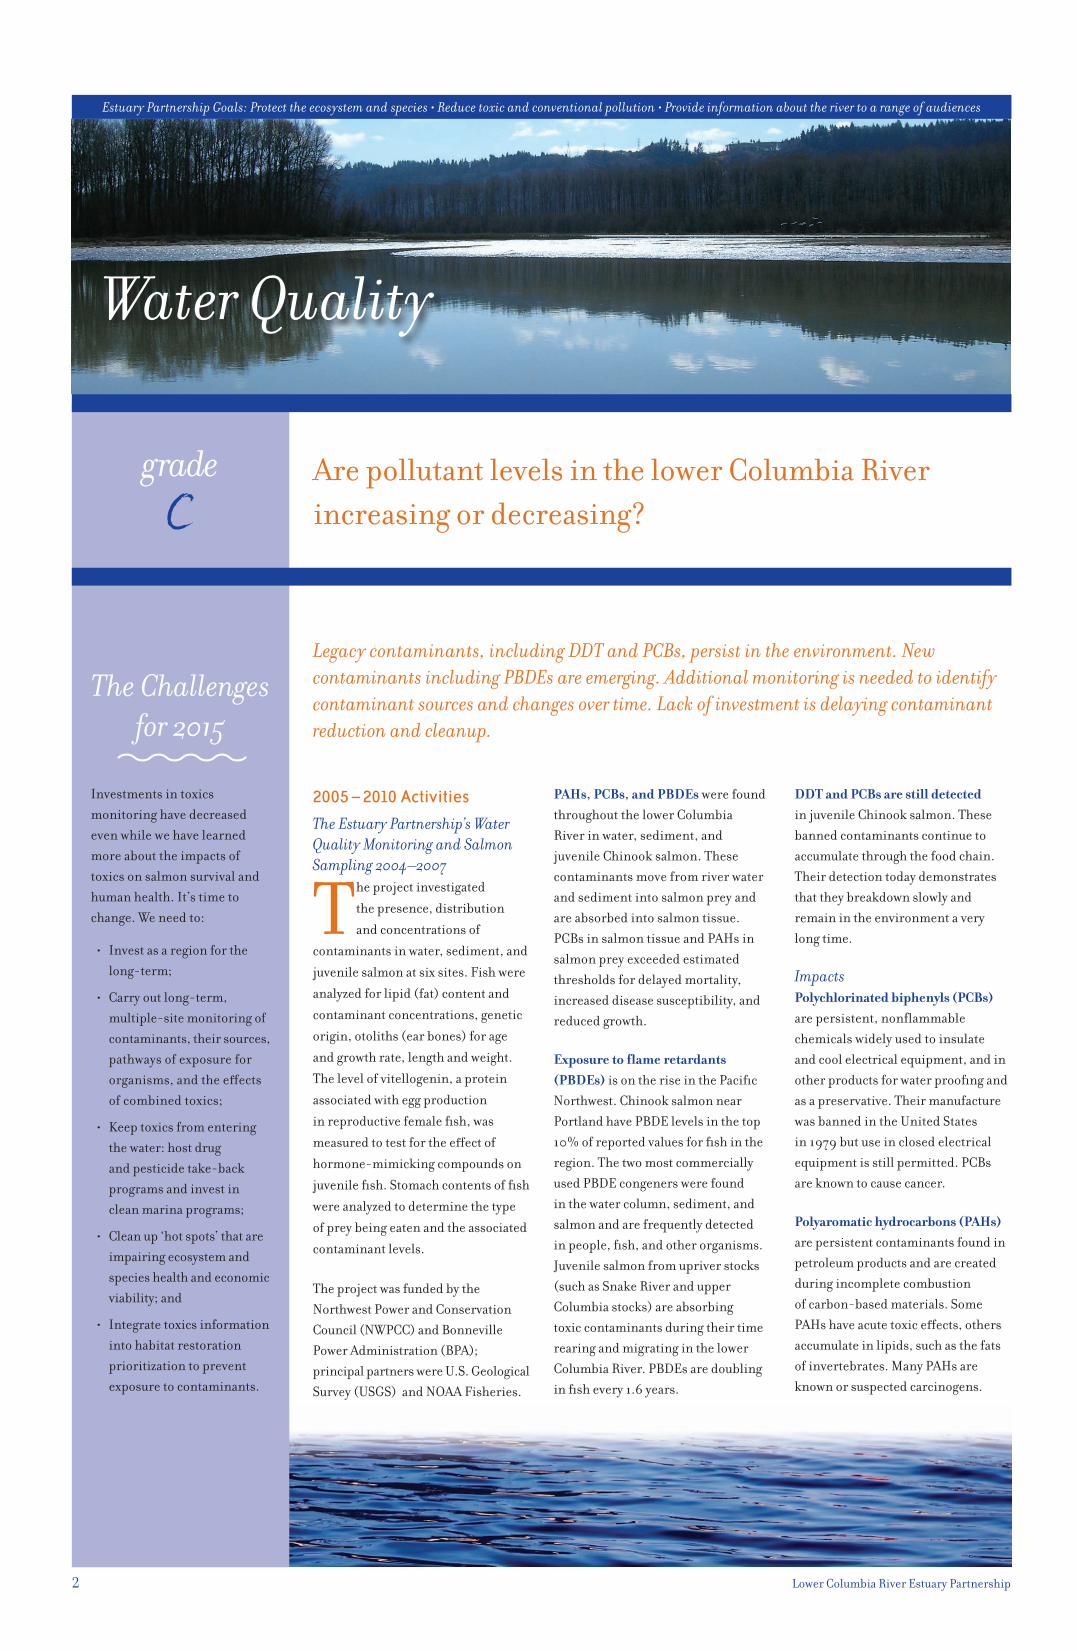
Legacy contaminants, including DDT and PCBs, persist in the environment . New contaminants including PBDEs are emerging . Additional monitoring is needed to identify contaminant sources and changes over time . Lack of investment is delaying contaminant reduction and cleanup .
2005 – 2010 Activities The Estuary Partnership’s Water Quality Monitoring and Salmon Sampling 2004–2007
The project investigated
the presence, distribution
and concentrations of
contaminants in water, sediment, and
juvenile salmon at six sites. Fish were
analyzed for lipid (fat) content and
contaminant concentrations, genetic
origin, otoliths (ear bones) for age
and growth rate, length and weight.
The level of vitellogenin, a protein
associated with egg production
in reproductive female fish, was
measured to test for the effect of
hormone-mimicking compounds on
juvenile fish. Stomach contents of fish
were analyzed to determine the type
of prey being eaten and the associated
contaminant levels.
The project was funded by the Northwest Power and Conservation Council (NWPCC) and Bonneville Power Administration (BPA); principal partners were U.S. Geological Survey (USGS) and NOAA Fisheries.
PAHs, PCBs, and PBDEs were found throughout the lower Columbia River in water, sediment, and juvenile Chinook salmon. These contaminants move from river water and sediment into salmon prey and are absorbed into salmon tissue. PCBs in salmon tissue and PAHs in salmon prey exceeded estimated thresholds for delayed mortality, increased disease susceptibility, and reduced growth.
Exposure to flame retardants (PBDEs) is on the rise in the Pacific Northwest. Chinook salmon near Portland have PBDE levels in the top 10% of reported values for fish in the region. The two most commercially used PBDE congeners were found in the water column, sediment, and salmon and are frequently detected in people, fish, and other organisms. Juvenile salmon from upriver stocks (such as Snake River and upper Columbia stocks) are absorbing toxic contaminants during their time rearing and migrating in the lower Columbia River. PBDEs are doubling in fish every 1.6 years.
DDT and PCBs are still detected in juvenile Chinook salmon. These banned contaminants continue to accumulate through the food chain. Their detection today demonstrates that they breakdown slowly and remain in the environment a very long time.
ImpactsPolychlorinated biphenyls (PCBs) are persistent, nonflammable chemicals widely used to insulate and cool electrical equipment, and in other products for water proofing and as a preservative. Their manufacture was banned in the United States in 1979 but use in closed electrical equipment is still permitted. PCBs are known to cause cancer.
Polyaromatic hydrocarbons (PAHs) are persistent contaminants found in petroleum products and are created during incomplete combustion of carbon-based materials. Some PAHs have acute toxic effects, others accumulate in lipids, such as the fats of invertebrates. Many PAHs are known or suspected carcinogens.
gradeC
The Challenges for 2015
Investments in toxics monitoring have decreased even while we have learned more about the impacts of toxics on salmon survival and human health. It’s time to change. We need to:
•
•
•
•
•
Invest as a region for the long-term;
Carry out long-term, multiple-site monitoring of contaminants, their sources, pathways of exposure for organisms, and the effects of combined toxics;
Keep toxics from entering the water: host drug and pesticide take-back programs and invest in clean marina programs;
Clean up ‘hot spots’ that are impairing ecosystem and species health and economic viability; and
Integrate toxics information into habitat restoration prioritization to prevent exposure to contaminants.

www.lcrep.org 3
Polybrominated diphenyl ethers (PDBEs) are a group of chemicals used as flame retardants in plastics and foam products. PBDEs are used in insulation and foam for furniture, mattresses, automobile seats, plastics for computer housings and appliance casings. Although the manufacture and import of PBDEs were phased out in 2004, they continue to be found in humans and the environment. PBDEs bioaccumulate in fish, marine mammals and birds, and affect reproductive and neurological development. Studies in animals show PBDEs can affect the developing brain, altering behavior and learning after birth and into adulthood. Levels of PBDEs are rising in the environment and people worldwide, but are highest in North America. Children are at the most risk from these chemicals.
Organochlorine pesticides, like PCBs, are called “legacy contaminants” because they persist in the environment. These also include DDT, designed to kill insect pests and widely used for decades. They accumulate in the food chain, reducing reproductive success for birds and increased risks of cancer for humans. DDT was banned in the United States in 1972. Other banned pesticides include aldrin, dieldrin, and chlordane, which also persist in the environment and organisms.
Dietary exposure to PAHs, PCBs, and PBDEs render salmon more susceptible to mortality caused by diseases. Multiple stressors (contaminants and pathogens) can interact to limit the productivity of wild salmon populations. Population-scale models indicate that chemical exposure may be a major source of delayed, disease-induced mortality among outmigrant salmon in the Columbia River Basin, with rates ranging from 1.5 – 9% depending on residence time in the estuary. The health and success of Chinook salmon in the lower Columbia River and upriver stocks are threatened by a range of contaminants, including PAHs, PCBs, PBDEs, DDT, current use pesticides, copper, mercury, and hormone disruptors. Some of these
contaminants cause direct lethal effects, others have indirect sublethaleffects – they alter salmonid growth, reproduction, and development and increase their mortality by predators, starvation, and disease.
The full report, Lower Columbia River and
Estuary Ecosystem Monitoring: Water
Quality and Salmon Sampling Report, 2007 is available at www.lcrep.org.
Estuary Partnership Ecosystem Monitoring ProjectWith funding from BPA, the Estuary Partnership is partnering with NOAA Fisheries, Pacific Northwest National Laboratory (PNNL) and USGS to collect juvenile salmon; salmon prey and food web; and salmon habitat data at four to six sites annually. The focus of this project is to assess the lower Columbia River estuary ecosystem condition and trends, focusing on those habitats important for juvenile salmon. When funds are identified
NOAA Fisheries will analyze fish tissue, blood, and stomach content collected from this project, as well as sampling at Mirror Lake for the contaminants PAHs, PCBs, DDTs, PBDEs, and estrogenic compounds.
Columbia River Toxics Reduction Working GroupThe EPA is leading a Columbia Basin effort with federal, tribal, state, and local governments, business interests, farmers, non-profit partners and others to develop a toxics monitoring and reduction plan for the Basin. Their work integrates work of the Estuary Partnership in the lower river. In 2009, EPA published the Columbia River Basin: State of the
River Report for Toxics, that summarized the current knowledge about four major contaminants in the Columbia River Basin. These contaminants (mercury, DDT, PCBs, PBDEs) are found throughout the basin at levels that negatively affect fish, wildlife,
and people. Mercury comes from atmospheric deposition and activities inside the basin. Unacceptably high levels of mercury in fish have resulted in fish consumption advisories throughout the basin. Similarly, the concentrations of banned DDT and PCBs exceed levels of concern resulting in fish consumption advisories being issued by every state in the basin.
Fish Consumption StandardThe Confederated Tribes of the Umatilla Indian Reservation, the Oregon Department of Environmental Quality (ODEQ), and EPA are developing a fish consumption standard more protective of human health. Native Americans consume 9–12 times more fish than other populations. Based on studies of fish consuming populations in Oregon and Washington, EPA is proposing a consumption rate of 175 grams per day, equivalent to approximately twenty-three eight-ounce fish meals per month. The standard, up from the current 17.5 grams per day, will be the highest in the nation. The new standard may help limit the amount of contaminants that can enter Oregon’s waters and the levels of toxics accumulating in the aquatic organisms.
Columbia River Contaminants and Habitat Characterization The USGS is researching emergent contaminants in the environment and food web of the lower Columbia River through a study called ConHab (Columbia River Contaminants and Habitat Characterization). This work investigates the concentrations of PBDEs, PCBs, organochlorine pesticides (e.g., DDTs), pharmaceuticals, estrogenic compounds, wastewater compounds, and others in water, sediment, invertebrates, resident fish, and piscivorous (fish eating) birds. The transport of fine sediments and contaminants will be investigated with the goal of predicting contaminant concentrations across the system.
Contaminants in Salmon StocksComposite Samples of 5–10 Juvenile Chinook Salmon
0
Who
le B
ody
(ng/
g w
et w
t)
Lower Columbia (n
=27)
Willa
mette (n
=4)
Snake River (n=3)
Mid Columbia (n=5)
Upper Columbia (n
=5)
Hatcheries (n
=6)
20
40
60
80
100
120∑ DDTs∑ PBDEs∑ PCBs
0
Who
le B
ody
(ng/
g lip
id)
Lower Columbia (n
=27)
Willa
mette (n
=4)
Snake River (n=3)
Mid Columbia (n=13)
Upper Columbia (n
=5)
Hatcheries (n
=6)
2,000
4,000
6,000
8,000
10,000∑ DDTs∑ PBDEs∑ PCBs
(n=number of composite samples) (Lower Columbia River Estuary Partnership, 2007)

4 Lower Columbia River Estuary Partnership
US Army Corps of EngineersIn 2005, the US Army Corps of Engineers (Army Corps) initiated its study of Corbicula fluminea, the freshwater Asian clam introduced into the lower Columbia River. Clams were collected from 37 sampling sites along the Columbia River between Skamokawa, Washington and Bonneville Dam. Clam tissue was analyzed for PAHs, PCBs, PBDEs, chlorinated pesticides, bioaccumulative trace metals, organotin, and lipids (body fat). Corbicula were fairly widespread and found at nearly all sampling sites and all had detectable levels of bioaccumulative contaminant(s).
Corbicula are a possible food source for sturgeon and other bottom feeding fish, aquatic and terrestrial mammals (otter, mink and raccoons), piscivorous birds, and humans. Toxins are bioaccumulating in clams and may further accumulate in the food chain, affecting fish, mammals, and birds, and pose human consumption concerns.
State of Oregon ActionsIn 2007, ODEQ established a water quality toxics monitoring program, beginning in the Willamette River Basin. Results show that mercury
concentrations in fish tissue significantly increased from 2002 to 2008 and is found at concentrations that exceed levels established by EPA for subsistence fishers and often exceed threshold values used for fish consumption advisories. ODEQ’s toxics reduction efforts are directed at both point and non-point pollution sources. Many reduction efforts are collaborative partnerships with other agencies and organizations. Toxic reduction activities include:
•
•
Developing or implementing water quality improvement plans (known as Total Maximum Daily Loads, or “TMDLs”) for toxics in a number of Columbia River tributaries. These include plans for the Willamette River, Columbia Slough, Johnson Creek, Pudding River, and Yamhill River. The plans address mercury, legacy pesticides (such as DDT and other organochlorine pesticides), current-use pesticide, PCBs, and arsenic. The goal of the TMDL plans is to identify and control contaminant sources to meet water quality standards.
Implementing new legislation on persistent pollutants (PBTs), developing a priority list of
persistent bioaccumulative toxic pollutants (PBTs) and source reduction and control methods.
•
•
•
•
•
•
•
Implementing Pesticide Stewardship Partnerships in agricultural watersheds.
Hosting hazardous waste collection events and facilities for households, small businesses and agricultural operations. The events remove a source of toxic pollution that, if improperly managed, could contaminate water. Since 2006, ODEQ has hosted five collection events that have collected over 92,000 pounds of pesticides.
Working with EPA to clean up contaminated sediments the Lower Willamette River in Portland.
Cleaning up abandoned mercury mines in the Willamette Basin.
Developing and enforcing wastewater and stormwater discharge permits.
Reducing the discharge of air toxics that could eventually end up in the Columbia River or its tributaries.
Working with EPA to lead a toxics monitoring effort in the Middle Columbia in 2008 and 2009.
State of Washington ActionsWashington became the first state in the nation to begin phasing out use and sale of PBDEs in common household items and in April 2010 the first state in the nation to phase out the use of copper in auto brake pads, banning brake pads containing more than 5% copper by 2021. When drivers use their brakes, friction releases copper shaving that fall on the road. When it rains, stormwater runoff carries the copper shaving to rivers where they pose a hazard to salmon and other marine life.
In addition, the Department of Ecology (WA Ecology) is also working on a number of toxics reduction efforts in the Columbia Basin including:
•
•
•
•
•
•
•
•
Developing water quality improvement plans (TMDLs) for toxics in a number of Columbia River tributaries. These include plans for the Yakima, Spokane, Okanogan, Walla Walla and Palouse Rivers, and Lake Chelan. The plans address legacy pesticides (such as DDT and other organochlorine pesticides), PCBs, and arsenic.
Cleaning up contaminated sediments in the Columbia River and contaminated land in the Columbia River basin.
Developing and enforcing wastewater and stormwater discharge permits.
Reducing the toxics emitted to the air that eventually find their way to the Columbia River.
Reducing the amount of hazardous waste produced in the Columbia River basin and improving the storage and disposal of hazardous waste.
Hosting pesticide programs to collect unused product.
Cleaning up the Hanford nuclear reservation, the largest superfund site in the world.
Cleaning up Lake Roosevelt. •
•
•••
•
•
•
•
•
Lower Columbia River Water Quality and Salmon Sampling Summary 2007
Lower Willamette Pesticides frequently detected in water
High PBDEs in SPMDs and salmon bodies
Low DDTs in salmon bodies High PAHs in salmon bile Vitellogenin detected
Confluence
• Vitellogenin detected
Columbia City
Highest PAHs in salmon stomach contents
Beaver Army Terminal
• Highest PCBs in salmon
• Lowest lipid content
Poi nt Ad a ms
• PBDEs on sediment • Low PAHs in salmon
• Largest fish, withhighest lipid content
W arr en dale
• Lowest PCBs and PBDEs on sediment and in SPMD s
• Lowest PCBs in salmon• Low PAHs, DDTs, andPBDEs in salmon
All Sites
Pesticides and wastewatercompounds in the water
DDTs in salmon and stomach contents
PCBs and PAHs in SPMDs, salmon, and stomach contents
PBDEs on sediment, in SPMDs, and in salmon and stomach contents

www.lcrep.org 5
Are water temperatures in the lower Columbia River increasing or decreasing and do they support native aquatic species? Water temperatures continue to increase in the lower Columbia River threatening native species .
Temperature is important to aquatic organisms, including endangered salmonids which are adapted to migrate, spawn, and rear in cold-water streams. High water temperatures are correlated with decreased availability of dissolved oxygen and increased susceptibility to disease.Increased temperatures can also affect the metabolic processes of both salmon and their predators and constrain salmonid access to shallow water habitats.
The average daily maximum temperature over a seven-day period must be 68° F to maintain salmon and steelhead migration. Lower Columbia River water temperatures regularly exceed this standard during low flow periods in the summer.
Temperatures in the Columbia River and tributaries are rising for many reasons. Reservoirs behind the dams absorb heat during the summer raising temperatures, and the loss of riparian vegetation decreases shade. Stormwater inputs and the effects of climate change also affect water temperature.
Do current dissolved oxygen levels in the lower Columbia River support native aquatic species?Generally yes, but summer temperatures and shallow back-water habitats cause dissolved oxygen levels to periodically drop below state standards .
Between 1995 and 2002, dissolved oxygen levels in some reaches of the lower Columbia River fell below the States’ minimum standard of eight milligrams per liter. Today, the lower Columbia River is no longer officially listed as impaired for dissolved oxygen levels, but it is likely during the summer and in reaches, including shallow back-water habitats, levels are lower than optimal for salmon.
Aquatic plants, invertebrates, and fish all require oxygen; dissolved oxygen is a measure of the amount of oxygen contained in water. When levels fall below five milligrams per liter aquatic life feels stress, especially cold-water species such as
salmon. Dissolved oxygen levels that drop below 1 – 2 milligrams often result in fish kills. Levels can vary greatly with water temperature and biological activity. Continuous monitoring shows daily peaks in dissolved oxygen during the day when plants are photosynthesizing and lows as oxygen is consumed by animals.
Other Estuary Partnership Efforts since 2005 Science to Policy Forums In May 2007, the Estuary Partnership initiated a forum series to bring together community leaders, scientists and practitioners to assess the status of current ecosystem issues, discuss effective approaches, and guide Estuary Partnership activities to address identified gaps.
May 2007: What Do Community Leaders and Scientists Need to Know Over 150 participants offered three key messages: 1) explain the problems, the risks to human health, potential remedies, and full costs; 2) implement reduction actions now; and 3) invest in long-term, comprehensive monitoring. Participants called for the Estuary Partnership to step up efforts to secure funds for toxics monitoring and reduction.
January 2008: Toxic ContaminantsParticipants examined the lack of sustained monitoring and our challenge to assess changes in toxics levels and locations, and the implication of known toxics levels on ecosystem health and the economy.
Participants called for the Estuary Partnership to: collect and analyze data at regular sites for a full suite of contaminants; host toxic reduction projects; and provide consumer information.
May 2009: Habitat Restoration Participants reviewed the progress of habitat restoration efforts and current challenges: projects have become more complicated, emphasis on fish survival numbers has increased, and the supply of ready-to-go-projects has been exhausted. Participants directed the Estuary Partnership to enhance coordination and collaboration; expand funding; increase the ecosystem context for salmon recovery; and complete our work on strategic prioritization.
June 2010: Being Accountable for InvestmentsThis forum will focus on ways to ensure investments get the results we want when information changes, projections aren’t realized or community needs shift. Participants will address regional accountability and identify appropriate metrics.
We have worked with Congress since 2008 to increase resources for contaminate reduction. We will continue to work to secure passage of the Columbia River Restoration Act of 2010.
USGS and NOAA water quality monitoring
Lower Columbia River Bi-State Water Quality
Program Sites: 1989 – 1995
• Sediment (365samplingsites)
Fish (92 sampling sites)
Lower Columbia River Sites Monitored Since Program End in 1995
USGS Monitoring (1 site)
The 1989 – 1995 Bi-State Water Quality Program remains the only ecosystem focused work that established baseline water quality data . Only one of the 500 sites monitored by the Bi-State program has been regularly monitored since the program ended in 1995 .
6 Lower Columbia River Estuary Partnership
Land Use
Do our land use decisions protect lower Columbia River water quality?
With more people came more roads, roofs, parking lots and other impervious surfaces . The more impervious surface, the more potential runoff of contaminates into water bodies . Innovative stormwater management features that lessen the impacts of development on water quality have increased .
How does impervious surface affect water quality?
We are unable to report how many acres of impervious surface were added since
2005 or the percentage of the lower Columbia River watershed covered in impervious surface. Tracking impervious surface levels over time across the 4,300 square mile lower Columbia River study area currently is not done but if tracked could provide an excellent barometer of stream health. When impervious surfaces levels in a watershed reach more than 25% it’s typically a sign of an unhealthy stream. As impervious surface levels rise, stream quality typically declines.
Impervious surfaces prevent rain from naturally soaking into the ground. As water flows over a hard surface, it picks up and carries a range of pollutants to local streams or directly to the Columbia River. In parking lots and driveways, contaminants include mercury and other heavy metals, oils, greases and
gasoline. Along residential streets, pet waste, fertilizers, herbicides, detergents, and vehicle-associated pollutants are common. Roofs often collect contaminants from the air – which in the lower Columbia River study area includes mercury generated from inside and outside the basin, as well as particulate
matter, nitrogen, and sulfur. Finally, emerging contaminants such as pharmaceuticals, hormones, caffeine, and flame retardants are also associated with stormwater. These pollutants decrease water quality, decrease habitat quality, and negatively impact fish and wildlife.
gradeC+
The Challenges for 2015
We are not currently measuring
the amount of impervious
surface. This is critical in
order to accurately assess the
impact of development on
water quality. The data can
motivate communities and
individuals to use techniques to
reduce or eliminate stormwater
runoff. The alternative of
collecting and treating runoff
places a huge financial burden
on citizens. Preventing
stormwater runoff is not only
less costly, but less harmful.
Estuary Partnership Goals: Protect the ecosystem and species • Reduce toxic and conventional pollution • Provide information about the river to a range of audiences
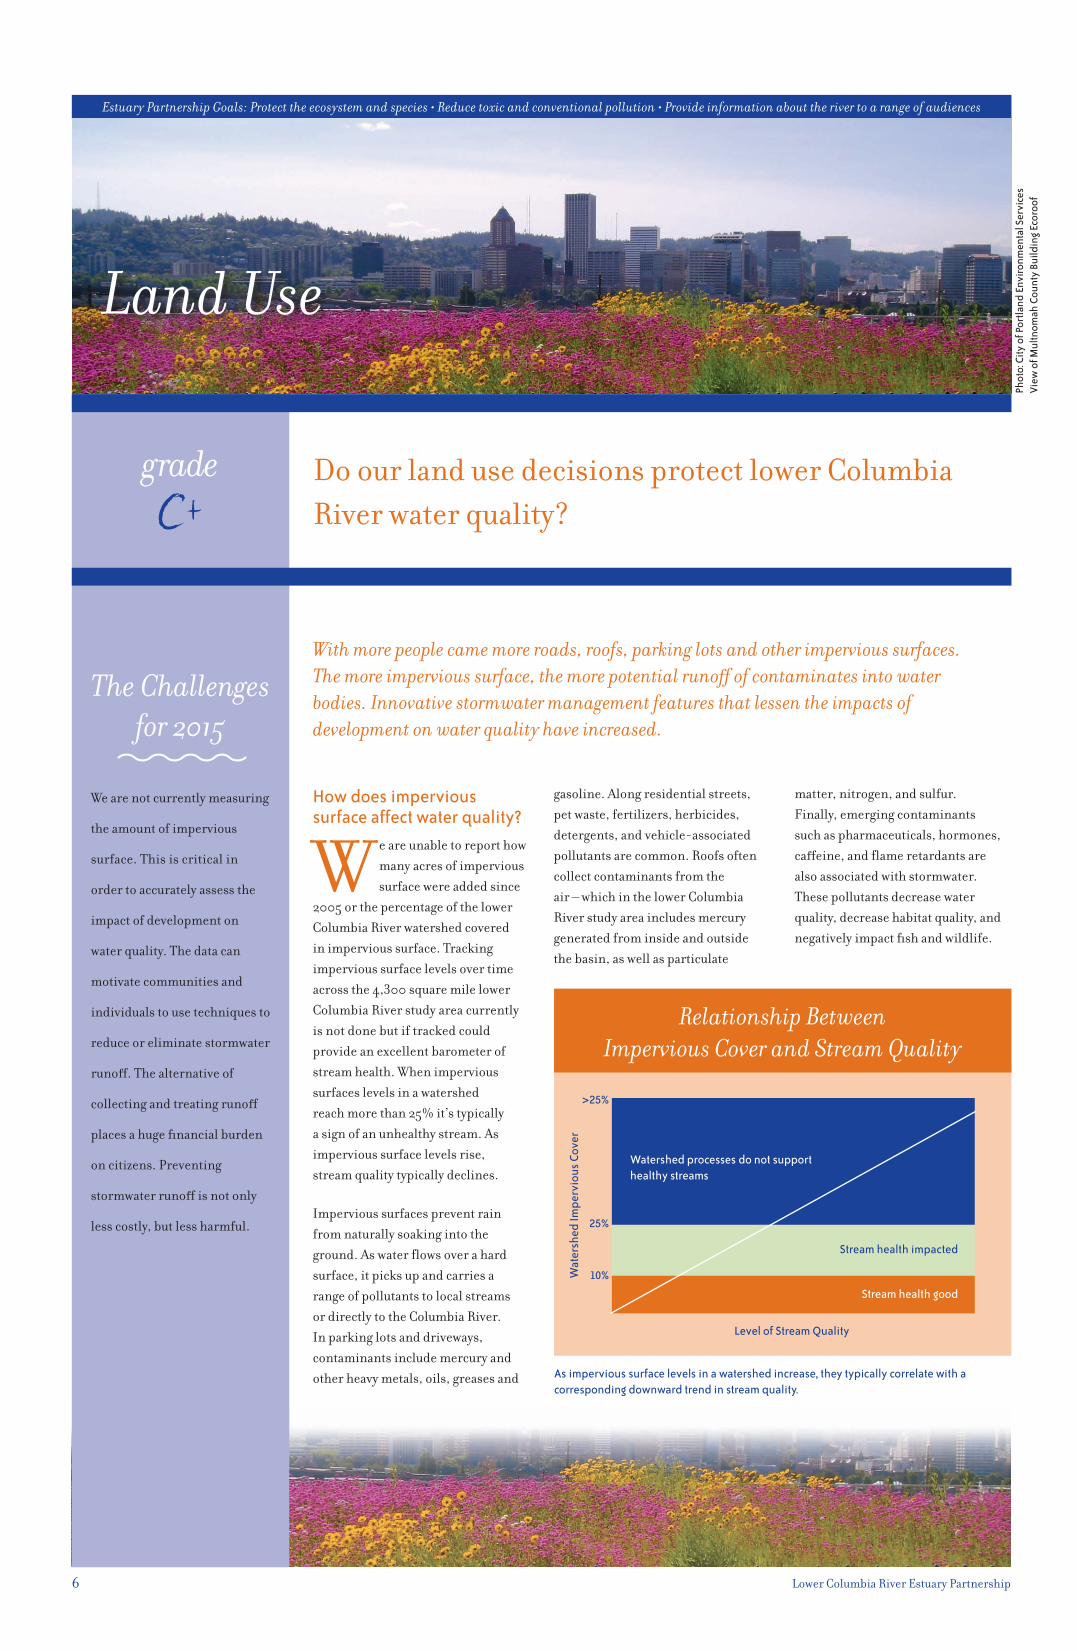
Relationship Between Impervious Cover and Stream Quality
Wat
ersh
ed Im
perv
ious
Cov
er
Level of Stream Quality
>25%
25%
10%
Watershed processes do not support healthy streams
Stream health impacted
Stream health good
As impervious surface levels in a watershed increase, they typically correlate with a corresponding downward trend in stream quality.
es
cro
nmen
tal S
ervi oo
forc
g E
ldin
nvi
ount
y Bu
ior
tland
Eity
of P
: Cto
Pho w
of M
ultn
omah
CieV

www.lcrep.org 7
New Stormwater Management Techniques IncreasingNew approaches that allow rainwater to infiltrate the ground are being used more regularly to help lessen the harmful impacts of stormwater runoff. Rather than collecting and treating stormwater, more and more communities, developers, and homeowners are adopting changes that manage stormwater on-site.
Parking lots are being designed and built to capture and infiltrate stormwater on-site. Ecoroofs are sprouting up across Portland to capture rainfall, in some cases treating more than 85% of the runoff. Some sidewalks, streets, and parking lots are testing permeable pavers as a surface. Retaining water on-site helps restore the natural hydrologic conditions of a watershed. Native forests, wetlands, meadows, pastures and other pre-development landscape features capture rainfall, allowing it to infiltrate into soil and groundwater. Parking lot or development designs that incorporate rain gardens, bioretention systems and natural vegetation allow water to naturally soak into the ground filtering out contaminants.
Innovative stormwater management projects in Portland have made the city a national leader for sustainable design, including recognition by EPA in its 2010 Environmental Protection Agency report “Residential
Construction Trends in America’s
Metropolitan Regions .” Citizens can take a self-guided cycling tour of Portland stormwater projects focused exclusively on green streets, or stormwater projects as pieces of art. The City of Portland is two years into a five-year program to add 43 acres of ecoroofs, 920 green street facilities, and plant 83,000 trees across the city. Through the City’s Clean River Rewards program, homeowners who capture stormwater on-site are offered a discount of up to 100% of the stormwater charges on their water and sewer bill.
Reusing land and redeveloping underused sites is one of the best ways to limit new impervious surfaces. Promoting redevelopment and transit-oriented development greatly focuses growth where services exist to support it and minimizes the impact on open lands.
2005 – 2010 Estuary Partnership Activities Field Guide to Water Quality Friendly Development In 2006 the Estuary Partnership launched the web based “Field Guide to Water Quality Friendly Development” to showcase innovative stormwater management projects in the lower Columbia River communities. The web site provides details on twenty-three different stormwater management techniques including grassy swales, ecoroofs, infiltration planters and permeable pavers. Each technique is supported with technical information and landscape examples that include the project location, a short description, photos, and ownership information.
The Field Guide allows local governments unfamiliar with stormwater friendly techniques, their cost, effectiveness, attractiveness, and maintenance requirements to see real applications ‘in their backyard.’ It shows how innovative stormwater management techniques can and have been effectively used in the region.
Measuring Impervious SurfaceThe Estuary Partnership is using remote sensing and ground sampling from a 2007 land cover classification to complete an extensive land cover analysis. When completed in 2011, we can provide a 10-year analysis of the change in impervious surface in the watershed, as well as changes in forest cover, wetland acreage, and other land cover types. These and other trends will be reported in 2011 and be included in the 2015 Report on the Estuary.
The Columbia RiverThe Columbia is the fourth largest river in North America and drains 258,000 square miles. Over eight million people live in the Columbia Basin and all depend on it to some degree for their livelihood and quality of life. Over 2,000 species of wildlife live in the lower river during some part of their life. The fourteen hydropower dams on the mainstem Columbia provide over 75% of the power for the Northwest, more than any other river in the US. Water from the Columbia irrigates half of the 7.3 million acres of income producing farm and ranch land in Idaho, Oregon and Washington. The river’s five deep water ports are the nation’s primary terminals for several importers of manufactured goods. The river carries 39% of the all the wheat bound for export in the US, and is the major depot for the nation’s bounty of grain. The Columbia Gorge is the wind surfing capital of the world and is designated a National Scenic Area. Hundreds of thousands of residents and visitors hike, fish, bike, and boat on its waters and along its shores all year long.
Estuary Partnership Schoolyard Stormwater Site at Alice Ott Middle School
Phot
o: C
ity o
f Por
tland
Env
ironm
enta
l Ser
vice
s Vi
ew o
f Mul
tnom
ah C
ount
y Bu
ildin
g Ec
oroo
f

8 Lower Columbia River Estuary Partnership
Estuary Partnership Goals: Protect the ecosystem and species • Reduce toxic and conventional pollution • Provide information about the river to a range of audiences
Stewardship
Has the Estuary Partnership provided citizens with opportunities to learn about the lower Columbia River?
Between 2005 and 2010 the Estuary Partnership Stewardship program increased emphasis on outdoor applied learning . Since 2005, we have provided 84,500 youth and adult learning experiences, an increase of 46% from 2005 .
In 2005, we refined our classroom programs to bring the outdoors inside, bring students outdoors
more often and increased emphasis on service learning, field work and on-river trips.
This change significantly increased demand for our programs. We are fully booked by January of each year with a waiting list at year end. Six full-time and two seasonal Environmental Educators now provide our programs. We have diversified from 100% public funding to over 50 corporate sponsors, several private foundations, and six different public entities, demonstrating the ability to develop and sustain programs.
Has the Estuary Partnership provided science-based programs to students?Since 2005, the Estuary Partnership has provided 76,500student learning experiences throughout the Estuary Partnership study area .
All Estuary Partnership Stewardship Programs are science based. Our
Environmental Educators are full-time professionals with over 30 years combined experience teaching complex science concepts to students in the classroom, in the field and on water. They deliver programs that incorporate proven “best education practices” and encourage critical thinking, problem solving, decision making, action and reflection. Working closely with teachers, we continually refine 25 classroom lessons and extensive field curriculum that meet state standards and grade level requirements in Oregon and Washington. The Estuary Partnership works with teachers to tailor programming to their classroom need. We use the Columbia River as the subject and the laboratory.
Classroom Lessons may be one time visits or serve as a precursor or postscript to an educational field trip, a service learning project, or an on-river trip. In the past five years, we offered 1,800 hours of classroom instruction. Lessons are typically 50 minutes long, include hands-on activities, discussions about local watershed issues, environmental
changes, and link to a service learning project or to field experiences.
Educational Field Trips typically follow a series of classroom lessons and provide students with an outdoor learning experience that directly applies to their classroom work. Since 2005, we have provided 5,917 field programs. Field trips take place in a nearby natural area, a local park, a state forest or national wildlife refuge along the Columbia River. Students spend time exploring, observing, and learning firsthand about the ecosystem through direct experience. This may involve monitoring water quality, creating journal entries, completing exercises about birds, native plants, soils, and other science subjects.
Service Learning Projects involve a series of classroom lessons and an on-the-ground application of science concepts that result in measurable environmental improvement to the service learning site. Most projects focus on removing invasive species or planting native trees and shrubs. Students learn through direct
gradeA
The Challenges for 2015
The approximately 16,800 students we work with each year represent a small fraction of the student population in our study area (about 6%). Every year our programs fill up earlier in the school year. Demand for science based, outdoor focused educational programming outpaces our ability to provide it. If we had the resources, we could provide on-river educational trips on our 34-foot canoes every day between April 1 and November 1.
The success of our StewardshipPrograms clearly demonstratesthe considerable unmet need for outdoor applied learning programs for students in the K-12 schools. Yet schools are cutting field programs and some even minimize science curriculum to meet reading and math scores. Some private funders have expressed concern having to make up for what public entities fail to fund.
www.lcrep.org 9
experience the negative impact of invasive plants on riparian habitats or the positive impacts of native trees and shrubs on water quality, riparian areas, and fish and wildlife. Programs grew from serving 3,100 students in 2000– 2005 to 12,430. Between 2005 and 2010 we provided 7,235 adult and student service learning experiences.
On-River Trips use the 34-foot canoes. Each canoe holds sixteen people and two Estuary Partnership staff which allows us to accommodate an entire class of students. Our on-river programming has quickly become our most requested outdoor applied learning experience as teachers recognize the unique nature and educational opportunities associated with a paddle on a local waterway. Since purchasing the canoes in 2007, we have taken 6,517 students on the river.
With an Environmental Educator at each end, students are a captive audience for education, river otter sightings, osprey fishing, the feel of the river’s current or ocean’s tides and other unique experiences only available on water.
The big canoes are conducive for teaching groups of people while on the water, are easily transported, and extremely safe. Before the canoes, we relied on jet boats and individual kayaks to provide on-water programs. Jet boats were limited to the Willamette River, were expensive, routes were fixed by the operator and noise levels limited teaching. Individual kayak rentals were difficult due to varying levels of skill among students.
Schoolyard Stormwater Projects have provided 5,195 students with hands-on environmental learning in schoolyard construction projects. Between 2005 and 2010, we completed Schoolyard Stormwater Projects at the Centennial Learning Center, Alice Ott Middle School, and Harvey Scott School, and a project at Humboldt School is nearly complete. During these projects students receive a series of classroom lessons on watershed and stormwater issues, work with a professional landscape architect to help them design an
on-site stormwater infiltration facility and often a corresponding outdoor classroom, and then help construct the facility as a service learning project. The program has radically changed a section of each school’s grounds and the projects continue to infiltrate hundreds of gallons of stormwater each year.
Has the Estuary Partnership provided opportunities for citizens to directly experience, protect, or restore the lower Columbia River?Since 2005, the Estuary Partnership’s Stewardship Programs have made almost 30,000 youth and adult connections to the Columbia through a wide range of activities .
Weekend Volunteer Plantings have resulted in 21,000 native trees and shrubs planted and 190 truck loads of invasive plants being removed since 2005. Estuary Partnership plantings take place every weekend from November through April. Projects focus on restoring riparian habitat under the guidance of Estuary Partnership Environmental Educators at three sites: Lacamas Creek, Ridgefield National Wildlife Refuge, and Steigerwald Lake National Wildlife Refuge. Volunteers plant an average of 300 – 500 trees or shrubs in one four hour project.
Community Paddles on the big canoes have taken youth and adults along Lake River in Ridgefield, WA, Willamette River near Portland, Multnomah Channel near Sauvie Island, and at sites along the lower Columbia River. Paddles also provide opportunities to youth through park districts, and SUN (Schools Uniting Neighborhoods) Schools. In April 2010, we provided a month of paddles in Scappoose: taking every 4th, 5th, and 6th grader on the river as part of their classroom programs, and offering a community wide paddle as well.
Lower Columbia River Water Trail The Estuary Partnership coordinates management of the trail with the Lower Columbia River Water Trail committee. We conduct Water Trail Stewardship projects and host the Water Trail web site which was completely overhauled in 2008. The Google maps based web site provides paddlers with the information they need to plan day or overnight trips on the trail.
The Volunteer Water Quality Monitoring Event was a two-week event in September 2005 – 2007. During the events, 3,174 students and adults monitored sites along the Columbia River mainstem and select tributaries. Beginning in 2008 we integrated volunteer water quality monitoring into our on-river education programs and field trips.
The Estuary Partnership Summer On-River Family Event was revived in 2009. We now host the event in Vancouver at Frenchmans Bar Park and feature our 34-foot canoes for on-river paddling contests.
Is the Estuary Partnership providing teachers with access to environmental education resources, trainings and workshops?
Since 2005, the Estuary Partnership has worked with over 500 teachers in 35 school districts throughout the Estuary Partnership study area. Teachers participating in our education programs gain skills, knowledge and the connection to environmental resources they need to incorporate environmental education into their curriculum and lead meaningful watershed education on their own.
The Estuary Partnership has also conducted eight teacher workshops since 2005. These expand teachers’ knowledge of environmental concepts, teach hands-on classroom and field activities, and give teachers the confidence to work with students in their schoolyard or local natural area.
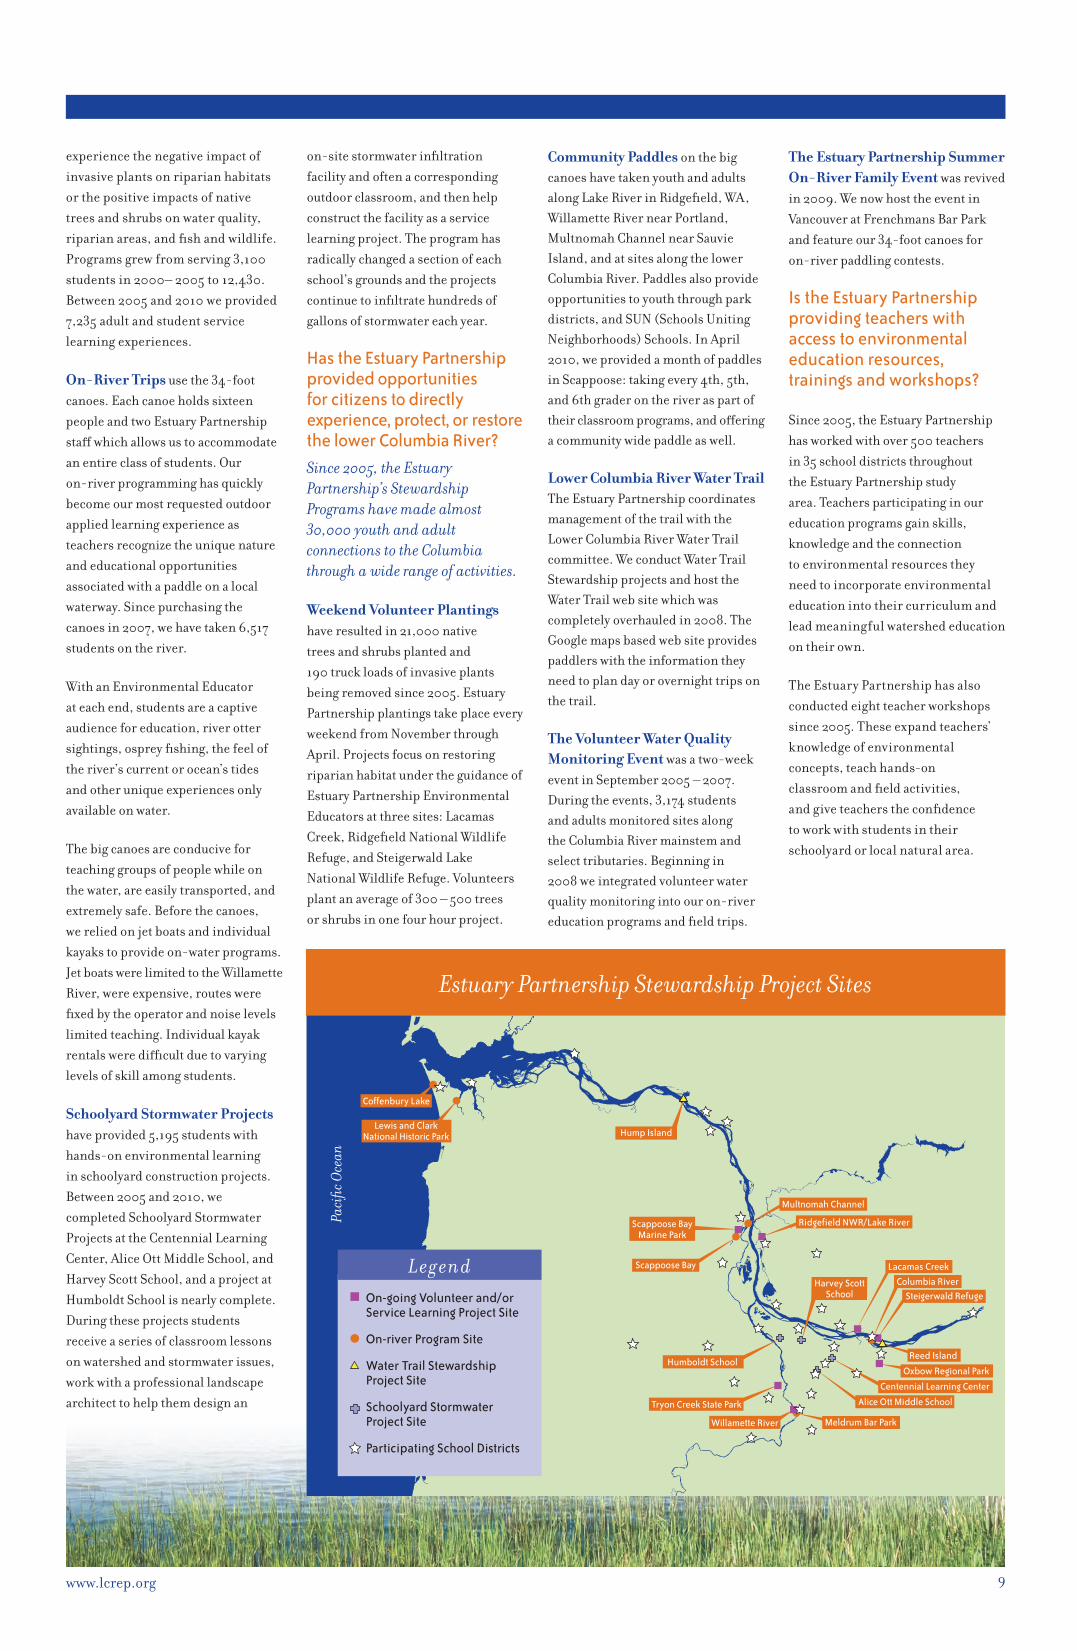
Estuary Partnership Stewardship Project Sites
On-going Volunteer and/or Service Learning Project Site
On-river Program Site
Water Trail Stewardship Project Site
Schoolyard Stormwater Project Site
Participating School Districts
Legend
Paci
fic O
cean

Lower Columbia Lower CoLumbia river estua
L e g e n d
Cities
Major Roads
County Lines
Estuary Partnership Study Area Extent
www.lcrep.org
Columbia River Basin
Oregon
Washington
0 5 10 15 20 Miles
Idaho
MT
NV
WY
UT
Paci
fic
Oce
an
River and Estuaryry PartnershiP study area

Lower Columbia River and Estuaryuary PartnershiP study areaLower CoLumbia river est
12 Lower Columbia River Estuary Partnership
Estuary Partnership Goals: Protect the ecosystem and species • Reduce toxic and conventional pollution • Provide information about the river to a range of audiences
Habitat
grade Are we gaining or losing habitat in the lower Columbia River?
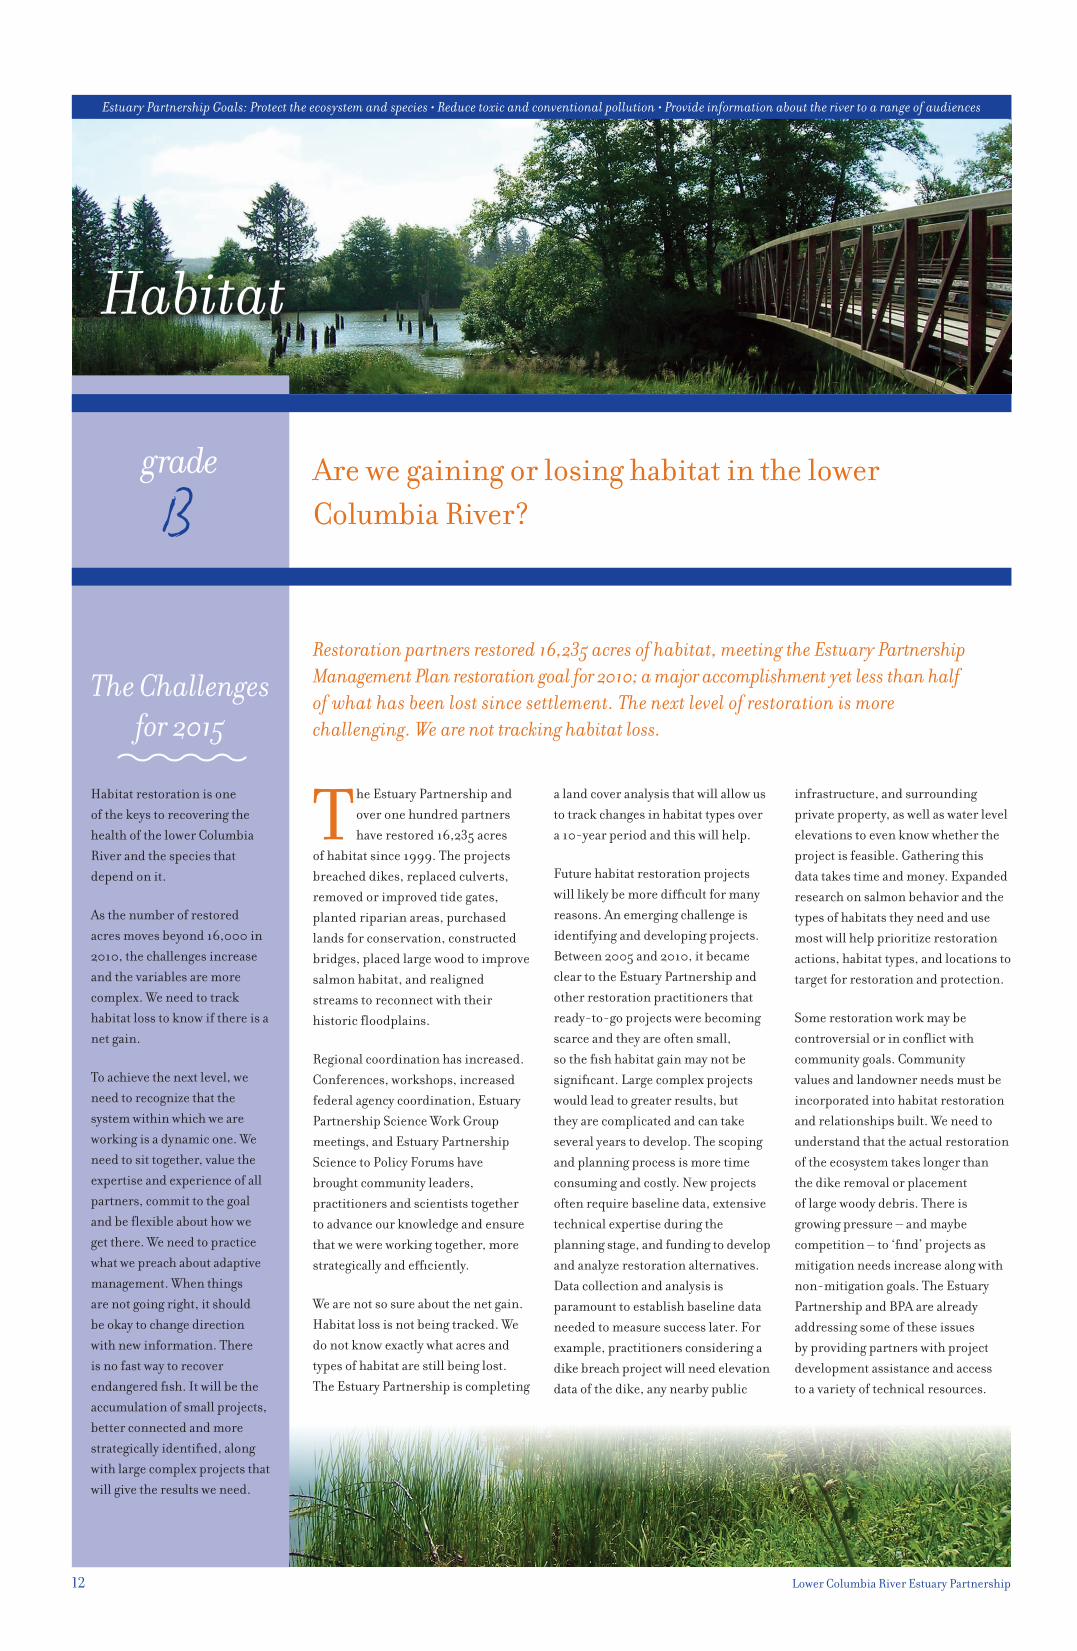
Restoration partners restored 16,235 acres of habitat, meeting the Estuary Partnership Management Plan restoration goal for 2010; a major accomplishment yet less than half of what has been lost since settlement . The next level of restoration is more challenging . We are not tracking habitat loss .
The Estuary Partnership and over one hundred partners have restored 16,235 acres
of habitat since 1999. The projects breached dikes, replaced culverts, removed or improved tide gates, planted riparian areas, purchased lands for conservation, constructed bridges, placed large wood to improve salmon habitat, and realigned streams to reconnect with their historic floodplains.
Regional coordination has increased. Conferences, workshops, increased federal agency coordination, Estuary Partnership Science Work Group meetings, and Estuary Partnership Science to Policy Forums have brought community leaders, practitioners and scientists together to advance our knowledge and ensure that we were working together, more strategically and efficiently.
We are not so sure about the net gain. Habitat loss is not being tracked. We do not know exactly what acres and types of habitat are still being lost. The Estuary Partnership is completing
a land cover analysis that will allow us to track changes in habitat types over a 10-year period and this will help.
Future habitat restoration projects will likely be more difficult for many reasons. An emerging challenge is identifying and developing projects. Between 2005 and 2010, it became clear to the Estuary Partnership and other restoration practitioners that ready-to-go projects were becoming scarce and they are often small, so the fish habitat gain may not be significant. Large complex projects would lead to greater results, but they are complicated and can take several years to develop. The scoping and planning process is more time consuming and costly. New projects often require baseline data, extensive technical expertise during the planning stage, and funding to develop and analyze restoration alternatives. Data collection and analysis is paramount to establish baseline data needed to measure success later. For example, practitioners considering a dike breach project will need elevation data of the dike, any nearby public
infrastructure, and surrounding private property, as well as water level elevations to even know whether the project is feasible. Gathering this data takes time and money. Expanded research on salmon behavior and the types of habitats they need and use most will help prioritize restoration actions, habitat types, and locations to target for restoration and protection.
Some restoration work may be controversial or in conflict with community goals. Community values and landowner needs must be incorporated into habitat restoration and relationships built. We need to understand that the actual restoration of the ecosystem takes longer than the dike removal or placement of large woody debris. There is growing pressure – and maybe competition – to ‘find’ projects as mitigation needs increase along with non-mitigation goals. The Estuary Partnership and BPA are already addressing some of these issues by providing partners with project development assistance and access to a variety of technical resources.
The Challenges for 2015
Habitat restoration is one of the keys to recovering the health of the lower Columbia River and the species that depend on it.
As the number of restored acres moves beyond 16,000 in 2010, the challenges increase and the variables are more complex. We need to track habitat loss to know if there is a net gain.
To achieve the next level, we need to recognize that the system within which we are working is a dynamic one. We need to sit together, value the expertise and experience of all partners, commit to the goal and be flexible about how we get there. We need to practice what we preach about adaptive management. When things are not going right, it should be okay to change direction with new information. There is no fast way to recover endangered fish. It will be the accumulation of small projects, better connected and more strategically identified, along with large complex projects that will give the results we need.

www.lcrep.org 13
Funding is limited and how it can be used is restricted. Funding from the NWPCC/BPA and NOAA provided the majority of restoration funding between 2005 and 2010. Their support has been critical to the progress achieved to date, but new funding sources with broader missions would provide the region additional resources and greater flexibility.
Capacity of local entities is stretched and access is limited for the hydraulic or structural engineers, modelers, experienced fish biologists, soil scientists, and other technical personnel needed to design and implement restoration projects.
Are important fish and wildlife habitats being protected and restored in the lower Columbia River? Yes . The number of habitat restoration projects implemented by restoration partners in the lower Columbia River has grown from 74 in 2005 to more than 134 projects in 2010 .
Of the 134 projects, the Estuary
Partnership directly funded 50 on-
the-ground restoration projects with
more than 100 partners, restoring or
protecting 2,958 acres, including the
reconnection of 570 acres of historic
floodplain to tidal influence, and
the opening of 58.2 miles of stream
habitat. Estuary Partnership support
came from NWPCC/BPA and NOAA.
In the last five years, the Estuary
Partnership funded 41 projects
restoring 1,875 acres, 40.4 stream
miles and reconnecting 123 acres to
tidal influence.
The Estuary Partnership examined
two factors when assessing habitat in
2005 and 2010: habitat restoration
and habitat accessibility. The majority
of the work supported by the Estuary
Partnership targets the thirteen ESA
listed salmon species found in the
Columbia River. For example, in
Washington’s Grays River watershed
the Columbia Land Trust permanently
protected 326 acres at the confluence
of Crazy Johnson Creek and the Grays
River. This site supports several
salmon populations, including a key population of chum salmon.
While much of the work focuses on salmon recovery, restoration projects provide benefits to the larger ecosystem. Restoration improves water quality, provides habitat for many species, and supports the
natural food web. For example, extensive and ongoing revegetation work at the Sandy River Delta by Ash Creek Forest Management has restored native plant diversity, provided richer forage for fish and wildlife, improved hydrologic function, and improved habitat for migratory neo-tropical birds.
Are restoration efforts increasing opportunities for fish and wildlife to use previously inaccessible habitat?Yes . The Estuary Partnership prioritizes tidal reconnection projects such as dike breaches and tide gate retrofits or removals .
Tidal reconnection projects provide unique benefits to the lower Columbia River. More than 50% of estuarine wetlands have been cut off from the lower Columbia River’s daily tidal cycle since the 1880s. Diking, tide gates, and small dams radically changed the landscape and made a broad range of habitat types inaccessible to fish and wildlife, particularly to juvenile salmon. Tidal reconnections restore the twice daily tidal cycle to these critical areas. Over time, a diked former pasture can be transformed into a tidal wetland that provides essential rearing, feeding, and resting areas for juvenile salmon.
At Fort Clatsop, near Astoria, Oregon for example, a failing tide gate was replaced with a bridge to restore tidal connection to 45 acres of historic floodplain. This project, led by the Columbia River Estuary Study Taskforce, along with the National Park Service and others, allowed fish to access what will eventually become high quality rearing habitat along the Lewis and Clark River.
The Walluski River Tidal Restoration project removed a portion of a remnant levee to enhance the tidal connection and added large woody debris in the floodplain and in river channels to increase habitat complexity. Tidal reconnection projects quickly change the landscape, but other habitat features can take longer to develop. Historically, large downed trees and tree stumps were an integral part of the lower Columbia River ecosystem. Rather than wait decades for newly planted trees to mature and fall, some projects are adding large wood to assist and accelerate the natural restoration processes underway.
Before Stephens Creek Restoration Project
Pre Project: Stephens Creek enters the Willamette River via a five-foot diameter, 350-foot long decommissioned combined sewer overflow pipe. The pipe was removed as part of the City of Portland, Bureau of Environmental Services project to improve conditions at the mouth of Stephens Creek.
After Stephens Creek Restoration Project
Post Project: Stephen’s Creek flows freely into the Willamette River. The streambank was regraded to a 3:1 slope to allow native vegetation to re-establish, stabilize the banks, cool the stream and provide fish habitat. Large wood structures, as well as snags and brush piles, clearly visible in the post project photo, were added along the creek and the Willamette River to increase structural habitat and conditions favorable for salmon. Revegetation activities included planting 3,500 bare root native trees and shrubs and 1,000 live pole cuttings.

14 Lower Columbia River Estuary Partnership
Legend
Estuary Partnership Funded Project
Other Partner’s Project
Completed
Underway
Estuary Partnership Study Area
1 Walluski R. Multiple Projects
2 Blind Slough Restoration and Cons.
3 Grays Bay Multiple Projects
4 Lacamas Creek Multiple Projects
5 Malarkey Ranch6 Scappoose Bottomlands
Multiple Projects7 Fort Columbia8 Germany Creek 9 Sandy R. Delta Multiple
Projects10 Skamakowa Creek/
Dead Slough11 Lewis & Clark River13 Willow Grove 14 Alder Creek19 Fort Clatsop20 Smith & Byee Lakes
Multiple Projects21 Mirror Lake Multiple
Projects22 Ramsey Lake Multiple
Projects23 Nelson Creek24 Conyers Creek
25 Lower Willamette Moorage
27 Col. Est. Env. Ed. 133 Wallacut River34 Chinook River 35 Port of Astoria38 Skipanon River39 Barrett Slough40 Hanson Creek41 Johnson Slough42 Larson Slough43 Vera Slough44 Crosel Creek45 Green Slough46 Haven Island47 Clarks Dismal Nitch50 Hogan Ranch51 Otter Point53 Chinook Diversion54 Lower Lewis River55 Oaks Bottom Refuge59 Stephens Cr. Confluence60 Crazy Johnson Creek 61 John Day River62 Wolf Bay 63 Lewis & Clark NWR66 Grays PUD Bar67 Nikka Creek68 Onieda Rd.69 Warren Slough71 Brooks Slough72 Julia Butler Hanson NWR73 Duck Creek75 Birnie Creek76 Ryan Point77 Clatskanie Bottoms79 Anunde Island80 Westport Slough81 Abernathy Creek83 Crims Island84 Walker Island 85 Fox Creek86 Trojan Wetlands87 Sandy Island88 Deer Island89 Sauvie Island -
Elledge Property90 Round Lake91 Sauvie Island Wildlife
Refuge
92 Sturgeon Lake93 Teal Slough95 Breeze Creek96 Lewis River Preserve97 Lockwood Creek98 Mason Creek99 Eagle Island100 Ridgefield NWR101 Salmon Creek102 Shillapoo NWR106 Multnomah Channel107 Burlington Bottoms108 McCarthy Creek109 Harborton Wetlands111 Vancouver Wat
Resource Center112 Cispus-Col. Springs113 Woods Landing114 Beaver Creek117 Lower Washougal R.118 Washougal Oaks119 Steigerwald NWR120 Duncan Creek121 Hamilton Creek 123 Columbia Slough124 Hardy Creek125 Lord Island 126 Ruby Lake128 Whitaker Ponds129 Vanport Wetlands132 Columbia Slough Conf.
Multiple Projects133 Deer Island Rest.
Assessment135 Perkins Creek136 Tryon Cr. Confluence137 Elochoman Slough
Acquisition143 Big Creek148 Col. Est. Env. Ed. 2152 Sauvie Island -
Gay Lake154 Widgeon Lake168 Baker Bay Eelgrass
Assessment169 NOAA Marine Debris
Removal170 Coal Creek Slough171 Megler Creek Design175 Lewis River Mud Lake
Habitat Restoration Efforts in the Lower Columbia River Estuary 1999 – 2010
2005 – 2010 Estuary Partnership Advances in Habitat RestorationThe Estuary Partnership’s Habitat Restoration program includes a variety of technical, scientific and regional coordination efforts that advance habitat restoration work in the lower Columbia River.
Advances between 2005 and 2010 include:
• We reconvened scientists in 2009 to refine the habitat restoration criteria originally developed in 2001 by over 100 regional scientists. We incorporated a salmon recovery focus and strengthened the criteria to focus on critical functions and habitat types to ensure the restoration of ecologically significant areas.
We completed a restoration prioritization in 2006 that identifies habitat restoration
•
sites based on disturbances at the landscape and site scale. We are now adding data on historic habitat change and juvenile salmon suitability to the prioritization and we will incorporate the Columbia River Estuary Ecosystem Classification, a hierarchical map of habitats. With data such as juvenile salmonid usage, the Classification can help identify potential project sites.
•
•
In 2008, we completed the first digital shoreline inventory of 630 miles of the mainstem and islands. We analyzed and classified data and conditions in a GIS database that will allow us to conduct an analysis of changing shoreline conditions in the future.
We initiated a pilot program in 2008 to assess the impacts of removing or modifying pile dikes
and pile structures on habitat conditions for juvenile salmon and other species.
•
•
•
Between 2005 and 2010, our Science Work Group met on a nearly monthly basis, providing a forum for public, private, tribal and non-profit scientists to share information about the river and provide guidance to the Estuary Partnership’s Technical Programs.
We initiated Action Effectiveness Monitoring in 2007 to monitor habitat restoration success at four projects – each had used a different restoration technique. This evaluation will allow us to begin to adaptively manage the effectiveness of both the project types and the cumulative impact of projects.
We hosted or co-hosted several events to enhance regional communication and collaboration
and strategically focus i
•
•
nvestments. These included:
Two-day Columbia River Estuary Conferences in Astoria in 2006, 2008 and 2010 with more than 125 participants discussing emerging issues and sharing innovative strategies.
Four “Science to Policy” forums focused on habitat restoration, toxics reduction, community needs and accountability. (See page 5)
We developed outreach tools to share progress and lessons learned including – Habitat
Restoration Case Studies and Habitat
Restoration Program 2000 – 2009 .
We transitioned our website to a Google based mapping application that makes restoration, monitoring, and toxics data accessible to the public.
•
•

www.lcrep.org 15
0
100
200
300
400
500
600
700
800
0
2
4
6
8
10
12
14
16
Restoration Acres by Year
The Importance of Habitat Restoration in the Estuary Historically, lower Columbia River fish and wildlife used a wide variety of estuarine habitats for shelter, food, rearing, and other functions important in their life cycle. However, the estuary does not look or function like it did 100 years ago: approximately 84,000 acres of floodplain have been converted to agricultural, urban or other uses – a habitat loss in excess of 50%.
Every single ESA listed salmonid in the Columbia Basin uses the estuary twice during its life cycle. Islands, mud flats, salt water marshes, scrub shrub wetlands, forested wetlands, sandy beaches, and a variety of other habitat types provide salmon with food sources and cool water with appropriate levels of oxygen, clarity, and salinity; shallow off channel habitats for resting, feeding and refuge; and the right channel contours and current velocities.
The wide range of habitats in the lower Columbia River and the benefits those habitats provide to salmon, humans, and hundreds
of other species has been greatly diminished.
Habitat restoration aims to restore the habitat conditions and ecological processes and conditions that species and a healthy ecosystem depend on.
Native salmon, other native fish and wildlife depend on a wide range of ecological conditions and processes to thrive. Salmon in particular depend on a wide variety of habitat types. Development, diking, flow changes, and other modifications to the ecosystem directly affect species– whether by changing predator prey relationships, cutting off access to habitat, or decreasing access to the food web.
Most habitat restoration projects have specific immediate restoration goals: to re-open salmonid access to previously cut off habitat, to restore tidal influence, to reestablish riparian vegetation. One of the most important benefits is longer term: the creation of self sustaining and stable ecological processes that will enhance and maintain the desired habitat over time.
The Estuary Partnership Management Plan (1999), the NWPPC Lower Columbia Province Plan (2004, amended 2008), the Fish and Wildlife Program, the draft NOAA Columbia River Estuary Recovery Module for Salmon and Steelhead (2010), the States of Oregon and Washington Recovery Plans, the Biological Opinion for the Federal Columbia River Power System (2000, 2004, 2008), and the EPA Columbia Basin State of the River Report for Toxics (2009) consistently identify habitat loss and toxic contamination as threats to fish and wildlife.
erosiosand aColum
The Mighty ColumbiaThe history of the Columbia starts thirteen million years ago with an outpouring of molten lava from north south fissures along the present day border of Washington and Oregon. Basalt floods came wave after wave for four million years, leaving a blanket of rock five thousand feet thick. This Columbia Plateau diverted the ancient River in a massive detour, Big Bend. The river was forced west, then south, then east to meet the Snake river before it finally turned west for its final run to the Pacific.
Between five million and two million years ago, as the Columbia continued to bend and eat away at the basalt, the Cascades Mountain began to arch up.
During the last ice age, two million to 12,000 years ago,
n and stiff winds spread nd silt across the bia Plateau, stacking up
150 feet.
About 14,000 to 12,000 years ago, catastrophic floods began. Ice formed a giant dam 2,500 feet high, forming behind it a five hundred cubic mile lake.
Suddenly in geologic time, the ice dam let go and the lake exploded into a flood that rampaged with ten times the combined flow of all the rivers of the world, travelling 50 miles an hour and releasing energy, 33 times greater than the largest earthquake.
Floods occurred at least 40 times, ripping away silt, blasting through rock, creating a tormented landscape of coulees, dry falls, and barren channels. They found their way to the Pacific, reaming out the Cascade canyon. Landslides dropped as many as fifty square miles of earth shaping the north side.
l Sch
ulm
an: N
eiPh
oto

16 Lower Columbia River Estuary Partnership
Endangered Species
gradeC+
Are threatened and endangered species in the lower Columbia River recovering?
Today, thirty-two species of plants, fish and wildlife that live in or use the lower Columbia River are listed as threatened or endangered under the ESA; in 2004 there were twenty-four . Lower Columbia River salmon remain threatened . The bald eagle is no longer listed as endangered – a national success story . The Columbian White-tailed deer remains endangered, but populations are showing improvements .
Lower Columbia River Chinook Salmon
In 2005, we chose the Lower Columbia River Chinook salmon to represent the thirteen species
of salmon and steelhead listed as threatened or endangered under the ESA. In 2010, all thirteen species remain listed.
Annual salmon returns are highly variable from year to year, even over five year periods. Salmon have an exceedingly complex life history. Juvenile salmon emerge in Columbia River tributary streams in late winter or spring. They may spend a year migrating downstream to the ocean or as little as a month or two. Stream type salmon are typically the fall run species that spawn in spring and migrate downstream in as little as a month. Ocean type are typically spring run species that spawn in August or September and then migrate downstream the following spring. Both types continue rearing in the North Pacific, reaching maturity in two to eight years before returning to their native stream to
spawn. Conditions anywhere along that continuum can play a large role in salmon survival rates.
Many past practices contributed to these ESA listings. Floodplain diking, urbanization, logging, hydropower facilities and agriculture lead to significant reductions in spawning and rearing habitat. Loss of estuary and tidal freshwater habitat including tributary confluences, has been significant for fall Chinook. Spring-run populations have largely been lost as the result of dams that blocked access to their high-elevation habitat. Hydropower operations, flow diversions for irrigation and municipal uses, and dredging activities impacted the natural hydrology in the lower river, lowering surface water elevations, altering habitat forming processes and changing water velocities, temperature, and dissolved gas content. Traditional hatchery produced fish differ from wild fish in their behavior, appearance, and or physiology and can decrease genetic diversity which lowers disease resistance and ability to recover from disturbances. Hatchery fish can
also increase competition for food and territory; decrease the carrying capacity of habitat; increase predation by larger hatchery fish; and increase risk of overharvest. Fishing harvests also played a role.
Salmon spend an average of four years in the ocean making ocean conditions an important driver of salmon survival. Warmer ocean temperatures hinder salmon survival, colder conditions increase the upwelling that brings more nutrients to the surface for salmon to feed on. Around 1977, temperatures of the north Pacific Ocean became warmer. In the 1990s they began to decrease. These shifts are often in response to global climate shifts such as El Nino and La Nina, and the longer term (20 – 30 years) Pacific decadal oscillation. Chinook salmon numbers are now generally higher than in previous years; but, these recent increases are likely short term fluctuations, not a sign of recovery.
Fortunately these past practices are changing and that will help with species recovery.
The Challenges for 2015
Although the number of Columbian White-tailed deer in the lower Columbia River is healthy, it lacks a third viable subpopulation in a secure and suitable habitat. Access to more suitable protected habitat along the lower Columbia River is key.
To further advance the bald eagle’s recovery, removal of contaminants is critical. Identifying and cleaning up toxic hot spots and pesticide take back events are two opportunities. Research is needed into the impact of emerging contaminants on eagle reproductive rates. Bald eagles need appropriate roosting areas away from development, along healthy rivers and streams with abundant fish and wildlife food sources. Site specific management plans would provide for long-term availability of habitat.
For threatened and endangered salmonids, the actions are the same: remove contaminants and restore habitat.
Estuary Partnership Goals: Protect the ecosystem and species • Reduce toxic and conventional pollution • Provide information about the river to a range of audiences

www.lcrep.org 17
We are unlikely to see lower Columbia salmon returns of the 1800s when 4.6 million native Chinook returned or even returns of 450,000 to 550,000 seen in the early 1900s. The current annual returns average less than 100,000 fish, over half originate from hatcheries.
A variety of actions can give salmon a better chance during non-ocean portions of their lifecycle. Adding large wood to streams; protecting and reestablishing riparian vegetation; protecting and restoring tidal wetlands and off channel habitats; breaching dikes to allow tidal influence and improve access to off channel habitats; and replacing or removing culverts and tidegates all benefit salmon and other species.
Bald Eagles Bald eagles became one of the great success stories of the Endangered Species Act when they were officially delisted in 2007. Between 2005 and 2007 the number of occupied bald eagle nests along the lower Columbia River increased by approximately twelve nests; even more use the area as wintering habitat during migration. The greatest concentration of nest sites occurs in the lower estuary downstream from Cathlamet, Washington where their large nests are found atop the tallest shoreline trees and on small islands.
Thirty years ago, occupied bald eagle nests in the lower Columbia River and across the lower 48 states were almost non-existent. There were only about 400 nesting pairs in the entire lower 48 states in the early 1960’s. The first counts in the lower Columbia River in the late 1970’s showed approximately ten occupied eagle nests. The near decimation was primarily the result of pesticides such as DDT (Dichloro-Diphenyl-Trichloroethane). DDT was widely used in agriculture and to control insects that carry diseases like malaria. Once considered one of the safest insecticides, by the 1970s the story on DDT was much different.
DDT and many chlorinated hydrocarbons such as dioxins concentrate in the fat of humans, livestock, aquatic organisms, and wildlife. This accumulation has severe effects in bald eagles, ospreys, brown pelicans, and peregrine falcons. DDT and its breakdown products, DDD and DDE, are toxic to embryos and weaken the eggshells that protect them during incubation. These toxic chemicals can also affect the fertility and nesting behavior of parents, resulting in the death of unhatched embryos and young chicks. These same chemicals are highly toxic to the prey of predatory birds, including crayfish, sea shrimp and many species of fish.
The number of occupied bald eagle nests in the lower Columbia River has increased annually but in certain areas the reproductive success of eagles remains well below state averages. Around Grays Bay and Cathlamet Bay eagle nests produce about half as many young per nest as eagles nesting elsewhere in Oregon and Washington. The latest study conducted in the 1990sshow decreased contaminant levels, but bald eagles were still exposed to levels of organochlorines high enough to impair their breeding success. For these reasons, we need to closely monitor the health of bald eagles.
Columbian White-tailed Deer Columbia River population of the Columbian White-tailed deer has been listed as endangered since 1967. The 1983 Columbian White-tailed Deer Recovery Plan requires “a minimum of 400 Columbian White-tailed deer be maintained in at least three viable subpopulations distributed in suitable secure habitat.”
The USFW established the Julia Butler Hansen Refuge in 1972, a major step for recovery of the species. The refuge contains more than 6,000 acres of pastures, forested tidal swamps, brushy woodlots, pastures, marshes and sloughs on Columbia River islands and the mainland. Protected islands include Hunting and Price Islands in Washington and Tenasillahe, Crims, and Wallace Islands in Oregon. The refuge’s complex habitats also benefit a large number of wintering birds, river otter, several pair of nesting bald eagles and osprey, and a small herd of Roosevelt elk.
In 2010, there were two viable and secure subpopulations – at Tenasillahe Island and along the mainland shoreline in Washington. In a fall 2009 survey, biologists found over 600 Columbian White-tailed deer scattered across lower river habitats. However, a third secure subpopulation has not yet been achieved.
The plan is to continue to move deer to upriver islands and habitats to help get them out of the floodplain. Flooding, habitat changes brought on by development, invasive species, and predation by coyotes are the primary threats to the deer population.
1979
–19
81 –
1983
–19
85 –
1987
–19
89 –
1991
–19
93 –
1995
–19
97 –
1999
–20
01 –
2003
–20
05 –
2007
–
120 –
100 –
80 –
60 –
40 –
20 –
0 –
Washington
Oregon
Source: Oregon Cooperative Fish and Wildlife Research Unit
Occupied Bald Eagle Nest Sites Along the Columbia River
Columbia River Threatened and Endangered Species
Chinook Salmon
Lower Columbia River Chinook Salmon
Upper Columbia River Spring-Run
Chinook Salmon
Snake River Spring/Summer
Chinook Salmon
Snake River Fall Chinook Salmon
Upper Willamette River
Chinook Salmon
Chum Salmon
Columbia River Chum Salmon
Coho Salmon
Lower Columbia River Coho Salmon
Sockeye Salmon
Snake River Sockeye Salmon
Steelhead
Lower Columbia River Steelhead
Middle Columbia River Steelhead
Upper Columbia River Steelhead
Snake River Steelhead
Upper Willamette River Steelhead
Other marine species that occur in the lower river and/or plume
Eulachon/Columbia River Smelt
North American Green Sturgeon
Leatherback Sea Turtle
Loggerhead Sea Turtle
Green Sea Turtle
Olive Ridley Sea Turtle
Southern Resident Killer Whale
Humpback Whale
Blue Whale
Sperm Whale
Terrestrial and freshwater animal species that occur in the lower river and floodplain
Oregon Silverspot Butterfly
Oregon Chub
California Condor
Columbian White-Tailed Deer,
Columbia River DPS
Marbled Murrelet, CA, OR, WA
Southern Sea Otter (historic range)
Northern Spotted Owl
Western Snowy Pacific Plover,
Coastal Population
Bull Trout
Cutthroat Trout
Plants
Bradshaw’s Desert-Parsley
Golden Paintbrush
Kincaid’s Lupine
Nelson’s Checker-mallow
Water Howellia
Willamette Daisy

18 Lower Columbia River Estuary Partnership
Oregon and the US EP
T he Estuary Partnership was
established in 1995 by the
governors of Washington and
A to provide a
coordinated, regional voice to improve
ecological conditions of the lower river .
Using a watershed ecosystem based
approach, the Estuary Partnership works
across political boundaries with 28
cities, nine counties, 38 school districts
and the states of Oregon and Washington
over an area that stretches 146 miles
from Bonneville Dam to the Pacific
Ocean . It is the lead two-state entity
working in partnership with the private
sector and government agencies focused
on the ecosystem .
The Estuary Partnership is one of the
28 estuaries in the nation designated
an “Estuary of National Significance .”
The National Estuary Program was
authorized in the 1987 Clean Water Act
and is administered by the US EPA .
Mission
The mission of the Estuary Partnership is to preserve and enhance the water quality of the estuary to support its biological
and human communities.
Guiding Principle
The health of the river will not significantly improve if new problems continually emerge even as old ones are solved.
Goals
•
•
Protect the ecosystem and species – restore 19,000 acres of wetlands and habitat by 2014 and promote improvements in
stormwater management.
Reduce toxic and conventional pollution – conduct long-term monitoring and work with partners to eliminate
persistent bioaccumulative toxics, bring water bodies up to water quality standards, reduce hydrocarbon and heavy metal
•
discharges and reduce bacterial contamination.
Provide information about the river to a range of audiences – provide applied learning programs to children and adults
and build federal, tribal, state, local, public and private coordination.
Comprehensive Conservation and Management PlanAs a National Estuary Program, the first task of the Estuary Partnership was to convene local partners, stakeholders and
citizens to assess the problems in the estuary and define a set of science based actions to address those problems. That
action plan, the Comprehensive Conservation and Management Plan, was completed in 1999, and implementation began
immediately. The Management Plan sets a course for the next 25 years and defines 43 actions with specific environmental
goals and objectives that address the priority issues facing the lower Columbia River.
Board of Directors 2010 riCk aPPLegate, Citizen
Jane baCChieri, (Chair) Citizen
tom byLer, oregon watershed enhanCement board
mike Carrier, offiCe of oregon governor kuLongoski
steve harvey, (viCe Chair) CowLitz wahkiakum CounCiL of governments
biLL hutChison, esq., roberts kaPLan LLP
david Judd, Citizen
PauL LumLey, CoLumbia river inter tribaL fish Commission
margaret magruder, agriCuLturaL Community
dean marriott, City of PortLand bureau of environmentaL serviCes
bob niChoLs, offiCe of washington governor gregoire
iLoba odum, washington dePartment of eCoLogy
diCk Pedersen, oregon dePartment of environmentaL quaLity
dianne Perry, oregon & washington sPonsor Ports
donna quinn, Cannery Pier hoteL
Jeff smith, smith root, inC.
kathryn van natta, northwest PuLP and PaPer
reed waite, Citizen
Ex Officio:yvonne vaLLette & mary Lou sosCia,
us environmentaL ProteCtion agenCy
Cathy tortoriCi & Patty dornbusCh, nationaL marine fisheries serviCe
kevin briCe, us army CorPs of engineers
greg fuhrer, us geoLogiCaL survey
debrah marriott, estuary PartnershiP
Honorary Board Membersthe honorabLe deb waLLaCe,
washington house of rePresentatives
the honorabLe brad witt, oregon house of rePresentatives
the honorabLe JaCkie dingfeLder, oregon senate
Staff debrah marriott, exeCutive direCtor
Chris hathaway, direCtor of stewardshiP and teChniCaL Programs (dePuty direCtor)
Pam andrews, assistant to the direCtor
tom argent, finanCe manager
sangeeta sharma, aCCounting sPeCiaList
maggie Jones, CommuniCation and deveLoPment sPeCiaList
Laura o’keefe, CommuniCation and deveLoPment sPeCiaList
windy hovey, CommuniCation and deveLoPment assistant
Jennie kLein, stewardshiP Programs manager
Josh hoLComb, eduCation Coordinator
mCkenzie miLLer, environmentaL eduCator
annie kLeffner, environmentaL eduCator
katie JaCobson, environmentaL eduCator
sean sweeney, seasonaL environmentaL eduCator
samantha Johnson, seasonaL environmentaL eduCator
Catherine Corbett, teChniCaL
Programs manager
evan haas, habitat restoration Coordinator
keith marCoe, gis & data Coordinator
Chris CoLLins, habitat sPeCiaList
biLL bennett, habitat restoration Coordinator
watershed Coordinator, vaCant
monitoring Coordinator, vaCant
l Sch
ulm
an: N
eiPh
oto
Warrior Rock Lighthouse, Sauvie Island

www.lcrep.org 19
©2006
Wal
ter S
iegm
und
The Power of Partnership
The Estuary Partnership includes 24 Board of Director members, 22 staff, 40+ Science Work Group members, 125 regional scientists, 110 community leaders, 1200 teachers, 120,000 students, a dozen technical experts, multiple universities, and thousands of citizens.
While many things have changed since 2005, the Estuary Partnership’s essential purpose and mission have not. Our leadership and advocacy for the river are critical to secure funds for the region and ensure that these resources are strategically invested in our partners to advance on-the-ground projects and scientific goals. We are facilitating innovative approaches, enhancing collaboration, and advancing the latest scientific information for the region.
To get results, it takes a lot of great partners. The progress we are making to improve the estuary is because of the investments of many organizations, agencies, foundations, corporations and individuals. The Estuary Partnership is supported by the US EPA National Estuary Program and the states of Oregon and Washington. We have received significant funds from the Northwest Power and Conservation Council, Bonneville Power Administration and NOAA Community-based Restoration program and many grants from other local, state and federal agencies.
Over half of the funding for stewardship and environmental education programs comes from the generous support of individuals, corporations and private foundations. REI has been a lead supporter of our stewardship progress since 2002.
Along with these investments, the Army Corps of Engineers has invested several million dollars in habitat restoration projects that target the goals of our Management Plan. Further progress is being made by the states of Oregon and Washington who are investing in species recovery and toxics reduction.
The Columbia Land Trust, Columbia River Estuary Study Task Force, the Oregon Watershed Enhancement Board, the Washington Department of Ecology and the Washington Lower Columbia Fish Recovery Board are major partners in lower river restoration efforts. Dozens of watershed councils, local governments and conservation organizations are improving conditions in the lower river. The Estuary Partnership relies on regional experts through collaborations and contracts to assist with scientific work. Key partners include PNNL, USGS, NOAA and the University of Washington. The Estuary Partnership Science Work Group guides Estuary Partnership technical programs, bringing a wide range of expertise to our efforts.
All of this makes our work possible and defines us as a National Estuary Program.
What is an estuary?
Estuaries are where rivers flow
into the sea, and fresh water
mixes with ocean tides. They
feature shallow wetlands, mud
flats, streams and protected
bays critical to coastal
environments. In this unique
area, life-giving nutrients from
the land and sea combine to
support a rich abundance of
plants and animals. The estuary
is a critical transition zone
that maintains water quality,
minimizes damaging floods,
nurtures fish and wildlife, and
provides beautiful recreation
areas for us all. We thank the members of the US Congress representing Oregon and Washington,
and the Oregon and Washington State Legislatures for their leadership for the Columbia River and their support of the Lower Columbia River Estuary Partnership.
Program Funders u.s. environmentaL ProteCtion agenCy state of oregon state of washington
Project Supporters Camas-washougaL Community Chest City of PortLand,
bureau of environmentaL serviCes east muLtnomah soiL and water
Conservation distriCt metro regionaL government nationaL fish and wiLdLife foundation nationaL oCeaniC & atmosPheriC
administration new beLgium brewing ComPany northwest Power and Conservation
CounCiL / bonneviLLe Power administration
oregon Community foundation oregon dePartment of environmentaL
quaLity oregon state marine board oregon watershed enhanCement board rei the sierra CLub foundation u.s. environmentaL ProteCtion agenCy u.s. fish and wiLdLife serviCe
Corporate Contributors ameC, inC. anChor environmentaL bank of the CasCades brown and CaLdweLL CasCade design City of PortLand, bureau of
environmentaL serviCes CaroLLo engineers Ch2m hiLL Cmts CoLumbia state bank Crane and merseth david evans and assoCiates, inC. deaCon CharitabLe foundation enviroissues ePson PortLand, inC. eteC, LLC. georgia-PaCifiC Camas miLL hdr engineering JaCobs assoCiates JLa PubLiC invoLvement
kiewit – biLfinger berger mwh gLobaL, inC. murray, smith & assoCiates, inC. nw groCery assoCiation nw naturaL otak, inC. PaCifiC sourCe heaLth PLans Parametrix Parsons brinCkerhoff PLaid Pantries Port of PortLand PortLand generaL eLeCtriC roberts kaPLan, LLC smith-root, inC. whoLe foods winkLer deveLoPment
Individual Contributors Charity adoLf riCk aPPLegate & bess wong emiLy auerbaCh Jane baCChieri anthony barber
nikki bennett JaCqui bishoP brandon bLake karey and gary boCk Patty boyden angeLa brown bob brown Jonathan brown & Jan betz
marC brown shieLa brown Cynthia bye tim Carrier katherine Cheney Leandra CLeveLand miChaeL Coe daryL CoLe Larry and bethany Cotton kim Cox sean darCy Jon dasLer JiLL davis sebastian degens kathy dietriCh John and JuLie dixon bruCe dobbs and amy Lee Patty dornbusCh
CarL dugger and Janet mathews Jonathan dusLer bLaine ebberts Christine esteP
CaroL fenstemaCher Jennifer foran Lorna fossand greg and mary fuhrer sarah goodnough ani graves tanya gray steve and Lynn greenwood rusty griffin everett guPton CaroLyn haas John haide steve harvey
tim havens mike and Carrie hendriCks gretChen honan
ron and kathy horres randy and Cindy hudson wiLLiam and barb hutChison dr. baddia Jabbour ruth Jenkins kit and amy Johnson david and maggie Jones david Judd and kathryn fitCh saL kadri John keLLy Jonathan kreitLer ken and teresa kubo Jim and CamiLLa Lenhart bonnie and gaLe Long ted and traCy Lundin steve mader margaret magruder diane marCoe debrah and dean marriott robert marriott susan marxer riChard maughan Lee and mariLee miCheLs Jody mCLeod Linda meng davis and Judy moriuChi andy morrow ann marie nava
Lisa nikunen and steve adams dawn niLson Judy nys Joanna ogintz marCia ohLemiLLer Jim and Laura o’keefe rev. ervin overLund gary Parker katy Parrish John PauLson
Christi Payne diCk and Jenny Pedersen mira Peterson kathy wentz PheLPs mike Pitner reuben and Jeri PLantiCo PatriCk Prendergast doug and marie Putnam donna quinn LuLu quinn david rankin marveita redding Joe reidy Jeff rogers ron ross zari santner tom and nanCy sChaumberg donna sChramm mike sChwartz CharLes sChweigert donna siLverberg Jennifer sims mindy smith
angeLLe soans mary Lou sosCia and duane meCham mark smith Joan snyder Louise soLLiday and tom shafer mark stauffer gerry and JaneLLe st. Pierre karen streeter graeme tayLor
kathLeen tibbets don and robin tJostoLvson Cathy tortoriCi and roy rogers ChuCk and mardy trembLay riCh & mary anne uLring
yvonne vaLLette and biLL kirChner kathryn van natta and
roger barnhurst John van staveren
ben viehoff
John voLkman tina and reed waite Jay watson PatriCk wheary sharon whitehaLL CharLes wiggins Lisa and brant wiLLiams marie wise CLaudia zahorCak roger zander
iris zhao

Inside: Assessing Trends in the Lower Columbia River
PresortedFirst Class M
ailU
S PostagePAID
Portland, OR
Permit N
o. 3142
INDICATOR
GRADE 2005 GRADE 2010
Water Quality:Are pollutant levels in the lower Columbia
River increasing or decreasing?
? CLegacy contaminants, including DDT and PCBs, persist in
the environment. New contaminants including PBDEs are
emerging. Additional monitoring is needed to identify
contaminant sources and changes over time. Lack of
investment is delaying contaminant reduction and cleanup.
Land Use:Do our land use decisions protect lower
Columbia River water quality?
C C+With more people came more roads, roofs, parking lots and other
impervious surfaces. The more impervious surface, the more potential runoff of
contaminates into water bodies. Innovative stormwater management features that
lessen the impacts of development on water quality have increased.
Stewardship:Has the Estuary Partnership provided
citizens with opportunities to learn about
the lower Columbia River?
A ABetween 2005 and 2010 the Estuary Partnership
Stewardship program increased emphasis on outdoor
applied learning. Since 2005, we have provided 84,500
youth and adult learning experiences, an increase of
46% from 2005.
Habitat:Are we gaining or losing habitat in the lower
Columbia River?
C
Restoration partners restored 16,235 acres of habitat, meeting the Estuary
Partnership Management Plan restoration goal for 2010; a major accomplishment
yet less than half of what has been lost since settlement. The next level of restoration
is more challenging. We are not tracking habitat loss.
Today, thirty-two species of plants, fi sh and wildlife that
live in or us
threatened or endangered under the ESA; in 20
there were twenty-four. Lower Columbia River salmon
ald eagle is no longer listed as
remain threatened. The bss story. The Columbian
opulations – a national succeendangered
White-tailed deer remains endangered, but p
e the lower Columbia River are listed as 04
COMMENTS
The stewardship we build lasts a lifetime
From the Executive Director
Fifteen years ago, when the lower Columbia River NEP was created, we were
cautioned that Washington State looked north to the Puget Sound and Oregon State looked south to the Willamette Valley. The states have made significant investment in those and other water bodies since then, even through tough economic times. Washingtonians and Oregonians knew investing in healthy waters was good for the ecosystem, good for our economy and good for our kids.
The States, US EPA and Congress, the NWPCC/BPA, NOAA, foundations, corporations and individuals have invested millions in the lower river through the Estuary Partnership. We have created a network of partners and defined unified approaches. USGS, NOAA, and EPA have done several one-time studies. Municipalities, conservation organizations,
watershed councils throughout the study area are doing their share.
Today, as a region we can pause to celebrate the 16,235 acres restored since 1999 and the new science and strategic approaches to restoration. We can celebrate our work providing 123,000 student and adult learning experiences that meet state requirements. We can celebrate that three years of toxics monitoring done at six sites, testing for new contaminants for the first time.
For all the successes we have gone about as far as we can without expanded investment on the mainstem Columbia. There is no sustained monitoring of contaminants, no focused toxic reduction activities.
Contaminants threaten species health, contaminate the habitat we are restoring, affect human consumption of fish and threaten our economy.
The cost of a healthy river is high. The problems have occurred over a long time and our responses need to recognize ecologic time. If we are to
be good stewards, our investments must be sustained and substantial.
Our businesses need it – farmers, shippers, ports, fishers – our ecosystem and the fish need it. More than anything, our kids need it.
ww
wPortland811 SLow
er.lcrep.org
W N
aito P
, Oregon
Colum
biaarkway
97204
River, Suite
410
EstuaryPartnership
Are threatened and endangered species in
the lower Columbia River recovering?are showing improvements.
B
2010 Report on the Estuary
Related Documents