STUDIES IN THE PHYSIOLOGY OF ARTIFICIAL FEVER. I. CHANGES IN THE BLOOD VOLUME AND WATER BALANCE John G. Gibson 2d, Israel Kopp J Clin Invest. 1938; 17(3):219-232. https://doi.org/10.1172/JCI100946. Research Article Find the latest version: http://jci.me/100946/pdf Pdf

Welcome message from author
This document is posted to help you gain knowledge. Please leave a comment to let me know what you think about it! Share it to your friends and learn new things together.
Transcript
STUDIES IN THE PHYSIOLOGY OF ARTIFICIALFEVER. I. CHANGES IN THE BLOOD VOLUMEAND WATER BALANCE
John G. Gibson 2d, Israel Kopp
J Clin Invest. 1938;17(3):219-232. https://doi.org/10.1172/JCI100946.
Research Article
Find the latest version:
http://jci.me/100946/pdf

STUDIES IN THE PHYSIOLOGYOF ARTIFICIAL FEVER. I.CHANGESIN THEBLOODVOLUMEANDWATERBALANCE
BY JOHN G. GIBSON, 2D,1 AND ISRAEL KOPP2(From the Department of Medicine, Harvard University, the Medical Clinic of the Peter Bent
Brigham Hospital, and the Department of Neurosyphilis of the Boston PsychopathicHospital, Boston)
(Received for publication December 7, 1937)
During recent years great interest has beenaroused in the use of artificially induced fever inthe treatment of disease. Numerous claims havebeen made for the benefits of fever therapy butvery little attention has been paid to the changesit brings about in the coordinated functions of thebody, well and diseased.
The dangers of fever therapy have been em-phasized by many authors. Reactions of varyingseverity from nausea and vomiting to tetany (1,2, 3), delirious episodes (4), convulsions (5),heat stroke (3) and shock (2, 3, 6, 7, 8), havebeen described and deaths have been reported(9, 10, 11, 12, 13, 14).
The purpose of the studies reported in thisseries of communications was to determine thechanges resulting from artificially induced feverin circulating blood volume, water balance, acid-base equilibrium, and hemodynamics and the re-lationship of these changes to the clinical condi-tion of the patient. Our studies on the first twoof these factors are reported herein.
No thorough studies on changes in blood vol-ume during artificial fever have been reported.In the opinion of several fever therapists (15,16, 17) no significant alterations in circulatingblood volume occur during artificial fever if wateris given liberally, although some workers havereported that some degree of blood concentrationdoes occur (18, 19, 20). Hemoconcentration asevidenced by increases in red counts and hemo-globin values has been regarded by some as evi-dence of a reduction in volume (19, 20), but-others (15) interpret the increase in hemoglobinas evidence of a real increase in total hemoglobinto meet increased oxygen requirements. Bymeans of the COmethod (21) and a dye method
1 Research Fellow in Medicine, Harvard MedicalSchool.
2 Research Associate in the Massachusetts Departmentof Mental Diseases.
(22), decreases in plasma volume have been ob-served after artificially induced fever in animals.
Reliable studies of the water balance in arti-ficial fever were not found in the literature, al-though the high fluid requirement amounting toas much as 3 to 6 liters during a 5 to 6 hourtreatment has been commented on (15, 23).
METHODS
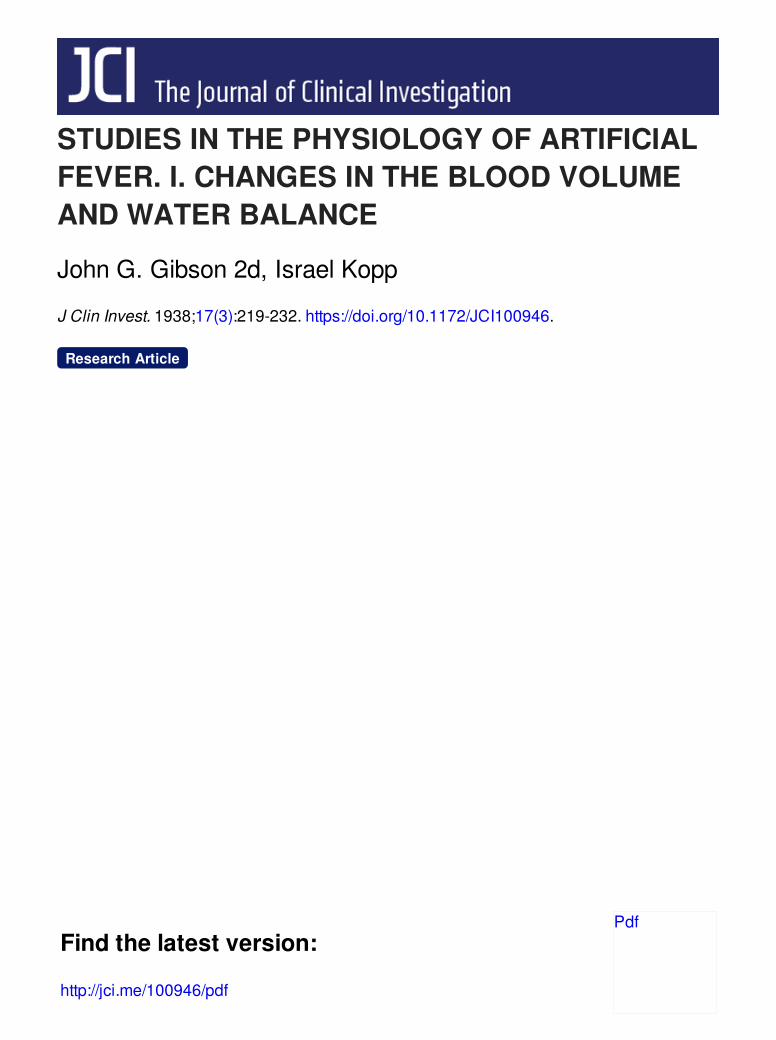
The dye method of determining the plasma and totalblood volume of Gibson and Evans (24) was used. Inthe experiments conducted in Rochester, N. Y., andDayton, Ohio, colorimetry was done by the techniquedescribed by Gibson and Evelyn (25) with the photo-electric colorimeter of Evelyn and Cipriani (26). The"direct" method (24) measures the plasma and totalblood volume obtaining at the time of dye injection, thedetermination being based upon the dilution in the bloodstream of a measured amount of Evans Blue of knownconcentration. In the "indirect" method an initial de-termination of blood volume is made by the "direct"method on the afternoon of the day preceding the fevertreatment (Figure 1). On the morning of treatmentthe rate of disappearance of dye from the blood streamis determined from the dye concentration of blood serumsamples taken at regular intervals over a two-hour pe-riod, and this rate is assumed to be constant throughoutthe ensuing experimental period. Changes in plasmavolume are estimated from the deviation of the dyeconcentration of blood serum samples taken during feverfrorf synchronous points on the disappearance slope,higher or lower density values representing a reductionfrom or increase over the prefebrile plasma volumerespectively. At the end of treatment the plasma volumeis again determined by the direct method, and the agree-ment between the final volume so determined and thefinal volume as estimated from the blood serum sampletaken just prior to the final dye injection constitutes acheck upon the accuracy with which changes in plasmavolume during the fever period have been measured.
That the disappearance slope of Evans Blue does re-main fairly constant during prolonged febrile periods, isevidenced by the fact that in 20 of the 31 experimentsreported herein, conducted as described above, the finalestimated plasma volume was within plus or minus 3per cent of the value obtained by actual redetermination.The narrow limits within which the final check fell in
219
JOHN G. GIBSON, 2D, AND ISRAEL KOPP
3@FINAL BLOOD VOLUME
ESTIMATED DETERMINEDPLASMA 1575 1585CELL 1285 1290
TOTAL BLOOD 280 2875
DYE D/SAPP1hAE SOPE'2--__
3 4 5 6 7 8 9 10 11 12 13 14 15 l6HOURS
IDUCT FEVER PERIOD --RECOVERY-*
TOTAL
INTAKE 3550 cc.Ofi°°°nlPo fmlDfoo l0n.opomp o PofP.f D- 0 o innO nO VOIDED * 185 cc.
FLUID INTAKE AND OUTPUT
TOTAL BLOOD VOLUME
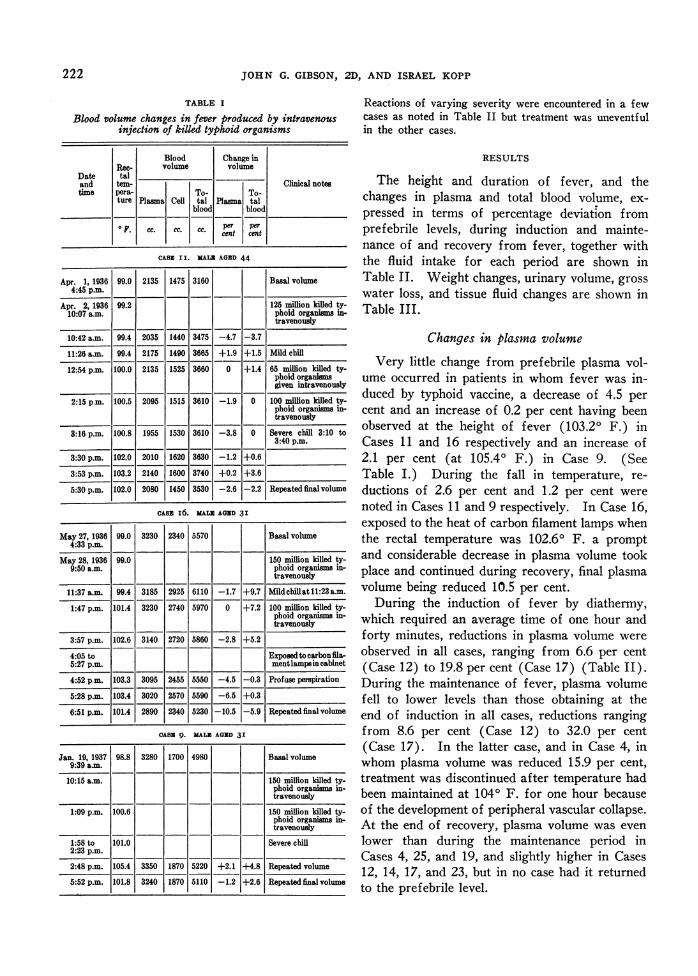
FIG. 1. METHODOF DETERMINING CHANGESIN BLOODVOLUMEDURING ARTIFICIAL FEVER
The initial blood volume (1) was determined the afternoon of the day preceding treatment. The rate ofdisappearance of the dye from the blood stream was determined during a prefebrile control period (2) theday of treatment. During induction of fever (3) the concentration of dye in the blood stream rose, indicatinga reduction in the plasma and total blood volume. During maintenance (4) a rise and later a fall in volumewhich continued through recovery (5) occurred. The repeated plasma volume at the end of treatment (6)agreed well with the final estimated plasma volume.
these cases was the justification for the modified pro-cedure followed in Cases R-2 to R-7 inclusive and D-1to D-3 inclusive, in which the disappearance slope wasnot determined prior to the induction of fever. A singleblood sample was taken before the patient was placedin the fever cabinet and the disappearance slope arbi-trarily constructed in such a manner that the final plasmavolume as estimated from the slope equalled the finalredetermined plasma volume after the latter had beencorrected for blood withdrawn in sampling.
Wehave found slight degrees of icterus to occur dur-ing artificial fever, but no colorimetric error is intro-duced thereby since the absorption of serum pigments atthe wavelength 620 millimicrons (at which measurementsof Evans Blue are made) was found to be so low thatslight increases thereof were negligible in relation to the
absorption due to the high concentrations of dye utilizedin these plasma volume experiments.
It is our opinion that, by the methods employed,changes in plasma volume were measured to within 3per cent. No claim for great accuracy is made forchanges in red cell and total blood volume because ofthe differences known to exist in red cell content ofperipheral and capillary blood, particularly when severe
physiological disturbances are taking place.All patients were weighed nude both before and after
treatment on lever type platform scales. Weights meas-
ured in pounds were obtained to the nearest one-eighthpound, and those measured in kilograms to the nearest0.05 kgm. Thus, changes in weight could be consideredin terms of water to within about 50 cc.
Patients treated by typhoid vaccine received tap water
INnLBLOODVOLUME4:0 PM.Il -28-35
PLASMA 1770ccCELL 1345 cc.TOTALBLOOD 3115 cc
1%j200F
;310030002900,oAAn
220
-5.671
PHYSIOLOGYOF ARTIFICIAL FEVER
by mouth, those treated by diathermy and hot moistcirculating air received 0.6 per cent saline solution bymouth, or 0.85 per cent saline intravenously-patientstreated by radiant energy were given tap water by mouthand in addition NaCl in 2 per cent solution in amountssufficient to make the salt content of the total fluidintake approximately equal to a 0.5 per cent saline solu-tion. Fluids given by mouth were measured in graduatesand those given intravenously from the usual graduatedclysis flask. It is thought that total fluid intake duringeach treatment was measured with an accuracy of about50 cc. Volume of urine and vomitus was measured ingraduated cylinders.
ANALYTIC CONSIDERATIONS
A bout of artificial fever may be thought of as con-sisting of three periods; the period of induction of tem-perature to the desired level during which the mechanismsof the body for temperature regulation are overcome,the period of maintenance at the desired temperature,and the period of recovery to normal temperature, dur-ing which the heat regulating mechanisms are againpermitted to function successfully. Changes in plasmaand total blood volume were analyzed in relation tothese three periods.
It was assumed that all water lost is withdrawn di-rectly f rom the blood stream via the skin, lungs, orkidneys, that weight changes may be considered in termsof water and that weight change represents the truedifference between the gross water loss from the bloodstream and total fluid intake, according to the equation
Gross Water Loss = Total Fluid Intake +Weight Loss or- Weight Gain (1)
The amount of fluid withdrawn from tissue spaces inpatients inadequately supplied with water or the amountentering the tissue spaces in those in whom excessivefluids were given was calculated by the equation
Loss = Gross Water Loss -(Total Fluid Intake
Tissue Fluid or
Gain = (Total Fluid Intake- Decrease in Plasma Vo
or+ Increase in Plasma Vo
ing the short treatments to 500 cc. during the long treat-ments could not be included in total fluid intake. Onthe other hand, it was not possible to determine, exceptin those cases in which all fluids were given intravenously,that all fluids administered were completely absorbed bythe end of the experimental period. These two sourcesof error tend to compensate each other. It is felt thatgross water loss and tissue fluid changes calculated inthe above manner are valid to within about 5 per cent,and are of value for the clinical interpretation of thesigns and symptoms presented during artificial fever.
MATERIAL STUDIED
Thirty-one studies were carried out on 25 patients, 21of whom were males and 4 females. All were under-going fever therapy, the diagnoses being indicated inTable III. In 3 studies, fever was induced by the in-travenous injection of killed typhoid organisms. In 8studies diathermy was used, the apparatus employedbeing the " Super Power " unit, with segmented elec-trodes encircling the arms, thighs, and waist, the currentvarying from 1500 to 2600 milliamperes. In one casetreated with typhoid vaccine and in two cases treated bydiathermy additional heating in the form of radiantenergy (carbon filament lamp) was used. In 13 studies,3 of which were made at Dayton, Ohio, fever was in-duced by hot moist circulating air in the "KetteringHypertherm " (27). In the 10 studies made in Bostonthe relative humidity in the cabinet was maintainedbetween 30 and 50 per cent during induction of fever.Dry bulb temperature was about 155 to 1600 F. and thewet bulb about 130 to 1350 F. during induction. Duringmaintenance, the air current was turned off and the pa-tient was covered with blankets. In the 3 cases studiedin Dayton, relative humidity was about 80 per cent, drybulb and wet bulb temperatures being about 1300 F. and1250 F. during induction, and 1250 F. and 1200 F. dur-ing maintenance respectively. Air speeds were somewhat
- Decrease in Plasma Volumeor J
+ Increase in Plasma Volume /
lume- Gross Water Loss
lume /
(2)
In cases in which vomiting occurred the amount ofvomitus was deducted from total fluid intake as beingfluid not available for replacement of water losses. Be-cause of the difficulty of determining the amount ofurine in the bladder at the beginning and end of treat-ment, data on urinary output are not regarded as morethan approximations. For comparison of individuals,changes in gross water loss and tissue fluid were con-sidered in terms of cc. per hour per kgm. of body weight.
These equations are intended to give only approximatemeasurements of the changes in the water balance. Oxy-gen consumption was not measured and therefore thewater of oxidation which might range from 200 cc. dur-
slower and the total air space somewhat smaller in thecabinets used in Dayton than in those used in Boston.Induction to desired fever levels was slower with the lowthan with the high humidities. In 7 studies conductedat Rochester, N. Y., fever was induced by means ofradiant energy (carbon filament lamps) in cabinets withlimited static air space (28).
Rectal temperature was elevated to 103 to 1040 F. inthe patients treated with typhoid vaccine, and to 1060 F.or over in most of the patients treated by the physicalmodalities. Treatment was discontinued because of col-lapse in Cases 4 and 17, treated by diathermy, and inCases 2, 10, and 21 treated by hot moist circulating air.
221
JOHN G. GIBSON, 2D, AND ISRAEL KOPP
TABLE I
Blood volume changes in fever produced by intravenousinjection of killed typhoid organisms
Blood Change inRec- volume volume
Date taland tem- Clinical notestime pera- To- To-
ture Plasma Cell tal Plasma talblood blood
0 F. cc. cc. cc. per percent cent
CA8S I I. KALE AGED44
Apr. 1, 1936 99.0 2135 1475 3160 Basal volume4:45 p.m.
Apr. 2, 1936 99.2 125 million killed ty-10:07 a.m. phoid organisms in-
travenously
10:42 a.m. 99.4 2035 1440 3475 -4.7 -3.7
11:26 a.m. 99.4 2175 1490 3665 +1.9 +1.5 Mild chill
12:54 p.m. 100.0 2135 1525 3660 0 +1.4 65 million killed ty-phoid organimsgiven intravenously
2:15 p.m. 100.5 2095 1515 3610 -1.9 0 100 million kllled ty-phoid organisms in-travenously
3:16 p.m. 100.8 1955 1530 3610 -3.8 0 Severe chill 3:10 to3:40 p.m.
3:30 p.m. 102.0 2010 1620 3630 -1.2 +0.6
3:53 p.m. 103.2 2140 1600 3740 +0.2 +3.6
5:30 p.m. 102.0 2080 1450 3530 -2.6 -2.2 Repeated finalvolume
CASE i6. MALE AGED 31
May 27, 1936 99.0 3230 2340 5570 Basal volume4:33 p.m.
May 28, 1936 99.0 150 million killed ty-9:50 a.m. phoid organims in-
travenously11:37 a.m. 99.4 3185 2925 6110 -1.7 +9.7 Mildchillat11:23a.m.
1:47 p.m. 101.4 3230 2740 5970 0 +7.2 100 million killed ty-phoid organisms in-travenously
3:57 p.m. 102.6 3140 2720 5860 -2.8 +5.2
4:05 to Exposedtocarbonfila-5:27 p.m. mentlampsincabinet4:52 p.m. 103.3 3095 2455 5550 -4.5 -0.3 Profuse perspiration
5:28 p.m. 103.4 3020 2570 5590 -6.5 +0.3
6:51 p.m. 101.4 2890 2340 5230 -10.5 -5.9 Repeated final volume
CASE 9. MALE AGED 3 I
Jan. 19, 1937 98.8 3280 1700 4980 Basal volume9:39 a.m.
10:15 a.m. 150 million killed ty-phoid organisms in-travenously
1:09 p.m. 100.6. 150 million killed ty-phoid organism in-travenously
1:58 to 101.0 Severe chill2:23 p.m.
2:48 p.m. 105.4 3350 1870 5220 +2.1 +4.8 Repeated volume
5:52 p.m. 101.8 3240 1870 5110 -1.2 +2.6 Repeated final volume
Reactions of varying severity were encountered in a fewcases as noted in Table II but treatment was uneventfulin the other cases.
RESULTS
The height and duration of fever, and thechanges in plasma and total blood volume, ex-pressed in terms of percentage deviation fromprefebrile levels, during induction and mainte-nance of and recovery from fever, together withthe fluid intake for each period are shown inTable II. Weight changes, urinary volume, grosswater loss, and tissue fluid changes are shown inTable III.
Changes in plasma volume
Very little change from prefebrile plasma vol-ume occurred in patients in whom fever was in-duced by typhoid vaccine, a decrease of 4.5 percent and an increase of 0.2 per cent having beenobserved at the height of fever (103.20 F.) inCases 11 and 16 respectively and an increase of2.1 per cent (at 105.40 F.) in Case 9. (SeeTable I.) During the fall in temperature, re-ductions of 2.6 per cent and 1.2 per cent werenoted in Cases 11 and 9 respectively. In Case 16,exposed to the heat of carbon filament lamps whenthe rectal temperature was 102.60 F. a promptand considerable decrease in plasma volume tookplace and continued during recovery, final plasmavolume being reduced 10.5 per cent.
During the induction of fever by diathermy,which required an average time of one hour andforty minutes, reductions in plasma volume wereobserved in all cases, ranging from 6.6 per cent(Case 12) to 19.8 per cent (Case 17) (Table II).During the maintenance of fever, plasma volumefell to lower levels than those obtaining at theend of induction in all cases, reductions rangingfrom 8.6 per cent (Case 12) to 32.0 per cent(Case 17). In the latter case, and in Case 4, inwhom plasma volume was reduced 15.9 per cent,treatment was discontinued after temperature hadbeen maintained at 1040 F. for one hour becauseof the development of peripheral vascular collapse.At the end of recovery, plasma volume was evenlower than during the maintenance period inCases 4, 25, and 19, and slightly higher in Cases12, 14, 17, and 23, but in no case had it returnedto the prefebrile level.
222
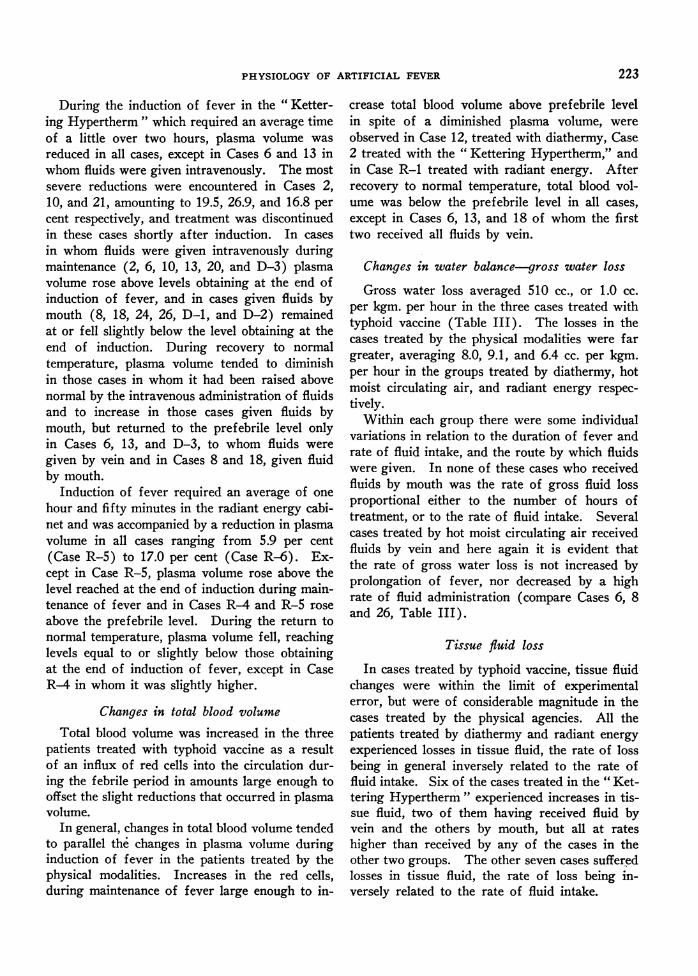
PHYSIOLOGYOF ARTIFICIAL FEVER
During the induction of fever in the " Ketter-ing Hypertherm " which required an average timeof a little over two hours, plasma volume was
reduced in all cases, except in Cases 6 and 13 inwhom fluids were given intravenously. The mostsevere reductions were encountered in Cases 2,10, and 21, amounting to 19.5, 26.9, and 16.8 per
cent respectively, and treatment was discontinuedin these cases shortly after induction. In cases
in whom fluids were given intravenously duringmaintenance (2, 6, 10, 13, 20, and D-3) plasmavolume rose above levels obtaining at the end ofinduction of fever, and in cases given fluids bymouth (8, 18, 24, 26, D-1, and D-2) remainedat or fell slightly below the level obtaining at theend of induction. During recovery to normaltemperature, plasma volume tended to diminishin those cases in whom it had been raised abovenormal by the intravenous administration of fluidsand to increase in those cases given fluids bymouth, but returned to the prefebrile level onlyin Cases 6, 13, and D-3, to whom fluids were
given by vein and in Cases 8 and 18, given fluidby mouth.
Induction of fever required an average of one
hour and fifty minutes in the radiant energy cabi-net and was accompanied by a reduction in plasmavolume in all cases ranging from 5.9 per cent(Case R-5) to 17.0 per cent (Case R-6). Ex-cept in Case R-5, plasma volume rose above thelevel reached at the end of induction during main-tenance of fever and in Cases R-4 and R-5 rose
above the prefebrile level. During the return tonormal temperature, plasma volume fell, reachinglevels equal to or slightly below those obtainingat the end of induction of fever, except in CaseR-4 in whom it was slightly higher.
Changes in total blood volumeTotal blood volume was increased in the three
patients treated with typhoid vaccine as a resultof an influx of red cells into the circulation dur-ing the febrile period in amounts large enough tooffset the slight reductions that occurred in plasmavolume.
In general, changes in total blood volume tendedto parallel the changes in plasma volume duringinduction of fever in the patients treated by thephysical modalities. Increases in the red cells,during maintenance of fever large enough to in-
crease total blood volume above prefebrile levelin spite of a diminished plasma volume, wereobserved in Case 12, treated with diathermy, Case2 treated with the " Kettering Hypertherm," andin Case R-1 treated with radiant energy. Afterrecovery to normal temperature, total blood vol-ume was below the prefebrile level in all cases,except in Cases 6, 13, and 18 of whom the firsttwo received all fluids by vein.
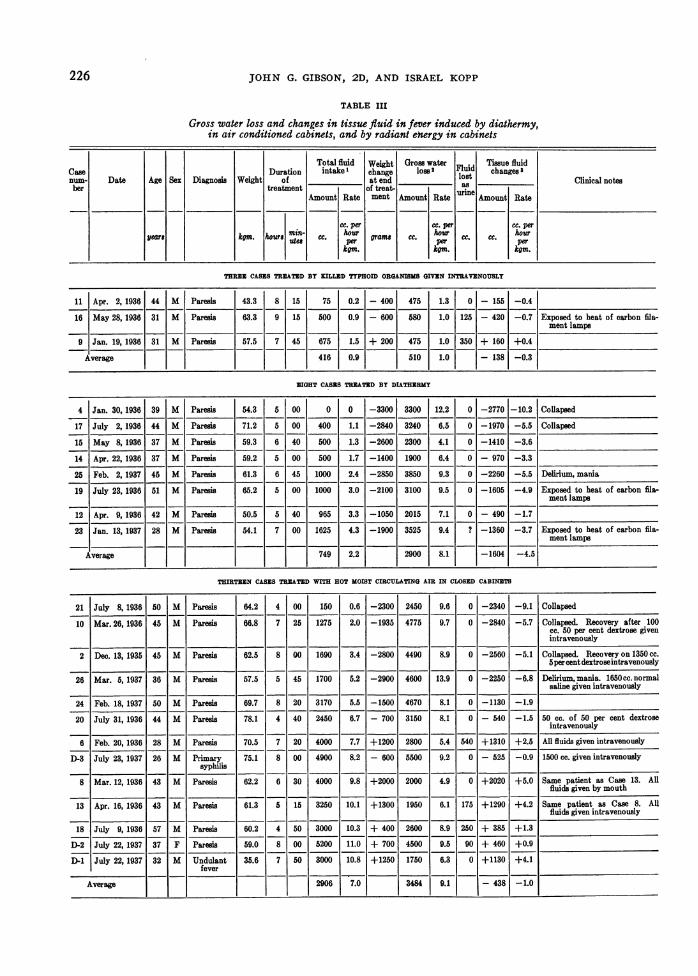
Changes in water balance-gross water loss
Gross water loss averaged 510 cc., or 1.0 cc.per kgm. per hour in the three cases treated withtyphoid vaccine (Table III). The losses in thecases treated by the physical modalities were fargreater, averaging 8.0, 9.1, and 6.4 cc. per kgm.per hour in the groups treated by diathermy, hotmoist circulating air, and radiant energy respec-tively.
Within each group there were some individualvariations in relation to the duration of fever andrate of fluid intake, and the route by which fluidswere given. In none of these cases who receivedfluids by mouth was the rate of gross fluid lossproportional either to the number of hours oftreatment, or to the rate of fluid intake. Severalcases treated by hot moist circulating air receivedfluids by vein and here again it is evident thatthe rate of gross water loss is not increased byprolongation of fever, nor decreased by a highrate of fluid administration (compare Cases 6, 8and 26, Table III).
Tissue fluid loss
In cases treated by typhoid vaccine, tissue fluidchanges were within the limit of experimentalerror, but were of considerable magnitude in thecases treated by the physical agencies. All thepatients treated by diathermy and radiant energyexperienced losses in tissue fluid, the rate of lossbeing in general inversely related to the rate offluid intake. Six of the cases treated in the " Ket-tering Hypertherm" experienced increases in tis-sue fluid, two of them having received fluid byvein and the others by mouth, but all at rateshigher than received by any of the cases in theother two groups. The other seven cases sufferedlosses in tissue fluid, the rate of loss being in-versely related to the rate of fluid intake.
223
JOHN G. GIBSON, 2D, AND ISRAEL KOPP
0
di
I1 I
A 4\5s_____I__
___I____,,] |£
0 0.*.E-lZ8|£
0 |£
aO0I ~
______ I___
co
m
00.40
I
V
1900}0
I'I
1jI
00I
P0
-I
.I3A
0 00 eq N- N 00 tO .q.0.. 4
ole o lt lo l ~co o
_ =__o o1 -.-4 0OC 00 OONc;:0 4) NCi O C. 00
Co0c10Coolou o l
colclewco-leweoq 0000 _o __eq eq COeq CO eq
-I ClI uI ¢oI
o8co v 0C00 Nto
_|_|CD J|- N|- |> - to | -
Iz01 1010C' CO eq
CO eq _ jO COJ. 00eq|.
CO, CO00 00
0 0 0o 0 o o_ _ -.1.- It I
000 CO 0 o00 00 0
X~~~~~t1e1 - e1
I ew0 0 00=
1|1Z19Z1 C>
CO g g q00CO
oIoIoIoloIoIoI00
0100101eq11I
0 0 00 00 0o
N 00 cOW10 4 co 00 NoI00
I . , , ,.I
010 lo 10 lo1 q
CO 00q C)i
o. Il il Iod Io.I.Io1 0 go10 1 01 l
. . .Iz
oH
01
m
I
0
I
N- 00 10I0 00 COC4 cd Cd
I
ICzn
oo
Ict
I
hIf
I A"
I
0
1a
0
00 00 0060 CN 0 00eq.. .410 .41 00 .O N 00
Ia'1' 1 ' 1 t° I - I + ~+ I + + II 00 1~01 141 d101o 0001 10.0000OI III I -ICIco t-I- I ItI O00 CO 00 04 N 0
qeq
Q co
0
eq C eq C
g IUV8U IIolb +1,so I,l IIolol
| q|ci | o 4 o| co co_1| > |_|
eq o~ ~ o4Id Oded C.:.cod ooo
I____1 X I c o o Io I e;u IIO II oo t-I
co tool 8 C*l " 81co8 1oo8I co0 cm Ieq00 to
'00I [0 c0j co CO CO 001 00 COO 00I I00L.0 IC4 0
1qco1o0so ti C CilolX C<li80
o 00q181°181X t f Nt
00 000_l 01l CO 1 1-1I-eq00 OCOI -I I I F
000000 0000 C~~~~~:I 00 000Cl 44CO00 eq N 0 00 eq C4 0e la
IO 1110 I ++8 +
1
eq co O O C C
I 1-1 COI 0 101 101 10010 1010,10
010COCO000 COj00 I~~~~~~~~~CDICO CO101010
IglelElg lolub lSoe,lcou~~~~~~~~;gl 188|°o
0t 010 0 0 0 -0 nIoIq-!OOiOc 0 0 00 coC CO COC
CI III
000 00 4 .4 0 00 00 0 o0 co
000000.41 00~~~~~~~~ 0000 ~~C*C COOC
co 00 000 00 cO CO0* ~ N0c co ~ 04 N N0 10
lo*loIq lo*C~CD=C
I-o I1 1e 2141
224
ie2
z1))
*I
I.X
*00
4;
30
CI
00&.gCia IoI,
1° 1-°4 °1°q

PHYSIOLOGYOF ARTIFICIAL FEVER
0
A
.a I ti
o0XF~~~~~~* A
I.S
I 2|A 2
C kE
.~ .
0
4
a34.-
p
0
I
I
Pl
a
9
co
0
-:11
z a
I
04"4r"4s "4
I
I
° 1'° oo02b-- CD e4 lU o 1t
CD co col lH 11S q0 0 0 04
S ce
'° 1+HI°o'8"4 t'- "4 0 "4 1°1"4 1-° "4 0 4-1 co
8 "4"4ooe11
o &a mwlc o lolo000
<; S; G;bl 9 M
i[5 I~~~~~~~I~~~I C
oco o 'o o o
ho 0 01 0 0*
"4 4 "4 " 0 o. 4l l BR ORl lgo 4m e co a £3&
I o c o -Ie
"4C 04 "4C
"44"
"4 Cl"4 c C
c- I- q q I e I
"4 "4 l"4 -U
o00
225
0 0
>4CaL)E -o
C.
Cd
00C)
0._
Cd
4)C-
a)
.0
Cd
0
CL)
3-04
Co
'0
"4
>4
-
a)
226 JOHN G. GIBSON, 2D, AND ISRAEL KOPP
TABLE III
Gross water loss and changes in tissue fluid in fever induced by diathermy,in air conditioned cabinets, and by radiant ew1.rgy in cabinets
Total fluid Weight Gross waterFli Tissue fluidCase Duration intake'1 change loss F2 i changes 3num- Date Age Sex Diagnosis Weight of _____ at end_____ lost Clinical notes
her treatment of treat- uainAmount Rate ment Amount Rateuie Amount Rate
cc. per cc. per cc. peryears hgm. h~~~~ourmin- c. hour ,, c hour houryears kgm. Ur8 ute# per ~~~gram C.preC C per
kgm. Icgm. kgm.
THREEN CASECS TREATED BY KILLED TYPHOID ORGANISMSGIVEN INTRVE1NOUSLY
11 Apr. 2, 1936 44 M Paresls 43.3 8 15 75 0.2 - 400 475 1.3 0 - 155 -0.4
16 May 28, 1936 31 M Paresis 63.3 9 15 500 0.9 - 600 580 1.0 125 - 420 -0.7 Exposed to heat of carbon fila-ment lamps
9 Jan. 19, 1936 31 M Paresis 57.5 7 45 675 1.5 + 200 475 1.0 350 + 160 +0.4
Average 416 0.9 510 1.0 -138 -0.3
EIGHT CASES TREATED BY DIATHERRMY
4 Jan. 30, 1936 39 M Paresis 54.3 5 00 0 0 -3300 3300 12.2 0 -2770 - 10.2 Collapsed
17 July 2, 1936 44 M Paresis 71.2 5 00 400 1.1 -2840 3240 6.5 0 -1970 -5.5 Collapsed
15 May 8, 1936 37 M Paresis 59.3 6 40 500 1.3 -2600 2300 4.1 0 -1410 -3.6
14 Apr. 22, 1936 37 M Paresis 59.2 5 00 500 1.7 -1400 1900 6.4 0 - 970 -3.3
25 Feb. 2, 1937 45 M Paresis 61.3 6 45 1000 2.4 -2850 3850 9.3 0 -2260 -5.5 Delirum, mania
19 July 23, 1936 51 M Paresis 65.2 5 00 1000 3.0 -2100 3100 9.5 0 -1605 -4.9 Exposed to heat of carbon fila-ment lamps
12 Apr. 9, 1936 42 M Paresis 50.5 5 40 965 3.3 -1050 2015 7.1 0 - 490 -1.7
23 Jan. 13, 1937 28 M Paresis 54.1 7 00 1625 4.3 -1900 3525 9.4 ?-1360 -3.7 Exposed to heat of carbon fila-ment lamps
Average 749 2.2 2900 8.1 -1604 -4.5
THIRTEEN CASES TREATED wITH HOT MOIST CIRCULATING AIR IN CLOSEDCABINETS
21 July 8, 1936 50 M Paresis 64.2 4 00 150 0.6 -2300 2450 9.6 0 -2340 -9.1 Collapsed
10 Mar. 26, 1936 45 M Paresis 66.8 7 25 1275 2.0 -1935 4775 9.7 0 -2840 -5.7 Collapsed. Recovery after .100cc. 50 per cent dextrose givenintravenously
2 Dec. 13, 1935 45 M Paresis 62.5 8 00 1690 3.4 -2800 4490 8.9 0 -2560 -5.1 Collapsed. Recovery on 1350 cc.spercentdextroseintravenously
26 Mar. 5, 1937 36 M Paresis 57.5 5 45 1700 5.2 -2900 4600 13.9 0 -2250 -6.8 Delirium, mania. 1650cc. normalsaline given intravenously
24 Feb. 18, 1937 50 M Paresis 69.7 8 20 3170 5.5 -1500 4670 8.1 0 -1130 -1.9
20 July 31, 1936 44 M Paresis 78.1 4 40 2450 6.7 - 700 3150 8.1 0 - 540 -1.5 50 cc. of 50 psr cent dextroseintravenously
6 Feb. 20, 1936 28 M Paresis 70.5 7 20 4000 7.7 +1200 2800 5.4 540 +1310 +2.5 All fluids given intravenously
D-3 July 23, 1937 26 M Primary 75.1 8 00 4900 8.2 - 600 5500 9.2 0 - 525 -0.9 1500 cc. given intravenouslysyphilis ____________ ____ _______________ ___
8 Mar. 12, 1936 43 M Paresis 62.2 6 30 4000 9.8 +2000 2000 4.9 0 +2020 +5.0 Same patient as Case 13. Allfluids given by mouth
13 Apr. 16, 1936 43 M Paresis 61.3 5 15 3250 10.1 +1300 1950 6.1 175 +1290 +4.2 Same patient as Case 8. Allflnids given intravenously
18 July 9, 1936 57 M Paresis 60.2 4 50 3000 10.3 + 400 2600 8.9 250 + 385 +1.3
D-2 July 22, 1937 37 F Paresis 59.0 8 00 5200 11.0 + 700 4500 9.5 90 + 460 +0.9
D-1 July 22, 1937 32 M Undulant 35.6 7 50 3000 10.8 +1250 1750 6.3 0 +1130 +4.1fever
Average 2906 7.0 3484 9.1 - 438 -10
PHYSIOLOGYOF ARTIFICIAL FEVER
TABLE III-Continued
Total fluid Weigh Groms water TIssue fluidCase Duration intake i change los2 Fluid changes3num- Date Age Sex Diagnosis Weight of at end lost Clinical notes
ber treatment of treat- asAmount Rate ment Amount Rate urine Amount Rate
cc. per cc. per cc. peryears km. iiows rain-
c. hourgas C.
hourC. C. hour
I er per pm.
BSVEN CASS THUATEDWITH R&DUTENEGY(CARBONvuN rrT LAM.) IN CABINETS WIm LIMITD 5TATIC AIR SPACE
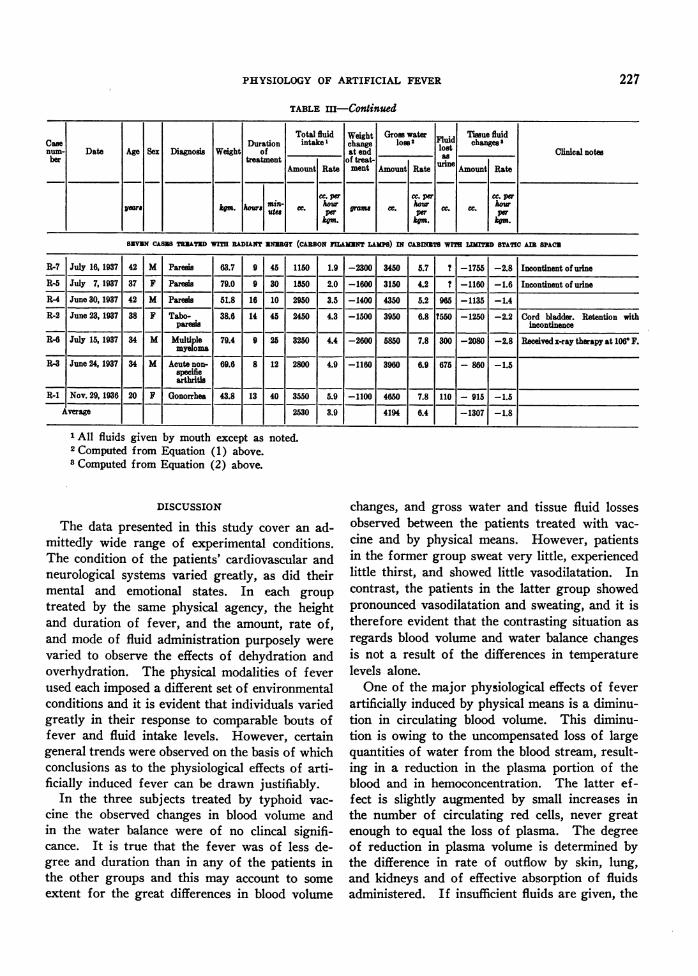
R-7 July 18, 1937 42 M Paresis 63.7 9 45 1150 1.9 -2300 3450 5.7 ? -1755 -2.8 Incontinent of urineR-5 July 7, 1937 37 F Pares 79.0 9 30 1550 2.0 -1600 3150 4.2 t -1160 -1.6 Incontinent of urineR-4 June 30, 1937 42 M Paresis 51.8 16 10 2950 3.5 -1400 4350 5.2 965 -1135 -1.4
R-2 June 23, 1937 38 F Tabo- 38.6 14 45 2450 4.3 -1500 3950 6.8 ?550 -1250 -2.2 Cord bladder. Retention withparesis incontinence
R-6 July 15, 1937 34 M Multiple 79.4 9 25 3250 4.4 -2600 5850 7.8 300 -2080 -2.8 Received x-ray therapy at 1060 F.myeloma
R-3 June 24, 1937 34 M Acute non- 69.6 8 12 2800 4.9 -1160 3960 6.9 675 - 860 -1.5specifiearthritis
R-1 Nov. 29, 1936 20 F Gonorrhea 43.8 13 40 3550 5.9 -1100 4650 7.8 110 - 915 -1.5Average 2530 3.9 4194 6.4 -1307 -1.8
All fluids given by mouth except as noted.2 Computed from Equation (1) above.3 Computed from Equation (2) above.
DISCUSSION
The data presented in this study cover an ad-mittedly wide range of experimental conditions.The condition of the patients' cardiovascular andneurological systems varied greatly, as did theirmental and emotional states. In each group
treated by the same physical agency, the heightand duration of fever, and the amount, rate of,and mode of fluid administration purposely were
varied to observe the effects of dehydration andoverhydration. The physical modalities of feverused each imposed a different set of environmentalconditions and it is evident that individuals variedgreatly in their response to comparable bouts offever and fluid intake levels. However, certaingeneral trends were observed on the basis of whichconclusions as to the physiological effects of arti-ficially induced fever can be drawn justifiably.
In the three subjects treated by typhoid vac-
cine the observed changes in blood volume andin the water balance were of no clincal signifi-cance. It is true that the fever was of less de-gree and duration than in any of the patients inthe other groups and this may account to some
extent for the great differences in blood volume
changes, and gross water and tissue fluid lossesobserved between the patients treated with vac-cine and by physical means. However, patientsin the former group sweat very little, experiencedlittle thirst, and showed little vasodilatation. Incontrast, the patients in the latter group showedpronounced vasodilatation and sweating, and it istherefore evident that the contrasting situation asregards blood volume and water balance changesis not a result of the differences in temperaturelevels alone.
One of the major physiological effects of feverartificially induced by physical means is a diminu-tion in circulating blood volume. This diminu-tion is owing to the uncompensated loss of largequantities of water from the blood stream, result-ing in a reduction in the plasma portion of theblood and in hemoconcentration. The latter ef-fect is slightly augmented by small increases inthe number of circulating red cells, never greatenough to equal the loss of plasma. The degreeof reduction in plasma volume is determined bythe difference in rate of outflow by skin, lung,and kidneys and of effective absorption of fluidsadministered. If insufficient fluids are given, the
227
JOHN G. GIBSON, 2D, AND ISRAEL KOPP
tissue fluids of the body are drawn upon for themaintenance of plasma volume with resultant de-hydration. Blood volume may be maintained atprefebrile levels by intravenous administration offluids, but in only 2 cases in this series was itmaintained at prefebrile level when fluids weregiven by mouth even in large amounts. Too rapidadministration of fluids by vein may result in anexcessive increase in blood volume and result incardiac embarrassment and failure.
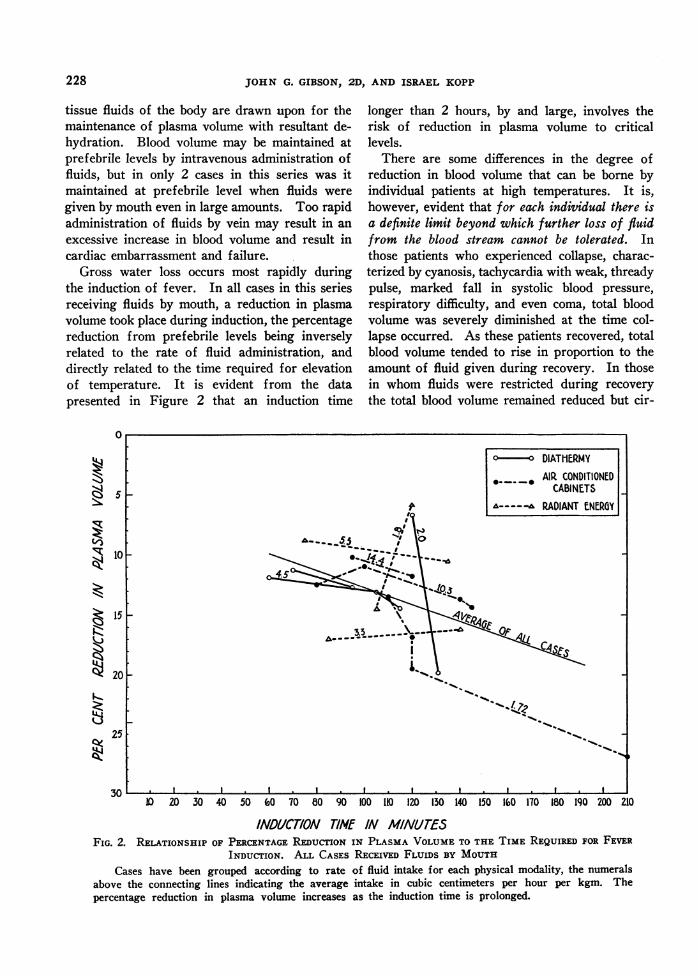
Gross water loss occurs most rapidly duringthe induction of fever. In all cases in this seriesreceiving fluids by mouth, a reduction in plasmavolume took place during induction, the percentagereduction from prefebrile levels being inverselyrelated to the rate of fluid administration, anddirectly related to the time required for elevationof temperature. It is evident from the datapresented in Figure 2 that an induction time
0
'N
0~3KJ~
KR
"a:T
5
10
15
20
25 [
30
longer than 2 hours, by and large, involves therisk of reduction in plasma volume to criticallevels.
There are some differences in the degree ofreduction in blood volume that can be borne byindividual patients at high temperatures. It is,however, evident that for each individual there isa definite limit beyond which further loss of fluidfrom the blood stream cannot be tolerated. Inthose patients who experienced collapse, charac-terized by cyanosis, tachycardia with weak, threadypulse, marked fall in systolic blood pressure,respiratory difficulty, and even coma, total bloodvolume was severely diminished at the time col-lapse occurred. As these patients recovered, totalblood volume tended to rise in proportion to theamount of fluid given during recovery. In thosein whom fluids were restricted during recoverythe total blood volume remained reduced but cir-
10 30 40 50 60 70 80 90 100 110 120 130 140 150 160 170 180 190 200 210
INDUCTION TIME IN MINUTESFIG. 2. RELATIONSHIP OF PERCENTAGEREDucTIoN IN PLASMAVOLUMETO THE TIME REQUIREDFOR FEVER
INDUCTION. ALL CASES RECEIVED FLUIDS BY MOUTH
Cases have been grouped according to rate of fluid intake for each physical modality, the numeralsabove the connecting lines indicating the average intake in cubic centimeters per hour per kgm. Thepercentage reduction in plasma volume increases as the induction time is prolonged.
n- DIATHERMY* -. AIPQ CONDITIONED
CABINETS _- RADIANT ENERGY
A3.5 _-_- -
I . I I I I I I . I I I
228
PHYSIOLOGYOF ARTIFICIAL FEVER
culatory readjustment took place at the reducedlevel as the temperature fell to normal. Thus,shock resulting from severe diminution in cir-culating blood volume is a potential danger inevery patient treated with artificial fever. Itsprevention depends primarily upon adequatemaintenance of the volume of the circulatingblood.
In Cases 8 and 13 (Tables II and III) thesame patient was subjected to bouts of fever ofcomparable height and duration. In the formerinstance all fluids were given by the intravenousroute, and blood volume was well maintainedthroughout treatment. In the latter instance allfluids were given by mouth at about an equal rate,but a moderately severe reduction in plasma andtotal blood volume occurred during induction andmaintenance of fever, even though the gain inweight and the rate of gross water loss werenearly equal in both experiments. It is evidentthat water may pass out of the blood stream morerapidly than it can be absorbed from the intestinaltract, and this fact has an important bearing onthe determination of the optimal rate of fluidadministration for maintenance of blood volume.
From the data presented in Table II it is evi-dent that the fluid requirement varies with theapparatus employed. Thus, the average rate of
14
13
12
toI08 0
8 .so37 O0
06
4 L-
o
fluid intake necessary to maintain plasma volumelevel and water balance is about 8, 9, and 6 cc. perhour per kgm. for diathermy, the "KetteringHypertherm," and radiant energy (28) respec-tively. If an uncooperative or irrational patientfails to take the prescribed amount of water bymouth by the end of fever induction, it may benecessary to give fluid parenterally to maintainthe water balance.
The mental state of the patient has an impor-tant relation to gross water loss and hence fluidrequirement as evidenced by the diminution inblood volume and by the gross water and tissuefluid losses in Cases 26, D-3, and R-7. Thesepatients were noisy, restless, or maniacal, tookfluids less readily and tolerated treatment lesswell than those who were quiet and cooperative.
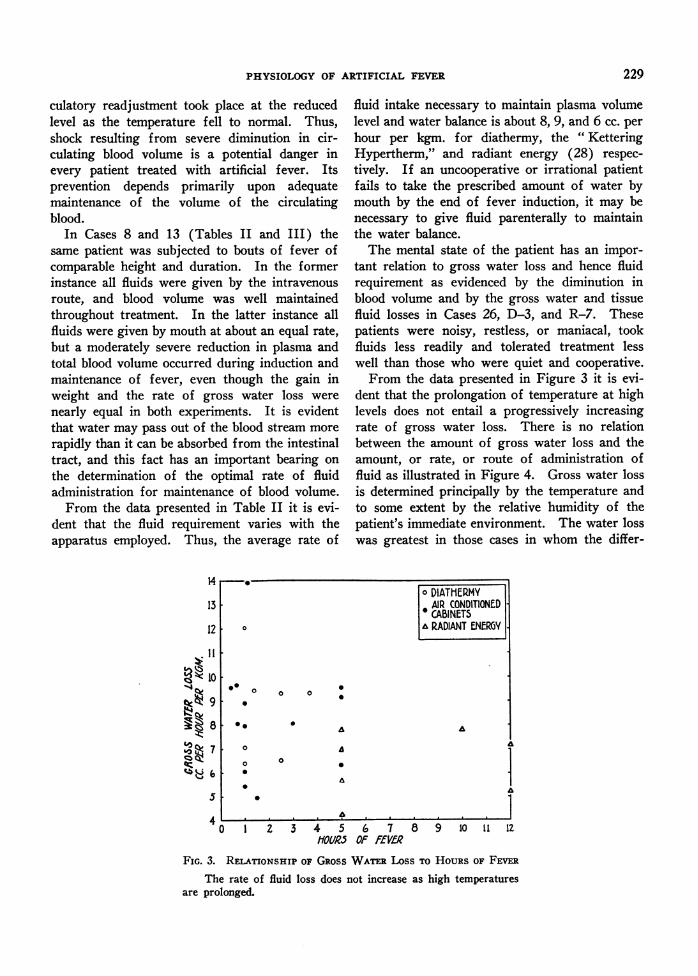
From the data presented in Figure 3 it is evi-dent that the prolongation of temperature at highlevels does not entail a progressively increasingrate of gross water loss. There is no relationbetween the amount of gross water loss and theamount, or rate, or route of administration offluid as illustrated in Figure 4. Gross water lossis determined principally by the temperature andto some extent by the relative humidity of thepatient's immediate environment. The water losswas greatest in those cases in whom the differ-
9 10 ll l2
FIG. 3. RELATIONSHIP OF GROSSWATERLoss To HOURSOF FEVER
The rate of fluid loss does not increase as high temperaturesare prolonged.
o DIATHERMYAIR CONDITIONEDCABINETS
& RADIANT ENERGY.
A~~~~~
5 -.
F~~~~~~~
1 2 3 4 5 6 7 8HOR.5 OF fEVfQ
229
JOHN G. GIBSON, 2D, AND ISRAEL KOPP
,:Z11:P
ck.4. 8
TOTALCC. PER
FLUD INTAKEHOUR Pf,R KOI
FIG. 4. RELATIONSHIP OF GRoss WATERLoSS TO TOTALFLUID INTAKE
The rate of gross water loss is not decreased by theadministration of large amounts of fluid, by mouth or
by vein.
ential temperature between the patient's body andhis environment was highest, and least in thosecases in whom it was lowest. No condusive evi-dence was obtained in this study that relativehumidity alone plays a decisive r6le. In patientstreated in the " Kettering Hypertherm " the rateof gross water loss was the same, by and large,in those instances where the relative humiditywas kept at 80 per cent as in those where it was
only 40 per cent, and the relation of tissue fluidloss to rate of intake was the same (Cases D-1,D-2, and 18, and D-3, 8, and 13, Table III).No measurements of relative humidity were ob-tained in the radiant energy cabinets in which theair was static, but it is doubtful if it was over
80 per cent at any time, and yet the rate of waterloss was less than in the cases treated in the"Kettering Hypertherm." It seems significantthat the dry bulb temperature of the air in theradiant energy cabinet could be dropped to nearlythe patient's own temperature, whereas it had to
be maintained around 1200 F. in the " KetteringHypertherm" to obtain high humidity of the cir-culating air. In a moving air stream at a tem-perature of 1200 F. or above, even at a relativehumidity of 80 per cent, evaporation can stilloccur.
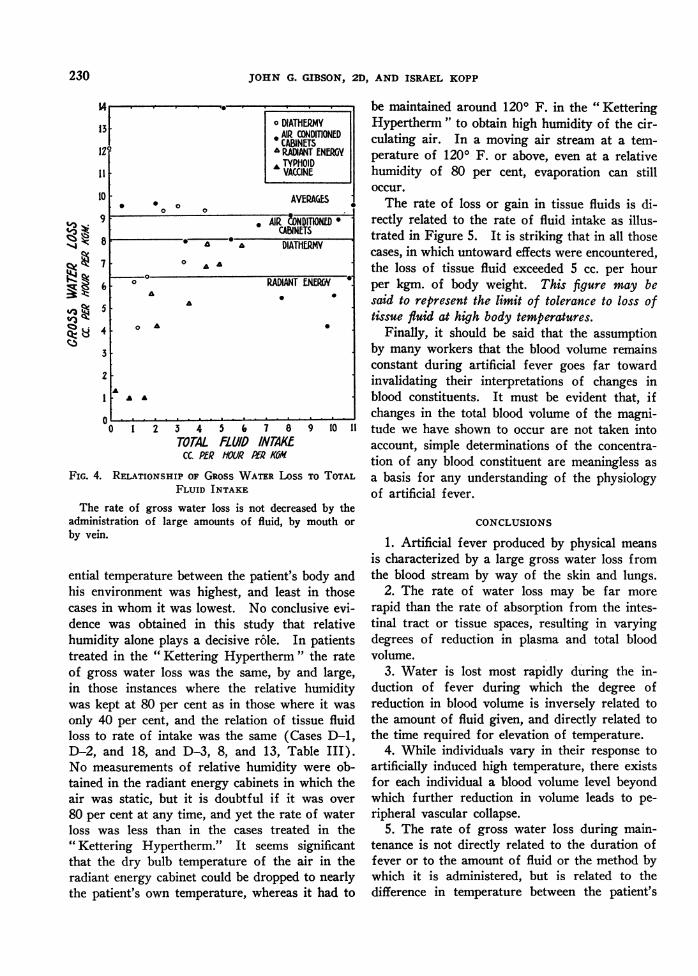
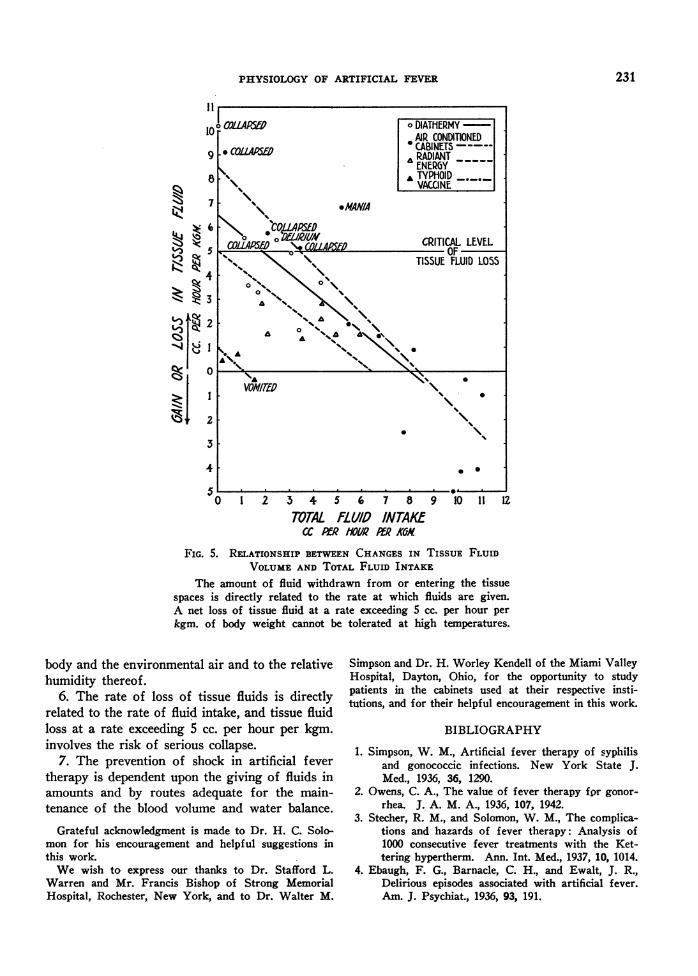
The rate of loss or gain in tissue fluids is di-rectly related to the rate of fluid intake as illus-trated in Figure 5. It is striking that in all thosecases, in which untoward effects were encountered,the loss of tissue fluid exceeded 5 cc. per hourper kgm. of body weight. This figure may besaid to represent the limit of tolerance to loss oftissue fluid at high body temperatures.
Finally, it should be said that the assumptionby many workers that the blood volume remainsconstant during artificial fever goes far towardinvalidating their interpretations of changes inblood constituents. It must be evident that, ifchanges in the total blood volume of the magni-
tude we have shown to occur are not taken intoaccount, simple determinations of the concentra-tion of any blood constituent are meaningless as
a basis for any understanding of the physiologyof artificial fever.
CONCLUSIONS
1. Artificial fever produced by physical means
is characterized by a large gross water loss fromthe blood stream by way of the skin and lungs.
2. The rate of water loss may be far more
rapid than the rate of absorption from the intes-tinal tract or tissue spaces, resulting in varyingdegrees of reduction in plasma and total bloodvolume.
3. Water is lost most rapidly during the in-duction of fever during which the degree ofreduction in blood volume is inversely related tothe amount of fluid given, and directly related tothe time required for elevation of temperature.
4. While individuals vary in their response toartificially induced high temperature, there existsfor each individual a blood volume level beyondwhich further reduction in volume leads to pe-ripheral vascular collapse.
5. The rate of gross water loss during main-tenance is not directly related to the duration offever or to the amount of fluid or the method bywhich it is administered, but is related to thedifference in temperature between the patient's
1 DIATHERMY13 . AIR CONDMONED
CABINETS121 WADANTENERGY
T,TYPHOID11 VACCINE
10 . 0 AVERAGES0
9 AIR &)NDITIONLDCABINETS
uA DIATHERMY7 0 AA
6 RADIANT ENERGYA .
5 -
4 o
3
2
A .
00 1 2 3 4 5 6, 7 8 9 10 1
230
PHYSIOLOGYOF ARTIFICIAL FEVER
N7X|I VAILIUN7
S 6 .~~*CORLASED5 C0LA@MN CRITICAL LEVEL
TISSUE FLUID LOSS
l 2 5 4 5 6 7 8 9 10 ll U
3
44Zj
TOTAL fLL//O INTAKM
FIG. 5. RELATIONSHIP BETWEENCHANGESIN TISSUE FLUIDVOLUMKEAND TOTAL FLUID INTAKE
The amount of fluid withdrawn from or entering the tissuespaces is directly related to the rate at which fluids are given.A net loss of tissue fluid at a rate exceeding 5 cc. per hour perkgm. of body weight cannot be tolerated at high temperatures.
body and the environmental air and to the relativehumidity thereof.
6. The rate of loss of tissue fluids is directlyrelated to the rate of fluid intake, and tissue fluidloss at a rate exceeding 5 cc. per hour per kgm.involves the risk of serious collapse.
7. The prevention of shock in artificial fevertherapy is dependent upon the giving of fluids inamounts and by routes adequate for the main-tenance of the blood volume and water balance.
Grateful acknowledgment is made to Dr. H. C. Solo-mon for his encouragement and helpful suggestions inthis work.
We wish to express our thanks to Dr. Stafford L.Warren and Mr. Francis Bishop of Strong MemorialHospital, Rochester, New York, and to Dr. Walter M.
Simpson and Dr. H. Worley Kendell of the Miami ValleyHospital, Dayton, Ohio, for the opportunity to studypatients in the cabinets used at their respective insti-tutions, and for their helpful encouragement in this work.
BIBLIOGRAPHY
1. Simpson, W. M., Artificial fever therapy of syphilisand gonococcic infections. New York State J.Med., 1936, 36, 1290.
2. Owens, C. A., The value of fever therapy for gonor-rhea. J. A. M. A., 1936, 107, 1942.
3. Stecher, R. M., and Solomon, W. M., The complica-tions and hazards of fever therapy: Analysis of1000 consecutive fever treatments with the Ket-tering hypertherm. Ann. Int. Med., 1937, 10, 1014.
4. Ebaugh, F. G., Barnacle, C. H., and Ewalt, J. R.,Delirious episodes associated with artificial fever.Am. J. Psychiat., 1936, 93, 191.
231
JOHN G. GIBSON, 2D, AND ISRAEL KOPP
5. Neymann, C. A., Blatt, M. L., and Osborne, S. L.,The treatment of chorea minor by means of elec-tropyrexia. J. A. M. A., 1936, 107, 938.
6. Kopp, I., and Solomon, H. C., Shock syndrome intherapeutic hyperpyrexia. Arch. Int. Med., 1937,60, 597.
7. Markson, D. E., and Osborne, S. L., The treatmentof arthritis by electropyrexia. Illinois M. J., 1933,64, 231.
8. Stecher, R. M., and Solomon, W. M., The treatmentof gonorrheal arthritis with artificial fever. Am.J. M. Sc., 1936, 192, 497.
9. Bishop, F. W., and Horton, C. B., and Warren, S. L.,A clinical study of artificial hyperthermia inducedby high frequency currents. Am. J. M. Sc., 1932,184, 515.
10. Sutton, L. P., and Dodge, K. G., The treatment ofchorea by induced fever. J. Pediat., 1933, 3, 813.
11. Wilbur, E. L., and Stevens, J. B., Morbid anatomicchanges following artificial fever, with report ofautopsies. South. M. J., 1937, 30, 286.
12. Epstein, N. N., The blanket method of inducingartificial fever. Arch. Phys. Therapy, 1937, 18,199.
13. Hartman, F. W., and Major, R. C., Pathologicalchanges resulting from accurately controlled ar-tificial fever. Am. J. Clin. Path., 1935, 5, 392.
14. Neymann, C. A., The effect of artificial fever on theclinical manifestations of syphilis and the trepo-nema pallidum. Am. J. Psychiat., 1936, 93, 517.
15. Bierman, W., and Fishberg, E. H., Some physiologicchanges during hyperpyrexia induced by physicalmeans. J. A. M. A., 1934, 103, 1354.
16. Goldfeder, A., Radiothermy on oxygen content andcapacity in human blood; the saturation point ofhemoglobin with oxygen. Arch. Phys. Therapy,1933, 14, 339.
17. Dennie, C. C., Polsky, M., and Lemoine, A. N., Hy-perpyrexia produced by the hot bath in the treat-ment of syphilis. J. Missouri M. A., 1936, 33, 1.
18. Carpenter, C. M., and Warren, S. L., Artificiallyinduced fever in the treatment of disease. NewYork State J. Med., 1932, 32, 997.
19. Feinberg, S. M., Osborne, S. L., and Afremow, M.L., A new method of nonspecific treatment ofallergic disease. J. Allergy, 1931, 2, 291.
20. Phillips, K., and Shikany, S., The value of hyper-pyrexia in the treatment of bronchial asthma.South. M. J., 1935, 28, 801.
21. McIntosh, R., On the effect of diathermy on bloodvolume. J. Physiol., 1931, 73, 361.
22. Knudson, A., and Schaible, P. J., Physiologic andbiochemical changes resulting from exposure toan ultrahigh frequency field. Arch. Path., 1931,11, 728.
23. Simpson, W. M., Studies on the physiology of fever.J. A. M. A. (Proc.), 1936, 106, 246.
24. Gibson, J. G., 2d, and Evans, W. A., Jr., Clinicalstudies of the blood volume. I. Clinical applica-tion of a method employing the azo dye "Evansblue" and the spectrophotometer. J. Clin. Invest.,1937, 16, 301.
25. Gibson, J. G., 2d, and Evelyn, K. A., Clinical studiesof the blood volume. IV. Adaptation of themethod to the photoelectric microcolorimeter. J.Clin. Invest., 1938, 17, 153.
26. Evelyn, K. A., and Cipriani, A. J., A photoelectricmicrocolorimeter. J. Biol. Chem., 1937, 117, 365.
27. Simpson, W. M., Artificial fever therapy of syphilis.J. A. M. A., 1935, 105, 2132.
28. Bishop, F. W., Lehman, E., and Warren, S. L., Acomparison of three electrical methods of produc-ing artificial hyperthermia. J. A. M. A., 1935,104, 910.
232
Related Documents