A/,,A -/sL3&7 NAS9-12077 T-638 Line Item No. 7 MA-129T R-9353 FINAL REPORT ANALYSIS OF COMBUSTION INSTABILITY IN LIQUID PROPELLANT ENGINES WITH OR WITHOUT ACOUSTIC CAVITIES June 1974 y C. L. Oberg, R. C. Kesselring, C. Warner, III & M. D. Schuman Rocketdyne Division, Iockwell International 6633 Canoga Avenue, C noga Park, California Reproduced by NATIONAL TECHNICAL INFORMATION SERVICE US Deparlment of Commerce Springfield, VA. 22151 Prepared For National Aeronautics and Space Administration Lyndon B. Johnson Space Center Contract NAS9-12077 R. C. Kahl, Technical Monitor PRICES SuBJECI To QGE

Welcome message from author
This document is posted to help you gain knowledge. Please leave a comment to let me know what you think about it! Share it to your friends and learn new things together.
Transcript
A/,,A -/sL3&7
NAS9-12077T-638Line Item No. 7MA-129TR-9353
FINAL REPORT
ANALYSIS OF COMBUSTION INSTABILITY IN LIQUID
PROPELLANT ENGINES WITH OR WITHOUT ACOUSTIC CAVITIES
June 1974
y
C. L. Oberg, R. C. Kesselring, C. Warner, III & M. D. Schuman
Rocketdyne Division, Iockwell International6633 Canoga Avenue, C noga Park, California
Reproduced by
NATIONAL TECHNICALINFORMATION SERVICE
US Deparlment of Commerce
Springfield, VA. 22151
Prepared For
National Aeronautics and Space Administration
Lyndon B. Johnson Space Center
Contract NAS9-12077
R. C. Kahl, Technical Monitor PRICES SuBJECI To QGE
FOREWORD
The technology program described herein was sponsored
by the National Aeronautics and Space Administration,Lyndon B. Johnson Space Center, Houston, Texas, under
Contract NAS9-12077. The study was conducted during
the 15-month period from 29 June 1972 to 28 September1973. The NASA technical monitor was Mr. R. C. Kahl.
At Rocketdyne, Mr. L. P. Combs was program manager and
Dr. C. L. Oberg was project engineer.
The literature review, Priem-type stability analysis,and steady-state combustion model analysis were doneprimarily by Dr. R. C. Kesselring. The NREC modelanalysis was done by Mr. M. D. Schuman. The generalized
cavity analysis was done by Dr. C. Warner III. Overall
technical direction was provided by Dr. C. L. Oberg.
R-9453
ii
ABSTRACT
Analytical studies have been made of the relative com-bustion stability of various propellant combinationsof interest to NASA-JSC when used with hardware con-figurations representative of current design practicesand with or without acoustic cavities. Available li-terature was reviewed to locate and summarize availableexperimental results relating to stability. Two com-bustion instability models, a Priem-type model and amodification of the Northern Research and Engineering(NREC) instability model, were used to predict the var-iation in engine stability with changes in operatingconditions, hardware characteristics or propellant com-bination, exclusive of acoustic cavity effects. TheNREC model was developed for turbojet engines but isapplicable to liquid propellant engines. A steady-statecombustion model was used to predict the needed inputfor the instability models. In addition, preliminarydevelopment was completed on a new model to predict theinfluence of an acoustic cavity with specific allowancefor the effects the nozzle, steady flow and combustion.
R-9353
iii/iv
CONTENTS
Introduction and Summary . . . . . . . . .. .. .. .. . 1Stability Experience Review . . . . . . . . . . . . .... .. 3Priem Model Instability Analysis . . . . . . . . . . . . . . 9
Description of the Model . . . . . . . . . . . . . . . . 9Steady-State Combustion Model Calculations . . . . . . . . . . 16Results From Priem-Type Analysis . . . . . . . . . . . . . 18
Quasi-Linear Stability Analyses . . . . . . . . . . . . . . 25NREC Instability Model . .. . . . . . . . . . . . . . . 26NREC Model Calculations . . . . . . . . . . . . . . . . 33Generalized Cavity Damping Model . . . . . . . . . . . . . 42Integral Equation Formulation . . . . . . . . . . . . . . 43Iterative-Variational Solution Technique . . .. . . . . ... 44"Least-Squares" Derivation of Eigenvalue Equation . . . . . . . . 47Formulation in Terms of atq(i) . . . . . . . . . . . . . . 48Computer Results . . . . . . . . . . . . . . . . . . . 51
Concluding Remarks . . . . . . . . . . . . . . . . . . . 61References . . . . . . . . . . . . . . . . . . . . . 63Appendix ADropsize Correlations . . . . . . . . . . . . . . . . . . 67Appendix BResults From Priem-Type Stability Analysis . . . . . . . . . . . 71
R-9353
v/vi

ILLUSTRATIONS
1. Priem-Type Stability Map Showing Effect of AV' . ... .... 102. Priem-Type Stability Map Showing Effect of K1 Parameter . . . . . 123. Effect of MAP Parameter on Predicted Stability Limits .... 134. Effect of K2 and K3 Parameters on Predicted Stability Limits . . 145. Local Stability Index as a Function of Dropsize for
Pc = 125 psia, APinj = 0 .2 Pc, CR = 2 . . . . 196. Local Stability Index as a Function of Dropsize for
Pc = 125 psia, APinj = 0.2 Pc, CR = 2 . . . . . . . . . . . 207. Predicted Nozzle Admittance for First Tangential and
Longitudinally Coupled Modes . . . . . . . . . . . . . . 348. Predicted Oscillatory Decay Rates Showing the Effect of
Droplet Temperature Oscillation . . . . . . . . . . . . . 359. Predicted Oscillatory Decay Rates for DF = 100 Microns. . . . . 3710. Predicted Oscillatory Decay Rates for IF = 400 Microns . . . . . 3811. Predicted Stability Limit Amplitudes for R = 2.0 Inches . . . .. 3912. Predicted Stability Limit Amplitudes for R = 4.0 Inches .. . . . 4013. Predicted Stability Limit Amplitudes for R = 6.0 Inches . . . . . 4114. Predicted Cavity Damping Without Combustion or Steady Flow . . . 5215. Predicted Effects of Uniform Combustion Source on
Cavity Damping . . . . . . . . . . . . . . . . . . 5516. Predicted Effect of Nozzle on Phase Angle of
Oscillating Pressure . . . . . . . . . . . . . . . . 58
TABLES
1. Summary of Results from Stability Experience Review .. .. . . 42. Predicted Effect of Parameter Variations on Stability . . . . . 23
R-9353
vii/viii
NOMENCLATURE
ARABIC SYMBOLS
A = specific acoustic admittance of nozzle
A = cross-sectional area of chamber
A = Priem stability index (critical disturbance amplitude)
A = cross-sectional area of nozzle throat
(i)a i) = iterative expansion coefficient, defined by Eq. 66
CD = orifice discharge coefficient
Cd = droplet drag coefficient
CF = thrust coefficient
C = heat capacity--constant pressure
C = heat capacity--constant volume
CR = contraction ratio
Ci = NREC combustion coefficients (i = 1, 2z, 2r, 26, 3, 4, 5, 6)
c = isentropic s6und velocity
c* = characteristic exhaust velocity
D = chamber diameter; with subscript, droplet diameter
f = mass median diameter of fuel spray
D = mass median diameter of oxidizer sprayox
= mass diffusivity
E = energy content used in NREC model
es = total internal energy (thermal only) of spray
e = energy release rate (see Eq. 37)
F = force of interaction between spray and gas
F = thrust
R-9353
ix
Fe = thrust per element
G(rjro) = Green's function
GN(rjr ) = modified Green's function defined by Eq. 68
g= gravitational constant (32.2 ibm-ft/lbf-sec )
AHcomb heat of combustion
AH = heat of vaporizationyap
h = source coefficient for generalized cavity damping model, Eq. 57o
i =- /-
J ( ) = Bessel function of first kind and order m
K2, 3 = parameters used in Priem-type model, Eq. 4, 5, and 6
k = B/c
k = thermal conductivity of gas
L = chamber length
Ls = depth of acoustic cavity
= Priem burning rate parameter, Eq. 1
M = Mach number
M = defined by Eq. 8yap
MAP = mass accumulation parameter, Eq. 3
MR = mixture ratio
MW = molecular weight
m = derivative of burning rate, As/Az
N = unit normal vector directed out of volume
NuH = Nusselt number for heat transfer
NuM = Nusselt number for mass transfer
9 = oscillatory source term, Eq. 16
R-9353
X
Pr = Prandtl number, VC /k
p = pressure
p = oscillatory pressure
PC = steady-state chamber pressure
Pv = vapor pressure
Q = heat release per unit volume from homogeneous reactions
Qs = heat release per unit volume of chamber from spray combustion
R = gas constant; also, chamber radius
Re = Reynold's number
UuX = response factor from Nusselt number, Eq. 48
5 s = response factor,s ~ Nu 'z
= response factor from heat blockage term, Eq. 53
r = radial position
r = chamber radius
r = position vector
S = area
S(ro;p = source term defined by Eq. 64
T = temperature
Tf = flame temperature
T q,kq, = expansion coefficient defined by Eq. 80
t = time
t = Priem wave time, 27rR/c.
u = velocity
u= oscillatory velocity
us = spray velocity
V = volume
R-9353
xi
V = axial gas velocitygas.
Vdrop s = axial spray velocity
AV' = Priem parameter, (Vgas - Vdrops)/c
V. = liquid injection velocityIn]
w(r) = weight factor, Eq. 77
w = mass generation of gas per unit chamber volume from spray combustion
Winj = injected mass flowrate
wvap = mass generation of gas per unit chamber volume from spray combustion
XF = burned fraction of fuel
XOX = burned fraction of oxidizer
y = specific acoustic admittance, defined by Eq. 59
z = axial coordinate
GREEK SYMBOLS
a = damping coefficient, imarginary part of 8
8 = complex angular frequency,
y = heat capacity ratio, C p/C
6(r-r') = Dirac delta function
6.. = Kronecker delta (6ij = 1 if i = j, = 0 if i # j)
6( ) = variational operator
s = overall burned fraction of spray
nN = eigenvalue for closed, rigid walled chamber, Eq. 62
6 = angular coordinate
A = normalization factor, Eq. 63
A = parameter in source distribution, A= .u T
p = gas density
R-9353
xii
Pk = spray density, mass per unit chamber volume
(PD)dr = density-diameter product for droplet
4.4.a = (U-u) ws
T = NREC delay time
= complex eigenvalue, = krw = wr /c+jarw/c; also withsubscript, eigenfunction
W = angular frequency
.inj = Priem parameter, w.inj = )in m/Ac
SUPERSCRIPTS
- (overbar) = denotes time average value; also, particular index
= denotes oscillatory quantity
+ = denotes vector quantityth
(i) = denotes i iterationA = denotes amplitude of complex quantitySUBSCRIPTS
o = denotes steady-state value; also, source coordinate
c = denotes chamber condition
d = denotes droplet condition
dr = denotes droplet condition
f = denotes fuel
g = denotes .gas
k = axial mode index
N = m,,q
m = circumferential mode index
q = radial mode index
ox = denotes oxidizer
r = denotes radial components
s = denotes spray parameter
t = denotes throat condition
z = denotes axial component
e = denotes angular component
R-9353
xiii/ xiv
INTRODUCTION AND SUMMARY
As requirements for new rocket engines arise, selections of the propellant combi-
nation and general hardware configuration to be used are normally required. The
selection processes should include an evaluation of the likelihood of encounter-
ing combustion instability problems during engine development and the expected
difficulty of obtaining adequate stability through the use of.instability suppres-
sion devices, such as acoustic cavities. In addition, such factors as the appli-cability of particular stabilization devices, their size requirements, and special
difficulties with particular propellants must be considered.
The purpose of the investigation described herein was to analytically predict the
relative stability of various propellant combinations of interest to NASA-JSC when
used with hardware configurations representative of current design practice and
with or without acoustic cavities to improve stability. Originally, consideration
was given to propellant combinations of the LOX/hydrocarbon, LOX/amine, and the
NTO/amine families. However, because of subsequent diminished interest in the
former two families, attention was later concentrated on the NTO/amine family
after the program was under way. The investigation included a literature search,
to define the known stability-related characteristics, and stability analyses,
employing two combustion instability models and a model to describe the effects
of the acoustic cavities. The evaluation was done in a manner that was not spe-
cific to any particular engine or hardware design but which provides general
information necessary to rationally include stability factors in the propellant
selection processes for a range of.engine applications. In addition, preliminary
development was completed of a generalized acoustic cavity model that includes
steady flow and combustion effects not considered in the previously developed model.
Early in the program, a thorough, but not exhaustive, review of the literature was
made, to locate and summarize available information relating to stability. Infor-
mation concerning the propellant combinations of interest and, also, similar pro-
pellant combinations, along with any special characteristics of the propellants
(such as a tendency toward "popping" or to form an explosive adduct), which may
affect stability, was sought. The available stability-related data were summar-ized and related to injector and engine characteristics as well as possible.Although considerable information was obtained, the results suggest a complex
interaction between important effects. Probably the results may be best used with
the aid of an analytical model to permit separation of diverse effects.
Two combustion instability models were used to predict the variation in engine
stability with hardware configuration and propellant combination, exclusive ofacoustic cavity effects. One of these was a Priem-type model; this type of insta-
bility model has been used extensively at Rocketdyne and elsewhere for many years.
The second model, which is applicable to liquid propellant engines but which hasbeen developed for analysis of turbojet engine afterburners, has been called theNorthern Research and Engineering Corporation (NREC) model (Ref. 1 ). The NRECmodel is based on an analysis of liquid propellant combustion instability byCulick (Ref. 2). In addition, a model for the steady-state combustion was used
to provide needed input for these stability models. Results from these stability
analyses were used to develop parametric representations, as much as possible, to
R-9353
1
show the relationship of stability to key parameters (such as dropsize and burningrate). Parametric representations were used to avoid restricting the results to aparticular set of injector/chamber conditions and dimensions. Results from theanalyses were used to establish the relative stability of the various configura-tions and to establish stability trends with changes in design parameters.
The Priem-type stability analysis was done for a relatively broad range of condi-tions and extensive plots have been developed of the variation of the stabilityindex, A, with important physical parameters. These plots may be used to a assessthe stability of new hardware configurations with minor additional calculations.Calculations were also made to show the effects of varying the choice of analysisparameters. The results show the importance, when performing stability analyses,of the choice of parameters to be held constant. In addition, the results suggestthat the propellant mass flux within an engine has a very strong influence on sta-bility. The greatest changes in stability were predicted when (1) chamber pres-sure was increased by increasing the propellant flow through a fixed set of hard-ware (worsened stability) or (2) contraction ratio was increased with a fixedthrust (improved stability).
The analysis done with the NREC stability model was less extensive than that donewith the Priem-type model. However, the results from the NREC analysis appear toagree in a rough qualitative way with those from the Priem-type analysis. Thedegree of agreement appears compatible with the major differences in approachthat have been used in development of the two models. The NREC model, or similarapproaches, appears to be a valuable method of analysis for liquid-propellantengines. The Priem and NREC models complement each other because each includesimportant factors not included in the other. Further work with the NREC model isrecommended.
Also, preliminary development of a model was undertaken to aid in the design ofacoustic cavities, which specifically included the effects of the nozzle, combus-tion, and steady flow. This model was based on a combination of the concepts usedin the existing cavity damping model (which does not specifically allow for theseeffects) and those used in the NREC model. Preliminary development of this modelwas completed, the effects due to pressure-coupled combustion response (velocitycoupling effects remain to be added), nozzle effects, and steady flow (as a uni-form approximation), as well as the acoustic cavity being included. The limitedcomputational results obtained thus far show the importance of interactions betweenthe effects of the cavities and those due to the nozzle, combustion, and steadyflow, under some circumstances. Because of these interactions, the need to ade-quately allow for them in cavity design is evident and additional work is recommended.
R-9353
2
STABILITY EXPERIENCE REVIEW
Available information relating to combustion instability, particularly concerningthe LOX/hydrocarbon, LOX/amine, and N204/amine and similar propellant combinationshas been reviewed to summarize and assess available information. The principaleffort involved review of the proceedings from combustion and combustion instabil-ity meetings. Although a computerized library search resulted in the acquisitionof only a few pertinent references, the review was aided by consultations with in-formed Rocketdyne personnel.
Results from this review are summarized in Table 1, which shows the combustionstability experience obtained with various propellant combinstions during a numberof engine development programs. The references quoted in Table 1 are Ref. 3through 37. Abbreviations used in Table 1 are defined at the end of the table.
The preponderance of stability experience with LOX/RP-1 has been accumulated atRocketdyne. This propellant combination was used in the Jupiter, Thor, Atlas,Saturn IB, and Saturn V engine systems. The earliest engine development programsdid not inlcude dynamic stability testing (i.e., no stability rating devices wereused) but significant testing was done to eliminate spontaneous instabilities.The MB-3 engine, for the Thor vehicle, required an injector face baffle to elimi-nate spontaneous instabilities. A baffle was also employed in the MA-5 engineused for the Atlas booster (which was essentially identical to the MB-3); also,this was the first LOX/RP-l engine for which dynamic stability was verified. Anidentical baffle configuration was employed in the H-1 engine to achieve dynamicstability. Much difficulty was encountered in the development of a dynamicallystable F-1 engine.. Among these difficulties were the elimination of low-frequency(nonacoustic) instability modes and a high sensitivity of acoustic modes of in-stability to minor changes in the injector face orifice pattern. In the finalversion of the F-1 engine, a 13-compartment, 3-inch-long baffle was used on theinjector face. The F-1 engine is relatively unique compared to all other engineslisted in Table 1, however, because of its large chamber diameter (39.2 inches)and its small contraction ratio (1.25). No more recent stabilityuork was foundconcerning engines in which the LOX/RP-l propellant combination was used.
With the exception of a very limited number of tests with LOX/UDMH in a high-pressure,two-dimensional model of the F-1, no experience with LOX/amines wasfound.
The NTO/amine propellant combinations have been employed extensively in recentyears. The majority of applications have been in engines of moderate size (~10-inch diameter). When these propellants have been employed in chambers with diam-eter greater than 10 inches, dynamic instability problems have invariably occurred.These problems have been solved in a number of cases (GEMSIP, Apollo, SPS, etc.)through the use of injector face baffles. In other cases, such as the 7.79-inch-diameter Lunar Module Ascent engine, acoustic absorbers have been used in additionto (or in place of) injector face baffles to achieve dynamic stability. Moreover,no maximum engine size is evident below which no instability is encountered. Forexample, instability problems were encountered in very small combustion chambers,viz., the 3-inch-diameter Rocketdyne RS-14 (9000 Hz instability) and the 1.6-inch-diameter Thiokol C-1 (17,000 Hz instability).
R-9353
3
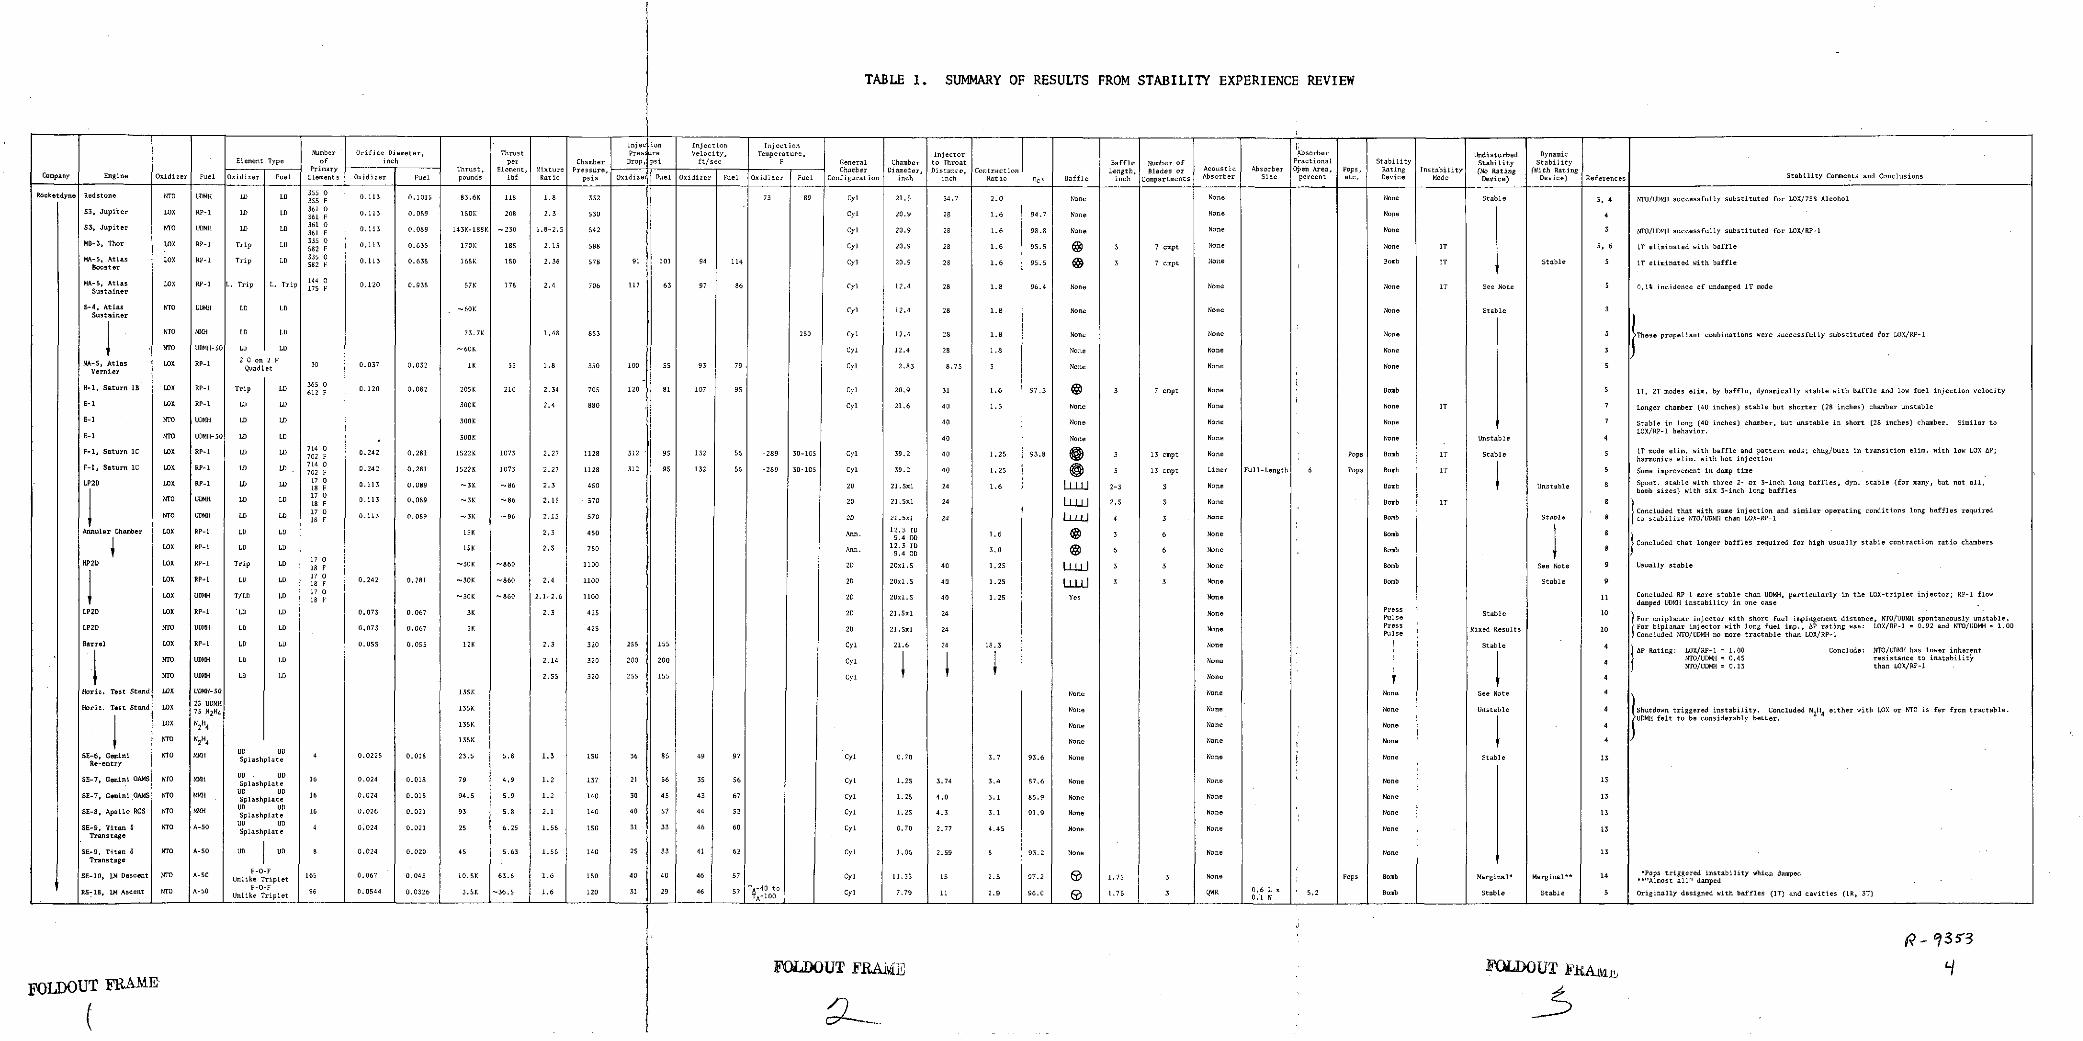
TABLE 1. SUMMARY OF RESULTS FROM STABILITY EXPERIENCE REVIEW
Injection Injection Injection INumber Orifice Diameter, Thrust Pres! re Velocity, Temperature, Injector Absorber Undisturbed Dynamic
Element Type of inch per Chamber Drop, psi ft/sec F General Chamber to Throat Baffle Number of Fractional Stability Stability StabilityPrimary Thrust, Element, Mixture Pressure, Chamber Diameter, Distance, Contraction. Length, Blades or Acoustic Absorber Open Area, Pops, Rating Instability (No Rating (With Rating
Company Engine Oxidizer Fuel Oxidizer Fuel Elements Oxidizer Fuel pounds lbf Ratio psia Oxidize, Fuel Oxidizer Fuel Oxidizer Fuel Configuration inch inch Ratio tc* Baffle inch Compartments Absorber Size percent etc. Device Mode Device) Device) References Stability Coents and Conclusions
Rocke5dyne Redstone NTO UDMH LD LD 5 0 0.113 0.1015 83.6K 118 1.8 332 73 89 Cyl 21.5 34.7 2.0 None None None Stable 3, 4 NTO/ODM successfully substituted for LOX/75% Alcohol
S3, Jupiter LOX RP- LD LD 361 0 0.113 0.089 150K 208 2.3 530 Cyl 20.9 28 1.6 94.7 None None None 4361 FS3, Jupiter NTO UDMH LD LD 361 0
363, Jupiter 1 0 0.113 0.089 143K-188K -230 1.8-2.5 542 Cyl 20.9 28 1.6 98.8 None None None 3 NTO/UDMH successfully substituted for LOX/RP-1
M5-3, Thor LOX RP-1 Trip LD 33 0 0.113 0.635 170K 18 2.15 588 Cyl 20.9 28 1.6 95.5 3 7 cmpt None None IT 5, 6 T eliminated with baffle192 F0,0 17eiiae ihbfl
MA-5, Atlas LOX RP-1 Trip LD 335 0 0.113 0.635 165K 180 2.36 578 91 101 94 114 Cyl 20.9 28 1.6 95.5 3 3 7 cmpt None Bomb IT Stable I iT eliminated with baffleBooster 582 F1
MA-I, Atlas LOX RP- L. Trip L. Trip 0 0.120 0.935 57K 178 2.4 706 117 63 97 86 Cyl 12.4 28 1.8 96.4 None None None IT See Note 0.1% incidence of undamped IT modeSustainer 7
S-4, Atlas NTO UDMH LD LD -60OK Cyl 12.4 28 1.8 None None None StableSustainer
NTO 9048 LD Lb 73.7K 1.48 853 250 Cyl 12.4 28 1.8 None None None 3 )These propellant combinations were successfully substit
0NTO UDMH-0 0LD LD -60K Cyl 12.4 28 1.8 None None None 3 )MA-b, Atlas WIX RP-l 2 0 on 2 FNoeonNMAVern iera LOX RP-1 2 0 on 2 FQuadlet 30 0.037 0.032 1K 33 1.8 350 100 55 93 79 Cyl 2.83 8.75 3 None None None 5H-V arn IB Lu R-I Trp LO 35
H-1, Saturn B OX RP-1 Trip LD 65 0 0.120 0.082 205K 210 2.34 705 120 81 107 95 Cyl 20.9 31 1.6 97.3 3 7 cpt None Bomb 5 T, 2T modes elim. by baffle, dynamically stable with baffle and low fuel injection
E-1 LOX RP-1 LD LD 300K 2.4 880 Cyl 21.6 40 1.5 None None None IT 7 Lunger chamber (40 inches) s
E-1 NTO UDMH LD LD 300K 40 None None None 7 Stable in lung (40 inLOX/RP-1 behavior.E-1 NTO UDMH-50 LD LD 300K 40 None None None Usal
F-l, Satun IC LOX P-I LD LD 7140 I oeei.wt afeF-1, Saturn IC LOX RP- LD LD 72 0 0.242 0.281 1522K 1073 2.27 1128 312 95 132 56 -289 30-105 Cyl 39.2 40 1.25 93.8 3 13 cmpt None Pops Bomb IT Stable mode elm. ith baffle and pattern ods; chug/bu in transition elm. ith70harmonics elim. with hot injectionF-1, Saturn lC LOX RP-1 LD LD 714 0 0.242 0.281 1522K 1073 2.27 1128 312 95 132 56 -289 30-105 Cyl 39.2 40 1.25 3 13 cmpt Liner Full-Length 6 Pops Bomb IT 5 Some improvement in damp timeLP2D LOX RP-1 LD LD 170 2S 21.5xl 24 1.06 2-3 3 None Buob 4 Unstable 8 spun
t. stable with three 2- or 3-inch-long baffles, dyn. stable (for many, hut not a18 0 3 8bomb sizes) with six 3-inch long baffles702 F17 0
NTO UD1MH LD LD 18 F 0.113 0.089 -3K -86 2.15 570 2D 21.5xl 24 161 2-N 3 None Bomb T 8
817 0011L7t 0 2 .8 3 8 .2 002 1.m 4LU oeBo cnc-Concluded that aith same injection and similar operating conditions long baffles requiredNTO UDMH LD LD 1X8 F 0.113 0.089 -3K -86 2.1S 570 2D 21.5x 24 25 3 None BombS-
Annular Chamber LOX RP-1 LD LD 15K 2.3 450 Ann. 12.3 1.6 3 6 None BombOX RP-1 LD LD 13. 1. 3 Concluded that longer baffles required for high usually stable contraction ratio chambers
LOS RPD1 Lb Lb 15K 2.3 700 Ann. 12.3 1038Il00bneBm815KD 2.3 70 79.40D 3.0 6 6 None Bomb
HP2D X RP-1 Trip LD 18 F -30K -860 1100 2D 20x1.5 40 1.25 Ii l 3 3 None Bomb See Note 9 Usually stable
LOX RP-I LD LD 17 0.242 0.281 -30K -860 2.4 1100 20 20x1.5 40 1.25 13 3 None Bomb Stable 9
LOX18 F -30K -860 2.1-2.6 1100 2D 20xI.5 40 1.25 Yes None 11 Concluded RP- more stable than UDMH, particularly in thePres Stble 0 Idamped UDMH instability in one case
LP2 LOX RP-I LD 0.073 0.067 3K 2.3 425 2D 21.x 24 None Pulse o uniplanar injector t fuel impingement distance, TO/ spontneusly un
LP2D M L L 0.073 0.07 3K 42 20 21.5 24 Nne Press Mied Results 1 For biplanar injector with long fuel imp., rating : /P- = 0.92 andPulse i Concluded NTO/UDMH no more tractable than LOX/RPS
Barrel LOX RP-1 LD LD 0.055 0.055 12K 2.3 320 255 155 Cyl 21.6 24 18.3 None Stable 4I IjP bating: too/RP-S = 1.00 Conclude: NTO0/0009 has Sneer inherent
tNTO/UDM = 0.45 resistance to instabilityNTO UDHL 2.1 320 205 115 NoneNTO/UDMH = 0.13 than LOX/RP-
SNTO UD LD LD 2.55 30290 255 155 Cyl None ,
Horiz. Test Stand LOX UDM-50 135K None None None See lute 4Horiz. Test Stand LOX 25 UDMH
7ori. Test and W 75 N2 4 135K None None None Unstable 4 Shutdwn triggered instability. Concluded N2H4 either with LOX or is far from trat~UDMH felt to be considerably better
LOX N2H4 131K None None None 4
NTO N284 135K None None None 4SE-6, Gevini NTO MM4H UD DO"R-, Gemini 0 Splashplate 4 0.0225 0.018 23.5 5.8 1.3 150 36 85 49 97 Cyl 0.70 3.7 93.6 None None None Stable 13Ne-entrySpahlt
SE-7, Gemini AMS NTO Uplashplat 16 0.024 0.018 79 4.9 1.2 137 21 56 35 56 Cyl 1.25 3.74 3.4 87.6 None None None 13
1-7, GeminisOAMS NTO H Splashplat 16 0.024 0.018 94.5 5.9 1.2 140 30 45 43 67 Cyl 1.25 4.0 3.1 85.9 None None None 13
SE-8, Apollo RCS NTO H UD DO 16 0.026 0.021 93 5.8 2.1 140 40 57 44 52 Cyl 1.25 4.3 3.1 91.9 None None None 13Splashplate
SE-9, Titan & NTO A-50 UD D 4 0.024 0.021 25 6.25 1.56 150 31 33 46 60 Cyl 0.70 2.77 4.45 None None None 13Transtage Splashplate
SE-9, Titan 8 NTO A-S D J UD B 0.024 0.020 45 5.63 1.56 140 25 33 41 62 Cyl 1.06 2.59 N 93.2 None None NoneTranstageI
F-O-FPops triggered instability hi dampeSE-10, LM Descent NTO A-50 Unlike Triplet 165 0.067 0.045 10.SK 63.6 1.6 150 40 40 46 57 Cyl 11.35 15 2.5 97.2 1.75 3 None Pops Bomb Marginal* Marginal** 14 *"Almost all" dampedF-O-F T36.5 1.6 106 46 5 TA-40 o 1
RS-18, L4 Ascent NTO A-50 Unlike Triplet 96 0.0544 0.0326 3.K 3. 1.6 120 31 29 4A oo7 Cyl 7.79 11 2.9 96.0 1.75 3 QWR 16 L 5.2 Bombbaffles (T) and ties (, 3T)
FOLDOUT FRAME FLDOUT A
FOLDOUT FRAME
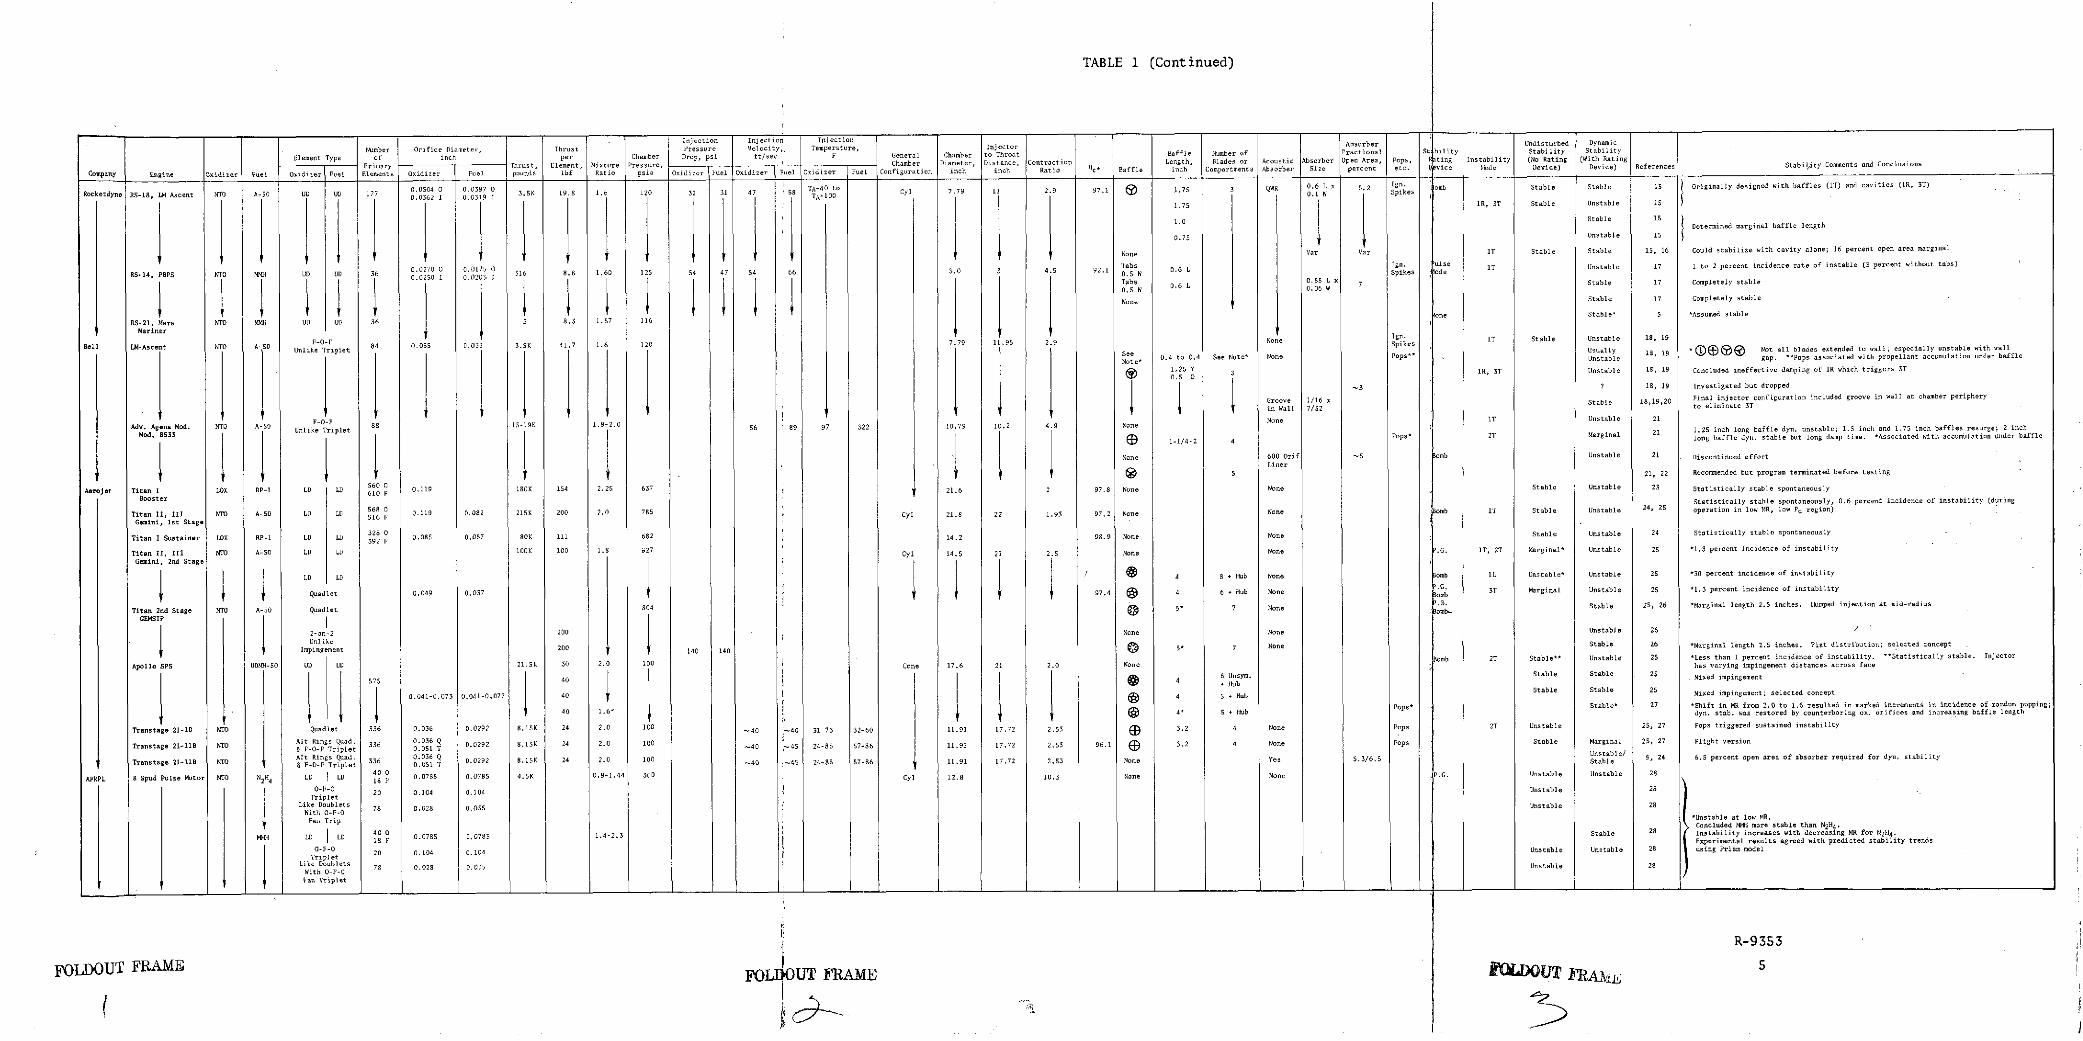
TABLE 1 (Continued)
Injection Injection Injection A
Number Orifice Diameter, Thrust Pressure Velocity,, Temperature, Injector Absorber Udisturbed Synnic
Elesest Type of inch per Chamber Drop, psi ft/sec F General Chamber to Throat Baffle Number of Fractional St bility Stability Stobility
Primary - Thrust, Element, Mixture Pressur, l Chambert Diameter, Distance, Contrction Length, Blades or Acoustic Absorber Open Area, Pops, ting I bilitY (NoRating (WithRating
Company Engine Oxidie Fuel t Ele ts Oxider Fuel uns lb Ratio psia Oxidizer Puel Ooidife Fuel Oxidizer Fuel Configuration inch inch Ratio c Baffle inch Compartments Absorber Size percent etc.rences tability Coents and Cocluss
0.004 0 .097 0 i, tO tmbetdyne S-, L Ascent17 0.0504 0 0.0397 0 TA-40 to2.9 97.1 1.75 3 QWR 0.6 L x 5.2Ign. omb Stable Stable 15 Originally designed with baffles (T) and cavities (R, 3T)
1.75 I, ST Stable Unstable 15
1.0 Stable 15Determined marginal baffle length
S ;0.75 Unstable 15
SNone Var Var 17 Stable Stable 15, 16 Could stabilize with cavity alone; 16 perce t open area marginalN ! Nne Var ar In
0.0270 0.0175 0 Tabs 0.6 L g. aloe IT Unstable 17 1 to 2 percent incidence rate of instable (3 percent without tabs)
RS-14, PBPS NTO MMH UD UD 36 0.0250 I 0.020.5I 1 88 1.60 125 54 4 54 6 3.0 4.9 92.1 0.5 Spikes ode
Tabs L.55 L 0 Stable 17 Completely stable0.5 W 0.06W
None Stable 17 Completely stable
one Stable* *Assued stable
RS-21, Mars NTO ,I UD UD 36 3 8.3 1.57 116
Mariner IIInMariner95 uNone Ign. 1T Stable Unstable 18, 19
Bell LM-Ascent TO 50 Unlike Triplet 84 0.055 0.033 3.5K 41.7 1.6 120 7.79 11.95 2.9 ne Spikes suly 18 9 Not all blades extended to wall; especial
SSee 0.4 to 0.4 See Note* None Pops** Unstable gap. **Pops associated with propellant accumulation under bafflei Note
I1.25 Y IR, 3T Unstable 18, 19 Concluded ineffective damping of IR which triggers 3T0.5 O~3 ? 18, 19 Investigated but dropped
S .[ ~ Groove [1/16 x Stable 18,19,20 Final injector configuration included groove in wall at chamber periphery
F F v [in Wall 7/32 to eliminate 3T
F-O-F 1.8-2.0 None IT Unstable 21
Ado. Agena Mod. Unlike Triplet 88 15-19K 56 89 97 322 10.79 10.2 4.9 None N-/- 1 Usal2Mod. 81 ed.5 TO A-1-1/-2e Triplet 15182 5 21 1.25 inch long baffle dyn. unstable; 1.5 inch and 1.75 inch baffles resurg
ModI 8533 1-1/4-2 4 Pops 2T Marginal 2long baffle dyn. stable but long damp time. *Associated with accumulation under baffle
None 600 Orif -5 ;omb Unstable 21 Discontinued effortLiner
V5 21, 22 Recommended but program terminated before testing
Aerojet Titan I LOX RP-1 LD LD 60 0 0.119 180K 154 2.25 637 21.6 2 97.8 None None Stable Unstable 23 Statistically stable spontaneo
Booster 10Statistically stable spontaneously, 0.6 percent incidence of instability (during
Titan II, III A- LD LD 5 0119 0.082 215K 200 2.0 785 Cyl 21.8 22 1.9 97.2 None None omb T Stable Unstable 24, 25 operation in low MR, low Pc region)
GmnItSae515 F U.1 .0B2 215K 200 2.8 785 Cyl 21.8 22 1.93 97.2 Sane Nn
Gemini, lst Stage
Titan I Sustainer LOt RP-1 LD LU 28 0 85 0.057 80K Ill 582 14.2 98 9 Non None Stable Unstable 24 Statistically stable spontaneouslyTitan I Sustainer LO P1 LD LD 3928 0 0.085 0.057 80K 11 [682 1. 89 Nn
Titan I, III NTO A-50 LD LD 100K 100 1.8 827 Cyl 14.5 21 2.5 None None .G. 1T, 2T rginal Unstable 25 *.3 percent incidence of instabilityGemini, 2nid StageAB1 1
I LD LD / 4 8 + Hub None 0mb lL Unstable* Unstable 25 30 percent incidence of instability
Quadlb 3 0D477446+.bNT Marginal Unstable 25 *1.3 percent incidence of instabilityQuadlet 0.049 0.037 y 97.4 0 4 n ub None
Titan 2nd Stage NT' A-SB Quadlet 84 5 7 Sne .. Stable 25, 26 *Marginal length 2.5 inches. Humped injection at mid-radiusageanN7ndASt0geuadlIet 804 ' 5" 7 None tm
GEMSIPI162-on-2 200 None None Unstable 26Unlike Stbe2
Impingement 200 140 140 5 7 None Stable 26 *Marginal length 2.5 inches. Flat distribution; selected concept
Apollo SPS UDMH-50 UD U 21 5K 30 2. 100 Cone 17.6 212.0 None has varying impingement distances across face
575 40 4 6 Unsym. Stable Stable 2557540 I I oub Mixed impingement
0.041-0.073 0.041-0.077 40 4 I b Stable Stable 25 Mixed impingement; selected concept
40 [ .6 I' 4]5 BuPops* Stable* 27 *Shift in MR from 2.0 to 1.6 resulted in marked increments in incidence of random popping40 1.6* 4 "5 + Hub dyPops-. b . ... ..tored by counterboring ox . ifi and inc. .sing baffle length
Transtage 21-1D NTO Quadlet 336 0.036 0.0292 8.15K 24 2.0 100 -40 '-40 31-73 32-60 11.91 17.72 2.5 3 3.2 4 None Pops 2T Unstable 25, 27 Pops triggered sustained instability
Transtage 21-11 0 TRings ut 336 0.036 Q 0.0292 8.15K 24 2.0 100 3.2 4 None Pops Stable Marginal 25, 27 Flight versionTrnsae 1-1 FO-F Triplet 0.051 T ED , 5-61.1 77 .39. .
Tantage 21-118 Alt Rings Quad. 336 006 Q 0.0292 8.15K 24 2.0 100 45 24-85 - 1.91 1772 253 None Yes 5./6.5 Unstle/ 5, 24 6.5 percent open area of absorber required for dyn. stabilityTrmstate 21-11B F-O-P Triplet 13 7.B K -40 24-S B 57-86 11.91 17.72 2,53 None Yesab3/6.
AFRPL 8 Spud Pulse Motor NTO NH4
LD I LD 40 0.0785 0.0785 4.5K 0.9-1.44 00 Cyl 12.8 10.3 None None P.G. Unstable Unstable 2818 F P 281. oeNn
O-F-O 20 0.104 0.104 Unstable 28Triplet
Like Doublets 78 0.028 0.035With O-F-IFan Trip -FI*stable at low MR.
xpeeConcluded l more stable than N2H4LD LD 40 0 0.0785 0.0785 1.4-2.3 Stable 28 Instability increases with decreasing MR for N2H4.LD LD 18 F !Experimental results agreed with predicted stability trends
O-F-O Unstable Unstable 28 using Priem model
Tri let 0.104 010sLik Doublets 78 0.028 0.035
nstable 28With O-U-OFan Triplet i,
I:! R-9353
FOLDOUT FRAME FOLD UT FRAME UT FRA! 5
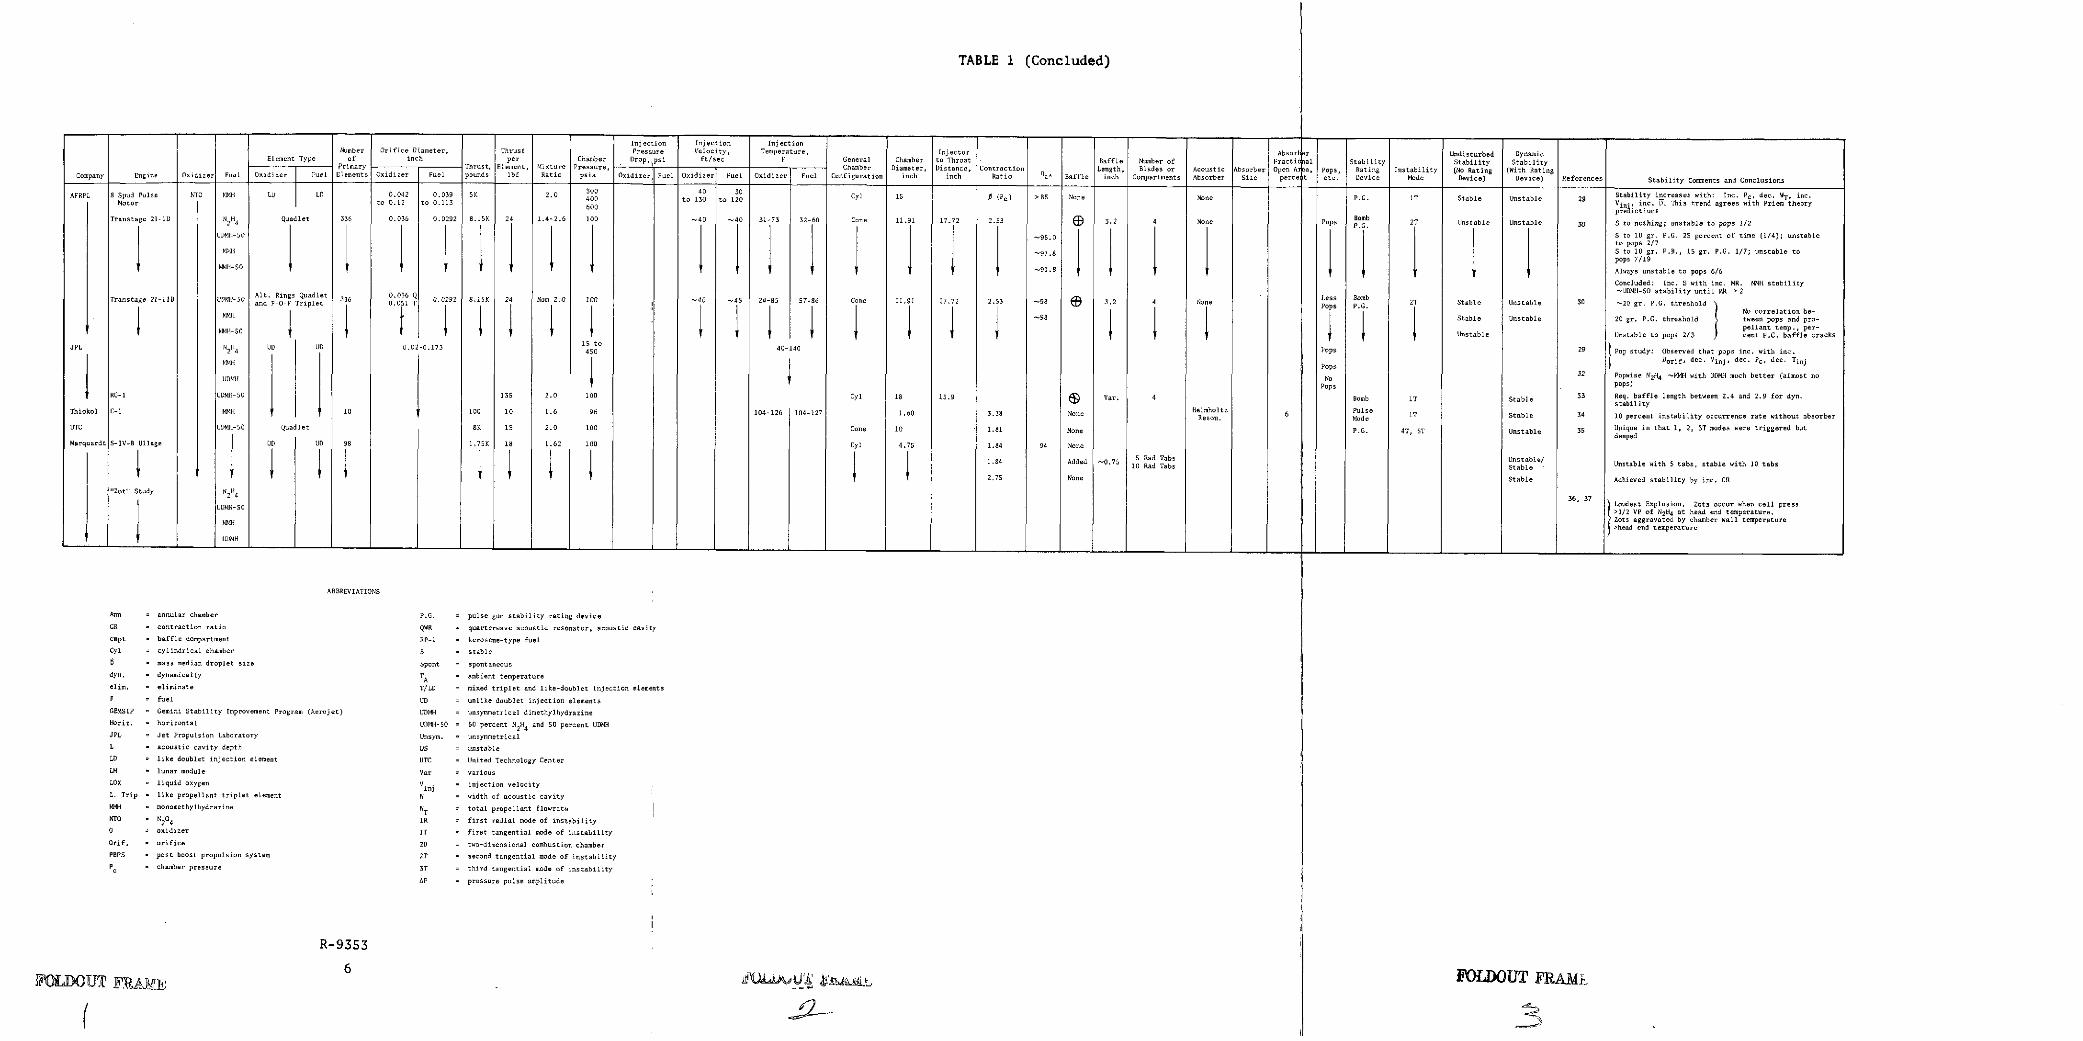
TABLE 1 (Concluded)
Injection Injection InjectionNumber Orifice Diameter, Thrust Pressure Velocity, Temperature, Injector Absorlr Undisturbed DynamicElement Type of inch per Chamber Drop, si ft/sec F General Chamber to Throat Baffle Number of Fracti ial Stability Stability StabilityPrimary Thrust, Element, Mixture Pressure, .. Chamber Diameter, Distance, Contraction Length, Blades or Acoustic Absorber Open A a, Pops, Rating Instability (No Rating (With Rating
Company Engine Oxidizer Fuel Oxidizer Fuel Elements Oxidizer Fuel pounds lbf Ratio psia Oxidizer Fuel Oxidizer Fuel Oxidizer Fuel Configuration inch inch Ratio c* Baffle inch Compartments Absorber Size perce t etc. Device Mode Device) Dvice) References tability Comments and ConclusionsAPIL 8 EPule Oxii0e Fuel LI Li.b2f19 t21 30l 3AFRPL 8 Spud Pulse N H LD0. 0.039 K 2.0 1 Cyl 1 (P >8 Non None P.. T table nstable 2 Stability increases with: Inc. Pc, dec. W, inc.
Motor to 0.12 to 0.113 600 i This tread agrees alth Prien theory
Transtage 21-ID N2H4 Quadlet 336 0.036 0.0292 8.15K 24 1.4-2.6 1i00 -40 -40 31-73 32-60 Cone 11,91 17.72 2.53 3.2 4 None Pops B mbstable nstable 3 S nothing; ustable to pops 1/2
MHDMH-50 95.0 Stoig.P..2peenoftm /4;usae
L N 0 -1 09 1 .0t o p o p s 2 / 7
-.4 91.8 I to 19 gr. P.R., *il gr. P.O. 1/7; unstable tospops 7/19
MMH-50 f91.8 Always unstable to pops 6/6Concluded: Inc. S with inc. MR. MM4H stability
UDlMH-50 stability until MR > 2Transtage 21-11a U -iD d Ft rgsT let 336 0 0.0292 8.15K 24 Nom 2.0 100 -40 -45 24-01 17-86 Cone 11.91 17.72 2.53 o98 2 4 None 2T Stable Unstable 30 -20 gr. P.G. threshold
NNo correlation be-99.11 tII'.98 Stable Unstable 20 gr. P.G. threshold tween pops and pro-814H-50 $pellant temp., per-I0i-50l 1 1 1 1 1 1 1 1 I I Unstable Unstable to pops 2/3 cent F.C. baffle cracks
JPL 2 4 UU 0.02-0.17 450 40-140 Pops 29 Pop study: Observed that pops inc. with inc.IM PpsDorif, dec. Vinj, dec. Pe, dec. Tinj
FUIH IIPops32 Popwise N2H4 ~.MH with UDMH much better (almost no
Pops pops)RC-1 UDMH-50 135 2.0 100 Cyl 18 15.9 Var. 4 Bomb IT Stable 33 Req. baffle length between 2.4 and 2.9 for dyn.stability
Thiokol C-1 1H 10 100 10 1.6 96 104-126 104-127 1.60 3.38 None Hesmhon.tz 6 Pulse
UTC UDMH-50 Quadlet 8K 15 2.0 100 Cone 10 1.81 None P.G. 4T, ST Unstable 3 Unique in that 1, 2, 3T modes we triggered butIdampedMarquardt S-IV-B Ullage UD UD 98 1.75K 18 1.62 100 Cyl 4.75 1.84 94 None
1.84 Added -0.75 1 Rad Tabsnable/ nstable aith 5 tabs stable with 19 tabsI I I 1 2.75 None S adtable Achieved stability by inc. CR
"Zot" Study N 2H4"D uH 4 36, 37 Loudest Explosion. lots occur when cell pressUD1-50 (>1/2 VP of N2H4 at head end temperature.I Zots aggravated by chamber wall temperature
Ib>head end temperatureMkIHUDMH
ABBREVIATIONS
Ann = annular chamber P.G. = pulse gun stability rating device
CR = contraction ratio QWR = quarterwave acoustic resonator, acoustic cavitycmpt = baffle compartment RP-I = kerosene-type fuelCyl = cylindrical chamber S = stable
= mass median droplet size Spont = spontaneous
dyn. = dynamically TA = ambient temperatureelim. = eliminate T/LD = mixed triplet and like-doublet injection elements
F = fuel UD = unlike doublet injection elementsGEMSIP = Gemini Stability Improvement Program (Aerojet) UDMH = unsymmetrical dimethylhydrazineHoriz. = horizontal UDMH-50 = 50 percent N2H4 and 50 percent UD
JPL = Jet Propulsion Laboratory Unsym. = unsymmetrical
L = acoustic cavity depth US = unstableLD = like doublet injection element UTC = United Technology CenterLM = lunar module Var = variousLOx = liquid oxygen V. inj = injection velocityL. Trip = like propellant triplet element W = width of acoustic cavity
NMH = monomethylhydrazine WT = total propellant flowrateNTO = 204 1R = first radial mode of instability0 = oxidizer IT = first tangential mode of instabilityOrif. = orifice 2D = two-dimensional combustion chamberPBPS = post boost propulsion system 2T = second tangential mode of instability
Pc = chamber pressure 3T = third tangential mode of instabilityAP = pressure pulse amplitude
R-93536
P JUtAE )~ 0 ~k&~kk OLDOUT FRAt
As might be expected, little information was found that would allow a direct com-parison between LOX/RP-l systems and NTO/amine systems. However, a limited num-ber of directly comparable tests was made with LOX/RP-1 and NTO/UDMH propellantcombinations in Rocketdyne engines. Both propellant combinations were operatedsuccessfully in the Atlas sustainer, Thor/Jupiter, and E-1 engine systems butwithout attempting to determine the relative dynamic stability. In addition, bothpropellant combinations were used in a low-pressure, two-dimensional model of theF-1 and a so-called "barrel" chamber with inert gas pulse rating techniques beingemployed. The barrel chamber was a model of a relatively high thrust engine inwhich the chamber diameter was modelled but a high contraction ratio was used toreduce the thrust to a convenient level. The results indicated essentially nodifference of stability in the two-dimensional engine but an indication of greaterstability with the LOX/RP-l combination with the barrel chamber was found. Inaddition, the LOX/UDMH propellant combination was found to be less stable thanthe LOX/RP-l combination in tests with a high-pressure, two-dimensional model ofthe F-1 chamber. It should be noted, however, that in most cases no special effortwas made to operate with the alternate propellant combination at its optimum mix-ture ratio and in many cases the exact mixture ratio achieved is not readilyavailable.
The NTO/50-50 propellant combination was substituted for LOX/RP-1 when the Titan-Iwas uprated slightly to become the Titan-II. Both the Titan-I and Titan-II wereonly "statistically" stable (i.e., without disturbing the engine with a ratingdevice, large numbers of tests could be made without the occurrence of spontaneousinstabilities). These engines were unstable to artificial disturbances introducedwith dynamic rating methods. No inherent stability advantage of either propellantcombination appeared evident. The desire to achieve a dynamically stable Titansecond-stage engine led to the GEMSIP (Gemini Stability Improvement Program) Pro-gram which culminated in the achievement of dynamic stability through an increasein thrust per element and the addition of injector face baffles.
The AFRPL performed a comparative stability study of the Transtage engine withN2H4 , N2H4/UDMH (50-50), MMH, and N2H4/MMH (50-50) fuels and NTO oxidizer. Withpulse guns being used for stability rating, the stability with the N2H4/UDMH (50-50) and MMH fuels was approximately equal and was significantly better than thatobtained with either the N2H4 or N2H4/MMH (50-50) fuels (which were also conduciveto "pops").
The susceptibility of amine-type fuels to pops, ignition spikes, etc., has oftenbeen of concern. While pops have been observed with LOX/RP-l propellants, thesepops have been attributed to entrainment of air in the propellant stream (Ref. 5).Pops observed with NTO/amine propellants have generally been attributed to blow-apart or stream separation (Ref. 31). Pops with NTO/amine propellants often re-sult in sustained instability and/or hardware damage. A recent study of poppingis reported in Ref. 30 in which the popping tendencies of N2H4 , MMH, and UDMH werecompared under varying injection conditions; UDMH was found to have less poppingtendency than N2H4 or MMH, which were comparable to each other.
Minton and Swick (Ref. 36) report the investigation of manifold explosions (whichthey called "Zots") with NTO/amine propellants. Their experiments indicated thatthe condensation of residual fuel vapor in a cold, empty oxidizer manifold followed
R-9353
7
by the contracting of this detonable fuel condensate with fresh oxidizer leads to
a manifold explosion or "Omzot". In Ref. , other types of Zots (Chizot, Pizot)are described, some of which would be called pops by other investigators. Zots
were concluded to occur only under conditions where local pressure is greater than
one-half the vapor pressure of N2H4 at the local temperature. The,occurrence of
Zots was found to be aggravated by high chamber wall temperatures.. Artificial
explosions were created by adding NTO to identical amounts of various fuels. The
"loudness" of the resulting detonations was measured and the resultant ranking may
be an indication of susceptibility to occurrence of damaging Zots as well (Table 1).
The literature review indicated that UDMH is the least likely of the amine family
to exhibit detrimental popping. MMH and (N2H4/UDMH, 50-50) are about equally sus-
ceptible to detrimental popping and are ranked as worse than UDMH but better than
N2H4/MMH (50-50) and straight N2H4 which are considered quite susceptible.
Of particular interest to this program is the work of Abbe et al. at AFRPL (Table
1)) during which the Priem stability model was used successfully to: (1) predict
the relative stability of an NTO/MMH engine design with an NTO/N2H4-UDMH (50-50)
engine design (Ref. 27) and (2) to investigate the effect on stability of various
design and operating conditions (Ref. 28). Abbe concluded that interactions be-
tween the various processes occurring in a combustor are so complex that an ana-
lytical model is necessary to predict the overall effect of a change in even a
single design or operating parameter.
R-9353
8
PRIEM MODEL INSTABILITY ANALYSIS
DESCRIPTION OF THE MODEL
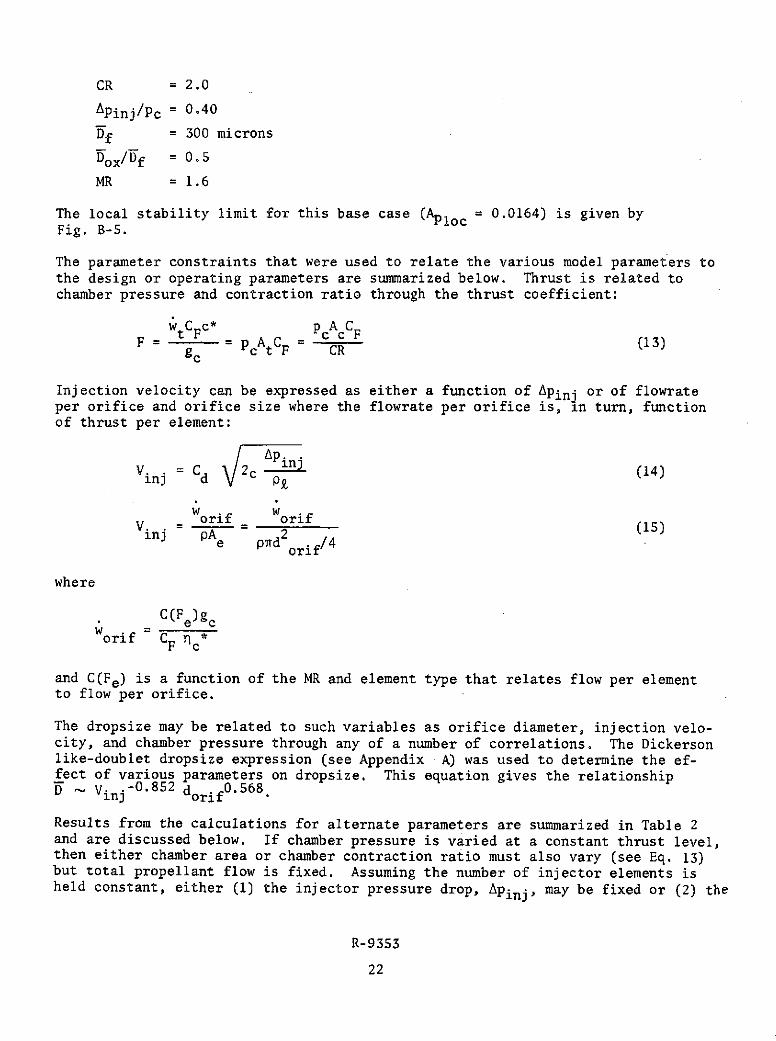
The Priem-type instability model has been used extensively to predict engine sta-bility. This model is based on numerical solution of a system of equations describ-ing the combustion/flow field within a small annular region chosen as representativeof the combustion chamber. The model considers basically only one dimension and,therefore, can approximate tangential modes but not radial, longitudinal, or coupledmodes. Although this model has some limitations, it does include the detailed spraycombustion processes in a quasi-steady sense and it does account for nonlinearities.Numerical solution of the equations gives a nondimensional overpressure, A = Ap/pc,required to initiate a high-frequency instability (transverse mode) as a functionof several nondimensional parameters. This critical overpressure, Ap, is deter-mined from a series of computer experiments in which the oscillatory combustionresponse (history), subsequent to various initial disturbance levels, is calculated.The disturbance that will cause an oscillation that neither grows nor decays is thecritical overpressure, the Ap. Conceptually, this is similar to bombing an enginewith varying bomb sizes until the minimum size is found that will cause a sustainedoscillation.
According to the Priem model, the stability index Ap is a function of severalparameters:
Burning Rate Parameter, ? = R (1)
Velocity Difference, AV' = JVgas - Vdrops /c (2)
Mass Accumulation Parameter, MAP = M vap/. .inj t (3)
yap inj w(3
K 10 -1/3 Ddr cp -1/2Small AV' Parameter, K - Sc (4)
13C RM
/oDroplet Drag Parameters, K2 4 (pD) v , and (5)
x dr /o
/3 CD Rp(63 4 (pD)dro (6)
where the subscript o refers to steady-state (stable) conditions. The values ofthese parameters may be calculated from the results of steady-state combustionmodel calculations. Generally (for most propellants and injector configurations),the most influential parameters are , the burning rate parameter, and AV', theaxial velocity difference.
A generalized plot of the calculated relationship between Ap, ~ and AV' is shownin Fig. .1. The parameter AV' varies with axial position in the engine and usuallyhas a minimum value near the injector. The model predicts that this region, cor-responding to a minimum AV', is the most unstable or most sensitive zone and,therefore, the analysis is generally done for this location only. Further, although
R-9353
9
1.0
AV' - 0,05
AV, o' 4
d V = 0.04/ .N,.' ,v, = 0.03
0 . -
NEUTRAL IAV' = 0.02STABILITYCURVES
<
avo. 0.01
UNSTABLE
- STABLE
0.001
I K 3 .K2 0 O
0.01 0.1 1.0
BURNING RATE PARAMETER,
Figure 1. Priem-Type Stability Map Showing Effect of AV'
R-9353
10

the value of AV' may be predicted to be zero at this location, it is generallyagreed that a minimum value of 0.01 is more reasonable because of turbulence ef-fects and nonuniformity of dropsizes. Thus, the stability analysis is commonlymade with AV' = 0.01 and for the sensitive zone.
The relationship between Ap, ?, and Kl, for AV' = 0.01 is shown in Fig. 2. Theparameter K1 arises through consideration of a more exact burning rate expression,than was originally used by Priem, for small values of AV' (Ref. 38).
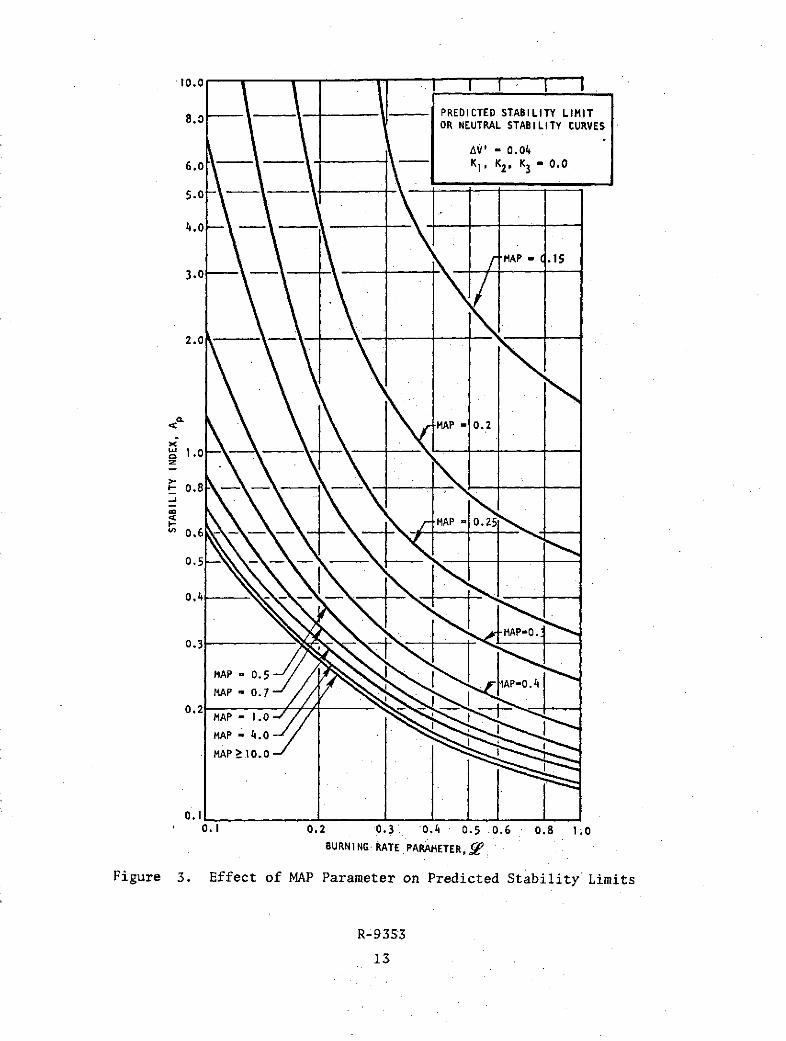
The relationship between Ap, 9, and MAP is shown in Fig. 3. The effect of theMAP parameter is to raise the stability limit at locations where a large propor-tion of the propellant has already been burned, and a small amount of unvaporizedpropellant is left to sustain an instability by burning. The most sensitive zoneof instability (minimum AV') normally occurs at an axial location where a largeproportion of the propellant is unburned (large MAP); therefore, the MAP parameteris generally of little importance.
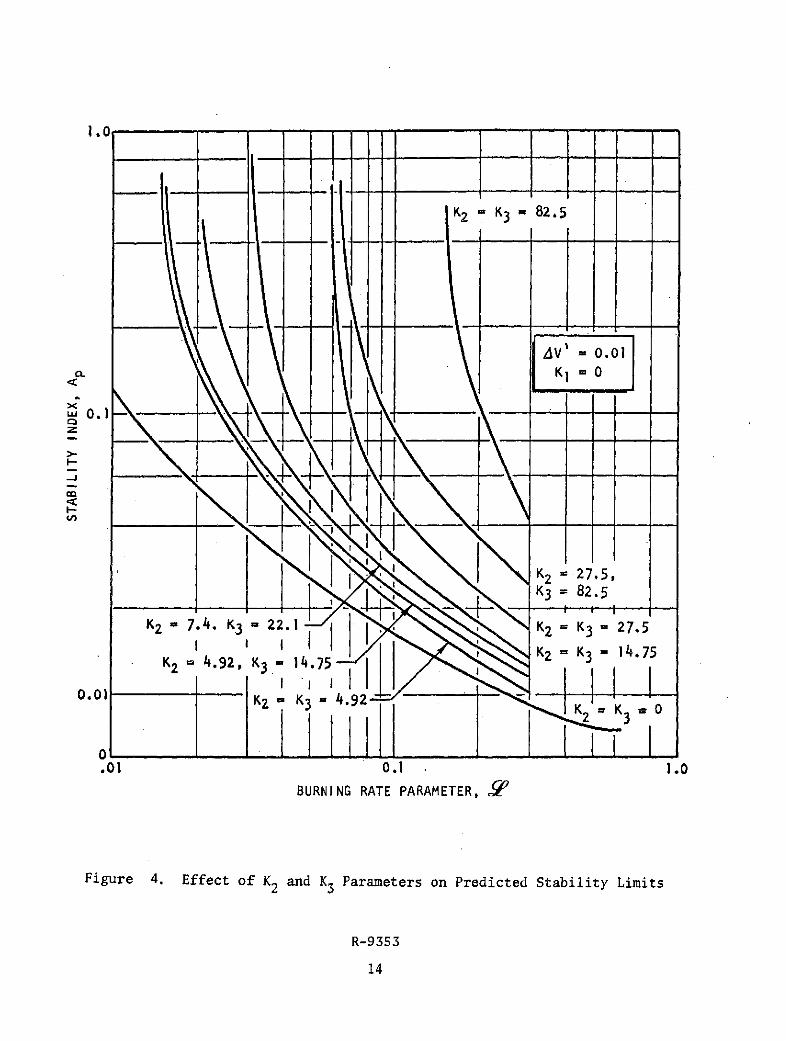
The relationship between Ap, _W, K2 and K3 is shown in Fig. 4. These parametersarise from a modification to the Priem model to include the effect of droplet drag(Ref. 38). These curves show that K1 and K2 can significantly change Ap, indicat-ing the importance of droplet drag.
Results from a steady-state combustion model are required for the Priem-type anal-ysis. Such steady-state models have been used extensively and several model varia-tions are available. Generally, in these models, the mass and mixture ratio dis-tributions created by the injector are assumed uniform to avoid the complexitiesof handling the nonuniform case. Moreover, in most cases it is satisfactory toemploy a model based on an evaporation coefficient rather than including dropletheating. This approximation is good as long as the chamber pressure is signifi-cantly below the critical pressure of the propellants.
Steady-state combustion models are based on numerical solution of the differentialequations describing the spray combustion processes. These equations apply toarrays of discrete droplets and, generally, are restricted to one-dimensional flow.Therefore, the calculation is usually begun at a position downstream from the in-jector where the equations are expected to apply. The calculation then proceedsdownstream in a stepwise fashion to the nozzle throat. Iteration procedures areemployed to ensure that the flow satisfies sonic conditions at the throat. Theinput required by the steady-state models includes:
* Chamber geometry (diameter, length, contraction ratio)
* Combustion gas properties (p, T, p, k, etc.) as a function of mixtureratio (obtained from equilibrium performance calculations)
* Axial position where calculation is to begin
* Initial condition of spray and gas at starting position
* Spray dropsize and dropsize distribution
* Spray velocity
* Spray temperature
R-9353
11
0.60:6 - - __ _ __ _ __ __ _
0.4 - - - PREDICTED STABILITY LIMITOR NEUTRAL STABILITY CURVES
0.3 AV' = 0.01K2, K3 0.0
10 < MAP < 10
0.2 -
K I- 0.20
0.10 K = 0.10
0.08
0K = 0.060.08
- 0.04
_-
Z 0.03
0.0 Kl . 0.040.02
K 1 0 .00--.
0.01
0.006 ___0.01 0.02 0.03 0.04 0.06 0.08 0.1 0.2 0.3 0.4 0.6 0.8 1.0
BURNING RATE PARAMETER,
Figure 2. Priem-Type Stability Map Showing Effect of K1 Parameter
R-9353
12
8.0 --- PREDICTED STABILITY LIMITOR NEUTRAL STABILITY CURVES
AV' - 0.04
6.0 - Ki, K2, K 3 0.0
5.0 - - - --
4.0--
3.0 --- --- ------ MAP C-(15
2.0
< C-MAP - 0.2
.1.0 - --
I- 0.8-o
MAP 0.25u 0.6 - - - -
0.50.40
0.3
MAP 0.50.20.MAP 0.7
0. 2 M A-P f .
MAP - 4.0
MAP >10.0
0.1
, .. I 0.2 0.3 -0.4 0.5 0.6 0.8 1.0BURNING RATE PARAMETER,$
Figure 3. Effect of MAP Parameter on Predicted Stability Limits
R-9353
13
1.0
K2 - K3 - 82.5
1 AV = 0.01K. 0:
1 |
I-I
K2 =7. 4. K3 22.1- K2 -K3 = 27.5
K2 - 4.92, K3 1 14 .75 K2=3-147
0.01 Kg=K= 4.92 1 ' L0.1-
0= - __
.01 0.1 1.0BURNING RATE PARAMETER, 9
Figure 4. Effect of K2 and K 3 Parameters on Predicted Stability Limits
R-9353
14
" Gas composition (MR)
* Gas flowrate (percent of spray burned)
* Gas pressure
* Initial dropsize
" Initial drop velocity
" Gas velocity
" Gas composition (percent of fuel burned, percentof oxidizer burned)
" Initial overall percent burned (vaporized)
Output from the steady-state combustion model includes the following variables asa function of axial location:
* Dropsize
* Drop velocity
* Gas velocity
* Gas composition (fraction of fuel burned, fraction of oxidizer burned)
* Gas physical properties
* Overall fraction burned (vaporized)
The Priem model input parameters can be calculated from the steady-state combustionmodel output through use of the following relationships:
m = - (7)
where e is the overall fraction burned.
MR 1M = (1-X ) MR + (1-XF) (8)vap0 OX) R+ F MR+ 0
where XOX, XF are the burned fractions of oxidizer and fuel, respectively. Also:
w. .n. j m (9)inj 0 Ac
oc2WR
t 2rR- (10)w c
27.0 Re-0 .84 Re 5 800.217 4
CD = 0.271 Re 0 2 1 7 80 < Re < 10 (11)4
2.0 Re > 10
R-9353
15
where Re = D dAVIP
The use of the Priem-type model in conjunction with a steady-state combustionmodel allows a relatively thorough evaluation of variations in engine stabilitywith the parameters of interest. These parameters can include dependent param-eters such as dropsize as well as operating and design variables such as chamberpressure or contraction ratio.
STEADY-STATE COMBUSTION MODEL CALCULATIONS
In formulating the analysis scheme, particular care was taken to group the effectsof the many independent variables such that a parametric analysis would not requireexcessive computer time or manual labor. Moreover, the results must be expressiblein a reasonable number of graphs, tables, or example problems. A summary of thisanalysis scheme and selection of analysis parameters is described below.
A so-called k' or evaporation coefficient steady-state model was used with thefollowing input parameters:
* Chamber diameter
* Chamber contraction ratio (throat diameter), CR
• Chamber length
* Chamber pressure, pc
" Mixture ratio, MR
* Initial spray velocity, V.in j
" Initial spray dropsize, D and Dox/Df
While the chamber and throat diameters are actually input into the steady-statemodel, the model is one-dimensional and actually considers only the total propel-lant mass flux (flowrate per chamber cross-section area) wt/Ac. Also:
t PcAt gc PcgcA = c*A c*CR (12)
c c
This expression was used to eliminate the chamber diameter from the list of keyparameters shown above.
Further, propellant dropsize was treated as an independent variable, which effec-tively separates some of the effects of injector orifice, injection pressure drop,liquid propellant properties, and chamber contraction ratio.
The coding of the k' computer model was modified to directly calculate the follow-ing Priem parameters from the steady-state model results: m, Mvapo, Winjo, V'
R-9353
16
and Kl. In addition, the following Priem-related parameters were calculated bythe model as functions of axial position:
MAP(R)
K2 /R
K3 /R
The effect of chamber size (radius, R) on the Priem parameters and thus, the sta-bility limit (Ap), was calculated through use of Fig. 2 without additionalsteady-state model results being required.
Additional practices were followed to reduce the number of variable steady-statemodel input parameters from the nine listed earlier to a total of six, viz., pro-pellant combination, CR, Pc, Vinj (or APinj), Df and Dox/Df. The chamber lengthwas held constant at 9 inches (injector face to beginning of nozzle convergence).The combustion efficiency (lc*) was assumed to be 96 percent. Mixture ratio wasfixed for each propellant combination (thus fixing the theoretical c*); a mixtureratio of 1.60 was used for both NTO/MMH and NTO/50-50 propellant combinations.
The assumed initial percent burned at the computational starting position was 1.0percent of each propellant. The spray velocity was calculated from selected valuesof Apinj, with Cd = 0.89 being used. A specialized form of the Nukiyama-Tanasawadropsize distribution was used which allowed the distribution to be calculatedfrom a specific mass median dropsize. This distribution is based on work by Ingeboas described in Ref. 40. The distribution function is:
dV (4.63/D)6 (D5/120) exp (-4.63 D/D) D 5 2.00 D
dD 0.0 D > 2.00 D
where D = Dox or Df and V is the volume fraction of the spray. An axial stepsize of 0.020 inch was used in the computer calculation procedure. The inclu-sion of droplet heating is the k' combustion model was not attempted.
A total of 240 computer runs with the steady-state combustion model was made forthe NTO/MMH and NTO/50-50 propellant combinations. These computer runs encom-passed the entire desired matrix of steady-state combustion conditions to be in-vestigated for those propellant combinations. The steady-state model runs foreach propellant combination included all possible combinations of the followingvariables:
Chamber Pressure, pc = 125 psia, 200 psia
Injector Pressure Drop, Ap = 0.2 Pc, 0.4 Pc
Combustor Contraction Ratio, CR = 2.0:1, 3.0:1
Fuel Dropsize (Mass Median), Df = 60, 100, 200, 300, 400 microns
Ratio of Oxidizer to Fuel Dropsize, Dox/Df = 0.5, 0.75, 1.0
R-9353
17

RESULTS FROM PRIEM-TYPE ANALYSIS
Steady-state combustion parameters needed as input to the Priem instability modelwere tabulated from the steady-state model results as functions of distance andchamber radius, if appropriate, for each case. The location of the most sensitivezone was found to shift further downstream as the variables Df, Dox, CR, APin and
Pc were increased. For operation at Df = 60 microns, Dox = 30 microns, CR = ,APinj = 0.20 Pc and Pc = 125 psia, the most sensitive zone was located about 0.02inch downstream of the starting point for the computer calculations. The maximumshift in the location of the sensitive zone was found to occur at Df = 400 microns,Dox = 400 microns, CR = 3, APinj = 0.40 pc and Pc = 200 psia. The sensitive zone
was located at slightly more than 2.00 inches from the starting point for theseconditions. Although the value of AV' at the most sensitive zone was assumed tobe its "turbulence," or minimum, value of 0.01, the actual numerical value wasusually only 0.002 to 0.004.
In all cases, the numerical values of MAP (representing the effect of remainingunvaporized propellant) and K2 and K3 (representing the effects of droplet drag)were found to be of such a magnitude that their influence on predicted stabilitywas negligible for the entire matrix of computer runs. This is not unusual forstorable propellants. Calculation of the Priem stability index, Ap, was thussimplified considerably, being a function of only the non-dimensional burning-rate parameter, _, the parameter K1 (the correction for small AV') and the non-dimensional AV', which was assumed to have a turbulence level value of 0.01 atthe sensitive zone.
Two methods of calculating the burning rate parameter were used. One method in-volved the use of the local value of the fraction burned per unit length (m) atthe most sensitive zone. With the second method, the average value of m over thefirst 2 inches of the combustion zone was calculated, which included the "mostsensitive" zone for all computer cases and which would avoid high local "point"values whose magnitude is sensitive to poorly defined steady-state model inputparameters such as initial percent of propellant burned. The local value of mat the sensitive zone was almost a factor of 10 larger than the averaged value ofm over the first 2 inches of chamber length for small dropsizes while for largedropsizes it was roughly one-half the averaged value.
The calculated value of K1 increased with decreasing Pc, Df and Dox but was inde-pendent of CR and APinj. A maximum value of K1 = 0.204 was obtained for Pc = 125psia, Df = 60 microns and Ifox =30 microns. A minimum value of K1 = 0.041 wasobtained for Pc = 200 psia and Df = Dox = 400 microns.
Values of the Priem stability index, Ap, were determined for the previously men-tioned ranges of chamber pressure, injection pressure drop, contraction ratio,and fuel and oxidizer dropsize for both the NTO/MMH and NTO/50-50 propellant com-binations at combustor radii of 2, 4, and 6 inches. Figure 2 was used in con-junction with the numerical values of q'and K1 obtained from the computer print-out to obtain the Ap value.
The results from this analysis are summarized in Appendix B, examples of whichare shown in Fig. 5 and 6. These results have been placed in an appendix
R-9353
18
0.10 I
0.07 Pc = 125 PSIA
APin j = 0 .2 pmyPc
CR = 21.0
R =2, 6 IN. Dox
0.05 Df
a R =2 IN.
< 0.75
w
00.5
-- I 0.5
R =6 IN.
0.01100 200 300 400
FUEL DROPSIZE, Df, MICRONS
Figure 5. Local Stability Index as a Function of Dropsizefor pc = 125 psia, Apinj = 0.2 Pc, CR = 2
R-9353
19
0.10 I I
0.07 Pc = 125 PSIA
Ap nj = 0.2 Pc
CR = 2
R = 4 IN.
0.05
O0
__ __ _1.0 =< = 4 IN.
" 0.03 ox
Df
0.75
co
0 .02 -- _ _--
00.5
0.01100 200 360 400
FUEL DROPSIZE, 0f, MICRONS
Figure 6. Local Stability Index as a Function of Dropsizefor pc = 125 psia, Apinj = 0.2 pc' CR = 2
R-9353
20
because of the large number of figures involved. Results obtained with the localvalue of the burning rate are presented in Fig. B-1 through B-16, while resultsobtained with the averaged value of the burning rate over the first 2 inches ofaxial distance are presented in Fig. B-17 through B-32. The dotted lines in thefigures re resent an extrapolation of the stability curve shown in Fig. 2 to avalue of between 1.0 and 10. For purposes of extrapolation it was assumed thatthe stability limit remained invariant beyond '= 1.0, i.e., Ap (Y-> 1.0) =A (_=l.0). Attempts during previous Rocketdyne-programs to extend the range ofthe stability limit plot in the direction of greater 9'were unsuccessful becausenumerical instability was encountered in the computer solution of the programmedequations. While Priem's original work (Ref. 41) showed a bowl-shaped curve, withAp increasing with increasing 9 for _T > 1, more recent work at Rocketdyne indi-cates that it may not increase, the apparent increase being due to numerical in-stabilities. Therefore, the dotted lines are believed to be upper limits for thestability index..
Many of the Ap curves shown in Fig. B-1 through B-32 exhibit a minimum in A .This results from the influence of Kl, which is dominant over the influence of the9'. It occurs most often when the value of 9? is relatively large and the varia-tion of Ap with 92 is small (see Fig. 2 ). Although this minimum in Ap impliesa "worst" dropsize, the curves on which the results are based have been extrapo-lated somewhat and this conclusion may be invalid.
The Priem-type stability analysis showed no significant difference in stabilitybetween the NTO/MMH and NTO/50-50 propellant combinations. The effect of varyingeach of the other parameters on stability, the remaining parameters being con-stant, can easily be determined by comparison of Fig. B-1 through B-32. Theseresults indicate that stability increases (improves) with increasing dropsize (forfixed CR, APinj/Pc, Pc, Dox/Df, and chamber diameter), contraction ratio (forfixed dropsize, APinj/Pc, Pc and chamber diameter) and fractional injection pres-sure drop as well as with decreasing chamber pressure and chamber diameter. How-ever, care must be exercised in making and using such comparisons because the re-sults depend on the parameters being held constant. The parameters being heldconstant for the results just noted imply hardware changes to allow them to beheld constant. Different results would be expected if, e.g., chamber pressurewere changed with fixed hardware.
The parameters chosen for the stability calculations (chamber pressure, fractionalinjection pressure drop, contraction ratio, chamber diameter and dropsize) werechosen because the selection minimized the number of parameters considered andemphasized the important physical processes. Nevertheless, the results (Fig. B-1through B-32) may be used by interpolation to estimate the Priem stability indexand, thus, relate stability to various hardware configurations and operating con-ditions. Such calculations have been made that illustrate the use of the curves.The principal additional information that is needed for this assessment is somemethod of calculating dropsizes of the propellants.
The influence of varying certain design parameters on stability with alternate con-straints, relative to a reference case, was calculated. The reference case was:
Pc = 125 psia
D = 8.0 inches (chamber diameter)
R-9353
21
CR = 2.0
APinj/Pc = 0.40
Df = 300 microns
Dox/Df = 0.5
MR = 1.6
The local stability limit for this base case (Aploc = 0.0164) is given byFig. B-5.
The parameter constraints that were used to relate the various model parameters tothe design or operating parameters are summarized below. Thrust is related tochamber pressure and contraction ratio through the thrust coefficient:
wtCF c* pcAcCFF= t =p* A C pCAcC(13)F = c cAtCF CR (13)
Injection velocity can be expressed as either a function of Apinj or of flowrateper orifice and orifice size where the flowrate per orifice is, in turn, functionof thrust per element:
Ap.Vinj = Cd 2c inj (14)
Sworif W orifV. . (15)inj pA 2in PAe prd orif/4
onif
where
=C(F e)gc
orif -CF c
and C(Fe) is a function of the MR and element type that relates flow per elementto flow per orifice.
The dropsize may be related to such variables as orifice diameter, injection velo-city, and chamber pressure through any of a number of correlations. The Dickersonlike-doublet dropsize expression (see Appendix A) was used to determine the ef-fect of various parameters on dropsize. This equation gives the relationshipb Vin. .-0.852 dorif 0.568
inj orifResults from the calculations for alternate parameters are summarized in Table 2and are discussed below. If chamber pressure is varied at a constant thrust level,then either chamber area or chamber contraction ratio must also vary (see Eq. 13)but total propellant flow is fixed. Assuming the number of injector elements isheld constant, either (1) the injector pressure drop, Apinj , may be fixed or (2) the
R-9353
22
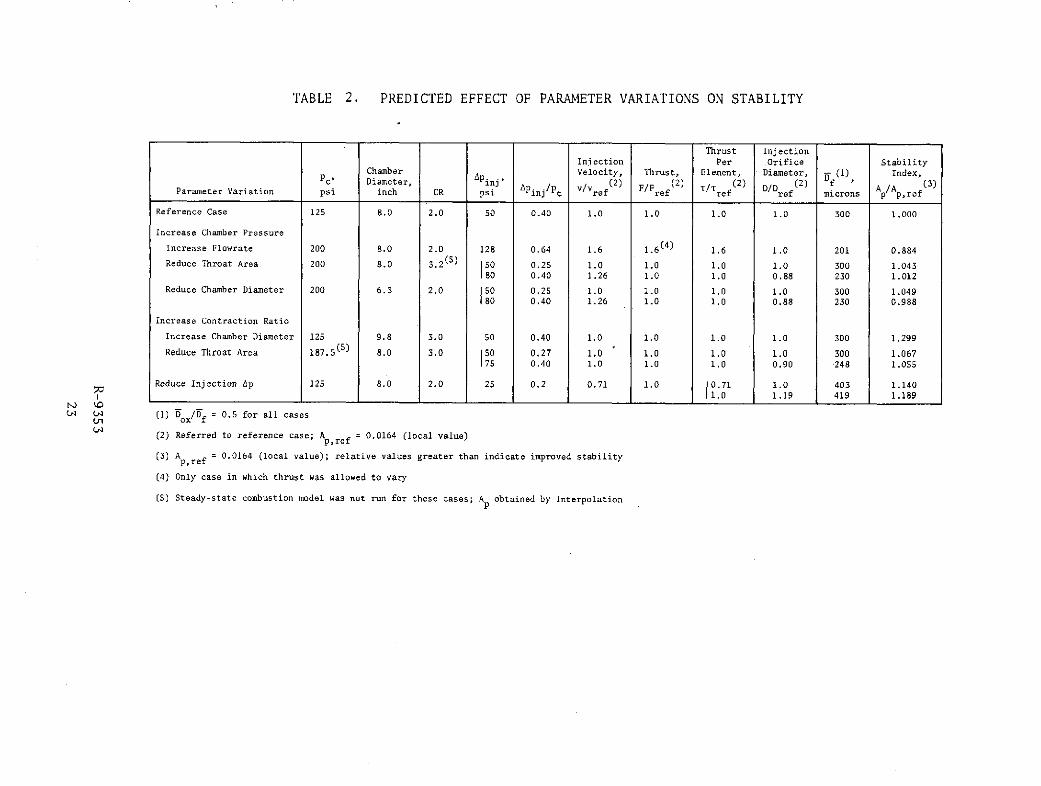
TABLE 2. PREDICTED EFFECT OF PARAMETER VARIATIONS ON STABILITY
Thrust InjectionInjection Per Orifice Stability
P' Chamber RVelocity, Thrust, Element, Diameter, - (1) Index,PCr Diameter, Pinj' (2) F/F (2) (2) (2) Af A (3)
Parameter Variation psi inch CR psi Ainj/Pc /ref F/Fref /Tref D/Dref microns p /Ap,ref
Reference Case 125 8.0 2.0 50 0.40 1.0 1.0 1.0 1.0 300 1.000
Increase Chamber Pressure
Increase Flowrate 200 8.0 2.0 128 0.64 1.6 1.6(4)
1.6 1.0 201 0.884
Reduce Throat Area 200 8.0 3.2 (5)
50 0.25 1.0 1.0 1.0 1.0 300 1.043180 0.40 1.26 1.0 1.0 0.88 230 1.012
Reduce Chamber Diameter 200 6.3 2.0 S0 0.25 1.0 1.0 1.0 1.0 300 1.049180 0.40 1.26 1.0 1.0 0.88 230 0.988
Increase Contraction Ratio
Increase Chamber Diameter 125 9.8 3.0 50 0.40 1.0 1.0 1.0 1.0 300 1.299
Reduce Throat Area 187.5(5)
8.0 3.0 j50 0.27 1.0 1.0 1.0 1.0 300 1.067175 0.40 1.0 1.0 1.0 0.90 248 1.055
Reduce Injection Ap 125 8.0 2.0 25 0.2 0.71 1.0 J0.71 1.0 403 1.14011.0 1.19 419 1.189I' O ___
( (1) Dox/Df = 0.5 for all cases
(2) Referred to reference case; Ap,ref = 0.0164 (local value)
(3) Ap,re f = 0.0164 (local value); relative values greater than indicate improved stability
(4) Only case in which thrust was allowed to vary
(5) Steady-state combustion model was not run for these cases; A obtained by interpolation
fractional injection pressure drop, APinj/Pc, may be fixed, with correspondingchanges in injection velocity and orifice diameter. Results from a series of cal-culations for several parameter variations are summarized in Table 2.
The analysis indicates that an increase in chamber pressure from 125 to 200 psiawill worsen stability only if thrust increased (see Table 2). Improved stabilityis predicted if Pc is increased to 200 psia while thrust and injection velocitywere held constant, irrespective of whether contraction ratio or chamber diameterwas increased. No appreciable change in stability was predicted for an increasein Pc to 200 psia, while holding thrust and fractional injection pressure drop,Ap/pc, constant when either contraction ratio or chamber diameter was increased.
An increase in contraction ratio from 2.0:1 to 3.0:1 improved the predicted sta-bility if Pc was allowed to increase so as to maintain constant thrust (Table 2 ).A substantial improvement in predicted stability occurred if the chamber diameterwas allowed to increase while maintaining constant Pc and thrust.
A decrease in injection Ap (or injection velocity), while maintaining constantthrust, improved the predicted stability when either the number of elements orthe orifice size was increased. This result is exactly opposite the conclusionthat might be reached from the Ap curves directly with the original constraintson the remaining parameters. The stability decrease caused by the decreased in-jection Ap indicated by the curves is more than offset by the stability increasecaused by the resultant increase in dropsize.
These results clearly show the importance of carefully defining the manner inwhich parameters are varied, viz., the parameter constraints. Different resultsmay be obtained from variations in the same parameter depending on how the remain-ing parameters are controlled. Nonetheless, the stability index plots developedduring this study allow appropriate evaluations to be made. Use of the localstability index plots (Fig. B-1 through B-16) is recommended over the averagedstability index plots (Fig. B-17 through B-32); the effect of the various param-eters on stability appears to be overly suppressed in the latter plots by theaveraging. Dropsize, and therefore the method used to determine dropsize, has astrong effect on predicted stability. Unfortunately, fully satisfactory methodsof determining dropsize are not available. For this reason the stability indexplots have been developed for a wide range of dropsizes to that they are not re-stricted to particular methods of predicting dropsize.
R-9353
24
QUASI-LINEAR STABILITY ANALYSES
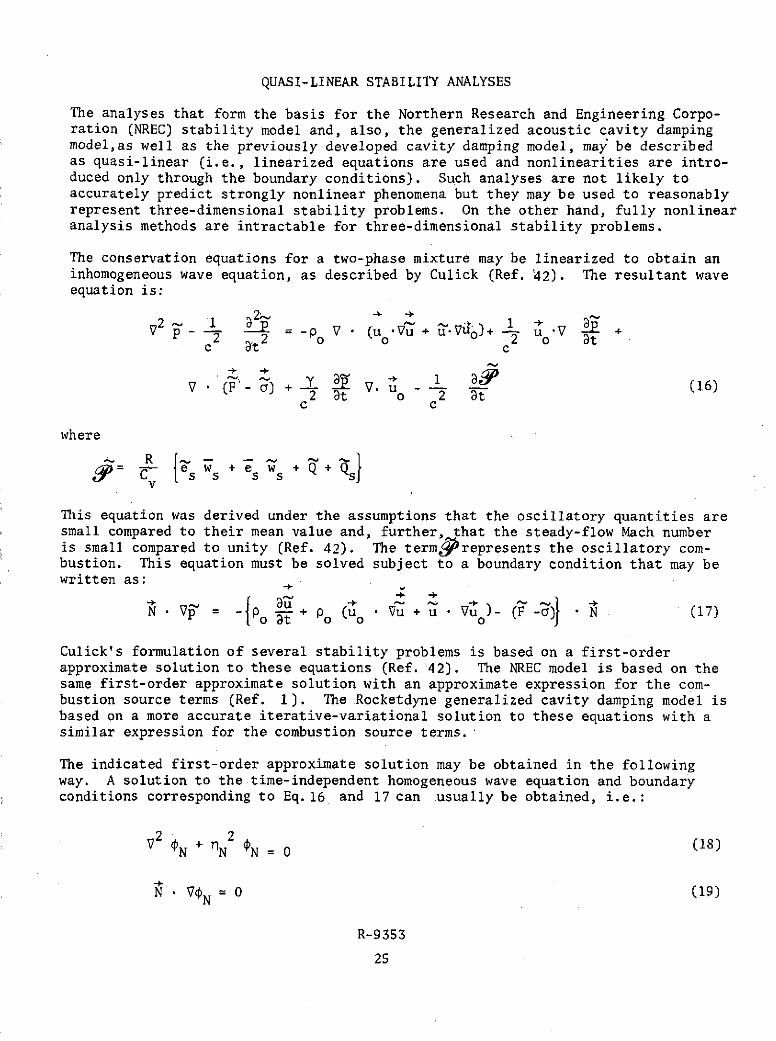
The analyses that form the basis for the Northern Research and Engineering Corpo-ration (NREC) stability model and, also, the generalized acoustic cavity dampingmodel,as well as the previously developed cavity damping model, may be describedas quasi-linear (i.e., linearized equations are used and nonlinearities are intro-duced only through the boundary conditions). Such analyses are not likely toaccurately predict strongly nonlinear phenomena but they may be used to reasonablyrepresent three-dimensional stability problems. On the other hand, fully nonlinearanalysis methods are intractable for three-dimensional stability problems.
The conservation equations for a two-phase mixture may be linearized to obtain aninhomogeneous wave equation, as described by Culick (Ref. 42). The resultant waveequation is:
v2 2 = - V (u o Vu + u'V o)+ - u +2 2 o o 2 a Btc at c
V (- ) + V. u- d (16)2 at o 2 at
c c
whereR
~+eW +Q+E- es Ws + e s sv
This equation was derived under the assumptions that the oscillatory quantities aresmall compared to their mean value and, further, that the steady-flow Mach numberis small compared to unity (Ref. 42). The termgrepresents the oscillatory com-bustion. This equation must be solved subject to a boundary condition that may bewritten as: +
N V~ +P (U Vu + *V )- (F- N (17)o a o 0
Culick's formulation of several stability problems is based on a first-orderapproximate solution to these equations (Ref. 42). The NREC model is based on thesame first-order approximate solution with an approximate expression for the com-bustion source terms (Ref. 1). The Rocketdyne generalized cavity damping model isbased on a more accurate iterative-variational solution to these equations with asimilar expression for the combustion source terms.
The indicated first-order approximate solution may be obtained in the followingway. A solution to the time-independent homogeneous wave equation and boundaryconditions corresponding to Eq.16 and 17 can usually be obtained, i.e.:
V2 N + N 2 N =0 (18)
N VON = 0 (19)
R-9353
25
where the subscript N stands for three indices, one for each dimension. Alternateboundary conditions can be used, and are desirable in some cases. Assuming a har-monic time dependence (eJit, = +ja) the time independent forms of Eq.16 and 17may be written as:
V2 + k2 = h (20)
N * Vp = -f (21)
where h and f represent the time independent form of the right-hand sides of Eq.16 and 17. If Eq. 18 and 20 are multipled by - and SN, respectively, then oneequation is subtracted from the other and the result integrated over the chambervolume, the result may be expressed as
2 2 NhdV + ffNdS (22)k = nN +(22)N 2dV
The integrals may be evaluated with ON being used in the expressions for h and fas an approximation for the pressure '.
The latter equation may also be obtained through use of Green's functions with aneigenfunction expansion being used for the Green's function. A more useful ex-pression has been obtained by Culick from further evaluation of the integrals inEq. 22, i.e.;
2 2 (2 [+ 2(k - nN f N dV = tiT N Re(y) + MoN N dS -
i Nf N (V.-o) dV - f Re(F)*V4NdV -
nNi - R - Re w + Q + Q dV +c 7C vE s ws + s N
Vf 2
-- dV + w Re - u VNdV (23)p 0c s N f s "N
NREC INSTABILITY MODEL*
The NREC model is based on a quasi-linear solution to the conservation equationsdescribing the combustion/flow field. NREC developed this model from an analysisformulated by Culick in the manner outlined above. The NREC model comprises twocomputer programs (HLMHLT and REFINE). HLMHLT calculates approximate oscillatory
*Rocketdyne has developed a capability for using the NREC model as a result of asubcontract to the General Electric Company for work on contract F33615-71-C-1742,Augmentor Combustion Stability Investigation. Rocketdyne's principal role hasconcerned analytical modeling at the driving processes.
R-9353
26
pressure distributions and the corresponding frequencies as solutions to theHelmholtz equation (time independent form of the wave equation) and without con-sidering combustion, i.e., it solves for N and kN from Eq.l18 and 19, usuallywith admittance-type boundary conditions without considering combustion. REFINEcalculates the frequencies and damping coefficients through a first-order correc-tion for combustion effects. This model can be used to predict the stability oflongitudinal and radial modes as well as the tangential modes described by thePriem model. In principle the model can also describe an acoustic cavity or linerbut the description is much less accurate than the cavity damping model. The re-quired input to the HLMHLT model includes:
* Chamber dimensions
* Average sound velocity and gas density
* Nozzle acoustic admittance
• Steady flow Mach number at nozzle entrance
The output from this program (approximate frequencies, damping coefficients, andpressure and velocity distributions) are used in REFINE. In addition, the inputto REFINE includes:
* A series of coefficients representing the oscillatory combustion
* Steady flow velocity distribution
These combustion coefficients may be calculated from models for the spray combus-tion. The REFINE program predicts the damping coefficients for each mode corres-ponding to the operating conditions.
The combustion energy release rate is approximated in the NREC model by an expon-entially decaying function (with axial position). Employing this assumption, thetime averaged energy release rate becomes:
-- -- E -z/u T (24)= p--e 24)v
while the oscillatory energy release rate is represented by:
zz
-.- (r, e, , t -- + -(25)
0 U U UT
R-9353
27
The oscillatory energy content (E) and the oscillatory time delay (T) are related
to the pressure and velocity fluctuations through following combustion coefficients:
u u ~ ur ~ C(u +(6
E= C -z +C e +C -Z+ C +C -z +C, (26)S 2z - - 2r - 3 4
Eu u u p u inj inj
T = C1 -_ + C 6 (27)
P inj
In the original model formulation, droplet vaporization was assumed to be the con-
trolling mechanism for driving an instability, with the vaporization rate beingassumed to depend only on the relative droplet Reynolds number. Recent calcula-
tions (Ref. 43) have shown that this assumption can lead to substantial errors
with high-frequency instabilities.
Method of Evaluating Combustion Coefficients
The mathematical formulation used in the NREC program results in a linear stability
model (i.e., the model formulation and solution are independent of the pressure
amplitude). From experimental data, the stability characteristics of a rocket
engine are known to be dependent upon the instability pressure amplitude. There-
fore, to allow for these nonlinearities to some extent and to analyze rocket enginesusing the NREC program,the combustion coefficients, which appear in the oscillatoryenergy release rate equation, are considered functions of the pressure amplitude.
According to the Rayleigh principle, maximum oscillatory driving effect is. obtainedwhen an unsteady combustion process (energy addition) occurs in phase with,and in
a region of,oscillating pressure. However, the overall combustion process comprisesnumerous localized, and often superimposed, combustion-related processes distri-buted throughout the chamber. Any of these processes may drive or supress a
resonance, depending upon relative location and sensitivity to the local pressurevariation.
A measure of the extent to which the combustion process can reinforce an acousticoscillation is the response factor which is defined so that it is compatible with
the Rayleigh criterion and is related to the local perturbations (Ref. 43). Thenonlinear response factor for an unspecified parameter W is defined as:
27rJo (W7Wp) d(wt)
: (28)w 27r
[ Re (j/)] 2d(wt)
where W is any oscillatory source of mass or energy and:
W = W - W (29)
R-9353
28
The time averaged rate, W, is given by:
2w
W f W d(wt) (30)--- = ( 3 0 )
o o o
For linear analysis of combustor instability, the response factor can be useddirectly to couple the combustion process to the gas dynamics. In the linear case,where all oscillations are sinusoidal, the relationship
fully specifies the coupling. However, when oscillatory pressure levels becomesufficiently large, often at a relative low amplitude, nonlinear effects (wavedistortion) become important. Further, shock wave-type behavior in either thetangential or longitudinal modes has been observed in which the nonlinearity ofthe gas dynamic oscillations is clearly important. To analyze the wave distortionproblem, the oscillatory pressure used in the calculation of the response factorhas been assumed to be described by the form (see Ref. 44):
Re I/p= np l cos (nwt) (31)n
where pl is defined in terms of the peak-to-peak pressure amplitude by (n ):
Pmax - Pmin 2pl (32)= (32)
p 1-p1
For low amplitudes the corresponding wave shape is sinusoidal while for large ampli-tudes the pressure wave shape approaches a steep fronted shock-type form.
Through the use of the response factor defined by Eq. 28, the combustion coeffic-ients for the NREC program can be evaluated as a function of the pressure ampli-tude (Ref. 45).
Evaluation of Combustion Coefficients for Spray Combustion
Theories of droplet combustion are available that may be used to evaluate the ex-tent of coupling between droplet burning rate and local pressure and velocityfluctuations. In general, droplet burning is enhanced by increased turbulencelevels or by periodic directional variations in velocity, because droplets arerelatively heavy and resist following gas streamlines. The overall process iscontrolled largely by heat transfer to the droplet and mass transfer away fromthe droplet, which are, in turn, influenced by the dynamics of the droplet rela-tive to its gaseous environment. The droplet vaporization rate may be expressedas (see Ref. 46):
6p s zk NuHWA g H(33)
VAP 2P£Dd cpv
R-9353
29

z kg NuH Ru Tf P-Pv
1/3 pDd I +* - I1NuH = 2.0 + 0 Pr u - d1 (35)
The equations used to represent the spray combustion are actually for a singlevaporizing material but the properties and energy release profiles that are usedpertain to bipropellant combustion.
The droplet mass continuity equation is:
d-( u )(36). d
VAP dz s zd) (36)
Substituting Eq. 33into Eq. 36 and integrating yields the droplet density as afunction of location. From this density distribution, the energy release rate perunit volume may be obtained, i.e.:
z
-E dz/uzT-fo zv= . e (37)V T
where the time delay and the energy content are:
2pD cPt Dd pv (38)6 z k NuH
g
Ed(z=0)E H AHCOMB (39)
g
Equations 37, 38, and 39 may be expanded into time averaged and oscillatoryparts. The first of these is the same as that discussed previously. The latterequations become:
+ T' z z NuHO 1 NuHT T- 0 1 z (40)
0 0 z Nu H z Nu H
T+? E u= 1 E (41)
o o u p
R-9353
30
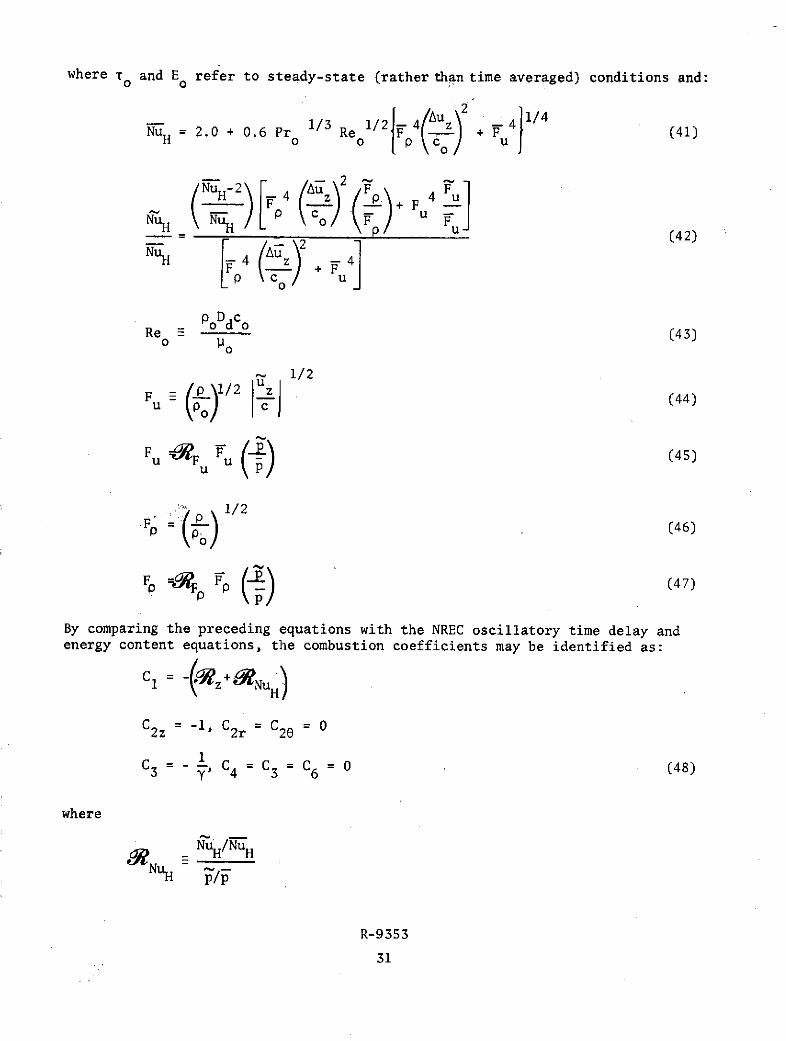
where T and E refer to steady-state (rather than time averaged) conditions and:S10
~~~1/3 Re1/2 F- 4 Uz +-4 (1Nu = 2.0 + 0.6 Pr 1/3 Re + 1 (41)H o o c u
2)
uH=H \"/ C-oz \F/ u F (42)
R - P°Dd~ °
,,, 1/2
Nu - /2 4 u F 4F
F +F
NuH NuH (4- o) u
(42)
By comparing the preceding equations with the NREC oscillatory time delay andenergy content equations, the combustion coefficients may be identified as:
2z = 2r 20
(C co u
p oDdco
3 =Re - , C4 = C =C 0 (48)3 6O
where
Fu . 1- 1/2 ( 4
F = 1/2
(4
Nu ,/ u
R- 9353
131
C3=--F4= 3=CP (47)
l NuH/NuH)
NuH
R-9353
31

The heat blockage term, z shown in the equations above is related to the combus-tion gas and liquid vapor properties by Eq. 34. This blockage term depends onthe oscillatory droplet temperature because the vapor pressure (p ) at the dropletsurface is related to the droplet temperature. For a single droplet, the heatingrate may be described by (see Ref. 46):
dTd 6kf z NuH Tg -Td AiV2=7tP (49)
=Dd Pcpd e-1 v(49)
Assuming that, at steady-state conditions,
-( - 0 (50)
and
S('p) (51)
etc., for the other variables, the time averaged solution to the preceding equa-tions gives:
S= z = kn 1 + cpv (Tg -Td)/Hvj (52)
and the oscillatory solution gives:
z =-z 2 (53)1 + Ac2
where
Svo I n (-o0z Po-Pvo pvo
40z e c ~ (T-TdA = (Zo)2 d \ Tdo
and
S= d £n Pv/d £n Td
Examination of the real part of the oscillatory blockage term indicates that thereal part of the response factor corresponding to this term will always be negativeand that its magnitude will increase as the frequency of oscillation increases.Combining the above results with
- NuH (54)
R-9353
32
and noting that the response factor for the Nusselt number is always positive(Ref. 43) lead to the conclusion that the response factor for the time delay willbe negative for low frequencies and positive for high frequencies.
The foregoing equations have been used to calculate the combustion-coefficents.Based on information given in Ref. 47, 8 has been assumed to be equal to 1.5. Theresponse factor has been evaluated with the velocity being assumed to be describedby:
C I pn cos (nwt-e) (55)
n
where 6 is the phase angle between the velocity and pressure. When e is zero, thevelocity and pressure are in phase, and traveling wave properties are simulated.For standing acoustic modes, the velocity and pressure are out of phase, whichcorresponds to e = 90 degrees.
The steady-state time delay (zo) has been determined by curvefitting results from
the steady-state combustion model calculations.
NREC MODEL CALCULATIONS
The NREC model was used to predict the stability characteristics corresponding tosome of the same engine conditions that were analyzed with the Priem-type model.The combustion coefficients were calculated as described above. No acoustic cav-ity effects were considered at this stage. The nozzle admittances were calculatedseparately and input to the program.
Nozzle admittances were calculated with an adaptation of the computer program de-scribed by Bell and Zinn (Ref. 48) which is based on the Crocco theory. Typicalcalculated admittance curves are shown in Fig. 7, which pertain to the first tan-gential mode and first tangential/longitudinally coupled modes. The real part ofthe predicted nozzle admittance is positive at high frequencies but negative atlow frequencies. The negative real components of the admittance implies a drivingeffect which, presumably arises from a conversion of steady-flow energy into oscil-latory energy. The nozzle also influences stability through the steady flow, whichcauses a convection of acoustic energy out of the chamber. Because of this con-vective effect, the net effect of the nozzle is expected to be a stabilizing oneeven at low frequencies.
The importance of allowing for oscillations in droplet temperature was investigatedto determine whether or not this effect should be included in subsequent calculations.The effect arises through the heat blockage factor, z, discussed earlier. Stabil-ity calculations were made for two chamber sizes. The results are shown in Fig. 8 ,which show the variation of predicted logarithmic decrements (damping coefficientdivided by frequency) with the instability amplitude (peak to peak). Negativelogarithmic decrements correspond to growing oscillations or unstable conditions.Apparently the importance of this droplet temperature effect is greatest at highfrequencies (i.e., the 2.0-inch-radius chamber) and at this condition the effortis significant. Therefore, the effect was included in all subsequent calculations.
R-9353
33
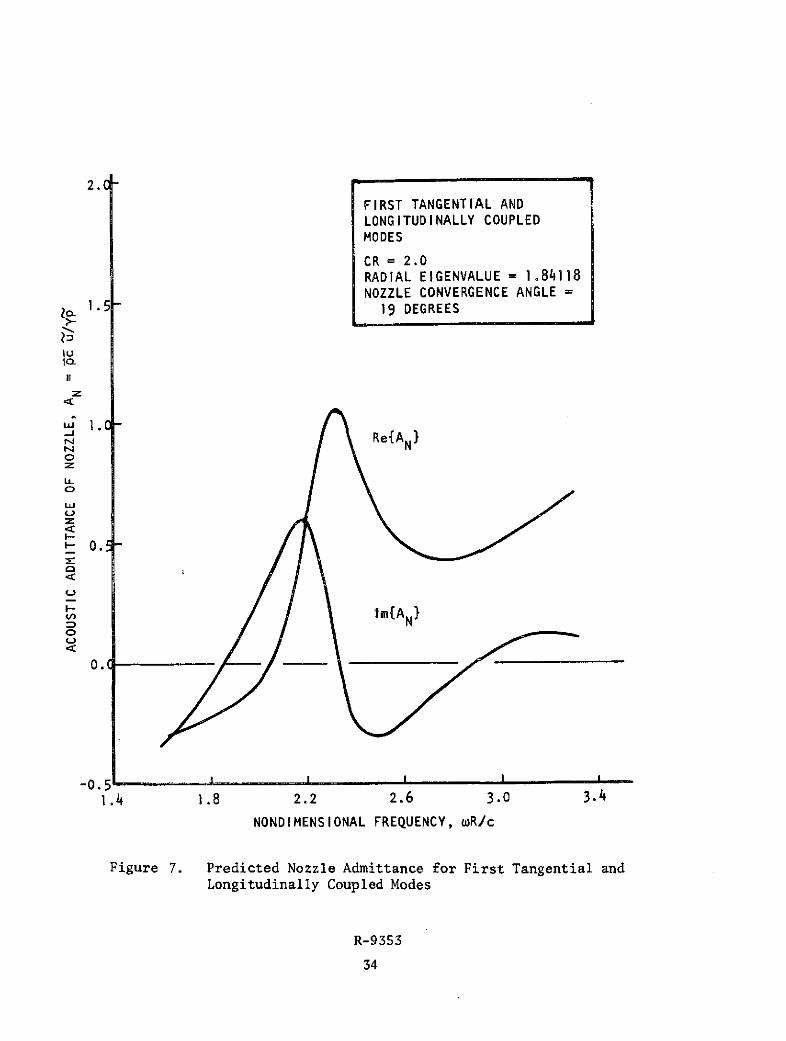
2.C
FIRST TANGENTIAL ANDLONGITUDINALLY COUPLEDMODES
CR = 2.0RADIAL EIGENVALUE = 1.84118NOZZLE CONVERGENCE ANGLE =
S1.5 - 19 DEGREES
IU
1.0-
II
z
Re{A NNN
:Tm{AN
ON
0.(
h
ILl
I.-.
I- , -
0.
-0.5 I I I I I
1.4 1.8 2.2 2.6 3.0 3.4
NONDIMENSIONAL FREQUENCY, wR/c
Figure 7. Predicted Nozzle Admittance for First Tangential andLongitudinally Coupled Modes
R-9353
34
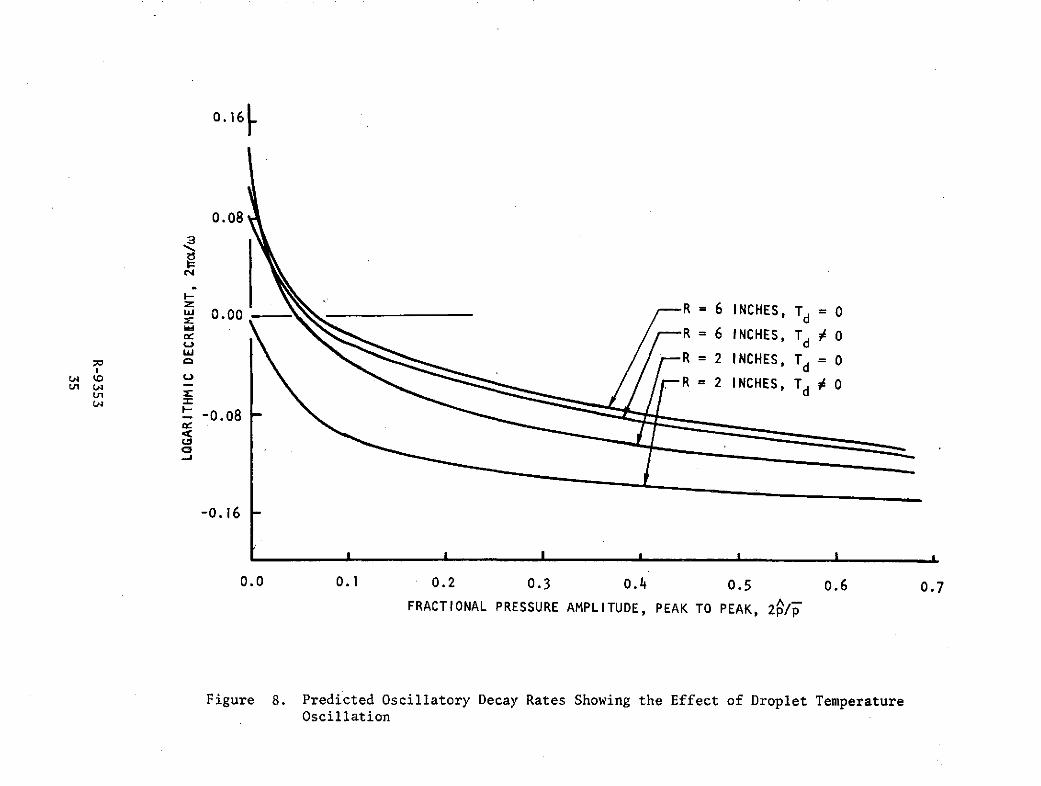
0.16.
0.08
3
z __----R = 6 INCHES, Td = 0I 0.00
R = 6 INCHES, T 4 0dR = 2 INCHES, Td = 0
t W /R = 2 INCHES, T 4 0Li d
-0.08 -
-0.16
I I I I I I I
0.0 0.1 0.2 0.3 0.4 0.5 0.6 0.7A-FRACTIONAL PRESSURE AMPLITUDE, PEAK TO PEAK, 2p/p
Figure 8. Predicted Oscillatory Decay Rates Showing the Effect of Droplet TemperatureOscillation
Results from a set of stability calculations for the first tangential mode in
three chamber sizes and with two droplet sizes are shown in Fig. 9 and 10. In
each case a critical amplitude is shown above which an instability is predicted
the critical amplitude being that corresponding to a logarithmic decrement of zero.
This critical amplitude, on a zero-to-peak rather than a peak-to-peak basis,corresponds to the Priem stability index.
Results from the NREC model analysis are summarized in Fig. 11 through 13, which
show the variation of this critical pressure amplitude (zero-to-peak) with drop-
size, dropsize ratio, and chamber radius. Corresponding curves from the Priem-
type analysis are also shown. Some of the results from the NREC model analysis
show a maximum stability index with increasing dropsize. This maximum arises
because the time average combustion effeciency drops with increasing dropsize,which increases the available energy and worsens stability. The reduction in
efficiency causes E, the energy content (Eq. 34), to increase, thus making more
energy available for driving an instability. This effect will not occur if the
combustion efficiency is 100 percent. It is not considered in the Priem-type
analysis as usually done. The results show a worsening of stability with increas-
ing chamber radius and, generally, an improvement with increasing dropsize.
The comparison of results from the NREC model analysis with those from the Priem-
type analysis (Fig. 11 through 13) shows substantial differences in the magnitude
of the critical pressure amplitude corresponding to the stability limit. More-
over, as noted above, the Priem-type results do not show the maximum that appears
in the NREC-type results. However, there are also major differences in the
methods of analysis used in these models and, therefore, substantial differences
in the results are not surprising. Nonetheless, the results show qualitativelysimilar trends, which is encouraging.
R-9353
36
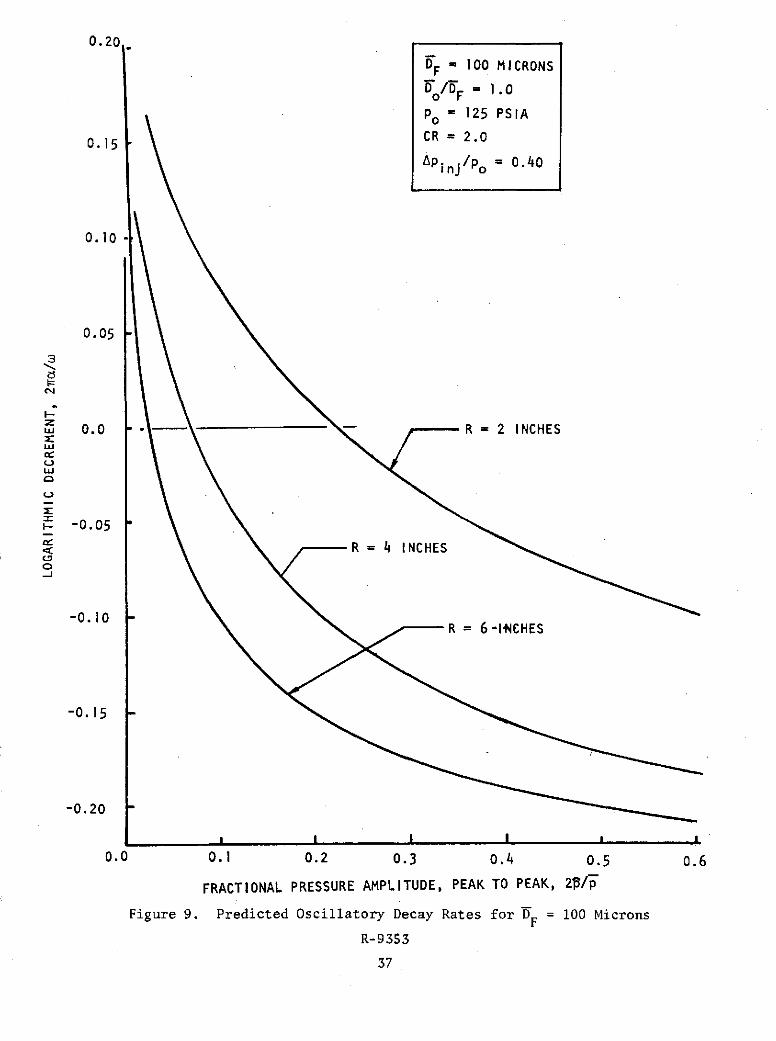
0.20
DF = 100 MICRONS
o/bF 1 .0p = 125 PSIA
0.15 CR = 2.0
Ap. ./p = 0.40i 0
0.10
0.05
3
0.0 *--R = 2 INCHES
-0.05
< R = 4 INCHES
w 0.10-C)0
-0.10 R = 6 -14CHES
-0.15
-0.20
p I p I p p
0.0 0.1 0.2 0.3 0.4 0.5 0.6
FRACTIONAL PRESSURE AMPLITUDE, PEAK TO PEAK, 2p/p
Figure 9. Predicted Oscillatory Decay Rates for DF = 100 Microns
R-9353
37
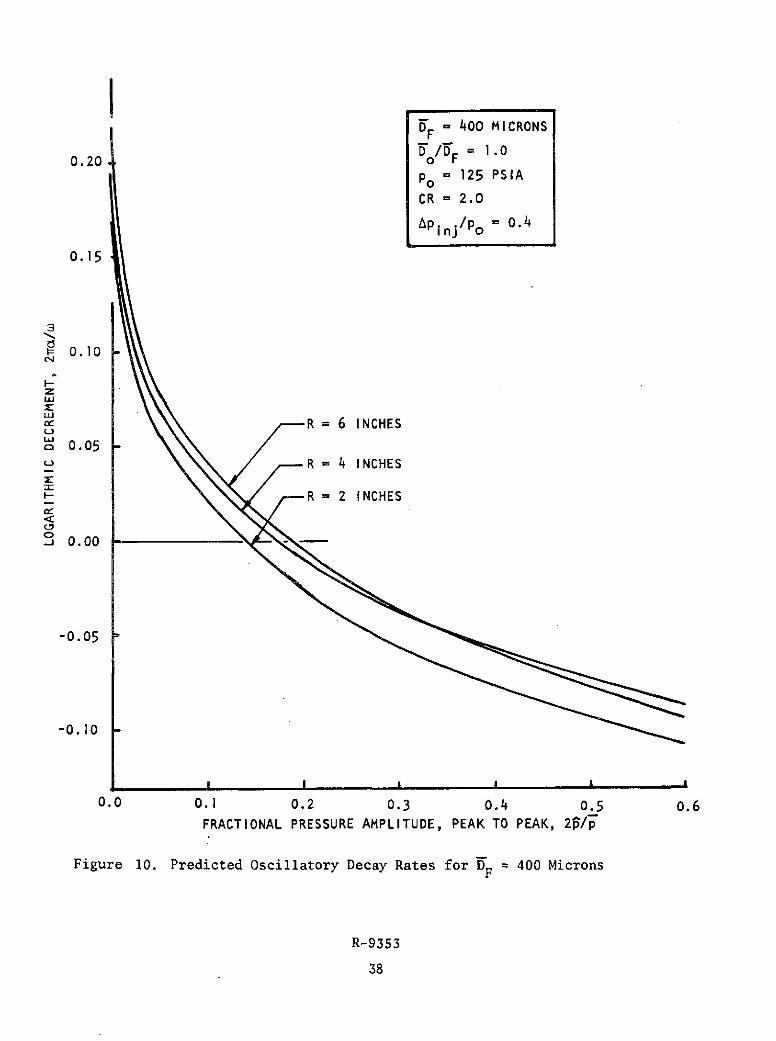
DF 400oo MICRONS
D/D = 1.00.20 oF
po = 125 PSIA
CR = 2.0
App. .inj/p = 0.4
0.15
0.10
w
R 6 INCHESL)
o 0.05R = 4 INCHES
R = 2 INCHESE
C)0
-J 0.00
-0.05
-0.10
i I I I I I
0.0 0.1 0.2 0.3 0.4 0.5 0.6
FRACTIONAL PRESSURE AMPLITUDE, PEAK TO PEAK, 26/p
Figure 10. Predicted Oscillatory Decay Rates for DF = 400 Microns
R-9353
38
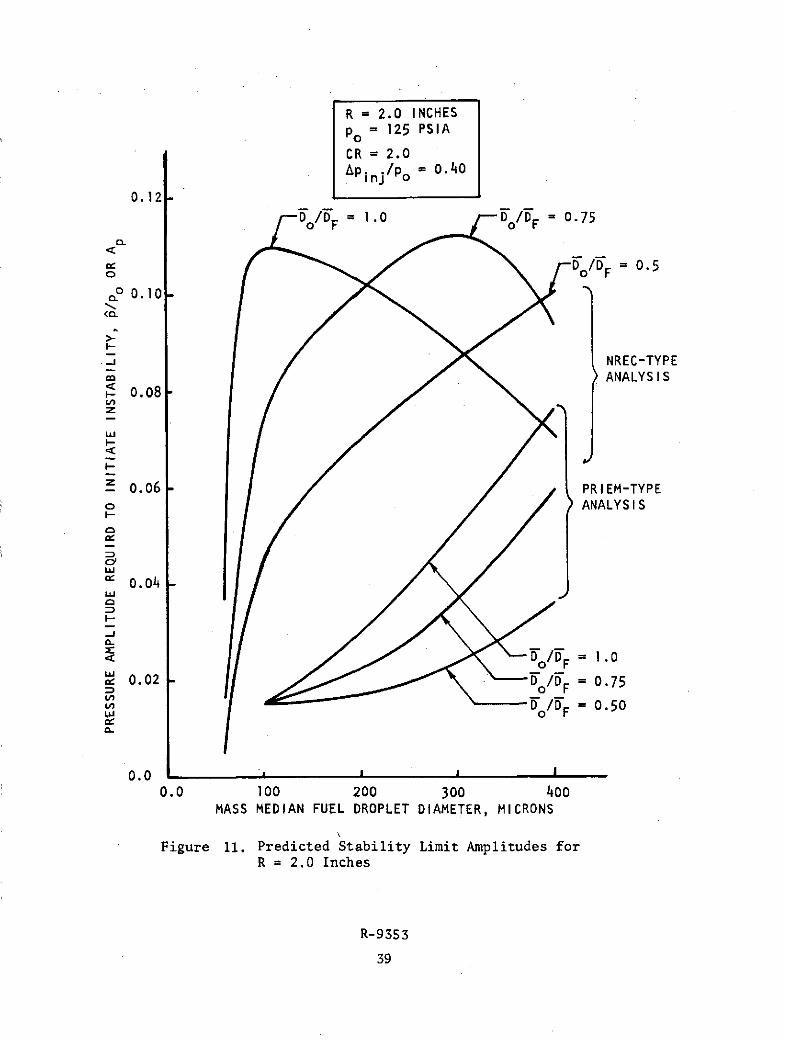
R = 2.0 INCHESpo = 125 PSIA
CR= 2.0Ap inj/Po = 0.40
0.12
D /D = .0-'o/F = 0.75
0D 0/D = 0.5o oF
0 0.10 -
I-
NREC-TYPE
<" ANALYSIS- 0.08
Cnz
wi
I-
S0.06 PRIEM-TYPEo ANALYSIS
-
w
ZE 0.02 D 0/D F= 0.75o F
S0.0 4
R = 2.0 Inches
R-9353
39
,,, 0.02 DID = 0.75
U, Do/DF = 0.50
0.0 , p I
0. 0 100 200 300 400
MASS MEDIAN FUEL DROPLET DIAMETER, MICRONS
\Figure 1i. Predicted Stability Limit Amplitudes for
R = 2.0 Inches
R- 9353
39
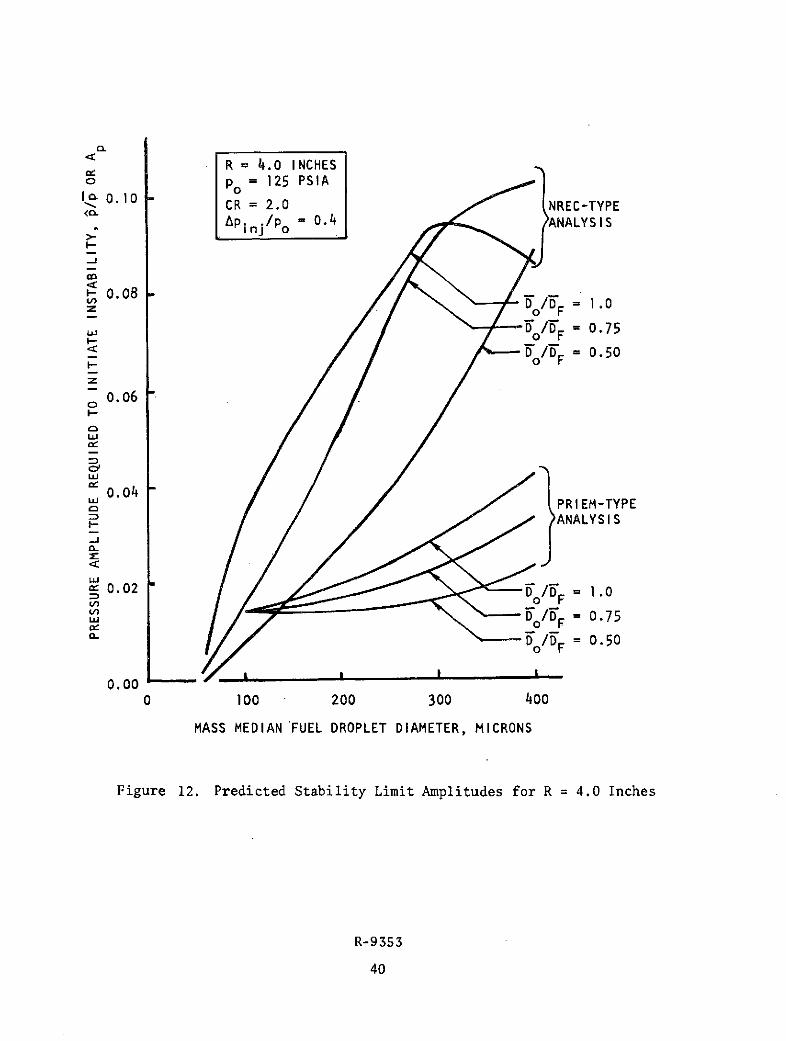
R 4.0 INCHESo p = 125 PSIA
-- 0.10 p" CR = 2.0 NREC-TYPE
Ap. ./p = 0.4 ANALYSIS
co
-0.08 --CA
0. 0Do5F = 1.0
,., /DF = 0.75
<_ i'/TF = 0.500F
C) 0.06C
Li
" 0.04PRIEM-TYPEANALYSIS
Li
c 0.02 = 10T / = 0.75a Do/DF = 0.50
0.00 I I I
0 100 200 300 400
MASS MEDIAN 'FUEL DROPLET DIAMETER, MICRONS
Figure 12. Predicted Stability Limit Amplitudes for R = 4.0 Inches
R-9353
40
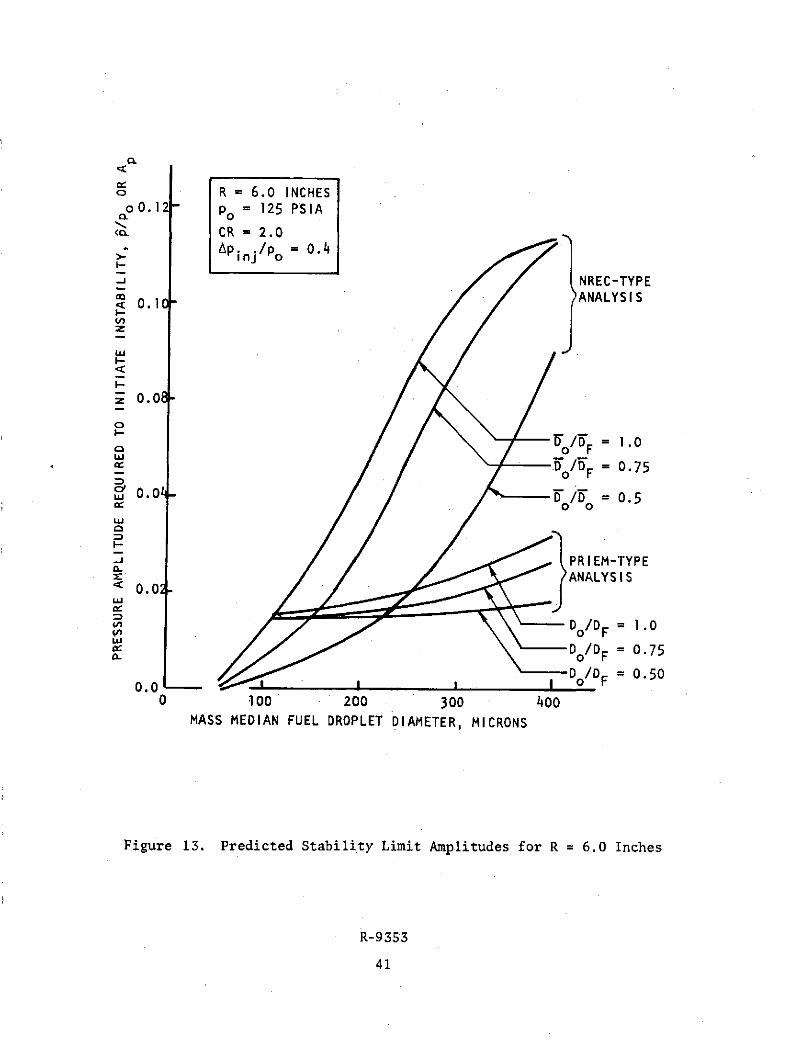
CL
o R = 6.0 INCHESoO.12 po = 125 PSIA
CL
CR = 2.0Ap. .inj/p = 0.4
NREC-TYPE
c . ANALYSIS< 0.1C-V-z
w
S0./o = 0.75o F
0.04 Do/D = 0.50 0
w
PRIEM-TYPEEANALYSIS
0.01
D /DF = 1.0
a. o F
D /D = 0.500.0 -I I I I F
0 100 200 300 400MASS MEDIAN FUEL DROPLET DIAMETER, MICRONS
Figure 13. Predicted Stability Limit Amplitudes for R = 6.0 Inches
R-9353
41

GENERALIZED CAVITY DAMPING MODEL
A generalized cavity damping model, based on the quasi-linear approach described
earlier, has been formulated and the preliminary development completed. With
this model, approximate solutions are obtained to restrictive forms of the inhomo-
geneous wave equation and boundary conditions (Eq. 16 and 17). The combustion
source terms were represented in the manner described previously for the NREC
model. For the vaporization limited process, the source may be written as:
-E e _Jd7z +d_
=p s - s
p p u u UT
u zuz Z z (t z ( d(
+ - t- -- + )(56)
u 0 U U T
where
= e+ This expression replaces all of the source terms showns z N
in Eq. 16, 1.e., = R '/C
Development of this cavity damping model has been approached on an incrementalbasis with individual effects being added one at a time. At present, three kindsof effects have been introduced: (1) a uniform steady flow, (2) a nozzle admit-
tance, and (3) pressure-coupled combustion response. However, the steady flowcontribution at the acoustic cavity has been neglected. (This is probably smallfor a cavity located adjacent to the injector.) The effects of gradients in thesteady flow, velocity coupled combustion, droplet drag, and steady flow at thecavity must be added at a later time. Therefore, at present the generalizedcavity model is based on solution of the following inhomogeneous wave equation:
(V2 + k ) p = 2jkM - 2 paz
z-z'd 1
- h° ez/ - J '(r, e, z') e X ' - S(r; - (57)
where a time dependence of the form ejP t has been assumed ( = +ja). The first
two terms on the right-hand side of Eq.57 correspond to the uniform steady flow inthe axial direction, where M = U/. The last expression arises from the pressure-coupled combustion source terms, where:
h - pE
andX. = u T
R-9353
42
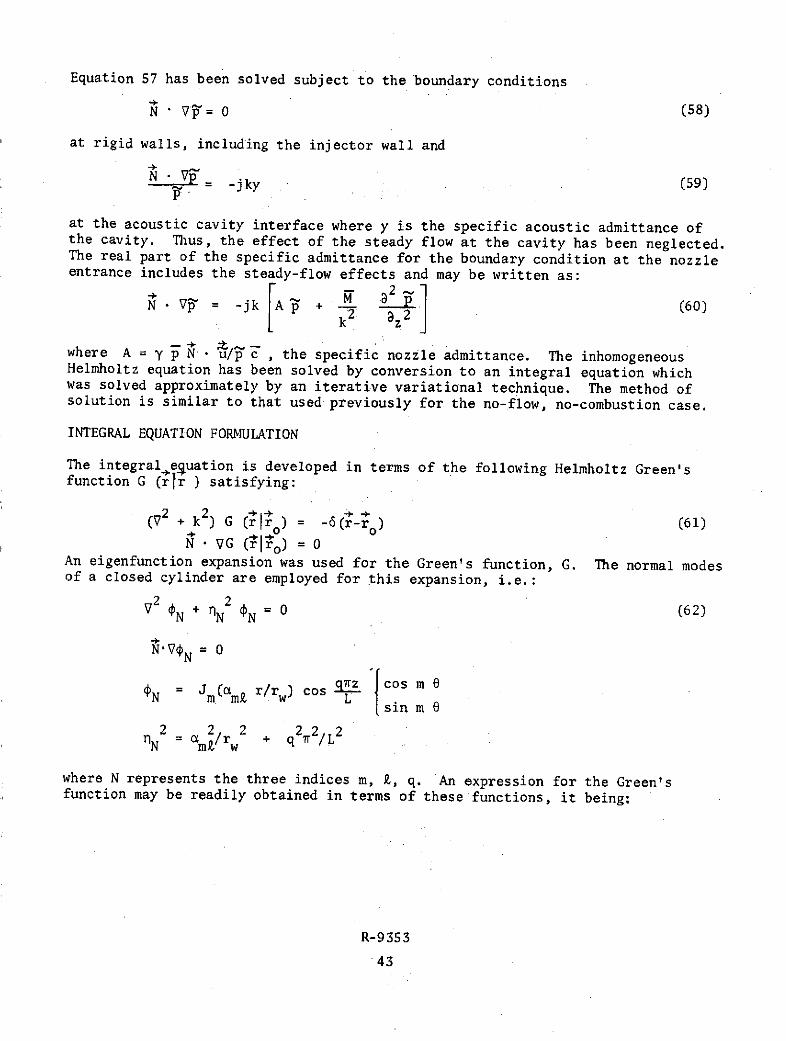
Equation 57 has been solved subject to the boundary conditions
N • V'= o (58)
at rigid walls, including the injector wall and
_N *vpN Vp= -jky (59)
at the acoustic cavity interface where y is the specific acoustic admittance ofthe cavity. Thus, the effect of the steady flow at the cavity has been neglected.The real part of the specific admittance for the boundary condition at the nozzleentrance includes the steady-flow effects and may be written as:
N V = -jk A p + 2 (60)
where A = y pN /p c , the specific nozzle admittance. The inhomogeneousHelmholtz equation has been solved by conversion to an integral equation whichwas solved approximately by an iterative variational technique. The method ofsolution is similar to that used previously for the no-flow, no-combustion case.
INTEGRAL EQUATION FORMULATION
The integral ejuation is developed in terms of the following Helmholtz Green'sfunction G (rfir ) satisfying:
(V + k2 ) G (r ) = -6(r-r) (61)
N VG (r ro) = 0An eigenfunction expansion was used for the Green's function, G. The normal modesof a closed cylinder are employed for this expansion, i.e.:
V2 N + N2 N = 0 (62)
N'VN = 0
= J (a r/rw) cos rz cos m em L sin m e
2 2 2 22 2N = a /r + q /L
where N represents the three indices m, Z, q. An expression for the Green'sfunction may be readily obtained in terms of these functions, it being:
R-9353
43
eN (r) N(ro)G(rI ) = AN (nN 2 - (63)
AN TN k 2)
A EA A A() 2((r )dVN m mi q N
2x
(0) _ f de d {cos m T m 60
m o sinm2 27 m=O (cos m4 only)
r 2 2A~r f w 2 am -m
A = r dr J 2 m2 - m ( 2m o m 9 2 m m)
A(L 2 qTrz L/2 q 0
(z) = dz cos L {2 qhq f L =
0 L q =0
Through use of this Green's function, the inhomogeneous wave equation and boundary
condition may be converted to an integral equation (Ref. 49, page 321).
p(r) = G(rr 0 ) S(r; P dVo +
+ fG(rlro) N V2(ro) dS° (64)
where S(ro; 1) represents the inhomogeneous term in the wave equation, theN - Vp term is given by the boundary conditions, and the vector sign (-) has beensuppressed on r and r for simplicity. This homogeneous integral is solved by aniterative-variational technique.
ITERATIVE-VARIATIONAL SOLUTION TECHNIQUE
The solution technique is similar to that used previously (Ref.50). Frequentlywith equations of this form, the integrals may be evaluated with an initial approx-imation for pressure to achieve an improved approximation for the pressure. There-fore, an iteration form of the expression is written as:
~(i+1) + (ip (r ) = fG(rlro) S(ro; -M) dV +
G(r 0r) N* V ) dS (6S)
R-9353
44
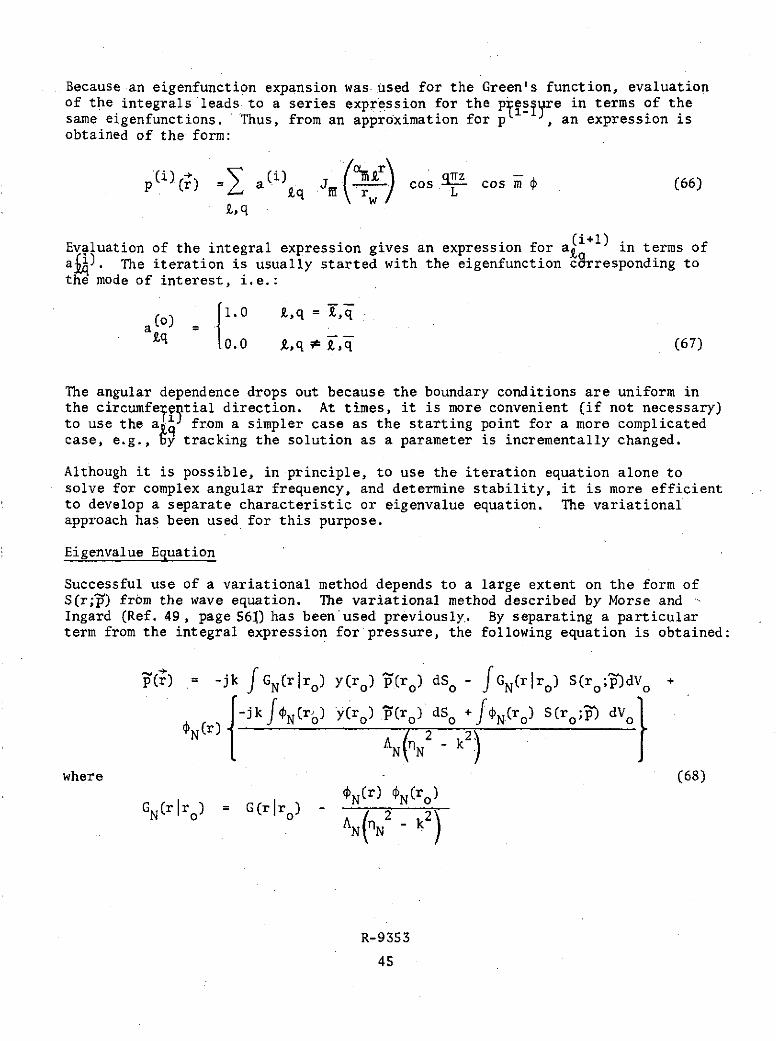
Because an eigenfunction expansion was used for the Green's function, evaluationof the integrals leads to a series expression for the pes re in terms of thesame eigenfunctions. Thus, from an approximation for p , an expression isobtained of the form:
p(i)(r) = a(i) q I cos L cos m (66)Z,q
(i+1)Evaluation of the integral expression gives an expression for a(i +l) in terms ofaA). The iteration is usually started with the eigenfunction c8rresponding tothe mode of interest, i.e.:
(O) 1.0 £,q = £,qa =1q 0.0 j,q ,q (67)
The angular dependence drops out because the boundary conditions are uniform inthe circumfeegitial direction. At times, it is more convenient (if not necessary)to use the a$ from a simpler case as the starting point for a more complicatedcase, e.g., by tracking the solution as a parameter is incrementally changed.
Although it is possible, in principle, to use the iteration equation alone tosolve for complex angular frequency, and determine stability, it is more efficientto develop a separate characteristic or eigenvalue equation. The variationalapproach has been used for this purpose.
Eigenvalue Equation
Successful use of a variational method depends to a large extent on the form ofS(r;P) from the wave equation. The variational method described by Morse and -Ingard (Ref. 49, page 561) has been used previously. By separating a particularterm from the integral expression for pressure, the following equation is obtained:
p(r) = -jk fGN(rlr o ) y(ro) (r o ) dS - GN(rr) S(r ;)dV
{-jkf N(r) y(r 0 ) (r ) dS 0 +f N(ro) S(ro;) dVo}
N(r) AN(tN2 - k2 )
where (68)N( r ) $N(ro )
GN(rjr o ) = G(rjr ) -N (r)
AN (N - k2 )
R-9353
45

Because of the homogeneous form of the equation, an amplitude coefficient can be
chosen for ' such that the term in parentheses ( ) equals unity. Without changingthe notation for pressure, this choice of amplitude gives:
f(r) = $N(r) - jk fGN(rro) Y(r) (r )dS0 - fGN(r Iro) S(ro;)dVo(69)
AN(nN 2 - k2 ) = -jkf N(r o) y(r 0 ) (r )dS 0 +f (ro) S(ro;0)dV (70)
This expression for ' clearly approaches the normal mode N as y and S (r; T)approach zero. Following Morse and Ingard by analogy, a functional is developedby multiplying Eq. 69 by -jkfy(r)p(r)dS and then by fS(r;p) dV and adding theresultant expressions to Eq. 70 to obtain:
A N2 k 2)= 2 JN(ro)[-jk y(ro) p(r )]dSo + fN(ro) S(ro;)dV -
f'(ro) [-jk -(ro)]dSo + [-jk y(r) -(ro)] fG(r Iro) L-jk y(r o ) ;(ro)]dV dV +
[-jk y(r ) ](r )]fG(rlro) S(ro ; )dVodS - S(r;p ) -(r)dV +
fSc(r;p) f GN(rro)[jk y(ro) '(ro)] dSodV + fS(r;f) G(rjr ) S(ro;')dVodV
(71)By varying this equation, a characteristic equation may be obtained:
6[AN N2 - k2)] =-2 6S(r;-) jN(r) -jkfGN(rr o) y(r ) ?(r )dS -
fGN(rjr o) S(roP)dV -fS(r;p) 6dV + -(r) 6S(r;Pd (72)
If the last two terms cancel, Eq. 72 is a variational implying EJ. 65. However,the last to terms cancel only for the special cases S = '(r) h e-z/ X and--2 42 73z from the wave equation (Eq. 57) the latter case demanding restrictionson 6p(r). The latter term is also usually dropped by order of magnitude arguments.
If only the term S (r;p) = K h e -z/ is retained, an equation similar to thatused previously is obtained (Ref. 50). With an approximation for pressure of theform - = A(i), the variation may be performed to obtain:
f1-jk y(r) ?P (r)I (r ) - fG(r r 0 -jk y(r ()(ro)]dSo0 p 0 0
fG(rlr ) S (r ;P' )dV JdS + fS (r; P ) p(i)(r) -
fG(rlr o) [-jk y(r) ) (ro)]dS - fG(r ro) S(r;('i))dVo dV 0 (73)
R-9353
46
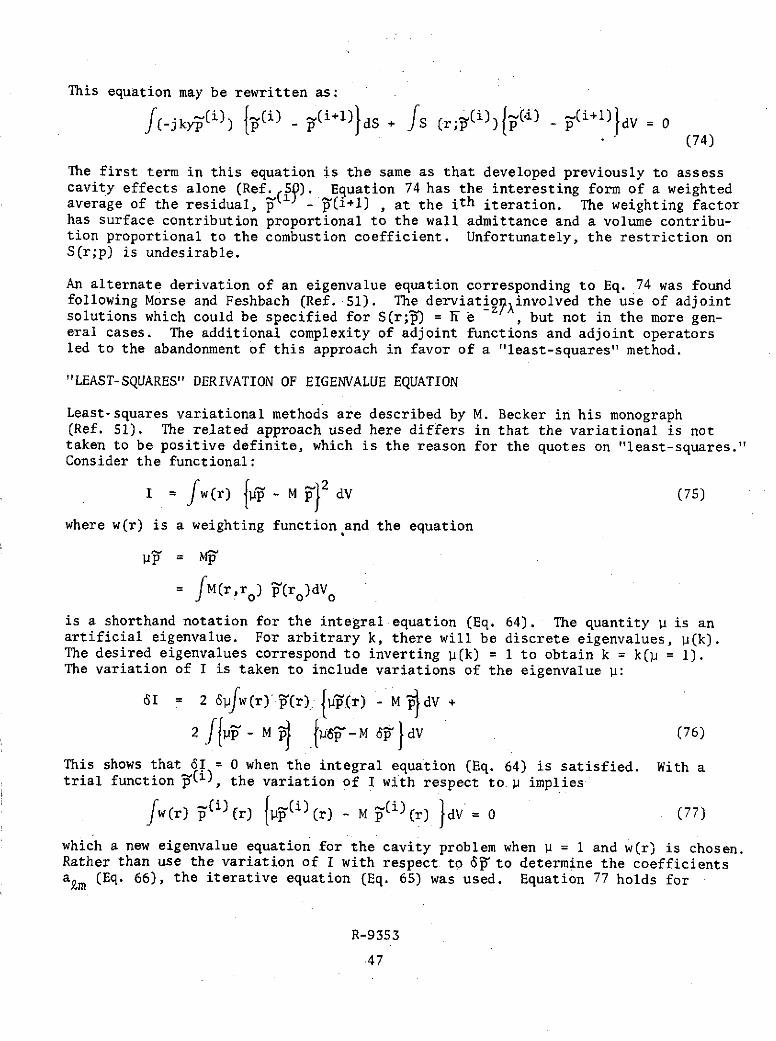
This equation may be rewritten as:
(-jky (i)) p(i) (i+1) dS + fS (r)(i) (4i) ( 1 dV = 0(74)
The first term in this equation is the same as that developed previously to assesscavity effects alone (Ref. 5). Equation 74 has the interesting form of a weightedaverage of the residual, pf - '(i+l) , at the ith iteration. The weighting factorhas surface contribution proportional to the wall admittance and a volume contribu-tion proportional to the combustion coefficient. Unfortunately, the restriction onS(r;p) is undesirable.
An alternate derivation of an eigenvalue equation corresponding to Eq. 74 was foundfollowing Morse and Feshbach (Ref. 51). The derviation involved the use of adjointsolutions which could be specified for S(r;p) = e - , but not in the more gen-eral cases. The additional complexity of adjoint functions and adjoint operatorsled to the abandonment of this approach in favor of a "least-squares" method.
"LEAST-SQUARES" DERIVATION OF EIGENVALUE EQUATION
Least-squares variational methods are described by M. Becker in his monograph(Ref. 51). The related approach used here differs in that the variational is nottaken to be positive definite, which is the reason for the quotes on "least-squares."Consider the functional:
I = fw (r) ft - M J 2 dV (75)
where w(r) is a weighting function and the equation
v p = -
= fM(r,ro) '(ro)dV o
is a shorthand notation for the integral equation (Eq. 64). The quantity P is anartificial eigenvalue. For arbitrary k, there will be discrete eigenvalues, p(k).The desired eigenvalues correspond to inverting p(k) = 1 to obtain k = k(i = 1).The variation of I is taken to include variations of the eigenvalue p:
61 = 2 6Sjw(r)'P (r) - {1(r) - M l dV +
2 p'- M 6p - M 69 dV (76)
This shows that 61 = 0 when the integral equation (Eq. 64) is satisfied. With atrial function (i), the variation of I with respect to i implies
w(r) ).i)(r) _(i) (r) - M (i)(r) JdV = 0 (77)
which a new eigenvalue equation for the cavity problem when P = 1 and w(r) is chosen.Rather than use the variation of I with respect to 6' to determine the coefficientsa£m (Eq. 66), the iterative equation (Eq. 65) was used. Equation 77 holds for
R-9353
47
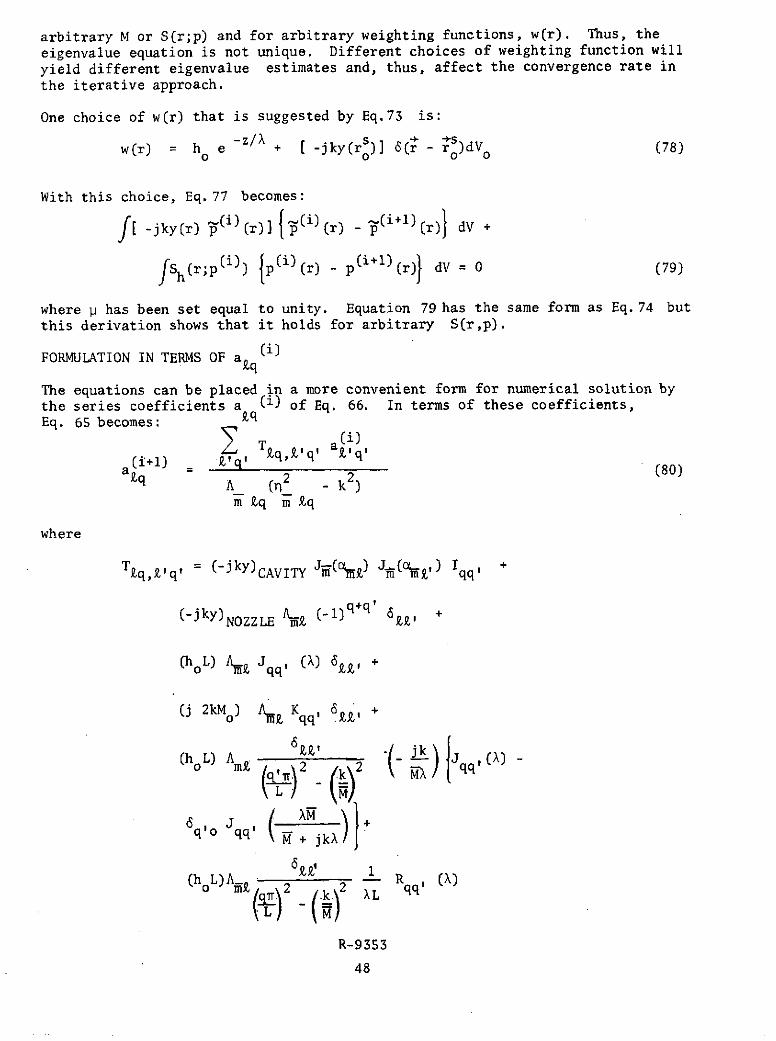
arbitrary M or S(r;p) and for arbitrary weighting functions, w(r). Thus, theeigenvalue equation is not unique. Different choices of weighting function will
yield different eigenvalue estimates and, thus, affect the convergence rate in
the iterative approach.
One choice of w(r) that is suggested by Eq.73 is:
-z/X s[-krsw(r) = h e + [ -jky(r)] 6('r - 'r)dV (78)
With this choice, Eq. 77 becomes:
f[ -jky(r) " ) (r) (i) (r)- (i+) (r) dV +
fSh(r;p(i)) Ip(i)(r) - p(i+l)(r) dV = 0 (79)
where p has been set equal to unity. Equation 79 has the same form as Eq.74 butthis derivation shows that it holds for arbitrary S(r,p).
(i)FORMULATION IN TERMS OF aq
kq
The equations can be placed in a more convenient form for numerical solution bythe series coefficients a (i) of Eq. 66. In terms of these coefficients,Eq. 65 becomes:
a(i)(i+l) T'q' q aq
a =qkq V (80)aq - A (n2 - k2) (8)
m kq m kq
where
Tq,,q, = (-jky)CAVITY Jf(cf) Jf(O,) 1qq' +
(-jky)NOZZLE Am (-1)q+q 6 +
(h L) A Jqq , (X) 6 +0 mt 2 2 q
(j 2kMJ) A Kqq, +
(h L)A R ,l ()o t k2 AL
L m2 (a)2- (k) XL qq
q'oJqq'\ + jkX!)
( 0L)AM , 2 -- R q (X)
LX
R-9353
48

and
y = A (q ) 2NOZZLE = A + L
o f Lz q Z cos Lqq L L
wS
where w denotes the slot width and:s
J () = L e -z/X cos q- cos q'z dzqq J L L L
L
0
R ,(A) = -q r e -z/ cos s7T- sin q-wz dzqq 0 L L L
O
Note that R (X = ) = Kq ,. The terms in Eq. 80 can be associated with thecorrespondiR5 terms in Eq. 5 via the coefficients, q, M, T, etc. The last two(h L) expressions correspond to the combustion-convection integral term inEq. 57. These two terms must be dropped in the computer program if the steadyflow M = 0 to avoid division by zero in the program. Analytically, these termsvanish when M = 0.0.
This eigenvalue equation (Eq. 79) can be rearranged by direct substitution toobtain:
(i)T(M=0) {a(i) - a(i+l) 0 (81)k q,'q' aq q,'q ,q £'q' a ,qt (81)
where the notation "M = 0" denotes that the steady flow terms have been deletedfrom T. , , in Eq. 80. The nozzle admittance term was retained. Equation 81holds e4n hen M 9 0, but when M = 0, it can be rewritten as:
Ar Aq(T q- k2) a ( ) {ai+l) - a i+2) = 0 (82)
The essence of Eq. 82 is the residual a(i) - a (i+2), which is weighted by a (i)and some additional factors. Equation b was ued as the basis for the computerprogram although the derivation is not rigorous for the case M 96 0. However,various modifications of Eq. 82 were tried successfully, e.g.:
a(i) a(i+l) - (i+2) 0 (83)kq Zq X ,
R-9353
49
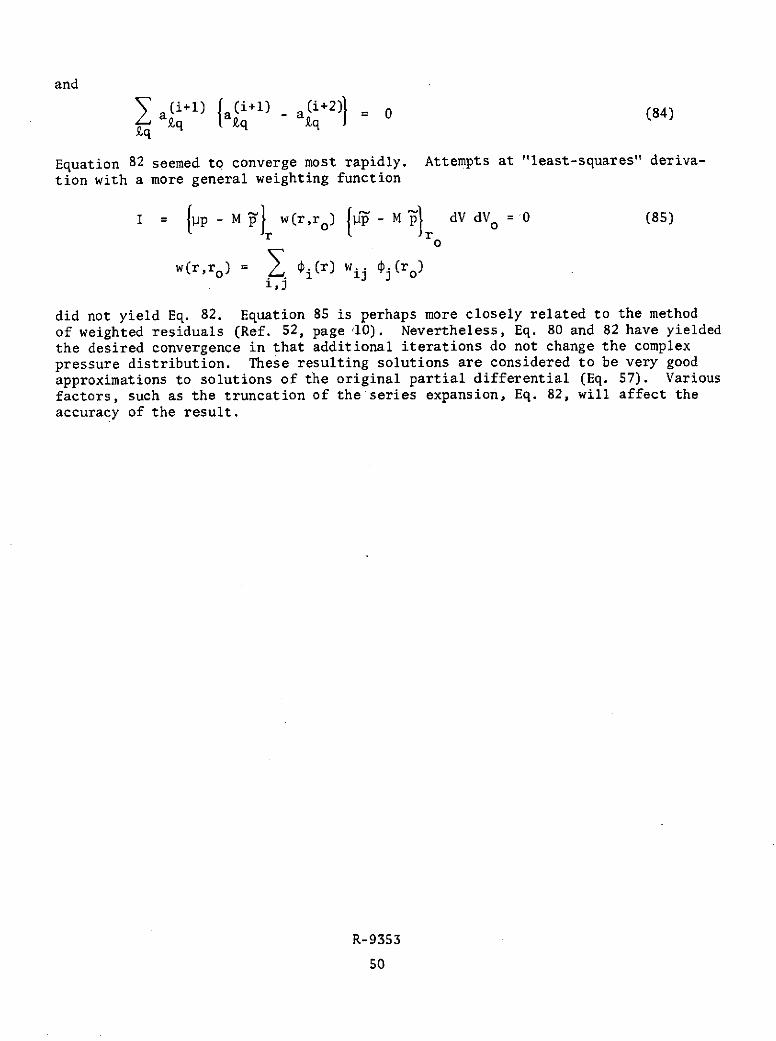
and
a(i+1) a(i+l) - a U+2) = 0 (84)kq q kq 9,q
Equation 82 seemed to converge most rapidly. Attempts at "least-squares" deriva-
tion with a more general weighting function
I = pp- M -r w(r,r°) I - M r dV dVo = 0 (85)
0
w(r,ro) = (r) wij i (ro)1,)
did not yield Eq. 82. Equation 85 is perhaps more closely related to the method
of weighted residuals (Ref. 52, page 10). Nevertheless, Eq. 80 and 82 have yielded
the desired convergence in that additional iterations do not change the complex
pressure distribution. These resulting solutions are considered to be very goodapproximations to solutions of the original partial differential (Eq. 57). Various
factors, such as the truncation of the series expansion, Eq. 82, will affect the
accuracy of the result.
R-9353
50
COMPUTER RESULTS
A computer program was developed to solve the foregoing equations and was adaptedfrom the previously developed cavity damping model. The computer subroutine usedto calculate to acoustic impedance of the acoustic cavity was used without change.At present, the program is only capable of analyzing the first-tangential model,which was done to facilitate model development. Sufficient progress has been madeto allow preliminary definition of the characteristics of the model predictions,but additional work is needed to generalize the model, fully characterize the pre-dictions, and relate the model results to measured stability results.
The computer program has been checked to a large extent by comparison of computa-tional results with analytical results from analytically solvable limiting cases.Also, comparisons have been made with results obtained with the previously developedmodel suppressing the new contributions in the generalized model. The two modelsare necessarily somewhat different because of the volume contribution included inthe new model.
As noted previously, the model was developed and checked on an incremental basis.
The results are discussed accordingly.
Acoustic Cavity
A comparison of results from the previous cavity model and from the generalizedshows that they are essentially identical, although different series expressionsand methods of calculation have been used. Some typical results are shown inFig. 14.
As shown in Fig. 14, the mode splitting obtained with the previous model was alsopredicted with the generalized model. With the acoustic cavity, two modes areobtained in place of the normal first-tangential mode. The lower frequency modeapproaches the normal chamber mode as the cavity becomes very small. The upperfrequency mode approaches a quarterwave mode in the cavity as the cavity widthbecomes small; nonetheless, the chamber is fully involved in this oscillation forcavities wide enough to be useful for stabilization.
The damping associated with each of these modes has not been calculated beyondthe crossover point between the two damping coefficient curves because only themost weakly damped mode is likely to occur.
For the lower frequency mode, the oscillatory pressure amplitude tends to increasewith distance from the cavity. For the high frequency mode, the oscillatory pres-sure amplitude tends to decrease with distance from the cavity. It is of interestto note these pressure distributions could be approximated by only the first twoterms in the series expansion, i.e.:
l = (a10 r/rw) cos mO (a (2) + a 2 cos -TZ (86)p 0 w00 01 L
R-9353
51
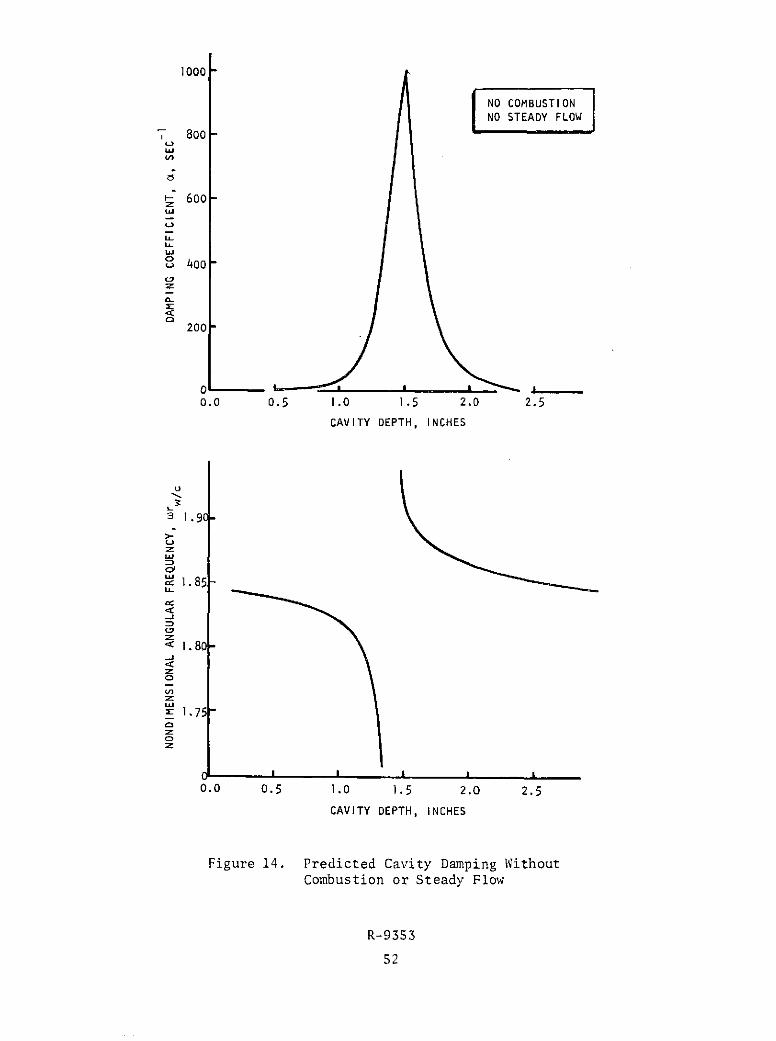
1000
NO COMBUSTIONNO STEADY FLOW
S800 -
L)
-600w
a-)
uJ
h
3 400
a-
200
0 IIi0.0 0.5 1.0 1.5 2.0 2.5
CAVITY DEPTH, INCHES
L
3 1.9C
-)
S1.85-
< 1.80--J
0
an
X 1.75
0z
0.0 0.5 1.0 1.5 2.0 2.5
CAVITY DEPTH, INCHES
Figure 14. Predicted Cavity Damping WithoutCombustion or Steady Flow
R-9353
52

It is also of interest that the flow of energy can be related to phase of the
pressure:
= p e (87)
The energy flux is (for no steady flow)4.
I = p Re (u) (88)
so that the time averaged energy flux is:
2<t>= <7Re = - PVi (89)
pW
The lines of constant phase are expected to have the qualitative features sketchedbelow:
CAVITYLINES OF CONSTANT PHASE
r=rw
r
Z Z=L
An examination of the computer results shows that this is the case if spatial oscil-lations in 4 are averaged out, since spatial oscillations are probably due to thefinite nature of the expansion series. Physically, acoustical energy flows outof the chamber at the acoustic cavity. This energy flows from all parts of thechamber.
Uniform Combustion
The simplest source term is a spatially uniform combustion. For this case thewave equation becomes:
2 2(V + k2 ) p = -h' (90)
For the rigid wall (no cavity case), the solution to this equation is:
S= 00 jkct (91)
k = 02 -h hk 100 100 21 100
R-95353
For a purely imaginary combustion coefficient, a growing wave results; the com-
puter program was checked for this simple case.
Spatially Uniform Combustion With Acoustic Cavity
A set of calculations was made for a uniform combustion source term. Results fromthese calculations are shown in Fig. 15. The primary effect is to shift the damp-ing coefficient curve downward from the no-source case, as expected. Also, thenet damping coefficient approximately equals the sum of the cavity and sourcecontributions (calculated individually), i.e.:
acomb + acav- 'oth (92)
An examination of the calculated pressure distributions shows little change dueto the addition of the uniform combustion.
Nonuniform Combustion With Acoustic Cavity
Calculations were made with an exponentially varying combustion distribution, i.e.:
h(z) = h e - z / (93)
From Eq. 70 it is evident that the contribution to the overall damping coefficientshould be approximately proportional to:
a -f i1 2 Im h(z)j} dV (94)
This expression suggests that this contribution will be nearly constant as X isvaried if - is approximately independent of axial position and:
rIm lh(z)} dz = constant (95)
or
h(X) = h( + )L 1 (96)1 - e
The effectiveness of this approach is demonstrated by the following results (noacoustic cavity):
w r (arw w
s, inches h X, inches c c
1.45 0.0 + 0.006j 1000 1.8413 -0.02453
0.0 + 0.013878j 5 1.8414 -0.02466
0.0 + 0.0018783j -5 1.8414 -0.02466
R-9353
54
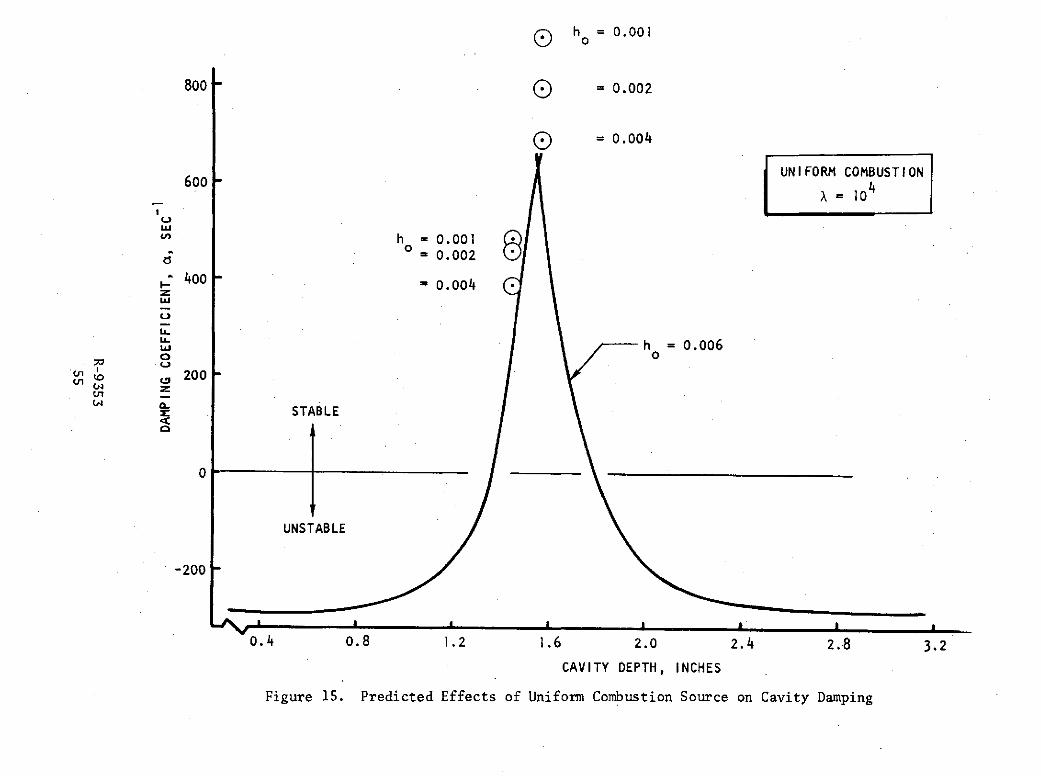
Sho = 0.001
800 ) = 0.002
) = 0.004
UNIFORM COMBUSTION600 4
X = 10IJ
CA h = 0.001o = 0.002
, 400 - = 0.004w
Li-
h = 0.006o 0o 200z(L
. STABLE
0
UNSTABLE
-200 -
0.4 0.8 1.2 1.6 2.0 2.4 2.8 3.2
CAVITY DEPTH, INCHES
Figure 15. Predicted Effects of Uniform Combustion Source on Cavity Damping
The change in damping (or driving) is indicated by the change in the or /c. Thenegative value for X corresponds to shifting the cavity to the opposite end ofthe chamber. In this mode, there is a small average flow of acoustic energy inthe z-direction from the region of greater combustion to that of less combustion.When an acoustic cavity was introduced, the following results were obtained:
Wr a r
k Reh 1 Im h X1, inches -
s ~ o ~ o c c
1.45 0.0 0.013878 5.0 1.7756 0.02116
140.006000 1000.0 1.7764 0.02331
0.001878 -5.0 1.7767 0.02488
1.65 0.013878 5.0 1.8819 0.020660.006000 1000.0 1.8832 0.01901
S 0.001878 -5.0 1.8845 0.01732
Thus, the effect of changing X has an opposite effect for the lower and upper(ks = 1.45, 1.65 correspond to the lower and upper modes, respectively). Thisresult implies that the effects are not additive, i.e.:
a (h, ycav) a (h = 0, ycav) + a (h, ycav =0)
The trends of these results can be explained in terms of the following equation:
a - Im h(z)} 12 dV (97)
The damping due to the cavity is greatest when the trends in pressure amplitudeand combustion source, h(z), are the same, i.e., both increasing or both decreas-ing with axial position.
Effects of Steady Flow
At present the model only includes a uniform steady flow, M = u/c, independent ofposition. Steady flow affects stability through its convective effect in the waveequation (Eq. 57) and also through the nozzle boundary condition (Eq. 60). Also,the injector boundary condition has been maintained as a9/8z= 0.
Without combustion or acoustic cavities, the inhomogeneous wave equation can besolved analytically. However, the first-tangential mode is independent of z andthus the addition of steady flow has no effect, since the relevant terms involvez-derivatives of pressure. Therefore, the program was checked out by comparisonwith analytical results for the first-tangential/first-longitudinal mode l101 =
J1 (1.841 r/R) cos wz/L cos 0, with injector and nozzle boundary conditions of8 7/8n = 0. The results were in agreement.
Calculations to investigate the effects of steady flow with distributed combustionbut no cavity, with
ho = 0.0 +0.013878j
S= 5.0 inches
S= 0.1R-9353
56
led to the conclusion that there was no significant difference between the flowand no-flow cases. However, when an acoustic cavity was also included, the effectswere significant, as shown below:
w)r ar9 inches h X, inches M
so c c __
1.45 0.0 + 0.01387824j 5.0 1.7751 0.01729 0.00.0 + 0.01387824j 1.7798 0.04511 0.1
0.0 + 0.0j 1.7707 0.04280 0.0
0.0 + 0.0j 1.7753 0.07190 0.1
The change in the damping coefficient, a, due to a steady-state flow M = 0.1is approximately independent of the presence of combustion (i.e., Aa rw/c =0.045 - 0.017 = 0.028 and 0.072 - 0.043 = 0.029). The presence of steady flowincreased the damping rate a for the cases considered, but for these cases, theamplitude of the oscillatory pressurelI decreases with increasing axial position.
Effects of Nozzle Admittance
For these calculations, the nozzle admittance has been taken to be a purely realpositive number in Eq. 82 and, thus, has a damping effect. The major effect ofnozzle admittance is to change the phase ip of the pressure distribution so as toimply flow of acoustic energy into the nozzle according to Eq. 97. This can beseen in the following case (no acoustic cavity, X = 1000 inches):
wr orX, inches h W W A
o c c
1000 0.0 + 0.006j 1.8413 -0.02453 0
1000 0.0 + 0.006j 1.8432 -0.00849 1.0
The phase angle can be shown to be a function only of z in the absence of theacoustic cavity and is shown in Fig. 16. These results agreed with analyticalresults for the same case. With an acoustic cavity, the steady-flow effect waschanged:
wr cxrX, inches h 0, inches - A
o sc c
5 0.0 + 0.01387824j 1.45 1.7798 0.04511 0
5 0.0 + 0.01387824j 1.45 1.7735 0.04922 1.0
The nozzle has the expected damping effect but, although the admittance is thesame as in the preceding case, the incremental change in damping (Aarw/c = 0.04922to 0.04511 = 0.00411) is down by a factor of four from the preceding case (Aarw/c =-0.00849 + 0.02453 = 0.01604). It is noted that the pressure amplitude jp at the
R-9353
57
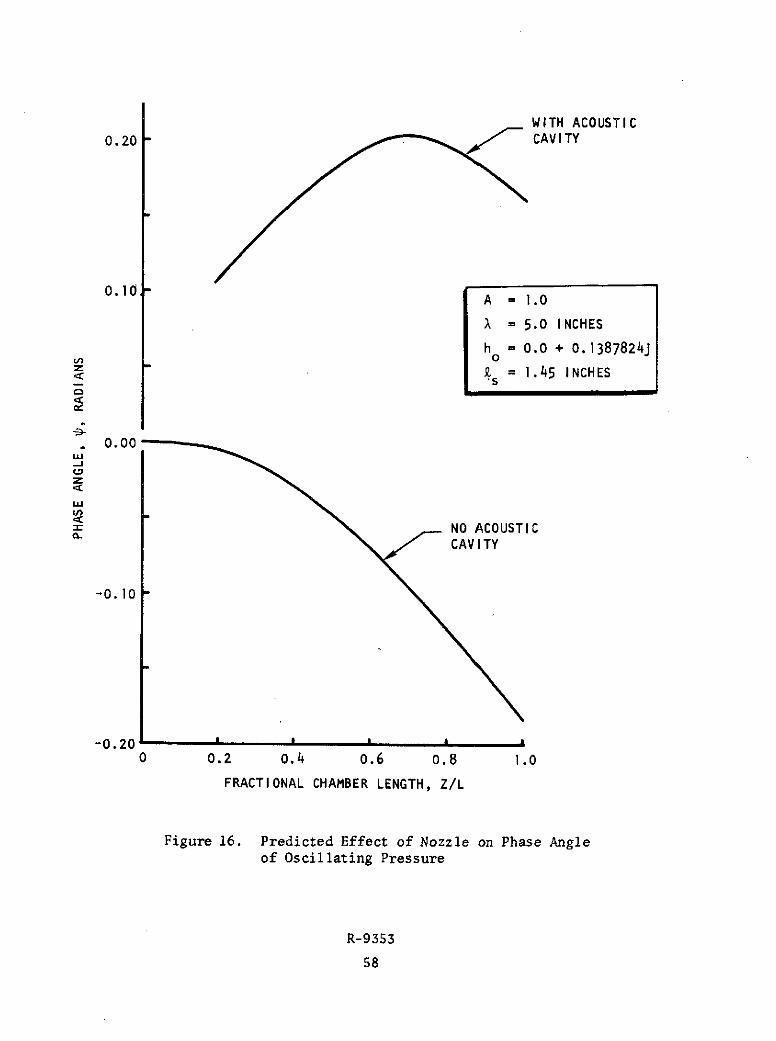
WITH ACOUSTIC0.20 CAVITY
0. 1 A = 1.0
X = 5.0 INCHES
h = 0.0 + 0.1387824juo 0
k = 1.45 INCHES
0.00-j
NO ACOUSTICCL CAVITY
-0.10
-0.20 I I I0 0.2 0.4 0.6 0.8 1.0
FRACTIONAL CHAMBER LENGTH, Z/L
Figure 16. Predicted Effect of Nozzle on Phase Angleof Oscillating Pressure
R-9353
58
nozzle has the same radial distribution in both cases, but the pressure I decreasesby approximately 50 percent in going from the injector to the nozzle in the lattercase. The factor of four is most likely determined by the square pressure of thepressure at the nozzle in these cases.
It is expected that nozzle admittance will more strongly damp the lower mode becausethe pressure at the nozzle is relatively higher. The plot of phase angle in Fig. '16shows that the flow of energy to the nozzle in accord with Eq. 97. The phase dependsstrongly on r for 0 < z/L < 0.2 because of the acoustic cavity and, therefore, isnot shown.
Effect of Cumulative Combustion-Convection Term
The last source term in Eq. 57 may be described as the cumulative combustion-convection term. The inclusion of this term in the program was found to havenegligible effect on the results for M = 0.1 for the few cases studied. Thereason is probably associated with the rapid oscillations corresponding to theexponential term in the integral.
R-9353
59/60
CONCLUDING REMARKS
The principal objective of the program described herein was to analytically pre-dict the relative combustion stability of various propellant combinations ofinterest to NASA-JSC when used with hardware configurations representative ofcurrent design and properties with or without acoustic cavities. As noted earlier,consideration was originally given to propellant combinations of the LOX/hydrocarbon,LOX/amine, and NTO/amine families, but was later concentrated on the NTO/amine fam-ily because of diminished interest in the other families.
To meet the objective of the program, several kinds of analysis were performed. Al-though this objective was achieved within the context of the contracted program andconsiderable progress has been made, the results show the need for further analysis.
Considerable information was generated as a result of the literature review. How-ever, the information shows considerable diversity, which probably reflects the gen-eral complexity of the instability problem. The results are probably best utilizedin conjunction with an analytical model to relate the conditions at a point of in-terest to those that previously evaluated experimentally.
A Priem-type stability analysis was done for a relatively broad range of conditions.Extensive plots of the variation of the stability index, A., with important physicalparameters have been developed. Because these plots were developed in terms ofphysical parameters, which minimized the total number of parameters, they do notshow all effects of interest. However, the plots may be used by interpolation toassess the effect of varying other parameters and, similarly, they may be used toassess the stability of new hardware configurations with minor additional calcula-tions. The manner in which this may be done has been illustrated by the additionalcalculations. The results from this analysis show the importance, when performingstability analyses, of the choice of parameters to be held constant. Oppositeeffects can be predicted by changing the parameters held constant. In addition,the results suggest that the propellant mass flux within an engine has a verystrong influence on stability. The greatest stability changes were predicted when(1) chamber pressure was increased by increasing the propellant flow through afixed set of hardware (worsened stability) or (2) contraction ratio was increasedwith a fixed thrust (improved stability).
The analysis done with the NREC stability model was less extensive than that donewith the Priem-type model. The Priem-type analysis was done with generalized pa-rametric curves that were available; but similar curves are not available for theNREC analysis and greater effort was required for each of these cases. The re-sults from the NREC analysis appear to be roughly compatible with those from thePriem-type analysis. The degree of agreement appears consistent with the majordifferences in approach that have been used in development of the two models. TheNREC model, or similar approaches, appears to be a valuable method of analysis forliquid-propellant engines. The Priem and NREC models complement each other becauseeach includes important factors not included in the other. Further work with theNREC model is recommended.
R-9353
61

Because of the need for a model to aid in the design of acoustic cavities thatspecifically included the effects of combustion and steady flow, development ofa generalized acoustic cavity model was also undertaken. This model was based ona combination of the concepts used in the existing cavity damping model (whichdoes not specifically allow for combustion and steady flow) and those used in theNREC model. Preliminary development of this model.was completed, with an iterativevariational solution method being used. At present the model includes effects dueto pressure-coupled combustion response (velocity coupling effects remain to beadded), nozzle effects, and steady flow (as a uniform approximattion), as well asthe acoustic cavity. Each of these contributions has been added incrementally andchecked by comparison with analytical results for limiting cases. The limited re-sults obtained thus far show the importance of interactions between the effects ofthe cavities and those due to the nozzle, combustion and steady flow, under somecircumstances. Because of these interactions, the need to adequately allow forthem in cavity design is evident and additional work is recommended.
R-9353
62
REFERENCES
1. Dix, M. D. and G. E. Smith, "Analysis of Combustion Instability in AircraftEngine Augmentors," AIAA Paper No. 71-700, presented at the AIAA/SAE 7thPropulsion Joint Specialist Conference, Salt Lake City, Utah, June 1971.
2. Culick, F. E. C., "Stability of High-Frequency Pressure Oscillations inRocket Combustion Chambers," AIAA J., Vol. 1, No. 5, May 1963.
3. Bates, J. 0., Experimental Evaluation of Storable Liquid Propellants inLarge Rocket Engines, R-1955, Rocketdyne Division, Rockwell International,Canoga Park, California, December 1959.
4. Levine, R. S., Rocketdyne Experience Regarding the Combustion Chamber Tract-ability of Various Propellant Combinations, RR-58-45, Rocketdyne, November1958.
5. Nestlerode, J., Rocketdyne, Private Communication.
6. Mikuni, D., Rocketdyne, Private Communication.
7. Stassinos, J., Rocketdyne, Private Communication.
8. Rocketdyne Research Memorandum, RM 848/352, 1 February 1962.
9. Coultas, T. A. and R. S. Levine, "Baffles and Chemical Additives as AcousticCombustion Stability Suppressors in a Two-Dimensional Thrust Chamber," SecondICRPG Combustion Conference, CPIA Publication No. 105, Vol. 2, May 1966, p. 61.
10. Rocketdyne Research Memorandum, RM 413/91, 18 June 1959.
11. Fourteenth NASA F-1 Program Review, Rocketdyne, May 1964.
12. Rocketdyne Research Memorandum, CHTUM 58-31, 25 August 1958.
13. Richtenburg, W., Rocketdyne, Private Communication.
14. Shuster, E., Rocketdyne, Private Communication.
15. Oberg, C. L., "LM Ascent Engine Acoustic Cavity Study," Sixth ICRPG Combus-tion Conference, CPIA Publ. No, 192, Vol. 1, December 1969, p. 303.
16. Oberg, C. L. et al., "Evaluation of Acoustic Cavities for Combustion Stabili-zation," Seventh JANNAF Combustion Meeting, CPIA Publ. No. 204, Vol. 1,February 1971, p. 743.
17. Oberg, C. L. et al., "Combustion Stabilization with Acoustic Absorbers,"Fifth ICRPG Combustion Conference, CPIA Publ. No. 183, December 1968, p. 359.
18. Bell Aerosystems Report No. D8539-953001.
R-9353
63
19. Senneff, J. M. and P. J. Morgante, "Combustion Stability Investigation of
the LM Ascent Engine," Second ICRPG Combustion Conference, CPIA Publ. No. 105,Vol. 1, May 1966, p. 23.
20. Senneff, J. and K. Berman, "Stability Investigation Relating to Bell/LM AscentEngine," Sixth ICRPG Combustion Conference, CPIA Publ. No. 192, Vol. 1,December 1969, p. 317.
21. Sherman, E. W., Jr. and D. T. Harrje, "History of Model 8533 Evolution withParticular Emphasis on Stability Aspects,: Sixth ICRPG Combustion Conference,CPIA Publ. No. 192, Vol. 1, December 1969, p. 351.
22. Reardon, F. H., "Advanced Agena Engine Combustion Stability Program,: SixthICRPG Combustion Conference, CPIA Publ. No. 192, Vol. 1, December 1969, p. 357.
23. Mehegan, P., Rocketdyne, Private Communication.
24. Dykema Owen, Aerospace, Private Communication.
25. Hefner, R. J., "Combustion Stability Development at Aerojet-General, FirstICRPG Combustion Instability Conference, CPIA Publ. No. 68, Vol. 1, January1965, p. 9.
26. Aerojet-General Corporation Report GEMSIP FR-1, SSD-TR-66-2, 31 August 1965.
27. McBride, J. M. and R. J. Hefner, "Combustion Stability Characteristics of theApollo SPS and Transtage Liquid Rocket Engines," Fourth ICRPG Combustion Con-ference, CPIA Publ. No. 162, Vol. 1, December 1967, p. 29.
28. Abbe, C. J. and W. L. Putz, "The Bipropellant Combustion Stability Character-istics of Hydrazine and MMH Fuels with Nitrogen Tetroxide for Post-Boost Pro-pulsion Application," Sixth ICRPG Combustion Conference, CPIA Publ. No. 192,Vol. 1, December 1969, p. 93.
29. Abbe, C. J. et al., "Influence of Storable Propellant Liquid Rocket DesignParameters on Combustion Instability," Fourth ICRPG Combustion Conference,CPIA Publ. No. 162, Vol. 1, December 1967, p. 73. Also see J. Spacecraft andRockets, Vol. 5, No. 5, May 1968, pp. 584-90.
30. Weiss, R. and R. Klopotek, Experimental Evaluation of the Titan III TranstageEngine Combustion Stability Characteristics, AFRPL Report No. TR-66-51,March 1966.
31. Houseman, J., "Jet Separation and Popping with Hypergolic Propellants,"Seventh JANNAF Combustion Meeting, CPIA Publ. No. 204, Vol. 1, February 1971,p. 445.
32. Clayton, R. M., "Baffle Performance with High-Impedance Injectors," SeventhJANNAF Combustion Meeting, CPIA Publ. No. 204, Vol. 1, February 1971, p. 797.
R-9353
64
33. Bailey, C. R., "Acoustic Liner for the C-1 Engine," Fifth ICRPG CombustionConference, CPIA Publ. No. 183, December 1968, p. 335.
34. Hoeptner, H. W., "Test Results and Analysis of Pulse Initiated Oscillationsin the UTC 8K Engine," Second ICRPG Combustion Conference, CPIA Publ. No. 105,Vol. 1, May 1966, p. 47.
35. Moberg, D. A., "Attentuation of Tangential Combustion Instability in anAblative, Hypergolic Bipropellant 1750-Pounds-Thrust Rocket Engine," FourthICRPG Combustion Conference, CPIA Publ. No. 162, Vol. 1, December 1967, p. 15.
36. Minton, S. J. and E. Z. Zwick, "An Investigation of Manifold Explosions inRocket Engines," Third ICRPG Combustion Conference, CPIA Publ. No. 138, Vol. 1,February 1967, p. 497.
37. Marquardt Report S-483, An Investigation of Oxidizer Manifold Explosions inthe Apollo SM/RCS Engine, 1 February 1966.
38. Coultas, T. A. and R. C. Kesselring, "Extension of the Priem Theory and ItsUse in Simulation of Instability on the Computer," Proceedings of the SecondICRPG Combustion Conference, CPIA Publication No. 105 Chemical PropulsionInformation Agency, Silver Spring Maryland, May 1966, page 163-192.
39. Lambiris, S., L. P. Combs, and R. S. Levine, "Stable Combustion Processes inLiquid Propellant Rocket Engines," Combustion and Propulsion, Fifth AGARDColloquium (MacMillan Co., New York, 1963), pages 569-634.
40. Ingebo, R. E., Dropsize Distributions for Impinging Jet Breakup in AirstreamsSimulating the Velocity Conditions in Rocket Combustors, NASA TN-4222, NationalAeronautics and Space Administration, Washington, D.C., 1958.
41. Priem, R. J. and D. C. Guentert, Combustion Instability Limits Determined bya Non-Linear Theory and a One-Dimensional Model, NASA TN D-1409, NationalAeronautics and Space Administration, Washington, D.C., October 1962.
42. Culick, F. E. C., Interactions Between the Flow Field, Combustion and WaveMotions in Rocket Motors, NWC TP-5349, Naval Weapons Center, China Lake,California, June 1972.
43. Heidmann, M.F., Amplification by Wave Distortion of the Dynamic Response ofVaporization Limited Combustion, NASA TND-6287, National Aeronautics andSpace Administration, Washington, D.C., May 1971.
44. Heidmann, M. F., Empirical Characterization of Some Pressure Wave Shapes inStrong Travelling Transverse Acoustic Modes, NASA TMX-1716, National Aero-nautics and Space Administration, Washington, D.C., January 1969.
45. Schuman, M. D. and C. L. Oberg, Rocketdyne contribution to final reportAugmentor Combustion Instability Investigation, General Electric Company,Evandale, Ohio, June 1974.
R-9353
65
46. Priem, R. J. and M. F. Heidmann, Propellant Vaporization as a Design Criterion
for Rocket Engine Combustion Chambers, NASA Technical Report R-67, NationalAeronautics and Space Administration, Washington, D.C. 1960.
47. Heidmann, M. F. and P. R. Wieber, Analysis of Frequency Response Character-
istics of Propellant Vaporization, NASA TND-3749, December 1966.
48. Bell, W. A. and B. T. Zinn, The Prediction of Three-Dimensional Liquid-
Propellant Rocket Nozzle Admittances, NASA CR-121129, Georgia Institute of
Technology, Atlanta, Georgia, February 1973.
49. Morse, P. M. and K. U. Ingard, "Theoretical Acoustics," McGraw-Hill, New York(1968).
50. Oberg, C. L. et al., Final Report, Evaluation of Acoustic Cavities for Com-bustion Stabilization, NASA CR-115007, R-8757, Rocketdyne, 1971.
51. Morse, P. M. and H. Feshback, Methods of Theoretical Physics, McGraw-Hill,New York (1953), Vol. I, p. 1108.
52. Becker, M., The Principles and Applications of Variational Methods, MITPress, Cambridge, Massachusetts (1964).
R-9353
66
APPENDIX A
DROPSIZE CORRELATIONS
A number of correlations have been developed for predicting propellant dropsize.Some of these are summarized below.
* Ingebo (Ref. A-1) for like doublets:
2.54 x 10⁴D30 2.64 \ + K P 1 /4
2 Vref) JAVj
where
K = 0.97 (22 22 1/4p 2 n-Heptan -]
Pref = 10.7 x 10- 4 g/cc V , fps
p = Pc/RT d - inch
IAVI V .. D3 0 -micronsinj 30D30 = mass mean drop diameter30
The velocity difference JAVI = jVg = Vinj may be approximated by neglect-ing Vg or, when used with a steady-state combustion model, it may be ad-justed until the predicted performance equal the measured performance
* Dickerson (Ref. A-2) for like doublets:_ do0.568
D = 5.84 x 10⁴ (PCF)0.852 (PCF)V.
where
D = 2.2 D30 - microns
d ~ inches
V ft/sec
PCF= 1.54 PL 1/3 L1/2 LPCF L L
PL -.lb/ft sec
o L , dyne/cm
PL - g/cc
R-9353
67
SZajac (Ref. A-3) for like doublets (60-degree impingment angle):-0.52
4 -0.75 P 05Laminar Jet = 4.85 x 10 V 0 7 5 d 0.57 (P.)
wax
4 -1.0 0.57Turbulent Jet D = 15.9 x 10 V d0 (W.-0.10wax Pj
where
D- microns
V - ft/sec
d - inches
Pc/Pj = Vel. profile parameter -1
and
D = (1.42 - .0073y)D6 0
where
D60 = dropsize for 60=degree impingement angle60
y = impingement angle
also
D=D Kwax
where 1/4.1/4
L pL wax]
R-9353
68
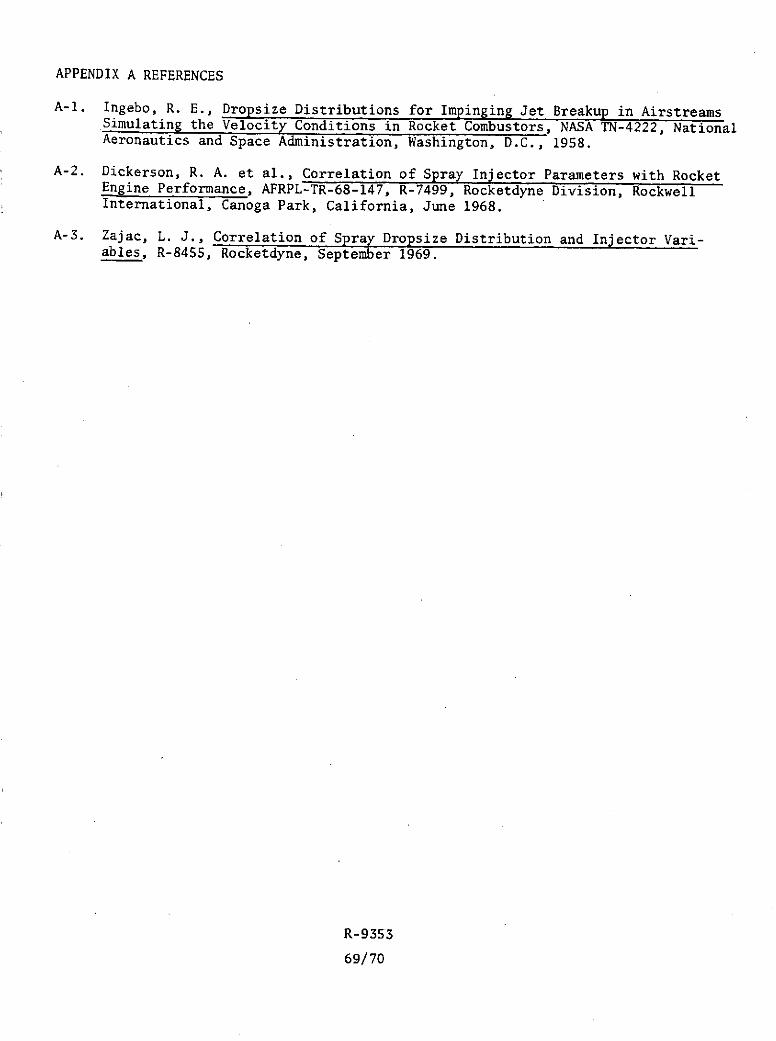
APPENDIX A REFERENCES
A-1. Ingebo, R. E., Dropsize Distributions for Impinging Jet Breakup in AirstreamsSimulating the Velocity Conditions in Rocket Combustors, NASA TN-4222, NationalAeronautics and Space Administration, Washington, D.C., 1958.
A-2. Dickerson, R. A. et al., Correlation of Spray Injector Parameters with RocketEngine Performance, AFRPL-TR-68-147, R-7499, Rocketdyne Division, RockwellInternational, Canoga Park, California, June 1968.
A-3. Zajac, L. J., Correlation of Spray Dropsize Distribution and Injector Vari-ables, R-8455, Rocketdyne, September 1969.
R-9353
69/70
APPENDIX B
RESULTS FROM PRIEM-TYPE STABILITY ANALYSIS
This appendix contains a series of plots of the calculated stability index, Ap,for a variety of conditions. These plots summarize the results from the Priem-type stability analysis.
R-9353
71
P = 125 psiac
APin j = 0.2 P
CR = 2
.10 R = 2, 6 in.
.07
D
R =2 in.f
.055
00
4
xA
>., .03
R ..6 in.
/00 too Zo0 o0o
Fuel Dropsize, D, microns
Figure B-1. Local Stability Index as a Function of Dropsizefor P = 125 psia, AP inj = 0.2 Pc , CR = 2
R-9353
72
P = 125 psiac
AP. . = 0.2 Pin) cCR = 3
R =-2, 6 in.• IO D
.7R = 2 in.
0.76
o 0.Yf
--- R = 6 in.
* 05 € J , ,
0-10
000.0
'-44
00 200 -300 0
Cd
R =6 in.
/000300 #100
Fuel Dropsize, D., microns
Figure B-2. Local Stability Index as a Function of Dropsizefor P = 125 psia, AP. .inj = 0.2 Pc , CR = 3
c in) c
R-9353
73
P = 125 psiaC
AP. .in = 0.4 P
CR= 2
R= 2, 6 in.
./0=•/ORJDo
D
.00
.oR R-2in.
050)
.03
-.
0a7s
I-R= 6 in.
/00 200 300 40oo
Fuel Dropsize, Df, microns
Figure B-3. Local Stability Index as a Function of Dropsizefor P = 125 psia, AP. .inj = 0.4 Pc , CR = 2
c in) c
R-9353
74
D
fPC = 125 psia
AP.in. = 0.4 P
CR = 3
.t _R = 2,6 in.
R = 2 in. .
.07
.05
U0
*0
IV-7>, .03~j4 -
/,0 ___3_o__
.0 2.
-R=6 in.
/00 200 30o 0oo
Fuel Dropsize, Df, microns
Figure B-4. Local Stability Index as a Function of Dropsizefor P = 125 psia, AP. .inj = 0.2 Pc , CR = 2
R-9353
75

Pc = 200 psia
P. .in =0.2 Pin) cCR= 2
R =2, 6 in.
.07
D01M 6o = ox
o 0.75"
-4
.R =2 in.
4)
..-4
R= 6 in.f i l lt I I l i 1 1 1 1 1 1 1 1 I I I t J i l I I
10o 300 MOO
Fuel Dropsize, Df, microns
Figure B-5. Local Stability Index as a Function of Dropsizefor P = 200 psia, AP. .inj = 0.2 Pc , CR = 2
c in) c
R-9353
76
P = 200 psiaC
AP. . = 0.2 Pinj CCR = 3
R = 2, 6 in.
/.. #O.o
1,0 Dox
Fue Dopiz, °-icon
R 2 in.
0
-4
'-0 ii0
IOO10 soee0q
Fuel Dropsize, D., microns
Figure B-6. Local Stability Index as a Function of Dropsizefor Pc = 200 psia, APinj= 0.2 Pc, CR = 3
R-9353
77
PC = 200 psia
AP. . = 0.4 Pin) cCR = 2
R = 2, 6 in.
.i0
D
0
-O4
8o.75
.g0.5
N _R -- 6 in.
Fuel Dropsize, Dr, microns
Figure B-7. Local Stability Index as a Function of Dropsize
*1-4n
for PF = 200 psia, . = 0.4 P CR = 2
R-9353
78

P = 200 psia /0= oxc
AP.in j = 0.4 P fCR=3
CR = 3
.10 R = 2, 6 in.
R = 2 in.
..75
0
/0o ,Zoo Soo g oo
Fuel Dropsize, D , microns
Figure B-8. Local Stability Index as a Function of Dropsizefor Pc = 200 psia, AP.n. = 0.4 Pc CR = 3
R-935379
>-,
4 -)
-)
.02 _ _ _ _
R =6 in.
/00 Zoo 300 4400
Fuel Dropsize, Df, microns
Figure B-8. Local Stability Index as a Function of Dropsizefor P c = 200 psia, AP inj = 0.4 P C, CR 3
R-9353
79

PC = 125 psia
AP. . = 0.2 PInj CCR = 2
R = 4 in.
.0
.O
.07
ox
Df>~ .03
R 4 in.4.
10o 200 300 9oo
Fuel Dropsize, Df, microns
Figure B-9. Local Stability Index as a Function of Dropsizefor P = 125 psia, AP inj = 0.2 Pc , CR = 2
R-935380
Pc = 12S psia
AP inj = 0.2 P
CR = 3
R = 4 in.
.07
*.o5 __ _ _ _ _ _
o0=
U - /0 D7
0.
.os R =4 in. 07
• * L I I I f i I II I l
/oo Zo 300 400
Fuel Dropsize, Df, microns
Figure B-10. Local Stability Index as a Function of Dropsizefor P = 125 psia, AP. = 0.2 P , CR = 3C inj C
R-9353
81
P = 125 psia
AP. . = 0.4 P
CR = 2
R =4 in., /0
.07
.05
o-: /0Z= -ox
Df
SR =4 in.
.-.
-d
NN -
/00 200 300 400
Fuel Dropsize, Df, microns
Figure B-i. Local Stability Index as a Function of Dropsizefor Pc = 125 psia, APinj = 0.4 Pc , CR = 2
R-9353
82
P = 125 psiaC
Ap = 0.4 Pinj cCR= 3
R =4 in.
.07
D---. o - ox
.o6
_____ 0o R = 4 in. 0.75-
I-4
.03
4J)
, 0/
I I I I I i I I I I I I I i
/00 200 300
Fuel Dropsize, Df, microns
Figure B-12. Local Stability Index as a Function of Dropsizefor Pc = 125 psia, APinj = 0.4 Pc, CR = 3
R-9353
83
P = 200 psiaC
AP.in =0.2 P
CR= 2
R =4 in../o
.05
4
x
o
____03____,o -Ox~D4= D
-4 f.R = 4 in.
- S
--S
* O / i I l I I I 1 1 1I I I 1 I l i ( I I l
/00 30oo S00 0o
Fuel Dropsize, Df, microns
Figure B-13. Local Stability Index as a Function of Dropsizefor P = 200 psia, AP. .inj = 0.2 P , CR = 2
c inj c
R-9353
84

PC = 200 psia
AP. .inj = 0.2 P
CR = 3
R =4 in..II
.07
o / D-. 0
0 ox
Tf
R = 4 in.
C)
S00.5
* III II
i l l iI I III I
0o .ZOo Soo 'oo
Fuel Dropsize, D, microns
Figure B-14. Local Stability Index as a Function of Dropsizefor P = 200 psia, AP. .inj = 0.2 PC. CR = 3
R-9353
85
P = 200 psia
AP. .in =0.4 P
CR= 2
R =4 in.
* 01
.05
U0* D
OX
D fR =4 in.
S .03
..4
/00 2oo 300 10
Fuel Dropsize, Df, microns
Figure B-15. Local Stability Index as a Function of Dropsizefor Pc = 200 psia, AP. .in = 0.4 P , CR = 2
c inj c
R-9353
86
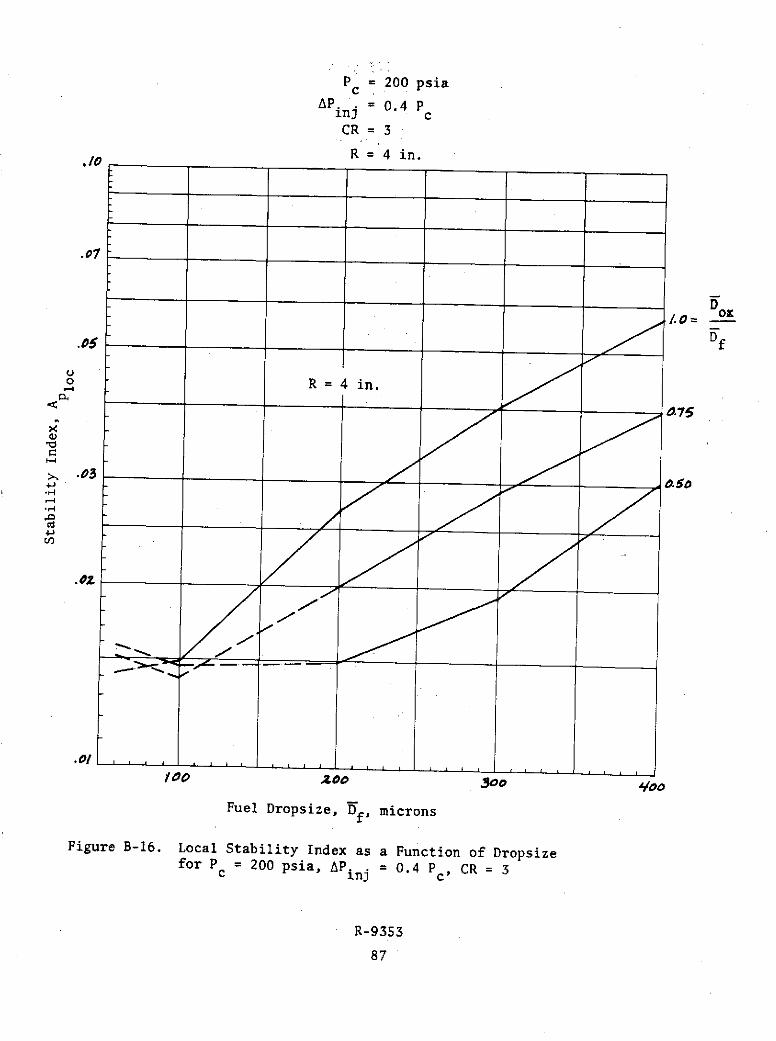
P = 200 psia
APin j = 0.4 P
CR= 3
.0R = 4 in.
1..00
D fUo R 4 in.
e-d
* I II__ _ _ _ _ _ _ _ _ _
1oo zo 3oo' 4o.
Fuel Dropsize, Df microns
Figure B-16. Local Stability Index as a Function of Dropsizefor Pc = 200 psia, AP . = 0.4 P c CR = 3
R-9353
87
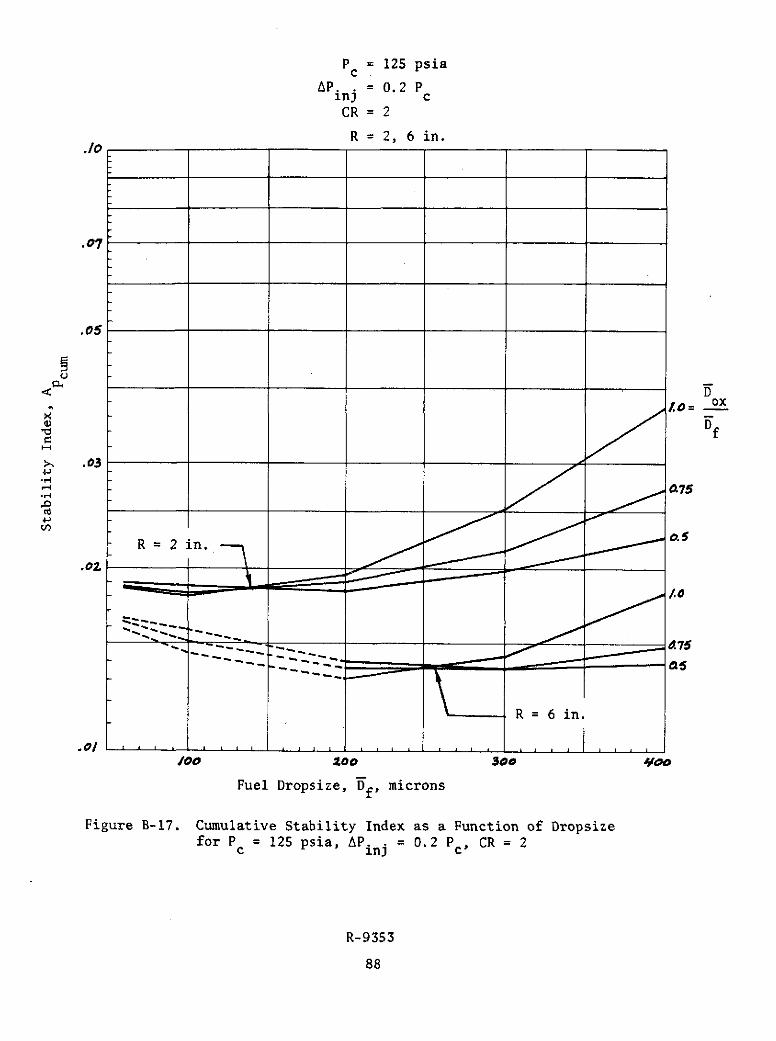
P = 125 psia
AP.in = 0.2 P
CR= 2
./ R = 2, 6 in.
.07
.os
.05
xD
D
"a75
R =2 in. o.5
.Oz
a$
R = 6 in.
.0//00 too 30o0 oo
Fuel Dropsize, Df, microns
Figure B-17. Cumulative Stability Index as a Function of Dropsizefor P = 125 psia, AP. . = 0.2 PC, CR = 2c inj
R-9353
88

PC 125 psia
AP . = 0.2 PlnJ cCR= 3
R= 2, 6 in.
.07
D
f
.ox /o = o_
S.05.75
4J
0p -R = 2 in. _
R = 6 in,
.0/ . . . . . L 1 4I ~ l I I l i I I l i l i I
/00 2.t 300 cc
Fuel Dropsize, D, microns
Figure B-18. Cumulative Stability Index as a Function of Dropsizefor P = 125 psia, AP. .inj = 0.2 Pc, CR = 2
R-9353
89
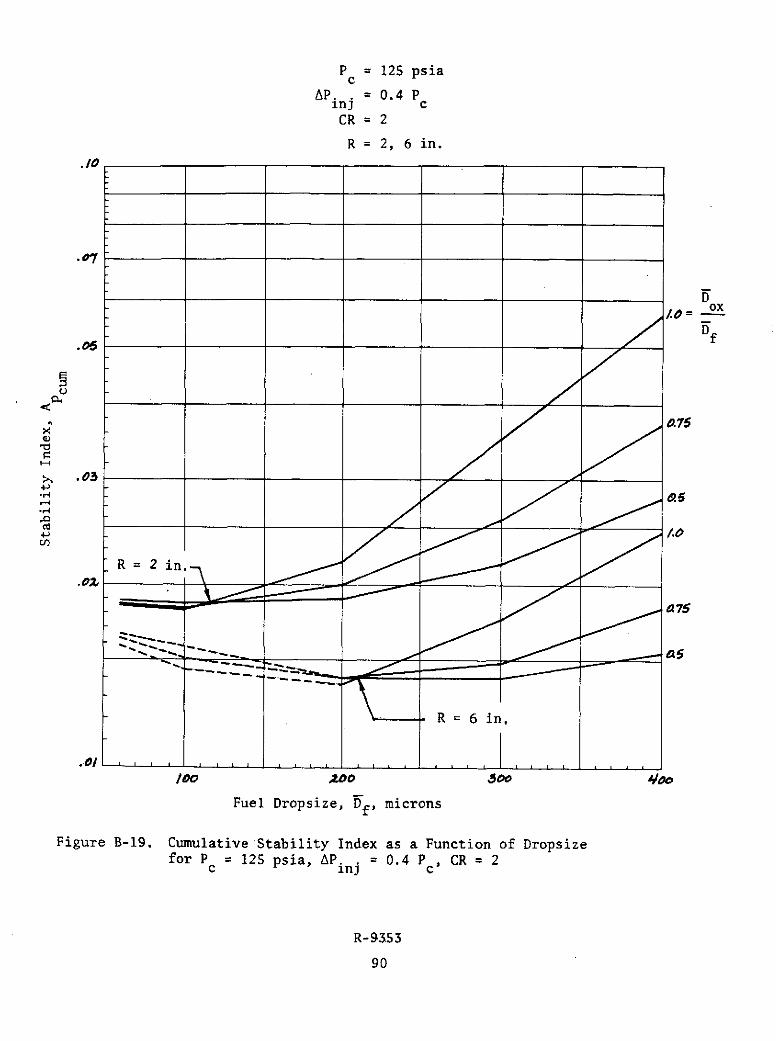
P = 125 psiaC
AP. . = 0.4 PinJ C
CR = 2
R = 2, 6 in.
.07
D
.0.0
>., .030.7
Cl)
R =2 in.
R = 6 in.
a i I lI i l i l l I I l l I i , , t
/oo00 Zo So ooo
Fuel Dropsize, D., microns
Figure B-19. Cumulative Stability Index as a Function of Dropsizefor P = 125 psia, AP. .inj = 0.4 Pc, CR = 2
R-9353
90
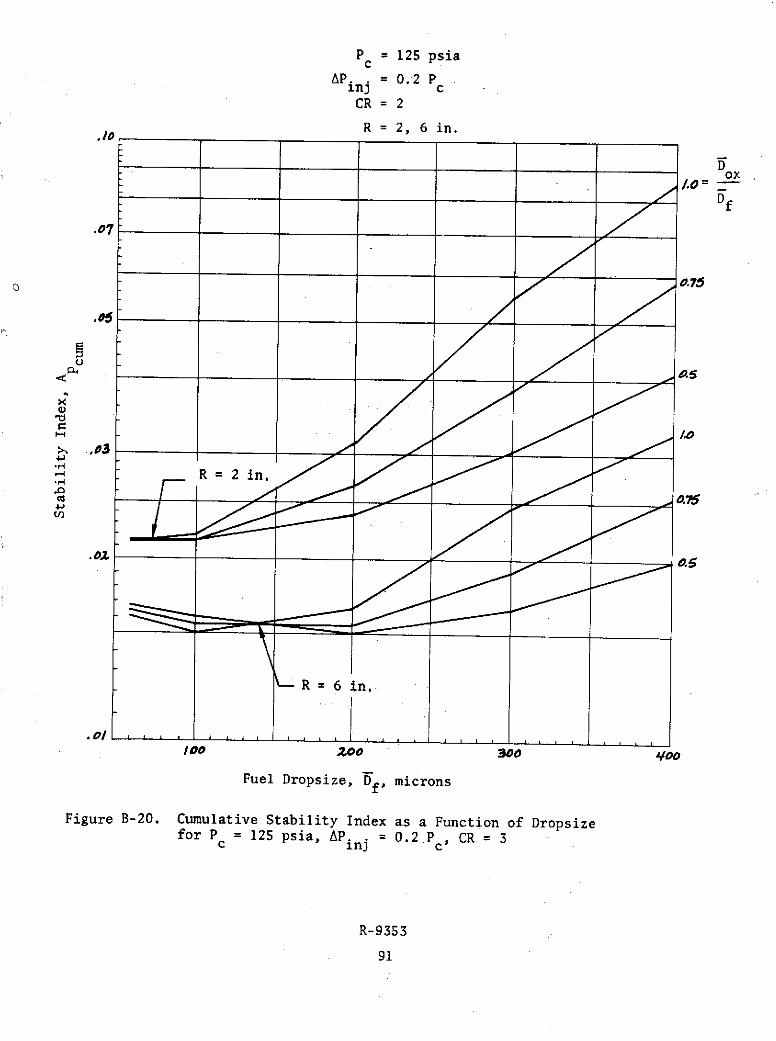
P = 125 psiac
AP. . = 0.2 Pin) CCR = 2
R = 2, 6 in.
Dox/.0
loozo go44
Cif
R 6 2iin.
zoo R0 -- 6in '
Fuel Dropsize, Dr, microns
Figure B-20. Cumulative Stability Index as a Function of Dropsizefor P = 125 psia, AP.n. = 0.2 P , CR = 3c inj c
R-9353
91

P = 200 psiac
AP. .nj = 0.2 P
CR = 2
R= 2, 6 in./ I0
.07
uD
x o
C) f
I,,>. .03
-47
.0~~~~, O___ ____ ___
Fuel Dropsize, D., microns
Figure B-21. Cumulative Stability Index as a Function of Dropsizefor P = 200 psia, AP inj = 0.2 Pc , CR = 2c ' ni c
R-9353
92
P = 200 psia
AP. .inj = 0.2 Pin) cCR = 2
R = 2, 6 in.dO
.07
D
f
.0.
R =2 in.-47
-R = 6 in.
. 1I II j I .I I .II I iI I I I/oo too Joe /o
/ 0 _______te
Fuel Dropsize, Df, microns
Figure B-22. Cumulative Stability Index as a Function of Dropsizefor P = 200 psia, AP. . = 0.2 Pc, CR = 3c in) c
R-9353
93
P = 200 psiaC
AP. . = 0.4 P
CR = 2
R = 2, 6 in.
./o07
oO7X
D.os /.o _ ox
Df
Cd
R 2 in
L--R = 6 in.
I00 200 300 4Io
Fuel Dropsize, Df, microns
Figure B-23. Cumulative Stability Index as a Function of Dropsizefor Pc = 200 psia, APin j = 0.4 PC, CR = 2
R-935394
P = 200 psiaC
AP.in j = 0.4 P
CR 3
.0 R = 2, 6 in.
.07
Dox
.f
.03 R =2 in.
R = 6 in.
.o O/ J J ' , , ,
S o o A1 00Fuel Dropsize, D, microns
Figure B-24. Cumulative Stability Index as a Function of Dropsizefor P = 200 psia, AP inj = 0.4 Pc CR = 3
R-9353
95
P = 125 psiaC
AP. .inj = 0.2 P
CR = 3
R = 4 in..1O
.07
.03
D
.0/.0 ox
.0/1
f
R = 4 in . , 0 7
/00 2oo 30oo 400Fuel Dropsize, Df., microns
Figure B-25. Cumulative Stability Index as a Function of Dropsizefor Pc = 125 psia, APinj = 0.2 P c, CR = 3
R-9353
96
P = 125 psiaC
AP. = 0.2 Pinj CCR = 2
R= 4 in../o
.07
.05
ox
R =4 in. D
a75
/00 Zoo .3 00
.0.00
Fuel Dropsize, D, microns
Figure B-26. Cumulative Stability Index as a Function of Dropsizefor P = 125 psia, AP. . = 0.2 P , CR = 2
R-9353
97

P = 125.psiaC
APn = 0.4 P
CR = 2
R = 4 in..10 .Io
.07
U
t
D1.o=
R_= 4 in.*4J
475
'0.
0oo 0 300 Jo
Fuel Dropsize, Df, microns
Figure B-27. Cumulative Stability Index as a Function of Dropsize
for Pc = 125 psia, APinj = 0.4 Pc, CR = 2
R-9353
98
P = 125 psiaC
AP.. = 0.4 PIn) cCR = 3
.Io R = 4 in.
.07
R 4 in..75
-1
.0
/00 10o 300 oo
Fuel Dropsize, Df., microns
Figure B-28. Cumulative Stability Index as a Function of Dropsizefor P = 125 psia, AP. . = 0.4 Pc, CR = 3
c in) c
R-9353
99
P = 200 psiaC
Ap. .inj = 0.2 P
CR = 2
R = 4 in.
.o7
.05
xD> .034.1
-4
R = 4 in. /o= ox
/00oo Zoo 30o
Fuel Dropsize, Df, microns
Figure B-29. Cumulative Stability Index as a Function of Dropsizefor P = 200 psia, AP. .in = 0.2 Pc, CR = 2
c in)c
R-9353
100
P = 200 psiaC
AP.in j = 0.2 P
CR = 3
./0o R = 4 in.
.07
.oso
' 4 DCu
T0 O.0 Df
4-)
R =4 in.
.0, ___ _.75
/00 200 300 Voo
Fuel Dropsize, Df, microns
Figure B-30. Cumulative Stability Index as a Function of Dropsizefor P = 200, AP. . = 0.2 P CR = 3c inj c'
R-9353
101
P = 200 psiac
AP.inj = 0.4 P
CR = 2
R =4 in../0
.034J 10=
Df• ' ' R = 4 in. /
.0Of
/00 zoo 300 #o
Fuel Dropsize, Df, microns
Figure B-31. Cumulative Stability Index as a Function of Dropsizefor P = 200 psia, AP. . = 0.4 P , CR = 2
c in) c
R-9353
102
P = 200 psiac
AP. . = 0.4 PinJ CCR = 3
R = 4 in..;0
.07
R = 4 in. ox
/00 -300 Yoooo £ oo oo gi l o
Fuel Dropsize, Df, microns
Figure B-32. Cumulative Stability Index as a Function of Dropsizefor Pc = 200 psia, AP inj = 0.4 Pc , CR = 3
R-9353
103/104
Related Documents


