DOCUMENT RESUME ED 361 396 TM 020 498 AUTHOR Phillips, Gary W.; And Others TITLE Interpreting NAEP Scales. INSTITUTION National Center for Education Statistics (ED), Washington, DC. PUB DATE Apr 93 NOTE 106p. PUB TYPE Reports Evaluative/Feasibility (142) EDRS PRICE MF01/PC05 Plus Postage. DESCRIPTORS *Academic Achievement; Criterion Referenced Tests; Educational Assessment; Educational Research; Elementary School Students; Elementary Secondary Education; *National Surveys; Norm Referenced Tests; Policy Formation; Research Methodology; *Scaling; *Scoring; Secondary School Students; Student Evaluation; *Test Interpretation; Test Results; Test Validity IDENTIFIERS *National Assessment of Educational Progress ABSTRACT This report deals with a variety of ways that have been, or could be, used to interpret the scales used in the National Assessment of Educational Progress (NAEP). Policymakers, researchers, and other users of assessment results need to understand the methods used for reporting NAEP. Having a reference is particularly important as the methods of reporting are changing. Chapter 1 covers the following methods that have been used, or could be used, to interpret scales: (1) percentage correct for each item; (2) average percentage correct; (3) item mapping; (4) scale anchoring; (5) achievement levels; (6) using scoring rubrics; and (7) benchmarking. The contrast between anchor levels and achievement levels is discussed. Chapter 2 discusses the distinction between norm-referenced and criterion-referenced interpretations, and the validity of the inferences drawn from NAEP interpretations. Issues of validity are especially important with regard to achievement levels, because they represent an effort to go beyond describing, to prescribing recommended levels of achievement for the nation. Eleven figures and four tables present analysis data. An appendix provides exemplar exercises for scale anchoring and for achievement levels. (SLD) *********************************************************************** Reproductions supplied by EDRS are the best that can be made from the original document. ***********************************************************************

Welcome message from author
This document is posted to help you gain knowledge. Please leave a comment to let me know what you think about it! Share it to your friends and learn new things together.
Transcript
DOCUMENT RESUME
ED 361 396 TM 020 498
AUTHOR Phillips, Gary W.; And OthersTITLE Interpreting NAEP Scales.INSTITUTION National Center for Education Statistics (ED),
Washington, DC.PUB DATE Apr 93NOTE 106p.PUB TYPE Reports Evaluative/Feasibility (142)
EDRS PRICE MF01/PC05 Plus Postage.DESCRIPTORS *Academic Achievement; Criterion Referenced Tests;
Educational Assessment; Educational Research;Elementary School Students; Elementary SecondaryEducation; *National Surveys; Norm Referenced Tests;Policy Formation; Research Methodology; *Scaling;*Scoring; Secondary School Students; StudentEvaluation; *Test Interpretation; Test Results; TestValidity
IDENTIFIERS *National Assessment of Educational Progress
ABSTRACT
This report deals with a variety of ways that havebeen, or could be, used to interpret the scales used in the NationalAssessment of Educational Progress (NAEP). Policymakers, researchers,and other users of assessment results need to understand the methodsused for reporting NAEP. Having a reference is particularly importantas the methods of reporting are changing. Chapter 1 covers thefollowing methods that have been used, or could be used, to interpretscales: (1) percentage correct for each item; (2) average percentagecorrect; (3) item mapping; (4) scale anchoring; (5) achievementlevels; (6) using scoring rubrics; and (7) benchmarking. The contrastbetween anchor levels and achievement levels is discussed. Chapter 2discusses the distinction between norm-referenced andcriterion-referenced interpretations, and the validity of theinferences drawn from NAEP interpretations. Issues of validity areespecially important with regard to achievement levels, because theyrepresent an effort to go beyond describing, to prescribingrecommended levels of achievement for the nation. Eleven figures andfour tables present analysis data. An appendix provides exemplarexercises for scale anchoring and for achievement levels. (SLD)
***********************************************************************Reproductions supplied by EDRS are the best that can be made
from the original document.***********************************************************************
,
"'
a A
CUT COPY AVALDIE
a
U DEPARTMENT OF COUCATt014°Mc. of Eduzstonal Rekkarett and froprovAment
ED%AT1ONAt. RESOURCES INFORMATIONCENTER (ERIC)
Th.; document has been reproduced asrecerinta from me person or organszatron
originating0 Minor changes hare been made to impforst
reproduction ouitay
Points of view or opinions stated in this docu-
ment dO trot atC11$1111rdy represent othcsal
OERI position Or Poior
s'r
What is The Nation's Report Card?
THE NATION'S REPORT CARD. the National Assessment of Educational Progress (NAEP), is the only nationallyrepresentative and continuing assasment
of what America's students know and can do in various subject areas. Since 1969, assessments have been conducted periodically in reading, mathematics,
science, writing, history/geography, and other fields. By making objective information on student performance available topolicymakers at the nadonal,
state, and local levels, NAEP is an integral part of our nation's evaluation of the condition and progress of education. Only informati(n related to academic
achievement is collected under this program. NAEP guarantees the privacy of individual students and theirfamilies.
NAEP is a congressionally mandated project of the National Center for Education Stati..\iics, the U.S. Department of Education. The Commissioner of
Education Statistics is responsible, by law, for carrying out the NAEP project thaws. :ompetitive awards to qualified organizations. NAEP reports directly
to the Commissioner, who is also responsible for providing continuing reviews, including validation studies and solicitation of public comment, on NAEP's
conduct and usefulness.
In 1988, Congress created the National Assessment Governing Board (NAGE) to formulate policy guidelines for NAEP. The board is responsible for
selecting the subject areas to be assessed, which may include adding to thcse specified by Congress; identifying appropriate achievement goals for each age
and grade; developing assessment objectives; developing test specifications; &signing the assessment methodology; developing guidelines and standards
for data analysis and for reporting and disseminating results; developing standards and procedures for interstate, regional, and national comparisons; improving
the form and use of the National Assessment and ensuring that all items telPcted for use in the National Assessment are free from racial, cultural, gender,
or regional bias.
The National Assessment Governing Board
Mark D. Musick, ChairmanPresidentSouthern Regional Education BoardAtlanta, Georgia
Hon. William T. Randall, Vice ChairCommissioner of EducationState Department of EducationDenver, Colorado
Parris C. BattleEducation SpecialistDade County Public SchoolsMiami, Florida
Honorable Evan BayhGovernor of IndianaIndianapolis, hidiana
Mary R. BlantonAttorneyBlanton & BlantonSalisbury, North Carolina
Boyd W. BoehljeAttorney and School Board MemberPella, Iowa
Linda R. BryantDean of StudentsFlorence Reizenstein Middle SchoolPittsburgh, Pennsylvania
Naomi K. CohenOffice of Policy and ManagementState of ConnecticrHartford, Connecticut
Charlotte CrabtreeProfessorUniversity of CaliforniaLos Angeles, California
Chester E. Finn, Jr.Founding Partner and Senior ScholarThe Edison ProjectWashington. DC
Michael S. GladeWyoming State Board of EducationSaratoga, Wyoming
William HumeChairman of the BoardBasic American, Inc.San Francisco, C lifornia
Christine JohnsonDirector of K-12 EducationLiuleton Public SchoolsLittleton, Colorado
John S. LindleyPrincipalGalloway Elementary SchoolHenderson, Nevada
Honorabk Stephen E. MerrillGovernor of New HampshireConcord, New Hampshire
Jason MillmanProfessorCornell UniversityIthaca, New York
Honorable Richard P. MillsCommissioner of EducationState Department of EducationMontpelier, Vermont
Carl J. MoserDirector of SchoolsThe Lutheran Church Missouri SynodSt. Louis, Missouri
3
John A. MurphySuperintendent of SchoolsCharlotte-Mecklenburg Schoolsamniotic, North Carolina
Michael T. NettlesProfessorUniversity of MichiganAnn Arbor, Michigan
Honorable Carolyn PollanArkansas House of RepresentativesFort Smith. Arkansas
Thomas TopuzesSenior Vice PresidentValley Independent BankEl Centro, California
Marilyn WhirryEnglish TeacherMira Costa High SchoolManhattan Beach, California
Emerson J. ElliottActing Assistant Secretary for Educational
Research and Improvement (Ex-Officio)U.S. Department of EducationWashington, D.C.
Roy TrubyExecutive Director, NAGBWashington. D.C.
NATIONAL CENTER FOR EDUCATION STATISTICS
INTERPRETINGNAEP SCALES
Gary W. Phillips Ina v S MullisMary Lyn Bourque Paul L. Williams Ronald K. Hambleton
Eugene H. Owen Paul E. Barton
APRIL 1993
Office of Educational Research and ImprovementU.S. Department of &Emotion
4
U.S. Department of EducationRichard W. RileySecretary
Office of Educational Research and ImprovementEmerson J. ElliottActing Assistant Secretary
National Center for Education StatisticsEmerson J. ElliottCommissioner
National Center for Education Statistics
"The purpose of the Center shall be to collect, analyze, anddisseminate statistics and other data related to educationin the United States and in other nations."Section 406(b)of the General Education Provisions Act, as amended (20U.S.C. 1221e-1).
April 1993
5
TABLE OF CONTENTS
Overview 1
CHAPTER 1: Ways of Interpreting NAEP Scales 5
Background 5
1. Percentage Correct For Each Item 72. Average Percent Correct 14
Improving the Summary Measure: The NAEP Scales 16The Need to Interpret the NAEP Scales 17
3. Item Mapping on the NAEP Scales 194. Scale Anchoring 275. Achievement Levels 35
Differences between Anchor Levels and Achievement Levels 35The 1992 Level-Setting Activity 36Policy-based and Operationalized Definitions 38Cut-ScoresSelection of Exemplar Exercises 49Alternative Methods for Interpreting the NAEP Scales 51
6. Building the Interpretation of the Scale into the Instruments 517. Benchmarking the NAEP Scales 54
Summary 61
CHAPTER 2: Issues in Interpreting NAEP Scales 63
Background 63
1. Norm-referenced and Criterion-referenced Interpretations 642. Validity 663. Validity Issues with Scale Anchoring 674. Validity Issues with Achievement Levels 74
Interpretations of the Point 300 on the NAEP Mathematics Scale 79
Summary 83
APPENDIX 85Exemplar Exercises for Scale An.thoring 87Exemplar Exercises for Achievement Levels 93
Acknowledgments
This report would not have been possible without the timeless work of many
dedicated people. In particular we would like to thank Roger Herriott for his insightful
observations and experience in how Federal statistical agencies should handle issues of
changing metrics. We would also like to thank Maureen Treacy for her managerial and
organizational assistance, and Angie Miles for her typing and word processing expertise.
Suellen Mauchamer greatly facilitated the whole process of printing and dissemination.
Eugene Johnson, Chancey Jones, and Kent Ashworth provided invaluable reviews and
support. We also want to thank Sue Ahmed, Larry Feinberg, Dan Kasprzyk, and Larry
Ogle for their many helpful suggestions. Drew Bowker was responsible for the special
analyses conducted for Chapter One. Sharon Davis-Johnson also contributed substantially
to typing Chapter One.
iv
7
OVERVIEW: THE ISSUES
This report deals with a variety of ways that have been, or could be, used to
interpret the scales used in the National Assessment of Educational Progress (NAEP).
NAEP is a congressionally mandated assessment survey that, under its current
authorization (PL-100-297), is "placed in the National Center for Education Statistics" and
reports "directly to the Commissioner for Educational Statistics." The Commissioner is to
conduct the survey with the advice of the National Assessment Governing Board (NAGS),
which will "formulate the policy guidelines for the National Assessment." Having such high
visibility in a Federal statistical agency places demands on NAEP to be understandable to a
wide range of audiences. In particular policymakers, researchers and other users ofassessment results need to understand the methods used for reporting NAEP, or at leasthave a reference or set of guidelines that provide such an understanding. That is theprimary purpose of this report.
Having a reference is particularly important when the methods of reporting
are changing. Such a change is taking place now, in 1993, as the National Center for
Education Statistics (NCES) begins to report NAEP results by achievement levels instead of
the anchor levels that have been in place since 1984.1 Other statistical agencies have dealtwith changes in reporting methods by using both the old and new methods for a period of
time. The purpose is to give the professional community and the public the opportunity to
understand and accept the difference and provide time for researchers to evaluate the new
approach. This is especially necessary when the old method is well established and
accepted and the new approach is controversial and more visible.
The Census Bureau used this approach in changing its measure of poverty.When poverty levels were set in the early 1960s, there were few forms of noncash
assistance received by poor people. As a result, such assistance was not considered as partof the definition of "income," which was then compared with the poverty thresholds to
determine poverty status. However, during the next two decades the largest increase inlow-income assistance has been in noncash programs, e.g., food stamps, Medicaid and
'Achievement levels were reported in 1990 for the NAEP mathematics scale. However these reports were issued by theNAGB, not NCES (which is a Federal statistical agency).
1
housing subsidies. Since these benefits were not considered part of income, they had no
effect on the poverty estimates released by the Census Bureau. There was much criticism
of (1) this narrow income definition and (2) the exclusion of a large portion of assistance to
low income people in the measurement of poverty. In the early 1980s the Census Bureau
began an aggressive research program to confront this issue. It issued a series of technical
reports providing alternative estimates and an ongoing discussion of measurement issues.
As part of the process, a number of conferences were held and consensus building activities
occurred. Although basic consensus now exists for how to measure these items, the 1990
estimates were still published in a "Research and Development" report. Current reports
provide measures of alternative concepts of income, each of which has its uses. In the
process new issues and controversies have arisen.
The Census Bureau change in the definition for reporting poverty in the
1980s is analogous to NCES's change in reporting student achievement in the 1990s. The
old method of reporting on what students know and can do (anchor levels) is shifting to the
new method of standards based reporting which emphasizes what students should know
and should be able to do (achievement levels). The current report will help readers make
the transition.Chapter 1 covers methods in which NAEP either has used, or could use, to
interpret its scales. The first two approaches are based on the percent correct for each
item, four approaches involve the use of the 0-500 NAEP scale, and one approach uses the
scoring rubric to derive the 0-400 NAEP writing scale. The seven methods are as follows:
1. Percentage Correct for Each Item - Used since the 1970s, these percentagesare referred to as p-values and are computed by region, gender, size ofcommunity, education level of the parent, and race/ethnicity.
2. Average Percentage Correct - In the 1970s this scale served as NAEP's initialsummary measure and was reported for sets of similar items.
3. Item Mapping - This approach was used in the 1985 literacy assessment ofyoung adults. The procedure maps each test item on to the NAEP 0-500scale.
4. Scale Anchoring - This approach was developed by ETS in 1984 as a methodfor describing selected points (standard deviation units) on the NAEP 0-500scale. It describes what students know and can do at each of the anchorpoints (200, 250, 300, 350).
2
9
5. Achievement Levels - Developed by the NAGB in 1990 and 1992 thisapproach uses a judgmental procedure to set basic, proficient and advancedstandards at grades 4, 8 and 12, and content descriptions of what studentsshould know and be able to do at each level.
6. Using Scoring Rubrics - Developed for the 1984-1988 Writing Assessments,this method uses the unsatisfactory, minimal, adequate and elaborated levelsof writing proficiency in the scoring rubrics as the NAEP scale.
7. Benchmarking - This is a potential way of interpreting the NAEP 0-500 scaleby referencing the scores to some external standard such as performance onthe Advanced Placement Test, the New Standards Project, the NationalCouncil of Teachers of Mathematics (NCTM) Standards, or the Pacesettersassessment.
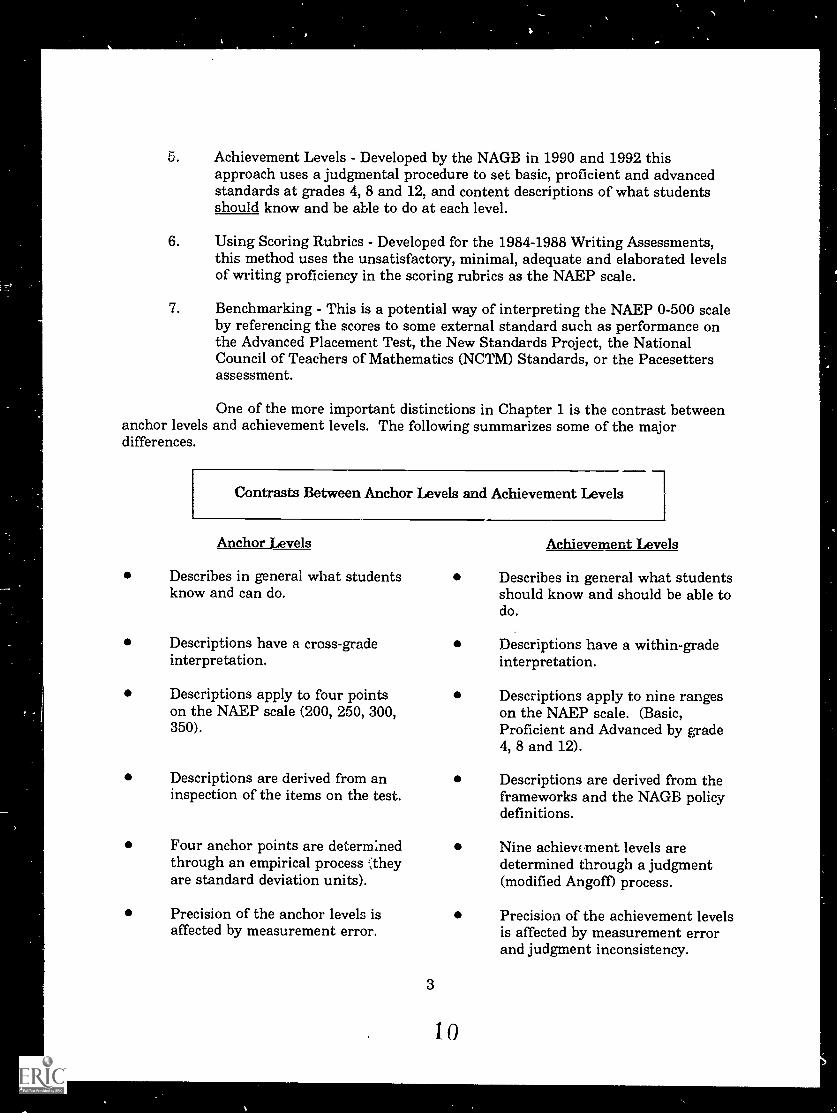
One of the more important distinctions in Chapter 1 is the contrast betweenanchor levels and achievement levels. The following summarizes some of the majordifferences.
Contrasts Between Anchor Levels and Achievement Levels
Anchor Levels
Describes in general what studentsknow and can do.
Descriptions have a cross-gradeinterpretation.
Descriptions apply to four pointson the NAEP scale (200, 250, 300,350).
Descriptions are derived from aninspection of the items on the test.
Four anchor points are detern3inedthrough an empirical process theyare standard deviation units).
Precision of the anchor levels isaffected by measurement error.
3
Achievement Levels
Describes in general what studentsshould know and should be able todo.
Descriptions have a within-gradeinterpretation.
Descriptions apply to nine rangeson the NAEP scale. (Basic,Proficient and Advanced by grade4, 8 and 12).
Descriptions are derived from theframeworks and the NAGB policydefinitions.
Nine achiewment levels aredetermined through a judgment(modified Angoff) process.
Precision of the achievement levelsis affected by measurement errorand judgment inconsistency.
1 0
Chapter 2 discusse3 two issues that are important in interpreting NAEP
results. The first is the distinction between norm-referenced versus criterion-referenced
interpretations, and how NAEP has attempted to provide both approaches to interpreting
results. The second issue is the validity of the inferences from these interpretations.
Validity is defined and is applied primarily to the anchor levels and the achievement levels.
Issues of validity are important with all seven approaches to interpreting NAEP scales, but
they are especially important with the use of achievement lev As. This is because the
achievement levels represent a more visible and controversial effort on the part of the
National Assessment to go beyond describing, to the point of prescribing, recommended
levels of achievement for the nation.
4
Li
CHAPTER 1
WAYS OF INTERPRETING NAEP SCALES
Background
The National Assessment of Educational Progress was designed to provide
comprehensive and dependable information on the progress cf education in the United
States.2 For the curriculum areas assessed, NAEP measures progress in achievement on a
periodic basis, profiles strengths and weaknesses in students' understanding, and describes
the home, school, and classroom contexts for learning.
From the initial considerations of feasibility in 1963 to the first National
Assessment in 1969 and over the y3ars since then, NAEP has undergone a series of
changes. NAEP has endeavored to reflect current information needs, as the manytechnological advances in measurement techniques during the last 30 years and the
increasingly complex educational needs of the nation have continually changed the context
for evaluating the meaning of "comprehensive and dependable" data.
Yet, while evolving within the context of changing times, the fundamental
objectives of NAEP, as well as some of the general issues in implementation, have remained
the same:
1. How can an appropriate set of objectives be developed?
2. What should the specifications be for the construction of new tests?3. In what ways should the National Assessment results be reported?
4. How can these results be made meaningful?
The questions above were among those raised by John Gardner, then
president of the Carnegie Corporation, to provide some structure for the deliberations at
2Ralph W. "Let's Clear the Air on Assessing Education," from The Nation's Schools, (Chicago, II: McGraw-Hill, Inc.,1966).
5
the first conference on the feasibility of conducting a national assessment of education.3
The essential goal of providing comprehensive and dependable data about educational
achievement remains a vital concern, but today discussions revolve around how to improve
the relevance of the data to be collected, the measurement methods involved, and the ways
the data are analyzed and reported.
The original questions remain basic to guiding improvement and retain a
freshness after years, but the environment for considering their answers has changed
dramatically. Eight experts in statistics and educational measurement and six foundation
members joined the U.S. Commissioner of Education, Francis Keppel, and his staff at that
first national assessment meeting. Today, thousands of individuals across the country are
involved in implementing and improving educational assessments. How best to measure
educational p.rcgress is a topic of spirited national debates. Projects are underway to
develop and implement national standards defining competent educational achievement,
and a number of major efforts are being made to design "break the mold" assessments.
Recently, the National Council on Education Standards and Testing recommended
developing an entire system of assessments to monitor progress toward common standards,
involving states and school districts as well as NAEP.4
Improving its approaches has been an historically intrinsic goal of those who
have led and shaped NAEP. Since its inception, the descriptions of important learning
within each curriculum area that define what NAEP should cover have been based on a
consensus approach, involving educators, administrators, policymakers, and interested
citizens. These descriptions, which began as lists of objectives established for each
curriculum area, supported by worthwhile pieces of knowledge and skills classified under
each objective, have evolved into integrated frameworks that address the increasing
competencies needed for employability, personal development, and citizenship, and that
account for contemporary research. Currently, discussions have begun abcut the possibility
of aligning NAEP with the planned national education standards.
3Jarnes A. Hazlett, "A History of the National Assessment of Educational Progress 1963 - 1973," (unpublished dissertation).
4The National Council on Education Standards and Testing, Raising Standards For American Education, (Washington,D.C.: U.S. Department of Education, 1992).
6
1. 3
The assessment instruments developed to measure student achievement
originally were comprised of discrete tasks, so the character of the response to a single
question or activity task would be the basis for a judgment about student learning. This
approach, which was modified during the late 1970s and 1980s in favor of more cost
efficient and easily summarized questions, is now enjoying a resurgence in an updated form.
Currently, performance tasks such as "hands-on" science investigations, are an important
component of NAEP assessments in each curriculum area, and the assessment results are
reported in terms of discrete tasks.
The NAEP analysis and reporting methods also have changed considerably
since the inception of the project. Yet, providing the most relevant and useful data to the
±verse NAEP audiences of policymakers, educators, and interested citizens remains a
continual challenge. The questions about how to report NAEP results in meaningful ways,
raised at the initial national assessment conference, are still pertinent 30 years later.
To provide background for continued exploration of the most effective
strategies for reporting NAEP data to its numerous constituencies, this chapter presents
information about ways NAEP data have been presented during the past 25 years. It also
looks to the future, describing alternative ways to report and interpret results in the
context of the national goals, emerging national standards, and increasingly more
sophisticated measurement technology.
1. The Percentage Correct for Each Item
Because NAEP initially emphasized the importance of individual test
questions having intrinsic merit, the first reports released by NAEP contained numerous
individual test questions together with their respective "p-values." Essentially, a p-value is
the percentage of the student population that answered the question correctly. P-values
were computed by region, gender, size of community, education level of the parent, and
race/ethnicity. This approach was in distinct contrast to tests that give each student a
7
1 4
score. However, NAEP's aim was not to describe individuals, but groups of students --
what proportion of them know this or can do that?5
The need to describe results for groups of students, rather than to score
scores to individuals, has enabled NAEP to adopt a matrix sampling appvoach whereby
students do not take the entire assessment in a curriculum area, but only a portion of it.6
Results are obtained for all the questions in the assessment by sampling a number of
nationally representative groups of students and giving each group part of the assessment.
This reduces the burden for individual students and permits many more questions to be
asked across different groups of students. Thus, NAEP has been able to collect data for
hundreds of questions and provide a comprehensive picture of students' performance within
each curriculum area.The actual number of individual questions included in the early report,'
depended on the number of items in the assessment, and on how many of those were
released to the public. In the first report for each curriculum area assessed, from 40 to 50
percent of all items assessed were released into the public domain. The unreleased items
were kept secure for readministration in future assessments to measure trends. Because
measuring trends requires that some portion of the measures be retained from assessment
to assessment, maintaining security for part of the items from assessment to assessment
continues to be an integral part of the NAEP design.
Percentages of correct responses to individual items provide very interesting
information about educational achievement. The results from individual items can be used
to highlight areas of strengths and weaknesses, or, viewed collectively, the results can be
used to create an overall picture of achievement. As a brief illustration, scrutiny of the
items contained in the 1992 mathematics assessment reveals that 89 percent of the fourth
graders were able to multiply 3 by 405 and divide 108 by 9, when a calculator was provided.
Seventy-two percent recognized that "three-hundred fifty-six thousand, ninety-seven" is
356,097. They also displayed beginning problem solving skills. Sixty-seven percent of the
fourth graders recognized that if you had 50 hamburgers and 38 children, 12 could have
5National Assessment of Educational Progress, Report I, 1969-1970 Science: National Results and Illustrations of GroupComparisons, (Denver, CO: Education Commission of the States, 1970).
&Eugene G. Johnson, "The Design of the National Assessment of Educational Progress," Journal of EducationalMeasurement, 1992, 29, pp. 95-110.
8
15
alb
two hamburgers. Forty-six percent were able to determine the amount of fencing needed
when shown a figure of a rectangular garden 8 feet by 10 feet. Thirty-seven percent
figured out that 10 pages in a photo album would be required for 88 photographs, if 9
pictures fit on a page. However, only 21 percent could calculate the amount of change that
should be received from $10.00 if they bought two calculators for $3.29 each. The same
percentage could determine how much flour was needed for three batches of cookies, if one
batch needed 1 and 1/3 cups.
At grade 8, students demonstrated success with simple word problems. For
example, 91 percent knew how much was charged per car if a car wash raised $84.00 and
21 cars were washed. They were less successful with multi-step problems and had difficulty
communicating about mathematics. Sixty-three percent of the eighth graders explained in
writing or by example how a number can be made smaller by multiplying, but only 13
percent were able to show their work and explain their reasoning involving a probability
problem about combinations of coins. In working with geometric figures, 65 percent of the
eighth graders could find the area of a rectangular carpet 9 feet long by 6 feet long, but
only 29 percent could compute the area of a square when the radius of an inscribed circle
was given. They also demonstrated varied performance on items measuring their
understanding of numbers -- 51 percent recognized that 1/2 is close to 0.52, and 22 percent
identified how many millions are in a billion.
At grade 12, students were able to solve traditional word problems in the
context of real-life situations. For example, 88 percent determined the answer to a question
about a checkbook balance, and two questions about the amount of change to be received
were answered by 81 percent and 75 percent of the twelfth graders, respectively. More
complex problems, however, were answered correctly by far fewer studeats. Only 5 percent
could determine yearly costs of videotape rentals at two different stores, given information
about charges, penalties, bonuses, and the number of tapes rented. In the content areas of
geometry, statistics, and algebra, 40 percent could evaluate 6n + 15 for n = 1, 2, and 3; 41
percent could find the slope of a line in the xy-plane, and 51 percent could determine the
number of dead batteries from a sample. Thirty-one percent could compute an average
from a frequency table, and 21 percent recognized the effect an outlier would have on the
average of a distribution. Twenty-six percent could solve a system of equations, and 7
percent could find the degree measure of an angle in a pyramid.
9
1 6
Showing items along with their percentages correct is still an important way
to report NAEP data. Most NAEP reports contain some examples of items to provide
descriptive illustrations of summarized results, and the media as well as magazine articles
often include example questions as part of their stories.
Still, the early mode of reporting many items together with their p-values
highlighted a problem that persists today -- how to communicate a comprehensive view of
NAEP findings in a brief and accurate manner. When reporting the first wave of
assessments across curriculum areas, it became clear that for the most part, educators,
policymakers, and the public did not have the time to study and assimilate the voluminous
item-by-item results. The problem for NAEP audiences trying to understand the results
became particularly acute when considering findings across a variety of subject areas.
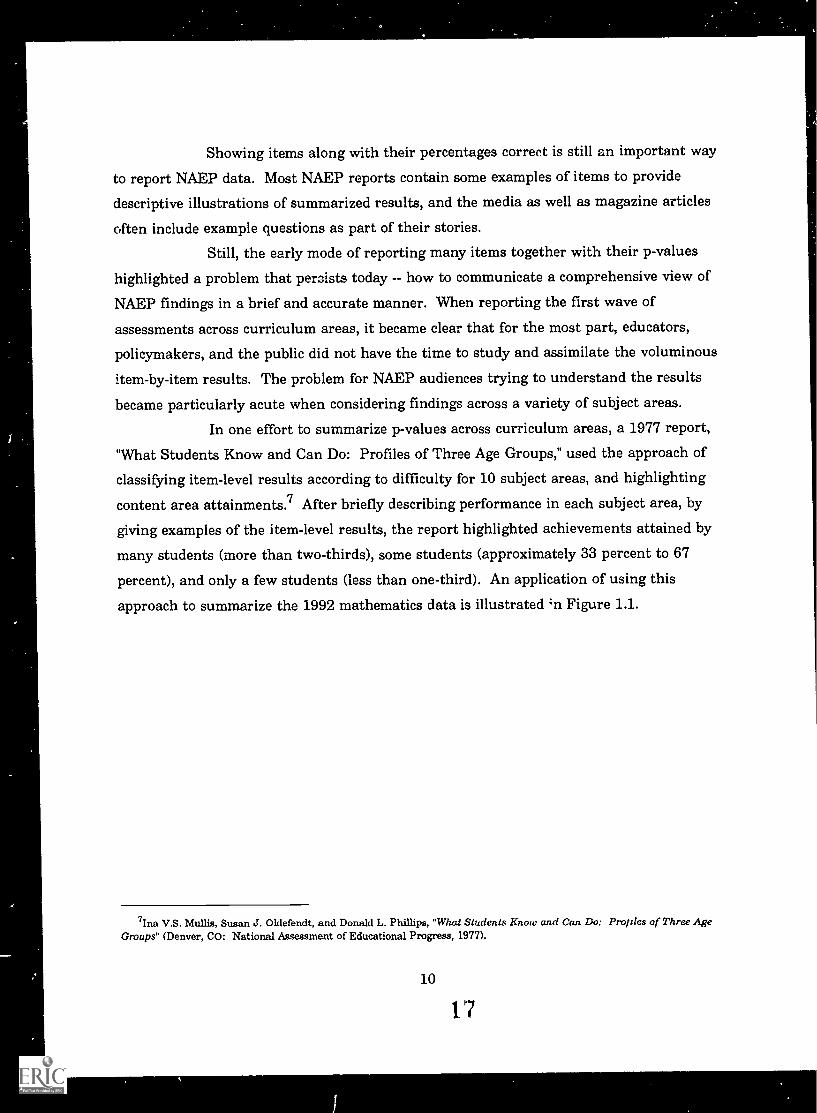
In one effort to summarize p-values across curriculum areas, a 1977 report,
"What Students Know and Can Do: Profiles of Three Age Groups," used the approach of
classifying item-level results according to difficulty for 10 subject areas, and highlighting
content area attainments.7 After briefly describing performance in each subject area, by
giving examples of the item-level results, the report highlighted achievements attained by
many students (more than two-thirds), some students (approximately 33 percent to 67
percent), and only a few students (less than one-third). An application of using this
approach to summarize the 1992 mathematics data is illustrated 'n Figure 1.1.
7Ina V.S. Mullis, Susan J. Oldefendt, and Donald L. Phillips, "What Students Know and Can Do: Pro Ides of Three AgeGrvups" (Denver, CO: National Assessment of Educational Progress, 1977).
10
17
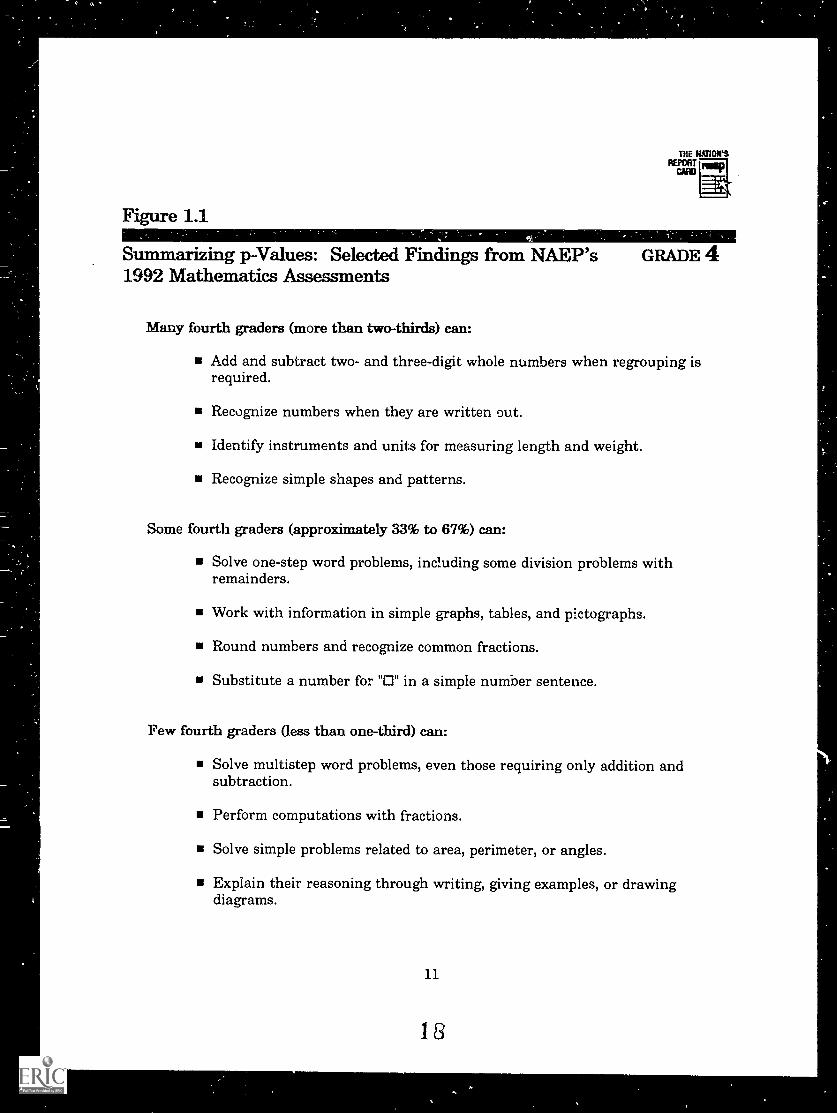
Figure 1.1
Summarizing p-Values: Selected Findings from NAEP's1992 Mathematics Assessments
GRADE 4
Many fourth graders (more than two-thirds) can:
Add and subtract two- and three-digit whole numbers when regrouping isrequired.
Recognize numbers when they are written out.
Identify instruments and units for measuring length and weight.
Recognize simple shapes and patterns.
Some fourth graders (approximately 33% to 67%) can:
Solve one-step word problems, including some division problems withremainders.
Work with information in simple graphs, tables, and pictographs.
Round numbers and recognize common fractions.
Substitute a number for "0" in a simple number sentence.
Few fourth graders (less than one-third) can:
Solve multistep word problems, even those requiring only addition andsubtraction.
Perform computations with fractions.
Solve simple problems related to area, perimeter, or angles.
Explain their reasoning through writing, giving examples, or drawingdiagrams.
11
1 3
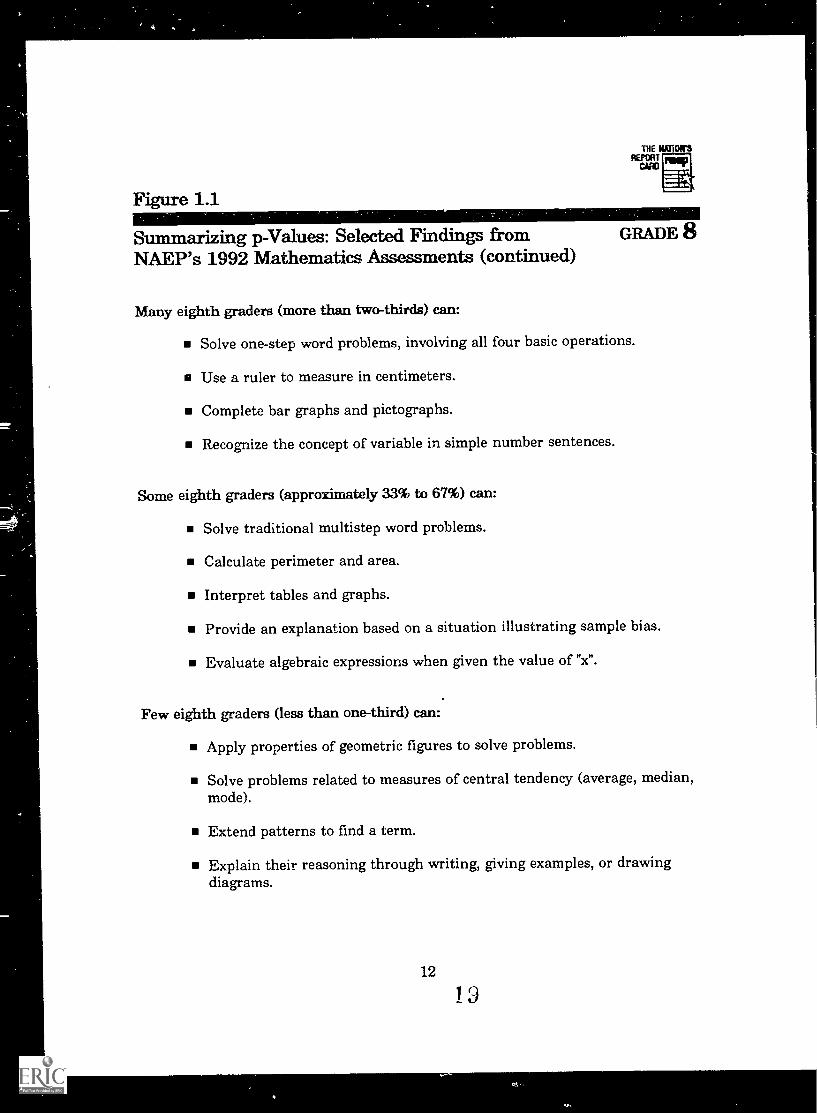
Figure 1.1
Summarizing p-Values: Selected Findings fromNAEP's 1992 Mathematics Assessments (continued)
GRADE 8
Many eighth graders (more than two-thirds) can:
Solve one-step word problems, involving all four basic operations.
Use a ruler to measure in centimeters.
Complete bar graphs and pictographs.
Recognize the concept of variable in simple number sentences.
Some eighth graders (approximately 33% to 67%) can:
Solve traditional multistep word problems.
Calculate perimeter and area.
Interpret tables and graphs.
Provide an explanation based on a situation illustrating sample bias.
Evaluate algebraic expressions when given the value of "x".
Few eighth graders (less than one-third) can:
Apply properties of geometric figures to solve problems.
Solve problems related to measures of central tendency (average, median,mode).
Extend patterns to find a term.
Explain their reasoning through writing, giving examples, or drawingdiagrams.
12
1 '3
Figure 1.1
Summarizing p-Values: Selected Findings fromNAEP's 1992 Mathematics Assessments (continued)
Many twelfth graders (more than two-thirds) can:
Solve traditional multistep word problems.
Read tables and a variety of graphic formats.
Recognize properties of common geometric figures.
GRADE 12
Some twelfth graders (approximately 33% to 67%) can:
Perform operations with exponents.
Apply an understanding of geometric relationships for common figures orsolids (e.g., rectangles and cubes).
Relate the information presented in tables to information in graphs.
Solve simple linear equations.
Few twelfth grades (less than one-third) can:
Apply an understanding of geometric relationships for less common figuresor solids (e.g., pyramids).
Demonstrate an understanding of the coordinate system in the xy-plane.
Determine measures of central tendency from tables or graphs.
Extend relatively complex patterns.
Solve problems about functions.
Explain their reasoning through writing, giving examples, or diagrams.
13
2 0
Average Percentage Correct
As the second wave of assessments was conducted in the 1970s and
trend results became available, the need to report primarily by appropriate summary
measures increased. NAEP needed a systertic and succinct way to respond to the
basic question of whether performance in e., curriculum area improved or
declined.
After considerable deliberation, the Technical Advisory Committee
(chaired by John Tukey at the time) decided that NAEP would adopt the average
percentage correct across the items as its primary summary measure.8 The
advantage of averaging is that it tends to cancel out the effect of peculiarities in
items that can affect item difficulty in unpredictable ways. Furthermore, averaging
made it possible to compare the general performance of subpopulations using less
complex computational methods, and this analysis was more easily understood by
the public.
The reports on trends in performance across time from the first
assessment to the second assessment in various subject areas used this method of
reporting. The percentage correct was computed for each item, and these were
averaged across sets of items to make comparisons across assessments or
subpopulations of students. This method is not the same as the more usual
procedure of counting the number right for each student, averaging across students,
and then converting that number to a percent -- or even, since under the matrix
sampling approach different students are given different sets of diverse items and,
therefore, differing numbers of items, computing the percent of items correct for
each student and taking the average across those students. Because the different
sets of questions can be easier or more difficult, and NAEP's role has been to
sin the early years, the median had been used to make comparisons between the national performance and that of variousdemographic subgroups. But, the growing importance of the summary measure in reporting results led the Technical AdvisoryCommittee to investigate the robustness of numerous measures of central tendency in view of their potential use in reportingNAEP data.
14
describe groups of students rather than individuals, the average percent-correct, ascomputed by NAEP, is the average of the item-by-item percent-correct statistics (p-
values) across a set of items (for example, mathematic questions). Item-by-item p-
values can be computed for students according to different demographic
characteristics, for example, those in different regions of the country (southeast,
northeast, etc.) and the average percent-correct compared across these groups ofstudents.
Despite their advantages and continued use today in some situations,several problems with the average percent-correct statistics became apparent. Forexample, great care had to be taken in comparing across subsets of items within anassessment, because sets of easy or difficult items could make achievement appear tobe overly high or low. Also, there was no way to make comparisons across age levels
unless students were given the same set of items. An interest by NAEP audiences incomparing results across age levels led to a proliferation of results, because anaverage was computed for all the items given at an age group, as well as for thesubsets of items that were in common across more than one age group (i.e., theitems taken by 9- and 13-year-olds, the items taken by 13- and 17-year-olds, and theitems taken by 9-, 13- and 17-year olds). 9
In addition, data about trends in performance across time had to bebased on the same set of items. Otherwise, there was no way to know if changes inthe sets of items were in some way making the assessments easier or more difficult,
and artificially influencing changes in overall achievement. The problem of nothaving a way to account for the effects of updating portions of the items fromassessment to assessment led to cumbersome reporting for the third assessment in acurriculum area. Just for the national results at one age level, three types of overallresults had to be presented -- trend for the items in all three assessments, trend for
9From 1969 fo 1983 NAEP assessed students at ages 9, 13, and 17 but did not collect data from representative samples ofstudents according to grade level. Because definitions of grade levels can change, age was felt to be a more stable basis formeasuring trends. To provide information more useful to education decision-makers, in 1983 NAEP began collecting data forrepresentative samples of students by grade as well as age. Currently, students are assessed at grades 4, 8, and 12.
15
22
the items in the last two assessments, and the average for all the items in the most
recent assessment. 10
Taken together, the various averages to compare across age levels and
the various averages to compare across assessment years resulted in a very user
unfriendly procedure for reporting trends. Furthermore, average percent-correct
statistics have limitations from a measurement perspective. When each student is
administered only a fraction of the items, as in the matrix-sampling approach used
by NAEP, the average percentage correct provides no estimate nf the distribution of
proficiency in the population. This statistic describes the mean performance of
students within subpopulations, but provides no other information about the
distributions of skills among students in the subpopulations. Without some estimate
of overall scores, there is no way to describe distributional performance patterns or
levels for the best students or the worst students across the nation or within
subpopulations.
Improving the Summary Wasure: The NAEP Scales
Since 1983, NAEP has used response scaling methods to summarize
results across items.11 This analytic method overcomes the limitations inherent in
the average percent-correct approach. If similar items require similar skills, the
regularities observed in response patterns can often be exploited to characterize both
respondents and items in terms of a relatively small number of variables. These
variables capture the dominant features of the data, permitting NAEP to estimate
proficiency for students based on a relatively small number of items.12
10 National Assessment of Educational Progress, Three National Assessments of Science: Changes in Achievement, 1969-77 (Denver, CO: author, 1978).
nvn general, NAEP uses response scaling methods in conjunction with an adaptation of matrix sampling where studentsare given interlocking subsets of items (called balanced incomplete block (BIB) spiralling). For a discussion of the introductionof scaling to NAB?, see Samuel Messick, Albert Beaton, and Frederick Lord, A New Design for a New Era (Princeton, NJ:Educational Testing Service, 1983).
12 Albert E. Beaton and Eugene G. Johnson, "Overview of the Scaling Methodolov Used in the National Assessment,"Journal of Educational Measurement, 1992, Vol 29, pp. 163-175.
Robert J. Mislevy, Eugene G. Johnson, and Eiji Muraki, "Scaling Procedures in NAEP," Journal of EducationalStatistics, 1992, 17, pp. 131-154.
16
23
All students can be placed on a common scale, even though none of
the respondents take all of the items within the pool. Using the scale, it becomes
possible to discuss distributions of proficiency for the nation and subgroups of
students and to estimate the relationships between proficiency and a variety of
background variables.
The advent of scaling NAEP data has steadily made the results more
accessible to policymakers and the general public. A series of proficiency scales that
span student performance across grades 4, 8, and 12 have been developed for the
curriculum areas assessed. These scales range from 0 to 500, and they represent a
summary measure of students' performance covering the domain specified in the
objectives framework. Using average proficiency on the scale as a summary measure
of student achievement or percentiles of performance to describe distributions,
comparisons can be made across time and across groups of students using the same
metric.
NAEP introduced new methods of creating composite scales from sets
of scales, so that results can be reported for overall proficiency as well as domains of
interest wi thin curriculum areas. For example, there are mathematics scales for the
content areas included in the mathematics objectives framework underlying the
assessment -- numbers and operations; measurement; geometry; data analysis,
statistics, and probability; and algebra and functions. The composite scale
measuring overall mathematics performance is computed as the weighted average of
the scale scores, where the weights correspond to the relative importance given to
each content area as defined in the framework of objectives. Proficiency on the
composite scale provides a global measure of performance for a curriculum area,
while proficiency on the scales based on relevant subdivisions within that
curriculum area provide more detailed information about performance.
The Need to Interpret the NAEP Scales
Comparisons among average proficiency results or performance
percentiles on the NAEP scales provide easily accessible information about how
educational achievement is ohanging across time, which groups of students are most
and least proficient in particular curriculum areas, and relative strengths and
17
weaknesses across the content subdivisions within curriculum areas. This
information, however, does not tell us what students know and can do within a
curriculum area.
While providing numerous beneficial analytic capabilities beyond those
provided by the item-by-item reporting initially used by NAEP, in and of themselves,
the scales do not describe students' achievement in relation to the specifics covered
in the assessment objectives frameworks.
To answer questions about students' strengths and weaknesses within
particular content areas, additional analyses need to be conducted. For example,
within the area of mathematics, each of the five content areas is comprised of
various concepts, procedures, and problem-solving challenges. Many educators or
parents may want to know, as described in the objectives framework, how much
students undei.stand about numbers (whole numbers, fractions, decimals, signed
numbers, rational and irrational numbers, and numbers expressed in scientific
notation), and if students can use particular operations (addition, subtraction,
multiplication, division, powers, and roots). In particular, some NAEP audiences
may be especially interested in students' ability to apply these mathematics concepts
and procedures to solve problems.
Similarly, the measurement concepts assessed included length
(perimeter and circumference), area and surface area, volume and capacity, weight
and mass, angle measure, time, Inc ey, and temperature. Under geometry, students
were asked to demonstrate knowledge of geometric figures and apply this
information to establish geometric relationships and solve problems.
The data analysis, statistics, and probability questions covered
appropriate methods for gathering data, the presentation of data, and the
interpretation of data. Concepts included measures of central tendency,
distributions, sampling, and probability. In algebra, the topics assessed were road
in scope, including algebra, elementary functions, trigonometry, and some topics
from discrete mathematics.
There are ways to investigate students' performance on individual
items in relation to their performance on the sales. The aim of these kinds of
analy ,es is to provide descriptions of students' item-level performance in light of
18
25
their scale-score estimates. The method used is to investigate how well students at
various levels on the scale did on the individual items. These interpretations, then,
provide information about what the best students know and can do, in comparison
to middle-performing and lower-performing students.
3. Item Mapping onto the NAEP Scales
One way to interpret the information obtained from individual items
in relation to the NAEP scale is through an item mapping technique developed to
report the results of NAEP's 1985 literacy assessment of young adults? For each
item in the assessment, the point on the scale was identified at which individuals
with that level of proficiency had an 80 percent probability of responding correctly.
That is, 80 percent of the individuals scoring at that scale level provided a correct
response to the item.
Selected items were then identified for illustrative purposes,
paraphrased, and graphically displayed along the scale. This information was
provided in conjunction with examples of items in their entirety and data showing
the percentages of students performing at or above various levels on the scale.
An adaptation of the item mapping procedure as applied to the 1992
mathematics results is portrayed in Figures 1.2 through 1.4. In these figures, the
grade 4, 8, and 12 results are presented separately, and for each grade, progressively
higher areas of the scale are mapped. Levels 150 through 300 are mapped for grade
4, Levels 200 through 350 for grade 8, and Levels 250 through 400 for grade 12.
This approach focuses on the area of the scale where most students at each of the
grades assessed performed, and thus permits more items to be shown on a single
page. However, the properties of the NAEP mathematics scale would permit a
condensed presentation where the area from 150 through 400 was mapped, and
selected items from all three grades were shown (perhaps in different colors for the
13Irwin S. Kirsch and Ann Jungeblut, Literacy: Profiles of America's Young Adults (Princeton, NJ: Educational TestingService, 1986).
19
(1
different grades). Conversely, an expanded and more detailed application of this
approach would include an item map for each of the five mathematics content areas
for each of the three grades (e.g., one grade 4 map for numbers and operations, one
for measurement, etc.).The results in Figure 1.2 show that 98 percent of the fourth graders
performed at or above Level 150 on the NAEP mathematics scale, 72 percent
performed at or above Level 200, and 17 percent performed at or above Level 250.
Virtually no fourth grade students performed at or above Level 300.
The items mapped on the left-hand side of the scale reflect items in
the content areas of numbers and operations, measurement, and geometry. The fact
that there are proportionally more items on the left hand side of the scale reflects
the additional weight given those domains at grade 4 in the objectives
framework.14
"For the 1990 and 1992 assessments, at grade 4, the approximate percentage distribution of questions by mathematicalcontent area was 45 percent for numbers and operations, 20 percent for measurement, 15 percent for geometry, 10 percent fordata analysis, statistics, and probability, and 10 percent for algebra and functions. At the other two grades assessed theweightings were as follows: numbers and operations, 30 percent at grade 8 and 25 percent at grade 12; measurement, 15percent at grades 8 and 12; geometry, 20 percent at grades 8 and 12; data analysis, statistics, and probability, 15 percent atgrades 8 and 12; and algebra and functions, 20 percent at grade 8 and 25 percent at grade 12.
20
27
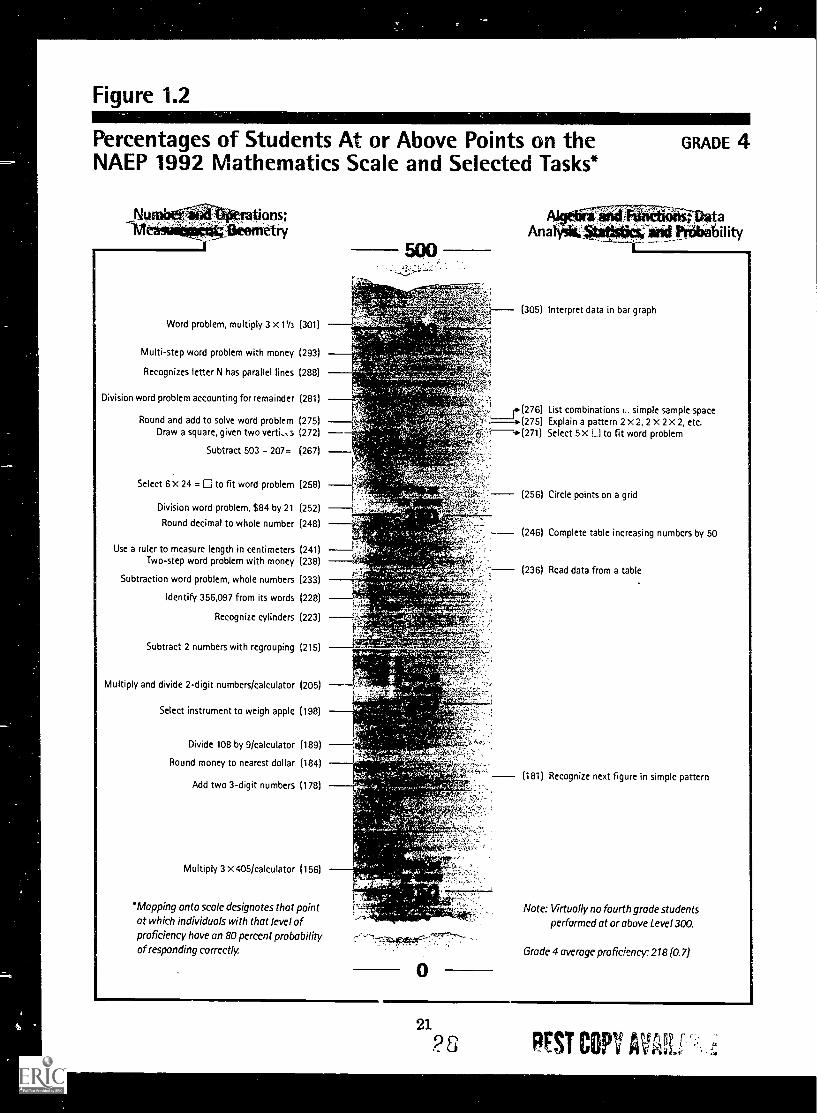
Figure 1.2
Percentages of Students At or Above Points on theNAEP 1992 Mathematics Scale and Selected Tasks*
Numb leritrnierations;etry
GRADE 4
AkjeIaTtitritirfiaiiTDataAnalyslitaltii**4-
Word problem, multiply 3 x 1V3 (301)
Multi-step word problem with money (293)
Recognizes letter N has parallel lines (288)
Division word problem accounting for remainder (281)
Round and add to solve word problem (275)Draw a square, given two verb., s (272)
Subtract 503 - 207= (267)
(305) Interpret data in bar graph
(276) List combinations 1.. simple sample space--*(275) Explain a pattern 2 x 2, 2 X 2 x 2, etc.
271) Select 5 X 0 to fit word problem
Select 6 x 24 = 0 to fit word problem (258)
Division word problem, $84 by 21 (252)
Round decimal to whole number (248)
Use a ruler to measure length in centimeters (241)Two-step word problem with money (238)
Subtraction word problem, whole numbers (233)
Identify 356,097 from its words (228)
Recognize cylinders (223)
Subtract 2 numbers with regrouping (215)
Multiply and divide 2-digit numbers/calculator (205)
Select instrument to weigh apple (198)
Divide 108 by 9/calculator (189)
Round money to nearest dollar (184)
(256) Circle points on a grid
(246) Complete table increasing numbers by 50
(236) Read data from a table
Add two 3-digit numbers (178)(181) Recognize next figure in simple pattern
Multiply 3 x 405/calculator (156)
'Mapping onto scale designates that pointat which individuals with that level ofproficiency have an 80 percent probabilityof responding correctly.
Note: Virtually no fourth grade studentsperformed at or above Level 300.
Grade 4 average proficiency: 218 (0.7)
0
21
28 PFST COPY AUL
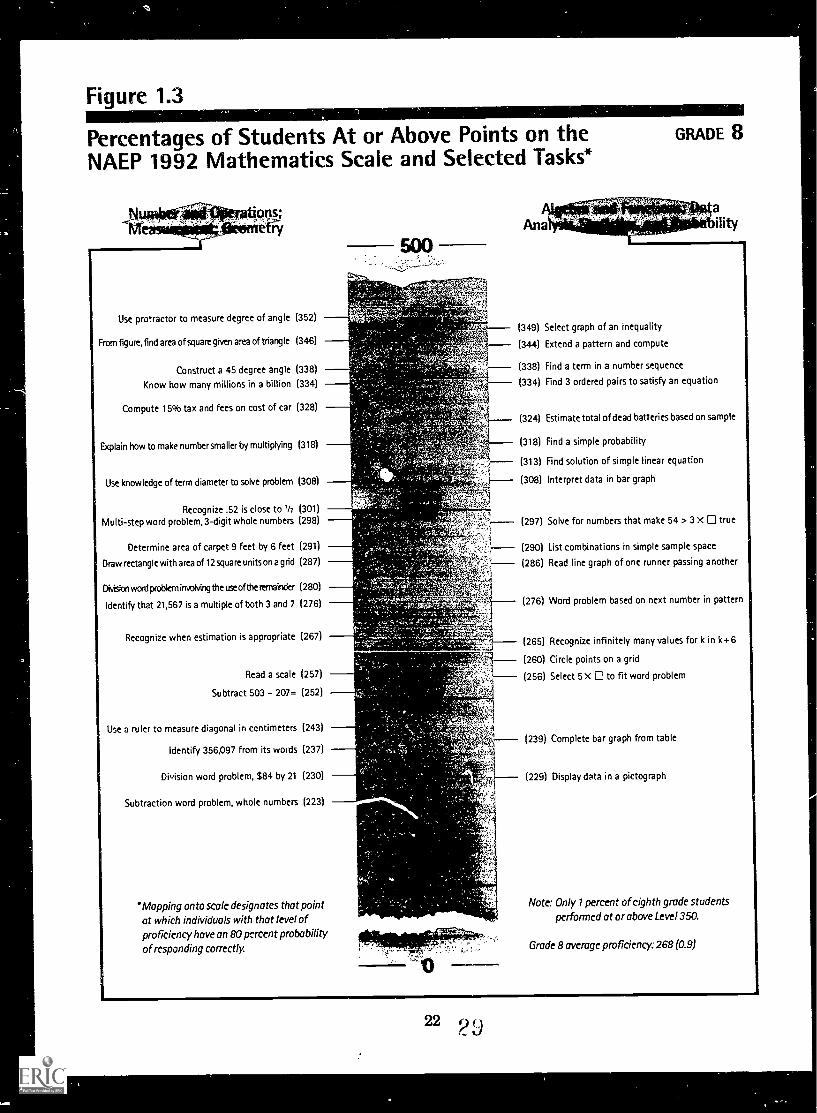
Figure 1.3
Percentages of Students At or Above Points on theNAEP 1992 Mathematics Scale and Selected Tasks*
_Limibetitiops;ivr the*
Use protractor to measure degree of angle (352)
From figure, find area of square given area of triangle (346)
Construct a 45 degree angle (338)
Know how many millions in a billion (334)
Compute 15% tax and fees on cost of car (328)
Explain how to make number smaller by multiplying (318)
Use knowledge of temi diameter to solve problem (308)
Recognize .52 is close to V2 (301)Multi-step word problem, 3-digit whole numbers (298)
Determine area of carpet 9 feet by 6 feet (291)
Draw rectangle with area of 12 square units on a grid (287)
Misico wcfel problem imotving the use of the remainder (280)
Identify that 21,567 is a multiple of both 3 and 7 (276)
Recognize when estimation is appropriate (267)
Read a scale (257)
Subtract 503 207= (252)
Use a ruler to measure diagonal in centimeters (243)
Identify 356,097 from its words (237)
Division word problem, $84 by 21 (230)
Subtraction word problem, whole numbers (223)
'Mapping onto scale designates that pointat which individuals with that level ofproficiency have an 80 percent probability
of responding correctly.
441
(338) Find a term in a number sequence
(334) Find 3 ordered pairs to satisfy an equation
GRADE 8
(349) Select graph of an inequality
(344) Extend a pattern and compute
aility
)01---- (324) Estimate total of dead batteries based on sample
(318) Find a simple probability
(313) Find solution of simple linear equation
) (308) Interpret data in bar graph
(297) Solve for numbers that make 54 > 3 X 0 true
(290) List combinations in simple sample space
j (286) Read line graph of one runner passing another
(276) Word problem based on next number in pattern
',I (265) Recognize infinitely many values for k in k + 6
(260) Circle points on a grid
(256) Select 5 x 0 to fit word problem
(239) Complete bar graph from table
(229) Display data in a pictograph
Note: Only 1 percent of eighth grade students
performed ot or above Level 350.
Grade 8 average proficiency: 268 (0.9)
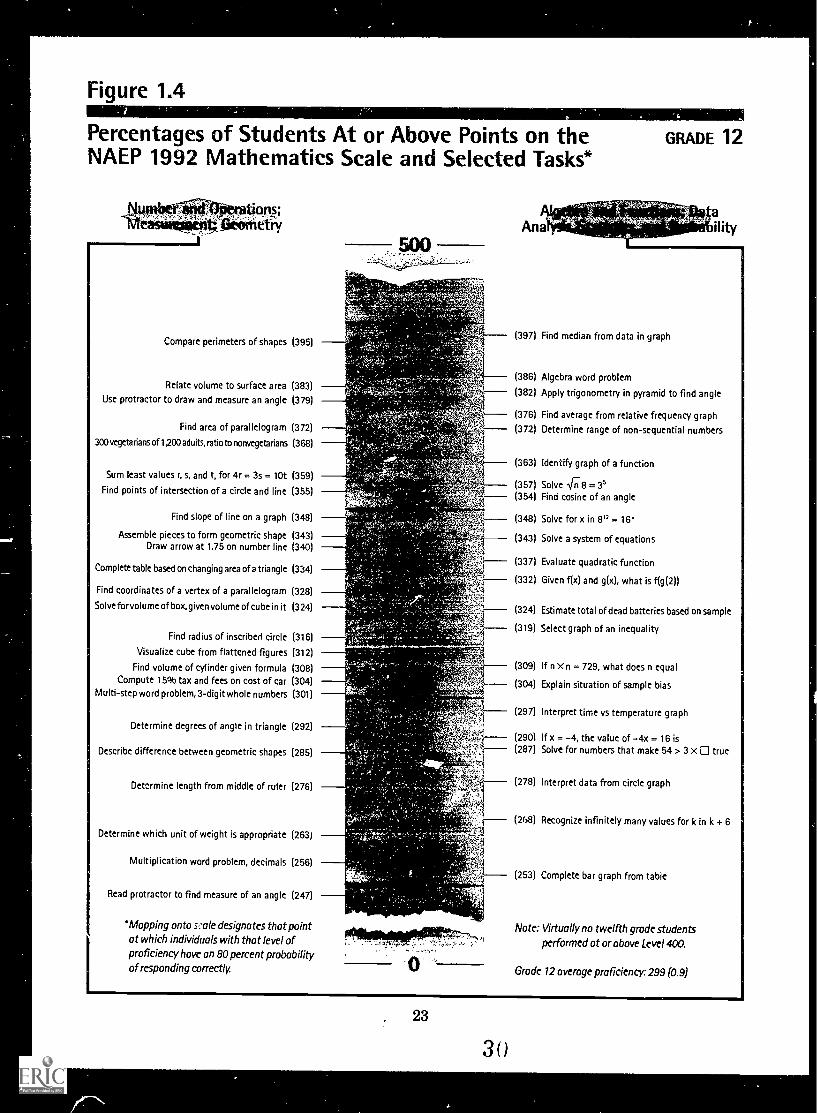
Figure 14
Percentages of Students At or Above Points on theNAEP 1992 Mathematics Scale and Selected Tasks*
11491WQA*Iptions.etry
Compare perimeters of shapes (395)
Relate volume to surface area (383)
Use protractor to draw and measure an angle (379)
Find area of parallelogram (372)
300 vegetarians of 1200, adults, ratio to nonvegetarians (368)
Sum least values r, s, and t, for 4r = 3s = 10t (359)
Find points of intersection of a circle and line (355)
Find slope of line on a graph (348)
Assemble pieces to form geometric shape (343)Draw arrow at 1.75 on number line (340)
Complete table based on changing area of a triangle (334)
Find coordinates of a vertex of a parallelogram (328)
Solve forvolume of box,given volume of cube in it (324)
Find radius of inscribed circle (318)
Visualize cube from flattened figures (312)
Find volume of cylinder given formula (308)Compute 15% tax and fees on cost of car (304)
Multi-step word problem,3-digit whole numbers (301)
Determine degrees of angle in triangle (292)
Describe difference between geometric shapes (285)
Determine length from middle of ruler (276)
Determine which unit of weight is appropriate (263)
Multiplication word problem, decimals (256)
Read protractor to find measure of an angle (247)
'Mapping onto scale designates that pointat which individuals with that level ofproficiency have an 80 percent probabilityof responding correctly.
GRADE 12
(397) Find median from data in graph
(386) Algebra word problem
(382) Apply trigonometry in pyramid to find angle
(376) Find average from relative frequency graph
(372) Determine range of non-sequential numbers
(363) Identify graph of a function
(357) Solve Irr; 8 = 35(354) Find cosine of an angle
(348) Solve for x in 8'2= 16'
(343) Solve a system of equations
(337) Evaluate quadratic function
(332) Given f(x) and g(x), what is f(g(2))
.-- (324) Estimate total of dead batteries based on sample
(319) Select graph of an inequality
(309) If n X n = 729, what does n equal
(304) Explain situation of sample bias
(297) Interpret time vs temperature graph
(290) If x = -4, the value of -4x = 16 is(287) Solve for numbers that make 54 > 3 X 0 true
(278) Interpret data from circle graph
(268) Recognize infinitely many values for k in k + 6
4-- (253) Complete bar graph from tabie
-
Note: Virtually no twelfth grade studentsperformed at or above Level 400.
Grade 12 average proficiency: 299 (0.9)
. 23
30
The items mapped on the right-hand side of the scale represent the
areas of data analysis and algebra, where there were fewer assessment items and
those that were included tended to cover introductory applications of concepts.
Nearly all fourth graders (98 percent) performed at Level 150 or
higher. Those achieving at the lower end of the scale appeared to have a grasp of
basic computation with whole numbers. For example, they could add (178) and
demonstrated some understanding of rounding procedures (184). In contrast, the
higher achieving fourth graders, the 17 percent who performed at or above Level
250 on the NAEP scale, provided correct solutions to word problems, such as
selecting the number sentence (2 X 6 = 0) to represent 2 rows of 6 cookies on a
cookie sheet (258) or finding the answer to a division word problem with a
remainder (281). They also circled points on a grid (256) and were able to list
possible combinations in a simple sampling situation (276). Most of the handful of
fourth graders performing at or above 300 on the scale were able to interpret data
from a bar graph (305).
A comparison between Figure 1.2 and 1.3 indicates growth in
mathematical understanding between grades 4 and 8. Nearly all eighth graders (97
percent) performed at or above Level 200 indicating that they were able to solve
simple word problems using subtraction (223) and division (230). The one-fifth of
eighth graders performing at or above Level 300 on the NAEP scale typically
performed such tasks as explaining one way to make a number smaller by
multiplying (318), computing a 15 percent charge for tax and fees on the cost of a
car (328), and constructing a 45 degree angle (338). In data analysis and algebra,
most were able to interpret data in a bar graph (308) and find the solution of a
simple linear equation (313), respectively. Examples of somewhat more difficult
tasks in these content areas were estimating the total number of dead batteries
based on a sample (324) and selecting a graph for an inequality (349).
As shown in Figure 1.4, half the twelfth graders performed at or above
level 300, demonstrating some understanding of geometry, data analysis, and
algebra. Most were able to calculate how the area of a triangle would change and
provide their results in tabular form (334). A more difficult task for these students
was solving an equation using exponents (348). The top-performing twelfth graders
24
(6 percent attaining Level 350) had a high degree of success in finding the
coordinate points where a circle and line intersected (355) and determining the ratio
of vegetarians to nonvegetarians, if 300 out of 1,200 adults were vegetarians (368).
They demonstrated understanding of geometric relationships by relating volume to
surface area (383) and comparing perimeters of shapes (395). They had somewhat
more difficulty in finding an average from a graph of relative frequency (376) and
applying trigonometry to find the degree measure of an angle in a pyramid (382).
To help us understand the properties of analyses which relate item-
level performance to performance on the overall scale, it is helpful to review the two
types of percentages involved in item mapping and what they mean:
The percentage performing at or above a particular point on the scale.This is the percentage of students whose overall scale-score estimatewas at that level or higher. For example, 17 percent of the fourthgraders performed at Level 250 or higher.
The 80 percent criteria for mapping. On the map, 80 percent of thestudents with that scale-score estimate answered the item correctly.Or, because the model places both students and items on the scale,students with that score estimate are predicted to have an 80 percentchance of success in answering that item or items like it correctly. Togive a concrete example, 80 percent of the fourth graders with a scoreestimate of 252 were able to solve a simple division word problemabout how much was charged per car at a car wash, if 21 cars werewashed and $84.00 was collected. Thus, a student with a scale scoreof 252 would have an 80 percent probability of answering thisquestion correctly. As an extension, this student would have a highprobability of answering other questions similar to the car washquestion correctly (around 80 percent).
Care should be taken in interpretin, the item mapping results to keep
the meaning of these percentages in mind. Taken together, 17 percent of the
students scored at or above 250, and for those who scored at 252, 80 percent
answered the car wash problem correctly. It must be emphasized, however, that
these data reflect probabilities of success based on the performance observed in the
assessment for students at various levels on the scale. In reality, although 80
percent of the fourth graders scoring at 252 answered the car wash problem
correctly, even greater percentages of the students at higher levels on the scale
answered the question correctly. Also, some (but proportionally fewer) students at
25
lower levels on the scale answered the item correctly (and most fourth graders were
at lower levels on the scale). The probabilities of success on this item are less for
students at lower levels of the scale -- much less at the lowest levels. Still, some of
them did answer the item correctly. Therefore, it is not a correct interpretation of
the results that only the 17 percent of students performing at or above 250 could
answer the car wash item correctly. In fact, across all students, regardless of their
scale-score estimate, 58 percent responded correctly to the car wash item.
Looking at items at the lower end of the scale, it is also important to
remember that although almost all students at the higher end of the scale would
answer the item correctly, not all of them would. To illustrate, 98 percent of the
fourth graders performed at or above 150 on the scale. Also, 80 percent of those
scoring at 156 were able to multiple 3 by 405, when a calculator was available.
Thus, the probabilities based on the assessment results indicate that nearly all
fourth graders would be able to solve this problem. In actuality, the p-value was 89
percent.Considering that even knowledgeable adults are likely to make
careless errors or misread questions and, therefore, 100 percent of them would not
answer items correctly, 80 percent is considered a high rate of success on the NAEP
assessment. Also, for items that map at the lower ranges of an interval, nearly all
students at the higher ranges of the interval generally answer the item correctly.
Using the 80 percent probability criteria suggests that in most situations, students
with the scale-score indicated would solve the problem correctly. However, the item
mapping procedure can be implemented using different criteria for success on the
items. For example, an analysis based on a 50 percent probability of success could
be used to indicate emerging skills for fourth graders who performed at various
levels on the scale.
In summary, the item mapping technique, as implemented by NAEP,
describes the types of questions students scoring at particular levels on the scale are
likely to answer correctly (with an 80 percent probability of success). It is a useful
way of profiling results across the range of the scale and is very versatile, as any set
of items for any group of students who participated in the assessment can be
mapped onto the scale. Also, this method is based almost entirely on an empirical
26
W*0
_
process. With the exception of specifying the level of the probability of success for
the analysis and creating the item descriptions, the process of creating the maps isfree of subjective or judgmental steps.
However, it is important to remember that for data about how many
students in the population answered an item correctly, regardless of their overall
performance on the scale, the percentage correct (p-value) is still the appropriatestatistic.
4. Scale Anchoring
Scale anchoring is a procedure to characterize students' performance
at particular points or "anchor levels" on the scale. As implemented for the 1990
and 1992 mathematics assessments, NAEP's scale anchoring procedure was based oncomparing item-level performance by students at four levels on the 0 to 500mathematics composite scale -- Levels 200, 250, 300, and 350.15 In brief, the
analyses delineated four sets of about 50 anchor items each that discriminated
between adjacent performance levels on the scale.16; The four sets of empirically
derived anchor items were studied by panels of mathematics educators who carefullyconsidered and articulated the types of knowledge, skills, and reasoning abilities thatwere demonstrated by correct responses to the items in each set. These descriptions,
together with example anchor items, were then used in conjunction with the
15Ina V.S. Mullis, John A. Dossey, Eugene H. Owen, and Gary W. Phillips, The State of Mathematics Achievement, NAEP's1990 Assessment of the Nation and the Trial Assessment of the States (Washington, D.C.: U.S. Department of Education,1991).
Ina V.S. Mullia, John A. Dossey, Eugene H. Owen, and Gary W. Phillips, The 1992 Mathematics Report Card(Washington, D.C.: U.S. Department of Education, 1993).
Albert E. Beaton and Nancy L. Allen, "Interpreting Scales through Scale Anchoring," Journal of Educational Statistics,1992, 17, pp. 191-204.
16In 1992, 22 items anchored at Level 200 and another 8 almost anchored (alsoconsidered, since they nearly satisfied the
anchoring criteria), at Level 250 there were 45 anchor items and 27 that almost anchored, at Level 300 there were 59 anchoritems and 29 that almost anchored, and at Level 350 there were 43 items and 34 that almost anchored. Of the 432 itemsincluded in the process, 165 did not anchor. In 1990, the totals of anchored and almost anchored items wem: 43 at Level 200,46 at Level 250, 64 at Level 300, and 43 at Level 350. Of the 275 items used in the process, 79 did not anchor.
27
percentages of students performing at or above the four levels to convey a concise
interpretation of the scale results.
To provide a sufficient pool of respondents at each anchor level for the
analyses, students performing at Level 200 on the scale were more broadly defined
as those whose estimated mathematics proficiency was between 187.5 and 212.5,
students at 250 were defined as those with estimated proficiency between 237.5 and
262.5, those at 300 had estimated proficiencies between 287.5 and 312.5, and those
at 350 between 337.5 and 362.5. In theory, anchor levels above 350 or below 200
could have been described; however, so few students in the assessment performed at
the extreme ends of the scale that it was not possible to do so.
After identifying the fourth, eighth, and twelfth graders performing at
the four anchor levels on the scale, two kinds of information were computed for
these students for each item -- the actual number of students at each of the levels
included in the analysis and the percentage who answered the item correctly
(weighted in accordance with the sampling design). Thus, for each item, a p-value is
computed separately for the students performing at each anchor level (four p-values
for each item, as shown later in this section). These analyses were performed for
each grade level at which the item was administered, and for the grade levels
combined, if the item was administered at more than one grade level.
Based on the p-values for each anchor level, the following criteria
were used to identify the items that discriminated between scale levels. That is, the
items that students at one anchor level were more likely to answer correctly than
were students at the next lower level.
Because it was the lowest level being defined, Level 200 was not
analyzed in terms of the next lower level, but was examined for the percentage of
students at that level answering the item correctly. More specifically, for an item to
anchor at Level 200:
1) At least 65 percent of the students at Level 200 answered the
item correctly.
2) At least 100 students were available for the analysis.
The first criterion was established so that items associated with a level
were those for which students at that level would have demonstrated at least some
28
degree of success (at least 65 percent or about two-thirds), and therefore, those
above the level would have an even higher degree of success. The second criterion
provides stability for the p-value estimates.
For an item to anchor at the remaining levels, additional criteria had
to be met. For example, to anchor at Level 250:
1) Sixty-five percent or more of the students at Level 250answered the item correctly.
2) At least 30 percent fewer students at Level 200 than at Level250 answered the item correctly.
3) At least 50 percent of the students at Level 200 answered theitem incorrectly.
4) At least 100 students at both Levels 200 and 250 were availablefor the analysis.
The same principles were used to identify anchor items at Levels 300
and 350. The additional criteria was attempting to find items fairly likely to be
answered correctly by students at one level, but unlikely at the levels below.
Essentially, for any given anchor item, students at the anchor level are likely to
answer the question correctly (65 percent or more likely), while those at the next
lower level are less likely to answer the question correctly (at least 30 percent less
likely). Also, students at the next lower level are somewhat likely to get the item
wrong (at least half of them). Collectively, as identified through this procedure, the
mathematics items at each anchor level represented advances in students'
understandings from one level to the next -- mathematical topics providing items
students at that level were more likely to answer correctly than were students at the
next lower level.
In preparation for use by panelists, the items were assembled with
their full anchoring documentation and scoring guides (for open-ended items) and
placed in notebooks by anchor level order concluding with the "did not anchor"
items. Within each anchor level, the items were arranged in accordance with the
classifications contained in the objectives framework. From 15 to 20 panelists,
representing mathematicians; mathematics educators at the college, secondary, and
elementary levels; and state and district mathematics supervisors, met for three days
29
3G
..
to identify systematically the mathematical knowledge, understanding, and problem-
solving abilities demonstrated by the students answering each item correctly. These
descriptions were then summarized to develop the characterizations of performance
for each anchor level. After being briefed in the anchoring process and given their
assignment, panelists worked independently in two groups to analyze the items,
draft their descriptions of performance for each anchor level, and select illustrative
items to support their descriptions. On the third day, panelists and staff worked
together as a whole to combine the two independently derived sets of descriptions.
Each of the two times this process was used, both groups agreed that
the two drafts were very similar. However, the cross-validation process was helpful
and permitted more individuals to be involved in the process. It also should be
noted that although the 1992 assessment was designed to measure trends from 1990,
the anchoring process was conducted to update the descriptions to reflect some
evolution in the 1992 items. Some items in the 1992 assessment had been carried
forward from 1990, but others were newly developed measures of the mathematics
framework intended to reflect improvements in assessing mathematics achievement.
Therefore, as anticipated, the 1992 descriptions were very similar to the 1990
descriptions, but there were variations.
30
37
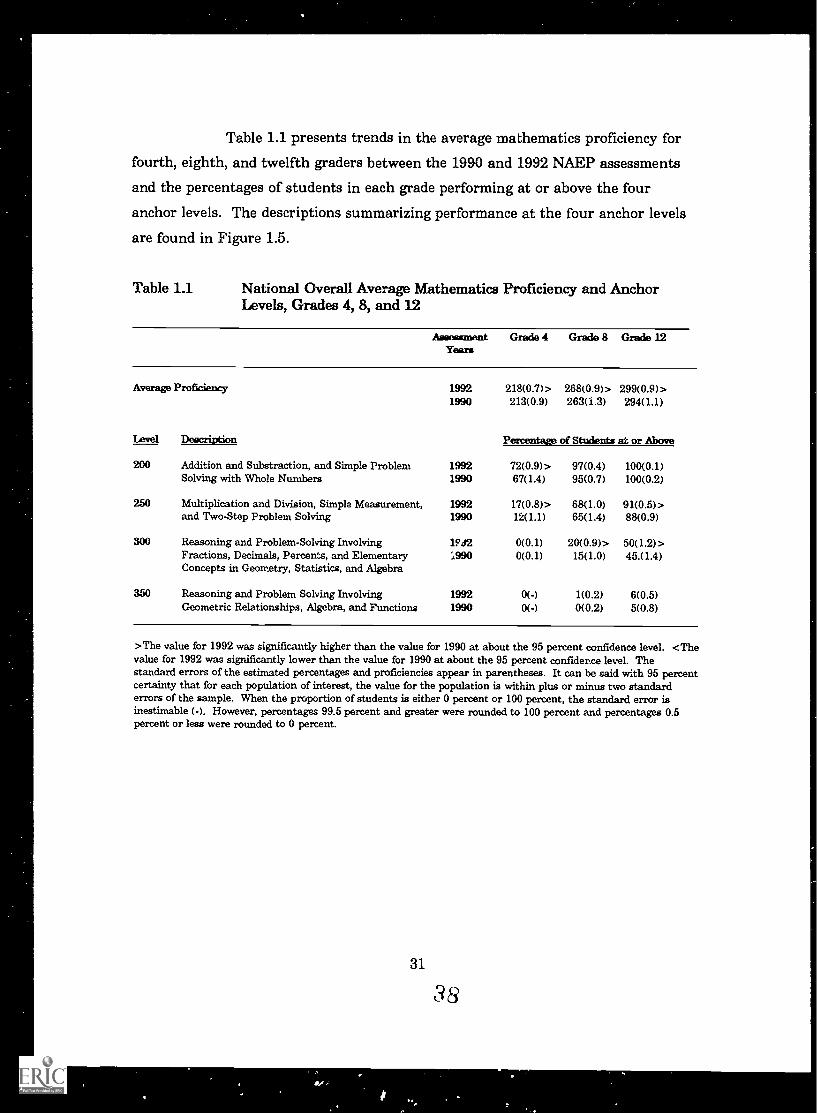
Table 1.1 presents trends in the average mathematics proficiency for
fourth, eighth, and twelfth graders between the 1990 and 1992 NAEP assessments
and the percentages of students in each grade performing at or above the four
anchor levels. The descriptions summarizing performance at the four anchor levels
are found in Figure 1.5.
Table 1.1 National Overall Average Mathematics Proficiency and AnchorLevels, Grades 4, 8, and 12
AssessmentYears
Grade 4 Grade 8 Grade 12
Average Proficiency 19921990
218(0.7)>213(0.9)
268(0.9)> 299(0.9)>263(1.3) 294(1.1)
Level Deacription Percentage of Students at or Above
200 Addition and Substraction, and Simple Problem 1992 72(0.9)> 97(0.4) 100(0.1)Solving with Whole Numbers 1990 67(1.4) 95(0.7) 100(0.2)
250 Multiplication and Division, Simple Measurement, 1992 17(0.8)> 68(1.0) 91(0.5)>and Two-Step Problem Solving 1990 12(1.1) 65(1.4) 88(0.9)
300 Reasoning and Problem-Solving Involving 1°ó2 0(0.1) 20(0.9)> 50(1.2)>Fractions, Decimals, Percents, and Elementary ;.990 0(0.1) 15(1.0) 45.( 1.4)Concepts in Geometry, Statistics, and Algebra
350 Reasoning and Problem Solving Involving 1992 0(-) 1(0.2) 6(0.5)Geometric Relationships, Algebra, and Functions 1990 0(-) 0(0.2) 5(0.8)
>The value for 1992 was significantly higher than the value for 1990 at about the 95 percent confidence level. <Thevalue for 1992 was significantly lower than the value for 1990 at about the 95 percent confider.ce level. Thestandard errors of the estimated percentages and proficiencies appear in parentheses. It can be said with 95 percentcertainty that for each population of interest, the value for the population is within plus or minus two standarderrors of the sample. When the proportion of students is either 0 percent or 100 percent, the standard error isinestimable (-). However, percentages 99.5 percent and greater were rounded to 100 percent and percentages 0.5percent or less were rounded to 0 percent.
31
41/
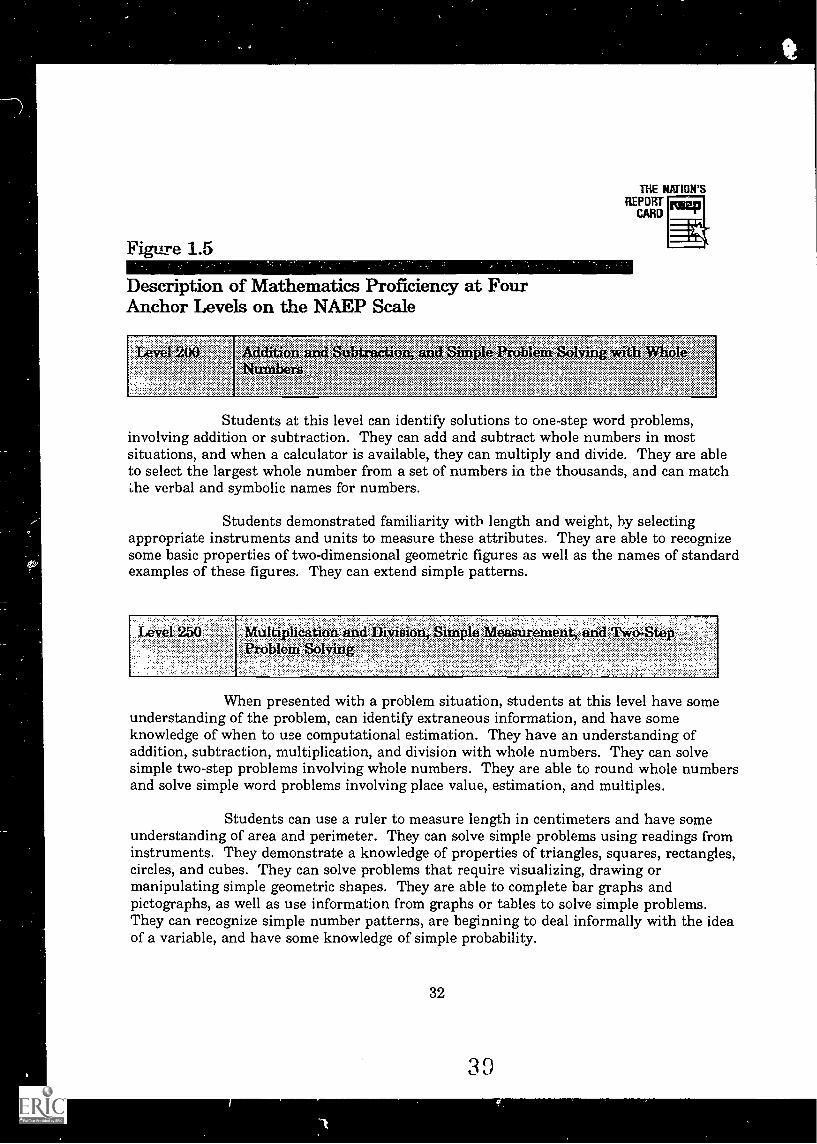
THE NAIION'SREPORT
CARD
Figure 1.5
Description of Mathematics Proficiency at FourAnchor Levels on the NAEP Scale
Leve12°° Addition and Subtraction, and Simple Problem Solving with leNumbers
Students at this level can identify solutions to one-step word problems,involving addition or subtraction. They can add and subtract whole numbers in mostsituations, and when a calculator is available, they can multiply and divide. They are ableto select the largest whole number from a set of numbers in the thousands, and can matchLhe verbal and symbolic names for numbers.
Students demonstrated familiarity with length and weight, hy selectingappropriate instruments and units to measure these attributes. They are able to recognizesome basic properties of two-dimensional geometric figures as well as the names of standardexamples of these figures. They can extend simple patterns.
When presented with a problem situation, students at this level have someunderstanding of the problem, can identify extraneous information, and have someknowledge of when to use computational estimation. They have an understanding ofaddition, subtraction, multiplication, and division with whole numbers. They can solvesimple two-step problems involving whole numbers. They are able to round whole numbersand solve simple word problems involving place value, estimation, and multiples.
Students can use a ruler to measure length in centimeters and have someunderstanding of area and perimeter. They can solve simple problems using readings frominstruments. They demonstrate a knowledge of properties of triangles, squares, rectangles,circles, and cubes. They can solve problems that require visualizing, drawing ormanipulating simple geometric shapes. They are able to complete bar graphs andpictographs, as well as use information from graphs or tables to solve simple problems.They can recognize simple number patterns, are beginning to deal informally with the ideaof a variable, and have some knowledge of simple probability.
32
39
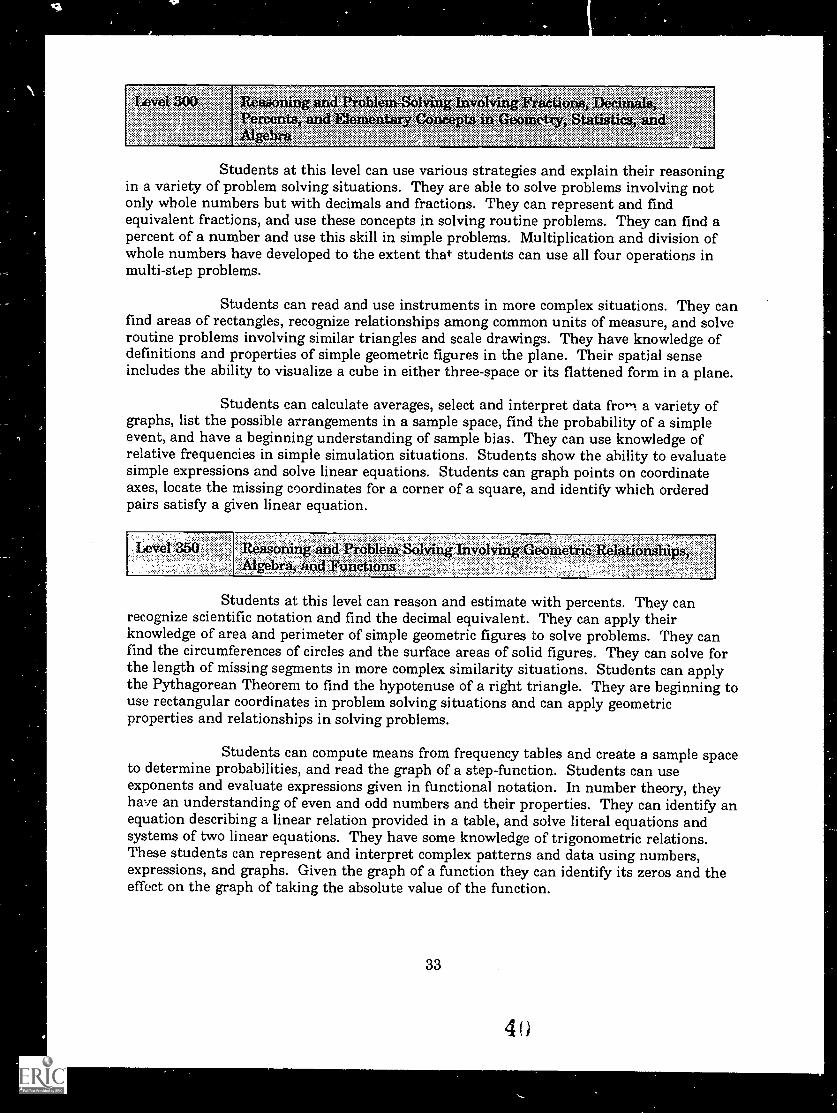
Loyd 300 Retwonitig and Problom-So Involving Fractionso Decimals,Percents, and Elementaty Concepts in Geoinc:try, Statistics, andAlgebra
Students at this level can use various strategies and explain their reasoningin a variety of problem solving situations. They are able to solve problems involving notonly whole numbers but with decimals and fractions. They can represent and findequivalent fractions, and use these concepts in solving routine problems. They can find apercent of a number and use this skill in simple problems. Multiplication and division ofwhole numbers have developed to the extent that students can use all four operations inmulti-step problems.
Students can read and use instruments in more complex situations. They canfind areas of rectangles, recognize relationships among common units of measure, and solveroutine problems involving similar triangles and scale drawings. They have knowledge ofdefinitions and properties of simple geometric figures in the plane. Their spatial senseincludes the ability to visualize a cube in either three-space or its flattened form in a plane.
Students can calculate averages, select and interpret data frorn. a variety ofgraphs, list the possible arrangements in a sample space, find the probability of a simpleevent, and have a beginning understanding of sample bias. They can use knowledge ofrelative frequencies in simple simulation situations. Students show the ability to evaluatesimple expressions and solve linear equations. Students can graph points on coordinateaxes, locate the missing coordinates for a corner of a square, and identify which orderedpairs satisfy a given linear equation.
ve :350
Students at this level can reason and estimate with percents. They canrecognize scientific notation and find the decimal equivalent. They can apply theirknowledge of area and perimeter of simple geometric figures to solve problems. They canfind the circumferences of circles and the surface areas of solid figures. They can solve forthe length of missing segments in more complex similarity situations. Students can applythe Pythagorean Theorem to find the hypotenuse of a right triangle. They are beginning touse rectangular coordinates in problem solving situations and can apply geometricproperties and relationships in solving problems.
Students can compute means from frequency tables and create a sample spaceto determine probabilities, and read the graph of a step-function. Students can useexponents and evaluate expressions given in functional notation. In number theory, theyhave an understanding of even and odd numbers and their properties. They can identify anequation describing a linear relation provided in a table, and solve literal equations andsystems of two linear equations. They have some knowledge of trigonometric relations.These students can represent and interpret complex patterns and data using numbers,expressions, and graphs. Given the graph of a function they can identify its zeros and theeffect on the graph of taking the absolute value of the function.
33
4
At grade 4, the percentage of students pe:(brming at or above Level 200 rose
from 1990 to 1992, indicating an increase in the proportion of fourth graders able to
identify solutions to one-step word problems involving addition or subtraction. Ther( was
also an increase in the percentage of fourth graders (from 12 to 17 percent) who could use
multiplication and division in the context of two-step problem-solving (Level 250).
Probably because material covered at Level 300 does not typically occur in the curriculum
until later than fourth grade, only a handful of fourth graders reached this level.
Virtually all of the eighth graders performed at or above Level 200 in both
assessments. Similarly, about two-thirds of these students performed at or above Level 250
in both assessments, indicating little change across time in eighth graders' ability to use
multiplicative reasoning or compute with whole numbers using all four numerical
operations. However, the percentage of students performing at or above Level 2:10, typified
by some mathematical understanding of geometry, data analysis, and algebra, increased
between 1990 and 1992, from 15 to 20 percent.
Most twelfth graders in both assessments performed at or above Level 250,
indicating some facility in two-step problem solving. That one-half demonstrated success
with problems involving fractions, decimals, percents, and elementary algebra, represented
an improvement from 1990, when only 45 percent performed at or above Level 300.
However, only 6 percent demonstrated a breadth of mathematical understanding that
included problem-solving involving geometric and algebraic relationships, and this
represented virtually no change from 1990.
In summary, the scale anchoring process, as implemented by NAEP, can
provide a concise summary of what students know and can do at various points along the
scale that differentiates them from students performing at lower levels. The procedure
involves both an empirical component to identify the anchor items and a subjective process
to develop the descriptions. However, two cross-validation efforts and the use of the
process in the 1990 and 1992 mathematics assessments have indicated a high degree of
similarity between descriptions developed by different groups of panelists. The process has
been implemented for all three grade levels simultaneously to maximize the amount of
information available from the scale and to condense the presentation of the results.
However, as shown, the anchor level information is created for each grade level and
panelists could consider the three sets of data separately, devising separate descriptions for
34
4
,
each grade. In general, there are many exemplar items for each anchor level; however, for
illustrative purposes, one exemplar item for each of the anchor levels is presented in the
appendix.
5. Achievement Levels
The 1988 legislation reauthorizing the National Assessment of Educational
Progress created an independent board, the National Assessment Governing Board,
responsible for setting policy for the NAEP program.17 Among other responsibilities, the
board has a statutory mandate to identify "appropriate achievement goals for each...grade in
each subject area to be tested under the National Assessment." Consistent with this
directive, and striving to achieve one of the primary mandates of the statute "to improve
the form and use of NAEP results," the Board set performance standards (called
achievement levels by NAGB) on the National Assessment in 1990, and again in 1992.
NAGB established a set of standards in 1990 for the mathematics assessment. Due to
technical difficulties they were re-established in 1992 with an improved methodology. The
discussion in this report is limited to the approach used in 1992.
Differences between anchor levels and achievement levels
In contrast to anchor levels which describe actual student performance on
NAEP, achievement levels are performance standards on the NAEP assessment that
identify what students should know and be able to do at various points along the
proficiency scale. In developing threshold values (cut scores) for the levels, a broadly
constituted panel of judges rated each grade-specific NAEP item pool using operationalized
policy definitions developed by the Board for "Basic," "Proficient," and "Advanced" student
performance. In contrast, the numerical values for anchor levels represent selected points
at regular intervals on the scale that have a statistical meaning in describing the
distribution of scores.
17 Public Law 100-297. (1988). National Assessment of Educational Progress Improvement Act (Article No. USC 1221).Washington, DC.
35
4 °
Another difference between the two is that the achievement levels provide
grade-specific interpretations of expected performance, while the proficiency levels offer a
cross-grade interpretation of the NAEP scale. There are three achievement levels, Basic,
Proficient, and Advanced for each of the three grades assessed, 4, 8, and 12. Each of the
nine levels is accompanied by a content description and exemplar exercises that delineate
recommended grade-appropriate expectations for student performance. This is in contrast
to the cross-grade descriptions of overall average proficiency at the four anchor levels
described in an earlier section of this report.
The 1992 level-setting activity
In September 1991, NAGB let a contract to American College Testing (ACT)
to convene panels of judges that would recommend levels on the 1992 NAEP assessments in
reading, writing, and mathematics. The work of ACT involved hundreds of professionals
and members of the general public. who assisted in the planning, designing, and
implementing of the level-setting meetings and public hearings. 18 Moreover, the ACT
documents were widely disseminated to a number of stakeholder groups for comment before
the work was initiated.
While the 1992 level-setting activities are not unlike those undertaken by the
Board for 1990, significant improvements were made in the process for 1992. There was a
concerted effort to bring greater technical expertise to the process: the contractor selected
by the Board has a national reputation for setting standards in a large number of
certification and licensure exams; an internal and external advisory team monitored all the
technical decisions made by the contractor throughout the process; and State assessment
directors periodically provided their expertise and technical assistance at key stages in the
project.
Three important sets of outcomes resulted from the standard-setting
activities. The first set of outcomes was the operationalized descriptions of each of the
three levels of expected achievement, by content area, for each of the three grades. The
second set of outcomes was the scale scores defining the lower bound for each achievement
level. The third set of outcomes was the selection of exemplar assessment exercises taken
"American Coilege Testing. (1992. ) Design document for setting achievement levels on the 1992 National Assessment ofEducational Progress in mathematics, reading, and writing: Final version. Iowa City, IA: Author.
36

from the NAEP item pool that would facilitate in describing the substance of each of the
levels. One illustrative item for each achievement level is provided in the appendix. Taken
together, these three sets of outcomes constitute a new way of interpreting the achievement
of students on the NAEP scale.
37
Policy-Based and Operationalized Definitions
Before the standard-setting panels reviewed the exercise pool and the
exemplar responses for the extended constructed response questions, it was necessary to
operationalize the policy definitions of the three achievement levels, Basic, Proficient, and
Advanced. The policy-based definitions of Basic, Proficient and Advanced were as follows:
Basic. This level, below proficient, denotes partial mastery of knowledge andskills that are fundamental for proficient work at each grade--4, 8, and 12.For twelfth grade, this is higher than minimum competency skills (whichnormally are taught in elementary and junior high schools) and coverssignificant elements of standard high-school-level work.
Proficient. This central level represents solid academic performance for eachgrade tested--4, 8, and 12. It reflects a consensus that students reaching thislevel have demonstrated competency over challenging subject matter and arewell prepared for the next level of schooling. At grade 12, the proficient levelencompasses a body of subject-matter knowledge and anal:rtical skills, ofcultural literacy and insight, that all high school graduates should have fordemocratic citizenship, responsible adulthood, and productive work.
Advanced. This higher level signifies superior performance beyond proficientgrade-level mastery at grades 4, 8, and 12. For twelfth grade, the advancedlevel shows readiness for rigorous college courses, advanced technicaltraining, or employment requiring advanced academic achievement. As databecome available, it may be based in part on international comparisons ofacademic achievement and may also be related to Advanced Placement andother college placement exams.
These policy definitions were presented to panelists along with an illustrative
framework for more in-depth development and operationalization of the levels. The
panelists were asked to describe the three levels from the specific NAEP assessment
framework with respect to the content and skills to be assessed. The operationalized
definitions were refined throughout the level-setting process, as well as validated with a
supplementary group of judges subsequent to the level-setting meetings. Panelists were
also asked to develop a list of illustrative tasks associated with each of the levels, after
which sample items or exemplar papers, in the case of extended constructed response items,
from the NAEP item pool were identified to exemplify the full range of performance of the
intervals between levels.
38
4 5
Since the purpose of the operationalized descriptions was to use such
descriptions as a common mental construct through which to filter the rating of items, the
emphasis in operationalizing the definitions was on the performance of examinees in the
basic, proficient, and advanced regions of the scale. In other words, the operationalized
descriptions and the exemplar items needed to represent the full range of performance from
one level to the next higher level with an emphasis on typical performance for the range.
The descriptions of levels generated by panelists were originally developed by
separate grade-level-specific groups, and as such, varied in the sharpness of the language,
the degree of specificity of the statements, and even in format. Therefore, an important
task of a subsequent validation effort was to sharpen the language, and, in the case of
mathematics, to give the descriptions durability by reflecting the language of the National
Council of Teachers of Mathematics Standards? The ratings, however, were based on
the descriptions developed by the first panel of judges. The operationalized descriptions for
grades 4, 8, and 12 are contained in Figures 1.6, 1.7 and 1.8, respectively.
19National Council of Teachers of Mathematics. Commission on Standards for School Mathematics (1989). Curriculumand evaluation standards for school mathematics. Washington, DC: NCTM.
39
46
AC.
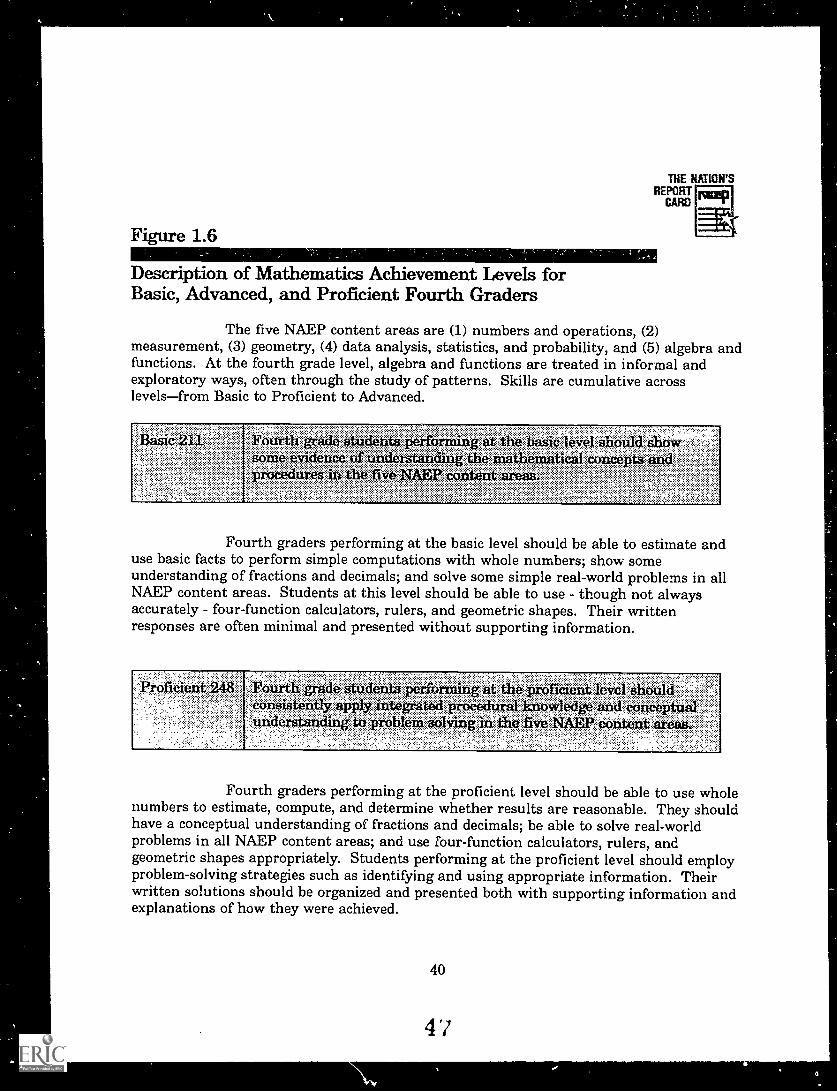
THE NATION'SREPORT
CARO
Figure 1.6
Description of Mathematics Achievement Levels forBasic, Advanced, and Proficient Fourth Graders
The five NAEP content areas are (1) numbers and operations, (2)measurement, (3) geometry, (4) data analysis, statistics, and probability, and (5) algebra andfunctions. At the fourth grade level, algebra and functions are treated in informal andexploratory ways, often through the study of patterns. Skills are cumulative acrosslevelsfrom Basic to Proficient to Advanced.
Baic 211, orrean c ve s $some evidence of rstanaing the mathematical concepts andprocedures in the five NANP content areas.
Fourth graders performing at the basic level should be able to estimate anduse basic facts to perform simple computations with whole numbers; show someunderstanding of fractions and decimals; and solve some simple real-world problems in allNAEP content areas. Students at this level should be able to use - though not alwaysaccurately - four-function calculators, rulers, and geometric shapes. Their writtenresponses are often minimal and presented without supporting information.
Fourth graders performing at the proficient level should be able to use wholenumbers to estimate, compute, and determine whether results are reasonable. They shouldhave a conceptual understanding of fractions and decimals; be able to solve real-worldproblems in all NAEP content areas; and use four-function calculators, rulers, andgeometric shapes appropriately. Students performing at the proficient level should employproblem-solving strategies such as identifying and using appropriate information. Theirwritten solutions should be organized and presented both with supporting information andexplanations of how they were achieved.
40
4 7
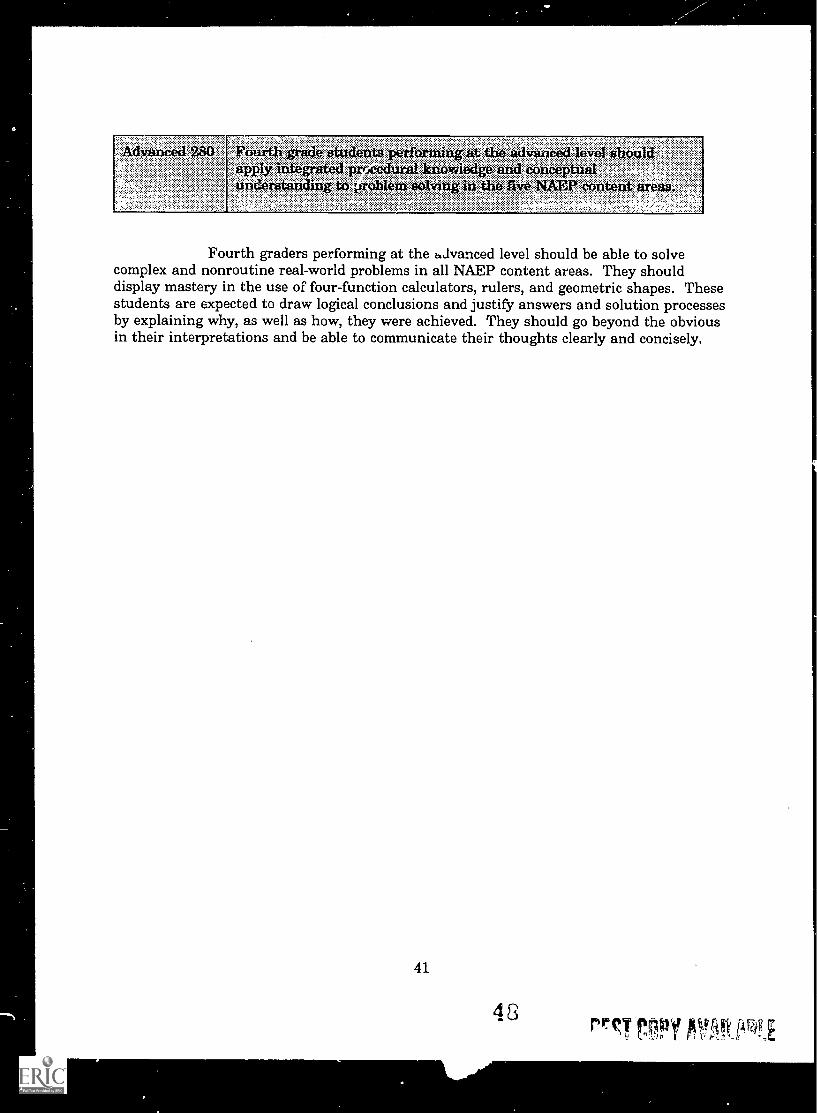
vanced 280 Fourth gtade students iwihrtningst the advanted level shouldapply integrated prr,cedural know and conceptualondostAmling to Problem solving in the (we 'NUE Orttent area0.
Fourth graders performing at the 2.dvanced level should be able to solvecomplex and nonroutine real-world problems in all NAEP content areas. They shoulddisplay mastery in the use of four-function calculators, rulers, and geometric shapes. Thesestudents are expected to draw logical conclusions and justify answers and solution processesby explaining why, as well as how, they were achieved. They should go beyond the obviousin their interpretations and be able to communicate their thoughts clearly and concisely.
41
48 "7 fiink[AE
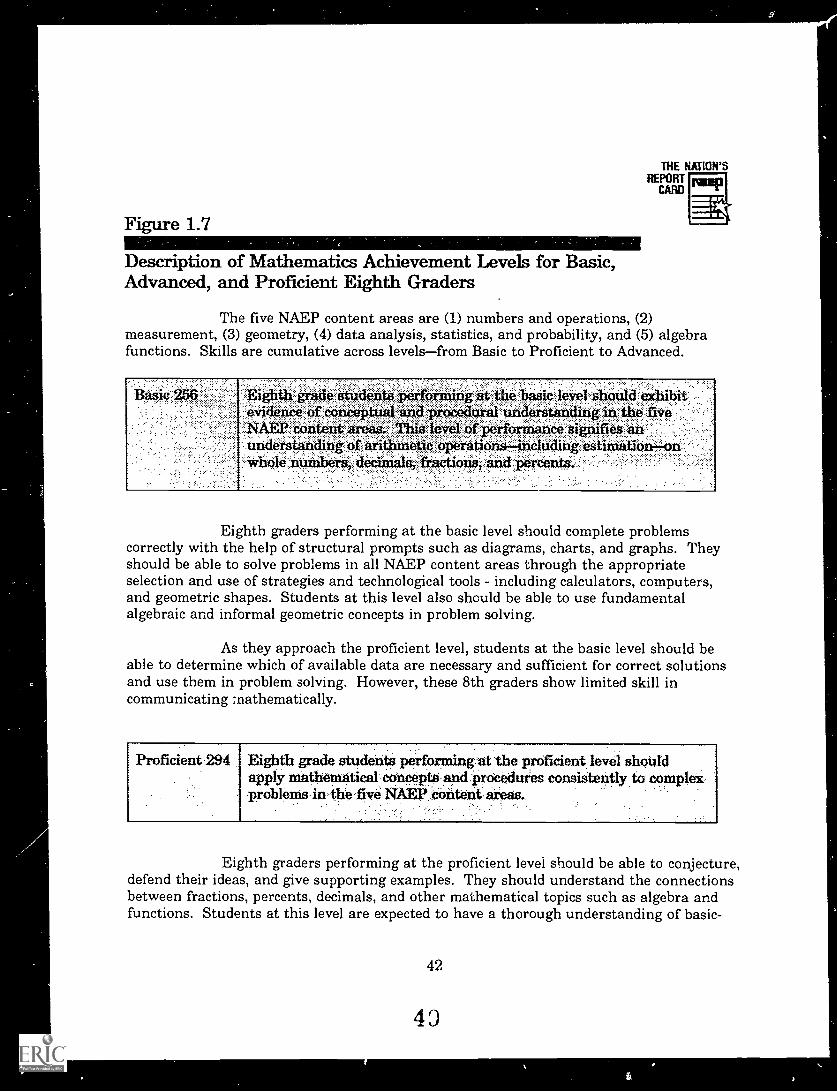
THE NATION'SREPORT
CARD
Description of Mathematics Achievement Levels for Basic,Advanced, and Proficient Eighth Graders
The five NAEP content areas are (1) numbers and operations, (2)measurement, (3) geometry, (4) data analysis, statistics, and probability, and (5) algebrafunctions. Skills are cumulative across levelsfrom Basic to Proficient to Advanced.
Eighth graders performing at the basic level should complete problemscorrectly with the help of structural prompts such as diagrams, charts, and graphs. Theyshould be able to solve problems in all NAEP content areas through the appropriateselection and use of strategies and technological tools - including calculators, computers,and geometric shapes. Students at this level also should be able to use fundamentalalgebraic and informal geometric concepts in problem solving.
As they approach the proficient level, students at the basic level should beable to determine which of available data are necessary and sufficient for correct solutionsand use them in problem solving. However, these 8th graders show limited skill incommunicating ;mathematically.
Proficient 294 Eighth grade students performing at the proficient level shouldapply mathematical concepts and procedures consistently to complexproblems in the five NAEP content areas.
Eighth graders performing at the proficient level should be able to conjecture,defend their ideas, and give supporting examples. They should understand the connectionsbetween fractions, percents, decimals, and other mathematical topics such as algebra andfunctions. Students at this level are expected to have a thorough understanding of basic-
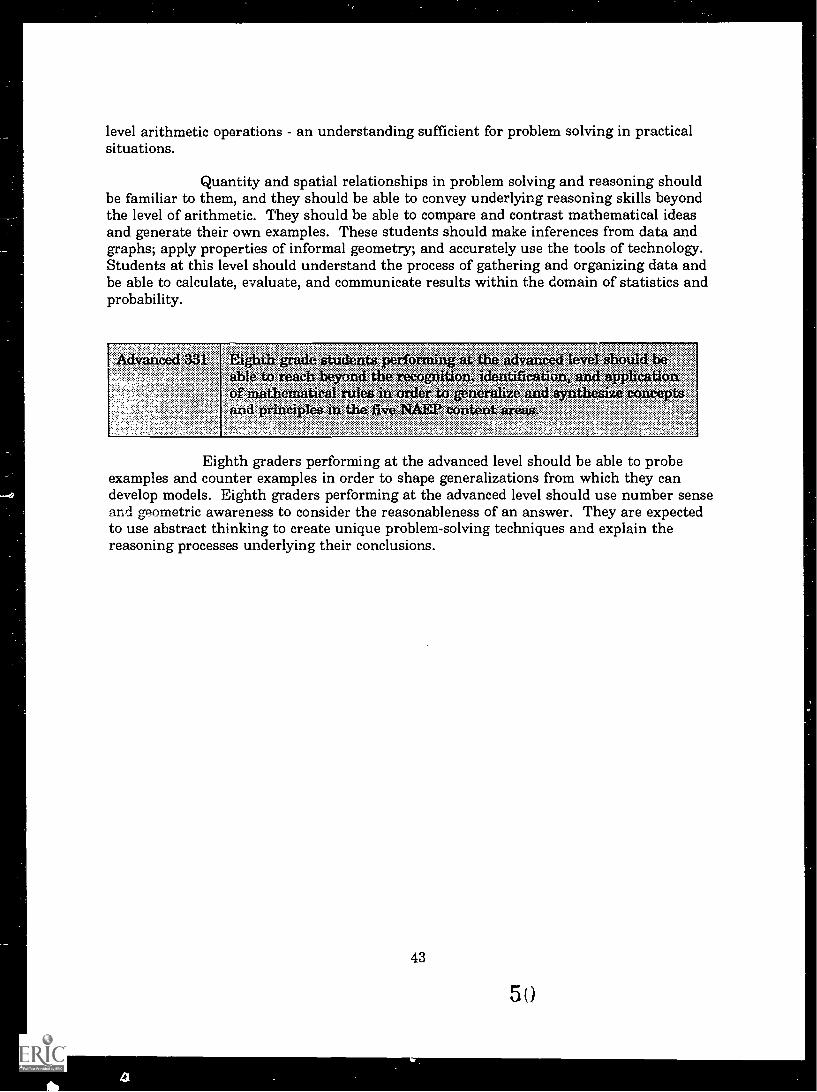
level arithmetic operations - an understanding sufficient for problem solving in practicalsituations.
Quantity and spatial relationships in problem solving and reasoning shouldbe familiar to them, and they should be able to convey underlying reasoning skills beyondthe level of arithmetic. They should be able to compare and contrast mathematical ideasand generate their own examples. These students should make inferences from data andgraphs; apply properties of informal geometry; and accurately use the tools of technology.Students at this level should understand the process of gathering and organizing data andbe able to calculate, evaluate, and communicate results within the domain of statistics andprobability.
Eighth students performing at the advanced Level should beahie to reach beyond the recognition, identievation, and applkationof mathematical rules in order to generalize and synthesize conceptsand priori-plea in tbe five NitiEP content amok
Eighth graders performing at the advanced level should be able to probeexamples and counter examples in order to shape generalizations from which they candevelop models. Eighth graders performing at the advanced level should use number senseand geometric awareness to consider the reasonableness of an answer. They are expectedto use abstract thinking to create unique problem-solving techniques and explain thereasoning processes underlying their conclusions.
43
50
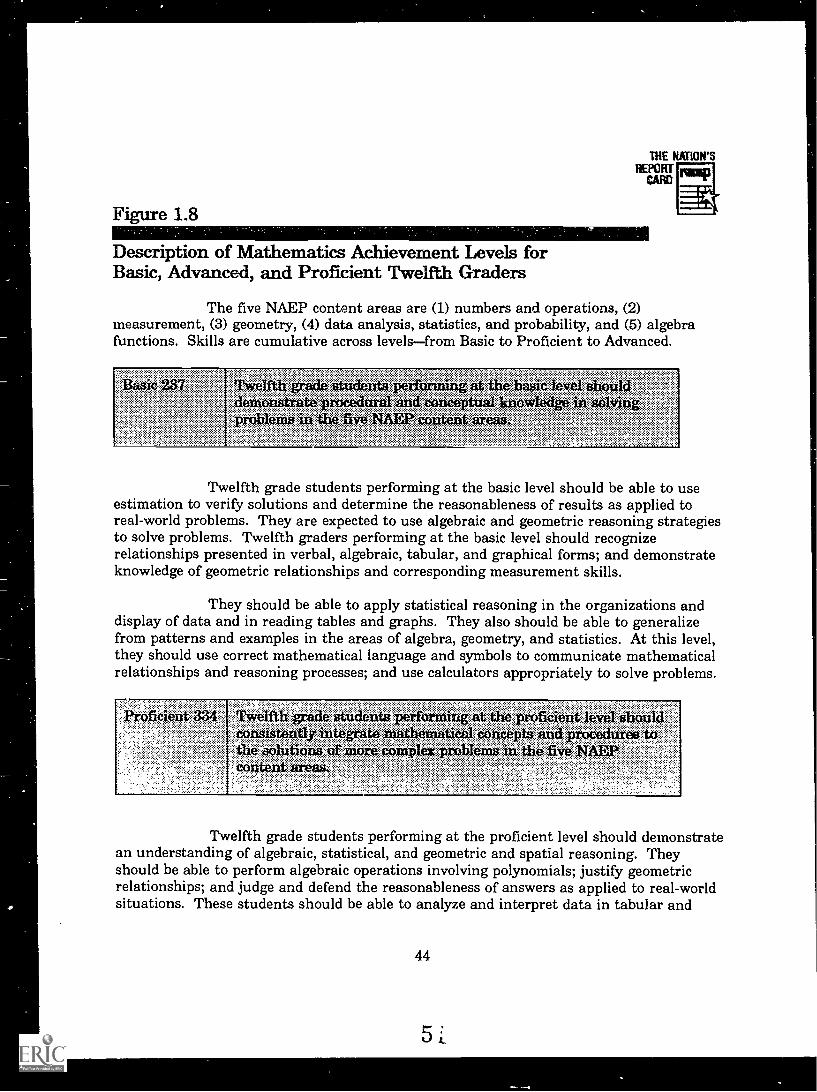
THE NATION'SREPORT
CARD
Figure 1.8
Description of Mathematics Achievement Levels forBasic, Advanced, and Proficient Twelfth Graders
The five NAEP content areas are (1) numbers and operations, (2)measurement, (3) geometry, (4) data analysis, statistics, and probability, and (5) algebrafunctions. Skills are cumulative across levelsfrom Basic to Proficient to Advanced.
Basic 287 Twelfth students performing at the bask level shoulddemonstrate procedural and eonee knowledge in solvingproblems in The five MEP content areas.
Twelfth grade students performing at the basic level should be able to useestimation to verify solutions and determine the reasonableness of results as applied toreal-world problems. They are expected to use algebraic and geometric reasoning strategiesto solve problems. Twelfth graders performing at the basic level should recognizerelationships presented in verbal, algebraic, tabular, and graphical forms; and demonstrateknowledge of geometric relationships and corresponding measurement skills.
They should be able to apply statistical reasoning in the organizations anddisplay of data and in reading tables and graphs. They also should be able to generalizefrom patterns and examples in the areas of algebra, geometry, and statistics. At this level,they should use correct mathematical language and symbols to communicate mathematicalrelationships and reasoning processes; and use calculators appropriately to solve problems.
Twelfth grade students performing at the proficient level should demonstratean understanding of algebraic, statistical, and geometric and spatial reasoning. Theyshould be able to perform algebraic operations involving polynomials; justify geometricrelationships; and judge and defend the reasonableness of answers as applied to real-worldsituations. These students should be able to analyze and interpret data in tabular and
44
5 :
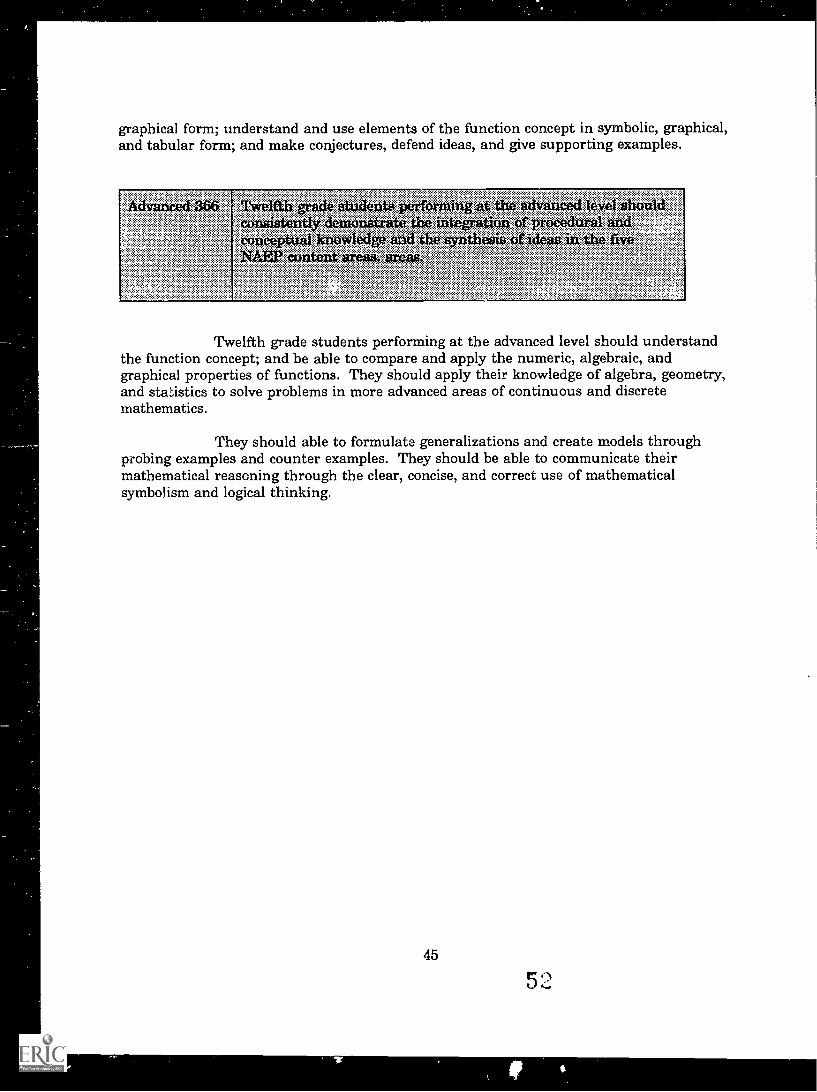
graphical form; understand and use elements of the function concept in symbolic, graphical,and tabular form; and make conjectures, defend ideas, and give supporting examples.
Advanced 366 rth grade nta perfortaing at- the advanced ievel shouldconsistently demonsizate the in tion of procedund andconee knowledge aod the syrdbeaia aide** in the fiveMEP content nem atess.
Twelfth grade students performing at the advanced level should understandthe function concept; and be able to compare and apply the numeric, algebraic, andgraphical properties of functions. They should apply their knowledge of algebra, geometry,and statistics to solve problems in more advanced areas of continuous and discretemathematics.
They should able to formulate generalizations and create models throughprobing examples and counter examples. They should be able to communicate theirmathematical reasoning through the clear, concise, and correct use of mathematicalsymbolism and logical thinking.
45
4"..,
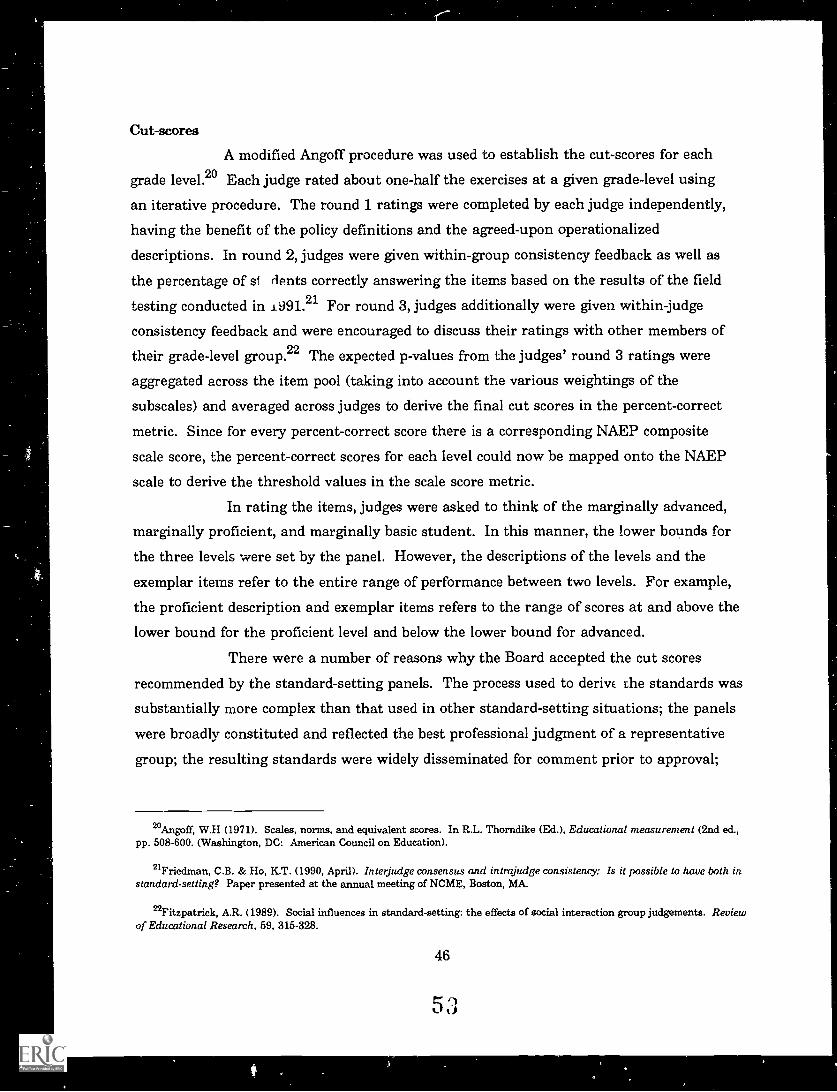
Cut-scores
A modified Angoff procedure was used to establish the cut-scores for each
grade level.20 Each judge rated about one-half the exercises at a given grade-level using
an iterative procedure. The round 1 ratings were completed by each judge indenendently,
having the benefit of the policy definitions and the agreed-upon operationalized
descriptions. In round 2, judges were given within-group consistency feedback as well as
the percentage of st dents correctly answering the items based on the results of the field
testing conducted in 1991.21 For round 3, judges additionally were given within-judge
consistency feedback and were encouraged to discuss their ratings with other members of
their grade-level group.22 The expected p-values from the judges' round 3 ratings were
aggregated across the item pool (taking into account the various weightings of the
subscales) and averaged across judges to derive the final cut scores in the percent-correct
metric. Since for every percent-correct score there is a corresponding NAEP composite
scale score, the percent-correct scores for each level could now be mapped onto the NAEP
scale to derive the threshold values in the scale score metric.
In rating the items, judges were asked to think of the marginally advanced,
marginally proficient, and marginally basic student. In this manner, the lower bounds for
the three levels were set by the panel. However, the descriptions of the levels and the
exemplar items refer to the entire range of performance between two levels. For example,
the proficient description and exemplar items refers to the range of scores at and above the
lower bound for the proficient level and below the lower bound for advanced.
There were a number of reasons why the Board accepted the cut scores
recommended by the standard-setting panels. The process used to deriv the standards was
substantially more complex than that used in other standard-setting situations; the panels
were broadly constituted and reflected the best professional judgment of a representative
group; the resulting standards were widely disseminated for comment prior to approval;
20Angoft W.H (1971). Scales, norms, and equivalent scores. In R.L. Thorndike (Ed.), Educational measurement (2nd ed.,pp. 508-600. (Washington, DC: American Council on Education).
21Friedinan, C.B. & Ho, K.T. (1990, April). lnterjudge consensus and intrajudge consistency: Is it possible to have both instandard-setting? Paper presented at the annual meeting of NCME, Boston, MA.
22Fitzpatrick, kR. (1989). Social influences in standard-setting: the effects of social interaction group judgements. Reviewof Educational Research, 69, 315-328.
46
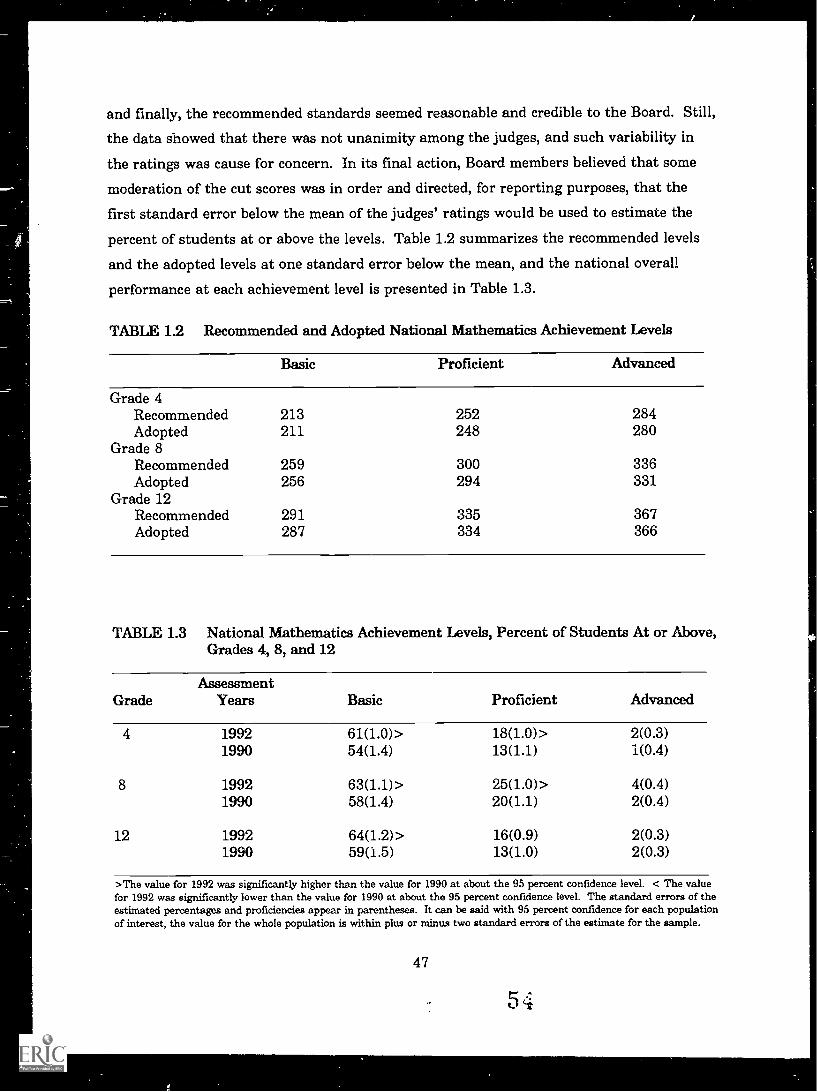
and finally, the recommended standards seemed reasonable and credible to the Board. Still,
the data showed that there was not unanimity among the judges, and such variability in
the ratings was cause for concern. In its final action, Board members believed that some
moderation of the cut scores was in order and directed, for reporting purposes, that the
first standard error below the mean of the judges' ratings would be used to estimate the
percent of students at or above the levels. Table 1.2 summarizes the recommended levels
and the adopted levels at one standard error below the mean, and the national overall
performance at each achievement level is presented in Table 1.3.
TABLE 12 Recommended and Adopted National Mathematics Achievement Levels
Basic Proficient Advanced
Grade 4Recommended 213 252 284Adopted 211 248 280
Grade 8Recommended 259 300 336Adopted 256 294 331
Grade 12Recommended 291 335 367Adopted 287 334 366
TABLE 1.3 National Mathematics Achievement Levels, Percent of Students At or Above,Grades 4, 8, and 12
AssessmentGrade Years Basic Proficient Advanced
4 1992 61(1.0)> 18(1.0)> 2(0.3)1990 54(1.4) 13(1.1) 1(0.4)
8 1992 63(1.1)> 25(1.0)> 4(0.4)1990 58(1.4) 20(1.1) 2(0.4)
12 1992 64(1.2)> 16(0.9) 2(0.3)1990 59(1.5) 13(1.0) 2(0.3)
>The value for 1992 was significantly higher than the value for 1990 at about the 95 percent confidence level. < The valuefor 1992 was significantly lower than the value for 1990 at about the 95 percent confidence level. The standard errors of theestimated percentages and proficiencies appear in parentheses. It can be said with 95 percent confidence for each populationof interest, the value for the whole population is within plus or minus two standard errors of the estimate for the sample.
47
At grade four, the percentage of students performing at or above the
achievement levels, Basic and Proficient rose from 1990 to 1992. This indicates that at the
Basic level (Level 211), more fourth graders should show evidence of beginning to
understand mathematical concepts such as number sense and place value and procedures
like computation and estimation (from 54 to 61 percent). At the Proficient level (Level 248)
students should be able to more consistently apply such mathematical procedures, and
should generally be better able to integrate mathematical ideas and procedures in order to
solve problems (from 13 to 18 percent). At the Advanced level (Level 283), the percentage
of fourth graders did not significantly change from 1990 to 1992. In absolute terms the
percentage of students at this level is very small indeed indicating only a small fraction of
students should be able to solve a variety of complex and real-world problems in all five
NAEP content areas.
The percentage of grade eight students performing at or above the Basic and
Proficient achievement levels rose across the two year period, having a pattern of
improvement from 1990 to 1992 generally about the same as that for fourth graders. The
proportion of eighth graders at or above the Basic level (Level 256) rose from 58 to 63
percent, indicating an increase in the percentage of students who should be able to
understand arithmetic operations -- including estimation -- on whole numbers, decimals,
fractions, and percents. The percentage of students at or above the Proficient level (Level
294) improved from 20 to 25 percent. These students should be able to apply mathematical
concepts and procedures consistently to complex problems in all the NAEP content areas.
Like the fourth graders, the percentage of students at or above the Advanced level (Level
331) did not significantly change from 1990 to 1992, and in absolute terms this represents a
very small fraction of the eighth grade population.
At grade twelve the percentage of students at or above the Basic level (Level
287) rose from 59 to 64 percent. These students should be able to use reasoning strategies
in areas like algebra and geometry to solve problems. The percentage of twelfth grade
students at or above the Proficient and Advanced level did not change over the two year
period.
48
Selection of Mcemplar Exercises
The purpose of including exemplar items in the reporting process was to
demonstrate the range of expected performance for groups of students at the Basic,
Proficient, and Advanced levels. The emphasis in identifying and selecting exemplar items
and papers was to represent the full range of performance from the lower level to the next
higher level with an emphasis on typical performance for the range.
The task for the panel was to select from the set of released items the best
possible exemplar items to reflect the levels.23 Three criteria were used to make those
selections. Although a statistical filter was used to select the items for consideration, the
primary criterion was a good match between the content of an item and the description of
the level it represented. The three criteria were as follows:
Using the released blocks of items, items whose e cted p-values did notexceed p > 0.51 for any of the levels were deleted. Items were tentativelyassigned to the lowest level for which they met the statistical criteria, that is,if an item qualified for the Basic level because the expected p-value 0.51, itwas assigned to that level. If it did not qualify, it was checked for theProficient level and then the Advanced ievel.
Items were then assigned as basic, proficient, or advanced depending onwhich description they best matched; non-matching items were eliminated.These deletions were based on knowledge of the discussions and intent of theoriginal panels, as well as an understanding of the content frameworks.
The items retained in the pool also had to have increasing expected p-valuesfrom Basic, to Proficient, to Advanced.
Sets of matched and classified items were presented to the validation panels
for possible selection as exemplars. The criteria these panels used to make selections were
threefold: (1) the perceived quality of the item (e.g., in mathematics, how well it reflected
the NCTM Standards); (2) whether, as a whole, the selections were representative of the
subscales; and, (3) in the case of items administered to more than one grade, which grade
was most appropriate for that item.
23It is typical in NAEP to release about 40% of the test items after each administration. The remaining items are keptsecure for use in future cycles. In 1992, five out of 13 blocks (38%) at each grade level were released into the public domain.Only items in one of these 6 grade-level blocks were eligible for selection as exemplars.
24The selection of p z 0.61 as a statistical criterion was a recommendation of the Technical Advisory Committee onStandard Setting (TACSS), an advisory group to ACT, which believed that examinees should have better than a 50-50 chanceof being successful on the item for it to be eligible as an exemplar.
49
5G
The appendix contains nine illustrative exemplar items, one for each of the
achievement levels. A fuller set of exemplar items is available from the NAGB to cover the
full range of scores within each achievement level.25
In summary, achievement levels interpretation provides a new way of looking
at the NAEP data by providing guidance on what students should know and be able to do.
The process of identifying such levels, in contrast to the NAEP anchoring procedure, is
more a judgment process, even though informed by empirical performance data. It is
interesting to note that although there were substantial differences between the 1990 and
1992 standard-setting procedures, the results of both, in terms of cut scores and
descriptions, are remarkably similar.
To the casual reader, the achievement and proficiency levels look very much
the same. In fact, they are quite different. The descriptions that accompany the
proficiency levels are derived from the content of the items and the underlying constructs
represented in the item pool. In developing the proficiency level descriptions, the expert
panels examine all items that anchor in deriving the descriptions. On the other hand, the
achievement levels descriptions are not specific to any particular item pool. Rather, they
reflect the content domain as represented in the assessment framework. As a matter of
fact, the descriptions are developed initially by the panel of judges before examining any
items. Throughout the proce , these descriptions are then refined and revised as panels
become more knowledgeable of the particular NAEP assessment.
The proficiency level descriptions assist in interpreting the anchor points on
the scale -- 200, 250, 300, 350. By their very definition they are point-specific. On the
contrary, achievement levels assist in describing and interpreting regions on the scale --
Basic, Proficient, and Advanced -- with an emphasis on "typical" performance for each
region.
The achievement levels are intended to give some utility and relevance to the
NAEP scale. They are meant to assist the nation and jurisdictions participating in the
Trial State Assessment in interpreting NAEP scores in terms of a quality standard that has
meaning for professional educators, curriculum specialists, prospective employers,
policymakers, as well as students and parents. Because the standards apply only to the
25American College Testing, Description of Mathematics Achievement Level Setting Process and Proposed AchievementLevels Description. (Washington, DC: National Assessment Governing Board, 1993).
50
57
current NAEP frameworks, they do not propose to be national standards, even though they
may function as such in the absence of any other national standards.
Alternative Methods for Interpreting the NAEP Scales
As suggested by the discussions of the item mapping and anchor level
procedures, even within these two methods many alternatives exist for interpreting the
NAEP scale results. For example, in Beyond the School Doors: The Literacy Needs of Job
Seekers Served by the US. Department of Labor, a combination of the item mapping and
anchoring procedures was used.26 The items were mapped onto the scale, and
descriptions were developed summarizing performance between various points (i.e., 225 or
lower; 226 to 275, 276 to 325, 326 to 375, and 376 or higher). The ranges between points
were identified as Level 1 through Level 5, and the percentage of respondents performing at
each of the levels was provided. For example, 35 percent of the job training partnership
enrollees (JTPA) performed at Level 3 on the document literacy scale, which included tasks
designed to measure the knowledge and skills associated with locating and using
information contained in job applications, payroll forms, bus schedules, maps, tables,
indexes, and so forth. The Level 3 tasks involved integration of more than two features of
information in relatively complex displays, with more distracting choices.
Building the Interpretation of the Scale into the Instruments
Another alternative is to build the interpretation of the scale into the
assessment instruments that comprise it. This has been done by NAEP in reporting the
results of the 1984 and 1988 writing assessments.27 In each of these writing assessments,
students responded to a variety of informative, persuasive, and imaginative writing tasks.
For example, students were asked to complete brief informative descriptions, reports, and
analyses; to write persuasive letters and arguments; and to invent their own stories.
26Irwin S. Kirsch, Ann Jungleblut, and Anne Campbell, Beyond the School Doors: The Literacy Needs of Job SeekersServed by the U.S. Department of Labor (Washington, D.C.: U.S. Department of Labor, 1992).
27Arthur N. Applebee, Judith A. Langer, Ina V.S. Mullis, Lynn B. Jenkins, The Writing Report Card, 1984-88 (Princeton,NJ: National Assessment of Educational Progress, Educational Testing Service, 1990).
51
5L3

The papers were evaluated on the basis of students' success in accomplishing
the specific purpose of each writing task (as measured by primary trait scoring). The
Levels of Task Accomplishment are shown in Figure 1.9.
52
5a

Figure 1.9
Scoring Rubric for 1984 and 1988 Writing Assessments
Levels of TaskAmin 'plialment
Score
4
3
2
1
0
Elaborated. Students providing elaborated responses went beyond theessential, reflecting a higher level of coherence and providing more detailto support the points made.
Adequate. Students providing adequate responses included theinformation and ideas necessary to accomplish the underlying task andwere considered likely to be effective in achieving the desired purpose.
Minimal. Students writing at the minimal level recognized some or all ofthe elements needed to complete the task but did not manage theseelements well enough to assure that the purpose of the task would beachieved.
Unsatisfactory. Students who wrote papers judged as unsatisfactoryprovided very abbreviated, circular, or disjointed responses that did noteven begin to address the writing task.
Not Rated. A small percentage of the responses were blank,indecipherable, or completely off task, or contained a statement to theeffect that the student did not know how to do the task; these responseswere not rated.
Based on the primary trait scores for responses to the writing tasks presented
in the assessments, the writing data were scaled using the Average Response Method
(ARM). The ARM provides an estimate of average writing achievement for each respondent
as if he or she had taken all of the writing tasks included, and as if NAEP had computed
average achievement -- the average primary trait score tiraes 100 -- across that set of tasks.
Thus, the interpretation of the NAEP writing scale was a direct translation
of the scores given the papers. Level 100 denoted unsatisfactory, Level 200 minimal, Level
53
60
300 adequate, and Level 400 elaborated, with the definitions of performance at the levels
being the same as the definitions used to develop the scoring criteria for the papers.
Acknowledging that most assessments contain a variety of item types, it still
might be possible to extend the concept underlying the writing scale analysis to other
assessment situations. Particularly, those with a heavy performance component might be
conducive to establishing scale interpretation with the development of the tasks themselves,
and as part of evaluating student performance on them.
For example, using an item mapping or anchoring procedure for questions
evaluated according to levels of success, like the writing tasks, would show for a variety of
such items where on the scale students seemed to be achieving partial success, where they
seemed to be achieving satisfactory performance levels, and where they seemed to be
achieving excellent performance levels. Some aggregate of the data could be used to
characterize these levels in an overall sense. Similarly, as part of the development process,
individual items could be designated to represent the various levels of understanding within
a curriculum area (e.g., partial, full, and extensive), and the results could be aggregated in
relation to the scale to represent how many students were at each level of understanding.
Based on the aggregations, the percentages of students performing at those levels can be
provided.
7. "Benchmarking" the NAEP Scale
It is increasingly common in American industry to strive to reach
"Benchmarks" set by the top producers of a product anywhere in the world. The idea is to
identify a high quality product that someone is actually making and set that as a standard
to strive for. We have adopted that rhetoric in the education reform movement in calling
for "World Class Standards." Other methods discussed in this report for interpreting the
NAEP scale have dealt with information entirely internal to the NAEP data base. This
suggested approach looks outside and asks, where would specific accomplishments be
located on the NAEP scale? Benchmarking would attempt to provide guideposts relating
54
levels on the scale to goals educators could understand and strive for, or to targets actually
achieved by others, or to knowledge required to perform a particular activity.28
While other approaches communicate what Americans know and can do, or
what the National Assessment Governing Board says they should know and be able to do,
benchmarks would permit educators and policymakers to set goals that have clear meaning
to them, and then see how many students are reaching the goals. They would be concrete
and specific, and not abstract. The objective would be to use what is familiar and
understood, or what is actually achieved somewhere. Levels such as "Proficient" or
particular anchor points on the scale could be conveyed in terms of the real life
accomplishments to which they relate.
Actual High Achievement. One easily understood and communicated
approach is to select cases of high achievement and to show where that achievement would
be on the NAEP scale. The fact that these levels on the scale are actually being achieved
gives credence to a goal that is set in terms of those levels. Some of the levels are easy, or
relatively easy, to identify. Others would require some work. Some examples are given
below in Figures 1.10 and 1.11.
The average NAEP scale score for the top 10 schools in the NAEP
assessment.
What is NAEP performance at the top? Knowing where the top 10 schools
are on the NAEP scale would tell us what is achievable in some places. It is
of course, not as simple as it sounds, because our top performing schools are
also usually those that have students from the top socioeconomic class....those
that exceeded expectations, the "outliers." (discussed in more detail in What
Americans Should Know: Information Needs for Setting Education Goals.)
In the highest-ranking State.
NAEP has identified top-ranking States for some subjects and grades, from
the State-by-State assessment. A "top" State could be identified among
industrial States, among highly urban States, among rural States, and among
poorer States.
28These approaches are explored in What Americans Should Know: Information Needs for Setting Education Goals, PaulBarton, (Policy Information Center, Educational Testing Service, 1991).
55
Students taking all four years of mathematics, algebra through calculus (or
four years in other subjects).
This can be determined from studies of transcripts of students who take
NAEP assessments.
Students who meet the course-taking standards for college set by the
National Commission on Educational Excellence.
This can also be obtained from transcript studies.
Proficiencies of students in selected countries.
This can be done by linking studies, such as international assessments and
NAEP assessments. The first such linking study was carried out in 1992.
We talk of meeting "world class" standards; this is a way of finding out what
they are, in terms of the NAEP scale.
Relating Accomplishments to the Scale. Another way to communicate what
particular levels on the scale mean in practical, real life terms is to place specific
accomplishments on it. While we may not expect all students to reach some of the high
level accomplishments, we will know how many do and can set goals in terms of raising the
percentage who are able to. They also can provide a reality check for levels set in other
terms, or provide an additional way to convey what a level on the NAEP scale means. One
might for example, after defining an "Advanced" level, say that this is a level reached by
students who can get a passing score on the forthcoming Pacesetter examination to be
introduced by the College Board (if that turns out to be the case). Some examples are
provided below in Figures 1.10 and 1.11.
Passing scores for Advanced Placement courses.
Where, on a NAEP scale, is the equivalent of a passing score on an Advanced
Placement (AP) examination? This could be obtained from a linking study,
with NAEP and AP exams given to the same students, or possibly by
identifying AP students in the NAEP background questionnaire.
56
63
Passing scores for Pacesetter courses.
These courses and assessments will be forthcoming from the College Board.
The relationship to NAEP scores could be established in the same way as for
AP courses.
Achieving NCTM standards.
If students achieved the standards set by the National Council of Teachers of
Mathematics, where would they score on the NAEP mathematics scale?
NCTM standards would be placed on the NAEP scale by a panel of experts
who would look at each NAEP question and judge whether a student who
achieved the standards would get it correct.
Meeting the standards of the New.Standards project.
As assessments are constructed for the New Standards Project, linking
studies could place them on the NAEP scale.
Meeting the expectations of employers...employer benchmarks.
The reading and mathematics level needed to enter a few specific occupations
would be identified as markers for preparation in school for the employment
world. These could be established by conducting a job analysis, establishing
panels of employers who hire for those occupations, or giving NAEP to a
sample of people working in those occupations.
Meeting the expectations of teachers...teacher benchmarks.
A sample of teachers of students assessed by NAEP would be asked to judge
each item. They would be asked to determine which questions they would
expect their students to answer correctly. These teacher expectations would
be placed on the NAEP scale. We would know the level of expectations, how
they change over time, and the gap between expectations and performance.
In summary, as shown in Figures 1.10 and 1.11, the benchmarking approach
to interpreting the NAEP scale is quite different from the other methods discussed. It is
57
6 4:4",t

aimed at being concrete, rather than abstract, grounding the scale in real life performance
comparisons outside the NAEP assessment, where specific accomplishments, or expectations
of teachers and others define the standards. This method might work especially well in
conjunction with some of the other methods described, for example, together with a detailed
item mapping technique to provide diagnostic information about which understandings
must be improved to reach the targets specified.
58
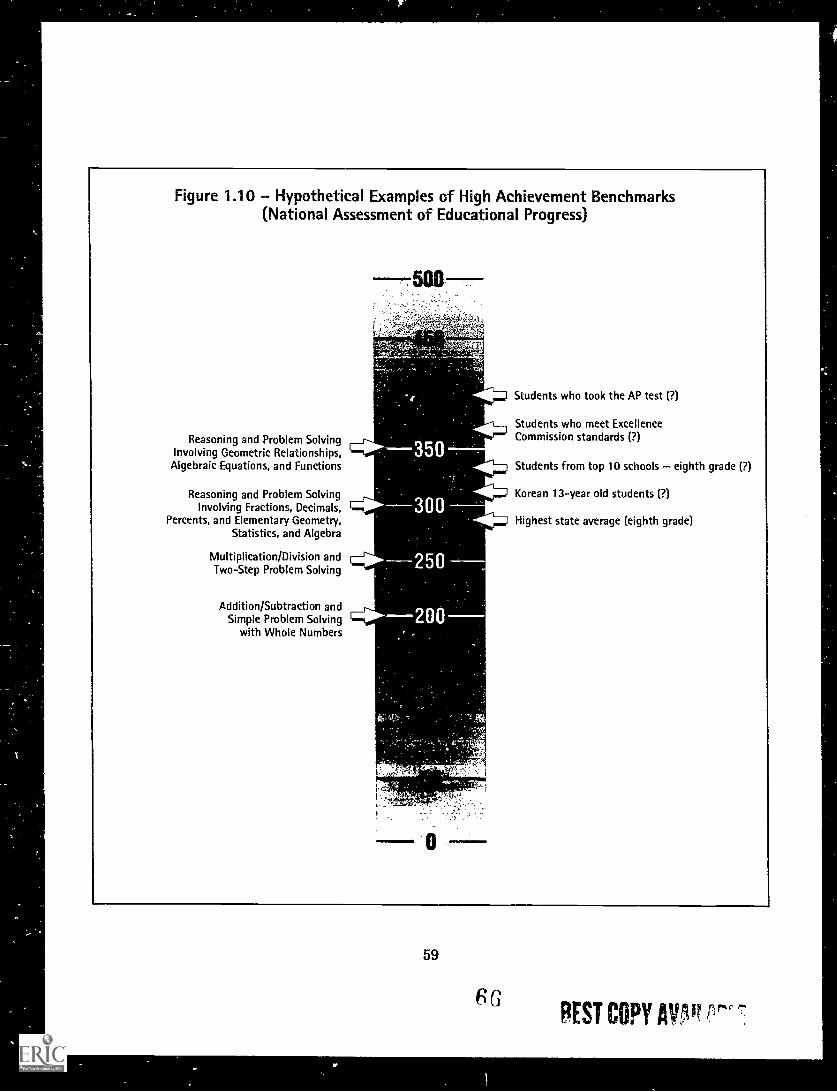
Figure 1.10 Hypothetical Examples of High Achievement Benchmarks(National Assessment of Educational Progress)
Reasoning and Problem SolvingInvolving Geometric Relationships,
Algebraic Equations, and Functions
Reasoning and Problem SolvingInvolving Fractions, Decimals,
Percents, and Elementary Geometry,Statistics, and Algebra
Multiplication/Division andTwo-Step Problem Solving
Addition/Subtraction andSimple Problem Solving
with Whole Numbers
Students who took the AP test (?)
Students who meet ExcellenceCommission standards (?)
Students from top 10 schools eighth grade (?)
Korean 13-year old students (?)
Highest state average (eighth grade)
59
eGBEST COPY AVP rr
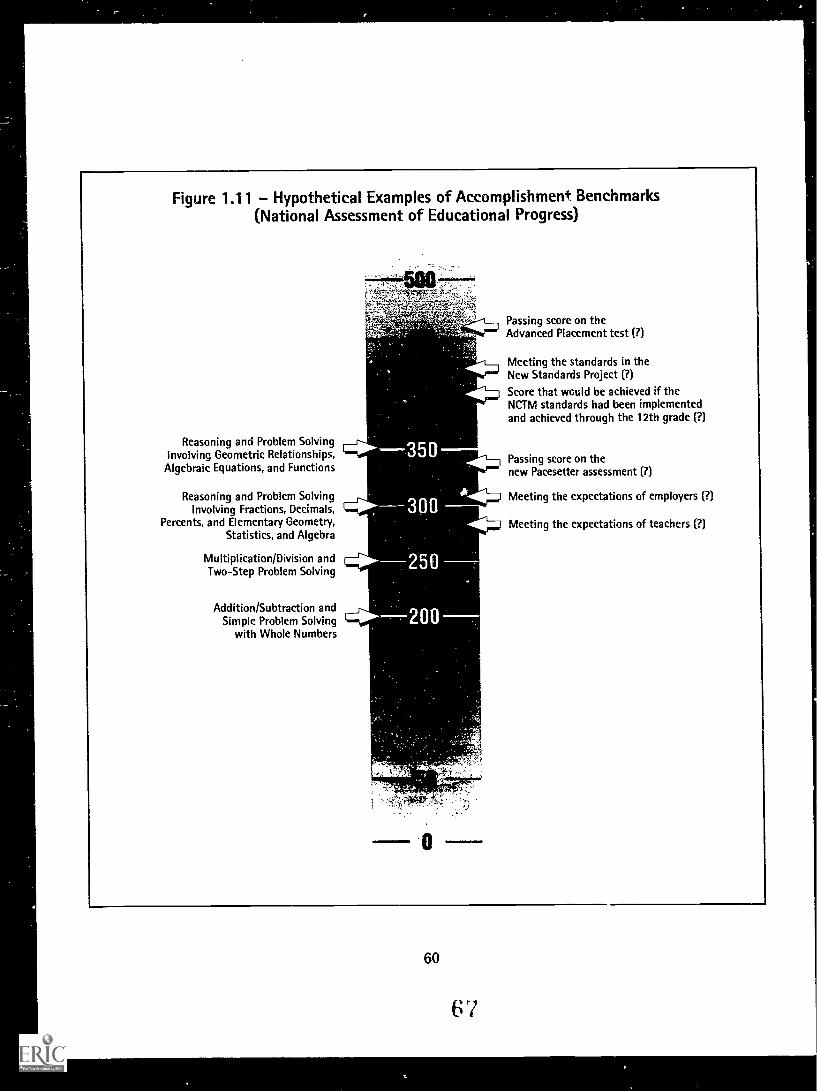
Figure 1.11 Hypothetical Examples of Accomplishment Benchmarks(National Assessment of Educational Progress)
Passing score on theAdvanced Placement test (?)
Meeting the standards in theNew Standards Project (?)
Score that would be achieved if theNCTM standards had been implementedand achieved through the 12th grade (?)
Reasoning and Problem SolvingInvolving Geometric Relationships,Algebraic Equations, and Functions
Reasoning and Problem SolvingInvolving Fractions, Decimals,
Percents, and Elementary Geometry,Statistics, and Algebra
Multiplication/Division andTwo-Step Problem Solving
Passing score on thenew Pacesetter assessment (?)
Meeting the expectations of employers (?)
Meeting the expectations of teachers (?)
Addition/Subtraction andSimple Problem Solving
with Whole Numbers
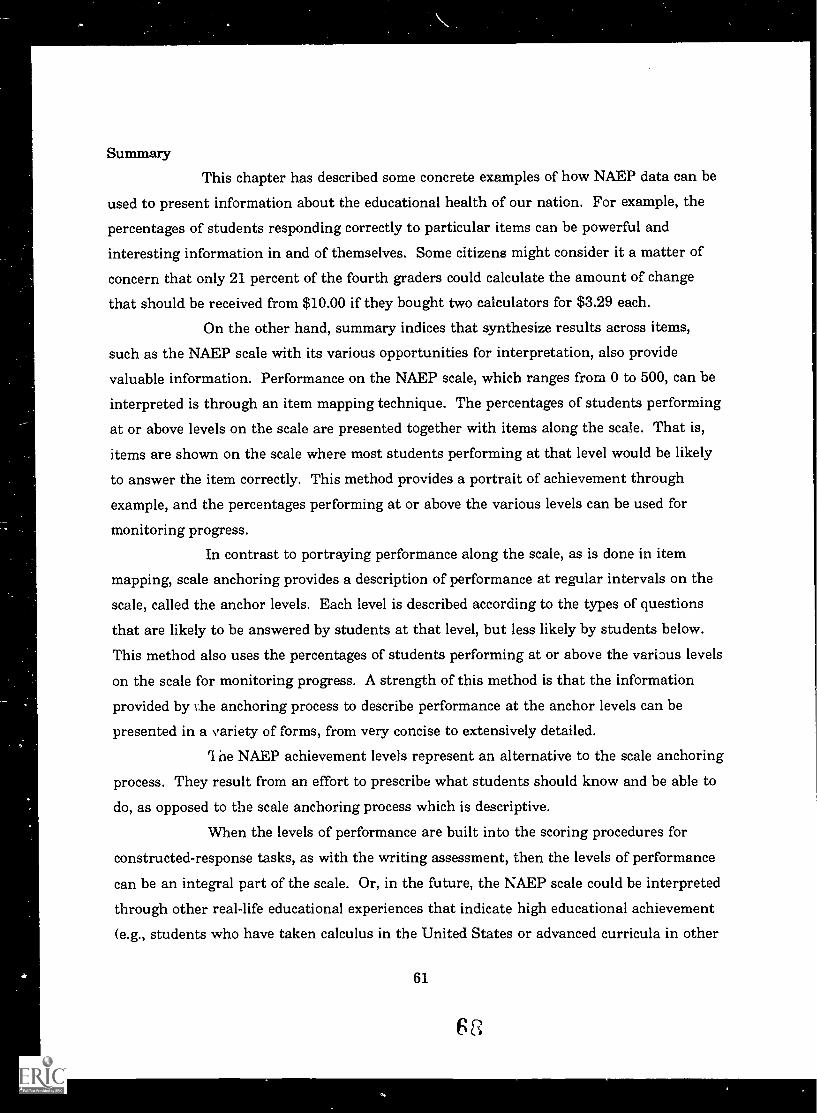
Summary
This chapter has described some concrete examples of how NAEP data can be
used to present information about the educational health of our nation. For example, the
percentages of students responding correctly to particular items can be powerful and
interesting information in and of themselves. Some citizens might consider it a matter of
concern that only 21 percent of the fourth graders could calculate the amount of change
that should be received from $10.00 if they bought two calculators for $3.29 each.
On the other hand, summary indices that synthesize results across items,
such as the NAEP scale with its various opportunities for interpretation, also provide
valuable information. Performance on the NAEP scale, which ranges from 0 to 500, can be
interpreted is through an item mapping technique. The percentages of students performing
at or above levels on the scale are presented together with items along the scale. That is,
items are shown on the scale where most students performing at that level would be likely
to answer the item correctly. This method provides a portrait of achievement through
example, and the percentages performing at or above the various levels can be used for
monitoring progress.
In contrast to portraying performance along the scale, as is done in item
mapping, scale anchoring provides a description of performance at regular intervals on the
scale, called the anchor levels. Each level is described according to the types of questions
that are likely to be answered by students at that level, but less likely by students below.
This method also uses the percentages of students performing at or above the various levels
on the scale for monitoring progress. A strength of this method is that the information
provided by the anchoring process to describe performance at the anchor levels can be
presented in a variety of forms, from very concise to extensively detailed.
'I he NAEP achievement levels represent an alternative to the scale anchoring
process. They result from an effort to prescribe what students should know and be able to
do, as opposed to the scale anchoring process which is descriptive.
VVhen the levels of performance are built into the scoring procedures for
constructed-response tasks, as with the writing assessment, then the levels of performance
can be an integral part of the scale. Or, in the future, the NAEP scale could be interpreted
through other real-life educational experiences that indicate high educational achievement
(e.g., students who have taken calculus in the United States or advanced curricula in other
61

industrial nations) or particular accomplishments (e.g., the passing score on an AP test or
the expectations of employers for an entry level job).
A variety of ways of giving meaning to the NAEP scale will accommL date the
variety of ways different people think about education, their needs and expectations of the
system, and the ways they go about setting targets and goals to raise achievement.
62
CHAPTER 2
ISSUES IN INTERPRETING NAEP SCALES
Background
Since its initial administration in 1969, NAEP has been reporting
information on the academic progress of nationally representative samples of American
school-age students and young adults. The information that NAEP provided throughout
the 1970s appeared to meet many of the information needs policymakers had at the time,
without being intrusive into State and local control of education. Results were reported by
age rather than grade, and performance data were reported at the exercise (test item) level.
In short, through the 1970s NAEP met the demands that were placed on it while not being
required to play a major role in driving public educational policy. As Messick, Beaton, and
Lord have observed, "The original design of the National Assessment of Educational
Progress (NAEP) was brilliantly responsive to the politi,d constraints of the time."29
Many factors in the fabric of educational policy and practice converged in the
1980s, however, that virtually demanded NAEP be redesigned to meet increasing needs for
an enhanced national achievement indicator.39 Among those factors were the accelerating
accountability movement among the States as well as, more recently, an increased executive
and legislative interest in educational policy factors, taken singly or together, increased the
technical and reporting demands placed on NAEP and significantly increased the stakes
associated with NAEP assessment.31
Beginning in 1983, and partially in response to those changing environmental
factors, NAEP underwent a major change in its design. This change in design increased its
capability to provide information that is relevant for educational policymakers and the
29S. Messick, A. Beaton, F. Lord. National Assessment of Educational Progress Reconsidered: A New design for a NewEra. NAEP Report No. 83-1. (Princeton Educational Testing Service. 1983), 1.
31National Academy of Education, Assessing Student Achievement in the States. The First Report of the National Academyof Education Panel on the Evaluation of the NAEP Trial State Assessment: 1990 Trial State Assessment, 1992.
63
70
public at large. One of the m.:'st profound design changes was the introduction of an Item
Response Theory (IRT) - based scale that ranged from 0 to 500. The development and
implementation of scale scores with reading in 1984 and mathematics in 1986 opened many
new possibilities for reporting and interpreting student performance that were not available
with item-level only reporting. Some of the benefits included: the flexibility of using
different items across time and still maintaining the same scale; the capacity to correlate
achievement data with a plethora of student, teacher, and school background information;
the creation of a summary index across items that simplified the results for policymakers,
the press, and the public; and the provision of a scale that, potentially, could yield criterion-
referenced, as well as norm-referenced interpretations.
1. Norm-referenced and Criterion-referenced Interpretations
The scales on which educational and psychological test scores are reported
have been a major source of conf, ision for educators, policymakers, and the public
throughout the history of testing. IQ scores, SAT and ACT scores, grade-equivalent scores,
and percentile scores are just a few of the scores that are confusing to many. Even the
simplest of distinctions, percents and percentiles, are regularly confused by educators,
policymakers, and the public.
The average IQ score is 100 and most IQ scores fall between 70 and 130.
Why? Because we arbitrarily chose to report scores that way. SAT scores, on the other
hand, are used in college admissions and have an average score of around 500. Most scores
fall between 400 and 600 and all scores fall between 200 and 800. ACT scores, which are
also used in college admissions, have their own metric, i.e., scale, for reporting scores. An
average score is 21 and most scores fall between 10 and 30. Here we have two tests used
for the same purpose being reported on very different scales. NAEP mathematics scores in
1990, on the other hand, were reported on a 500-point scale with the average score for a
nationally representative sample of 4th, 8th, and 12th graders being 250. Most scores fell
between 150 and 350. The message should be clear. The scales on which most test scores
are reported are quite arbitrary and are chosen by test developers to distinguish between
tests and to enhance the interpretability of test scores.
64
Almost all testing and assestiment programs attempt to provide methods of
interpreting their scores. Such interpretations give meaning to the scores and make the
results of the testing understandable to the general public. The basic problem in the case
of NAEP at the current time is how to best give meaning to the NAEP scale scores. The
two major approaches to providing meaning to test scores are called norm-referenced and
criterion-referenced interpretations.
A norm-referenced interpretation is obtained by comparing examinee scores
to a well-defined comparison group (usually a nationally representative sample). The norm-
referenced score tells how well the student did in comparison to the norm group. Some
examples include percentiles, grade equivalents, stanines, quartilies, and standard deviation
units.
A criterion-referenced interpretation is obtained from test scores by
comparing examinee scores to a well-defined content domain. As a general rule the content
domain is defined via an explicit set of test objectives, and item and test specifications,
around which the test is built. Criterion-referenced interpretations indicate what a student
knows and can do. Since they are grounded in specific content objectives, they are typically
more instructionally relevant. The difference is similar to contrasting a swimmer's place in
a race (a norm-referenced comparison) to his or her time in finishing the race (a criterion-
referenced comparison). Both interpretations are important, but they may yield different
impressions of the same performance. A swimmer may finish first place on a local swim
team (i.e., he or she is excellent relative to a local norm), but his or her time may never
qualify for the Olympics (relative to high absolute standards).
Many policymakers and educators, as well as the public, seem to want scales
for test score reporting that have as much criterion-referenced meaning as thermometer
scales for measuring temperature or yardsticks for measuring distance. People over the
years have learned to attach meaning to points (temperatures) on the thermometer scales.
They know what happens at 32°, and they know how they feel at 68° and 98.6°. They also
know the effects at 212°. (This is called benchmarking in Chapter 1.) Unfortunately, in
educational testing, student achievement is being measured and for these measurements we
must create new reporting scales that will be arbitrary (like the temperature scale) but will
not have the clarity of meaning associated with scales to measure temperature, distance,
weight, and many other physical measurements. The clarity will need to come through
65
7 rl
experience with the scales. But, hardly any educational test score reporting scales have
been around long enough or have remained stable enough over time for persons to become
as familiar with them as they are with thermometers, rulers, and weight scales.
The National Center for Educational Statistics is aware of problems that
have plagued many score reporting systems. In fact, some of the same criticisms of many
score reporting systems have been leveled at NAEP. NCES has sought to enhance the
utility of NAEP score reporting by using scales that will have a clear meaning and be useful
for describing student performance and measuring trends using cross-sectional designs.
Many steps have been taken to achieve this goal, though the effort has not been without
some criticism.32 In this chapter, the validity of different ways of interpreting NAEP
scales will be considered. Of special interest is the new way of reporting NAEP data - the
achievement levels and the evidence that should be compiled to support the intended
interpretations of these levels. Unless the scales, the proposed framework for interpreting
selected scores, and achievement levels can stand up to technical criticisms, the scales will
have limited value for influencing educational policy and practice.
2. Validity
Thirty-two degrees on the Fahrenheit scale is known as the point at which
water freezes. The accuracy or validity of this interpretation of 32 degrees was established
long ago. But it would be easy to conduct a study or experiment today to validate the
interpretation of 32 degrees as the freezing point of water. In much the same way, through
the compilation of evidence, the validity of the various interpretations of the anchor and
achievement levels needs to be established as well. These points were established for a
good reason, i.e., to enhance the meaning and usefulness of the NAEP reporting scale, but
evidence must be compiled to show that these points can serve their intended purposes.
Evidence must be compiled that lends credibility or believability to the intended
interpretations of these points.
32R.A. Forsyth, "Do NAEP scales yield criterion-referenced interpretations," Educational Measurement: Issues andPractice, 1991, 10, pp 3-9, 16.
66
Validity is a characteristic of the inference made from test scores, it is not a
characteristic of any specific test instrument, such as the NAEP tests, that produces these
scores. Therefore, it is not correct to refer to NAEP, or any test, as a valid or invalid test
instrument. Rather, "...[validity] refers to the appropriateness, meaningfulness, and
usefulness of the specific inferences made from test scores [italics addedr.M It is from
test scores that inferences are made; it is the interpretations of the test scores that must be
validated for the various ways in which they are used. The test developer has the
responsibility for providing evidence of the validity of the score interpretations that are
likely to be made from the test results.
3. Validity Issues With Scale Anchoring
In Chapter 1 we have described the rationales for, and the development of,
the NAEP anchor points. The purpose of the anchor points is to give meaning to the scales
that are used to report the performance of groups of students. This is a very important
point to keep in mind; the anchor level descriptors describe outcomes that students can do
at specific points on the NAEP scale. The descriptors are intended to give meaning to
selected points on the NAEP scale and to reference student performance to understandable
behaviors that have been specified in the NAEP assessment frameworks. Student
performance relative to the anchor levels should not be used as a predictor of student
performance on other measures or to support inferences that go beyond describing student
performance relative to the NAEP content.
The intended meaning of the anchor levels for the 1992 mathematics
assessment is fully described in Chapter 1 of this volume. As an example, the anchor level
represented by a scale score of 250 generally represents student understanding of addition,
substraction, multiplication, and division with whole numbers. It also represents the
capacity to perform two-step problem solving exercises.
33American Education.al Research Association, American Psychological Association, National Council for Measurement inEducation, Standards for Educational and Psychological Testing, (Washington, DC: 1985).
67
7 t;.
Interpreting actual student behaviors from the anchor level descriptions must
be done cautiously. While the description of the anchor level 250 suggests that students
have a general understanding of arithmetic operations, it does not follow that students are
able to perform all possible exercises that involve arithmetic operations. Furthermore,
there may be very few assessment exercises that relate to specific knowledge and skills
implied in the anchor point descriptions, such as division. For the anchor levels, there may
be as few as one exercise that pertains to some of the specific knowledge and skills in the
level descriptions.For example, many students at level 250 may be able to use basic arithmetic
operations to solve simple mathematical exercises, but few of them may be able to use those
operati one as successfully if the numbers are large or the context of the application is more
complex. Such advanced behavior probably would be suggestive of performance at a higher
anchor level.
Consequently, there is always the danger of over-interpreting student
performance at the anchor points. That is, one might assume that all students at a level
250 understand and apply basic mathematical operations in all contexts. Clearly, this is
not the case, and to sustain such a position would be an invalid interpretation of level 250
performance.
Anchor level descriptions, along with their illustrative items, provide a
general indication of performance at each anchor point. Taken as a whole, the combination
of descriptions and illustrative items give the public and education professionals that
capacity to reference points on the NAEP scale to what students generally know and can
do.
Several forms of evidence for the validity of the processes for relating student
behaviors, such as those described just above, to a specific anchor point (250, for example)
have been gathered by Educational Testing Service. First, the test items that serve as the
basis for the description and interpretation of each anchor point were carefully selected to
distinguish between scores at adjacent anchor levels. Clear distinctions among anchor
levels must be possible or the interpretations about the proportion of the sample at or
above each point cannot validly be made. Second, a national committee of mathematics
experts was divided into two groups. Each group independently generated anchor level
descriptions. The descriptions generated by each group were very similar, suggesting that
68
the descriptions did indeed reflect student behaviors at each anchor point, given the
selection rules discussed in Chapter 1. Third, there is statistical evidence to support the fit
of the psychometric model used in data analysis, hence the locations of the items on the
NAEP scale - central to the anchor and achievement level descriptions - are without serious
dispute. Thus, there is evidence for the internal validity of the processes use to develop the
anchor level descriptions and for the inferences that are made about what students know
and can do at each anchor level. However, prior to discussing how the proportions of
students at or above each anchor point are interpreted as an indicator of educational
progress, one important characteristic of the anchor level descriptions will be reviewed.
The anchor level descripCons were derived using the selection rules listed in
Chapter 1. Recall that the method used for generating the anchor level descriptions
included a priori selection of points on the NAEP scale. Items whose difficulty values
corresponded to each of these points, and that also met the statistical criteria, were then
identified. Among the statistical criteria was the requirement that each item have a p-value
of at least .65. Based on the items identified at each anchor point, two randomly-equivalent
groups of mathematics experts then made informed inferences about likely student
behaviors for each anchor point.
While interpretations of student performance in the NAEP sample can be
made based on the internal, process validity evidence, the decision to use the 65% criterion
for describing the anchor levels has had an important influence on the standard of
performance that is actually interpreted at any anchor level. Early in the anchoring
process an 80% rule was used for selecting items from which level descriptions were
developed. Later the 65% criterion was adopted. The choice of the statistical criteria for
selecting items to be used to develop anchor level descriptions is important, because
different criteria are likely to lead to different descriptions. Given that the underlying
distribution of scores is independent of the descriptions, inferences about the status of the
student sample's performance are likely to be different for different criteria.
Selecting items using a 65% criterion, for example, would result in selecting a
more difficult set of items upon which to base anchor level descriptions than an 80%
criterion. Descriptions that are referenced to a more difficult (the 65% criterion) set of
items will reference more challenging content than descriptions that are referenced at less
challenging levels (the 80% criterion).
69
7G
From an interpretive perspective, more challenging descriptors will give a
different picture about national achievement than less challenging descriptors. As noted
above, since the proportions of examinees at each level remain the same, more challenging
descriptions could lead to a more sanguine interpretation of the status of achievement
nationally than less challenging descriptions.
The selection of the statistical criteria for description development was an
arbitrary one. Arbitrary decisions about the statistical criteria are not necessarily
inappropriate. As long as the statistical criteria remain the same over an extended period
of time, trend data can be meaningfully interpreted. Experience with the performance data
and descriptions will enhance the interpretability of the data and allow policymakers to
become comfortable with the use of data in crafting educational policy.
The interpretation of the proportions of students at or above each anchor
level is important descriptive information about the performance of American students.
These proportions are presented in Table 1.1 of Chapter 1 in this volume. It is appropriate
to interpret these data as reporting the proportions of all students in the United States
who would have scored at or above each anchor level had all students been administered
the NAEP tests, given the sampling methodology that was used to collect that data. We
can be very certain, within the limits of the measurement error, that 15 percent of the
eighth grade students in 1990 scored at or above 300 and that 20 percent of eighth grade
students scored at or above that same level in 1992.
In addition to interpreting the performance of proportions of students at or
above each anchor level, NAEP data also allow the interpretation of proportions of students
correctly responding to sample test items (p-values). The sample items are illustrative of
each of the anchor levels, and along with the anchor level descriptors, are intended to add
meaning to the 500 point NAEP scale.
While p-values are very straightforward to interpret (the proportion of
examinees correctly answering an item or exercise), because there can be many p-values
associated with any sample item, care must be taken to correctly interpret the group of
students for which the p-values have been calculated. Further, extreme care must be taken
when p-values are interpreted within the context of anchor levels. A specific example
follows from the sample item presented in the Appendix that illustrates level 300
performance. Consider the following table:
70
77
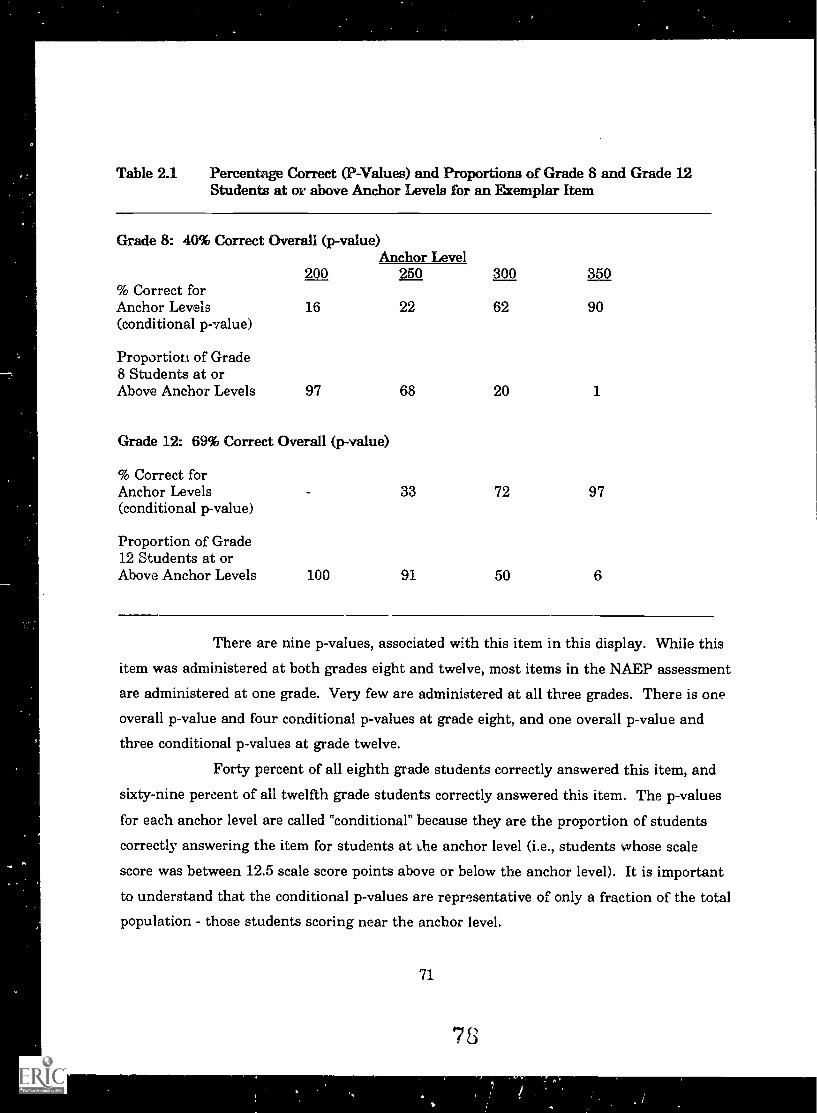
Table 2.1 Percentage Correct (P-Values) and Proportions of Grade 8 and Grade 12Students at or above Anchor Levels for an Exemplar Item
Grade 8: 40% Correct Overall
% Correct for
(p-value)Anchor Level
300 350200 250
Anchor Levels(conditional p-value)
16 22 62 90
Proportion of Grade8 Students at orAbove Anchor Levels 97 68 20 1
Grade 12: 69% Correct Overall (p-value)
% Correct forAnchor Levels(conditional p-value)
33 72 97
Proportion of Grade12 Students at orAbove Anchor Levels 100 91 50 6
There are nine p-values, associated with this item in this display. While this
item was administered at both grades eight and twelve, most items in the NAEP assessment
are administered at one grade. Very few are administered at all three grades. There is one
overall p-value and four conditional p-values at grade eight, and one overall p-value and
three conditional p-values at grade twelve.
Forty percent of all eighth grade students correctly answered this item, and
sixty-nine percent of all twelfth grade students correctly answered this item. The p-values
for each anchor level are called "conditional" because they are the proportion of students
correctly answering the item for students at the anchor level (i.e., students whose scale
score was between 12.5 scale score points above or below the anchor level). It is important
to understand that the conditional p-values are representative of only a fraction of the total
population - those students scoring near the anchor level.
71
78
=1.
So far this discussion has presented interpretations of overall p-values by
grade and conditional p-values by anchor level for each grade. There is, however, further
possibility for confusion in interpreting student pm formance when the item p-values for
students at each level are confused with proportions of students scoring at or above each
anchor level.
A common error in interpreting anchor level performance is confusing the
proportion of students correctly answering an item with the proportion of examinees
scoring at each anchor level. This confusion has been described in detail by Linn and
Dunbar,34 and in Chapter 1 of this volume. Using the information from the level 300
item above, we know tht.,t 40 percent of all the eighth grade students answered the item
correctly. Further, 20 percent of the stu lents scored at or above anchor level 300. Upon a
cursory reading of the results, one might improperly conclude that only 20 percent of the
students answered the item correctly because the item anchored at a level 300.
In this example, the misinterpretation that 20 percent answered the item
correctly, when in fact 40 percent answered it correctly, would be understating the
performance of the sample. Understating the performance could then give rise to greater
alarm about more general and invalid interpretations about student performance.
There are other cautions as well that need to be heeded when interpreting
sample items that illustrate performance at the anchor levels. A sample item illustrating a
specific anchor level does not address performance of students at higher or lower anchor
levels. Using the item above as an example, it is incorrect to assume that students
achieving at anchor levels less than 300 would necessarily incorrectly answer the item.
Examinees scoring just below a scale score of 300 have nearly as much chance of correctly
answering the level 300 item as students scoring at that level.
Conversely, it would be incorrect to assume that all students above a scale
score of 300 would answer the item correctly. Some students scoring above 300 may
incorrectly answer the item. For example, the conditional p-value for all students scoring
at 350 in grade eight is 90 percent, meaning that 10 percent of the students at level 350 did
not answer the item correctly.
34Robert L. Linn and Steven B. Dunbar, "Issues in th*. Design and Reporting of the National Assessment of EducationalProgress," Journal of Educational Mea.surement, 1992, vol. 29, pp. 177-194.
72
7 9
Valid interpretations beyond describing the actual proportions at or above
each anchor level, or performance by each item, become much more problematic. Going
beyond reporting the actual proportions of sample members at or above the NAEP anchor
levels has been criticized on validity grounds. Forsyth has made this point very clearly.36
He cites, among other examples, interpretations made regarding the performance of
students based on the 1986 Science Report Card.36 As Forsyth points out, the authors of
that report interpreted the results of student performance on the science assessment as
meaning that students were not prepared to participate in civic affairs. This generalization
by the authors was based on their interpretation of low scores on thinking skills and
science knowledge, outcomes that are presumably related to informed civic participation.
The problem with this interpretation, as Forsyth correctly indicated, is that
while the generalization may have been correct, there was no validity evidence for such an
interpretation. Such evidence is required by the Standards for Educational and
Psychological Testing.
Specifically, Standard 1.1 indicates:
Evidence of validity should be presented for the major types ofinferences for which the use of a test is recommended. A rationaleshould be provided to support the particular mix of evidence presentedfor the intended uses. (p. 13).
Standard 1.2 requires that:
If validity for some common interpretations has not been investigated,that fact should be made clear, and potential users should becautioned about making such interpretations. Statements aboutvalidity should refer to the validity of particular interpretations... (p.13).
Extending interpretations beyond the actual data is an important issue when
evaluating the 1992 mathematics results. There are important educational and
policymaking reasons in wanting to extend interpretations from the NAEP data base.
Because the NAEP data base is so comprehensive and important, it is only natura'. to want
35Robert A. Forsyth, "Do NAEP Scales yield criterion-referenced interpretationsr' Educational Measurement : Issues andPractice, 1991, 10, pp. 3-9, 16.
36Ina V. Mullis and Lynn B. Jenkins, The Science Report Card: Elements at Risk and Recovery, (Washington, DC.: U.S.Department of Education, 1988).
73
80
to find as much meaning in the results as possible. However, the relationship between
student performance as reflected by the anchor levels and other important issues, such as,
readiness for advanced mathematics study, the adequacy of the mathematics curricula
among the nation's schools, and understanding whether current performance is sufficient to
compete in today's international marketplace, has simply not been established.
This is not meant to suggest that such relationships cannot or should not be
established, but rather they are not currently part of the validity data that has been
collected for NAEP. To extend interpretations beyond performance on the NAEP scale
itself, without validity evidence for these interpretations, would be inappropriate.
4. Validity Issues with Achievement Levels
Reporting NAEP results relative to what students should know is a
qualitative change from reporting what students do know. Such a change recognizes the
role NAEP assessments may have in the future relative to the continuing trend toward the
identification and assessment of national curriculum standards. Various proposals have
been suggested, such as those found in AMERICA 2000,37 the National Educational
Goals Panel Report,38 and the report of the National Council on Education Standards
and Testing, 39 that suggest some policymakers would like to see NAEP assume a more
direct role in the assessment of national educational standards.
There are other examples of extended uses of NAEP scores that would not
have been possible in the past, uses that are far beyond NAEP's original purpose of
monitoring the achievement of groups of students at the national and regional levels. Some
of the recent applications of NAEP data include:
1. the Trial State Assessments conducted in 1990 and 1992
37U.S. Department of Education , AMERICA 2000: An Education Strategy, 1991.
3sNational Educational Goals Panel Report (NEGP), The National Educational Goals Panel Report: Building a Nation ofLearners, (Washington, DC: NEGP, 1991).
39The National Council on Education Standards ad Testing, Raising Standards for American Education, ( Washington,DC.: U.S. Department of Education, 1992).
74
7_
2. the recasting of the achievement levels by the National Educational
Goals Panel to define competent student performance°
3. the use of NAEP items for the 1988 and 1991 International
Assessment of Educational Progress, (IAEP).41
Another potential use of NAEP data and scales is being considered by NAGB.
Currently NAGB is considering establishing a policy for linking other assessments, such as
state, local, and commercial tests, to the NAEP scale. In fact, California,42 Maryland, and
Kentucky have already shown interest in linking their state assessment results to the
NAEP scale.
These and other demands on NAEP and the NAEP scale represent a trend in
which the stakes for NAEP testing have increased. Raising the stakes for NAEP puts an
additional burden on all components of the NAEP assessment, and particularly on those
who wish to make valid interpretations of NAEP scores. There is growing evidence that
misunderstandings of NAEP scales and scores result in interpretations that are not
necessarily supported by the data.43 44 45 46 Given the increasingly high stakes uses
of NAEP results, it is critical that the validity and invalidity of various interpretations are
known. It is only in this way that public policy can be illuminated based on valid
inferences from the test results.
40NEGP, 1991.
41Two reports relate to the use of NAEP scales for IAEP Assessments. They are:
Archie E. Lapointe, Nancy A. Mead, and Gary W. Phillips, A World of Difference: An International Assessment of Mathematicsand Science (Report No: 19-CAEP-01, Princeton: Educational Testing Service, 1989).
IAEP Te.hnical Report: Volume Two,(Princeton: Educational Testing Service, 1992).
42Stephen G. Schilling and R. Darrell Bock, Relating CAP Grade Twelve Reading and Mathematics Scale Scores to NAEPReading and Mathematics Scores, 1989.
43Robert A. Forsyth, 1991.
44R. Glaser and R. Linn, Assessing Student Achievement in the States: The First Report of the National Academy ofEducation Panel on the Evaluation of the NAEP Trial State Assessment, (Stanford, CA: National Academy of Education, 1992).
45Richard M. Jaeger. "General issues in reporting of the NAEP Trial State Assessment results," in Glaser, R. and Linn, R.,Assessing Student Achievement in the States, (Stanford, CA: National Academy of Education, 1992).
46Robert L. Linn and Steven B. Duribar "Issues in the design and reporting of the National Assessment of EducationalProgress," Journal of Educational Measurement, 1992, 29, 177-194.
75
2
In the future it is expected that achievement levels will replace anchor levels
as the primary way of reporting NAEP results. With the increased visibility of NAO.?, it
wili become more important in the future to address issues of validity. A recent United
States General Accounting Office (GAO) correspondence47 and a planned GAO report
have highlighted the need to attend to the validity of inferences from the achievement
levels. Unfortunately, no single study or piece of evidence is likely to be sufficient to either
validate or invalidate the intended interpretations. It is usually a matter of compiling a
substantial amount of information and then considering it in a comprehensive way. This
concept of assessing validity through compiling evidence is captured nicely by the Standards
for Educational and Psychological Testing:
Validity is the most important consideration in test evaluation. The conceptrefers to the appropriateness, meaningfulness, and usefulness of specificinferences made from test scores. Test validation is the process ofaccumulating evidence to support such inferences. A variety of inferencesmay be made from scores produced by a given test, and there are many waysof accumulating evidence to support any particular inference. Validity,however, is a unitary concept. Although evidence may be accumulated inmany ways, validity always refers to the degree to which that evidencesupports the inferences that are made from the scores. The inferencesregarding specific uses of a test are validated, not the test itself.
In line with this view of gathering validity evidence from a variety of sources,
and anticipating the importance of the achievement levels in the future, the National
Academy of Education (NAE) has agreed to conduct a series of 10 validity studies based on
the achievement levels developed by the NAGB in 1992. The results of the 10 studies will
be available in the fall of 1993 and are part of a larger set of 22 studies being conducted as
part of the Congressionally mandated evaluation of the Trial State Assessment.
The National Academy of Education Panel, in their evaluation of the
achievement level setting process, introduced a useful distinction between internal and
external validity evidence. Internal evidence comes from the processes themselves, the
methods and procedures used by and with judges as recommendations about standards and
47National Assessment Technical Quality. GAO Correspondence to Congressman Ford end Kildee, March 11, 1992.GAO/PEMD-99-22R.
76
83
level descriptions. If, for example, processes and methods were changed, or a different
panel of judges were used, to what extent would the results be altered?
External evidence has to do with data external to the process itself that can
be used to support or refute the desired interpretations of the anchor and achievement
levels. In large and unusually complex projects that have increasingly high stakes
associated with them, substantial amounts of internal and external data are needed to
support the strong interpretations associated with the anchor and achievement levels. Both
internal and external sources of validity data will be discussed in the following sections.
The NAE divided their studies into four external validity studies and six
internal validity studies. The external validity studies involve comparing the results
obtained by NAEP to external information. The four studies will compare NAEP results
to:
1) teacher judgments who use the operational definitions of basic,
proficient and advanced to categorize students
2) international data equated to NAEP
3) levels of performance of 12th graders to college admissions tests
4) the content judgments of a cross-validation sample of subject experts.
The six internal validity studies are analyses of the process NAGB use to set achievement
levels. The studies include an analysis of:
1) the differential effects in setting the achievement levels caused by the
differing item formats (e.g., multiple-choice versus constructed
responses)
2) the sources of error in setting the achievement levels
3) the variation in achievement levels across the different content areas
4) the setting of three achievement levels from each item rather than the
usual one standard in the Angoff procedures
5) judgments from teachers and others on the achievement levels
6) the observations of the entire achievement level-setting process.
77
84

Collectively, this series of studies should provide sufficient evidence to make informed
judgments about the validity of the achievement levels.
In addition to the recommended internal and external validity studies that
are either completed or underway, more global concerns about the capacity of the National
Assessment, as currently conceived, to maintain its status as a valid achievement indicator
must be raised. A specific example follows.
The historical approach to establishing achievement levels for mathematics
and reading has been a model where content is first specified through frameworks, item
specifications and assessment items and tasks are written consistent with the frameworks,
the assessments are administered, and then achievement levels are developed. One of the
problems this approach creates is that there may be a lack of consistency between the
achievement level standards and what the assessment actually measures. (As an example,
the eighth grade mathematics basic achievement level description indicates that students
should be able to solve problems using computers. Computer usage is not a part of the
NAEP mathematics assessment.) The question arises, what are the validity issues for
assessing progress toward standards when the assessment instrument may not reflect the
standards?
One model for the development of assessment instruments and achievement
levels that would eliminate this validity problem would be to move to a developmental
sequence where the achievement level standards are established first, and then the
frameworks, items and tasks, and assessment instruments are developed and implemented.
This model would ensure the consistency between the assessment instrument and the
achievement level standards, and enhance the validity of both.
The larger validity issue, however, is whether the NAEP assessment can
measure prespecified world-class standards without undergoing some basic design
transformations. If the model of specifying the achievement level standards first in the
development process were implemented, it is conceivable that the standards would place a
very high premium on content that was challenging for most American school children.
Such high standards would require the development of an assessment instrument that
measures well at the high end of the achievement distribution. Th9 NAEP assessment,
currently designed to measure what students know and can do across all parts of the
achievement distribution, would need to focus much more at the upper end of the
78
distribution due to the more challenging content (standards). For a given amount of
testing time, focusing the assessment at the upper end will, by necessity, result in an
assessment instrument that measures students less well at the mid- to lower-ranges of the
achievement distribution.
Interpretations of the Point 300 on the NAEP Mathematics Scale
AP has been discussed in this chapter, interpretations of test scores must be
validated by the compiling of evidence. Currently we have two major ways of interpreting
the NAEP scales -- by anchor levels and achievement levels. The interpretations of anchor
levels have been designed to indicate what students can do in mathematics at a certain
point on the scale. In contrast, descriptions of the achievement levels are designed to
indicate what students should be able to do in mathematics at a certain range on the scale.
We will use the 300 point on the NAEP scale to illustrate this difference more clearly.
Using the anchor level interpretation of 300, the overall description of the
level is that students can use reasoning and problem-solving involving fractions, decimals,
percents, and elementary concepts in geometry, statistics, and algebra. More specifically,
students at this level can use various strategies and explain their reasoning in a variety of
problem-solving situations. They are able to solve problems involving not only whole
numbers but also decimals and fractions. They can represent and find equivalent fractions,
and use these concepts in solving routine problems. They can find a percent of a number
and use this skill in simple problems. Multiplication and division of whole numbers have
developed to the extent that students can use all four operations in multistep problems.
Students can read and use instruments in more complex situations. They can
find areas of rectangles, recognize relationships among common units of measure, and solve
routine problems involving similar triangles and scale drawings. They have knowledge of
definitions and properties of simple geometric figures in the plane. Their spatial sense
includes the ability to visualize a cube in either three-dimensional space or its flattened
form in a plane.
Students can calculate averages, select and interpret data from a variety of
graphs, list the possible arrangements in a sample space, find the probability of a simp!e
event, and have a beginning understanding of sample bias. They can use knowledge of
relative frequencies in simple simulation situations. Students show the ability to evaluate
79
simple expressions and solve linear equations. Students can graph points on coordinate
axes, locate the missing coordinates for a corner of a square, and identify whiih ordered
pairs satisfy a given linear equation.
Using the same point 300 with achievement levels, there are three
descriptions of what students should be able to do at this point, depending on whether they
are in fourth, eighth or twelfth grade.
Fourth grade students at 300 are within the Advanced range and should
apply integrated procedural knowledge and conceptual understanding to problem solving in
the five content areas. Fourth graders performing at the advanced level should be able to
solve complex and nonroutine real-world problems in all NAE7 content areas. They should
display mastery in the use of four-function calculators, rulers, and geometric shapes. These
studenta are expected to draw logical conclusions and justify answers and solution processes
by explaining why, as well as how, they were achieved. They should go beyond the obvious
in their interpretations and be able to communicate their thoughts clearly and concisely.
Eighth grade students at 300 are within the T oh ient range and should
apply mathematical concepts and procedures consistently to complex problems in the five
NAEP content areas. Eighth graders performing at the proficient level should be able to
conjecture, defend their ideas, and give supporting examples. They should understand the
connections between fractions, percents, decimals, and other mathematical topics such as
algebra and functions. Students at this level are expected to have a thorough
understanding of basic-level arithmetic operations -- an understanding sufficient for
problem solving in practical situations. Quantity and spatial relationships in problem
solving and reasoning should be familiar to them, and they should be able to convey
underlying reasoning skills beyond the level of arithmetic. They should be able to compare
and contrast mathematical ideas and generate their own examples. These students should
make inferences from data and graphs, apply properties of informal geometry, and
accurately use the tools of technology. Students at this level should understand the
process of gathering and organizing data and be able to calculate, evaluate, and
communicate results within the domain of statistics and probability.
Twelfth graders at 300 on the scale are within the Basic range and shnuld
demonstrate procedural and conceptual knowledge in solving problems in the five NAEP
areas. Twelfth grade students performing at the basic level should be able to use
80
87
estimation to verify solutions and determine the reasonableness of results as applied to
real-world problems. They are expected to use algebraic and geometric reasoning strategies
to solve problems. Twelfth graders performing at the basic level should recognize
relationships presented in verbal, algebraic, tabular, and graphical forms; and demonstrate
knowledge of geometric relationships and corresponding measurement skills. They should
be able to apply statistical reasoning in the organizations and display of data and in reading
tables and graphs. They also should be able to generalize from patterns and examples in
the areas of algebra, geometry, and statistics. At this level, they should use correct
mathematical language and symbols to communicate mathematical relationships and
reasoning processes, and use calculators appropriately to solve problems.
As can be seen from the two types of interpretations there are several
differences.
First, the description for 300 as an anchor point is exactly that. It describeswhat students can do who are at or near this point on the scaie. In contrast,when using achievement levels, 300 falls into a range of scores, in theadvanced range at grade 4, the proficient range at grade 8, and the basicrange at grade 12. (Second, the anchor level description is for students in all three grades(although only a handful of fourth graders were at or above 300). Studentsat this level are likely to be able to do the types of activities in mathdescribed at that point regardless of grade or age. In contrast, theachievement level descriptions are grade specific and are different at thethree grades, reflecting the different expectations of students at the threegrade levels.
Third, and perhaps the most important difference, is the use of the words canand are able to in the anchor level description and the words should and areexpected to in the achievement level descriptions. Since the anchor leveldescription is based on an examination of items that discriminate at thatlevel it is an empirical judgment about what students are able to do on theassessment in mathematics at level 300. In contrast, the achievement leveldescriptions are developed by a panel of experts to reflect what students ateach level and at each grade should know and should be able to do and thenmapped onto the scale. While the anchor level descriptions are derivedprimarily from an inspection of the actual items on the test, the achievementlevel operationalized descriptions are derived primarily from the testobjectives. In other words, the anchor level descriptions are based onperformance on the assessment and the achievement level descriptions arebased on expectations about performance. These two types of descriptionsare not interchangeable.
81
88
One issue that has arisen in the interpretation of the achievement levels is
that readers tend to interpret them as statements of what students can do as opposed to
what students should do at the various levels on the NAEP Scale. For example, based on
the preliminary results of the review of press clippings from the 1990 release of Nii,EP data
using achievement levels", the NAEP Technical Review Panel found that the vast
majority of articles interpreted the achievement levels as statements of what students can
do.
In order to determine better the extent to which students can do the
behaviors mentioned in the achievement level descriptions, NCES sponsored a conference
on March 3, 1993 to address the issue. Data from various studies were provided by ACT
and the NAEP Technical Review Panel that attempted to determine the extent to which
students "can do" the activities the achievement level descriptions indicate students "should
do." Although data and arguments were provided from a variety of perspectives, the issue
was not resolved. In the future, the issue needs to be more thoroughly addressed, and
several ongoing studies will continue to examine the topic.
The achievement level standards were developed based on collective
judgments about how students should perform. These descriptions were designed to be
general statements about what students should be able to do at the various levels. Readers
should be aware that additional evidence is needed regarding the mastery of the knowledge
and skills implied in the achievement level descriptions. Because this process is
developmental, modifications and improvements may be made in the future that could
affect the reporting of results.
Knowledge and skills implied by each achievement level description represent
expectations for student mathematical learning. It is important to consider, however, that
the mathematical knowledge and skills contained in the achievement level descriptions are
not intended to represent the universe of behaviors that might define a particular
knowledge or skill, nor do they necessarily relate to any specific number of items in the
NAEP assessment.
For example, some of the behaviors contained in the eighth grade Proficient
(294) description are; "Students ... should understand the process of gathering and
,ismary L Bourcue and Howard H. Garrison. The Levels of Mathematic Achievement: Initial Performance Standards forthe 1990 NAEP Mathematics Assessment. (Washington, D.C.: National Assessment Governing Board, 1991).
82
WOK
I.
organizing data and be able to calculate, evaluate, and communicate results within the
domain of statistics and probability." The number and complexity of assessment exercises
that could be written to define the universe of knowledge and skills related to probability
and statistics is potentially immense, ranging from the simple to the complex.
The vehicle that is available to refine our focus on the segment of the domain
represented in the description is the illustrative items. The illustrative items help the test
user understand what is expected at each achievement level. Although only one illustrative
item for each achievement level is provided in the Appendix, a larger set of items are
available in other reports (e.g., see NAEP 1992 Mathematics Report Card for the Nation
and the States).
At present, the best way that a test user has to understand the expected level
of performance is to view each achievement level description, and the entire set of
illustrative items associated with each level, in the aggregate. Viewing both the
descriptions and the illustrative items in the aggregate will provide an overall picture of
expected performance at each achievement level. As test development increases the size of
the item pools over time, more items will become available for the test user so that a clearer
picture of the expected levels of performance will emerge.
In summary, if we want to know what students actually can do at selected
levels on the NAEP scale, we have to use the anchor level interpretations. If, on the other
hand, we want to know what students should be able to do at certain levels on the scale, we
have to use the achievement level interpretations.
Summary
As NAEP continues to explore ways to report its results more clearly and
concisely to its audiences in the face of the growing complexity of the assessment and the
demands placed upon it, issues related to the validity of the interpretations of those results
will continue to arise. It has been clearly articulated that validity is related to the
interpretations and use of the test scores and also related to the accumulation of evidence
to support those interpretations.
Currently NAEP is introducing a new way of interpreting scores -- the
achievement levels set by NAGB -- and in the future may consider other new ways of
making NAEP data more useful and meaningful. The need for validity evidence to support
83
9 0
the interpretations presented by use of the achievement levels is evident, and Congress,
through NCES, has provided for an independent evaluation to start the process. The
National Academy of Education's evaluation of the Trial State Assessment is examining
evidence from several studies that will help assess the validity of interpretations. As has
been pointed out in this chapter, there have been times in past NAEP reports when
interpretations were made using the anchor level descriptions that did not present evidence
to support those interpretations. NCES has worked to remedy that situation and make the
interpretations in NAEP as valid as possible using the anchor levels, and its goal is to make
the same effort with the achievement levels, and any future methods of reporting and
interpreting NAEP data.
84
9

APPENDIX
:
9 2
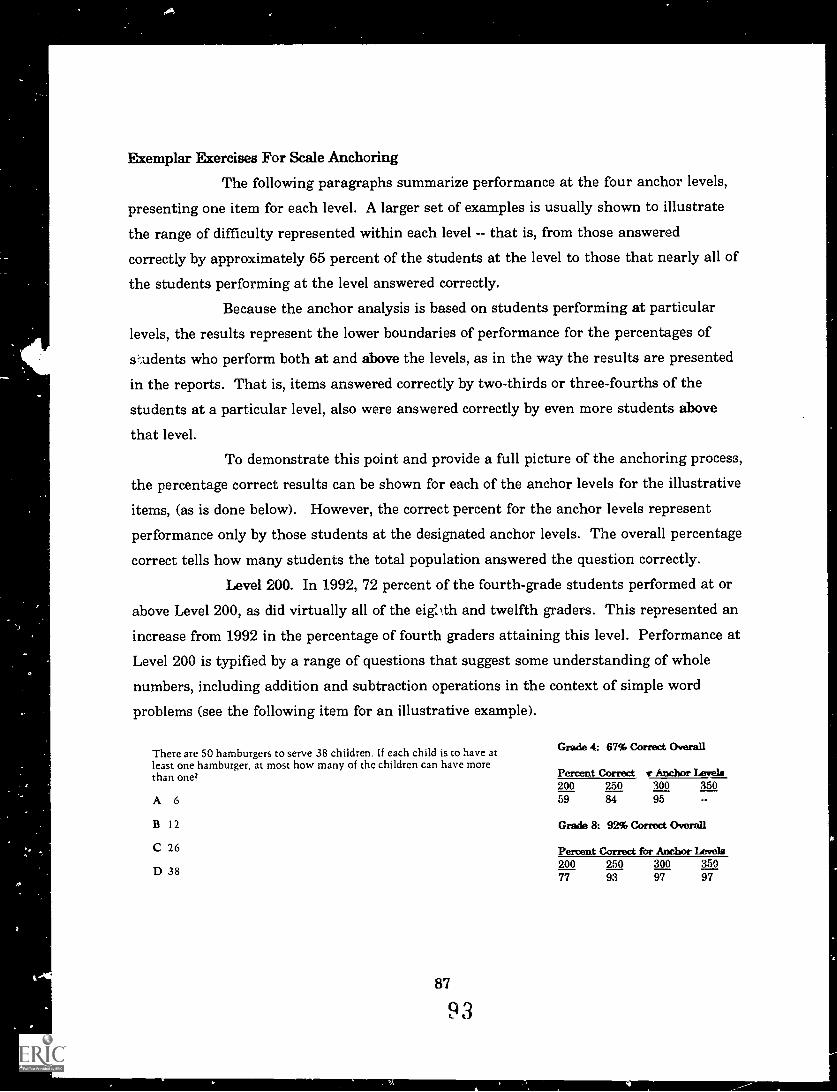
Faemplar Exercises For Scale Anchoring
The following paragraphs summarize performance at the four anchor levels,
presenting one item for each level. A larger set of examples is usually shown to illustrate
the range of difficulty represented within each level -- that is, from those answered
correctly by approximately 65 percent of the students at the level to those that nearly all of
the students performing at the level answered correctly.
Because the anchor analysis is based on students performing at particular
levels, the results represent the lower boundaries of performance for the percentages of
s'-,udents who perform both at and above the levels, as in the way the results are presented
in the reports. That is, items answered correctly by two-thirds or three-fourths of the
students at a particular level, also were answered correctly by even more students above
that level.
To demonstrate this point and provide a full picture of the anchoring process,
the percentage correct results can be shown for each of the anchor levels for the illustrative
items, (as is done below). However, the correct percent for the anchor levels represent
performance only by those students at the designated anchor levels. The overall percentage
correct tells how many students the total population answered the question correctly.
Level 200. In 1992, 72 percent of the fourth-grade students performed at or
above Level 200, as did virtually all of the eig'oth and twelfth graders. This represented an
increase from 1992 in the percentage of fourth graders attaining this level. Performance at
Level 200 is typified by a range of questions that suggest some understanding of whole
numbers, including addition and subtraction operations in the context of simple word
problems (see the following item for an illustrative example).
Grade 4: 67% Correct OverallThere are 50 hamburgers to serve 38 children. If each child is to have atleast one hamburger, at most how many of the children can have morethan one? Percent Correct T Anchor Levels
NO 250 MO 350A 6 59 84 95
B 12 Grade 8: 92% Correct Overall
C 26 Percent Correct for Anchor LevelsNO 250 MO 350
D 38 77 93 97 97
87
93
Fifty-nine percent of the fourth graders and 77 percent of the eighth graders
at Level 200 answered this question correctly. Because more than 65 percent of the Level
200 students at one grade, but not at the other grade, answered this item correctly, it
almost met the criteria for anchoring and represents the most difficult items likely to be
answered correctly by students at Level 200. However, since 84 percent of the fourth
graders and 93 percent of the eighth graders at Level 250 were able to answer this item
correctly, many students with proficiency levels in the 225 to 250 range would be expected
to be able to solve problems of this nature. As with the item mapping, however, it is
important to remember that the p-values in relation to various levels of scale-score
performance differ from the p-values for the total population. Taking the total population
of students into consideration regardless of their scale-score estimate, the item was
answered correctly by 67 percent of the fourth graders and 92 percent of the eighth
graders.
Students performing at or above Level 200 also showed a familiarity with the
attributes of length and weight, demonstrating relatively consistent success in recognizing
the instruments used to measure these attributes and identifying appropriate units of
measure. Their understanding of geometric figures and pattern sequences appeared to be
very minimal.
Level 250. Students performing at or above Level 250 appeared to have
extended their understanding of whole numbers from additive to multiplicative settings and
were able to solve some two-step problems. In 1992, 17 percent of the fourth graders, two-
thirds of the eighth graders, and 91 percent of the twelfth graders performed at or above
this level. This represented an improvement for fourth graders, but essentially no change
at grades 8 and 12.
88
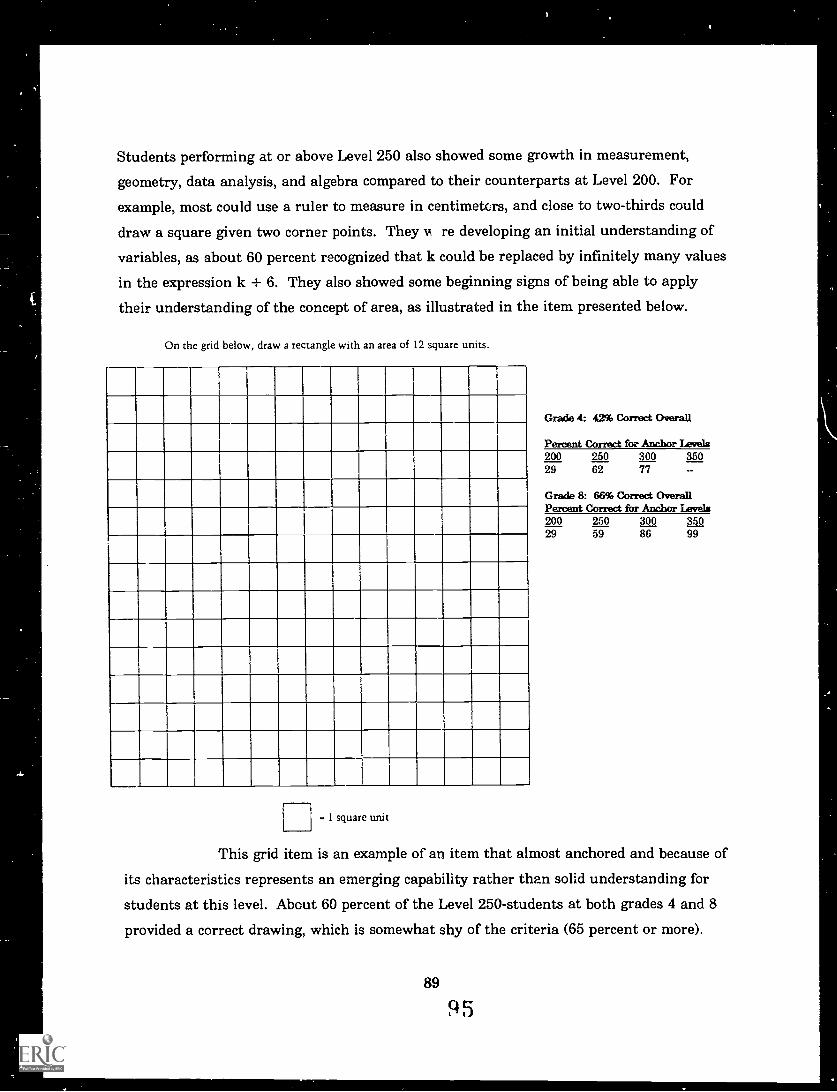
.4.
Students performing at or above Level 250 also showed some growth in measurement,
geometry, data analysis, and algebra compared to their counterparts at Level 200. For
example, most could use a ruler to measure in centimetors, and close to two-thirds could
draw a square given two corner points. They N't re developing an initial understanding of
variables, as about 60 percent recognized that k could be replaced by infinitely many values
in the expression k + 6. They also showed some beginning signs of being able to apply
their understanding of the concept of area, as illustrated in the item presented below.
On the grid below, draw a rectangle with an area of 12 square units.
- 1 square unit
Grade 4: 42% Correct Overall
Percent Correct for Anchor Levels200 250 300 36029 62 77
Grade 8: 66% Correct OverallPercent Correct for Anchor Levels200 250 300 35029 59 86 99
This grid item is an example of an item that almost anchored and because of
its characteristics represents an emerging capability rather than solid understanding for
students at this level. About 60 percent of the Level 250-students at both grades 4 and 8
provided a correct drawing, which is somewhat shy of the criteria (65 percent or more).
89
95
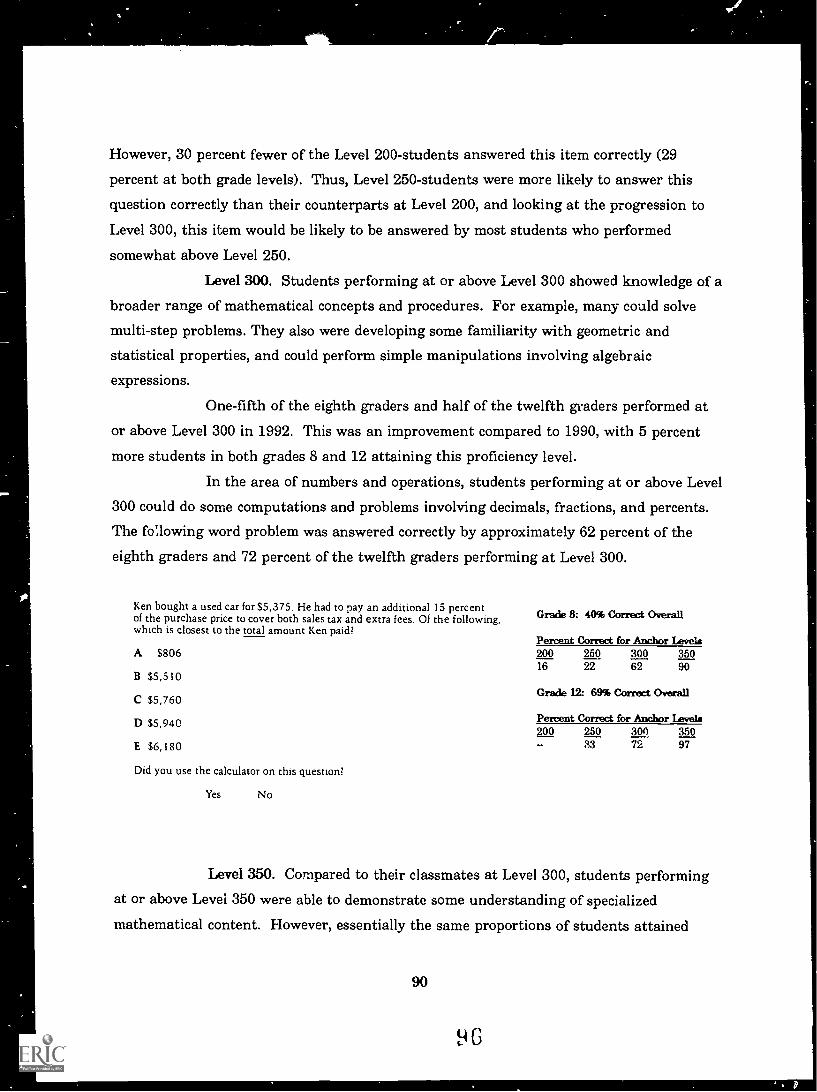
However, 30 percent fewer of the Level 200-students answered this item correctly (29
percent at both grade levels). Thus, Level 250-students were more likely to answer this
question correctly than their counterparts at Level 200, and looking at the progression to
Level 300, this item would be likely to be answered by most students who performed
somewhat above Level 250.
Level 300. Students performing at or above Level 300 showed knowledge of a
broader range of mathematical concepts and procedures. For example, many could solve
multi-step problems. They also were developing some familiarity with geometric and
statistical properties, and could perform simple manipulations involving algebraic
expressions.
One-fifth of the eighth graders and half of the twelfth graders performed at
or above Level 300 in 1992. This was an improvement compared to 1990, with 5 percent
more students in both grades 8 and 12 attaining this proficiency level.
In the area of numbers and operations, students performing at or above Level
300 could do some computations and problems involving decimals, fractions, and percents.
The fo:lowing word problem was answered correctly by approximately 62 percent of the
eighth graders and 72 percent of the twelfth graders performing at Level 300.
Ken bought a used car for $5,375. He had to pay an additional 15 percentof the purchase price to cover both sales tax and extra fees. Of the following,which is closest to the total amount Ken paid?
Grade 8: 40% Correct Overall
Percent Correct for Anchor LevelsA $806 200 250 300 350
16 22 62 soB $5,510
C $5,760
D $5,940
E $6,180
Did you use the calculator on this question?
Grade 12: 69% Correct Overall
Percent Correct for Anchor Levels200 250 300
7235097
Yes No
Level 350. Compared to their classmates at Level 300, students performing
at or above Level 350 were able to demonstrate some understanding of specialized
mathematical content. However, essentially the same proportions of students attained
90
96
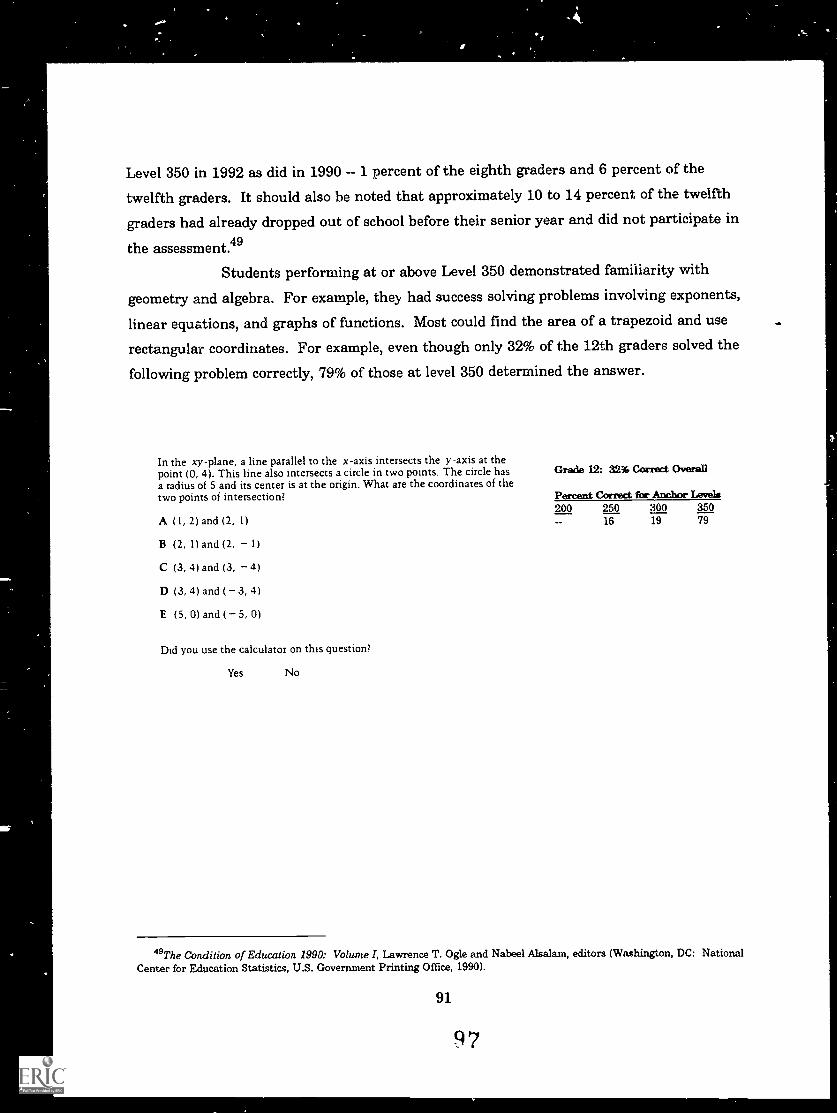
Level 350 in 1992 as did in 1990 -- 1 percent of the eighth graders and 6 percent of the
twelfth graders. It should also be noted that approximately 10 to 14 percent of the twelfth
graders had already dropped out of school before their senior year and did not participate in
the assessment.°Students performing at or above Level 350 demonstrated familiarity with
geometry and algebra. For example, they had success solving problems involving exponents,
linear equations, and graphs of functions. Most could find the area of a trapezoid and use
rectangular coordinates. For example, even though only 32% of the 12th graders solved the
following problem correctly, 79% of those at level 350 determined the answer.
In the xy-plane, a line parallel to the x-axis intersects the y-axis at thepoint (0, 4). This line also intersects a circle in two points. The circle hasa radius of 5 and its center is at the origin. What are the coordinates of thetwo points of intersection?
A (I, 2) and (2, 1)
B (2, 1) and (2, 1)
C (3, 4) and (3, 4)
D (3, 4) and ( 3, 4)
E (5, 0) and ( 5, 0)
Did you use the calculator on this question?
Yes No
Grade 12: 32% Correct Overall
Percent Correct for Anchor Levels200 250 300 350
16 19 79
49The Condition of Education 1990: Volume I, Lawrence T. Ogle and Nabeel Alsalam, editors (Washington, DC: NationalCenter for Education Statistics, U.S. Government Printing Office, 1990).
91
9 7
To reinforce an understanding of techniques that investigate p-values in
relation to scale level, the following discussion uses examples from the ancho:- data. Forexampl , 20 percent of the eighth graders and 50 percent of the twelfth graders performed
at or above Level 300 on the mathematics scale. The item requiring students to compute a15 percent addition to the cost of a car for tax and fees was answered correctly by 62 and72 percent of the eighth and twelfth graders performing at Level 300, respectively. Thus,students performing at Level 300 would have approximately a two-thirds probability ofanswering this type of question correctly. Students at higher levels on the scale wouldhave a higher probability of responding correctly (e.g., more than 90 percent at Level 350),and students at lower levels on the scale would have a lower probability (e.g., about 25percent at Level 250). In actuality, when the total populations were considered regardlessof scale level, 40 percent of the eighth graders and 69 percent of the twelfth gradersresponded correctly. The scale and anchor interpretations help describe what better andpoorer students know and can do, but the overall percentages correct (p-values) for each
item indicate the likelihood of success across the total population.
92
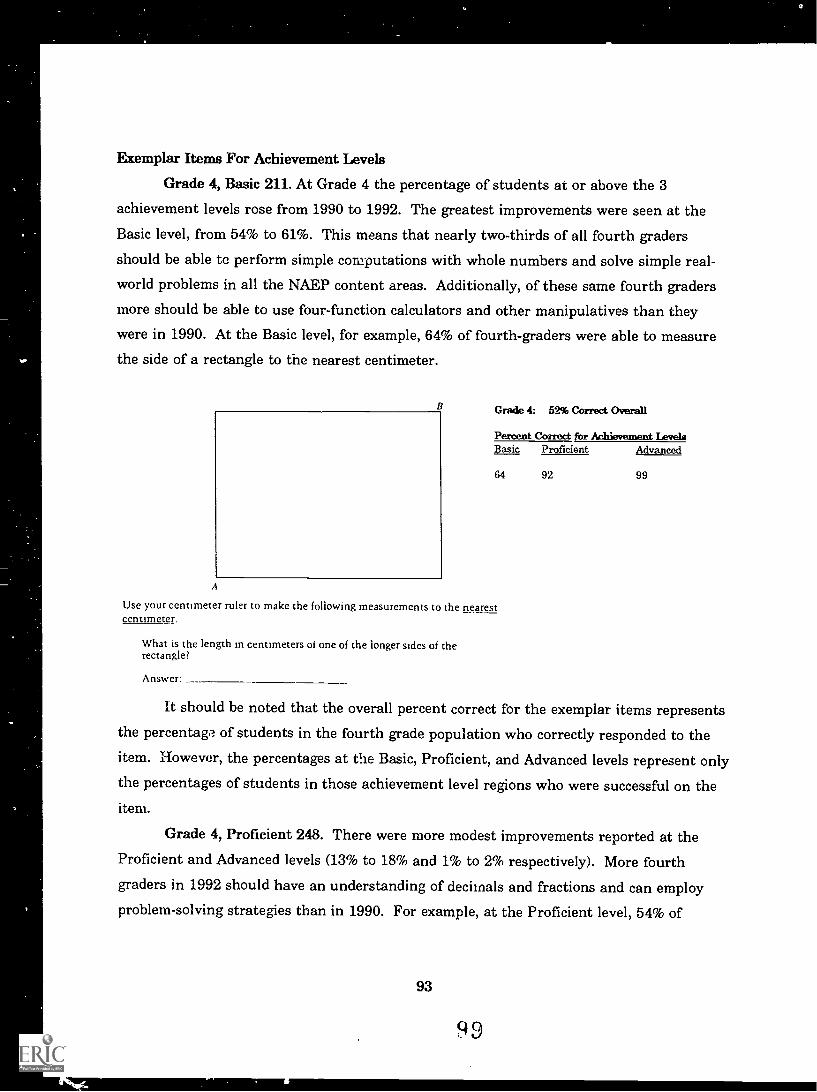
Exemplar Items For Achievement Levels
Grade 4, Basic 211. At Grade 4 the percentage of students at or above the 3
achievement levels rose from 1990 to 1992. The greatest improvements were seen at the
Basic level, from 54% to 61%. This means that nearly two-thirds of all fourth graders
should be able tc perform simple computations with whole numbers and solve simple real-
world problems in all the NAEP content areas. Additionally, of these same fourth graders
more should be able to use four-function calculators and other manipulatives than they
were in 1990. At the Basic level, for example, 64% of fourth-graders were able to measure
the side of a rectangle to the nearest centimeter.
A
Grade 4: 52% Correct Overall
Percent Correct for Achievement Levet'Basic Proficient Advanced
64 92 99
Use your centimeter ruler to make the following measurements to the nearestcentimeter.
What is the length in centimeters ot one of the longer sides of therectangle?
Answer
It should be noted that the overall percent correct for the exemplar items represents
the percentap of students in the fourth grade population who correctly responded to theitem. However, the percentages at the Basic, Proficient, and Advanced levels represent onlythe percentages of students in those achievement level regions who were successful on theitem.
Grade 4, Proficient 248. There were more modest improvements reported at theProficient and Advanced levels (13% to 18% and 1% to 2% respectively). More fourth
graders in 1992 should have an understanding of decimals and fractions and can employ
problem-solving strategies than in 1990. For example, at the Proficient level, 54% of
93
9 9
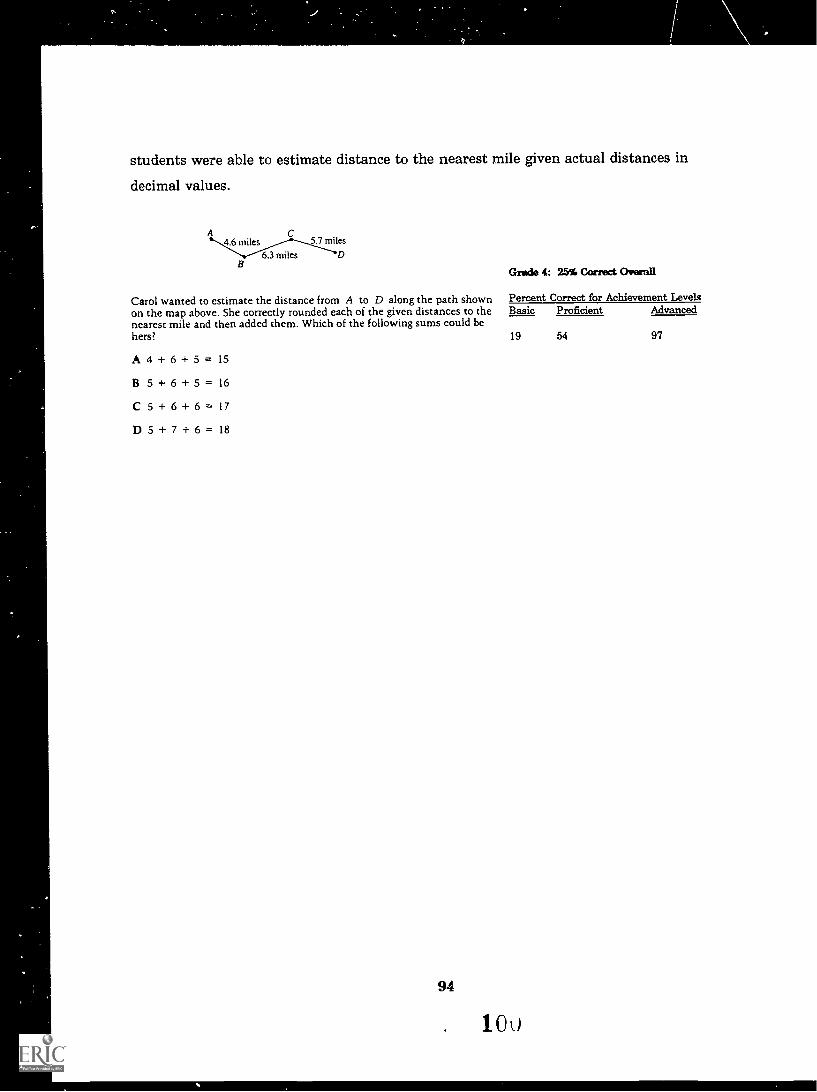
students were able to estimate distance to the nearest mile given actual distances in
decimal values.
Amiks
6.3 miles
Grade 4: 25% Correct Overall
Carol wanted to estimate the distance from A to D along the path shown Percent Correct for Achievement Levelson the map above. She correctly rounded each of the given distances to the Basic Proficient Advancednearest mile and then added them. Which of the following sums could behers? 19 54 97
A 4 + 6 + 5 = 15
B 5 + 6 + 5 = 16
C 5 + 6 + 6 = 17
D 5 + 7 + 6 = 18
94
. 1 o
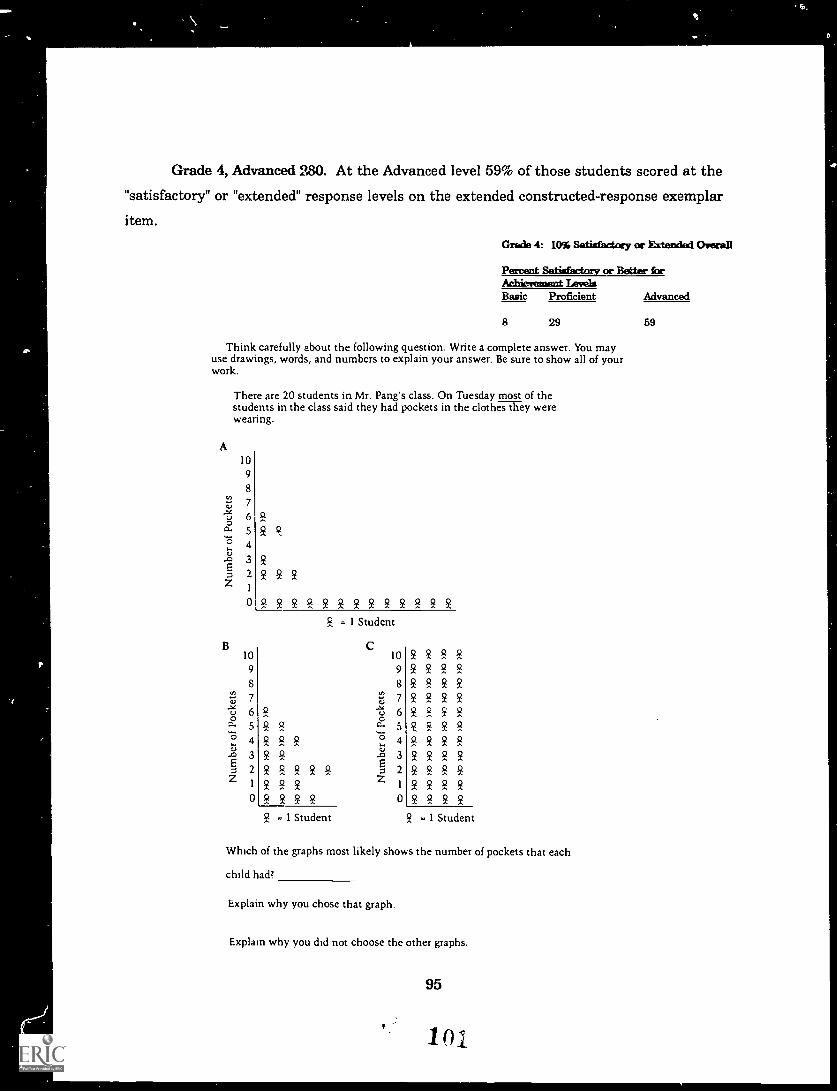
=IP
9.
Grade 4, Advanced 280. At the Advanced level 59% of those students scored at the
"satisfactory" or "extended" response levels on the extended constructed-response exemplar
item.
Grade 4: 10% Satisfactory or Ertended Overall
Percent Satiwree+nry or Better kAchievement LevelsBasic Proficient Advanced
8 29 59
Think carefully about the following question. Write a complete answer. You mayuse drawings, words, and numbers to explain your answer. Be sure to show all of yourwork.
There are 20 students in Mr. Pang's class. On Tuesday most of thestudents in the class said they had pockets in the clothes they werewearing.
A10
9
7
6 95 924
3
1
09999999999999299
9= 1 Student
10
9
7
6 95 9249993 22299999199902999
9- 1 Student
10299292229829227292269929529994299939929299991999902922
9- 1 Student
Which of the graphs most likely shows the number of pockets that each
child had?
Explain why you chose that graph.
Explain why you did not choose the other graphs.
95
101
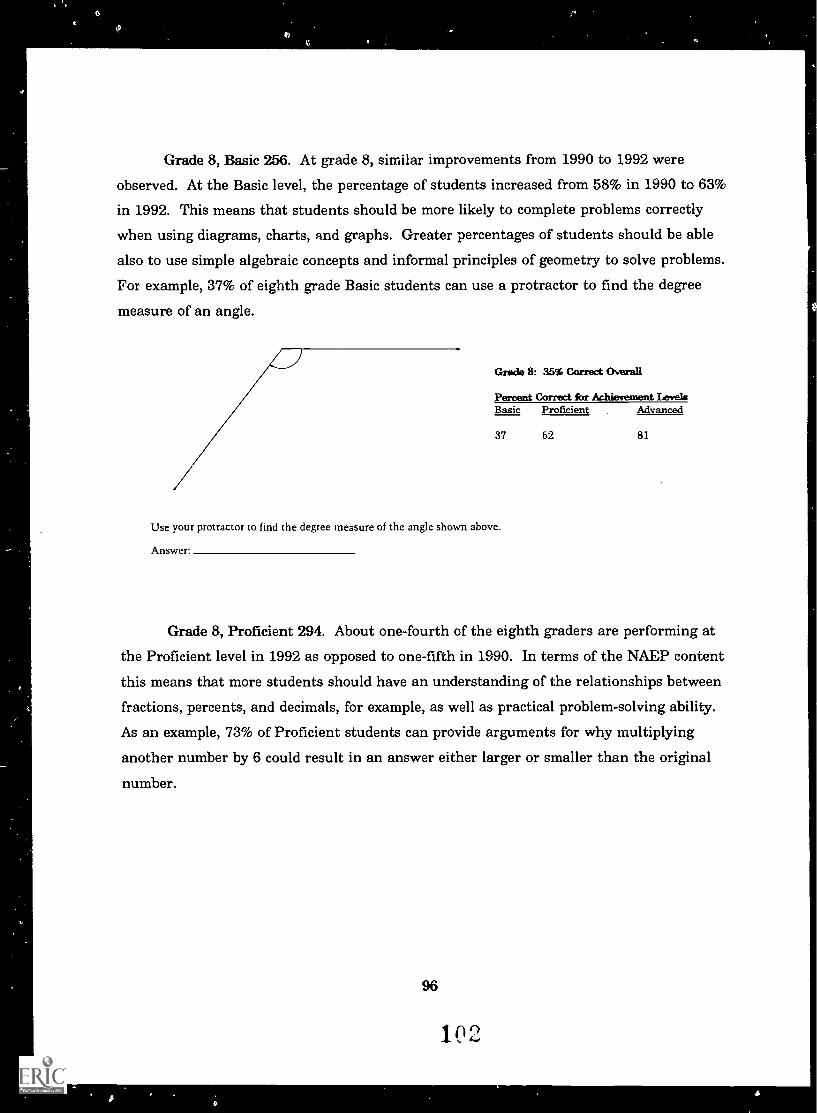
Grade 8, Basic 256. At grade 8, similar improvements from 1990 to 1992 were
observed. At the Basic level, the percentage of students increased from 58% in 1990 to 63%
in 1992. This means that students should be more likely to complete problems correctly
when using diagrams, charts, and graphs. Greater percentages of students should be able
also to use simple algebraic concepts and informal principles of geometry to solve problems.
For example, 37% of eighth grade Basic students can use a protractor to find the degree
measure of an angle.
Grade 8: 35% Correct Overall
Percent Correct for Achievement LevelsBasic Proficient Advanced
37 62 81
Use your protractor to find the degree measure of the angle shown above.
Answer
Grade 8, Proficient 294. About one-fourth of the eighth graders are performing at
the Proficient level in 1992 as opposed to one-fifth in 1990. In terms of the NAEP content
this means that more students should have an understanding of the relationships between
fractions, percents, and decimals, for example, as well as practical problem-solving ability.
As an example, 73% of Proficient students can provide arguments for why multiplying
another number by 6 could result in an answer either larger or smaller than the original
number.
96
I. 2
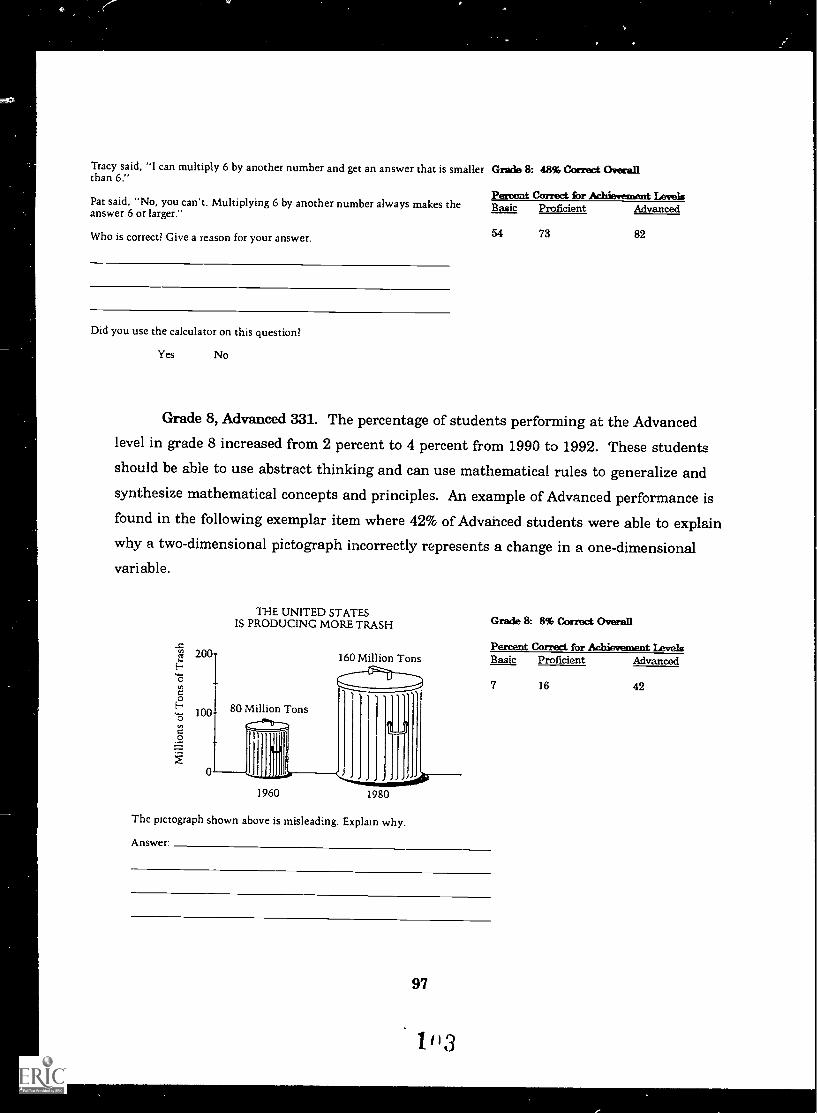
Tracy said, "I can multiply 6 by another number and get an answer that is smaller Grade 8: 48% Conrad Overallthan 6."
Pat said, "No, you can't. Multiplying 6 by another number always makes theanswer 6 or larger."
Who is correct? Give a reason for your answer.
Did you use the calculator on this question?
Yes No
Percent Correct for Achievement LevelsBasic Proficient Advanced
54 73 82
Grade 8, Advanced 331. The percentage of students performing at the Advancedlevel in grade 8 increased from 2 percent to 4 percent from 1990 to 1992. These studentsshould be able to use abstract thinking and can use mathematical rules to generalize and
synthesize mathematical concepts and principles. An example ofAdvanced performance isfound in the following exemplar item where 42% of Advahced students were able to explainwhy a two-dimensional pictograph incorrectly represents a change in a one-dimensionalvariable.
100
THE UNITED STATESIS PRODUCING MORE TRASH
80 Million Tons
160 Million Tons
1960 1980
The pictograph shown above is misleading. Explain why.
Grade 8: 8% Correct Overall
Percent Correct for Achievement levelsBasic Proficient Advanced
Answer
97
1 113
16 42
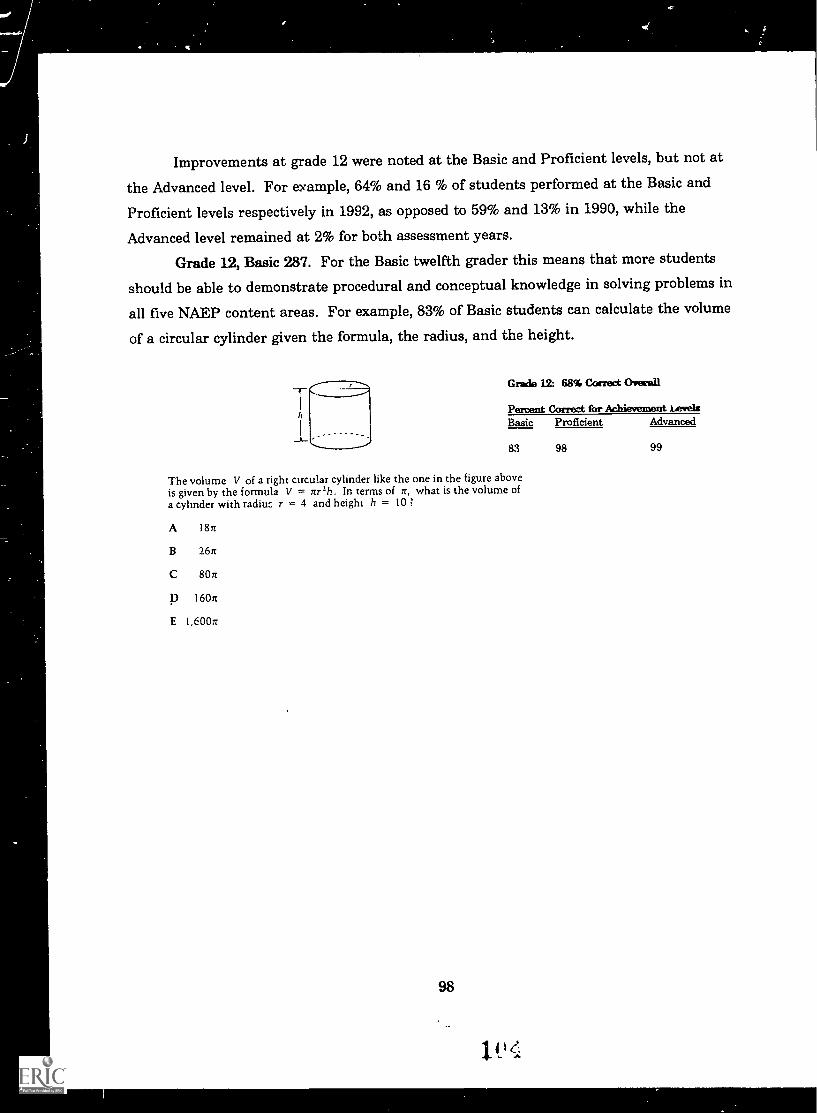
Improvements at grade 12 were noted at the Basic and Proficient levels, but not at
the Advanced level. For example, 64% and 16 % of students performed at the Basic and
Proficient levels respectively in 1992, as opposed to 59% and 13% in 1990, while the
Advanced level remained at 2% for both assessment years.
Grade 12, Basic 287. For the Basic twelfth grader this means that more students
should be able to demonstrate procedural and conceptual knowledge in solving problems in
all five NAEP content areas. For example, 83% of Basic students can calculate the volume
of a circular cylinder given the formula, the radius, and the height.
Grade 12: 68% Correct Overall
Percent Correct for Achievement LevelsBasic Proficient Advanced
83 98 99
The volume V of a right circular cylinder like the one in the figure aboveis given by the formula V = nr2h. In terms of n, what is the volume ofa cylinder with radiuc r = 4 and height h = 10 ?
A 18rt
B 267r
C 8Orr
p l6Orr
E 1,600n
98
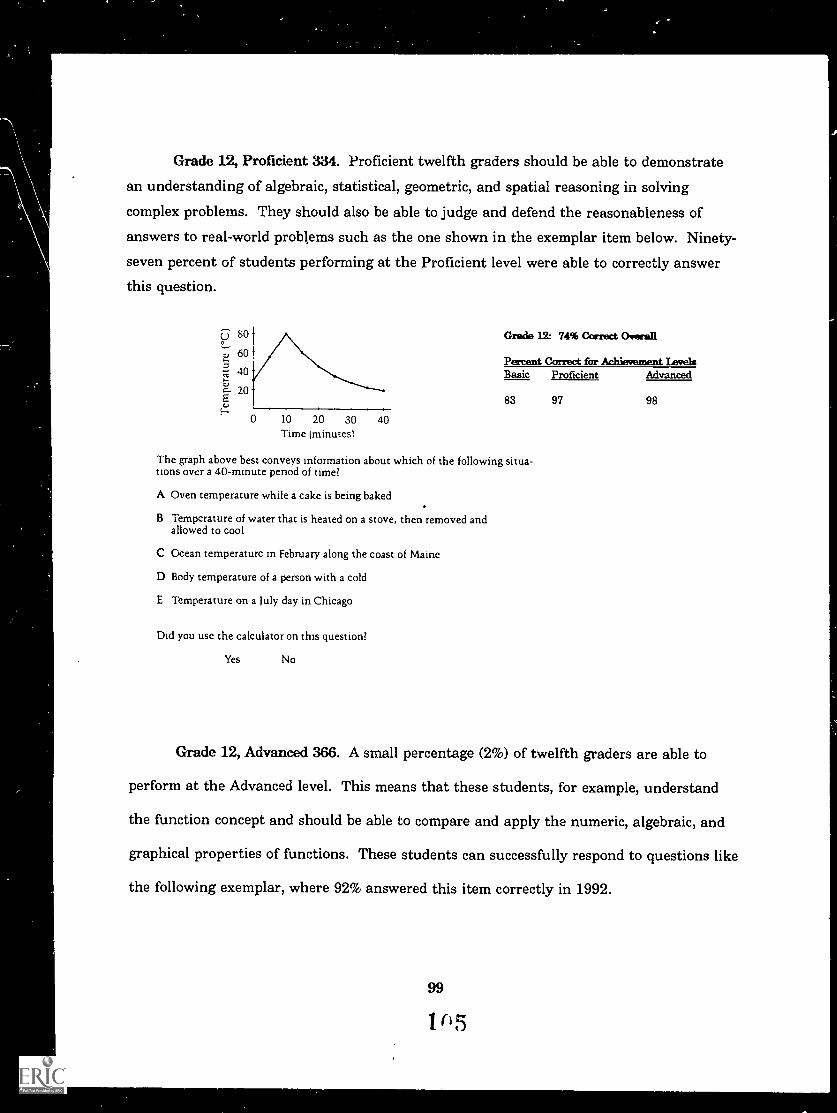
Grade 12, Proficient 334. Proficient twelfth graders should be able to demonstrate
an understanding of algebraic, statistical, geometric, and spatial reasoning in solving
complex problems. They should also be able to judge and defend the reasonableness of
answers to real-world problems such as the one shown in the exemplar item below. Ninety-
seven percent of students performing at the Proficient level were able to correctly answer
this question.
10 20 30 40Time (minutes!
Grade 12: 74% Correct Overall
Percent Correct for Achievement LevelsBasic Proficient Advanced
83 97 98
The graph above best conveys information about which of the following situa-tions over a 40-minute period of time?
A Oven temperature while a cake is being baked
B Temperature of water that is heated on a stove, then removed andallowed to cool
C Ocean temperature in February along the coast of Maine
D Body temperature of a person with a cold
E Temperature on a July day in Chicago
Did you use the calculator on this question?
Yes No
Grade 12, Advanced 366. A small percentage (2%) of twelfth graders are able to
perform at the Advanced level. This means that these students, for example, understand
the function concept and should be able to compare and apply the numeric, algebraic, and
graphical properties of functions. These students can successfully respond to questions like
the following exemplar, where 92% answered this item correctly in 1992.
99
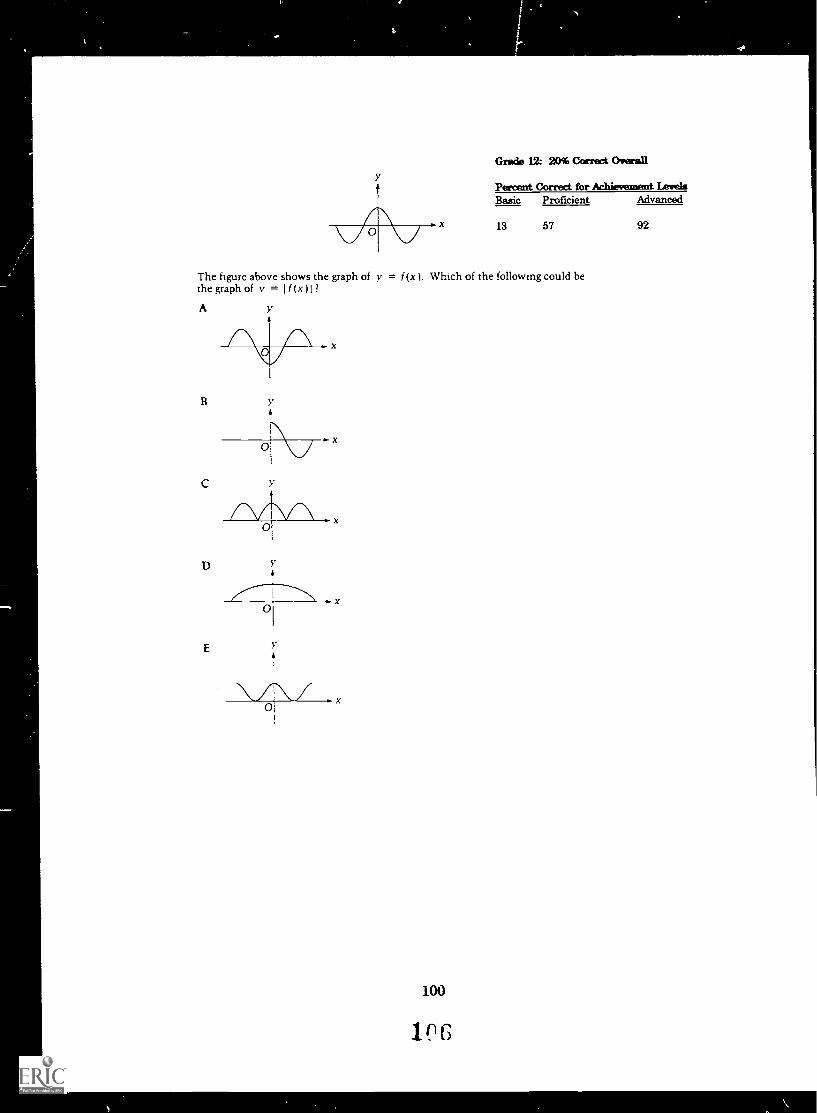
wo V
Grade 12: 20% Correct Overall
Percent Correct for Achievement Level:Basic Proficient Advanced
13 67 92
The figure above shows the graph of y = f(x ). Which of the following could bethe graph of v = 1 f (x)I?
A
AAA
X
100
106
Related Documents