AD-A145 039 NONDESTRUCTV EVIBRATORY TESTING AND EVALUATION PROCEDURE FOR MILIARY RO..( ARMY ENGINEER WATERWAY EXPERIMENT STATION VICKSBURG MS GEOTE. D M COLEMAN -NLSSEDhU 8 EhEEEG-849 /6EEE Sfllfllfllfllfllfl ll

Welcome message from author
This document is posted to help you gain knowledge. Please leave a comment to let me know what you think about it! Share it to your friends and learn new things together.
Transcript

AD-A145 039 NONDESTRUCTV EVIBRATORY TESTING AND EVALUATIONPROCEDURE FOR MILIARY RO..( ARMY ENGINEER WATERWAYEXPERIMENT STATION VICKSBURG MS GEOTE. D M COLEMAN
-NLSSEDhU 8 EhEEEG-849 /6EEESfllfllfllfllfllfl ll
1ilI.0 8E I!I2L_ 12
1.8IIII III1 iJ
MICROCOPY RESOLUTION TEST CHART
MISCELLANEOUS PAPER GL-84-9
NONDESTRUCTIVE VIBRATORY TESTING
AND EVALUATION PROCEDUREFOR MILITARY ROADS AND STREETS
by
David M. Coleman
0 Geotechnical Laboratory
' "DEPARTMENT OF THE ARMYWaterways Experiment Station, Corps of Engineers
PO Box 631Vicksburg, Mississippi 39180
Olq
July 1984Final Report
Approved For Public Release. Distribution Unimited
IDTOE:
Prepared for
Headquarters, US Army FacilitiesEngineering Support AgencyFt. Belvoir, Virginia 22060
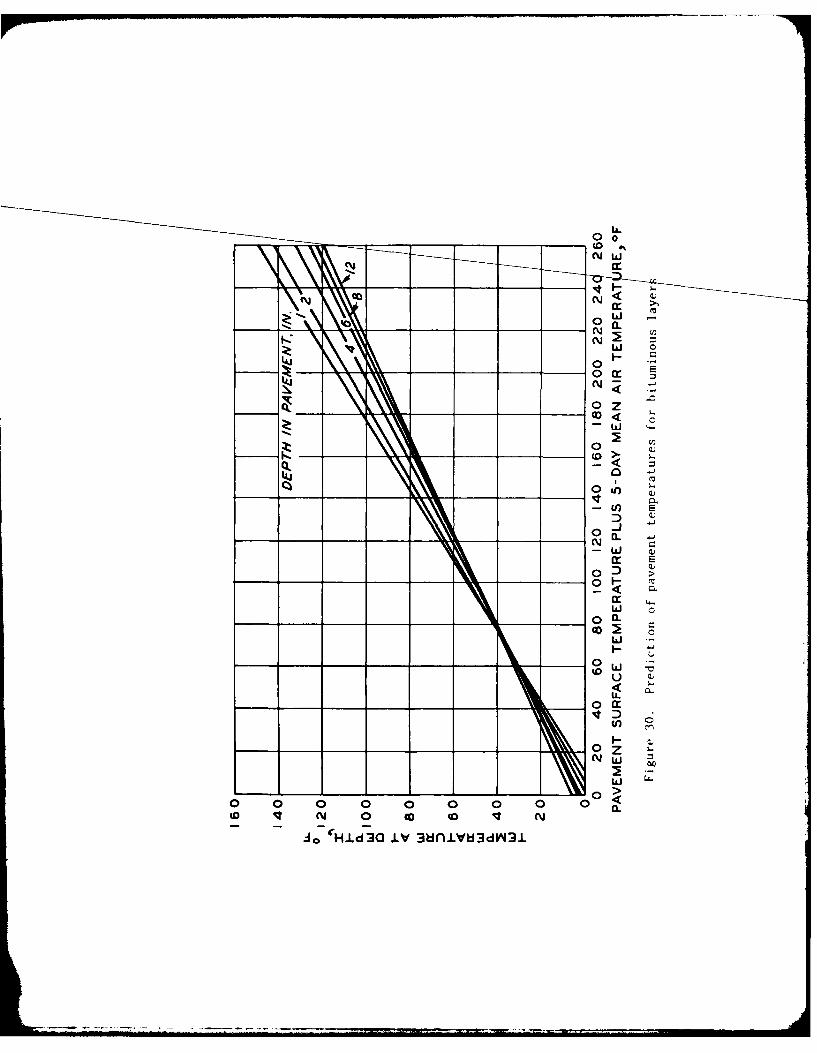
LABORATORY
84 08 20 16t'

Destroy this report when no longer needed Do notreturn it to the originator
The findings in this report are not to be construed as anofficial Department of the Army position unless so
designated by other authorized documents
The contents of this report are not to be used for
3dvertising, publication, or promotional purposes.Citation of trade names does not constitute anofficial endorsement or approval of the use of such
commercial products.

UnclassifiedSECURITY CLASSIFICATION OF THIS PAGE (he. Deis Entered)
READ INSTRUCTIONSREPORT DOCUMENTATION PAGE BEFORE COMPLETING FORM
1. REPORT NUMBER j2 ckOVT4CCESSION N% 3.CIPI ENT'S CATALOG NUMBER
Miscellaneous Paper GL-84-9 5fjI'~~ ' '4. TITLE (end Subtitle) S. TYPE OF REPORT & PERIOD COVERED
NONDESTRUCTIVE VIBRATORY TESTING AND EVALUATION Final reportPROCEDURE FOR MILITARY ROADS AND STREETS
6. PERFORMING ORG. REPORT NUMBER
7. AUTHOR(.) S. CONTRACT OR GRANT NUMBER(*)
David M. Coleman
9. PERFORMING ORGANIZATION NAME AND ADDRESS 10. PROGRAM ELEMENT. PROJECT, TASK
US Army Engineer Waterways Experiment Station AREA 6 WORK UNIT NUMBERS
Geotechnical LaboratoryP0 Box 631, Vicksburg, Mississippi 39180
11. CONTROLLING OFFICE NAME AND ADDRESS 12. REPORT DATE
US Army Facilities Engineering Support Agency July 1984
Ft. Belvoir, Virginia 22060 13. NUMBER OF PAGES
13114. MONITORING AGENCY NAME & ADDRESS(If different from Controlling Office) 15. SECURITY CLASS. (of this report)
Unclassified
IS.. DECL ASSI FICATIONi DOWNGRADINGSCHEDULE
16. DISTRIBUTION STATEMENT (of thle Report)
Approved for public release; distribution unlimited.
17. DISTRIBUTION STATEMENT (of the ebetrsct entered In Block 20, If different from Report)
IS. SUPPLEMENTARY NOTES
Available from National Technical Information Service, 5285 Port Royal Road,
Springfield, Virginia 22161.
19. KEY WORDS (Continue on reveree side If neceeery end Identify by block number)
Highway pavements Pavement performance and evaluation
Military facilities Road Rater 2008Nondestructive testing Roads and streets pavementsOverlays (pavements) Single-axle dual-wheel loads 18,000 lb
20. A IAh ACT 0srat itue - e rere ed ff nteery sad Ideflify by block nuamber)
A procedure for the nondestructive evaluation of military roads andstreets is presented. Nondestructive testing is performed with the Road Rater
2008, an electrohydraulic vibrator which measures the load-deflection responseof pavements. From the measured load-deflection response, the dynamic stiffness
modulus (DSM) is calculated. Correlations of the DSM to the number of allowablepasses of an 18,000-lb single-axle dual-wheel load, determined from conventionaldestructive testing and evaluation procedures, are used with existing analytical
(Continued)
DO h ) 473 U EOTION OrNOV 5 IS OSOLETE UnclassifiedSECUmrT CLASSIFCATtON 00 TImtS ParE (mIle,, Dote Entered)
- ke .I .. . .... r .. . .... : ,T . .. . . .- , ! - ll_ . ... 1' . .. l . . . . il

Unc lass if iedSECURITY CLASSIFICATION OF THIS PAGE(M3 Date Entered)
20. ABSTRACT (CONTINUED).
-relationships to determine the number of allowable passes the pavement can sup-port, and, if required, the overlay thickness.
This report also describes the testing equipment, testing techniques,data reduction procedures, and computational methodology used in developingthe evaluation procedures. Detailed examples are presented in the Appendicesto guide the users through the evaluation procedures for both flexible (AC) andrigid (PCC) highway pavements. An operator's guide describing the day-to-daymaintenance and operation of the NODET is presented in Appendix C.
UflcIass if 1.t1
SECURITY CL ASSrIF
:A T
h _ OF
T.1. PAC' It, . C. '.
PREFACE
The investigation reported herein was sponsored by the U. S. Army
Facilities Engineering Support Agency (FESA), Fort Belvoir, Virginia, the
U. S. Army Forces Command (FORSCOM), Fort McPherson, Georgia, and the U. S.
Army Training and Doctrine Command (TRADOC), Fort Monroe, Virginia.
The study was conducted at the U. S. Army Engineer Waterways Experiment
Station (WES) during the period 1 October 1979 to 30 September 1982 by the
Pavement Systems Division (PSD) of the Geotechnical Laboratory (GL). Per-
sonnel of the PSD involved in this study were Messrs. D. R. Alexander, A. J.
Bush III, D. M. Coleman, D. E. Elsea, P. S. McCaffrey, Jr., and T. P. Williams.
The work was conducted under the supervision of Mr. R. W. Grau, Chief, Proto-
type Testing and Evaluation Unit (PT & EU), and Mr. J. W. Hall, Jr., Chief,
Engineering Investigations, Testing, and Validation Group (EITVG) of the PSD.
The work was under the general direction of Mr. A. H. Joseph, Chief, PSD
(Retired); Dr. T. D. White, Chief, PSD; and Dr. W. F. Marcuson III, Chief, GL.
This report was prepared by Mr. Coleman.
COL Tilford C. Creel, CE, was Commander and Director of WES during the
study and preparation of this report. Mr. F. R. Brown was the Technical
Director.
NT I,;
. . .DYT
Dist
-- -1
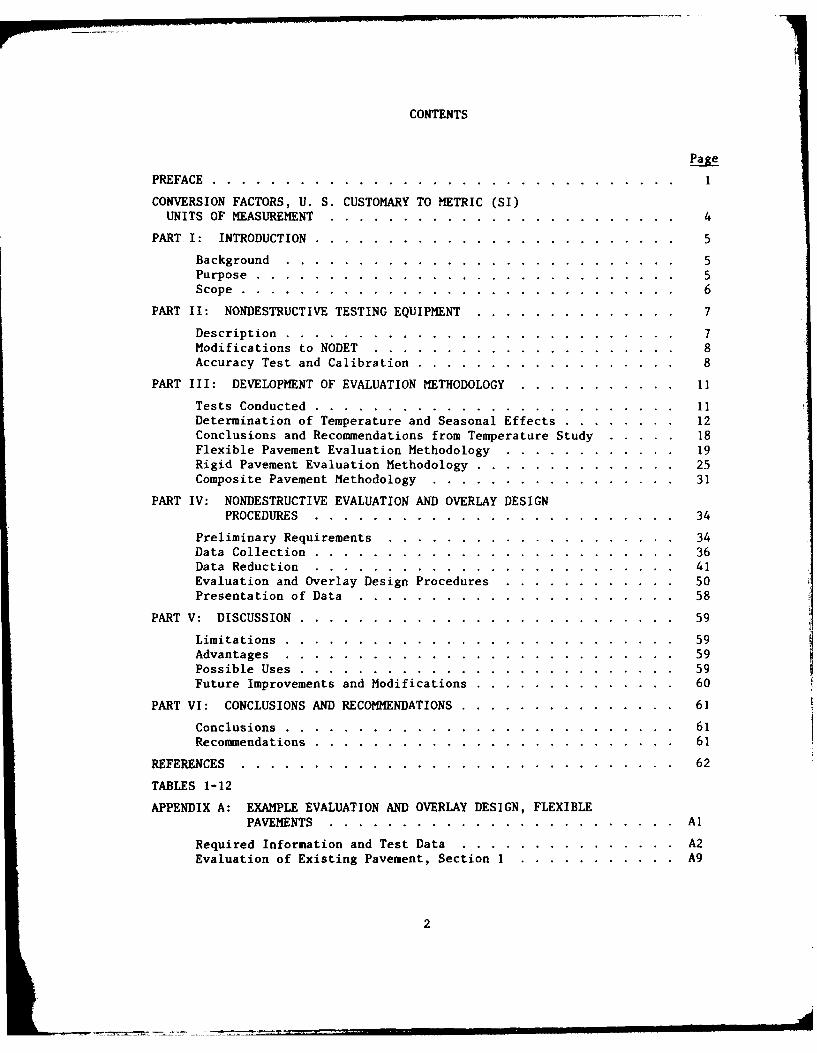
CONTENTS
PREFACE .. ................... ..............
CONVERSION FACTORS, U. S. CUSTOMARY TO METRIC (SI)UNITS OF MEASUREMENT. ..................... .... 4
PART I: INTRODUCTION .. .................... ..... 5
Background. ...................... ...... 5Purpose .. .................... ......... 5Scope .. ................... ........... 6
PART II: NONDESTRUCTIVE TESTING EQUIPMENT ... ............. 7
Description .. ................... ........ 7Modifications to NODET ... ..................... 8Accuracy Test and Calibration. .. .................. 8
PART III: DEVELOPMENT OF EVALUATION METHODOLOGY. ............ 11
Tests Conducted .. ....................................... 111Determination of Temperature and Seasonal Effects. ..... .... 12Conclusions and Recommendations from Temperature Study .... ... 18Flexible Pavement Evaluation Methodology. ............. 19Rigid Pavement Evaluation Methodology .. .............. 25Composite Pavement Methodology. ................... 31
PART IV: NONDESTRUCTIVE EVALUATION AND OVERLAY DESIGNPROCEDURES. ..................... ..... 34
Preliminary Requirements. ...................... 34Data Collection .. .................... ..... 36Data Reduction ... ........................ 41Evaluation and Overlay Design Procedures. ............. 50Presentation of Data. ........................ 58
PART V- DISCUSSION. ... ........................ 59
Limitations. ..... ....................... 59Advantages ..... ........................ 59Possible Uses. .... ....................... 59Future Improvements and Modifications .. .............. 60
PART VI: CONCLUSIONS AND RECOMMENDATIONS .. ............... 61
Conclusions. ..... ....................... 61
Recommendations .. ..................... .... 61
REFERENCES .... ............................ 62
TABLES 1-12
APPENDIX A: EXAMPLE EVALUATION AND OVERLAY DESIGN, FLEXIBLEPAVEMENTS. .................... .... Al
Required Information and Test Data ..... ........... A2Evaluation of Existing Pavement, Section 1 ...... ...... A9
2

Page
Evaluation of Existing Pavement, Section 2B ... ........... ... AllPavement Overlay Thickness Design, Section 2B ..... .......... All
APPENDIX B: EXAMPLE EVALUATION AND OVERLAY DESIGN, RIGIDPAVEMENTS ............ ......................... BI
Required Information and Test Data ..... ............... ... B2Evaluation of Existing Pavement, Section 2 ... ........... ... B6Pavement Overlay Thickness Design, Section 2 ... .......... . B8
APPENDIX C: INSTRUCTION MANUAL FOR THE NODET "............. CI
Background ........... ........................... ... C2Purpose and Scope .......... ........................ ... C2Digital Instrumentation System ...... ................. ... C3Operational Preparation ........ ..................... ... C8Force Calibration .......... ......................... COVelocity Sensor Calibration ......... ................... CliMaintenance ........... ........................... ... C12
Step-By-Step Setup Checklist ....... .................. .. C12
Instructions for Using the Bidirectional Distance-Measuring Instrument ........ ....................... C13
Installation and Troubleshooting ...... ................. C17
APPENDIX D: SOIL AND PAVEMENT DATA USED IN DEVELOPMENT OFEVALUATION METHODOLOGIES ........ ................. DI
3

CONVERSION FACTORS, U. S. CUSTOMARY TO METRIC (SI)UNITS OF MEASUREMENT
U. S. customary units of measurement used in this report can be converted to
metric (SI) units as follows:
Multiply By To Obtain
degrees Fahrenheit 5/9 Celsius degrees*
feet 0.3048 metres
inches 25.4 millimetres
kips (force) per inch 175.1268 kilonewtons per metre
kips (mass) 4,448.222 newtons
miles (U. S. statute) 1.609347 kilometres
pounds (force) 4.448222 newtons
pounds (force) per 6,894.757 pascals
square inch
pounds (mass) 0.4535924 kilograms
pounds (mass) per 16.01846 kilograms per cubic metrecubic foot
pounds (mass) per 27,679.9 kilograms per cubic metrecubic inch
square inches 6.4516 square centimetres
* To obtain Celsius (C) temperature readings from Fahrenheit (F) readings,
use the following formula: C = (5/9)(F - 32). To obtain Kelvin (K) read-ings, use: K = (5/9)(F - 32) + 273.15.
4
NONDESTRUCTIVE VIBRATORY TESTING AND EVALUATION PROCEDURE FOR
MILITARY ROADS AND STREETS
PART I: INTRODUCTION
Background
1. Nondestructive pavement testing (NDT) has drawn the attention of
pavement researchers and managers in recent years as a useful tool for evalu-
ating the load-carrying capabilities, predicting the rehabilitation require-
ments, and estimating the remaining life of pavement systems. The maintenance,
repair, and rehabilitation of the pavement network (roads, streets, airfields,
and parking areas, etc.) at Army installations remains one of the highest ex-
penditures of the Facilities Engineer. Indications are that these expendi-
tures will continue to increase since the majority of the pavement systems at
Army installations have exceeded their 10- to 20-year design life. The abil-
ity of the Facilities Engineer to predict maintenance, repair, or rehabilita-
tion requirements before the pavements fail is important to the installation
operations and will result in improved efficiency through proper allocation of
available fundings.
2. The U. S. Army Engineer Waterways Experiment Station (WES) was re-
quested by the Facilities Engineering Support Agency (FESA), the U. S. Army
Forces Command (FORSCOM), and the U. S. Army Training and Doctrine Command
(TRADOC) to develop the test techniques and analytical methodology for non-
destructive evaluation and overlay design of Army roads and streets.
Purpose
3. This study was conducted to develop the test techniques and analy-
tical methodology required to evaluate the load-carrying capacity of roads and
streets and design pavement overlays using the Road Rater 2008, which is re-
ferred to as the NODET. Specific objectives were to:
a. Evaluate NODET to determine the accuracy of the velocitysensors, the indicated vibrating frequencies, and the load ap-plied to the pavement.
b. Develop a field operation manual for the NODET.
5

c. Verify the applicability of temperature adjustment factorsdeveloped for other testing devices for use with the NODET.
d. Develop correlations between the NODET load-deflection relationsand the allowable load-carrying capacity of the pavement; orbetween the NODET load-deflection relations and the elasticproperties of the pavement.
e. Develop step-by-step evaluation and overlay design proceduresusing these correlations for flexible, rigid, and compositepavements.
f. Document the evaluation procedure in an interpretation manualthat will guide the user in fully assessing the structuralcapacity of his pavements and provide the methodology fordesigning overlays to support the anticipated traffic.
g. Develop a computer program to provide the user with a fast, ac-curate method of handling the data, correcting for temperatures,predicting allowable loads, and calculating the required over-lays for the pavement system.
Scope
4. This report describes the NODET (commercial name: Road Rater 2008),
modifications to the NODET made at WES, as well as the accuracy tests and
calibrations performed. The development of the evaluation methodology is also
explained. The nondestructive evaluation procedure is described in detail to
instruct the user in evaluating highway pavements and designing overlays, where
required. Examples of evaluations and overlay designs are given in Appendices
A and B. An instruction manual for the NODET is included as Appendix C. Data
used in the development of evaluation methodologies is included as Appendix D.
t . .........6

PART II: NONDESTRUCTIVE TESTING EQUIPMENT
Description
5. The NDT equipment used in this study was the Road Rater Model 2008.
This device was purchased by FORSCOM then transferred to the FESA inventory,
and is generally referred to as the NODET.
6. The NODET is an electrohydraulic (electronically controlled hydrau-
lic force generator) nondestructive test device that applies a vibratory
sinusoidal force to the pavement surface and measures the resulting deflection
response. The force is measured with three load cells mounted on an 18-in.-
diam* steel plate that contacts the pavement surface. Deflections are moni-
tored with velocity transducers. These velocities are electronically inte-
grated to produce deflections.
7. The NODET is housed in a tandem-axle trailer towed by a crew-cab
pickup truck (Figure 1). A gasoline engine powers the hydraulic and elec-
trical systems. The force-generating system consists of a 4000-lb reaction
mass, three load cells, a hydraulic activator, and air springs for centering
the reaction mass to provide for equal load distribution. The deflection
Figure 1. Model 2008 road rater nondestructive pavement test device (NODET)
A table of factors for converting U. S. customary units of measurement to
metric (SI) units is presented on page 4.
7

measurement system consists of velocity transducers located in the center of
the loading plate and at 18, 30, and 48 in. from the center of the plate.
These transducers measure the velocity of the pavement surface movement which
is then electronically integrated to read deflection in milliinches (mils).
Figure 2 shows the loading plate and velocity transducers.
8. The NODET digital instrumentation system console (Figure 3) contains
all the instrumentation controls and readouts necessary for operation. It is
located in the cab of the tow vehicle in a floor bracket just to the right of
the driver. After the initial setup, all equipment operations and data col-
lection can be controlled from this console. The data collected are automati-
cally recorded by the printer located in the lower right corner of the console.
These data include: identification number or test location, force, frequency,
and the four measured deflections.
Modifications to NODET
9. Several modifications to the NODET were required to improve the
accuracy and efficiency of operation. These included designing, constructing,
and mounting a mechanism to lower and place the velocity sensors; installing
an air compressor to supply air for the air bags; and mounting the control box
and cables in the tow vehicle. To accurately determine the locations of the
test points a bidirectional distance-measuring meter was installed in the
tow vehicle. The instrumentation system console was modified to improve the
method of field calibrating the force-generating system. A fan was added to
the console to help cool the instrumentation. During accuracy testing of the
velocity transducers, the NODET transducers did not perform within the re-
quired ranges and new transducers were installed.
Accuracy Test and Calibration
Force calibration
10. The force calibration of the NODET is very important for accurate
pavement load and displacement measurements. The NODET was calibrated at WES
by using three Baldwin Lima Hamilton (BLH) load cells sandwiched between two
18-in.-diam steel plates. The NODET loading plate was placed over this sand-
wich construction and operated at frequency ranges of 5 to 50 Hz at a 3000-lb

*t 2g t~:
3iir . Conitrol .jini dati wqui1sitii un1 ifIt for t tic NODUh.

peak-to-peak load. The value for force calibration was established from this
test and is used in the daily calibration check of the NODET, as discussed
later.
Velocity transducer calibration
11. The velocity transducers are calibrated using a calibrated shake
table. Each transducer is placed on the shake table and vibrated at known
deflections. The NODET electronics are then adjusted to correctly read that
deflection.
Field calibration checks
12. Methods were developed to check the NODET's calibration in the
field. These methods are fully described in Appendix C.
13. The load cells and velocity transducers must be properly calibrated
to provide accurate collection of pavement load and deflection data. Both the
force calibration value and the velocity transducers should be checked at WES
at regular intervals of 6 months or 600 operating hours, whichever comes first.
10

PART III: DEVELOPMENT OF EVALUATION METHODOLOGY
Tests Conducted
14. The development of the nondestructive evaluation methodology de-
scribed in this report is based on correlating nondestructive test results
with the load-carrying capability of pavements. The NODET was used to collect
the nondestructive load-deflection data while conventional procedures for
in situ measurement of pavement properties were used to determine the load-
carrying capacity of the pavements.
15. Data for this study were collected at 58 different sites on three
U. S. Army installations (Ft. Polk, Ft. Eustis, and WES) in the United States
during the period March 1980 through April 1981 and at 20 different sites on
10 airfields located in the Republic of Korea during the period May through
July 1982. The pavements selected for testing were generally free of major
surface defects with relative strengths ranging from weak to strong. The
pavements tested were not under the influence of frost or subsequent thaw.
The facilities where data were collected are listed in Table 1.
Nondestructive testing
16. Before destructive testing was begun on the test pavements, a
series of nondestructive tests were performed using the NODET operating at
frequencies of 15, 20, and 25 Hz. Previous work with the NODET indicated that
the equipment performed best and the force, velocity, and deflection output
signals were nearest a sinusoidal wave at an operating frequency of 20 Hz.
Only the 20-Hz data were used in development of the evaluation procedure;
however, the additional data at 15- and 25-Hz data were collected to provide a
comparison of the load-deflection outputs at different frequencies.
Destructive testing
17. The destructive testing consisted of the determination of conven-
tional soil-pavement parameters through in-place and laboratory tests on sam-
ples of the various pavement elements. In-place tests consisted of California
bearing ratio (CBR) or plate-bearing tests as well as density and moisture
content measurements. The test methods used in obtaining data at the Ft. Eus-
tis, Ft. Polk, and WES test sites are described in Hall and Elsea (1974).
The small aperture test method for CBR determination was used at the Ft. Eus-
tis, Ft. Polk, and WES test sites. The CBR of a pavement layer tested by the
11

small aperture method is based on a single measurement determined in a 6-in.-
diam core hole. The moisture content was determined for each layer tested
for CBR. Since the small-aperture-test method was used, in-place density de-
terminations were not made. For rigid pavements, the modulus of soil reaction,
k , of the pavement layer directly beneath the portland cement concrete (PCC)
was determined by converting measured CBR values to k values as shown in
Plate 4 of Hall and Elsea (1974). The data from the Korean airfields were
obtained from conventional test pits. The CBR values measured on these flex-
ible pavement sites and presented in this report are the average of three CBR
tests performed on each pavement layer in these pits. In-place density and
moisture content measurements were also performed at each test level. Plate-
bearing tests were performed on the base course of the rigid pavements to de-
termine the modulus of soil reaction, k . In-place density and moisture con-
tent determinations were also made on the base course in these test pits.
Laboratory tensile splitting tests were performed on the PCC cores taken from
each test site in accordance with ASTM C-496-71 (American Society for Testing
and Materials 1980). The concrete tensile splitting strength was converted
to flexural strength as described in Hall and Elsea (1974) using the empirical
relationship developed by Hammitt (1971). Test procedures for the CBR, plate-
bearing, density, and moisture content measurements made at the Korean test
sites are given in Military Staadard 621A (Department of Defense 1964).
Presentation of data
18. A summary of the physical property and nondestructive test data for
each test site is presented in Tables 2, 3, and 4 for flexible, rigid, and
composite pavements, respectively. Complete structural data from each test
location are tabulated in Appendix D.
Determination of Temperature and Seasonal Effects
19. The stiffness, and therefore the deflection response, of pavements
containing asphaltic.concrete (AC) layers is directly related to the tempera-
ture of that asphalt layer. Presently most evaluation procedures using de-
flection measurements take into account the mean air temperature or some
temperature-related factor so that pavements can be tested at varying temper-
atures and then adjusted to a common temperature for comparison purposes.
20. During the development of the dynamic stiffness modulus (DSM)
12

evaluation procedure for airfield pavements (Green and Hall 1975), it was
realized that the measured stiffness of a pavement must be corrected in order
to evaluate flexible pavements during varying temperatures. A temperature
test section consisting of 4, 8, and 14 in. of asphalt was constructed and
tested with nondestructive testing equipment at various temperatures. This
research led to the development of a set of correction factor curves which
were used to correct the DSM data to a common mean pavement temperature of
700 F. Later research" resulted in the modification of these curves into the
DSN temperature correction factor curves presently used. These temperature
correction factor curves are presented in Figure 4.
160
4"' 6"
140 8-
10"
u. 12012 14
wIO
4
~NOTE: FLEXIBLE PAVEMENTS LESS THANZ 3 IN. THICK ARE NOT CORRECTED
w FOR TEMPERATURE.
40 10 "
0,6 0.8 1.0 1.2 1.4 1.6 1.8 2.0 2.2 2.4
DSM CORRECTION FACTOR
Figure 4. DSM temperature correction factor curvesfor flexible pavements
21. The applicability of these temperature correction factors to the
NODET had not been verified. Therefore, a series of tests were conducted to
determine if the DSM temperature correction factors that have been developed
SBush, A. J. 111. 1979 (Nov). "Correction Factors and Deflections Measuredon Pavements Containing Asphaltic Concrete Layers," Memorandum for Record,U. S. Army Engineer Waterways Experiment Station, CE, Vicksburg, Miss.
13
,. j , . . .. .
for other pavement testing devices are applicable to the NODET.
Temperature effects testing
22. Five pavements with varying thicknesses of AC were selected to be
tested during different seasons and at various temperatures. These pavements
are designated W-1 through W-5 in Table 2 which shows the physical properties
of the test pavements. The thickness of the asphalt layer in these pavements
varied from 2.0 to 4.75 in.
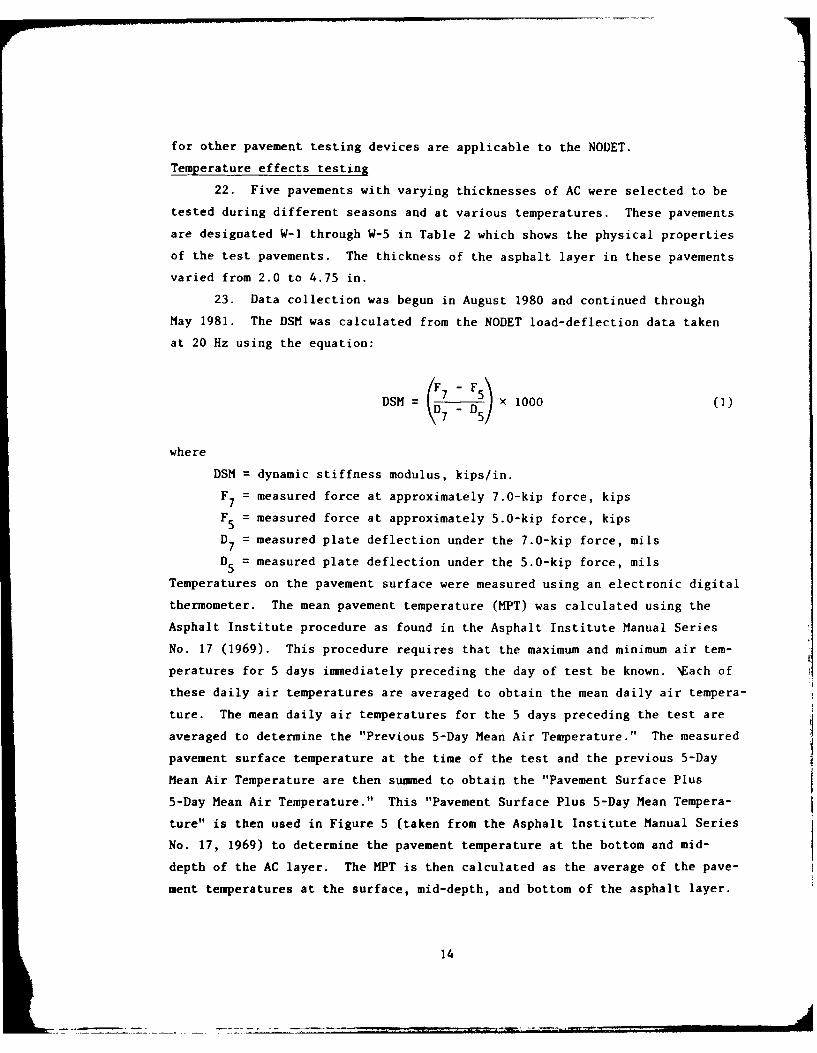
23. Data collection was begun in August 1980 and continued through
May 1981. The DSM was calculated from the NODET load-deflection data taken
at 20 Hz using the equation:
DSM = X 1000 (1)
where
DSM = dynamic stiffness modulus, kips/in.
F7 = measured force at approximately 7.0-kip force, kips
F5 = measured force at approximately 5.0-kip force, kipsD7 = measured plate deflection under the 7.0-kip force, mils
D5 = measured plate deflection under the 5.0-kip force, mils
Temperatures on the pavement surface were measured using an electronic digital
thermometer. The mean pavement temperature (MPT) was calculated using the
Asphalt Institute procedure as found in the Asphalt Institute Manual Series
No. 17 (1969). This procedure requires that the maximum and minimum air tem-
peratures for 5 days immediately preceding the day of test be known. \Each of
these daily air temperatures are averaged to obtain the mean daily air tempera-
ture. The mean daily air temperatures for the 5 days preceding the test are
averaged to determine the "Previous 5-Day Mean Air Temperature." The measured
pavement surface temperature at the time of the test and the previous 5-Day
Mean Air Temperature are then summed to obtain the "Pavement Surface Plus
5-Day Mean Air Temperature." This "Pavement Surface Plus 5-Day Mean Tempera-
ture" is then used in Figure 5 (taken from the Asphalt Institute Manual Series
No. 17, 1969) to determine the pavement temperature at the bottom and mid-
depth of the AC layer. The MPT is then calculated as the average of the pave-
ment temperatures at the surface, mid-depth, and bottom of the asphalt layer.
14
160
140 -
DEPTH IN PAVE TEN, N.LL 2o 120
.I0
t60
0 0
-40
20 - _
00 20 40 60 80 100 120 140 160 180 200 220 240 260
PAVEMENT SURFACE TEMPERATURE PLUS 5-DAY MEAN AIR TEMPERATURE,-F
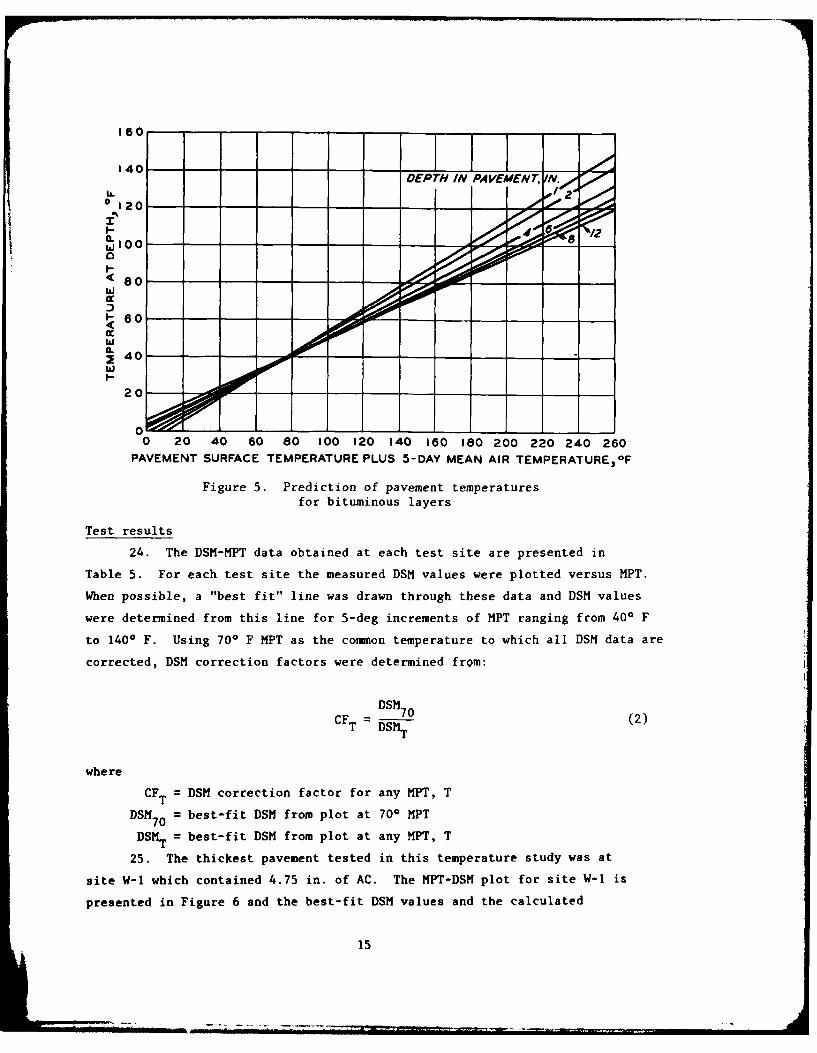
Figure 5. Prediction of pavement temperaturesfor bituminous layers
Test results
24. The DSM-MPT data obtained at each test site are presented in
Table 5. For each test site the measured DSM values were plotted versus MPT.
When possible, a "best fit" line was drawn through these data and DSM values
were determined from this line for 5-deg increments of MPT ranging from 400 F
to 1400 F. Using 700 F MPT as the comon temperature to which all DSM data are
corrected, DSM correction factors were determined from:
CF = DSM 70 (2)T DSMI
where
CFT = DSM correction factor for any MPT, TDS70 = best-fit DSM from plot at 70* MPT
DSMT = best-fit DSM from plot at any MP, T
25. The thickest pavement tested in this temperature study was at
site W-1 which contained 4.75 in. of AC. The MPT-DSM plot for site W-1 is
presented in Figure 6 and the best-fit DSM values and the calculated
15

250
200
150
z~ 100
'00 304 4 o
Fi0 MPT 228v38 f0.38191 (OSM)
500
0300 350 400 450 500
DYNAMIC STIFFNESS MODULUS. KIPSAN
Figure 6. MPT versus DSM for site W-1
temperature correction factors are presented in Table 6. The NODET tempera-
ture correction factors from Table 6 along with the currently used WES tempera-
ture correction factors were then plotted versus MPT. As seen in Figure 7
these correction factor curves are nearly identical to about 900 F MPT where
the NODET correction factor begins to become slightly larger than the WES
correction factor. The maximum difference occurs at 1400 F MPT where the
NODET correction factor is 6 percent higher than the WES correction factor.
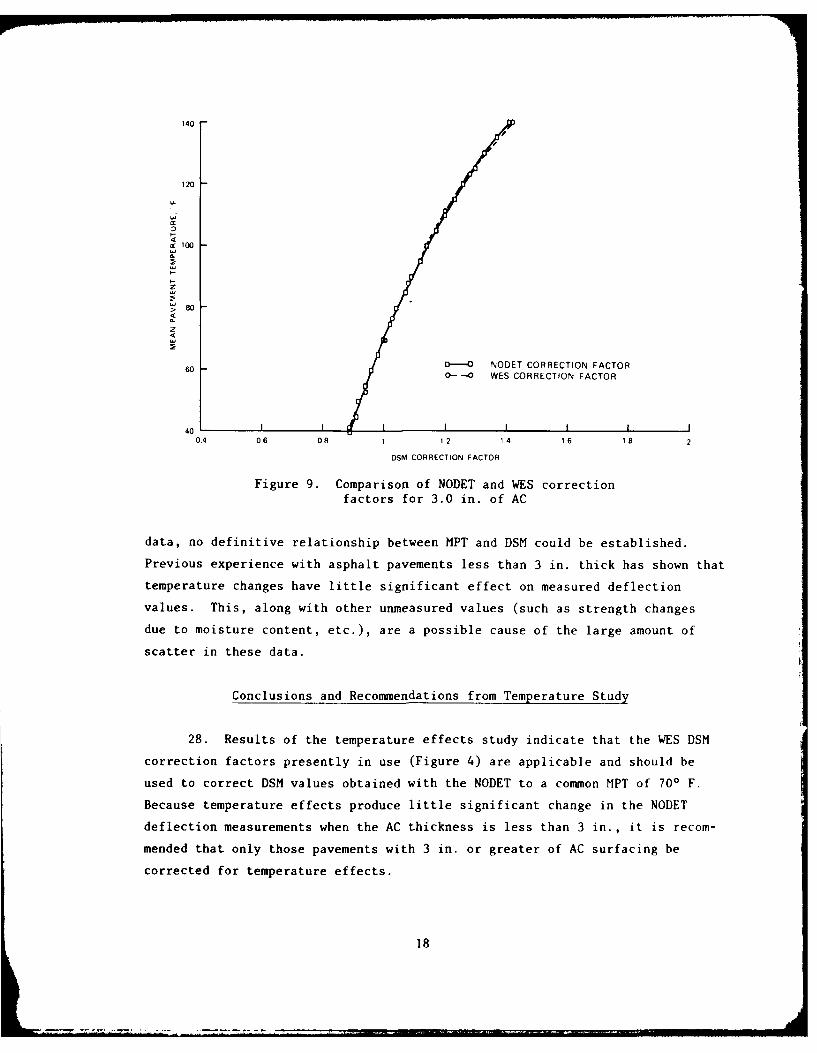
26. Site W-3 contained 3.0 in. of asphalt and was the second thickest
pavement used in the temperature study. The MPT-DSM data for site W-3 from
Table 5 are plotted in Figure 8. Using the best-fit line from Figure 8, the
best-fit DSM was used to calculate the temperature correction factors. These
best-fit DSM values and calculated temperature correction factors are pre-
sented in Table 6. The calculated NODET correction factors and the currently
used WES correction factors are then plotted versus MPT in Figure 9. These
correction factors agree very well with the NODET correction factors being al-
most identical to the WES correction factors presently in use.
27. Sites W-2, W-4, and W-5 contained less than 3 in. of asphalt. Plots
of the MPT-DSM data for these sites from Table 5 showed considerable scatter
and no real trend could be seen. Due to the large amount of variation in these
16

140 ,
120
,, 110c'I
D
c 100
90-z
< 70
60 0-o NODET CORRECTION FACTORo- -o WES CORRECTION FACTOR
50
0.4 06 0.8 1.0 1.2 14 16 1.8 2.0
TEMPERATURE CORRECTION FACTOR
Figure 7. Comparison of NODET and WES correctionfactors for 4.75 in. of AC
60
140
120
100
0
z800
60 MP 1. 0308Da
40
DYNAMIC STIFFNESS MODULUS. KIPWIlN
Figure 8. fPT versus DSM for site W-34 0. .. . . .. .. • . . . . .. . .,rl .. n ..
140 -
120 -
S100
> 80
z
-D- NODET CORRECTION FACTOR- -. WES CORRECTION FACTOR
40 10.4 0.6 08 1 12 14 16 18 2
DSM CORRECTION FACTOR
Figure 9. Comparison of NODET and WES correction
factors for 3.0 in. of AC
data, no definitive relationship between MPT and DSM could be established.
Previous experience with asphalt pavements less than 3 in. thick has shown that
temperature changes have little significant effect on measured deflection
values. This, along with other unmeasured values (such as strength changes
due to moisture content, etc.), are a possible cause of the large amount of
scatter in these data.
Conclusions and Recommendations from Temperature Study
28. Results of the temperature effects study indicate that the WES DSM
correction factors presently in use (Figure 4) are applicable and should be
used to correct DSM values obtained with the NODET to a common MPT of 700 F.
Because temperature effects produce little significant change in the NODET
deflection measurements when the AC thickness is less than 3 in., it is recom-
mended that only those pavements with 3 in. or greater of AC surfacing be
corrected for temperature effects.
18

Flexible Pavement Evaluation Methodology
29. The methodology described in the following paragraphs is used for
the structural evaluation of flexible (AC) highway pavements and is based on
the allowable load-carrying capability of the pavements. The major parameters
affecting the structural performance of flexible pavements are pavement thick-
ness, soil strength, number and configuration of wheels or axles, and number
of load repetitions (U. S. Army Engineer Waterways Experiment Station 1951,
1961).
30. The nondestructive evaluation procedure described in Part IV uses a
measurement of overall pavement rigidity in terms of the DSM. The DSM is a
measurement of the rigidity of the total pavement system and not independent
measurements of the major parameters listed above.
31. Development of the basic evaluation methodology for flexible high-
way pavements consisted of establishing a correlation between DSM and the
allowable single-axle dual-wheel load. This correlation was developed by
performing DSM tests on both highway and airfield pavements and correlating
the results with the allowable load on a single axle determined from conven-
tional evaluation procedures. After development of the DSM versus allowable
load relationships for six different pass levels, the evaluation methodology
was based on existing interrelationships between axle passes, vehicle opera-
tions, pavement thickness, soil strength, and axle load and configurations.
Basic load and wheel configurations
32. An 18,000-lb, single-axle, dual-wheel load (Figure 10) was selected
as the basic load and wheel configuration in accordance with TM 5-822-5 (Head-
quarters, Department of the Army 1980).
Development of evaluation methodology
33. After collection of the data as described in paragraphs 15-17 the
allowable single-axle load for a given pass level was calculated for each test
site using the following procedure.
a. Convert the pavement to an "Equivalent Thickness of Subbase,"TS , in inches, using the equivalency factors in Table 7.
b. Using TS from a above, determine the "Total Equivalent Pave-
ment Thickness," TEQ , in inches. The TEO is defined as a
pavement section composed of: 3.5 in. of AC, 4.0 in. of100 CBR crushed stone base, and a variable amount of subbase.The total equivalent pavement thickness is determined from:
19

- * 13Y2" -:58 Y2 13Y2
DUAL WHEELS,PNEUMATIC TIRES
CONTACT PRESSURE 70 PSICONTACT AREA 64.29 SQ IN.
Figure 10. Basic wheel configuration: 18,000-ib,single-axle, dual wheels
TEQ = 3.5 AC + 4.0 base + (T S - 16.05) subbase
TEQ = 7.5 + (TS - 16.05)
TEQ = T - 8.55 in. (3)
Note that the 16.05 in. above is the result of converting therequired 3.5 in. of AC (equivalency factor 2.3) and 4.0 in. ofcrushed stone (equivalency factor 2.0) to equivalent subbase.If TS were less than 16.05 in. the equation for computing
TEQ would be
T - 8.05
TEQ = 3.5 + 2.00 (4)
c. Calculate the load repetition factor, ai , for the specifiedpass level from the equation
a= 0.23 log ( Passes) + 0.15 (5)
where Passes = the equivalent number of 18,000-lb axle loadson a single traffic lane during a 20-yearperiod.
d. Calculate TEQ/(11IA)
20

whereTEQ = total equivalent pavement thickness from Step b
= load repetition factor from Step cA tire contact area = 64.29 sq in.
e. Using TE/(aj) calculated in Step d, determine CBR/p fromthe CBR c rve shown in Figure 11.
CBR
0.001 0.01 0.10 1.00
2
-~3
4
5
6
7
Figure 11. CBR curve
f. Calculate the equivalent single-wheel load from the equation
CBRPESWL CBR xA (6)
P
where
PESWL = equivalent single-wheel load, lb
CBR = measured CBR at depth TEACBR ECB = value determined from CBR curve in Step ep
A = tire contact area = 64.29 sq in.
The equivalent single-wheel load is defined as the load on asingle wheel with the same contact area as one wheel of amultiple-wheel configuration that produces a maximum deflectionequal to that beneath the multiple-wheel configuration.
21
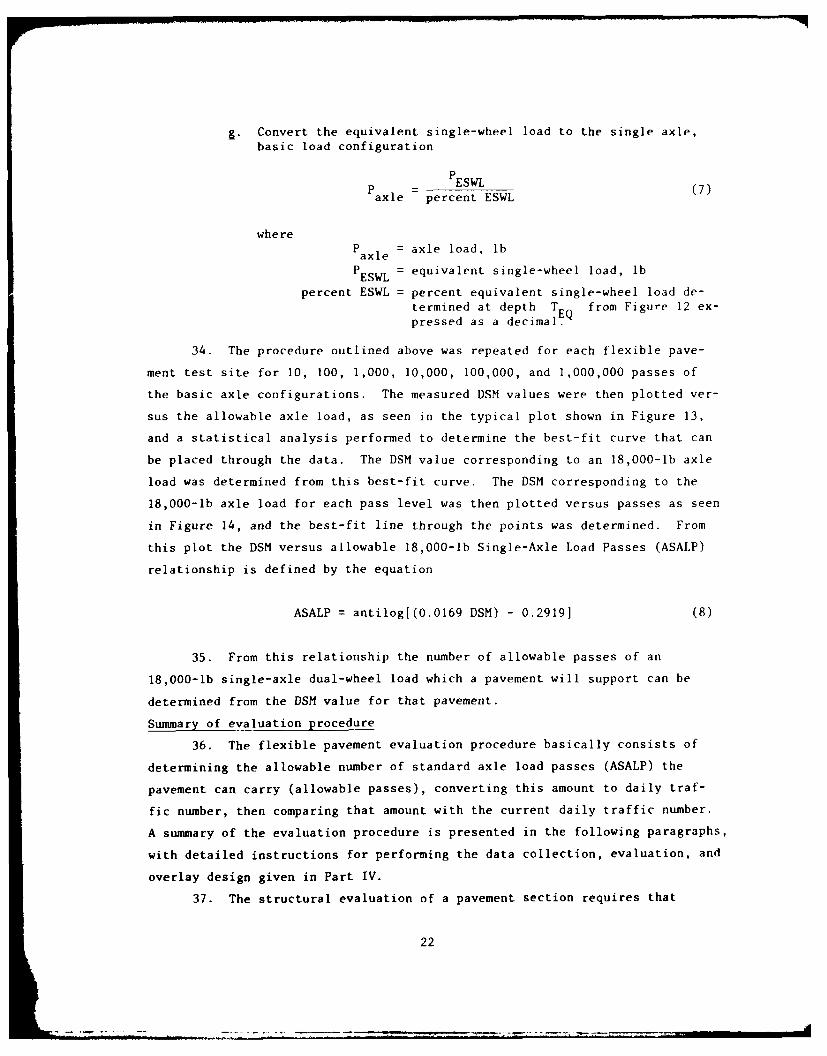
g. Convert the equivalent single-wheel load to the single axle,
basic load configuration
PESWL (7)axle percent ESWL
whereP axle= axle load, lb
PESWL equivalent single-wheel load, lb
percent ESWL = percent equivalent single-wheel load de-termined at depth T EQ from Figure 12 ex-pressed as a decimal.
34. The procedure outlined above was repeated for each flexible pave-
ment test site for 10, 100, 1,000, 10,000, 100,000, and 1,000,000 passes of
the basic axle configurations. The measured DSM values were then plotted ver-
sus the allowable axle load, as seen in the typical plot shown in Figure 13,
and a statistical analysis performed to determine the best-fit curve that can
be placed through the data. The DSM value corresponding to an 18,000-lb axle
load was determined from this best-fit curve. The DSM corresponding to the
18,000-lb axle load for each pass level was then plotted versus passes as seen
in Figure 14, and the best-fit line through the points was determined. From
this plot the DSM versus allowable 18,000-lb Single-Axle Load Passes (ASALP)
relationship is defined by the equation
ASALP = antilog[(0.0169 DSM) - 0.29191 (8)
35. From this relationship the number of allowable passes of an
18,000-lb single-axle dual-wheel load which a pavement will support can be
determined from the DSM value for that pavement.
Summary of evaluation procedure
36. The flexible pavement evaluation procedure basically consists of
determining the allowable number of standard axle load passes (ASALP) the
pavement can carry (allowable passes), converting this amount to daily traf-
fic number, then comparing that amount with the current daily traffic number.
A summary of the evaluation procedure is presented in the following paragraphs,
with detailed instructions for performing the data collection, evaluation, and
overlay design given in Part IV.
37. The structural evaluation of a pavement section requires that
22
t

15~
20\
,o0 1 -3a.l
EQUIVALENT SINGLE-WHEEL LOAD IN PERCENT OF AXLE OR VEHICLE LOAD
Figure 12. Percent ESWL curve for 18,000-1bsingle-axle, dual wheels
23

2600
2400
2000 _
1___00_ 1 DSM,50 2 (AXLE LOAD)0 5 6 3 0 2
1200 ____LGN
J LEGEI4O
0 rT EUSTIS
800 A _ - KOREAN AIRFIELDSV WES
400 ____ ____ ____
00 100 200 300 400 500 600 700 oo 900 1000
AXLE LOAD. KIPS
Figure 13. DSM versus axle load for 10,000 passes
600
500
400
X
LL 300
-OSM- I7 T 279,17 (LOG PASSES)
200 ~PASSES-AN7'|'ILOG (0.0 169 DSM-O 29 191200
100
0 I I .I | I i IIL I L
10 100 1000 10. IC0 O.
I ,000-LS AXLE LOAD PASSES
Figure 14. DSM versus 18,000-lb axle load passes
24
several things be known about the section before evaluation begins. This
includes information on the pavement structure, current daily traffic, and
estimated future traffic. Load deflection data are then collected with the
NODET operating at 20-Hz frequency and 5,000- and 7,000-lb force. During this
testing the pavement surface temperature should be measured at 1-hr intervals.
On completion of the NDT the maximum and minimum air temperatures for 5 days
preceding and each day during the testing should be obtained from the instal-
lation weather station.
38. After obtaining the NODET data, the DSM for each test is calcu-
lated and each of these DSM values is corrected for temperature effects to
bring all of the tests to a common mean pavement temperature of 700 F. The
corrected DSM values are then plotted to produce a DSM profile for each
branch. From this DSM profile a representative DSM is determined for each
section. For each section the ASALP is calculated from Equation 8. If the
calculated number of allowable passes, in terms of daily traffic number (ADTN),
is greater than the current daily traffic number (CDTN), the pavement is
structurally adequate. The CDTN is determined from traffic data as described
in paragraphs 51 and 52 and is the equivalent number of 18,000-lb single-axle
load passes using a pavement each day. If the ADTN is less than the CDTN the
section is structurally inadequate and some type of rehabilitation may be re-
quired. Step-by-step details of the flexible pavement evaluation and overlay
design procedure are presented in Part IV.
Rigid Pavement Evaluation Methodology
39. Many parameters affect the load-carrying capacity of rigid pave-
ments. The major parameters affecting the structural performance of rigid
pavements include pavement thickness, concrete strength, strength of founda-
tion, wheel or track configuration, and traffic volume during the design
life.
40. The evaluation methodology for rigid or PCC pavements was developed
in a manner similar to the flexible pavement methodology. As in the flexible
pavement methodology, the DSM is used to measure the overall rigidity of the
pavement system. However, in the rigid pavement procedure the radius of rela-
tive stiffness, k , a measure of the stiffness of a PCC slab relative to that
of the subgrade, is also determined from the NODET data, as discussed later.
25

Basic load and wheel configuration
41. The basic load and wheel configuration used in the rigid pavement
evaluation methodology is the 18,000-lb single-axle dual-wheel load as speci-
fied in TM 5-822-6 (Headquarters, Department of the Army 1977).
Development of evaluation methodology
42. The evaluation methodology for rigid pavements involves establish-
ing a relationship between DSM, I , and passes of a standard axle load (SAL).
The first step in developing this evaluation methodology was to modify the
rigid pavement design chart from TM 5-822-6 to read passes of a SAL instead
of design index. This modification, shown in Figure 15, amounted to con-
structing the Rigid Pavement Design Chart as described in "Development of
Rigid Pavement Thickness Requirements for Military Roads and Streets" (Ohio
River Division Laboratories 1961), replacing the rigid pavement design index
with passes.
43. The next step was to develop the relationship between DSM, 2
and passes. This relationship should be such that both DSM and 2 are used
to determine the number of allowable passes. Several steps were involved in
this development:
a. Calculate the modulus of subgrade reaction, k , for a range ofPCC slab thicknesses, h , from the equation
h3
k = 341005.97 h- [units: lb/cu in.] (9)
These calculations are made for radius of relative stiffness,2 , values ranging from 20 to 60 in. Equation 9 is a re-arrangement of the radius of relative stiffness equation(Equation 10) (Ohio River Division Laboratories 1961) assuming
the modulus of elasticity of concrete, E , to be 4 x 10⁶ psiand Poisson's ratio of concrete, v , to be 0.15.
1/4
2 Eh3] [units: in.] (10)
b. From each value of k determined above, along with its corre-sponding thickness, h , the interior stress in the slab undera 7,000-lb load and a 64.29-sq-in. area is calculated, alongwith the resulting deflection, using th Westergaard equations(Westergaard 1926).
26

I 0001
00
800
800
272
c. The deflections calculated in Step b above were divided intothe 7,000-lb load to yield a theoretical DSH value. This compu-tation is allowed because the load-deflection response of rigidpavements is linear.
d. Assuming a flexural strength, R , of 700 psi and using the hand the k values from Step a the rigid pavement design chart(Figure 15) was used to determine the number of axle load passescorresponding to the assumed f and theoretical DSM values.
e. For each 2 value the number of passes was plotted versustheoretical DSM to produce the curves shown in Figure 16. Thisplot provides the basic relationship between DSM and passes foruse in the evaluation of rigid pavements.
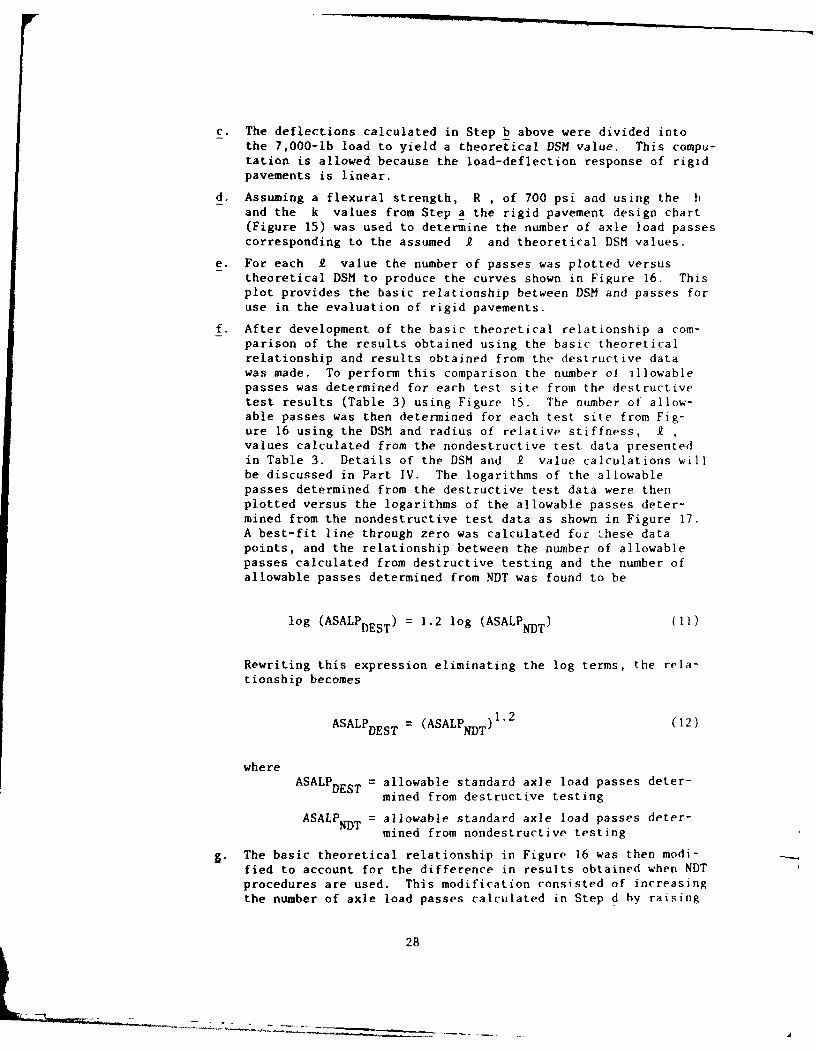
f. After development of the basic theoretical relationship a com-parison of the results obtained using the basic theoreticalrelationship and results obtained from the destructive datawas made. To perform this comparison the number of illowablepasses was determined for each test site from the destructivetest results (Table 3) using Figure 15. The number of allow-able passes was then determined for each test site from Fig-ure 16 using the DSM and radius of relative stiffness, 2 ,values calculated from the nondestructive test data presentedin Table 3. Details of the DSM and 2 value calculations willbe discussed in Part IV. The logarithms of the allowablepasses determined from the destructive test data were thenplotted versus the logarithms of the allowable passes deter-mined from the nondestructive test data as shown in Figure 17.A best-fit line through zero was calculated for these datapoints, and the relationship between the number of allowablepasses calculated from destructive testing and the number ofallowable passes determined from NDT was found to be
log (ASALPDEST) = 1.2 log (ASALPNDT) (11)
Rewriting this expression eliminating the log terms, the rela-tionship becomes
ASALPDEST = (ASALPNDT)1.2 (12)
whereASALP = allowable standard axle load passes deter-
DEST mined from destructive testing
ASALPNDT = allowable standard axle load passes deter-mined from nondestructive testing
g. The basic theoretical relationship in Figure 16 was then modi-fied to account for the difference in results obtained when NDTprocedures are used. This modification consisted of increasingthe number of axle load passes calculated in Step d by raising
28

Il0 I I T 7 1 1
'a.
I0 o______
t0o,_____
0
0
1029

20
LEGEND
o FT. EUSTIS0 FT. POLK
A KOREAN AIRFIELDSV WES
LogPosses)oost"LogPosse S)ND T
ASALPDe *-(ASALPD1 1.2
16
J9
0
.t2
01-zI-
LLS
w
° 000
_ _ _ 0 _ _ _ _ _ _ _ _
U)
CL 0
0 60 6
4
2
00 2 4 6 f0 92 14
LOG PASSES FROM NOT. Log(Pases) NOT
Figure 17. Relationship between destructive testingand NDT for rigid pavements
30

the number of passes to the 1.2 power. The increased passeswere then replotted as in Step e to produce the rigid pavementNDT evaluation chart presented in Figure 18.
44. Using the NDT data obtained with the NODET and the rigid pavement
NDT evaluation chart shown in Figure 18 the number of allowable passes of the
standard axle can be determined.
Summary of rigid
pavement evaluation procedure
45. The rigid pavement evaluation procedure basically consists of deter-
mining the number of allowable passes the pavement will carry (ASALP), convert-
ing the ASALP to the Allowable Daily Traffic Number (ADTN), then comparing the
ADTN with the Current Daily Traffic Number (CDTN). The NODET load-deflection
data obtained at 20-Hz frequency and the 5,000- and 7,000-lb force levels pro-
vide the information to calculate the DSM and £ values for each test. The
DSM is calculated from the NODET load-deflection data using Equation 1. The
radius of relative stiffness £ of a rigid pavement is obtainable through
deflection basin measurements (Bush 1979). The radius of relative stiffness,
£ , is determined from Figure 19 which gives the relationship between a ratio
of deflections measured at points 18 and 48 in. from the center of the load
plate at a load of 7 kips and £ . The calculated DSM and £ values are
plotted in profile form and a representative DSM and £ for each section is
determined. The number of allowable passes for each section is then deter-
mined from Figure 18, converted to daily traffic number (ADTN), and compared
with the Current Daily Traffic Number (CDTN) to determine the structural ade-
quacy of the pavement section. Step-by-step details of the rigid pavement
evaluation and overlay design procedure are presented in Part IV.
Composite Pavement Methodology
46. Although data were collected on composite (AC over PCC) pavements
(Table 4), no definite relationships correlating the NODET DSM data to conven-
tional evaluation procedures for these pavements could be established. There-
fore no evaluation methodology for composite pavement evaluation using the
NODET is presented.
31

10____ ______
toeI-
0
0 ?
0
lo
It
33
0
OSM
0 500 1000 1500 2000 2500 3000 3500DYNAMIC STI'FFNESS MOOLUIS. OS&4 (KIPS/INCH)
Figure 18. Rigid pavement NDT evaluation chart

0.9 -
0.8 -
Z 0.60
-U-
0.5
.4
0.5
0.4 - _ _ _ _ -
0.3 - _ _ - _ _ --
0.2
20 30 40 50 60 70 80 90 100 110 120
RADIUS OF RELATIVE STIFFNESS, Q
Figure 19. Deflection ration versus radius of relative stiffness
33

PART IV: NONDESTRUCTIVE EVALUATION AND OVERLAY DESIGN PROCEDURES
Preliminary Requirements
47. Before beginning data collection with the NODET, certain data must
be obtained. These include determining the pavement structure, daily traffic
number, and an estimate of the amount of traffic that will use the pavement in
the future. If it has not been done previously the pavement network should be
divided into branches and sections as outlined in TM 5-623 (Headquarters,
Department of the Army 1982). Station numbers should also be assigned within
the branches.
Determination of pavement structure
48. Both the flexible and rigid pavement evaluation procedures require
that the type and thickness of each material in the pavement system be known.
This information can often be obtained from existing facility records such as
"as-built" drawings or maintenance records. In areas where information on the
pavement structure is incomplete, out-of-date, or nonexistent, it will be neces-
sary to determine the pavement structure by coring the pavements. This infor-
mation should be updated when any rehabilitation, such as placement of an over-
lay or recycling, is performed or other changes in pavement structure occur.
Determination of current
daily traffic and future traffic
49. Before the structural evaluation of a pavement can be performed,
the current daily traffic must be known and an estimate of the future traffic
expected to use the pavements must be made. The current daily traffic can be
determined from existing records of recent traffic-volume studies or by con-
ducting a traffic-volume study. The future traffic can be estimated from
traffic-volume studies which include vehicle classification counts as described
in "Transportation and Travel, Traffic Engineering Study Reference (Head-
quarters, Military Traffic Management Command 1976).
Conversion to the standard axle load
50. In this evaluation procedure all traffic should be in terms of
passes of the 18,000-lb single-axle dual-wheel load or Standard Axle Load
(SAL). Traffic data which are not in this form, such as design index (DI) or
vehicles/day for each vehicle classification, must be converted to passes of
the SAL as shown in the following paragraphs.
34

51. Conversion from DI to standard axle load passes. Often traffic
data will be in terms of the DI. For flexible pavements the DI is an index
representing all traffic expected to use the pavement during its life. It
is based on typical magnitudes and compositions of traffic reduced to equiva-
lents in terms of repetitions of an 18,000-lb single-axle dual-wheel load.
The number of passes of the standard axle load corresponding to each flexible
pavement DI is given in Table 8. For rigid pavements, the rigid pavement de-
sign index is used which is different from the DI used for flexible pavements.
Table 9 gives the number of equivalent SAL passes corresponding to each of the
rigid pavement Dl's, along with a range of equivalent passes for each index
(Ohio River Division Laboratories 1961). To convert from DI to SAL passes,
simply find the DI in the appropriate table and read the number of equivalent
SAL passes. The DI is based on a 20-year pavement life and the daily traffic
number (DTN) can be obtained by dividing the number of SAL passes for a given
DI by 7,300 which is the number of days in 20 years.
52. Conversion from vehicles/day for each classification to standard
axle load passes. To aid in evaluating vehicular traffic, TM's 5-822-5 and
5-822-6 (Headquarters, Department of the Army 1980, 1977) divide the various
vehicles into six groups as shown in Table 10. If the axle load (or gross
load for forklift trucks and track vehicles) is known for the vehicles,
Table 11 is used to determine the equivalent operations factor as a function
of vehicle group and load. The number of equivalent SAL passes per day is
then calculated for each vehicle and the equivalent SAL passes are summed to
determine the number of equivalent SAL passes/day. In some cases the traffic-
volume data will contain only the number of vehicles/day for each group. If
this is the case, the equivalent operations factors listed in Table 12 should
be multiplied by the number of vehicles/day to obtain the number of equivalent
SAL passes per day for each group. The number of equivalent SAL passes for
each vehicle group is then summed to obtain the number of equivalent SAL
passes/day which is the CDTN. The equivalent operations factors presented in
Table 12 were determined from plots of equivalent operations factor versus
load for each group. These plots are based on the data presented in Table 11.
The equivalent operations factors for each group in Table 12 are the equivalent
operations factors corresponding to 75 percent of the maximum load for that
group.
35

Dividing streets into branches and sections
53. All pavements to be evaluated should be divided into manageable
segments. TM 5-623 provides an excellent method for dividing the pavements
into branches and sections. A branch is any identifiable part of the pavement
network that is a single entity and has a distinct function such as an indi-
vidual street or parking lot. A section is a subdivision of a branch that
contains consistent characteristics in regard to pavement structure, construc-
tion history, traffic, and pavement condition. Division of the pavements into
sections based on pavement structure and traffic is required to complete the
evaluation of the pavement. These sections will also provide permanent refer-
ences allowing the same sections to be tested repeatedly in later years.
These sections can be further subdivided based on the results of the NDT, as
discussed in paragraph 73.
Data Collection
Equipment setup and preparation
54. The procedures for preparing the NODET for data collection are de-
tailed in Appendix C. These preparations include: attaching the control
cables to the NODET and instrumentation control box, attaching the velocity
transducers in their proper positions, system warmup, air spring pressuriza-
tion, and force calibration. Upon completion of these preparations, data
collection is ready to begin.
Data collection
55. Test locations. For roads and streets on military installations,
data should be collected at 100-ft intervals on opposite sides of the center
line. On flexible pavements, the test should be conducted in the outside
wheel path of each lane. On rigid pavements, tests should be conducted at the
center of the slab nearest the 100-ft distance.
56. The simplest and safest method for collecting the data is to test
one lane of a street at 200-ft intervals going with the flow of traffic. The
electronic distance measuring equipment in the tow vehicle is used to deter-
mine the station numbers of the test. When reaching the end of the branch
the distance-measuring device should be put on HOLD, the NODET turned around,
and the opposite lane tested at 200-ft intervals offset 100 ft from the last
test performed in the adjacent lane. Care should be taken to reverse the
36

distance-measuring equipment and release the HOLD button after turning the
NODET around so the stationing of the test locations will be consistent.
Typical test patterns for roads and streets are shown in Figure 20.
3L
I100 FT 10 FT
FLEXIBLE PAVEMENTS
x x
100 FT 100 -1FT ,
RIGID PAVEMENTSFigure 20. Typical test patterns
57. In parking areas containing curbs, tests should be conducted in the
wheel paths of the traffic lanes. In small parking areas where the 100-ft
test spacing is not practical, the test should be spaced to obtain at least
three tests per parking area. On large motorpools and open parking areas,
tests should be conducted in a grid pattern to provide uniform coverage of the
area. However, tests should not be spaced further than 200 ft apart.
58. Data collection procedure. The data used in this NDT evaluation
procedure are obtained with the NODET operating at 20-Hz frequency and dynamic
force levels of 5,000 and 7,000 lb.
59. After equipment setup, warmup period, and force calibration, the
NODET is ready to begin the data collection. The procedure for collecting
data at a test location is:
a. Stop the NODET with the load plate over the desired testlocation.
b. Set test number in the thumbwheel located on the instrumenta-tion control console.
c. Check the operating frequency by pressing the FREQ switch onthe control console (Figure 21). The panel meter should read20.0. If the frequency is not set at 20 Hz the frequency con-trol potentiometer (frequency knob) should be adjusted untilthe panel meter reads 20 Hz.
37
PANEL METER
FORCECAUA ,TION
ROAD
FREOUENCY FORCE RATER F M4!C IWCCONTROL CONTROLPOTENTIO METER POTENTI OMETER F
PRINTER
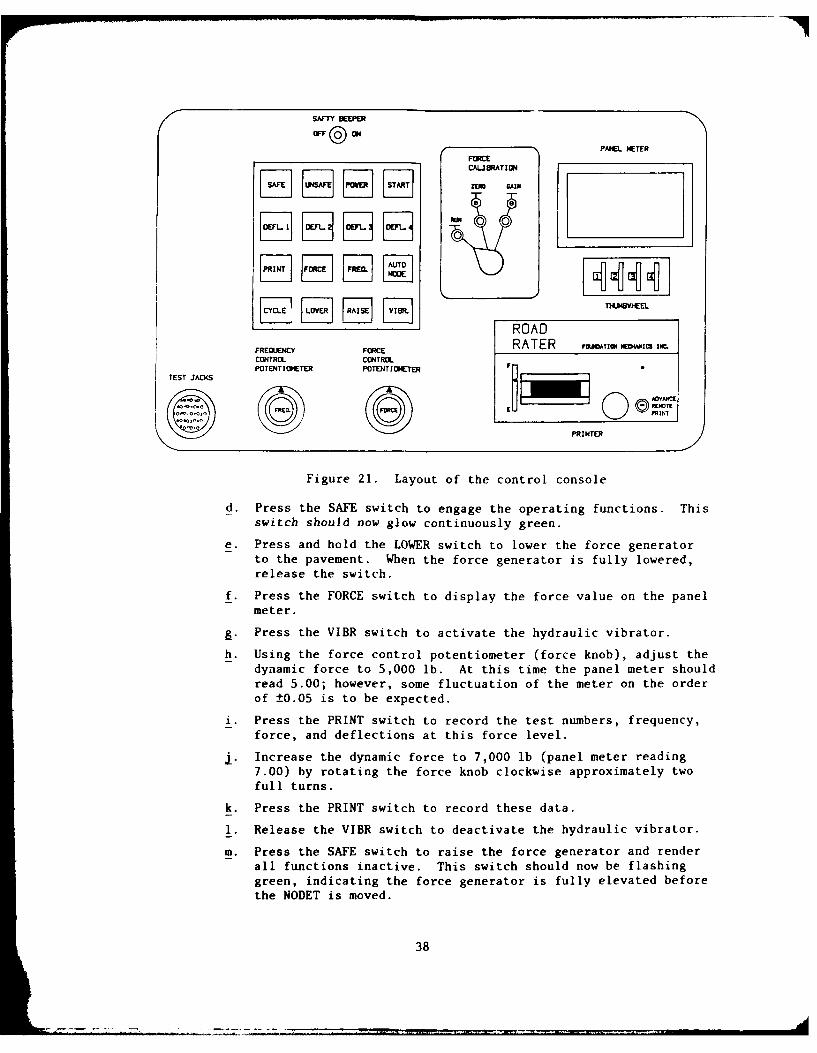
Figure 21. Layout of the control console
d. Press the SAFE switch to engage the operating functions. Thisswitch should now glow continuously green.
e. Press and hold the LOWER switch to lower the force generatorto the pavement. When the force generator is fully lowered,release the switch.
f. Press the FORCE switch to display the force value on the panel
meter.
g. Press the VIBR switch to activate the hydraulic vibrator.
h. Using the force control potentiometer (force knob), adjust thedynamic force to 5,000 lb. At this time the panel meter shouldread 5.00; however, some fluctuation of the meter on the orderof ±0.05 is to be expected.
i. Press the PRINT switch to record the test numbers, frequency,
force, and deflections at this force level.
j. Increase the dynamic force to 7,000 lb (panel meter reading7.00) by rotating the force knob clockwise approximately twofull turns.
k. Press the PRINT switch to record these data.
1. Release the VIBR switch to deactivate the hydraulic vibrator.
m. Press the SAFE switch to raise the force generator and renderall functions inactive. This switch should now be flashinggreen, indicating the force generator is fully elevated beforethe NODET is moved.
38

n. Check the data for any obvious errors before moving to the nexttest location.
60. A record of the test number, test location (branch, section, sta-
tion number, etc.), and time should be kept in a fieldbook or other permanent
record. A typical fieldbook setup is shown in Figure 22.
TEST BANC SECTION STATION: SURFACE,NUMBER NUMBER NUMBER TIME TEMPERATURE NOTES
. . ..-. ... . . .
Figure 22. Typical fieldbook setup
61. NODET output. The digital printer contained in the instrumentation
system control console provides a permanent record of the test data on paper
tape. The printout format is shown in Figure 23.
62. Locating data errors. Occasionally, errors will occur in the data;
therefore, each set of data should be checked before moving to the next test
location. This check should include making sure each channel printed cor-
rectly. Errors of this type include a channel with all zero readings (Fig-
ure 24a) or a missing channel (Figure 24b). These problems are usually minor
printer malfunctions and can be corrected by repeating the test. If the
39
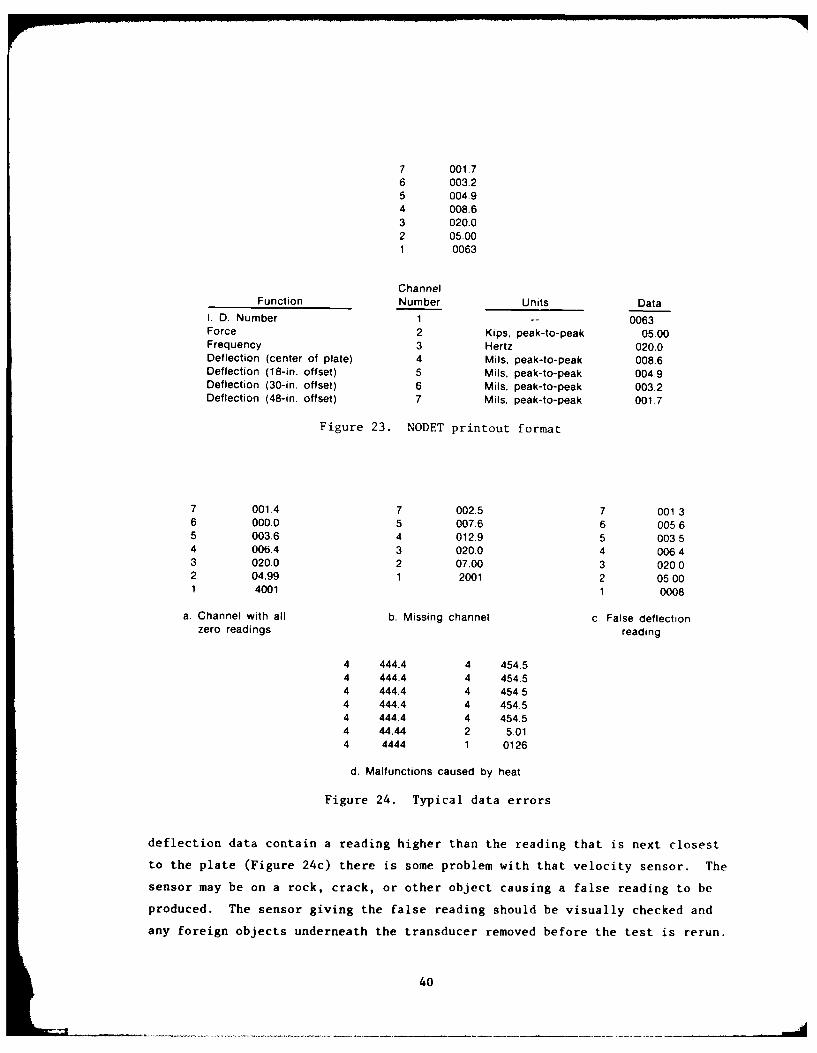
7 001.76 003.25 004.94 008.63 020.02 05.001 0063
ChannelFunction Number Units Data
I. D. Number 1 -- 0063Force 2 Kips, peak-to-peak 05.00Frequency 3 Hertz 020.0Deflection (center of plate) 4 Mils, peak-to-peak 008.6Deflection (18-in. offset) 5 Mils, peak-to-peak 004.9Deflection (30-in. offset) 6 Mils, peak-to-peak 003.2Deflection (48-in. offset) 7 Mils, peak-to-peak 001.7
Figure 23. NODET printout format
7 001.4 7 002.5 7 001 36 000.0 5 007.6 6 00565 003.6 4 012.9 5 00354 006.4 3 020.0 4 006 43 020.0 2 07.00 3 02002 04.99 1 2001 2 05001 4001 1 0008
a. Channel with all b. Missing channel c False deflectionzero readings reading
4 444.4 4 454.54 444.4 4 454.54 444.4 4 454.54 444.4 4 454.54 444.4 4 454.54 44.44 2 5.014 4444 1 0126
d. Malfunctions caused by heat
Figure 24. Typical data errors
deflection data contain a reading higher than the reading that is next closest
to the plate (Figure 24c) there is some problem with that velocity sensor. The
sensor may be on a rock, crack, or other object causing a false reading to be
produced. The sensor giving the false reading should be visually checked and
any foreign objects underneath the transducer removed before the test is rerun.
40
63. The NODET printer is sensitive to high temperatures and will mal-
function if the instrumentation control console is not kept cool. Temperatures
greater than approximately 900 F in the area of the instrumentation console may
result in malfunctions such as those seen in Figure 24d. Large fluctuations
in the panel meter force readings that will not stabilize and/or large dis-
crepancies between the panel meter force reading and tape output can also be
caused by excessive heat. To prevent this malfunction from occurring the cab
of the tow vehicle should be kept cool.
64. Large fluctuations in the panel meter force readings that will not
stabilize may result from uneven pressure in the air bags or loss of pressure
in one or more of the bags. If these fluctuations occur and cannot be at-
tributed to heat, the pressure in the air bags should be checked and adjusted
if necessary.
65. If there is any doubt as to the validity of the data recorded on
the tape, each value of force, frequency, and deflection can be checked inde-
pendently by depressing the appropriate switch on the instrumentation console
and reading the resulting value on the panel meter. Should the automatic
printer stop working for any reason, testing can continue with the data being
recorded manually.
66. Pavement temperature measurements. When collecting NDT data on
asphaltic concrete or composite pavements, the pavement surface temperature
should be measured and recorded at 1-hr intervals. To obtain these data the
thermometer probe is attached to the pavement, as shown in Figure 25, and
shielded from direct sunlight until the temperature reading peaks. This
value is then recorded along with the time and location in the fieldbook shown
in Figure 22.
Data Reduction
DSM calculation
67. After completing the data collection the next step is to calculate
the DSM for each test location. To simplify this procedure the data should be
tabulated onto the NDT data sheets; sample sheets are shown in Figures 26 and
27. Figure 26 is the data sheet for recording flexible pavement data; while
the rigid pavement data are recorded on the data sheet shown in Figure 27.
68. The DSM is then calculated using the equation
41
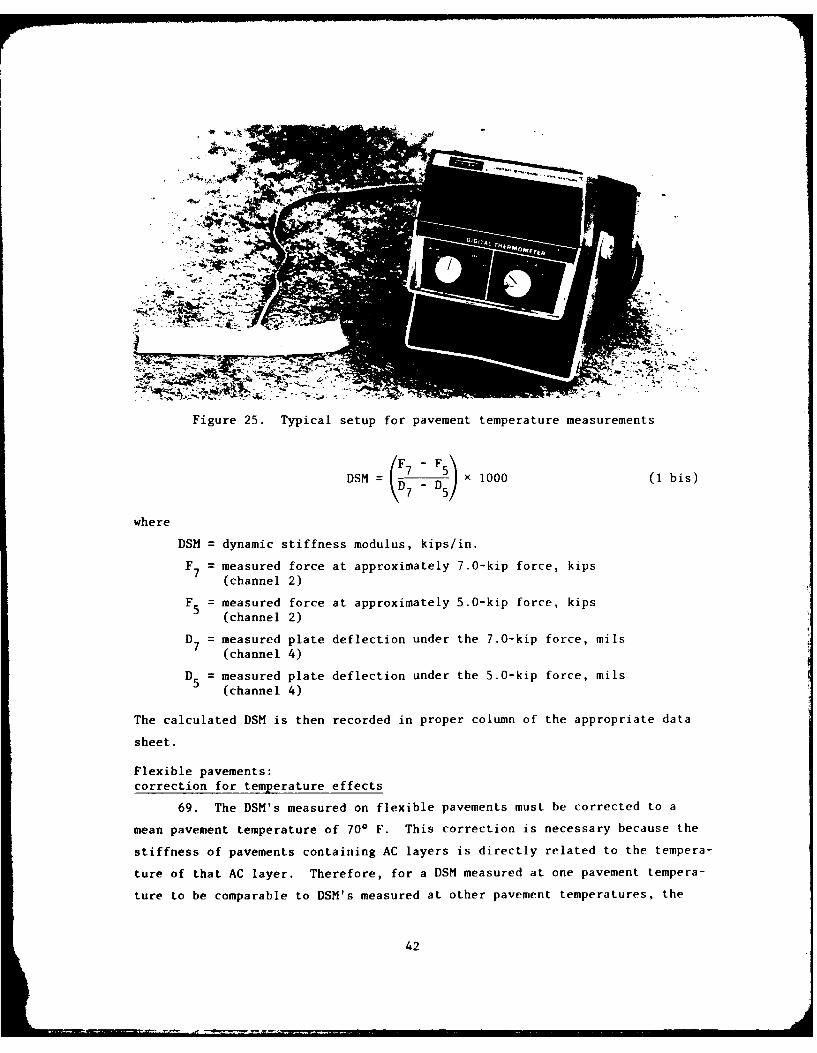
Figure 25. Typical setup for pavement temperature measurements
DSM = x 1000 (1 bis)
where
DSM = dynamic stiffness modulus, kips/in.
F 7 = measured force at approximately 7.0-kip force, kips(channel 2)
F5 = measured force at approximately 5.0-kip force, kips(channel 2)
D7 = measured plate deflection under the 7.0-kip force, mils(channel 4)
D5 = measured plate deflection under the 5.0-kip force, mils(channel 4)
The calculated DSM is then recorded in proper column of the appropriate data
sheet.
Flexible pavements:
correction for temperature effects
69. The DSM's measured on flexible pavements must be corrected to a
mean pavement temperature of 700 F. This correction is necessary because the
stiffness of pavements containing AC layers is directly related to the tempera-
ture of that AC layer. Therefore, for a DSM measured at one pavement tempera-
ture to be comparable to DSM's measured at other pavement temperatures, the
42

- ............ .."
a
Z..
; e i 4
.
>> 0
I jtI
CA E
4.r
4, 1 . . , . _ ,
, ,,,,,,
K w
-l 0.
.n 7

0
m )
4-I-
) m 0 0
~-4 W4- -'T -4
44
-- -- - --- ---- - - - - - --4---
E CD4JJ cm 4co- I I 1 1
a) 5. (~-4 o
4-j
4--4
U) r=
c
'-L4
W% 4-
0U)00----------------------------- -Ln Z,4 4
DSM values should be corrected to a common mean pavement temperature. The
correction factors used in correcting the measured DSM values to the common
mean pavement temperature of 70* F for flexible pavements are presented in
Figure 28 and the DSM correctic, factors for AC over PCC pavements are pre-
sented in Figure 29.
70. To correct the measured DSM, the DSM correction factor is deter-
mined from Figure 28 using the mean pavement temperature and thickness of the
asphalt layer. The mean pavement temperature is calculated using the Asphalt
Institute method as described in paragraph 23 and Figure 30. The correction
factor obtained is then multiplied by the measured DSM to obtain the tempera-
ture corrected DSM.
Radius of relative stiffness calculation
71. For rigid pavements the radius of relative stiffness 2 should
be determined from the NODET data. The radius of relative stiffness is deter-
mined at the 7.0-kip-force level using the deflections measured at 18 and
48 in. from the center of the plate, and Figure 31. The deflection ratio
A48/A18 is calculated, then used in Figure 31 to determine 2 . The NODET
data sheet for rigid pavements (Figure 27) contains columns for recording the
deflection ratio and 2 value to simplify the calculations.
Selecting representative DSM values
72. To aid in determining the representative DSM value to use in evalu-
ating a pavement section each corrected DSM value should be plotted in profile
form. The best results are obtained when each DSM measured on a branch or
street is plotted along the length of the branch or street. The locations of
the pavement sections should be noted along the bottom of the profile.
73. Although a pavement section may supposedly be of the same type and
construction, it should be subdivided and treated as more than one group
when the DSM values measured in one area differ greatly from those measured
in another area of the same section.
74. The DSM value assigned to a pavement group or section should be the
statistical mean corrected DSM for the group (X) minus one standard devia-
tion (S). A minimum of three test points should be taken in each section.
45

4-C-4
00 zaLu
LLI o
CDZ 0 j
wLU cc 0
U CL D Qj. 2
wZj - z w~
LA.C-)LL0 0
f- LU0
o
-4
0
oo
cs
to C- co
:1 U3nV~W1I3YAdN3

C,)
z
<U
LLJ w
0 -
<u0 w.
>~ cv
x u .0. .
ui ~ 0 >
0 u '-
zg0
0 L
C-4
0
o CL
:j -3kfIjnJ.LvUd3 IN3VI3AVd NV3VW
IL.
N0 Z
wVAJ 0 >-$
_ _ _ _
oJ -'I- )
L'J)
cr E
Lai
LLI
LI0
Li -
(/)
I a
NI D
0 Z
0 0 0 0 0* N
- -dOH.Ld3(3 IV 3uLJVb3dV43.L

09
08
Z 0.6- - -- -
-LU
0.
0.4
0.3
0.220 30 40 50 60 70 80 90 100 110 120
RADIUS OF RELATIVE STIFFNESS, V
Figure 31. Deflection ratio versus radius of relative stiffness
49
lvalua-tion and Overlay Desi n Procedures
Fexib I e pavements
75. Eva luat ionr ocedu re. After determining the representait vc i":9
the pavement section we are ready to evaluate the section. The _,tept ' rrl t!,"
evaluation procedures are:
a. )etermine the numbe r of (ASALP ) f rom Equat i on 8
ASALP =antilogj0.0l69(DS1 ) - 0.2919i
b. Convert the al lowable passes to all owable Laiiv t ,iI t i umtcr
(ADTN) by dividing the number of a I lowable pass.-t, by 7 .
which is the number of days in a 20-year period t- ADN "therefore the allowable average number of daily lb,' -t'-
axle load passes based on a 20-year pe-i od.
c. Compare the allowable DTN (ADTN) ohtai nd i Step h ,ith t:;,.current DTN (CDTN). Is the AI)TN greater thin i. ht CLII.N ''
Yes - The pavement i s st ructura I IV Adiqm.it,No - The pavement is not structurillv .cjiaty
Caution must be used in interpreting the va iuj t ti1, iil It ,The evaluation is based on coniditions existiig ,t tht, iijt t',,NDT was performed and does not t ake nto ac(couit s- t-Iigthichanges resulting from frost or freeze/tlhia eftect:. ;i ir,!i
extreme dry or wet periods.
76. Overliay_ design procedur.e . It the pavemen : nt st rio t. . .-
quate, some type of rehabilitation is required. unm type ()f rehOi i it It 1, . i,,
to overlay the existing pavement. The jmotnt of overlay required t -up;
the expected future traffic can he determined fron the previouszly obti a,',ri
NDT results. The steps in determining the required overlay thick :ir<s ire:
a. Determine the total equivalent thickness, TFQ , of tli. jav,-
ment section:
(1) Convert the existing pavement section to an eIuiva Itlitthickness of subbase, TS I rsing the equivalencv takt r.
in Table 7. TS is determined by mult iplying the l.I i
thickness by the proper equivalency factor to convert ,a'lhlayer to thickness of equivalent subbase, then smiimingeach thickness to determine the total, TS '
(2) Using TS , determine the total equivalent pavement thick-
ness, TE Q which is composed of 3.5 in. of AC, 4.0 in.
of 100 CBR crushed stone base, and a vatiabl, amounit ofgranular subbase. The TEQ is determined from
50

TEQ = 3.5 AC + 4.0 base + (TS - 16.05) subbase
TEQ = 7.5 + (Ts - 16.05)
TEQ = TS - 8.55 in. (3 his)
Note that the 16.05-in. equivalent subbase is the resultof converting the required 3.5-in. of AC (equivalency fac-tor = 2.3) and 4.0-in. of crushed stone base (equivalencyfactor = 2.0) to equivalent subbase. If TS were less
than 16.05 in., the equation for computing TEQ would be
T - 8.05TEQ 3.5 + (4 his)
b. Enter the flexible pavement design curves (Figure 32) with thenumber of allowable passes (ASALP) computed from Equation 8and determine the subgrade CBR at the equivalent thickness,TEQ
c. Reenter the design curves (Figure 32) with the estimated futuretraffic and move vertically to the subgrade CBR value determinediii Step b above then horizontally to determine the thicknessrequired, Tr
d. Determine the amount of asphaltic concrete overlay required:
= r TEQo 2.30
wheret = overlay required, in.
0
T r= required thickness (from c)r
TEQ = equivalent thickness (from a)
77. A complete example of the pavement evaluation and overlay design
procedure is presented in Appendix A.
Rigid pavements
78. Evaluation procedure. After completing the data reduction the
steps in evaluating rigid pavements are:
a. Determine the number of allowable passes of the standard axleload from Figure 33.
(1) Enter with the representative DSM for the pavement section.
51
di

I 0
Io n
I~~ - - I
w
eUzi
I T caI T
a 0OL 0 Lo 0 LV- N C4 m
'N1 'SS3N)l3IHl 1N3WA3A'~d

10" 1 f f
100
0
0
00- 06
z
3t
'
9
OSM
0 500 1000 1500 2000 2500 3000 3500
DYNAMIC STIFFNESS MCODULUS, OSM ImIPS/INCH)
Figure 33. Rigid pavement NDT evaluation chart

(2) Proceed vertically to the average k value determined forthe pavement section.
(3) Read the number of allowable SAL passes from the leftmargin.
b. Convert the number of allowable passes to ADTN by dividing the
allowable passes by 7,300.
c. Compare the allowable DTN (ADTN) with the current DTN (CDTN).Is the ADTN greater than the CDTN?
Yes - The pavement is structurally adequate.No - The pavement is not structurally adequate.
Caution must be used in interpreting the evaluation results.The evaluation is based on conditions existing at the time theNDT was performed and does not take into account strengthchanges resulting from frost or freeze/thaw effects of fromextreme dry or wet periods.
79. Overlay design procedure. The overlay thickness required to sup-
port the design traffic can be determined from the following steps:
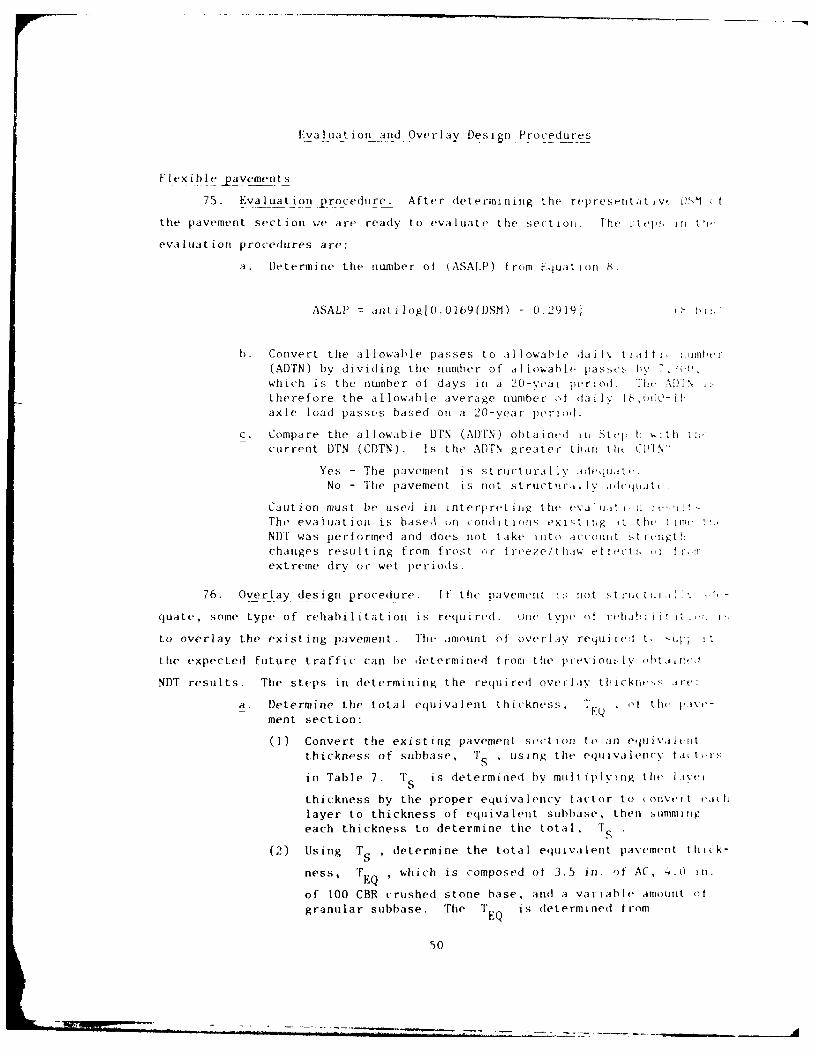
a. Determine the required pavement thickness, hd 9 using the
existing pavement thickness, h ; the number of ASALP (fromstep a of the evaluation procedure); and the estimated futuretraffic level. Determine the required pavement thickness fromthe rigid pavement design chart (Figure 34) as follows:
(1) Enter with the pavement thickness, h , and go left to the
allowable pass level (ASAL).
(2) Move vertically from this point to the estimated futurepass level.
(3) Read the required pavement thickness, hd 9 to the nearest
1/10 in.
b. Check the flexural strength.
(1) Calculate the modulus of subgrade reaction, k
h3
k = 341005.97 U (14)
The 0.7 factor included in Equation 14 results from cor-relations between 2 from deflection measurements andcomputed from pavement properties using Equation 9. Thesecorrelations were initially performed by Bush (1979)and confirmed in this study.
(2) Enter the design chart (Figure 34) with the pavementthickness, h , and move left to the allowable pass level.
(3) Move vertically to the k value determined above, thenleft to determine the flexural strength, R
54
1,01,L -
CD 0 C 1 C
900N
850
10
60
60,
450
400
18,000-LB AXLE LOAD PASSES
Figure 34. Rigid pavement design chart
55

If the flexural strength is outside a 400- to 900-psi range a
flexural strength within this range (usually 650 or 700) shouldbe used to redetermine hd . The new value of hd is found by
entering the design chart with the assumed flexural strengthand moving right to the correct k , then vertically to theestimated future traffic level, then right to determine hd
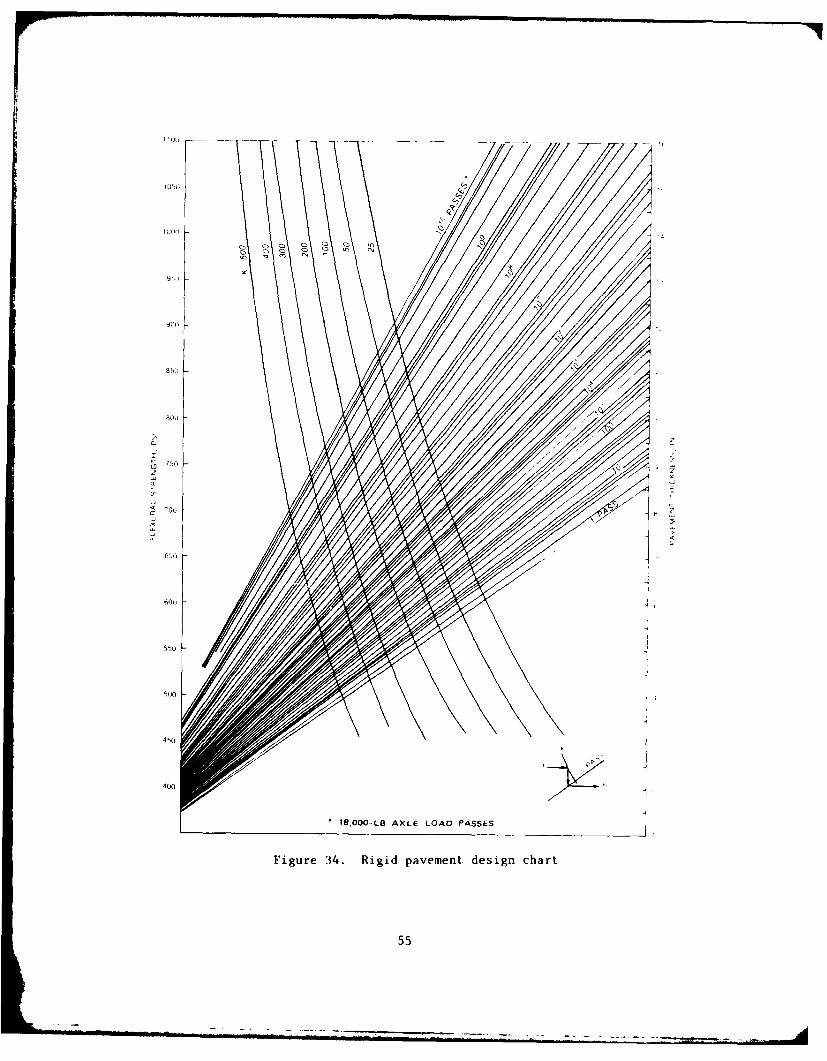
c. Determine the amount of flexible overlay required to the
nearest 1/2 in.*
t = 2.5(Fhd - Cbh) (15)
where
t = flexible pavement overlay thickness, in.
F = factor from Figure 35 determined for a rigid pave-ment design index (determined from Table 9 usingexpected future traffic) and k . This factor pro-jects cracking that may be expected in existing PCCpavement.
hd = required thickness, in.
c b = condition factor for base pavement
Cb = 1.00 when rigid base pavement slabs containonly nominal initial cracking
Cb = 0.75 when the rigid base pavement slabs con-
tain multiple cracks and numerous corner
breaks
h = existing PCC pavement thickness
d. Determine amount of partially bonded rigid overlay required.*
h 1.4 d 14 14 (16)
whereh = overlay thickness required, in.
0
hd = required pavement thickness, in.
c r = condition factor for existing pavement
C = 1.00 when the slabs are in good condition,
r with little or no structural cracking
C = 0.75 when the slabs show initial crackingr due to loading, but little or no multiple
cracking
C = 0.50 when a larger number of slabs showmultiple cracking, but the majority of slabsare intact or contain only single cracks
Reference: TM 5-822-6/AFN 88-7, Chapter 1, page 40, paragraph 13.8.2.
56
MODULUS OF SUBGRADE REACTION - k. LB/IN.
0 50 100 150 200 250 300 350 400
1.00
o. o- -50.95 \ .7
~0.925
o0 .75
S ARIGI 0.250 0.775
.75,\0.
(2) 0.25- 0.675
05 i _ 0.25
70.5750.45.475
N 0.425
0.40
NOTES:(1) DETERMINE F FACTOR FROM ABOVE CHART USING MEASURED
k. USE CURVE NUMBERED SAME AS RIGID PAVEMENT INDEX,i.e. FOR RPDI OF 3,USE CURVE (5)
(2) MINIMUM F VALUE = 0.40. FOR k > 400 USE F FOR k = 400(3) SOURCE: TM 5-822-6/AFM 88-7, Chapt 1
Figure 35. Determination of rigid pavement cracking factor F
57
C = 0.35 when the majority of slabs show multiple
r cracking
h = existing PCC thickness
e. Determine the amount of rigid overlay with a leveling or bondbreaking course required.*
ho (d) 2 Cr(h 2 ) (17)
Note: TM 5-822-6 (Department of the Army 1977) requiresthat the minimum rigid overlay pavement thickness be6 in., while the minimum all-bituminous overlay be 4 in.
80. A complete example of the rigid pavement evaluation and overlay
design procedure is presented in Appendix B.
Presentation of Data
81. Upon completion of the evaluation, a report should be prepared.
The report should include:
a. Map showing the pavements tested.
b. Information on the pavement structure.
c. Traffic information.
d. A brief description of the surface condition for each section.
e. DSM plots for each branch.
f. Tables showing the results of the evaluation.
g. Conclusions and recommendations.
Reference: TM 5-822-6/AFM 88-7, Chapter 1, page 36, paragraph 13.4.2.
58

PART V: DISCUSSION
Limitations
82. Certain limitations or restrictions are inherent in the nondestruc-
tive test and evaluation procedures described in this report. These are: the
testing must be performed with the Road Rater Model 2008 vibrator; the test to
measure the DSM must be made at a frequency of 20 Hz with an 18-in.-diam con-
tact load plate; the thickness of the pavement layers above the subgrade and
the type of material comprising each layer must be known; the evaluation is
based on conditions existing at the time of the evaluation, and the load-
carrying capability may be considerably different than if the pavement were
under the effect of frost or freezing conditions, spring thaw, or extremely
wet or dry conditions; no evaluation procedure is available for composite
pavements; and thick pavements (generally greater than 12 in.) can result in a
large amount of scatter in the load-deflection data.
Advantages
83. The advantages of this method of pavement evaluation are the rapid,
nondestructive capabilities that provide minimal interference with vehicle
operations. Since the NODET testing requires only a small amount of time
(about 2 min per test), a much more thorough investigation of pavement
strength variability can be made than is practical using destructive testing.
Possible Uses
84. There are several possible alternatives for implementing the NODET
evaluation procedures described herein. The first alternative would be to use
the NODET evaluation on a project basis to evaluate an existing pavement and
make rehabilitation recommendations. The advantages of this alternative are
that the NODET could be used to recommend the amount of overlay required
without extensive destructive testing and any extremely weak areas where com-
plete reconstruction would be required could be pinpointed and corrected prior
to application of the overlay. The major disadvantage of this alternative is
the time and expense involved in transporting the equipment to perform only a
59

small amount of testing. A second alternative would be to use the NODET
evaluation to determine test pit locations. This would be especially useful
in failure investigations, evaluating thick pavements (generally greater than
12 in.), or evaluating composite pavements. The advantage of using the NODET
in this manner is that the relative strengths of the pavement can be deter-
mined prior to excavating the test pits. The third alternative for implement-
ing the NODET evaluation would be to test and evaluate pavements on a "whole-
sale" basis, that is, testing and evaluating the entire pavement system of an
installation. This has the advantage of providing an evaluation of all the
pavements so that the evaluations of different streets can be compared and
maintenance priorities established. Disadvantages include the time and ex-
pense of a large-scale testing program as well as the manpower required to
handle such a large amount of data.
Future Improvements and Modifications
85. There are several improvements and modifications to the present
NODET equipment and evaluation procedures that, if adopted, would decrease the
time required to collect and reduce the NODET data and improve the efficiency
of the evaluation. One of these improvements would be the addition of an auto-
matic data acquisition system to the instrumentation control panel. This
system, presently available, would automatically collect, record, and reduce
the load-deflection data, thus reducing the time required for the data collec-
tion and data reduction phases of the evaluation. Another improvement to the
data collection procedure would be a statistical means for determining if
sufficient data had been obtained within a given pavement section prior to
leaving that section. This could be in the form of a nomograph or could be
included in the automatic data acquisition system.
86. A major improvement in the evaluation of roads and streets would be
the completion and implementation of the elastic layer evaluation procedure.
The elastic layer evaluation procedure would enable the user to evaluate all
types of pavement systems including flexible, rigid, and composite (asphalt
over concrete) pavements using one basic procedure, as well as make the
evaluation procedure easily adaptable to new loads and vehicles, different
NDT devices, and new pavement materials.
60

PART VI: CONCLUSIONS AND RECOMMENDATIONS
Conclusions
87. This report presents procedures for the nondestructive evaluation
and overlay design of military roads and streets. The procedures are basic-
ally correlations of nondestructive vibratory test results to conventional
pavement evaluation criteria. From this study it is concluded that:
a. The flexible and rigid pavement evaluation procedures presentedin this report are applicable to the evaluation of militaryroads and streets using the NODET nondestructive testingequipment.
b. Results of the temperature effects study confirm that forAC pavements greater than 3 in. thick the WES DSM correctionfactors presently in use are applicable to the NODET and shouldbe used to correct DSM values obtained with the NODET to acommon mean pavement temperature of 700 F.
c. AC pavements less than 3 in. thick should not be corrected fortemperature effects.
d. Although data were collected on composite pavements, a definiterelationship correlating the NODET DSM to conventional evalua-tion procedures for these pavements was not established.
Recommendations
88. Based on the results of this study, it is recommended that:
a. The NODET evaluation procedures for flexible and rigid highwaypavements be adopted for use in evaluating military roads andstreets.
b. In the initial stages of implementation, additional test pitor core hole testing be conducted on flexible and rigid pave-ments and the data used to further develop and define the basiccorrelations.
c. Consideration be given to installing an automatic data acquisi-tion system to the existing NODET instrumentation controlpanel.
d. A statistical means be developed to determine if sufficientload-deflection data have been obtained within a given pavementsection.
e. The elastic layer method of evaluation be completed andimplemented.
61

REFERENCES
American Society for Testing and Materials. 1980. "Standard Test Method forSplitting Tensile Strength of Cylindrical Concrete Specimens," Designation:C 496-71, 1980 Book of ASTM Standards, Philadelphia, Pa.
Bush, A. J. III. 1979 (Jun). "Comparison of Dynamic Surface Deflection Mea-surements on Rigid Pavements with the Model of an Infinite Plate on an ElasticFoundation," Masters Thesis, Mississippi State University, State College, Miss.
Department of Defense. 1964 (Dec). "Military Standard Test Method for Pave-ment, Subgrade, Subbase, and Base-Course Materials," MIL-STD-621A, Washington,D. C.
Green, J. L. and Hall, J. W., Jr. 1975 (Sep). "Nondestructive VibratoryTesting of Airport Pavements, Experimental Test Results, and Development ofEvaluation Methodology and Procedure," Report No. FAA-RD-73-205-1, Vol I,Federal Aviation Administration, Washington, D. C.
Hall, J. W., Jr., and Elsea, D. R. 1974 (Feb). "Small Aperture Testing forAirfield Pavement Evaluation," Miscellaneous Paper S-74-3, U. S. Army EngineerWaterways Experiment Station, CE, Vicksburg, Miss.
Hammitt, G. M. II. 1971 (Dec). "Concrete Strength Relationships," ResearchPaper, Texas A&NM University, College Station, Tex.
Headquarters, Department of the Army. 1977 (Apr). "Engineering and Design;Rigid Pavements for Roads, Streets, Walks, and Open Storage Areas," TechnicalManual 5-822-6, Washington, D. C.
- . 1980 (May). "Engineering and Design, Flexible Pavement forRoads, Streets, Walks, and Open Storage Areas," Technical Manual 5-822-5,Washington, D. C.
. 1982 (Nov). "Pavement Maintenance Management," TechnicalManual 5-623, Washington, D. C.
Headquarters, Military Traffic Management Command. 1976 (Apr). "Transporta-tion and Travel, Traffic Engineering Study Reference," MTMC Pamphlet No. 55-8,Washington, D. C.
Ohio River Division Laboratories, U. S. Army Engineer Division, Ohio River.1961 (Jul). "Development of Rigid Pavement Thickness Requirements forMilitary Roads and Streets," Technical Report No. 4-18, Cincinnati, Ohio.
The Asphalt Institute. 1969 (Nov). "Asphaltic Overlays and Pavement Rehabil-itation," Manual Series No. 17, College Park, Md.
U. S. Army Engineer Waterways Experiment Station, CE. 1951 (Jun). "Collec-tion of Letter Reports on Flexible Pavement Design Curves," MiscellaneousPaper No. 4-61, Vicksburg, Miss.
. 1961 (Aug). "Revised Method of Thickness Design for FlexibleHighway Pavements at Military Installations," Technical Report No. 3-582,Vicksburg, Miss.
Westergaard, H. M. 1926. "Stresses in Concrete Pavements Computed byTheoretical Analyses," Public Roads, Vol 7, No. 2.
62

4
W: 0
-
0
41
4-4
r-4-
4) 04N ~0 1-44 -
-4 F I
co I
o 0%
0- 0 0.4 1
411
u to41 0 0t1
00 44 '.'
414
I00 m. 142
a > ". 6 w0 W. 0
m )t 44LI 4) 0
I-) -4 14 qI
S.. '14 a0
44
.r44)
1. U 94 142
1A ) -4
W4 4j M
Z 0 0 0.

Ei- lt 1... h ikuria BR II- k-- t 1- 1,, el, TB
lId 91 a ) v rntil t. 2lS i ilyi ,*l -IA i 1 ,1 1 4 .
IL '2) >aiu ia tre t n 2i) C a ld ,, -- , I .g, I I I
FIA I)0 1 5 1rS hedy Sau l] 1 Crd i t I I I i, .Iit-
BIA' t. I 25 Ni.re ltr.,dminlI -- , )i ii 5,l , -- , '. ' -I) Oa) -- -
EI. : .8O C0a 1rve 1., I-Aad1 /, itEm7 ,.0 1.75 S(hi n tra inrba -- 5 ,,Rive lru v2 -. 5 S.R~,u~r.~.
[BA , m, r s hedstne-l Bi. S ~ iiltu --la I,) a
[3 B7) 0 ,rlay gral -- 753 a.) eBrnniiny C, sr ¢,n,
t2 I0 0 20 staii zd iO 25 S.-ta rvel -- 7, 2 L1*ta
[*2 4.0 1 . a I, III .- Il. -c, . l
E 12A 0 I.5 SaIIIn i rae i " I ae t) Lve i l taI -, -l
£13A 20 i75 , n.d -ae 5 / Lean1 , .a -dr 1 S
E14A 10 20 Sarta i ann -- I5 Sa-u d It '-. 5 iIau --,
EIS BC 2 ( CIYrh esl S Ii S., G e I I, I
E17 3.0 1.75 0,1 lae1 tt anr- 8 kB ... ... ru 42 5 11
EIB 4,5 B.C Cran~d Bl.ne I1,U- 85 I r . i .- ... s 1.-, 1-u
w 1 4.75 0.79 Clay grane ".0- I/ ean clan 4, S I -
W82 20 9.0 1ne stab nILed IOO+ 20 0 Clay gravrl - S r, Li',, la
83 3.0 19-S Sandy gravel 24 22. Iran, 1.a, 14
W4 2.5 1.5 Sandy granel lB 4.5 I l a 20 - / 1 It, .as
89 2.0 6.75 Sandy gravel 59 SIG Iran ly
86 75 6.0 Crasd ste IC00 sn e y
W7 4.0 8.0 Crnshedsnnne Ioo. S/; Ira., clay l8
S 7.B 4.0 Crasednnnr 100+ 24 C Clay gravel Sc S n ly
KI 3.5 4.0 Sandy gan I 126 22.5 Sandy gravel 41 S C cI s1 aldl
2 2.25 4.0 Sandy avel It 9. S ga-l 00 0 Silts sandI 81 r .2 , ,,.
K3 2.75 12.29 Sandy gravel 91 ll- C Grave l y and 29 Sc Gniu I ly ,rv lr
84 7 5 5.5 Sady grand )6 13.0 SaIy gravel 48 SIG Sd In, Iau
epp =5 2 . I
K5 IS 0 4.5 BsIy sand 40 11.9 S.ily andy gravel 1004 SC Silt nan
K6 9.9 8.s Silly sand 39 4.0 AC IC0n t / SL Ity sand --
K7 3.9 8.0 Bissai...a.g slb -- 4. Sily san dy grave 79 7.0 Sands ilan S'5, S> 4r4
88 7.0 18,0 Gravelly sand '14 SIG Sity nan 20
Septh n 5 in- 99
eepIt a 2 i 0
K9 6.0 12 0 Gravelly sand 90 3,0 Lean nlay 14 BiG SIlty sand ,Septh 1 i 18
810 2.29 6.5 Sandy granel RS8 61.2 Sily san 41 SiC Silly nanI'.1
phv 9<in-bF I On
Sp82n.
828 3.0..8..0.Sandy-gravel...9.17.0 Gravelly sand 90 II .laigan =10, I-~a I. --. Depth n 18J "" in....

CM tR.k,,... HR t7."put..R.....i.--.-
12 2 - " 2 - , . -
121
24Dth - 'U . . -2.<- --
-- /G. HSad v(ine .7hq t - - ,.15 - 9; .
-- -o3Ut,.Ix -- v Hi-it- 1,
00q 81h K I .
2. 02 1 7 R i I i .. . .0C 01 ]
0 1 7 ,
S / tU:¢]y--7 I1 I . 10.it. '7lO-. 7 - - h it -+ ..t --
0- 1 4 q- 2 1 1
0. p I.-
-j' 2 -9 1 11 4
0 1 - I S 0I
'. ~ g. Iy--. 702 H3 b H1t 2, 0,8 -t 0Dt Hi4 2 99 4 0 A
SIG ~ ~ ~ ~ ~ ~ ~ A 12. (f- 774 Q C 1"
I A922 Hs 01 1 -o1)C
s10 RI s 41 1
7.04 128 9 b 0 9C0 5 W 1
Det 34il 99 2.4 f, 0 H i
9(0~ San (tn) 2 9 HA 9 o2 &H h. 9
H.H L- 7 11 H%. 40. H R 10 0 9 IsR I I- Rt9
S 0 .4 4,

0 , -d 0 0 - C A 0 0_4. 4
CIN ' 0 C -0 4 4 4 4 0 0 C ~ 0 0 . 0 N
4i 4 0 0 4 4 4 4 4 4
-a4 ,i 4- .. .* 0
I:
Ni s 0 -
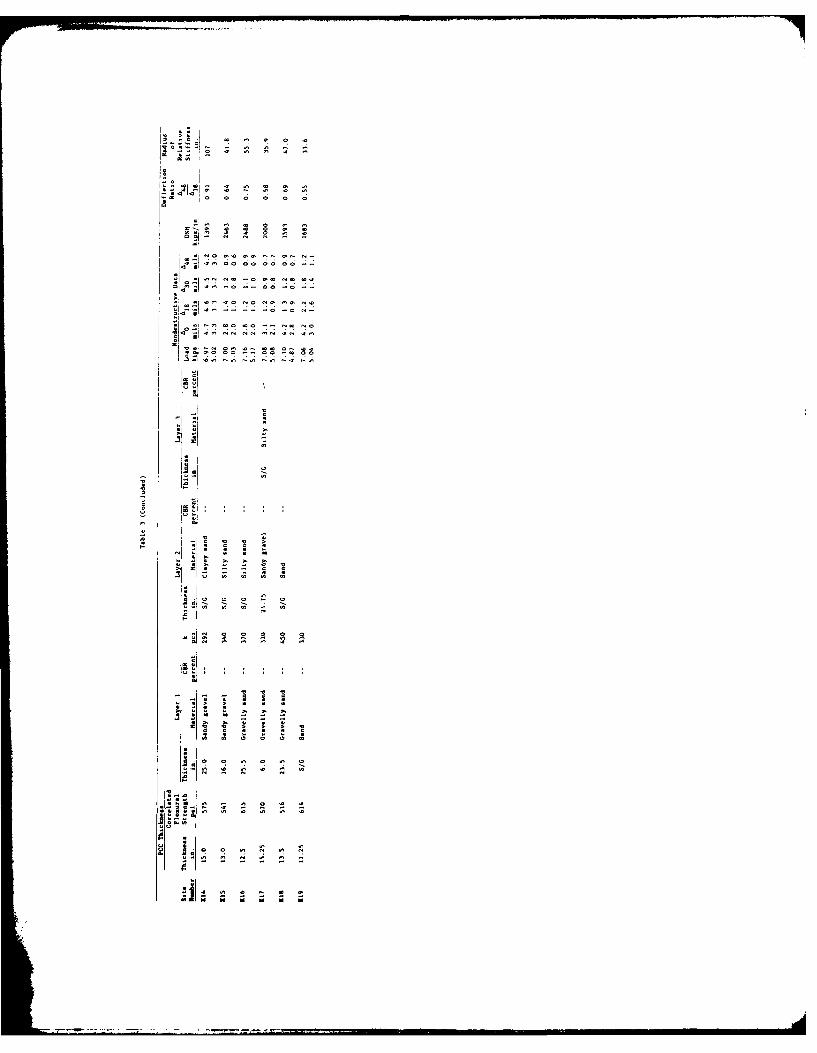
fi' ~ N - -
<NO 0.000 00 --
* C, -~ ON 00 NO NO NO NC
* CCC 0~NCN0
tO 1 ON NN NN ON ON ON
0000~ 00 C 00
NI
~I ~
.0 'V
-~ o I I C
~ C C
9 .,.~ 9~0 0 0 0 N CNN N
*C~I0-0 0 0 0

PCC PavementAC Correlated
Pavement Flexural Layer I Layer 2
Site Thickness Thickness Strength Thickness CBR Thickness
Number in. in. psi in. Material percent in. Material
E4 5.0 6.0 770 Subgrade Sandy clay 5
E19 3.75 11.25 640 11.0 Lean clay 7 Subgrade Heavy clay
E20 7.5 8.5 750 Subgrade Heavy clay 3
E21 4.75 8.0 750 3.25 Sand gravel 37 10.0 Crushed stone
P6 6.25 7.25 860 Subgrade Sandy clay 47
P8 1.25 7.7 915 Subgrade Sandy clay 6
P12 5.0 7.7 940 Subgrade Sandy clay 4
P14 4.0 7.0 940 1.5 Asphalt -- Subgrade Silty sandSlabjacking
P16 5.5 7.4 950 Subgrade Silty sand 39
P17 6.5 7.0 925 0.5 Asphalt -- Subgrade Heavy clay
P18 6.5 7.0 925 0.5 Asphalt -- Subgrade Heavy clay
P19 6.75 7.5 915 1.25 Asphalt -- Subgrade Heavy clay
P20 6.25 7.1 910 Subgrade Heavy clay 1.0
* If thickness <3.0 in., correction factor 1.0.
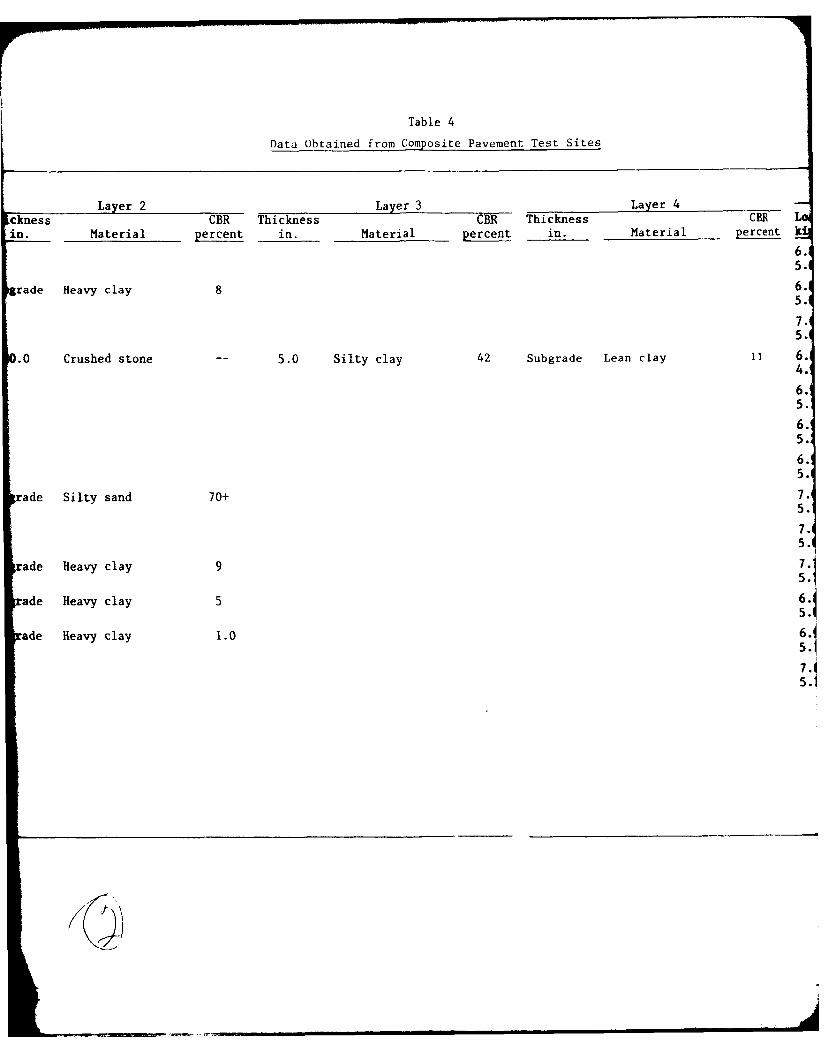
Table 4
Data Obtained from Composite Pavement Test Sites
Layer 2 Layer 3 Layer 4ckness CBR Thickness CBR Thickness CBR
in. Material percent in. Material percent in. Material percent k
6.5.
trade Heavy clay 8 6.5.
7.5.
).0 Crushed stone 5.0 Silty clay 42 Subgrade Lean clay II 6.4.
6.5.
6.5.
6.5.
trade Silty sand 70+ 7.5.
75.
rade Heavy clay 9 7.1
ade Heavy clay 5 6
ade Heavy clay 1.0 6.17.4
5.1a ey l
tU

Temperature DataNondestructive Data Surface +
5-Day 5-Day Temperature Measured Corr ,tedCBR Load 0 18 30 A4 8 Surface Mean Mean Correction DSM
percent kips mils mils mils mils OF OF OF Factor* kips/ikn. i t,/a6.87 8.7 5.8 4.2 2.1 95.0 61.7 156.7 1.07 659 J55.09 6.0 4.0 2.9 1.5
6.86 4.5 4.2 3.0 2.4 86.7 63.7 150.4 1.05 1300 ,5.04 3.1 2.9 2.2 1.77.08 7.4 4.7 3.5 2.2 66.0 62.4 128.4 0.97 800 -65.08 4.9 3.3 2.5 1.6
11 6.86 3.8 3.1 2.7 2.0 73.0 62.4 135.4 1.01 17094.98 2.7 2.2 1.9 1.56.98 3.0 1.8 1.2 0.9 98.2 73.1 171.3 1.16 1790 2L765.19 2.0 1.2 0.9 0.66.95 5.8 5.1 4.2 3.5 89.5 73.1 162.6 1.00 1088 h5.21 4.2 3.7 3.0 2.56.99 4.1 2.9 2.5 2.1 103.0 73.1 176.1 1.17 1477 285.07 2.8 2.0 1.7 1.57.04 5.0 3.7 2.9 2.3 92.4 73.1 365.5 1.11 127 '.135.13 3.5 2.6 2.0 1.6
7.00 3.3 2.4 1.9 1.5 95.1 73.1 168.2 1.14 1960 45.04 2.3 1.7 1.3 1.07.13 5.5 4.3 3.6 2.9 97.5 73.1 170.6 1.16 11765.13 3.8 3.0 2.5 2.06.89 5.7 4.5 3.8 3.1 91.5 73.1 176.1 1.19 1156 b
5.04 4.1 3.3 2.8 2.36.98 7.7 6.3 5.4 4.6 114.0 73.1 187.1 1.26 8o05.14 5.4 4.4 3.9 3.37.04 5.0 4.2 3.5 3.0 87.0 73.1 166.9 1.14 ?,5.18 3.6 3.1 2.6 2.2

LM . Nn N N Ln 00-40
C~~~~1 C' 00N ~ 0
4 J-
Mo kn- N 0 00 ? ct) cn 00W L0%%.C
-4 -4 -4
.44:j (Vn in) N W Ln 0 4 i) LM0 N
41 \D Lt' ?L) 0n '0 0 N 0 % % 0 4
41r4
w '0 N- N in0 -0 N r4 M 4 4 NCAQ U30 -4 0 0 0 0 co O I- It at) 00co04
- -4 -4
E4 J00
4
0) 0014 t 4 4 wt 0 0% r- w% c-4 0% '-
01 o 4 as %0 W) C\ 4 -It) r- 0-- 4-4-4 1 M . I n n f
414
Ii 010 - o Lm r 40 G
Do. 04 0 > U 93 4 $4 1
~.'0 0 0 0 0t z~ 0 4 . 4 =.
m0 4 0 N 1 m' 400 .a '-4 .-4 c') N
-4 4 -44 -4
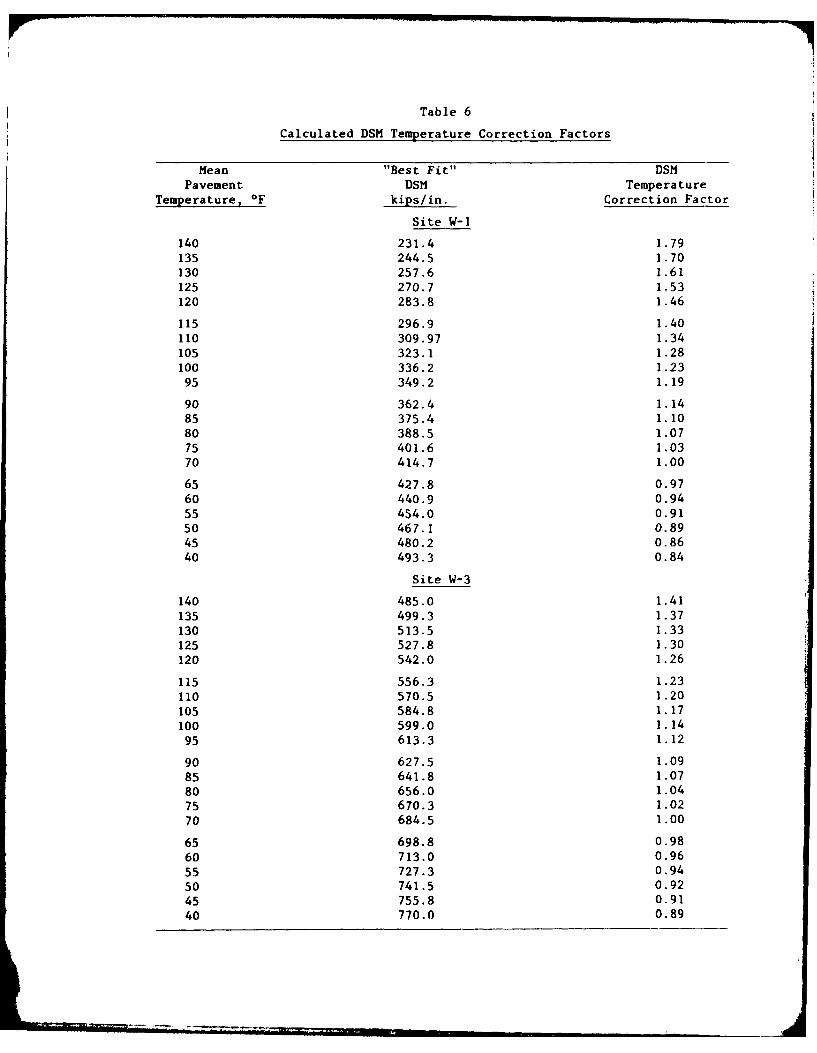
Table 6
Calculated DSM Temperature Correction Factors
Mean "Best Fit" DSMPavement DSM Temperature
Temperature, *F kips/in. Correction Factor
Site W-1
140 231.4 1.79135 244.5 1.70130 257.6 1.61125 270.7 1.53
120 283.8 1.46
115 296.9 1.40110 309.97 1.34105 323.1 1.28100 336.2 1.23
95 349.2 1.19
90 362.4 1.1485 375.4 1.1080 388.5 1.0775 401.6 1.0370 414.7 1.00
65 427.8 0.97
60 440.9 0.94
55 454.0 0.9150 467.1 0.8945 480.2 0.8640 493.3 0.84
Site W-3
140 485.0 1.41135 499.3 1.37130 513.5 1.33125 527.8 1.30120 542.0 1.26
115 556.3 1.23110 570.5 1.20105 584.8 1.17100 599.0 1.1495 613.3 1.12
90 627.5 1.0985 641.8 1.07
80 656.0 1.0475 670.3 1.02
70 684.5 1.00
65 698.8 0.98
60 713.0 0.96
55 727.3 0.94
50 741.5 0.92
45 755.8 0.9140 770.0 0.89

Table 7
Equivalency Factors to Convert Pavements
to Equivalent Subbase*
Material Equivalency Factor
AC 2.30
Crushed stone (100 CBR) 2.00
Stabilized gravel 2.00
Stabilized sand 1.50
Unbound granular material 1.00
Subbase 1.00
* Reference: TM 5-822-5, para 7-5.
Table 8
Relationship Between Flexible Pavement Design
Index and Equivalent Passes of the Standard
Axle Loading
Equivalent 18,000-lb
Design Index Axle Load Passes
1 3,100
2 13,500
3 59,000
4 260,000
5 1,150,000
6 5,000,000
7 22,500,000
8 100,000,000
9 440,000,000
10 2,000,000,000
Adapted from U. S. Army Engineer Waterways ExperimentExperiment Station Technical Report 3-582, Aug 1961.
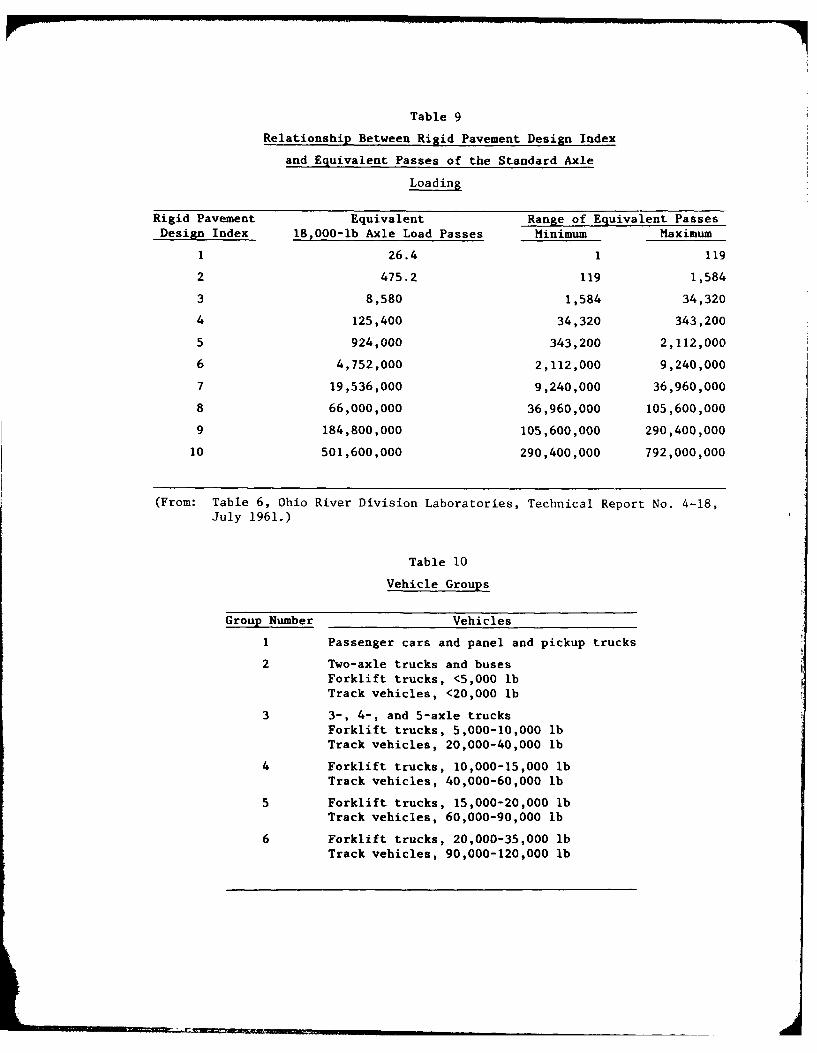
Table 9
Relationship Between Rigid Pavement Design Index
and Equivalent Passes of the Standard Axle
Loading
Rigid Pavement Equivalent Range of Equivalent PassesDesign Index 18,000-lb Axle Load Passes Minimum Maximum
1 26.4 1 119
2 475.2 119 1,584
3 8,580 1,584 34,320
4 125,400 34,320 343,200
5 924,000 343,200 2,112,000
6 4,752,000 2,112,000 9,240,000
7 19,536,000 9,240,000 36,960,000
8 66,000,000 36,960,000 105,600,000
9 184,800,000 105,600,000 290,400,000
10 501,600,000 290,400,000 792,000,000
(From: Table 6, Ohio River Division Laboratories, Technical Report No. 4-18,July 1961.)
Table 10
Vehicle Groups
Group Number Vehicles
1 Passenger cars and panel and pickup trucks
2 Two-axle trucks and busesForklift trucks, <5,000 lbTrack vehicles, <20,000 lb
3 3-, 4-, and 5-axle trucks
Forklift trucks, 5,000-10,000 lbTrack vehicles, 20,000-40,000 lb
4 Forklift trucks, 10,000-15,000 lbTrack vehicles, 40,000-60,000 lb
5 Forklift trucks, 15,000-20,000 lbTrack vehicles, 60,000-90,000 lb
6 Forklift trucks, 20,000-35,000 lbTrack vehicles, 90,000-120,000 lb

.0*ll E.- >
W 4 0 0~
o o
oo
> a
w ~ ~~ - 'o I oNQ
o w o
04140
w o. 04 0m
0'
I., (.
w v. to -
aa
o .U MO
- 0 0-40n
14 4 (1.1N4 co
o~~ 0c4 ~ ..
-4 14
'1 1-.o 0 0 0
m In Go 4

Table 12
Equivalent Operations Factors for Vehicle Groups
Group Vehicle Equivalent Operations Factor
1 Passenger cars and panel and pickup 0.025
trucks
2 Two-axle trucks and buses 3.5Forklift trucks, 5 kipsTrack vehicles, 20 kips
3 3-, 4-, and 5-axle trucks 8.2Forklift trucks, 5-10 kipsTrack vehicles, 20-40 kips
4 Forklift trucks, 10-15 kips 0.36
Track vehicles, 40-60 kips 29.0 29.0*
5 Forklift trucks, 15-20 kips 1.3Track vehicles, 60-90 kips 480.0 480.0*
6 Forklift trucks, 20-35 kips 52.0Track vehicles, 90-120 kips 5,700.0 5,700.0*
If no breakdown between forklift trucks and track vehicles is available
use the equivalent operations factor for the track vehicle.

APPENDIX A
EXAMPLE EVALUATION AND OVERLAY DESIGN, FLEXIBLE PAVEMENTS
A]

Required Information and Test Data
1. A nondestructive pavement evaluation and overlay design are to be
made on a section of roadway for the following conditions:
Pavement structure
Layer Material Thickness, in.
Surface Asphaltic concrete 3.0
Base Crushed stone 6.0
Subbase Clay gravel 6.0
Subgrade Lean clay
Traffic data (Daily traffic obtained from traffic count)
Group Vehicle Type Average Daily Traffic/Lane
1 Passenger car and panel and pickup 100trucks
2 2-axle trucks and buses 10Forklift trucks, <5 kips 0Track vehicles, <20 kips 0
3 3-, 4-, and 5-axle trucks (40-kip 35gross weight)
Forklift trucks, 5-10 kips 0Track vehicles, 20-40 kips (25-kip I
gross weight)
4 Forklift trucks, 10-15 kips (15-kip Igross weight)
Track vehicles, 40-60 kips 0
Convert current traffic
to standard axle load passes
2. The current average daily traffic is converted to equivalent standard
axle load passes using the equivalent operation factors in Tables 11 and 12,
main text.
A2

Equivalent StandardOperations Axle Load
Group Vehicle Type Vehicles/Day Factor Passes
I Passenger cars and panel and 100 0.025* 2.5pickup trucks
2 2-axle trucks 10 3.5* 35
3 3-, 4-, and 5-axle trucks 35 11.0* 385(40-kip gross weight)
Forklift trucks, <5 kips 0Track vehicles, <20 kips 0
4 Forklift trucks, 10-15 kips 1 0.43* 0.4(15-kip gross weight)
Track vehicles, 40-60 kips 0
Total equivalent standard axle load passes 423
Current daily traffic number = CDTN = 423.
* Equivalent operations factor from Table 12.
Equivalent operations factor from Table 11.
Estimate of future
traffic for overlay design
3. Based on a recent traffic-volume study it is estimated that
5,000,000 equivalent standard axle load passes will use this roadway in the
next 20 years.
Test data
4. The NODET test data obtained on the roadway are transferred from the
data tape to the NODET flexible pavement data sheet as shown in Figure Al.
Notice that two lines are required for each test location on this data sheet.
The 7-kip load data are normally recorded on the first line and the 5-kip data
recorded on the second line.
Calculation of
temperature correction factor
5. The DSM temperature correction factor is calculated as shown in
Figure A2 and placed in the appropriate column of the NDT data sheet.
DSM calculation and
correction for temperature effects
6. The DSM is calculated from the NODET load-deflection data and
recorded in the proper column of the data sheet. Each DSM value is then
multiplied by the DSM temperature correction factor to obtain the corrected
A3

a.i: c
- - - - - - - -
4 0
010N . ' ' - - - - - -
, I
m >1 w~ a T
4, r0'.u
c u I
w m-m
e - 4 . .'t it -4-
0.0
CAx
-Z-
to 0.
CA
o s,
j '4
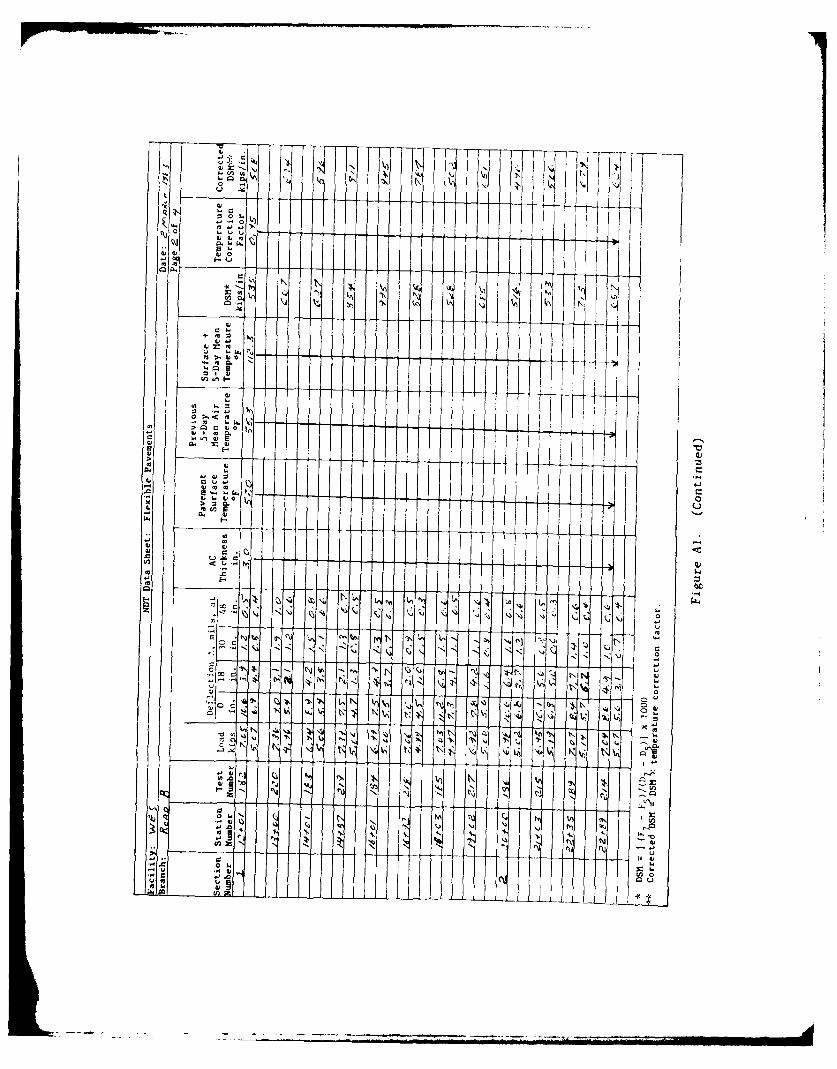
0 .1 -0
41 0
m - - - - - - - - - - - -
-~ - - - - -l-
W
~,u6
6)6
am 'A
., - -, 4u.6
- --. - .m-----------------

ut
4j 0a Ij U
0 4
I'I
+ 4
4u~
cl oJ

u.A
(1I 41
Ea w
9N
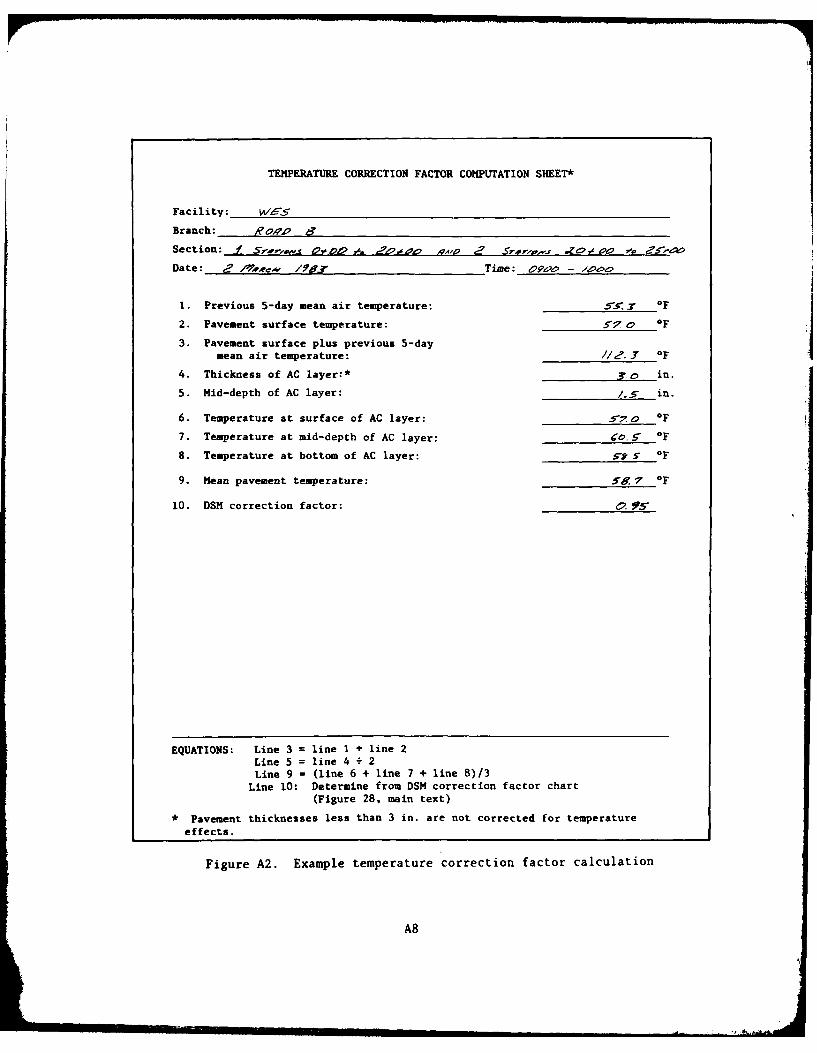
TEMPERATURE CORRECTION FACTOR COPUTATION SHEET*
Facility: WE5
Branch: v' Oap .
Section: I ppvr.w- Oebs,. 0.'00-A/ ' Z'00
Date: / 7rec /78"r Time: 09a0 - /000
1. Previous 5-day mean air temperature: O'.5 F
2. Pavement surface temperature: r7o OF
3. Pavement surface plus previous 5-daymean air temperature: //2. Y -F
4. Thickness of AC layer:* 3o in.
5. Mid-depth of AC layer: /.5 in.
6. Temperature at surface of AC layer: O 0 F
7. Temperature at mid-depth of AC layer: -157 OF
8. Temperature at bottom of AC layer: £7. 5 OF
9. Mean pavement temperature: 587 0 F
10. DSH correction factor: .9
EQUATIONS: Line 3 = line I + line 2Line 5 = line 4 2Line 9 = (line 6 + line 7 + line 8)/3
Line 10: Determine from DSM correction factor chart(Figure 28, main text)
* Pavement thicknesses less than 3 in. are not corrected for temperature
effects.
Figure A2. Example temperature correction factor calculation
A8

DSH, which is recorded in the last column of the data sheet.
Selecting representative DSM values
7. The temperature corrected DSM values are plotted in profile form as
shown in Figure A3. The mean DSM and standard deviation for Section I is
calculated and marked on the DSM profile. The DSM values for Section 2 are
variable, and this section was divided into four subsections based on the
relative DSM values. The mean DSM and standard deviation for each subsection
were calculated and marked on the DSM profile.
Evaluation of Existing Pavement, Section I
Determine number of allowable standard axle load passes (ASALP)
8. The mean DSM minus one standard deviation (x - a) for Section 1 is
525 kips/in.
ASALP = antilog 10.0169 x (DSM) - 0.2919] (8, main text)
ASALP = antilog [0.0169 x (525) - 0.2919]
ASALP = antilog [8.5806]
ASALP = 3.81 x 10⁸ passes
Convert to allowable daily traffic number (ADTN)
ASALP7,300
3.81 x 1087,300
ADTN = 52,153
Compare ADTN with current daily traffic number (CDTN)
Is ADTN > CDTN?
ADTN = 52,153 > CDTN = 423
Yes, pavement is adequate
A9

ib
-cr m
ww
a~
IL _
0
Uix b z 0Zz
ix b bCID
cmrF ~V(0 N CO 4
ix b4 b4 (nL
HON I/Sd>N HWSO
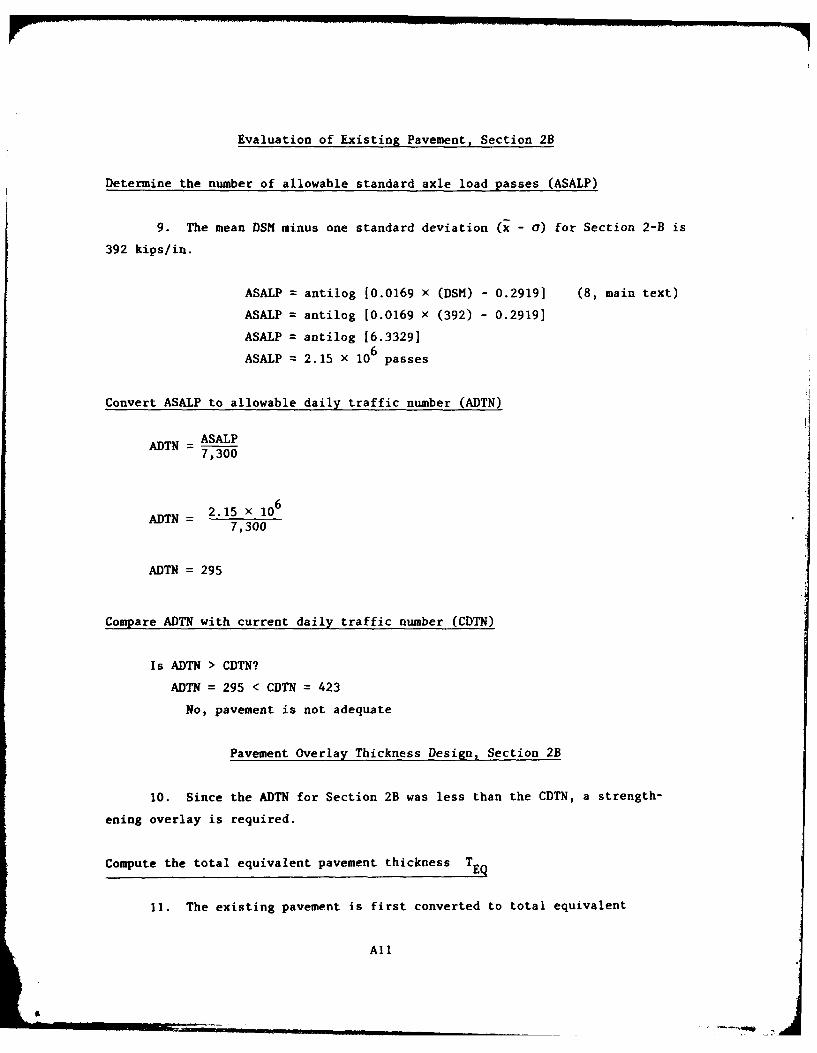
Evaluation of Existing Pavement, Section 2B
Determine the number of allowable standard axle load passes (ASALP)
9. The mean DSM minus one standard deviation (x - a) for Section 2-B is
392 kips/in.
ASALP = antilog [0.0169 x (DSM) - 0.2919] (8, main text)
ASALP = antilog [0.0169 X (392) - 0.2919]
ASALP = antilog [6.3329]
ASALP = 2.15 x 10⁶ passes
Convert ASALP to allowable daily traffic number (ADTN)
= ASALP7,300
= 2.15 x 10⁶
7,300
ADTN = 295
Compare ADTN with current daily traffic number (CDTN)
Is ADTN > CDTN?
ADTN = 295 < CDTN = 423
No, pavement is not adequate
Pavement Overlay Thickness Design, Section 2B
10. Since the ADTN for Section 2B was less than the CDTN, a strength-
ening overlay is required.
Compute the total equivalent pavement thickness TEQ
11. The existing pavement is first converted to total equivalent
All

subbase Ts , using the appropriate equivalency factors selected from
Table 7 (main text).
EquivalentThickness Equivalency Subbase Thickness
Material in. Factor in.
AC 3.0 X 2.30 = 6.90
Crushed stone 6.0 x 2.00 = 12.00
Clay gravel 6.0 x 1.00 = 6.00
T = 24.90s
12. The total equivalent subbase thickness (inches), T = 24.90 , iss
then converted to the total equivalent pavement section thickness TEQ
TEQ = Ts - 8.55 (3, main text)
TEQ = 24.90 - 8.55
T = 16.35 in.
Determine the required pavement thickness TR
13. Enter the design curves (Figure 32) with the number of allowable
SAL passes (ASALP = 2.15 x 10⁶) and the equivalent thickness (TEQ = 16.35 in.)
to determine the effective subgrade CBR.
CBR = 5.7
14. Reenter the design curves (Figure 32) with the estimated future
traffic (5,000,000 passes) and the 5.7 CBR to determine the required thick-
ness Tr
T = 17.2 in.r
A12

Compute the overlay thickness required
T T r TEQ (13)o 2.30
T 17.2 - 16.35 0.85
o 2.30 2.3
T = 0.37 in.0
Use T 0 1.5 in. minimum recommended overlay
A13

I
APPENDIX B
EXAMPLE EVALUATION AND OVERLAY DESIGN, RIGID PAVEMENTS
BI

Required Information and Test Data
1. A nondestructive pavement evaluation and overlay design are to be
made on a section of roadway for the following conditions:
Pavement structure
Layer Material Thickness, in.
Surface PCC 8
Base Clay gravel 6
Subgrade Sand clay --
Traffic data, (Dailytraffic obtained from traffic count)
Average DailyGroup Vehicle Type Traffic/Lane
1 Passenger car and panel and pickup 100trucks
2 2-axle trucks and buses 10Forklift trucks, <5 kips 0Track vehicles, <20 kips 0
3 3-, 4-, and 5-axle trucks 35Forklift trucks, 5-10 kips 0Track vehicles, 20-40 kips 1
4 Forklift trucks, 10-15 kips (15-kip 1gross weight)
Track vehicles, 40-60 kips 0
Convert current traffic
to standard axle load passes
2. The current average daily traffic is converted to equivalent
standard axle load passes using the equivalent operation factors in Tables 11
and 12, main text.
B2
II 4
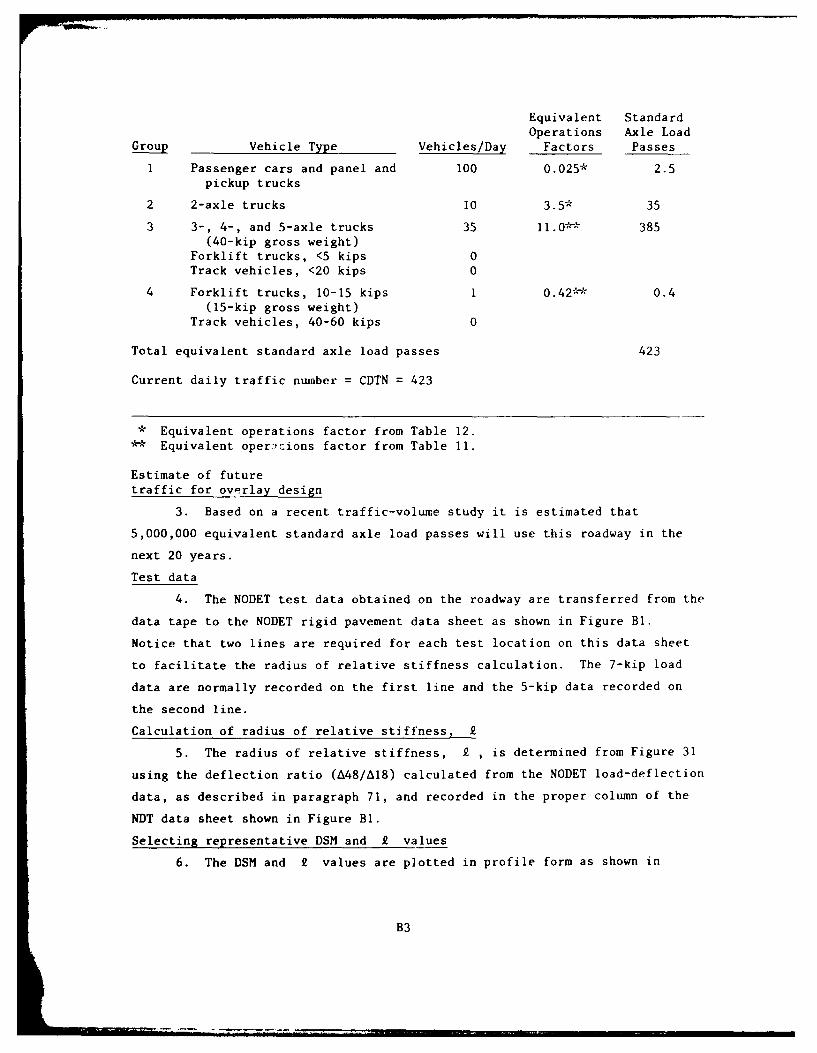
Equivalent StandardOperations Axle Load
Group Vehicle Type Vehicles/Day Factors Passes
1 Passenger cars and panel and 100 0.025* 2.5
pickup trucks
2 2-axle trucks 10 3.5* 35
3 3-, 4-, and 5-axle trucks 35 11.01 385(40-kip gross weight)
Forklift trucks, <5 kips 0Track vehicles, <20 kips 0
4 Forklift trucks, 10-15 kips 1 0.42* " 0.4(15-kip gross weight)
Track vehicles, 40-60 kips 0
Total equivalent standard axle load passes 423
Current daily traffic number = CDTN = 423
* Equivalent operations factor from Table 12.
Equivalent oper.:, ions factor from Table 11.
Estimate of future
traffic for overlay design
3. Based on a recent traffic-volume study it is estimated that
5,000,000 equivalent standard axle load passes will use this roadway in the
next 20 years.
Test data
4. The NODET test data obtained on the roadway are transferred from the
data tape to the NODET rigid pavement data sheet as shown in Figure BI.
Notice that two lines are required for each test location on this data sheet
to facilitate the radius of relative stiffness calculation. The 7-kip load
data are normally recorded on the first line and the 5-kip data recorded on
the second line.
Calculation of radius of relative stiffness, k
5. The radius of relative stiffness, £ , is determined from Figure 31
using the deflection ratio (A48/A18) calculated from the NODET load-deflection
data, as described in paragraph 71, and recorded in the proper column of the
NDT data sheet shown in Figure BI.
Selecting representative DSM and £ values
6. The DSM and £ values are plotted in profile form as shown in
B3
Ii AD-A145 039 NONDESTRUCTIVF VIBRATORY TESTING AND EVALUATIONPROCEDURE FOR MILIARY RD.U) ARMY ENGINEER WATERWAYEXPERIMENT STATION VICKSBUJRG MS GED E. D M COLEMAN
UNC ASSD U 4WES MPD 0G2 N
So84

IIIJIIL25
MfCROCOPY RESOLUTION TEST CHART

4) 0 0)
>.
cu (L
u '4-I
Gic 41
4..
00)
41\ .''0 u 19 ,
a %.
0 Q~~4 U).'.
Z *-.~%N~ N"h~N ~j< ~z N' 14-j
-- -- --
w" *4td ~ N ~ .
Vl W

to __ _ ---m- - I
E 0
r= ,
0 0
4=,ft %n r4i F1 ~ ii0 0
- IC
t'j C" %C\n N N N m4
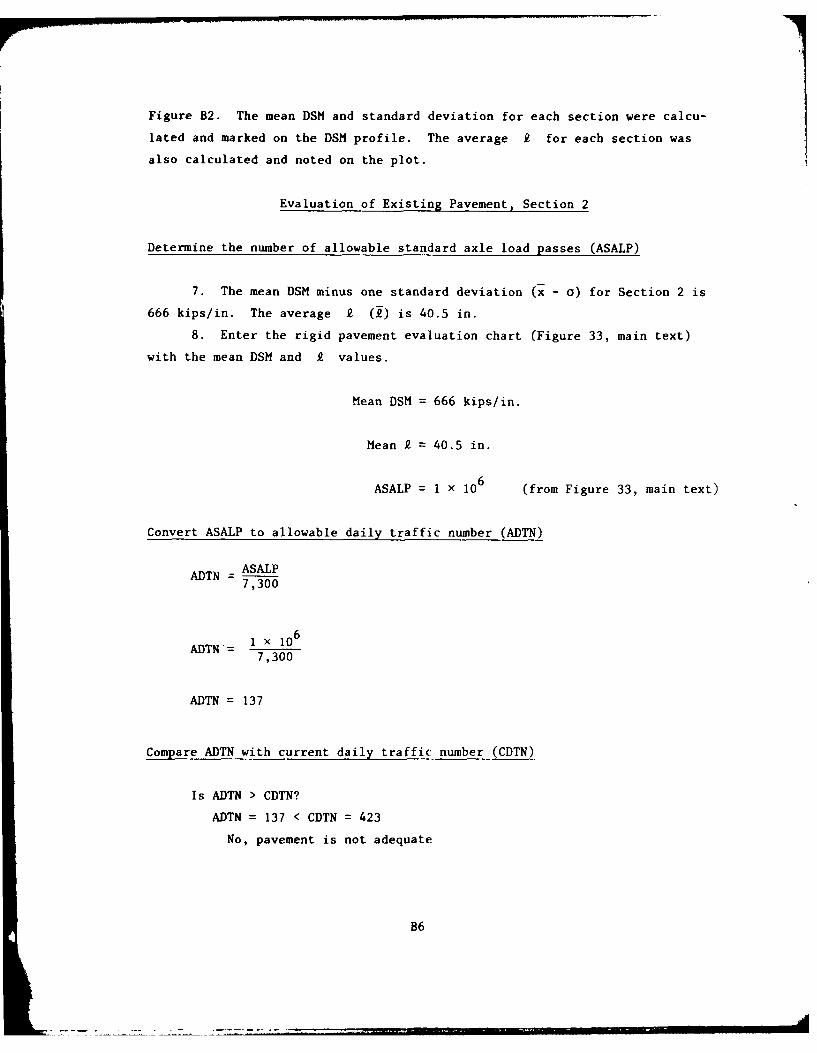
Figure B2. The mean DSM and standard deviation for each section were calcu-
lated and marked on the DSM profile. The average k for each section was
also calculated and noted on the plot.
Evaluation of Existing Pavement, Section 2
Determine the number of allowable standard axle load passes (ASALP)
7. The mean DSM minus one standard deviation (x - Y) for Section 2 is
666 kips/in. The average R (2) is 40.5 in.
8. Enter the rigid pavement evaluation chart (Figure 33, main text)
with the mean DSM and £ values.
Mean DSM = 666 kips/in.
Mean 2 = 40.5 in.
ASALP = I x 106 (from Figure 33, main text)
Convert ASALP to allowable daily traffic number (ADTN)
ADTN -ASAP7,300
A D T N ' -
7,300
ADTN = 137
Compare ADTN with current daily traffic number (CDTN)
Is ADTN > CDTN?
ADTN = 137 < CDTN = 423
No, pavement is not adequate
B6

BRANCH, MISSOURI ROAD1500-
1400-
1200- 817
1M" 151
a-135 F-f--
81231
U
k
(no6 00
w __
6002 -l-4i
400-20 - 50 5
qw
,.._ ._.-" , 5200,- ---\-"i--,,. -- LLW u ,
0 SECTION 1 SECTION 2
0 2 4 6 8 10 12 14 1BSTATIONS. HO. FT.
Figure B2. Example DSM profile, rigid pavement
B7

Pavement Overlay Thickness Design, Section 2
9. Since the ADTN for Section 2 is less than the CDTN, a strengthening
overlay is required. The overlay design may be for an AC overlay or a PCC
overlay.
Determine the required pavement thickness, hd
10. Enter the rigid pavement design chart (Figure 34, main text) with6
the existing thickness of 8 in. and the number of allowable passes, 1.0 x 10⁶Move vertically to the estimated future pass level, 5 x 10 passes, and deter-
mine the required thickness, hd .
hd = 8.6 in.
Check the flexural strength
11. Compute the modulus of subgrade reaction, k , for the 8-in. pave-
ment thickness and the 40.5-in. radius of relative stiffness.
k = 341005.97 (h)3 (14, main text)(k x 0.7)
4
k = 341005.97 (8) 4(40.5 x 0.7)
k = 270 pci
12. Use the rigid pavement design chart to check the flexural strength.
Enter: with the existing thickness, 8 in., move to the allowable pass level,
1.0 x 10 , then -ove vertically to the k determined above (270), then left
to the flexural strength.
R = 512 psi
B8

13. The flexural strength is within the expected ranges.
Compute thickness of flexible overlay
14. The required AC overlay (t0 ) is computed as follows:
to = 2.5 (Fhd - Cbh) (15, main text)
t = 2.5 [(0.92)(8.6) - (0.90)(8.0)]o
t = 2.5 [7.91 - 7.210
t = 2.5 (0.71)0
t = 1.8 in.0
Use 4.0 in. in accordance with TM 5-822-6, para-
graph 13.8.3 (Headquarters, Department of the
Army 1977).
where F = 0.92 from Figure 35 and Cb = 0.90
Compute thickness of rigid overlay
15. The thickness of PCC overlay to be placed directly on the existing
rigid pavement is computed in the following manner:
h 1.4 1(h 14 4(h)4ho hd)~ -C r
h° = 1.4 (86)1.4 - (0.75)(8)1.4
h = 3.8 in.0
Use 6.0 in. in accordance with TM 5-822-6, para-
graph 13.4.2 (Headquarters, Department of the Army
1977).
where C = 0.75
r
B9

Compute thickness of rigid overlay with a leveling or bond-breaking course
ho= Vh2 -C h 2d r
ho = (0-75) (8)2
h = 5.1 in.0
Use 6.0 in accordance with TM 5-822-6, para-
graph 13.4.2 (Headquarters, Department of the
Army 1977).
B1O

APPENDIX C
INSTRUCTION MANUAL FOR THE NODET
by
Darrell E. Elsea, Patrick S. McCaffrey, Jr.
Pavement Systems DivisionGeotechnical Laboratory
U. S. Army Engineer Waterways Experiment StationVicksburg, Mississippi
Cl

Background
1. Facility Engineers (FE's) are responsible for the maintenance, re-
pair, and rehabilitation of roads, streets, and airfields on Army installa-
tions. The ability to predict maintenance requirements and to evaluate load-
carrying capabilities of these pavements would improve the FE's efficiency
through proper allocation of available fundings.
2. To determine the load-carrying capability of these pavements, the
U. S. Army Facilities Engineering Support Agency has obtained a Model 2008
Road-Rater. The Road-Rator is an electrohydraulic (electronically controlled
hydraulic force generator) nondestructive test device, generally referred to
as the NODET. The NODET applies a vibratory sinusoidal force to the pavement
surface and measures the resulting response. The force is measured with three
load cells mounted on an 18-in.-diam plate that contacts the pavement surface.
Deflections are monitored with velocity sensors that measure velocity of the
pavement surface. These velocities are integrated electronically to produce
deflections.
3. The NODET is contained in a tandem-axle trailer which is towed by a
crew-cab pickup truck. A gasoline engine supports the hydraulic and electrical
systems. The force-generating system consists of a 4000-lb reaction mass,
three load cells, a hydraulic actuator, and air springs for equal load distri-
bution. Figure Cl is a schematic diagram of the force-generating system. A
digital control box is connected to the trailer with cables.
4. The NODET is designed to obtain load-deflection measurements of any
pavement surface accessible to it and the tow vehicle. After initial setup,
successive measurements can be made by the operator(s) without leaving the tow
vehicle.
Purpose and Scope
5. This instruction manual describes the operation, calibration, and
maintenance procedures for the NODET. It applies only to the operation of the
NODET device and does not contain methods for analyzing the data collected.
This manual is intended to supplement the owner's manuals for component parts
of the NODET.
C2

LOADINGACTUATORS
FRAMEWORK
MASAS VEHICLE
LADELLS LAR AINSRING
TEST SURFACE
Figure C . Schematic of the force-generating system
Digital Instrumentation System
6. The NODET digital instrumentation system console contains all the
initrumentation controls and readouts necessary for operation. The console
includes 16 pushbutton switches arranged in a four by four matrix. Each
switch is labeled with an identification of its function. The switch faces
are illuminated when active. A layout of the control console is shown in
Figure C2, and a description of each control switch is listed below.
SAFE
7. When depressed, this switch renders all operating functions in-
active and will automatically raise the force generator to its fully elevated
position. When depressed, the switch flashes green. When the switch is not
depressed and the force generator is in the fully elevated position, the
switch is lighted constantly green and a safety beeper within the console will
sound to indicate the SAFE switch is not engaged. When the force generator is
not fully elevated, this switch lamp is off, the UNSAFE switch glows red, and
C3

SAFTY 1BEEPER
POFt. N METERFORCE
CALIBaRATICA
SAA
FRE [CY FOE RATER RO, ,"INXC ,_
CONTROLR CONTROL
CONTROLIN COTO
TETJCS POTENTIOMETER POTENTIOMETERF
PRINTER
Figure C2. Layout of instrumentation control console
the beeper frequency increases. The SAFE switch should be depressed when mov-
ing the tow vehicle. Just above the switch matrix, there is an on-off switch
to make the beeper operational.
UNSAFE
8. This switch glows red any time the force generator is not fully
elevated. Depressing this switch will stop the automatic cycle at any point
and clear all system functions. When the UNSAFE switch is illuminated, the
tow vehicle should never be moved.
POWER
9. This switch, when depressed, glows white indicating the system is
active. When released, the system is off.
START
10. When depressed, this switch activates the engine starter.
DEFL. 1 through DEFL. 4
11. These switches, when depressed individually, glow white, indicating
that the panel meter display is the peak-to-peak deflection, in mils, of the
pavement surface at the location of the appropriate numbered velocity sensor.
C4

12. When depressed, this switch causes the system to scan and print
the following seven functions: (a) identification number, (b) frequency,
(c) force, (d) deflection 1, (e) deflection 2, (f) deflection 3, and
(g) deflection 4.
FORCE
13. When depressed, this switch glows white indicating the peak-to-peak
dynamic force, in kips, is displayed on the panel meter.
FREQ.
14. When depressed, this switch glows white indicating that the fre-
quency of dynamic loading, in Hertz, is displayed on the panel meter.
AUTO MODE
15. When depressed, this switch is staged for automatic operation, and
a cycle may then be initiated by depressing the CYCLE switch.
CYCLE
16. When in the automatic mode, depressing the CYCLE switch starts the
cycle sequence which (a) lowers the force generator, (b) activates the vibra-
tor to the preset levels of force and frequency, (c) scans and prints, and
(d) elevates the force generator to the safe (travel) position.
LOWER
17. This switch, when depressed and held, lowers the force generator.
RAISE
18. This switch, when depressed and held, raises the force generator.
VIBR.
19. This switch, when depressed, activates the hydraulic vibrator to
preset levels of force and frequency. It must be noted that before the VIBR.
switch is depressed the FORCE CALIBRATION switch, located in the center of
the console, must be in the RUN position.
Frequency knob (fre-
quency control potentiometer)
20. When the FREQ. switch is active, the frequency of the dynamic load-
ing is displayed on the panel meter. The force generator does not need to be
lowered nor vibrating to change frequency levels. Clockwise rotation of the
control increases frequency. The minimum frequency of the NODET is 5 Hz, and
the maximum frequency is 50 Hz.
C5

Force knob (force
control potentiometer)
21. This control is used to adjust the dynamic force. When the FORCE
switch is activated and the force generator is down and vibrating, the level
of peak-to-peak dynamic force input to the pavement surface is displayed on
the panel meter. Clockwise rotation of this control increases force. The
peak-to-peak (P-P) force output of the NODET ranges from 0 to 8,000 lb.
Digital printer
22. The printer provides a permanent record of the test data. The
printout format includes function identification, by channel number, as shown
below.
Function Channel No. Data Units
I. D. number 1 0036 --
Force 2 3.93 kips P-PFrequency 3 15.0 HertzDeflection 4 19.3 mils P-PDeflection 5 18.1 mils P-PDeflection 6 14.7 mils P-PDeflection 7 9.8 mils P-P
Printer ADVANCE-REMOTE-PRINT switch
23. The printer controls are operated by a toggle switch located on
the face of the printer. The switch is spring-centered in REMOTE position.
When in this position, the printer is controlled electronically from within
the console. When the switch is held in the ADVANCE position, the recording
paper advances to provide space for handwritten notes. When the switch is
pushed into the PRINT position, the single function displayed on the panel
meter will be printed.
Thumb-wheel switch
24. The four-digit thumb-wheel switch is set by the operator to provide
an identification number on the data printout. The setting will be printed
on channel 1 of the printout on activation of the PRINT switch.
Digital panel meter
25. The.panel meter provides a visual display of any of the test data,
except I. D. number, by depressing the switch identified with the parameter
of interest.
C6

Force calibration
26. The force calibration portion of the console was added by the
Instrumentation Services Division of WES to aid in the calibration of the
NODET. The force calibration will be discussed in detail later in this
manual.
Master switch
27. The electrical power is routed thro,.;h a master switch which must
be turned ON to enable the engine ignition and starter operation. This switch
is located inside the NODET trailer, in the front left corner near the engine
hour meter. The master switch should be turned off whenever the operator
leaves the NODET (with the engine off) for any long period of time. Failure
to turn off the master switch may result in a dead battery.
Test jacks
28. A monitor junction containing 19 test jacks is located on the lower
left on the control console. After removal of the dust cover, the following
parameters of interest can be monitored with the aid of a digital multimeter.
Identifi-
Test Jack cation Description
A Vi Raw signal from velocity sensor No. 1
B V2 Raw signal from velocity sensor No. 2
C V3 Raw signal from velocity sensor No. 3
D V4 Raw signal from velocity sensor No. 4
E F (input) Raw signal from load cells
F F (DC) Force signal to panel meter
G OSC (HI) Frequency signal from control box to themass actuator
H f (DC) DC frequency signal to panel meter
m DI (+)
K +5 VDC Power supply output
L GND Ground
M Dl (-)
P -15 VDC Power supply output
T +15 VDC Power supply output
V GND Ground
C7

Operational Preparation
29. All steps necessary to prepare the NODET for operation are described
below. Before beginning operation the trailer must be attached to a properly
prepared tow vehicle by hitch, safety chains, breakaway brakes, and electrical
connections for trailer and brake lights.
Control console hookup
30. Remove the console cover and place the console on its stand in the
floor of the tow vehicle. Attach the three control cables to their connectors
on the back of the console. Remove the control cable receptacle covers from
the rear of the tow vehicle and the front of the NODET and store them. (These
covers must be in place at all times when the truck-trailer interconnect cables
are not connected to prevent moisture from entering the NODET electrical sys-
tem.) Attach the truck-trailer interconnect cables to the connectors near the
truck bumper and the left front of the trailer, taking care to run the cable
through the cable clamps on the trailer tongue.
Velocity sensor hookup
31. The four velocity sensors are marked to indicate their relative
position on the NODET, with No. I being at the center of the force generator
contact plate. Screw sensor No. 1 into the top of the contact plate. The re-
maining three velocity sensors are suspended from the sensor positioning de-
vice under the rear center of the trailer, at distances of 18, 30, and 48 in.
from the center of the plate. Route the velocity sensor cables through the
force generator opening in the bottom of the trailer in such a manner that
they will not be damaged during the operation. A junction box is located in
the rear of the trailer just forward of the left side of the fuel tank. Remove
the dust covers from the connectors marked 1, 2, 3, and 4. Connect the ve-
locity sensor cables to their respective connector.
Engine preparation
32. Normal engine checks should be made prior to starting the NODET
engine. The fuel filler opening and fuel gage are both located on the tank
at the rear of the trailer. The engine is located in the front of the trailer
with the oil dipstick located on the right side of the engine. The hydraulic
fluid reservoir is located in the right front of the trailer. Engine fuel
and oil grades and hydraulic fluid specifications are given in the maintenance
portion of this manual.
C8
Starting the engine
33. Depress the POWER switch on the control console to its ON position.
Move both the master switch and ignition switch on the engine control panel
to the ON position. A choke control on the engine control panel can be used
if necessary. Start the engine by depressing either the START switch on the
control console or the starter button on the engine control panel. The choke
control, if used, should be pushed into its run position as soon as possible.
Allow the engine to run for 20 to 25 min to allow warmup of the hydraulic
fluid and electronics before calibrating force.
Air springs
34. The NODET has eight air springs. Six of these are used to center
the mass and transfer the dynamic force to the test surface. Figure C1 shows
the position of the air springs. Three are located above and three below the
mass. The upper air springs are manifolded together, as are the lower, to
equalize the pressure and to provide only two valves for pressurization.
Pressurize the lower set of air springs first, with the force generator in the
raised position with all pressure off the upper air springs. The lower air
springs are pressurized to 90 psi. After the lower air springs have been
pressurized, lower the force generator to the ground. With the force generator
in the down position, pressurize the upper air springs to 60 psi. Two
automotive-type air valves for pressurizing the upper and lower air springs
are located on the rear side of the force generator, along with an indicator
for determining the mass position. After the lower and upper air springs have
been pressurized to 90 and 60 psi, respectively, the reaction mass of the
force generator should be in the center position. Recommended pressure should
be maintained at all times for the NODET to work properly.
35. The two remaining air springs are located outboard of the force
generator on the bottom left and right. These two air springs allow some of
the trailer static weight to be transferred to the force generator and minimize
vibrator feedback to the trailer. Each of these two air springs has its own
air valve, located to the left and right of the force generator, and should be
inflated at 40 to 50 psi (45 psi). Figure C3 shows the location of the air
valves for pressurizing the air springs.
36. A 12-volt DC-powered air compressor is mounted in the rear of the
trailer. It is switch-controlled directly off the engine battery. It
C9

Figure C3. Location of air spring pressurization valves:(1) left outboard, (2) upper mass, (3) lower mass,
(4) right outboard
should not be used unless the engine is running and should be turned off when
pressurization of the air springs is complete.
Force Calibration
37. The force calibration of the NODET is very important for accurate
pavement load and displacement measurements. The NODET was calibrated at WES
by using three BLH load cells sandwiched between two 18-in.-diam steel plates.
The NODET was then placed over this sandwich construction and run at frequency
ranges of 5 to 50 Hz at 3,000 lb peak to peak. From these data, the value for
force calibration is established.
Field force calibration procedures
38. The force calibration on the console has a three-position switch,
which is labeled RUN, ZERO, and GAIN. To calibrate the force, the force
generator must be in the SAFE position, and the engine should have been
running 20 to 25 min. After the warmup period is complete, the following
CIO

steps must be taken for proper calibration:
a. Depress the FORCE switch on the control console to displayforce calibration values on the panel meter.
b. With the FORCE CAL. switch in the RUN position, the panel meterdisplays a value of 0.00 to 0.03. This value is the dynamicforce output in the SAFE position.
c. Set the FORCE CAL. switch to the ZERO position. The value onthe panel meter should be the same as in Step b above. Ifthere is a difference, a new ZERO value must be set. To dothis, turn the ZERO trimpot one way or the other with a smallscrewdriver. Bring the panel meter reading toward 0.00; thisis a nulling zero. The best calibration accuracy is with thetrimpot turned as far clockwise as possible and still obtain avalue of 0.00.
d. Set the FORCE CAL. switch to the GAIN position. To set theforce amplified gain, adjust the GAIN trimpot until the panelmeter reads the laboratory calibration value of 9.70. Thisvalue is printed on the console above the panel meter. Thisvalue should be checked at WES annually.
e. Set the FORCE CAL. switch to the RUN position.
After these steps have been completed, the force system is calibrated. These
values should be checked several times a day, usually at midmorning, noon, and
midafternoon.
Velocity Sensor Calibration
39. The velocity sensors were calibrated at WES by using a calibrated
shake table. Each sensor was vibrated at known deflections, and the NODET
electronics were adjusted to that deflection. The calibration of the velocity
sensors should be checked at WES at regular intervals of 6 months or 600 oper-
ating hours, whichever comes first.
40. No field calibration procedure exists for the velocity sensors.
One method of quickly checking the velocity sensors in the field is to place
the sensors side by side on the contact plate. Then actuate the vibrator and
monitor the deflection values. All velocity sensors should produce approxi-
mately the same deflections.
41. The velocity sensors are delicate instruments and should be de-
tached and stored when the NODET is being transported.
Cli

Maintenance
Engine
42. The NODET is equipped with a Kohler Model K532, two-cylinder air-
cooled engine. For details of the service schedule, the operator should con-
sult the manufacturer's owner's manual. The operator should keep a log
noting the date that maintenance or any other type of work is performed on
the NODET. Original copies of the owner's manuals should be on file at the
operators office, and copies of these manuals should be kept in the tow vehi-
cle, assuming that the same tow vehicle will be used at all times.
Alternator
43. The NODET is equipped with an Onan alternator. For general in-
formation and the parts list, see the owner's manual.
Hydraulic fluid
44. The hydraulic fluid used in the NODET must meet the specification,
Mil H5606. This is an aircraft hydraulic fluid with a red petroleum base.
NO OTHER TYPE OF HYDRAULIC FLUID SHOULD BE USED. Damage will result if
hydraulic fluid is substituted. Most airports or airfields have Mil H5606
hydraulic fluid.
45. The hydraulic system is equipped with a disposable filter and a
pressure indicator located in the left front corner above the battery. The
pressure indicator reads 0 psi when the filter is clean. As the pressure
reaches 10 psi or after 100 hours of operation, the filter should be changed.
The filter is the UCC brand, part No. UC-MS-1518-4-10.
Step-by-Step Setup Checklist
46. A step-by-step setup checklist is provided below for the conve-
nience of the operator. Paragraph numbers indicate where detailed information
may be found.
a. Connect the trailer to the tow vehicle and attach the safetychains, breakaway brakes, and electrical connections for thetrailer and brake lights (paragraph 30).
b. Attach the three control cables to their connectors in the backof the control console (paragraph 30).
c. Attach the truck-trailer interconnect cables to the connectorson the truck bumper and the left front of the trailer(paragraph 30).
C12

d. Attach the four velocity transducers in their proper positionsto the transducer positioning device under the rear center ofthe trailer. Connect the velocity transducer cables to theproper connector on the junction box located in the left rearof the trailer (paragraph 31).
e. Make normal engine checks including fuel, engine oil, andhydraulic fluid (paragraph 32).
f. Turn on NODET POWER switch and engine master switch(paragraph 33).
g. Start the engine and run for 25 min to allow warmup of thehydraulic fluid and electronics (paragraph 33).
h. Remove locking pins.
i. Pressurize outboard air springs to 45 psi (paragraphs 34-36).
j. Release pressure from upper air springs (left valve) andpressurize lower air springs (right valve) to 90 psi(paragraphs 34-36).
k. Lower force generator and pressurize upper air springs to60 psi (paragraphs 34-36).
1. Perform force calibration with force generator fully elevatedand in SAFE position (paragraphs 37-38).
Instructions for Using the Bidirectional Distance-Measuring Instrument
47. The NODET tow vehicle is equipped with a Nu-Metrics distance-
measuring instrument (DMI) to accurately determine test locations. The DMI
display and operating switches are located below the dash just to the right
of the driver.
48. The DMI installed in the NODET tow vehicle is a precision elec-
tronic instrument designed for computing and displaying measurement data from
mobile vehicles. To measure the distance traveled, sensing targets (which arf
attached to the tow vehicles front wheel rim) move past a sensing head cre-
ating electrical pulses. These pulses are conveyed to the DMI via an elec-
trical cable where they are processed and displayed.
Functional controls
49. The DMI has four pushbutton switches, two toggle switches, and a
series of four thumb-wheel switches. The functional control switches are:
ON/OFF - Input power switch. This switch turns theunit on and off.
HOLD - Holds all displayed data and stops the count.
C13

RESET - Returns the display to zero.
BI-DIR - The bidirectional switch in the out positionallows the unit to count additively. Whenthe switch is depressed the unit countssubtractively.
DATA - The data toggle switch is used for enteringdata via the thumb-wheel switches.
SENSOR ON/OFF - This toggle switch located on the lower dashto the left of the driver is used to activatethe sensing head.
THUMB-WHEEL SWITCHES - The thumb-wheel switches located on the DMIunit are used for calibrating the DMI andfor entering data.
Operation
50. General. The electronic distance-measuring instrument installed
in the NODET tow vehicle is easy to operate. When using the DMI the distance,
in feet, along the street can be measured starting from zero at some reference
point, or a preestablished station number can be input into the system.
51. The steps involved in using the DMI are:
a. Check to make sure the correct calibration program number isset in the thumb wheels (see Calibration).
b. Turn on the unit and sensing head switches.
c. With the tow vehicle stationary, press the reset switch toclear the display.
d. Depress the HOLD switch to keep the display at zero.
e. Upon reaching the point where measurement is to begin, stop the
front bumper, driver's door, center of the NODET wheels, orother convenient reference over the beginning point.
f. Release the HOLD switch and move forward. The display shouldnow be counting additively.
g. When the end of the section to be measured is reached, depressthe HOLD switch to stop the count.
52. Using bidirectional switch. The bidirectional switch permits dis-
tances to be subtracted from the displayed measurement. To activate the bi-
directional feature press the BI-DIR switch. The display should now count
subtractively as the vehicle moves forward. Remember to release the BI-DIR
switch when you are ready to count additively again.
53. Using data entry. The data entry toggle switch along with the bi-
directional switch allows arbitrary distances, such as a manually measured
distance, to be added or subtracted from the display. The data entry function
C14
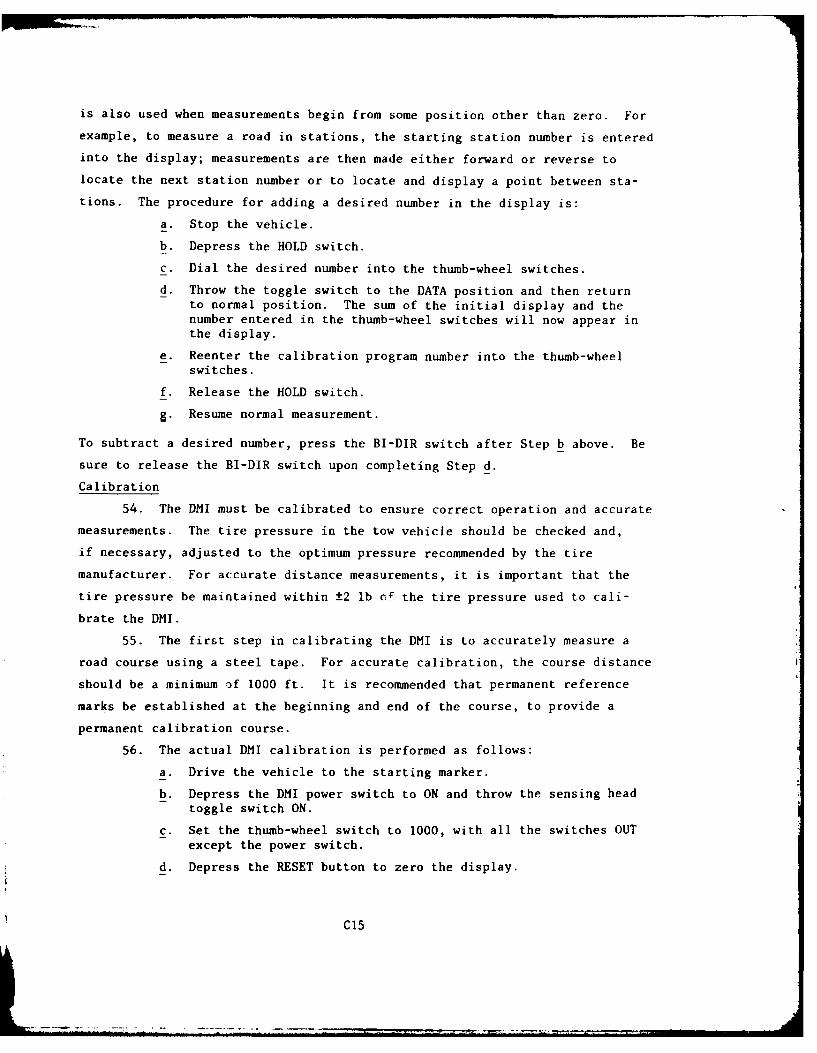
is also used when measurements begin from some position other than zero. For
example, to measure a road in stations, the starting station number is entered
into the display; measurements are then made either forward or reverse to
locate the next station number or to locate and display a point between sta-
tions. The procedure for adding a desired number in the display is:
a. Stop the vehicle.
b. Depress the HOLD switch.
c. Dial the desired number into the thumb-wheel switches.
d. Throw the toggle switch to the DATA position and then returnto normal position. The sum of the initial display and thenumber entered in the thumb-wheel switches will now appear inthe display.
e. Reenter the calibration program number into the thumb-wheelswitches.
f. Release the HOLD switch.
&. Resume normal measurement.
To subtract a desired number, press the BI-DIR switch after Step b above. Be
sure to release the BI-DIR switch upon completing Step d.
Calibration
54. The DMI must be calibrated to ensure correct operation and accurate
measurements. The tire pressure in the tow vehicle should be checked and,
if necessary, adjusted to the optimum pressure recommended by the tire
manufacturer. For accurate distance measurements, it is important that the
tire pressure be maintained within ±2 lb of the tire pressure used to cali-
brate the DMI.
55. The first step in calibrating the DMI is to accurately measure a
road course using a steel tape. For accurate calibration, the course distance
should be a minimum of 1000 ft. It is recommended that permanent reference
marks be established at the beginning and end of the course, to provide a
permanent calibration course.
56. The actual DMI calibration is performed as follows:
a. Drive the vehicle to the starting marker.
b. Depress the DMI power switch to ON and throw the sensing headtoggle switch ON.
c. Set the thumb-wheel switch to 1000, with all the switches OUTexcept the power switch.
d. Depress the RESET button to zero the display.
C15
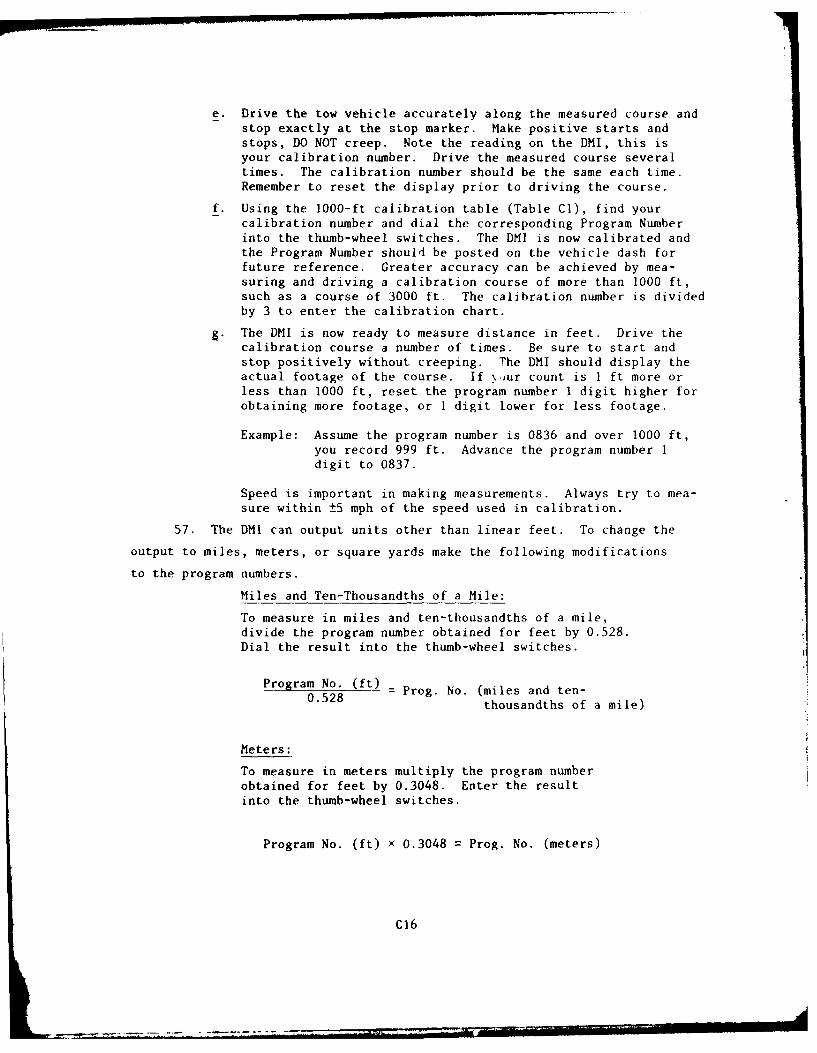
e. Drive the tow vehicle accurately along the measured course andstop exactly at the stop marker. Make positive starts andstops, DO NOT creep. Note the reading on the DMI, this isyour calibration number. Drive the measured course severaltimes. The calibration number should be the same each time.Remember to reset the display prior to driving the course.
f. Using the 1000-ft calibration table (Table CI), find yourcalibration number and dial the corresponding Program Numberinto the thumb-wheel switches. The DMI is now calibrated andthe Program Number should be posted on the vehicle dash forfuture reference. Greater accuracy can be achieved by mea-suring and driving a calibration course of more than 1000 ft,such as a course of 3000 ft. The calibration number is dividedby 3 to enter the calibration chart.
. The DMI is now ready to measure distance in feet. Drive thecalibration course a number of times. Be sure to start andstop positively without creeping. The DMI should display theactual footage of the course. If !,xur count is I ft more orless than 1000 ft, reset the program number 1 digit higher forobtaining more footage, or 1 digit lower for less footage.
Example: Assume the program number is 0836 and over 1000 ft,you record 999 ft. Advance the program number 1
digit to 0837.
Speed is important in making measurements. Always try to mea-
sure within ±5 mph of the speed used in calibration.
57. The DMI can output units other than linear feet. To change the
output to miles, meters, or square yards make the following modifications
to the program numbers.
Miles and Ten-Thousandths of a Mile:
To measure in miles and ten-thousandths of a mile,divide the program number obtained for feet by 0.528.Dial the result into the thumb-wheel switches.
Program No. (ft) = Prog. No. (miles and ten-0.528 thousandths of a mile)
Meters:
To measure in meters multiply the program numberobtained for feet by 0.3048. Enter the resultinto the thumb-wheel switches.
Program No. (ft) x 0.3048 = Prog. No. (meters)
C16

Square Yards:
Divide the width of the road by 9 and multiplytimes the program number obtained for feet.
Road width (ft) x Prog. No. (ft) = Prog. No. (sq yd)9
General Program Number:
Desired reading x 1000 = Program Number (PRM)Actual DMI display
Installation and Troubleshooting
58. This section is intended only to be an introduction to the DMI and
to give the user guidance in using the DMI that is installed in the NODET tow
vehicle. Complete installation instructions, along with a troubleshooting
guide, are contained in "Instruction Manual - Nu-Metrics Distance Measuring
Instruments" by Nu-Metrics, Connellsville, PA.
C17

Table Cl
Calibration Table for DMI Programming (Computed for Calibration of
Fixed Course Distance of 1000 ft)
Calibration Proram Calibration Program Calibration Prograi
750 1.333 793 1.261 836 1.196751 1.332 794 1.260 837 1.195752 1.330 795 1.258 838 1.193753 1.328 796 1.256 839 1.192754 1.326 797 1.255 840 1.191755 1.325 798 1.253 841 1.189756 1.323 799 1.252 842 1.188757 1.321 800 1.250 843 1.186758 1.319 801 ].249 844 1.185759 1.318 802 1.247 845 1.184760 1.316 803 1.245 846 1.182761 1.314 804 1.244 847 1.181762 1.312 805 1.242 848 1.179763 1.311 806 1.241 849 1.178764 1.309 807 1.239 850 1.177765 1.307 808 1.238 851 1.175766 1.306 809 1.236 852 1.174767 1.304 810 1.235 853 1.172768 1.302 811 1.233 854 1.171769 1.300 812 1.232 855 1.170770 1.299 813 1.230 856 1.168771 1.297 814 1.229 857 1.167772 1.295 815 1.227 858 1.166773 1.294 816 1.226 859 1.164774 1.292 817 1.224 860 1.163775 1.290 818 1.223 861 1.162776 1.289 819 1.221 862 1.160777 1.287 820 1.220 863 1.159778 1.285 821 1.218 864 1.158779 1.284 822 1.217 865 1.156780 1.282 823 1.215 866 1.155781 1.281 824 1.214 867 1.154782 1.279 825 1.212 868 1.152783 1.277 826 1.211 869 1.151784 1.276 827 1.209 870 1.150785 1.274 828 1.208 871 1.148786 1.272 829 1.206 872 1.147787 1.271 830 1.205 873 1.146788 1.269 831 1.203 874 1.144789 1.268 832 1.202 875 1.143790 1.266 833 1.201 876 1.142791 1.264 834 1.199 877 1.140792 1.263 835 1.198 878 1.139
(Continued)
(Sheet 1 of 6)

Table Cl (Continued)
Calibration Program Calibration Program Calibration Program
879 1.138 925 1.081 971 1.030
880 1.136 926 1.080 972 1.029881 1.135 927 1.079 973 1.028
882 1.134 928 1.078 974 1.027883 1.133 929 1.077 975 1.026884 1.131 930 1.075 976 1.025885 1.130 931 1.074 977 1.024886 1.129 932 1.073 978 1.023887 1.127 933 1.072 979 1.022888 1.126 934 1.071 980 1.021
889 1.125 935 1.070 981 1.019890 1.124 936 1.068 982 1.018891 1.122 937 1.067 983 1.017892 1.121 938 1.066 984 1.016
893 1.120 939 1.065 985 1.015894 1.119 940 1.064 986 1.014
895 1.117 941 1.063 987 1.013896 1.116 942 1.062 988 1.012897 1.115 943 1.061 989 1.011898 1.114 944 1.059 900 1.010
899 1.112 945 1.058 991 1.009
900 1.111 946 1.057 992 1.008901 1.110 947 1.056 993 1.007902 1.109 948 1.055 994 1.006903 1.108 949 1.054 995 1.005904 1.106 950 1.053 996 1.004905 1.105 951 1.052 997 1.003906 1.104 952 1.051 998 1.002907 1.103 953 1.049 999 1.001908 1.101 954 1.048 1000 1.000909 1.100 955 1.047 1001 0.999910 1.099 956 1.046 1002 0.998
911 1.098 957 1.045 1003 0.997912 1.097 958 1.044 1004 0.996
913 1.095 959 1.043 1005 0.995914 1.094 960 1.042 1006 0.994915 1.093 961 1.041 1007 0.993916 1.092 962 1.040 1008 0.992917 1.091 963 1.039 1009 0.991818 1.089 964 1.037 1010 0.990819 1.088 965 1.036 1011 0.989
920 1.087 966 1.035 1012 0.988
921 1.086 967 1.034 1013 0.987922 1.085 968 1.033 1014 0.986
923 1.084 969 1.032 1015 0.985
924 1.082 970 1.031 1016 0.984
(Continued)
(Sheet 2 of 6)

Table CI (Continued)
Calibration Program Calibration Progra Calibratuon Program
1017 0.983 1063 0.941 1109 0.9021018 0.982 1064 0.940 1110 0.9011019 0.981 1065 0.939 1111 0.9001020 0.980 1066 0.938 1112 0.8991021 0.980 1067 0.937 -113 0.8991022 0.979 1068 0.936 1114 0.8981023 0.978 1069 0.936 1115 0.8971024 0.977 1070 0.935 1116 0.8961025 0.976 1071 0.934 1117 0.8951026 0.975 1072 0.933 1118 0.8951027 0.974 1073 0.932 1119 0.8941028 0.973 1074 0.931 1120 0.8931029 0.972 1075 0.930 1121 0.8921030 0,971 1076 0.929 1122 0.8911031 0.970 1077 0.929 1123 0.8911032 0.969 1078 0.928 1124 0.8901033 0.968 1079 0.927 1125 0.8891034 0.967 1080 0.926 1126 0.8881035 0.966 1081 0.925 1127 0.8871036 0.965 1082 0.924 1128 0.8871037 0.964 1083 0.923 1129 0.8861038 0.963 1084 0.923 1130 0.8551039 0.963 1085 0.922 1131 0.8841040 0,962 1086 0.921 1132 0.8831041 0.961 1087 0.920 1133 0.8831042 0.960 1088 0.919 1134 0.8821043 0.959 1089 0.918 1135 0.8811044 0.958 1090 0.918 1136 0.8801045 0.957 1091 0.917 1137 0.8801046 0.956 1092 0.916 1138 0.8791047 0.955 1093 0.915 1139 0.8781048 0.954 1094 0.914 1140 0.8771049 0.953 1095 0.913 1141 0.8771050 0.952 1096 0.913 1142 0.8761051 0.952 1097 0.912 1143 0.8751052 0.951 1098 0.911 1144 0.8741053 0.950 1099 0.910 1145 0.8731054 0.949 1100 0.909 1146 0.8731055 0.948 1101 0.908 1147 0.8721056 0.947 1102 0.908 1148 0.8711057 0.946 1103 0.907 1149 0.8701058 0.945 1104 0.906 1150 0.8701059 0.944 1105 0.905 1151 0.8691060 0.943 1106 0.904 1152 0.8681061 0.943 1107 0.903 1153 0.8671062 0.942 1108 0.903 1154 0.867
(Continued)
(Sheet 3 ot 6)
IA

Table CI (Continued)
Calibration Progra Calibration Program Calibration Program
1155 0.866 1201 0.833 1247 0.8021156 0.865 1202 0.832 1248 0.8011157 0.864 1203 0.831 1249 0.8011158 0.864 1204 0.831 1250 0.8001159 0.863 1205 0.830 1251 0.7991160 0.862 1206 0.829 1252 0.7991161 0.861 1207 0.829 1253 0.7981162 0.861 1208 0.828 1254 0.798
1163 0.860 1209 0.827 1255 0.7971164 0.859 1210 0.827 1256 0.7961165 0.858 1211 0.826 1257 0.796
1166 0.858 1212 0.825 1258 0.7951167 0.857 1213 0.825 1259 0.7941168 0.856 1214 0.824 1260 0.7941169 0.856 1215 0.823 1261 0.7931170 0.855 1216 0.822 1262 0.7921171 0.854 1217 0.822 1263 0.7921172 0.853 1218 0.821 1264 0.7911173 0.853 1219 0.820 1265 0.7911174 0.852 1220 0.820 1266 0.7901175 0.851 1221 0.819 1267 0.7891176 0.850 1222 0.818 1268 0.7891177 0.850 1223 0.818 1269 0.7881178 0.849 1224 0.817 1270 0.7881179 0.848 1225 0.816 1271 0.7871180 0.848 1226 0.816 1272 0.7861181 0.847 1227 0.815 1273 0.7861182 0.846 1228 0.814 1274 0.7851183 0.845 1229 0.814 1275 0.7841184 0.845 1230 0.813 1276 0.7841185 0.844 1231 0.812 1277 0.7831186 0.843 1232 0.812 1278 0.7831187 0.843 1233 0.811 1279 0.7821188 0.842 1234 0.810 1280 0.7811189 0.841 1235 0.810 1281 0.781
1190 0.840 1236 0.809 1282 0.780
1191 0.840 1237 0.809 1283 0.780
1192 0.839 1238 0.808 1284 0.7791193 0.838 1239 0.807 1285 0.7781194 0.838 1240 0.807 1286 0.778
1195 0.837 1241 0.806 1287 0.7771196 0.836 1242 0.805 1288 0.776
1197 0.836 1243 0.805 1289 0.776
1198 0.835 1244 0.804 1290 0.7751199 0.834 1245 0.803 1291 0.7751200 0.833 1246 0.803 1292 0.774
(Continued)
(Sheet 4 of 6)

Table Cl (Continued)
Calibration Program Calibration Program Calibration Program
1293 0.773 1339 0.747 1385 0.7221294 0.773 1340 0.746 1386 0.7221295 0.772 1341 0.746 1387 0.7211296 0.772 1342 0.745 1388 0.7211297 0.771 1343 0.745 1389 0.7201298 0.771 1344 0.744 1390 0.7201299 0.770 1345 0.744 1391 0.7191300 0.769 1345 0.743 1392 0.7181301 0.769 1347 0.742 1393 0.7181302 0.768 1348 0.742 1394 0.7171303 0.768 1349 0.741 1395 0.7171304 0.767 1350 0.741 1396 0.7161305 0.766 1351 0.740 1397 0.7161306 0.766 1352 0.740 1398 0.7151307 0.765 1353 0.739 1399 0.7151308 0.765 1354 0.739 1400 0.7141309 0.764 1355 0.738 1401 0.7141310 0.763 1356 0.738 1402 0.7131311 0.763 1357 0.737 1403 0.7131312 0.762 1358 0.736 1404 0.7121313 0.762 1359 0.736 1405 0.7121314 0.761 1360 0.735 1406 0.7111315 0.761 1361 0.735 1407 0.7111316 0.760 1362 0.734 1408 0.7101317 0.759 1363 0.734 1409 0.7101318 0.759 1364 0.733 1410 0.7091319 0.758 1365 0.733 1411 0.7091320 0.758 1366 0.732 1412 0.7081321 0.757 1367 0.732 1413 0.7081322 0.757 1368 0.731 1414 0.7071323 0.756 1369 0.731 1415 0.7071324 0.755 1370 0.730 1416 0.7061325 0.755 1371 0.729 1417 0.7061326 0.754 1372 0.729 1418 0.7051327 0.754 1373 0.728 1419 0.7051328 0.753 1374 0.728 1420 0.7041329 0.753 1375 0.727 1421 0.7041330 0.752 1376 0.727 1422 0.7031331 0.751 1377 0.726 1423 0,7031332 0.751 1378 0.726 1424 0.7021333 0.752 1379 0.725 1425 0.7021334 0.753 1380 0.725 1426 0.7011335 0.749 1381 0.724 1427 0.7011336 0.749 1382 0.724 1428 0.7001337 0.748 1383 0.723 1429 0.7001338 0.747 1384 0.723 1430 0.699
(Continued)
(Sheet 5 of 6)

Table CI (Concluded)
Calibration Program Calibration Program Calibration Program
1431 0.699 1477 0.677 1523 0.6571432 0.698 1478 0.677 1524 0.6561433 0.698 1479 0.676 1525 0.6561434 0.697 1480 0.676 1526 0.6551435 0.697 1481 0.675 1527 0.6551436 0.696 1482 0.675 1528 0.6551437 0.696 1483 0.674 1529 0.6541438 0.696 1484 0.674 1530 0.6541439 0.695 1485 0.674 1531 0.6531440 0.695 1486 0.673 1532 0.6531441 0.694 1487 0.673 1533 0.6521442 0.694 1488 0.672 1534 0.6521443 0.693 1489 0.672 1535 0.6521444 0.693 1490 0.671 1536 0.6511445 0.692 1491 0.671 1537 0.6511446 0.692 1492 0.670 1538 0.6501447 0.691 1493 0.670 1539 0.6501448 0.691 1494 0.669 1540 0.6491449 0.690 1495 0.669 1541 0.6491450 0.690 1496 0.669 1542 0.6491451 0.689 1497 0.668 1543 0.6481452 0.689 1498 0.668 1544 0.6481453 0.688 1499 0.667 1545 0.6471454 0.688 1500 0.667 1546 0.6471455 0.687 1501 0.666 1547 0.6471456 0.687 1502 0.666 1548 0.6461457 0.686 1503 0.665 1549 0.6461458 0.686 1504 0.6651459 0.686 1505 0.6651460 0.685 1506 0.6641461 0.685 1507 0.6641462 0.684 1508 0.6631463 0.684 1509 0.6631464 0.683 1510 0.6621465 0.683 1511 0.6621466 0.682 1512 0.6611467 0.682 1513 0.6611468 0.681 1514 0.6611469 0.681 1515 0.6621470 0.682 1516 0.6601471 0.680 1517 0.6591472 0.679 1518 0.6591473 0.679 1519 0.6581474 0.679 1520 0.6581475 0.678 1521 0.6581476 0.678 1522 0.657
(Sheet 6 of 6)

APPENDIX D
SOIL AND PAVEMENT DATA USED IN DEVELOPMENT OF
EVALUATION METHODOLOGIES
DI

4J
0:4 0a e 0 0 7
31 0
mi 4I00 V'V 0 (6 1. r-
>, >
co r uu ooD C- U cr 0C'Jr 0, 4,0u < ck <*~~~~ u un, U,. .Or'o'- 0~' ~ ~ '0.C~~~~~~> . I I
II CC :
(u. CC CC 0 00 1 )10 1 1 1
0 0
4,0C4 4 40 .. 0
.- 0. w-, JC4E
r 400 0 w 0
.4 0 0 0
a, 4 Lei4
4
4
Ea UI' j
'A'0Wt
(4 (8(4 (4(4 (

r 4
4) I)
ot 0 4)
m 0 0041 a ,
.3' 0 u -C. u1C 43C "D L, 4,c c
414 0, 01 01 4.41.0 .
C; 4-4 0' ,4 4 O0's- o 0 4, a, l
43 4.4 .. C .355 4.Ou .4C >> ~ 44
4)1
00 04AC 0 0 0c5.' 00 0 0. 0. 0.- L.Cd cc 4o .5 *tO -. 7'. 4dG 4.'
1..4 0 000/ 000 W04C~ 00/ O 0Of. O .r 0'
00
04 t
4 C V . -dc4
Go csU 453 ,7C.4 4~ 4J~ 4.~ 4- .LA
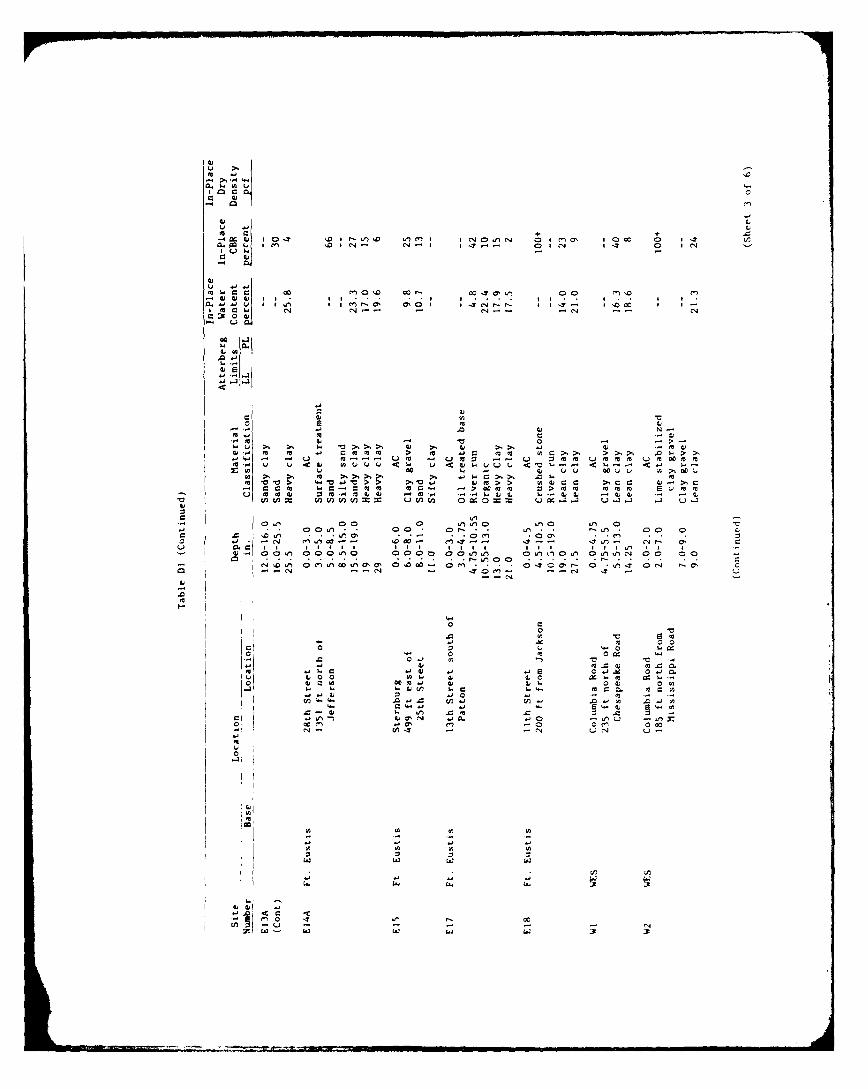
u0
4- +-~4, I0-n~ N .d'0 Ln I CJu C' 0 1 m , I 00 0D
II01 i -11 ~ -CN(
10 14
104
4, - LM
co 0
a C;~f C,0 01 - LIM 1; . 0 0 C.0 ~ ~ ~ ~ L .0 00~ .~(- o ~ - 0 -
o~ ~ (N ((.aC ( 0C , ,. *jr .-:J~ o45- C0.4 00 .0 0 00 T 011 0.r.-ot 0,T~ 00 00
1
0 0
0
0 0 4) 0 w:3 0 140m 4
-. r 4,140) r.0:iii0 0
0. 4W. w0 ox
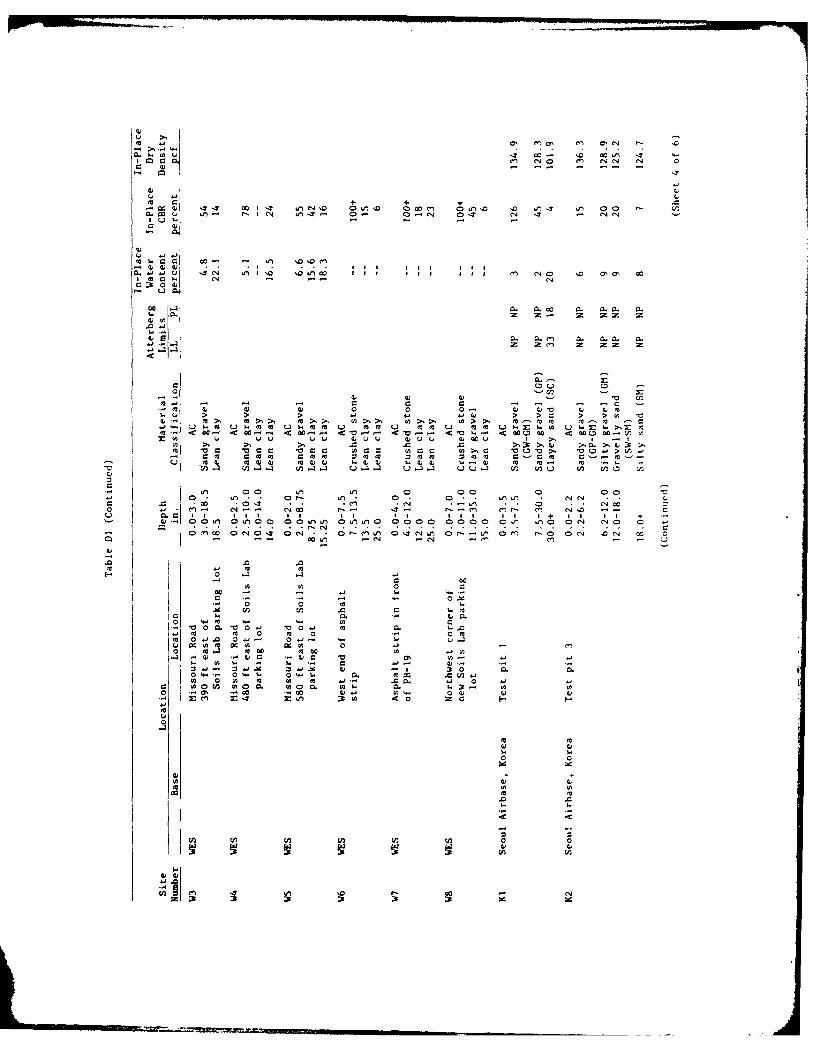
a, C N m CNN N 4
- cC-40 01 12 C4 1; 1 DI . 0 v a 1-m Cq .- ~ I N O 0 I 0 0~~ ~ . 0 . ~ f 0 ' /
I u J - -1
4
r 1 0
.~ N --Z N.
u -
tj ~ ~~~ ~ ~ ~ mz1 ' 1> 1> - - z ZZ r
412 - o,- , o-- <10- - a-- <l 0-~ oo bo 0 0-oc v Wu- u- j Z (d u Zuuu wa
.m (uC. m 0m 4 )( da4) 4) -3 l I) w -3 tr w u n 'nC
10n- - c -m c 0 0 - ccLn.4 : :. 0 c 0- In C 04 c4 4
3.- .0 ..0 . . rqo
0U 100) 104)a, 1044 a,44 L")4 I.4 10 'n. 1n a 1c. a0c r -
I C~. -~3 cf-33 U3,3 .. ,3 UU.3 ~ 13 (3 ~ 0 CJ
00I
0V . 0 0. 0o , o(I * Q .o~~~~~~ 0'C o' m~r . ... C ~ .N 0 -
4 o- 0 wu-
00 -h -- 4.3 N ~ . ~- .4In
r.1 0 mc0. 10 V 0 000 -, , I.) Co wU a d0, v--
* .X 0 101
I .~ i~ (3 .0 1IL16 1.0 40
W (A)1 oa. o0
V00.V .. ) O.1 0 0.I.fn
61 1 0 0 1 110 010 0..- oC. a.1
j 1 1 1 1 .
ot Cv~10 00 0.1-3 3t. 4 1)0 V1- .

001~)O - '0% a - l 0 C) 0. a en 7 In .c -a, 0 a'. or0SOC -z24. I l v) m.- )1-. c'.4 c 4N ~)-
-s 0
4j '
CL,!- O. . 0 .NO 00 C6 12 a.. 0C' N
61 CLIQ
- :1 1 > VV>1
Go bo- -A -n -C Go ccQwwL- n< )0 cca
>0,. C400. >. 0. -0 u .0 0.0 I. 0. j 0. 0. 0 m .>1 0.0. I
.0 r r
U412 0.00 0. En (n 0.0 E .0 M . W. (n 0n w. 0. En En.0
I~ I
0 '-'- cl 0 0 0 0 0. c. a' 0i U) I. 0a0 Vn WUn 041 C0 -n -y -0100 10 m
141.1~~c .- I'. A --- -.
.I) 441 ) 1 4 1 'mU ~ U V VV V V V ~ . 0 C U .QJ 041 04 N'CU CC C C C1041 )~
4j~0 6jII ~ . 4j~~Z4 ) C))) U U UU E.'~'.U ) ) - .
4j
C 0 W ~ 4C) 4 4)O'. '0 ' . 0 ~ . 'o.1 jNt. - N O'- N ' S C)
U 0 C SI I S 4 I 5 5 . I I 5 44, 0.n 0 0 .) 0 0 0rn .1 0 .) I, 0
(A '.*-~ ~ 0 acf r ' 4. .)% '0 00 '0 . . '0 0 ' 0'
0~ ~ N m No m N - - ' 7- -41)
.0o
U)d

(7 -n In C1 .) 1- ~ ~ ~ ~ ~ C 0jI -.7 tc00 0n t n-30I 00
m cJ
. 0 u
s. 0. P. a, P. a. a'. 33. .. . a. 0z) i z z z z -Z z zz z Z Z Z
aJU 3 . a. 2. a. 9L . a.. 3...33 3.3.. Lr)7- z Z Z n Z z( zZ z z7-ZZ 4.
3. m~ m m m r m
W - 0- a -0 V) 0
U m m. *.I 4. 4.m.4 . . . . 1 0 . .
m 0m 0' r-0**-m -m7
4j..~~~~ ~~ 000000 00(0 00 000
0 .40
0 - (- - rn' 00'J - - 'C444
'4
MuC10
9: Q 0
.a
co 044 44-44
0401
Go..4
ou4
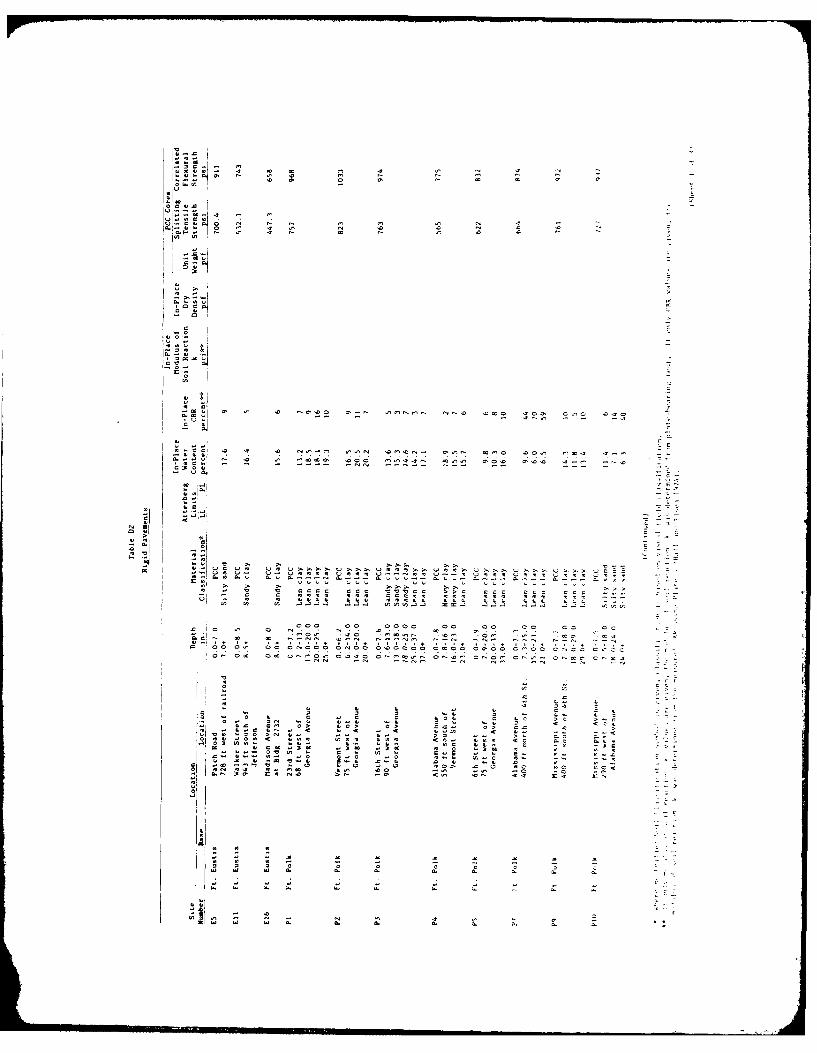
* -., C h.
.t .t, - 0 C 40
ci O40 .. . . . .. .. .C. ,N ." N... N. -: 7
0 0' 0 0' . C 0..0.
4. 0 4 4 . N N vv .
,0.,1. , i i , i , i4 i , , w
0C C 0 , -

0 .4O C 4 . C4 N 0..4 N
I- t c
o4. oo
3
o,
* - x
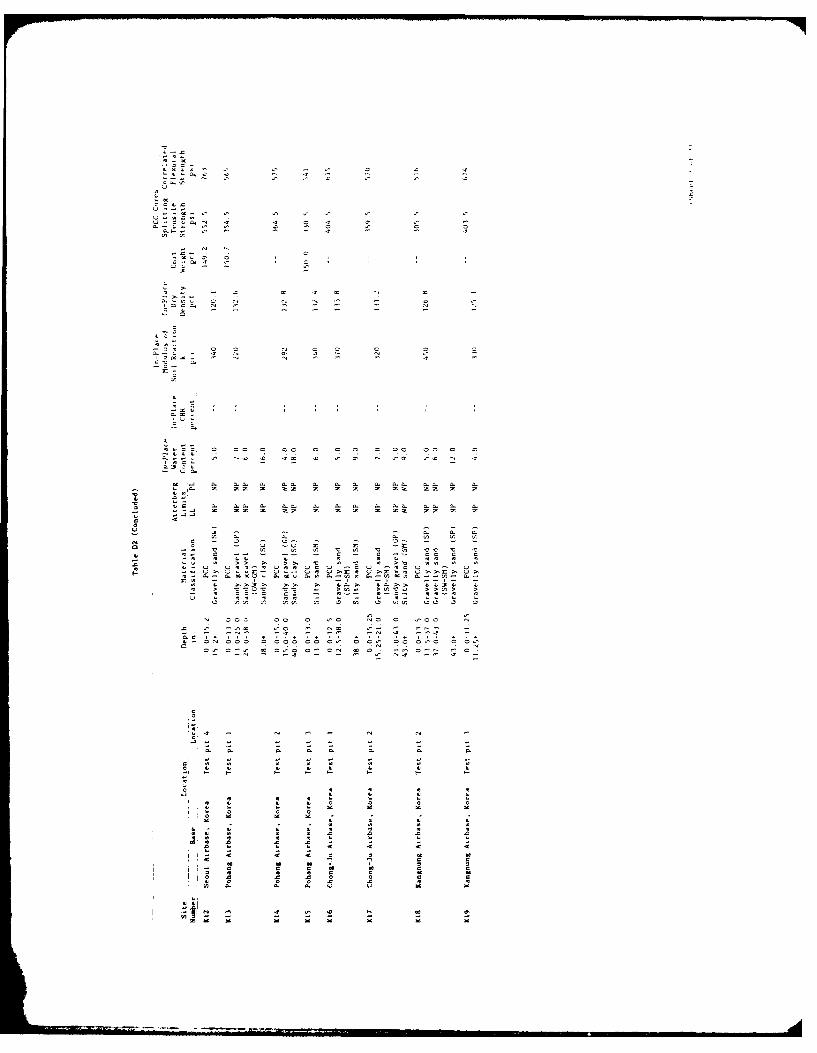
C-.0004
N 4 4 C 4 0 A'
0'044 A' C
*40>. a A' a A' a N
o-.eC C C3 C ac C C C a aC Ca a a
0 3 2 4.
; ~aa- 3 33 3 3 3333333 33 3 3O -=-'t A -O 42 0. a-A- A- A-A- A. 0- a- a. a-a, a-a- a- a.
- -A3Z3333333 3 33 33 3 3
0 A' C A' CA' A' A' CA'o > A' C A'C 3 3
- - A' CC C ~ a ~ a -v~ ~ CO 0- 0 -- A'-A'A' 0 A' C -- ~ 00 0 0- 0 0 00 0 0 4- 00 0
a A CC C CC V A ~ 0 >~ 00 0 A* 4- C CO-tA'O COO CO C ~> C 00 C C.'CCCAr-CA~-C 0 CC3O CC3'-O UCCEC CC0- a-- a-0000Ca 0.00 a-a a--coo 0--aOOa A.C A.-
a 4. 0C3C- Ca C ta-a 40-CC 44-30 4-0 C e~Ct t'V >3..' >C'CC > CCC> C
C a a a a a a C a C C C C C C C
.0 A' A'A'3 A'C NE A'0A'A' -
4-Ca CCC COCa aa CA' C CA' Ca CaC C CA'
4-. - 4- 4- 4-. H
00~ 4 .0 .0 .0 -- - - -A A 3 3 3 3
3 3 0 0 00 00
I I 0 0 44 00 0 0* 0 0 0 44 44
0 .0 .0 .0 0 0 0 0I 0 0.0 ~0 4 0
00!0'

4.,, - p . - -~ -, .0 -~ -- ,- .. S S S S -
* N - S-, -, 4 4 -~ .r -- -. - ..- - -
44 *4X N ,N '.NX 4 4.. , CC 5
40 -NN N 44 4 44S44 ' 4 0 NX 000 4 44 , 44- - - N N - - - - - -
- .0..
- to0
r C
~*0.
1, 04
a.: .. ,~ 4.: . >5' 5 5.5. 4 -~ <~. - .. Q- u~404 - C> C> C>, C5. 5' S~.0>> 5' 4>.> 5.
0 .s0000 0 S.- C >0 0.,-
.544- C >4 -~ NO N= 000 C.roco 0.-a O.5*-SC0 0.5.50- 0.'*~ 0
0.5.50.-.04> 0>-CO >44>-C 4 0 C 0
5, 5..0 .0-C
Oot a- - t 0 4.5 50t t 4 tO 0 t 0 4tOt -- 0 CO 0 5 0.0 0-..00. 0..~ t.-.t - C t.. 55±.465~ I, tO 54*t tO S >0 ±4COt iSO 3>. St COt 01,4< 4 <0 ta.0 V C) C..' C)E 0 4 1, 4.O 1, SOt 4 52 t 4 4 4 40-- --- -- a 5-a.O - - .-.- 0.-. ±-C C4 0 o a... ~.0 0 04 - 1, - 4. - 4. .0.0ttS 5,0 00.0 .04< 0 00 .. '.fl(S40 t.tS 40 tO ... r- S 0 50 C>-~J 0- .0- ~0 .4 5> oa4
a4~
0 0 0 0
.0 .0 .0 .0 .0 .0* 0 0 0 0 - - - - - -0 0 5 o o 0 o oa a a 0. 0. 0. 0. 0. 0.
,i~ '~ a~~. 0.
O~j 0 0 - > 4 .04004 - 44 44 .0 .0 - - - -Z~&0 a a a 0. 0. 0. 0. 0. 0.

0-4..
- a.
0 00
-04.. .3 - --
O a.
0-ac .3 00'
.303.
3.6
- 0]
3. -i- I... .4 >~
C :~:c~:~4- '~:ou-ca.c~
~
C.: 3. 3. 3.3.0: 0:
40 .3~40 .3~0C .r'-* 0,4C .0~0- .4. - - C ~34 .4. - CO3..~ 04.30 0.344 04.300 . 34(4
-- .4.4- CC'~34
0 - - -0 0 0
- 4. 3. 3.C .40 .4~ .40
oj 3.'e3. 3.C3. 4.3.3.-4 3.3.> 3.3.> 3.30
- C I. C
0 -04 0 C .4. 4 CCi .CC ao r-- aC~ 034 oCro
3! I
II 4
I 3.!
HI '~ ~
C C C4. 4. 4.
a;
C- a.
~24. 4. a.

Related Documents