Morphological and Molecular Diversity, Phylogeography and Ethnobotany of Pnmus Il/ricana (Hook. f.) Kalkman in Ethiopia By Ziyin Mihretie Asmare A Thesis Submitted to The Department of Microbial, Cellular and Molecular Biology Presented in Fulfillment ofthe Requirements tor the Degree of Doctor ofPhHosophy in Biology (Applied Genetics) College of Natural Sciences Addis Ababa University Addis Ababa, Ethiopia June 2014

Welcome message from author
This document is posted to help you gain knowledge. Please leave a comment to let me know what you think about it! Share it to your friends and learn new things together.
Transcript

Morphological and Molecular Diversity, Phylogeography
and Ethnobotany of Pnmus Il/ricana (Hook. f.) Kalkman in
Ethiopia
By
Ziyin Mihretie Asmare
A Thesis Submitted to
The Department of Microbial, Cellular and Molecular Biology
Presented in Fulfillment ofthe Requirements tor the Degree
of Doctor ofPhHosophy in Biology (Applied Genetics)
College of Natural Sciences
Addis Ababa University
Addis Ababa, Ethiopia
June 2014

ABSTRACT
Morphological and Molecular Diversity, l)hylogeography and Ethnohotany of
PI'II//IIS ajl'ical/fl (Hook. f.) Kalkman in Ethiopia
Ziyin Mihrctie
Addis Ababa University, June 2014
This dissertation reports diversity, phylogeography and ethnobotany of Pl'llnus
aji'icana (Hook. f.) Kalkman in Ethiopia. P. C(ii'icana is an economically important,
but endangered tree species of Africa. Five quantitative morphological traits were
studied in situ on 21 natural populations of P. aji'icana over its distribution range in
Ethiopia, and the following mean values were found: total height (l9.3m), bole height
(7.4m), diameter at breast height (70.2cm), bark thickness (20.3ulIn), and fresh bark
mass (I 59.6kg). Al"lOYA based ou the five traits revealed that there was significant
variation among populations (P < 0.001), which could be due to environmental andlor
genetic or age structure differences. Pearson's correlation analysis revealed significant
positive correlations among all traits (except bole height vs. bark thickness) (P <
0.0 I). Furthermore, all traits (except bark thickness) showed significant negative
correlations with altitude (P < 0.05). Six nSSRs and five cpSSRs were used to study
molecular genetic diversity and structure of the 21 P. aji'icana populations. A total of
89 nSSR and 14 cpSSR alleles, and 16 chloroplast haplotypes were found. The study
showed that P. [!!i'icana in Ethiopia maintains high levels of diversity in both nSSR
(Hr = 0.725) and cpSSRs (hI' = 0.703). AMOYA revealed that most (88.05%) of the
nuclear genetic variation occurs within populations; whereas nearly half (47.8%) of
chloroplast genetic variation occurs among populations. There was moderate nuclear
(FsT = 0.122) and high chloroplast (OST = 0.478) genetic differentiation among
III

populations (P < 0.00 I). Distance-based clustering (peoA and UPGMA) and
individual-based population assignment methods as well as comparison of observed
and permuted differentiation indices revealed geographic pattern for nSSR diversity,
but no geographic pattern for cpSSR diversity, which could be due to differences in
the effect of genetic drift and/or the mechanism of gcne flow between cpDNA and
nDNA. However, Mantel test indicated signiticant positive correlation between
geographic and genetic distances for both nSSR (Rxy = 0.126) and cpSSR (Ib,:y =
0.107) (P = 0.00 I). The ethnobotanic study confirmed the multipurpose character of
P. {{fi'icana, and six major use categories (medicinal, construction and carpentry,
fuel/firewood, beverage preparation, apiculture, and traditional rituals) were
determined for the species. Significant genetic differentiation in more than 95% of the
population pairs suggests that almost all the populations deserve conservation, but as
there are often limitations of resources to conserve such a large number of
populations, prioritization may be needed. Thus, based on a weighted-score
population prioritization matrix that integrates genetic, morphological, conservation
status, and ethnobotanic criteria; Kuni, Jimma, and Assela are the top three priority
populations for conservation of the species.
iv

ACKNOW1,IWGMIINTS
I would like to express my sincere gratitude to my advisor Prolessor E":ndashaw
Bekek It)!' his invaluahle ad\'ice~ encouragement, guidance as weI! as timely
commenls and corrections.
I deepl\ 'lcknowledge the Il)!lowing individuals from Federal Research and Training
Centre I('r Forests, Natural Ilazards and Landscape, Department of Forest Genetics,
Austria I BFW): PmI'. Dr. Thomas Gehurek, Dr, Silvio Schueler. Dr, Heino Konrad,
and lng, I'homas Thalma),r, tor their kind collaboration to carry out par! of the lab
work ill [heir laboratory unci li)r the pl'Ol(lUnd assistance I obtained li'om them during
my stay there,
I am gralcl'll to the Oftice of the iJirector lor Graduate Programmes, Addis Ababa
UniversilY: BFW, Austria: and Bioversity International lor their Ilnancial support to
carry olll the research, I am also indebted to Bahir Dar University for giving me
sponsorship to pursue m)' PhD study, Deep appreciatiol1 is extended to the
Deparlllll'llI or Microbial. Cellular and Mokculal' Biology of Addis Ababa University
f(lf accepting me (lS a PhD student and giving me the required academic training anci
servin's,
I al11 thankful to Ihe Ethiopian Institute of Biodiversity (EIB) and fOthiopian Wildlife
Consel'v<llion Authority (!'WeA) 1'01' giving me permits to export leaf and DNA
samples "I' p, {!/i'icm}(/ to Austria for molecular laboratory work,
Due thanks go 10 my wire W/ro Haimanol (Jete, my SOil Nahom Ziyin, 111)' mother
Email....\).ellll~kserct.l1)\ cousin Ato (Jetachew Hibst with his liu11il)" Ill)'
brothers: Yihull Mihrctie, Addis Mihretie, and Demeke Tilahun,
v

I would like also to thank Dr. Kille Dagne, Dr. rassil Assefll, and Dr. Kassallul1
1 os fay" /(ll' their hclp encouragement, and priceless comments,
I am lh"nkllil to Ato Ayalew l'alcma (a lecturer at Jimnm University and a PhD
Candidate at Leuven University, Belgium) with his family, Ato Ayana Gel'bashe, ;\10
Woljirn Ahern, Ato \Vonuimu Baye, Ato Kumssa Gutu, Ato iVlaiza Manaye, Ato
l'izil<m !lilatc, /\10 Jarsso UUlllll, AIO Biniam Abebe, Ato Shumeye Ayale\\', 1\10
AnuHl liasselL A10 Ibrahim Mume, Ala lkyan Adem, and Ala Abdurahman Adem
Illr helping me during sampic and cthnobolanic data collection, I would like also to
thank the inl(1I'Inlll1ts 101' sllllring their knowledge on PI'III1I1S aji'icolla I(}r the
ethnobol,lI)ic study,
Finall), I would like to extend my gratitude to all my colleagues and other people who
contributed positively in one way or the other to the accomplishment of my study,
vi

TABLE OF CONTENTS
I, I S I () I,' FIG U R ES ",,,,,,,,,,,,,,,,,,,,, ,"'"'' ,,, "" "","""",""" "" "" ,,, ,,""" '''''''''''''''''' ''','''','''' ,x
LIS'I (l I' '1';\ B L ES",,, """,,,,,,,,,,,,,, ,"',," '" '"'' '"'' ""'" '"'''' """" '" """"," """"",,,,,,,,, "" '" "x i
LIST 0 r f\ C R ON Y M S "" """ ,,,"'" ,,, """" ,,," ,,," ""'" ",,"" "" '" "" """'" ""''''', '''''' '" "'"'' xii
I, I S' lor f\ PPEN Die ES '"'''' ,"""'" '" ""'"'''''' ,,," """""" '" ,""" "" "" '''" """,," ''',' "",,,,,, xii i
OM PI I R I: I NTR OD ueTI ON """"" "" "" """",, "" "" """"" ",," """" """""""",,",, """ I
I, I, I liversit)' and Ethiopia in brief """""""""""""""""""""""""""""""""""""""'" I
I .2, S ta teillent of the problem "",,",,"" "" """ """ "" ",,"" """ """ "" '" ",," "" """" "" "" '" 2
I ,,\, II \ potheses 0 I' the study""" ,,,,,,,,,,,,,,, "",,",," """"""""" "" "" ",," ",,""""""" "" "",3
I A, (lhjcetivcs of the study ,,,,,,,,,,,,,,,,,,,,,,,,,,,,,,,,,,,,,,,,,,,,,,,,,,,,,,,,,,,,,,,,,,,,,,,,,,,,,,,,,,,,,,,,,,,,,3
I A, I ' C;cneral objceti vc ,,,,,,,,,,,,,,,,, "",,""',' ,,," ",," ,"",' "" '''','' ,,"','" ,,,,,,,,,,,,,,,,,,,,,,,,,, "",3
I A ,2, S peei tic object i ves ,,,"""",' '"'' ,,,"''''''',,' "",,' """ "" '"'' """""""""""",,,, """, '''' '" 4
(' H A PTI R 2: LlI[RATU R ERE V I lOW,,, "" """"""'" "" """""" """""""" ",""",,"""" "" 5
2, I , J\ 5 sessme n t 0 I' geneti c d i vel's i tl' "",,,,,,,,,,,,,,,,,,,,,,,,,,,,,,,,,,,,,,,,,,,,,,,,,,,,,,,,,,,,,,, ","",,"" S
2 ,2, Inl porta nce 0 I' eth nobotan ic stud l' "",,,,,,,,,,,,,,,,,,,,,,,,,,,,,,,,,,,,,,,,,,,,,,,,,,,,,,,,,,,,,,,,,,,,,,,,8
2.3. f{lltanic description or r. q/i-iC(fJllI ................................................... .................. ,,,. 10
2.'1, Reproductive biology of p, aji-ic{[}1(1 """""""""""""""",,,,,,, '""" " " ,," " " " """,,, II
2 ,5, !) i 51 ri but ion and ecology of Y '!/i'ic{///{/ """" ,,""" "" """ ","""" """" """",, "" "," 14
2.6. PIJ~'logeography ofF. {{/i·icWIll." ............................................................................ 16
2,7, F I h n 0 bota n yoI' /" aji-; e{// /(f"""""""""""""""""""""""""""""""""""""""""", I 8
2,8, Threats and conservation status of p, {(/TiC{{II{/""""""""""""""""""""""""""", 19
2,9, I 1 i vcrs itl' 0 I' p, uji'ic{///(f """" "" ",,",," ",,",,"" "" """ ",,"" ,," "" "" """"",, """"" "" 2 I
C H A PIT R 3: MATE R 1;\ LS AND M ETH ODS "'" ,,,"" """" "'" ,,""" """""""" "" ,," """ 23
:l, I , I'<'pulat ion sam pi i ng """ '" """ ,,,"" ,,,'''''' "" """, '"'''' "''','''' "",," ," "" ,,,"','"'' ,,," "" 23
3,2, (JLlant itat i ve mDrphological data collect ion a nd anal ),5CS"""""""""" "" """""" ", 2S
VII

3.3. Sample collection for microsatellite (SSR) investigation ....................................... 27
3.4. IlNA isolation ......................................................................................................... 28
.1.5. ~vl icrosatellite (SSR) markers ................................................................................. 28
1.6. IlNA amplitication and genotyping ........................................................................ 29
3.7. Nliciear SSR data analyses ..................................................................................... 30
3.8. Chloroplast SSR data analyscs ............................................................................... 32
3.9. Ethnobotanic data collection and analyses ............................................................. 33
CHAPTLR 4: RESULTS ................................................................................................... 35
4.1. ()uantitative morphological traits ........................................................................... 35
4.2. Nuc1car microsatellitc markers ............................................................................... 39
4,2.1. Genetic diversity within populations ............................................... , ... , ........... 39
4.2 .. ' eienetic structure of populations ..................................................................... .42
4.2.2.1. Regional pattern of gene tie diversit), ........................................... , ................ 42
4.2.2.2. Differentiation aIllong poPLIlations ............................................................... 42
4.2 .. '.3. Pair-wise population comparisons ................................................................ 48
4.2.2.4. Correlation between genetic and geographic distance matrices .................. .48
4.3. (,1110roplast microsatellite markers ......................................................................... 52
4.3. I. Chloroplast DNA variation .............................................................................. 52
4.3.2. Relationship ancl geographic distribution ofhaplotypes ................................. 56
4.4. Ltllllobotany or 1'. lI/i-i('(II/!I ..................................................................................... 60
4.,1.1. Localnomenciatllre of I'. !I/i-jcw/{{ ............................................... , .................. 60
4.'1.2. Medicinal lIses or P. l{/i-icww ...................................................................... , .. ,63
4.4 .. 1. Non-mcdicinaluses or P. !I/i·jcw/lI ............................................................... , .. 66
CIIAI'TIR.5: DISCUSSION, CONCLUSION AND RECOMMENDATION ................ 70
5.1.ll;scll5sion ............................................................................................................... 70
VIII

5.1.1, Genetic diversity within populations ................................................................... 70
5.1.:>, (;enetic structure ofpopulations .......................................... : ............................... 72
5. I .. ). Indigenous knowledge on 1'. oli-icoilo ................................................................. 78
5.IA. Implications for conservation 01'1'. oli-ic{/Iw ....................................................... 79
5.:>. (·,,,'clusions ............................................................................................................. 84
5.3. Recommendations ................................................................................................... 85
REFERI·.NCES .................................................................................................................. 87
APPENDiCES ................................................................................................................. 105
IX

LIST OF FIGURES
Figure I I'mi/lls aji'ical/a: (a) tree (b) raceme with flowers (e) twig with fruits .............. I I
Figure 2 Distribution map of PFlIIIIIS (!ji·ic(/lJa . ................................................................ 15
Figul"(' 3 ,Vlap showing 21 sampling localities of I'rlllllls aji'ical/a in Ethiopia ................ 25
Figure 4 Principle of tree height measurement using trigonometric methods .................. 26
Figu re ~ U PGMA dendrogram for 21 populations of PmllllS aji"icm/(/ from Ethiopia ... .43
Figure (, Principal Co-ordinate Analysis showing the multivariate relationships ........... .45
Figure 7 Results of individual population assignment perlormed with STRUCTURE .. .46
Figure X Correlation between geographic and genetic distance matrices I"l' nSSR ......... 51
Figu re !) Cienealogicalnetwork of 32 haplotypes of 53 Pmlllls ,!ji"icw/(/ popUlations ..... 57
Figu re I II Distri but ion of hap lot ypcs of Prill/liS aji'ic(JJw ................................................ 58
Figure II Correlation between geographic and genetic distance matrices for cpSSR ..... 60
Figure 12 A debarked Pl'lll1l1S l{ji'ic(fJW tree near Injibara lown ....................................... 67

LIST OF TABLES
Table 1 Description ofsflmpling localities of PI'IIIIIIS q/i'ical/a in Ethiopia ..................... 24
Table 2 Mean values for quantitative morphological traits of Prill/lis a/i·ical/a ............... 36
Ta ble 3 ;\ na lysis 0 I' variance (A NO V A) results lor quanti tative traits ............................. 3 7
Table 4 I lunnett T3 mUltiple comparison results for quantitative traits ........................... 38
Table 5 Pearson's correlations among quantitative traits ................................................. 39
Table (, Genetic diversity indices based on six nSSRs .................................................... .41
Ta ble 7 Part it ion ing 0 f variation based on nSS R using AM 0 V A .................................... 4 7
Table X I'air-wise population matrix of genetic and geographic distances ..................... .49
Tab'" 9 Pair-wise population matrix of FST values .......................................................... 50
Table 1 (J Haplotype diversity measures based on cpSSR ................................................. 53
Table 11 Haplotype construction and ti·equency .............................................................. 54
Table 12 Partitioning of haplotype variation based on cpSSR using AIVIOVA ................ S9
~ 13 Nomenclature of PI'IIIIIIS a/i'ieal/a in different localitics of Ethiopia ................ 62
Table 14 Reported medicinal uses of Prill/liS q/i'icono in Ethiopia .................................. 65
Table 15 Reported non-medicinal uses of /'I'III/IIS q/i-ieal/{[ in Ethiopia ........................... 69
Table 16 Relative weights of different criteria to prioritize P. a/i-ic{[/lil populations ....... 81
Table 17 Summary of prioritization results of PJ'l/IlIIS q/i'ical/a populations ................... 82
XI

LIST OF ACRONYMS
AMOYA analysis ofmolccular variance
ANOV 1\ -= analysis of variance
a.s.1. -- ahove sea level
b.s.1. c below sca levcl
CITES convention on intcrnational trade in endangered species of wild fauna and 110ra
cpSSR chloroplast simple sequence repeats
ORiI diameter at brcast height
ILJCN international union for conservation of nature
nSSR nuclear simple sequence repeats
peoA principal coordinate analysis
PCR . p()lymerase chain reaction
RAPO randomly amplilled polymorphic DNA
SSR ~ simple sequence repeats
LI PC; M;\ un-weighted pair group methods with arithmctic average
lJSAID LJnited States agency for international development
xii

LIST OF APPENDICES
Appendix I Specific sites from where P. ali-ieol/a samples were collected in Ethiopia.
Appendix 2 Sequences of microsatellitc markers (nSSR & cpSSR) used in this study.
Appendix 3 List of alleles generated at nuclear and chloroplast microsatellite loci.
Appendix 4 Summary ofehi-square tests Il)r Hardy-Weinberg equilibrium.
Appendix 5 Summary of linkage disequilibrium tests among six nSSR loci.
Appendix 6 The Evann" table output ofSTRUCTlJRE HARVESTER analysis.
Appendix 7 The Evanno graph output of STRUCTURE HARVESTER analysis.
Appendix 8 Pair-wise Ilopulation matrix ofG"sT values lor P. ali'ieal/a populations.
Appendix 9 Pair-wise population matrix of D"I values lor P. ali-ic{//J(f populations .
. Appendix 10 UPGMA dendrogram for 46 PI'III/IiS ali-ieal/o populations.
Appendix II Principal Co-ordinate Analysis lor 46 PJ'lIIlIlS {{Ii-ieol/a populations.
Appendix 12 Results orSTRlJCTURE for 5 I PJ'lIIlIlS {{Ii'ieal/a populations.
Appendix 13 Questionnaire for the ethnobotanic data collection 01'1'. ,{Ii-icwliI.
Appelldix 14 English equivalents of Amharic words.
XIII

CIIAPTI<:H I: INTHO[)UCTION
1.1. DiYl'rsily and Ethiopia in brief
The high geographical ancl cljlll~tjc diversity in Ethiopia have given rise to many and
varied ecosystems. These ecosystems have species richness and high percentage of
endemislll. More than thirty-nine percent of the internationally rccognized
biodiversity hotspot area. the Eastern Afromontane Biodiversity Hotspot. is found in
Ethiopia (l3irdLife International. 2(12).
Ethiopia contains a significant number of the world's broad ecological regions with its
remarkablc geological history. broad latitudinal spread (3° and ISON) and ,enormous
altitudinal range (lI'om 116 m b.s.1. at Afar depression to 4620 m a.s.1. at
mountaintops of Ras Dashen). The Great Rift Valley cuts diagonally across the
country from northeast to south. creating a vast depression that separatcs the two
major hi~'hland systems of the country. Much of the area of Ethiopia is dominated by
highland platcaus that are interrupted by deep gorgcs and valleys. which are fonned
by large rivcrs and their tributaries. Geological events have produced the extreme
landscape that partly affects patterns of rainfall and provides altitudinal gradients 111
ambient temperatures, offering a variety of ecosystems.
The variety of habitats in Ethiopia supports a rich varicty of different species. which
contributes to the overall biological diversity of the country. Biological cliversity or
biodivcrsity has been defilled by the Convention on Biological Diversity (CBD) as
"the variability among living organisms ti'om all SOLirces including infer alia,
terrestrial. marine and other aquatic ecosystems and the ecological cOl11plexes of
which they arc part; this includes diversity within species. between species. and of

ecosystellls", A diverse biological wealth is provided by the varied ecosystems of the
country: as pattern of diversity strongly associates with environmental gradients,
illcilldin~ gradients of precipitation, temperature, seasonality, evapotranspiration, soil,
and top"graphy (Givnish, 1999; McCain; 2007), The huge biodiversity the country
hosts today is also partly attributed to the proximity of the country to Asian continent
(USAID,2008),
Ethiopia is rich in biodiversity including human, There are more than 80 population
groups ill the COlilltry. Each group has its own indigenolls knowledge acculllulated
through time and passed from generation to generation, StUdying and understanding
the indigenous knowledge of these people can have a contribution to the proper and
slistainahle utilization or natural resources of the coulltry. Traditional people around
the world possess unique knowledge of plant resources on which they depend for
lood, medicine and general utility (Martin, 1995), Particularly, multipurpose plant
species have considerable contribution to the livelihood of local populations,
Unfortunately, most of these mUltipurpose species are facing a decline of their
popUlations due to the growing demand of their products for household consumption
as well as for local, regional and international trade. Therefore, assessing the use
pattern ol'these species is essential to develop a sustainable participatory conservation
strategy It)!' them.
1.2. Stall'ment of the problem
PrllllllS (//i-icollo is an economically important, but endangered tree species of Ati'ica.
Several aspects of the species such as diversity, phylogeography and ethnobotany are
studied in most parts of its distribution range, However, Ethiopian populations werc
not full, covered in thc previous studies, though tile sJlccies is widely distribution in
2

the country. Therefore. unless such aspects of the species are thoroughly studied over
its distrihution range in the cOlin try, development of efficient management strategies
for con:-.crvatiol1, domestication and slIstainable utilization of the species would not be
possible.
1.3. Hypotheses of the study
Thc ma'lor hypotheses of the study are:
I. There could be genetic differentiation among different populations of P. "li';cwllI
due to limited gene flow as populations are highly fragmented and sparsely distributed
in the country.
2. Pi'll/III., "Ii-;c"n" could have migrated from Ethiopia to the other distribution range
cOllntries of Africa.
3. Difterent communities in Ethiopia could use P. Ci!i';cana for ditTerent purposes as
reported from other distribution range countries of the species because traditional
people "round the world possess unique knowledge of plant resources on which they
depend 1(,,' food. medicine and gcneralutility.
104. Ohjel'1ives of the study
/04.1. General objective
The general objective of the research was to study diversity. phylogeography and
ethno!1otany of P. ali-;c{{}1lI populations established at different altitudes and
geographical locations over its distribution range in Ethiopia.
3

1.4.2. Specilic objectives
The research was spccitically aimed to:
• As.'·,css genetic diversity within and among populations of the species using
nlll'lear and chloroplast microsatellitc markers.
• Investigate paltern of genetic diversit), of the species in relation to its
dis! ribllt ion.
• Inl,:r the phylogeography of P. {!Ii-icolla in Ethiopia.
• VlTil)1 the Ethiopian tree seed zone system for P. {{/hc{f}llI.
• Assess variation in quantitative morphological traits among populations of the
SPt'I'ICS.
• Investigate association between morphological traits of the species and
environmental factors.
• Survey indigenous knowledge on 1'. oli'icoll" li'0111 dilferent parts of Ethiopia.
• Cakgorize populations of P. {!/i-icontl ill their order of priority for conservation.
4

CHAPTER 2: LITERATURE REVIEW
2.1. Assessment of genetic diversity
Genetic diversity is a level of biodiversity that refers to the variation among alleles of
genes in different members of populations of a species (Steffen er "/,, 2009). Genetic
variatioJl is reflected in differences among individuals for many characters from DNA
sequences and proteins to behavioral and morphological traits. Each specics that
persists has a characteristic genetic diversity. The current magnitude and distribution
of genetic diversity within a species depends on the effects and interactions or several
evolutionary forces (mutation, selection, migration, and gcnetic dritt) over the long
cvolutinllary history of the species. In order to conserve and use genetic diversity, its
extent and distribution should tirst be assessed and determined. Diversity can be
evaluatcd at the phenotypic, genotypic as well as physiological levels. Assessment of
phenotypic variation focuses on morphological traits: those charactcristics that define
the shape' and appearance of individuals. Some of these traits can be considered as
genetic if their expression in related individuals is heritable. The genetic variation
among individuals at different levcls can be investigated by employing a variety or
genetic Illarkcrs.
;\ genetic marker is a measurable character that can detect variation III a DNA
sequenc,·. Three types of genetic markers namely: morphological. biochemical
(protein/allozyme) and molecular (DNA) have becn developed to assess genetic
variation among individuals.
The traditional way of determining variation within and between populations was by
assessin~. morphological difterenecs among individuals. Morphological measures
5

have the advantage of being readily availablc. do not require sophisticated equipment
and are the most direct measure of phenotype, thus they are available tor immediate
usc. However. morphological determinations need to be taken by an expert in the
species. they are subject to changes due to environmcntal factors and may vary at
different developmental stages and their number is limited.
Biochemical (protein/allozyme) markers are analyzed by electrophoresis and revealed
by histochemical stains specific to the proteins being assayed. Detecting
polymorph isms in protein markers has the advantages of being co·dominant,
technically simple. and inexpenssive. I-Iowcver, protein markers are also limited by
being influenccd by the environment and their expression changes in different
developmental stages.
Molecul,u' (DNA) markers are developed to dctcet polymorph isms in nuclear or
organellaI' DNAs. As molecular markers concern the DNA molecuic itselt: they are
considered to be object ive measures of variation. They are not subjected to
environmental intluences; tests can be carried out at any time during developmental
stages; they have the potential of existing in unlimited numbers. Many different types
of molecular markers with differcnt properties have been developed, but the most
commonly used ones are RFLI', RAI'D, AFLP, ISSR, SSR and SNP (Maheswaran,
20(4). h,,' instance. RAPD. Arl~p, ISSR and SSR were 'employed to study the
fl)llowill~ Ethiopian forest trcc species: H([g1'lli([ ([byssilliclI (Bruce) .l.F. Gille!.
RAPD (Kumlign Asmare, 2005), ISSR (Tilye Feyissa 1'1 lIl., 2007), AFLI' and SSR
(Tayc I:kkele 1'1 lIl., 2009): 1'1'111111.1 '1/i'i(,([I1([- RAPD (I-Iailu Atnafu, 2007): Cordi([
([1i-ic([lI{f I.am. - AFLI' and SSR (Abayneh Derero 1'1 al .. 2011): .lulliperus pI'I!cem
Hoclls!. ,'X Endl. - AFLP (Demissew Scrtse ('I ([/.,2011).
6

A genetic markel' is described as good marker ifit is polymorphic, reproducible in any
laboratory experiment, co-dominant, evenly distributed throughout the genome,
discriminating, not subjccted to environmental influences, selectively neutral, and
inexpensive; however as no single type of molecular marker tlilfills all these criteria,
the natllre of the question being addressed, technical demand, operational cost..
manpowcr, facilities available should be weighed to choose the suitable marker
(Mahes\\aran, 2004).
For this rcsearch, both nuclear and chloroplast SSR markers as well as quantitative
morphological traits were used. SSR markers are used since they became increasingly
popular in plant population genetics due to their hyper-variability, locus-speciticity
and co-dominance nature (Squirrell ef al .. 2003). The time and cost involved in
developing spceies-specific primers !i'om genomic libraries or sequencc databascs has
becn citL'll as the major drawback of the SSR markers (Nybom, 2004). However,
transtcr or primers developed for a particular species to related taxa avoids the
laborious and time consuming process of cloning new microsatellite (SSR) markers
for a spl'cles. This approach was employed in the present study as species-specilic
SSt< primers have not been developed for P. a/i·icltllil. With regard to the
morphological quantitative traits of P. {{/i-iC(lII({ used in this study, there is no data to
what extent the traits can be influenced by environmental factors. Presumably,
environ",ental intluence on the traits, at least on some, could not be low. In 1'1'111111.1'
({lIilll1J L. genotype by site interaction was quite high for stem height but was low for
girth increment (Muranty e/ III. 1998). Hitherto, the objcctive of this study was not to
determine heritability of the traits but to assess whether there arc differcnces in the
traits anHlng popUlations over thc distribution range of the species in the country.
7

Studyin" genetic diversity of species has several applications in different sectors such
as conservation (c.g. conservation prioritization, regulation of threatened species, ancl
identification of taxonomic units), agriculture (e,g, germ plasm improvement), and
medicinc (e.g. personalized medicine). The existing genetic variation is the result of
continuous changes in natural selection and adaptability to changes in the variolls
forms 01 environment through both phyletic and phylogenetic evolution (Endashaw
Bckele. 1986). Genetic diversity in domestic species and their wild relatives enables
researchers to develop improved varieties of animals ancl plants for human needs.
Diversit, in wild species is a potential resource; species that might not have known
direct cCllllomic value today may turn out to be economically important in the future.
To ensurc future adaptability of species and to allow for selection and breeding,
intraspecific genetic variation must remain available (FAO, FLO and IPGRI, 2004).
An understanding of the patterns of variation within and among populations of trees is
essential 111l" devising optimum genetic management strategies for their conservation
and sus",inable utilization (Dawson and Powell, 1999). i\ prerequisite for thc efficient
use of ~cnetic resources in any planting program is a detailed understanding of the
extent and distribution of genetic variation available within the species.
Trees provide a widc range of products, including food, lodder for livestock, and
medicincs for both people and livestock. P. (!/i';cana is one of such tree species that
deserve diversity study for its conservation, domestication and utilization.
2.2, 1m pOI·tance or ethnobotanic study
Ethnoboiany studies the relationship between humans and plants in all its complexity
and is gellerally based on a detailed observation and study of the use a society makes
8

of plants. including all the beliefs and cultural practices associated with this use
(Ghmbani el al., 2006), Ethnobotanic studies show that cultural attitudcs and
perspectives on the lISC and application of biological resources within communities
constitute a valuable component in conservation, domestication and improvement of
plant-based products (Omonhinm in, 2012),
Ethnobotanic knowledge plays a grcat role in drug discovery, and thus a specilically
dcsignated lield of rcsearch called Ethnopharmacology has been developed, Ghorbani
e/ af. (2006) define Ethnopharmacology as .. the interdisciplinary scientilic exploration
of biologically activc agents traditionally employed or observed by man", According
to Fabricant and Farnsworth (200 I), most useful drugs derived li'om plants have been
discovered by follow up of ethnomedical uses, Fabricant and Farnsworth (200 I)
I'eported that li'om a total of 122 compounds scientillcally identilied li'OIll 94 species
of plants, 80% were used for the samc or related ethnomedical purposes,
Etlllloblltanic inli.lrIllation can reduce thc enormous effort needed to discover drugs
11'0111 phillIS by random search. Por example, according to rabricant and Farnsworth
(200 I), tile bioactive constituent aftinin was identilied from Heliopsis Ivngipes (A,
Gray) I3lake in less than two weeks based on an ethnomedieal report of the use of the
plant as ~111 analgesic (local anesthetic).
Some wild plant resources are severely threatened by habitat loss and species
selective overexploitation, In the context of conservation and sustainable use of wild
plant resources, ethnobotany can contribute to the scienti lic base 1'01' management
decisions by identifying practices that arc either positive or negative to the
conservation of the resources, If an ethnobotanic study reveals utilization of plant
reSOllrcl':-- non-slistainably, intervention actions can be taken to ensure the survival of
9

thc species. Alternatively. if the ethnobotanic study identifies practices that have
positive ~ol1triblltiol1 to the conservation of the species, actions to encourage slich
practices can be taken.
2.3. Botanic description of P. (((i'kallil
The following botanical description is extracted t1'om Kalkman (1965). 1'. 1I/i"ic(II1II
(Hook. I'.) Kalkman (synonym Pygellill ,!/i"icallllill Hook.1) (family Rosaceae) is a
medium 10 large canopy tree with 30··-40 m height and up to I m diameter. Young
trees haw smooth, reddish bark whereas older trees have dark, platy, resinous bark. It
has the rare ability to regenerate its bark as long as the vascular cambiulll is not
destro)l'd (Stcwart. 200}a). I.cavcs are simple. alternate. oval or lancc shaped. 5-15 x
2-6 cm. Thcy arc evergreen but somc fall prior to li'uit development. Inllorescenec is
IOta 30-flowered raceme and is composed of small, white or greenish, hairy and
fragrant Ilowers. The tree produces flolVers with male and female parts. Fruits are
spherical. 5 to 8 mm wide and 9 to II mm long, biller, pinkish-brown, turning to
dark-red or reddish-brown pulp as they get ripe. The fruit is a drupe, each with a
single sCl'd. Leaves, twigs. fruits, and bark emit a "cherry" odor when crushed. which
is characteristic of the genlls PrlllllfS.
10
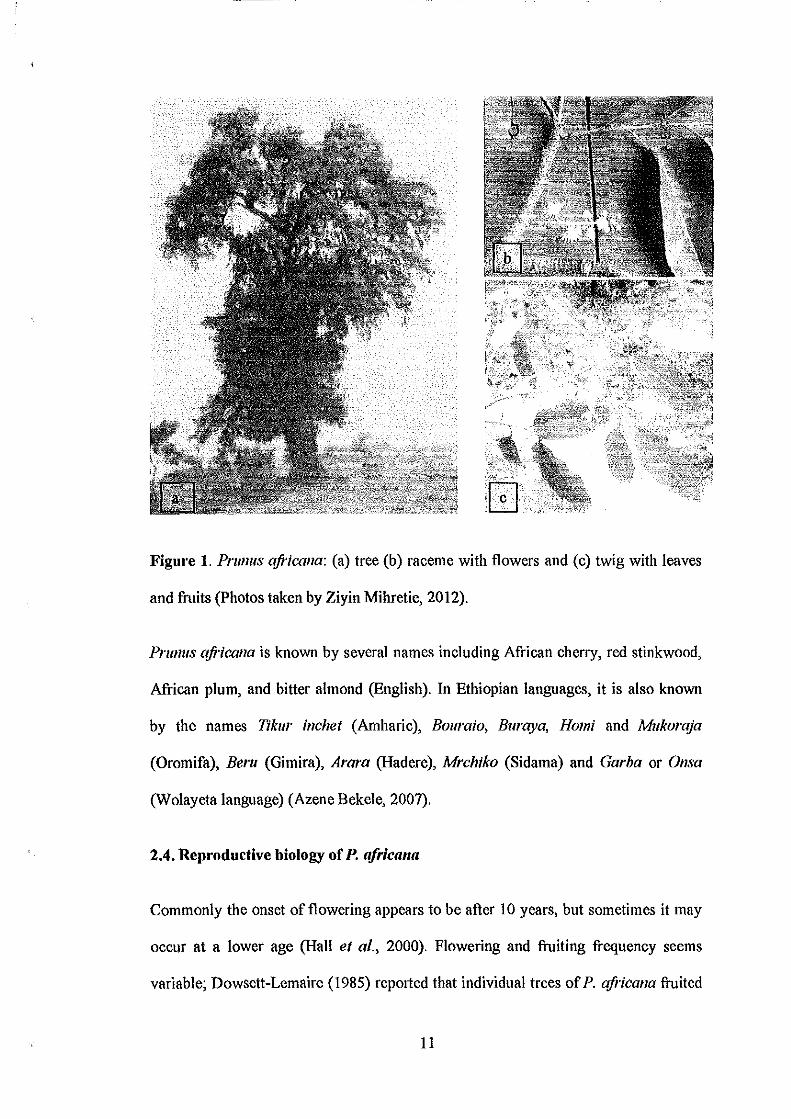
Figure 1. Prunus africana: (a) tree (b) raceme with flowers and (c) twig with leaves
and fruits (photos taken by Ziyin Mihretie, 2012).
PtUlIUS africana is known by several names including African cherry, red stinkwood,
African plum, and bitter almond (English). In Ethiopian languages, it is also known
by the names T/kut inchet (Amharic), Bouta/o, Buraya, Homi and Mukoraja
(Oromifa), Beru (Gimira), Arara (Hadere), Mrchiko (Sidama) and Garba or OllSa
(Wolayeta language) (Azene Bekele, 2007).
2.4. Reproductive biology of P. africana
Commonly the onset of flowering appears to be after 10 years, but sometimes it may
occur at a lower age (Hall et al., 2000). Flowering and fruiting frequency seems
variable; Dowsett-Lemaire (1985) reported that individual trees of P. ajNcana fruited
11

in alternate years in Malawi (ca 10030'S). In South Africa, fruiting is also reported to
be irregular (Breitenbach, 1965; Geldenhuys, 1981). The cause of the irregular
!lowering frequcncy for the species is not known. In terrestrial orchids, the irregular
!lowering patterns were reported to be caused by a complex of biotic and abiotic
tilctors. which can act in both ways and it depends on the species and its habitat
(K indlnwnn and flalounova, 200 I).
According to Hall el a/. (2000), three zones have been identitied in relation to
reproduct ive seasonality of P. aji'icww; 'year-round' equatorial zone (within 5° of the
equator). 'northern' seasonal zone (north of latitude SON), and 'southern' seasonal
zone (south of latitude 50 S). In the equatorial zone, there is no strong !lowering
seasonality: some individuals arc tlowering almost every month. \Vith few exceptions,
north or SON the !lowering season corresponds to the November-January period.
South or 5"S. !lowcring tends to coincide with cool and dry conditions from April to
October. Fruits develop within 4 to 6 months of pollination (Sacande el a/., 2004).
Though there is lack of data ti'om well designed studies, evidences lI'om different
sources suggest that pollination in P. l{ji'ical1a is mediated by animals. Hall el ill.
(2000) consider the role of wind to be negligible based on Hamilton's (1972)
observation that pollen grains tililing to the soil surtilee are poorly dispersed.
According to Hall el lI/. (2000), the ti'agrant character of the· tlowers also suggests
insect pollination. Of course, the report of Fichtl and Admasu Adi (1994) that becs
(HymelHlptera: Apidae) forage for nectar and pollen in Ethiopia supports the above
suggestion.
The potential seed dispersal agents of P. aji'icalla are birds and monkeys (Sunderland
and Nket(,r, 1996: Hall el "/,, 2000: Farwig el ai., 2006). Sunderland and Nkefor
12

(1996) reported two potential dispersal agents of the species in Cameroon: the primate
Cercopil/WCIIS preussi; and the bird AndJ'opadlis lIlonlmms. In Kenya, Farwig el at.
(2006) ,,!Jserved 36 frugivorous species including birds (Andropadll.l' gmcifil'O.I'll'i.l',
PYCllO}/()/IIS barba/lis and TlIrlll!" tymponistria) and primates (Cercopithecus mili.\',
('ercopillieclfs ascol1in\' and ('O/O/JlfS glfereza) feeeling on P. r{/j'ic([}l{f fruits and
potentially dispersing thc seeels. Despite the presence of such seeel dispersal agents,
Berens (2010) found that the mean seed dispersal distancc of the species was 5 m in
the Kakamega Forest (Kenya).
Doubts "vel' whether P. {{ji'icanll seed is strictly recalcitrant have been expressed
(Were ancl Munjuga, 1998; Legesse Negash, 2004) and the occurrence of germination
inhibit(,,-, in the pcricarp of ti'esh seeds has been suggested (Geldenhu),s, 1981).
Nevertheless, for practical purposes the seed is considered recalcitrant and unless
carefull, stored only a small proportion remains viablc atier as short a period as three
wccks (\lInderiand and Nketor, 1996).
Vegetative propagation through cuttings from juvenile plants of P. oji'icono has been
achieved with varying degrees of success in difterent media (Tchoundjeu el af.,
2002). Rooting success in an experiment in Cameroon was higher (80%) with a
sawdust mcdium than with sand (72%) or a I: I mix of the two (71 %).
In lerll1:- of seedling growth. light was observed to be a significant I~\ctor in
Cameroon: under 70% shade, seedlings became weak and pale whereas at 40% shade
normal internode length was found (Sunderland and Nkefor, 1996).
13

2.5. Distribution aud ecology of P. (((riel/J/I/
PJ'lIIllfS ({Idcoll(l is the only species ill the genus PJ'llllllS that is native to Ati'ica
(Hedberg. 1989). As shown in its distribution' map (Figure 2). P. a/deal/a is
geographically widespread species growing in the highland lorests in mainland ;\Ii'ica
(Angola. Cameroon. Democratic Republic of Congo. Ethiopia. Kenya. Ivlalawi.
Nigeria. Somalia. South Africa. Sudan. Swaziland. Tanzania. Uganda. Zimbabwe)
and outlving islands (Bioko. Grande Comore. Madagascar. Sao Tome) (Kalkman.
(965).
In the tnlpics. P. a/i'icalill is lound between 1200-3000 m a. s. I .. but further south.
where cooler latitudes compensate lor altitude, it occurs at lower elevations
(Cunningham. 2006). 1'. a/i-ical/u is geographically associated with mean annual
rainli"l ,'rom 500-700 mm (high latitudes) to over 3000 mm (low latitudes) and
optimal conditions tor the species appear to be temperatures of 11-19 0(' alld 17-23 "('
ill the coolest and warmest months respectively (Hall el al .• 2000).
1'1'111111.1 ,,/i'iclII}(/ is restricted 'to those parts of Africa that experience temperate
climatic conditions and with a moisture supply sufficient to meet potential evapo
transpiration during the growing season. It is high temperature and/or insurtlcient
rainlall dul'ing the wannest months of the year that essentially limit P. (!/i'icw/u to the
montane regions of Ali'ica (Hall el al .. 2000).
PrwJ1Is (ddcaJllI occurs in forests transitional between lowland and Afi"olllontane. and
in a range of Ali'omontane forest types. In the various Ali'omontane torest types. the
abundance of P. a/i'iClll/li varies widely but the species is sufficiently prominent to
14

have t)('l'J) L1sed as a plant community descriptor: Prlmus Zone of the rVlontane Forest
l3elt (Hailliiton, 1974), P)'gelllll ivloist iVlontane rorest (Spinage, 1972) .
',>'-.. -'
. .... ,\" ,~, I ..
Figure 2. Distribution map of Pnllll/.\' {!/i'ic!II/(/ (Source: Hall el 01., 2000).
In Ethiopia, P. ([/i'ieol/([ populations are highly thlgmented and sparsely distributed in
the tonner Gojjam, Gondar, Shewa, Arsi, Bale, Harerge, Wollega, Illubabor, Kelil and
Sidama areas (Hedberg, 1989).
PnfllllS ((Ii'icana forms symbiotic associations with arbuscular mycorrhizal fungi·
(Tesfaye Wubet el 01., 2(03). A new species of fungi was isolated ti'om P. O/i-;C!II1lI
seeds and named Diplodi([ roslilo/{l sp. nov (Abdella Gure, 2004). Pathogenic Illilgi
15

were also reported li'om nursery and seedling studies (Breitenbach, 1965; Mwanza (I
al., 199') J.
2,6. Ph)'logeography of P. '!ti'icIII/II
Phylogcography is an integrative field of science that uses genetic information to
study the geographic distribution of genealogical lineages, especially those found
within species (A vise, 2000). Deciphering spatial and temporal components of
population structure and interpreting the evolutionary and ecological processes
responsihle are major goals ofphylogeography.
With re~ard to the processes leading to the current distribution of p. llji-iCllI/II,
different suggestions have been made based on extant stands (Aubreville, 1976 cited
in Kadu <'1111., 2011; Kalkman, 1988) and DNA studies (Mucllugi ellll., 2006; Kadu
ellll., 20 I I; 2013). Aubreville (1976 cited in Kadu el al., 20 II) suggested a Laurasian
origin of Prill 111.1' with subsequent movement through the Middle East into north-east
of Africa; wllereas Kalkman (1988) proposed a Gondwanian origin of Prill 111.1' with
northward movement along a path starting in regions corresponding to Australia,
South 1\lllerica and Ali·ica.
The role of fossil record in inferring the phylogeography of p. aMeal/1I has been
limited as there arc only lew reports li'om its distribution range. Fossil pollen grains of
1'1'/11/11.1' have been reported li'oni younger deposits «' 40 000 years old) on Mount
Kilimanjaro, Tanzania, and on Mount Kenya (Coetzec, 1967; Van Zinderen Bakker
and Coetlee, 1972). The occurrence of pollen of PI'lIllIlS comparable to P. a/i'icl/I/(/
was also reported from Ugandan sediments of nearly the same age as the earlier
reports ( . '13,000 years old) (Marchant el al., 1997).
16

The ph\logeography of P. ali-icili/ll has become the subject of some recent studies
using DNA markers. Based on random amplitied polymorphic DNA (RAPD) study,
Muchugi e/ (II. (2006) concluded that both long-distance seed dispersal and migration
via the southern migratory tract (SMT) could bc responsible for the occurrence of P.
(!/i';c(f//(I in outlying islands and tile distant \Vest All'jean mountain massifs. They
supported Laurasian origin of PI'lII/I/S with subsequent movement through the Middle
East into north-east of Ati'ica, and proposed the Eastern Rift Valley in Kenya as a
probabl,' halTier to gene flow. Kadu ('I al. (2011) provided significant insights into the
popUlation history of P. ali-iCIII/(I within mainland Ati-ica and its neighboring islands
based on cpSSR markers. They suggested an early split of Madagascar population
li'olll lilt' main lineage speculating possibly unique dispersal events facilitated h).' birds
lll' the southern Monsoon drift or the Mozambique cUlTent. For the colonization of
West f\ frica, Kadu ('I al. (20 II) suggested former existence of a migration corridor
from east to west and proposed two migration scenarios: (i) a split during southward
migration of 1'. (lideal/a at the southern fringe of the Ethiopian highlands with
migration of Albertine Rift Vall.ey populations to West Ali'ica; or (ii) the independent
colonization or \Vest Africa via a north-western migration corridor and subsequent
colonizalion of western Uganda li'om West Africa. They suggested the uppcr river
Nile basin and the Lake Victoria basin as key barriers to dispersal in the early
population history of the species, which doesn't agree with the earlier suggestion of
the Rili Valley as a probable barrier to gene flow. However, another work of Kadud
lIl. (20 I .1) based on nSSR agrees with the suggestion of the Rili Valley as a probable
balTier l(l gene flow. Kadu ('I al. (20 I 3) explained the disagreement to be clue to the
dislocatiun of a historical immigration barrier to a more recent barrier to gene flo\\
over several hundreds of kilometers. Finally, Kadu el al. (2013) concluded that the
17
•

biogeography of p, a/i'icllIl(f is multifaceted and has been determined by rare long
distance dispersal events coupled with constant migration at intermediate
gcograpllicall'angcs and strong gene-now barriers.
2.7. J<:thnobolany of 1'. {(/i'i(,l1l111
PI'WJIlS u/i'ic{I}/(/ has many traditional lIses in its range cOllntries. In Cameroon,
branches are used for making axe. hoc and ceremonial spear handles (Nsom and Dick.
1992; Cunningham and !Vlbcnkum. 1993; Stewart. 200 I); timber is used It)r roof
support. bridge decks. fuel wood (Stcwart. 200 I). window and door Il'ames (Iverson.
1993): the bark is used as traditional medicine for human ailments (Nsom and Dick.
1992: Cunningham and Mbcnkum. 1993: Stewart. 20Cl I) and ailments of domcstic
animal., (Stewart. 200 I); leaves and seeds are also used as traditional medicines
(Stewart. 2001); ti"uits and leaves used as wildlile food (Cunningham and Mbcnkum.
1993; Stc·wart. 200 I); flowers used for honcy production (Stewart. 200 I), Ugandans
use the timber for mortars and pestles. beehive supports. building poles. bean stakes
(Cunningham. 1996). lirewood. charcoal. furniture, flooring, paneling, carving,
building poles and posts. and utensils (Lambert. 1998). Kenyans usc the timber le)r
house bu'liding and for furniture (Beentje. 1994); the bark as traditional medicine to
treat levers (Kokwaro. 1976) and gonorrhea (Lindsay. 1978). as purgative (l3eentje.
1994): 'lild leaves to treat stomach pain (Kokwaro, 1976). In South AtI'ica, the bark is
used as " traditional medicine le)l' chest pain (Van Wyk el (Ii .. 1997) and intercostal
pain (Ilutchings el (Ii,. 1996), In Ethiopia, the bark is used to treat wound (Moa
Meger". ('I (ii" 2013; Sintaychu Tamene. 2011), ear infection and toothache (Mirlltsc
Giday ('I ui" 2009), Ascariasis and Gonorrhea (Fisseha Mesfin "I (ii .. 2009), and
leaves to treat eye inlection (Nigussie Amsalu, 2010) and Tonsillitis (Ragllnathan and
18

Ivlequentc Solomon, 2009). The tree has also other benetits including erosion control,
provision of shade or shelter, windbreak, soil fertility improvement, and as
ornamcntal plant (Legessc Negash. 2002).
In modern medicine, the bark of P. aji';calla is highly valued for its remedy against
benign prostatic hyperplasia (131'1-1) (non-cancerous enlargement of the prostate),
which is common in men over the age of' 50 (Tyler, 1(94). The bark extract was
patented in 1966 (Debat, 1(66) and processed to provide treatment for prostate gland
hypertrophy (Longo and Tira, 1981: Catalano el al., 1984). According to Cunningham
(2006). patents t()i' new products based on P. aji'ic{l//(! bark or bark extract has been
proliterated with nine nell' patents taken out since 2000. The extract from the bark
contains several pharmacologically active compounds including phytosterols (e.g. 13-
sitosterol). pentacyclic triterpenes (oleanolic and ursolic acids) and ferulic esters (n
clocosanul and n-tetracosanol) (Longo and Tira, 1981: Catalano el "I .. 1(84). which
may intcrfere with the development of' I3PH (Stewart, 2003b). According to
Cunningham el al. (1997), an annual international trade of P. ({Idem/(! bark extract lor
the treatment of benign prostatic hyperplasia worth approximately lJS$220 million in
the tinal pharmaceutical product. P. aji';C{l/1ll is a potential resource tor Ethiopia to
have high share in the international market of medicinal plants (Endashaw Hekele.
2007): ""'Illers can bendit greatly through the domesticHtion and cultivation of the
tree (Legcsse Negash, 2002).
2.S. Th reats and conservation sh,tus of P. (!{i'i('{/I/{/
Cunningham el al. (1997) estimated the worldwide annual export of barks collected
by telling of trees ti'om natural stands to be about 4,000 tonnes. The natural resource
base is Illost exploited and under the greatest threat in Cameroon (Cunningham and
19

rvibenklllll, 1993) and Madagascar (Walter and Rakotonirina, 1995 cited in
Cunningham el ai" 1997). Exploitation is also high, though less intensive, in Kenya
(Cunnill~ham el al" 1997) and on the island of Bioko (Equatorial Guinea)
(Sunderland and Tako. 1999), Accordillg to Cunnillgham ('I ai, (1997), accurate
exploitatioll figures for other countries are not available, but arc considered to be
comparatively low, Though valuable genetic resources of P, !I/i';C{///{/ might have been
lost as :-;llille or the populations arc heavily over-exploited in parts or its distribution
range, it is not in danger of extinction at the species level (Dawson el (II" 2000).
Problem, with the sustainability of the bark harvest have resulted !i'om a lack of
knowledge of sustainable harvest levels and li'om the huge demands on wild
populatil'lls (Stewart. 2003b). In addition to over-exploitation through commercial
lise, lOG!! lise, deforestation, habitat fragmentation, wildfires, invasive alien species as
well a~ l:limate change arc fllllong the threats of the species at different range
countrie, (.Iimu, 20 II). Modcled distribution of P. a/i'ieal7a indicates that the species
is likely to be affected negatively by climate change (Mbatudde elal" 2012a: Vinceti
el (/1" 2(13).
In Ethiopia, though it is not known to what extent the bark of 1'. aji';clII/{/ is
commercialized, it is clear that the species is one of the victims of deforestation as the
\"(-lrest l'l',>Ollrccs of the country have been seriollsly threatened by deforestation
(Reusing. 2000). In the former times, Montane forests were the main constituents of
the natural vegetation in the Ethiopian highlands (Breitenbach, 1963). However, in the
last fc\\ decades, most or the AfrOlllontanc forests have been cleared and only a very
small p""portion of the original vegetation remains (Friis, 1992: Demel Teketay and
Granstr(illl. 1995).
20

Due to the severity of the threats to P. a/hcalla. some international and national
conservation measures have been taken. Internationally, the species is included in
Appendix II of the CITES (Convention on International Trade in Endangered Species
of Wild Fauna and flora) and the IUCN (International Union for Conservation of
Nature) Red List of threatened species. In national levels. policies have been
cstablishl~d in variolls African countries aiming to ensure sustainable utilization and
managelllent of P. q/;'i('(/}llI though ent()I'cemcnt issues and control problems persist
(Vinceti ,'I al .. 2(13). In Ethiopia. two lield gene-banks have been established at
Debre labor and Lepis and P. II/i'icalla is being conserved there
(l1!!p:1 Iwww. i be.gov .et/biod i vers(!.y/eonservat ion/fgbs/forest -tield-genebanks). a nd the
Oromia state government has included P. a/i-icalla in the list of prohibited tree species
(Anonymous. 2003). In Cameroon and Kenya, P. a(i'icalla planting programs have
enjoyed -.;ome Sllccess indicating potential for ex sill! conservation if coupled with
sListaill<lhk managed harvesting (lvluchugi (II (1/., 2(06).
2.9, Diversity of P. I!fi'ic{/I/{/
PrevioLis studies usmg RAI'D markers on P. II/hcalla rrom Ethiopia. Kenya,
Cameroon. Uganda, and ivladagascar showed the existence of high genetic diversity in
the species (Barker el al., 1994; Dawson and Powell, 1999; rvtuchugi e/ al., 2006;
Ilailu {\tnafu, 2007). Dawson and Powell (1999) included a population of P. ({/helill"
li'01n Ethiopia in their study and they found the population to be the most diverse (H,
0.137) "I' all the 10 populations considered in their study. Hailu Atnalil (2007)
studied the genctic variation of six natural population of 1'. a/i'iclllla li'OIn Ethiopia
using 1(;\1'1) markers and showed the existence of high genetic diversity (~U in the
Tepi (0.'>07), Lepis (0.290) and Chilimo (0.297) popUlations. farlVig ~{ lIi. (2008)
21

found higher values of genetic diversity (II,) ranglIlg from 0.73 to 0.83 in Kenya
using nSSR markers. Kadu ~I al. (20 II) found high total gene diversity (h, 0.886)
from 32 populations in nine A ti'ican countries excluding Ethiopia using cpSSR
markers. In another study using nSSR markers, Kaelu el al. (2013) also found high
genetic diversity (II,.) ranging from 0.430 (South Africa: Mpumalanga) to 0.827
(Kenya: Kibri forest). In terms of phytochemical content. Martinelli <'I al. (1986)
found a signilleant difterence betwcen bark extracts of the species from mainland
Africa alld iVladagascar. Similarly, Kadu el ul. (2012) reported a signiticant variation
in the cOllcentration of bark constituents aillong 20 P. l{/i'iC(lIl(( populations. However,
the conlTntration of bark constituents originating from different populations did not
sholl' a vcry distinct geographical pattern (Kadu el al., 2012). Gaehie el III. (2012)
also reported the existence of variation in terms of crude bark extract mean yields,
chem iell I composition, and spec i tic compounds among different I'. a/i'ic{/}/(/
populations in Kenya.
Studies on morphological traits of P. a/i'ic{/}/{/ are limited. Nevcrtheless. there arc
some studies on morphological traits mainly aimed at estimating bark yiclds of P.
II/i'icaila trees at a particular site (Cunningham and Mbenkum. 1993: Bctti and
Ambara. 20 II). i\ survey carricd out in Cameroon on a 15 year old enrichment
plantin[! site (Ntingue) with trees up to 17 J11 high showecl that diameter at breast
height of I'. {!/i'ic{///{/ varied considerably (7.9 - 42.3 cm), with a mean of 15.8 cm (n ~
49 trecsl (Cunningham and Mbenkum. 1993). Another study carried out on Mount
Cameroon forest (Camcroon) estimated the mean mass of stem barks of I'. iI/i-ic{(/J((
trees with D[lH >: 30cm to be 99.86 kg based 011 the equation. V (l.OOOO'I*I)' 'Ill"
which lillks the volumc (V) of fresh bark to the diametcr (D) of each P. ({/i'iCllIi(/ tree
(Betti and Ambara, 20 II).
22

CHAPTER 3: MATERIALS AND METHODS
3.1. Populatioll samplillg
Populatioll sampling was carried out over the distribution range of P. q/i';cmlO in
Ethiopia. which included three regional states and one city administration: namely:
;\mhara. Oromia. SNNP. and Addis Ababa (Table I and Figure 3). The area
geographically spans between 35°32' (Gore) to 41 °49' (Gam i'vluleta) longitude East
and 5"5.,' (Kibre Mengist) to II °50' (Debre Tabor) latitude north. The geographic
distance bctwecn populations ranges li'om 26 (Addis Ababa - Menagesha) to 700 km
(Gara ~'It"eta - Gore) Crable 8). Twenty one populations were selected from the
distribution range of the species in the country based on geographic location (degree
of isolation of populations). availability of trees (expected population size) and
availability of logistical support for sampling (access to transportation). The specilic
sites li'ClIll where samples were eollccted in each locality are described in Appendix I.
The altitudinal rangc of the populations is between 1584 III (Ilarenna) and 2XS9 III
(Debre I aboI') above sea level. Geographic coordinate. altitude and type of habitat lex
each locality are presented in Table I.
23

Tahle I. Description 01'21 sampling localities 01' PI'lIllI/S a!i'iclIIw in Ethiopia.
Lat Long Altitllde Locality Code SZ Hahitat
(N) (E) (III)
Addis Ababa AA 9°03' 38°46' 2335-2587 20.3 Park & Campus
2 Agerc Mariam AG 5°53' 38°16' 2239-2271 24.2 Farm
3 AIlHlllucl A~'I 10°31 ' 37"34' 2228-2298 20.1 Farm
4 Asell" AS 7"56' 3<)°08' 2390-2638 21.1 Farm
5 l3elklc 131) g02S' 36°22' 2026-2103 23.2 Fnrm
6 BOllga HO r16' J6°15' 1752-18'11 23.3 (Jrazing field
7 flulhci HU 6°17' 36°49' 2454-2485 23.3 Chllrch I(,rest
8 Chilil1lo CII 9°04' 38°08' 2403-2447 2004 State 1()I'est
<) I)en hc <>1'0 DE 10°49' 38°44' 2522-2678 20.2 Farm
10 Debrc Tabor 1)1' II °50' 38"00' 2716-2859 20.1 Church t(wests
II Clara Ivluleta GM <)°09' 41 °49' 2423-2536 21.2 Comillunal fixest
12 Gore GO 8°09' 35°32' 2011-2089 23.1 Grazing tield
13 i-IarellllH I1A 6°38' 39°42' 1584-160 I 24.2 National park
1'1 Ingih;lra IN 10°56' 36°56' 2624-2737 20.1 ('0111 III un,,1 forest
I,S J illllll;1 .II 70l12' 36°48' 1808-1880 23.3 Coftee timn
16 K ibrc !\Ilcngist KM 5u 53' 38°59' 1768-1823 24.2 Farm
17 Kuni KU 9°00' 40°50' 2339-250 I 21.2 Comlllllnal I'orest
18 Lcpis LP 7°IS' 38°48' 2209-2225 21.1 F arJll
19 iVIeIl~lgesha MN g058' 3Xo~n' 2294-2,111 20.3 State i()J'cst
20 Nehcemte NK 9"06' 36°36' 2182-2269 2004 farm
21 WofWasha WW 9°46' 39°46' 2568-2656 20.2 State lorest
Lat ~ latitude, Long ~ longitude, and SZ ~ seed zones according to Aalb",k (1l)'J.l).
24

........... ~.{ ~t ..•.. >-.. /' ........ . ,./ ."
Figlll'e 3. Map showing 21 sampling localities of P/1l1nts ajNealla in Ethiopia (See
Table 1 for population abbreviations).
3.2. Quantitative mOl'phological data collection and analyses
A total of 21 0 trees with stem diameter at breast height (DBH) greater than or equal to
30 centimeters were sampled from twenty one populations of P. a/tical/a. Five
economically important quantitative morphological traits; namely: total height, bole
height, DBH, bark thickness, and bark mass were measured ill situ for each tree. The
altitude, where each plant was found, was also measured with an altimeter.
Heights were measured using geometric methods (West, 2009) as illustrated in Figure
4 and described as follows: A tree of height h = AC, was standing on the ground. A
straight stick of known length I = BC was positioned vertically at the base of the tree.
25

I-Ieight or the tree was determined by standing at a convenient distance away 11'om the
tree and holding a graduated ruler DF in a position that the linc of sight 0(' to the
base of the tree was coincided with the zero mark of the ruler. Without moving head
up or down, the distance I' ~ FE was read li'om the ruler, which coincided with the
linc of sight OB to the top of the stick against the tree. The distance t ~ Dr was also
read fro III the ruler, which coincided with the line of sight OA to the tip of the tree.
Using geometric principles, the height of the tree was calculated Ii'olll these
mcaSUre1l1cnts as h = till'.
\
j' ) ~ 'c:':': = ~ {~ ~ ~ ~ ~ . , ........................ .
-- -- -- -----------,. ------ - ---- - - - - - -_ .. _--_ ..
<.
Figul'e 4. Principle of tree height measurcment using trigonometric methods (West,
2009).
lJBH was determined by measuring the girth of the stem at a height of 1.3m vertically
above ground from the base of the tree with a tape measure. To obtain 1)131-1, girth
measurement was divided by the mathematical constant pi (IT), which is the ratio of
the circumlerence of any circle to its diameter and has a value of approximately
3.142.
Hark thickness of standing trees was measured with a ruler and a screw driver basc:d
on the principles applied on bark gauge (Cunningham, 2001) as follows. The screw
26

driver was pushed through the bark until the resistance of the underlying wood was
lelt. ;\ rllbber band was wound around thc shaft of the screw driver adjacent to the
outer sllrlilce of the bark and then part of the screw driver that had been inserted was
measured with a ruler aftcr it was pulled out of the bark. Four bark thickness
measurements were made at right angles around the stem at a hcight of 1.3m and thcn
their average was taken.
Hark mass pCI' tree was calculated using the equation Mb = 0.0405216 (DI.OII'), where
Mb is mass of ti'csh bark in kg and D is the diamcter of the tree at breast height ill cm.
The eqll<ltion was developed by Betti and Ambara (20 II) for 1'. ,,/riml/" ill
Call1enHH1.
Descriptive statistics was lIsed to calculate means and standard deviations of the
quantitative morphological traits assessed. One way analysis of variance (;\NGVA)
and Dunnett '['3 post hoc test (tor multiple comparisons of means) were carricd out to
investig11le variation in quantitative morphological traits among the populations
surveYl'd. Pearson's correlation analysis was done to investigate the existence of
corrciatiPtls among the quantitative morphological traits and altitude. SPSS vcrsion
16.00 (SI'SS Inc .. 2007) was used lor the analyses.
3.3. Sample collection lor micl'Osatellit(· (SSH) investigation
I.eaf saillpies wcre collectcd fi'<lI11 trecs found at different habitat types including state
forests, Cllll1ll1l11Hll torests, church forcsts, cOIllll1unal grazing tields, public parks. and
crop 1[\1'1 11 S. FrOll1 each population, young leaves froll1 10 trees were collected and
dried in fip-Iock plastic bags with silica gel. To decrease the chance of sampling
closel) rdated individuals within a population, trees normall) a minimuill of about
27

100 III alld a maximulll of about 5 kill apart were sampled though the fonner criterion
was not I'ullilled in two of the populations. namely Denkoro and Wof Washa due to
scarcity ul'trces.
3.4. DNA isolation
Total genomic DNA was isolated ii'om 40 to 60 mg of dried leaf samples using triple
cetyltrimethyl ammonium bromide (CTAB) extraction technique modified by Borsch
c{ 01. ("Oll.l). However. in this study. the second extraction was used as the qualit), of
the DNA was better than the lirst extraction whereas its quantity was bettcr than the
third c\tractioll. The isolated DNA samples were rlill ill \lj{) agarosl' gel
eieetl'llpl",resis to check if the required quality and quantity of DNA was obtaincd
from thl' extraction, Concentration and purity of the DNA samples was further
dctcrm ined using ND-I 000 spectrophotometer (NanoDrop, USA).
3.5. Mierosatellitc (SSR) markcrs
A total lIl' 11 microsatellite (SSI<) markers originally developed for other species were
used (Appendix 2). Nuclear DNA waS studied at six microsatellite loci originally
charactcrized in peach IPr/llllls persico, primer pairs U3 (UDP9-403) and US
(UDI'9i>-O 18): Cipriani e/ 01 .. 1999: and 1'2 (PS 12/\02): Sosinski e{ {{I., 20001 and
wild elll'rry (l'nllllls ({ViI/ill, primers pairs EivlPaSO 1. EMPaS06 and EMPaS I 0;
Vaughan and Russell, 2004). These microsatellite markers were previously
transferred to Prill/liS {{Meal/{{ (Cavers ci al., 2009; Kadu el al .. 2013).
For the investigation of chloroplast DNA variation, live microsatellite loci originally
characterized in Japanese plum (Pnllll/s salicil/{I. primer pairs TPSCP I. TPSCP5 and
TPSCP 1 0: Ohta c{ ul .. 2005) and SOl'hlls III1CIII}(Il'iu (primer pairs rps 161'1112 and tl'l1T-
28

Lpml: (hcster 1'1 !I/.. 20(7) were used. These markers were also previously
transfl'rI\·d to /'I'III1I1S (lji'ic'(/}/(/ by Kadu 1'1 (1/. (20 II).
3.6. DNA ,"nplification and gcnot),ping
PCR re<lctions were perlormed in a 10 ~[L volume containing 1~[1. (10-70 ng) total
genomic DNA. 2.3 ~[1. KAPA2Gr,[ ButTer A (KAPAI:lIOSYSTEivIS). 0.05 mM or
each dN I~P. 0.21 mM or each primer. one or the tlVO being 5' labeled with a
tluoresccnce dye. 0.45 lJ KAPA2G"1 Fast DNA polymerase (KAPABIOSYSTEMS).
and autoclaved de ionized water. Amplilications were run on a. PTe~ I 00 thermo
cycler using the lollowing heating profile: a lirst step initial denaturing at 95 "C Ii)r 3
min j()II(lIved by 35 cycles. each consisting or 30 s denaturing at 94°C, 30 s annealing
at a specilic temperature (54 lie j()r all nSSR primers. 49 lie ror trnT~Lpml. 50 lie tor
TPSCP5 and rpsl6pm2. 53 lie lell' TPSePI. and 55 lie lor TPSCPIO). and 5 s
extcnsi'"1 at 72 0c. The last cyele lVas ended by an extra 30 sat 72°(' to cOlllplete
extcnsiullo
peR amplitied DNA ti'agment size was determined by capillary gel electrophoresis
using a ('EQHOOO sequcneer (Beckman-Coulter. USA). A volume or I ~,I. 1'('1{
product in 35 ~[L sample loading solution with 0.5 f1L DNA size standard (40Ilbp) lias
rllil in the sequencer which separates fragments using polyacrylamide gel in a
capillan svstem and generates cleetropherograms. Genotyping ofHmpliticd /i'atll11ents
was carricd out li'OIll the readings orelectropherogral11s produced lor each sample.
Some I'. aji'ic({i/{{ DNA samples or Kadu e{ a/. (20 II) were amplified and genotyped
along with the current samples as standards in order to compare and see how the
present data fit into previously published result.
29

3.7. Nllclear SSR data analyses
The microsatellite data set was checked for the presence or genotyping errors and null
alleles IIsing the program MICRO-CHECKER (van Oosterhout 1'/ III .. 2004).
Deviations "'om Hardy Weinberg eqllilibrium (HWE) were assessed IIsing CenAIEx
(>.501 (I'('akall and Smollse. 2006; 2012). Genotypic disequilibrium between loci was
tested IIsing Arlequin 3.5 (Excoftler and Lischer. 20 I 0).
Number of observed alleles (N,,). effective number of alleles (N,.). observed
heteroz\!,!llsity (110). IInbiased expected heterozygosity (H,). fixation index (F).
number uf private alleles (Ap). and percentage of polymorphic loci (PPL) per
populati,'" were calelliated using GenAl Ex 6.501 (Peakall and Smollse. 2006: 2012).
Allelic richness (R,) was calculated using FSTA T 2.9.3.2 (Goudet. 1995).
Phylogeugraphic signal was tested using SPAGeDi lAb (Hardy and Vekemans.
2002). whieh evaluates the contribution of the stepwise mutation in the ditTerentiation
pattern by comparing observed RSI with RSI obtained after 1000 allele size
permutations (pRsr). If stepwise mutations do not contribute to differentiation. FSI
and RSI values are equal. but RSI is expected to be significantly higher than me,1Il
permuted Rsr under a phylogeographic pattern if stepwise mutations contribute to
d i ftcren t iat ion.
Dcndro~ralllS were produced lIsing Lin weighted pair group method arithmetic average
(U I'G~'I;\) based on Cavall i-Sforza and Edwards (1967) chord distances aller creating
1000 bootstrapped matrices in M I(,ROSA TELLITE ANALYSER (MSA) (Dieringer
and Sehlotterer. 2003). The computer programs NEIGHBOUR and (,ONSf.NSE in
the I'll Y LI I' 3.63 package (Felsenstein. 1989) were used for tree constructioll.
30

Additionally, principal co-ordinate analysis was conducted using GenAIEx 6.501
(Peakall and Smouse, 2006; ~O 12) to explore multivariate relationships among inter
individual Nei's slandard genetic distance (Nei. 1972).
Analysis or molecular vanance (AMOYA) was carried out uSlllg Arlequin J.5
(Excof'lln and I -ischer. 20 10) to investigate population dirferentiation at various
levels oj' subdivisions del1ned based on geographical units, tree seed zones, and
individual-based popUlation clusters uSlllg both FST and RST in separate analyses
based on 10 aoo permutations.
The model-based Bayesian clustering method implemented in STRUCTURE 2.3
(Pritchard "I (1/" 2(00) was used to intCr clusters by assigning individual multi-locus
genotypes probabilistieally to a user del1ned number or K clusters. The admixture
model \\ ithout incorporation or population information was L1sed assuming correlated
allele li'l'quencies using K values ranging from 2 to 21, run lengths.of SOO UOO
iterations with a burn-in period or 200 000. Five rLins per K were performed on the
total dal;] set. The most likely number or clusters was interred using the I'.K statistic
or Evanno ('I a/. (2005) implemented in STRUCTURE HARYESTER 0.6.93 (Earl
and von Iloklt. 2012).
Pair-wist' population comparisons based on Nci's unbiased genetic distance (Nei.
1978) and difterent indices of population differentiation CST (Wright, 1(43). G''s I
(1v1einll<lns and Hedrick. 20 II) and Dc·" (,Iost. 2008). as well as correlation analysis
between genetic and geographic distance matrices (Mantel, 1967) to test the
hypothesis of isolation by distance were computed using GenAIEx 6.50 I (Pcakall and
Smouse. 2006; 2012).
31

3.8. Chloroplast SSR data analyses
Seven sillgle loci, namely TPSCPI. TPSCP5, TPSCPIO, rpsl6pm2a. rpsl6pm2b,
trnT-I.pml n, anel trnT-Lpml b were combineel to construct multi-locus haplotypes
usillg (;"IlAIEx 6.50 I (Peakall anel Smouse, 2006: 2012). The last four loci are inelels
(illsertion/deletion) of 5-26 base pairs t'lUnd in the tlanking regions of the loci
rps 16pl1lc and trnT-Lpml (Kadu e/ III .. 20 II). In constructing multi-locus haplotypes.
the present data were combined with the data set of Kadu el al. (20 I I). comprising
haplotypes from the main block of the specie's geographic range across sub-Saharan
A li'ica, to see how the current data tit into the previously publishecl result.
The IlLII1lhcr nf haplotypes per populatinn (N,,). the effective number of haplotypes
(N,.). tilt' number of private haplotypes (N,,) and haplotype diversity (1-1,.) were
calculal''tlusing GenAIEx 6.50 I (I'eakall and Smouse, 2006: 2(12).
Haplotype relationships were inferred by constructing a statistical parsimony nelwork
tollowing a Iwo-step strategy according to Banter el al. (2006). This proceclure
accounts lor the (presumably) different mutation rates underlying indel anel
microsatellite variation. First, haplotype data ti'OJ11 the indel variation \\'ere employed
to eonslruct a backbone network using TCS 1.18 (Clement el al .. 2000). Second, the
net\\ ork \Vas enlarged by adding the variation at l11icrosatellite loci manually at the
respective positions of the backbone. Haplotypes were coded following Kadll eI II/.
(20 II).
Total haplotype diversity (hT) and average within population haplotype diversity (hs)
were calculated according to Pons and Petit (1995; 1996) using the sotlware
PERM liT (http://www.pierroton.inra.ti·/gcneticsllabo/Software). To test for the
32

existence of phylogcographic pattern in haplotype diversity, the two measurcs of
differentiation NST and GST, which are based on ordered and unordered alleles,
respccti\'l~ly, were compared. Significance was tested based on 1000 permutations.
I\nal)'sis of molecular v'manee (AiV10VA) was carried ,,"t tu determine the
proportiun of haplotype variation within individuals and among populations. Mantel
test was done on genetic and geographic distance matrices to test the hypothesis of
isolation by distance. Both AMOVA and Mantel test were computed using Gelll\IE.s
6.501 (I'eakall and Smouse, 2006: 2012) and signilicances were tested based on 9999
perm utat i(JIls.
3,9. I~thn()hotanic data collection and analyses
Etl1l10butanic data were collected from October 2011 to May 2012 fi'OI11 20 localities
Crable I. excluding Addis Ababa). In total. 100 informants (5 per locality) belonging
to the ")lIowing flve ethnic groups: Oromo, Amhara, Awi, Gom, and Kem, were
i ntcrv ie\\ cd. Fi rst. local authorit ies i nelud ing kebele adm in istrators, agricul tura I
development agents and elders were communicated to explain the researchers'
intention and request recommendation for informants (traditional healers and people
with most probable knowledge about the plant). Based on recommendations,
informanls were contacted and briefed about the aims of the study and gave verbal
prior inf()rmed consent. Inlormants were ensured of the anonymity of their personal
information provided to increase the chances that they would provide genuine
rcsponsc\. Interviews were conducted individually to prevent inlormants from being
inlluenct'd by each other and to respect their individual medical secrets. The whole
plant or a branch with li'esh leaves, flowers and Ih,i!s of P. '{theaI/O was shown to the
informants and asked to identify, name and describe it in their mother language, or
33

they were asked whether they knew the plant by telling the local name, showing
pictures and giving descriptions of the plant to them. Semi-structured interviews were
undertaken using the pre-prepared interview guide (Appendix 13) and conversations
were held with the help of local assistants. With most of the informants interviews
were carried out ill Amharic language. but I1JI' some (who can't speak Amharic)
qLlcstioll~ wcre translated into their local language with the assistance of native
interprt'ilTs. Questions were asked in a stepwise manner by til'st asking relevant data
011 their age. address, level of education and occupation. Following that, informants
were asked to share thcir knowledge on the plant. Questions asked during the
interviews were related to the importance of the plant; medicinal and non-medicinal
llses: parts lIsed, method of preparation. route and dose of administration, traditions
and stories about the plant (Appendix 13). Qualitative and quantitative data allalyses
metholb were employed to describe and present the information collected.
34

CHAPTER 4: RESULTS
4.1. Quantitative morphological traits
The mean values tor quantitative morphological traits measured in silu on 21
populati"ns of 1'. IIIi-ielln({ are shown in Table 2. The five quantitative morphological
traits had the 1"llowing mean values over all populations: total height (19.3 I 6.1 m),
bole height (7.4 + 3.7 m), diameter at breast height (DI3H) (70.2 ,. 28.5 cm). bark
thickness (20.3 + 3.2 mm), and li'esh bark mass (159.6 + 124.3 kg) Crable 2). The
highest Illean values per population for the live quantitative morphological traits- total
height (~(i.2 m), bole height (13.8 m), DBII (109.1 em), bark thickness (23.3 mm).
and fresh bark niass (333.6 kg) - were recorded in 8ulki, Bulki, Lepis. Assela. and
Jimma. respectively; whereas the lowest corresponding mean values were ill the
1()lIowill~ populations: total height (14.4 m) and bark mass (51.7 kg) in Wof Wash,.,
Dfll-l (3'i.'! em) and bark thickness (14.6 n1ln) in Nckemte, and bole height (3.9 m) in
Ingibara. Mean values of morphological traits may vary according to ages of
populati()ns but it is dimeult to inler agcs of populations based on these mean values
of morphological traits because of two reasons. First, inferences of population ages
based on different traits (e.g. lor height ancl DI3H) cannot bc the same. Second, we are
not sure to what extent environmental factors affect the traits. For example, I have
observed tlwt trees inside lorests tend to be taller and thinner than trees on open areas.
35

Table 2. Mean vailles (with standard deviations) for quantitative morphological traits
measured ;us;11I on 21 populations of PruUIIS ({Ii';ew/([ in Ethiopia.
Total Bole height Bark thickness Populatioll
height (m) DBII (em) Bark mass (kg)
(m) (mm)
BlJ 29.2 (6.7) 13.8 (3.3) 64.8 (14.6) 20.9 (1.5) 124.7 (50.9)
.II 24.7 (5.4) 6.0 (1.3) 106.1 (33.9) 20.9 (3.2) 333.6 (197.5)
1.1' 24.4 (4.2) 10.6 (2.7) 109.1 (17.6) 22.8 ( I. 9) 331.8 (99.6)
GO 23.0 (5.6) 8.9 (2.8) 74.8 (15.5) 22.2 ( I. 9) 162.3 (63.0)
BD 22.0(7.4) 7.9 (1.9) 81.6(19.90 21.7(3.4) 194.9 (95.4)
A(; 21.7 (8.4) 10.4 (3.8) 69.9 (19.9) 20.0 (4.3) 146.2 (77.7)
KM 21.4 (8.1 ) 7.9 (1.8) 72,9 (39.3) 20.0 (2.S) 184.3 ( 194.2)
130 19.6 (5.8) 9.3(2.1) 63.8 (23.3) 20.0 (4.1) 128.7 (86.7)
HA 19.6(2.4) I 1.6 (1.8) 66.7 (17.8) 18.8 (1.5) 133.8 (62.6)
CII 18.4 (4.0) 7.5 (2.5) 59.9 (21.3) 20.8 (2.6) 112.9 (77.1)
KU 18.1 (6.6) 9.0 (6.5) 80.4 (24.9) 19.9 (0.9) 195.4 (108.0)
I)T 17.9 (3.3) 5.2 (1.6) 66.8 (23.S) 21.6 (2.4) 139.2 (92.2)
MN 17.4 (3.3) 6.4 (2.5) 48.2 (28.2) 20.5 (2.0) 86.1 (124.2)
NK 17.2 (4.9) 5.7 (4.2) 39.9 (14.3) 14.6 (4.7) 52.1 (38.1)
/\S 16.9 (2.6) 5.2 (1.6) 98.3 (21.4) 23.3 (3.0) 276.6 (109.4)
AA 16.5 (2.8) 5.7(2.4) 48.9 (13.8) 19.8 (4.1) 74.4 (41.4)
DC 16.5 (3.8) 5.5 (2.5) 87.3 (14.9) 21.5 (2.2) 216.9 «)2.9)
Ai',,1 15.S (3.5) 4.4(1.7) 71.2 (22.6) 19.5 (1.5) 154.9 (97.3)
Givl 15.2(4.4) 5.1 (1.'1) 64.2 (25.8) 20.4 (0.7) 132.7 (95.6)
IN 15.0 (4.9) 3.9 (2.4) 57.8 (31.3) 17.4 (1.5) 118.1(147.5)
WW 14.4 (2.9) 4.7 (2.4) 41.3 (7.0) 19.2 (1.5) 51.7 (17.9)
Average or
all sample, 19.3 (6.1) 7.4(3.7) 70.2 (28.5) 20.3 (3.2) 159.6 (124.3)
36

One-wu.\' analysis of variance (ANOVA) revealed that there was statistically
signiticant variation (I' ,., 0.000) among the populations of P. ({/heal/o in the
quantitative morphological traits assessed (Table 3). further analysis by Dunnett T3
post hoc test showed that 9.0%, 20.0%, 11.9%,6.2% and 9.5% of the population pairs
(a total of 210 pairs) were significantly different in their mean total height, bole
height. ImH. bark thickness. and bark mass, respectively (P < 0.05) (Table 4).
PearSOll-:"; correlation analysis revealed signifIcant positive correlations among all
quantitative morphological traits, except between bole height and bark thickness (I' <
0.01). I·urthermore. all quantitative nlllrphological traits. except bark thickness,
showed significant negative correlations with altitude (I' < 0.05). However, bark
thickness correlated positively with altitude though not significant (r ~ 0.039, P >
0.05) (Table 5).
Table J. ;\nalysis of variance (i\NOV i\) results for five quantitative morphological
traits among 21 popUlations of Pi'll/IllS a/i-ic(/}li/ in Ethiopia.
~'lorpIHlI()gical trait Sum of Squares df Mean Square F P
Total height 2919.067 20 145.953 5.566 0.000
Bole height 1426.067 20 71.303 9.188 0.000
DBH 72283.457 20 3614.173 7.017 0.000
8ark thickness 706.381 20 35.319 4.881 0.000
Bark m~I""'" 1239959.791 20 61997.990 5.889 0.000
37

Table 1. Dunnett T3 multiple comparison results for 5 quantitative morphological traits of21 populations of Prunus africana in Ethiopia. (Only
significant mean differences at the 0.05 level are depicted: H = total height, B bole height, D = DBH, T bark thickness and M = bark mass).
For population acronyms see Table L
AA AG AM AS BD BO BU CH DE DT GM GO HA [N Jl KM KU LP MN NK WW
AA D.M D,M D D.M
AG D.M
AM
AS T D D,T,M D,M
BD D D
BO B B D,M
BU H,B H,B H,B B T D,M
CH B D,M
DE H,B T D,M D,M
DT B H,B T D,M
GM B H,B T D,M
GO T T D,M D,T,M D,M D,T,
HA B B B B B B B M
IN B B H,B B T
Jl H B B D D
KM B B B
KU
LP H H,B H,B H,B B H,B H,B B D,M D,T,M D,T,M
MN H,B B
NK H,B
ww B H,B B H H,B
38

"
Table ~. Pearson's correlations among quantitative morphological traits of Prlfl1l1S
{I/i'ic{I!lu trees in Ethiopia (I' is belol\' diagonal and P is above diagonal).
Total Flole Bark
height height OBH thickness Bark mass Altitude
Total hei~dll 0.000 0.000 0.001 0.000 0.000
Bole heii!ht 0.667"' 0.000 0.180 0.003 0.000
DI3H 0.573 0.242 0.000 0.000 0.1J32
Hark thickness 0.234"' 0.093 OA06" 0.000 0.572
Bark Illa-..s 0.555" 0.203" 0.980" (1.322" O.0l7
Altitudl' -0.283' -0.330 -0.148' 0.039 -0.144'
** Correlation is signitieant at 0.01 and * at 0.05 level (2-tailed t-test).
4.2. Nude'll' micl'osatellitc mal'kers
4.2.1. (;,'nctic diversity within populations
A total or 89 alleles were revealed at the SIX mierosatellite loci all ovcr the
populations (mean number or alleles per locus was 14.83). Thc most variable locus
was EMI'ASIO with 27 alleles, while the least variable one was U3 with only 2 alleles
(Appendix 3). Eight of the populations (OT, HA, IN, LP, AG, WW, GM and AM)
were tixed ror a singlc allele at locus U3. The total genc diversity (H,.) for the spccies
was 0.725; whereas the mean within population genc diversity (Hs) was 0.640. The
observed (Ho) and expected (He') heterozygosities rangcd from 0.433 (Gara Muleta) to
0.8:\.\ (/\ddis Ababa) and 0.452 (Oenkoro) to 0.732 (Addis Ababa) respectivel).
Allelic richness (R,) ranged ti'Olll 2.667 (Wof Washa) to 7.167 (Nekemte) with all
1l)

average of 5.063. The mean value Illi' the number of eflective alleles (N,.) was 3.408
with the highest being in l3edele (4.47<)) and the smallest in Denkoru (1.992). Must of
thc populations had negative Jixation index (F); only illur populations (NK. CI-I, AM
and GM) had positive values.
Private alleles were dctected in more than 65 percent uf the populations (Table 6),
signaling regional divergence among the populations of P. q/i'icmlll in Ethiopia.
Bedele had 3; Nekcmte, flulki. Amanuei. Gore and Harenna each had 2: Addis
Ababa. Honga. rVlenagesha. Asella. Kuni. Dcbre Tabor, Lepis and Gara ivlulcta each
had I private allele. The li'equencies of the private alleles lVere generally;> 0.05. The
observed number of alleles, elkctive number of alleles, ubserved and expected
heterozygosities, fixation indices, and percentages of polymorphic loci: all averaged
over loci arc shown in Tablc 6.
Though ,ome populations showed heterozygote deliciency or excess, only one highly
signilicant deviation from HWE (I' < 0.001) was detected (population DE; Appendix
4). Linkage disequilibrium between loci within populations was also detected in sOllle
populations at some loci (Appendix 5).
40

Table 6. Genetic diversity indices based on six nSSRs I()r 21 populations oj' PrJ/JIIIS
(!/;-ic{/J/{f in Ethiopia.
Population II" F
AA 6,167 3,<)02 0,833 0,732 -0,216 6,167
MN 5.500 4.092 0,717 0.704 -0,079 ),500
PPL
IOO,(J
100,0
ell ),167 H46 (J,GI7 0,672 0,025 ),167 0 1 OIl. 0
WW 2.667 2,280 0,633 0.498 -0.356 2.667 0 83..1
IN 4,333 3.299 0.683 0,639 -0,121 4.333 0 83.3
AM ),000 3.563 0.600 0,627 0.004 5.000 2 83,3
Dr 4,167 3,()99 (),750 0,619 -0.283 4,167
DE' ),333 1.992 0.550 0.452 -0, I gO .U.l3 () 100.0
riO 6,000 4,277 (J.7l? 0.731 -0,034 6,000 IO(),O
HD 6.333 4,479 (J.717 O,7IS -0.059 6,333 3 J()(),O
NK 7.167 4,064 0.667 lUIS (L005 7.167 2 IO(J,()
(lU 5,667 3.'160 (l,GS3 0,709 -0.020 5.667 2 WO.O
GO 5,833 4,057 0.750 0,687 -0.141 5,833 2 100.0
.II ),667 3.443 0,683 0,686 -0.058 5,667 0 100,0
AS
KlJ
5,833 3,532 0,800 0,702 -0,191 5,833
4,SOO },185 0,783 0.682 -0,230 4,SOO
I (lO,O
IOO,Q
K M 5.500 .1.038 0.717 0,617 -0,206 5,500 {) 100,0
IIA 033 3.'199 0,683 0,608 -0,203 4J33 2 83..1
1.1' 5.167.1.378 O.GOO 0,602 -0.020 5,167
;\(; 4,SOO ],062 0.617 0,592 -(J,OS6 ~1.5()O 0 83.\
GM .UOO 2,218 0.433 OA84 0.01:' 3.500
Nn ~ Number of observed alleles, Nc ~ number of effective alleles. H" observed
hcterolygl)sity. He ~ unbiased expected heterozygosity, F ~ tixation index. An ~
number "I' private alleles. f'PL. percentage of polymorphic loci, and R, average
allelic ri"llIlcss [N" and fl., are the same because of equal sample SIze III each
popul"t ion (11= 10)].
41

"
4.2.2. Cenetic strnetnre of populations
4.2.2.1. I{<'gioual pa ttern of genetic diversity
All the I'"pulations (i'om southwestern (SW) part of Ethiopia were polymorphic at all
the six Illei (I'PL c. 100.0); whereas only 25.0%, 42.8% and 75.0% of the populations
li'om northern. southeastern (SE) and central Ethiopia. respectively. were polymorphic
at all till' loci. The remaining percentages of populations li'om these regions had a PI'L
value of X3.3 (Table 6). Similarly, allelic richness (R,) was above the average value
for all till' populations from S\V Ethiopia: whereas it was above the average value
only I(ll -'5.0%. 42.8% and 75.0% of the populations from north. SF anti central
Ethiopia. respectively. When counting the number of private alleles at regional level.
populati()ns from SW. SF. northern and central Ethiopia had a Illean number of 1.67,
0.86. 0.7' anti 0.50 private alleles, respectively.
4.2.2.2. Differentiation among populations
Overall differentiation alllong populations was highly signiticant for both the indices
based ,111 unordered alleles (FSl 0.122, P c. 0.000 I) and based on ordered alleles
(RST II 186, P 0.000 I). Higher values were lound lor G"ST (0.339, P '.' o.aoo I) and
D,,, (0.".17. I' ~ 0.0001). Comparison of RSI and pRsr values revealed that the nuclear
microsall'llile diversity of P. ({/i'iCWl(l had marginally significant ph)~logeographic
signaturl' with pRS1 '0.125 ancl RSl > pRST (I' ~ 0.047).
The relationship among populations based on a bootstrapped Cavalli-Sfoua and
Edwan" (1967) chord distance matrix is shown in the UI'GrvtA tree (Figure 5).
General". clustering within the populations revealed geographic pattern with slight
l11ismatrl,es. All of the populations from northwestern side of the Great Rili Valley
42

(except DE, WW, MN and BU) grouped into one cluster; whereas populations from
the southeastern side of the Great Rift Valley (except LP) aggregated into a separate
cluster. However, when UPGMA analysis was done together with populations from
other African countries (including the data set of Kadu et al., 2013), all of the
Ethiopian populations (except DE) were grouped together in a separate cluster
(Appendix 10).
DE
WV"J
WI
AG ¥
I(U )(..
HA )(..
l(f,1 ¥
Gr.I¥
BU
AS ¥
GO
60
JI
III
CH
N.I
DT
SD
tp¥
Figure S. UPGMA dendrogram for 21 populations of Pl'lll1l1S (!/i'icana from Ethiopia
(Populations located southeast of the Great Rift Valley are marked with asterisk).
43

In the principal co-ordinate analysis (peoA), 62.2% of the variation is explained by
the first three principal axes; first axis (27.8%), second axis (20.4%) and third axis
(14.1 %). Gcnerally, the principal co-ordinate analysis revealed phylogeographic
pattern in the nuclear microsatellite diversity of P. aji'iclIlIlI. Most of the popUlations
are distrihuted within the space of the first two principal coordinates in a similar
pattern as their geographic distribution in the country. Along Principal Coordinate
Axis 2. all of the popUlations occupying the right side of the plots were sampled ii'om
the northwestern side of the Great Rill Valley. while about 64 % of thc populations
occupying thc lell side of the plots were sampled Ii'om the southeastern side of' the
Great Rifi Valley. Generally, popUlations sampled hom near the central part of the
countr) tend to occupy around the origin of the coordinates: whereas populations
sampled f;lr from the center of the country tend to occupy f'lr from the origin of the
coordinates (Figure 6). The population ii'om Denkoro is clearly separated ii'om the
rest of till' populations. Similar to the result of UPGMA clustering. when l'C'oA was
done using the combincd data (including the data set of Kadu e/ a/., 2(13) all of the
Ethiopian populations were grouped together in a separate cluster from other African
populati()ns (Appendix II).
44

<> 'I'll' nil
NK /> () IN <.' DT
.. \, ... , " ,) ()" (> ('JI
• GO '
BOV. <; AA ~l • AG • LP i\fN: .;!; . <> Btl ~ (,> Ai\I -r,
• Jilll
• GM
<> .11
Axis 1
DE<;
Figure 6. Principal Co-ordinate Analysis showing the multivariate relationships of 21
Prill/liS qfi'ic[[l/[[ populations from Ethiopia. Populations southeast of the Great Rift
Valley are marked with dots and populations nOlihwest of the Rift Valley are marked
with diamonds.
Generally, individual-based population assignment using admixture analysis in
STRUCTURE revealed low assignment coefficients for the specific clusters
illustrating weak population clusters. On the other hand, STRUCTURE
HARVESTER 0.6.93 (Earl and vonHoldt, 2012) identified the most likely group
structure to be seven as ""In P(D) reached a maximum at K = 7 (Appendix 6 and 7).
However, at K = 7 most of the clusters showed heavy admixture from other clusters
(Figure 7). Similar to the results of UPGMA and PCoA analyses, all of the Ethiopian
populations were grouped together in a separate cluster from other African
populations (Appendix 12).
45

Figul'e 7. Results of individual population assignment (admixture model) performed
with STRUCTURE for 21 Prlmlls ajl'icalla populations from Ethiopia (K = 7).
W4~n analysis of molecular variance (AMOVA) was done using FST as measure of
differentiation, the molecular variance was partitioned into 11.95% among
populations and 88.05% within populations. However, when R~l' was used as measure
of differentiation by taking allele size and stepwise mutation into account, 18.0% of
the variance was found among the populations. Analysis of populations based on
geographical units, tree seed zones, and STRUCTURE based clusters using R~T
revealed significant differentiation among the groups. However, when Fs'l' was used
there was no significant differentiation among the tree seed zones (Table 7).
46

Table 7. Partitioning of variation based on six nuclear microsatellite loci among 210
Prlll1lfS u/l'icl1l1u individuals in Ethiopia computed by analysis of molecular variance
(AMOV i\).
F, ... I RS'I
Source' of 'X) IX)
variation df SS ve variation P SS ve variation P
Among popul,ltiolls 20 143.01 0.26 11.95 *** 10492.99 21.37 18.00 ***
Within POPlll,llions 399 768.15 1.93 88,(1) *** 38839.30 97.3'1 82.00 ***
Among 7 clusters 6 71.57 0.12 5.'12 *** 6258.26 12.96 10.75 **
Among populations 14 71.44 0.16 7.21 *** 4234.73 10.26 8.51 ***
within clusters
Within populations 399 768.15 1.91 87.37 *** 38839.30 97.34 80.74 *** Among seed Innes 9 68.13 0.02 0.84 NS 7502.06 13.5'1 Il.1c **
Among populations II 74.88 0.24 11.16 *** 2990.93 8.73 7.30 ***
within seed zOlles
Wilhin populations 399 768.15 1.93 88.00 *** 38839,30 97.34 SI.JS ***
Among geog., IlllilS 3 30.44 0.03 1.56 * 3243.09 6.36 ).30 * Among POPll1<lliollS
17 112.57 0.23 10.70 *** 7249.90 16.46 1.1.70 *** within geog. wlits
Within popul<lIions 399 768.15 1.93 87.74 *** 38839.30 97.34 81.0 I ***
d r ~ degree of freedom. SS sum of squares. ve ~ variance components. * r <. 0.05.
H I' <. (J.O I. *** P <. 0.00 I, and NS ~ non-significant (I':> 0.05)
47

4.2.2.3. Pair-wise population comparisons
Pair-wise population matrix of Nci's unbiased genetic distances and geographic
distances for 21 P. (!!i'icollo populations is presented in Table 8. The highest genetic
distance (1.040) was between Denkoro and Wof Washa populations; whereas the
smallest distance (0.0 I 0) was between Chilimo and Bedele populations. Pair-wise
comparisons of populations using the three indices of population differentiation [Fsr
Crable I) I.. G"" (Appendix 8) and D", (Appendix 9)] also showed that the highest
genetic differentiation was between Denkoro and \Vor V./asha; whereas the lowest
was between Chilimo and l3edele populations, which are in agreement with Nei's
genetic distance values. The pair-wise comparisons orpopuiations lIsillg FST, G"S"[ and
1\." rel'l'aleel that 95.7%, 95.7% and 96.2% of the population pairs (a total of 211J
pairs), respectively, were significantly difterentiated (I' < 0.05) (Table 9, Appendices
Sandt))
4.2.2.4. Correlation between genetic anel geographic distance matrices
rhe i'vIalltci test lor isolation by distance revealed a signilicant positive correlation
between genetic distance and geographic distance matrices for 21 P. ({/j'ic([Iw
populations in Ethiopia based on six nuclear mierosateliite loci (Rx)' = 0.126. I' <
0.001) (Figure 8).
48

Table 2. Pair-wise population matrix of Nei's unbiased genetic distance (above the diagonal) and geographic distance in km (below the
diagonal) among 21 Prunus africana populations in Ethiopia.
DE
DT NK
JI
IN
GO
SD
eH AA
MN
AM
LP SO AS
SU
HA
lG.\f
GM
AG
KU
WW
DE
138
302
406
197
459
368
205
196
207
132
391
480
324
546
477
549
385
551
306
163
DT NK Jf IN GO SD eH AA MN AM LP SO AS SU HA KM GM AG KU WW
0.706 0.689 0.471 0.634 0.546 0.582 0.489 0.545 0.599 0.484 0.614 0.541 0.740 0.567 0.812 0.545 0.698 0.773 0.978 1.040
0.164 0.209 0.130 0.148 0.078 0.158 0.183 0.260 0.238 0.247 0.220 0.436 0.497 0.332 0.350 0.494 0.324 0.418 0.527
340
478
153
491
415
308
321
324
154
512
543
451
631
608
670
513
662
442
300
157
207
158
75
168
238
215
190
314
207
307
314
438
444
573
402
465
355
0.123 0.103 O.1I7 0.091 0.048 0.299 0.191 0.220 0.292 0.130 0.260 0.320 0.250 0.303 0,428 0.364 0.3 0.328
360
148
98
211
263
239
324
225
77
258
158
341
315
575
259
467
399
0.120 0.249 0.125 0.141 0.196 0.265 0.283 0.289 0.148 0.224 0.316 0.356 0.422 0.483 0.382 0.315 0.446
0.122 0.110 0.100 0.298 0.255 0.202 0.306 0.131 0.234 0.376 0.273 0.397 0.451 0.403 0.433 0.355
345 0.101 0.134 0.293 0.196 0.100 0.162 0.125 0.343 0.294 0.214 0.189 0.295 0.215 0.365 0.300
281 98
246 303 205
290 369 272
281 344 246
83
453
415
412
517
567
605
570
580
478
336
345
372
126
397
251
489
457
700
393
590
499
263
298
134
310
248
420
407
604
356
494
400
0.01 0.062 0.115 0.094 0.089 0.048 0.170 0.201 0.126 0.157 0.269 0.172 0.223 0.470
0.145 0.118 0.073 0.173 0.104 0.102 0.184 0.102 0.155 0.260 0.258 0.222 0.437
70 0.212 0.148 0.151 0.066 0.202 0.203 0.238 0.205 0.275 0.270 0.197 0.641
47 26 0.119 0.155 0.123 0.199 0227 0.171 0.196 0.193 0.164 0.230 0,421
173
210
288
167
342
321
366
405
354
297
195
209
195
341
131
375
288
353
335
356
227
136
203
187
316
132
354
289
346
359
344
251
160
49
382
389
335
478
491
538
490
521
396
255
0.105 0.062 0.267 0.229 0.130 0.051 0.039 0.154 0.188 0.336
0.100 0.266 0.276 0.127 0.Q78 0.183 0.058 0.251 0.365
281 0.194 0.044 0.141 0.071 0.164 0.121 0.165 0.254
79
246
124
159
391
168
293
294
326
126
387
339
647
271
540
476
315
157
229
325
247
221
215
0.151 0.032 0281 0.279 0.278 0.186 0.524
0.238 0.205 0.296 0.282 0.247 0.392
321
244
0.125 0.154 0.164 0.196 0.358
115 0.083 0.079 0.179 0.320
636 364 479 0.172 0228 0.360
166 179 79 534 0.312 0.237
536 291 402 109 447 0.478
505 348 440 235 462 145

Table 3. Pair-wise population matrix of FST values for 21 Prunus africana populations in Ethiopia (FST values below the diagonal and
probability, P based on 9999 permutations, above diagonal).
DE
DT
NK
JI
IN GO ED
cn AA.
MN
AM
LP
EO
AS BU
HA
KM
GM
AG
II..'U
ww
DE DT NK JI IN GO BD CH ..... ***
0.207 *** *** u* ** 0.182 0.064 NS
0.156 0.074 0.050 *'" *** ... ** 0.192 0.060 0.050 0.054
0.168 0.062
0.168 0.046
0.162 0.065
0.161 0.067
0.173 0.082
0.169 0.086
0.198 0.091
0.160 0.073
0.191 0.1l0
0.168 0.1l7
0.049
0.042
0.036
0.072
0.060
0.073
0.089
0.048
0.070
0.078
0.073
0.050
0.057
0.061
0.074
0.087
0.092
0.054
0.068
0.081
0.224 0.107 0.081 0.102
0.183 0.109 0.089 0.111
0.246 0.164 0.136 0.150
0.224 0.108 0.102 0.109
0.221 0.110 0.079 0.084
0.287 0.166 0.116 0.140
** * 0.054 .* 0.051 0.046 NS 0.050 0.054 0.029
0.083 0.075
0.Q78 0.063
0.076 0.051
0.100 0.067
0.064
0.Q75
0.097
0.093
0.114
0.152
0.119
0.050
0.086
0.078
0.077
0.071
0.115
0.079
0.037
0.047
0.049
0.050
0.034
0.057
0.061
0.058
0.063
0.lD7
0.069
0.054
0.051
0.045
0.070
0.047
0.047
0.062
0.053
0.064
0.109
0.089
0.109 0.091 0.067 0.071
0.130 0.1l3 0.139 0.141
AA MN AM LP SO
*** *** *.* ***
** * ... ,,* *** *.* ** .. ** """ ** NS • " .. NS * .. • * NS ** "
-*'" ... NS
0.062 ** .. * " 0.060 0.055 .. NS
0.063 0.065 0.056 ..
0.037 0.048 0.042 0.053
0.061 0.062 0.082 0.086 0.060
0.060
0.Q78
0.071
0.066
0.067
0.071
0.Q75
0.062
0.041
0.087 0.034
0.063 0.061
0.049 0.045
0.108 0.091 0.046 0.094 0.085
0.086 0.068 0.070 0.044 0.058
0.062 0.069 0.070 0.085 0.057
0.160 0.133 0.128 0.138 0.101
>I< P < 0.05; ** P < 0.01;** P < 0.001; NS, non-significant (p;::: 0.05)
50
AS
*". * ... ... * ••• .** • *. ** ..
** *** *** "'''
0.054
0.048
0.086
O.lll
0.090
0.062
0.150
BU HA
• *. .* •
"** * .. * **. "**
"'** *** *** ** ** ** ** *** ***
*** ** *** .. * NS ** ** **
**" 0.080
0.072 0.062
0.113 0.085
0.090 0.073
0.071 0.Q73
0.128 0.135
KM GM AG
"'**
***
*"' ..
*""
'" ..",
*"'.
0.061
0.050
0.069
0.126
n. ... *
**. *,," *** ""* **. *** * lit'" **
*** *** NS ..
*** * *** ** *** ***
*iIt *** .'" **
*** 0.091
0.101 0.098
0.160 0.108
KU ww .*" *"* *** ...* ** • ***
***
***
.** .... *.
*** *** ***
*,,>1< * .. * * .... *".
***
*** * ...
*** "'" .. *."
u* ,,*. ***
0.146

" .:-~ '1 \:-(-:;<) ¢ '}}-.} ;.) ., (.;-;) (u') Q O-<i' ¢;;. "'\.
'" <-)') {;.> ,~
<-;9 (;$- ., ., , ,~~ ., <--}t) 1~! Q
'} '{:-' '" .!j
>
1.0 {
0.5
0.0';'" -----.-------,-------------------_------l o lOu 200 300 6DO 7(}O soo
Gt{'graphk Dhl;lIu'e (kill)
Figure 8. Correlation between geographic and genetic distance matrices of 21 Prunlls
qfi'icana populations in Ethiopia.
51
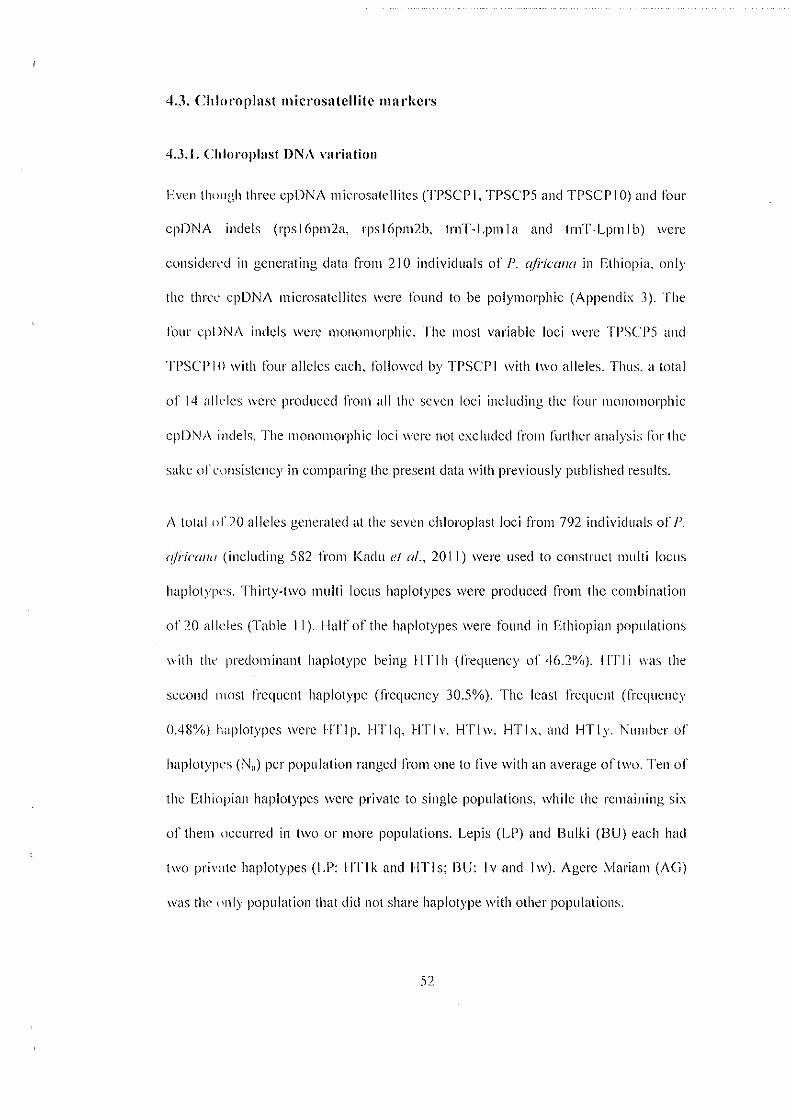
4.3. Chloroplast microsatcllitc markers
4.3.1. Chloroplast DNA variation
Even th(lugh three cpDNA m icrosatellites (TI'SCP I. TPSCPS anel TPSCP I 0) anel four
cpDNA inelels (rps 16pm2a. rps 16pm2b. trnT-Lpml a and trnT-Lpml b) were
considered in generating data li'om 210 inelividuals of P. {I/i-ic{ll/{/ in Ethiopia. only
the three epDNA mierosatcllites were found to be polymorphic (Appendix 3). The
Il)ur epl lNA inelc1s were monomorphic. The most variable loci were TPSCP5 and
TI'SCPlllwith four alleles each. Il)lIoweel by TPSCPI with two alleles. Thus. a total
of 14 alleles were produced li'om all the seven loci including the lour monomorphic
epUN!\ inelels. The monomorphic loci were not exclueled from further analysis Illi' the
sake of e(lnsistency in comparing the present data with previously published results.
A total (lJ' 20 alleles generated at the seven chloroplast loci li'om 792 individuals of P.
{//ricu"" (including S82 from Kadu el ul .. 2011) were useel to construct multi locus
haplotypes. Thirty-two multi locus haplotypes were proelueed f!'om the combination
of 20 alleles Cfable II). Half of the haplotypes were found in Ethiopian populations
with the preelominant haplotype being I-ITlh (frequency of 46.2%). HTli was the
second most fi'equent haplotype (frequency 30.5%). The least li'equent (li'equeney
0.48%) haplotypes were IITlp. IITlq. I-ITlv. HTlw. I-ITlx. anel HTly. Number of
haplotypes (N,,) per population ranged from one to live with an average oftll'o. Ten of
the Ethi(lpian haplotypes were private to single populations. while the remaining six
of them occurred in two or more populations. Lepis (LP) and Bulki (BU) each had
two private haplotypes (LI': IITlk and liTis; flU: Iv and I IV). Agere Mariam (A G)
was thl' <'nly population that did not share haplotype with other populatiolls.
52

filteen populations harbored two to five haplotype, while the remaining SIX
populations contained only single haplotype. Of the later group of populations,
B ec\e Ie. Chilimo, Debrc Tabor. aod Nekcmte wcre fixed for HT I h; Menagesha Ill!'
HTli a III I Agerc Mariam for HTlu. The highest haplotype diversity (H,) ofO.S22 was
founcl in the Amanuel population, i()l\owed by thc Bulki population (1-1,. ~ 0.800). The
charactnistics of chloroplast haplotypes in each population are showl1 in Table 10.
Table 10. Haplotype diversity measures for 21 populations of P. q/i'icw/{/ in Ethiopia.
Population n Ilapiotype N;I Nt' Nil 11,.
AM III I a. I g. Ill. Ii ,I 3.85 0 0.822
8LJ 10 I a, I h. I i, lv, III' 5 3.57 2 I).SOO
LP III I i, I k. I,.. Is 4 2.94 2 0.73J
.II 10 Ig, Ih. Iq. II 4 2.78 0.711
GO 10 I h, Ii 2 2.00 0 0.556
KLJ 10 Ih, Ii 2 1.92 0 0.533
IN 10 Ih, Ii 2 1.92 0 0.533
flO 10 Ig, Ih 2 1.92 0 0.533
KIvI 10 Ie, I i, I,. 3 1.85 0.511
GM 10 Ih, Ii 2 1.72 0 0.467
AS 10 Ih, Ii, Ip 3 1.52 0.378
IVW 10 I h, I i. I)' 3 1.52 0.378
AA 10 Ill, Ii 2 1.47 0 0.356
I-\i\ 10 I I, Is 2 1.22 0.200
DE 10 Ill, Ii 2 1.22 0 0.200 I
8ll 10 I h 1.00 0 o.oon CH 10 Ih 1.00 II 0.000
DT 10 III 1.00 0 0.001i
IvIN 10 Ii 1.00 a n.ooo NK 10 III 1.00 0 0.000
AG 10 lu 1.00 0.000
11 sample size, N" ~ numbcr of haplotypes, N, ~ etTeetivc number of haplotypes, N"
numbl'l' of private haplotypes. and H, -' hapi'otype diversity.
53

Table 4. Haplotype construction and frequency in 21 Prunus aji-icana populations revealed by four cpDNA indels (loci 1-4) and three cpDNA
microsatellites (loci 5-7). Alleles are represented as one for the presence of fragment and MO for the absence of fragment in the case of the
indels (loci 1-4) and number of nucleotide repeats in the case of micro satellites (loci 5-7).
BaekboneNt 1 2 3 4
Nt subdivision a b c d e f <¥ h i j k 1 m n 0 p q r s t u v w x y a b a b c a .. Indels*
1 2 2 2 2 2 2 2 2 2 2 2 2 2 2 2 2 2 2 2 2 2 2 2 2 2 2 2 I I 1 2
2 1 1 1 1 I 1 1 1 1 1 1 1 1 1 1 I 1 1 1 1 1 1 1 1 1 1 1 1 1 1 2
3 t 1 1 1 I 1 1 1 I 1 1 1 1 I 1 1 1 I 1 I 1 1 I I I 2 2 1 1 1 1
4 1 1 1 1 1 I I 1 1 1 1 1 1 1 1 1 1 1 1 I 1 1 1 1 1 I 1 1 1 1 I
MS§ b
5
a
2
1
1
2
5 9 10 10 10 11 8 9 9 9 9 9 9 8 8 8 10 10 10 10 9 9 9 9 9 9 8 10 9 9 9 9 10
6 9 9 9 9 9 9 10 10 9 8 8 8 8 8 8 10 10 8 8 10 11 11 11 9 9 8 8 9 10 9 9 9
7 9 9 11 12 12 11 9 10 10 9 10 I1 9 10 11 10 11 10 9 11 10 11 9 11 12 9 9 9 9 10 11 11
Populationt
AA 2 8
BD 10
CH 10
*IndeI loci 1,2,3,4 are rps16pm2a, rps16pm2b, tmT-Lpmla, and tmT-Lpmlb; §MS-Chloroplast mlcrosatelhte IOC15, 6, 7 are TPSCPl, TPSCP5,
and TPSCPI 0; "j"See Table 1 for population codes.
54

Table 11. (Continued).
DT 10
KU 6 4
GO 5 5
HA 9
IN 4 6
II 3 5
KM 2 7
LP 5 2 2
MN 1O
NK 10
BO 6 4
DE 9
AG 10
AS 8
BU 4 3
ww 8
GM 7 3
AM 2 3 2 3
Total 3 0 2 0 0 0 12 97 64 0 2 0 0 0 0 2 2 10 10 1 0 0 0 0 0 0 0
55

4.3.2. Helationship and geographic distribntion of haplotypes
The relationship between 32 haplotypes is demonstrated by the genealogical network
in Figure' 9. The backbone or the network consists or tive main haplotypes (denoted
1-1'1' I HI). Sixteen or the haplotypes were found in Ethiopia. Ten of the I:thiopian
haplotypes (HTlp-IITly) were not luund in other countries. Five of the sixteen
haplotypes (liT I a. HT I c. HT I g. HT I hand HT I i) were shared with 'east" (excluding
Uganda) and southern AIi'ican populations but only one haplotype (HTI k) was shared
with a West Ati'iean population (Equatorial Guinea) (rigure 10). All of the haplotypes
found in Ethiopia were members of the I-ITI tamily.
In the present stuely. the predominant haplotype was IITlh. which occurred iii 16
Ethiopian populations. mainly on the northwestern side of the Rill Valley. and in two
non-Cthiopian populations (I Kenyan and I Tanzanian). The second most frequent
haplot)'pe was I-ITI i. which occurred in 13 populations on both sides of thc Rill
Valley in Ethiopia anel in two non-Ethiopian populations (I Kenyan and I Tanzanian)
(Figure III).
56

10 }-----~ In 1111
Figlll'e 9. Genealogical network of 32 haplotypes of 53 PI'II1IIIS aji'icana populations
from 10 African countries. Non-white colors represent haplotypes found in Ethiopia,
and haplotypes shared with populations of other African countries are represented by
concentric circles. The size of the haplotypes is drawn proportional to their
frequencies. Very small white circles represent hypothetical intermediate haplotypes.
57

Figure 10. Distribution of 16 hap!otypes of Prunlls aji'icana found in Ethiopian
populations (marked with non-white colors). Codes for non-Ethiopian populations;
GQ=Moka, KA=Chuka, KB=Kinale, KC=Kapcherop, KD=Kakamega, KE=Londiani,
KG=Taita, KS=Kibiri forest, SA=Mpumalanga, SB=KwaZulu-Natal, TB=Kilimanjaro,
TD=Shume Magamba, TE=Kidabaga, TT=Udzungwa, ZWA=Nyanga,
ZWB=Chimanimani, ZWC= Chipinge, NG=Ngel Nyaki Forest Reserve, CB= Lower
Mann's Spring, CA=Ngashie-Mt Oku, CC=Ngashie-Mt Oku, MC=Antsahabiraoka,
MA=Marovoay, MB=Lakato forest, UA=Kibale Forest, UB=Kalinzu Forest, UC=Bwindi
Forest, UD=Mabira Forest, KF=OI Danyo Sambuk, KT=Lari, TC=Kindoroko Catchment,
T A=Meru Catchment and for Ethiopian populations see Table 1.
58

Total haplotype diversity (h'l cO.703, SE ~ 0.0572) was about two times higher than
the mean within population diversity (hs ~ 0.367, SE ~, 0.0629). which suggests
genetic differentiation aillong populations. Indeed, analysis of molecular variance
(AMOV i\) revealed highly signilieant genetic differentiation among the populations
(C;SI c, O.'l78. P ~ 0.0001). The haplotype variation was partitioned into 47.8% among
populali(lns and 52.2% within populations (Table 12).
The measure of genetic differentiation based on ordered alleles (NST 0,483. SE
0.0836) "as higher than unordered allele measurc of genetic differentiation (GST ~
0.4 78. SI' 0.0903). However. comparison of observed NST (0.483) with mean
permuted NST (0.473) revealed that the chloroplast micl'Osatellite diversity of P.
1I1i-iclInl/ had no significant phylogeographic pattern in the investigated populations (I'
:> OJ))). Nevertheles~, rVlantel lest lor isolation by distance revealed a significant
positive correlation between geographic and Nei's genetic distance matrices (Rxy
(J.I07. ". 0.001) (Figure II).
Tab'" 12. Partitioning of haplotype variation among 210 1'/,111111" ali-iclIlilI individuals
in Ethiopia computed by analysis of molecular variance (AMOVA).
Variance Source of variation df SS % of variation I'
components
Among populations 20 37.25 0.17 47.8% 0.0001
Within populations 189 34.70 0.18 52.2%
Total 209 71.952 0.35 100%
df·c degree of li·eedom. and SS ~ sum of squares
S9

;1,--· __________________________ ,···1
0.3 , g ~ A 0.6 L-·----------------------.,~ , 5 '-'
0.4
0.'
Y'" t),f)i)OJx+0.:'S9 R: ==0 nilS
I
I
Figure 11. Correlation bctween geographic and genetic distance matrices of 21
PI'lIl1I1S q(i'icana populations in Ethiopia based on seven cpSSR loci.
4.4. Ethnobotany of P. ajric(tl1(t
The ethnobotanic survey on P. qfj-icana in the 20 localities over its distribution range
in Ethiopia revcaled the multipurpose character of the spccies; people in different
patis of thc country usc the plant for different purposes and thus six major use-
categories were recorded for the species.
4.4.1. Local nomenclature of P. (tjriC(tl1(t
PI'lIllIlS q(i"icana is known by several namcs in different parts of Ethiopia Cfable 13).
Its common name in Amharic is Tikur inchet. However, it is also known by other
Amharic names including Homa by the people around Amanuel and Dcbre Tabor
towns, and Koma by the people around Denkoro forest. However, the common name
Tikur inclIct is used for other tree species in some localities of the Amhara region like
60

Amanul'l, Debre Tabor and wor Washa, The use of this common name can lead to
confusion in Stich areas. In Oromiya, P. qji'iCOl1(J is called by several names including
Bura)'u by the people around Chilimo forest, Mcnagesha forest, and Asella town;
Ilomi by the people arounci Redele, Gore and Nekemte towns; Halcba or Keteba by
the people around Kuni town; Ivlechelo by the people around Gara Muleta; Suke by
the people around Agere Mariam town, Harenna lorest, Kibre Mengist town, and
Lepis village; and Omo by the people around Jimma town, The people around Honga
town also call p, oji'icollo by the name Omo in Kefla language, Okanse in Gofta
language is the name given to P. q/i'iC{[}W by the people around Rlilki town. The Awi
people arollnd Injibara tOWIl call P. (di-iC(fll(f by the name Damtse.
61

Table 1.\. Nomenclature of Prill/liS a/i-icrlll(f in different localities of Ethiopia based
011 respoll':'>CS of five informants in each locality.
Local Name Language Locality
Asella
GuraYLI Orol1lif~ -o;----c---.-.. -. -
Chilimo Forest
lVlenagesha Forest
Dailltst' J\ wi Ingibara
Amanuel HOllw Alllharic
Debre Tabor
Bedele
Hom! Oromifa Gore
Nekemte
Keteba/l-Ialeba Oromifa Kuni
--_.-
Koma Amharic Denkoro Forest
Meclll'l{l Oromifa Gara Mulcta
Okansl' Gorin I3l1lki
01110 Keffa Bonga
Omo Oromifa Jilllma
- -----
Agere Mariam
Harenna Forest Slike Oromifa
Kibre lVIengist
Lepis
Addis Ababa I"ikur 111cilet Amharic
Wof Washa Forest
62

.4.4.2. Medicinalnses of P. 1((i'icl/l/l/
Peopic ill difterent parts of Ethiopia claimed that P. IIli'icli/w is used lor the treatment
of sevcral types of health problems lor both human and livestock (Table 14). Several
traditional medicines were reported to be prepared II'om II'esh, dried, or powdered leaf
or bark of P. 1I(;';CIII111 alone or mixed with other ingredients. Informants reported that
those traditional medicines are commonly prepared in the lorm of juice, decoction,
paste or powder for oral, nasal or dermal aelm inistration.
Reported traditional trcatments for human health pl'Oblcms
Strong cough, asthma, Mich. Tikusat (li:ver), snake bite, stomach pain In children,
head li,·c'. wound, bed wetting in children, and menstruation problem (over bleeding)
were reported to be treated by P. IIIi-icall((. To treat strong cough, one Melekiya
(I Sml) 01' bark decoction with sugar is taken orally lor three days, or one-third of a
Meleki, a of the juice of crushed leaf bud in water is taken orally for three days, or
small amount of juice of crushed leaf in water with salt is taken as a drink lor one day.
or bark is boiled together with coffee and a cup of decoction is taken orally. 01' about
Scc of tll'ied leaf decoction is taken orally twice a day It)r two days. For asthma
treatmell!. small amount of leaf bud decoction is taken orally for three days. cor Mkh
(Sunstrohe), one cup of juice of leavcs crushed together with leaves of Tena Adam
(Rilla c/llliepensis L.) and Tejesar (Cl'll/bopogoll cilJ'lllliS Stap!) in water is
aciministered orally Illr three days, or leaf crushed together with leaves of Bisana
(CraIOIl IIl((croslachYlis Hochst. ex Delile) is smelled. For Tilmsat (lever), one cup of
juiee "f crushed leaves together with leaves of Sensei (.JIIslicia scflill/perilllill
T.Ander,"") in water is taken urally for one day and body is washed by the crushed
leaves. FllI' snake bite, small amollnt (part of a ivIelekia that immerses half of the
63

smaillillger's internodes) of juice llfcrushed bark in water is takell orally fClI' one day.
for stomach pain in children. small amount o I' juice of crushed leaf bud in water is
given tmdly for one day. To destroy head-lice. hair is washed with Icaves crushed in
water. For wonnd healing, powdered root-bark mixed with butter is applied on the
wound in the evening and the powder is sprinkled on the wound in the morning. or
powder of dried leaf mixed with lemolljuice is applied on the wound twice a day for
three days. Iled wetting in childrcn is said to be treated by exposing part of the
child's hody below the neck to the smoke produced by putting twigs on a burning
charcoal. Oral administratioll of about live milliliter of the Ilitrate of dried leaf
powder ill cold watcr ft)J' olle day was claimed as a treatment when a woman
ellcoullters over bleeding due to menstruation.
Reported traditional trcatments for livestock health problems
Livestock health problems reported to be treated by P. aji'ic(///{/ are wound on cattle.
horse. IllUIe and donkey; eye illness in cattle; fungal disease on calfs skin: stomach
ache in l'attle; and shivering in cattlc. It was also claimed that P. (!/i'il'(lIIU is used tClr
increasing milk production in cow, and for fattening of ox. For wound treatment on
cattle. horse. mule and donkey. the powder of dried bark mixed with salt is sprinkled
on woum!. orjuice of crushed leaf or bark is applied on wound until it heals. To treat
eye ill",'" ill ealtle. juice of the crushed leaf is applied 011 the sick-eye Illr three days.
Fungal disease on ealt's skin was said to be Ireated by applying juice ofcrushecl bark
on inJected skin and administering half a bottle of the juice orally.
64

Table I-I. Reported traditional medicinal uses of 1'1'111111.1' q/i'ic{/lla to treat health
problems in both human and livestock in Ethiopia.
Health problem
Strong cough
Mich (Sunstroke)
Wound
Snake bite
; Asthma E ;:J :t Siomach pain in children
Tikusat (fevcr)
I kad-lice
Bcd wetting in children - -- ---
Menstruation problem
I Wound on cattle, horse, mule and I donkey
i he illness in cattle ---'----
fungal disease on calfs skin
~ I Stomach-ache in cattle 0, tn 1- - - -------
31 siliveri:~i~'.:attle ___ _
IlIr1l1ation difficulty in cattle, horse, mu Ie and donkey
Rl'ducedmilk production in cow
I Skinninessofox
'Xl lnl'
8
4
4
-----
4
3
2
, , - ---------
2
2 -----
3
13
4
2
2
2
2
2
Part used Application I'oule
bark. leaf oral -----
leaf oral I , -nasal2
root-bark, topical
lear' ---------- -
bark oral
leaf oral --------
leaf oral
- - r leaf OI'al. topical
leaf hair
twig topical ------
leaf oral
leaf, bark topical
leaf topical
bark topical. oral
oral
topical
Icaf nasal
leaf oral
bark oral
% Inf - I'ercentage of intortnants. 'Mixed with RIlla cha/epellsil' L. and C),llliJOjJOgOIl
cilralll.l' Stapf; 'mixed with CroWIl !IJ{/cl'OslachYlIs Hochst. ex Dclile: 'mixed with
lemon ,iuicc; "mixed with JIIslicia schilllperiall{/ T.Anderson; 'mixed with Albizia
scliillliw/'illllll and Mil/ellia jerrugillea; "mixed with Echillop.l' kebericho and
frank i [H:l'!lSC.
65

To treat stomach-ache in cattle, t\Yo cups of juice of the bark crushed together with
barks or Sessa (Alhizia schilllperi(lllll Oliv.) and Birbira (Millelliaji:rl'/lgin('(l Hoehs!.)
is given orally lor 3-4 days. Bark of P. africano, Kebercho (Echillop.I' kehericho
lvlcstin). ti"ankinccnsc and hen"s feces are smoked neal' the animal as a treatment to
shiverin~ in cattle. When urination dimenlt)' occurs in cattle, horse, lllule and
donkey. one glass of juice of crushcd leaf in water is added through nose openings lor
one day, 1'0 increase mill' production, one glass of juice of crushed leaf bud in water
is given 1'l1t' one day to a cow that gives small amollnt of milk. To fatten a skinny ox,
one gJas\ nfjuicc of crushed bark in water with salt is given orally for one day.
4.4.3. Non-medicinal IIses of P. 1(/i';CIIIIII
Other than its medicinal use. P. a/i-icllnll was reported to have several IIses in hOllse
construct iUIl, carpentry, making plowing tools, bridge construction, apiculture, local
alcoholic drink preparation, wedding ceremonies and other traditional rituals (Table
15).
Aecordin~ to the informants, the wood of P. afi'ic(IIl{/ is very strong and resistant to
pest allad., It is thlls highly sought lor construction works such as bridges and houses.
It is uscd tor making pillars, beam tor root~ and doors. However, people around
Injibara town do not use the wood tor house construction as they believe that it
attracts lightening ifused lor house construction.
The wood has a general use for handles of tools such as axe and hoes. It is also used
for making timber, mortar, coffin, grain storage barrel and bed. Branches or young
stems arl' llsed tor 'making "!v1ensh" (Ethiopian traditional tool IIsed during the
threshint' process of cereals and grain legumes) and walking sticks. Branches or small
6(,

\'
sized stems are used for making "Kenber" (yoke), "Mofer", "Erf' and "Digir", which
are the components of a traditional plowing apparatus that is pulled by a pair of oxen.
Figure 12. A debarked PrlllN/s ajricana tree near Injibara town. The bark is removed
to kill the tree so that mortars made from the dried stem will not crack (Photo taken
by Ziyin Mihretie, 2012).
The wood is reported to be excellent for charcoal production. Dried twigs and
branches are also reported to be suitable for firewood.
PrllIIlIS aji'ica/la trees are reported to be useful in apiculture. It is said that beekeepers
prefer P. ajricana trees for mounting traditional hives as they are suitable for this
purpose. Barks, resins, as well as leaves are reported to be useful for smoking
traditional hives in order to attract bees to the hive. Flowers are also reported to be
important for bee foraging.
Leaves are used for making two types of local alcoholic drinks called "Areke" and
"Tella". Some informants reported that in order to make Areke "stronger" small
amounts of P. ajricanG leaves are mixed with the leaves of Gesho (Rhamnus
67

!,ril/oitle,1 L'Her.), which is one of the major ingredients to make the local alcoholic
drinks. I_caves arc used for washing containers (large pots) that are lIsed for the
ferment"t ion process of the local beer called Tella. The leaves arc also used for
baking bread that is used for making the beer.
In some localities. wedding ceremonies and traditional ritual practices take place
under th" shade of P. I{ji-iC{{I/{{ trees. In East Gojjam, there is a tradition of performing
part of a wedding ceremony called "Homa-Koreta" under a tree of P. {{ji'ic{{I/{{. The
ceremony takes place in the morning of the wedding day. For the ceremony, the bride
or bridegroom is taken to a nearby P. q/;'ic{[}w tree being carried on the back of a man
(I'or bride) ur on the shoulder of the man (tor bridegroom) accompanied by several
people. Iisually, at least a tree of p, ({ji-ici/I/(/ is lound within a village as it is protected
main I)' I,"' this purpose. Most of the invited guests, especially youngsters, participate
in this rcremony. When the participants of the ceremony reach to the tree, they move
round thl' tree thrice b)' singing a typical song called "Logaw-Shibo". Then, an
earthenware cup called ''Tsiwa'' tilled with "Difdif' is given to the bride or
bridegr(HHll to taste it thrice and break the Tsiwa by throwing it to the tree. I I' the
Tsiwa is broken being crashed with the trunk of the tree, it is considered as a sign of
good Iud to the bride or bridegroom. Then a piece or "Injera" pasted with a t) pe of'
sauce called "Awaze" is given to each participant. Then each participant of' the
ceremolll takes leaves li'om the tree and gives it to the bride's or bridegroom's mother
at hOllle. The bride's or bridegroom's mother receives the leaves by carrying a
traditional sieve called "Wannt" on her head. Throughout this ceremonial activity the
attendants chant, dance and sing songs related to the ceremony.
68

In some localities of Oromia Region, informants reported that there is a traditional
ritual practice called "Kallu" under a large tree of P. q/i·icana. It is said that such a
tree is demarcated and protected by making fences with stones surrounding it. Such a
. trce is respected and no one is allowed to cut it.
In spite of the fact that P. 1I1i-ic(//){/ is reported to have such a wide variety of
medicin,1I and non-medicinal uses. it is reported to be poisonous. According to the
informants, leaves of p. ali-ic{///{/ are not useful as fodder to livestock; they kill if
consumed. Especially, cut and wilted leaves are reported to be very toxic to sheep.
Tahle f 5. Reported non-medicinal uses of P/'1Inlls q/i'icana in Ethiopia.
Usc category Description of uses
Construct ion and Wood lor house and bridge construction, pillar, door. beam f(lr
carpcntr.' root: handles of axe and hoe, mortar, comn, grain storage barrel,
bed, timber, "Mensh", walking stick. "Kenber", '·Morer". "Ed"
and "Digir"
Fuelitirelvood -C--' ... _--
Dried twigs and branches for firewood, and wood for charcoal
--- - - -- -, -,------- --- -- - ----
Apiculture Tree for mounting traditional hives; bark, resin, as well as leaves
for smoking traditional hives; flowers for bee loraging
- -- ------
I.oea I a koilol ic Leaves: mixed with leaves of Gesho (Rhamnlls prinoides) f(,r
drinks making "Areke", for washing pots that are used for 'Tell,,"
preparation. lor baking bread lor Tella
-
Traditional rituals -~----.. - -
Part of wedding ceremony called "Homa-Koreta", and a traditional
ritual practice called "Kallu" takc place under p. {(Idean" trees
69

CHAPTER 5: DISCUSSION, CONCLUSION AND RECOMMENDATION
5.1. Oisl'lIssioll
5.1.1. Celletic diversity within poplliations
The present stlldy showed that there is high genetic diversity in the 21 P. a/i'ic({l1({
populatiuns in Ethiopia as revealed by both nuclear and chloroplast microsatellite
markers. Within populationnucieargene diversity (II, c' 0.452 - 0.732) is comparable
to genetic diversity values of 25 P. q/i'icalla populations in other eight !\ti'ican
countries (I-I,. 0.430 0.827:. Kadu el al., 2013), and in eight Kenyan populations
(H, Co 0.'1.1- 0.83; Farwig el ({I .. 2008). However, this value is higher than genetic
diversit\ values observed in other previous studies on P. ({/i'ic(///{/ based on RAP!)
markers rH, ~ 0.020 0.137 (Dawson and Powell, 1999): 11,. 0.041 0.150
(Muehusi el al .. 2006); II, 0.150 0.307 (Hailu Atnafu. 2007)J. The RAPD based
diversity of Ethiopian P. a/i';cw/{/ is higher than that of other populations assessed by
RAPD markers. The differences in the level of genetic diversity between RAP!) based
ancl mierosatellite based studies could be partly due to the nature of the genetic
markers and/or sampling strategies used; microsatellite markers give higher within
population diversity value than RAPD markers (Nybom. 2004). The mean within
populatiun chloroplast haplotype diversity in the present study (hs 0.367) is higher
than th,' result of an African-wide P. a/dcalla study in 32 populations from nine
countries (hs ~ 0.234; Kadu el al .. 20 II), and it is still higher than the total haplotype
diversit\ of live P. a/i'ic(///{/ populations in three countries (h'l - 0.242: Mbatudde el
al .. 2012h).
70

The study revealed that there are differences in the levels of genetic diversity among
the populations investigated. The highest within population nuclcar genetic diversity
(H,) was recorded in the Addis Ababa population, while the lowest value was in
Denkoru. Gam Muleta and Wof Washa populations had also relatively lower genetic
diversity values. The highest nuclear genetic diversity in the Addis Ababa population
could be partly due to pooled effect of gene now mediated by humans. As Addis
Ababa is the capital city of t:thiopia. there is high rate of human migration ti'om
di ITerent parts of the country to the city. Thus. there are possibilities that some of the
P. a/i'i('(/I/a trees sampled for the present study could have been established ti'OIll
seeds or seedlings. which were accidentally or purposefully brought hom other parts
of the cuuntry.
General!:, populations in the southwestern part of the country had relatively higher
genetic diversity, A similar pattern or genetic diversity distribution was it)und \11
Cordia 1I/i'ic{JJ/{/ Lam. (Abayneh Dcrem, 2007). This relatively higher difference In
the level of genetic diversity among the populations could be explained by range edge
enect: Denkoro. Gam ~'Iuleta and Wof Washa populations are the northeastern limits
of the ['<lnge of P. a/hcal/a. which is primarily distributed in southwestern part of
Ethiopia extending to other Ati'ican countries. If this nOI·theastern part of the species
range has been recently colonized. diversity levels could be lower due to founder
elkets (lI' popUlation bottlenecks during migration events (Austerlitz ff 01 .. 2000).
Recent I'c-colonization or northern Ethiopia by Hagenia ab)'ssinica .I.F.Gmel. Ii'om
possibly south western part or the country was reported based on chloroplast
haplotypl' and le)Ssil pollen evidences (Taye Bekele el al .. 2009). According to Taye
Bekele ('I al. (2009). fossil pollen evidences also indicate a northward re-colonization
or some other tree species sllch as Podoc(II1Jusjiilcalus A.Cunn. ex ParI.. JUlliperus
71
procem Ilochsl. ex End!. and Olea L. species in A ti·ica. Unfortunately. there is no
such pollen fossil evidence for P. {Iji-icol/a to supplcment the genetic data and make a
strong conclusion on the colonization path of the spccies.
5.1.2. Ceneti<' structure or populatious
Genetil' tlilTcrcntiation among popUlations
Signific<lllt genetic differentiation alllong populations of P. ({/ric(I}llI was revealed ill
both nllNI\ and cpllNA studies. The genetic differentiation among populations in
cpDNA was higher than in nONA, as indicated by the Gn value of cpSSRs (0.478)
and F" value of nSSRs (0.122). The reasonable difference between FST and GSJ
values suggests that historical gene flow via seeds alone moderately reduced the
differcnlialion in nON!\. Thus, the difference between the levels of genetic
diftcrentiation in cpDNA and nDNA could be explained by (I) gene Ilow is higher for
nDNA (hoth seed and pollen dispersal) than in cpDNA (only seed dispersal). and (2)
the eneTI of genetic driti is stronger on cpDNA than on nDNA as the effective
populati(\n size is lower in epDNA than in nDNA (Latta, 2004; Pettit e{ al .. 2005). In
supporl (\1' the lirst explanation, Berens (20 J 0) found that pollen dispersal distance
exceeds seeel dispersal distance by a factor of 23 in P. (!ji·icollo. Mbatudde e{ al.
(20 12b) also found that gene Ilow among populations of P. q!i'icono based on nuclear
DNA data was significantly higher than that based on chloroplast DNA.
The lew I of nuclear genetic differentiation found in this study (FST ~ 0.122) is lowcr
than rep()rted for 25 natural populations of P. aji-iC(II1{l from other African countries
using 11ll' same nSSR markers (Fsi ~ 0.27; Kaelu {'I ({I., iOI3). The vallie of
chloroplast DNA differentiation in the present stllely (GSI = 0,478) is also lower than
72

reported le)r 32 natural populations of P. aji"icallo li'om other Ali'ican countries using
thc same- cpSSR markers (CiS[ 0.735; Kadu el uJ .. 20 II). Higher values of
differentiation indices in the previous studies could be due to the larger maximum
geographical distance between the sampled populations (Nybom, 2004), which ranges
from Madagascar to Equatorial Guinea: whereas the maximulll geographical distance
between the sampled populations in the present study is between Ciore and Gara
Mulcta. Thus, the lower level of genetic differentiation among populations
investigiltecl in the present study could be due to absence of strong barrier to gene
exchange as only a few migrants pCI' generation are necessary to inhibit differences
aecumulilting between populations (Mills ancl Allenclort~ 1996) 01' the time after
populati(lns have been separated could not be large enough to accumulate such big
levels of genetic differences.
Pair-wisl' comparison or populations lIslng FST values revealed that 95.7t!'fJ of the
populilti()n pairs were signilicantly differentiated. The highest genetic diffcrentiation
was between Oenkoro and Wof Washa populations. Non-significant dirtcrcntiation
was 1(1und only between the following 9 pairs of populations out of the total 21 ()
pairs; flO-BO, CH-NK, CH-AM, CH-BO, AA-BO, AA-BO, BO-AM, ancl AM-ClivI.
The lack of genetic differentiation among these populations suggests that there was
gene flow at least during the establ ishment of sampled trees for this study. Most of the
populations were presumably connected genetically in the past when the Ali'oniontane
lelrests \\cre widely distributed in the country (Breitenbach, 1963). Ilowever, in the
last lew decades the distance between contemporary populations have been increased
due to anthropogenic fragmentation of forest ecosystems (Friis, 1992; Demel Teketay
and Granstrom, 1995; Reusing, 2{)OO). Even at present, some remnant trees most
likely exist and act as stepping stllnes for gene Ilow between some pllpulations like
73

GO-GD ilnd CI-I-NK_ Homoplasy could also be another possible explanation for non
signitic'lI1l genetic differentiation between the populations, especially for population
pairs slich as AM-OIVI ami BO-Mvl for which Ihe geographic distance appears too
large ttll' gene exchange to take place (Whitlock, 20 I I),
The AMOV j\ analysis showed that most (88,Q5%) of the nSSR variation lies within
POpuIOli,,"s, a reSlilt compmibJe wilh previous studies based on RAPD markers
(Dawson, 1999; Muchugi, 2()06; Haitu Atnalh, 20(7), A high within populatioll
genetic diversity is a characteristic of species with long,lived individuals, overlapping
general,,,"s, Ollt breedillg maling system and wide distribution nlilge (Nybom, 200d:
Aegisdollir ~I (//" 20(9), Whereas, 1'01' cpSSR markers Ilcarly half (47.8%) or the
genetic \ariatioll lies among the populatiolls, The different percentage of within and
among population genetic variation values obtained for nuclent' and chloroplast
markers could, in combination with differences in gene Ilow by pollen and seed
(i:lerc[)s.W I 0: Mbatudde ('I a/., 20121», be due to difterences in the impact of genetic
drift 011 chioropiasl and nuciear DNAs (Latla, 2004: Pettit ,,/ (1/" 200S),
In this SllitIy. when FST was lIsed as measure ofdifferciltiation, /1.95% of the variance
was ftHlmi among the populations. However, when Rs r was lIsed as measure of
eli ftercnl iation by taking allele size and slepwise mutation into account, 18.00% of the
variance was found among the populations, which suggests thaI mutation has played a
significmll role on the diflcrentiation ofpopulaliolls. Still, a higher diflercncc between
f'" and Rsr values and thus a signilkant effect of mutation on the regional
tli rterciliialion of 1'. afriwJ/a popUlations IVas revealed in Kadu el ai, (2013),
Thc i\~'I()VA analysis using RSI among groups or popUlations classified based 011
geographical units. tree seed zones, and STRUCTURE,based clusters rcvealed
74

signiticant diffcrentiation alllong the groups. Howcver, there was 110 signilicHnt
differentiation among the tree seed zones when PST was used lor the analysis. The
abscnce ofsigniticant genetic differcntiation suggests that there was gene flow across
the seed mnes, which wcre delineated for Ethiopia by Aalba:k (1993) as a basis to
regulate the use of tree reproductive materiaf for all important species in the cOllntry.
One-wa, analysis of variance (ANOVA) showed that there was statistically
significant variation among the populations of P. q/i'iC(f}}(f in the quantitative
morphological traits assessed. Further analysis by Dunnett '1'3 post hoc test revealed
that <J.n"",. 20.0%, 11.9%, 6.2% and 9.5% of the popUlation pairs were significantly
different I'rom each other in their mean total height, bole height, DBH. bark thickness.
and barl; mass, respectively. The significant divergence between popUlations in
quantitative morphological traits could be due to genetic andlor environmental
difTerenc:es or it could be due to differences in age structures of the populations.
Variable mean values of DBI-f were reported for P. ({Mccllla popUlations at diflcrent
age groups by different authors; 15.8 cm at 15 years (Cunningham and iVlbenkum.
199:1).211.5 cm at 17 years. 27.5 c:m at 18 years (Gachie 1'1 (// .. 2012). and 52.2 cm at
18.5 years. 30.7 cm at 21.6 years, 11.7 cm at 15 years (Weru, 2012). Information on
heritability of the morphological traits of P. a/i'ic(l/la is not available in the literature.
I-/owever. height and DBII showed moderate to high narrow and broad sense
heritabilities in P/'ll/ll/.\' (lviI/III (l'v/uranty 1'1 (I/. 1998).
Pearson's correlation analysis revealed significant positive correlations among all
qllantita! ivc morphological traits. except between bole height and bark thickness.
Furthermore, all the quantitative morphological traits, except bark thickness. showed
signific"nt negative correlations with altitude, which supports the above suggestion
7)

that environmental factors could be partly responsible for the differences between
populatinns in morphological traits. However, there was no signilicant correlation
between genetic diversity measures and quantitative morphological traits investigated
in this study. This could be partly due to the genetic markers used and quantitative
trait loci studied are individually inherited and probably no association exists.
Correlation between genetic and geog.-aphic distances
To ill\'l'~ligate genetic reiatiullship between populations, Nci's unbiased genetic
distance.", were computed and the highest genetic distance was lound between
Denkoro and Wof Washa populations: whereas the smallest distance was between
Chilin", and Hedele popUlations. which are in line with the values of pair-wise
population comparisons using genetic difterentiation indices (rST, G"ST and D",).
Environmental barriers, historical processes and life histories may shape the genetic
structure of populations (Gerlach and MusolC 2000; Acgisdottir d (1/ .. 2009).
MorcovL'l'. populations in close proximity are genetically more similar than more
distant populations as species' geographical distributions are typically more extended
than all individual's dispersal capacity. Indeed, the Mantel l<:st I(lr isolation by
distance revealed a significant positive correlation between geographic and Nei's
genetic distance matrices of P. (f/i-ic(fl/{/ populations investigated in this stuely using
both cpS'-;R and nSSR markers. A similar result was reported by Hailu J\tnalll (2007)
for six I'. a/i'ic(ll/{/ populations li'Dlll Ethiopia using RAPD markers. I'vlbatudele e/ a/.
(20 12b) also found significant correlations between geographic and genetic distances
or 1'. u/ricall(l populations for both cpDNA and nDNA.
76

Phylogc{)grallhic patteI'll
Phylogeographic analysis relies on interpreting patterns of congrucnce or lack of
eongrucnce between the geographical distribution of alleles and their genealogical
relationships (Avise, 2000). A pattern of congruence is observed if closely related
alleles are geographically restricted and occlir in proximity to each other. Such
congruellc'e indicates a long-standing paltcl'Il of highly restricted gene now. This
pattern arises when scattering is reduced because the novel mutations remain
localized within the geographical context of their origins. In the presellt study.
comparison of RST and permuted Rsr (pRSTJ revealed that the nSSR diversity of P.
a/i'iculw had marginally significant phylogeographic pattern with RST> pRsl'(P ~
0.(47) Illardy and Vekcmans, 2U(2); whereas the comparison of observed NST
(OAR3) with mean permuted NSI (0.473) revealed no phylogeographic pattern (I' >
0.05) li)r cpSSR diversity in the investigated populations of the species (POllS and
Petit, 1996). One possible explanation lor the lack of phylogeographic pattern in
cpDNA dilTerentimion is that genetic drift has a stronger effect on crDNA than on
nDNA (Latta. 2004: Penite el (II .. 20(5) and thus it could have disrupted such patterns
in cpDN/\. The zero level of within population cpDNA haplotype diversity in 28% of
the pnpulations suggests that genetic drin has greatly aHeeled the haplotype
frcqllcnc'ies of tile popUlations.
High proportion of cpSSR haplotypes (live of the sixteen) of 1'. <!/i-h:tllw li'Dlll
Etiliopian populations were shared with 'east' (excluding Uganda) and southern
African populations, but only Oll~ haplotype was shared with a population n'om
EquatDri;" Guinea, which cOlild be due tll homoplasy. The high proponioll of
77
haplotype sharing with 'east' and southern African populations and a higher mean
within population haplotype diversity in the Ethiopian populations supports the
hypothesis that suggests southward migration of P. {//i-ic{///{/ fi'om the Ethiopian
highlamk However. the absence of Ethiopian haplotypes in the . Western'
populations (in both West Afi'iean and Ugandan populations) do not support either of
the two nligration scenarios of P. afi'icalla to West Ati'iea proposed by Kadu <'I al.
(20 II) as: (i) southward migration of 1'. a/i'iclIn{f ti'om the southern fi'inge of tile
Ethiopiall highlands to Albertine Riti valley (Uganda) and then to West Afi'ica or (ii)
the indepcndent colonization of West Afi'iea directly fi'om the Ethiopian highlands
possibl: llsing the Marta iVloLJntains (Sudan) as stepping stones via a northwcstern
Illigratiull corridor and the subsequcnt colonization or western Uganda from \Vesl
Africa.
5.\.3. Indigenous kllowledge 011 P. aji'jcilJliI
The present ethnobotanic study eOlltirms the multipurpose nature of 1'. ,!/i-ic{f!f(I. Six
m'1ior usc categories (medicinal. construction and carpentry. fuellfirewood. beverage
preparation. apiculture. and traditional rituals) were determined for the species. The
findings are consistent with previous studies. which reported several uses of P.
a/i-icon(/ from different AIi'ican countries (Nsom and Dick. 1992: Cunningham and
MbcnkLllll. 1993: Cunningham. 1996: Lambert. 1998: Stewart. 2001). Especially. the
three usc catcgories- medicinal. construction and carpentry. and fuel/firewood- are
most frcquently reported from different distribution range countries ofthc species.
In this silidy. strong cough. asthma. Mich. Tikusat (fever). snake bite. stomach pain in
children. head lice. wound. bed wetting in children, ancl menstruation problem (over
bleeding) were reported to be treatecl by using different parts (mainly bark and leat) of
78

r. a/i'iCIIJltl trees. Similar human health problems previously reported to be treated by
the planl are wound (Stewart, 2003b; Moa Megersa el ai., 2013; Sintayehu Tamene,
2011), nlenstruation problem and fever (Kokwaro, 1976; Stewart, 2003b), and
slomach pain (Kokwaro, 1976). Bii "I ai. (2010) demonslrated the antifililgal and
antibacterial activity of P. t{/dc(fJ/{/ lIsing hexane and methanol stem bark extracts,
which supports the claimed traditional medicinal uses of the plant.
Livestock health problems reported to be treated by r. a/derllla are wound on cattie,
horse, mule and donkey; eye illness in cattle; fungal disease on calfs skin: stomach
ache in cattle; and shivering in cattle. A similar livestock ailment reported in previous
studies is wound (Stewari, 2003b; Sintayehu Tamene, 20 II). The claim that bark of
1'. {//i'icuJl{/ is used to treat fungal disease on calfs skin is supported by the scientific
demonstration of the specie's antifungal activity by Bii el ai. (20 I 0).
In this siudy, besides its medicinal use, Ihe species was reported to have several othcr
uses in I",use construction, carpenlry, making plowing tools, bridge construction, fuel
wood, apiCUlture, local alcoholic drink preparation, wedding ceremony and traditional
rituals. Similar uses reported earlier include house and bridge construction (Iverson.
1993: l3ecntje, 1994; Cunningham, 1996), apiCUlture and filel (Stewart, 2003b).
5.1.4. 1111 plications for conservation of P. afric({//({
The presence of high within population genetic diversity, and the significant genetic
differenliation revealed in morc than 95% of the popUlation pairs investigated in tbis
stud), suggest that almost all the populations of r. a/heal/a deserve conservation, bUI
as there are alien limitations of resources to conserve such a large number of
populalions. prioritization for conservation may be needed. Thus, a weighted-score
79

population prioritization matrix that integrates genetic, morphological, conservation
status. and cthnobotanic criteria was developed and osed to prioritize the populations
of V a/l'i('l/1/(/ for ill silll and ex silll conservation of the species. This method is
,imilnr to that ofTaye Sekele cllil. (2011).
The j(lll<lwing criteria were used to score populations for genetic and morphological
traits, cunservation status of the populations as well as ethnobotnnic values of the
species ill the localities:
A. Within population diversity of each population (I{.) was scored 011 a scale from
to 5 relative to the mean diversity (H, 0.(42) lor all the investigated populations as
follows: (I) H, < 0.508, (2) 0.5085 H,. < 0.564, (3) 0.564 5 II, <0.620, (4) 0.6205 He
<: 0.676. and (5) 0.676 < H,.
13. e;enel k dincrentiation was scored 011 a scale li'clll1 I to 5 based on the l11ean
average ~cnet;c distance (Ne;, 1978) 1"0111 a popUlation to all others (AGD): (I) AGD
< 0.200. (2) 0.200 5 AGD < 0.300. (3) 0.300 5 AGD < 0.400, (4) 0.400 < AGD <:
0,500, and (5) 0.500 0: AGD.
C'. l3ark mass lVas scored on a scale of I to 5 as the average mass of fresh bark (nM)
of all sampled trees in a population: (I) nM < 108.1, (2) 108.1 < fliVI < 164.5, (3)
164.5 < Ili'vl < 220.8, (4) 220.8 0: fliVI < 277.2, and (5) 277.2 sBM.
I). CurrL'rl\ conservation stalUs was qualitatively assessed by observation of the
preSSllre li'om sllrrounding eOl11ll1unitks and the currellt level of legal protection on a
scale r'\'l11 I to 4: (I) Well-protected, not threatened; (2) lair protection, but
vulnel'flhic: (3) open accessible and endangered; and (4) open accessible and gravely
endangerl'd,
80

E. Ethnohotanic value was scored on a scale of I to 5 based on six LIse-categories of
the plant in a locality. Use-categories had the following values: medicinal (1.5);
construct ion and carpentry (0.5); fuellfirewood (0.5); apiculture (I); local alcoholic
drinks (O.i): and traditional rituals (I).
Table I (>. Relative weights of different criteria (%) to prioritizc Pmlllls 1I!i-iclIllli
populatiolls ill Ethiopia for in silll and ex silll conservation.
Criterion III situ conservation
A. Diversity (H,) 45%
B. Genetic distance (AGO) 25%
C. Bar" mass (13M) 10%
D. Conservation status 10%
C. Ethnohotany 10%
Ex :dlll conservation
50%
40%
10%
The criterion H, ensures the inclusion of populations with high genetic diversity while
average !-!elletic distance (AGD) avoids redundancy by choosing genetically separated
populations for both ill silll and e.r silll conservations (Taye Bekele el 01 .• 20 II). The
current c()Ilservation status of the populations and the ethnobotanic values of the plant
in the localities are important criteria for ill silll conservation but not applicable to ex
silll conservation. Similarly. the morphological criterion (bark mass) is important lor
e.\" silu cOllservation, domestication, and utilization programs. Based on these criteria,
total s(orcs wcre calculated for each population giving different wcight tll each
criterion (Table 16). The valucs from all critcria were summed and populations IVcre
ranked according to thcir total score Crable 17).
81

Table 17. Summary of prioritization results of 21 Prill/liS (!/i-iC{///{/ populations in
Ethiopia 1'01' ;11 silll and ex silll conservation.
b. Prioritization for ex situ n. Prioritization for ill silll conservation
conservation
Pop' II, AGO 13M CS ET Sum Rank Pop* 1-1, AGO 13M SLIm Rank
KU .II AS NK GO BU HO HD IN iVlN AA AM KM LI'
·1< 15 ·1, 10 ·1< 10 ·1< 10 ·1' 10 ,1< I () ,15 S ,15 ::; 3() 10 I:' 10 ·1' 10 .1() S
':'7 10 10
CI-I ]!l 5 AG ".7 10 DT 27 15 riA ".7 10 DE 'l 25 W\\, <) 20
GM 'i 10 -=.c:.-_
6 10 8 2 'I 4
" 6 'I 2 2
" ()
10 4 4 4 4 ()
':'
"
7.5 4 5.0 7 7.5 5 10.0 7 7.5 7 2.5 S 7.5 7 5.0 7 10.0 5
2.5 " 2.5 7.5 7 10.0 :) 7.5 2 2.5 7 7.5 5 2.5 4 2.5 7 7.5 2 5.0 2 10.0 4
77.5 77.0 2 75.5 3 74.0 4 73.5 .\ 6Y.5 ()
68.5 7 68.0 8 65.0 9 63.5 10 59.5 II 59.5 II 58.0 I':' 56.5 13 54.5 14 53.5 15 52.5 16 50.5 17 49.5 18 .18.0 19 37.0 20
KU 50 .II 50 AS 50 GO 50 1311 50 NK 50 AA 50 iVlN 50 HD 50 BO 50 IN 40 OT 30 1.1' 30 DE 10 AM '10 KM 30 CI-I 40 AG 30 I-IA 30 W\\, 10 GM 10
24 16 16 16 16 16 16 16 8 8
16 2'1 16 40
8 16 8
16 16 32 16
6 10 8 ·1 ·1 2 2 2 6 4 4 'I
10 6 4 6 4 4
" 2 <I
80 76 7,1 70 70 68 68 6g
611 62 60 58 56 56 52 52 52 50 50 ",4
30
2 3 4 4 5 5 5 6 7 8 9
10 10
" " " 12 12 13 14
• I'op~p"pldation codes follow Table I; /-I,. = gene diversity, AGD c. average genetic
distance between one population and the rest, BM ~ bark mass, CS .e conservation
statLis. a,)(1 ET· ethnobotany.
The top three priority populations for ill silll conservation are Kuni, Jimma and
Asella. Nekemte population follows in fourth position Crable 17a). Kuni, Jimma and
Asella mc still the top three priority populations for ex silll conservation: Gore and
Bulki equally follow in fourth position Cfable 17b).
In order to get better insights into the conservation units that can best maintain
evolutin,,,,,')' processes and the potential for evolutionary change in the future,
consideration of both genetic and ecological information is important (Endashaw
Hekele. I ')86: Crandall el al., 2000). However, for ethnobotanieally important species

eonSi(i<'ralion of its ethnobotanic imporlance must be considered, Furthermore.
biochemical evaluations are also imporUlllt because the chemical constituents fmd
amounts may vary based on [ocal conditions, Ecological factors 1 slIch as frequency
dependent mating, pollinator interactions (Cavers el af,. 2003) as well as regeneration
status. should also be taken into consideration, Furthermore, as Crandall e( III, (2000)
recoillmends. management of populations for conservation should consider the
Ib!lowing three principles, First. management should aim to preserve adaptive
diversity and evolutionary processes across the geographic range of a species. Second,
management actions might depend Oil the severity and nature of recent disturbance on
the conservation tlllit. Third, when possible. managemenl recommendations should be
made on Ihe basis of adequate sampling and appropriate analyses. With regard to
ecological lactors, the present study lacks data but, as a starling point, idcntilication of
priority ~onservation units mainly based on molecular data can provide a valuable
practical li'amcwo,'k for the conservation of p, q!i';cO/J(I in Ethiopia,
From the ethnobotanic study, practices that have either positive or negativc impact on
the conservation of p, a!r;c{Jf/{l wcre identified. Some traditional practices such as
using the tree Ibr construction, carpentry and fuel are detrimental as long as
suslainahle lise is not practked: whereas other practices such as using leaves and
barks ill!' local medicine are not as such damaging to the plant Still other traditional
practices and beliefs such as avoiding the use of /" (I/;';C(lII(I wood li'om hOllse
construclion by people around Injibara tearing strike of the house by lightening,
protecting trees lor wedding ceremony in some localities of Amhara region and lor
the dill" I practice called 'Kallu' in some localities or Oromia have positive
contribulion to the conservation of tile species,
83

5.2. COIll'iusions
There is high level of genetic diversity in Ethiopian populations of 1'. a/i'ic{f/w though
thc species has becn highly threatened by deforestation in the country. Ncvertheless,
there arc di fferenccs in the level of genetic diversity among the investigated
populations. Generally, populations in the southwestern part of the country havc
relative" higher gcnetic diversity.
The populations are significantly differentiated li'om each other in both nDNA and
cpDNA. The differentiation among populations in epDNA is highcr than nDNA.
which ("ould be due to the differences in the elket of genetic drill and/or the
mechanism of gene flow between cpDNA and nDNA. Most of the nuclear genetic
variation lies within populations, whereas for that of chloroplasts nearly half of the
variation lies among the populations. Significant nuclear genetic differentiation also
exists alllong groups of populations classified based on geographical factors and the
software STRUCTURE. However. there is no significant genetic differentiation
among the populations collected from differcnt tree seed zoncs of Ethiopia.
1'1'/11//1,\ !I/i'ic{/}/{/ populations in Ethiopia are genetically differentiated through
isolation by distance; populations in closc proximity are gcnetically Illore similar than
more distant populations as evidenced by signiticant correlations between genetic and
geographic distances in both nSSR and cpSSR markers.
There is also statistically significant variation among the populations or P. a/i-i('{//lil in
the assessed morphological traits. The significant divergence of populations in the
lllorpllOlugicai traits could be due to genetic andlor envirollmental dillercnccs or it
could be due to differences in age structures or the populations.
84

Nuclear III iCl'osatell ite cI ivcrsity of P. q/l'ic({I/{{ has marginally signi ficant
phylogc(lgraphic pattern; but no pattern for cpSSR diversity in the investigated
populations, The phylogeographic pattern in cpSSR could have been disrupted by
genetic llt'ili; as driti has a stronger effect on cpDNA than on nONA,
The absence of Ethiopian haplotypes in the' Western' populations (West A i'rican and
Ugandan populations) does not support migration scenarios of p, aji'ic({I/li li'om
Ethiopia to 'West Ali'ica', However, the high proporti,on of haplotype sharing with
'east' (e:-..clucling Uganda) and southern African populations and a higher mean within
populati(ln haplotype diversity in the Ethiopian populations supports the hypothesis
that suggests southward migration ofP. ({/i'iClll1(1 tt'OIll the Ethiopian highlands,
PrllllllS (//i"ic(ll1o has several uses in the country and six ma.Jor lise categories arc
determined lor the species, Some traditional practices such as using thc tree lor
construction, carpentry and fuel arc detrimental; whereas other practices such a~ lIsing
leaves and barks for local medicines are not as such damaging to the plant. Still other
tradition,d practices and beliefs such as protecting trees for wedding ceremon), and
rituals 11<1\,c positive contribution to conserve the species.
Based on the weighted-score population prioritization matrix, which is developed in
this stulh, the top three priority populations for ill situ as well as ex situ conservations
art' KUIl i. J illlJl1a. and Asella.
5,3, Recommendations
As the study revealed high within population genetic diversity and signilicant genetic
differentiation aillong popUlations, nearly all the investigated populations of P.
((/;';ClIIJU deserve conservation. However. as there are otten limitations of resollrces to
85

conserve such a large number of populations, the weighted-score population
prioriti/:ttion matrix developed based on genetic and morphological data of the
present study should be considered during the designing of strategies to conserve the
species. (;enotypes lI'om the other populations should be introduced to those sites
with high population priority: namely Kuni, Jimma, and Assela.
Provenance trials should be carried out to disclose whether the causes of the
differences among populations in quantitative morphological traits are genetic andlor
environmental or age structure differences.
The tree seed zone system of Ethiopia, which was delineated based on ecological
faclor~ J1(~eds adjustment for P. (~/i'j('m}{/ lIsing genetic data li'olll molecular studies
and provl'nance trials.
Biomedical studies are needed to verily the claims on the medicinal values of 1'.
al;';e{/I/ll I,"' both humans and livestock. Prioritizing based on informants' consensus
would help to locus the biomedical or pharmacological studies to some key health
problems.
("omm[1I1"t) participatory conservation strategies should be designed to reduce the
negative impacts of traditional practices on P. ({ii'icollll and to increase the henetits
comnlLII1ities gain lI'om the species.
86

REFERENCES
Aalbrek. A. (1993). Tree Seed Zones for Ethiopia. Forestry Research
('cnlerINational Tree Seed Project, Addis Ababa.
Abayneh Derero (2007). Genetic variation in Cordia l!fi'ic(tlw Lam. in Ethiopia. PhD
ilissertation. Georg-August University. Gottingen. (Jermany.
J\bayneh Dcrero, Gailing, 0 .. Finkeldey, R. (20 II). ivlaintenance of genetic diversity
in Cordia (!INeal/o l.am., a declining forest tree species in Ethiopia. Tree
AbdeJh, (lure (2()04 J. Seed,borne fungi of the Ati'omontane tree species PodoC{//711fS
.ti;/CIlllls and Prlllllls a{i-icol/o in Ethiopia. PhD Thesis, Swedish University of
;\griclIllliral Sciences, LJppsala.
Aegisdollir. H.H .. Kuss. P. and Stocklin. J. (2009). Isolated populations of a rare
alpine plant show high genetic diversity and considerable population
difterentiation. Ann. BOI. 104: 1313-1322.
Anonymous (2003). Pores! Proclamation ofOromia Proclamation No. 7212003.
Austedit/, F .. Mariette. S., Machon, N .. Gouyon. P-H. and Goddle, B. (2000). Effects
oi' colonization processes on genetic divcrsity: differences between annual
plants and tree species. Gelletics 154: 1309-1321.
Avise . .I.e. (2000). I'hylQgeography: The Histol'~' and FOl'mation or Species.
Harvard University Press, Cambridge.
87

Azene Ilekele (2007). Useful Trecs "lid Shrubs of ICthiopia: ldcntiticatioll,
Propagation alld Managcmellt for 17 Agroclimatie ZOlles. World
Agroforestry Centre, East Africa Region, Nairobi Kenya.
[liinkr. (i .. Moog, LI .. Fiala, B .. IVlohamcd, wI.. Weising, K. and Blattner, ['.R. (2006).
;\ chloroplast genealogy of myrmeeophytie Macar<ll/ga species
(I·.uphorbiaceae) in Southeast Asia reveals hybridization, vicariance and long·
dIStance dispersals. Mol. I'col. IS: 4409-4424.
Barker. N., Cunningham, A.B .. Morrow, c., and Harley, E.H. (1994). A preliminary
investigation into the use of RAPD to assess the genetic diversity of a
threatened A li'iean tree species: /',.,IIIIIS aji-iew/{{. S!reli!zia I: 221-230.
Beentje. H..1. (1994). Kellya Trees, Shrubs and Liall"s. National Museullls of
I(enya, Nairobi.
Berens, D. (20 I 0). Genetic dynamics across early life stages in the tropical trce
I'I'IIIIIIS aji-ical/([ (Rosaceae). PhD Dissertation, Johannes Gutenberg
l !niversity Nlainz, Germany.
Betti, ,1.1.. and Ambura, J. (2011). Mass of PI'III/IIS ({Mcal/a stem barks on the Mount
('"meroon forest. IlIf . .f. Bio""ers. ('ollSen'. 3: 267-279.
Bii, C. I(orir, K.R .. Rugutt, J. and Mutai, C. (20 I 0). The potential usc of I'ml/lls
uji-icmw for the control, treatment and management of COlllillon fungal and
bacterial inlections. J. Med Plall! Res. 4: 995-998.
BirdLill' International (2012). Eastern Afrolllontane Biodiversity Hotspot: Ecosystem
I'rollle, Final Version.
88

Horscil. 'I .. Hill!. K.W .• Quandt. D., Wilde. V .. Neinhuis, C. and Burthlott. W. (2003).
Non-coding plastid ImT-lmF sequences reveal n well resolvcd phylogeny of
basal angiosperms . .I. Fvol. Bioi. 16: 558·~576.
Brcitenbach. r.v. (1963). The Indigenolls Trees of Ethiopia, Ethiopian Forestry
,\"ncintion. Addis Ababa.
Rreitcnhach. F. V, (1965). The Indigenous Trees of Southern Africa, 4 Vols.
("wernment Printers. Pretoria.
Catnlano. S .• Ferretti. M .. Marsili, A. and Morelli, I. (1984). New constituelHs or
l'nlllllS ajricfIIlO bark extra,'!..1. Nal. Prod. 47: 910·911.
Cavalli -\ lorza. I.. L. and Edwards. A. W.F. (1967). Phylogenetic analysis: models and
"stimatiol1 procedures, Alii, J. HUIll. Gelle/. I'): 233 257,
Cawrs. \ .. Navarro. C and Lowe. 1\ . .1. (2003). j\ combination of molecular markers
identities evolutionarily signiticant units in (',,<ire/a odomla L. (i'vlcliaceae) in
(05tn Kica. Co liSeI', Gmcl. 4: 571 ~580.
L,vers. :) .. ~'lunro, R.C.. Kadu, C.A.C. and Konrad, H. (2009), Transier of
ll1iel'osatellite loci lor the tropical tree Pnmlls '!Ii'icClI/{/ (Hook.f.) KalknHln.
Sill'lle Gellel, SS: 276279,
Chester. \'i.. Cowan. R.S .. Fay. M.L ancl Rich. T.C.C. (2007), Parentage or endemic
,""rims I.. (Rosaceae) species in the British Isles: evidence Irolll plastid DNA
H,,/, .I, Lil/n Soc, 154: 291 .. 104.
89

Cipriani_ G., Lot, G., I-luang, W.G., rvlarrazzo, M.T., Peterlunger, E. and Testolin, R.
(1999). AC/GT and AG/CT microsatellite repeats in peach [I'/'IIIIII.\' I',,/'.\'im
(I.) Batsch]: isolation, characterization and cross-species amplitication in
/'I'//III1.\'. iileo/'_ AI'I'!. Gellef. 99: 65-72.
Clemen\. M .. Posada, D. and Crandall. K.A. (2000). TCS: a computer program to
cst imate gene genealogies. Mo!. Fcol. 9: 1657- 1660.
CoetZCl'_ .I.A. (1967). Pollen analytical studies In Fast and Southel'll Arrica.
1'"I"ea"col. lUi'. 3: J - J 46.
Crandall. K.A. l:lininda-Emonds, O.R.I'., Mace, (i.M. and Wayne, R.I<. (2000).
('onsidering evolutionary processes in conservation biology. ii'elll!I' Em/.
h'ol. IS: 290-295.
CunninglHull. A.fl. (J 996). People, Park and Plant Usc: Recommendations for
:\-I nltiple-Use Zones and Development Alternatives a!'Ound Bwindi
Impenetrable National Park, Uganda. People and Plants working paper 4,
l' N ESCG, Paris.
Cunningilam, A.B. (2001). Applied Ethnol!otany: People, Wild Plant Use and
Conservation. Earthscan Publications Ltd., London.
Cunnin,',I1am, A. 13. (2006). Convention on international trade in endangered species
01' wild l~ltIl1a and flora significant trade review of Prlllln\' q/i-iCWlU. Sixteenth
Illceting of the Plants Committee Lima (Peru).
90

Cunn i n ",ham, A.B. and tvl benk um, F.T. ( 1(93). Sustai nability of Ha r\'esli ng 1'I'IIIIIIS
/f./i'icallll Bal'l< in Cameroon: A Medicinal Plant in International Trade.
I'cople and Plants working paper 2, UNESCO. Paris.
Cunningham, iVI" Cunningham, A.n. and Sehippmann, U. (1997). TI'ade in PI'I/II/IS
II/i'iellllll and the Implementation of CITES. German Federal Agency 1(,1'
Nature Conservation, Bonn, Ciermany.
Dawson. I. and Powell, W. (1999). Genetic variation in the A fi'omontane tree 1'1'lI11/1,\'
1I/J'ic(fJl{I, an endangered mcdicinal species. Mol. E('ol. 8: IS I-I 56.
Dawson, I" Were, .I. and Lengkeek, A. (2000). Conservation of P/,IIIIUS {!/i'i('(fJ/{[, an
over-exploited AII'ican medicinal tree. In: FMest Genetic Resonrces No, 28,
PI'. 27-H (Palm berg-Lerche, c., Hald, S. and Sigaud, P., cds.). FAO, Rome,
Iialy.
Deba!..I. (1966). Br. App., 25.893/66, June, 10.
Demel I eketa), and Granstrom, A. (1995). Soil seed banks III dry At,'omonlane
",rests of Ethiopia . .1. /leg. Sci. 6: 777-786.
DemisseIV Serlse, Gailing, 0" Eliades, N-G. and Finkeldey, R. (2011).
,'\nthropogenic and natural causes inOuencing population genetic structure or
.!/I/lipaus 1'I'O('e/'(/ Hoehs\. ex Enell. in the Ethiopian highlands. Gene!. Resow.
(mp /'1'01. 58: 849--859.
Dieringer. D. and Schlotterer, C. (2003). MICROSATELLITE ANALYSER (MSA):
a plat/ell'lll independenl analysis IDol for large micros"tellite data sets. Mol.
/ceol. Noles 3: I 67-1 69.
91
Gerlach. G. and Musoll~ K.F. (2000). Fragmentation of landscape as it cause lor
!!l'nctic subdivision in bank voles. ('OIlSI!J'l'. Bio/. 14: 1066·1074.
Ghorballi. A., Naghibi,F. and rVlosaddegh, 1\1, (2006). Ethnobotany,
cthnophannacology and drug discovery. fraJ!. J. Pilal'm. Sci. 2: 109·11 S.
Givnish. T..I. (1999). On the causes or gradients in tropical tree diversity. J. licol. 87:
193-210.
(joudc1. J. (1995). rSTAT (Versioll 1.2): a colllputer program to calculate F-statistics.
J llered 86: 485 486.
Hailu ,\lI1attl (2007). Genetic variation in some natural population or Prill/liS A/i';f'{/IIII
from Ethiopia as revealed by rnnclomly amplitied polymorphic DNA (RAPD).
ivlSc Thesis, Addis Ababa University, Addis Ababa, Ethiopia.
Hall, JJL O'Brien, E.M. and Sinclair, F.L. (2000). Frlmlls (I/ric(ll/I/: A Monograph.
School of I\gricuitural and Forest Sciences Publication Number 18. University
"I' Wales, Bangor.
I-Iamilton, /\.C. (I Q72). The interpretation of polien diagrams from highland Uganda.
I'u/aeoeco/. Ali'. 7: 45·149.
Hamilton. A,C, (1974). Distribution patterns or torest trees in Uganda and their
historical significance. VegelalioJl 29: 21·35.
Hardy, 0,,1, ancl Vckemans. X. (2002), Spagedi: a versatile computer program to
analyse spatial genetic structure at the individual (]I' jJopulation levels. Mol.
1·.1"0/. Noles 2: 618-620,

I-!edbert!. O. (1989). Rosaceae. In: Flora of Ethiopia, Pittosporaceae to Araliaceae,
Vol. 3, pp. 31- 44 (Hedberg_ I. and Edwards, S., eds.). Addis Ababa/ lJppsala.
l'lhiopia /Sweden.
Hutchings, A., Scott, A.I-I., Lewis, G. and Cunningham, A.B. (1996). Zuln Medicinal
I'lallts: An Inventory. University of Natal Press, Scottsville.
Iverson. C. (1993). Dossier on 1'1'111111.1' aji'ic(///{/ (Hook f.) Kalkm. Roseaceae.
I !npnblished Report prepared for the School of Agricultural ami Forest
Sciences. University of Wales. Bangor.
.Iimu. L.. N. (20 II). Threats and conservation strategies for the African cherry (1'1'111111.1'
iI!i-;cwla) in its natural range- a review . .!. f.-col. Nill. Ellviroll. 3: IIS-130 .
.lost, L. (2008). GST and its relatives do not measure ditferentiation. Mo/. lOco/. 17:
41115--4026.
Kadu .. C'.A.C., Schueler, S., KOllrad, H., lvIuluvi, G.IvI., Eyog-ivlatig, 0 .. rVluchugi, A ..
Williams. V.L .. Ramamonjisoa, L., Kapinga, c., Foahom, B., Katsvanga. C ..
I-Ianlshimana, D., Obama, C. and Geburek, T. (20 II). Phylogeography of the
;\ fromontane PrllJllIs (~/i'icllll(f reveals a former migration corridor between
r::ast and West African highlands. Mol. Ecol. 20: 165-178.
Kadu, c'A.C., Parich, A., Schueler, S .. Konrad, 1-1., lvIuluvi, G.IvI., Eyog-lVIatig, 0.,
iVluchugi. A .. Williams, V.L., Ramamonjisoa, L .. Kapinga. C .. Foahoill. B ..
Katsvanga, C., Hafashimana, D., Obama, C .. Vinceti, B., Schumacher, R. and
(!cburek, T. (2012). Bioactivc constituents in 1'1'111111.1' II/i';cil/w: geographical
95

v;\I'iation throughollt Afi'ica and associations with envirollmental and genetic
parameters. PIi)'lo"lielllisIIT 83: 70 78.
Kadu, C'.i\.C .. Konrad, H .. Schueler, S .. Muluvi, Ci.M .. Eyog-Matig, 0 .. Muchugi, i\ ..
\Villiams, V.L., Ramamon.iiso(l, L., Kapinga, C., Foahol1l, B., Katsvanga, C,.
Iialashimana, 0 .. Obama, C. and Geburek, 1. (2013). Divergent pattern or
nuclear genetic diversity across the range orthe Afromolllane P/,WIlI.\· iI!i'i,,{///(/
mirrors variable Pleistocene climate of AII'iean highlands. A 1111. BOI. Ill: 47
w.
Kalknlall. C. (1965). The old wLlrld speclcs of Pl'IlIlII.I' sub-genus I. ill//'(}ce 1'lI.I'I/.I'.
!ill/lIleil 13: 33-35.
Kalkmall. C. (1988). The phylogeny of the Rosaceae. BOI . .J. LillI/. SO". 98: 37· 59.
Kindlmalln, P. and Baloullova, I. (2001). Irregular nowering patterns 111 terrestrial
orchids: theories vs empirical data. Web Emf. 2: 75-82.
Kokwal·{l . .1.0. (1976). Medicinal Plants of rcast Africa. East A li'ican Literature
I~urcau, Nairobi, Kenya,
Kumiligll Asmare (2005). Estimatioll of sex-related genetic divcrsity or I/ilgel/iil
"h.\'ssilli"iI (Bruce) .I.F. Gmet. MSc Thesis, Addis Ababa Ulliversity. Addis
Ababa, Ethiopia.
Lambert. .I.E. (1998). Primate Ihlgivory in Kibale National Park Uganda and its
·implications for human use of forest resources. lUi' . .J. Em!. 36: 23424IJ.

,
)
Latta, ICC" (2004). Relating processes to pattcrns of gcnetic variation across
landscapes. Fol'. F;col. Mal/ag. 197: 91·-102.
Legessc Negash (2002). Review of rcsearch advances in some selected A Ii'iean trees
II ith special reference to Ethiopia. !--"!liop . .!. BioI. Sci. I: 81--126.
Legesse Negash (2004). Rapid seed-based propagation method for the threatened
;\ friean cherry (PJ'/II/IiS ali-ieal/a). Nell' Fol'. 27: 215--227.
Lindsay. R.S. (1978). Medicinal Plants of Mal'ak",et, Kenya. Royal BOlanic
(Jardens, Kew.
I.ongll. 1<' and Tira, S. (1981). Constituents of I'l'gelllll ali'ieol/Illi/ bark. Plal/la Med.
,12: 195-196.
,'vlaheslla""n. IVI. (2004). Molecular markers: history. features and applications. Adv.
liiolech. Ang: 17-24.
Mantel. N. (1967). The detection of disease clustering and a generalized regression
approach. ('(/I/cel' Res. 27: 209-220.
Marchant, R., Taylor, D. and Hamilton, A. (1997). Late Pleistocene and Holocene
history at Mubwindi swamp, southwest Uganda. Qllal. Res. 47: 316·328.
Martin. ( ,..I. (1995). Ethnobotany: A Methods Manual. Chapman ancl Hill, London.
Martinelli, E.i'vl., Seraglia, R. and Pifferi. G. (1986). Characterization of Pl'gelllll
a(i'i{'{/1/11111 bark extracts by I-IRGC with computer assistance . .!. High Reso!.
e 'hl'OIll(//ogl'. Chl'olllalOgr. ('01111111111. 9: 106-1 10.
97

Mbatudde, lVI., Mwanjololo, lVI., Kaklldidi, E.K. and Dalitz, H. (2012a).
1\lodelling the potential distribution of endangered PrullllS o/i-i('ol/{/ (Hook.f.)
Kalkm. in East Africa. 11j;' .!. Ecol. 50: 393--403.
Mbatuddc. 1Vi" Nyakaana, S" rlob. S. and Dalitz. H. (2012b). Genetic slructllre
"I' I'rul1i1S a/i"ic({l1(/ Rosaceae (Hook.l~) Kalkm. in East AIi'iea, as
inferred 6'om nuclear and chloroplast DNA. A/;·. J. PiOI1! Sci.
mo!eclll1o/. 7: 9-14.
McCain. C.lv!. (2007). Could temperature and water availability drive elcvational
sl'ccies richness patterns') A global case study for bats. Gloh. D:o/. iliogeogr.
1(,: 1-1.l.
Meirmans, P.G. and Hedrick, r.w. (2011). Assessing population structure: FSI and
rc:lated measures. Mo/. ['co/. Resollr. 11: 5-18.
Mills. L.S. and Allendorf. F. W. (1996). The one-migrant-per-gencration rule III
conservation and management. COl/serv. Bioi. 10: 1509-1518.
Mirutse C;ida)', Zemedc Astinv, Zerihun Woldu and Tilahun TeklehaYlllanot (2009).
I\·ledicinal plant knowledge of the Beneh ethnic group of Ethiopia: an
c·thnobotanical investigation . .J. £tlil/o"io/. £tlll/omed. 5: 34.
Moa Megersa, Zemedc Asfaw, Enserillu Kelbessa. Abebe Heyene and Bizuneh
Woldeab (2013). An ethnobotanical study of medicinal plants in Wayu Tuka
ilistriet, East Welega Zone of Oroillia Regional State, West Ethiopia. J
Ullilobiol. ElllIlomed. 9: 68.
98

Muchugi, A., Lcngkeek, G., Agufa, C., Muluvi, G., Njagi, E. and Dawson, I. (2006).
Cicnetic variation in the threatened medicinal tree Pl'llJ1l1S {{/i'ic(fJ1{( in
('i.lmCrOOll and Kenya: implications for current management and evolutionary
history. S. A/i-. J. BOI. 72: 498 - 506.
Muranty. H., Schennann, N., Santi, F. and Dufoll!', .I. (1998). Gcnetic paramcters
estimated tl'om a wild cherry cliallel: consequences for breeding. SilVlle Gellel.
47: 5-6.
MwanZH. E . .I.I'v!., Waithaka, S.K., Mibcy, R.K., Kariuki, G. and Simons, S.A. (1999).
First report of Collelolriclllllll Rloeosporioides as a foliar and dieback
pathogen of PI'IIIIIIS ,,/i';c:{///(/ in Kenya. 1'1,,"1 Dis. 83: 79.
Nci, M. (1972). Genctic distance betwcen populations. Alii. Nat. 106: 283-292.
Nei, 1vI. t 1978). Estimation of average hetcrozygosity and genctie distance fro111 a
small number of individuals. Gellelics 89: 583-590.
Nigussic Amsalu (2010). An ethnobotanieal study of medicinal plants in Farta
Worcda, South Gondar Zone of Amhura Rcgion, Ethiopia. I\'ISc Thesis, Addis
i\baba University, Addis Ababa, Ethiopia.
Nsom. C,L. and Dick, .I. (1992). An ethnobotanical tree survey of the Kllm area.
I inpublished Report prepared for the !jim Mountain Forest Project.
Nybom. II. (2004). Comparison of different nuclear DNA markers for estimating
intraspecitic gcnetic divcrsity in plants. Mol. Eco!. 13: 1143-1155.
99

Ohta, S .. Nishitani. C. and Yamamoto, T. (2005). Chloroplast microsatcllites in
l'I'IIIII1S, Rosaceae. Mol. Eco/. Notes 5: 837-840.
Omonhinmin, A.C. (2012). Ethnobotany oj' Da<T),odes "dlltis (G. Don) H .. I. Lam in
Snutilcrn Nigeria I: practices and applications among the Yoruba speaking
pl·ople. Etllllohot. Res. AplII. 10: 175-184.
I'eakall. R. and Smouse, I'.E. (2006). GENALEX 6: genetic analysis in Excel.
Population gcnetic solhvare for teaching and research. Mol. Eco/. Notes 6:
2X8-295.
I'eakall. R. and Smouse, P.E. (2012). GenAl Ex 6.5: Genetic analysis in Excel.
P()pulation genetic solhvare for teaching and research
liioin/izl'lIIatics 28: 2537-25.19.
an update.
Petit, R . .I .. Duminil. .I" Fineschi, S" Hampe, A., Salvini, D. and Vendramin. G.G.
(2005). Comparative organization of chloroplast, mitochondrial and nuclear
diversity in plant populations. Mo/. &01. 14: 689-701.
Pons, O. and Petit, R.J. (1995). Estimation, variance and optimal sampling of gene
divcrsity. I. Haploid locus. 71leol'. App/. Gellet. 90: 462--470.
Pons, O. and Petit, R . .I. (1996). Measuring and testing genetic differcntiation with
ordered versus unordered alleles. Gelletics 144: 1237·1245.
Pritchard . .I.K., Stephens, P. and Donnelly, P. (2000). Inference oj' population
structure using multilocus genotype data. Genetics 155: 945-959.
100

Ragunathan, M. and Mequcnte Solomon (2009). The stueiy of spiritual remedies in
orthodox rural churches and traditional medicinal practice in Gondar Zuria
district, Northwestern Ethiopia. Phcog . .!. 1: 178-183.
Reusing. M. (2000). Change detection of natural high forests in Ethiopia using remote
s"nsing and GIS techniques. 111/. Arch. Flw/ligl'{I11/. Rell/o/e .')'1'11.1'. XXXIII
(I'art (7): 1253-1257.
Sacandc. M .. Pritchard. H.W. and Dudley, A.E. (2004). Germination and storage
characteristics of 1'1'111111.1' {//i-iC{/lIo seeds. Nell' For. 27: 239 .. ·250.
Sintayehll Tamenc (20 II). An ethnobotanical study of medicinal plants in Wondo
(jenet natural torest and actiacent kebeles, Sidama Zone, SNNP Region,
I.thiopia. MSc Thesis, Addis Ababa University, Addis Ababa, Ethiopia.
Sosinski. H .. Gannavarapu, Ivl.. Hager, 1..1)" Beck, L.E .. King, G . .I .. R)'der. C.D ..
Rajapakse. S., Baird. IV.V., Ballard. R.E. and Abbott. A.G. (2000).
(harncterization of microsatellite markers III peach 1'1'111111.1' pel'.I'ico (L.)
Ilatsch. Theol'. Appl. (jelle/. 101: 421·-428.
Spinage. CA. (1972). The ecology and problems of the Volcano National Park,
R wanda. BioI. COlISerl'. 4: 194-204.
SPSS Ilil. (2007). SPSS for Windows, Version 16.0. SP';S Inc .. Chicago.
Squirrel. .I" Hollingsworth, P.M. and Woodhead. IVI. (2003). How much effort is
required to isolate lIuclem microsatellites from plants? Mol. Leol. 12: 1.139
101

Steffen. W .• Burbidge. A.A .. Hughes, L., Kitching, R., Lindenmuyer, D., Musgrave,
\\! .. Smith, i'vl. S. and Werner, P.A. (2009). Australia's Biodiversity and
Climate Change. csmo Publishing, Australia.
Stewart. K.M. (200 I). The eommerciul bmk harvest of the A tHean Cherry (f'tllllll"
II/tic(/J}(/) 011 Mount Oku. Cameroon: etTects on traditionaluscs and population
dvnamics. PhD Dissertation. rlorida International University. USA.
Stell'art. K.M. (2003a). The ;\Iikan Cherry (Prlmu.I afi'ic(Jlla): Can lessons be learned
rr\.)ll1 an over-exploited medicinal tree? J EI/mupJwl'lI1{lC()1. 89: 3 M I.;.
Stewart. K.M. (200:lb). The Alrican cherry (1'1'111111.1 q/i'icillla): li'om hoc·handles to
the international herb murke!. Ecol/. BOI. 57: 559-569.
Sunderland. T. and Nketor. .I. (J 996). Consel'vation through cultivation: a ease stud)
01 the propagation of {'/,W/I!S (,/i-iC(/}IiI. In: A Strnlegy for the COllservatioll
,,1'1'1'111111.1' qfri<'llllll Oll Mount Cameroon. Technical Papers and Workshop
Proceedings, 2 J ·22 February,
Sunderland. 1'. and Taka, C.T. (J 999). The exploitation of {'ruilllS aji'it;w/(/ on the
island of Bioko. Equatorial Guinea. 1\ report for the People ami Plants
Initiative, WWF·Gcrmuny and the IliCN/SSe Medicinal Plant Specialist
( ;l'OUp.
Taye Hekele, Gailing, 0 .. Mohammed Llmer and Finkeldey. R. (2009). Chloroplast
UNA haplotype diversity and postglacial recolonization of lI11gullia
ui)J'ssillic(f (Bruce) ,1.F. Gmd. in Ethiopia. I'll/III ,)\'.1'1. E""I. 280: 175 ·185,
102

Taye fkl<ele, Gailing, O. and Finkeldey, R. (20 II). Assessment and integration of
genetic, morphological and demographic variation in J-iagellia {fhyssillic{f
(Ilruce) J.F. Gmel to guide its conscrvation . .I. Nat. COl/sen'. 19: 8-17.
Tchoundjcu, Z., Avana, M.L., Leakey, R.R.B., Simons, A..I., Asaah, E., Duguma, B.
and Bell, J.B. (2002). Vegetative propagation of Prill/liS ({/i'ieal/a: effects of
rooting mediulll, auxin concentrations and leaf area. Agndhr, ,\)!.\'I. 54: 183
1')2.
Tesl:1ye Wubet, Weill, M., Kottke, I., Demel Teketay and Oberwinkler, r. (2003).
Molecular diversity of arbuscular mycorrhizal fungi in Prill/lis a/i';c(lI/o, an
endangercd medicinal tree species in dry AII'omontane forests of Ethiopia.
Nl'lI' Phytol. 161: 517-528.
Tileye I'cyissa, Nybom, H., 8anish, LV. and Welander. M. (2007). Analysis of
[!enetic diversity in the cndangered tropical tree species Hagel/;a aiJyssil/;('a
using ISSR markers. Genet. Resollr. Crop El'ol. 54: 947--958
Tyler, V.E. (1994). Herhs of Choice: The Therapeutic Usc of Phytolllcdicinais.
Pharmaceutical Products Press, New York.
USA I D (2008). Ethiopia biodiversity and tropical torests 1181119 assessment.
Van Oostcrhout, c., Hutchinson, W.F., Wills, D.P.M. and Shipley, P. (2004).
,\'lleRO-CHECKER: soliware lor identifying and correcting genlltyping
errors inmierosatcllitc data. Mol. Ecoi. Notes 4: 535·538.
Van W\I<. B-E., Van Oudtshoorn, B. and Gericke, N. (1997). Medicinal Plants of
Sonth Africa. Briza Publications. Pretoria.
103

Van Zinderen Bakker, lO,M, and Coetzce, lA, (1972), A re-appraisal of Late
()uaternary climatic evidence ti'Ofll tropical Ati'iea. Pa/oeoeco/. A/i'. 7: 151-
I X I.
Vaughau. S.P. and Russell, K. (2004). Characterization of novel mierosatellites and
development of multiplex PCR for large-scale population studies in wild
cherry, Pnll/lls OVilllll. Mo/. Fco/. Noles 4: 429431.
Vinceti. Il., Loo, .I" Gaisberger, II., van Zonneveld, M..I., Schucler, S., KOlll'ad, H.,
Kadu, C.A.C. and Geburek, T. (2013). Conservation priorities tix Prl/ll/l.,
II/rimllll deli ned with the aid of spatial analysis of genctic data and climatic
variables. PI.oS ONF 8: e59987.
Were, .I. and Munjuga, M. (1998). Preliminary tindings on the storage behavior or
I Jn!l1l1s ({/j'iCWlll ancl S'c/eroc(JJ:),o hirJ'ea seed in Kenya. In: Recalcitrant
Seeds, pp. 431-437 (Marzalina, ivl., Khoo, K.C., .Iayanthi, N., Tsan, r.Y. and
Krishnapillay, B" cds.). International Union or Forestry Research
Urganisations. Kuala i.UlllpUL
Weru, S.M. (2012). Distribution, utilization and management of Pnll/IIS a/i'ic(ll/{J
(Hook. f) in Gichugu Division, Kirinyaga District, Central Kenya. MSc.
Ihcsis, Kenyatta University.
West, P.W. (2009). Tree and FOI'est Measurement, 2nd ed. Springer-Verlag, Berlin.
Whitlock. M.C. (20 I I). G's I' and I) do not replace Fs1 . Mol. Eco/. 20: 1083-1091.
Wright. S. (1943). Isolation by distance. Gellelics 28: 114·138.
104

APPENDICES
Appendix I. Specilic sites li'om where I'I'IIIIIIS ({Ii'jew/{{ samples werc collected in
Ethiopia.
Locality Code iVID* Specific site
Addis Ababa AA 4 Sheger and Hamle 19 Parks, and 4kilo & 6kilo campuses of
AALJ
2 Agere
AG Meressa village, 14km North of Agere Mariam town on the
i"ladam way to Gerba town
.1 AmallucI AM 5 Laydamot village, about I Okm North of Amanucl town
4 Asella AS 2km South East of Asella town
5 He(lele I:lD 3km North West of'Hedele town
() Bonga 130 2 Within 2km around Honga town
7 l3ulki HU 0.5 Medhanealem church forest, O.Skm East of I:lulki town
8 Chi limn CH 2 South Eastern part of Chi I imo state forest
9 Denkoro DE 13ili village, about 4km South East of Dcnkoro state forest
10 Debrc Tahor DT Eycsus and Lijitu Mariam churches in Debrc Tabor town
II Gam Mulda GM 1.5 Gara Muleta escarpment, 4km North West of Girawa town
12 Gore GO 2 Within 3km around Gore town
13 l-farCIlIl(l HA About ISkm East of Angetu town within the Harenna lorest
14 Ingihara IN Kolela mountain, about Skm South East of Injibara town
IS .IillllllH .II 4 Skm North West of.limma town on the way to AgarD town
Kibrc 16 KM 2 Within 3km around Kibre Mengist town
Mengist
17 Kuni KU 7km South west of Kuni town
18 Lepis LP 2km West of Lepis town
19 lvlenagesha MN South Eastern part of Menagesha state lorest
20 Nckemte NK 2 About Skm North East of Nekemte town
21 Wof Wasl", WW 0.3 North Western part of Wof Washa state I()rest
;, MD Maximum distance (km) between sampled trees
105

Appendix 2, Sequences of II microsatellite markers (6 nSSR and 5 cpSSR) used in
this study.
"SSR Pl'imcr sequeHce (SI-J') Repent motif'
EMPASO I F: CAAAATCAACAAAATCTAAACC (OA)9(OA) II
R: CAAGAATC'rTCTAGCTCAAACC .-.-.~.~.-.-.-------~ ------,--.-~
EMI'ASot, F: AAOCGOAAAGCACAGGTAG (CT)12
R: lTGCTAGCATAGAAAAGAATTGTAG
EMPAS 10 F: GCTAATATCAA;\ TCCCAGCTCTC (GA)28
R: TGAAGAAGTATGGCTrCTGTGG
UJ F: CTGGCTTACAACTCCCI\AGC (AO)22
R: COTCGACCAACTGACACTCA -------------------------------------
us F: TTCT;\ATCTGGGCTATGGCG (AC)21
R: OAAGTTCACATITACGACAGGG ,-_.---------
P2 F: GCCACCA;\TGGnCTTCC (GA)21
R: AGCACCAGATGCACCTGA
CllSSR Primer sc(]ucncc (5'·.1') Repeat mom' Location
TPSCI' I F: TTGAAAACOAATCCTAATG (T)9 rpl16 inlroll
R: ATTTTCTTTTTCCTTTGTf\TTATC
TPSCP5 F: TTTCTA TCTCA TTGGTCCTT (T)8
intergenic
R: ATTCGCTCTTGACAGTGA T
TPSCrlO F: GGTTTCTTTTGAGTTAT1TGAG (T)9 rps 16 intl'Oll
R: CTTT1TTCTrATTCITCCCCAAC
rps 161'111' F: CAACTTGAGTTATO;\GGATAC (T)9(0111(G)10 rpsl6lntro/l
R: TCGGGATCGAACA TCAATrGCAAC
Lpllll F: CATTACAAA TGCGA TOCTeT (A)4(TA)2 trnT-L spacer
R: n;CTATAT1AATAGGTi\TGTT
, In the species 11'0111 which the markers were originally developed,
106

Appendix 3. List of alleles generated at SIX nuclear and seven chloroplast
microsatellite loci of Prill/liS aji"ic{lIIo (i'om 21 populations in Ethiopia. \ '
EMI'AS10
134 170
138 182
140
142 0:;-.~ '" ~ c " E
146
bO 148 ~ 150
152
~ 154 ~
::?, 156
186
190
192
194
196
202
20,1
206
208
160 210
164 212
168
. Total 27
EMPAS06
190 212
194 214
196
198
200
202
204
206
208
210
20
216
218
220
222
224
226
230
248
nSSR Primers
1'2
144 164
146 166
148
150
152
154
156
158
160
162
19
168
170
172
174
176
178
180
cpSSR Loci
EMPAS01
230 250
236 252
240
242
244
246
248
15
254
256
258
260
262
us 246
248
250
252
254
256
6
U3
142
150
2
TI'SCI'IO TPSCP5 TPSCPI rps 16pll12a rps 16pll12b t1'11T -Lpll11 a trnT-Lpm I b
'Total 4
8
9
10
II
4
9
10
2
2 I
" numbCl' of nucleotide repeats li)r the ll1icrosatellite loci (TPSCI'I, TI'SCI'5, and
TPSCI' I II).
h I ~ presence and 2 ~ absence of fragmcnt for indels (rps 16pm2a, rps 16pm2b, trnT
I "pm I H, and trnT-Lpml b).
107 \
•

Appendix 4. Summary of chi-square tests for Hardy-Weinberg equi I ibri Uill at six
nuclear 1l1icrosatellite loci for 21 {'ml/lls (l1i-icol/(I populatiolls in Ethiopia.
nSSR primers
Populatioll Pop. Code Eivi PASO I EiviPAS06 EI"IPASIO U3 U5 1'2
! Addis Abaha AA ,
Bedelc BO
Chi limo CH
Oebre Tabor OT
KUlli KU
Gore GO
Ilarcnna I-IA
Ingibara IN ""
Jilllllla .II
Kibrc IViengisl Kivi
, Lcpis LP *
rvlenagcslw ivlN
, Nckcmte NK
Bonga BO
Dellkoro DE * ** * >,<>;=';' * , Agcre iVlariam AG
Asella AS
Bulki BU
WofWasha WW * * ; Gara !vluleta Givi * , Amanuel Aivi *
* P < 0.05, ** P < 0.01, *** P < 0.001
108

Appendix 5. Summary or linkage e disequilibrium tests among six nSSR loci tor 21
Prllllll,\ (!/i'j(:ww populations in Ethiopia (Populations with significant linkage
ciiscquilibrium at P < 0.05 are depictcd).
EMI'ASOI I':MI'AS06 EMPASIO U3 US
EMPASfll
EMPASfll> CH,HA.AG
i EMPASIII DT,BO,WW KU,LI',DI':
U3 DE
US KU,KM,WW DE BD,LP,DE,AS KU,RO.DE /
1'2 NK.BO.WW,GM KU,DE.IVW DE.AG,WIV,AM 1.I',Dl:.W\v
109

Appendix 6. The Eva11110 table output of STRUCTURE HARVESTER analysis.
I( Reps Mean LnP(K) Sf. dev LnP(K) Ln'(K) ILn"(K)1 Delta K
2 , -4463.220000 0.901110
3 , -4700.480000 150.499375 -237.260000 461.580000 3.066989
4 :' -4476.160000 50.656717 224.320000 76.220000 1.504638
5 , -4328.060000 22.614663 148.100000 158.120000 6.991924
6 :' -4338.080000 32.985027 -\ 0.020000 74.160000 2.248293
7 :' -4273.940000 19.727975 64.140000 344.540000 17.464540
8 .; -4554.340000 62.620029 -280.400000 106.320000 1.697859
<) ) -4728.420000 74.805862 -174.080000 148.460000 l.n4604
10 , -4754.040000 70.396293 -25.620000
110

Appendix 7. The Evanno graph output of STRUCTURE HARVESTER analysis.
15
:-.~ 10 ~ 0' o
5
0
DeltaK = mean(jL"(K)IJ f scl(L(K))
\
.~- .. -..... / \ ----9
L
3 4 5 I) 7 8 9 K
III

Appendix 8. Pair-wise population matrix of G"ST values for 21 Prunus afi-icana populations in Ethiopia (GnST values below the diagonal and
probability, P based on 9999 permutations, above diagonal).
DE DT NK JI IN GO BD CH AA MN AM LP BO
DE *n ... * *** .... .. ... ...... ** • DT 0.673 .,.* ... •• ...... NK 0.655 0.230 NS "** •• JI 0.543 0.279 0.153 **.n ** *. **'" IN 0.635 0.198 0.146 0.169 u .. '" ••• GO 0.590 0.220 0.153 0.297 0.177 ** •• ••• ... SO 0.608 0.136 O.Ill 0.160 0.160 0.140 NS NS • CH AA
MN
AM
LP
SO
0.552 0.220
0.595 0.267
0.616 0.329
0.551 0.309
0.627 0.325
0.587 0.292
AS 0.681 0.473
BU 0.598 0.505
HA 0.714 0.406
0.057 0.183 0.138 0.175 (I.Oll ** ** NS 0.330 0.247 0.358 0.342 0.094 0.193 ..."* 0.224 0.305 0.312 0.246 0.148 O~151 0.260 ** 0.270 0.333 0.263 0.147 0.136 0.099 0.212 0.167
0.348 0.348 0.370 0.228 0.142 0.228 0.227 0.218 0.150
0.154 0.185 0.239 0.167 0.062 0.133 0.097 0.155 0.098
0.300 0.275 0.299 0.388 0.217 0.141 0.260 0.250 0.327
0.339 0.346 0,409 0.333 0.235 0.220 0.246 0.264 0.281
0.315 0.408 0.345 0.288 0.192 0.151 0.318 0.240 0.188
0.361 0,456 0.447 0.263 0.225 0.214 0.287 0.266 0.086
...... *** ..... .** ,.
*** *'"
.,. NS
** • NS
0.158
0.336 0.241
0.336 0.055
0.190 0.211
0.128 0.128 KM 0.594 0.420
GM 0.685 0.548
AG 0.699 0.399
KU 0.762 0.462
WW 0.799 0.573
0.496 0.531 0.514 0.398 0.376 0.356 0.393 0.301 0.080 0.275 0.279
0,413 0,430 0.452 0.289 0.243 0.321 0.349 0.234 0.216 0.093 0.189
0.340 0.359 0.465 0.405 0.274 0.273 0.260 0.283 0.251 0.322 0.215
0.429 0.513 0.450 0.409 0.530 0.504 0.628 0,498 0.431 0,458 0.374
,. P < 0.05; ** P < 0.01;** P < 0.001; NS, non~significant (p:::: 0.05)
112
AS BU HA .... ••• •• * ..* ."'. • ** "' .. ***
.. * ..
*"* *** n*
** •• • "'* ** *"* *** * •• ..* •• * •• .... ** ••• **. ... ,.* NS **
** ** 0.196 **" 0.146 0.305
0.352 0.272 0.196
0.389 0.396 0.248
0.352 0.346 0.238
0.249 0.295 0.273
0.566 0,477 0,457
KM . ...
.... **
.. **
>I<
.. *" .. *** ,,, ...
0.157
0.133
0.255
0.427
GM AG KU ww ... * ** •
• •• .... .>lu. •• *
••• ••• ** •
•• * ** ... * **"
•• * *.* ••• ••• • •• NS •• • •• ••• • ••• ** • "'** ". •• .... "'." ••• • ••
• ** • * • ••• •• ••• .. ,. " .. . .. *** *** **.
0.265 * ... "** 0.339 0.381 .... 0,474 0.346 0.539

Appendix 9. Pair-wise population matrix of Desl values for 21 Prunus africana populations in Ethiopia (Dcst values below the diagonal and
probability, P based on 9999 permutations, above diagonal).
DE DT
NK
JI
[N
GO BD
CH AA
MN
AM
LP BO
AS BU
HA
KM
GM
AG
KU
WW
DE
0.521
0.526
00403
0.485
0.449
0.474
00408
0,462
0.479
0.397
0.469
0.456
0.550
0.463
0.567
0.436
0.504
0.547
0.642
0.651
DT .....
0.166
0.2Ot
0.133
0.154
0.095
0.154
0.196
0.244
0.217
0.226
0.217
0.370
00402
0.293
0.307
0.400
0.285
0.356
0.425
NK
*** .. **
0.113
0.104
0.113
0.082
0.041
0.263
0.171
0.200
0.261
0.Ii7
0.233
0.268
0.233
0.273
0.372
0.315
0.264
0.312
JI
*"* *"* ..
0.118
0.224
0.118
0.133
0.188
0.234
0.247
0.256
0.139
0.208
0.270
0.308
0353
0.399
0.325
0.276
0.382
IN
*** *
0.125
0.114
0.095
0.275
0.233
0.184
0.266
0.177
0.221
0.318
0.246
0.335
0373
0.336
0.363
0.316
GO
*** **"
**
0.103
0.126
0.268
0.184
0.101
0.159
0.124
0.304
0.258
0.206
0.187
0.279
0.206
0.316
0.289
ED
*** ** ..
0.008
0.070
O.IlO
0.096
0.099
0.045
0.164
0.180
0.136
0.162
0.267
0.174
0.209
0.406
CH
.* ..
NS **
NS
0.143
0.109
0.066
0.159
0.097
0.101
0.164
0.102
0.149
0.243
0.231
0.203
0.372
AA
"** ***
*** **
NS
**
0.201
0.154
0.163
0.072
0.200
0.190
0.237
0.212
0.282
0.261
0.198
0.506
MN
***
**
***
" **
*"*
0.117
0.154
0.116
0.189
0.202
0.171
0.192
0.204
0.165
0.214
0.372
AM
***
** *** **
**
NS
** ....
0.098
0.069
0.243
0.207
0.125
0.055
0.046
0.144
0.179
0.298
>I< P < 0.05; ** P < 0.0 1 ;** P < 0.001; NS, non-significant (P 2': 0.05)
113
LP
*,,* *** ... *
... **"
"
0.111
0.247
0.249
0.124
0.082
0.171
0.058
0.233
0.316
BO
* •• .,,*
..
**
NS
'"
0.184
0.040
0.151
0.090
0.191
0.133
0.162
0.267
AS
*** ***
....
***
*"' .. *.* n*
**
0.146
0.100
0262
0.273
0.259
0.185
0.436
EU
***
**
....
*** ••• NS
0.224
0.198
0.282
0.256
0.225
0.353
HA
**'" *** ***
*** ** ... * ... . ... **
*"
0.129
0.152
0.157
0.194
0.315
KM
*** ** ..
***
**.
** ***
*
*** ***
0.093
0.084
0.181
0.291
GM AG
*** ***
***
***
*** *** ***
NS
***
*** ... ... 0.162
0.229
0.305
*** ***
•• ... *
*** ***
*** ***
** ***
0.281
0.222
KU ww **'" ***
***
***
***
*** *** **" *** *** *" '"*" *** ..... *** ....
*** ... * ***
0.405

Appendix 10. UPGMA dendrogram for 46 P},lIl1l1S ({ji'icana populations including the
data set of Kadu e/ al. (2013). See Appendix 12 for abbreviations of non-Ethiopian
populations and Table 1 for that of Ethiopian populations.
GQl
Z'IV?
SAt
SA2
ZW2 Z'N'l TZo KE~,
TZ4 TZ1
1<E7 KES
TZ':·
MGI
DE
"VVI f...N AS
HA GM Ul
LP ,:; 0
1<1.,1 .~
AG ;:; 8U 0.
0 BO 0.
DT § CH '0. AA
0 :.a GO &1 8D NK AI, .. I
IN ·JI
KU Cf'.>l2
UGl UG3-KE2 KE~,
KE4
KEI UG4
UG2
eMI ekE
114
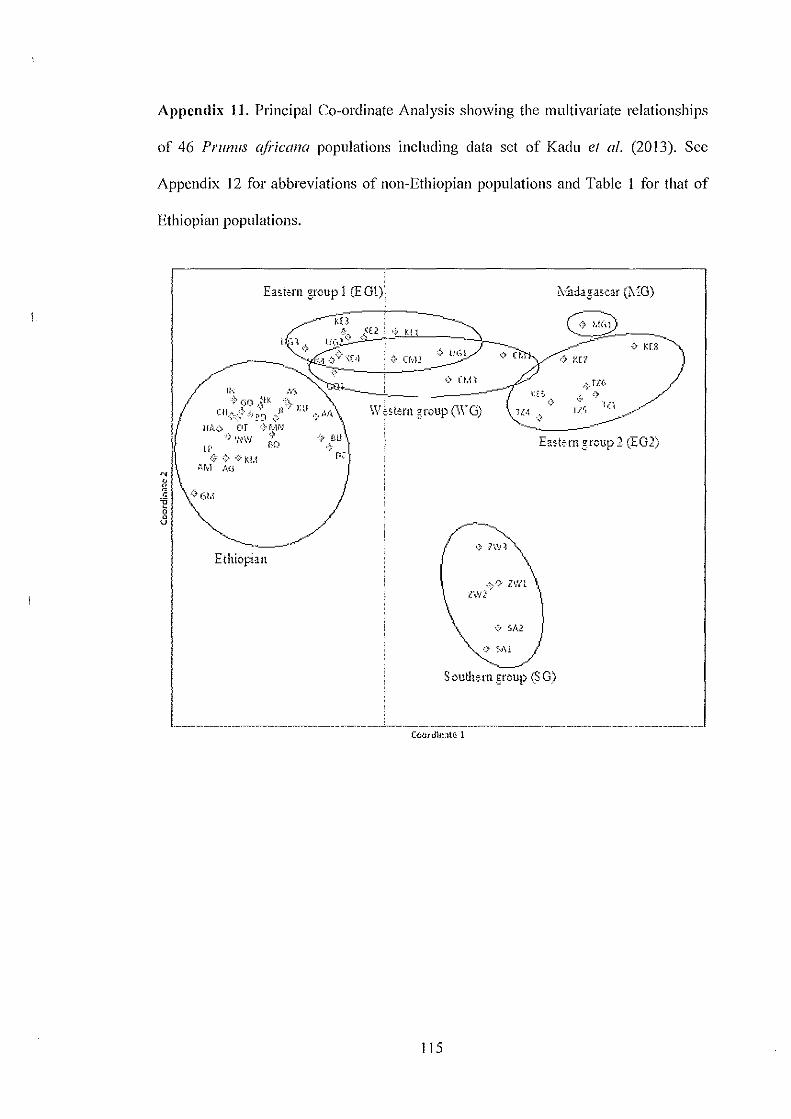
Appendix 11. Principal Co-ordinate Analysis showing the multivariate relationships
of 46 PI'III1I1S ({trica/1a populations including data set of Kadu e/ 01. (2013). See
Appendix 12 for abbreviations of non-Ethiopian populations and Table 1 for that of
Ethiopian populations .
.... _------------Ethiopi1"
115
,>''/ Z'Nt lW.!
S outllem group (S G)
Related Documents