Supporting information Conductive surfaces responsive to temperature, salt and electrical potential Alissa J. Hackett †‡ , Jenny Malmström* †‡ , Paul J. Molino § , Julien E. Gautrot # , Hongrui Zhang § , Michael J. Higgins § , Gordon G. Wallace § , David E. Williams †‡ and Jadranka Travas-Sejdic* †‡ † Polymer Electronics Research Centre, School of Chemical Sciences, University of Auckland, New Zealand ‡ MacDiarmid Institute for Advanced Materials and Nanotechnology, New Zealand § ARC Centre of Excellence for Electromaterials Science, Intelligent Polymer Research Institute, University of Wollongong, NSW, Australia # School of Engineering and Materials Science, Queen Mary University of London, United Kingdom * Email: [email protected] (Jenny Malmström), [email protected] (Jadranka Travas- Sejdic) Electronic Supplementary Material (ESI) for Journal of Materials Chemistry B. This journal is © The Royal Society of Chemistry 2015

Welcome message from author
This document is posted to help you gain knowledge. Please leave a comment to let me know what you think about it! Share it to your friends and learn new things together.
Transcript

Supporting information
Conductive surfaces responsive to temperature, salt
and electrical potential
Alissa J. Hackett†‡, Jenny Malmström*†‡, Paul J. Molino§, Julien E. Gautrot#, Hongrui Zhang§,
Michael J. Higgins§, Gordon G. Wallace§, David E. Williams†‡ and Jadranka Travas-Sejdic*†‡
†Polymer Electronics Research Centre, School of Chemical Sciences, University of Auckland,
New Zealand
‡MacDiarmid Institute for Advanced Materials and Nanotechnology, New Zealand
§ARC Centre of Excellence for Electromaterials Science, Intelligent Polymer Research Institute,
University of Wollongong, NSW, Australia
#School of Engineering and Materials Science, Queen Mary University of London, United
Kingdom
* Email: [email protected] (Jenny Malmström), [email protected] (Jadranka Travas-
Sejdic)
Electronic Supplementary Material (ESI) for Journal of Materials Chemistry B.This journal is © The Royal Society of Chemistry 2015
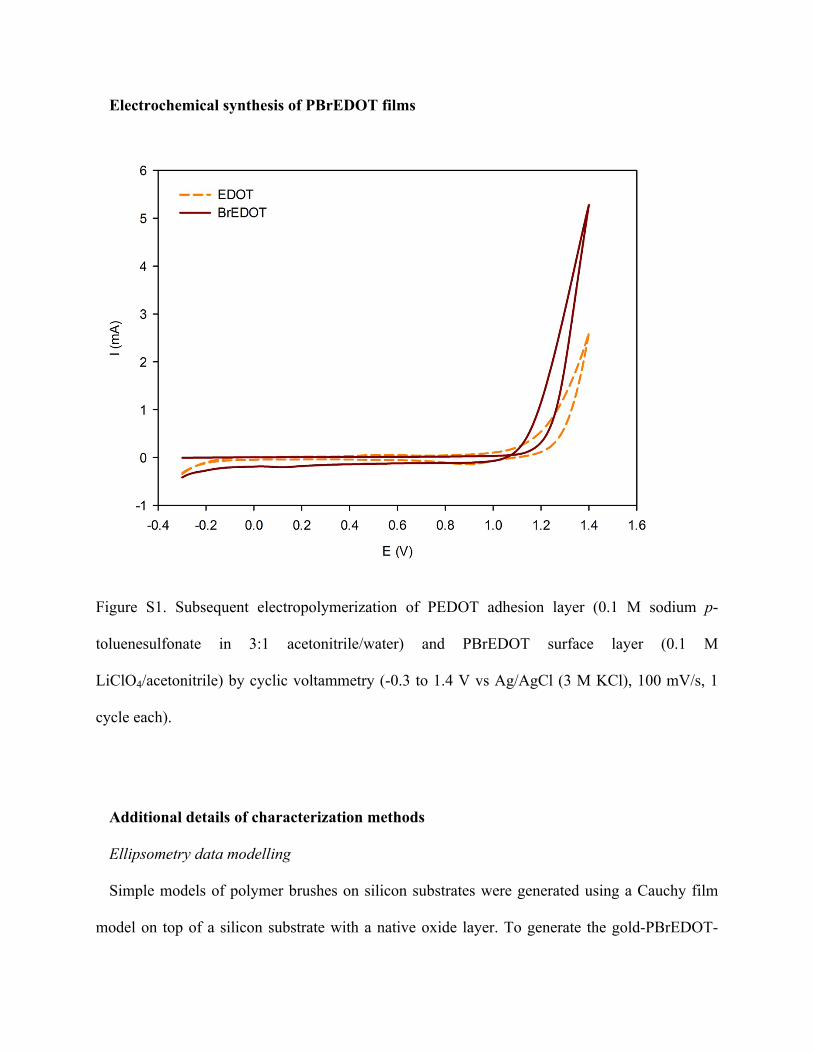
Electrochemical synthesis of PBrEDOT films
Figure S1. Subsequent electropolymerization of PEDOT adhesion layer (0.1 M sodium p-
toluenesulfonate in 3:1 acetonitrile/water) and PBrEDOT surface layer (0.1 M
LiClO4/acetonitrile) by cyclic voltammetry (-0.3 to 1.4 V vs Ag/AgCl (3 M KCl), 100 mV/s, 1
cycle each).
Additional details of characterization methods
Ellipsometry data modelling
Simple models of polymer brushes on silicon substrates were generated using a Cauchy film
model on top of a silicon substrate with a native oxide layer. To generate the gold-PBrEDOT-

brush models, the optical constant of the gold substrate (~230 nm grown on top of a silicon wafer
with a thin titanium adhesion layer) were first measured on the bare gold substrate using a b-
spline model (model of choice from the software package and used for materials absorbing in the
optical range probed and for which the optical constants are not known). The PBrEDOT layer
was also modelled using a b-spline model. The refractive index n obtained from this model for
the dry PBrEDOT at 633 nm was 1.491 and its extinction coefficient k was 0.129, in good
agreement with the values obtained by Baba et al.1 The brush layer was generated on top of these
two surfaces using a Cauchy film model.
The optical constants of the salt solutions used were obtained by fitting ellipsometry data
obtained for a silicon substrate with a 25 nm silicon oxide layer. These were used, for each
concentration and salt type, for modelling the ellipsometry data of gold-PBrEDOT-brush and
silicon-brush samples. Given the complexity of the multilayer model presently used and the
heterogeneity of the materials characterized, a graded layer was not introduced to model the
brush layer, to limit the number of parameters to be fit. In addition, to distinguish PEDOT-driven
swelling from brush swelling, the optical constants and swelling (50% ±10%) of the PEDOT
initiator coatings were measured in aqueous solutions and used to build the model.
Measurements were carried out in triplicate for each salt concentration at room temperature (23
°C).
EIS model circuit parameters
The EIS model circuit (Figure S1) consists of a resistor (R2) in series with a constant phase
element (CPE) representing a non-ideal capacitance Q2 with a fractional exponent 0 < α < 1, both
of which are in parallel to a capacitor C1. Finally, a series resistance R1 is included to represent
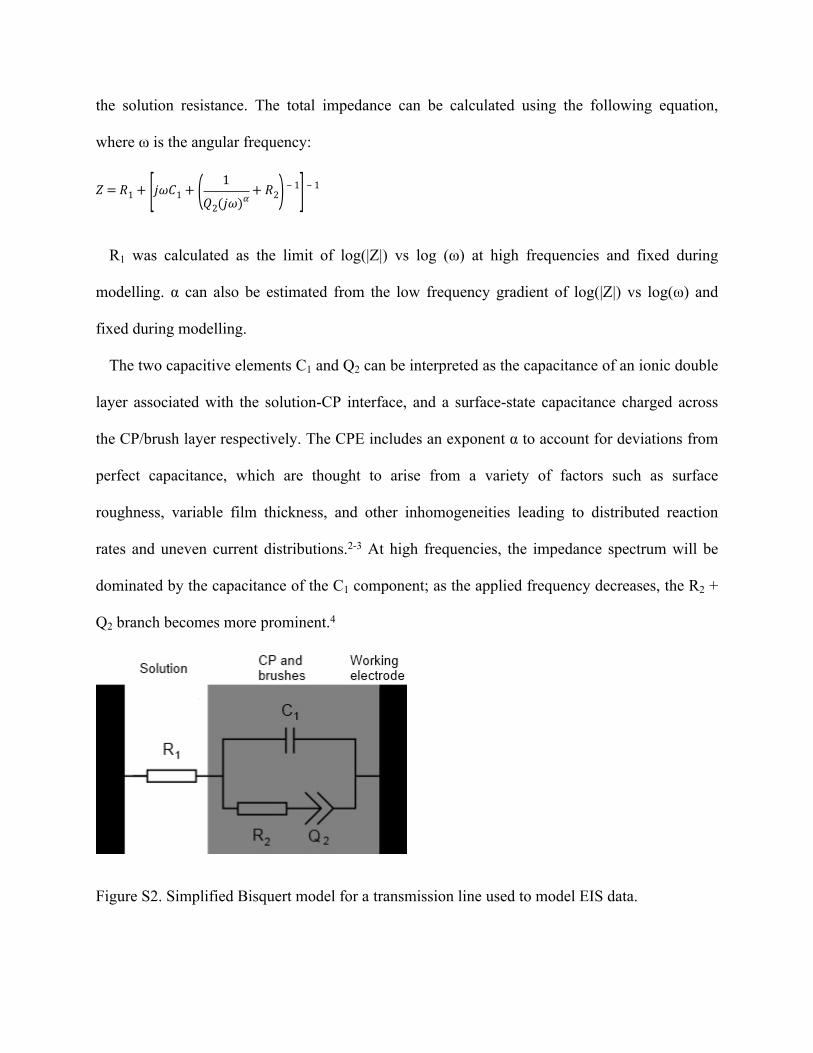
the solution resistance. The total impedance can be calculated using the following equation,
where ω is the angular frequency:
𝑍= 𝑅1 + [𝑗𝜔𝐶1 + ( 1
𝑄2(𝑗𝜔)𝛼+ 𝑅2) ‒ 1] ‒ 1
R1 was calculated as the limit of log(|Z|) vs log (ω) at high frequencies and fixed during
modelling. α can also be estimated from the low frequency gradient of log(|Z|) vs log(ω) and
fixed during modelling.
The two capacitive elements C1 and Q2 can be interpreted as the capacitance of an ionic double
layer associated with the solution-CP interface, and a surface-state capacitance charged across
the CP/brush layer respectively. The CPE includes an exponent α to account for deviations from
perfect capacitance, which are thought to arise from a variety of factors such as surface
roughness, variable film thickness, and other inhomogeneities leading to distributed reaction
rates and uneven current distributions.2-3 At high frequencies, the impedance spectrum will be
dominated by the capacitance of the C1 component; as the applied frequency decreases, the R2 +
Q2 branch becomes more prominent.4
Figure S2. Simplified Bisquert model for a transmission line used to model EIS data.

UV-vis turbidity measurements of free polymers
Figure S3. a) UV-vis turbidity measurements of P(PEGMMA-co-DEGMMA, 1:5) with
increasing Na2SO4 concentrations. The cloud point is determined as the temperature at which
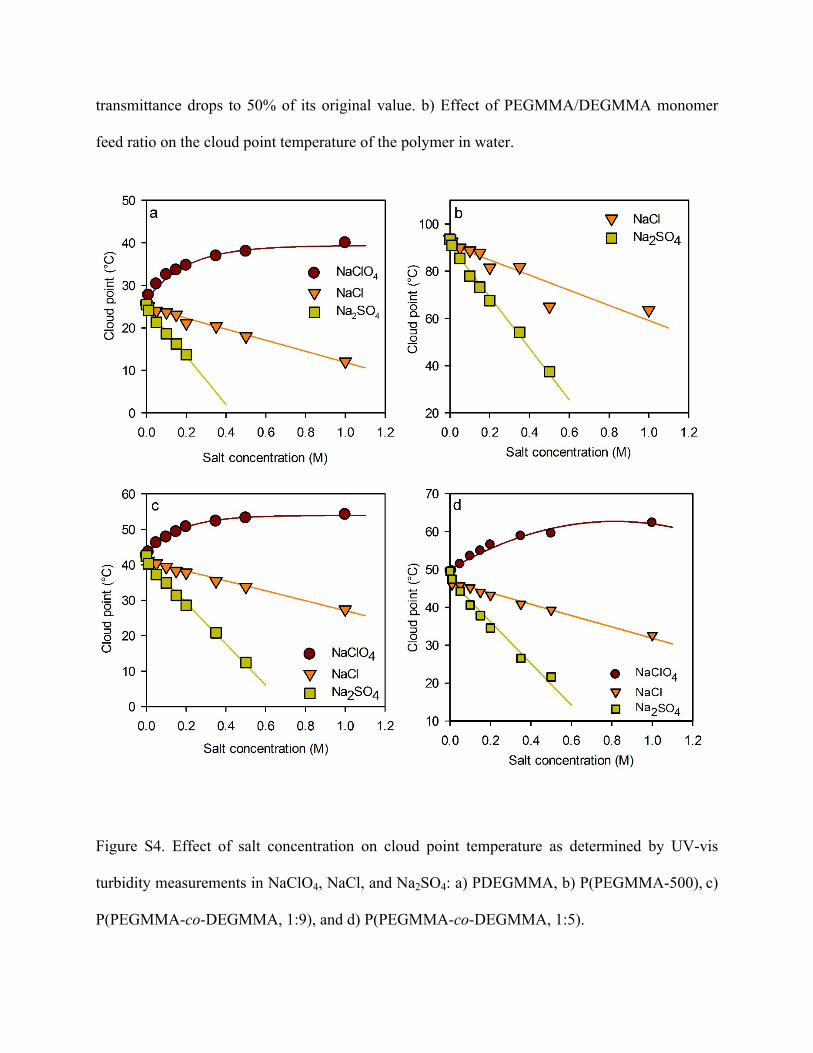
transmittance drops to 50% of its original value. b) Effect of PEGMMA/DEGMMA monomer
feed ratio on the cloud point temperature of the polymer in water.
Figure S4. Effect of salt concentration on cloud point temperature as determined by UV-vis
turbidity measurements in NaClO4, NaCl, and Na2SO4: a) PDEGMMA, b) P(PEGMMA-500), c)
P(PEGMMA-co-DEGMMA, 1:9), and d) P(PEGMMA-co-DEGMMA, 1:5).

FTIR spectra of grafted brushes
FT-IR spectra of films grafted with P(PEGMMA-co-DEGMMA, 1:5) for various times, as well
as the ungrafted control was analyzed and shows the appearance of the characteristic C-H stretch
peaks at 2800–3100 cm-1, corresponding to C-H groups on the PEDOT backbone and ethylene
glycol units of the grafted brushes, and the growth of the ester C=O stretch at around 1700 cm-1
verify successful grafting (Figure S5b). Growth of the brushes is tracked by calculating the area
under the C-H peak at 2800–3100 cm-1, as shown in Figure S5c.
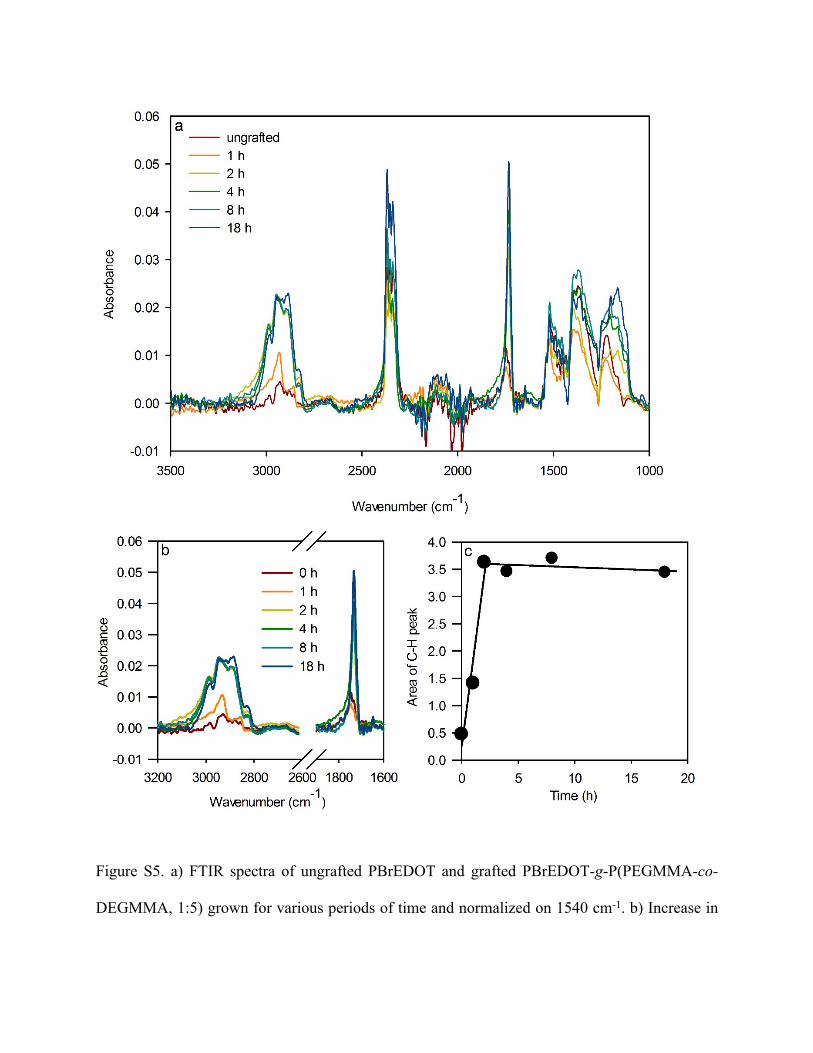
Figure S5. a) FTIR spectra of ungrafted PBrEDOT and grafted PBrEDOT-g-P(PEGMMA-co-
DEGMMA, 1:5) grown for various periods of time and normalized on 1540 cm-1. b) Increase in

C-H stretch (3100-2800 cm-1) and C=O stretch (1800-1650 cm-1) with grafting time. c) Area
under the C-H peak vs grafting time.
Ellipsometry from Si substrates
Brushes were grown directly from Si substrates as controls to aid with modelling, due to the
improved fit (as demonstrated by the lower mean square errors provided in Table 1 in the main
paper). For the brushes grafted from silicon wafers, the brushes all exhibited a gradual collapse
starting between 0.2 – 0.4 M. The higher mean square errors observed for the PBrEDOT-grafted
brushes (MSE ~30 vs. below 5 for the Si-grafted brushes) suggest some level of interpenetration
of the brush within the PEDOT layer, leading to reduced fitting.
Figure S6. Ellipsometry measurements showing degree of swelling of brush compositions
grafted from Si substrates as a function of concentration of NaCl solution.

QCM-D data
Raw data
Figure S7. An example of recorded QCM-D data showing the change in frequency and
dissipation of PBrEDOT-g-P(PEGMMA-co-DEGMMA, 1:9) with increasing Na2SO4
concentration (5th overtone, 22 °C, data not normalized to ungrafted PBrEDOT).
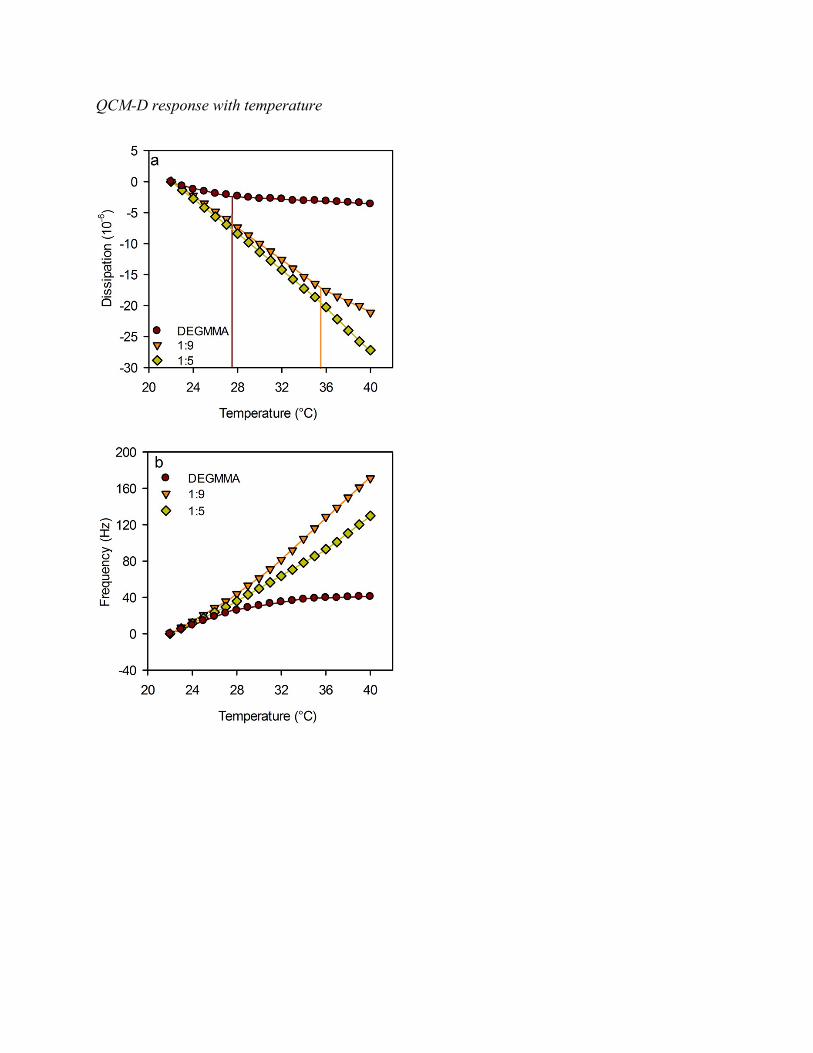
QCM-D response with temperature
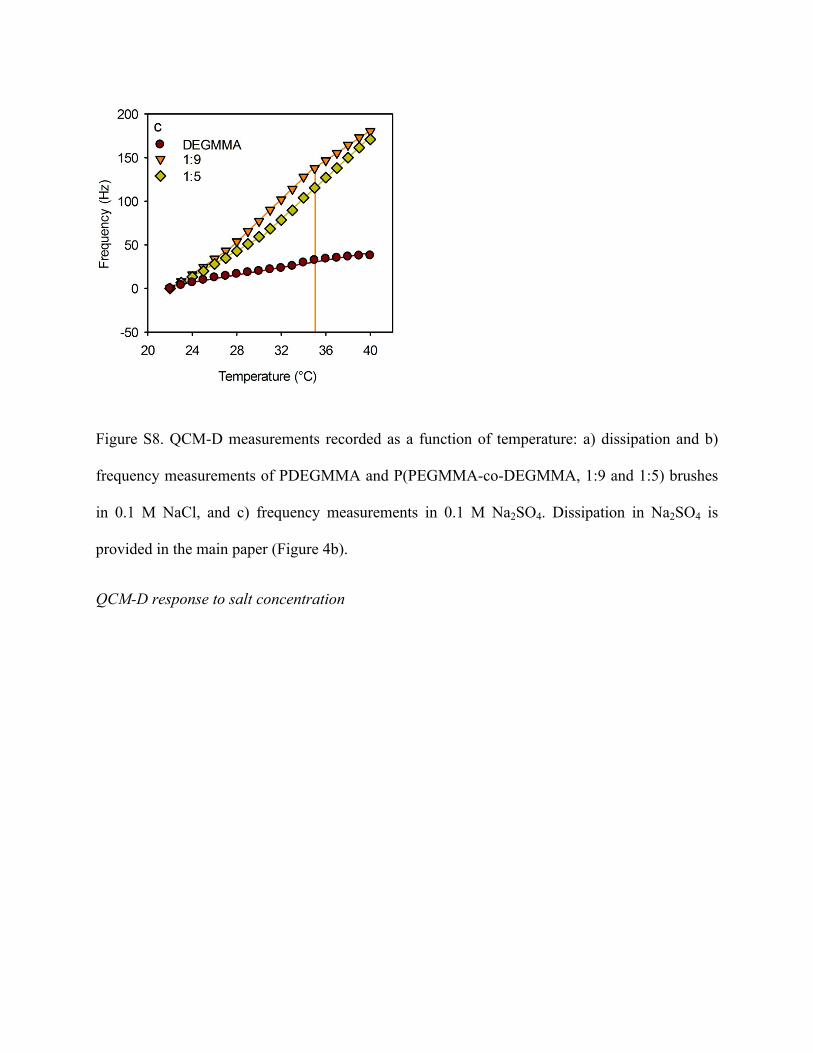
Figure S8. QCM-D measurements recorded as a function of temperature: a) dissipation and b)
frequency measurements of PDEGMMA and P(PEGMMA-co-DEGMMA, 1:9 and 1:5) brushes
in 0.1 M NaCl, and c) frequency measurements in 0.1 M Na2SO4. Dissipation in Na2SO4 is
provided in the main paper (Figure 4b).
QCM-D response to salt concentration

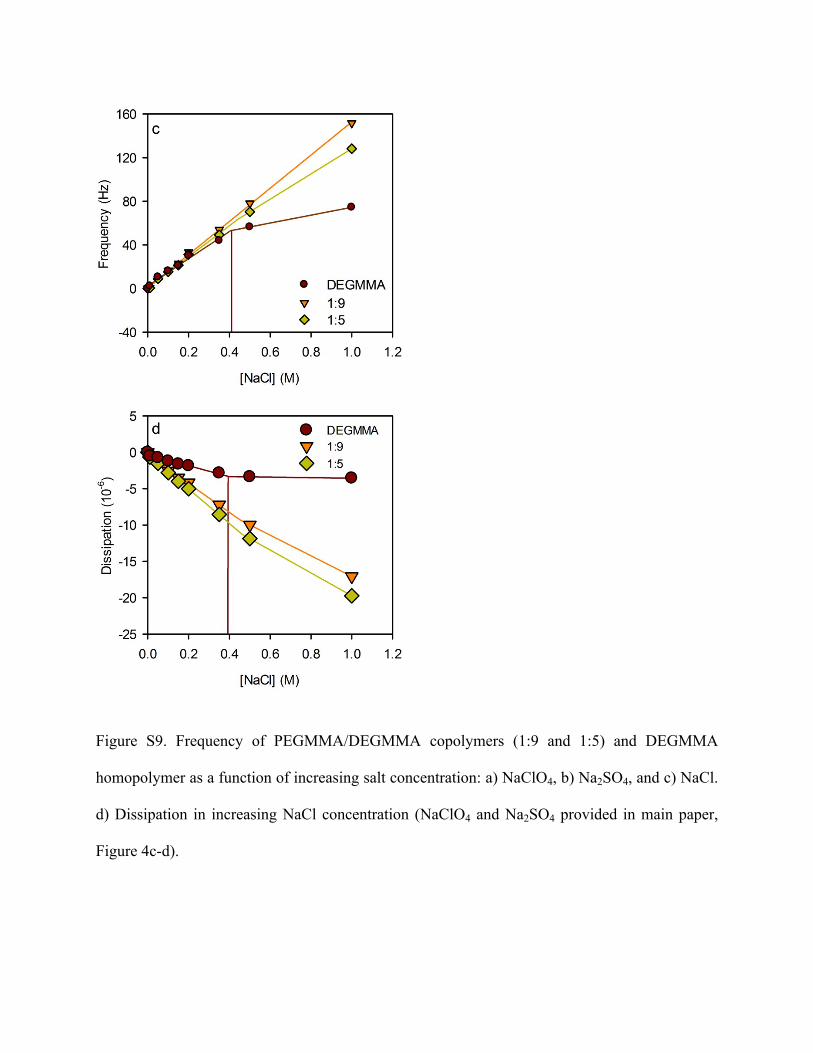
Figure S9. Frequency of PEGMMA/DEGMMA copolymers (1:9 and 1:5) and DEGMMA
homopolymer as a function of increasing salt concentration: a) NaClO4, b) Na2SO4, and c) NaCl.
d) Dissipation in increasing NaCl concentration (NaClO4 and Na2SO4 provided in main paper,
Figure 4c-d).
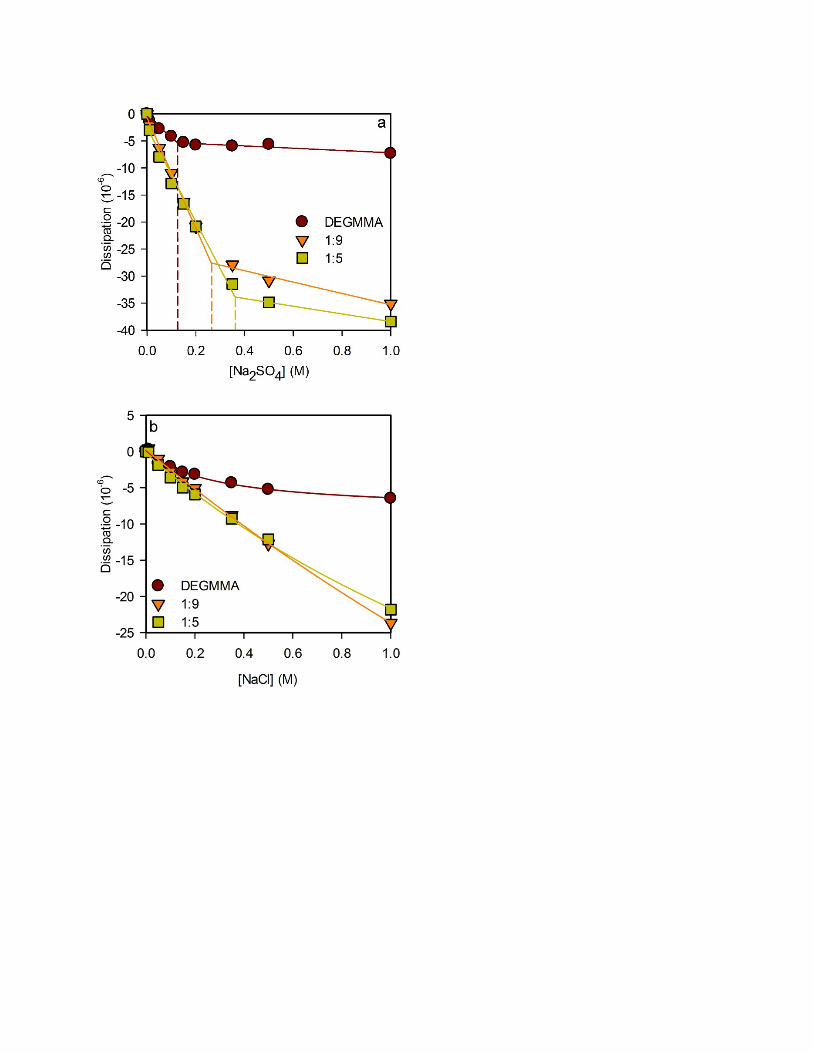
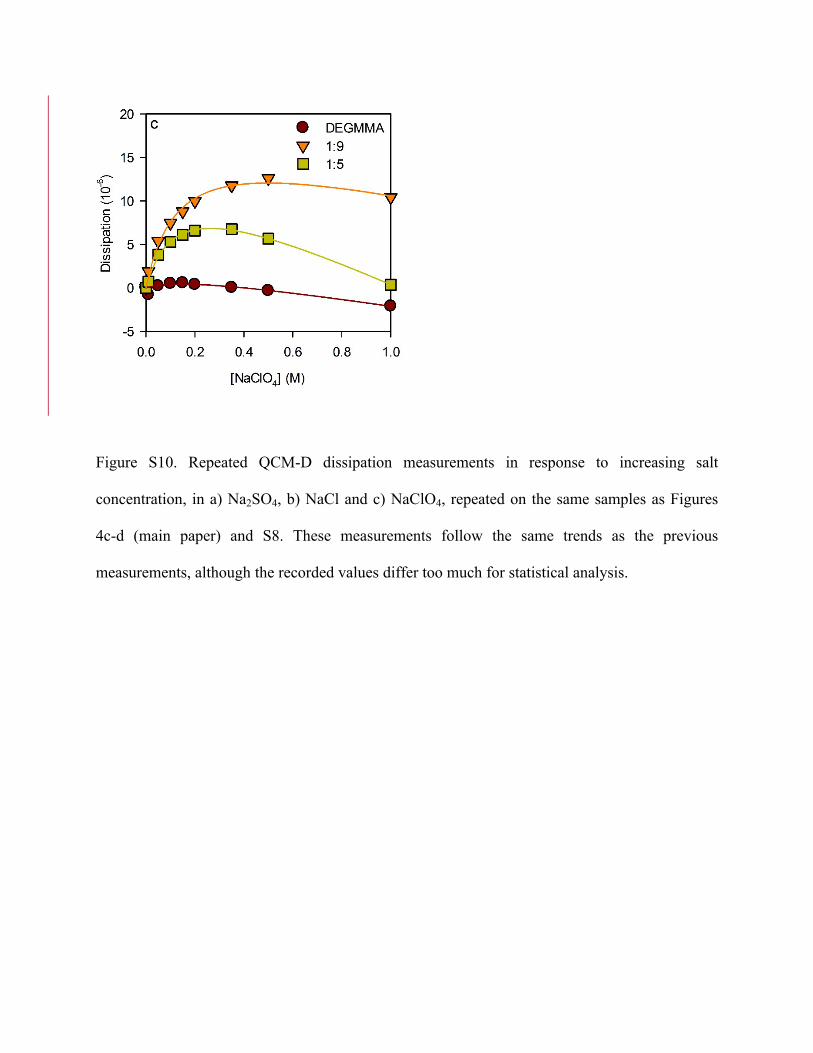
Figure S10. Repeated QCM-D dissipation measurements in response to increasing salt
concentration, in a) Na2SO4, b) NaCl and c) NaClO4, repeated on the same samples as Figures
4c-d (main paper) and S8. These measurements follow the same trends as the previous
measurements, although the recorded values differ too much for statistical analysis.

Cyclic voltammetry characterization
Figure S11. Cyclic voltammograms of ungrafted PBrEDOT and grafted PBrEDOT-g-
P(PEGMMA-co-DEGMMA, 1:5) in 0.1 M salt solutions: a) NaClO4/5 °C; b) NaClO4/50 °C; c)
Na2SO4/5 °C; d) Na2SO4/50 °C.

Electrochemical impedance spectroscopy
Figure S12. Overlaid Nyquist plots of grafted PEGMMA/DEGMMA sample in 0.1 M Na2SO4,
recorded every 1 °C between 5-50 °C. (Inset: The slope of the impedance plot was calculated
from 1 mHz to 1 Hz.)
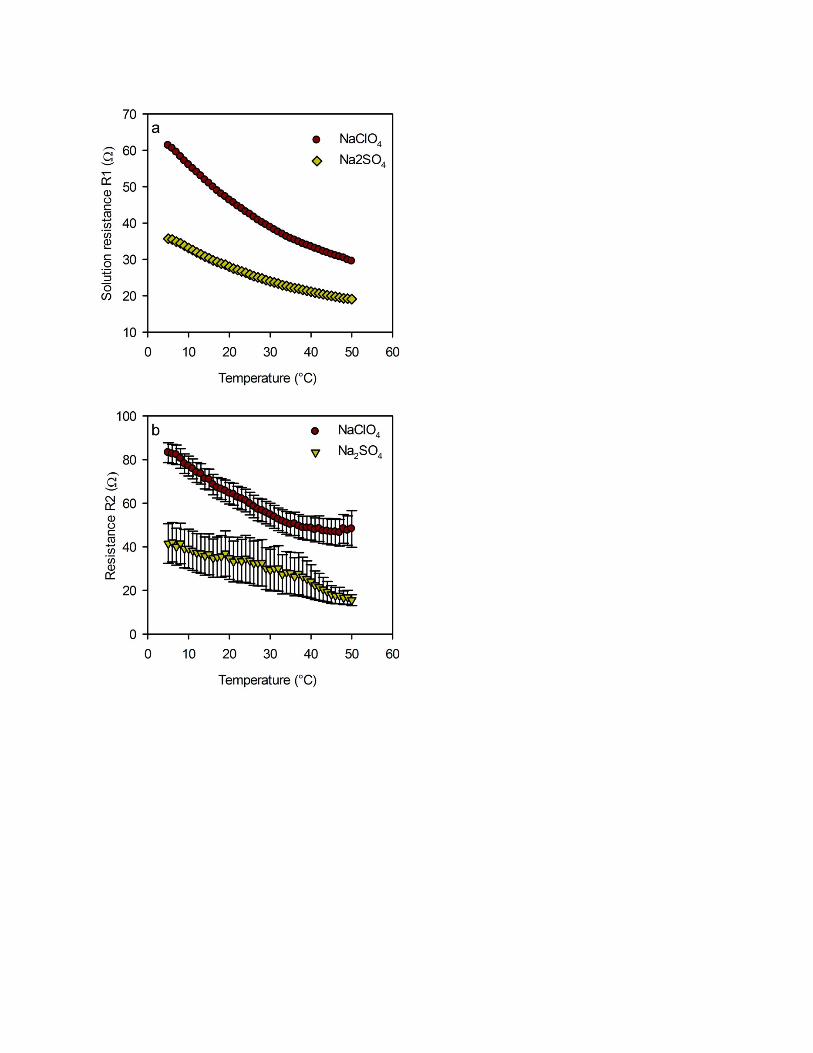
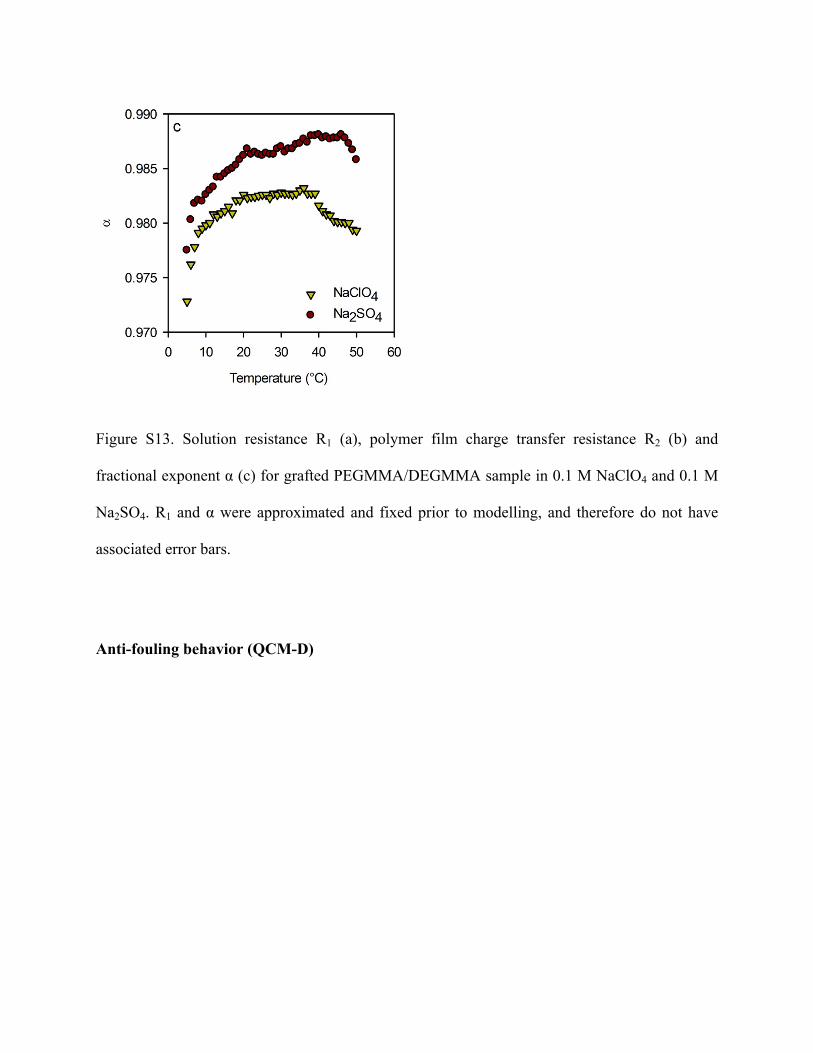
Figure S13. Solution resistance R1 (a), polymer film charge transfer resistance R2 (b) and
fractional exponent α (c) for grafted PEGMMA/DEGMMA sample in 0.1 M NaClO4 and 0.1 M
Na2SO4. R1 and α were approximated and fixed prior to modelling, and therefore do not have
associated error bars.
Anti-fouling behavior (QCM-D)

Figure S14. Dissipation response of ungrafted PBrEDOT, PBrEDOT-g-P(DEGMMA) and
PBrEDOT-g-P(PEGMMA-co-DEGMMA, 1:9) corresponding to the frequency response shown
in Figure 8, recorded in in serum-free media and 20% serum. All three samples showed an
increase in dissipation on addition of serum, due to the bulk shift caused by the solution.
1. Baba, A.; Lübben, J.; Tamada, K.; Knoll, W., Optical Properties of Ultrathin Poly(3,4-ethylenedioxythiophene) Films at Several Doping Levels Studied by In Situ Electrochemical Surface Plasmon Resonance Spectroscopy. Langmuir 2003, 19 (21), 9058-9064.2. Jorcin, J.-B.; Orazem, M. E.; Pébère, N.; Tribollet, B., CPE analysis by local electrochemical impedance spectroscopy. Electrochim. Acta 2006, 51 (8–9), 1473-1479.3. Kim, C.-H.; Pyun, S.-I.; Kim, J.-H., An investigation of the capacitance dispersion on the fractal carbon electrode with edge and basal orientations. Electrochim. Acta 2003, 48 (23), 3455-3463.4. Chen, Y.; Hong, T.; Gopal, M.; Jepson, W. P., EIS studies of a corrosion inhibitor behavior under multiphase flow conditions. Corros. Sci. 2000, 42 (6), 979-990.
Related Documents