Review of the Final Environmental Impact Statement and Draft Reevaluation of Final Environmental Impact Statement for the Mid-Currituck Bridge Currituck County, NC Prepared by: Walter Kulash Transportation Planning Consultant P.O. Box 252, Little Switzerland, NC 29748 [email protected] Prepared for: Southern Environmental Law Center (SELC) on behalf of No Mid-Currituck Bridge and the North Carolina Wildlife Federation December 14, 2016

Welcome message from author
This document is posted to help you gain knowledge. Please leave a comment to let me know what you think about it! Share it to your friends and learn new things together.
Transcript

Review of the
Final Environmental Impact Statement and
Draft Reevaluation of Final Environmental
Impact Statement for the
Mid-Currituck Bridge
Currituck County, NC
Prepared by:
Walter Kulash Transportation Planning Consultant
P.O. Box 252, Little Switzerland, NC 29748
Prepared for:
Southern Environmental Law Center (SELC)
on behalf of
No Mid-Currituck Bridge and the North Carolina Wildlife
Federation
December 14, 2016

FEIS and Draft Reevaluation Review, Mid-Currituck Bridge December 14, 2016 Page 1
INTRODUCTION
This report, based on a review of the 2012 Final Environmental Impact Statement, Mid-Currituck
Bridge (hereinafter “FEIS”), various supporting documents, and the Mid-Currituck Bridge Study,
Draft Reevaluation of Final Environmental Impact Statement, September 2016 (hereinafter “Draft
Reevaluation”) addresses:
A. Issues with traffic projection and traffic level of service as reported in the FEIS.
B. Traffic issues and conclusions in the Draft Reevaluation
C. Conceptual plan for a “non-bridge” alternative, “Improved Modified ER2,” a refinement of
the FEIS alternative ER2, meeting the Purpose and Need of the Mid-Currituck Bridge project
but at far lower cost and environmental footprint than any of the alternatives considered in the
FEIS or its Draft Reevaluation.
Documents referred to in this Report:
2012 Final Environmental Impact Statement, Mid-Currituck Bridge, hereinafter FEIS
Mid-Currituck Bridge Study, Draft Reevaluation of Final Environmental Impact Statement,
September 2016, hereinafter Draft Reevaluation
2010 Highway Capacity Manual, hereinafter HCM
Mid-Currituck Bridge Study, Statement of Purpose and Need, October, 2008, hereinafter
P&N Statement
Mid-Currituck Bridge, 2035 Traffic Forecast Report, April, 2008, hereinafter Traffic
Forecast Report
Mid-Currituck Bridge, Traffic Alternatives Report, April 2008, hereinafter Traffic
Alternatives Report
Mid-Currituck Bridge Final Report Traffic and Revenue Forecast, July 2011, ARUP,
hereinafter Traffic and Revenue Report
SUMMARY AND CONCLUSIONS
A. Issues Related to the FEIS
1. Future traffic projection -- The forecast of future traffic, based on population and visitation
forecasts made over ten years ago, is obsolete. Its use in the FEIS greatly overstates the
“need” for a Mid-Currituck bridge.
2. Traffic capacity method -- The FEIS applies an inappropriate traffic analysis method for
NC 12, significantly understating future capacity and Level of Service and contributing to
an incorrect analysis of non-bridge alternatives.
3. Non-bridge alternatives -- The FEIS does not include a reasonable non-bridge alternative.
The only non-bridge alternative considered, Alternative ER2, is a costly plan appearing
almost “designed to fail.”

FEIS and Draft Reevaluation Review, Mid-Currituck Bridge December 14, 2016 Page 2
4. Toll feasibility -- The FEIS reports future traffic volumes for a Mid-Currituck Bridge that
are far greater than those reported in traffic and revenue projections made independently of
the FEIS to support toll financing.
5. Hurricane evacuation -- The hurricane evacuation “standard” applied in the FEIS has no
basis in meteorology, storm forecasting, peer site comparison, or locally adopted
preparedness planning. This “standard” cannot be attained by any FEIS alternative, with or
without a Mid-Currituck Bridge, and should be dismissed as a factor in assessing
alternatives and in justifying the project.
B. Issues related to the Draft Reevaluation:
1. Non-bridge alternatives -- The Draft Reevaluation establishes but does not acknowledge
the feasibility of non-bridge solutions to meet project purpose and need.
2. Inappropriate traffic analysis methodology for NC 12 -- The Draft Reevaluation applies
the same inappropriate methodology, as used in the FEIS for analysis of capacity on NC 12,
thereby: (a) overstating the “need” for a Mid-Currituck Bridge and (b) understating the
capacity and Level of Service attainable without a Mid-Currituck Bridge or with a non-
bridge alternative.
3. Toll feasibility -- The Draft Reevaluation projection of traffic volume indicates that a Mid-
Currituck Bridge would not even come close to feasibility as a toll-supported project.
C. Conceptual Plan for a Non-Bridge Alternative
An Improved Alternative ER2, yielding most of the benefits of the Preferred Alternative but at a
small fraction of its cost, would:
1. Add measures to preserve capacity and property access along US 158 and delete the
northbound hurricane evacuation lane now included in Alternative ER2.
2. Retain the elements of Alternative ER2 (grade separation of the US 158/NC 12 intersection
and a superstreet segment adjacent to it on US 158) which furnish most of the travel
performance benefit.
3. Right-size the improvements to NC 12, bringing road size into conformity with 2040
traffic projections, eliminating all of the four-lane widening called for in Alternative ER2,
adding limited mileage of three-lane road, and replacing traffic signals with roundabouts.
A. ISSUES RELATED TO THE FEIS
A.1 Future Traffic Projections
The traffic forecast for the year 2035 underlying both the “need” and analysis of alternatives in the
FEIS was based on a land use plan and real estate projections that are over ten years old.1 These
inputs from before the 2007-08 recession have already been greatly overtaken by events and are
obsolete.
1 Traffic Forecast Report, Section 2.1 states that 2035 forecasts were “based on same assumptions used in previous
2025 forecasts,” which in turn were completed in July, 2002 (Traffic Forecast Report, Section 1.0).

FEIS and Draft Reevaluation Review, Mid-Currituck Bridge December 14, 2016 Page 3
Planning for major road projects throughout the state has routinely been updated, not only with
new travel forecasts but also in numerous instances with overhauled sets of alternatives to be
considered. There is no reasonable excuse for a project as costly and intrusive as the Mid-
Currituck Bridge not being held to the same standard of timeliness.
A.2 Traffic Capacity Methodology on NC 12
The traffic capacity analysis procedure (two-lane rural highway) used in the FEIS for NC 12 is
inappropriate for the area through which NC 12 passes. The appropriate methodology (adaptation
of the multi-lane procedure from the HCM) yields significantly different results. The use of an
inappropriate capacity analysis method in the FEIS:
Understates the capacity of NC12.
Invalidates the purpose and need statement, of the FEIS by significantly overstating the
level of congestion on NC 12.
Invalidates the comparison of alternatives, by misrepresenting the ability of NC 12 to
accommodate future growth in traffic without a Mid-Currituck Bridge or with a non-bridge
alternative.
2012 FEIS Understates the Capacity of NC 12 -- The capacity methodology used in the FEIS
understates, by a significant amount, the vehicular capacity of NC 12 in both Dare and Currituck
Counties. This understated capacity in turn contributes to both an inaccurate computation of
“need” for improvement of NC 12, as well as an understatement of the benefits to be gained by
non-bridge alternatives, such as Improved ER2.
The FEIS computes the vehicular capacity of NC 12 using a proprietary software package (HCS
2000) that follows the method for the “Class II Two-Lane Highway” in both the 2000 Highway
Capacity Manual2 and the current 2010 Highway Capacity Manual
3 (hereinafter HCM). In the
Class II Two-Lane Highway method (unlike the “Multi-lane Highways” method used in the FEIS
for US 158), “capacity” is not defined as the maximum possible hourly flow of vehicles, but rather
by the ability of a motorist to freely overtake, or pass, any slower-moving vehicle. Under the Class
II Two-Lane Highway method, maximum “capacity” is reached when the motorist’s “percent time
spent following” (i.e. time spent desiring to, but being unable to pass a slower vehicle) reaches 85
percent. The “collective opinion and judgment of TRB’s” [Transportation Research Board’s]
HCQS Committee of experts”4 determined that this level of inability to pass is unacceptable to the
typical motorist, and is therefore identified as Level of Service (LOS) F, the “worst” LOS possible,
creating the misleading impression that no further increase in traffic flow is possible. Unlike other
methodologies used in the FEIS (for example on US 158) where LOS F is indeed at the boundary
of hourly vehicle flow, LOS F in the Class II Two-Lane Highway method, occurring at levels well
2 HCM 2000 Highway Capacity Manual, Transportation Research Board of the National Academies, 2010, Chapter 12,
Section III, Two Lane Highways. 3 HCM 2010 Highway Capacity Manual, Transportation Research Board of the National Academies, December, 2010,
Volume 2, Chapter 15, page 15-1,Two-Lane Highways. The HCM2010 definition of Class II highway closely follows
that in the HCM200, and the HCM2010 method for computing capacity and Level of Service is of the Class II
highway is identical to that in HCM2000. 4 HCM, v1, page 5-7 describes method for defining LOS for all road types

FEIS and Draft Reevaluation Review, Mid-Currituck Bridge December 14, 2016 Page 4
below (around 60 percent of) the possible maximum vehicle flow, simply indicates that a
subjectively-determined marker of motorist convenience has been reached.
The HCM identifies the Class II Two-Lane Highway method as appropriate for highways in rural
area.5 The Class II Two-Lane Highway method is intended for highways carrying long-distance
travelers, with a preponderance of “through” trips (i.e., trips with neither origin nor destination
immediately along the subject road). The Class II Two-Lane highway is assumed to be “rural” in
character, with few driveways, even fewer intersecting roads, and no intrusion by pedestrian
crosswalks or bicycle travel. In these rural conditions, drivers expect to maintain consistently high
speed with ability to freely overtake slower vehicles, and with this ability limited only by sight
distance and opposing traffic flow and not by regulatory limitations (speed limits, “no passing”
zones, etc.) due to roadside development.
NC 12 and its traffic in Dare and Currituck counties are anything but rural. The overwhelming
majority of traffic is making short local trips (i.e., with origin, destination, or both along the road),
not long-distance “through” travel. Drivers, most of them non-resident visitors, are far more
focused on identifying their destinations than on covering long distances without hindrance. The
design features of the NC 12 roadway and its adjoining land uses further signal the absence of a
rural high-speed driving environment. The number of driveways, commercial entrances fronting
residential and commercial properties, bicycle sidepaths, and pedestrian crosswalks all signal to
the driver that NC 12 is more urban than rural.
Traffic engineers regularly apply the Class II Two-Lane Highway method to inappropriate
locations (such as NC 12) because proprietary software packages for applying HCM methods do
not yet offer an appropriate method for two lane roads in low-speed town or developed
environments. Until such methods are offered by proprietary software products, the correct
procedure is to adapt, to two-lane roads in developed areas, a two-lane version of the “multilane”
(four- or more lane) method given in the HCM. This approach establishes: (1) a capacity based on
vehicle flow, rather on the convenience of passing at will and (2) LOS based on consumption of
the road’s vehicular capacity, rather than on “percent of time spent following.”
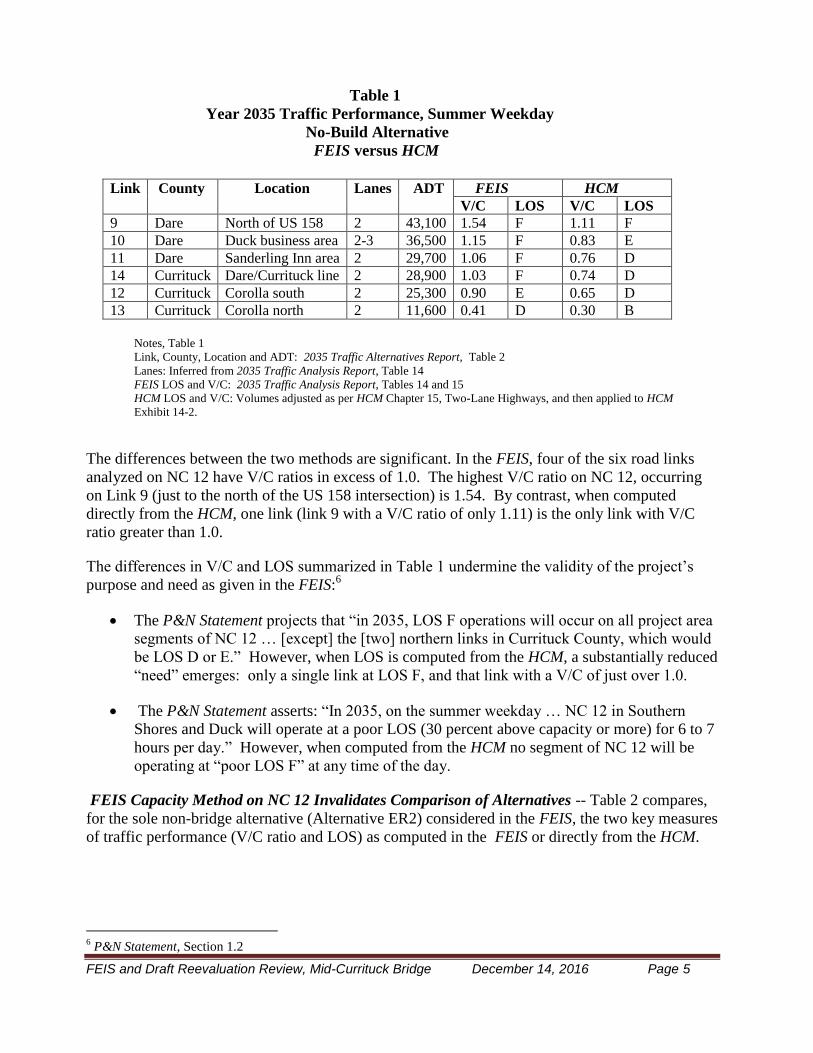
Understated Capacity of NC 12 Invalidates Purpose and Need Statement -- Table 1, below,
compares the two key measures of traffic performance (volume-to-capacity (“V/C”) ratio and LOS)
as computed in the FEIS and directly from the HCM, for the year 2035 for the No-Build
alternative.
5 HCM, v2, page 15-2
FEIS and Draft Reevaluation Review, Mid-Currituck Bridge December 14, 2016 Page 5
Table 1
Year 2035 Traffic Performance, Summer Weekday
No-Build Alternative
FEIS versus HCM
Link County Location Lanes ADT FEIS HCM
V/C LOS V/C LOS
9 Dare North of US 158 2 43,100 1.54 F 1.11 F
10 Dare Duck business area 2-3 36,500 1.15 F 0.83 E
11 Dare Sanderling Inn area 2 29,700 1.06 F 0.76 D
14 Currituck Dare/Currituck line 2 28,900 1.03 F 0.74 D
12 Currituck Corolla south 2 25,300 0.90 E 0.65 D
13 Currituck Corolla north 2 11,600 0.41 D 0.30 B
Notes, Table 1
Link, County, Location and ADT: 2035 Traffic Alternatives Report, Table 2
Lanes: Inferred from 2035 Traffic Analysis Report, Table 14
FEIS LOS and V/C: 2035 Traffic Analysis Report, Tables 14 and 15
HCM LOS and V/C: Volumes adjusted as per HCM Chapter 15, Two-Lane Highways, and then applied to HCM
Exhibit 14-2.
The differences between the two methods are significant. In the FEIS, four of the six road links
analyzed on NC 12 have V/C ratios in excess of 1.0. The highest V/C ratio on NC 12, occurring
on Link 9 (just to the north of the US 158 intersection) is 1.54. By contrast, when computed
directly from the HCM, one link (link 9 with a V/C ratio of only 1.11) is the only link with V/C
ratio greater than 1.0.
The differences in V/C and LOS summarized in Table 1 undermine the validity of the project’s
purpose and need as given in the FEIS:6
The P&N Statement projects that “in 2035, LOS F operations will occur on all project area
segments of NC 12 … [except] the [two] northern links in Currituck County, which would
be LOS D or E.” However, when LOS is computed from the HCM, a substantially reduced
“need” emerges: only a single link at LOS F, and that link with a V/C of just over 1.0.
The P&N Statement asserts: “In 2035, on the summer weekday … NC 12 in Southern
Shores and Duck will operate at a poor LOS (30 percent above capacity or more) for 6 to 7
hours per day.” However, when computed from the HCM no segment of NC 12 will be
operating at “poor LOS F” at any time of the day.
FEIS Capacity Method on NC 12 Invalidates Comparison of Alternatives -- Table 2 compares,
for the sole non-bridge alternative (Alternative ER2) considered in the FEIS, the two key measures
of traffic performance (V/C ratio and LOS) as computed in the FEIS or directly from the HCM.
6 P&N Statement, Section 1.2

FEIS and Draft Reevaluation Review, Mid-Currituck Bridge December 14, 2016 Page 6
Table 2
Year 2035 Traffic Performance, Summer Weekday
Alternative ER2
FEIS versus HCM
Link County Location Lanes ADT FEIS HCM
V/C LOS V/C LOS
9 Dare North of US 158 3 43,100 1.36 F 0.98 E
10 Dare Duck business area 3 36,500 1.15 F 0.83 E
11 Dare Sanderling Inn area 3 29,700 0.94 E 0.67 D
14 Currituck Dare/Currituck line 4 28,900 0.44 B 0.44 B
12 Currituck Corolla south 4 25,300 0.38 B 0.38 B
13 Currituck Corolla north 2 11,600 0.41 D 0.30 B
Notes:
Link, County, Location and ADT: 2035 Traffic Alternatives Report, Table 2
Lanes: Traffic Alternatives Report, Table 14
FEIS LOS and V/C: Traffic Alternatives Report, Tables 14 and 15
HCM LOS and V/C: HCM
The two methods of computing capacity yield significantly different levels of traffic performance
for Alternative ER2.
The FEIS reports that the two busiest Dare County links (Links 9 and 10) even after
widening to three lanes throughout would still operate at LOS F, with V/C ratios of 1.36
and 1.15, respectively. Although the FEIS does not offer operable guidelines defining the
project’s purpose to “substantially improve traffic flow” on NC 12, the failure to eliminate
LOS F conditions (one of them a “poor” LOS F) could reasonably be interpreted as failure
to “substantially improve.”
On the other hand, when computed from the HCM, none of the links on NC 12 operate at
LOS F. The LOS E which occurs on the two most congested links is considered
acceptable for peak hour conditions in developed areas such as the NC 12 corridor.
It should be noted that the thirteen percent increment of capacity gained by Alternative ER2 on its
most congested links (due to addition of a TWLTL on links 9 and 11) is the same when computing
V/C and LOS by both the FEIS and HCM methods as summarized in Table 2. The fault in
computation of traffic performance for Alternative ER2 in the FEIS is therefore not in the
increment of capacity gained (from the TWLTL) by the Alternative ER2, but in the computation
of the underlying capacity of the two-lane road to which that increment is added. In the FEIS
method, adding the increment thirteen percent to the incorrectly computed capacity of a two-lane
road yields a “poor” LOS F on Link 9 and LOS F on Link 10. When the increment of thirteen
percent is added to the correctly computed capacity of a two-lane road, neither link operates at
LOS F.

FEIS and Draft Reevaluation Review, Mid-Currituck Bridge December 14, 2016 Page 7
A.3 Lack of Reasonable Non-Bridge Alternative
Characteristic features of any well-structured low-build alternative are:
A goal of significantly improving traffic performance, rather than rigorously meeting a
pre-determined performance target (e.g., a specified Level of Service).
Review of and possible incorporation of standing proposals and STIP projects.
Attention to affordability, with a focus on gaining a substantial portion (but not all) of the
maximum possible improvement at a small fraction of the cost of that maximum
improvement. In short, getting the most bang for the buck.
Emphasis on fixing obvious “bottlenecks” widely perceived as troublesome, rather than
gaining system-wide improvements.
Alternative ER2 follows the above guideline of addressing a major “bottleneck” (at the US
158/NC 12 intersection) by incorporating STIP project R-4457. On the other hand, other major
components of alternative ER2 violate guidelines for a well-structured low-build option: (1) the
costly widening of NC 12 to four lanes in Currituck County is driven by the need to meet a Level
of Service target, rather than by making needed improvements at a reasonable cost and (2) the
hurricane evacuation lane on US 158 northbound is a costly item that has little value for
evacuation traffic, has no value for other traffic, and has not been weighed against other measures
(e.g., change in evacuation notification procedures) that improve evacuation.
Because of the high cost of these two items (widening of NC 12 and hurricane evacuation lane on
US 158) combined with their meager benefits, Alternative ER2 is decidedly not cost-effective. Its
cost of over $400 million (which includes $150-200 million in right of way, astonishing for
something called an “Existing Road” alternative) approaches that of the $500–600 million
Preferred Alternative.
Alternative ER2 could have been made into a far more affordable alternative by modifying or
eliminating those components requiring large right-of-way acquisition and delivering little benefit
in return. However, the FEIS reports no effort to take the obvious steps to refine Alternative ER2
into a more affordable alternative. Instead, the FEIS 7 dismisses the possibility of funding the
bloated Alternative ER2, stating “it is not known when the project [Alternative ER2] would be
implemented because there is no State funding …” for improvements other than a Mid-Currituck
Bridge in the study area STIP.
An Improved Alternative E2 observing the above guidelines for a reasonable low-build alternative
is described in Section C of this report.
7 FEIS Section 2.4

FEIS and Draft Reevaluation Review, Mid-Currituck Bridge December 14, 2016 Page 8
A.4 Toll Feasibility
The FEIS projects a far greater use of a tolled Mid-Currituck Bridge than does the rigorous
forecast prepared by the Traffic and Revenue Report. The FEIS projection of year 2035 usage of a
Mid-Currituck Bridge of 12,6008 AADT is almost double the 7,485 AADT
9 projected by the
Traffic and Revenue Report. This discrepancy does not warrant further analysis at this time, as the
reduction in travel demand (section B.3 of this report) reported in the Draft Reevaluation dwarfs
the issue of differences between the FEIS and Traffic and Revenue Report projections of Mid-
Currituck Bridge traffic. However, should a revised traffic and revenue study, presumably based
on updated population data similar to that in the Draft Reevaluation, again show a large disparity
in bridge traffic forecasts compared to Draft Reevaluation forecasts, then careful scrutiny of the
disparity would be worthwhile.
While the projections in the Traffic and Revenue Report exhibit the caution and conservatism
typical of toll feasibility studies, the “key assumption …that electronic keys will be available at all
rental properties”10
rented by toll bridge users is uncharacteristically optimistic.
Electronic entry keys are temporary codes for access to preprogrammed lock devices at the rental
unit, activating at check-in and expiring at check-out. Emailed to renters in advance of their visit
to the Outer Banks, electronic keys eliminate the need for renters to visit rental agency offices to
receive and return keys. Freed from the need to visit a rental agency office, visitors would be far
more likely to use the Mid-Currituck Bridge for non-stop travel to their rental unit, and less likely
to use US 158 across the Wright Memorial Bridge to travel to a rental office.
Nonetheless, it is hard to believe that electronic keys will be available and used at 100 percent of
rental units. Not only would the cooperation of the entire rental community—owners, agents and
renters—be required, but also a substantial number of visitors are destined for lodgings (such as
those rented individually by owners, airbnb rentals, etc.) not likely to participate in an electronic
key system.
A.5 Hurricane Evacuation
The FEIS11
identifies the need to “reduce substantially hurricane evacuation times....” However,
attainment of this need cannot be measured because the FEIS fails to provide either (1) an
operable standard for hurricane evacuation time or (2) any consideration of means other than road
widening to improve hurricane evacuation time.
The FEIS Purpose and Need Does Not State an Operable Standard -- The 18-hour “standard”
for hurricane evacuation time, as adopted by the North Carolina State Legislature in 200512
cannot
be meaningfully applied to individually proposed transportation improvements, such as the
8 Traffic Alternatives Report, Table 3.
9 Traffic and Revenue Report, (Table 25) year 2030 AADT of 6,780 expanded to year 2035 AADT of 7,485 by
applying an annual growth rate of 2.0 percent compounded (Table 13). 10
Id., Section 6.1. 11
FEIS Section 1.2. 12
North Carolina General Statutes § 136-102.7.

FEIS and Draft Reevaluation Review, Mid-Currituck Bridge December 14, 2016 Page 9
proposed Mid-Currituck Bridge or any other road improvement. Evacuation times are a system-
wide characteristic, reflecting aggregated travel times over a series of individual road links, for the
entire evacuation area. Improving a single link within the evacuation area could no doubt improve
(reduce) the overall evacuation time. However, it is inconceivable that any single improvement
could bring the overall evacuation time into compliance with the 18-hour standard. Indeed, even
an improvement as massive as the half-billion dollar Mid-Currituck Bridge is only projected to
reduce year 2035 evacuation clearance time to around 27 hours, still greater that the 18-hour
standard and no better than the year 2010 clearance time, also 27 hours.13
No Criteria for Comparing Changes in Evacuation Times -- All alternatives considered in the
FEIS improve (reduce) total evacuation times. However, there are no criteria that assess the costs
and benefits associated with each of the evacuation outcomes. For example, there is no way to
value the half-billion dollar cost of the Bridge alternatives against the stated reduction in
evacuation times. Is the cost of a longer evacuation time simply more delay time on the roads in a
one-time event for most travelers? Is the additional travel time translatable into injury and
fatalities? For transportation planning throughout the state, safety consequences are routinely
computed and entered into the benefit-cost equation of an alternative. Why isn’t such comparison
made of evacuation safety? If a comparison can’t be made, then why are we issuing evacuation
time standards?
“One Size Fits All” Evacuation Standard -- The “one-size fits all” evacuation “standard” ignores
realities of coastal seasonal populations. The 18-hour state-legislated “standard” for evacuation
times does not account for staged evacuation, as is typical in advanced planning for coastal areas
in the southeast U.S. An example of a well-developed staging sequence, in Monroe County, FL,14
calls for a 48-hour evacuation time for all non-residents, 36 hours for mobile homes and
institutions, and 30 hours for resident population.
Unsupportable Rationale for Selected Evacuation Time Target -- The three arguments for
“preferred clearance time” of 18 hours15
are all based on unsupported assumptions:
1. Requiring that evacuation be “conducted mostly during daylight hours” is not only
arbitrary and unsupported by any emergency management advisories, but also
contradictory, in that (1) there is not likely to be 18 hours of daylight in hurricane season
with a storm looming and (2) waiting for daylight to begin an evacuation would almost
certainly contribute to “violating” the 18-hour “standard”.
2. The goal of “Limiting the amount of personnel that North Carolina law enforcement would
have to commit to one shift for an evacuation” presumably is intended to accommodate the
availability of locally-stationed NCSHP officers, and possibly also to minimize the cost of
an evacuation. Neither of these concerns is justified or quantified. Under a governor-
mandated state of emergency, multiple shifts of NCSHP officers could be made available,
particularly for the small number of relevant postings. Furthermore, at no point in any
available documentation is the cost of additional NCSHP manpower weighed against the
half-billion dollar cost of the Bridge alternatives.
13
Mid-Currituck Bridge Study, Hurricane Evacuation Alternatives Analysis, June 2010, Table 1. 14
Monroe County 2010 Comprehensive Plan, Monroe County, Florida, Policy 216.1.8. 15
P&N statement, Section 1.10.

FEIS and Draft Reevaluation Review, Mid-Currituck Bridge December 14, 2016 Page 10
3. A “ preference” for evacuation within the National Hurricane Center’s warning period as
opposed to… hurricane watch period” in no way supports the 18-hour evacuation
“standard”. Warnings are typically issued 36 hours ahead of the expected arrival of
tropical storm force winds (39 miles per hour) and, depending on the speed of the storm,
48 – 60 hours ahead of the arrival of hurricane-force winds. A 36-hour evacuation time is
therefore possible entirely within the hurricane warning period.
B. DRAFT REEVALAUTION FLAWS
B.1 The Draft Reevaluation Reports but Fails to Identify the Change in Project Need
The first and presumably primary conclusion of the Draft Reevaluation that “the transportation
needs remain”16
is contradicted by data presented in the Draft Reevaluation.
The year 2040 traffic forecasts for the individual links reported in the Draft Reevaluation 17
range
from around 60 percent to 80 percent of the year 2035 forecasts as reported for the same links in
the FEIS. The corresponding decrease in traffic from the 2035 to the 2040 forecast, therefore,
ranges from around 20 percent to 40 percent.
Further, because traffic delay grows disproportionably faster than increases in traffic volume, the
reductions (Draft Reevaluation versus FEIS) of 20–40 percent in traffic volumes translate to a far
greater reduction (53 to 100 percent) in miles of road operating at unacceptable levels of service
(Table 3 below).
Table 3
Miles of Road with Demand Exceeding Capacity
FEIS Year 2035 No-Build Versus Draft Reevaluation Year 2040 No-Build
No-Build
Alternative
FEIS
Year 2035
No-Build
Alternative
Draft Reevaluation
Year 2040
Percent
Reduction
In Miles
Demand above capacity (LOS F)
Summer Weekdays 14.7 miles 2.3 miles 84 percent
Summer weekend 43.5 miles 8.3 miles 81 percent
Demand greater than 30 percent above capacity (LOS F)
Summer weekdays 5.7 miles 0.0 miles 100 percent
Summer weekends 7.9 miles 3.7 miles 53 percent
Source: Draft Reevaluation, Table 4
16
Draft Reevaluation, Section 6.0. 17
Id, Tables 1 and 2.

FEIS and Draft Reevaluation Review, Mid-Currituck Bridge December 14, 2016 Page 11
The FEIS repeatedly gauges attainment of its primary project need18
“to substantially improve
traffic flow” on US 158 and NC 12 to reductions in mileage with demand exceeding capacity on
these two roads.19
The Draft Reevaluation, in claiming that “the transportation needs remain”
implies that the needs as identified in FEIS still remain. However, the Draft Reevaluation’s own
data (Table 3 above) show that the needs as identified in the FEIS are far from “remaining.” More
accurately, in light of the Draft Reevaluation year 2040 traffic forecast, the needs as identified in
the FEIS have largely disappeared.
The absurdity of the Draft Reevaluation claiming that “the transportation needs remain” is further
illustrated (Table 4 below) by comparing the LOS performance aggregated for summer weekdays
and weekends, for the year 2040 No-Build and ER2 alternatives with that of the year 2035
Preferred Alternative.
Table 4
Miles of Road with Demand Exceeding Capacity
FEIS Preferred Alternative versus Draft Reevaluation No-Build and ER2 Alternatives
(1)
Preferred
Alternative
FEIS
Year 2035
(2)
No-Build
Alternative
Draft
Reevaluation
Year 2040
(3)
Alternative
ER2
Draft
Reevaluation
Year 2040
Miles of road with demand above capacity (LOS F)
Weighted average of summer weekdays and weekends
7.4 4.0 2.0
Miles of road with demand 30 percent or more above
capacity, weighted average of summer weekdays and
weekends
1.1 1.1 0.0
Source: Draft Reevaluation, Table 4
With the reduction in traffic demand forecast in the Draft Reevaluation for the year 2040, both the
No-Build and the Alternative ER2 outperform the Preferred Alternative as reported and found to
meet project need in the FEIS. If the Preferred Alternative was found to meet project need in the
FEIS, than it follows that both No-Build and the Alternative ER2 meet Purpose and Need in light
of the year 2040 travel demand data in the Draft Reevaluation. This further implies that either (1)
the need for the project has evaporated, since even a No-Build is now better than the FEIS
Preferred Alternative that was found to meet project need or (2) Alternative ER2 should be refined
and pursued as providing significant improvement (column 3 versus columns 1 and 2 in Table 4
above) at a far lower cost than the Preferred Alternative.
18
P&N Statement, Section 1.3. 19
TAR, Tables 12, 13, 14 and 15.

FEIS and Draft Reevaluation Review, Mid-Currituck Bridge December 14, 2016 Page 12
To ignore, as does the Draft Reevaluation, that the year 2040 No-Build and Alternative ER2 meet
project need is to imply that project need is not a fixed goal, but is somehow a moving target, to be
adjusted as traffic demand diminishes. The lack of an operable goal for traffic improvement in the
FEIS is a major shortcoming in that document, and leads to absurdities in interpreting the updated
information in the Draft Reevaluation.
B.2 Inappropriate Traffic Analysis Methodology
The traffic analysis in the Draft Reevalaution is based on traffic demands that are significantly
lower than that forecast in the FEIS. The traffic analysis procedure for the Draft Reevaluation for
NC 12, however, appears to be the same (Class II Two-Lane Highway) as in the FEIS, and
therefore inappropriate for NC 12.
Combining these factors of (1) a decrease in projected traffic volume and (2) continued use of an
inappropriate capacity analysis method results in an even greater invalidation of FEIS findings
than those discussed in Section A.2 above.
Draft Reevaluation Data Further Invalidates Original Purpose and Need Statement – Table 5
below compares, for the No-Build Alternative, two key measures of traffic performance (V/C
ratio and LOS) as computed in two differing ways: (1) from the FEIS, using year 2035 traffic data
and the HCS Class II Highways method and (2) applying HCM methods to the year 2040 data in
the Draft Reevaluation.
Table 5
Comparison of Traffic Performance
FEIS versus Draft Reevaluation/HCM
No-Build Alternative, Summer Weekday
Link County Location Lanes FEIS
Year 2035
Draft Reevaluation/HCM
Year 2040
ADT V/C LOS ADT V/C LOS
9 Dare North of US 158
10 Dare Duck business area 2-3 36,500 1.15 F 30,300 .66 D
11 Dare Sanderling Inn area
14 Currituck Dare/Currituck line
12 Currituck Corolla south 2 28,900 0.90 E 19,900 .43 C
13 Currituck Corolla north
Notes:
Link, County, Location and ADT: Link definitions from Traffic Alternatives Report, Table 2. ADT
from Draft Reevaluation, Table 2. Data for Links 9, 11, 13 and 14 not shown in the Draft Reevaluation
Lanes: Inferred from Traffic Alternatives Report, Table 14
FEIS V/C and LOS: Traffic Alternatives Report,, Tables 14 and 15
Draft Reevaluation/HCM LOS and V/C: Draft Reevaluation ADT and HCM methodology
The FEIS projected year 2035 LOS of “F” and “E” for the two links (links 10 and 12 respectively)
reported in the Draft Reevaluation. However, HCM procedures applied to the updated year 2040
traffic demand from the Draft Reevaluation result in projected “D” (moderate congestion) and “C”

FEIS and Draft Reevaluation Review, Mid-Currituck Bridge December 14, 2016 Page 13
(free flowing) for these two links. The conclusion of the Draft Reevaluation20
that “the needs the
project is trying to meet remain needs” is far from accurate.
B.3 Impact of Revised Travel Demand on Toll Bridge Revenue
The year 2040 travel demand projections reported in the Draft Reevaluation result in a major
reduction in previously forecast toll revenue for the Mid-Currituck Bridge.
This reduction (Table 6 below) results from two factors compounded: (1) the reduction in all
traffic (toll as well as non-toll) within the study area and (2) a further reduction in the “capture”
rate (percentage all bridge traffic choosing to use a toll bridge) due to the reduced congestion in
the year 2040 forecast.
Table 6
Impact of Traffic Forecast Reduction on Toll Bridge Revenue
Year 2035 from FEIS versus Year 2040 from Draft Reevaluation
1 Year 2040 toll revenue, pre-Draft Reevaluation $36.8 million
Adjustment for Decrease in Traffic
2 Year 2035 AADT, 2 bridges, from FEIS 50,100 AADT
3 Year 2040 AADT, 2 bridges, from Draft Reevaluation 30,800 AADT
4 Adjustment, Draft Reevaluation traffic as percent of FEIS 61.6 percent
Adjustment for change in capture rate
5 Decrease in capture rate, FEIS to Draft Reevaluation 11.1 percent
6 Adjustment, Draft Reevaluation capture as percent of 2012 FEIS 88.9 percent
8 Total adjustment to Pre-Draft Reevaluation year 2040 toll revenue 54.8 percent
9 Year 40 toll revenue, adjusted for Draft Reevaluation $20.2 million
Notes:
Row 1 Traffic and Revenue Report, Table 28
2 Draft Reevaluation, Table 1
3 Draft Reevaluation, Table 1
4 Row 3 /Row 2
5 Traffic and Revenue Report, Table 26. Capture rate of 0.58 percent change in capture per 1,000 AADT
derived from Table 26, and then applied to 19,200 difference in AADT, year 2035 versus year 2040
(Rows 2 and 3)
6 1.00 – Row 5, stated as percent
8 Row 4 x Row 6
9 Row 1 x Row 8
Toll collection costs (20 percent of toll revenue or $4 million annually)21
and annual bridge
maintenance/rehabilitation reserve costs (around $3.1 million annually)22
would leave annual net
20
Reevaluation, Section 1.6 21
Washington State DOT, Comparative Analysis of Toll Facility Operational Costs, February 22, 2007

FEIS and Draft Reevaluation Review, Mid-Currituck Bridge December 14, 2016 Page 14
revenue of only around $13 million available for debt service in the year 2040. This available net
revenue ($13 million) would service only around $260 million23
in loans, or around one-half of the
$527 million of debt financing for bridges as proposed in the preliminary Plan of Finance
presented in the Draft Reevaluation.24
In early years of the project (during “ramp-up” of toll
revenue) total revenue would be insufficient to cover operations and maintenance cost, and would
therefore leave nothing for debt service.
The updated travel demand forecast from the Draft Reevaluation indicates that the project is far
from viable as a toll-financed project.
4. ELEMENTS OF AN IMPROVED NON-BRIDGE ALTERNATIVE PLAN
Alternative ER2, the only non-bridge alternative addressed in the FEIS and Draft Reevaluation,
meets the three purposes of the Mid-Currituck Bridge project, to: (1) substantially improve traffic
flow (2) reduce travel time and (3) reduce hurricane evacuation time. Further, Alternative ER2,
despite its lack of a Mid-Currituck Bridge, delivers most of the traffic benefits produced by the
Preferred Alternative. For the four most important measures of traffic performance summarized in
the Draft Reevaluation, Alternative ER2 delivers between 61 percent and 100 percent of the
accomplishment attained by the Preferred Alternative (Table 7 below).
Table 7
Comparison of Traffic Performance, Year 2040
Alternative ER2 Versus Preferred Alternative Improvement Due to
Alternative
Alternative ER2
Performance
As Percent of
Preferred
Alternative
Preferred
Alternative
Alternative
ER2
Annual VMT with traffic demand at or
above road capacity (millions of VMT)
7.2 million
VMT
5.2 million
VMT
72 %
AnnualVMT with traffic demand 30 percent
or more above road capacity (millions of VMT)
1.9 million
VMT
1.9 million
VMT
100 %
Miles of road with traffic demand at or
above road capacity (weighted average of summer
weekday and weekend)
3.3 miles 2.0 miles 61 %
Miles of road with traffic demand 30 percent
or more above road capacity (weighted
average, summer weekday and weekend)
1.1 mile 1.1 mile 100 %
Source: Draft Reevaluation, Table 4
22
Based on bridge length of 4.7 miles, deck maintenance cost of $0.20 per square foot and a one-time major
rehabilitation at 25 percent of initial cost. 23
Loan at 4 percent interest, 40 years. 24
Draft Reevaluation, Section 1.3.3.

FEIS and Draft Reevaluation Review, Mid-Currituck Bridge December 14, 2016 Page 15
Objectives of an Improved Alternative ER2
The Improved Alternative ER2 would:
1. Add measures to preserve capacity and property access along US 158, and delete the
northbound hurricane evacuation lane.
2. Retain the elements of Alternative ER2 (grade separation of the US 158/NC 12 intersection
and a superstreet segment adjacent to it on US 158) which furnish most of its the travel
performance benefit.
3. Right-size the improvements to NC 12, bringing road size into conformity with 2040 traffic
projections, eliminating all of the four-lane widening called for in Alternative ER2, adding
limited mileage of three-lane road, and replacing traffic signals with roundabouts.
Individual elements of an Improved Alternative ER 2 are described in the following sections.
US 158 Elements of an Improved Alternative ER2
For US 158 from Barco to the Wright Memorial Bridge, retain (or modify with access
management measures, discussed below) the existing 5-lane undivided cross section, with
continuous Two-Way Left Turn Lane (TWLTL). This cross section has adequate capacity for the
year 2040 summer weekend traffic.
For the 15.5 mile segment between NC 136 near Poplar Branch and the western end of the Wright
Memorial Bridge, conduct a comprehensive access management study. This type of study
identifies road improvements, fitting within the existing right of way or “spot” widening of it, that
preserve the capacity of US 158 for through traffic (i.e., with neither origin nor destination along
US 158) while at the same time preserving or even improving the access to properties fronting on
US 158 as traffic volumes rise. Improvement measures included in a comprehensive access
management study include location of additional traffic signals, coordination of traffic signals,
development of seasonal traffic signal timing algorithms, new or extended local streets and roads
providing access to streets served by a traffic signal on US 158 and designated U-turn locations.
The study will also explore the feasibility of converting some segments to a superstreet, which
can improve the exit movement from roadside properties during heavy traffic periods.
The basic element of the superstreet concept—some restriction of mobility at cross streets
compensated by convenient U-turn sites nearby—can also be applied at selected locations not part
of a continuous superstreet. These measures include the Median U-Turn and the Restricted
Cross Street U-Turn.
From the eastern end of the Wright Memorial Bridge to the entrance of the Home Depot, a
distance of 1.3 miles, reconstruct US 158 into a four-lane superstreet. Except for the number of
lanes (four instead of six-eight) the concept and operation of this superstreet is identical to that
proposed for Alternative ER2 in the FEIS. A superstreet at this location could be expected to
improve access for the fronting properties, while reducing delay for through traffic.

FEIS and Draft Reevaluation Review, Mid-Currituck Bridge December 14, 2016 Page 16
At the US 158/NC 12 junction, proceed with project R-4457 for the grade separation of the
existing intersection. In light of the reduced year 2040 traffic volumes as reported in the Draft
Reevaluation, examine two options beyond the full interchange being considered in project R-
4457: (1) a simple flyover, permitting conflict-free movement between US 158 eastbound and NC
12 northbound and also the reverse movement, from NC 12 southbound to US 158 westbound and
(2) a Continuous Flow Intersection, (also called a Displaced Left Turn Intersection) which is
an at-grade signalized design that can greatly outperform a conventional intersection.
NC 12 Elements of an Improved ER2 Alternative
Establish maximum road configuration of three lanes, undivided, with a continuous Two-Way
Left-Turn Lane. Expand existing two-lane road segments to three-lane TWLTL on the basis of
traffic volume (existing and projected) and density of driveway and intersecting street spacing,
Segments (presumably all or most of NC 12 in Currituck county) will not benot widened to 3-lane
but will remain as two-lane undivided. Roads will have 4-foot paved shoulder and swale
drainage.
Convert signalized intersections on NC 12 to one-lane roundabouts, to reduce delay, boost
vehicular capacity and improve appearance of the road. Develop a plan for adding roundabouts at
currently unsignalized locations, to: (1) control speed (2) provide cross-street access and (3) to
provide U-turn opportunities so drivers can avoid left turns into NC 12 when traffic is congested.
For the predictable extreme of peak periods when both traffic signal and roundabouts begin to
“fail” due to saturated flow, plan for manned traffic control at key intersections.
Develop a plan for more connectivity between locals streets and NC 12.
Consolidate driveways to reduce number on NC 12. Identify and negotiate cross-access
easements to eliminate some driveways on NC 12.
Review and advance, as part of road projects, elements contained in the Dare County and
Currituck County Comprehensive Transportation Plans and also the Duck and Southern Shores
Town Plans. Add hybrid beacon pedestrian signals at selected non-intersection pedestrian
crossings. Add variety of crossing warning devices, as outlined in the Manual on Uniform
Traffic Control Devices.
Areawide Administrative Actions Supporting Alternative ER2
Develop traffic advice app for visitors, showing profile of congestion, congestion alerts,
estimated travel times, etc. Institute electronic keys for rentals, eliminating travel to/from rental
agency offices and spreading out check-in/out times. Stagger check-in check-out times.

WALTER M. KULASH, P.E. Traffic Engineer
EDUCATION
Graduate Studies, Civil Engineering
(Transportation Planning) Northwestern
University, Evanston, Illinois (1970)
Master of Business Administration, University
of North Carolina, Chapel Hill, North Carolina
(1965)
Bachelor of Science, Industrial Engineering,
North Carolina State University, Raleigh, North
Carolina (1964)
EXPERIENCE
Public-interest traffic engineering consultant,
2007 – present
Principal, Senior Transportation Planner,
Glatting Jackson Kercher Anglin, Inc., Orlando,
Florida (1987 - 2007)
Senior Transportation Planner, Post, Buckley,
Schuh & Jernigan, Inc., Orlando, Florida (1984
- 1987)
Senior Associate, Alan Voorhees & Associates,
McLean, Virginia (1971 to 1984)
REGISTRATION
Professional Engineer, Florida, #45920
Alabama #31910 and North Carolina (pending).
MAJOR AREAS OF EXPERTISE
Over 40 years of experience in traffic
engineering. Since the 1990’s, focused on
bringing balance to the design of roads,
improving not just their vehicular traffic
capacity but also their accommodation of non-
motorized travel, and their value for local
businesses and as focal points of civic pride and
enthusiasm. Has applied this approach,
“context sensitive” design, to roads in new
communities, in "retro-fits" of damaged areas
such as blighted commercial strips and early-
generation shopping malls, and the rebuilding
of major arterial highways.
Roadway Planning: Applied traffic forecast
modeling and capacity analysis for concept plan
for Shelby Farms Parkway in Memphis;
“86/64” plan for replacing riverfront freeway in
Louisville; Riverfront Parkway conversion
from freeway in Chattanooga; Route 202
greenway/parkway in Bucks County, PA.;
Martin Luther King Parkway through the
University Circle area in Cleveland; Route 19
riverfront conversion from freeway in Trenton;
Fort Washington Way (I-71) in Cincinnati; I-
20/59 in downtown Birmingham; Alaskan Way
freeway conversion in Seattle.
Highway Alternatives Analysis: Conversion of
Columbus Boulevard to waterfront centerpiece,
Philadelphia; downsizing of Cumberland
Avenue, Knoxville; prototype designs for strip
reclamation, Savannah GA, La Crosse, WI and
Kansas City; reclamation of Route 51,
Pittsburgh; transition to urban boulevard on
Brambleton Avenue, Norfolk; “town and
country” concept on Maybank Highway,
Charleston SC; removing ramps and restoring
urban street features on Mercury Boulevard in
Hampton, VA; lane reduction and transition to
urban avenue on South Orange Avenue,
Orlando; transition to urban boulevard on
Johnny Dodd Boulevard, Mount Pleasant, SC.
Traffic Capacity Analysis: Responsible charge
for application of Highway Capacity Manual
procedures and proprietary applications
software (HCS and Synchro) for projects
throughout the US, including traffic impact
analysis for private developments, comparison

WALTER M. KULASH, P.E. Traffic Engineer
of road improvement alternatives, review of
proposed road designs and environmental
impact analysis.
Environmental Document Review: Reviewed
traffic and transportation elements of
environmental documents for major highway
projects in Tennessee, California, Georgia,
Florida, New York and Pennsylvania. Focus of
reviews included traffic capacity analysis,
traffic modeling and safety analysis.
Residential Street Design: Street designs for
numerous communities, including Bluffton,
South Carolina; Centerville, Ohio; Liberty,
California; Suffolk, Virginia.
Town Center Streets: New urbanist street and
block layouts in numerous communities.
Policy Advice on “Smart Growth” traffic
planning: PennDOT, New Jersey DOT,
Delaware Valley RPC.
Testimony: Accepted as expert for court
testimony in Pennsylvania, New York, Georgia
and Ohio. Numerous appearances at hearings
for record.
PUBLICATIONS
Residential Streets, Third Edition, 2001, Urban
Land Institute, (Principal Author).
Time Saver Standards for Urban Design, 2003,
McGraw Hill Companies, Traffic Calming,
Section 7.2.
Can’t Get There from Here – Or Can We,
Forum for Applied Research and Public Policy,
Summer, 2001
.
Massachusetts Highway Design Manual
(Intersection, Traffic Calming Chapters), 2005.

Goals, Objectives and Policies – Conservation and Coastal Management 3.2-101
No later than six months after the effective date of this comprehensive plan and as part of every Evaluation and Appraisal Report thereafter, Monroe County shall review and re-evaluate the key variables on which hurricane clearance times have been calculated, with the highest priority given to conducting surveys necessary to more accurately predict peak seasonal occupancy rates, behavioral response factors and related assumptions. If data becomes available to indicate need for an adjustment of any factor such data shall, within one year of certification of such data, be used to re-run transportation models of the Southeast Florida Hurricane Evacuation Study. New clearance times produced by such additional runs of the Southeast Florida Hurricane Evacuation Study shall be incorporated by plan amendment. [9J-5.012(3)(c)4] Policy 216.1.6 Monroe County shall seek an interlocal agreement with the National Oceanic and Atmospheric Administration (NOAA) for installation of at least four tide gauges at critical locations throughout the Keys in conjunction with the Florida Keys National Marine Sanctuary Program. The interlocal agreement shall address funding sources. [9J-5.012(3)(c)4] Policy 216.1.7 Monroe County shall seek an interlocal agreement, with one or more appropriate agencies, to draft and implement a comprehensive program for expanded resident and visitor hurricane awareness and evacuation procedures. The program will identify education needs and adequate funding sources to include, at a minimum, staffing requirements, distribution of hurricane public awareness brochures, media coverage, and public announcements in English and Spanish. [9J-5.012(3)(c)4] Policy 216.1.8
In the event of a pending major hurricane (category 3-5) Monroe County shall implement the following staged/phased evacuation procedures to achieve and maintain an overall 24-hour hurricane evacuation clearance time for the resident population.
1. Approximately 48 hours in advance of tropical storm winds, a mandatory evacuation of non-
residents, visitors, recreational vehicles (RV’s), travel trailers, live-aboards (transient and non-transient), and military personnel from the Keys shall be initiated. State parks and campgrounds should be closed at this time or sooner and entry into the Florida Keys by non-residents should be strictly limited.
2. Approximately 36 hours in advance of tropical storm winds, a mandatory evacuation of mobile home residents, special needs residents, and hospital and nursing home patients from the Keys shall be initiated.
3. Approximately 30 hours in advance of tropical storm winds, a mandatory phased evacuation of permanent residents by evacuation zone (described below) shall be initiated. Existing evacuation zones are as follows:
a) Zone 1 – Key West, Stock Island and Key Haven to Boca Chica Bridge (MM 1-6)
b) Zone 2 – Boca Chica Bridge to West end of 7-mile Bridge (MM 6-40) c) Zone 3 – West end of 7-Mile Bridge to West end of Long Boat Key Bridge (MM 40-63) d) Zone 4 – West end of Long Boat Key Bridge to CR 905 and CR 905A intersection (MM
63-106.5) e) Zone 5 – 905A to, and including Ocean Reef (MM 106.5–126.5)
The actual sequence of the evacuation by zones will vary depending on the individual storm.. The concepts embodied in this staged evacuation procedures should be embodied in the appropriate County operational Emergency Management Plans.

Goals, Objectives and Policies – Conservation and Coastal Management 3.2-102
The evacuation plan shall be monitored and updated on an annual basis to reflect increases, decreases and or shifts in population; particularly the resident and non-resident populations. [9J-5.012(3)(c)4] For the purpose of implementing Policy 216.1.8, this Policy shall not increase the number of allocations to more than 197 residential units a year, except for workforce housing. Any increase in the number of allocations shall be for workforce housing only. Policy 216.1.9 In accordance with the Monroe County Hurricane Preparedness Evacuation and Shelter Plan, special needs populations shall be identified by the Monroe County Department of Emergency Management. Monroe County shall implement the procedures contained in the Plan for the safe evacuation of these populations. [9J-5.012(3)(c)4] Policy 216.1.10 By January 4, 1998, Monroe County shall coordinate with the Florida Department of Transportation to draft and implement a program which will establish priorities for elevation of low segments of US 1. The program shall, at a minimum, identify funding sources and scheduling. Priority consideration shall be given to elevation of the 18-mile stretch of US 1 northbound from Key Largo. [9J-5.012(3)(c)4] Policy 216.1.11 By January 4, 1997, Monroe County shall adopt Land Development Regulations which require that all new and redeveloped marinas provide a hurricane contingency plan for review and approval before permits can be issued. [9J-5.012(3)(c)4] Policy 216.1.12 Monroe County shall establish separate dedicated funds to accommodate future technological advances in hurricane analyses and communication systems for the Emergency Management and Emergency Communications Department. [9J-5.012(3)(c)4] Policy 216.1.13 During a hurricane evacuation, Monroe County shall implement the procedures contained in the Monroe County Hurricane Preparedness Evacuation and Shelter Plan for modifying normal bridge openings including coordination with the U. S. Coast Guard and Florida Department of Transportation. [9J-5.012(3)(c)4] Policy 216.1.14 By January 4, 1998, Monroe County shall complete a Post-Disaster Recovery Plan which will include a structured procedure aimed at debris removal preparedness during hurricane evacuation and re-entry (See Objective 217.2 and related policies). [9J-5.012(3)(c)4] Policy 216.1.15 Monroe County shall consider implementing impact fees to offset the public costs of hazard mitigation, evacuation, reconstruction of public facilities, emergency communications equipment and similar needs. [9J-5.012(3)(c)4]

Washington State Department of Transportation
COMPARATIVE ANALYSIS OF TOLL FACILITY OPERATIONAL COSTS
REPORT
FEBRUARY 22, 2007
I B I G R O U P R E P O R T
TABLE OF CONTENTS
February 22, 2007 Page i
1. INTRODUCTION ......................................................................................................................1
1.1 Methodology .......................................................................................................................................... 1
2. TOLL FACILITY COMPARISON .............................................................................................3
3. FINDINGS.................................................................................................................................6
3.1 .1 Tol l Col lect ion Operat ing Cost as a Percentage of Annual To l l Revenue . . . . . . . . . . . . . . . . . . . . . . . . . . . . . . . . . . . . . . . . . . . . . . . . . . . . . . . . . . . . . . . . . . . . . . . . . . . . . . . . . . . . . . . . . . . . . . . . . . . . 6
3.1 .2 Tol l System Maintenance Costs as a Percentage of Annual To l l Revenue . . . . . . . . . . . . . . . . . . . . . . . . . . . . . . . . . . . . . . . . . . . . . . . . . . . . . . . . . . . . . . . . . . . . . . . . . . . . . . . . . . . . . . . . . . . . . . . . . . . . 8
3.1 .3 Average Tol l Col lect ion Operat ing Cost Per A l l To l l Transact ions . . . . . . . . . . . . . . . . . 9 3.1 .4 Percent o f Elect ronic and Manual To l l Transact ions . . . . . . . . . . . . . . . . . . . . . . . . . . . . . . . . . . . . 10 3.1 .5 number of Customer Serv ice Staf f Per Number of Accounts . . . . . . . . . . . . . . . . . . . . . . . . . 11
3.2 Organization of Oversight Agencies ................................................................................................. 11
3.3 Conclusions......................................................................................................................................... 15
APPENDIX A: DATA SOURCES

I B I G R O U P R E P O R T
Washington State Department of TransportationCOMPARATIVE ANALYSIS OF TOLL FACILITY OPERATIONAL COSTS
February 22, 2007 Page 1
1. INTRODUCTION When the new Tacoma Narrows Bridge (TNB) opens in 2007, it will offer both electronic and manual toll collection. An operations contractor will provide the staff to manually collect tolls, operate the customer service center, process violations, and maintain the new electronic toll collection system. Washington State Department of Transportation (WSDOT) will primarily be responsible for setting policies and procedures, providing public communications, and ensuring that the contractual obligations are met.
As Tacoma Narrows will be the first toll facility in Washington to deploy Electronic Toll Collection (ETC), this report compares the cost of operating other contracted, ETC-equipped toll facilities across the country and provides information regarding their oversight role and organization.
This report examines the range of operations cost data collected from other toll facilities similar to TNB, and offers some conclusions regarding how the planned TNB oversight functions and costs compare to other facilities.
1.1 Methodology Operational cost data was gathered for toll facilities that have similarities in scope and function to Tacoma Narrows Bridge. Criteria for determining which toll facilities were to be researched required that all or part of toll collection and customer services operations are performed by a contractor, and that ETC be deployed at the facility.
Annual reports for each facility were reviewed. The variations in toll facilities and data included in the annual reports necessitated that this review be followed by requests for additional, specific operations cost information. Detailed cost information is not typically provided in an annual report. Each agency was contacted to collect information at a level that would be useful for comparison to operational costs at TNB.
No toll facility is an exact “match” for comparison to TNB. There is a great range in the size and scope of toll facilities and how they are operated, including what expenses are considered “operations” costs and how the configuration of the facility affects these costs. These variations to be considered include:
• Magnitude and Type of Facility: Volume of traffic, number of toll lanes, and the amount of the toll charged vary widely, and directly affect the amount of revenue collected. Whether a facility is a bridge or toll road (which can be many miles long, with multiple entry/exit points) is also a fundamental difference that must be considered. Since operations costs are often presented as a percentage of toll revenue, the magnitude of the facility is a major factor.
• Method of Toll Collection: Beyond the type and size of facility, there are a number of variations that occur at the operational level, starting with how tolls are collected. Some facilities, like TNB, staff tollbooths or use Automated Coin Machines (ACM) for toll collection in addition to their ETC program. Others facilities offer ETC only. As the industry has shown that it generally costs less to collect a toll electronically versus manually, the number of ETC versus manual transactions is a consideration for analyzing operations costs.
• Division of Responsibilities: The types of responsibilities assigned to the contractor(s) and those that remain with the agency vary by agreement, and clearly
I B I G R O U P R E P O R T
Washington State Department of TransportationCOMPARATIVE ANALYSIS OF TOLL FACILITY OPERATIONAL COSTS
February 22, 2007 Page 2
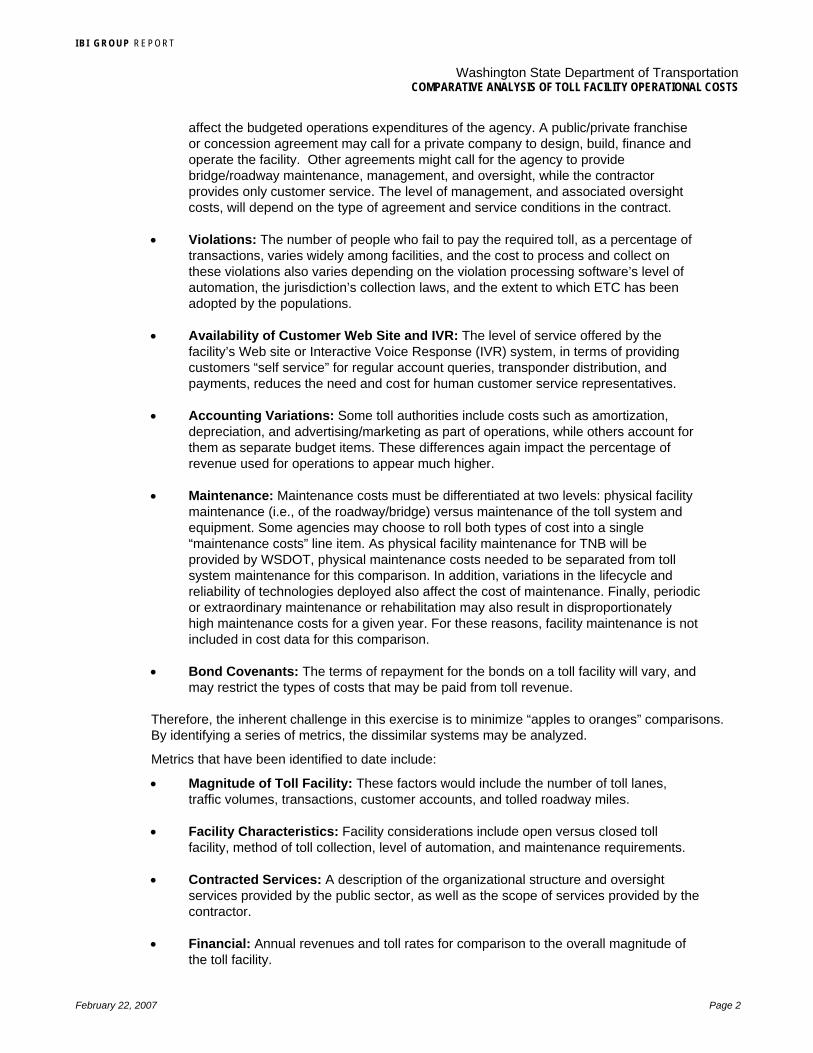
affect the budgeted operations expenditures of the agency. A public/private franchise or concession agreement may call for a private company to design, build, finance and operate the facility. Other agreements might call for the agency to provide bridge/roadway maintenance, management, and oversight, while the contractor provides only customer service. The level of management, and associated oversight costs, will depend on the type of agreement and service conditions in the contract.
• Violations: The number of people who fail to pay the required toll, as a percentage of transactions, varies widely among facilities, and the cost to process and collect on these violations also varies depending on the violation processing software’s level of automation, the jurisdiction’s collection laws, and the extent to which ETC has been adopted by the populations.
• Availability of Customer Web Site and IVR: The level of service offered by the facility’s Web site or Interactive Voice Response (IVR) system, in terms of providing customers “self service” for regular account queries, transponder distribution, and payments, reduces the need and cost for human customer service representatives.
• Accounting Variations: Some toll authorities include costs such as amortization, depreciation, and advertising/marketing as part of operations, while others account for them as separate budget items. These differences again impact the percentage of revenue used for operations to appear much higher.
• Maintenance: Maintenance costs must be differentiated at two levels: physical facility maintenance (i.e., of the roadway/bridge) versus maintenance of the toll system and equipment. Some agencies may choose to roll both types of cost into a single “maintenance costs” line item. As physical facility maintenance for TNB will be provided by WSDOT, physical maintenance costs needed to be separated from toll system maintenance for this comparison. In addition, variations in the lifecycle and reliability of technologies deployed also affect the cost of maintenance. Finally, periodic or extraordinary maintenance or rehabilitation may also result in disproportionately high maintenance costs for a given year. For these reasons, facility maintenance is not included in cost data for this comparison.
• Bond Covenants: The terms of repayment for the bonds on a toll facility will vary, and may restrict the types of costs that may be paid from toll revenue.
Therefore, the inherent challenge in this exercise is to minimize “apples to oranges” comparisons. By identifying a series of metrics, the dissimilar systems may be analyzed.
Metrics that have been identified to date include:
• Magnitude of Toll Facility: These factors would include the number of toll lanes, traffic volumes, transactions, customer accounts, and tolled roadway miles.
• Facility Characteristics: Facility considerations include open versus closed toll facility, method of toll collection, level of automation, and maintenance requirements.
• Contracted Services: A description of the organizational structure and oversight services provided by the public sector, as well as the scope of services provided by the contractor.
• Financial: Annual revenues and toll rates for comparison to the overall magnitude of the toll facility.

I B I G R O U P R E P O R T
Washington State Department of TransportationCOMPARATIVE ANALYSIS OF TOLL FACILITY OPERATIONAL COSTS
February 22, 2007 Page 3
• Impact of Violations: The annual number of violations, collection rate, staffing requirements and the impact to operations costs.
• Customer Services: The volume of customer service requests and associated staffing requirements.
2. TOLL FACILITY COMPARISON With consideration to the challenges described above, the following toll facilities are included in this analysis:
• E-470, Denver CO: E-470 is a 47-mile toll road along the eastern perimeter of Denver, and offers a timesaving route to the Denver Airport. The E-470 Public Highway Authority manages E-470. Payment may be made using manual toll collection booths, Automated Coin Machines or the EXpressToll transponder.
• Golden Gate Bridge (GGB), San Francisco CA: The Golden Gate Bridge is overseen by the Golden Gate Bridge, Highway and Transportation District. Unlike the other Bay Bridges, GGB staff includes manual toll collectors. GGB participates in the FasTrak electronic toll collection program.
• Tobin Bridge, Boston MA: The Tobin Bridge connects the Charlestown section of Boston with Chelsea, and is part of the Massachusetts Turnpike. The bridge is maintained by MASSPORT. ETC has been deployed via the FAST LANE program, which is administered by the Massachusetts Turnpike Authority (MTA).
• Central Texas Regional Mobility Authority (CTRMA),1 Austin TX: CTRMA will be the oversight agency for 183-A, a new all-ETC facility. The Texas Department of Transportation (TxDOT) will provide ETC operations via a contractor.
• Bay Bridges, San Francisco Bay Area CA: The Bay Area Toll Authority (BATA) is the agency that administers toll collection on the seven state-owned bridges in the region. In addition, BATA operates the customer service centers for customers with transponders under the FasTrak program. Caltrans owns, operates, and maintains these bridges, including providing manual toll collection.
• Transportation Corridor Agencies (TCA), Orange County CA: TCA (also known as “The Toll Roads”) consists of two separate toll authorities that oversee the Foothills/Eastern and San Joaquin Hills toll roads. The Toll Roads accept cash and the FasTrak ETC transponder for payment.
• SR 91 Expressway, Orange County CA: SR 91 is a ten-mile toll road that was the world's first all ETC toll facility. SR 91 is owned and operated by the Orange County Transportation Authority (OCTA), which purchased the road from a private concessionaire in 2003. OCTA operates the customer service center for SR 91. Violations processing is contracted. SR 91 only accepts FasTrak transponders for payment.
• Causeway Bridge, New Orleans LA: The Greater New Orleans Expressway Commission (GNOEC) is the controlling body of the Causeway Bridge, the longest bridge in the world. Tolls are collected both manually and electronically.
1 This report uses engineering estimates provided by CTRMA for operations costs.

I B I G R O U P R E P O R T
Washington State Department of TransportationCOMPARATIVE ANALYSIS OF TOLL FACILITY OPERATIONAL COSTS
February 22, 2007 Page 4
The following table summarizes the division of responsibilities between contractors and public agencies at these facilities.
Services Provided by Contractor Services Provided by Agency
E-470 All toll collection, customer service, violations processing, auditing, and courtesy patrols.
Toll oversight, roadway maintenance.
Caltrans Bridges All ETC operations. Manual toll collection, bridge maintenance. Oversight
provided by BATA.
Golden Gate Bridge
All ETC operations. Bridge maintenance, manual toll collection. Oversight by BATA.
Tobin Bridge Contractor provides hardware/software maintenance for ETC only.
MASSPORT provides bridge maintenance and oversight. Massachusetts Turnpike Authority provides toll collection.
CTRMA 183-A
Customer Service Center, Violation Processing (under an interagency agreement). Preventative and predictive and corrective maintenance for the toll collection system.
The TTA Division of TxDOT administers the Customer Service Center (CSC) and the Violation Processing Center (VPC). Some on-site toll collection enforcement is provided. The CTRMA Director of Operations administers maintenance.
TCA Call center, toll payment enforcement, Customer Service Center, facility management, incident response.
Accounting, administration, financial and operations oversight.
SR 91 Enforcement, call center, customer service, facility management, incident response.
Manage contract, set toll policy and pricing, manage external service agreements, financial management, implement corridor improvements.
The Causeway Electronic toll collection. Manual toll collection, oversight.
The following table presents key operations data for each facility named above. The purpose of this table is to provide a side-by-side comparison of the different facilities.

I B I G R O U P R E P O R T
Washington State Department of TransportationCOMPARATIVE ANALYSIS OF TOLL FACILITY OPERATIONAL COSTS
February 22, 2007 Page 5
Section 3: Findings, presents a comparison and analysis of this collected data.
FACILITIES E-470 Caltrans Bridges Golden Gate Bridge Tobin Bridge CTRMA TCA SR 91
Type of Structure Toll road Seven bridges Bridge Bridge Toll road Four toll roads Toll roadLocation Denver, CO Bay Area, CA San Francisco, CA Boston, MA Austin, TX Orange County, CA Orange County, CANumber of Toll Collection Locations 31 65 14 7 4 N/A 4Miles of Toll Road 47 26.3 1.7 2.75 4.5 51 10Annual Traffic Volume N/A 135,000,000 20,000,000 9,000,000 109,500,000 11,200,000
Typical Toll Paid by 2-Axle Vehicle* $1.00 - $11.75 $3.00 $4.00 $3.00 N/A $3.00 $1.10 - $7.75Annual Number of Toll Transactions 51,488,900 133,596,000 20,654,000 9,000,000 10,993,435 94,038,882 11,169,000
Percent Electronic Toll Collection 67% 77% 60% 42% N/A 70% 100%Percent Manual Toll Collection 33% 23% 40% 68% N/A 30% 0%
Number of Electronic Toll Collection Accounts 199,563 170,000 65,200 N/A N/A 310,957 116,000Number of Transponders Issued 360,570 240,000 83,000 N/A N/A 558,930 180,000
Number of Customer Service Staff 41 N/A N/A N/A N/A 170 30Number of Toll Collector Staff 89 260 100 19 N/A N/A All ETC
Annual Revenue from Toll Payments $84,499,000 $265,362,000 $84,419,500 $28,000,000 $11,599,000 $168,000,000 $32,375,471Annual Toll Collection Operations Cost $11,589,800 $38,931,390 $15,479,000 $4,500,000 $3,162,495 $27,593,000 $5,146,526Annual Toll System Maintenance Cost $1,575,400 $2,972,514 $12,088,000 $2,500,000 $3,487,800 $10,300,000 $2,525,000*Rate for ETC or average toll collected
Notes:a) Tobin Bridge is part of the Interagency Group cooperative toll consortium. Individual statistics for "just" Tobin Bridge cannot be known.b) Operations and Maintenance costs for Tobin Bridge are low because the bridge has no violations processing costs and only contracts for hardware/software maintenance.c) E-470 has numerous toll collection points, so the toll paid varies by miles driven. d) CTRMA's toll road, 183-A. All numbers are projected estimates for 2009.
COMPARISON OF FACILITIES
Toll Characteristics
Facility Characteristics
Financial Data
Toll Operations Staffing
I B I G R O U P R E P O R T
Washington State Department of TransportationCOMPARATIVE ANALYSIS OF TOLL FACILITY OPERATIONAL COSTS
February 22, 2007 Page 6
3. FINDINGS There is a great range in the size and scope of toll facilities, average tolls, and how they are operated, including what expenses are considered “toll collection” costs and how the toll collection methods and practices affects these costs. These variations include:
• Size of Facility • Type (road, tunnel, bridge) of
Facility • Percent of Electronic Toll
Transactions • Division of Responsibilities
between Contractor(s) and Agency • Number of Violators and Cost to
Collect
• Availability of Automated ETC Customer Account Access via Internet and Telephone
• Variations in Facility Bond Covenants
• Variations in Accounting Practices
This section presents comparisons of the data collected from the various facilities.
3.1 Toll Collection Operating Cost As a Percentage of Annual Toll Revenue
For the purpose of this exercise, toll collection operating costs were defined as “the cost to collect tolls”, including staff and consumables for Manual Toll Collection, Customer Service costs for ETC, and violation enforcements. Operating costs also include agency contract administration and oversight. Service patrols and incident response were not included. Although operating costs are generally provided in annual reports, it was necessary to follow up with agencies to ensure that the cost provided in the report was inclusive of the costs described above.
The following chart shows the percentage of toll revenue that is spent on operating costs, including the budgeted cost for Tacoma Narrows Bridge over the life of the operations contract.

I B I G R O U P R E P O R T
Washington State Department of TransportationCOMPARATIVE ANALYSIS OF TOLL FACILITY OPERATIONAL COSTS
February 22, 2007 Page 7
Figure 1: Toll Collection Operating Cost as a Percent of Annual Toll Revenue
*2009 Estimate for TNB include $1 discount on ETC transactions**2010 Estimate includes $1 toll increase to $4
16%12% 14% 16% 15% 16% 17.6% 16%
20%
TacomaNarrows
(2009Estimated)
TacomaNarrows
(2010Estimated)
E-470 CaltransBridges
Golden Gate Bridge
Tobin Bridge TCA SR-91 LakePontchartrain
Causeway
When comparing toll collection costs, it might be expected that those facilities with a higher ETC percentages would also have a lower overall cost. However, Figure 1 shows a fairly close range when comparing toll collection costs as a percentage of annual toll revenue. This highlights the impact of different toll collection practices and facility characteristics. For example, the seven Caltrans-operated bridges in the San Francisco Bay Area are operationally very different from the Tobin Bridge in Boston. But the toll collection cost percentages are quite close. The Caltrans bridges have heavy traffic, high toll rates, and a lower percentage of ETC use, whereas the Tobin Bridge is a smaller operation with moderate ETC use. Tobin Bridge uses gated toll lanes, effectively eliminating violations and the associated collection costs. SR 91 in Orange County is a 100%-ETC facility (no toll booths), yet the high rate of violations erodes the operational cost savings that might otherwise be seen. The slight increase in toll collection cost for the Transportation Corridor Agencies (TCA) in Orange County is due to large size and many manual toll collection points.

I B I G R O U P R E P O R T
Washington State Department of TransportationCOMPARATIVE ANALYSIS OF TOLL FACILITY OPERATIONAL COSTS
February 22, 2007 Page 8
3.2 Toll System Maintenance Costs as a Percentage of Annual Toll Revenue
The maintenance costs data collected for this exercise include maintenance of toll system hardware, software, lane equipment, and communications. They also include salary costs for IT staff that troubleshoot and maintain the toll system. Costs for road signs, facility maintenance, trash pickup, landscaping, etc., are not included. For TNB, toll systems maintenance is included in the toll operations contract and is not a separate cost item.
The following chart shows the percentage of annual toll revenue that is budgeted for toll system maintenance costs at various other facilities.
Figure 2: Toll System Maintenance Cost as a Percent of Annual Toll Revenue
16%
1%
14%
9%
13%
3%
6%
15%
E-4
70
Cal
trans
Brid
ges
Gol
den
Gat
eB
ridge
Tobi
n B
ridge
CTR
MA
(est
imat
es)
TCA
SR
-91
Lake
Pon
tcha
rtrai
n
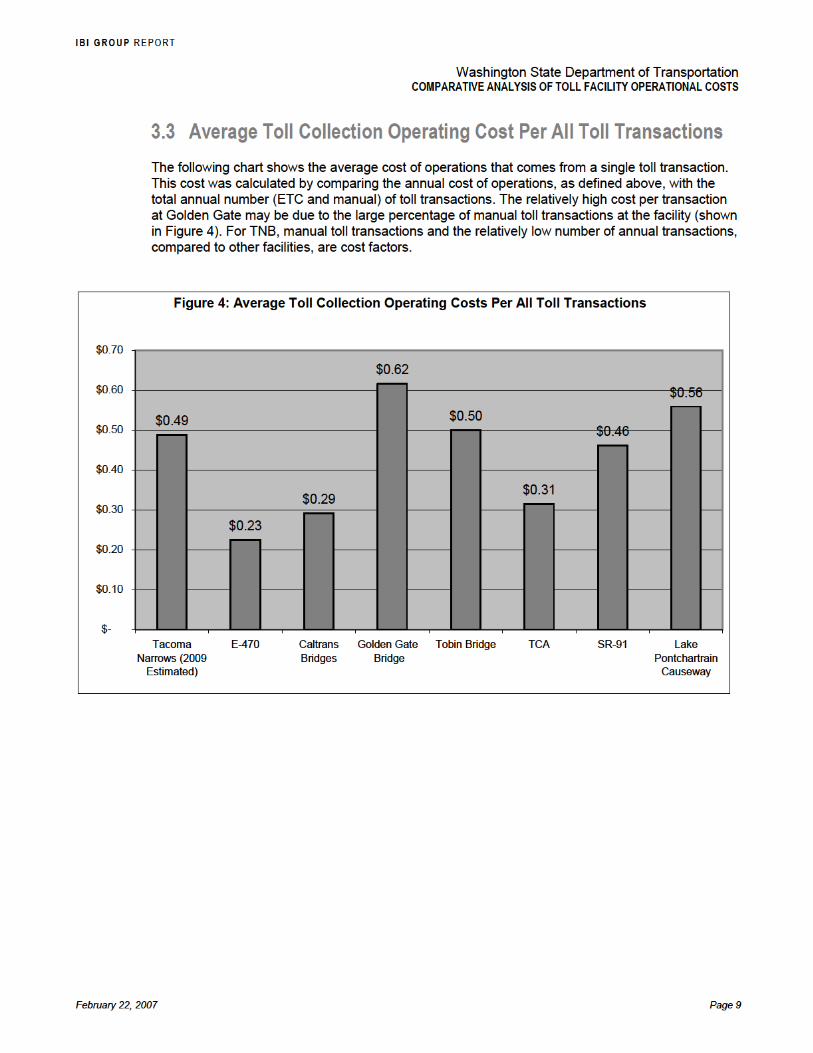


I B I G R O U P R E P O R T
Washington State Department of TransportationCOMPARATIVE ANALYSIS OF TOLL FACILITY OPERATIONAL COSTS
February 22, 2007 Page 11
3.5 Number of Customer Service Staff Per Number of Accounts Facilities were surveyed on the number of customer service staff and the number of active ETC accounts to determine the relative staffing requirements based upon the size of the facility. Customer service staff may apply payments, open and close accounts, distribute transponders, provide account assistance, and process violations. Although some authorities have separate staff categories for violations processing and customer service, others simply assign staff duties based upon the day’s workload.
Figure 5: Number of ETC Accounts Per Each CSC Staff*for agencies reporting staffing data
0
1000
2000
3000
4000
5000
6000
E-470 TCA SR-91
ETC
Acc
ount
s
3.6 Organization of Oversight Agencies The Washington State Department of Transportation has been particularly strong in emphasizing agency accountability and financial transparency in public works projects, with very positive results. With construction nearing completion, the reintroduction of highway tolling will shift public scrutiny from construction to accountability of the toll collection operation. Although a contractor will be operating the ETC system, physically collecting the tolls and interfacing with the public at customer service centers, the public will not be directly cognizant of this private entity. Instead the public will see WSDOT as the “face” behind each positive or negative experience. In addition, the handling of public funds and storing of individual personal information (including credit card information as part of ETC accounts) requires a level of hands-on management by WSDOT as the party ultimately responsible for this new toll facility.
In order to safeguard the substantial public investment in the new bridge itself, the revenues collected (required by law to be used strictly for the repayment of the bridge construction costs, minus operations and maintenance costs), and the public goodwill towards WSDOT as an agency, WSDOT staff must oversee contractor operations, ensure proper financial procedures are followed, market the Good To Go! program, and other oversight functions.

I B I G R O U P R E P O R T
Washington State Department of TransportationCOMPARATIVE ANALYSIS OF TOLL FACILITY OPERATIONAL COSTS
February 22, 2007 Page 12
Toll operational and financial oversight is a common function of all agencies at other facilities. All of the facilities contacted for this research effort had some public agency oversight role that varied in accordance with the range of functions performed by the contractor, and were organized into various divisions to meet these obligations. Some examples include:
• E-470: The E-470 Public Highway Authority is organized into divisions for Toll Operations, Roadway and Lane Management, Engineering, Finance, and Information Technology. Within these divisions, the agency’s oversight functions include accounting and finance support, bank verification, managing investor and legislative relations, payroll, internal auditing, traffic/revenue reviews, ETC marketing, technical support, and public relations.
• Transportation Corridor Agencies: At TCA, the agency divisions include Communications and Public Affairs, Finance/Administration, Toll Operations, and Engineering and Environmental Planning. Key functions include financial oversight and budgeting, project management, information technology, and customer service and toll compliance (violations) oversight.
• SR 91: As a division of Orange County Transportation Authority (OCTA), SR 91-specific functions include management, auditing, marketing and administration.
E-470, TCA, and SR 91 are all facilities where the breadth of contractor services is similar to TNB. In reviewing the organizational structure and roles and responsibilities of these agencies in overseeing contractor operations, the following functions have been identified that are applicable to TNB and that are needed as tolling commences and TNB begins day-to-day operations.
Toll Operations Management: Overall responsibility for the safe and efficient management of the tolled roadway, including interfacing with other WSDOT divisions, such as maintenance, the Olympic Region Traffic Management Center, and other toll projects; as well as being a key point of contact for the contractor’s management team. Other responsibilities may include:
• Management and administration of the toll operations contract
• Performance monitoring and reporting of contractor services
• Performance monitoring and reporting of toll operations services
• Long and short term planning – identification or approval of major initiatives, such as marketing plans, incentive programs, etc.
• Response to requests for information by WSDOT executive staff, OFM, OST, the Governor’s office, and elected officials
• Ensuring that that operations comply with state laws for safety, enforcement, and bond repayment
• Preparation, administration, approval, and management of all operating and capital budget expenditures
• Oversight of daily revenue collection and reconciliation reporting
• Oversight of security initiatives

I B I G R O U P R E P O R T
Washington State Department of TransportationCOMPARATIVE ANALYSIS OF TOLL FACILITY OPERATIONAL COSTS
February 22, 2007 Page 13
• Coordination with bridge maintenance and supervision of other toll operations oversight staff
• Coordination with engineering consultants, contractors and outside agencies for special projects
IT Systems Maintenance: This function includes oversight of the contractor’s servicing of the toll system hardware and software, including upgrades and replacement of equipment under the system warranty.
• Monitoring of toll system hardware and software maintenance activities and comparison of system upgrades against contract requirements
• Software application problem identification, documentation, and working with the contractor to resolve
• Monitoring of system hardware and equipment maintenance and resolution of any issues arising from the contractor’s maintenance performance
• Intermittent operation of equipment to test its functionality
• Oversight of system hardware and equipment inventory, including spare parts
• Oversight and administration of network security
Facility Operations: The WSDOT Toll Operations manager and support staff ensures proper toll facility operations:
• Coordination and monitoring of daily toll collections in collaboration with the contractor
• Review (and possibly development) of operating manuals, plans and procedures to improve toll operations, customer service, violation processing, financial audits, traffic control and security measures
• Coordination of traffic activities with the bridge maintenance unit, contractors and other agencies
• Coordination with WSDOT and Washington State Patrol incident response
• Management of violation enforcement processing quality, fairness, policies and procedures and maintaining liaison with Pierce County Court System, Washington State Patrol, and the Administrative Office of the Courts
• Monitoring and response to complaints or questions concerning the toll operations especially customer service and violation processing
• Assistance with the preparation, administration and monitoring of the annual operating budgets
• Coordination of TNB operations with other WSDOT tolling projects
I B I G R O U P R E P O R T
Washington State Department of TransportationCOMPARATIVE ANALYSIS OF TOLL FACILITY OPERATIONAL COSTS
February 22, 2007 Page 14
Marketing: The Good To Go! ETC program is the statewide ETC program for other future toll facilities implemented in Washington. Therefore, branding and marketing of Good To Go! is a WSDOT function. Activities include:
• Oversight and approval of the use of Good To Go! and WSDOT logos by the contractor
• Review of promotional materials prepared by the contractor
• Development of an overall marketing plan for Good To Go!
• Development of potential ETC customer incentive plans and oversight of contractor implementation
• Coordination with other Washington toll facilities for local promotion of Good To Go!
Finance: Financial functions include the management, utilization and development of systems and techniques to audit and analyze toll system revenue and traffic data, including:
• Assistance with the preparation, administration and monitoring of the annual operating and capital budgets
• Conduct of periodic audits of toll revenue transactions including reconciliation with TRAINS
• Analysis of financial reports and progress
• Management and oversight of the development of toll collection, revenue auditing and traffic analysis system enhancements
• Preparation of monthly reports for any system report problems
• Administration of the operations and maintenance contract, including renewals
• Preparation of independent toll system revenue reports
• Identification and reporting of revenue data errors and discrepancies
General Administration: Other functions that are provided by WSDOT include:
• Provision of public information
• Management of special projects and events
• Day to day administrative support and payroll
This review of toll agency oversight functions and organization has demonstrated that there are many commonalities in the roles and responsibilities that agencies undertake in the management of toll facilities, despite the many variations that can be seen in the size and scope of the those facilities. The range of common key oversight functions performed by agency staff includes overall management, contractor operations oversight (including customer service and violations processing), reporting and finance, technical support, and marketing.

I B I G R O U P R E P O R T
Washington State Department of TransportationCOMPARATIVE ANALYSIS OF TOLL FACILITY OPERATIONAL COSTS
February 22, 2007 Page 15
3.7 Conclusions Overall, this exercise confirmed the difficulties of comparing costs to operate vastly different facilities that may only share the single common characteristic of tolls. However, the estimated toll collection costs for Tacoma Narrows Bridge are within the industry range for such costs, particularly considering the relatively small size of the facility. TNB has estimated 12-16% for operations and administration of tolls over the life of the operations contract, which is within the range found for the other facilities researched. Administration costs are more varied depending on the size and age of the toll system.
TNB has estimated an initial 55% penetration rate for Good To Go!. Although a somewhat higher rate than other bridges, this is certainly not an unreachable goal, considering the high levels of local and commuter traffic in the area, and the likelihood of an initial ETC discount. Public surveys have indicated that many residents make frequent trips across the bridge, even several times per day. Most of these residents will use Good To Go!
All agencies have toll operations staff that provide auditing and oversight of the operations contractor, including performing independent reviews of revenue and violations reports, budgeting, and marketing, as well as the other functions described in Section 3.2. As other toll projects, including the SR 167 HOT Lanes are likely to follow TNB, WSDOT will also need oversight staff to ensure the integration of these facilities.

I B I G R O U P R E P O R T
Washington State Department of TransportationCOMPARATIVE ANALYSIS OF TOLL FACILITY OPERATIONAL COSTS
February 22, 2007
APPENDIX A
DATA SOURCES

I B I G R O U P R E P O R T
Washington State Department of TransportationCOMPARATIVE ANALYSIS OF TOLL FACILITY OPERATIONAL COSTS
Toll Operations Costs – Data Sources
Facility Primary Data Source Notes on Operations Costs
Notes on Maintenance Costs
E-470 2005-06 Budget E-470 Staff
Cost for Operations Contract and salaries. Includes direct cost, does not include animal removal and litter, from 2005-06 budget
Includes IT salaries, select software, toll system hardware maintenance.
Caltrans Bridges Annual Report BATA Staff
Includes toll accounting, manual toll collection from Caltrans, plus CSC operations
Includes toll equipment maintenance and IT support.
Golden Gate Bridge 2003/04 Annual Report From Annual Report. From Annual Report.
Tobin Bridge Tobin Bridge staff. Includes administration, toll collector salaries, direct costs and payment to MTA for ETC.
Toll system and hardware maintenance.
CTRMA General Engineering Contractor estimate.
Estimated for first year of operations.
Estimated for first year of operations.
TCA FY ’05 Annual Report 2006 Budget
2006 Budgeted Operations Costs, incl. Toll Ops Admin
2006 Budgeted Maintenance Costs
SR-91 OCTA Staff, based on 2006 budget
2006 Budgeted Costs 2006 Budgeted Costs
Lake Pontchartrain 2004/05 Budget Cost of operating services plus toll collector salaries
Includes a few misc. items like A/C and plumbing supplies for which separate costs were not available.
Related Documents