CAPITAL EXITED INCREASES BY 47% FROM 1Q PAGE 4» Q&A: OPTIMIZING CHARITABLE GIVING FOR PE INVESTORS PAGE 6» 90% OF PE-BACKED IPOS HIT OR BEAT TARGET IN 1H 2015 PAGE 11» AND COMPANY INVENTORY 2H 2015 SPONSORED BY

Welcome message from author
This document is posted to help you gain knowledge. Please leave a comment to let me know what you think about it! Share it to your friends and learn new things together.
Transcript
CAPI TAL E X I T ED INCRE ASE S BY 47 %F ROM 1QPAGE 4»
Q& A : OP T IMIZ ING CHARI TABL E GIV ING F ORPE INVE S T ORSPAGE 6»
90% OF PE-BACKED IP OS HI T OR BE AT TARGE TIN 1H 20 15PAGE 11»
AND COMPANY INVENTORY2H 2015
S P O N S O R E D B Y

Give your exit strategy a tax cut......and maximize your charitable impactYou are committed to sharing your success with the causes you care about most. But did you know there is a smarter way to give?
Donating your appreciated private equity interests to charity before your exit can increase your contribution and reduce your tax burden. It is a strategy that is often overlooked— but it demands specialized expertise.
Fidelity Charitable’s Complex Assets Group can help you take advantage of the benefits of a donor-advised fund to contribute illiquid assets to charity. In the last two years alone, we helped facilitate the donation of more than $1 billion in private equity interests and other illiquid assets, benefiting our donors and the charities they support.
1This hypothetical example is for illustrative purposes, and assumes all gains are subject to the maximum federal long-term capital gain tax rate of 20% and the Medicare surtax of 3.8%. This does not take into account state or local taxes, if any. 2Availability of certain federal income tax deductions may depend on whether deductions are itemized. Charitable contributions of capital gain property held for more than one year are usually deductible at fair market value. Deductions for capital gain property held for one year or less are usually limited to cost basis. This does not consider effect of any limitation on itemized deductions (e.g., the Pease limitation). 3A donor of complex assets to a public charity must generally substantiate the value of the income tax charitable deduction claimed by obtaining a licensed appraisal of the asset. A valuation expert should be expected to discount the value of the asset for lack of marketability and for minority interest purposes. In this instance, a 10% discount is assumed. The extent of discounting is highly dependent on the facts and circumstances regarding the asset at the time of contribution. Fidelity Charitable is the brand name for Fidelity® Charitable Gift Fund, an independent public charity with a donor-advised fund program. Various Fidelity companies provide services to Fidelity Charitable. The Fidelity Charitable name and logo and Fidelity are registered service marks of FMR LLC, used by Fidelity Charitable under license. The tax information provided is general and educational in nature, and should not be construed as legal or tax advice. Fidelity Charitable does not provide legal or tax advice. (731310.1.0)
Want to explore how a donor-advised fund can enhance your exit strategy?
Contact the Fidelity Charitable Complex Assets Group today. FidelityCharitable.org/pe 800.262.4923
See the impact1
By donating $2 million in privately held stock to charity before a sale takes place, an investor can give $476,000 more, and receive a $276,000 higher charitable income tax deduction.
Donating appreciated privately held stock
Sell stock, donate proceeds Donate stock directly
Money for charity2 $1,524,000 $2,000,000
Charitable deduction $1,524,000 $1,800,0003
$476,000 MORE TO CHARITY
$276,000 HIGHER DEDUCTION
Assumes a cost basis of $0 and a long-term capital gain of $2 million
CONTENTSOverview
Q&A: Karla D’Alleva Valas
Exits by Type
Corporate Acquisitions
Secondary Buyouts
IPOs
Exits by Industry
Exits by Region
Company Inventory
4-5
6
7
8
9
10-11
12
13
14
CREDITS & CONTACTPitchBook Data, Inc.
JOHN GABBERT Founder, CEO
ADLEY BOWDEN Senior Director, Analysis
ContentALEX LYKKEN Editor
ANDY WHITE Lead Data Analyst
DANIEL COOK Senior Data Analyst
GARRETT BLACK Senior Financial Writer
BRIAN LEE Data Analyst
NIZAR TARHUNI Financial Writer
JENNIFER SAM Senior Graphic Designer
JESS CHAIDEZ Graphic Designer
Contact PitchBookpitchbook.com
RESEARCH
EDITORIAL
SALES
COPYRIGHT © 2015 by PitchBook Data, Inc. All rights reserved. No part of this publication may be reproduced in any form or by any means—graphic, electronic, or mechanical, including photocopying, recording, taping, and information storage and retrieval systems—without the express written permission of PitchBook Data, Inc. Contents are based on information from sources believed to be reliable, but accuracy and completeness cannot be guaranteed. Nothing herein should be construed as any past, current or future recommendation to buy or sell any security or an offer to sell, or a solicitation of an offer to buy any security. This material does not purport to contain all of the information that a prospective investor may wish to consider and is not to be relied upon as such or used in substitution for the exercise of independent judgment.
Fidelity Charitable is an independent public charity with a donor-advised fund program. A donor-advised fund is a dedicated charitable account that allows individual donors to make a single tax-deductible donation, and then recommend how that donation is invested for growth and distributed to their preferred charities. Established in 1991, Fidelity Charitable has helped donors support more than 190,000 nonprofit organizations with more than $20 billion in grants.
Fidelity Charitable’s donors include many professionals who work in private equity. In the last two years alone, Fidelity Charitable has worked with PE firms and investors to facilitate the donation of more than $1 billion in non-publicly traded assets, including appreciated PE interests. By giving these types of assets to a charity with a donor-advised fund program, the contributing PE investor can generally take advantage of all available tax efficiencies, including a potential fair market value tax deduction and the elimination of capital gains taxes.
With this strategic giving technique, Fidelity Charitable helps PE investors give up to 20 or 30 percent more to charity, use one charitable donation to support many different public charities, and create a thoughtful, long-term plan for giving.
Fidelity Charitable’s mission is to make charitable giving simple and effective. For more information, call 800.262.4923 or visit www.FidelityCharitable.org/pe.
3 PITCHBOOK 2H 2015
PE EXITS & COMPANY INVENTORY

OverviewGLOBAL PE EXIT FLOW BY QUARTER
The good times are still rolling for PE sellers. In fact, the seller’s
market is rising above even the historic numbers seen last year in terms of value. 2Q saw a gargantuan $194 billion exited through 516 sales worldwide, pushing first half totals to $327 billion across 1,026 liquidity events. That figure puts 2015 on favorable footing compared to last year’s massive haul of $587 billion. In addition, the total capital exited in the second quarter was 16% higher than the previous high of the past four and a half years—$168 billion in 3Q 2014. These vast sums speak to just how heated valuations have grown.
Source: PitchBook
GLOBAL EXIT FLOW BY YEAR
Source: PitchBook
$52
$106
$80
$77
$59
$84
$79
$135
$58
$79
$107
$150
$136
$132
$168
$151
$132
$194
346
463
371
378413 412
399
509
415
458486
560
472
560
539
567
510
516
0
100
200
300
400
500
600
$0
$50
$100
$150
$200
$250
1Q 2Q 3Q 4Q 1Q 2Q 3Q 4Q 1Q 2Q 3Q 4Q 1Q 2Q 3Q 4Q 1Q 2Q
2011 2012 2013 2014 2015Capital Exited ($B) # of Exits Closed
$322
$392
$223
$148
$235
$315
$356
$394
$587
$327
1,246
1,551
1,070
702
1,263
1,5581,733
1,9192,138
1,026
0
500
1,000
1,500
2,000
2,500
$0
$100
$200
$300
$400
$500
$600
$700
2006 2007 2008 2009 2010 2011 2012 2013 2014 1H 15
Capital Exited ($B) # of Exits Closed
INTELLIGENCE IN ACTIONPITCHBOOK FOR PE FIRMS : No one offers more insight on the private equity landscape
Monitor peer activity
Identify LPs for your fund
Benchmark your performance
…and more!
Find out more by emailing [email protected] or visiting pitchbook.com
Source: PitchBook
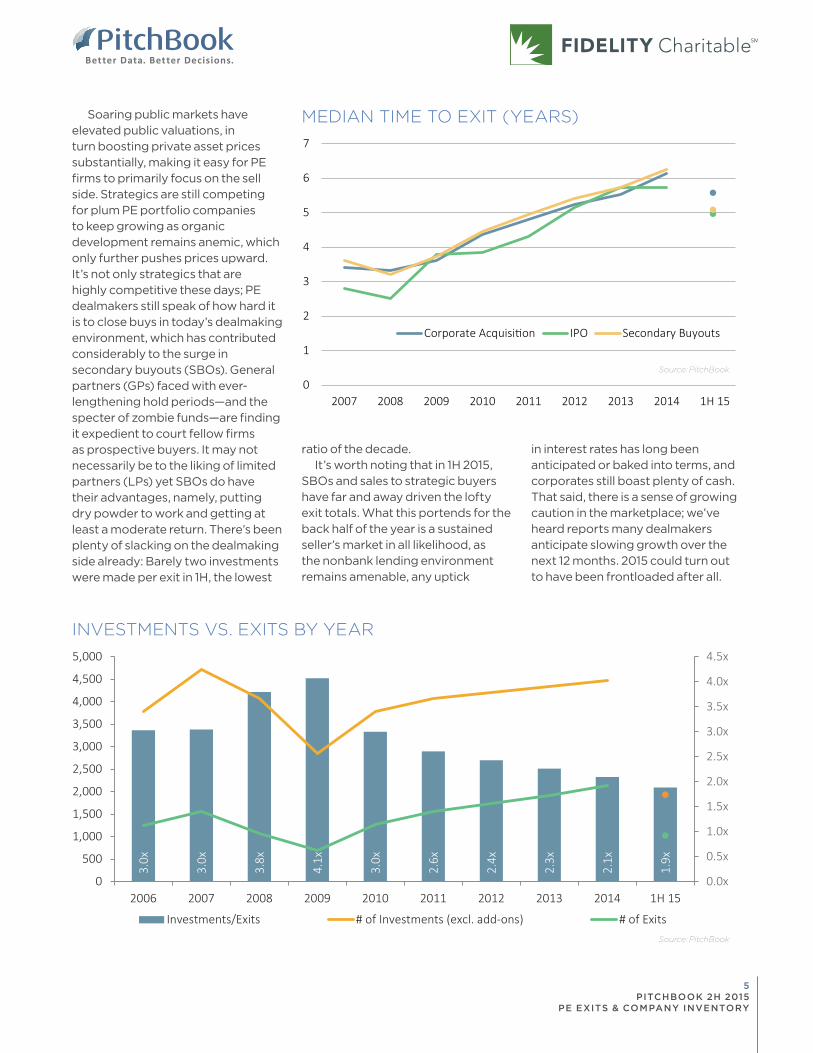
Soaring public markets have elevated public valuations, in turn boosting private asset prices substantially, making it easy for PE firms to primarily focus on the sell side. Strategics are still competing for plum PE portfolio companies to keep growing as organic development remains anemic, which only further pushes prices upward. It’s not only strategics that are highly competitive these days; PE dealmakers still speak of how hard it is to close buys in today’s dealmaking environment, which has contributed considerably to the surge in secondary buyouts (SBOs). General partners (GPs) faced with ever-lengthening hold periods—and the specter of zombie funds—are finding it expedient to court fellow firms as prospective buyers. It may not necessarily be to the liking of limited partners (LPs) yet SBOs do have their advantages, namely, putting dry powder to work and getting at least a moderate return. There’s been plenty of slacking on the dealmaking side already: Barely two investments were made per exit in 1H, the lowest
ratio of the decade.It’s worth noting that in 1H 2015,
SBOs and sales to strategic buyers have far and away driven the lofty exit totals. What this portends for the back half of the year is a sustained seller’s market in all likelihood, as the nonbank lending environment remains amenable, any uptick
INVESTMENTS VS. EXITS BY YEAR
in interest rates has long been anticipated or baked into terms, and corporates still boast plenty of cash. That said, there is a sense of growing caution in the marketplace; we’ve heard reports many dealmakers anticipate slowing growth over the next 12 months. 2015 could turn out to have been frontloaded after all.
MEDIAN TIME TO EXIT (YEARS)
Source: PitchBook
3.0x
3.0x
3.8x
4.1x
3.0x
2.6x
2.4x
2.3x
2.1x
1.9x
0.0x
0.5x
1.0x
1.5x
2.0x
2.5x
3.0x
3.5x
4.0x
4.5x
0
500
1,000
1,500
2,000
2,500
3,000
3,500
4,000
4,500
5,000
2006 2007 2008 2009 2010 2011 2012 2013 2014 1H 15
Investments/Exits # of Investments (excl. add-ons) # of Exits
0
1
2
3
4
5
6
7
2007 2008 2009 2010 2011 2012 2013 2014 1H 15
Corporate Acquisition IPO Secondary Buyouts
5 PITCHBOOK 2H 2015
PE EXITS & COMPANY INVENTORY
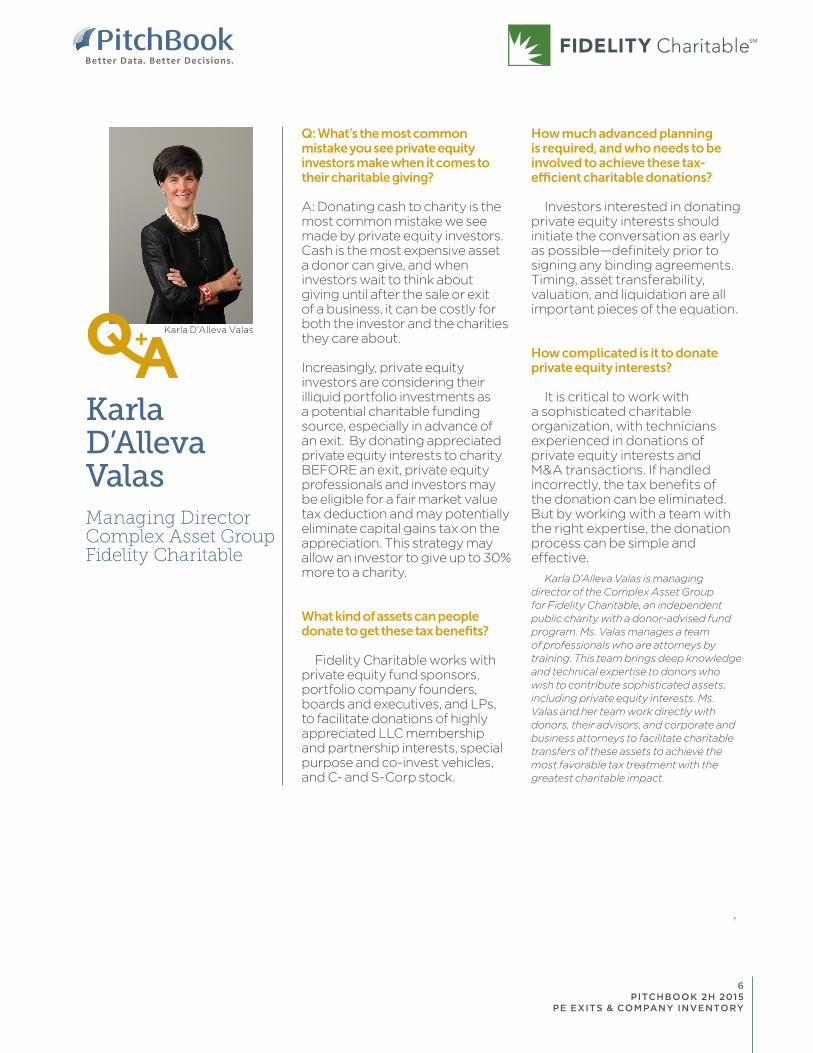
KarlaD’AllevaValas Managing DirectorComplex Asset GroupFidelity Charitable
Q: What’s the most common mistake you see private equity investors make when it comes to their charitable giving?
A: Donating cash to charity is the most common mistake we see made by private equity investors. Cash is the most expensive asset a donor can give, and when investors wait to think about giving until after the sale or exit of a business, it can be costly for both the investor and the charities they care about.
Increasingly, private equity investors are considering their illiquid portfolio investments as a potential charitable funding source, especially in advance of an exit. By donating appreciated private equity interests to charity BEFORE an exit, private equity professionals and investors may be eligible for a fair market value tax deduction and may potentially eliminate capital gains tax on the appreciation. This strategy may allow an investor to give up to 30% more to a charity.
What kind of assets can people donate to get these tax benefits?
Fidelity Charitable works with private equity fund sponsors, portfolio company founders, boards and executives, and LPs, to facilitate donations of highly appreciated LLC membership and partnership interests, special purpose and co-invest vehicles, and C- and S-Corp stock.
How much advanced planning is required, and who needs to be involved to achieve these tax-efficient charitable donations?
Investors interested in donating private equity interests should initiate the conversation as early as possible—definitely prior to signing any binding agreements. Timing, asset transferability, valuation, and liquidation are all important pieces of the equation.
How complicated is it to donate private equity interests?
It is critical to work with a sophisticated charitable organization, with technicians experienced in donations of private equity interests and M&A transactions. If handled incorrectly, the tax benefits of the donation can be eliminated. But by working with a team with the right expertise, the donation process can be simple and effective.
Karla D’Alleva Valas is managing director of the Complex Asset Group for Fidelity Charitable, an independent public charity with a donor-advised fund program. Ms. Valas manages a team of professionals who are attorneys by training. This team brings deep knowledge and technical expertise to donors who wish to contribute sophisticated assets, including private equity interests. Ms. Valas and her team work directly with donors, their advisors, and corporate and business attorneys to facilitate charitable transfers of these assets to achieve the most favorable tax treatment with the greatest charitable impact.
Karla D’Alleva Valas
6 PITCHBOOK 2H 2015
PE EXITS & COMPANY INVENTORY
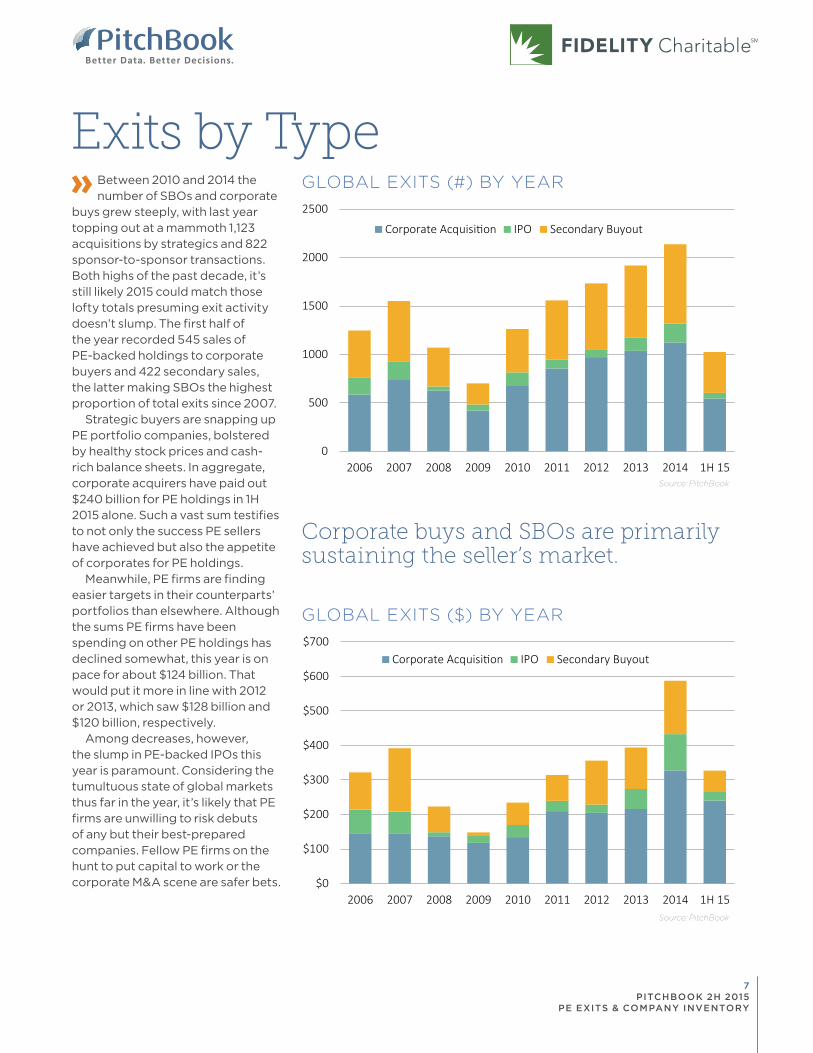
Exits by TypeGLOBAL EXITS (#) BY YEARBetween 2010 and 2014 the
number of SBOs and corporate buys grew steeply, with last year topping out at a mammoth 1,123 acquisitions by strategics and 822 sponsor-to-sponsor transactions. Both highs of the past decade, it’s still likely 2015 could match those lofty totals presuming exit activity doesn’t slump. The first half of the year recorded 545 sales of PE-backed holdings to corporate buyers and 422 secondary sales, the latter making SBOs the highest proportion of total exits since 2007.
Strategic buyers are snapping up PE portfolio companies, bolstered by healthy stock prices and cash-rich balance sheets. In aggregate, corporate acquirers have paid out $240 billion for PE holdings in 1H 2015 alone. Such a vast sum testifies to not only the success PE sellers have achieved but also the appetite of corporates for PE holdings.
Meanwhile, PE firms are finding easier targets in their counterparts’ portfolios than elsewhere. Although the sums PE firms have been spending on other PE holdings has declined somewhat, this year is on pace for about $124 billion. That would put it more in line with 2012 or 2013, which saw $128 billion and $120 billion, respectively.
Among decreases, however, the slump in PE-backed IPOs this year is paramount. Considering the tumultuous state of global markets thus far in the year, it’s likely that PE firms are unwilling to risk debuts of any but their best-prepared companies. Fellow PE firms on the hunt to put capital to work or the corporate M&A scene are safer bets.
Source: PitchBook
Source: PitchBook
0
500
1000
1500
2000
2500
2006 2007 2008 2009 2010 2011 2012 2013 2014 1H 15
Corporate Acquisition IPO Secondary Buyout
GLOBAL EXITS ($) BY YEAR
$0
$100
$200
$300
$400
$500
$600
$700
2006 2007 2008 2009 2010 2011 2012 2013 2014 1H 15
Corporate Acquisition IPO Secondary Buyout
Corporate buys and SBOs are primarily sustaining the seller’s market.
7 PITCHBOOK 2H 2015
PE EXITS & COMPANY INVENTORY
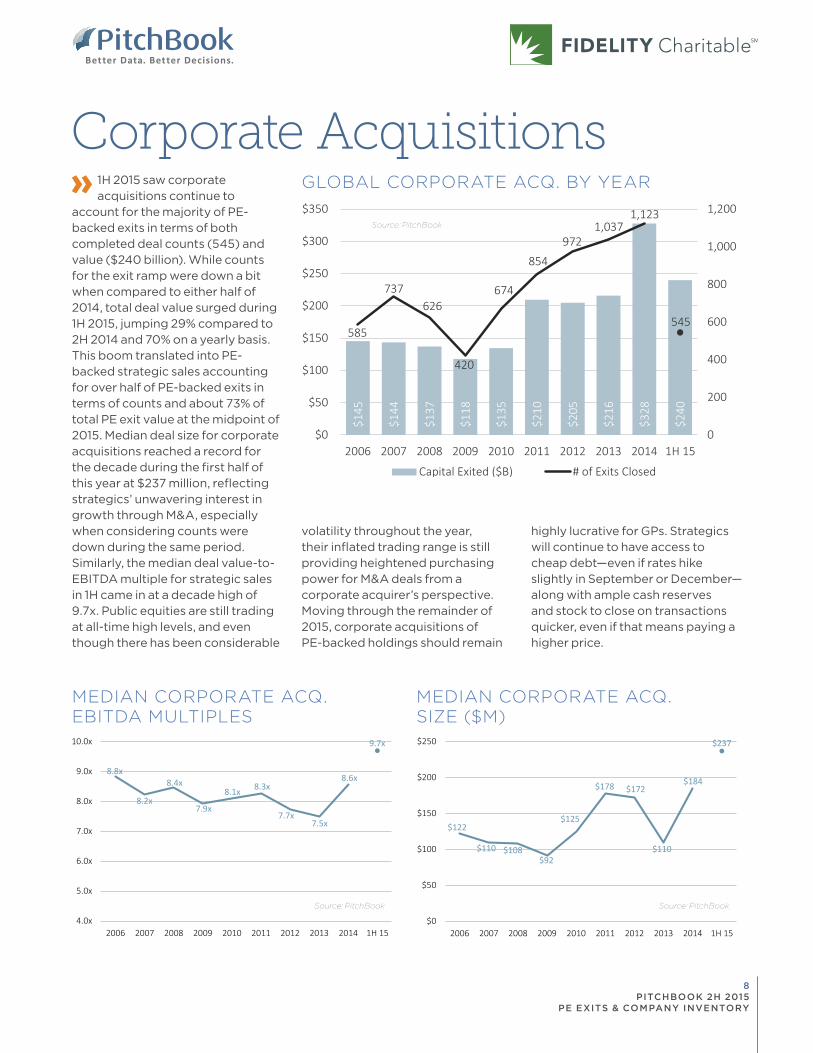
Corporate AcquisitionsGLOBAL CORPORATE ACQ. BY YEAR1H 2015 saw corporate
acquisitions continue to account for the majority of PE-backed exits in terms of both completed deal counts (545) and value ($240 billion). While counts for the exit ramp were down a bit when compared to either half of 2014, total deal value surged during 1H 2015, jumping 29% compared to 2H 2014 and 70% on a yearly basis. This boom translated into PE-backed strategic sales accounting for over half of PE-backed exits in terms of counts and about 73% of total PE exit value at the midpoint of 2015. Median deal size for corporate acquisitions reached a record for the decade during the first half of this year at $237 million, reflecting strategics’ unwavering interest in growth through M&A, especially when considering counts were down during the same period. Similarly, the median deal value-to-EBITDA multiple for strategic sales in 1H came in at a decade high of 9.7x. Public equities are still trading at all-time high levels, and even though there has been considerable
volatility throughout the year, their inflated trading range is still providing heightened purchasing power for M&A deals from a corporate acquirer’s perspective. Moving through the remainder of 2015, corporate acquisitions of PE-backed holdings should remain
highly lucrative for GPs. Strategics will continue to have access to cheap debt—even if rates hike slightly in September or December—along with ample cash reserves and stock to close on transactions quicker, even if that means paying a higher price.
MEDIAN CORPORATE ACQ. EBITDA MULTIPLES
MEDIAN CORPORATE ACQ.SIZE ($M)
Source: PitchBook
Source: PitchBook Source: PitchBook
$145
$144
$137
$118
$135
$210
$205
$216
$328
$240
585
737626
420
674
854
9721,037
1,123
545
0
200
400
600
800
1,000
1,200
$0
$50
$100
$150
$200
$250
$300
$350
2006 2007 2008 2009 2010 2011 2012 2013 2014 1H 15
Capital Exited ($B) # of Exits Closed
8.8x
8.2x
8.4x
7.9x
8.1x 8.3x
7.7x7.5x
8.6x
9.7x
4.0x
5.0x
6.0x
7.0x
8.0x
9.0x
10.0x
2006 2007 2008 2009 2010 2011 2012 2013 2014 1H 15
$122
$110 $108$92
$125
$178 $172
$110
$184
$237
$0
$50
$100
$150
$200
$250
2006 2007 2008 2009 2010 2011 2012 2013 2014 1H 15
8 PITCHBOOK 2H 2015
PE EXITS & COMPANY INVENTORY
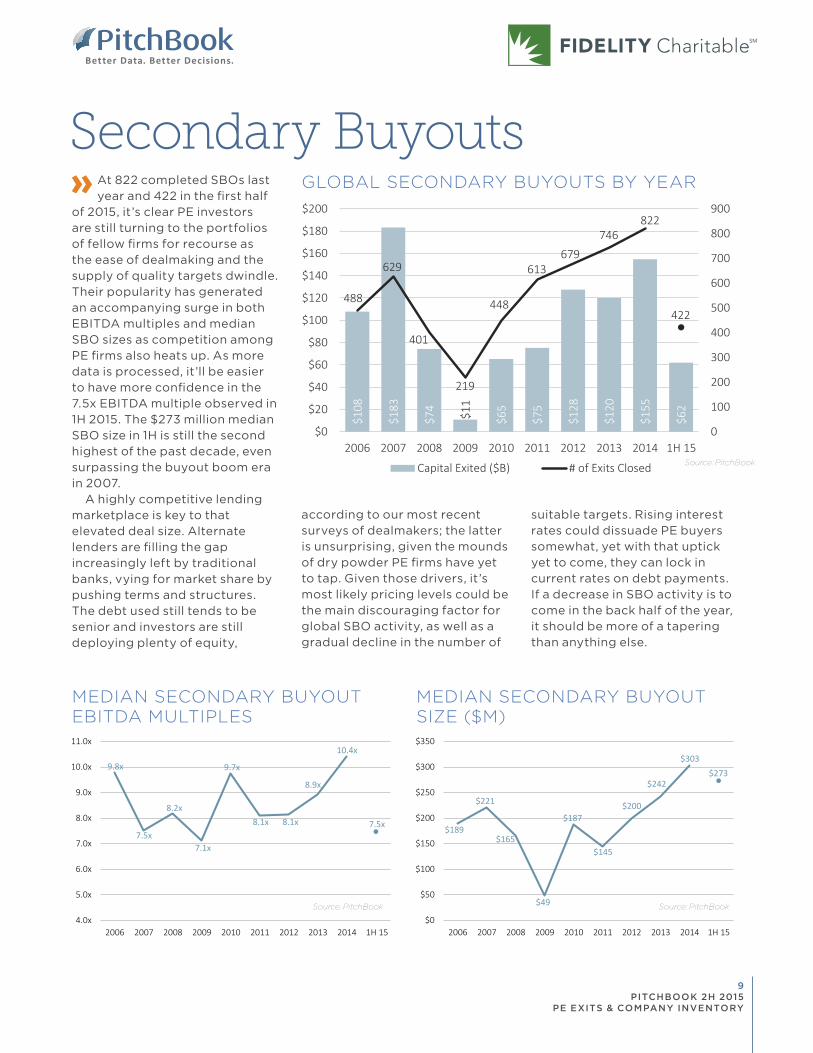
Secondary BuyoutsGLOBAL SECONDARY BUYOUTS BY YEARAt 822 completed SBOs last
year and 422 in the first half of 2015, it’s clear PE investors are still turning to the portfolios of fellow firms for recourse as the ease of dealmaking and the supply of quality targets dwindle. Their popularity has generated an accompanying surge in both EBITDA multiples and median SBO sizes as competition among PE firms also heats up. As more data is processed, it’ll be easier to have more confidence in the 7.5x EBITDA multiple observed in 1H 2015. The $273 million median SBO size in 1H is still the second highest of the past decade, even surpassing the buyout boom era in 2007.
A highly competitive lending marketplace is key to that elevated deal size. Alternate lenders are filling the gap increasingly left by traditional banks, vying for market share by pushing terms and structures. The debt used still tends to be senior and investors are still deploying plenty of equity,
according to our most recent surveys of dealmakers; the latter is unsurprising, given the mounds of dry powder PE firms have yet to tap. Given those drivers, it’s most likely pricing levels could be the main discouraging factor for global SBO activity, as well as a gradual decline in the number of
suitable targets. Rising interest rates could dissuade PE buyers somewhat, yet with that uptick yet to come, they can lock in current rates on debt payments. If a decrease in SBO activity is to come in the back half of the year, it should be more of a tapering than anything else.
MEDIAN SECONDARY BUYOUT EBITDA MULTIPLES
MEDIAN SECONDARY BUYOUT SIZE ($M)
Source: PitchBook
Source: PitchBook Source: PitchBook
$108
$183
$74
$11
$65
$75
$128
$120
$155
$62
488
629
401
219
448
613679
746822
422
0
100
200
300
400
500
600
700
800
900
$0
$20
$40
$60
$80
$100
$120
$140
$160
$180
$200
2006 2007 2008 2009 2010 2011 2012 2013 2014 1H 15
Capital Exited ($B) # of Exits Closed
9.8x
7.5x
8.2x
7.1x
9.7x
8.1x 8.1x
8.9x
10.4x
7.5x
4.0x
5.0x
6.0x
7.0x
8.0x
9.0x
10.0x
11.0x
2006 2007 2008 2009 2010 2011 2012 2013 2014 1H 15
$189
$221
$165
$49
$187
$145
$200
$242
$303$273
$0
$50
$100
$150
$200
$250
$300
$350
2006 2007 2008 2009 2010 2011 2012 2013 2014 1H 15
9 PITCHBOOK 2H 2015
PE EXITS & COMPANY INVENTORY
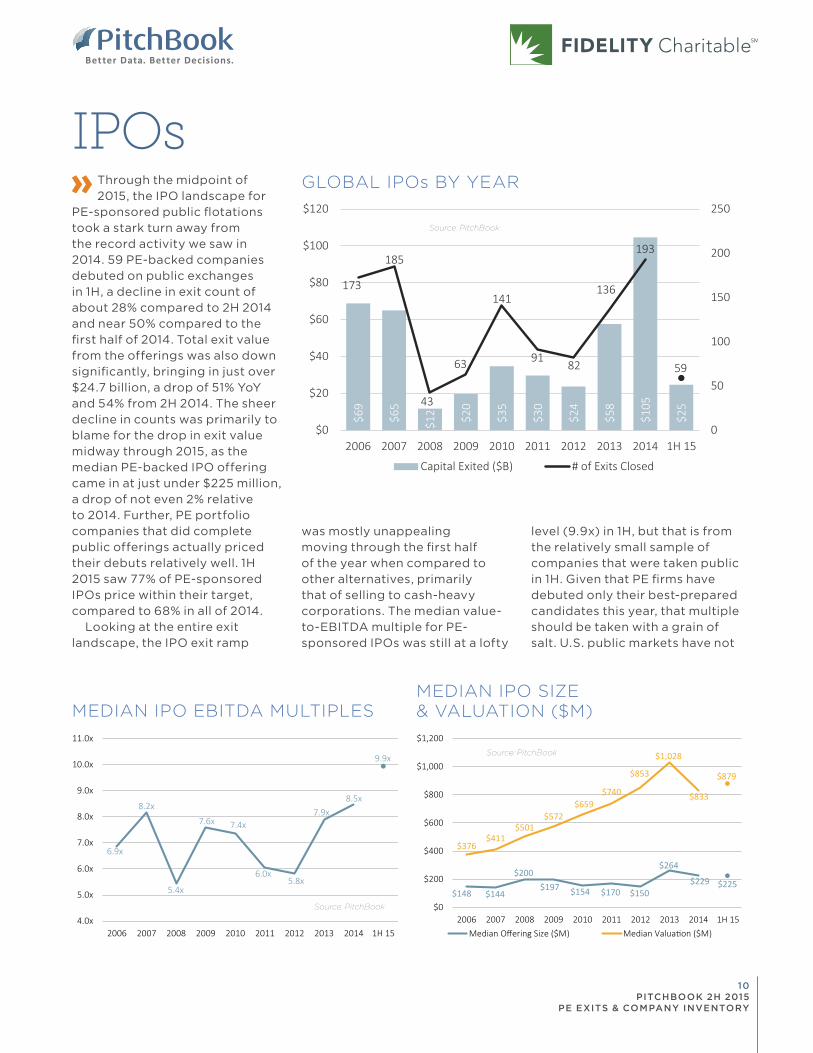
IPOsGLOBAL IPOs BY YEARThrough the midpoint of
2015, the IPO landscape for PE-sponsored public flotations took a stark turn away from the record activity we saw in 2014. 59 PE-backed companies debuted on public exchanges in 1H, a decline in exit count of about 28% compared to 2H 2014 and near 50% compared to the first half of 2014. Total exit value from the offerings was also down significantly, bringing in just over $24.7 billion, a drop of 51% YoY and 54% from 2H 2014. The sheer decline in counts was primarily to blame for the drop in exit value midway through 2015, as the median PE-backed IPO offering came in at just under $225 million, a drop of not even 2% relative to 2014. Further, PE portfolio companies that did complete public offerings actually priced their debuts relatively well. 1H 2015 saw 77% of PE-sponsored IPOs price within their target, compared to 68% in all of 2014.
Looking at the entire exit landscape, the IPO exit ramp
was mostly unappealing moving through the first half of the year when compared to other alternatives, primarily that of selling to cash-heavy corporations. The median value-to-EBITDA multiple for PE-sponsored IPOs was still at a lofty
level (9.9x) in 1H, but that is from the relatively small sample of companies that were taken public in 1H. Given that PE firms have debuted only their best-prepared candidates this year, that multiple should be taken with a grain of salt. U.S. public markets have not
MEDIAN IPO EBITDA MULTIPLESMEDIAN IPO SIZE& VALUATION ($M)
Source: PitchBook
Source: PitchBook
Source: PitchBook
$69
$65
$12 $2
0
$35
$30
$24
$58
$105
$25
173
185
43
63
141
9182
136
193
59
0
50
100
150
200
250
$0
$20
$40
$60
$80
$100
$120
2006 2007 2008 2009 2010 2011 2012 2013 2014 1H 15
Capital Exited ($B) # of Exits Closed
6.9x
8.2x
5.4x
7.6x 7.4x
6.0x5.8x
7.9x8.5x
9.9x
4.0x
5.0x
6.0x
7.0x
8.0x
9.0x
10.0x
11.0x
2006 2007 2008 2009 2010 2011 2012 2013 2014 1H 15
$148 $144
$200$197 $154 $170 $150
$264
$229 $225
$376$411
$501$572
$659$740
$853
$1,028
$833
$879
$0
$200
$400
$600
$800
$1,000
$1,200
2006 2007 2008 2009 2010 2011 2012 2013 2014 1H 15Median Offering Size ($M) Median Valuation ($M)
10 PITCHBOOK 2H 2015
PE EXITS & COMPANY INVENTORY
IPOs (contd.)
Source: PitchBook
PE % OF TOTAL IPOS
% OF PE-BACKED IPOS TO HIT OFFERING RANGE
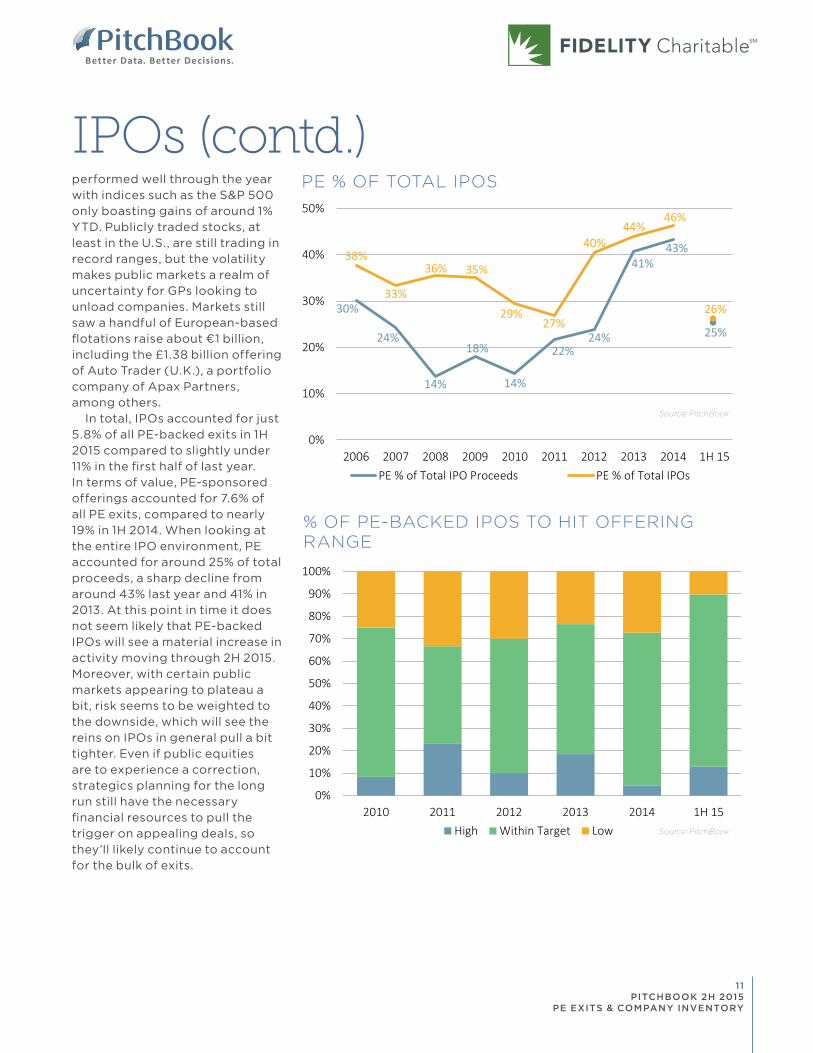
performed well through the year with indices such as the S&P 500 only boasting gains of around 1% YTD. Publicly traded stocks, at least in the U.S., are still trading in record ranges, but the volatility makes public markets a realm of uncertainty for GPs looking to unload companies. Markets still saw a handful of European-based flotations raise about ¤1 billion, including the £1.38 billion offering of Auto Trader (U.K.), a portfolio company of Apax Partners, among others.
In total, IPOs accounted for just 5.8% of all PE-backed exits in 1H 2015 compared to slightly under 11% in the first half of last year. In terms of value, PE-sponsored offerings accounted for 7.6% of all PE exits, compared to nearly 19% in 1H 2014. When looking at the entire IPO environment, PE accounted for around 25% of total proceeds, a sharp decline from around 43% last year and 41% in 2013. At this point in time it does not seem likely that PE-backed IPOs will see a material increase in activity moving through 2H 2015. Moreover, with certain public markets appearing to plateau a bit, risk seems to be weighted to the downside, which will see the reins on IPOs in general pull a bit tighter. Even if public equities are to experience a correction, strategics planning for the long run still have the necessary financial resources to pull the trigger on appealing deals, so they’ll likely continue to account for the bulk of exits.
Source: PitchBook
30%
24%
14%
18%
14%
22%24%
41%43%
25%
38%
33%
36% 35%
29%27%
40%44%
46%
26%
0%
10%
20%
30%
40%
50%
2006 2007 2008 2009 2010 2011 2012 2013 2014 1H 15PE % of Total IPO Proceeds PE % of Total IPOs
0%
10%
20%
30%
40%
50%
60%
70%
80%
90%
100%
2010 2011 2012 2013 2014 1H 15High Within Target Low
11 PITCHBOOK 2H 2015
PE EXITS & COMPANY INVENTORY
Exits by Industry
GLOBAL EXITS ($) BY INDUSTRY
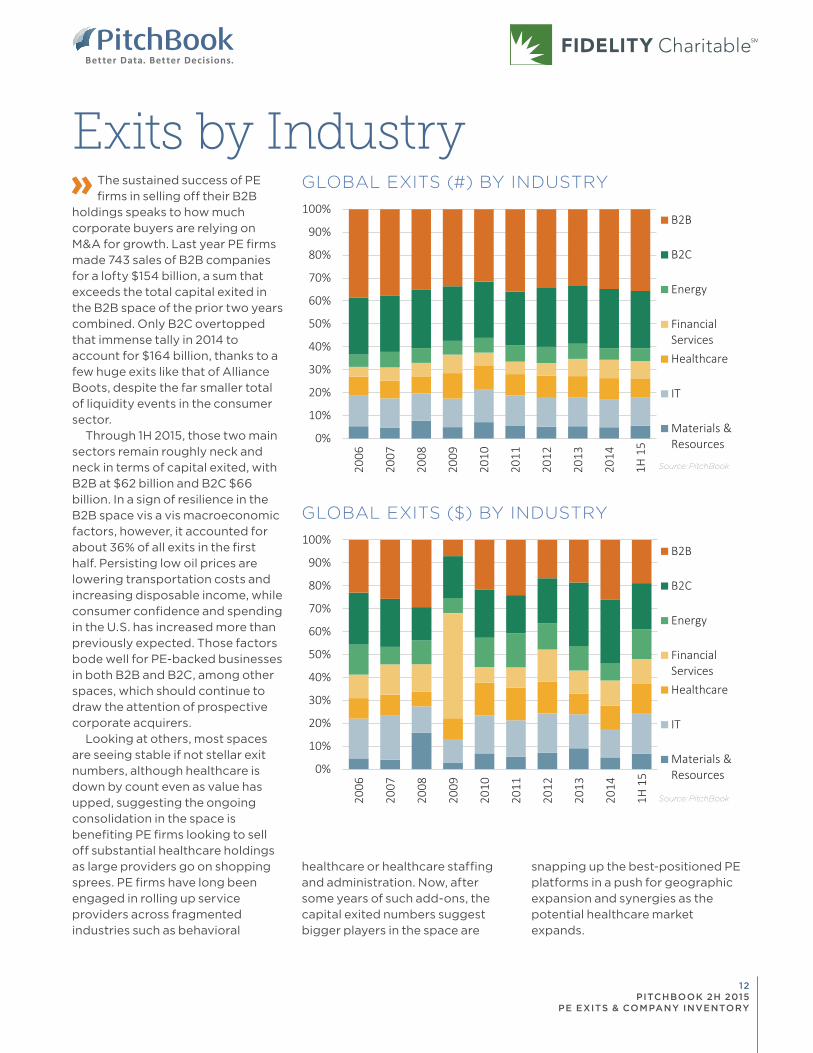
GLOBAL EXITS (#) BY INDUSTRYThe sustained success of PE firms in selling off their B2B
holdings speaks to how much corporate buyers are relying on M&A for growth. Last year PE firms made 743 sales of B2B companies for a lofty $154 billion, a sum that exceeds the total capital exited in the B2B space of the prior two years combined. Only B2C overtopped that immense tally in 2014 to account for $164 billion, thanks to a few huge exits like that of Alliance Boots, despite the far smaller total of liquidity events in the consumer sector.
Through 1H 2015, those two main sectors remain roughly neck and neck in terms of capital exited, with B2B at $62 billion and B2C $66 billion. In a sign of resilience in the B2B space vis a vis macroeconomic factors, however, it accounted for about 36% of all exits in the first half. Persisting low oil prices are lowering transportation costs and increasing disposable income, while consumer confidence and spending in the U.S. has increased more than previously expected. Those factors bode well for PE-backed businesses in both B2B and B2C, among other spaces, which should continue to draw the attention of prospective corporate acquirers.
Looking at others, most spaces are seeing stable if not stellar exit numbers, although healthcare is down by count even as value has upped, suggesting the ongoing consolidation in the space is benefiting PE firms looking to sell off substantial healthcare holdings as large providers go on shopping sprees. PE firms have long been engaged in rolling up service providers across fragmented industries such as behavioral
healthcare or healthcare staffing and administration. Now, after some years of such add-ons, the capital exited numbers suggest bigger players in the space are
snapping up the best-positioned PE platforms in a push for geographic expansion and synergies as the potential healthcare market expands.
Source: PitchBook
Source: PitchBook
0%
10%
20%
30%
40%
50%
60%
70%
80%
90%
100%
2006
2007
2008
2009
2010
2011
2012
2013
2014
1H 1
5
B2B
B2C
Energy
FinancialServicesHealthcare
IT
Materials &Resources
0%
10%
20%
30%
40%
50%
60%
70%
80%
90%
100%
2006
2007
2008
2009
2010
2011
2012
2013
2014
1H 1
5
B2B
B2C
Energy
FinancialServicesHealthcare
IT
Materials &Resources
12 PITCHBOOK 2H 2015
PE EXITS & COMPANY INVENTORY
Exits by Region
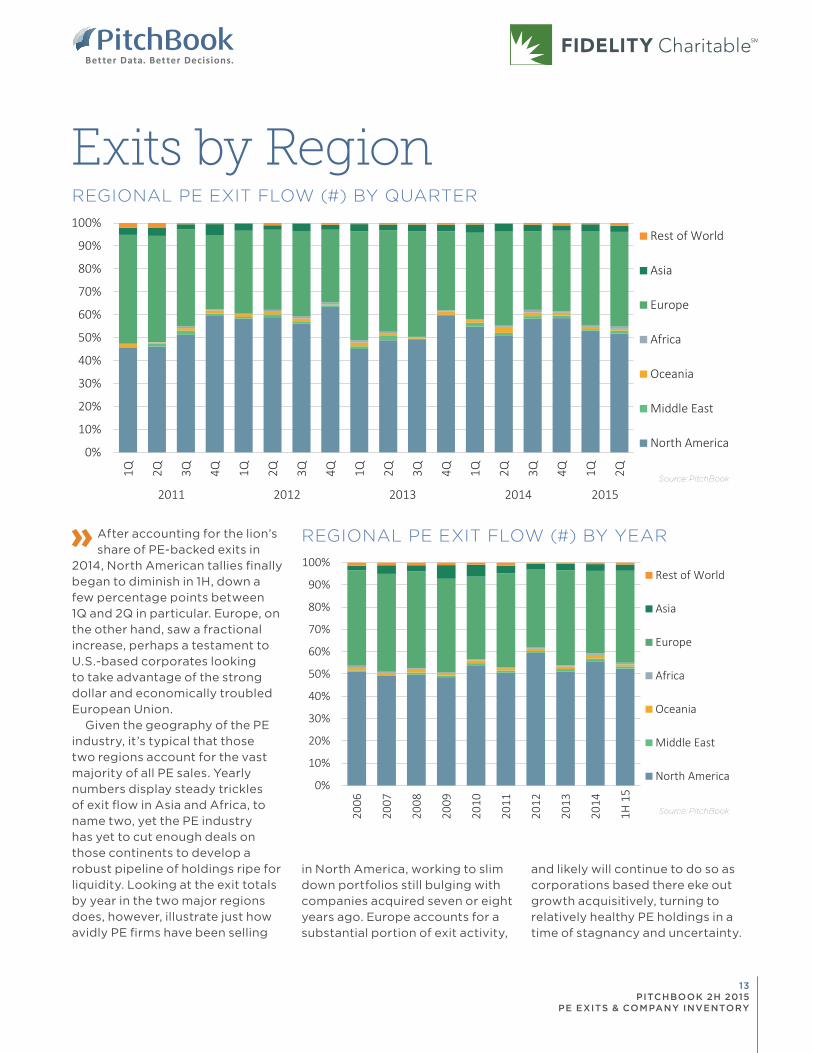
REGIONAL PE EXIT FLOW (#) BY YEARAfter accounting for the lion’s share of PE-backed exits in
2014, North American tallies finally began to diminish in 1H, down a few percentage points between 1Q and 2Q in particular. Europe, on the other hand, saw a fractional increase, perhaps a testament to U.S.-based corporates looking to take advantage of the strong dollar and economically troubled European Union.
Given the geography of the PE industry, it’s typical that those two regions account for the vast majority of all PE sales. Yearly numbers display steady trickles of exit flow in Asia and Africa, to name two, yet the PE industry has yet to cut enough deals on those continents to develop a robust pipeline of holdings ripe for liquidity. Looking at the exit totals by year in the two major regions does, however, illustrate just how avidly PE firms have been selling
Source: PitchBook
Source: PitchBook
REGIONAL PE EXIT FLOW (#) BY QUARTER
in North America, working to slim down portfolios still bulging with companies acquired seven or eight years ago. Europe accounts for a substantial portion of exit activity,
and likely will continue to do so as corporations based there eke out growth acquisitively, turning to relatively healthy PE holdings in a time of stagnancy and uncertainty.
0%
10%
20%
30%
40%
50%
60%
70%
80%
90%
100%
1Q 2Q 3Q 4Q 1Q 2Q 3Q 4Q 1Q 2Q 3Q 4Q 1Q 2Q 3Q 4Q 1Q 2Q
2011 2012 2013 2014 2015
Rest of World
Asia
Europe
Africa
Oceania
Middle East
North America
0%
10%
20%
30%
40%
50%
60%
70%
80%
90%
100%
2006
2007
2008
2009
2010
2011
2012
2013
2014
1H 1
5
Rest of World
Asia
Europe
Africa
Oceania
Middle East
North America
13 PITCHBOOK 2H 2015
PE EXITS & COMPANY INVENTORY
Company InventoryGLOBAL INVENTORY OF CURRENTLY PE-BACKED COMPANIES
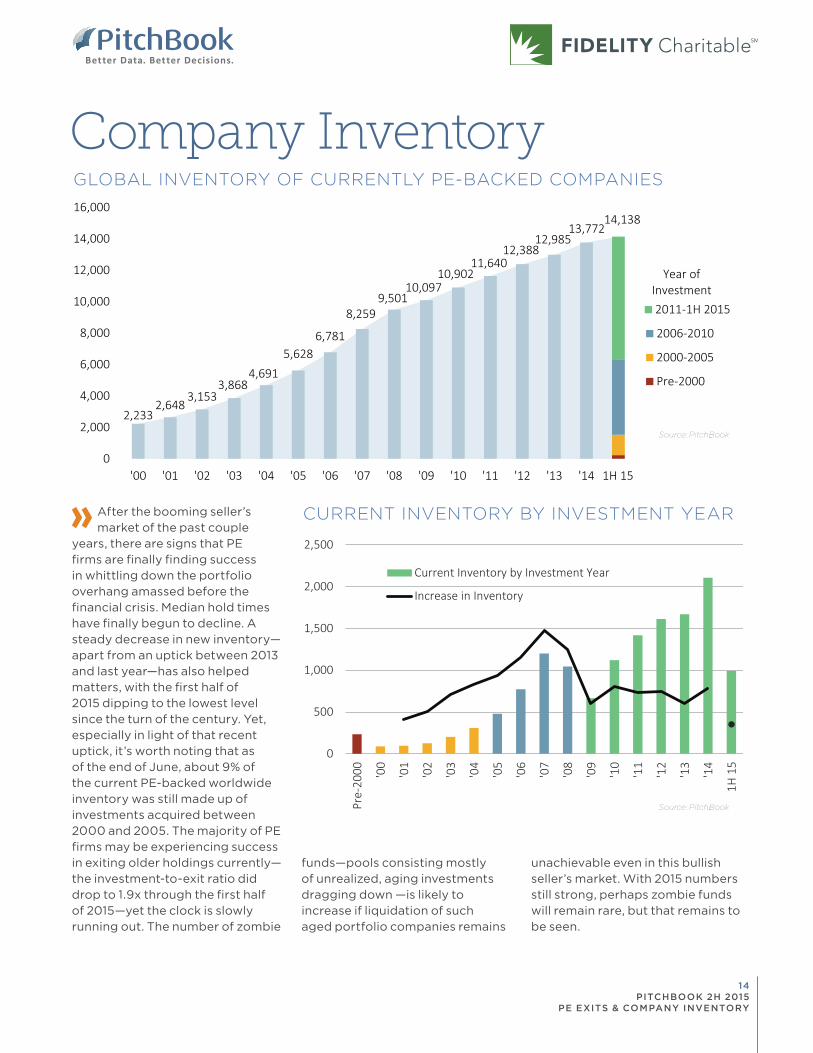
CURRENT INVENTORY BY INVESTMENT YEARAfter the booming seller’s market of the past couple
years, there are signs that PE firms are finally finding success in whittling down the portfolio overhang amassed before the financial crisis. Median hold times have finally begun to decline. A steady decrease in new inventory—apart from an uptick between 2013 and last year—has also helped matters, with the first half of 2015 dipping to the lowest level since the turn of the century. Yet, especially in light of that recent uptick, it’s worth noting that as of the end of June, about 9% of the current PE-backed worldwide inventory was still made up of investments acquired between 2000 and 2005. The majority of PE firms may be experiencing success in exiting older holdings currently—the investment-to-exit ratio did drop to 1.9x through the first half of 2015—yet the clock is slowly running out. The number of zombie
funds—pools consisting mostly of unrealized, aging investments dragging down —is likely to increase if liquidation of such aged portfolio companies remains
unachievable even in this bullish seller’s market. With 2015 numbers still strong, perhaps zombie funds will remain rare, but that remains to be seen.
Source: PitchBook
2,2332,648
3,1533,868
4,6915,628
6,781
8,2599,501
10,09710,902
11,64012,388
12,98513,772
14,138
0
2,000
4,000
6,000
8,000
10,000
12,000
14,000
16,000
'00 '01 '02 '03 '04 '05 '06 '07 '08 '09 '10 '11 '12 '13 '14 1H 15
2011-1H 2015
2006-2010
2000-2005
Pre-2000
Year of Investment
Source: PitchBook
0
500
1,000
1,500
2,000
2,500
Pre-
2000 '0
0
'01
'02
'03
'04
'05
'06
'07
'08
'09
'10
'11
'12
'13
'14
1H 1
5
Current Inventory by Investment Year
Increase in Inventory
Source: PitchBook
14 PITCHBOOK 2H 2015
PE EXITS & COMPANY INVENTORY
Search companies, firms, or people... Live Chat
DASHBOARD COMPANIES & DEALS INVESTORS & BUYERS FUNDS & IRR LIMITED PARTNERS ADVISORS PEOPLE PUBLIC FINANCIALS CRM MORE
CAPITAL INVESTED & DEAL COUNT DEALS BY REGIONS
SEARCH RESULTS
SAVED SEARCHES
Europe League Table 40,672
Funds w/ Dry Powder 12,948
Open Funds 89
Recent IT Deals 51,176
500 Startups 114,382
NEWS & LIBRARY
Katzen Eye Group Goes Varsity
Energy
VCs Doing Better Than Ever
PE Breakdown
European Activity Highlights
2010 Vintage Buyout Funds
Top Exits by Industry
Brightside Acquisition AnaCap’d
Super Uber Round
Meritech Closes $500M Fund
Limited Partners
2,716 LP’s
Limited Partners Name (2,716)# Limited Partner Type # Affiliated Funds
# Affiliated Investors
1
2
3
4
5
6
7
8
9
10
11
12
13
New York State Common Retirement Fund
Pennsylvania State Employee’s Retirement S...Pennsylvania Public School Employee Retire...
Bell Atlantic Master Trust
Teachers Insurance and Annuity Assocation...
Massachusetts Pendon Reserves Investment...
Metropolitan Life Insurance
New York State Teachers Retirement System
Metlife Insurance Company of ConnecticutMassachusetts Mutual Life Insurance Company
China Insurance Company
Public Pension Fund
Public Pension Fund
Public Pension Fund
Corporate Pension
Insurance Company
Public Pension Fund
Insurance CompanyPublic Pension Fund
Insurance Company
Insurance Company
Public Pension Fund
594502
348333
328313
312308
304
274373
Download SalesforceDeselect All
Select Top 25
Select Page
Select All
Invert Selected
Show Selected Only
Remove Selected
New York State Teachers Retirement System Public Pension Fund 308
Bell Atlantic Master Trust Corporate Pension 333
AUM Private Equity
Private Equity (%) HQ Location HQ Ph
312192
158157
169136
185126
212
163147
Add Column
176,200.00
25,900.00
50,500.00103.35
178.50
59,700.00
516,206.00104,300.00
405,900.00
24,700.00181,980.00
13,919.80
25,900.00
8,040.00103.35
178.50
5,916.00
516,206.007,800.00
405,900.00
24,700.0018,371.00
8%
12%22%17%
42%
12%
7%8%
4.5%
7.3%10%
Albany, NY
Harrisburg, PA
Harrisburg, PA
Basking Ridge, NJ
New York, NY
Boston, MA
New York, NYAlbany, NY
Bloomfield, Ct
Springfield, MA
Quebec, Canada
Layouts:
LP Summary Layout Save Save As
126 104,300.00 7,800.00 8% Albany, NY
157 103.35 103.35 17% Basking Ridge, NJ
COMPANY SIGNALS
LiquidPlanner Seattle, WashingtonBusiness/ Productivity Software... -
Series BLast Inv. Type
May-2014Last Inv. Date
4Investor
Growth RateSize Multiple
45People
$24.32MVal. May 2014
Company Name
The Stiller
Bonobos
Growth Rate
10.2%
19.65%
Size Multiple
1.32K
150K
Total Capital Invested (millions, USD) Deal Count
2003 2004 2005 2006 2007 2008 2009 2010 2011 2012 2013 2014
2.73xx avg.
76th %ile
115%98th %ile
weekly
DON’T LET INCOMPLETE DATA LEAVE YOU
IN THE DARKPitchBook offers more visibility into exit trends than any other source
Contact us for a demo of the financial
information technology trusted by leading
investors, companies and advisors
pitchbook.com | US + 1 206.623.1986 | UK +44 (0) 207.190.9809
Bet ter Data. Bet ter Decisions.PitchBook
Companies & Deals
Service Providers
Valuations & Multiples
InvestorsFunds & Performance
FinancialsLimited Partners
People
Related Documents