Bayesian Variable Selection and Data Integration for Biological Regulatory Networks Shane T. Jensen Department of Statistics The Wharton School, University of Pennsylvania [email protected] Gary Chen and Christian Stoeckert, Jr Department of Bioengineering and Department of Genetics University of Pennsylvania Shane T. Jensen 1 March 5, 2008

Welcome message from author
This document is posted to help you gain knowledge. Please leave a comment to let me know what you think about it! Share it to your friends and learn new things together.
Transcript

Bayesian Variable Selection andData Integration for Biological
Regulatory Networks
Shane T. Jensen
Department of Statistics
The Wharton School, University of Pennsylvania
Gary Chen and Christian Stoeckert, Jr
Department of Bioengineering and Department of Genetics
University of Pennsylvania
Shane T. Jensen 1 March 5, 2008

Motivation• Genes are long sequences of DNA that are transcribed to
eventually become a protein
• Near-identical genetic material can lead to many di!erent
cell types and species
• A critical aspect of cellular function is how genes are
regulated and which genes are regulated together
Shane T. Jensen 2 March 5, 2008

Gene Regulatory Networks
• Genes are regulated by transcription factor (TF) proteins
that bind directly to the DNA sequence near to a gene
• The bound protein a!ects the amount of transcription,
thereby a!ecting the amount of protein produced
• The collection of TFs and their target genes is often called
the gene regulatory network
– Goal is to elucidate regulatory network: which genes are
targeted for regulation by a particuler TF?
Shane T. Jensen 3 March 5, 2008

Di!erent Data Types
• Gene expression data: microarray chips used amounts of
mRNA present for each gene across many conditions
• ChIP binding data: antibodies used to identify areas of
genome physically bound by a particular TF
• Promoter element data: binding sites for a TF discovered
by a sequence search algorithm
Shane T. Jensen 4 March 5, 2008

Gene Expression Data
• Gene expression: measure of whether gene is turned on or
turned o! at a specific time
• Genes with similar expres-
sion across time or in dif-
ferent conditions may be co-
regulated
• Detect groups of genes that have correlated gene
expression across many conditions
Shane T. Jensen 5 March 5, 2008

ChIP Binding Data
• Chromatin Immunoprecipitation Experiments
• Antibodies used to pull out
parts of genomic sequence
that are physically bound to
a particular TF
• Genes in close proximity to a TF binding site are possibly
regulatory targets of that TF
Shane T. Jensen 6 March 5, 2008

Promoter Element Data
• Some known promoter elements: the set of sequence
binding sites recognized by a particular TF
• Promoter elements highly conserved but not identical:
A 0.05 0.02 0.85 0.02 0.21 0.06
C 0.04 0.02 0.03 0.93 0.05 0.06
G 0.06 0.94 0.06 0.04 0.70 0.11
T 0.85 0.02 0.06 0.01 0.04 0.77
!"
atgacgtctagcatcgaaatcgacgacgatcgacgactagctactctacgatcg
aaaacatcgattgacgtttggtcgtaactttggcacgatcagcgatcgatcact
aacagctatgacgtcgaaatcgaacatcgagacggacggcaacgtctacgatcg
aaaacatcagctagcagcactagctaggattgacgtttggtcgtaactttggct
aattatgctacgtgacgtacacgtacgtgacggactaagtcagctagcgtagct
aattatgctacgtacgcggctcgctacactgacggagcatcaggtatttgacgt
aaaaggcatcagctagcagcactagctaggtgacctggtcgtaactttggct
aattatgctacgtggcgtacacgtacgtgacggactaagtcagctagcgtagct
• Matrix used to scan genomic sequences for putative
promoter elements, which are then used to predict
regulated genes
Shane T. Jensen 7 March 5, 2008
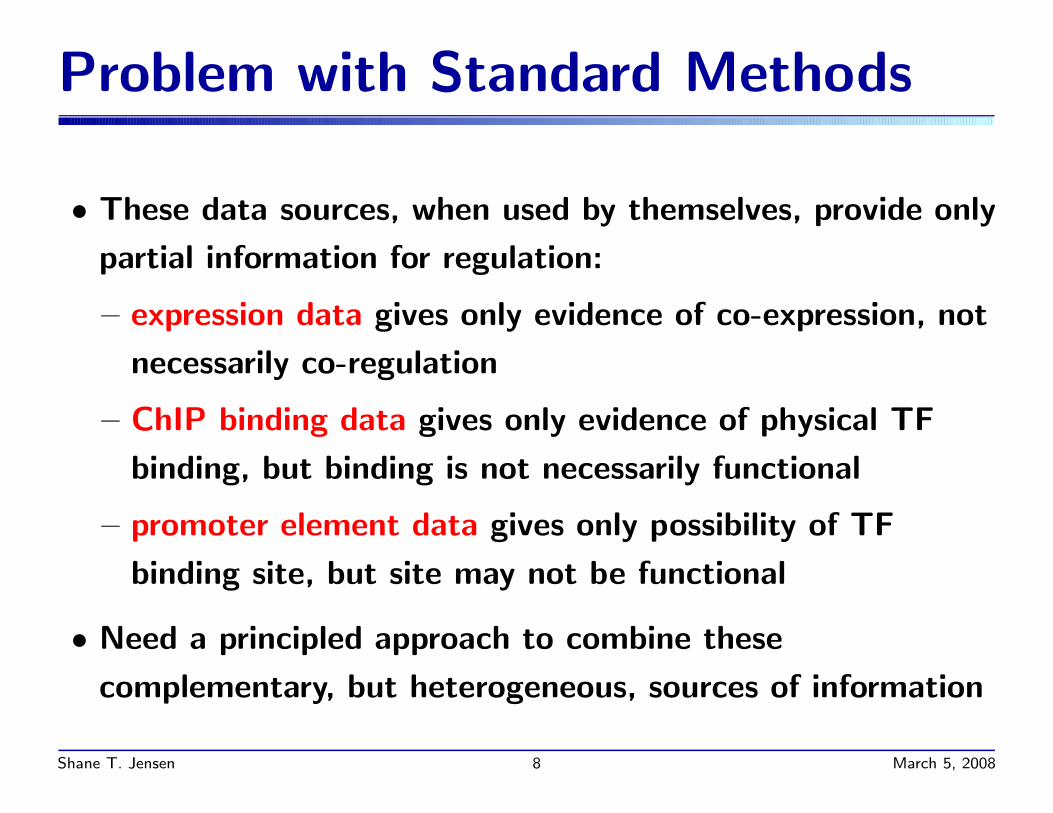
Problem with Standard Methods
• These data sources, when used by themselves, provide only
partial information for regulation:
– expression data gives only evidence of co-expression, not
necessarily co-regulation
– ChIP binding data gives only evidence of physical TF
binding, but binding is not necessarily functional
– promoter element data gives only possibility of TF
binding site, but site may not be functional
• Need a principled approach to combine these
complementary, but heterogeneous, sources of information
Shane T. Jensen 8 March 5, 2008

Available Data
• Data: expression, ChIP binding, and promoter element
data for 106 TFs in Yeast
• gene expression data across T di!erent experiments
git = log-expression of gene i in experiment t
fjt = log-expression of TF j in experiment t
• ChIP binding data for each gene i and TF j
bij = probability that TF j physically binds near gene i
• promoter element data for each gene i and TF j
mij = probability that gene i has a binding site for TF j
Shane T. Jensen 9 March 5, 2008

Regulatory Indicators
• Regulatory network is formulated as unknown indicators:
Cij = 1 if gene i is actually regulated by TF j
Cij = 0 otherwise
• These Cij variables give the edges that connect TFs and
their target genes on a regulatory graph
• C will be inferred using a Bayesian hierarchical model
– principled framework for combining heterogeneous data
sources by using informed prior distributions
Shane T. Jensen 10 March 5, 2008

Likelihood Model
• First model level involves target gene expression git as a
linear function of TF expression:
git = !i +!
j
"j · Cij · fjt + #it
• Error term is normally distributed: #it # Normal(0, $2)
• Regulation indicators Cij perform variable selection : only
TFs j with Cij = 1 involved in expression of target gene i
• Biological reality: often the simultaneous action of multiple
TFs are needed to change target gene expression
Shane T. Jensen 11 March 5, 2008
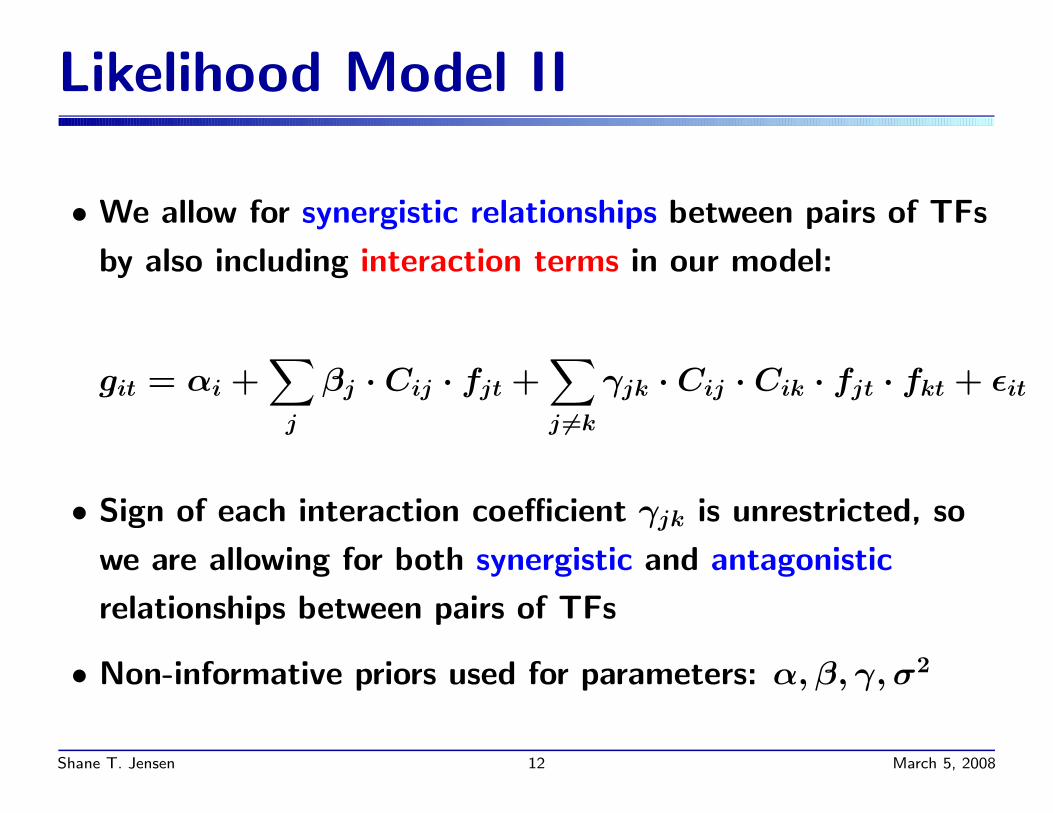
Likelihood Model II
• We allow for synergistic relationships between pairs of TFs
by also including interaction terms in our model:
git = !i +!
j
"j · Cij · fjt +!
j $=k
%jk · Cij · Cik · fjt · fkt + #it
• Sign of each interaction coe"cient %jk is unrestricted, so
we are allowing for both synergistic and antagonistic
relationships between pairs of TFs
• Non-informative priors used for parameters: !, ", %, $2
Shane T. Jensen 12 March 5, 2008
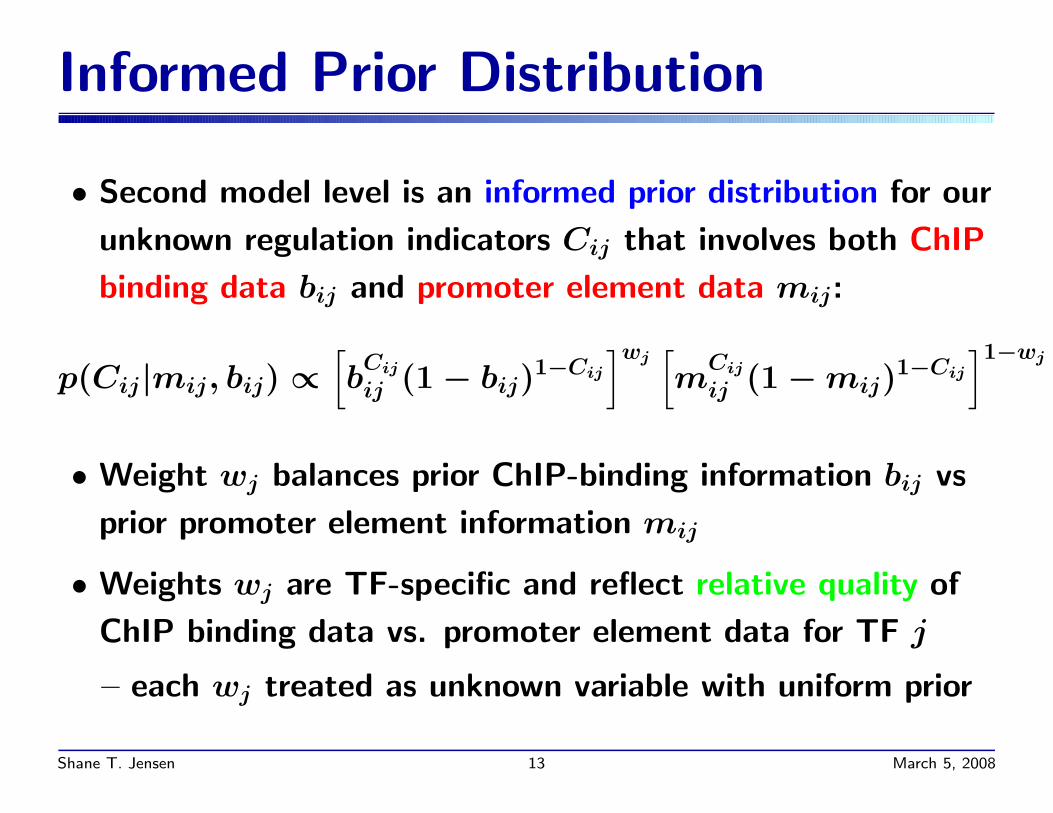
Informed Prior Distribution
• Second model level is an informed prior distribution for our
unknown regulation indicators Cij that involves both ChIP
binding data bij and promoter element data mij:
p(Cij|mij, bij) %"
bCij
ij (1 ! bij)1!Cij
#wj"
mCij
ij (1 ! mij)1!Cij
#1!wj
• Weight wj balances prior ChIP-binding information bij vs
prior promoter element information mij
• Weights wj are TF-specific and reflect relative quality of
ChIP binding data vs. promoter element data for TF j
– each wj treated as unknown variable with uniform prior
Shane T. Jensen 13 March 5, 2008
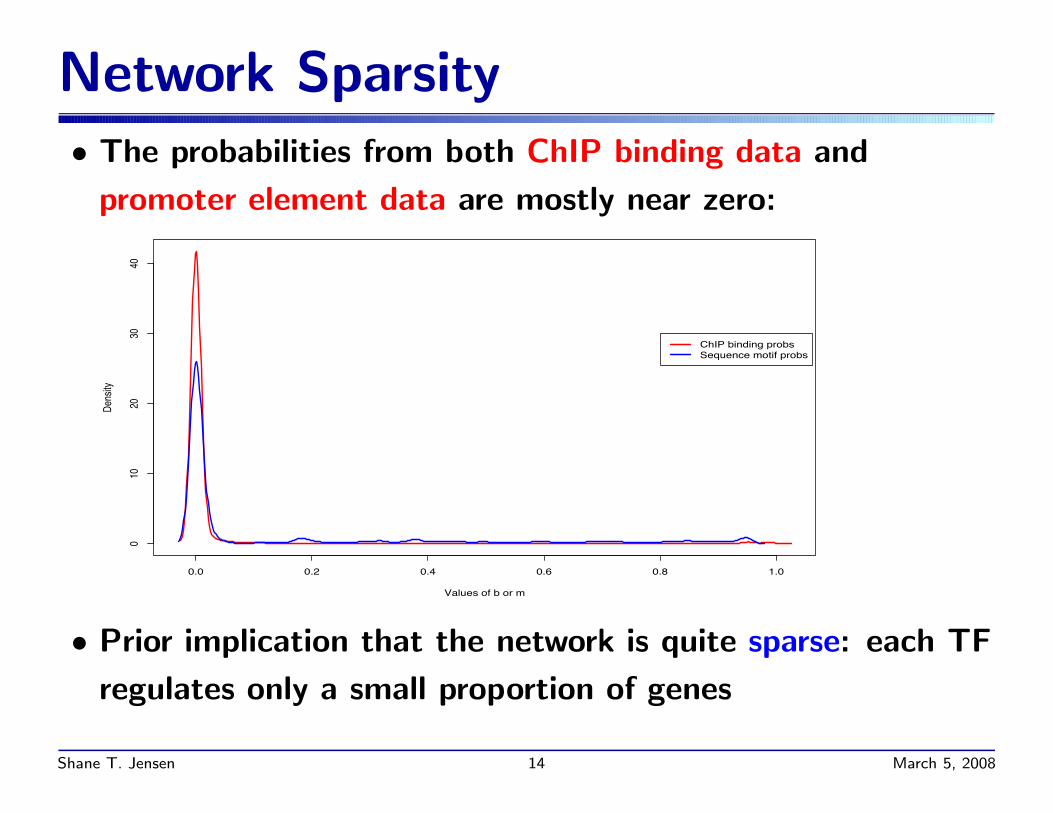
Network Sparsity• The probabilities from both ChIP binding data and
promoter element data are mostly near zero:
0.0 0.2 0.4 0.6 0.8 1.0
010
2030
40
Values of b or m
Dens
ity
ChIP binding probsSequence motif probs
• Prior implication that the network is quite sparse: each TF
regulates only a small proportion of genes
Shane T. Jensen 14 March 5, 2008

Implementation
• Get draws from joint posterior distribution using a Gibbs
sampling strategy.
1. Sampling !, ", %, $2 given C, w, g, f , b, m
• standard random e!ects model
2. Sampling each Cij given !, ", %, $2, w, g, f , b, m
• easy 0-1 posterior probability calculation for each Cij
3. Sampling each wj given C, !, ", %, $2, g, f , b, m
• grid sampler over the (0,1) range
Shane T. Jensen 15 March 5, 2008
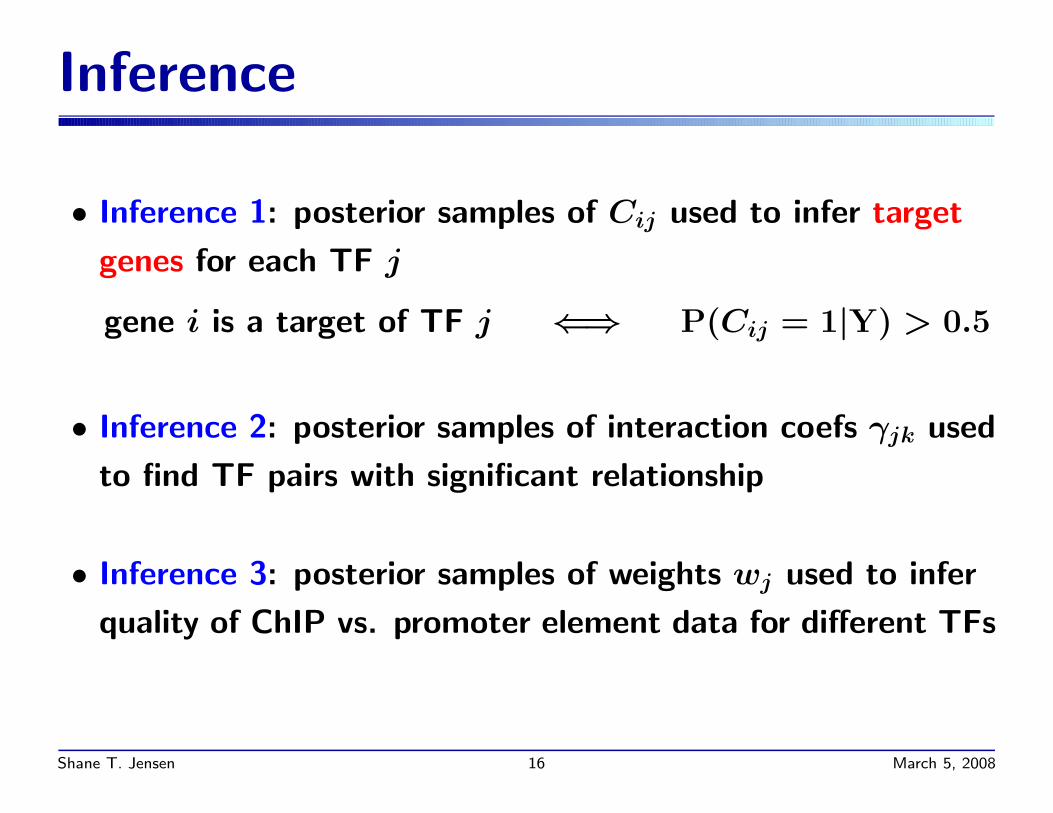
Inference
• Inference 1: posterior samples of Cij used to infer target
genes for each TF j
gene i is a target of TF j &' P(Cij = 1|Y) > 0.5
• Inference 2: posterior samples of interaction coefs %jk used
to find TF pairs with significant relationship
• Inference 3: posterior samples of weights wj used to infer
quality of ChIP vs. promoter element data for di!erent TFs
Shane T. Jensen 16 March 5, 2008

Comparison of Predictions
• Primary goal is prediction of target genes based on
estimated posterior probability P(Cij = 1|Y) > 0.5
• Can compare to several other current approaches:
1. MA-Networker: Gao et.al. 2004
2. GRAM: Bar-Joseph et.al. 2003
3. ReMoDiscovery: Lemmens et.al. 2006
• Two external measures used for validation
1. similarity of MIPS functions between target genes
2. response of target genes to TF knockout
Shane T. Jensen 17 March 5, 2008
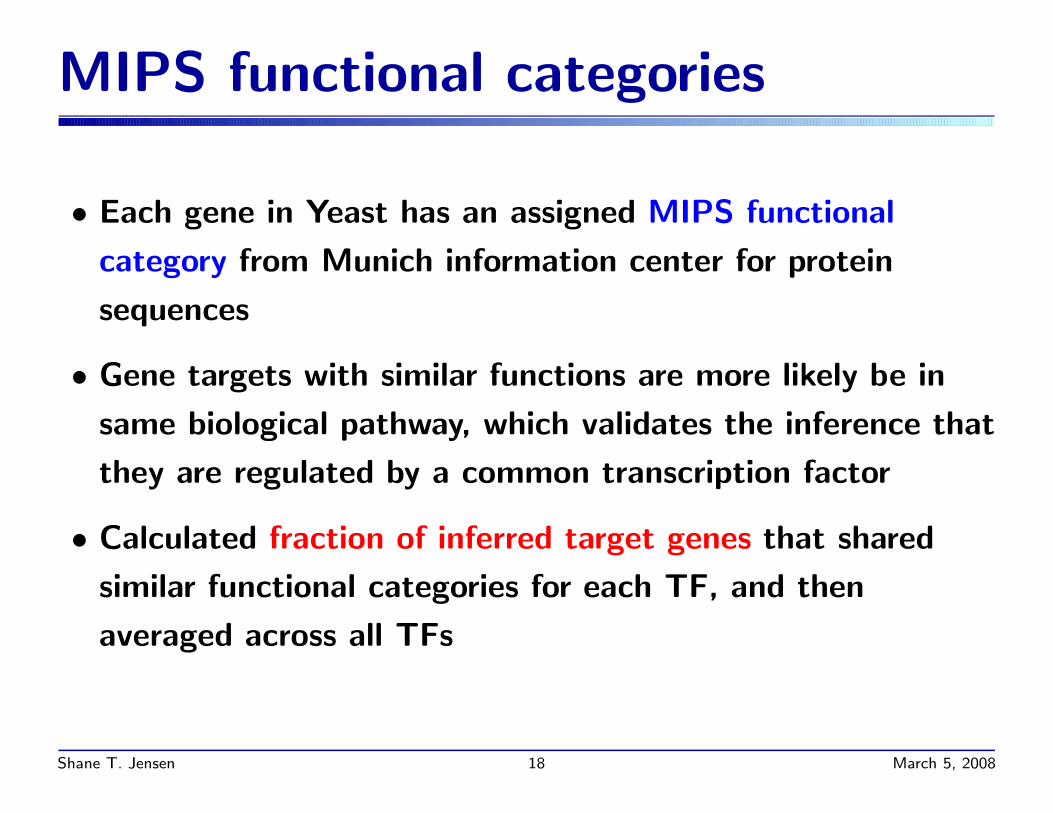
MIPS functional categories
• Each gene in Yeast has an assigned MIPS functional
category from Munich information center for protein
sequences
• Gene targets with similar functions are more likely be in
same biological pathway, which validates the inference that
they are regulated by a common transcription factor
• Calculated fraction of inferred target genes that shared
similar functional categories for each TF, and then
averaged across all TFs
Shane T. Jensen 18 March 5, 2008

Fraction of Target Genes with Similar Functional Category
All 3 Exp+ChIP Exp Only MA−Networker GRAM ReMoDiscovery Binding Expression
0.00.1
0.20.3
0.40.5
Thresholded DataPrevious MethodsOur Model
• Gene targets from our full model have slightly higher
functional similarity than other methods
• All integration methods better than single data source
Shane T. Jensen 19 March 5, 2008
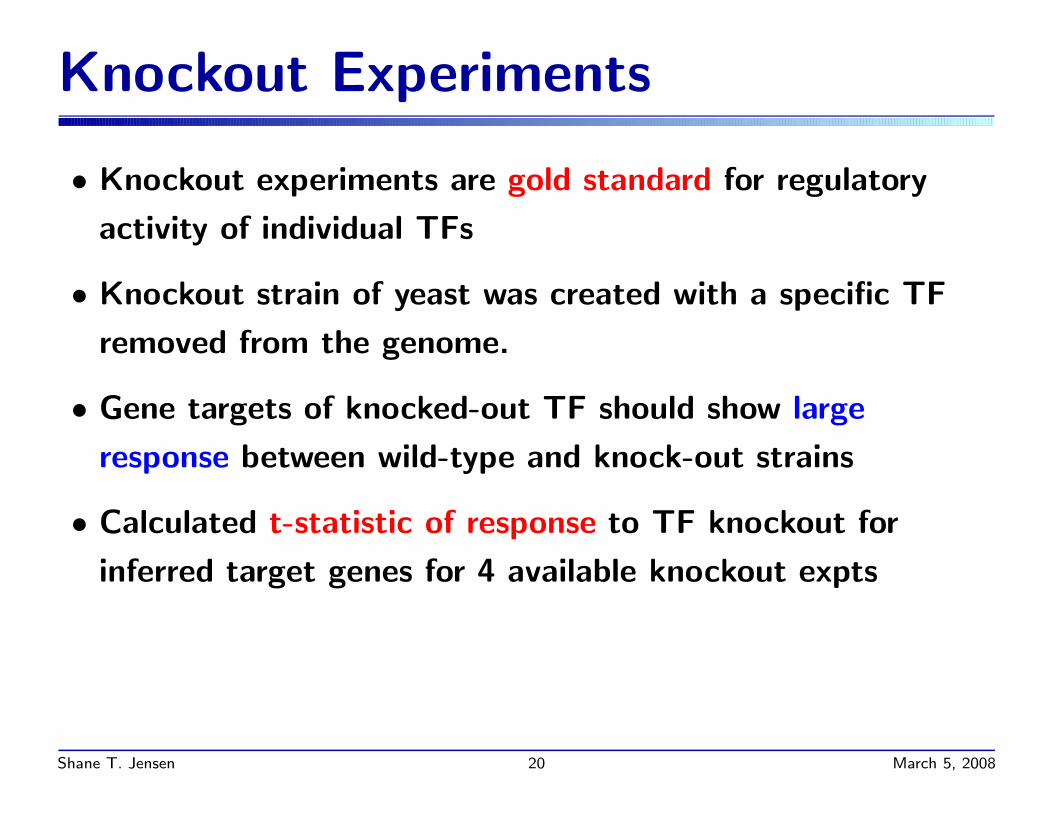
Knockout Experiments
• Knockout experiments are gold standard for regulatory
activity of individual TFs
• Knockout strain of yeast was created with a specific TF
removed from the genome.
• Gene targets of knocked-out TF should show large
response between wild-type and knock-out strains
• Calculated t-statistic of response to TF knockout for
inferred target genes for 4 available knockout expts
Shane T. Jensen 20 March 5, 2008

T-statistic for Knockout Response
All 3 ExpChIP Exp MANet GRAM ReMo Bind Exp
02
46
8
GCN4 knockout experiment
8.13 8.38
4.2
7.3
3.81
7.21
3.73
0.1
ThresholdedData
Previous MethodsOur Model
All 3 ExpChIP Exp MANet GRAM ReMo Bind Exp
01
23
45
67
SWI4 knockout experiment
5.56 5.52
1.45
4.794.4
0.35
1.3
2.36
ThresholdedData
Previous MethodsOur Model
All 3 ExpChIP Exp MANet GRAM ReMo Bind Exp
01
23
45
YAP1 knockout experiment
3.773.3
0.02
2.11
0.65
1.30.87
1.67
ThresholdedData
Previous MethodsOur Model
All 3 ExpChIP Exp MANet GRAM ReMo Bind Exp0
12
34
5
SWI5 knockout experiment
3.24
3.95
1.75
3.04
0.58
2.5
1.83
0.1
ThresholdedData
Previous MethodsOur Model
• Our gene targets show greater response to TF knockout
across all 4 knockout experiments
Shane T. Jensen 21 March 5, 2008

Inference for Weight Variables• Posterior distributions of wj variables for same 39 TFs:
ABF1
ACE2
BAS1
CAD1
CBF1
FKH1
FKH2
GAL4
GCN4
GCR1
GCR2
HAP2
HAP3
HAP4
HSF1
INO2
LEU3
MBP1
MCM1
MET3
1MS
N4ND
D1PD
R1PH
O4PU
T3RA
P1RC
S1RE
B1RL
M11
RME1
ROX1
SKN7
SMP1
STB1
STE1
2SW
I4SW
I5SW
I6YA
P1
0.20.4
0.60.8
1.0
K K K K
• Centered substantially higher than 0.5: suggests that ChIP
binding data is generally superior to promoter element data
Shane T. Jensen 22 March 5, 2008
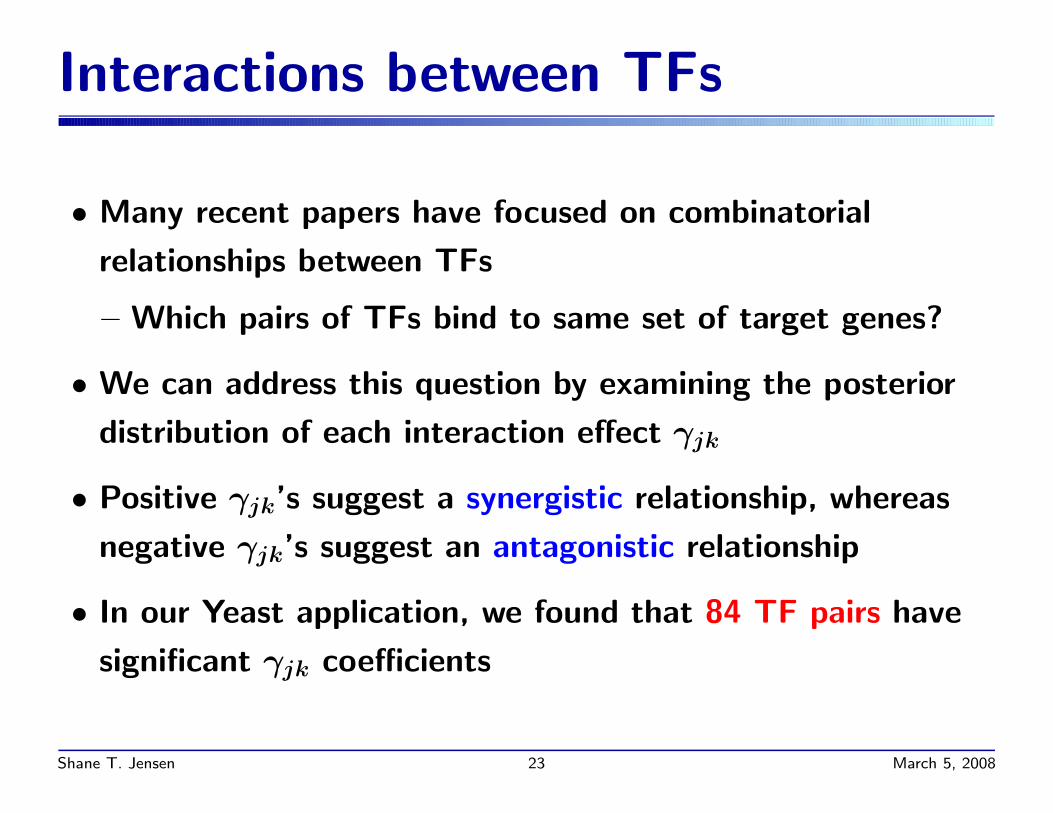
Interactions between TFs
• Many recent papers have focused on combinatorial
relationships between TFs
– Which pairs of TFs bind to same set of target genes?
• We can address this question by examining the posterior
distribution of each interaction e!ect %jk
• Positive %jk’s suggest a synergistic relationship, whereas
negative %jk’s suggest an antagonistic relationship
• In our Yeast application, we found that 84 TF pairs have
significant %jk coe"cients
Shane T. Jensen 23 March 5, 2008

Interactions between TFs
• Many predicted interactions are known and involved in
several important pathways
• Nodes = TFs and edges = significant interactions
Shane T. Jensen 24 March 5, 2008

Mouse Application
• Also applied our model to one Mouse TF, C/EBP-", which
has all three data types available
• We identified 14/16 validated C/EBP-" targets
– More targets missed when using only single data source
• Our model also potentially reduces false positives:
– we predict 38 target genes compared to 72 predicted
from expression data alone or 779 from ChIP data alone
• Estimated weight of w = 0.92 for favoring ChIP binding
data over promoter element data
– promoter element data useful in some instances, but
generally less discriminative power than ChIP data
Shane T. Jensen 25 March 5, 2008
Summary
• Combining multiple data sources (expression, ChIP binding
and promoter element data) leads to improved predictions
• Bayesian hierarchical model is a natural framework for
integrating heterogenous data sources
– Most Bayesian variable selection approaches use
non-informative priors for selection indicators
– Our approach uses informed priors for our selection
indicators based on addditional data sources
Shane T. Jensen 26 March 5, 2008

Summary II
• Fully probabilistic approach: no reliance pre-clustering of
data or dependence on arbitrary parameter cuto!s
• Flexibility for genes to belong to multiple regulatory
clusters and pairs of transcription factors to interact
• Variable weight methodology achieves appropriate balance
of priors: we confirm common belief that promoter
element data is less reliable, but useful in some cases
Shane T. Jensen 27 March 5, 2008

References
• Chen, G., Jensen, S.T. and Stoeckert, C. (2007).
"Clustering of Genes into Regulons using Integrated
Modeling." Genome Biology 8:R4
• Jensen, S.T., Chen, G., and Stoeckert, C. (2007).
"Bayesian Variable Selection and Data Integration
for Biological Regulatory Networks." Annals of
Applied Statistics 1: 612-633.
Shane T. Jensen 28 March 5, 2008
Related Documents


![rKS - mof.go.jp · Â&ö lí *ñ d'¼_ D Ø@ 5 GI G\\^~rKS D Ø _>8Zc #'/ D Ø W[c *ñ d\KZ1 I Z8^8 `0d *ñ ¦ '¼@ 2 V_ )*(YE} G\\^~rM G _ 8 Ê]ví Ê*ñZ - | D Øb% $× lg `0d *ñ](https://static.cupdf.com/doc/110x72/5cacf05f88c99392198d2fe6/rks-mofgojp-aoe-li-n-d-d-o-5-gi-grks-d-o-8zc-d-o.jpg)