Anatomy, ultrastructure and lignin distribution of stone cells in two Pyrus species Shutian Tao a , Shahrokh Khanizadeh b , Hua Zhang a , Shaoling Zhang a, * a Pear Engineering Research Centre, College of Horticulture, Nanjing Agricultural University, 1 Weigang, Nanjing, Jiangsu Province 210095, PR China b Horticultural Research and Development Centre, Agriculture and Agri-Food Canada, 430 Gouin Boulevard, Saint Jean sur Richelieu, Quebec J3B 3E6, Canada 1. Introduction Lignin is a polymer derived from the dehydrogenative poly- merization of three different monolignols—p-coumaryl alcohol, conferyl alcohol and sinapyl alcohol. Lignin is widely distributed in plant cell walls and confers strength, rigidity and impermeability. In some plants with extreme needs for both structural support and water transport, e.g. terrestrial trees, lignin makes up 15–36% of the dry weight of the wood. Lignin is therefore one of the world’s most abundant natural polymers, along with cellulose. In addition, it plays crucial roles in plant defense against biotic and abiotic stresses [1–4]. The presence of lignin in high concentrations in cell walls is regarded as a positive benefit, for example in the fiberboard industry, and lignification of plant tissues also has a well-recognized impact on foods, particularly on forage digestibility and bioavailability [5]. However, there is a further unusual instance of lignification in foods—an increase in the lignin content of some fruit, specifically in the form of stone cells [6], which occurs during normal development and/or ripening after harvest [7]. Until now, considerable effort has been devoted to investigating the process of lignin formation and lignin distribution in cell walls, and various techniques have been developed in this process. For example, the distribution of lignin can be determined by interference microscopy and confocal laser scanning microscopy (CLSM). Furthermore, fluorescence microscopy has been used to visualize the lignin distribution in wood cell walls by autofluor- escence [8,9]. The technique of transmission electron microscopy coupled with energy dispersive X-ray analysis (TEM-EDXA) was successfully used to quantify the lignin distribution in mercurized wood tissue [10]. The staining of ultrathin sections with potassium permanganate (KMnO 4 ) in order to determine the lignin distribu- tion in woody cell walls experienced somewhat of a renaissance in the 1980s and 1990s. In this case, the lignin molecule is oxidised by KMnO 4 . The permanganate anion is reduced to manganese dioxide, which then precipitates, indicating the site of reaction. Singh et al. [11], in particular, used staining intensity as an indicator of lignin distribution in the S2 layer of Pinus radiata tracheids. Pyrus bretschneideri and Pyrus pyrifolia, which originated in China, are widely cultivated in Asia, and they are characterized by the existence of stone cells in the fruit pulp. Several factors influence the formation of stone cells, including cultural practices, Plant Science 176 (2009) 413–419 ARTICLE INFO Article history: Received 26 September 2008 Received in revised form 16 December 2008 Accepted 16 December 2008 Available online 31 December 2008 Keywords: Stone cells Ultrastructure Lignin distribution Autofluorescence SEM TEM ABSTRACT The statement ‘‘seeing is believing’’ expresses the importance of microscopy in basic and applied research. In this study, anatomy, ultrastructure and lignin distribution in stone cells from the fruit of two Pyrus species (Pyrus bretschneideri cv. ‘Jingaisu’ and Pyrus pyrifolia cv. ‘Kousui’) were examined by using light microscopy (LM), scanning electron microscopy (SEM) and transmission electron microscopy (TEM) as well as autofluorescence analysis. To our knowledge, this is the first time this combined method has been used to analyze the stone cells in pear fruit. Sections stained with phloroglucinol–HCl revealed the presence of lignin in stone cells, and showed that stone cells were distributed in a mosaic pattern in the flesh, with larger stone cells concentrated around the core and smaller ones in the pericarp. There were no obvious differences in stone cell structure between the two varieties, but stone cell size and content was much greater in ‘Jingaisu’ than in ‘Kousui’. Further, lignin accounted for 29.8% of stone cell composition in ‘Jingaisu’, a significantly higher proportion than in ‘Kousui’ (24.6%); this result was confirmed by autofluorescence analysis. More detailed information on lignin distribution across the cell wall was obtained by TEM combined with the KMnO 4 staining technique. In TEM images, cell walls of both pear varieties were typically divided into four layers: compound middle lamella (CML), secondary wall 1 (S1), outer secondary wall 2 (S2L) and secondary wall 2 (S2), with different staining intensities for different lignin concentrations in those regions. ß 2008 Elsevier Ireland Ltd. All rights reserved. * Corresponding author at: Pear Engineering Research Centre, College of Horticulture, Nanjing Agricultural University, 1 Weigang, Nanjing, Jiangsu Province 210095, PR China. Tel.: +86 25 84396580; fax: +86 25 84395266. E-mail addresses: [email protected] (S. Tao), [email protected] (S. Khanizadeh), [email protected] (H. Zhang), [email protected] (S. Zhang). Contents lists available at ScienceDirect Plant Science journal homepage: www.elsevier.com/locate/plantsci 0168-9452/$ – see front matter ß 2008 Elsevier Ireland Ltd. All rights reserved. doi:10.1016/j.plantsci.2008.12.011

Welcome message from author
This document is posted to help you gain knowledge. Please leave a comment to let me know what you think about it! Share it to your friends and learn new things together.
Transcript
Plant Science 176 (2009) 413–419
Anatomy, ultrastructure and lignin distribution of stone cells in two Pyrus species
Shutian Tao a, Shahrokh Khanizadeh b, Hua Zhang a, Shaoling Zhang a,*a Pear Engineering Research Centre, College of Horticulture, Nanjing Agricultural University, 1 Weigang, Nanjing, Jiangsu Province 210095, PR Chinab Horticultural Research and Development Centre, Agriculture and Agri-Food Canada, 430 Gouin Boulevard, Saint Jean sur Richelieu, Quebec J3B 3E6, Canada
A R T I C L E I N F O
Article history:
Received 26 September 2008
Received in revised form 16 December 2008
Accepted 16 December 2008
Available online 31 December 2008
Keywords:
Stone cells
Ultrastructure
Lignin distribution
Autofluorescence
SEM
TEM
A B S T R A C T
The statement ‘‘seeing is believing’’ expresses the importance of microscopy in basic and applied
research. In this study, anatomy, ultrastructure and lignin distribution in stone cells from the fruit of two
Pyrus species (Pyrus bretschneideri cv. ‘Jingaisu’ and Pyrus pyrifolia cv. ‘Kousui’) were examined by using
light microscopy (LM), scanning electron microscopy (SEM) and transmission electron microscopy
(TEM) as well as autofluorescence analysis. To our knowledge, this is the first time this combined method
has been used to analyze the stone cells in pear fruit. Sections stained with phloroglucinol–HCl revealed
the presence of lignin in stone cells, and showed that stone cells were distributed in a mosaic pattern in
the flesh, with larger stone cells concentrated around the core and smaller ones in the pericarp. There
were no obvious differences in stone cell structure between the two varieties, but stone cell size and
content was much greater in ‘Jingaisu’ than in ‘Kousui’. Further, lignin accounted for 29.8% of stone cell
composition in ‘Jingaisu’, a significantly higher proportion than in ‘Kousui’ (24.6%); this result was
confirmed by autofluorescence analysis. More detailed information on lignin distribution across the cell
wall was obtained by TEM combined with the KMnO4 staining technique. In TEM images, cell walls of
both pear varieties were typically divided into four layers: compound middle lamella (CML), secondary
wall 1 (S1), outer secondary wall 2 (S2L) and secondary wall 2 (S2), with different staining intensities for
different lignin concentrations in those regions.
� 2008 Elsevier Ireland Ltd. All rights reserved.
Contents lists available at ScienceDirect
Plant Science
journal homepage: www.elsev ier .com/ locate /p lantsc i
1. Introduction
Lignin is a polymer derived from the dehydrogenative poly-merization of three different monolignols—p-coumaryl alcohol,conferyl alcohol and sinapyl alcohol. Lignin is widely distributed inplant cell walls and confers strength, rigidity and impermeability. Insome plants with extreme needs for both structural support andwater transport, e.g. terrestrial trees, lignin makes up 15–36% of thedry weight of the wood. Lignin is therefore one of the world’s mostabundant natural polymers, along with cellulose. In addition, it playscrucial roles in plant defense against biotic and abiotic stresses [1–4].The presence of lignin in high concentrations in cell walls is regardedas a positive benefit, for example in the fiberboard industry, andlignification of plant tissues also has a well-recognized impact onfoods, particularly on forage digestibility and bioavailability [5].However, there is a further unusual instance of lignification infoods—an increase in the lignin content of some fruit, specifically in
* Corresponding author at: Pear Engineering Research Centre, College of
Horticulture, Nanjing Agricultural University, 1 Weigang, Nanjing, Jiangsu Province
210095, PR China. Tel.: +86 25 84396580; fax: +86 25 84395266.
E-mail addresses: [email protected] (S. Tao), [email protected]
(S. Khanizadeh), [email protected] (H. Zhang), [email protected] (S. Zhang).
0168-9452/$ – see front matter � 2008 Elsevier Ireland Ltd. All rights reserved.
doi:10.1016/j.plantsci.2008.12.011
the form of stone cells [6], which occurs during normal developmentand/or ripening after harvest [7].
Until now, considerable effort has been devoted to investigatingthe process of lignin formation and lignin distribution in cell walls,and various techniques have been developed in this process. Forexample, the distribution of lignin can be determined byinterference microscopy and confocal laser scanning microscopy(CLSM). Furthermore, fluorescence microscopy has been used tovisualize the lignin distribution in wood cell walls by autofluor-escence [8,9]. The technique of transmission electron microscopycoupled with energy dispersive X-ray analysis (TEM-EDXA) wassuccessfully used to quantify the lignin distribution in mercurizedwood tissue [10]. The staining of ultrathin sections with potassiumpermanganate (KMnO4) in order to determine the lignin distribu-tion in woody cell walls experienced somewhat of a renaissance inthe 1980s and 1990s. In this case, the lignin molecule is oxidised byKMnO4. The permanganate anion is reduced to manganese dioxide,which then precipitates, indicating the site of reaction. Singh et al.[11], in particular, used staining intensity as an indicator of lignindistribution in the S2 layer of Pinus radiata tracheids.
Pyrus bretschneideri and Pyrus pyrifolia, which originated inChina, are widely cultivated in Asia, and they are characterized bythe existence of stone cells in the fruit pulp. Several factorsinfluence the formation of stone cells, including cultural practices,
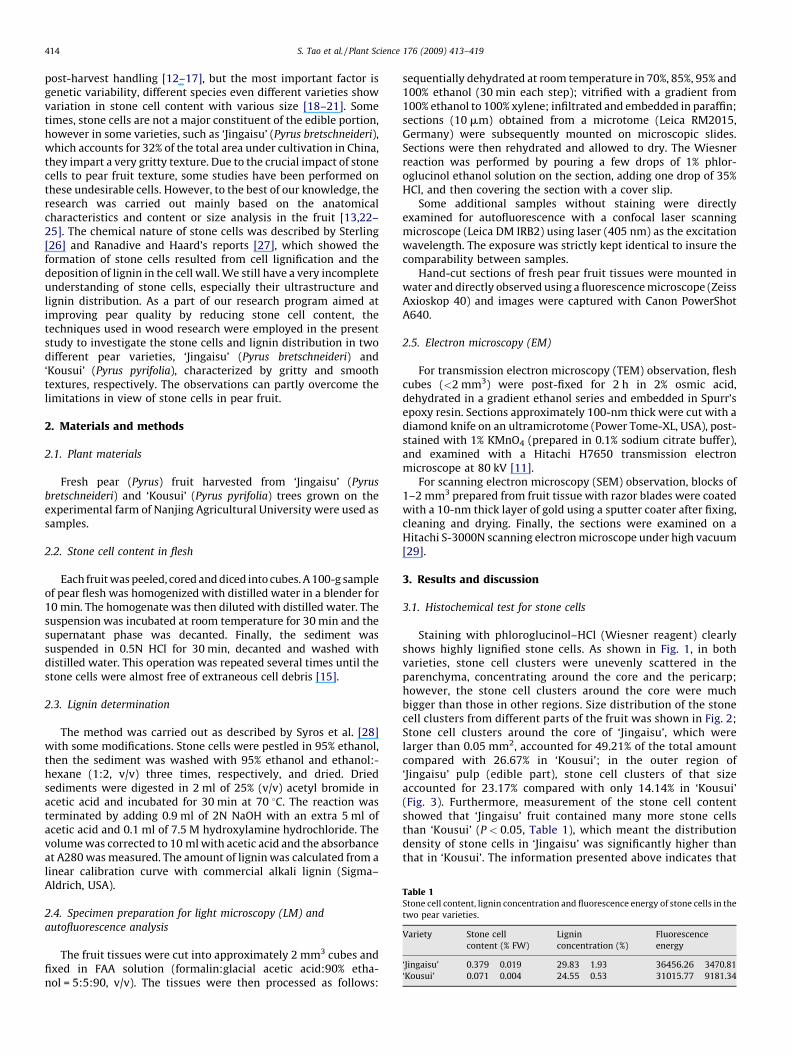
Table 1Stone cell content, lignin concentration and fluorescence energy of stone cells in the
two pear varieties.
Variety Stone cell
content (% FW)
Lignin
concentration (%)
Fluorescence
energy
‘Jingaisu’ 0.379 � 0.019 29.83 � 1.93 36456.26 � 3470.81
‘Kousui’ 0.071 � 0.004 24.55 � 0.53 31015.77 � 9181.34
S. Tao et al. / Plant Science 176 (2009) 413–419414
post-harvest handling [12–17], but the most important factor isgenetic variability, different species even different varieties showvariation in stone cell content with various size [18–21]. Sometimes, stone cells are not a major constituent of the edible portion,however in some varieties, such as ‘Jingaisu’ (Pyrus bretschneideri),which accounts for 32% of the total area under cultivation in China,they impart a very gritty texture. Due to the crucial impact of stonecells to pear fruit texture, some studies have been performed onthese undesirable cells. However, to the best of our knowledge, theresearch was carried out mainly based on the anatomicalcharacteristics and content or size analysis in the fruit [13,22–25]. The chemical nature of stone cells was described by Sterling[26] and Ranadive and Haard’s reports [27], which showed theformation of stone cells resulted from cell lignification and thedeposition of lignin in the cell wall. We still have a very incompleteunderstanding of stone cells, especially their ultrastructure andlignin distribution. As a part of our research program aimed atimproving pear quality by reducing stone cell content, thetechniques used in wood research were employed in the presentstudy to investigate the stone cells and lignin distribution in twodifferent pear varieties, ‘Jingaisu’ (Pyrus bretschneideri) and‘Kousui’ (Pyrus pyrifolia), characterized by gritty and smoothtextures, respectively. The observations can partly overcome thelimitations in view of stone cells in pear fruit.
2. Materials and methods
2.1. Plant materials
Fresh pear (Pyrus) fruit harvested from ‘Jingaisu’ (Pyrus
bretschneideri) and ‘Kousui’ (Pyrus pyrifolia) trees grown on theexperimental farm of Nanjing Agricultural University were used assamples.
2.2. Stone cell content in flesh
Each fruit was peeled, cored and diced into cubes. A 100-g sampleof pear flesh was homogenized with distilled water in a blender for10 min. The homogenate was then diluted with distilled water. Thesuspension was incubated at room temperature for 30 min and thesupernatant phase was decanted. Finally, the sediment wassuspended in 0.5N HCl for 30 min, decanted and washed withdistilled water. This operation was repeated several times until thestone cells were almost free of extraneous cell debris [15].
2.3. Lignin determination
The method was carried out as described by Syros et al. [28]with some modifications. Stone cells were pestled in 95% ethanol,then the sediment was washed with 95% ethanol and ethanol:-hexane (1:2, v/v) three times, respectively, and dried. Driedsediments were digested in 2 ml of 25% (v/v) acetyl bromide inacetic acid and incubated for 30 min at 70 8C. The reaction wasterminated by adding 0.9 ml of 2N NaOH with an extra 5 ml ofacetic acid and 0.1 ml of 7.5 M hydroxylamine hydrochloride. Thevolume was corrected to 10 ml with acetic acid and the absorbanceat A280 was measured. The amount of lignin was calculated from alinear calibration curve with commercial alkali lignin (Sigma–Aldrich, USA).
2.4. Specimen preparation for light microscopy (LM) and
autofluorescence analysis
The fruit tissues were cut into approximately 2 mm3 cubes andfixed in FAA solution (formalin:glacial acetic acid:90% etha-nol = 5:5:90, v/v). The tissues were then processed as follows:
sequentially dehydrated at room temperature in 70%, 85%, 95% and100% ethanol (30 min each step); vitrified with a gradient from100% ethanol to 100% xylene; infiltrated and embedded in paraffin;sections (10 mm) obtained from a microtome (Leica RM2015,Germany) were subsequently mounted on microscopic slides.Sections were then rehydrated and allowed to dry. The Wiesnerreaction was performed by pouring a few drops of 1% phlor-oglucinol ethanol solution on the section, adding one drop of 35%HCl, and then covering the section with a cover slip.
Some additional samples without staining were directlyexamined for autofluorescence with a confocal laser scanningmicroscope (Leica DM IRB2) using laser (405 nm) as the excitationwavelength. The exposure was strictly kept identical to insure thecomparability between samples.
Hand-cut sections of fresh pear fruit tissues were mounted inwater and directly observed using a fluorescence microscope (ZeissAxioskop 40) and images were captured with Canon PowerShotA640.
2.5. Electron microscopy (EM)
For transmission electron microscopy (TEM) observation, fleshcubes (<2 mm3) were post-fixed for 2 h in 2% osmic acid,dehydrated in a gradient ethanol series and embedded in Spurr’sepoxy resin. Sections approximately 100-nm thick were cut with adiamond knife on an ultramicrotome (Power Tome-XL, USA), post-stained with 1% KMnO4 (prepared in 0.1% sodium citrate buffer),and examined with a Hitachi H7650 transmission electronmicroscope at 80 kV [11].
For scanning electron microscopy (SEM) observation, blocks of1–2 mm3 prepared from fruit tissue with razor blades were coatedwith a 10-nm thick layer of gold using a sputter coater after fixing,cleaning and drying. Finally, the sections were examined on aHitachi S-3000N scanning electron microscope under high vacuum[29].
3. Results and discussion
3.1. Histochemical test for stone cells
Staining with phloroglucinol–HCl (Wiesner reagent) clearlyshows highly lignified stone cells. As shown in Fig. 1, in bothvarieties, stone cell clusters were unevenly scattered in theparenchyma, concentrating around the core and the pericarp;however, the stone cell clusters around the core were muchbigger than those in other regions. Size distribution of the stonecell clusters from different parts of the fruit was shown in Fig. 2;Stone cell clusters around the core of ‘Jingaisu’, which werelarger than 0.05 mm2, accounted for 49.21% of the total amountcompared with 26.67% in ‘Kousui’; in the outer region of‘Jingaisu’ pulp (edible part), stone cell clusters of that sizeaccounted for 23.17% compared with only 14.14% in ‘Kousui’(Fig. 3). Furthermore, measurement of the stone cell contentshowed that ‘Jingaisu’ fruit contained many more stone cellsthan ‘Kousui’ (P < 0.05, Table 1), which meant the distributiondensity of stone cells in ‘Jingaisu’ was significantly higher thanthat in ‘Kousui’. The information presented above indicates that
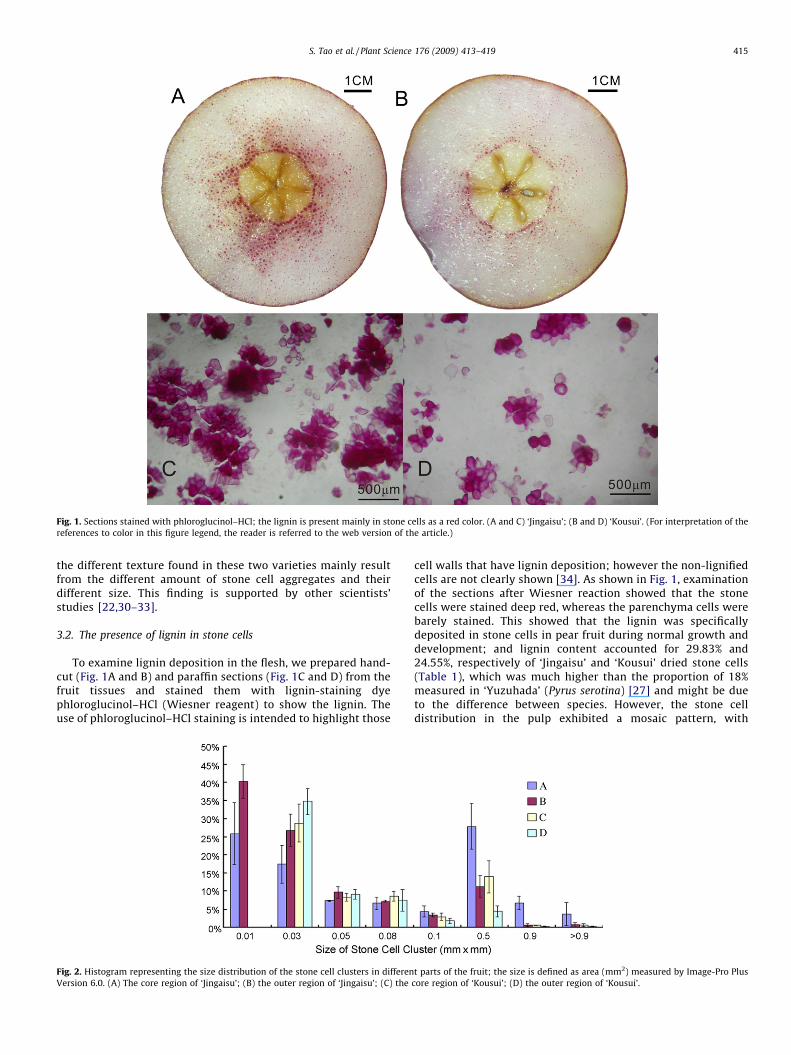
Fig. 1. Sections stained with phloroglucinol–HCl; the lignin is present mainly in stone cells as a red color. (A and C) ‘Jingaisu’; (B and D) ‘Kousui’. (For interpretation of the
references to color in this figure legend, the reader is referred to the web version of the article.)
S. Tao et al. / Plant Science 176 (2009) 413–419 415
the different texture found in these two varieties mainly resultfrom the different amount of stone cell aggregates and theirdifferent size. This finding is supported by other scientists’studies [22,30–33].
3.2. The presence of lignin in stone cells
To examine lignin deposition in the flesh, we prepared hand-cut (Fig. 1A and B) and paraffin sections (Fig. 1C and D) from thefruit tissues and stained them with lignin-staining dyephloroglucinol–HCl (Wiesner reagent) to show the lignin. Theuse of phloroglucinol–HCl staining is intended to highlight those
Fig. 2. Histogram representing the size distribution of the stone cell clusters in differen
Version 6.0. (A) The core region of ‘Jingaisu’; (B) the outer region of ‘Jingaisu’; (C) the
cell walls that have lignin deposition; however the non-lignifiedcells are not clearly shown [34]. As shown in Fig. 1, examinationof the sections after Wiesner reaction showed that the stonecells were stained deep red, whereas the parenchyma cells werebarely stained. This showed that the lignin was specificallydeposited in stone cells in pear fruit during normal growth anddevelopment; and lignin content accounted for 29.83% and24.55%, respectively of ‘Jingaisu’ and ‘Kousui’ dried stone cells(Table 1), which was much higher than the proportion of 18%measured in ‘Yuzuhada’ (Pyrus serotina) [27] and might be dueto the difference between species. However, the stone celldistribution in the pulp exhibited a mosaic pattern, with
t parts of the fruit; the size is defined as area (mm2) measured by Image-Pro Plus
core region of ‘Kousui’; (D) the outer region of ‘Kousui’.
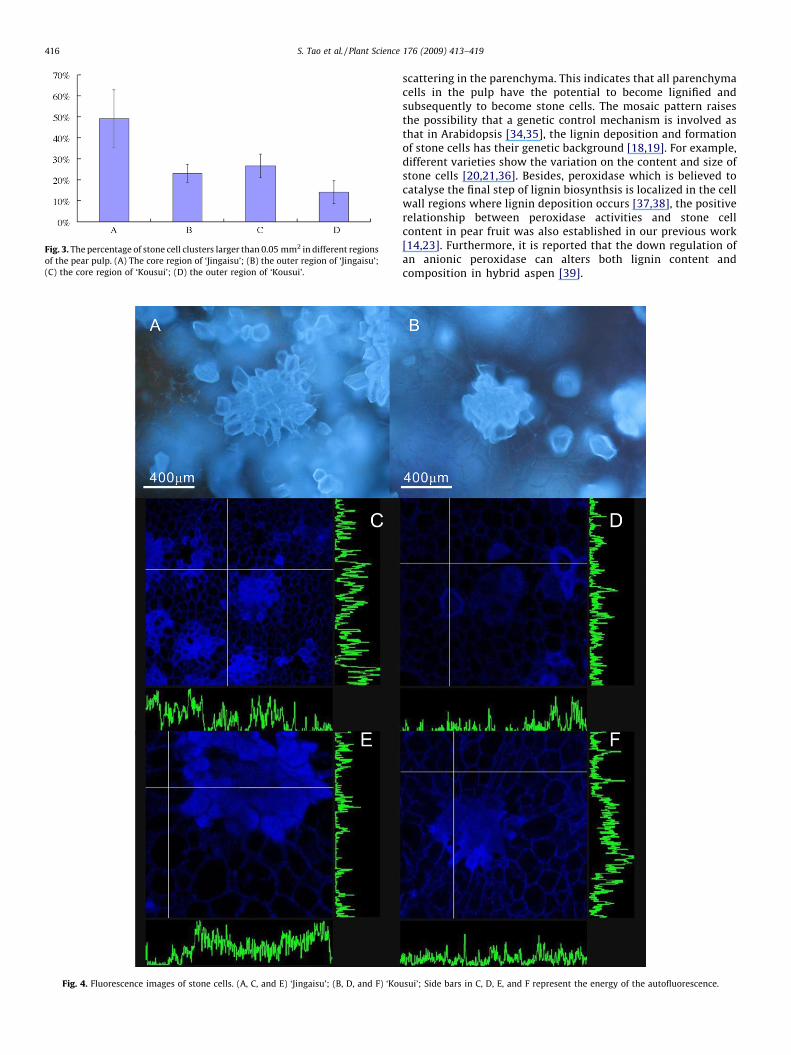
Fig. 3. The percentage of stone cell clusters larger than 0.05 mm2 in different regions
of the pear pulp. (A) The core region of ‘Jingaisu’; (B) the outer region of ‘Jingaisu’;
(C) the core region of ‘Kousui’; (D) the outer region of ‘Kousui’.
Fig. 4. Fluorescence images of stone cells. (A, C, and E) ‘Jingaisu’; (B, D, and F) ‘Kou
S. Tao et al. / Plant Science 176 (2009) 413–419416
scattering in the parenchyma. This indicates that all parenchymacells in the pulp have the potential to become lignified andsubsequently to become stone cells. The mosaic pattern raisesthe possibility that a genetic control mechanism is involved asthat in Arabidopsis [34,35], the lignin deposition and formationof stone cells has their genetic background [18,19]. For example,different varieties show the variation on the content and size ofstone cells [20,21,36]. Besides, peroxidase which is believed tocatalyse the final step of lignin biosynthsis is localized in the cellwall regions where lignin deposition occurs [37,38], the positiverelationship between peroxidase activities and stone cellcontent in pear fruit was also established in our previous work[14,23]. Furthermore, it is reported that the down regulation ofan anionic peroxidase can alters both lignin content andcomposition in hybrid aspen [39].
sui’; Side bars in C, D, E, and F represent the energy of the autofluorescence.
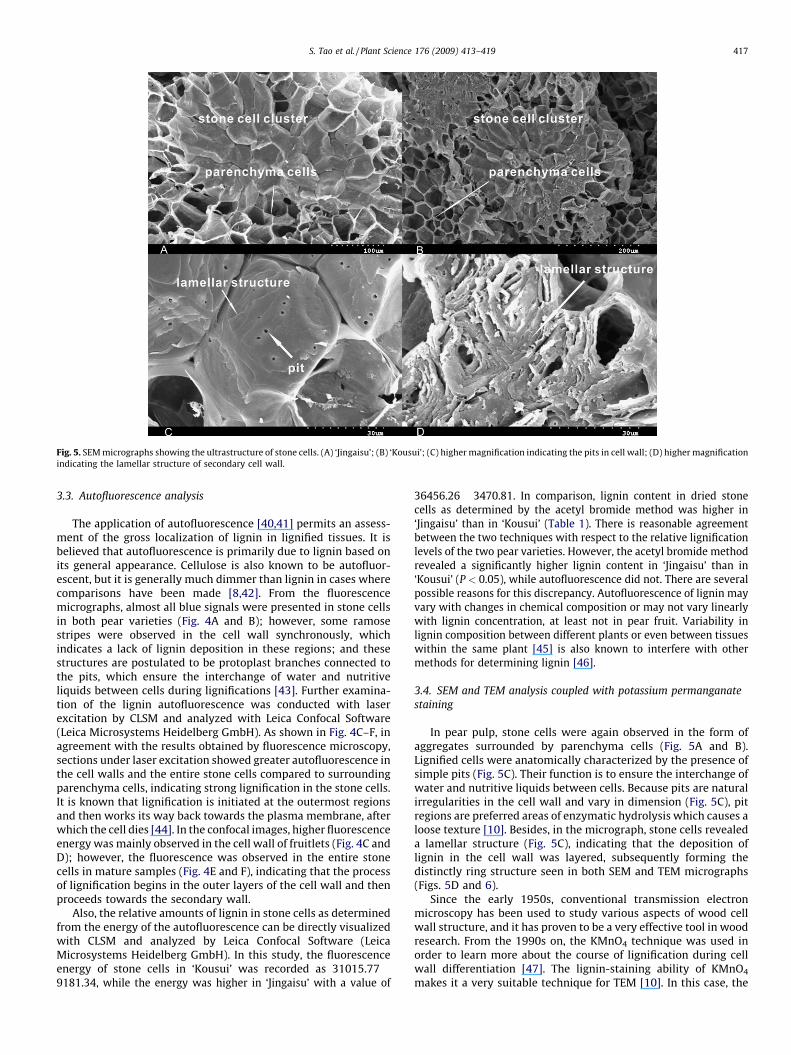
Fig. 5. SEM micrographs showing the ultrastructure of stone cells. (A) ‘Jingaisu’; (B) ‘Kousui’; (C) higher magnification indicating the pits in cell wall; (D) higher magnification
indicating the lamellar structure of secondary cell wall.
S. Tao et al. / Plant Science 176 (2009) 413–419 417
3.3. Autofluorescence analysis
The application of autofluorescence [40,41] permits an assess-ment of the gross localization of lignin in lignified tissues. It isbelieved that autofluorescence is primarily due to lignin based onits general appearance. Cellulose is also known to be autofluor-escent, but it is generally much dimmer than lignin in cases wherecomparisons have been made [8,42]. From the fluorescencemicrographs, almost all blue signals were presented in stone cellsin both pear varieties (Fig. 4A and B); however, some ramosestripes were observed in the cell wall synchronously, whichindicates a lack of lignin deposition in these regions; and thesestructures are postulated to be protoplast branches connected tothe pits, which ensure the interchange of water and nutritiveliquids between cells during lignifications [43]. Further examina-tion of the lignin autofluorescence was conducted with laserexcitation by CLSM and analyzed with Leica Confocal Software(Leica Microsystems Heidelberg GmbH). As shown in Fig. 4C–F, inagreement with the results obtained by fluorescence microscopy,sections under laser excitation showed greater autofluorescence inthe cell walls and the entire stone cells compared to surroundingparenchyma cells, indicating strong lignification in the stone cells.It is known that lignification is initiated at the outermost regionsand then works its way back towards the plasma membrane, afterwhich the cell dies [44]. In the confocal images, higher fluorescenceenergy was mainly observed in the cell wall of fruitlets (Fig. 4C andD); however, the fluorescence was observed in the entire stonecells in mature samples (Fig. 4E and F), indicating that the processof lignification begins in the outer layers of the cell wall and thenproceeds towards the secondary wall.
Also, the relative amounts of lignin in stone cells as determinedfrom the energy of the autofluorescence can be directly visualizedwith CLSM and analyzed by Leica Confocal Software (LeicaMicrosystems Heidelberg GmbH). In this study, the fluorescenceenergy of stone cells in ‘Kousui’ was recorded as 31015.77 �9181.34, while the energy was higher in ‘Jingaisu’ with a value of
36456.26 � 3470.81. In comparison, lignin content in dried stonecells as determined by the acetyl bromide method was higher in‘Jingaisu’ than in ‘Kousui’ (Table 1). There is reasonable agreementbetween the two techniques with respect to the relative lignificationlevels of the two pear varieties. However, the acetyl bromide methodrevealed a significantly higher lignin content in ‘Jingaisu’ than in‘Kousui’ (P < 0.05), while autofluorescence did not. There are severalpossible reasons for this discrepancy. Autofluorescence of lignin mayvary with changes in chemical composition or may not vary linearlywith lignin concentration, at least not in pear fruit. Variability inlignin composition between different plants or even between tissueswithin the same plant [45] is also known to interfere with othermethods for determining lignin [46].
3.4. SEM and TEM analysis coupled with potassium permanganate
staining
In pear pulp, stone cells were again observed in the form ofaggregates surrounded by parenchyma cells (Fig. 5A and B).Lignified cells were anatomically characterized by the presence ofsimple pits (Fig. 5C). Their function is to ensure the interchange ofwater and nutritive liquids between cells. Because pits are naturalirregularities in the cell wall and vary in dimension (Fig. 5C), pitregions are preferred areas of enzymatic hydrolysis which causes aloose texture [10]. Besides, in the micrograph, stone cells revealeda lamellar structure (Fig. 5C), indicating that the deposition oflignin in the cell wall was layered, subsequently forming thedistinctly ring structure seen in both SEM and TEM micrographs(Figs. 5D and 6).
Since the early 1950s, conventional transmission electronmicroscopy has been used to study various aspects of wood cellwall structure, and it has proven to be a very effective tool in woodresearch. From the 1990s on, the KMnO4 technique was used inorder to learn more about the course of lignification during cellwall differentiation [47]. The lignin-staining ability of KMnO4
makes it a very suitable technique for TEM [10]. In this case, the
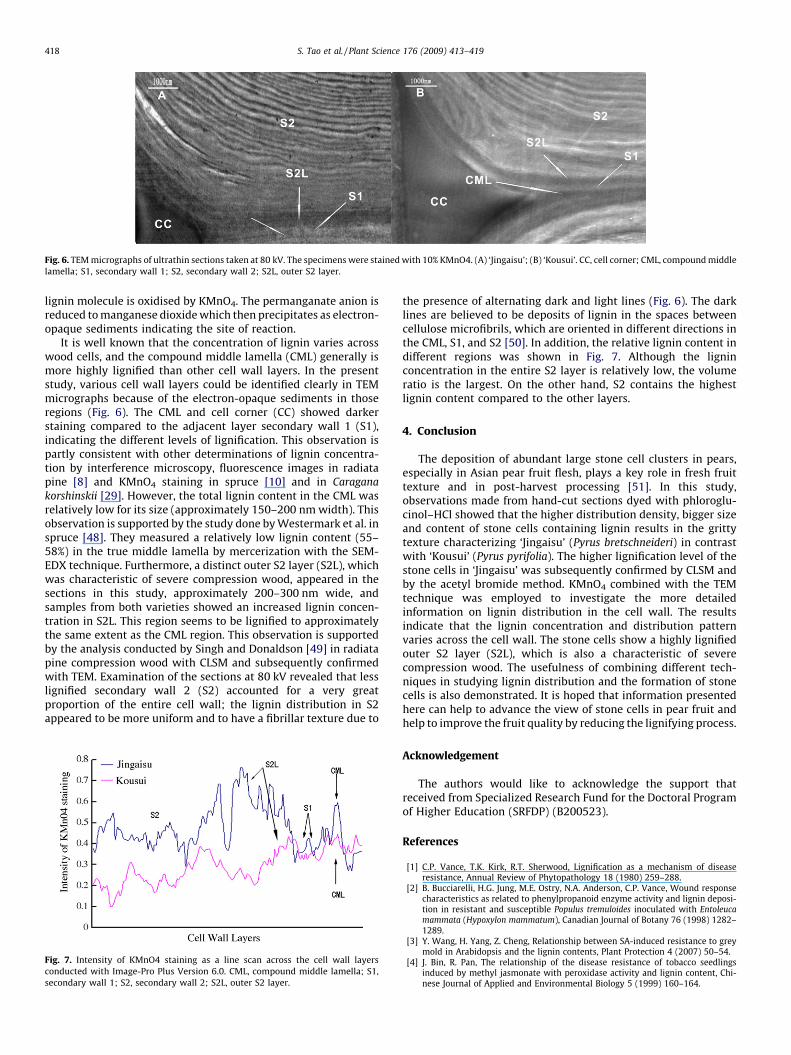
Fig. 6. TEM micrographs of ultrathin sections taken at 80 kV. The specimens were stained with 10% KMnO4. (A) ‘Jingaisu’; (B) ‘Kousui’. CC, cell corner; CML, compound middle
lamella; S1, secondary wall 1; S2, secondary wall 2; S2L, outer S2 layer.
S. Tao et al. / Plant Science 176 (2009) 413–419418
lignin molecule is oxidised by KMnO4. The permanganate anion isreduced to manganese dioxide which then precipitates as electron-opaque sediments indicating the site of reaction.
It is well known that the concentration of lignin varies acrosswood cells, and the compound middle lamella (CML) generally ismore highly lignified than other cell wall layers. In the presentstudy, various cell wall layers could be identified clearly in TEMmicrographs because of the electron-opaque sediments in thoseregions (Fig. 6). The CML and cell corner (CC) showed darkerstaining compared to the adjacent layer secondary wall 1 (S1),indicating the different levels of lignification. This observation ispartly consistent with other determinations of lignin concentra-tion by interference microscopy, fluorescence images in radiatapine [8] and KMnO4 staining in spruce [10] and in Caragana
korshinskii [29]. However, the total lignin content in the CML wasrelatively low for its size (approximately 150–200 nm width). Thisobservation is supported by the study done by Westermark et al. inspruce [48]. They measured a relatively low lignin content (55–58%) in the true middle lamella by mercerization with the SEM-EDX technique. Furthermore, a distinct outer S2 layer (S2L), whichwas characteristic of severe compression wood, appeared in thesections in this study, approximately 200–300 nm wide, andsamples from both varieties showed an increased lignin concen-tration in S2L. This region seems to be lignified to approximatelythe same extent as the CML region. This observation is supportedby the analysis conducted by Singh and Donaldson [49] in radiatapine compression wood with CLSM and subsequently confirmedwith TEM. Examination of the sections at 80 kV revealed that lesslignified secondary wall 2 (S2) accounted for a very greatproportion of the entire cell wall; the lignin distribution in S2appeared to be more uniform and to have a fibrillar texture due to
Fig. 7. Intensity of KMnO4 staining as a line scan across the cell wall layers
conducted with Image-Pro Plus Version 6.0. CML, compound middle lamella; S1,
secondary wall 1; S2, secondary wall 2; S2L, outer S2 layer.
the presence of alternating dark and light lines (Fig. 6). The darklines are believed to be deposits of lignin in the spaces betweencellulose microfibrils, which are oriented in different directions inthe CML, S1, and S2 [50]. In addition, the relative lignin content indifferent regions was shown in Fig. 7. Although the ligninconcentration in the entire S2 layer is relatively low, the volumeratio is the largest. On the other hand, S2 contains the highestlignin content compared to the other layers.
4. Conclusion
The deposition of abundant large stone cell clusters in pears,especially in Asian pear fruit flesh, plays a key role in fresh fruittexture and in post-harvest processing [51]. In this study,observations made from hand-cut sections dyed with phloroglu-cinol–HCl showed that the higher distribution density, bigger sizeand content of stone cells containing lignin results in the grittytexture characterizing ‘Jingaisu’ (Pyrus bretschneideri) in contrastwith ‘Kousui’ (Pyrus pyrifolia). The higher lignification level of thestone cells in ‘Jingaisu’ was subsequently confirmed by CLSM andby the acetyl bromide method. KMnO4 combined with the TEMtechnique was employed to investigate the more detailedinformation on lignin distribution in the cell wall. The resultsindicate that the lignin concentration and distribution patternvaries across the cell wall. The stone cells show a highly lignifiedouter S2 layer (S2L), which is also a characteristic of severecompression wood. The usefulness of combining different tech-niques in studying lignin distribution and the formation of stonecells is also demonstrated. It is hoped that information presentedhere can help to advance the view of stone cells in pear fruit andhelp to improve the fruit quality by reducing the lignifying process.
Acknowledgement
The authors would like to acknowledge the support thatreceived from Specialized Research Fund for the Doctoral Programof Higher Education (SRFDP) (B200523).
References
[1] C.P. Vance, T.K. Kirk, R.T. Sherwood, Lignification as a mechanism of diseaseresistance, Annual Review of Phytopathology 18 (1980) 259–288.
[2] B. Bucciarelli, H.G. Jung, M.E. Ostry, N.A. Anderson, C.P. Vance, Wound responsecharacteristics as related to phenylpropanoid enzyme activity and lignin deposi-tion in resistant and susceptible Populus tremuloides inoculated with Entoleucamammata (Hypoxylon mammatum), Canadian Journal of Botany 76 (1998) 1282–1289.
[3] Y. Wang, H. Yang, Z. Cheng, Relationship between SA-induced resistance to greymold in Arabidopsis and the lignin contents, Plant Protection 4 (2007) 50–54.
[4] J. Bin, R. Pan, The relationship of the disease resistance of tobacco seedlingsinduced by methyl jasmonate with peroxidase activity and lignin content, Chi-nese Journal of Applied and Environmental Biology 5 (1999) 160–164.
S. Tao et al. / Plant Science 176 (2009) 413–419 419
[5] M. Baucher, M.A. Bernard-Vailhe, B. Chabbert, J.M. Besle, C. Opsomer, M. VanMontagu, J. Botterman, Down-regulation of cinnamyl alcohol dehydrogenase intransgenic alfalfa (Medicago sativa L.) and the impact on lignin composition anddigestibility, Plant Molecular Biology 39 (1999) 437–447.
[6] C.A. Schroeder, Progress report on study of sclereid formation in avocado fruitpericarp, California Avocado Society Yearbook 66 (1982) 161–165.
[7] L.L. Shan, X. Li, P. Wang, C. Cai, B. Zhang, C.D. Sun, W.S. Zhang, C.J. Xu, I. Ferguson,K.S. Chen, Characterization of cDNAs associated with lignification and theirexpression profiles in loquat fruit with different lignin accumulation, Planta227 (2008) 1243–1254.
[8] L.A. Donaldson, A.P. Singh, A. Yoshinaga, K. Takabe, Lignin distribution in mildcompression wood of Pinus radiata D. Don, Canadian Journal of Botany 77 (1999)41–50.
[9] L.A. Donaldson, Lignification and lignin topochemistry—an ultrastructural view,Phytochemistry 57 (2001) 859–873.
[10] J. Fromm, B. Rockel, S. Lautner, E. Windeisen, G. Wanner, Lignin distribution inwood cell walls determined by TEM and backscattered SEM techniques, Journal ofStructural Biology 143 (2003) 77–84.
[11] A. Singh, G. Daniel, T. Niisson, Ultrastructure of the S2 layer in relation to lignindistribution in Pinus radiata tracheids, Journal of Wood Science 48 (2002) 95–98.
[12] Y.J. Qiao, S.L. Zhang, S.T. Tao, Z.M. Zhang, Z.L. Liu, Advances in research ondeveloping mechanism of stone cells in pear fruit, Journal of Fruit Science 25(2005) 367–371.
[13] Z.M. Zhang, S.L. Zhang, Y.J. Qiao, S.T. Tao, Y.C. Miao, H.L. Cao, Effect of bagging withdifferent types of bags on fruit quality of Jingaisu pear cultivar, Journal of FruitScience 23 (2006) 510–514.
[14] S.L. Zhang, Z.M. Zhang, Y.J. Qiao, J. Wu, S.T. Tao, Effects of fruit bagging at differentstages on pear quality and sclereid development and the activities of their relatedenzymes in the pear variety Kousui, Acta Botanica Boreali-Occidentalia Sinica 26(2006) 1369–1377.
[15] S.H. Lee, J.H. Choi, W.S. Kim, T.H. Han, Y.S. Park, H. Gemma, Effect of soil waterstress on the development of stone cells in pear (Pyrus pyrifolia cv. ‘Niitaka’) flesh,Scientia Horticulturae 110 (2006) 247–253.
[16] X.Y. Liu, L. Li, Y.P. Cai, Effect of light intensity for formation of stone cell andcorrelation between activity of endogenous IAA, ZR and ABA and formation ofstone cell in Pyrus. spp., Acta Laser Biology Sinica 15 (2006) 161–166.
[17] H. Zhang, S.L. Zhang, S.T. Tao, X.T. Jiang, T. Wu, J.X. Xiao, Effects of bagging onHosui pear fruit developmental microenvironment and quality during coldstorage, Journal of Fruit Science 25 (2008) 12–16.
[18] B.P. Wang, A genetic study on brachyscelereids in pear fruit flesh, Journal ofZhejiang Forestry College 2 (1985) 29–32.
[19] X.S. Hu, Y.F. Han, D.Y. Qiu, Advance in studies on genetic variation of lignincontent in tree species, Forest Research 12 (1999) 563–571.
[20] X.G. Li, B.L. Sheng, J. Lin, Z.M. Yan, Q.S. Yang, Y.H. Chang, Study on the stone cellcontent from different pear varieties, Jiangsu Agricultural Sciences 4 (2004) 65–67.
[21] Z.M. Zhang, H.G. Hu, Study on stone cell content of the different pear variety,Anhui Agricultural Science Bulletin 13 (2007) 28–29.
[22] Q.H. Liu, K.L. Wang, Q.H. Zhou, D.Y. Han, A study on the relationship between thestructure and morphology of the sclereids and the quality of the pear fruit, Journalof Laiyang Agricultural College 9 (1992) 252–255.
[23] S.T. Tao, S.L. Zhang, Y.J. Qiao, B.L. Sheng, Study on sclereids and activities of severalrelated enzymes during the development of pear fruit, Journal of Fruit Science 21(2004) 516–520.
[24] J.Y. Nie, J. Li, Z.F. Yang, H.J. Zhang, M.Q. Li, Study on the conditions for measuringstone cell content in pear flesh by freezing method, Journal of Fruit Science 23(2006) 133–135.
[25] X.Y. Liu, G.Z. Gao, H.X. Li, Z.Q. Lei, The studies on the changing laws of the fruitgrowth, development and the stone cell forming of Pyrus bretschneideri cv.Jingaisu pear, Journal of Huaibei Coal Industry Teachers College 27 (2006) 49–53.
[26] C. Sterling, Sclereid development and the texture of Bartlett pears, Food Research19 (1954) 433–443.
[27] A.S. Ranadive, N.F. Haard, Chemical nature of stone cells from pear fruit, Journal ofFood Science 38 (1973) 331–333.
[28] T. Syros, T. Yupsanis, H. Zafiriadis, A. Economou, Activity and isoforms of perox-idases, lignin and anatomy, during adventitious rooting in cuttings of Ebenuscretica L., Journal of Plant Physiology 161 (2004) 69–77.
[29] F. Xu, X.C. Zhang, R.C. Sun, Q. Lu, Anatomy, ultrastructure and lignin distribution incell wall of Caragana Korshinskii, Industrial Crops and Products 24 (2006) 186–193.
[30] Q.Y. Mou, W.X. Li, H.Y. Zhang, Relationship between stone cells content and fruitquality of pear, Deciduous fruits 1 (1996) 7–9.
[31] S.R. Tao, H. Xin, Q.G. Chu, Study on the comparative anatomy of pear fruits ofdifferent durable storage, Journal of Laiyang Agricultural College 9 (1992) 35–36.
[32] M. Gu, F.Q. Lin, B.B. Zhang, Study on the anatomy of pear fruit, China fruits 4(1989) 32–34.
[33] X.Y. Liu, L. Li, M. Zong, Y.P. Cai, Contents and distributions of stone cell and theireffects on fruit quality of pear, Journal of Anhui Agricultural University 31 (2004)104–106.
[34] R. Zhong, A. Ripperger, Z.H. Ye, Ectopic deposition of lignin in the pith of stems oftwo Arabidopsis mutants, Plant Physiology 123 (2000) 59–69.
[35] J. Bender, G.R. Fink, Epigenetic control of an endogenous gene family is revealedby a novel blue fluorescent mutant of Arabidopsis, Cell 83 (1995) 725–734.
[36] E. Dibuz, Sclereid formation in the flowers and fruits of pears, Acta Horticulturae475 (1998) 317–325.
[37] A.S. Ranadive, N.F. Haard, Peroxidase localization and lignin formation in devel-oping pear fruit, Journal of Food Science 37 (1972) 381–383.
[38] S.H. Lee, J.H. Choi, W.S. Kim, Y.S. Park, H. Gemma, Effects of calcium chloride spray onperoxidase activity and stone cell development in pear fruit (Pyrus pyrifolia ‘Nii-taka’), Journal of the Japanese Society for Horticultural Science 76 (2007) 191–196.
[39] Y. Li, S. Kajita, S. Kawai, Y. Katayama, N. Morohoshi, Down-regulation of an anionicperoxidase in transgenic aspen and its effect on lignin characteristics, Journal ofPlant Research 116 (2003) 175–182.
[40] V.R. Franceschi, T. Krekling, A.A. Berryman, E. Christiansen, Specialized phloemparenchyma cells in Norway spruce (Pinaceae) bark are an important site ofdefense reactions, American Journal of Botany 85 (1998) 601–615.
[41] M. Lopez-Serrano, M.D. Fernandez, F. Pomar, M.A. Pedreno, A.R. Barcelo, Zinniaelegans uses the same peroxidase isoenzyme complement for cell wall lignifica-tion in both single-cell tracheary elements and xylem vessels, Journal of Experi-mental Botany 55 (2004) 423–431.
[42] J.A. Olmstead, D.G. Gray, Fluorescence spectroscopy of cellulose, lignin andmechanical pulps: a review, Journal of pulp and paper science 23 (1997) 571–581.
[43] China Academy of Sciences, Plant Cell, Press of Science, Beijing, 1977, pp. 9–13.[44] L.A. Donaldson, Mechanical constraints on lignin deposition during lignification,
Wood Science and Technology 28 (1994) 111–118.[45] M. Chrisriernin, Lignin composition in cambial tissues of poplar, Plant Physiology
and Biochemistry 44 (2006) 700–706.[46] U. Westermark, Bromination of different morphological parts of spruce wood
(Picea abies), Wood Science and Technology 19 (1985) 323–328.[47] L.A. Donaldson, J. Hague, R. Snell, Lignin distribution in coppice poplar, linseed
and wheat straw, Holzforschung 55 (2001) 379–385.[48] U. Westermark, O. Lidbrandt, I. Eriksson, Lignin distribution in spruce (Picea abies)
determined by mercurization with SEM–EDXA technique, Wood Science andTechnology 22 (1988) 243–250.
[49] A.P. Singh, L.A. Donaldson, Ultrastructure of tracheid cell walls in radiata pine (Pinusradiata) mild compression wood, Canadian Journal of Botany 77 (1999) 32–40.
[50] Y.H. Li, Botany, Shanghai Press of Science and Technology, Shanghai, 1984 , pp.46–51.
[51] J. Wei, F.R. He, Study on the sclereid in the fruit of Suli and Yali, Journal ofYangzhou University (Agriculture and Life Sciences Edition) 9 (1988) 85–86.
Related Documents