ARTICLE RBI Bulletin December 2017 25 commercial borrowings and recourse to IMF loans. As a result, total external debt steadily increased to 28.7 per cent of GDP by end-March 1991. With economic reform commencing in 1991, India’s external debt has witnessed significant changes in its size as well as composition, reflecting policy changes guiding the overall external debt strategy. The key elements of the economic reforms process included the liberalisation of current account transactions leading to current account convertibility while containing the CAD within sustainable limits; gradual opening up of the capital account; compositional shifts in capital flows away from debt to non-debt creating flows and a calibrated approach to external commercial borrowings (ECBs), especially short-term debt that kept in view external vulnerabilities and discouraged volatile elements of flows. Against this background, this article summarizes the developments relating to India’s external debt in 2016-17 and its changing profile since the 1990s. The remainder of the article is organized into five sections. Section II summarizes developments in India’s external debt during 2016-17. Section III analyses key trends that shaped the evolution of external debt over the years. Section IV assesses external vulnerability using various external debt based indicators and empirically examines the relationship between external debt and debt service payments. Section V situates India’s external debt position in a cross- country perspective, i.e., vis-à-vis other EMEs. Section VI sets out concluding remarks. II. Major Developments in India’s External Debt in 2016-17: A Snapshot India’s external debt stock was placed at US$ 471.9 billion at end-March 2017, recording an annual decline for the first time after 2001-02. As the US dollar depreciated vis-à-vis the Indian rupee (INR), there was a valuation loss of US$ 1.5 billion which restricted the decline in external debt to US$ 13.1 billion, abstracting from this valuation change the decline This article provides a snapshot of the developments relating to India’s external debt in 2016-17 and assesses its changing profile since the early 1990s. Alongside a gradual compositional shift in external indebtedness from government to the non-government sector, there has been a rapid rise in short-term debt (by original maturity) since mid-2000s, with trade credit related debt being the fastest growing component. Introduction External debt forms an important part of external finance for emerging market economies (EMEs), bridging shortage of domestic capital and the funding requirement of the current account deficit (CAD) while playing a consumption smoothing role as well. The availability of world-wide pool of resources allows external borrowing at lower costs for capital deficient economies (Manzocchi, 1997). While external debt aids domestic growth by supplementing domestic investment, high dependence on foreign borrowings can also saddle an economy with the oppressive burden of external debt, with implications for overall macroeconomic management. On the eve of Independence, India had little external debt. As the post-Independence development strategy under various five year plans unfolded, India’s external debt (medium and long-term) rose from 1.8 per cent of GDP at end-March 1955 to about 17 per cent by end-March 1970. The focus was to raise the economy’s investment rate by supplementing national savings with foreign borrowing and external transfers in the form of grants. The widening of the CAD during 1980s was largely financed through * This article is prepared by Dr. Rajeev Jain (Director) and Shri John V. Guria (Assistant Adviser) in the Division of International Trade and Finance of the Department of Economic and Policy Research, Reserve Bank of India. The valuable suggestions provided by Shri Rajan Goyal (Adviser) are gratefully acknowledged. The views expressed in the article are those of the authors and do not represent the views of the Reserve Bank of India. Anatomy of India’s External Debt: Assessment of Key Trends*

Welcome message from author
This document is posted to help you gain knowledge. Please leave a comment to let me know what you think about it! Share it to your friends and learn new things together.
Transcript

ARTICLE
RBI Bulletin December 2017 25
Anatomy of India’s External Debt: Assessment of Key Trends
commercial borrowings and recourse to IMF loans. As a result, total external debt steadily increased to 28.7 per cent of GDP by end-March 1991.
With economic reform commencing in 1991, India’s external debt has witnessed significant changes in its size as well as composition, reflecting policy changes guiding the overall external debt strategy. The key elements of the economic reforms process included the liberalisation of current account transactions leading to current account convertibility while containing the CAD within sustainable limits; gradual opening up of the capital account; compositional shifts in capital flows away from debt to non-debt creating flows and a calibrated approach to external commercial borrowings (ECBs), especially short-term debt that kept in view external vulnerabilities and discouraged volatile elements of flows.
Against this background, this article summarizes the developments relating to India’s external debt in 2016-17 and its changing profile since the 1990s. The remainder of the article is organized into five sections. Section II summarizes developments in India’s external debt during 2016-17. Section III analyses key trends that shaped the evolution of external debt over the years. Section IV assesses external vulnerability using various external debt based indicators and empirically examines the relationship between external debt and debt service payments. Section V situates India’s external debt position in a cross- country perspective, i.e., vis-à-vis other EMEs. Section VI sets out concluding remarks.
II. Major Developments in India’s External Debt in 2016-17: A Snapshot
India’s external debt stock was placed at US$ 471.9 billion at end-March 2017, recording an annual decline for the first time after 2001-02. As the US dollar depreciated vis-à-vis the Indian rupee (INR), there was a valuation loss of US$ 1.5 billion which restricted the decline in external debt to US$ 13.1 billion, abstracting from this valuation change the decline
This article provides a snapshot of the developments relating to India’s external debt in 2016-17 and assesses its changing profile since the early 1990s. Alongside a gradual compositional shift in external indebtedness from government to the non-government sector, there has been a rapid rise in short-term debt (by original maturity) since mid-2000s, with trade credit related debt being the fastest growing component.
Introduction
External debt forms an important part of external finance for emerging market economies (EMEs), bridging shortage of domestic capital and the funding requirement of the current account deficit (CAD) while playing a consumption smoothing role as well. The availability of world-wide pool of resources allows external borrowing at lower costs for capital deficient economies (Manzocchi, 1997). While external debt aids domestic growth by supplementing domestic investment, high dependence on foreign borrowings can also saddle an economy with the oppressive burden of external debt, with implications for overall macroeconomic management.
On the eve of Independence, India had little external debt. As the post-Independence development strategy under various five year plans unfolded, India’s external debt (medium and long-term) rose from 1.8 per cent of GDP at end-March 1955 to about 17 per cent by end-March 1970. The focus was to raise the economy’s investment rate by supplementing national savings with foreign borrowing and external transfers in the form of grants. The widening of the CAD during 1980s was largely financed through
* This article is prepared by Dr. Rajeev Jain (Director) and Shri John V. Guria (Assistant Adviser) in the Division of International Trade and Finance of the Department of Economic and Policy Research, Reserve Bank of India. The valuable suggestions provided by Shri Rajan Goyal (Adviser) are gratefully acknowledged. The views expressed in the article are those of the authors and do not represent the views of the Reserve Bank of India.
Anatomy of India’s External Debt: Assessment of Key Trends*

ARTICLE
RBI Bulletin December 201726
Anatomy of India’s External Debt: Assessment of Key Trends
in external debt in 2016-17 would have been of the order of US$ 14.6 billion. The principal driver was the contraction in the stock of non-resident deposits due
to lumpy redemption of FCNR(B) deposits raised by banks under a special swap scheme during September to November 2013. Furthermore, the stock of commercial borrowings also declined as repayments remained higher than fresh disbursements during the year. At 20.2 per cent of GDP at end-March 2017, the external debt was lower by 3.3 percentage points than its level at end-March 2016 (Table 1).
Component-wise, commercial borrowings continued to be the largest component, with a share of 36.7 per cent, followed by NRI deposits (24.8 per cent) and short-term trade credit (18.3 per cent). While long-term debt obligations dominated the maturity profile, the share of short-term debt (original maturity) increased as short-term trade credit recorded net inflows after a span of three years in tandem with the pick-up in merchandise trade in H2 of 2016-17 (Chart 1). On a residual maturity basis, however, short-term debt constituted 41.5 per cent of total external debt at end-March 2017 (42.7 per cent at end-March 2016) and stood at 52.9 per cent of total foreign exchange reserves (57.4 per cent at end-March 2016) (Table 2). Thus, short-term debt by residual maturity fell from US$ 206.9 billion to US$ 195.9 billion due to large scale repayment of FCNR(B) deposits.
Table 1: External Debt – Outstanding and Variation(US$ billion)
Component Outstanding at end-March
Percentage variation
2015 2016 2017 PR
Mar-16 over
Mar-15
Mar-17 over
Mar-16
1. Multilateral 52.4 54.0 54.5 3.0 1.1
2. Bilateral 21.7 22.5 23.2 3.4 3.4
3. IMF 5.5 5.6 5.4 2.1 -3.5
4. Trade Credit 12.6 10.6 9.8 -15.6 -8.3
5. Commercial Borrowings 180.3 180.7 172.8 0.2 -4.4
6. NRI Deposits 115.2 126.9 116.9 10.2 -7.9
7. Rupee Debt 1.5 1.3 1.2 -15.1 -3.9
8. Short-term Debt 85.5 83.4 88.0 -2.5 5.5
Of which Short-term trade credit 81.6 80.0 86.5 -2.0 8.1
Total External Debt 474.7 485.0 471.9 2.2 -2.7
Memo ItemsA. Long-Term Debt 389.2 401.6 383.9 3.2 -4.4
B. Short-Term Debt 85.5 83.4 88.0 -2.5 5.5
C. External Debt-GDP Ratio (Per cent)
23.9 23.5 20.2
PR: Partially Revised.Source: Government of India and RBI.

ARTICLE
RBI Bulletin December 2017 27
Anatomy of India’s External Debt: Assessment of Key Trends
The currency-wise pattern shows that the US dollar constituted 52.1 per cent of total external debt, followed by the Indian rupee (33.6 per cent), SDRs
(5.8 per cent), the Japanese yen (4.6 per cent) and the euro (2.9 per cent). The borrower classification shows that the outstanding debt of the government was a tad higher due to external assistance availed during the year; however, non-government debt declined by end-March 2017.
III. Key Long-term Trends Shaping India’s External Debt
India’s external debt has undergone significant level and compositional changes since the early 1990s. Drawing on the lessons from the external payment crisis of 1991 and the recommendations of the High level Committee on Balance of Payments, 1993 (Chairman: Dr. C. Rangarajan), the policy approach has been guided by (i) restrictions on size, maturity and end-use of ECBs; (ii) LIBOR-based interest ceiling on non-resident deposits to discourage the volatile component of such deposits; (iii) pre-payment and refinancing of high cost external debt; and (iv) measures to encourage non-debt creating financial flows such as foreign direct investment (FDI) and foreign portfolio investment (FPI).
With the gradual opening up of the capital account, the size of India’s external debt expanded
Table 2: Residual Maturity of External Debt Outstanding as at End-March 2017
(US$ billion)
Component Short-term up to one
year
Long-term
Total
1. Sovereign Debt (long-term) $ 4.6 91.1 95.7
2. Commercial Borrowings # 24.0 147.3 171.3
3. NRI deposits 79.3 37.6 116.9
(i) FCNR(B) 11.4 9.6 21.0
(ii) NR(E)RA 57.4 25.8 83.2
(iii) NRO 10.5 2.2 12.7
4. Short-term Debt* (original maturity) 88.0 - 88.0
Total (by residual maturity) 195.9 276.0 471.9
Memo item: Short-term debt by residual maturity as percentage of:
Total External Debt 41.5
Total Reserves 52.9
$: Inclusive of Foreign Portfolio Investors (FPI) Investments in Government Securities.#: Commercial Borrowings are inclusive of trade credit, FPI investments in corporate debt instruments and a portion of non-government multilateral and bilateral borrowings and therefore may not tally with the figures provided in other Tables under original maturity.*: Also includes FPI investments in security receipts issued by Asset Reconstruction Companies (ARCs) under the extant corporate debt limits. Source: RBI

ARTICLE
RBI Bulletin December 201728
Anatomy of India’s External Debt: Assessment of Key Trends
from US$ 83.8 billion at end-March 1991 to US$ 471.9 billion at end-March 2017. However, the external debt to GDP ratio – a summary measure of a country’s potential to service external debt by switching production to exports – declined sharply from 37.3 per cent at end-March 1992 to 16.8 per cent by end-March 2006 (Chart 2). Even though the increase in external debt – on average – exceeded the pace of expansion of the domestic economy in nominal terms since the second half of the 2000s, the ratio remained modest relative to its level during the 1990s and stood at 20.2 per cent of GDP at end-March 2017 (Chart 3).
III.1 Compositional Shifts in External Indebtedness
In the first half of the 2000s, the Government prepaid high cost multilateral and bilateral loans in order to reduce its interest burden. Consequently, the share of government debt – including debt raised on concessional terms from official creditors – shrank from 48 per cent by end-March 2000 to 20 per cent at end-March 2017. The share of concessional debt fell from 15 per cent at end-March 2011 to 9 per cent end-March 2017 (Chart 4).
Consequent upon liberalisation during the 1990s, space opened up for the private corporate sector with
a view to modernising the manufacturing sector and allowing greater access to foreign technology and foreign capital. This led to a significant rise in the share of non-government debt in total external debt since 2000.
Prior to 1991, the bulk of short-term debt was borrowed by public sector canalising agencies for financing the import of petroleum, petroleum products and fertilisers. Such short-term debt constituted around 10 per cent of total external debt during the 1980s. The experience with the balance of payments crisis of 1991 led to the adoption of policies for prudent external debt management with less dependence on short-term foreign capital. This resulted in a declining share of short-term debt in total debt during the 1990s; however, the share of short-term debt based on original maturity – incurred by both private and public sectors – rose again from the early-2000s, underpinned by strong growth in imports which averaged 26 per cent during 2002-03 to 2011-12 as compared with 8 per cent during 1990-91 to 2001-02. Estimates based on a vector error correction model (VECM) using data from 2000:Q2 to 2017:Q4 suggest that the elasticity of trade credit with respect to merchandise imports

ARTICLE
RBI Bulletin December 2017 29
Anatomy of India’s External Debt: Assessment of Key Trends
and the exchange rate of the rupee1 is positive and statistically significant (Table 3).2
Another noteworthy development was the phasing out of non-resident deposits of up to one-year maturity – following the raising of the minimum maturity period of fresh NR(E)RA deposits to one year in line with the maturity structure of FCNR(B) deposits with effect from April 2003 – which reduced
the share of non-resident deposits in total short-term debt to almost nil by end-March 2005 (Chart 5).
Short-term debt measured on a residual maturity basis provides an assessment of the total forex outgo on account of debt service payments in the next one year and accordingly becomes useful from operational considerations. Besides short-term debt with original maturity, it comprises the repayments due under medium and long-term debt by original maturity during the next one year. By this metric, the share of short-term debt (residual maturity) in total external debt increased from 37.6 per cent at end-March 2008 to 42.1 per cent by end-March 2013.3 The prohibition of investment by FPIs in fresh issuances of T-bills since April 2014 reduced the share of short-term debt by residual maturity during 2013-14 and 2014-15.4 With FCNR(B) deposits mobilised under the special swap window falling due for redemption during September to November 2016, the share of short-term debt by residual maturity rose to 42.7 per cent
Table 3: VECM Model: Trade Credit related External Debt (2000:Q2 to 2017:Q1)
ECT C LIMP LER Adj. R2
Coefficient -0.15 -2.70 1.40 0.55 0.80
T-Statistics -3.94* 3.87* 2.28**
Note: LIMP and LER representing merchandise imports and INR exchange rate respectively are defined in log form. ECT is error correction term.* and ** imply statistical significance at 1 per cent and 5 per cent respectively.
1 The responsiveness of external debt to the exchange rate of the rupee point to (a) the confi dence channel - appreciation is viewed as improving credit worthiness and, therefore, the supply of debt; and (b) the cost channel whereunder appreciation reduces hedging costs. 2 All the three variables are I(1) (see Annex II) and series are found to be co-integrated using the Johansen cointegration test. Thus, vector error correction model (VECM) is specifi ed which restricts the long-run behavior of the endogenous variables to converge to their cointegrating relationships while allowing for short-run adjustment dynamics.
3 Consistent time series data on short-term external debt by residual maturity are available only since end-March 2008. 4 All outstanding FPI holdings in T-Bills as on April 07, 2014 were permitted to taper off on maturity/sale.

ARTICLE
RBI Bulletin December 201730
Anatomy of India’s External Debt: Assessment of Key Trends
by end-March 2016. After the bulk of these deposits were redeemed by banks, the share of short-term debt by residual maturity in total external debt declined to
41.5 by end-March 2017, inspite of fresh accretions to other constituents, viz., NRE/NRO deposits and trade credit (Chart 6).
ARTICLE
RBI Bulletin December 2017 31
Anatomy of India’s External Debt: Assessment of Key Trends
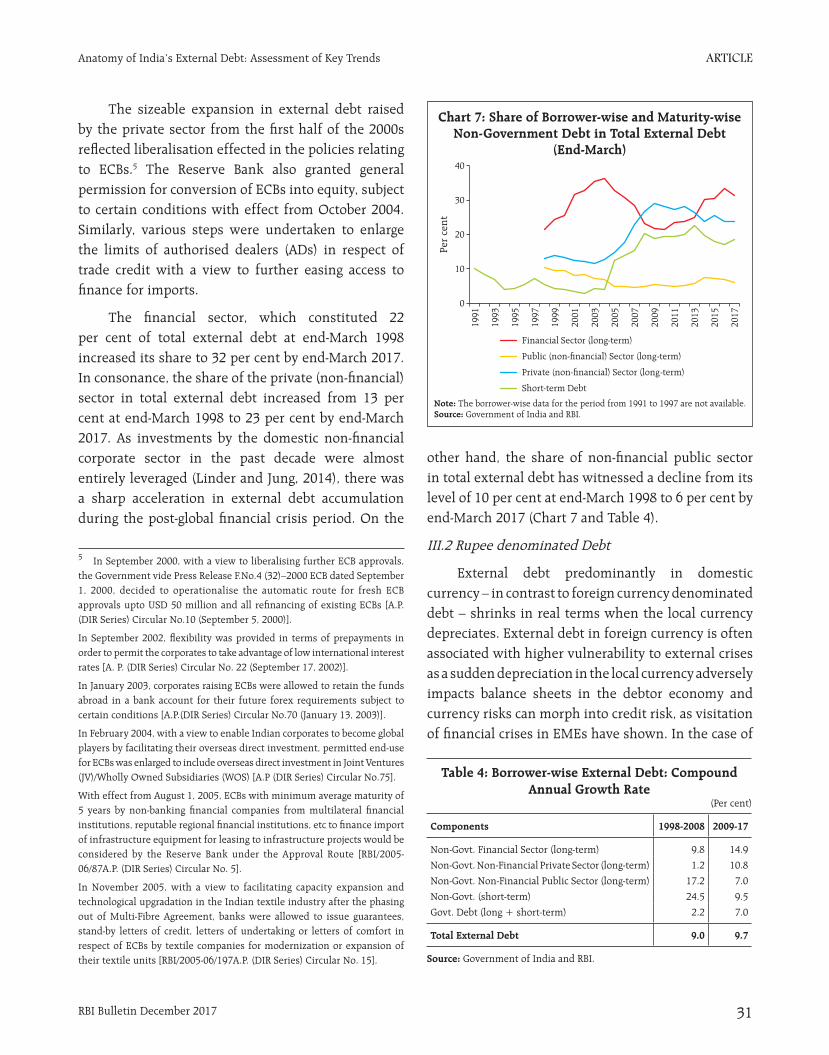
The sizeable expansion in external debt raised by the private sector from the first half of the 2000s
reflected liberalisation effected in the policies relating to ECBs.5 The Reserve Bank also granted general permission for conversion of ECBs into equity, subject to certain conditions with effect from October 2004. Similarly, various steps were undertaken to enlarge the limits of authorised dealers (ADs) in respect of trade credit with a view to further easing access to finance for imports.
The financial sector, which constituted 22 per cent of total external debt at end-March 1998 increased its share to 32 per cent by end-March 2017. In consonance, the share of the private (non-financial) sector in total external debt increased from 13 per cent at end-March 1998 to 23 per cent by end-March 2017. As investments by the domestic non-financial corporate sector in the past decade were almost entirely leveraged (Linder and Jung, 2014), there was a sharp acceleration in external debt accumulation during the post-global financial crisis period. On the
other hand, the share of non-financial public sector in total external debt has witnessed a decline from its level of 10 per cent at end-March 1998 to 6 per cent by end-March 2017 (Chart 7 and Table 4).
III.2 Rupee denominated Debt
External debt predominantly in domestic currency – in contrast to foreign currency denominated debt – shrinks in real terms when the local currency depreciates. External debt in foreign currency is often associated with higher vulnerability to external crises as a sudden depreciation in the local currency adversely impacts balance sheets in the debtor economy and currency risks can morph into credit risk, as visitation of financial crises in EMEs have shown. In the case of
5 In September 2000, with a view to liberalising further ECB approvals, the Government vide Press Release F.No.4 (32)–2000 ECB dated September 1, 2000, decided to operationalise the automatic route for fresh ECB approvals upto USD 50 million and all refi nancing of existing ECBs [A.P. (DIR Series) Circular No.10 (September 5, 2000)].
In September 2002, fl exibility was provided in terms of prepayments in order to permit the corporates to take advantage of low international interest rates [A. P. (DIR Series) Circular No. 22 (September 17, 2002)].
In January 2003, corporates raising ECBs were allowed to retain the funds abroad in a bank account for their future forex requirements subject to certain conditions [A.P.(DIR Series) Circular No.70 (January 13, 2003)].
In February 2004, with a view to enable Indian corporates to become global players by facilitating their overseas direct investment, permitted end-use for ECBs was enlarged to include overseas direct investment in Joint Ventures (JV)/Wholly Owned Subsidiaries (WOS) [A.P (DIR Series) Circular No.75].
With effect from August 1, 2005, ECBs with minimum average maturity of 5 years by non-banking fi nancial companies from multilateral fi nancial institutions, reputable regional fi nancial institutions, etc to fi nance import of infrastructure equipment for leasing to infrastructure projects would be considered by the Reserve Bank under the Approval Route [RBI/2005-06/87A.P. (DIR Series) Circular No. 5].
In November 2005, with a view to facilitating capacity expansion and technological upgradation in the Indian textile industry after the phasing out of Multi-Fibre Agreement, banks were allowed to issue guarantees, stand-by letters of credit, letters of undertaking or letters of comfort in respect of ECBs by textile companies for modernization or expansion of their textile units [RBI/2005-06/197A.P. (DIR Series) Circular No. 15].
Table 4: Borrower-wise External Debt: Compound Annual Growth Rate
(Per cent)
Components 1998-2008 2009-17
Non-Govt. Financial Sector (long-term) 9.8 14.9
Non-Govt. Non-Financial Private Sector (long-term) 1.2 10.8
Non-Govt. Non-Financial Public Sector (long-term) 17.2 7.0
Non-Govt. (short-term) 24.5 9.5
Govt. Debt (long + short-term) 2.2 7.0
Total External Debt 9.0 9.7
Source: Government of India and RBI.

ARTICLE
RBI Bulletin December 201732
Anatomy of India’s External Debt: Assessment of Key Trends
India, external debt remains largely foreign currency denominated, though the share of rupee denominated debt has gradually increased in recent years (Chart 8). As regards to India’s long-term public and publically guaranteed external debt, it is mainly held in US dollars (Chart 9).
Much of the increase in INR denominated debt is evident during the post-GFC crisis period as investment limits for FPI in the debt segment – in both G-sec and corporate bond market – have been gradually increased (Annex I).6 Moreover, relatively low inflation, stable value of the INR and positive
6 Other recent policy measures inter alia include permission of investments by FPIs in unlisted corporate debt securities and securitized debt instruments in February 2017.

ARTICLE
RBI Bulletin December 2017 33
Anatomy of India’s External Debt: Assessment of Key Trends
yield differentials also made Indian rupee debt particularly attractive for foreign investors. The spike in the corporate bond market could also be attributed to increased transparency and price discovery in recent years (SEBI, 2017). In September 2015, resident importers were allowed to raise trade credit in INR within the prescribed framework after entering into
a loan agreement with the overseas lenders. Similarly, domestic eligible entities have been permitted to raise INR denominated ECBs/bonds where the currency risk is borne by the lenders (Box I). Reflecting the impact of these measures, the share of the rupee denominated debt rose to 33.6 per cent at end-March 2017 from 11.6 per cent at end-March 2000.
In recent years, Masala bonds have become one of the
popular debt instruments for overseas borrowings by Indian
resident entities. Prior to the revision in the ECB policy
by the Reserve Bank in September 2015, the International
Financial Corporation and the Asian Development Bank
were permitted to issue rupee denominated bonds in the
overseas market to support infrastructure development
in the country. The revised policy allowed Indian
corporates, Real Estate Investment Trusts (REITs) and
Infrastructure Investment Trusts (InvITs) to issue Masala
bonds overseas. In November 2016, the Reserve Bank
allowed Indian banks to raise capital/long term funds
through Masala bonds. In February 2017, multilateral and
regional financial institutions were permitted to invest
in rupee denominated bonds (RDBs) which would have
also increased the appetite for rupee debt among overseas
investors. From the macro perspective, issuance of RDBs
have thus far been reckoned within the aggregate limit
of INR 2443.23 billion for foreign investment in corporate
debt. However, the issuances of RDBs have been excluded
from the limit for investments by FPIs in corporate bonds
with effect from October 3, 2017.
Since Masala bonds are INR-denominated, the currency
risk obviated for issuers. The London Stock Exchange (LSE)
has become the most popular market for Indian masala
bonds issuers, followed by Singapore Stock Exchange
(SGX) and Stock Exchange of Mauritius (SEM). The first
Indian resident issuer of Masala Bond was the Housing
Development Finance Corporation (HDFC) Ltd. on the
London Stock Exchange in July 2016. Since then, Indian
resident entities have issued/listed around US$ 2.7 billion
worth of Masala bonds in overseas capital markets during
July 2016 to July 2017 with the coupon rate in the range of
Box I: Masala Bonds
6.88 per cent to 9.05 per cent (Chart A). In 2016-17, RDBs
– including both privately placed and listed on overseas
stock exchanges – amounted to US$ 3.5 billion.
On a review of the framework for issuance of INR
denominated bonds overseas (Masala bonds) and with
a view to harmonising the various elements of the ECB
framework, in June 2017, the Reserve Bank decided that:
(i) Minimum original maturity period for Masala bonds
raised upto USD 50 million equivalent in INR per financial
year will be 3 years and for bonds raised above USD 50
million equivalent in INR per financial year will be 5
years; (ii) The all-in-cost ceiling for such bonds will be 300
basis points over the prevailing yield of the Government
of India securities of corresponding maturity; and (iii)
Entities permitted as investors should not be related party
within the meaning as given in India-AS 24.
Note: The issuance of Masala bonds by Indian resident entities in overseas capital markets was ‘Nil’ in November and December of 2016, and in February, June and July of 2017.Source: LSE, SGX, and SEM.
Chart A: Masala Bonds issued/listed by Indian resident entities in overseas capital markets
(Amount in US$ million)

ARTICLE
RBI Bulletin December 201734
Anatomy of India’s External Debt: Assessment of Key Trends
III.3 Instrument-wise classification of India’s external debt
Instrument-wise pattern of external debt has also undergone change in recent years. While foreign capital raised through market-based instruments such as bonds and notes has steadily increased in post-crisis period, the share of ‘loans’ moderated from 50 per cent at end-March 2008 to 40 per cent at end-March 2017. Nevertheless, majority of external debt continues to be raised in form of loans. The second largest instrument in India’s external debt is ‘currency and deposits’, which recorded a significant increase during September-November 2013 following the introduction of Swap Window for FCNR(B) dollar funds by the Reserve Bank in September 2013, resulting in the increase of its share from 20 per cent at end-March 2013 to 25 per cent at end-March 2014. Notwithstanding the lumpy redemption of FCNR(B) deposits in 2016-17, it continues to account for more than a quarter of external debt. The declining share of trade credit since end-March 2013 reflects slowdown in import activity (Chart 10).
IV. External Debt Sustainability and Vulnerability Indicators
External debt based indicators are important in determining external vulnerability of an economy. Conventionally, external debt is assessed in terms of its maturity structure, reserve adequacy and debt servicing for this purpose.
IV.1 Maturity Structure of External Debt
During the period of turbulence in global financial markets, countries with high exposure to short-term external debt run roll-over risk, especially if domestic fundamentals are weak. The conventional indicators used to gauge such risks are (i) share of short-term debt in total external debt; and (ii) reserves to short-term external debt. As the rate of accumulation of external debt decelerated during the 1990s, the share of short-term external debt by original maturity too declined to nearly 4 per cent by 2003-04, less than half of its level at end-March 1991. It increased in subsequent years mainly due to the elevated level of trade credit underlying a sharp rise in imports. Short-term debt based on residual maturity is a more operational indicator as it is based on actual debt service payments and as such, it helps to monitor the potential outflow of foreign exchange in the next twelve months.
IV.2 Reserve Cover
The reserve cover for external debt increased from 7 per cent at end-March 1991 to 138 per cent at end-March 2008 (Chart 11). With the sharp increase in external debt in the post-GFC period, the reserves cover fell to 68 per cent by end-March 2014. In the next three years, however, a net accumulation in foreign exchange reserves improved the cover to 78.4 per cent by end-March 2017, auguring well for debt servicing capacity. Another indicator – widely recognised as an important variable in the empirical literature (e.g., IMF, 2000; and Aizenman and Hutchison, 2010)

ARTICLE
RBI Bulletin December 2017 35
Anatomy of India’s External Debt: Assessment of Key Trends
referred as an early warning signal of exchange market pressure in emerging markets – is the ratio of short-term debt to reserves (Chart 12). In fact, forex reserves as at end-March 2017 were almost double the level of short-term debt obligations estimated on residual maturity basis. It implies that reserves far exceed the ratio of unity as conventionally recommended by the IMF (2000) as a starting point for analysis of reserve
adequacy for countries with significant but uncertain access to capital markets.
Further, debt distress phases are typically preceded by an increase in short-term external debt (residual maturity) and current account deficits which, in turn, increases pressure on existing foreign exchange reserves. By this measure as well, there has been a modest improvement in recent years. India’s foreign exchange reserves were of the order of about 175 per cent of its external financing requirement as at end-March 2017, much higher than in the taper talk period (Chart 13).
IV.3 Debt service ratio remains far modest relative to the 1990s
Another indicator that reflects debt related risks and is commonly used is the debt service ratio which is defined as gross debt service payments as ratio of current receipts.7 In general, India’s debt service ratio has been on a downward trajectory since 1990-91 except during the years when lumpy servicing occurred
7 The IMF defi nes debt service ratio as the ratio of external debt service payments of principal and interest on long-term and short-term debt to exports of goods and services for any one year (External Debt Statistics: Guide for Compilers and Users, 2003).

ARTICLE
RBI Bulletin December 201736
Anatomy of India’s External Debt: Assessment of Key Trends
due to pre-payments of external debt or redemption of special schemes such as Resurgent India Bonds and India Millennium Deposits. Furthermore, current receipts – reflecting the debt service capacity of the economy – also grew exponentially during 1999-2000 to 2011-12 and helped contain the debt service ratio during the period. A modest rise in debt service ratio in 2014-15 and 2015-16 was on account of decline in current receipts and/or higher payments due on account of redemption of ECBs. In 2016-17, however, debt service ratio improved mainly with the rise in current receipts (Chart 14).
From the debt sustainability perspective, various measures of indebtedness are used to identify solvency and liquidity risks. In the case of India, empirical analysis suggests that there is a unidirectional relationship from external debt stock to annual debt service payments. However, there is no such evidence when external debt is normalised by size of the economy (external debt-GDP ratio) and debt service payments are measured in terms of repayment capacity (Box II). In other words, analysis suggests that there is no evidence of ‘ponzi financing’ where foreign borrowings are raised to repay earlier
Risks relating to the external debt burden of an economy
are generally assessed against the debt service capacity of
the economy. The “debt overhang” literature underscores
the likelihood of larger debt affecting domestic growth as
expected debt service costs may adversely affect domestic
and foreign investment (Krugman, 1988 and Sachs, 1989).
Debt service ratios provide a metric of the potential
claim on resources and the associated risk of payment
difficulties and distress. According to the IMF, a low and
Box II: Relationship between India’s External Debt and Debt Service Payments
stable debt service ratio implies that the existing level of external debt is potentially sustainable. Following the empirical approach of other studies (e.g. Fatai et al 2016), the direction of causality is verified (from external debt to debt service payments or vice versa) using annual data for the period 1970 to 2016.
In view of the presence of unit root in both series (Annex II & III)8, all variables are taken as first differences of their
(Contd....)
8 However, for reference, results of only Augmented Dickey-Fuller test for checking unit root are provided in Annex II and III.
ARTICLE
RBI Bulletin December 2017 37
Anatomy of India’s External Debt: Assessment of Key Trends
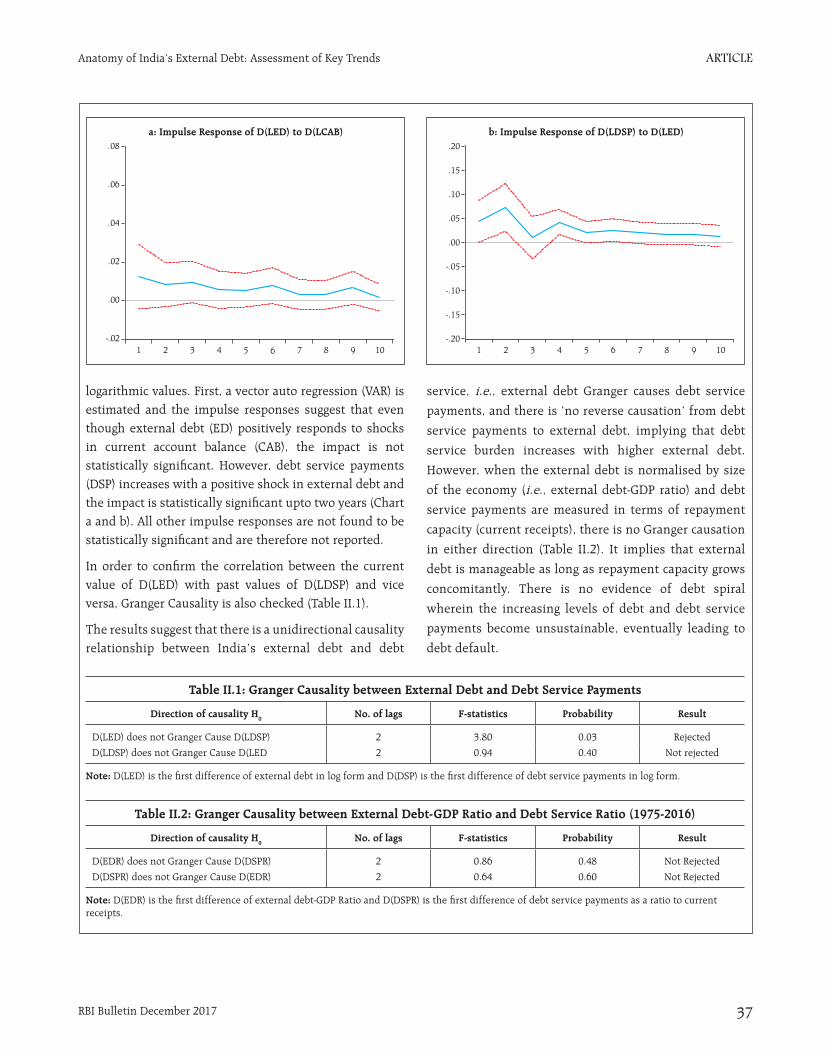
logarithmic values. First, a vector auto regression (VAR) is estimated and the impulse responses suggest that even though external debt (ED) positively responds to shocks in current account balance (CAB), the impact is not statistically significant. However, debt service payments (DSP) increases with a positive shock in external debt and the impact is statistically significant upto two years (Chart a and b). All other impulse responses are not found to be statistically significant and are therefore not reported.
In order to confi rm the correlation between the current value of D(LED) with past values of D(LDSP) and vice versa, Granger Causality is also checked (Table II.1).
The results suggest that there is a unidirectional causality relationship between India’s external debt and debt
Table II.1: Granger Causality between External Debt and Debt Service Payments
Direction of causality H0 No. of lags F-statistics Probability Result
D(LED) does not Granger Cause D(LDSP) 2 3.80 0.03 Rejected
D(LDSP) does not Granger Cause D(LED 2 0.94 0.40 Not rejected
Note: D(LED) is the first difference of external debt in log form and D(DSP) is the first difference of debt service payments in log form.
Table II.2: Granger Causality between External Debt-GDP Ratio and Debt Service Ratio (1975-2016)
Direction of causality H0 No. of lags F-statistics Probability Result
D(EDR) does not Granger Cause D(DSPR) 2 0.86 0.48 Not Rejected
D(DSPR) does not Granger Cause D(EDR) 2 0.64 0.60 Not Rejected
Note: D(EDR) is the first difference of external debt-GDP Ratio and D(DSPR) is the first difference of debt service payments as a ratio to current receipts.
service, i.e., external debt Granger causes debt service
payments, and there is ‘no reverse causation’ from debt
service payments to external debt, implying that debt
service burden increases with higher external debt.
However, when the external debt is normalised by size
of the economy (i.e., external debt-GDP ratio) and debt
service payments are measured in terms of repayment
capacity (current receipts), there is no Granger causation
in either direction (Table II.2). It implies that external
debt is manageable as long as repayment capacity grows
concomitantly. There is no evidence of debt spiral
wherein the increasing levels of debt and debt service
payments become unsustainable, eventually leading to
debt default.

ARTICLE
RBI Bulletin December 201738
Anatomy of India’s External Debt: Assessment of Key Trends
borrowings as was the case with some Latin American countries in the late 1990s.
V. A Cross-country Perspective
In terms of stock at the end of 2016, India is one of the most externally indebted EMEs – it is the fourth most external indebted country after China, Brazil and Russia. In terms of the external debt to GDP ratio, however, India’s position is relatively better. In terms of reserve cover for total external debt, India ranks better than Brazil and Russia. Similarly, the share of short-term debt (original maturity) in India’s total external debt was modest relative than China, Malaysia, Thailand, South Africa, Argentina, Turkey, and Philippines. However, the reserve cover for short-term debt (residual maturity) was thinner than other EMEs, except South Africa, Turkey, and Malaysia (Chart 15).
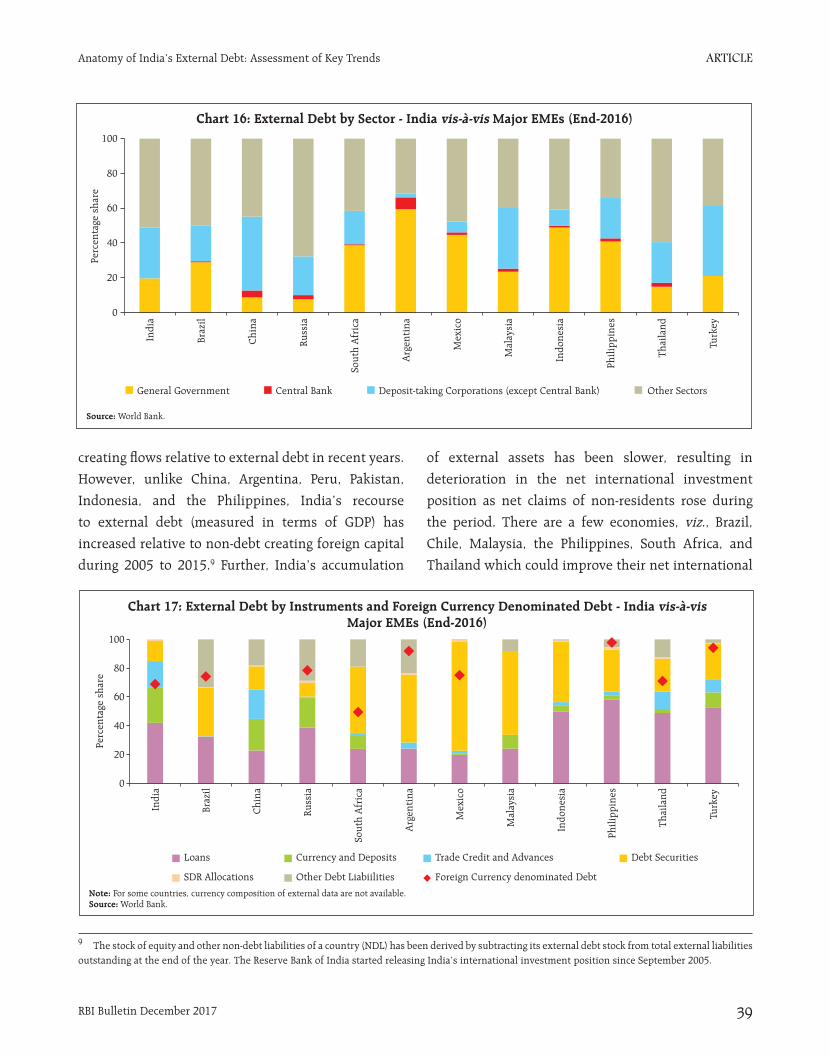
Government (sovereign) debt constitutes nearly 20 per cent of total external debt, which is lower than other major EMEs such as Argentina (59 per cent), Indonesia (49 per cent), Mexico (45 per cent), Philippines (41 per cent), and South Africa (39 per cent). Deposit-taking corporations (except the central
bank) in India account for around 29 per cent of
external debt; the ratio is higher in case of China
(43 per cent), Turkey (40 per cent), and Malaysia (35
per cent). In case of India, the share of non-financial
sector (other sector) in total external debt is lower
than Russia and Thailand (Chart 16).
In terms of instruments, India’s external debt has
been largely through ‘loans’, accounting for over 40
per cent of total outstanding debt at end-2016. Major
EMEs where ‘loans’. constitute a higher share in debt
than India include the Philippines, Turkey, Indonesia,
and Thailand. India’s share of ‘currency and deposits’
in total external debt was the highest among major
EMEs, whereas the share of ‘trade credit and advances’
in total external debt is the second highest after China.
India’s external debt raised through debt securities is
lower than most other EMEs including China, Brazil,
and South Africa. The Philippines, Turkey, Argentina,
Russia, Mexico, and Brazil have a higher share of
their external debt in foreign currencies than India
(Chart 17).
A cross-country comparison shows that a number
of EMEs increased their dependence on non-debt
ARTICLE
RBI Bulletin December 2017 39
Anatomy of India’s External Debt: Assessment of Key Trends
creating flows relative to external debt in recent years.
However, unlike China, Argentina, Peru, Pakistan,
Indonesia, and the Philippines, India’s recourse
to external debt (measured in terms of GDP) has
increased relative to non-debt creating foreign capital
during 2005 to 2015.9 Further, India’s accumulation
of external assets has been slower, resulting in
deterioration in the net international investment
position as net claims of non-residents rose during
the period. There are a few economies, viz., Brazil,
Chile, Malaysia, the Philippines, South Africa, and
Thailand which could improve their net international
9 The stock of equity and other non-debt liabilities of a country (NDL) has been derived by subtracting its external debt stock from total external liabilities outstanding at the end of the year. The Reserve Bank of India started releasing India’s international investment position since September 2005.

ARTICLE
RBI Bulletin December 201740
Anatomy of India’s External Debt: Assessment of Key Trends
investment positions despite increased recourse to debt and/or equity liabilities (Chart 18).
VI. Conclusion
To conclude, India’s external debt has exhibited a marked transformation since the early 1990s. While India has been prudent in moving gradually and incrementally in liberalising the capital account, its external debt has expanded in size and its composition has changed over the years in line with evolving needs and policy choices. The growing share of non-government debt and non-concessional debt signifies the expanded role of the Indian private corporate sector in domestic economic activity, but also vulnerability to credit and market risks. Even though India’s short-term debt has increased since mid-2000s, the concomitant rise in foreign exchange reserves (aided by robust current receipts) has insulated the domestic economy from an external debt trap as suggested by empirical analysis.
Another key change in the profile of external debt is the increasing share of INR denominated debt in recent years which can be attributed to major policy initiatives taken by the Government and the Reserve
Bank and the increasing appetite of foreign investors for INR denominated debt. On various parameters of external debt indicators, India fares better than the peer economies except China. Nevertheless, the growing reliance on debt financing – especially portfolio debt inflows – could create external vulnerabilities in the face of intensified global financial volatility and thus warrants regular monitoring.
References
Aizenman, Joshua and Michael M. Hutchison (2010), “Exchange Market Pressure and Absorption by International Reserves: Emerging Markets and Fear of Reserve Loss during the 2008-09 Crisis”, NBER Working Paper No. 16260.
Fatai, O.O. (2016), “Causal Nexus between External Debt and Economic Growth: The Nigerian Case”, International Journal of Management and Commerce Innovations, Vol. 4, Issue 1, pp: 92-98,
International Monetary Fund (2000), “Debt – and Reserve-Related Indicators of External Vulnerability”, Prepared by the Policy Development and Review Department in consultation with Other Departments, March.

ARTICLE
RBI Bulletin December 2017 41
Anatomy of India’s External Debt: Assessment of Key Trends
International Monetary Fund (2003), “External Debt Statistics: Guide for Compilers and Users”, June.
Krugman, Paul (1988) “Financing vs. Forgiving a Debt Overhang”. Journal of Development Economics, Vol. 29: 253-268.
Lindner, Peter and Sung Eun Jung (2014), “Corporate Vulnerabilities in India and Banks’ Loan Performance”, IMF Working Paper No.14/232.
Manzocchi, Stefano (1997), “External Finance and Foreign Debt in Central and Eastern European Countries” IMF Working Paper No. 97/134.
Sachs, Jeffrey (1989), “The Debt Overhang of Developing Countries,” in Debt Stabilization and Development: Essay in Memory of Carlos Diaz Alejandro, ed. by Calvo, A. Guillermo, and others, (Basil Blackwell: Oxford), p. 80-102.
Securities and Exchange Board of India (2017), Annual Report, 2016-17.
World Bank (2016), International Debt Statistics, World Bank Group.
World Bank (2017), International Debt Statistics, World Bank Group.

ARTICLE
RBI Bulletin December 201742
Anatomy of India’s External Debt: Assessment of Key Trends
Annex I: Major Policy Changes for FPI’s Participation in Indian Debt Market
Year Government bonds Year Corporate bonds
Apr. 2004 FII permitted in T-bills Mar. 1998 FIIs also permitted in unlisted debt securities within the overall approved ceiling*
Nov.-2004 FII limit raised to US$ 1.75 billion Dec. 2004 Separate FII limit of 0.5 billion over and above the limit for government bonds
Apr. 2006 FII limit raised to US$ 2.0 billion Apr. 2006 Limit raised to US$ 1.5 billion and restricted to listed corporate bonds only
Jan. 2007 FII limit raised to US$ 2.6 billion Sep. 2006 Separate limit of US$ 0.5 billion in Tier II bonds
Jan. 2008 FII limit raised to US$ 3.2 billion Jun. 2008 Limit raised to US$ 3.0 billion
Jun. 2008 FII limit raised to US$ 5.0 billion Oct. 2008 Limit raised to US$ 6.0 billion
Nov. 2010 Limit raised to US$ 10 billion (incremental amount of US$ 5 billion to be invested in long-term G-sec with maturity of over 5 years.
Feb. 2009 Limit raised to US$ 15 billion
Nov. 2011 Limit increased to US$15 billion Nov. 2010 Limit raised to US$ 20 billion#
Jun. 2012 Sub-limit for G-sec (long-term) increased to US$ 10 billion
Mar. 2011 Limit raised in long-term bonds to US$ 25 billion
Jan. 2013 Total limit raised to US$ 25 billion
Sublimit for long-term category raised to US$ 15 billion
No investment in T-bills
Nov. 2011 Limit increased by US$ 5 billion
Jun. 2013 Total limit enhanced to US$ 30 billion Sep. 2012 QFIs allowed up to US$ 1 billion
Apr. 2014 FII permitted in G-Sec with residual maturity of one year and above
Apr. 2013 Limit set at US$ 51 billion (by merging sub-limits)
Jul. 2014 Increase in sub-limit to US$ 25 billion within the existing limit for investment in G-sec (US$ 30 billion)with minimum residual maturity of 3 years (corresponding reduction of US$ 5 billion in limit for SWFs, Insurance and pension funds, etc.)
Apr. 2016 Limit of US$ 51 billion fixed in Rupee terms at Rs. 2443.23 billion (including masala bonds)
Oct. 2015 Quarterly increases in FPI limits for Central G-Sec and SDLs since October 2015
Sep. 22, 2017 Rs. 2273.22 billion (excluding masala bonds) w.e.f. Oct.3, 2017
Additional limit of Rs. 170.01 billion for Q4 FY18
FPI limit of Rs. 2443.23 billion for corporate bonds (excluding masala bonds) from Jan. 01, 2017
As at end Mar. 2017 Rs. 2,410 billion (~US$35 billion)^
As at end Sep. 2017 Rs. 2,751 billion (~US$43 billion)
From Oct. 3, 2017 Rs. 2,893 billion (~US$44 billion)
*Within the overall approved debt ceiling, separate sub-limits of US$ 0.1 billion for 70:30 route and US$ 0.9 billion for 100 per cent debt limit route which were also subsequently modified till the demarcation of these routes were eliminated in January 2008.
# Incremental amount for long-term bonds (> 5 years) of infrastructure companies.
^Since October 2015, the limits for investment by FPIs in Central Government Securities and State Development Loans are announced/ fixed in Rupee terms. Figures in brackets are estimated using reference rate for INR against USD at the beginning of the quarter.
ARTICLE
RBI Bulletin December 2017 43
Anatomy of India’s External Debt: Assessment of Key Trends
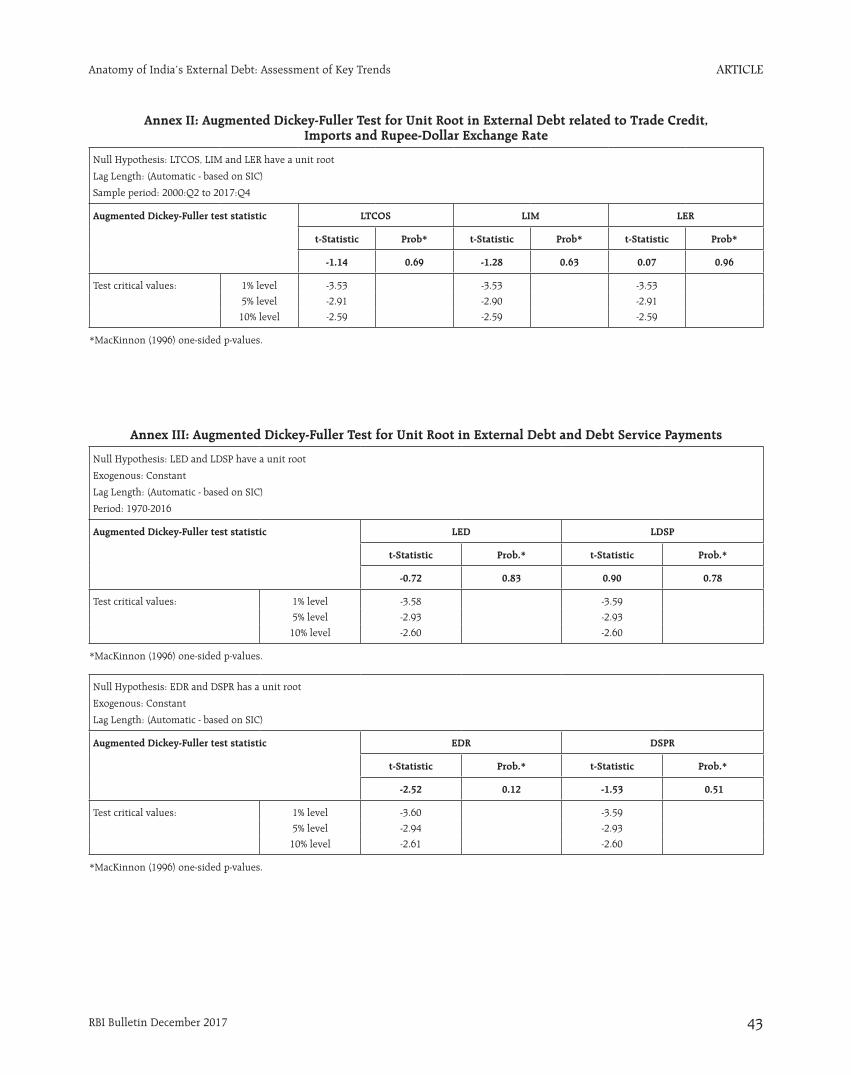
Annex II: Augmented Dickey-Fuller Test for Unit Root in External Debt related to Trade Credit, Imports and Rupee-Dollar Exchange Rate
Null Hypothesis: LTCOS, LIM and LER have a unit root
Lag Length: (Automatic - based on SIC)
Sample period: 2000:Q2 to 2017:Q4
Augmented Dickey-Fuller test statistic LTCOS LIM LER
t-Statistic Prob* t-Statistic Prob* t-Statistic Prob*
-1.14 0.69 -1.28 0.63 0.07 0.96
Test critical values: 1% level -3.53 -3.53 -3.53
5% level -2.91 -2.90 -2.91
10% level -2.59 -2.59 -2.59
*MacKinnon (1996) one-sided p-values.
Annex III: Augmented Dickey-Fuller Test for Unit Root in External Debt and Debt Service Payments
Null Hypothesis: LED and LDSP have a unit root
Exogenous: Constant
Lag Length: (Automatic - based on SIC)
Period: 1970-2016
Augmented Dickey-Fuller test statistic LED LDSP
t-Statistic Prob.* t-Statistic Prob.*
-0.72 0.83 0.90 0.78
Test critical values: 1% level -3.58 -3.59
5% level -2.93 -2.93
10% level -2.60 -2.60
*MacKinnon (1996) one-sided p-values.
Null Hypothesis: EDR and DSPR has a unit root
Exogenous: Constant
Lag Length: (Automatic - based on SIC)
Augmented Dickey-Fuller test statistic EDR DSPR
t-Statistic Prob.* t-Statistic Prob.*
-2.52 0.12 -1.53 0.51
Test critical values: 1% level -3.60 -3.59
5% level -2.94 -2.93
10% level -2.61 -2.60
*MacKinnon (1996) one-sided p-values.
Related Documents