Harvard MIT Stanford Caltech Columbia Berkeley Cambridge ali rsità appartenenza dei vincitori al momento dell’assegnazione del Nobel La pluri-premiata: Marie Curie, la prima a vincere due Nobel (in fisica e in chimica) Il più vecchio: Leonid Hurwicz, il successo arriva a 90 anni 2. 2. 7. La signora dell’economia: Elinor Ostrom, l’unica donna a vincere un Nobel in ambito economico 7. 4. Il più giovane: Lawrence Bragg, a 25 anni è già Nobel 3. L’orgoglio di mamma e papà: Jan e Nikolaas Tinbergen, gli unici fratelli ad aver vinto un Nobel (il primo in economia, il secondo in medicina) 4. L’autodidatta: Guglielmo Marconi, l’unico tra i Nobel per la fisica a non avere una laurea 5. 6. Il postumo: Erik Axel Karlfeldt, il primo a ricevere il Nobel dopo la morte 1. nati in ciascuna città 1931 1961 1991 1 7 4 12 1 1 5 6 1 4 4 9 5 2 5 6 4 2 10 4 2 3 13 3 3 2 8 2 3 2 7 5 28 17 La visualizzazione esplora le caratteristiche di venticinque tra le più importanti Le città ordinate per latitudine (in cinque fasce) e per longitudine (all'in sono analizzate attraverso parametri demografici, territoriali, ambientali, ec La forma del poligono e degli elementi che lo compongono restituisc C dimensioni possibili (kmq) età nu altezza edificio più alto (m) prezzo medio degli imm numero di visitatori e turisti (mln) precipitazioni media annuale (mm) temperatura anno di fondazione 1529 città sup rap dim cen zona temperata zona temperata zona temperata zona tropicale zona temperata 753 a.C. 10. Roma 2,7 6.398 103 5,9 16. Shan 5.192 6,9 10 1619 1,9 1.572 262 22. Giacarta 500 a.C. 9. Milano 1,3 6.250 231 7,1 19,6 4.238 5,1 5,3 1819 19,8 12.246 280 21. Singapore 11,5 4,1 13.156 885 8. Praga 1,2 3,7 109 3.645 1833 14. Dubai 2,1 3.003 7,7 8,2 1769 12,3 2.244 304 76 0,3 1.785 0,1 0,5 100 5. Londra 8,1 15,1 308 310 2.680 3,7 1850 0,3 3.638 131 1,8 17. Honolulu 2,8 23. Buenos Aires 2,9 2.354 173 1536 53 a.C. 6. Parigi 2,2 8,4 209 14.862 140 0,5 3,2 59 3.097 8,2 10.019 1521 18. Città del Messico 2,8 8,8 1.561 225 1 1886 24. Johannesburg 2,2 932 223 5 2,9 118 2.281 1237 7. Berlino 3,5 3,7 125 3.129 13. Lisbona 0,5 1.760 110 2,1 138 a.C. 3,1 1899 19. Nairobi 1,8 674 140 4,6 1788 25. Sydney 2,6 244 6.529 0,1 1,4 2,5 1,5 0,1 0,9 0,5 0,2 1,2 0,1 4,1 16,8 0,2 1,5 0,7 1,5 0,7 1,2 0,7 0,2 0,5 12,1 20. Bangkok I dati sono stati raccolti da: city-data.com, currentresults.com, euromonitor.com, globalpropertyguide.com, skyscrapercenter.com, weatherbase.com, wikipedia.org. 1. 2. 11. 17. 23. 24. 18. 19. 12. 13. 14. 5. 6. 7. 8. 9. 10. 3. 4. stories, architecture, inspiration ANATOMY OF A DATA-VISUALIZATION

Anatomy of a dataviz
Jan 27, 2015
Accurat's data visualization for La Lettura dissected and explained / lectures for NYU ITP + Parsons Media and Technology Students, February and March 2013
Welcome message from author
This document is posted to help you gain knowledge. Please leave a comment to let me know what you think about it! Share it to your friends and learn new things together.
Transcript
2012
Har
vard
MIT
Stan
ford
Calt
ech
Colu
mbi
a
Berk
eley
Cam
brid
gele p
rinci
pali
univ
ersi
tàdi
app
arte
nenz
a
dei v
inci
tori
al m
omen
tode
ll’as
segn
azio
ne
del N
obel
La pluri-premiata:
Marie Curie,
la prima a vincere
due Nobel (in fisica
e in chimica)
Il più vecchio:
Leonid Hurwicz,
il successo arriva
a 90 anni
2.
2. 7.
La signora dell’economia:
Elinor Ostrom, l’unica
donna a vincere un Nobel
in ambito economico7.
4.
Il più giovane:
Lawrence Bragg,
a 25 anni è già Nobel3.
L’orgoglio di mamma e papà:
Jan e Nikolaas Tinbergen,
gli unici fratelli ad aver
vinto un Nobel (il primo
in economia, il secondo
in medicina)
4.
L’autodidatta:
Guglielmo Marconi,
l’unico tra i Nobel
per la fisica a non avere
una laurea
5.
6.Il postumo:
Erik Axel Karlfeldt,
il primo a ricevere
il Nobel dopo la morte
1.
tota
lede
i vin
cito
rina
ti in
cias
cuna
città
1901
1931
1961
2012
1991
1
7
4
12
1
1
5
7
6
1
7
4
4
9
17
11
5
2
5
23
6
7
4
2
10
4
2
3
13
3
3
2
8
2
3
2
7
5
28
17
51
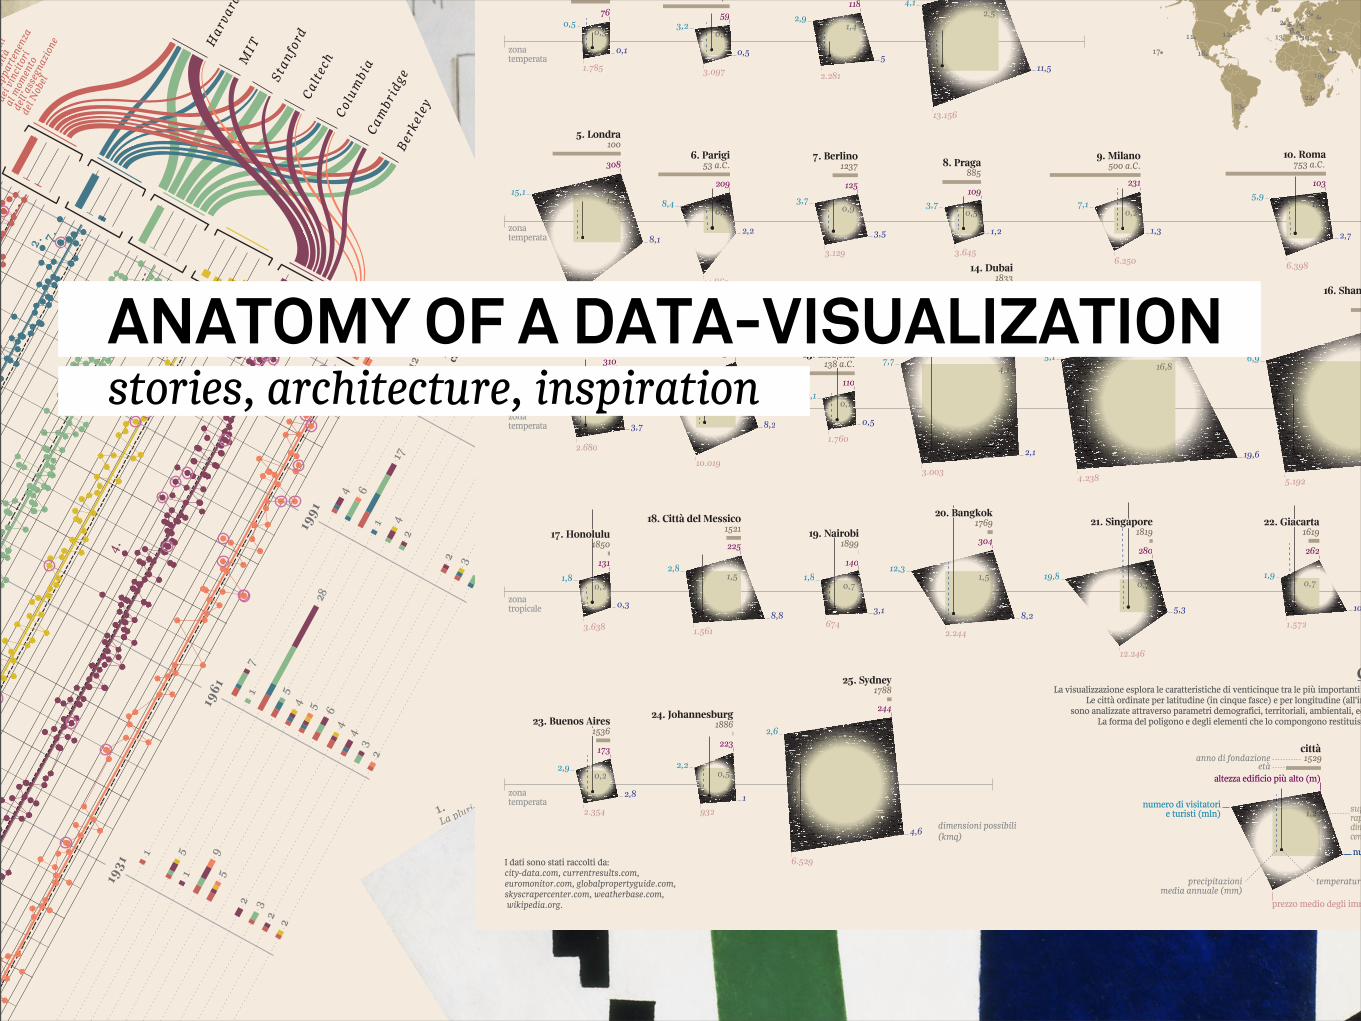
La visualizzazione esplora le caratteristiche di venticinque tra le più importanti metropoli internazionali.Le città ordinate per latitudine (in cinque fasce) e per longitudine (all'interno della stessa fascia)
sono analizzate attraverso parametri demografici, territoriali, ambientali, economici e architettonici.La forma del poligono e degli elementi che lo compongono restituiscono l’identità della città.
Come si legge?
dimensioni possibili (kmq)
età
numero di abitanti (mln)
altezza edificio più alto (m)
prezzo medio degli immobili (
numero di visitatorie turisti (mln)
precipitazionimedia annuale (mm)
temperatura media annule (
anno di fondazione 1529città
superficie (migliaia di kmq) rappdimcentra
zonatemperata
zonatemperata
zonatemperata
zona tropicale
zonatemperata
753 a.C.10. Roma
2,7
6.398
1035,9
16. Shanghai
5.192
6,9
10,1
1619
1,9
1.572
262
22. Giacarta
500 a.C.9. Milano
1,3
6.250
231
7,1
723 a.C.15. Pechino
19,6
4.238
330
5,1
5,3
1819
19,8
12.246
280
21. Singapore
11,5
4,1
13.156
8858. Praga
1,2
3,7109
3.645
183314. Dubai
2,1
3.003
828
7,7
8,2
1769
12,3
2.244
304
76
0,3
1.785
0,1
0,5
1005. Londra
8,1
15,1
308
19.316
178111. Los Angeles
310
2.680
3,7
4,9
1850
0,3
3.638
131
1,8
17. Honolulu
2,8
23. Buenos Aires
2,9
2.354
173
1536
53 a.C.6. Parigi
2,2
8,4
209
14.862
140
0,5
3,259
3.097
161312. New York
8,2
10.019
381
10
152118. Città del Messico
2,8
8,8
1.561
225
1
188624. Johannesburg
2,2
932
223
5
2,9118
2.281
12377. Berlino
3,5
3,7
125
3.129
13. Lisbona
0,5
1.760
1102,1
138 a.C.
3,1
189919. Nairobi
1,8
674
140
4,6
178825. Sydney
2,6
244
6.529
0,11,4
2,5
1,50,1 0,9 0,5 0,2
1,2
1,3 1,20,1
4,1 16,8
0,21,5
0,71,5
0,7
1,2
0,7
0,2 0,5
12,1
20. Bangkok
I dati sono stati raccolti da: city-data.com, currentresults.com, euromonitor.com, globalpropertyguide.com, skyscrapercenter.com, weatherbase.com, wikipedia.org.
1.
2.
11.
17.
23.24.
18.
19.
12. 13.
14.
5.6.
7.8.9.10.
3. 4.
stories, architecture, inspirationANATOMY OF A DATA-VISUALIZATION

2012
Har
vard
MIT
Stan
ford
Calt
ech
Colu
mbi
a
Berk
eley
Cam
brid
gele p
rinci
pali
univ
ersi
tàdi
app
arte
nenz
a
dei v
inci
tori
al m
omen
tode
ll’as
segn
azio
ne
del N
obel
La pluri-premiata:
Marie Curie,
la prima a vincere
due Nobel (in fisica
e in chimica)
Il più vecchio:
Leonid Hurwicz,
il successo arriva
a 90 anni
2.
2. 7.
La signora dell’economia:
Elinor Ostrom, l’unica
donna a vincere un Nobel
in ambito economico7.
4.
Il più giovane:
Lawrence Bragg,
a 25 anni è già Nobel3.
L’orgoglio di mamma e papà:
Jan e Nikolaas Tinbergen,
gli unici fratelli ad aver
vinto un Nobel (il primo
in economia, il secondo
in medicina)
4.
L’autodidatta:
Guglielmo Marconi,
l’unico tra i Nobel
per la fisica a non avere
una laurea
5.
6.Il postumo:
Erik Axel Karlfeldt,
il primo a ricevere
il Nobel dopo la morte
1.
tota
lede
i vin
cito
rina
ti in
cias
cuna
città
1901
1931
1961
2012
1991
1
7
4
12
1
1
5
7
6
1
7
4
4
9
17
11
5
2
5
23
6
7
4
2
10
4
2
3
13
3
3
2
8
2
3
2
7
5
28
17
51
La visualizzazione esplora le caratteristiche di venticinque tra le più importanti metropoli internazionali.Le città ordinate per latitudine (in cinque fasce) e per longitudine (all'interno della stessa fascia)
sono analizzate attraverso parametri demografici, territoriali, ambientali, economici e architettonici.La forma del poligono e degli elementi che lo compongono restituiscono l’identità della città.
Come si legge?
dimensioni possibili (kmq)
età
numero di abitanti (mln)
altezza edificio più alto (m)
prezzo medio degli immobili (
numero di visitatorie turisti (mln)
precipitazionimedia annuale (mm)
temperatura media annule (
anno di fondazione 1529città
superficie (migliaia di kmq) rappdimcentra
zonatemperata
zonatemperata
zonatemperata
zona tropicale
zonatemperata
753 a.C.10. Roma
2,7
6.398
1035,9
16. Shanghai
5.192
6,9
10,1
1619
1,9
1.572
262
22. Giacarta
500 a.C.9. Milano
1,3
6.250
231
7,1
723 a.C.15. Pechino
19,6
4.238
330
5,1
5,3
1819
19,8
12.246
280
21. Singapore
11,5
4,1
13.156
8858. Praga
1,2
3,7109
3.645
183314. Dubai
2,1
3.003
828
7,7
8,2
1769
12,3
2.244
304
76
0,3
1.785
0,1
0,5
1005. Londra
8,1
15,1
308
19.316
178111. Los Angeles
310
2.680
3,7
4,9
1850
0,3
3.638
131
1,8
17. Honolulu
2,8
23. Buenos Aires
2,9
2.354
173
1536
53 a.C.6. Parigi
2,2
8,4
209
14.862
140
0,5
3,259
3.097
161312. New York
8,2
10.019
381
10
152118. Città del Messico
2,8
8,8
1.561
225
1
188624. Johannesburg
2,2
932
223
5
2,9118
2.281
12377. Berlino
3,5
3,7
125
3.129
13. Lisbona
0,5
1.760
1102,1
138 a.C.
3,1
189919. Nairobi
1,8
674
140
4,6
178825. Sydney
2,6
244
6.529
0,11,4
2,5
1,50,1 0,9 0,5 0,2
1,2
1,3 1,20,1
4,1 16,8
0,21,5
0,71,5
0,7
1,2
0,7
0,2 0,5
12,1
20. Bangkok
I dati sono stati raccolti da: city-data.com, currentresults.com, euromonitor.com, globalpropertyguide.com, skyscrapercenter.com, weatherbase.com, wikipedia.org.
1.
2.
11.
17.
23.24.
18.
19.
12. 13.
14.
5.6.
7.8.9.10.
3. 4.
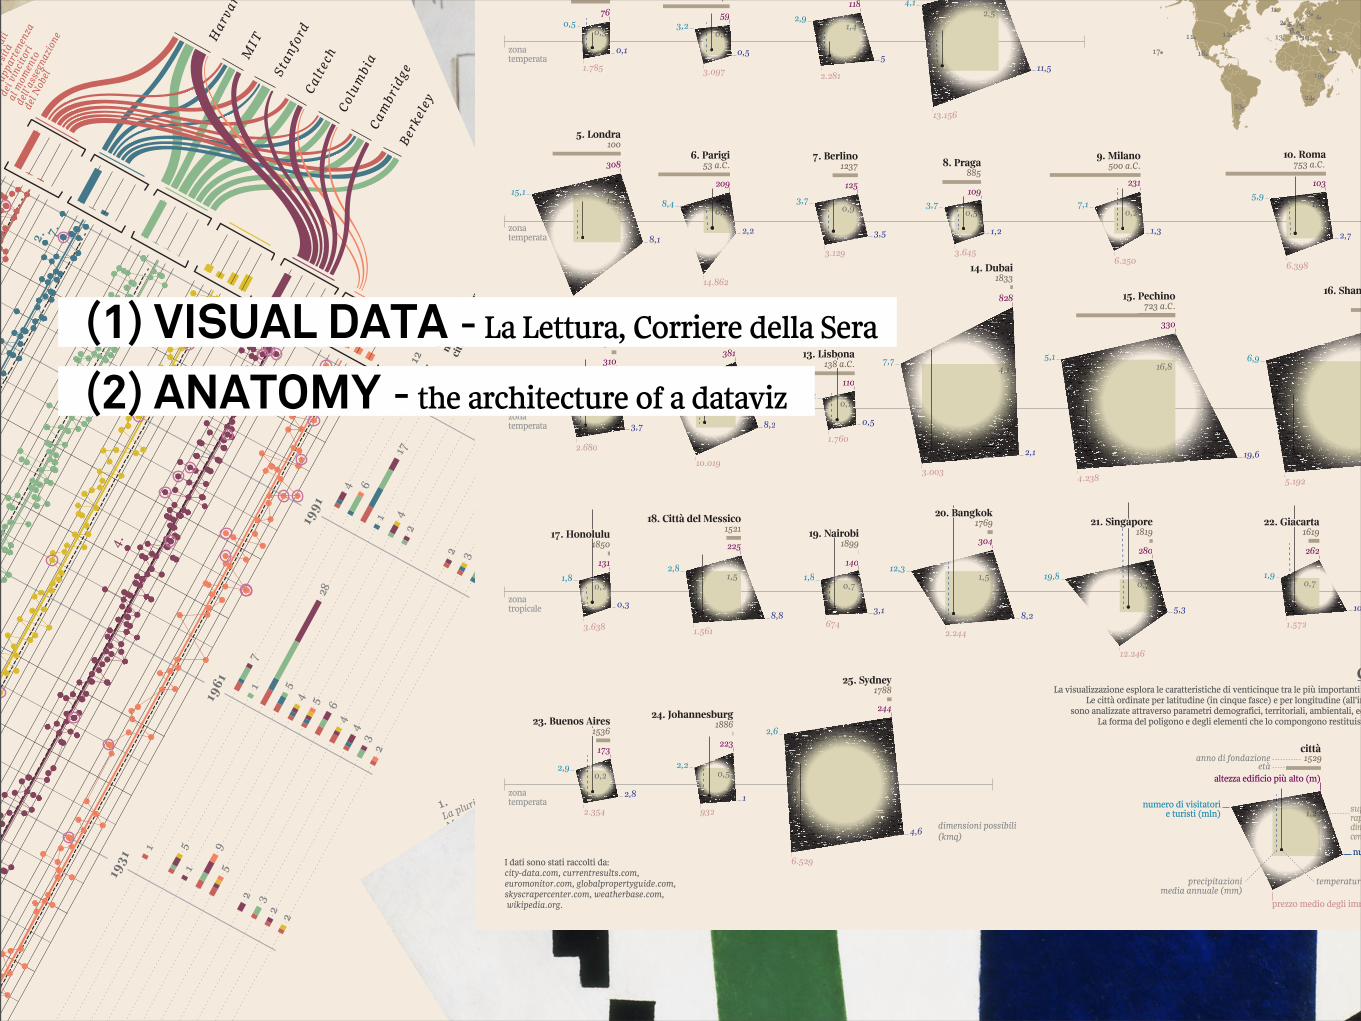
(1) VISUAL DATA - La Lettura, Corriere della Sera
2012
Har
vard
MIT
Stan
ford
Calt
ech
Colu
mbi
a
Berk
eley
Cam
brid
gele p
rinci
pali
univ
ersi
tàdi
app
arte
nenz
a
dei v
inci
tori
al m
omen
tode
ll’as
segn
azio
ne
del N
obel
La pluri-premiata:
Marie Curie,
la prima a vincere
due Nobel (in fisica
e in chimica)
Il più vecchio:
Leonid Hurwicz,
il successo arriva
a 90 anni
2.
2. 7.
La signora dell’economia:
Elinor Ostrom, l’unica
donna a vincere un Nobel
in ambito economico7.
4.
Il più giovane:
Lawrence Bragg,
a 25 anni è già Nobel3.
L’orgoglio di mamma e papà:
Jan e Nikolaas Tinbergen,
gli unici fratelli ad aver
vinto un Nobel (il primo
in economia, il secondo
in medicina)
4.
L’autodidatta:
Guglielmo Marconi,
l’unico tra i Nobel
per la fisica a non avere
una laurea
5.
6.Il postumo:
Erik Axel Karlfeldt,
il primo a ricevere
il Nobel dopo la morte
1.
tota
lede
i vin
cito
rina
ti in
cias
cuna
città
1901
1931
1961
2012
1991
1
7
4
12
1
1
5
7
6
1
7
4
4
9
17
11
5
2
5
23
6
7
4
2
10
4
2
3
13
3
3
2
8
2
3
2
7
5
28
17
51
La visualizzazione esplora le caratteristiche di venticinque tra le più importanti metropoli internazionali.Le città ordinate per latitudine (in cinque fasce) e per longitudine (all'interno della stessa fascia)
sono analizzate attraverso parametri demografici, territoriali, ambientali, economici e architettonici.La forma del poligono e degli elementi che lo compongono restituiscono l’identità della città.
Come si legge?
dimensioni possibili (kmq)
età
numero di abitanti (mln)
altezza edificio più alto (m)
prezzo medio degli immobili (
numero di visitatorie turisti (mln)
precipitazionimedia annuale (mm)
temperatura media annule (
anno di fondazione 1529città
superficie (migliaia di kmq) rappdimcentra
zonatemperata
zonatemperata
zonatemperata
zona tropicale
zonatemperata
753 a.C.10. Roma
2,7
6.398
1035,9
16. Shanghai
5.192
6,9
10,1
1619
1,9
1.572
262
22. Giacarta
500 a.C.9. Milano
1,3
6.250
231
7,1
723 a.C.15. Pechino
19,6
4.238
330
5,1
5,3
1819
19,8
12.246
280
21. Singapore
11,5
4,1
13.156
8858. Praga
1,2
3,7109
3.645
183314. Dubai
2,1
3.003
828
7,7
8,2
1769
12,3
2.244
304
76
0,3
1.785
0,1
0,5
1005. Londra
8,1
15,1
308
19.316
178111. Los Angeles
310
2.680
3,7
4,9
1850
0,3
3.638
131
1,8
17. Honolulu
2,8
23. Buenos Aires
2,9
2.354
173
1536
53 a.C.6. Parigi
2,2
8,4
209
14.862
140
0,5
3,259
3.097
161312. New York
8,2
10.019
381
10
152118. Città del Messico
2,8
8,8
1.561
225
1
188624. Johannesburg
2,2
932
223
5
2,9118
2.281
12377. Berlino
3,5
3,7
125
3.129
13. Lisbona
0,5
1.760
1102,1
138 a.C.
3,1
189919. Nairobi
1,8
674
140
4,6
178825. Sydney
2,6
244
6.529
0,11,4
2,5
1,50,1 0,9 0,5 0,2
1,2
1,3 1,20,1
4,1 16,8
0,21,5
0,71,5
0,7
1,2
0,7
0,2 0,5
12,1
20. Bangkok
I dati sono stati raccolti da: city-data.com, currentresults.com, euromonitor.com, globalpropertyguide.com, skyscrapercenter.com, weatherbase.com, wikipedia.org.
1.
2.
11.
17.
23.24.
18.
19.
12. 13.
14.
5.6.
7.8.9.10.
3. 4.
(1) VISUAL DATA - La Lettura, Corriere della Sera
(2) ANATOMY - the architecture of a dataviz
2012
Har
vard
MIT
Stan
ford
Calt
ech
Colu
mbi
a
Berk
eley
Cam
brid
gele p
rinci
pali
univ
ersi
tàdi
app
arte
nenz
a
dei v
inci
tori
al m
omen
tode
ll’as
segn
azio
ne
del N
obel
La pluri-premiata:
Marie Curie,
la prima a vincere
due Nobel (in fisica
e in chimica)
Il più vecchio:
Leonid Hurwicz,
il successo arriva
a 90 anni
2.
2. 7.
La signora dell’economia:
Elinor Ostrom, l’unica
donna a vincere un Nobel
in ambito economico7.
4.
Il più giovane:
Lawrence Bragg,
a 25 anni è già Nobel3.
L’orgoglio di mamma e papà:
Jan e Nikolaas Tinbergen,
gli unici fratelli ad aver
vinto un Nobel (il primo
in economia, il secondo
in medicina)
4.
L’autodidatta:
Guglielmo Marconi,
l’unico tra i Nobel
per la fisica a non avere
una laurea
5.
6.Il postumo:
Erik Axel Karlfeldt,
il primo a ricevere
il Nobel dopo la morte
1.
tota
lede
i vin
cito
rina
ti in
cias
cuna
città
1901
1931
1961
2012
1991
1
7
4
12
1
1
5
7
6
1
7
4
4
9
17
11
5
2
5
23
6
7
4
2
10
4
2
3
13
3
3
2
8
2
3
2
7
5
28
17
51
La visualizzazione esplora le caratteristiche di venticinque tra le più importanti metropoli internazionali.Le città ordinate per latitudine (in cinque fasce) e per longitudine (all'interno della stessa fascia)
sono analizzate attraverso parametri demografici, territoriali, ambientali, economici e architettonici.La forma del poligono e degli elementi che lo compongono restituiscono l’identità della città.
Come si legge?
dimensioni possibili (kmq)
età
numero di abitanti (mln)
altezza edificio più alto (m)
prezzo medio degli immobili (
numero di visitatorie turisti (mln)
precipitazionimedia annuale (mm)
temperatura media annule (
anno di fondazione 1529città
superficie (migliaia di kmq) rappdimcentra
zonatemperata
zonatemperata
zonatemperata
zona tropicale
zonatemperata
753 a.C.10. Roma
2,7
6.398
1035,9
16. Shanghai
5.192
6,9
10,1
1619
1,9
1.572
262
22. Giacarta
500 a.C.9. Milano
1,3
6.250
231
7,1
723 a.C.15. Pechino
19,6
4.238
330
5,1
5,3
1819
19,8
12.246
280
21. Singapore
11,5
4,1
13.156
8858. Praga
1,2
3,7109
3.645
183314. Dubai
2,1
3.003
828
7,7
8,2
1769
12,3
2.244
304
76
0,3
1.785
0,1
0,5
1005. Londra
8,1
15,1
308
19.316
178111. Los Angeles
310
2.680
3,7
4,9
1850
0,3
3.638
131
1,8
17. Honolulu
2,8
23. Buenos Aires
2,9
2.354
173
1536
53 a.C.6. Parigi
2,2
8,4
209
14.862
140
0,5
3,259
3.097
161312. New York
8,2
10.019
381
10
152118. Città del Messico
2,8
8,8
1.561
225
1
188624. Johannesburg
2,2
932
223
5
2,9118
2.281
12377. Berlino
3,5
3,7
125
3.129
13. Lisbona
0,5
1.760
1102,1
138 a.C.
3,1
189919. Nairobi
1,8
674
140
4,6
178825. Sydney
2,6
244
6.529
0,11,4
2,5
1,50,1 0,9 0,5 0,2
1,2
1,3 1,20,1
4,1 16,8
0,21,5
0,71,5
0,7
1,2
0,7
0,2 0,5
12,1
20. Bangkok
I dati sono stati raccolti da: city-data.com, currentresults.com, euromonitor.com, globalpropertyguide.com, skyscrapercenter.com, weatherbase.com, wikipedia.org.
1.
2.
11.
17.
23.24.
18.
19.
12. 13.
14.
5.6.
7.8.9.10.
3. 4.
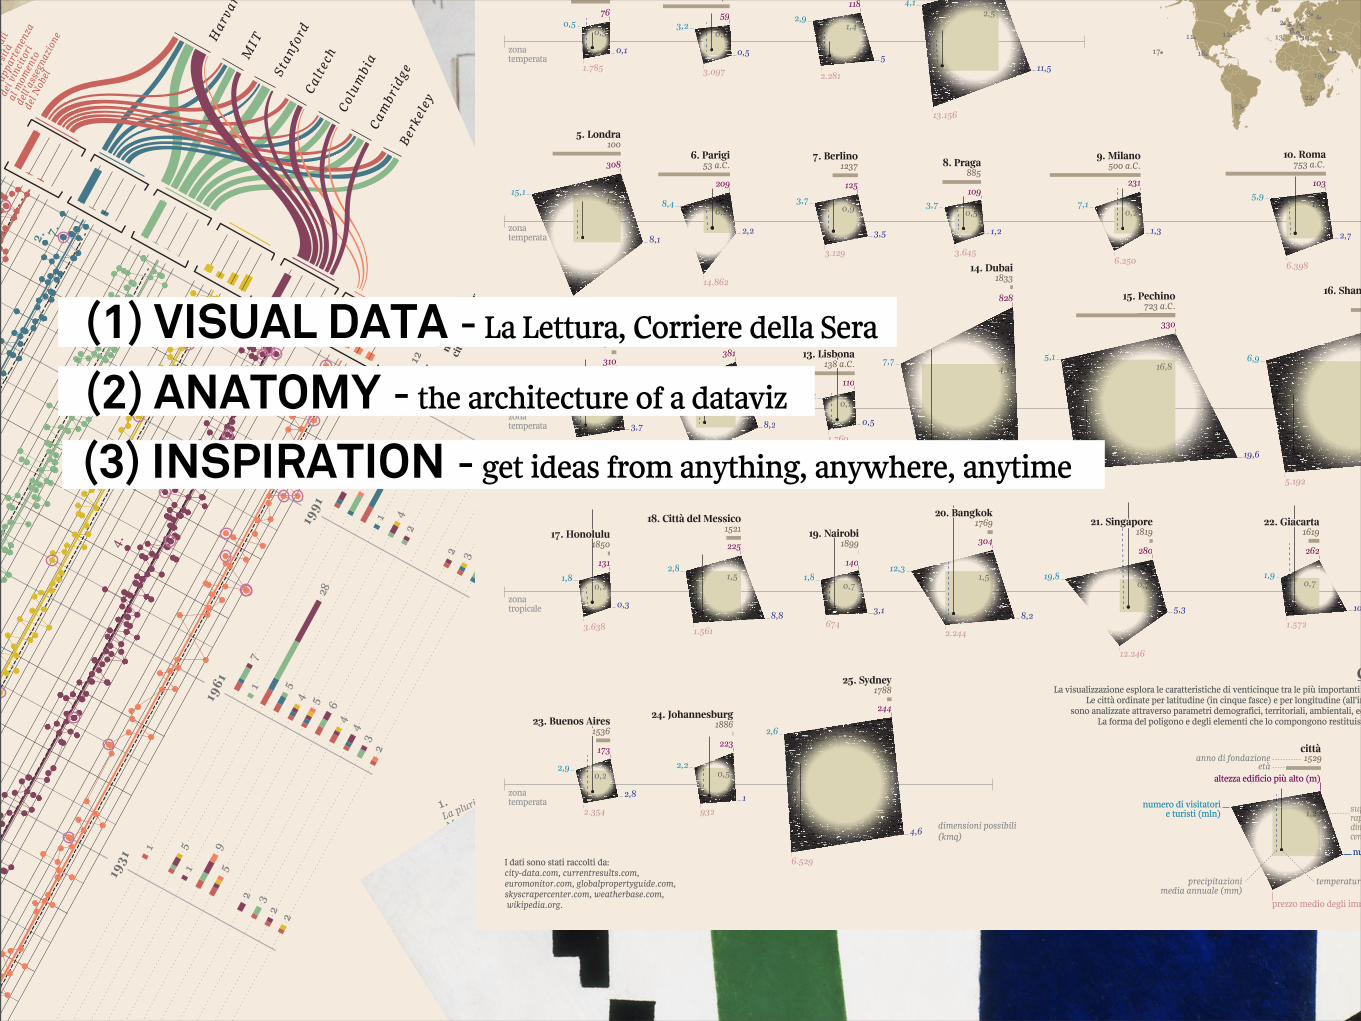
(1) VISUAL DATA - La Lettura, Corriere della Sera
(2) ANATOMY - the architecture of a dataviz
(3) INSPIRATION - get ideas from anything, anywhere, anytime

me?architecturalstudies
(2006)
interaction design exhibition design
(2006-2010)
(wanted to bea musician)
(wanted to bea dancer)
PhD in design
(2011-2013)founder ofAccurat
(2011- )

me?
I cannot code
I deal onlywith what I can handle
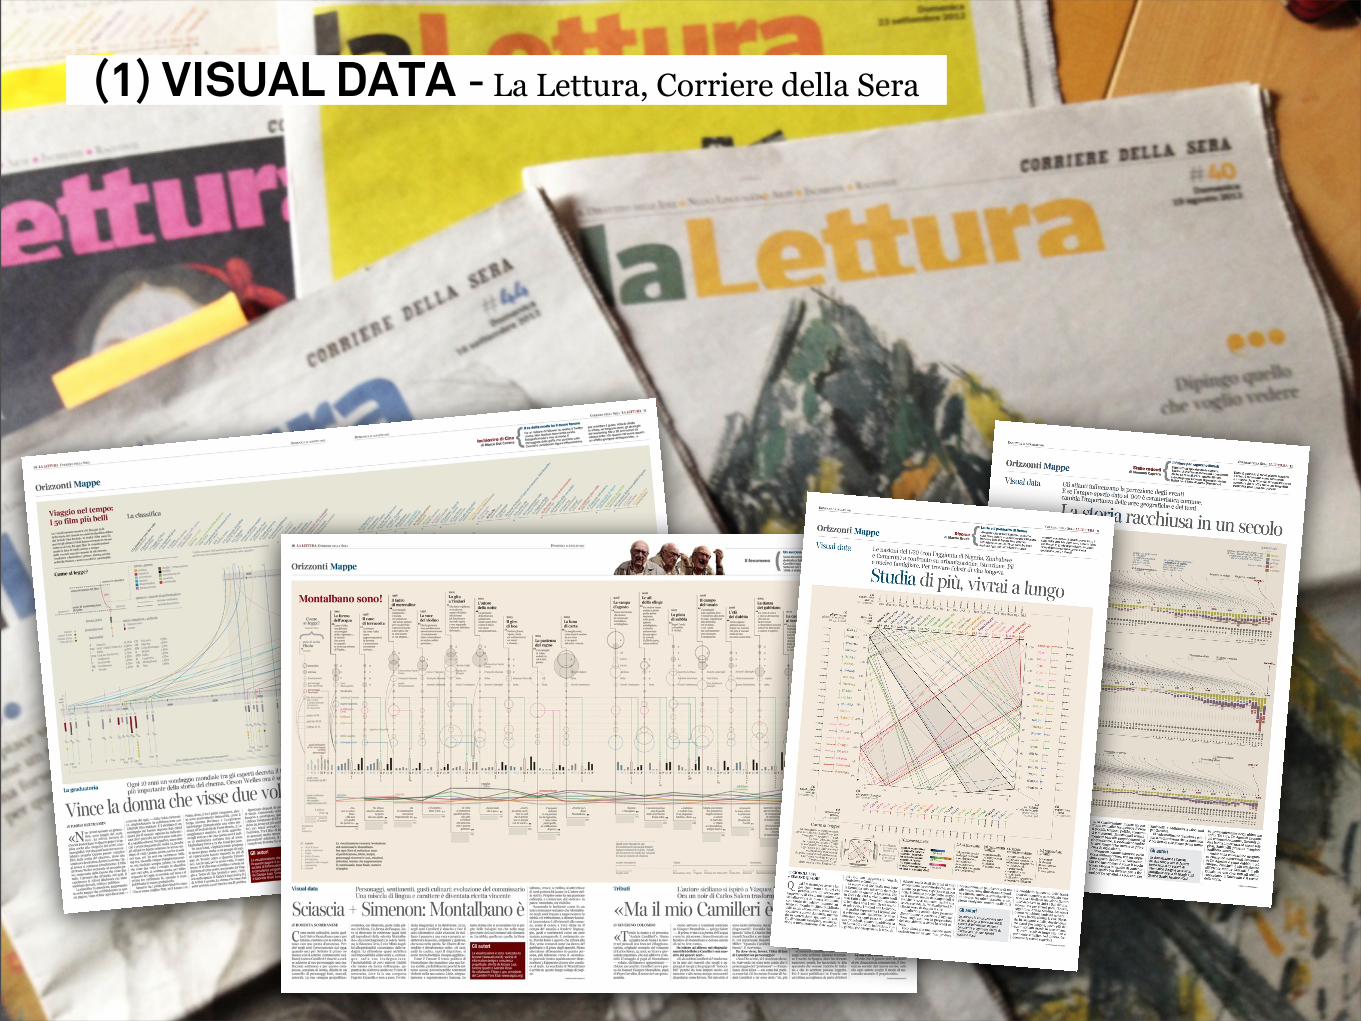
(1) VISUAL DATA - La Lettura, Corriere della Sera
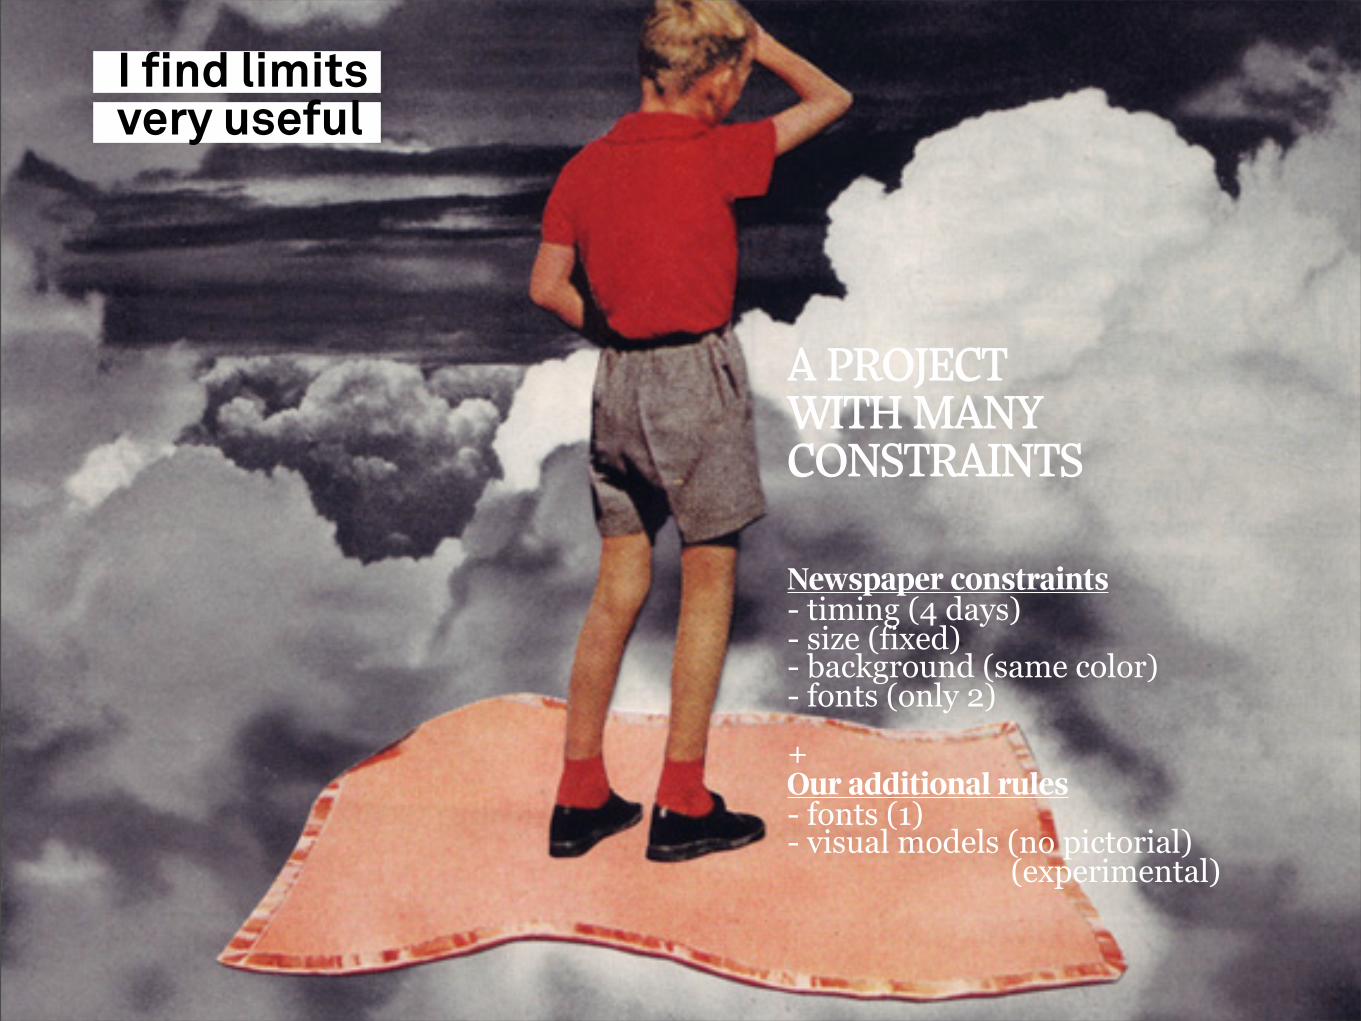
A PROJECTWITH MANY CONSTRAINTS
Newspaper constraints- timing (4 days)- size (fixed)- background (same color)- fonts (only 2)
+Our additional rules- fonts (1)- visual models (no pictorial) (experimental)
I find limits very useful
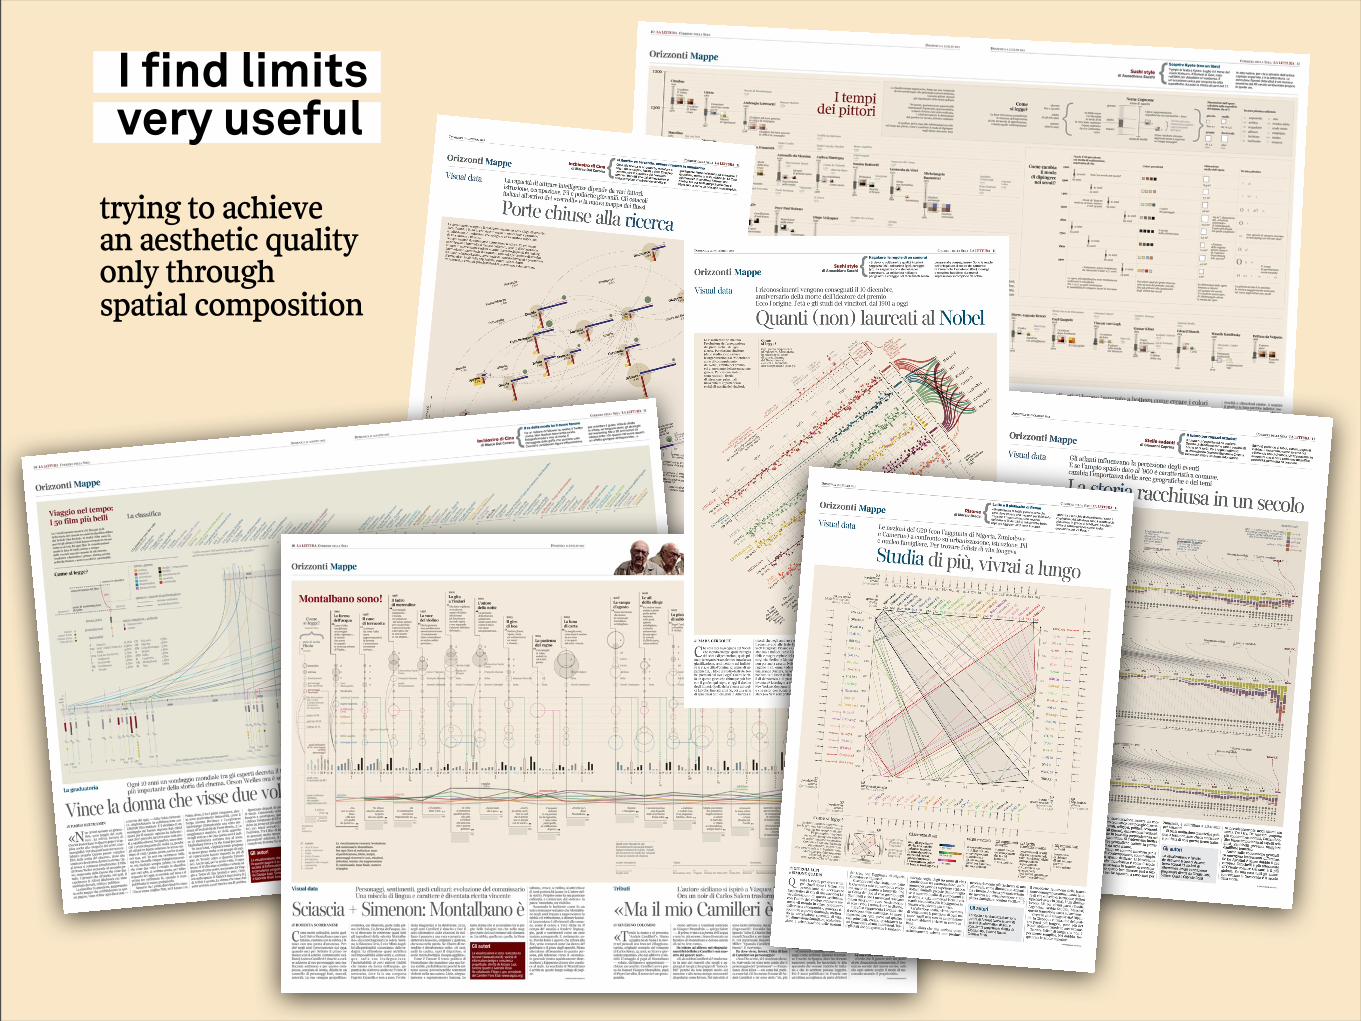
trying to achieve an aesthetic qualityonly throughspatial composition
I find limits very useful
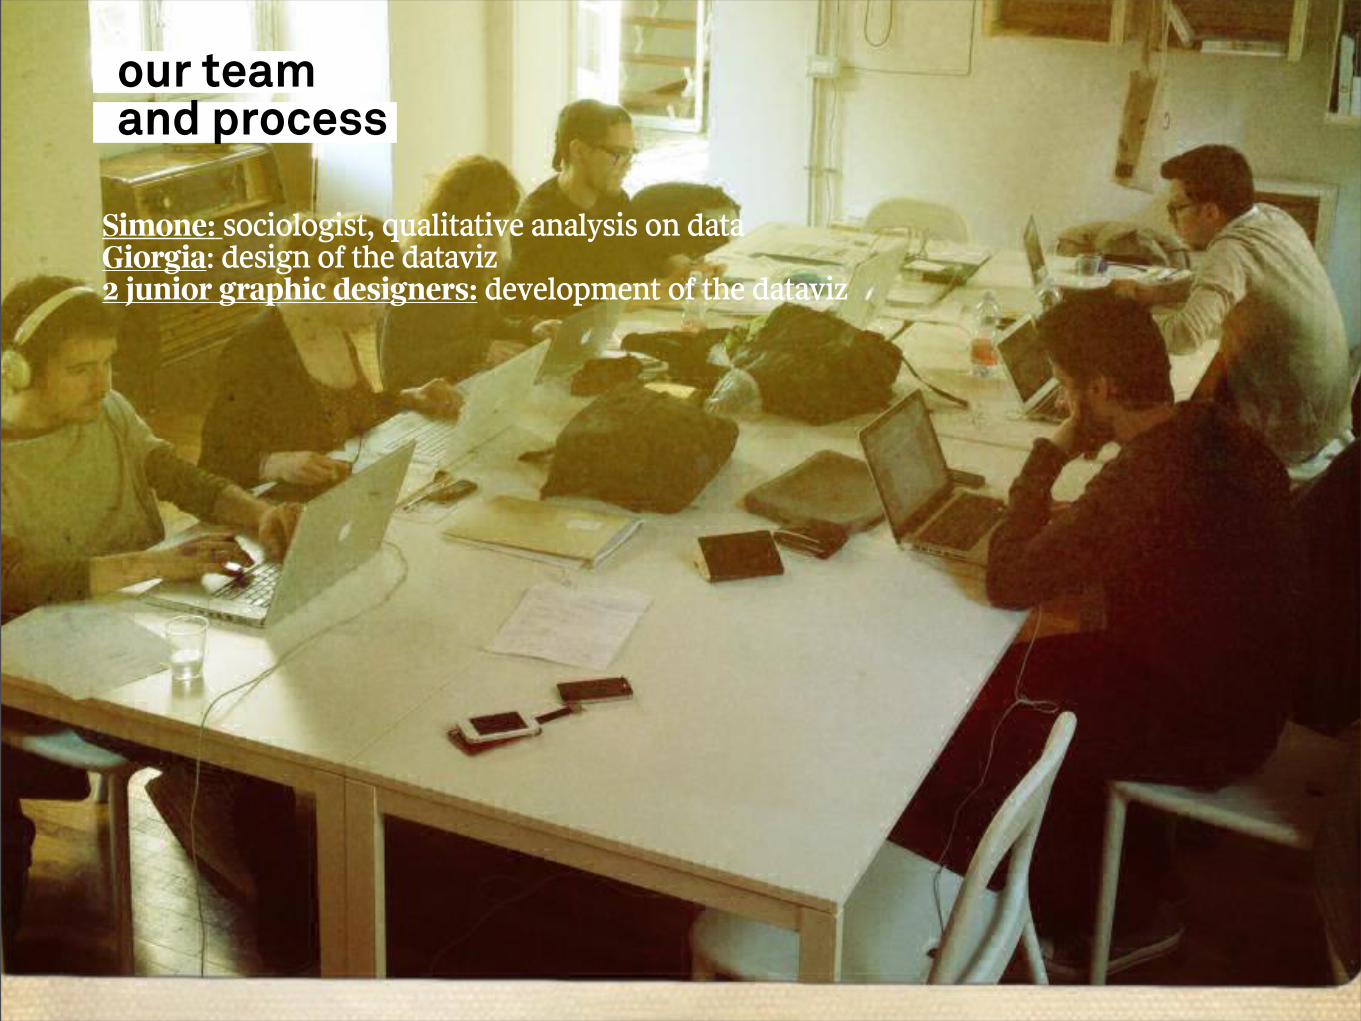
our teamand process
Simone: sociologist, qualitative analysis on dataGiorgia: design of the dataviz2 junior graphic designers: development of the dataviz
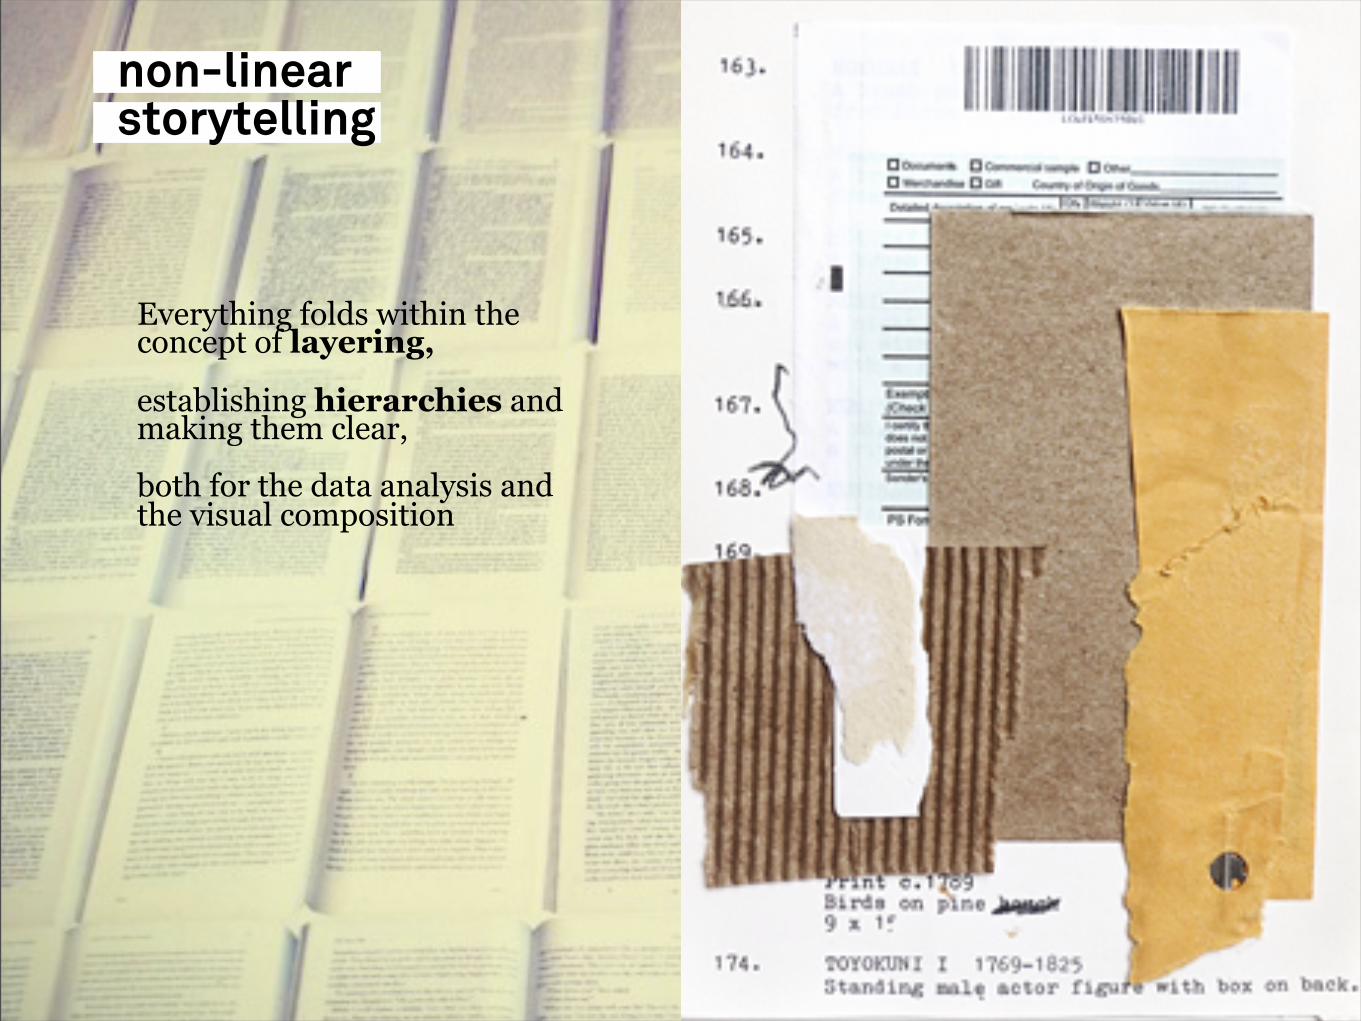
non-linearstorytelling
Everything folds within the concept of layering,
establishing hierarchies and making them clear,
both for the data analysis and the visual composition
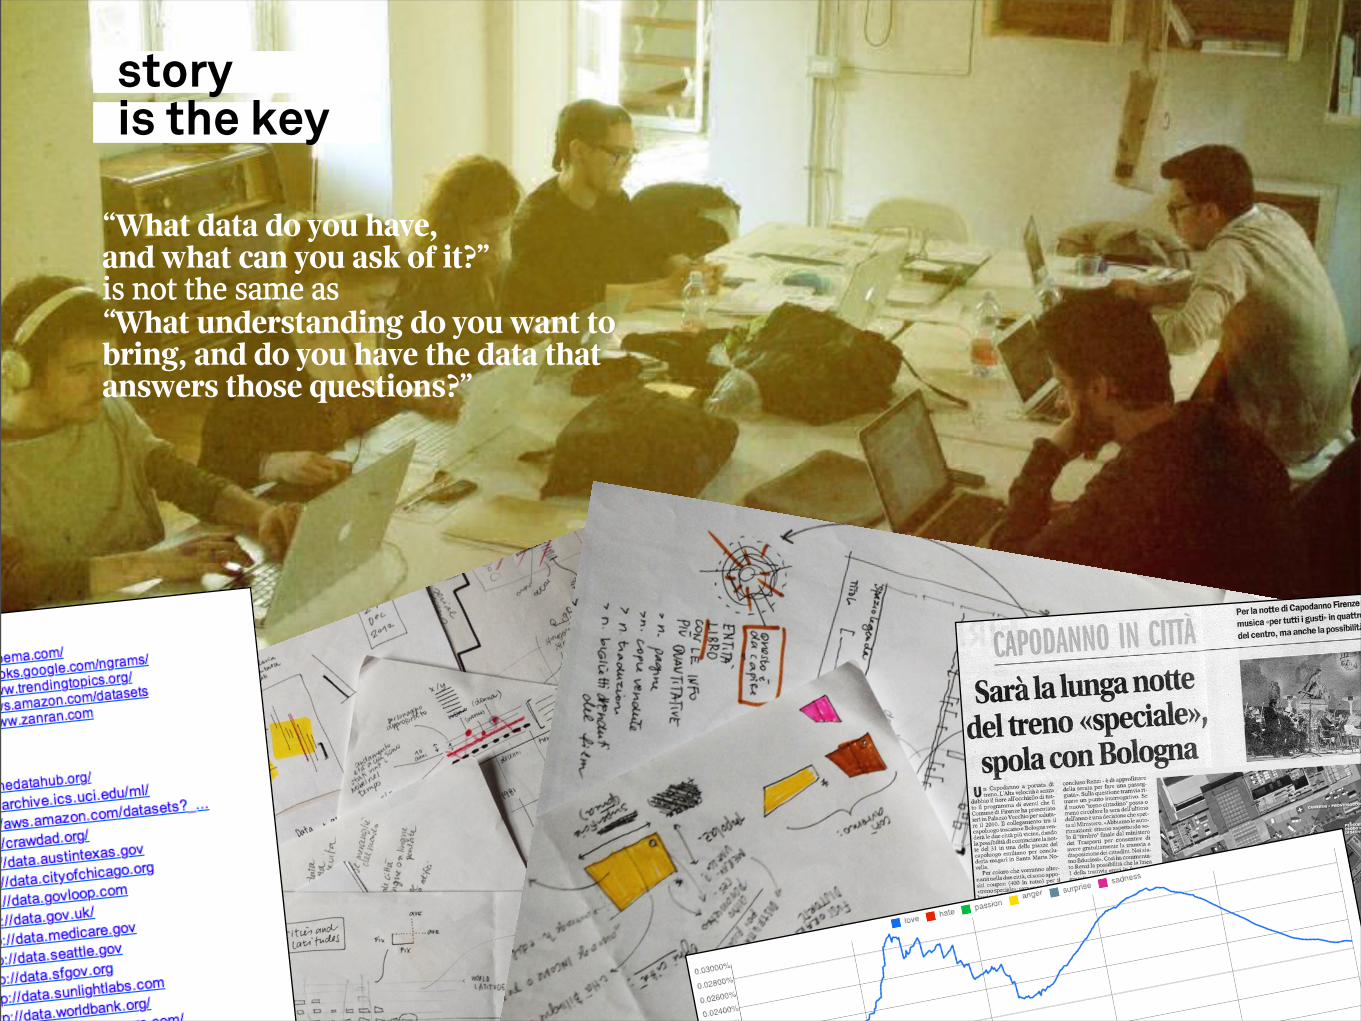
storyis the key
“What data do you have, and what can you ask of it?” is not the same as “What understanding do you want to bring, and do you have the data that answers those questions?”
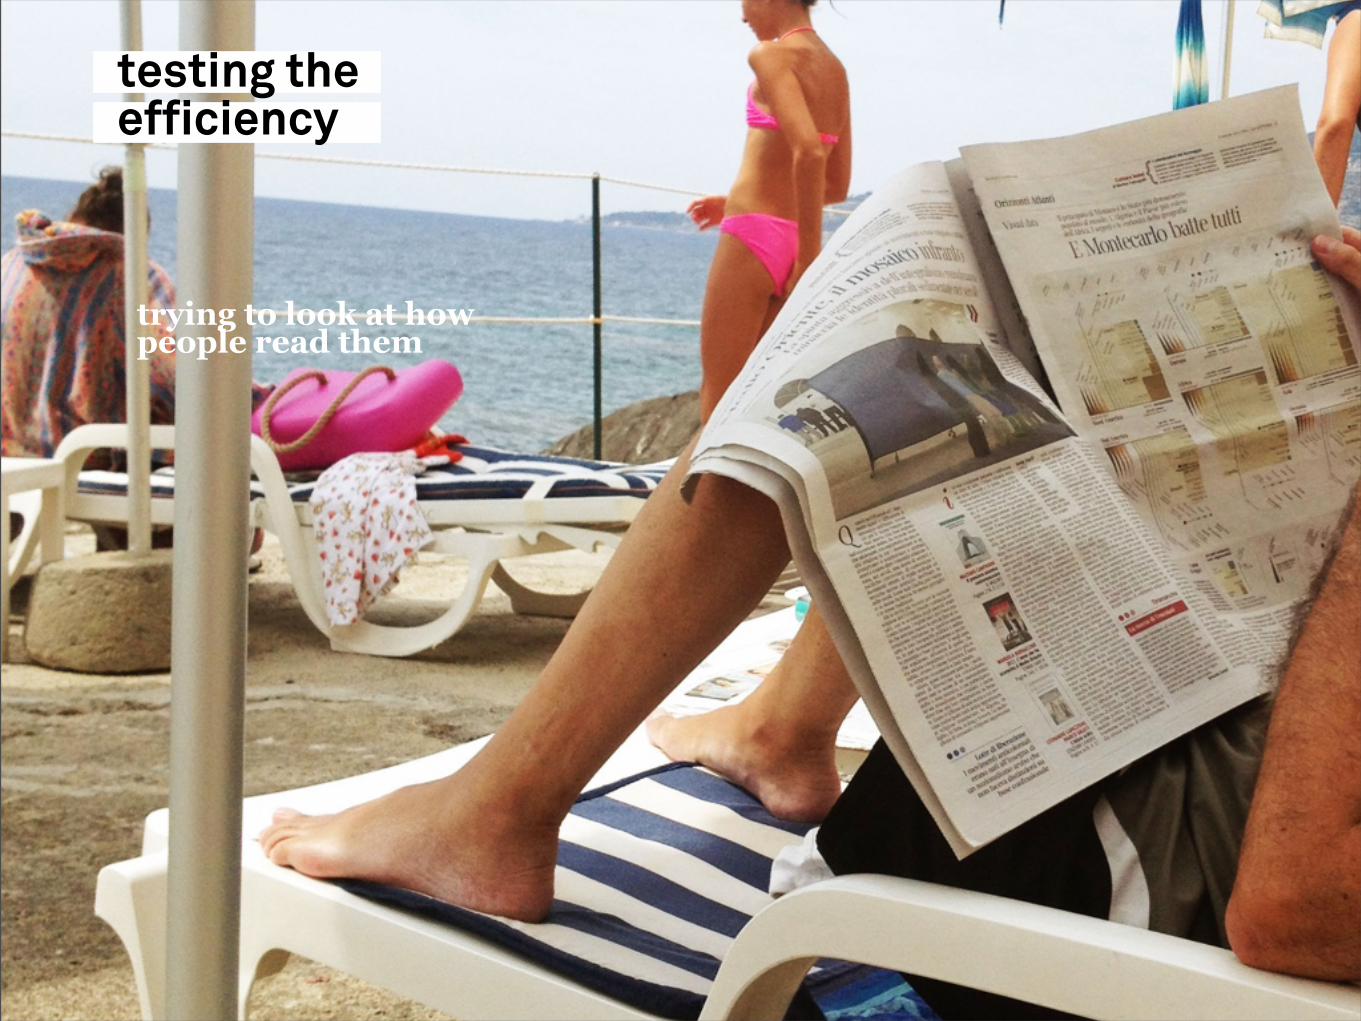
testing theefficiency
trying to look at how people read them
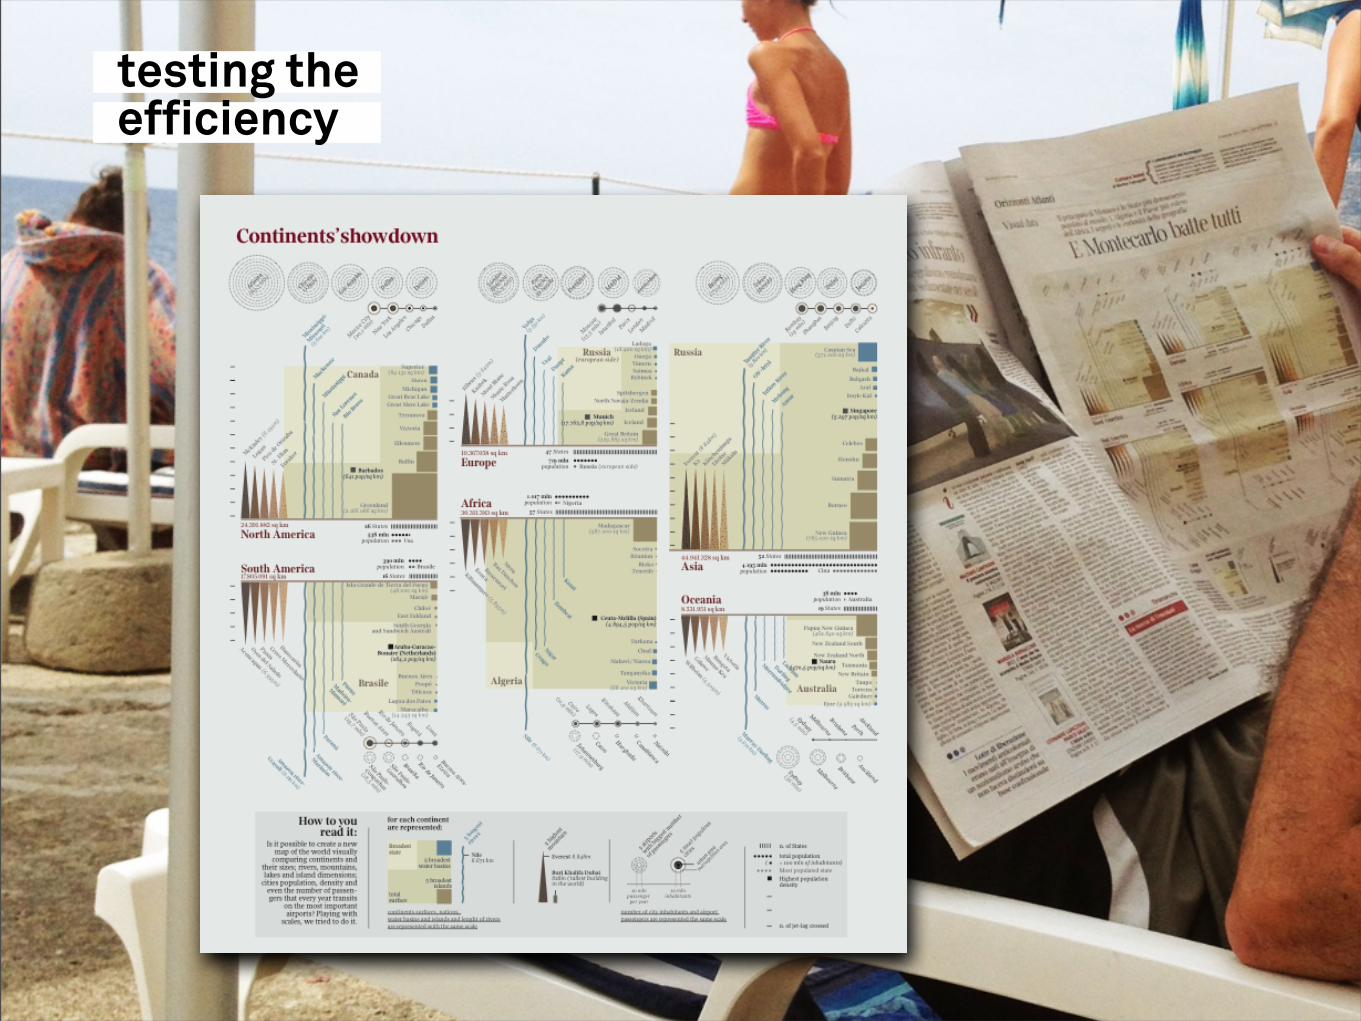
testing theefficiency
testing theefficiency
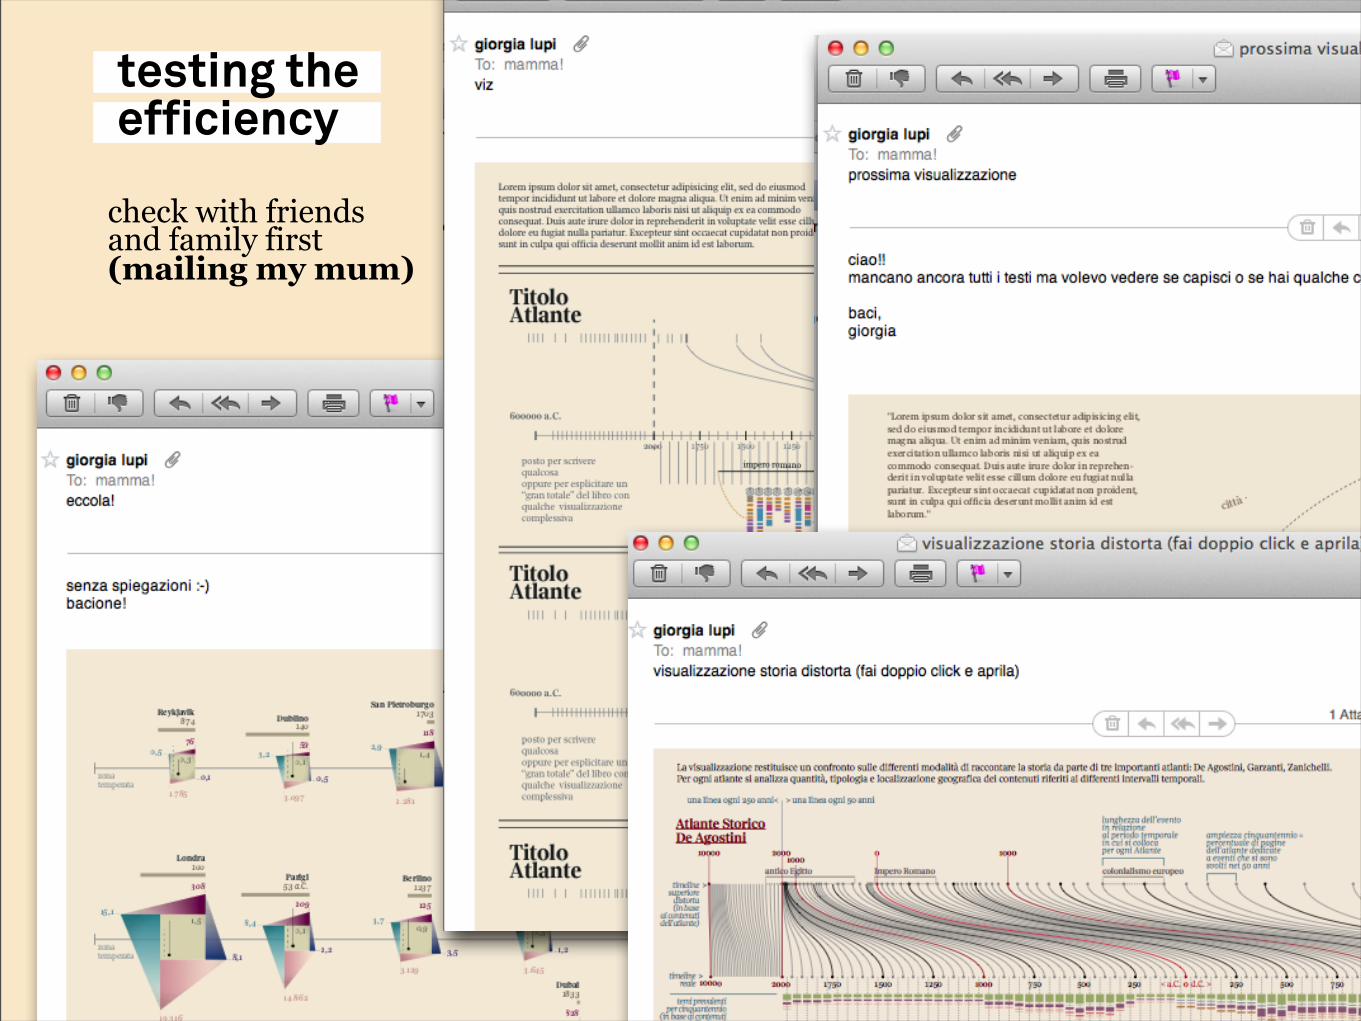
check with friends and family first(mailing my mum)

testing theefficiency
our goals:
telling something you didn’t know
making you feel something
after 16 slides,I can show youour dataviz

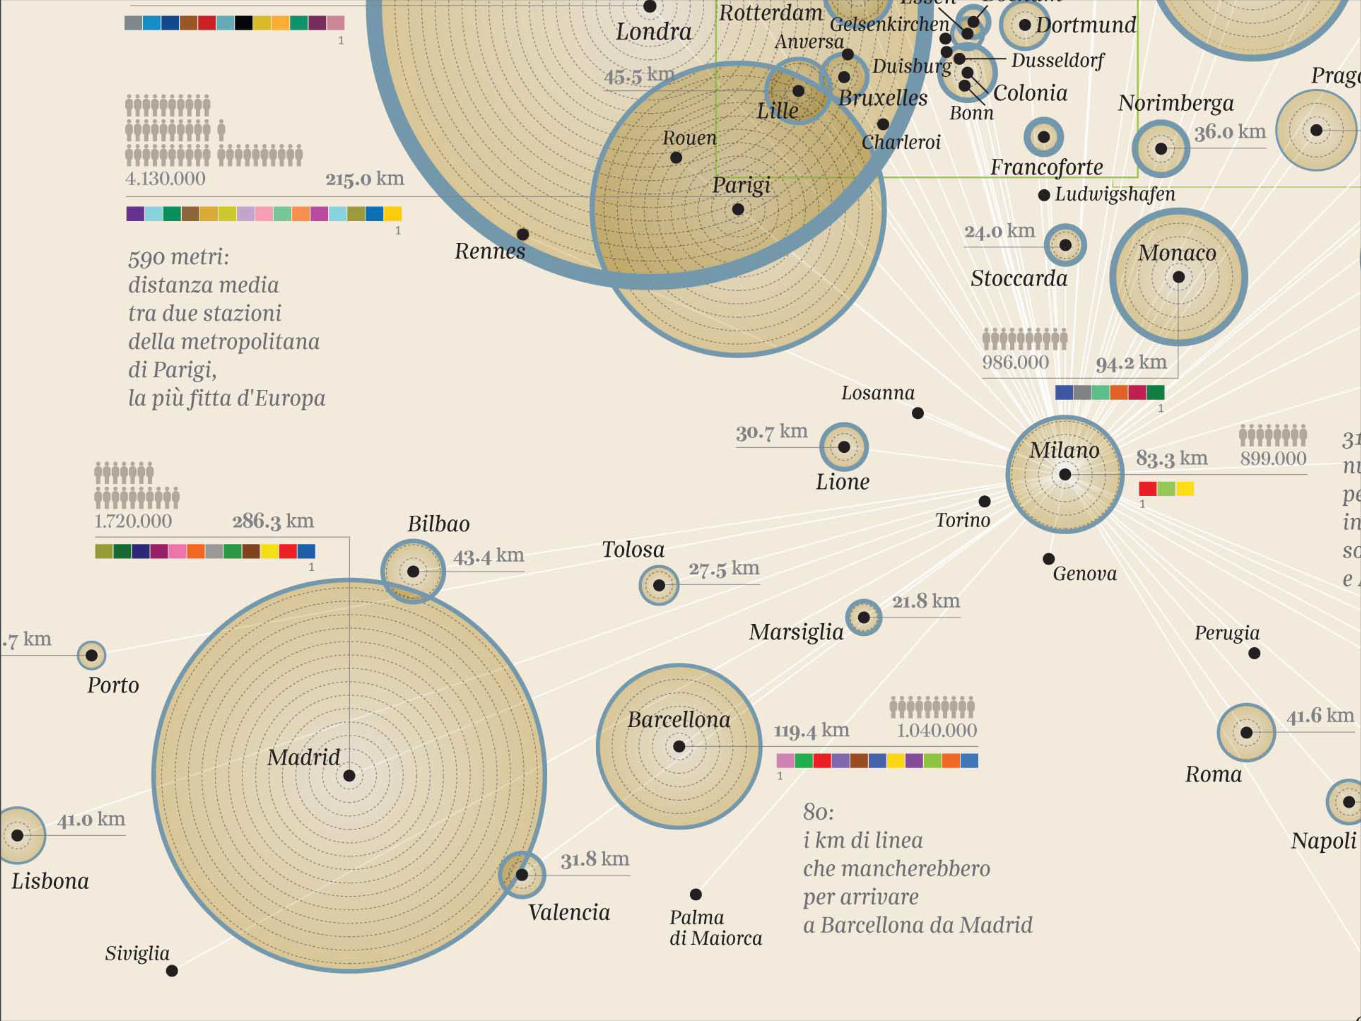
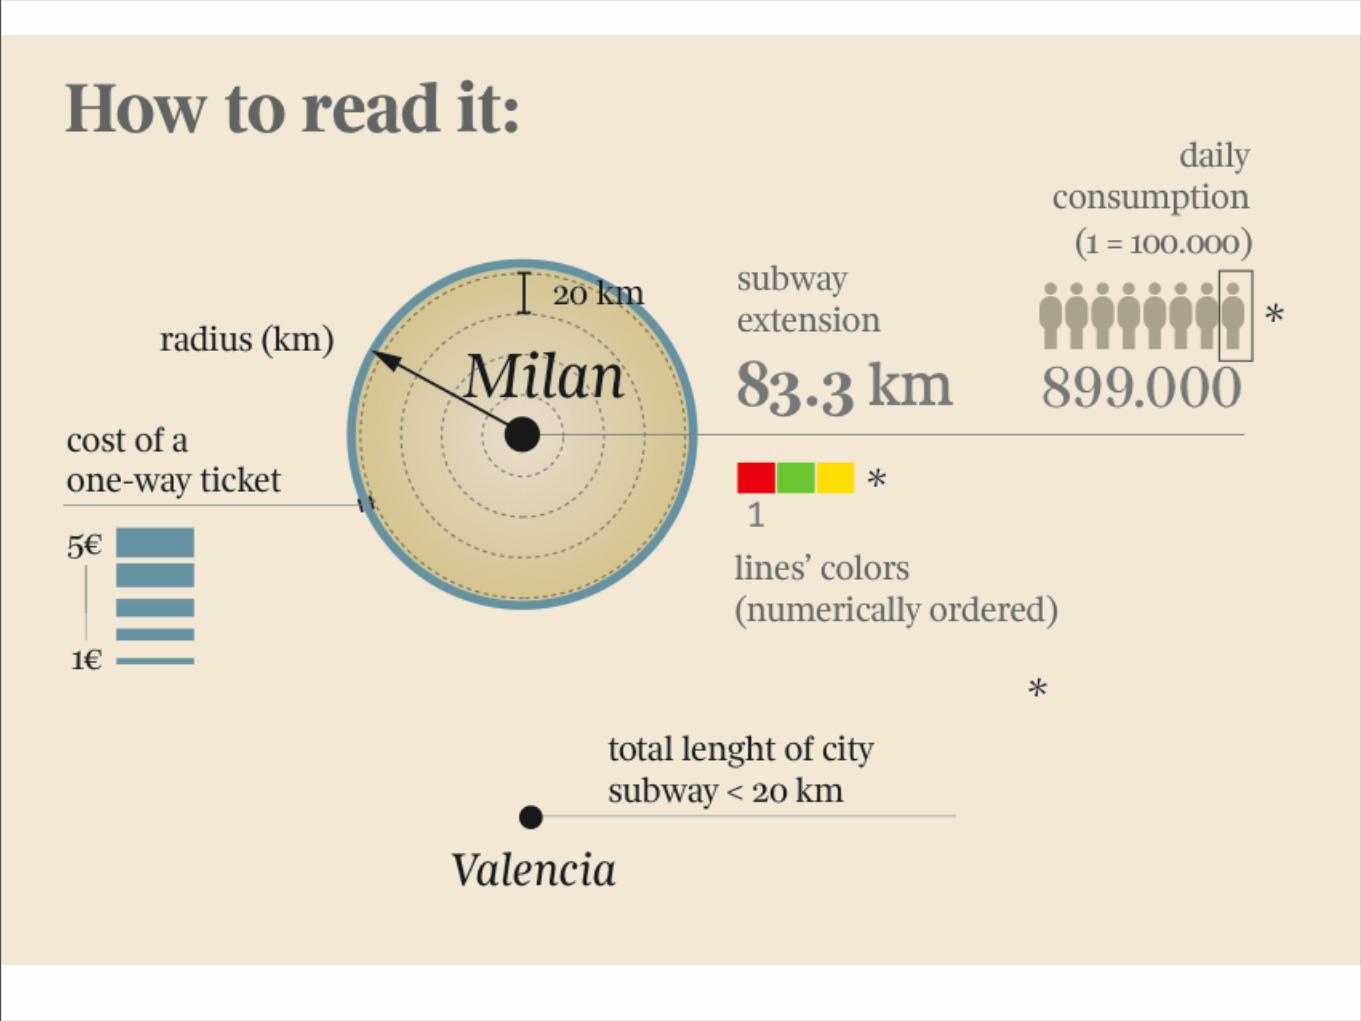
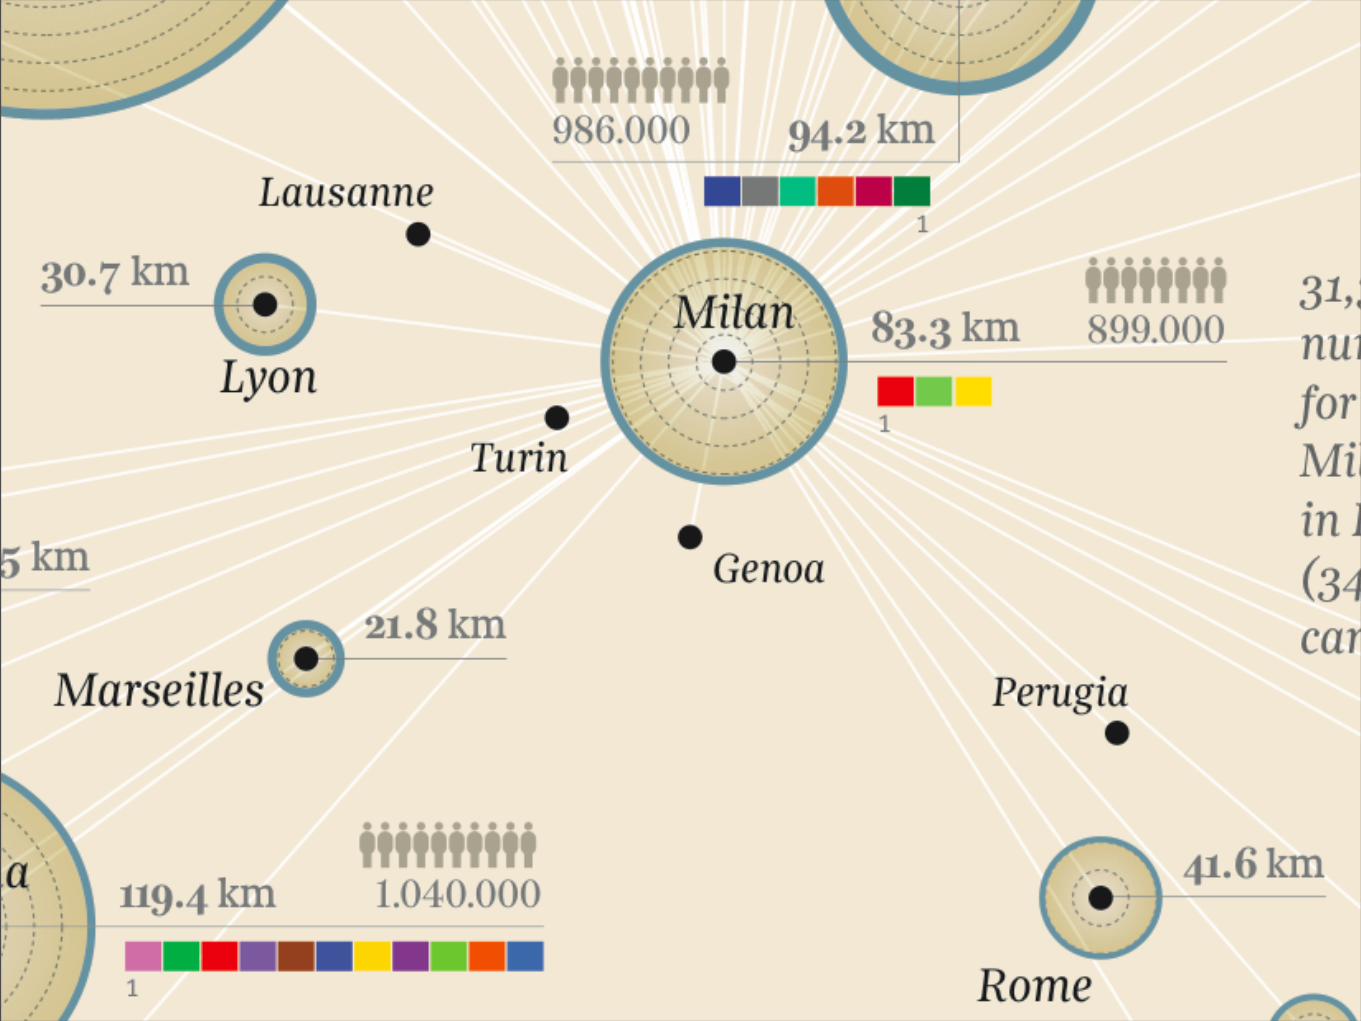
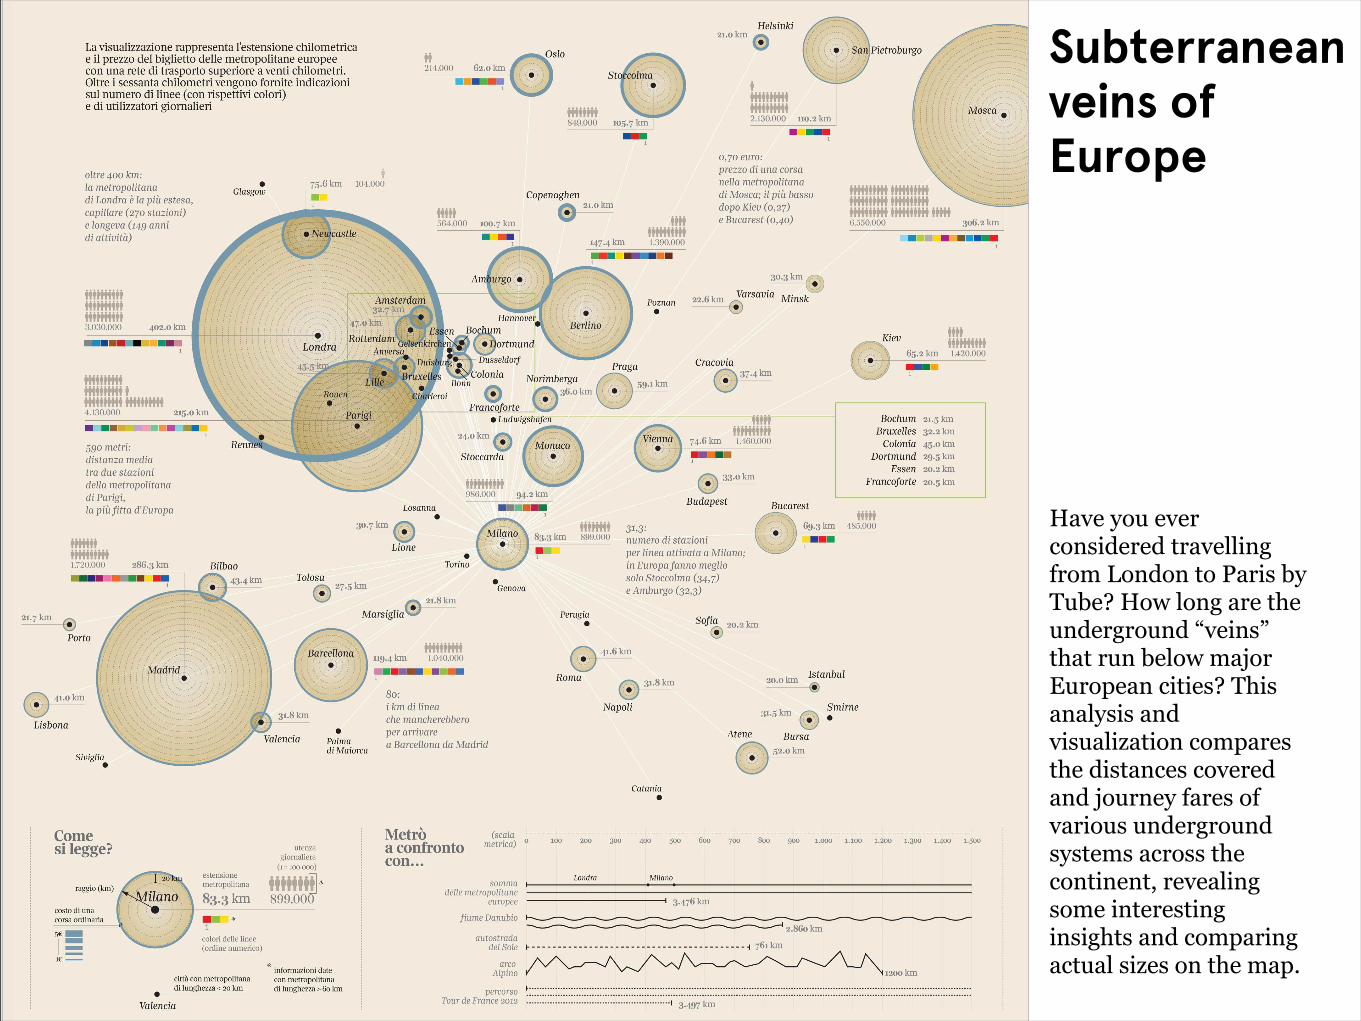
Subterranean veins of Europe
Have you ever considered travelling from London to Paris by Tube? How long are the underground “veins” that run below major European cities? This analysis and visualization compares the distances covered and journey fares of various underground systems across the continent, revealing some interesting insights and comparing actual sizes on the map.
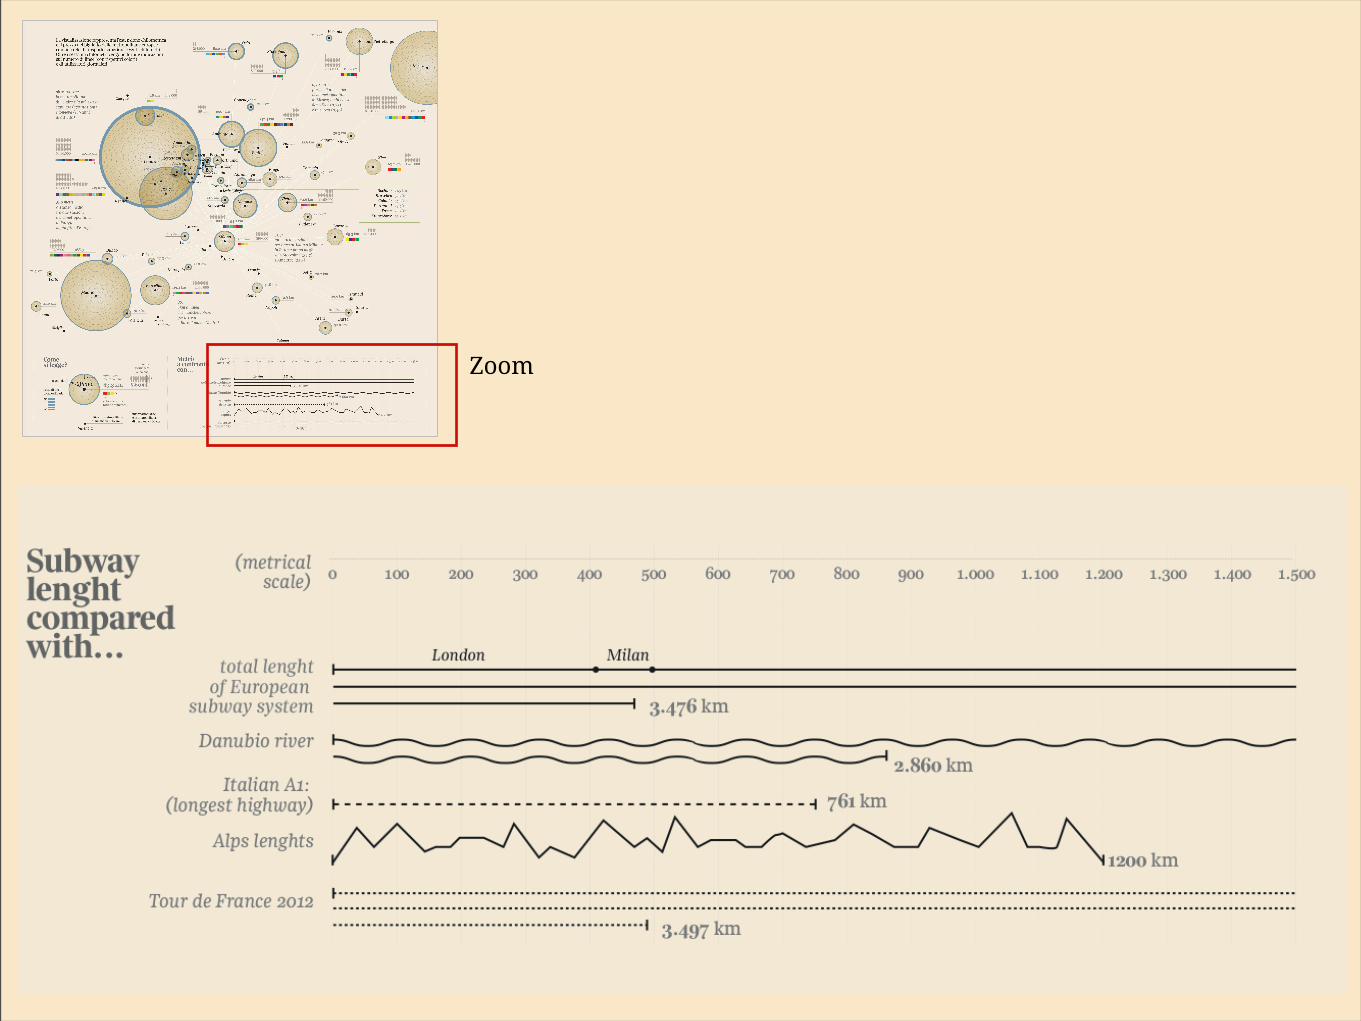
Zoom
Subterranean veins of Europe
Have you ever considered travelling from London to Paris by Tube? How long are the underground “veins” that run below major European cities? This analysis and visualization compares the distances covered and journey fares of various underground systems across the continent, revealing some interesting insights and comparing actual sizes on the map.
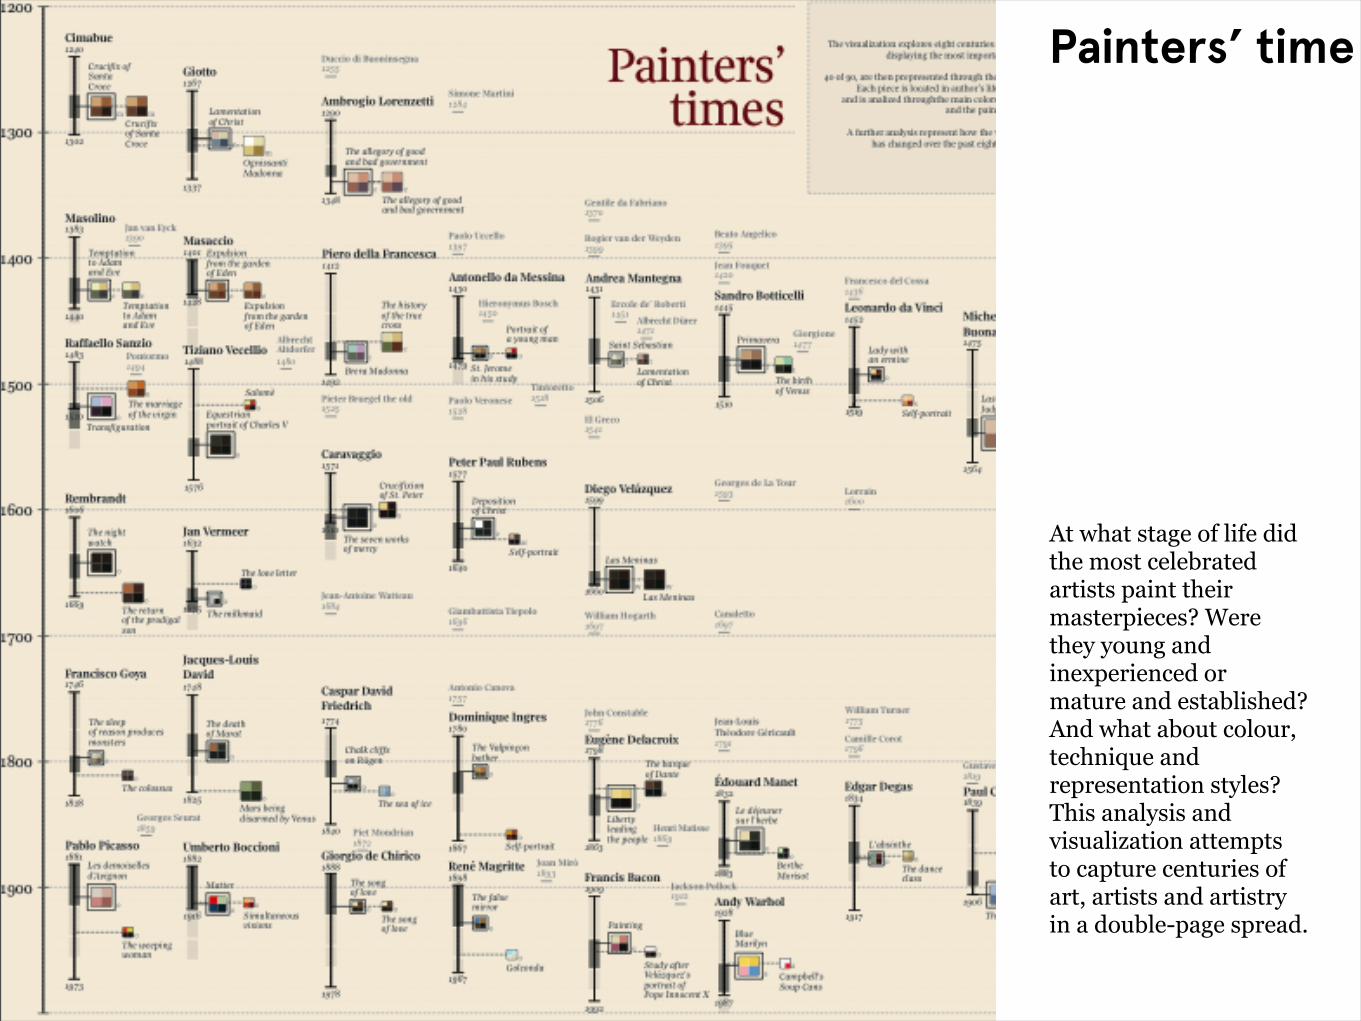
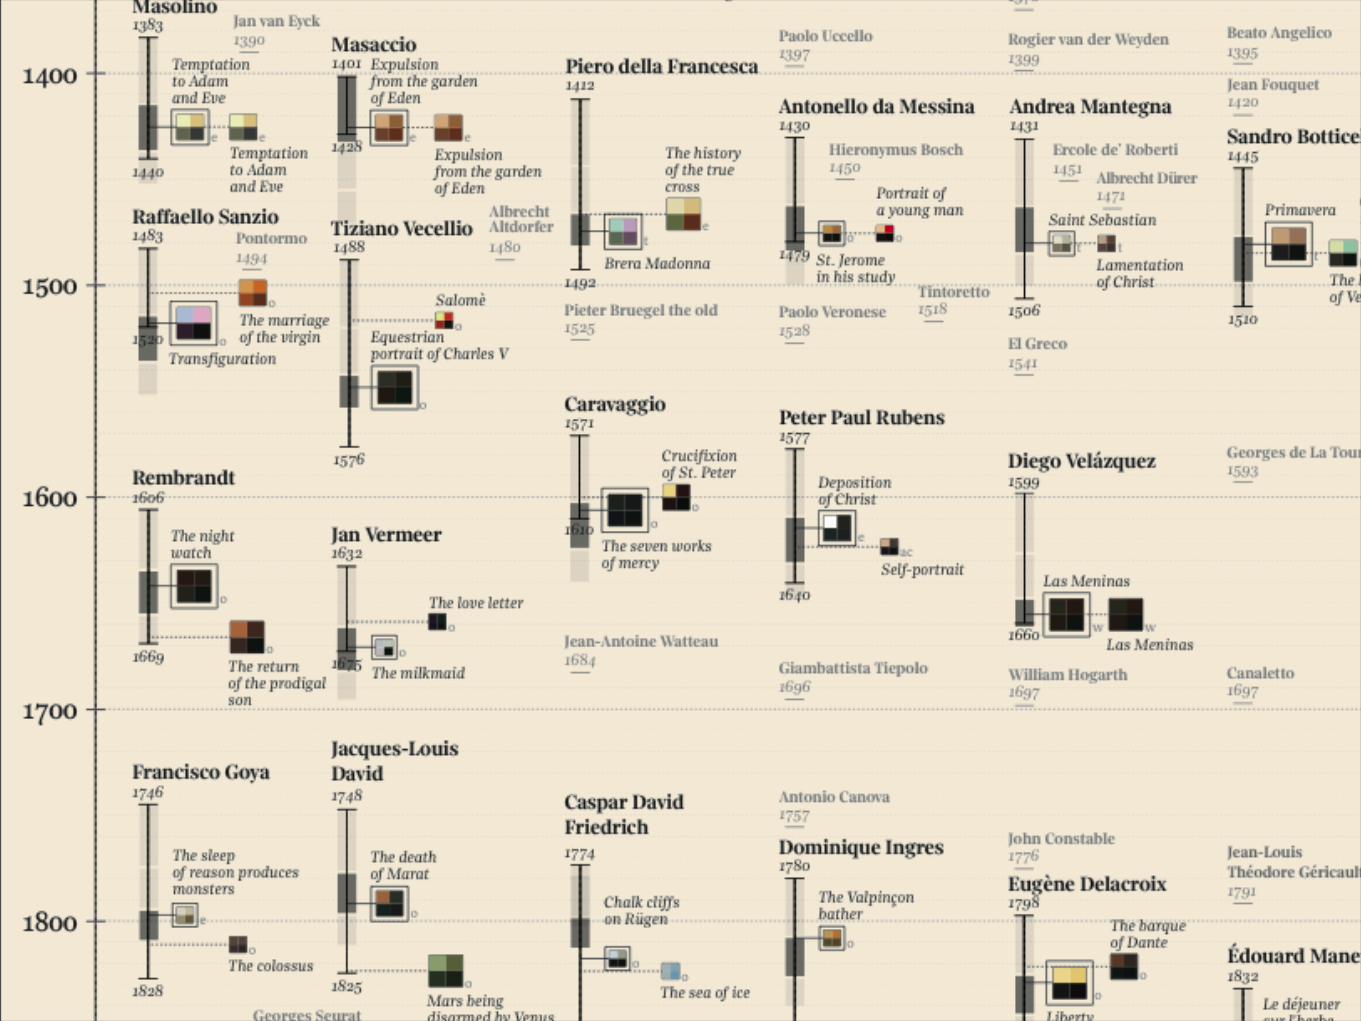
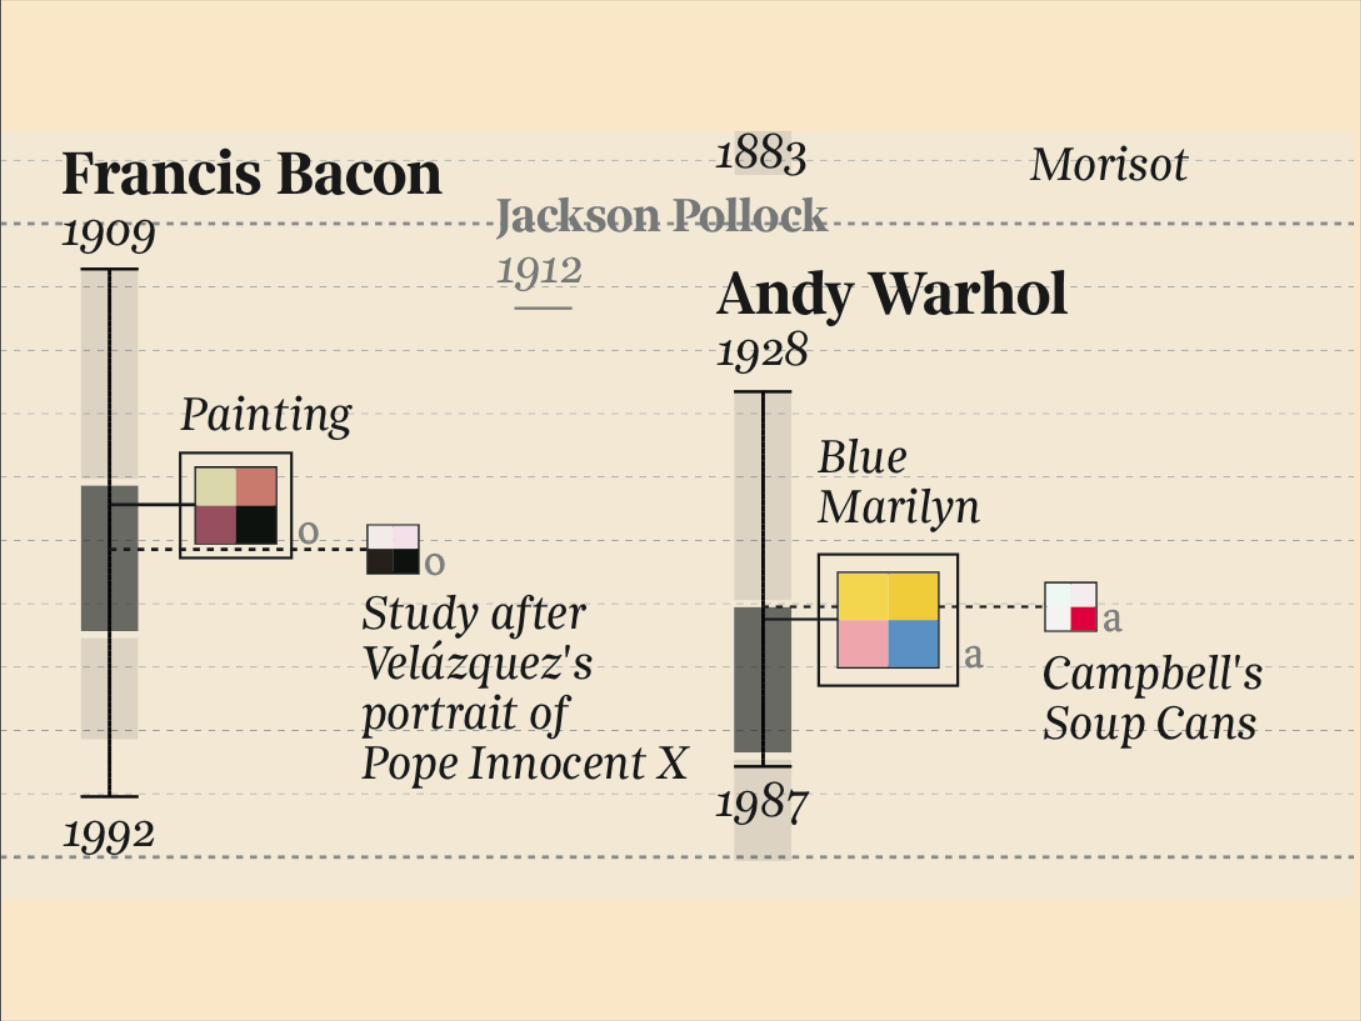
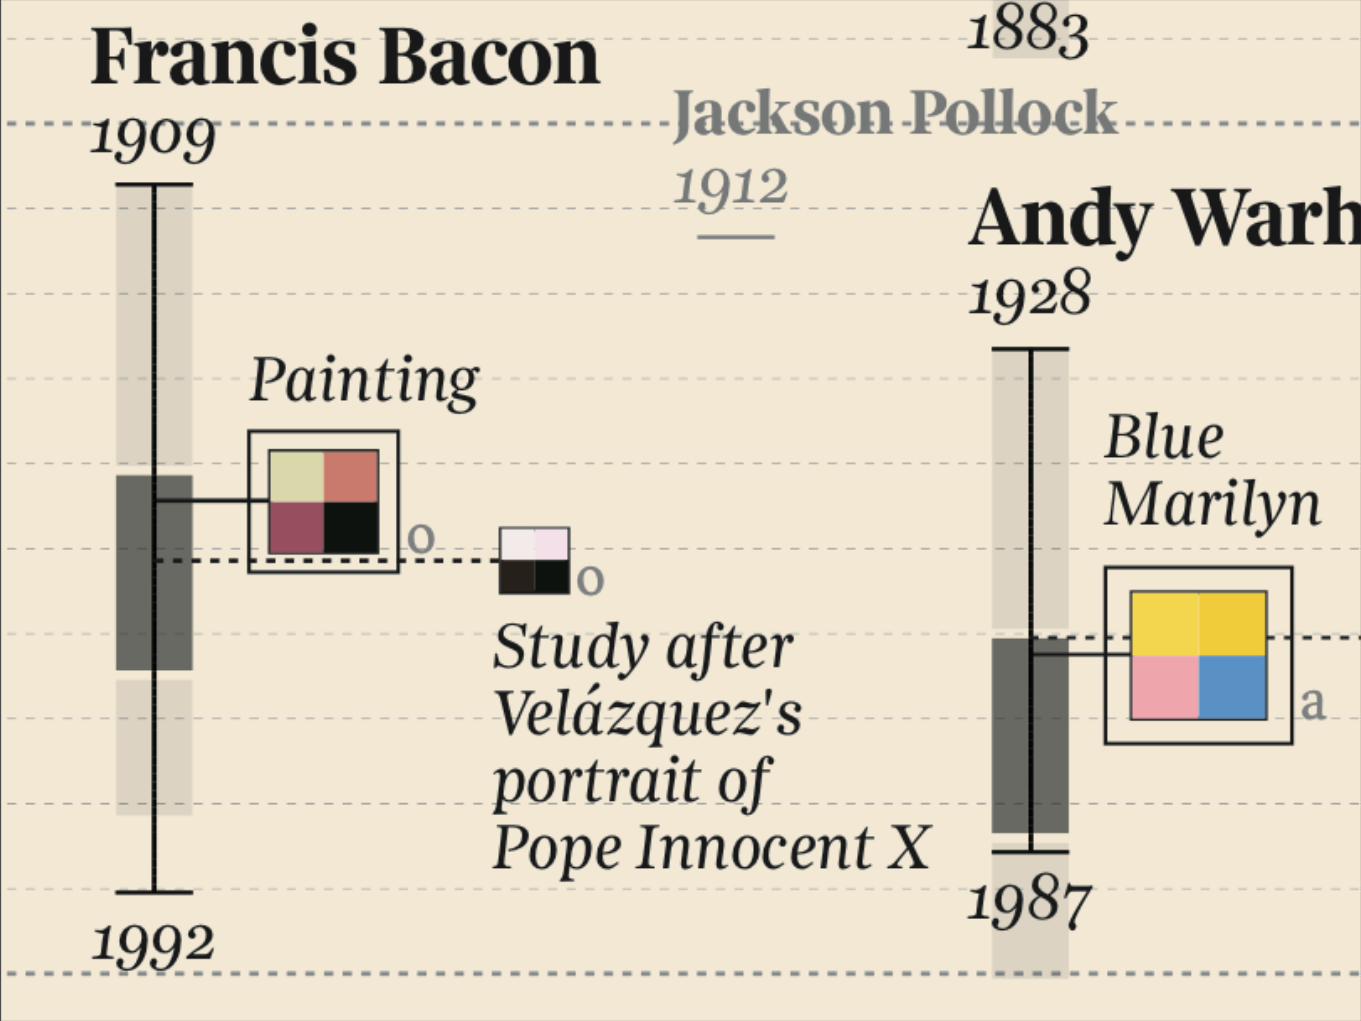
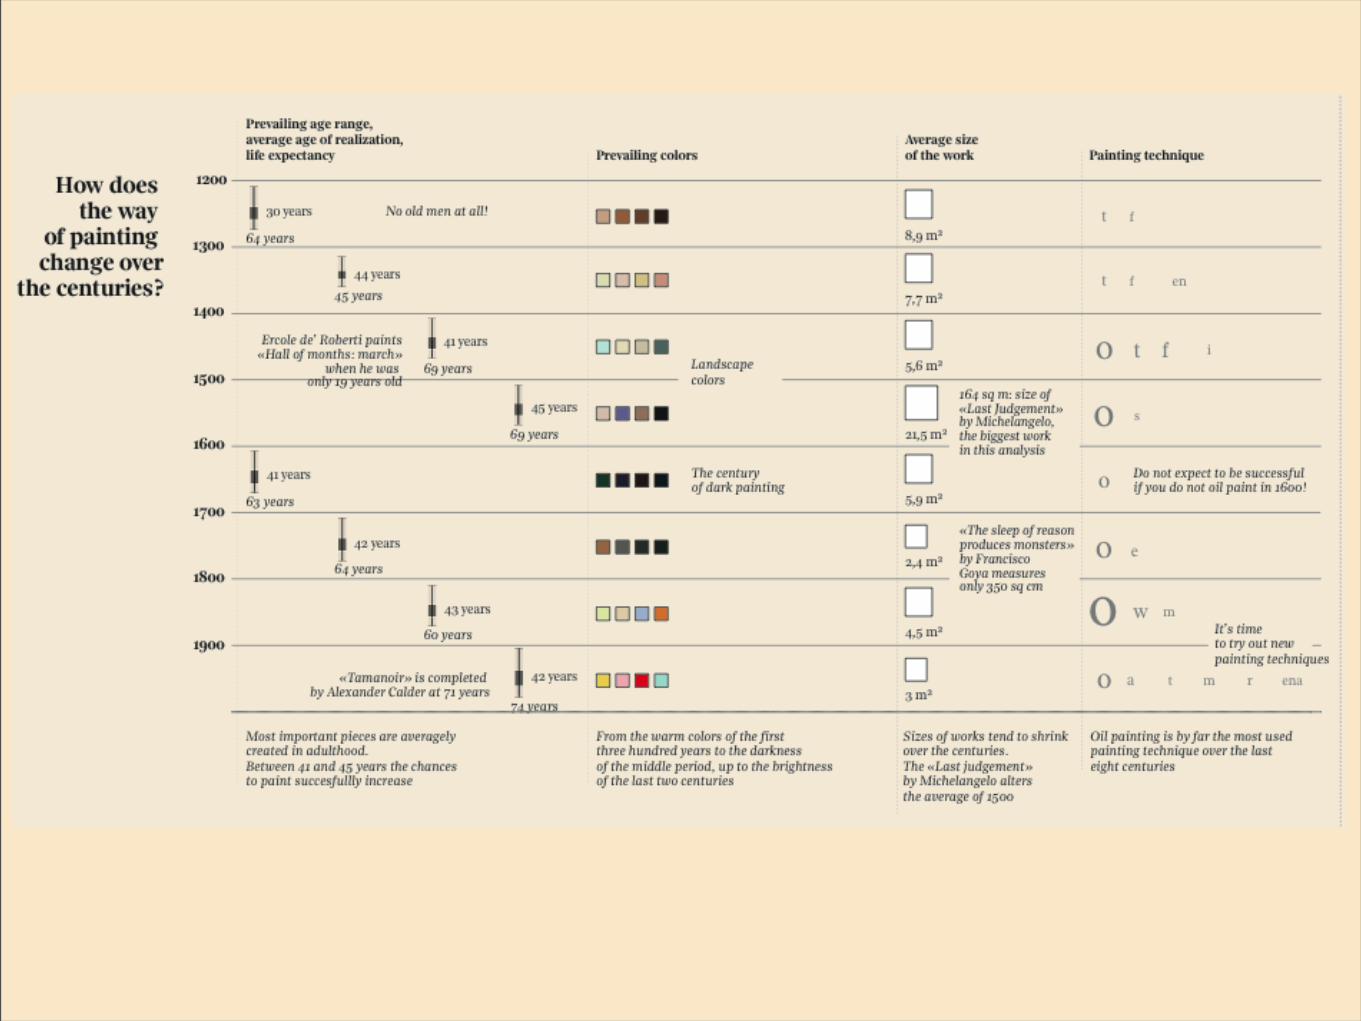
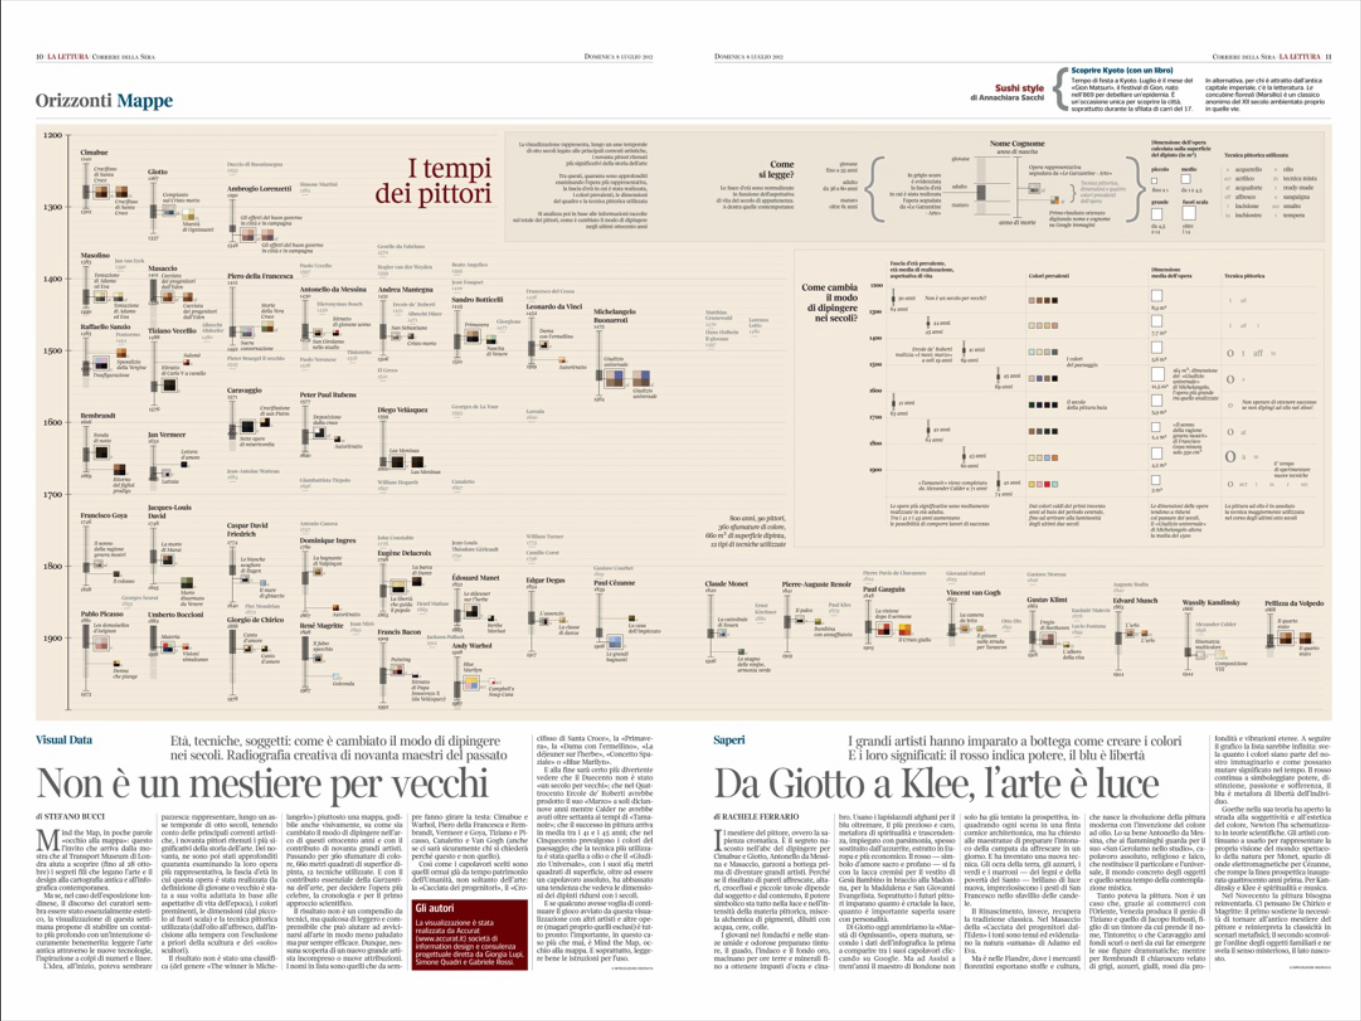
Painters’ time
At what stage of life did the most celebrated artists paint their masterpieces? Were they young and inexperienced or mature and established? And what about colour, technique and representation styles? This analysis and visualization attempts to capture centuries of art, artists and artistry in a double-page spread.

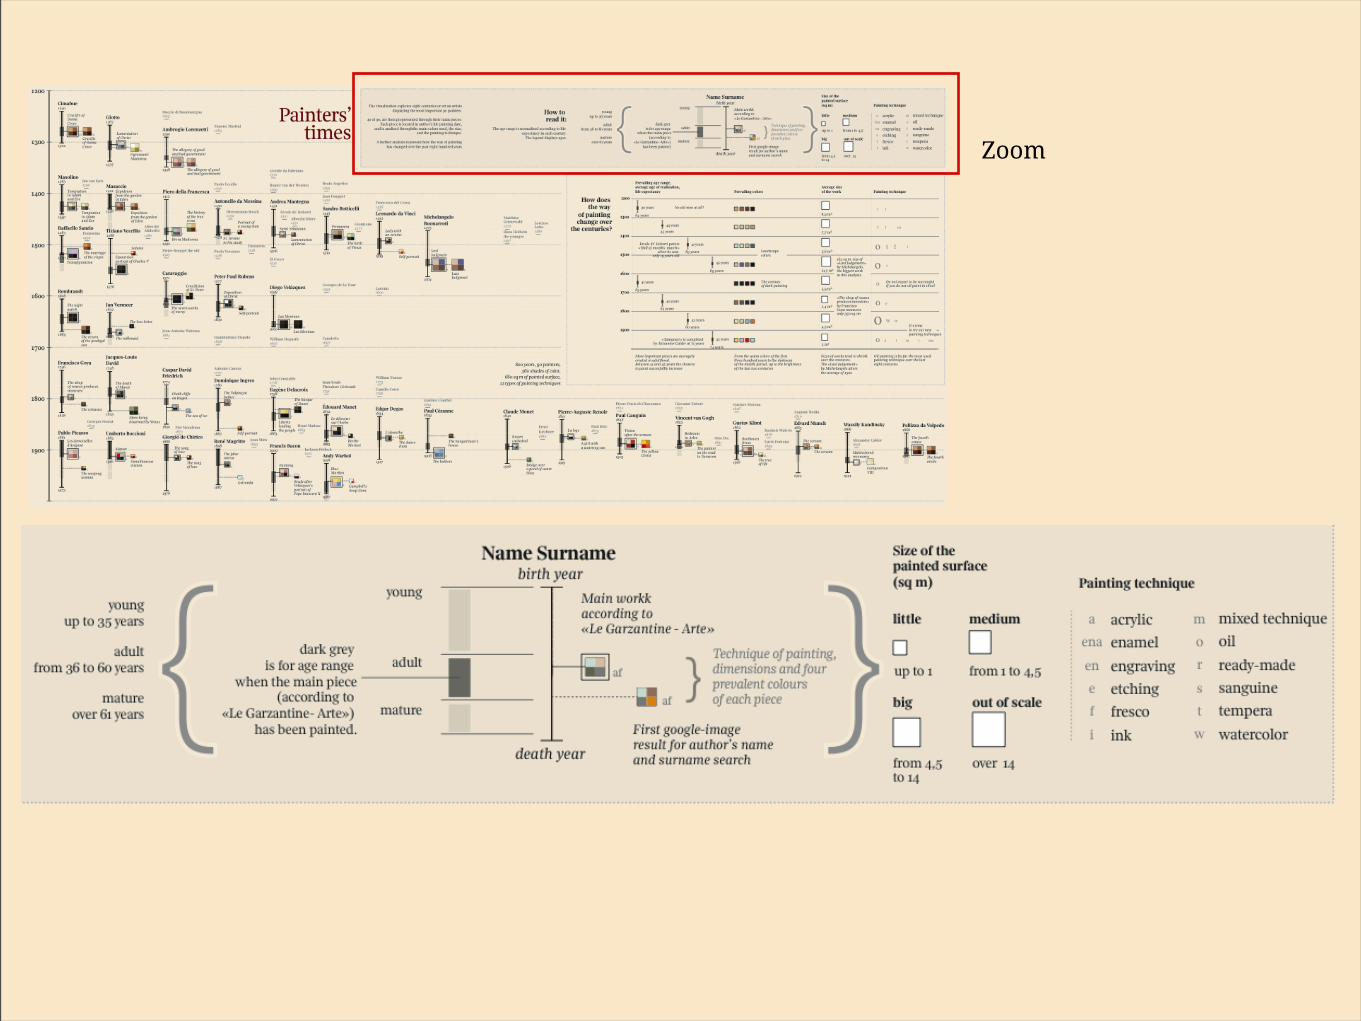
Zoom

(2) ANATOMY- the architecture of a dataviz
have you ever thought about how you would describe (interpret) your own work?

towards a non linear-layered storytelling(article - Parsons Journal for Information Mapping)

towards a non linear-layered storytellinglayering and making hierarchies clear
if we consider our collective presentation as composed of the pieces within a tale, we aim to build a singular “greater-story” built through the layering of sub stories, or story components.
“
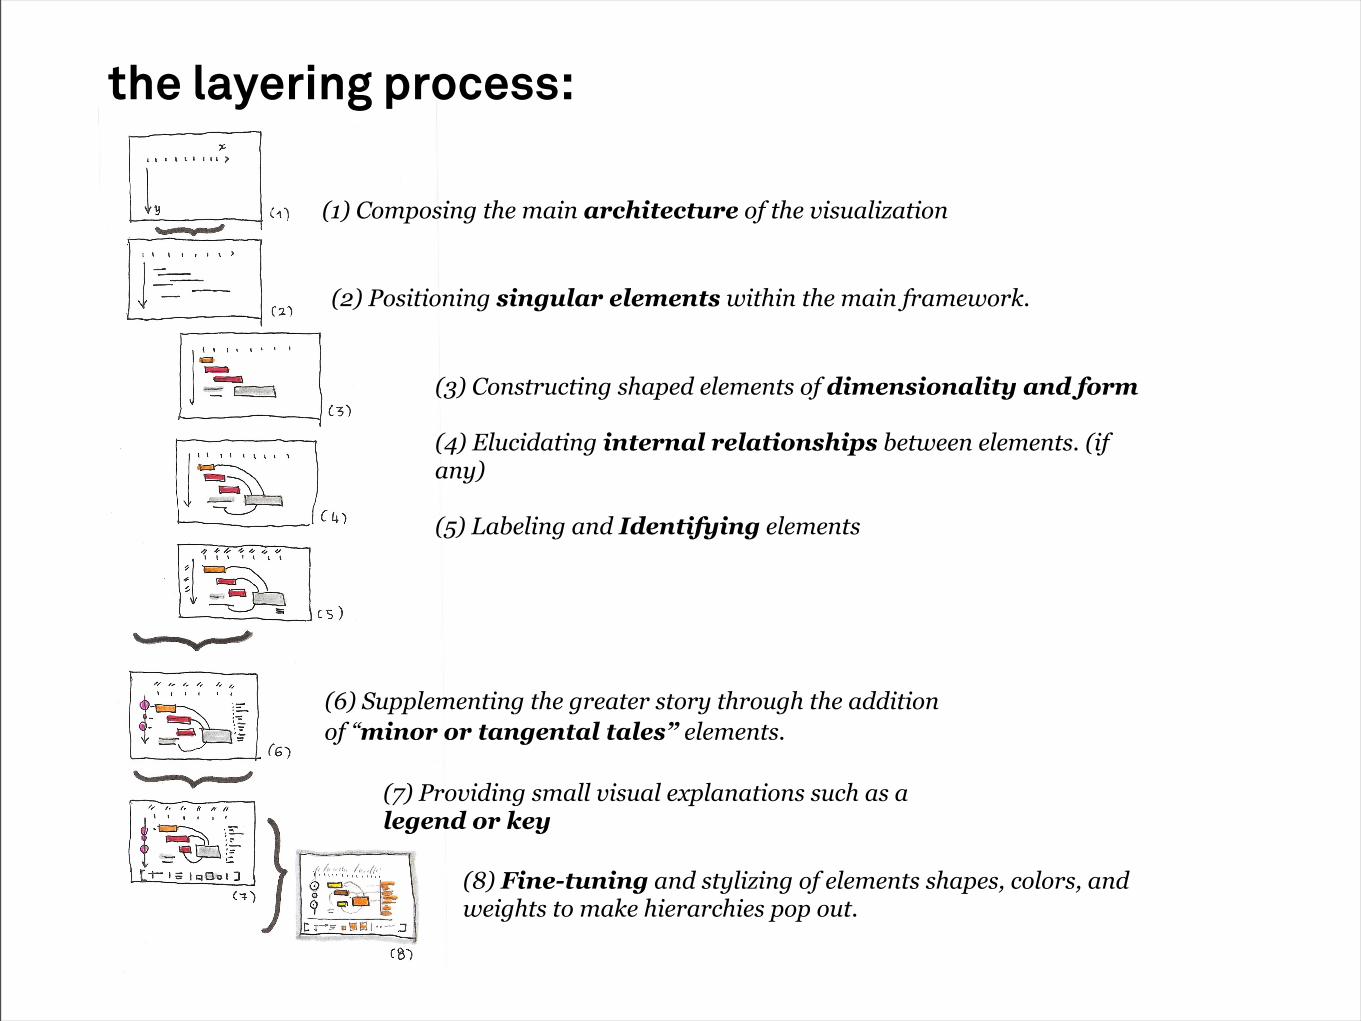
the layering process:
(6) Supplementing the greater story through the addition of “minor or tangental tales” elements.
(1) Composing the main architecture of the visualization
(2) Positioning singular elements within the main framework.
(3) Constructing shaped elements of dimensionality and form
(4) Elucidating internal relationships between elements. (if any)
(5) Labeling and Identifying elements
(7) Providing small visual explanations such as a legend or key
(8) Fine-tuning and stylizing of elements shapes, colors, and weights to make hierarchies pop out.

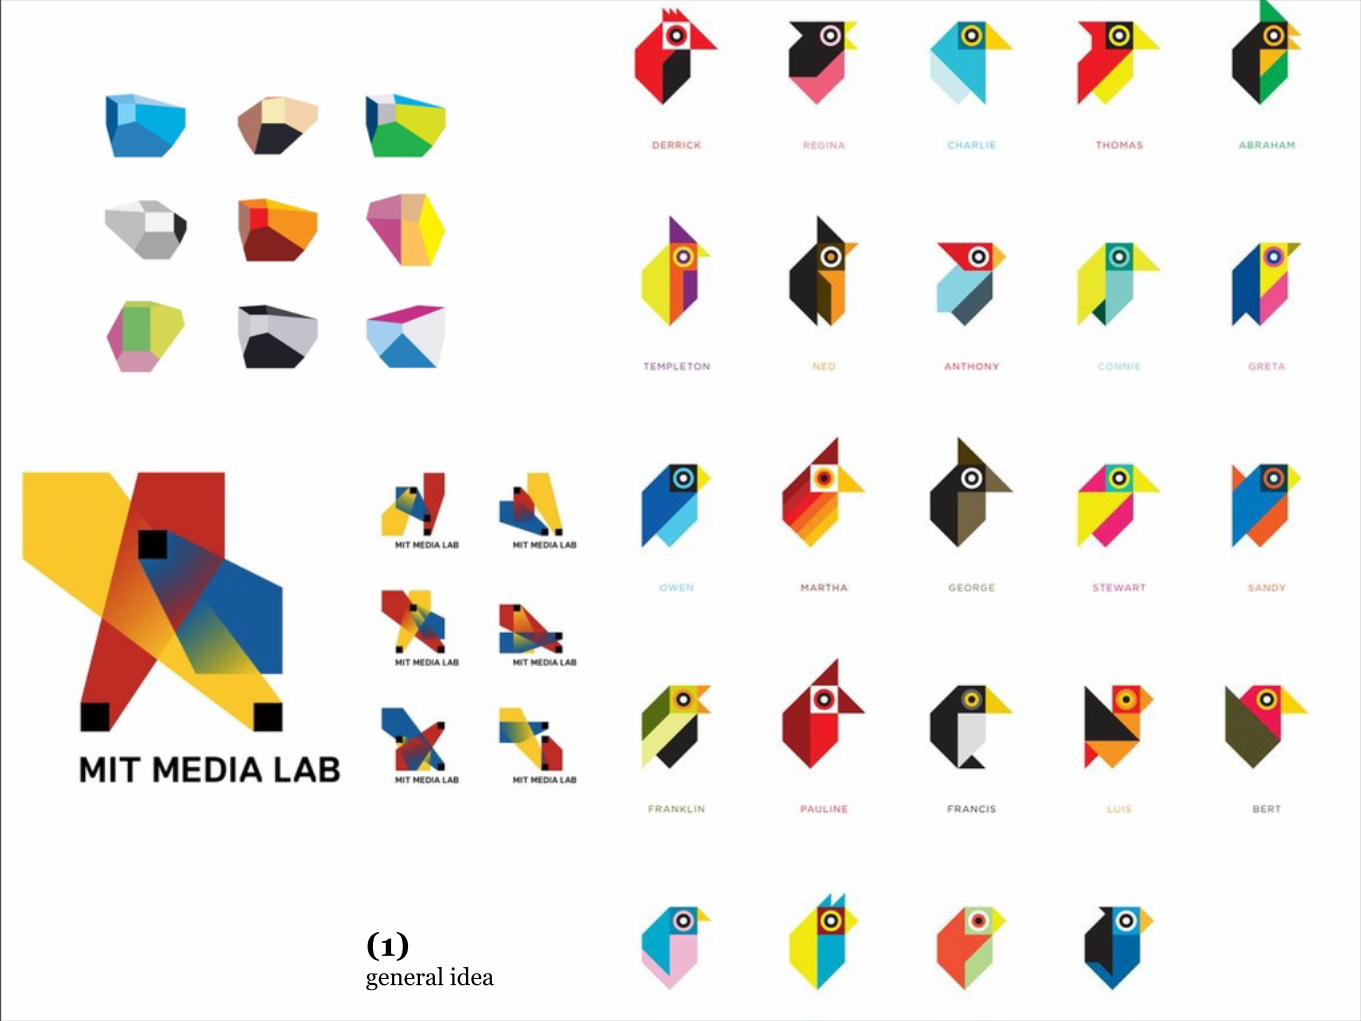
(3) INSPIRATION- get ideas from anything, anywhere, anytime
“it is not what you look at that matters, it's what you see”
H.D. Thoreau
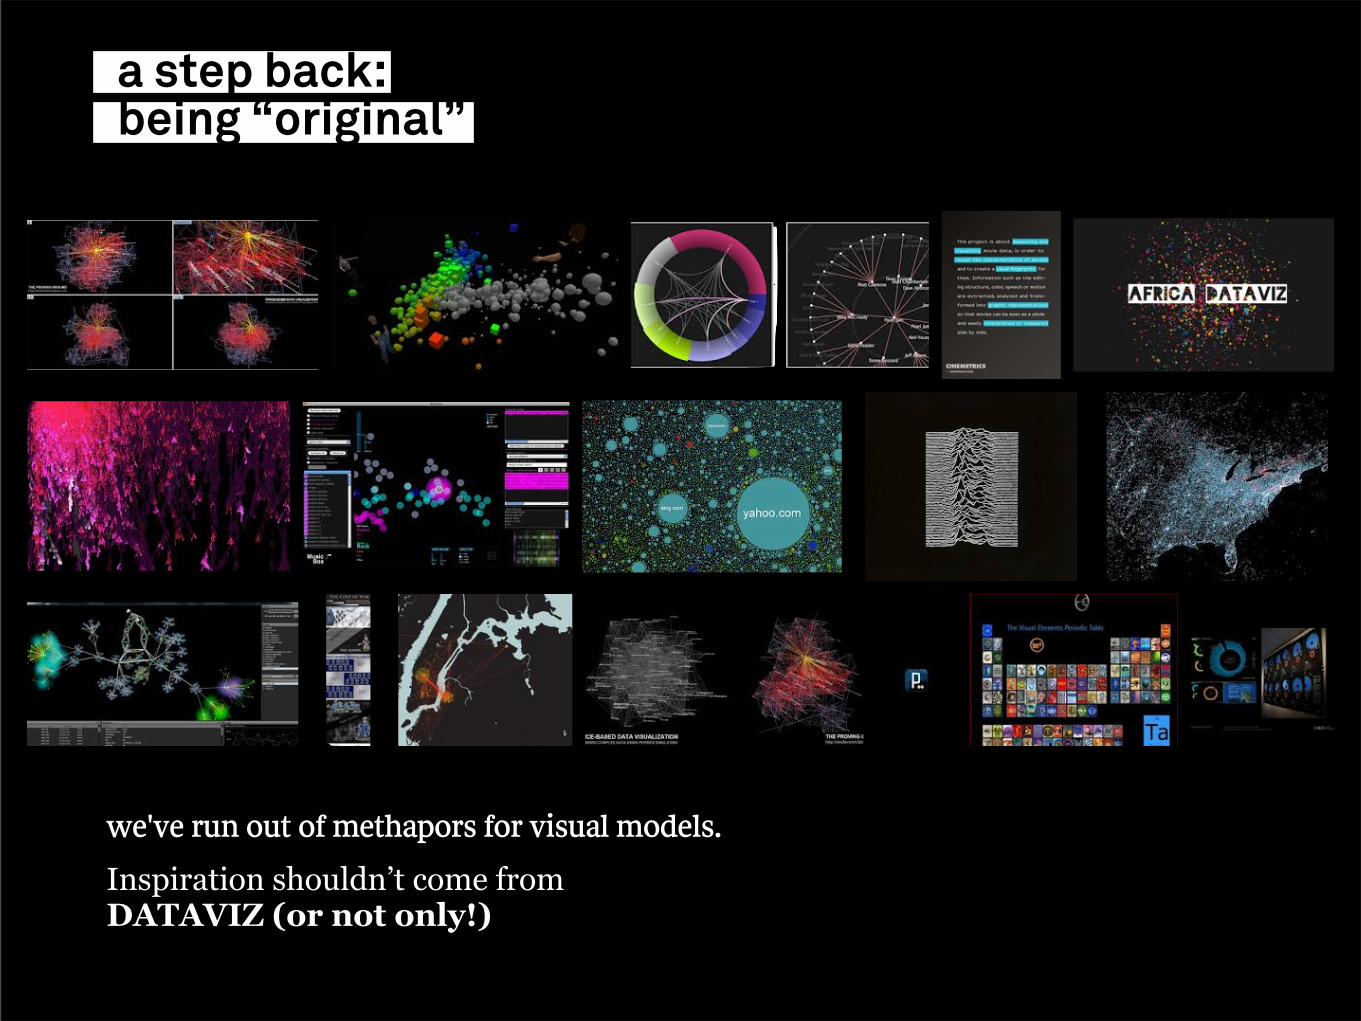
we've run out of methapors for visual models.
Inspiration shouldn’t come from DATAVIZ (or not only!)
a step back:being “original”

“an attempt to analyze the aesthetic qualities of things that are naturally pleasant to the eye,
in order to understand how they can be abstracted and re-used as core principles and guidelines in building visual compositions.”
how totranslatewhat yousee in somethingelse?

My way is:drawing out everything that catches my attention
“The act of reproducing things introduces a level of abstraction that helps focusing on the aspects of the composition that caught my attention. “
fiding yourown way
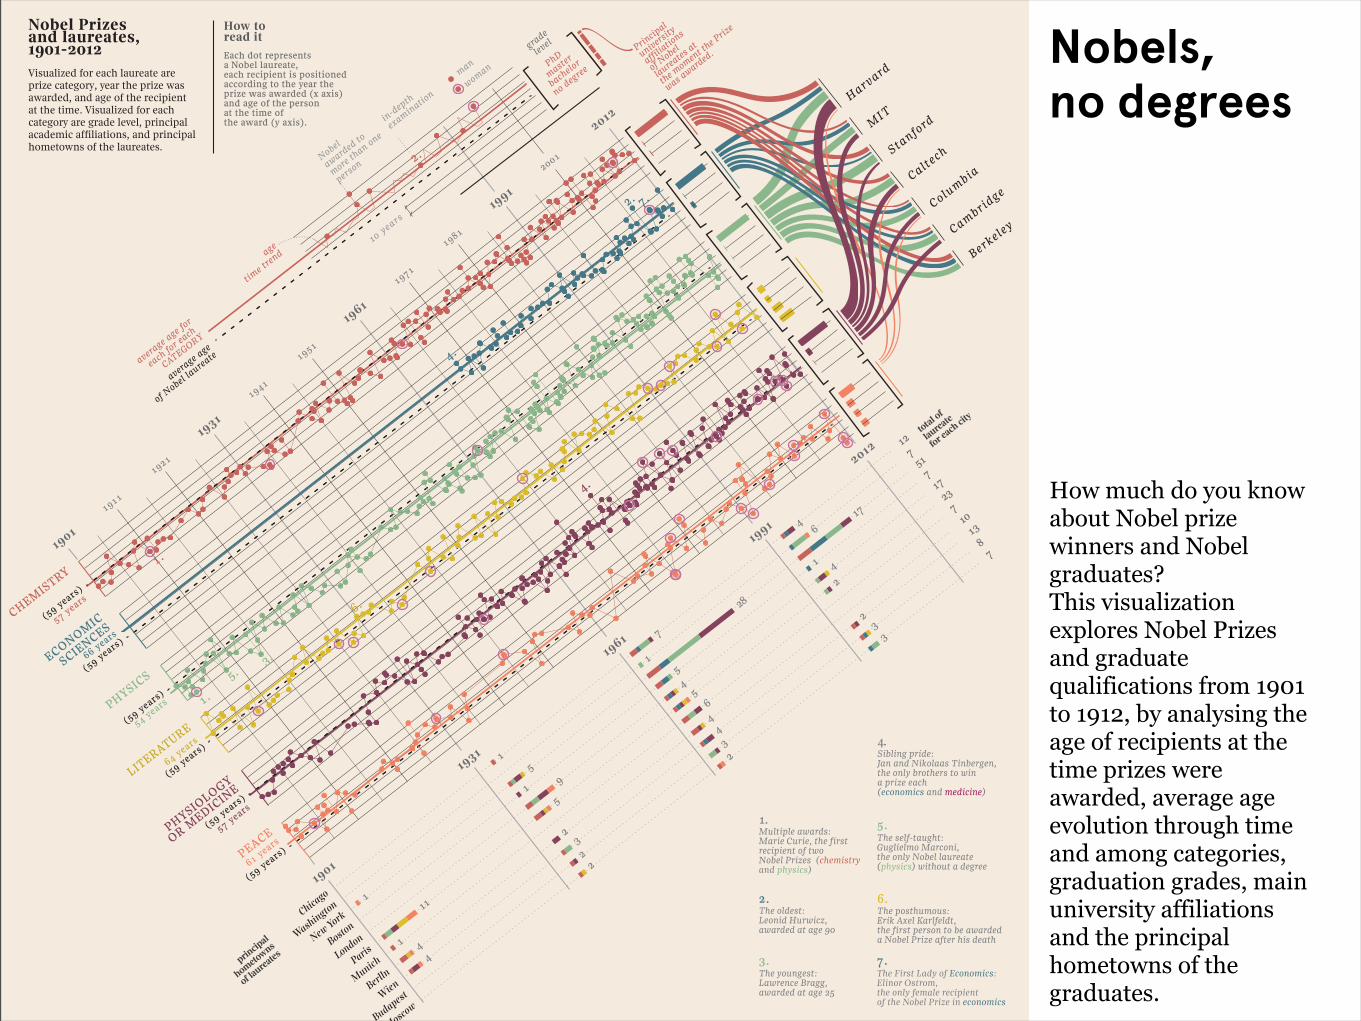
Nobels, no degrees
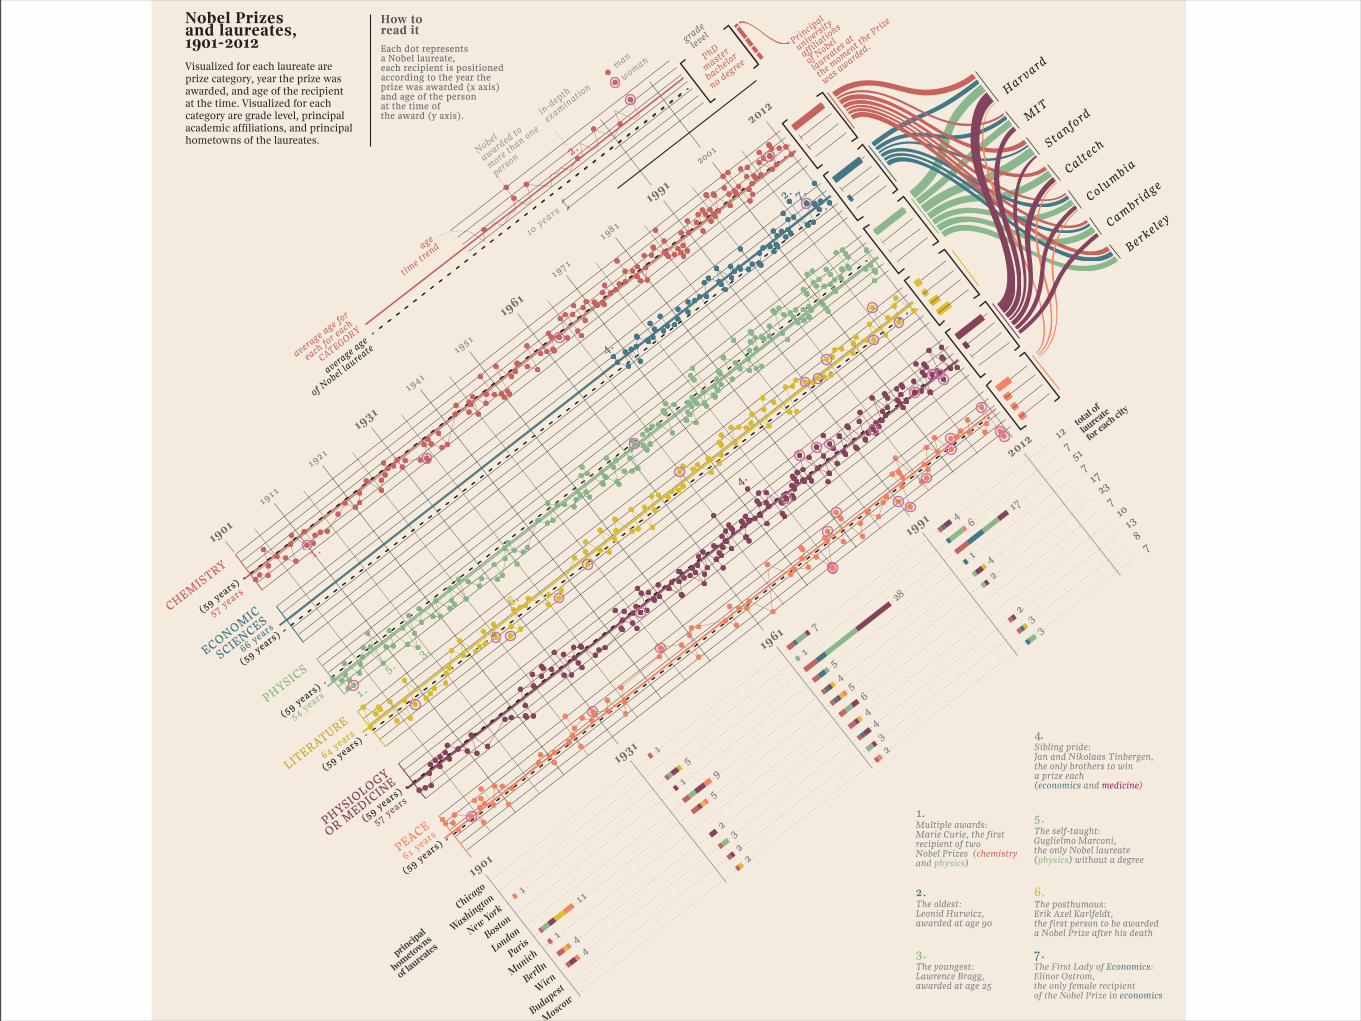
How much do you know about Nobel prize winners and Nobel graduates?This visualization explores Nobel Prizes and graduate qualifications from 1901 to 1912, by analysing the age of recipients at the time prizes were awarded, average age evolution through time and among categories, graduation grades, main university affiliations and the principal hometowns of the graduates.
1901
1931
1961
1991
2012
PEACEPHYSIOLOGY
OR MEDIC
INE
LITERATURE
PHYSICS
ECONOMIC
SCIENCESCHEMISTRY
64 years
57 years
61 years
54 years
66 years57 years
(59 years)
(59 years)
(59 years)
(59 years)
(59 years)
(59 years)
1911
1921
1941
1951
1971
1981
2001
Harvard
MIT
Stanford
Caltech
Columbia
BerkeleyCambridge
PhD
master
bachelor
no degreeman
woman
Principal
university
affiliatio
ns
of Nobel
laureates at
the moment th
e Prize
was awarded.
10 years
average age
of Nobel la
ureateaverage age for
each for each
CATEGORY
age
time tr
end
Nobel
awarded to
more than one
person
in-depth
examination
grade
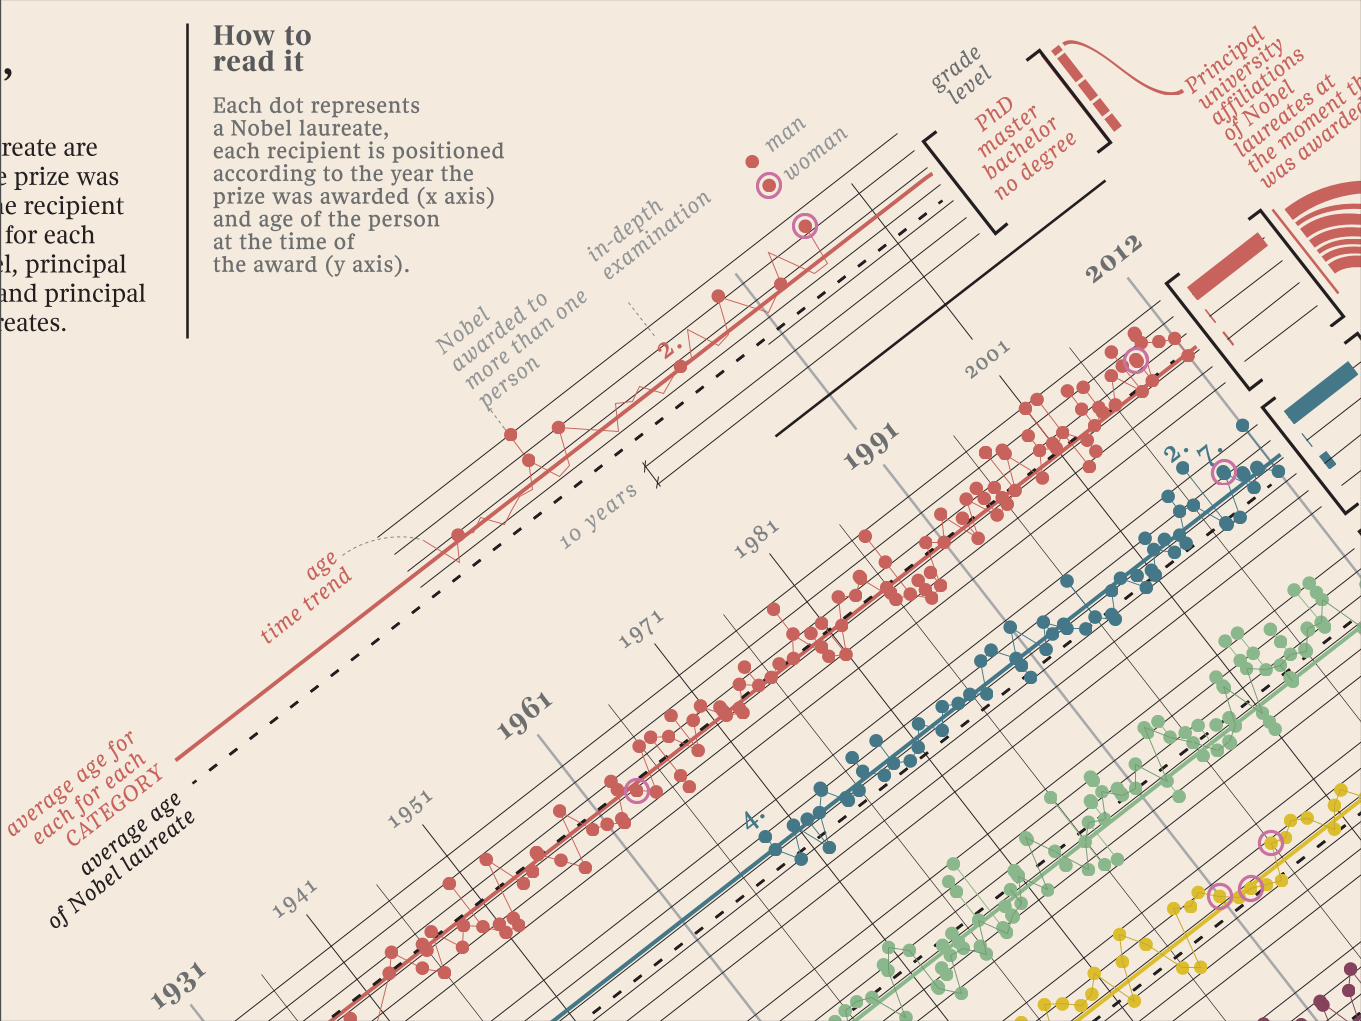
levelHow toread it
Nobel Prizes and laureates, 1901-2012 Each dot represents
a Nobel laureate, each recipient is positioned according to the year the prize was awarded (x axis) and age of the person at the time of the award (y axis).
Multiple awards: Marie Curie, the first recipient of two Nobel Prizes (chemistry and physics)
The oldest: Leonid Hurwicz, awarded at age 90
2.
1.
1.
3.5 .
2 . 7 .
4 .
The First Lady of Economics: Elinor Ostrom, the only female recipient of the Nobel Prize in economics
7.
4.
Visualized for each laureate are prize category, year the prize was awarded, and age of the recipient at the time. Visualized for each category are grade level, principal academic affiliations, and principal hometowns of the laureates.
The youngest: Lawrence Bragg, awarded at age 25
3.
Sibling pride: Jan and Nikolaas Tinbergen, the only brothers to win a prize each (economics and medicine)
4.
The self-taught:Guglielmo Marconi, the only Nobel laureate (physics) without a degree
5.
6.The posthumous: Erik Axel Karlfeldt, the first person to be awarded a Nobel Prize after his death
1.
2.
principal
hometowns
of laureates
total of
laureate
for each city
1901
1931
1961
2012
1991
Chicago
1
7
4
12
Boston
1
1
5
7
Washington
6
1
7
London
4
4
9
17
Paris
11
5
2
5
23
Munich
1
6
7
Berlln
4
4
2
10
Wien
4
4
2
3
13
Budapest
3
3
2
8
Moscow
2
3
2
7
6.
1
5
28
New York
17
51
1931
1961
1991
2012
1941
1951
1971
1981
2001
PhD
master
bachelor
no degreeman
woman
Principal
university
affiliatio
ns
of Nobel
laureates at
the moment th
e Prize
was awarded.
10 years
average age
of Nobel la
ureateaverage age for
each for each
CATEGORY
age
time tr
end
Nobel
awarded to
more than one
person
in-depth
examination
grade
levelHow toread it
Nobel Prizes and laureates,
Each dot represents a Nobel laureate, each recipient is positioned according to the year the prize was awarded (x axis) and age of the person at the time of the award (y axis).
2 . 7 .
4 .
Visualized for each laureate are prize category, year the prize was awarded, and age of the recipient at the time. Visualized for each category are grade level, principal academic affiliations, and principal hometowns of the laureates.
2.
1901
1931
1961
1991
2012
PEACEPHYSIOLOGY
OR MEDIC
INE
LITERATURE
PHYSICS
ECONOMIC
SCIENCESCHEMISTRY
64 years
57 years
61 years
54 years
66 years57 years
(59 years)
(59 years)
(59 years)
(59 years)
(59 years)
(59 years)
1911
1921
1941
1951
1971
1981
2001
Harvard
MIT
Stanford
Caltech
Columbia
BerkeleyCambridge
PhD
master
bachelor
no degreeman
woman
Principal
university
affiliatio
ns
of Nobel
laureates at
the moment th
e Prize
was awarded.
10 years
average age
of Nobel la
ureateaverage age for
each for each
CATEGORY
age
time tr
end
Nobel
awarded to
more than one
person
in-depth
examination
grade
levelHow toread it
Nobel Prizes and laureates, 1901-2012 Each dot represents
a Nobel laureate, each recipient is positioned according to the year the prize was awarded (x axis) and age of the person at the time of the award (y axis).
Multiple awards: Marie Curie, the first recipient of two Nobel Prizes (chemistry and physics)
The oldest: Leonid Hurwicz, awarded at age 90
2.
1.
1.
3.5 .
2 . 7 .
4 .
The First Lady of Economics: Elinor Ostrom, the only female recipient of the Nobel Prize in economics
7.
4.
Visualized for each laureate are prize category, year the prize was awarded, and age of the recipient at the time. Visualized for each category are grade level, principal academic affiliations, and principal hometowns of the laureates.
The youngest: Lawrence Bragg, awarded at age 25
3.
Sibling pride: Jan and Nikolaas Tinbergen, the only brothers to win a prize each (economics and medicine)
4.
The self-taught:Guglielmo Marconi, the only Nobel laureate (physics) without a degree
5.
6.The posthumous: Erik Axel Karlfeldt, the first person to be awarded a Nobel Prize after his death
1.
2.
principal
hometowns
of laureates
total of
laureate
for each city
1901
1931
1961
2012
1991
Chicago
1
7
4
12
Boston
1
1
5
7
Washington
6
1
7
London
4
4
9
17
Paris
11
5
2
5
23
Munich
1
6
7
Berlln
4
4
2
10
Wien
4
4
2
3
13
Budapest
3
3
2
8
Moscow
2
3
2
7
6.
1
5
28
New York
17
51
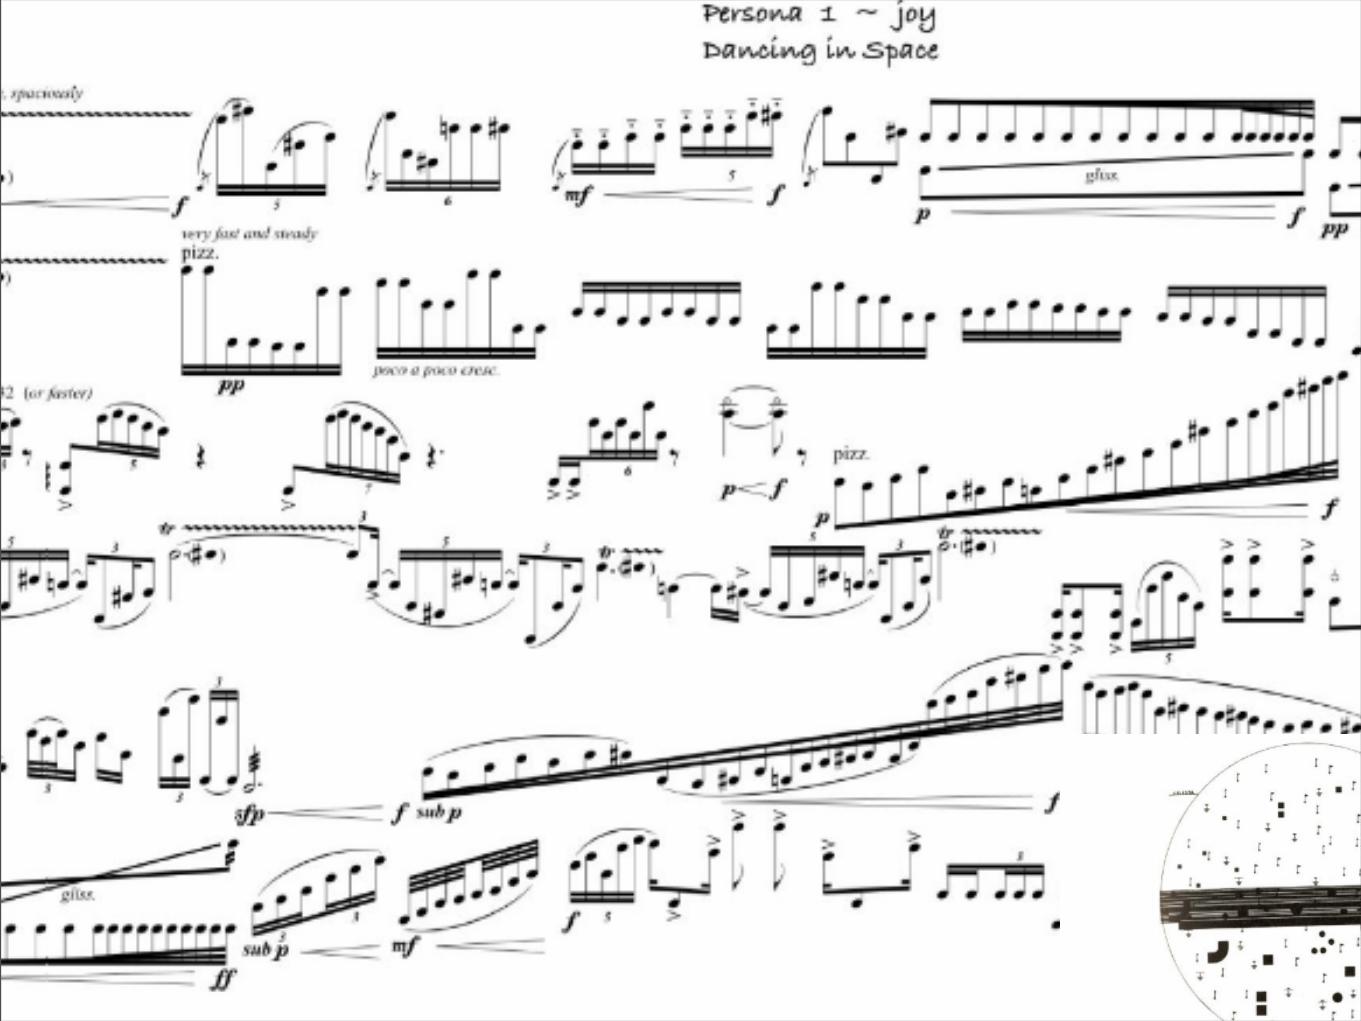
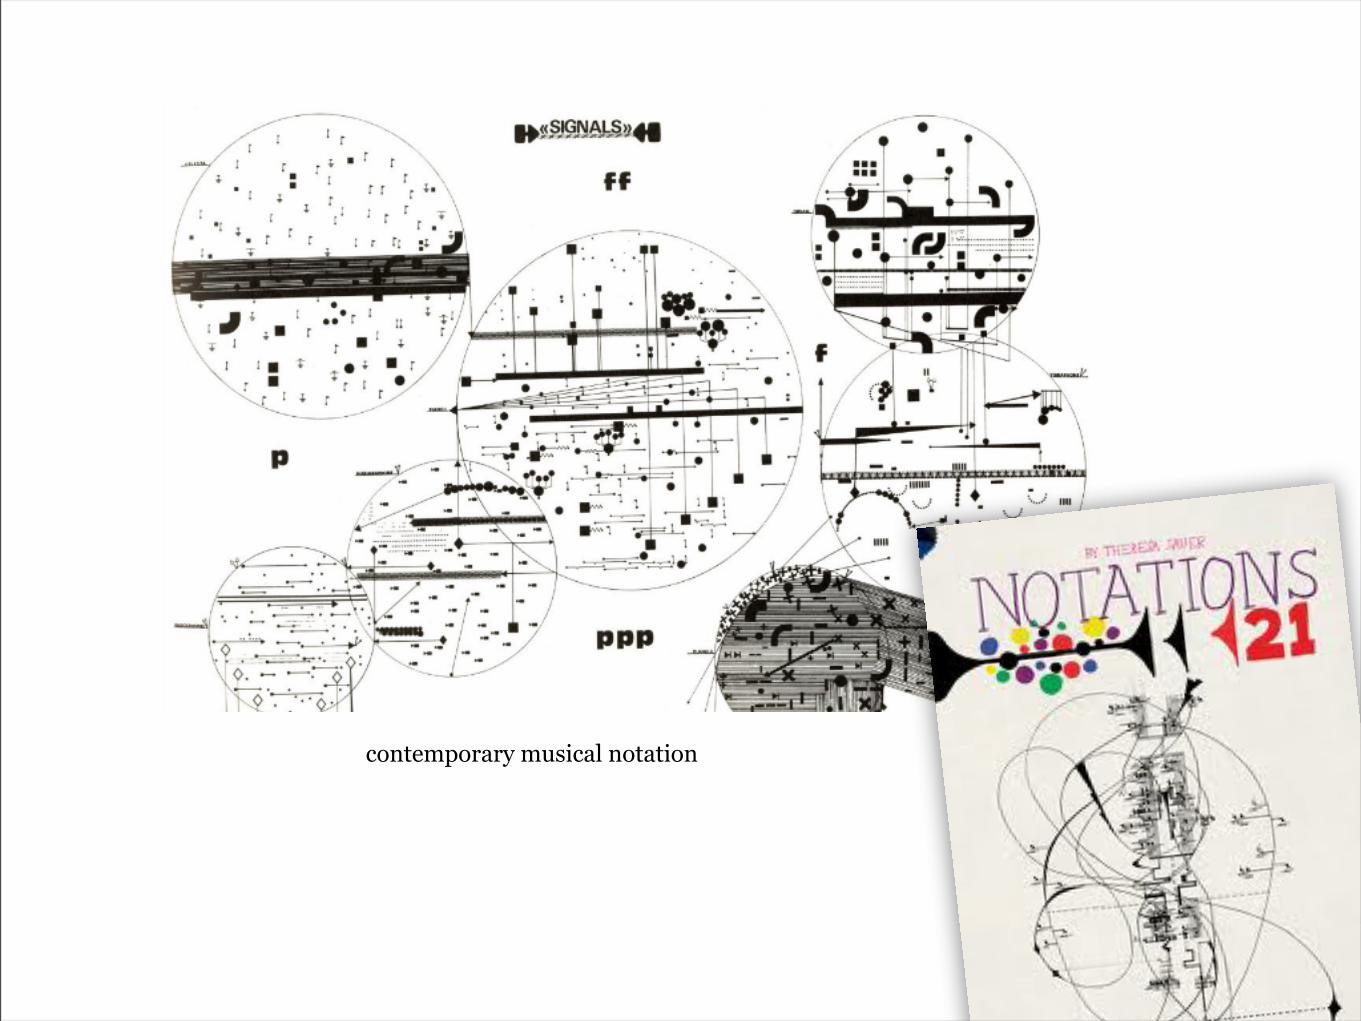
contemporary musical notation
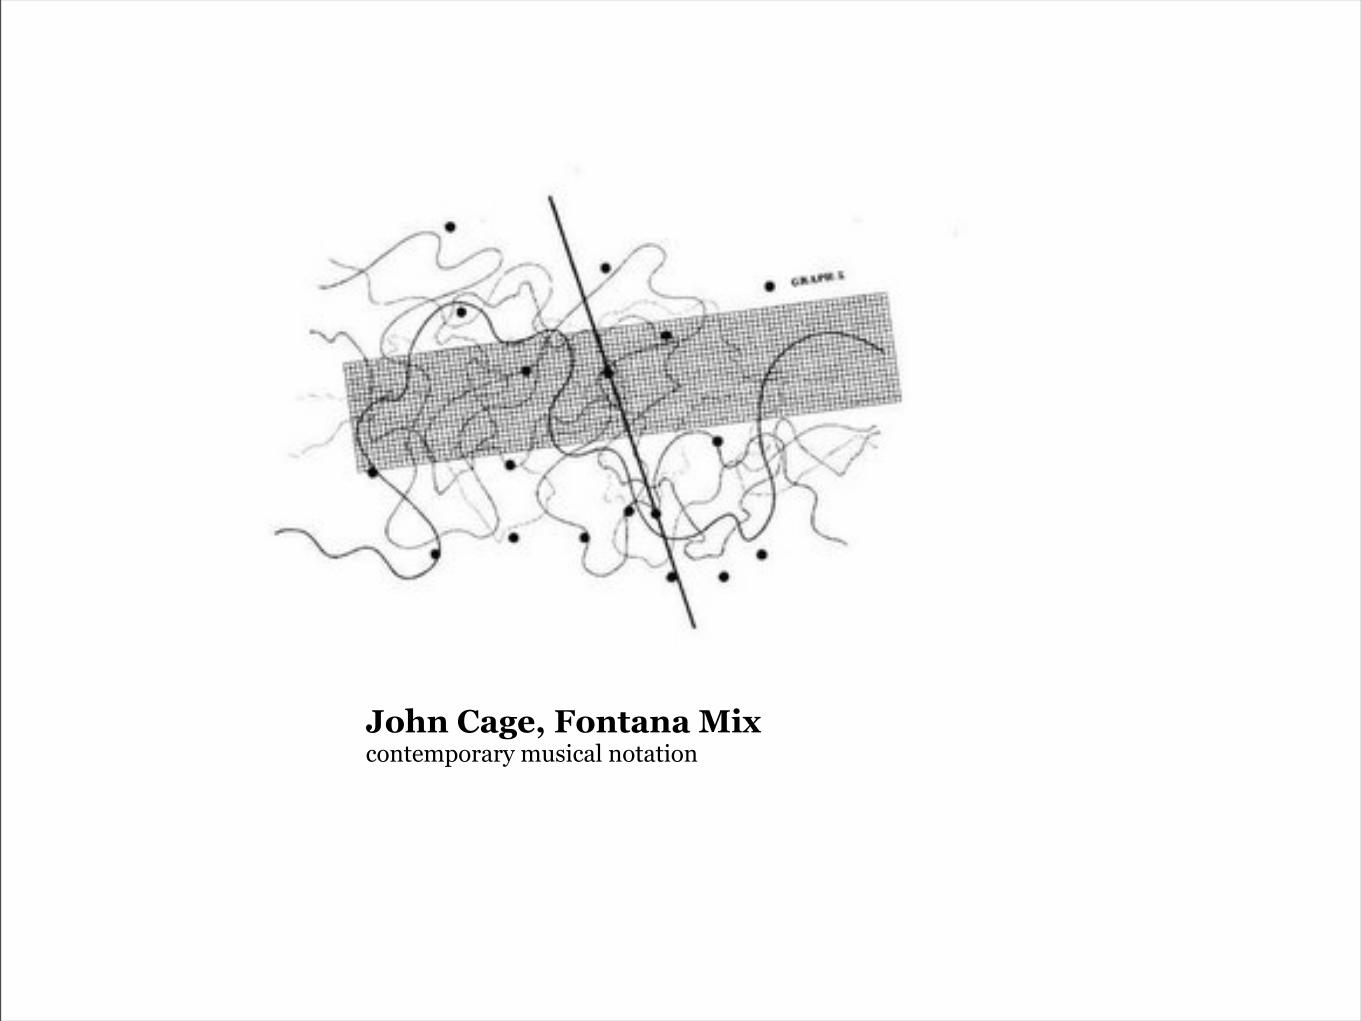
John Cage, Fontana Mixcontemporary musical notation
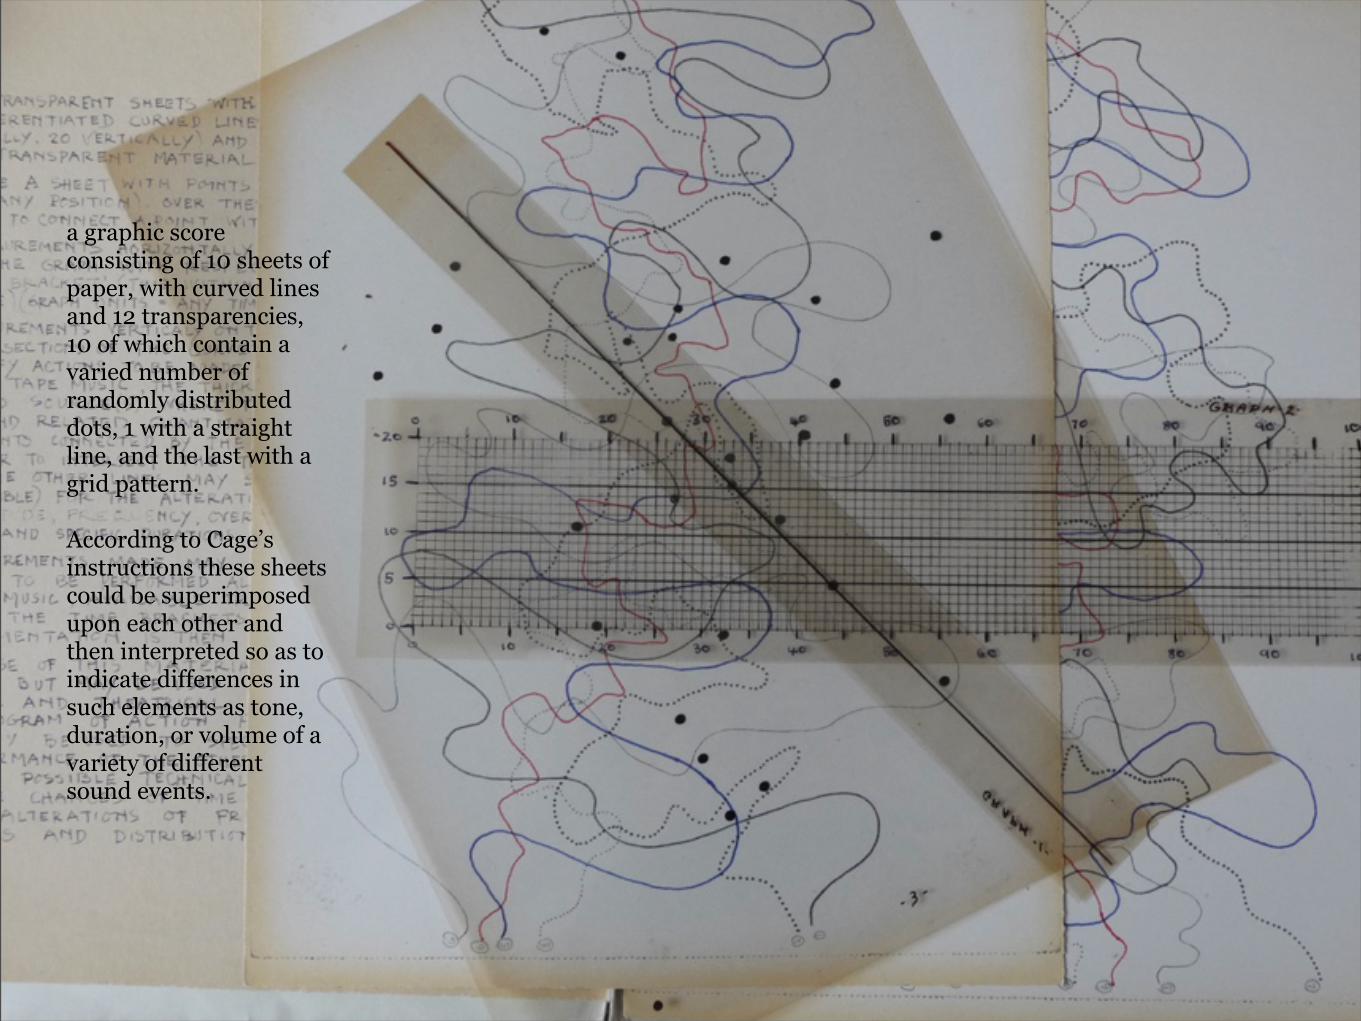
a graphic score consisting of 10 sheets of paper, with curved lines and 12 transparencies, 10 of which contain a varied number of randomly distributed dots, 1 with a straight line, and the last with a grid pattern.
According to Cage’s instructions these sheets could be superimposed upon each other and then interpreted so as to indicate differences in such elements as tone, duration, or volume of a variety of different sound events.
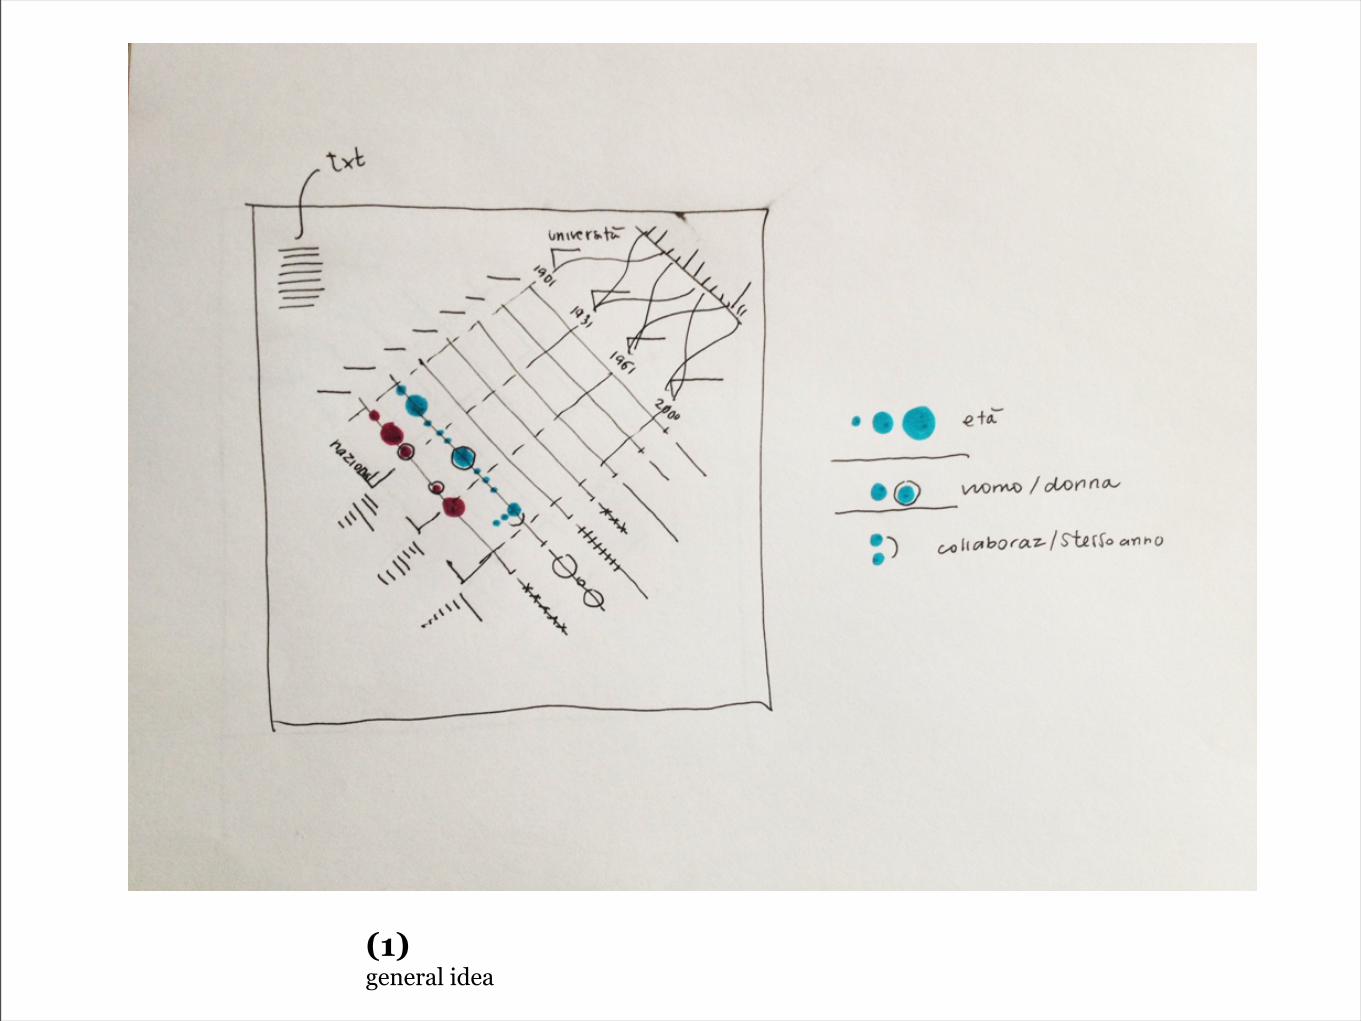
(1)general idea
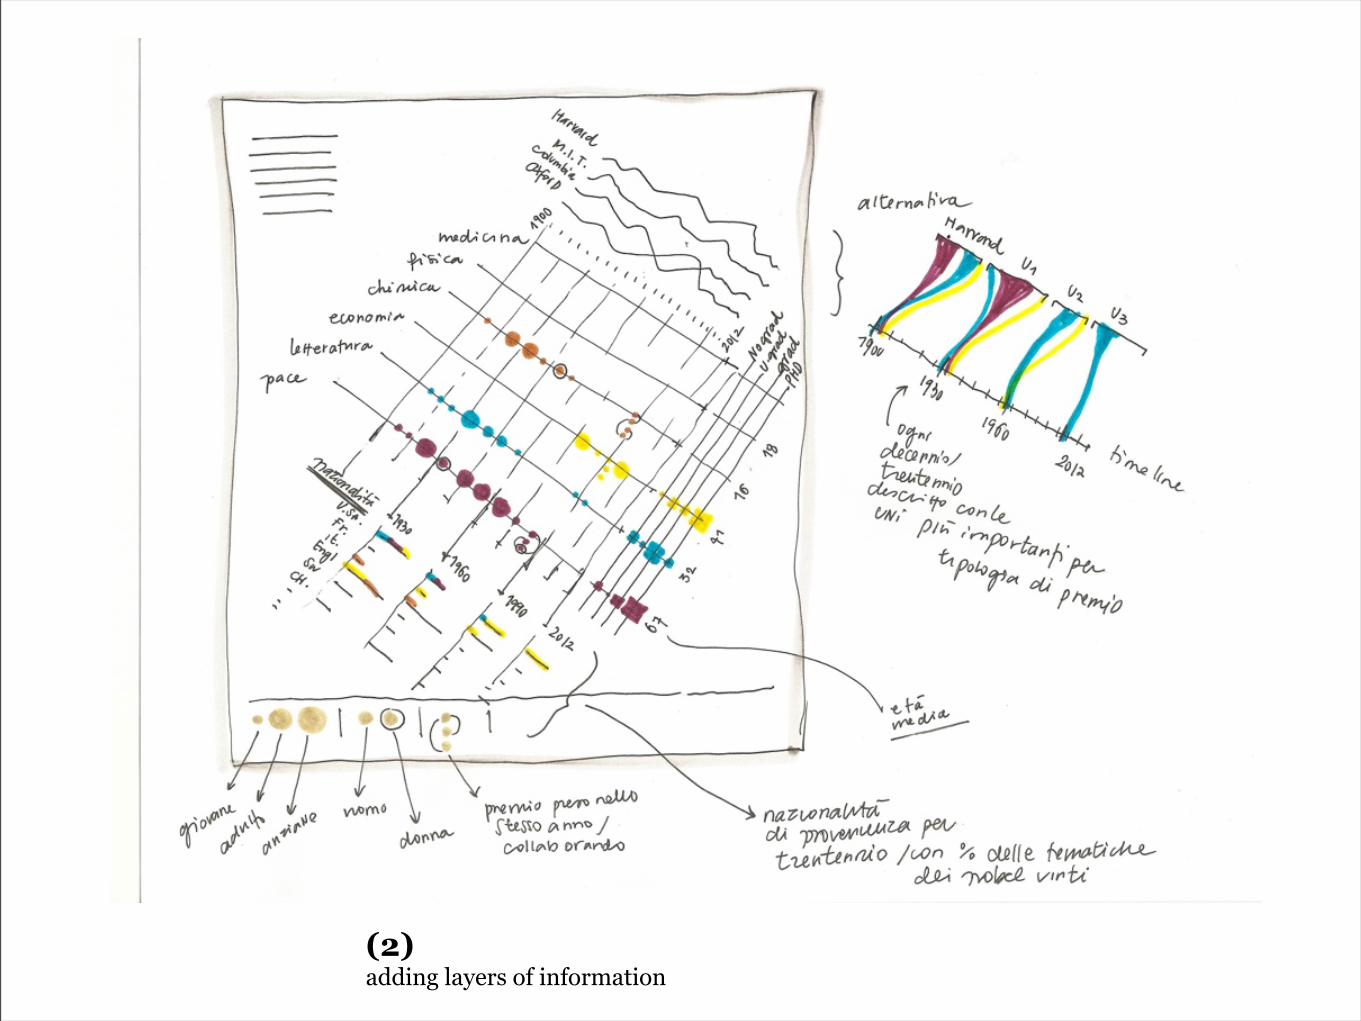
(2)adding layers of information
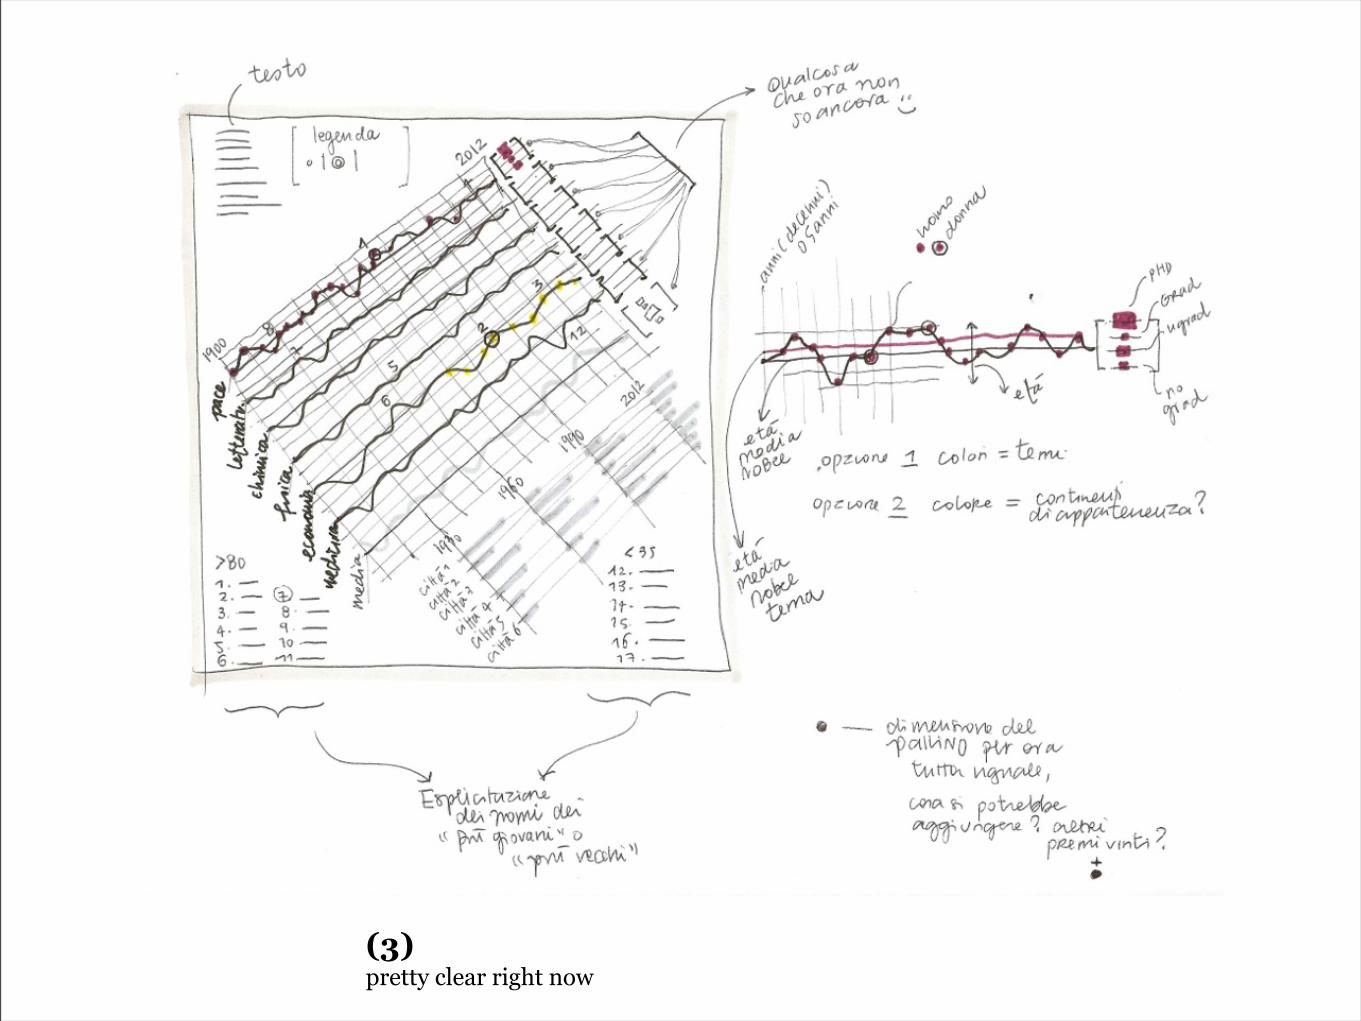
(3)pretty clear right now
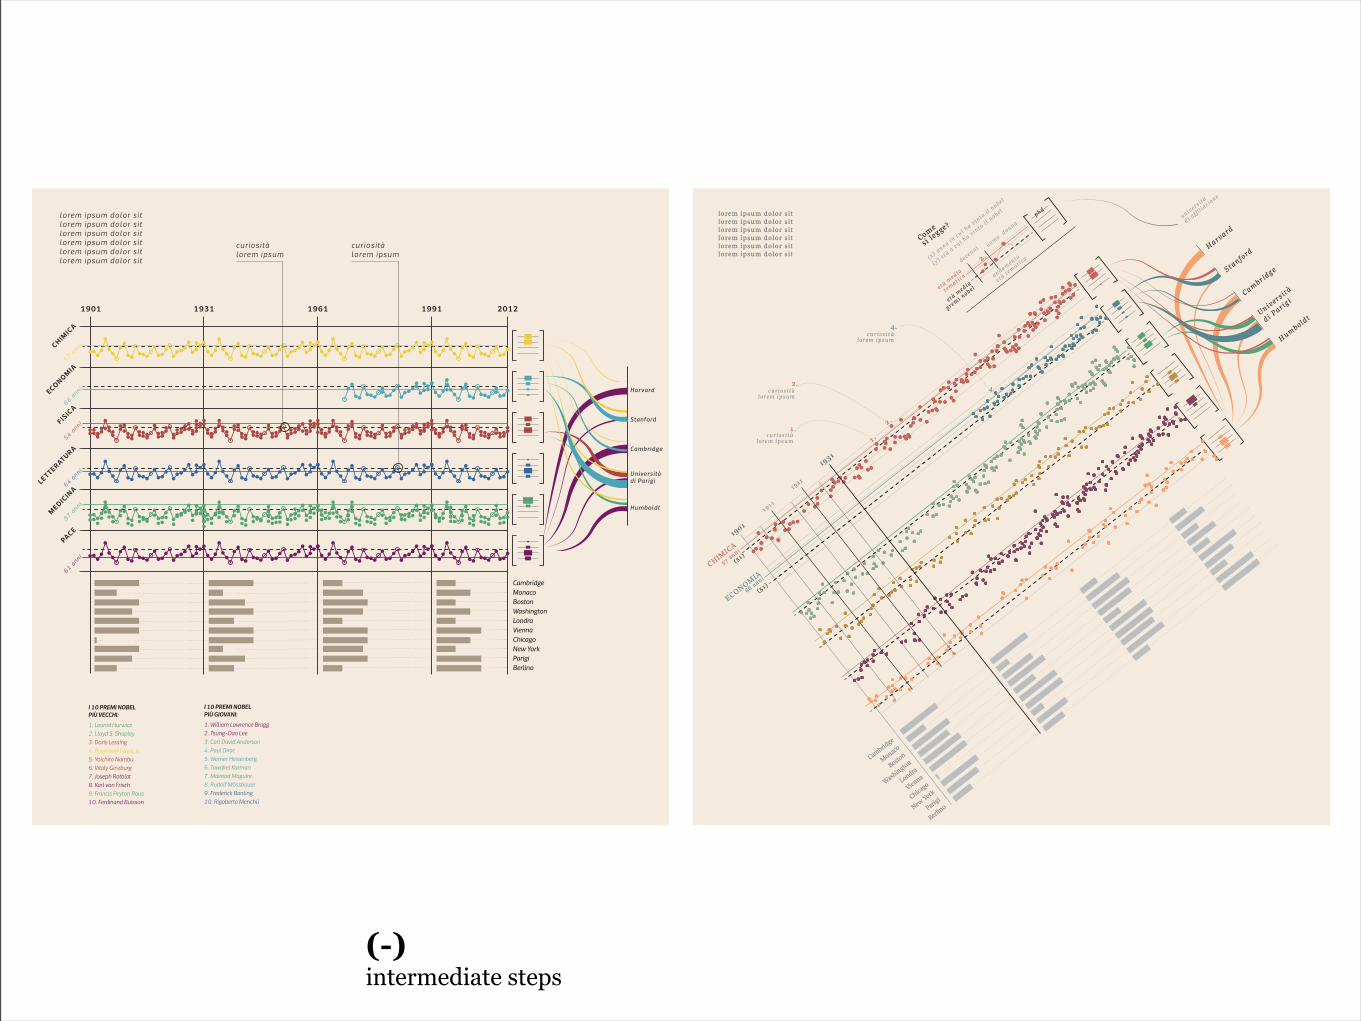
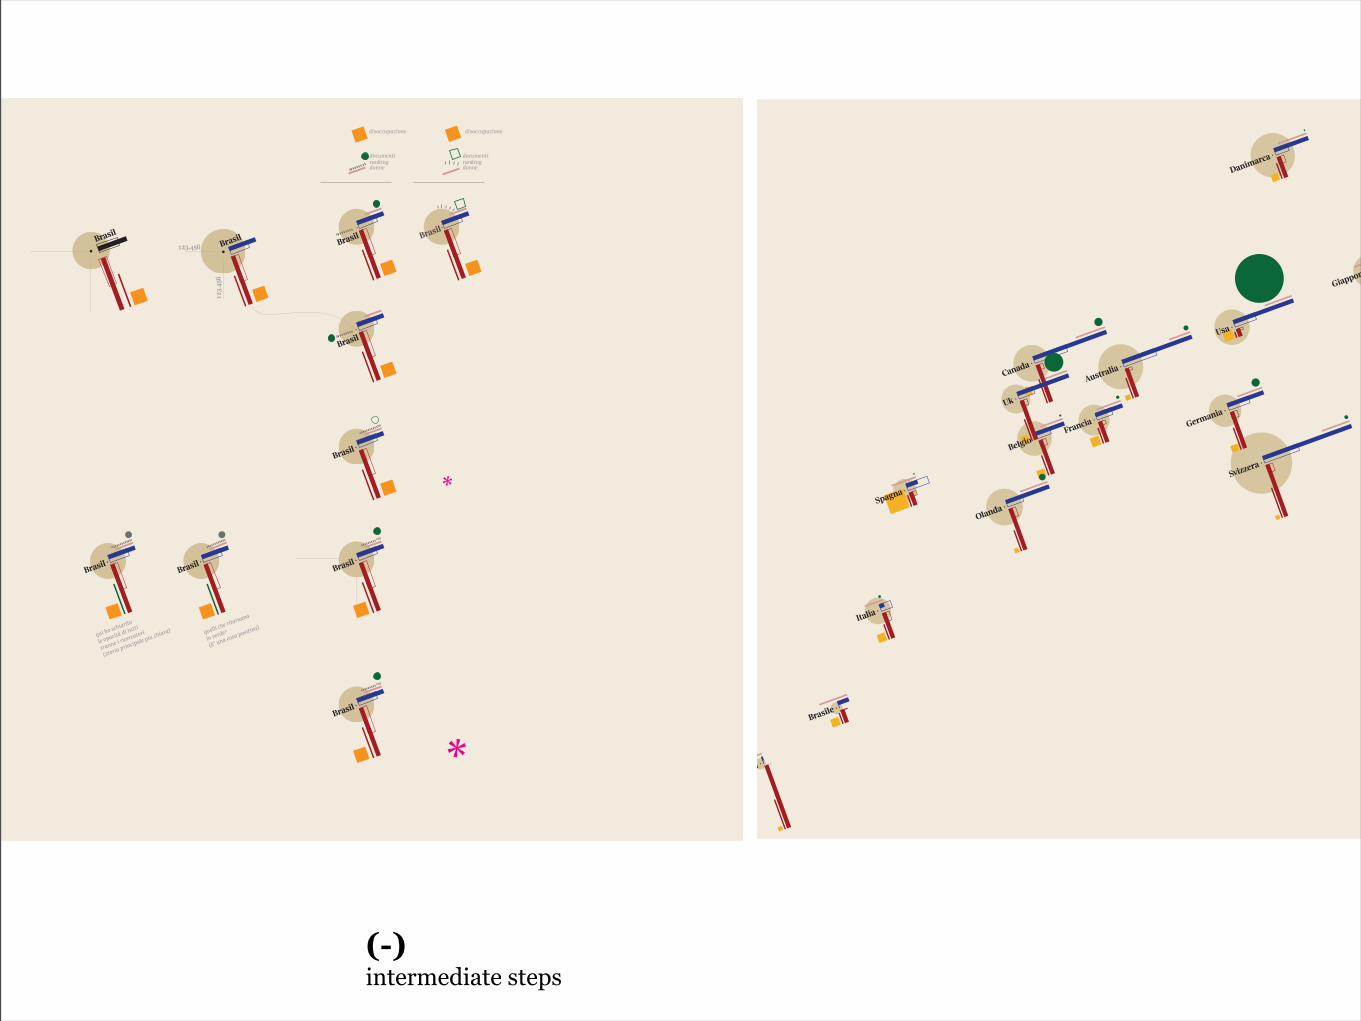
(-)intermediate steps
1901
1911
1921
1931
ECONOMIACHIM
ICA
lorem ipsum dolor s i tlorem ipsum dolor s i tlorem ipsum dolor s i tlorem ipsum dolor s i tlorem ipsum dolor s i tlorem ipsum dolor s i t
Harvard
Stanford
Cambridge
Università
di Parigi
Humboldt
Cambridge
Chicago
New York
Parigi
Berlino
Boston
WashingtonMonaco
Londra
Vienna
curiositàlorem ipsum
66 anni
57 anni
(51)
(51)
4 .
4 .
curiositàlorem ipsum
curiositàlorem ipsum
2.
1.1.
2.
2 .
phd
età media
premi nobel
Come
si legge?
età media
tematica
decenni uomodonna
università
di affilia
zione
andamento
età tematica(y) età a cui h
a vinto i l nobel
(x) anno in cui h
a vinto i l nobel
1 9 0 1 1 9 3 1 1 9 6 1 1 9 9 1 2 0 1 2
PACE
MEDIC
INA
LETTERATURA
FISIC
A
ECONOMIA
CHIMIC
A
lorem ipsum dolor s i tlorem ipsum dolor s i tlorem ipsum dolor s i tlorem ipsum dolor s i tlorem ipsum dolor s i tlorem ipsum dolor s i t
H a r va rd
S ta n fo rd
Ca m b r i d ge
U n i v e r s i tàd i Pa r i g i
H u m b o ld t
Cambridge
ChicagoNew YorkParigiBerlino
BostonWashington
Monaco
LondraVienna
cur ios i tàlorem ipsum
cur ios i tàlorem ipsum
1. Leonid Hurwicz
I 10 PREMI NOBELPIÙ VECCHI:
I 10 PREMI NOBELPIÙ GIOVANI:
2. Lloyd S. Shapley3. Doris Lessing4. Raymond Davis, Jr.5. Yoichiro Nambu6. Vitaly Ginzburg7. Joseph Rotblat8. Karl von Frisch9. Francis Peyton Rous10. Ferdinand Buisson
1. William Lawrence Bragg2. Tsung-Dao Lee3. Carl David Anderson4. Paul Dirac5. Werner Heisenberg6. Tawakel Karman7. Mairead Maguire8. Rudolf Mössbauer9. Frederick Banting10. Rigoberta Menchú
64 anni
57 anni
61 anni
54 anni
66 anni
57 anni

1901
1931
1961
1991
2012
PEACEPHYSIOLOGY
OR MEDIC
INE
LITERATURE
PHYSICS
ECONOMIC
SCIENCESCHEMISTRY
64 years
57 years
61 years
54 years
66 years57 years
(59 years)
(59 years)
(59 years)
(59 years)
(59 years)
(59 years)
1911
1921
1941
1951
1971
1981
2001
Harvard
MIT
Stanford
Caltech
Columbia
BerkeleyCambridge
PhD
master
bachelor
no degreeman
woman
Principal
university
affiliatio
ns
of Nobel
laureates at
the moment th
e Prize
was awarded.
10 years
average age
of Nobel la
ureateaverage age for
each for each
CATEGORY
age
time tr
end
Nobel
awarded to
more than one
person
in-depth
examination
grade
levelHow toread it
Nobel Prizes and laureates, 1901-2012 Each dot represents
a Nobel laureate, each recipient is positioned according to the year the prize was awarded (x axis) and age of the person at the time of the award (y axis).
Multiple awards: Marie Curie, the first recipient of two Nobel Prizes (chemistry and physics)
The oldest: Leonid Hurwicz, awarded at age 90
2.
1.
1.
3.5 .
2 . 7 .
4 .
The First Lady of Economics: Elinor Ostrom, the only female recipient of the Nobel Prize in economics
7.
4.
Visualized for each laureate are prize category, year the prize was awarded, and age of the recipient at the time. Visualized for each category are grade level, principal academic affiliations, and principal hometowns of the laureates.
The youngest: Lawrence Bragg, awarded at age 25
3.
Sibling pride: Jan and Nikolaas Tinbergen, the only brothers to win a prize each (economics and medicine)
4.
The self-taught:Guglielmo Marconi, the only Nobel laureate (physics) without a degree
5.
6.The posthumous: Erik Axel Karlfeldt, the first person to be awarded a Nobel Prize after his death
1.
2.
principal
hometowns
of laureates
total of
laureate
for each city
1901
1931
1961
2012
1991
Chicago
1
7
4
12
Boston
1
1
5
7
Washington
6
1
7
London
4
4
9
17
Paris
11
5
2
5
23
Munich
1
6
7
Berlln
4
4
2
10
Wien
4
4
2
3
13
Budapest
3
3
2
8
Moscow
2
3
2
7
6.
1
5
28
New York
17
51
Nobels, no degrees
How much do you know about Nobel prize winners and Nobel graduates?This visualization explores Nobel Prizes and graduate qualifications from 1901 to 1912, by analysing the age of recipients at the time prizes were awarded, average age evolution through time and among categories, graduation grades, main university affiliations and the principal hometowns of the graduates.
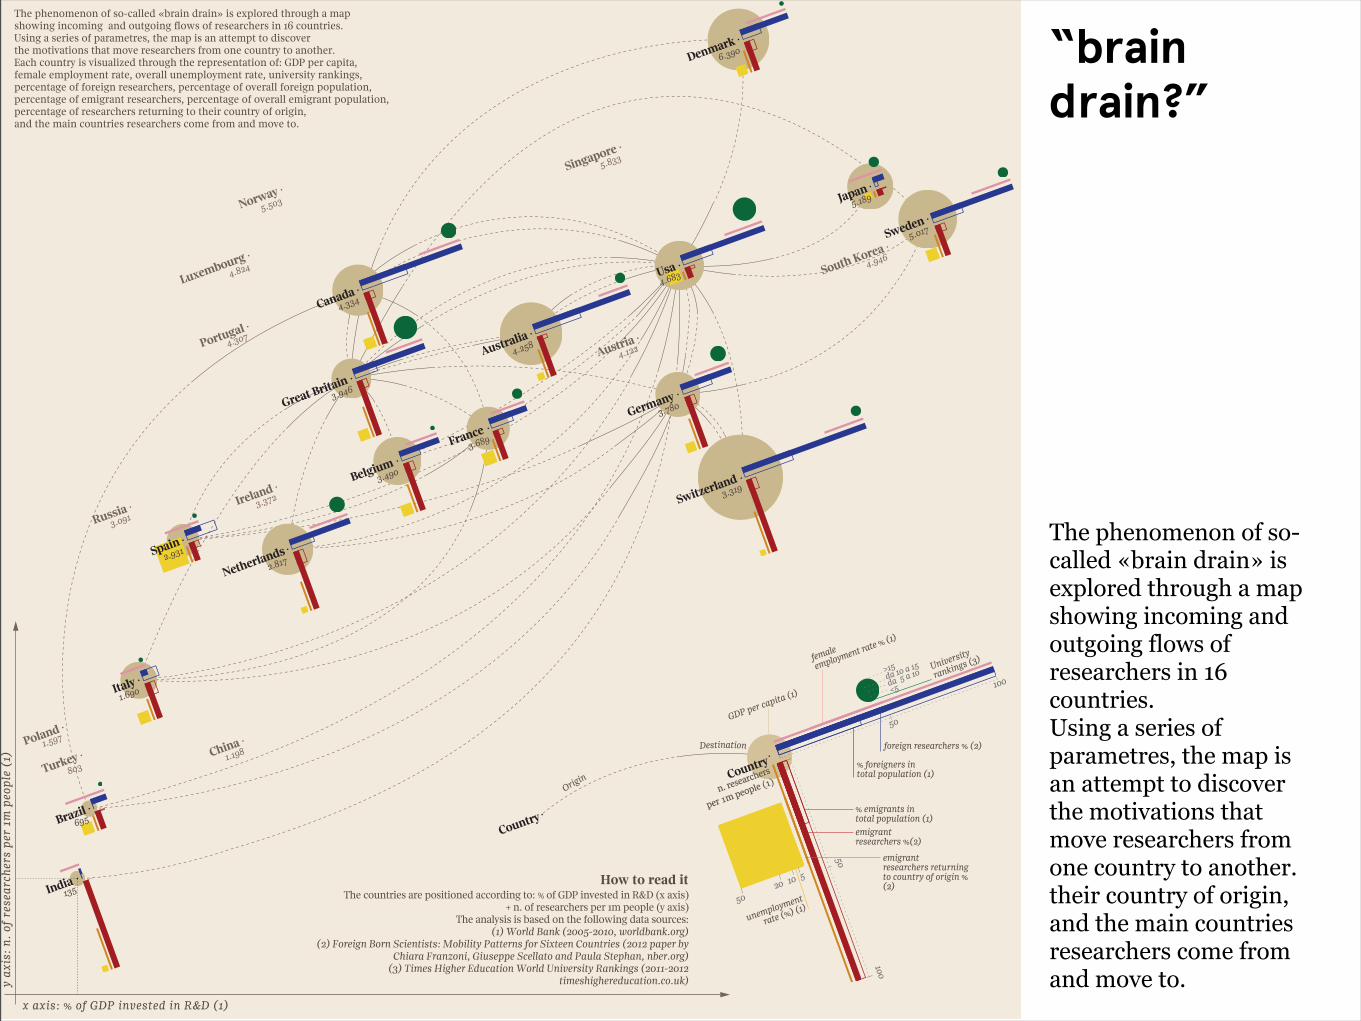
“braindrain?”
The phenomenon of so-called «brain drain» is explored through a mapshowing incoming and outgoing flows of researchers in 16 countries.Using a series of parametres, the map is an attempt to discoverthe motivations that move researchers from one country to another.their country of origin,and the main countries researchers come from and move to.
Denmark
India
Brazil
Italy
Spain
Netherlands
Great Britain
Canada
Belgium
France
Australia
Usa
Germany
Switzerland
Japan
Sweden
The phenomenon of so-called «brain drain» is explored through a map showing incoming and outgoing flows of researchers in 16 countries. Using a series of parametres, the map is an attempt to discover the motivations that move researchers from one country to another.Each country is visualized through the representation of: GDP per capita, female employment rate, overall unemployment rate, university rankings, percentage of foreign researchers, percentage of overall foreign population, percentage of emigrant researchers, percentage of overall emigrant population, percentage of researchers returning to their country of origin, and the main countries researchers come from and move to.
x axis: % of GDP invested in R&D (1)
y ax
is: n
. of r
esea
rche
rs p
er 1
m p
eopl
e (1
)
female
employment rate % (1)
emigrantresearchers %(2)
foreign researchers % (2)
% emigrants in total population (1)
% foreigners in total population (1)
unemployment
rate (%) (1)
GDP per capita (1)
emigrantresearchers returning to country of origin %(2)
Country
Country
n. researchers
per 1m people (1)
50
100
50
100
>15da 10 a 15
da 5 a 10
<5
5020 10 5
Destination
Origin
University
rankings (3)
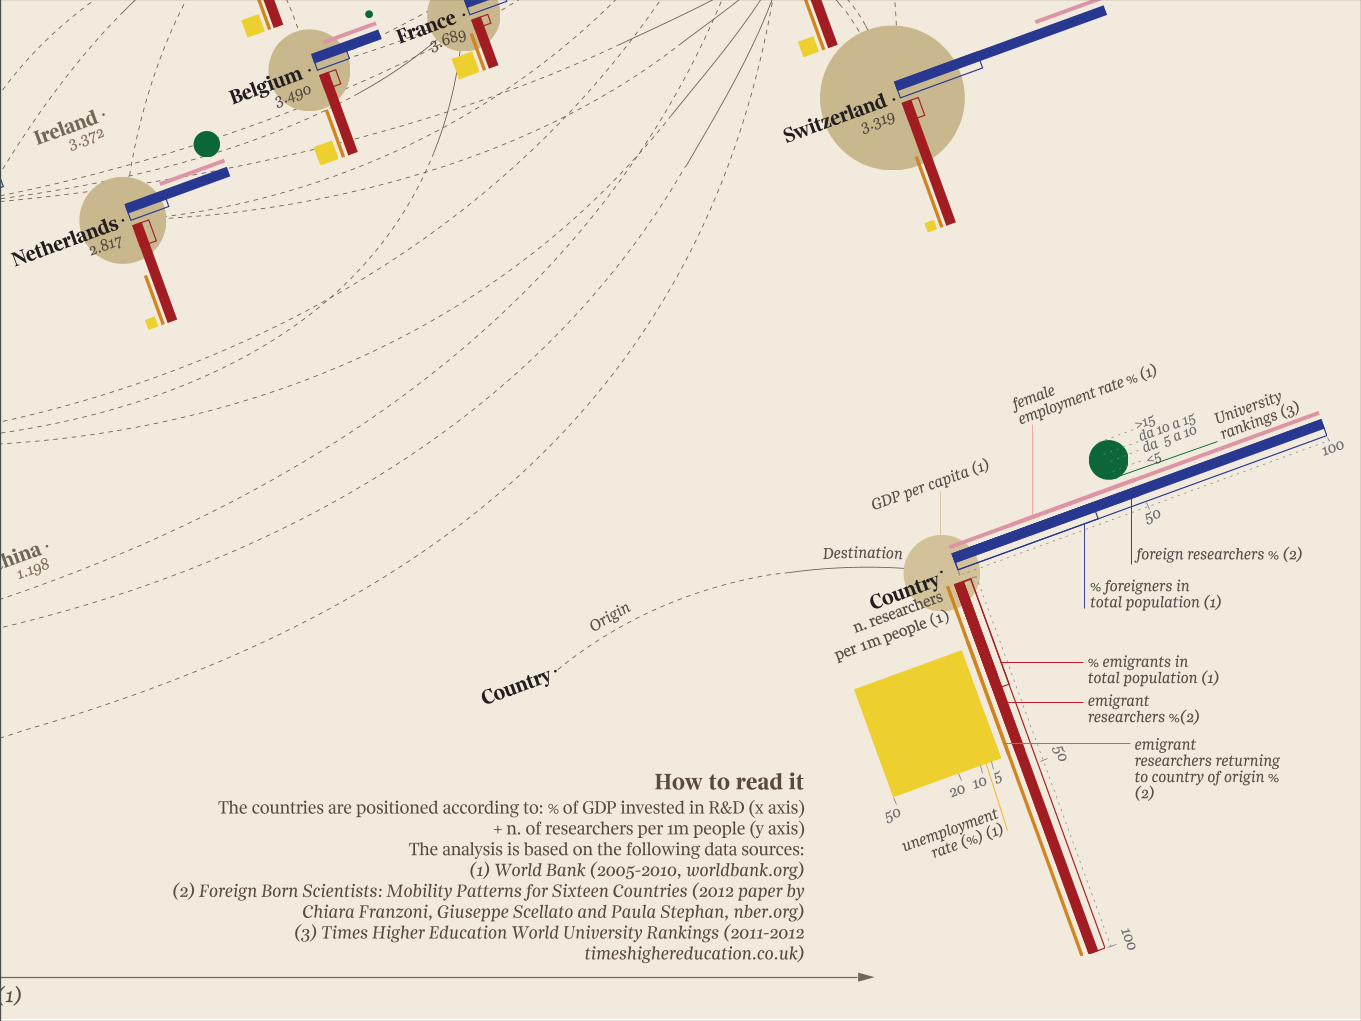
How to read itThe countries are positioned according to: % of GDP invested in R&D (x axis)
+ n. of researchers per 1m people (y axis)The analysis is based on the following data sources:
(1) World Bank (2005-2010, worldbank.org)(2) Foreign Born Scientists: Mobility Patterns for Sixteen Countries (2012 paper by
Chiara Franzoni, Giuseppe Scellato and Paula Stephan, nber.org)(3) Times Higher Education World University Rankings (2011-2012
timeshighereducation.co.uk)
4.334
3.946
3.490
2.8172.931
1.690
695
135
3.689
4.258
3.780
3.319
4.683
5.017
5.189
6.390
Ireland3.372
China1.198
Turkey803
Singapore5.833
Norway5.503
Portugal4.307
Luxembourg4.824
Austria4.122
Poland1.597
South Korea4.946
Russia3.091
Netherlands
Belgium
FranceGermany
Switzerland
x axis: % of GDP invested in R&D (1)
female
employment rate % (1)
emigrantresearchers %(2)
foreign researchers % (2)
% emigrants in total population (1)
% foreigners in total population (1)
unemployment
rate (%) (1)
GDP per capita (1)
emigrantresearchers returning to country of origin %(2)
Country
Country
n. researchers
per 1m people (1)
50
100
50
100
>15da 10 a 15
da 5 a 10
<5
5020 10 5
Destination
Origin
University
rankings (3)
How to read itThe countries are positioned according to: % of GDP invested in R&D (x axis)
+ n. of researchers per 1m people (y axis)The analysis is based on the following data sources:
(1) World Bank (2005-2010, worldbank.org)(2) Foreign Born Scientists: Mobility Patterns for Sixteen Countries (2012 paper by
Chiara Franzoni, Giuseppe Scellato and Paula Stephan, nber.org)(3) Times Higher Education World University Rankings (2011-2012
timeshighereducation.co.uk)
3.490
2.817
3.689
3.319Ireland
3.372
China1.198
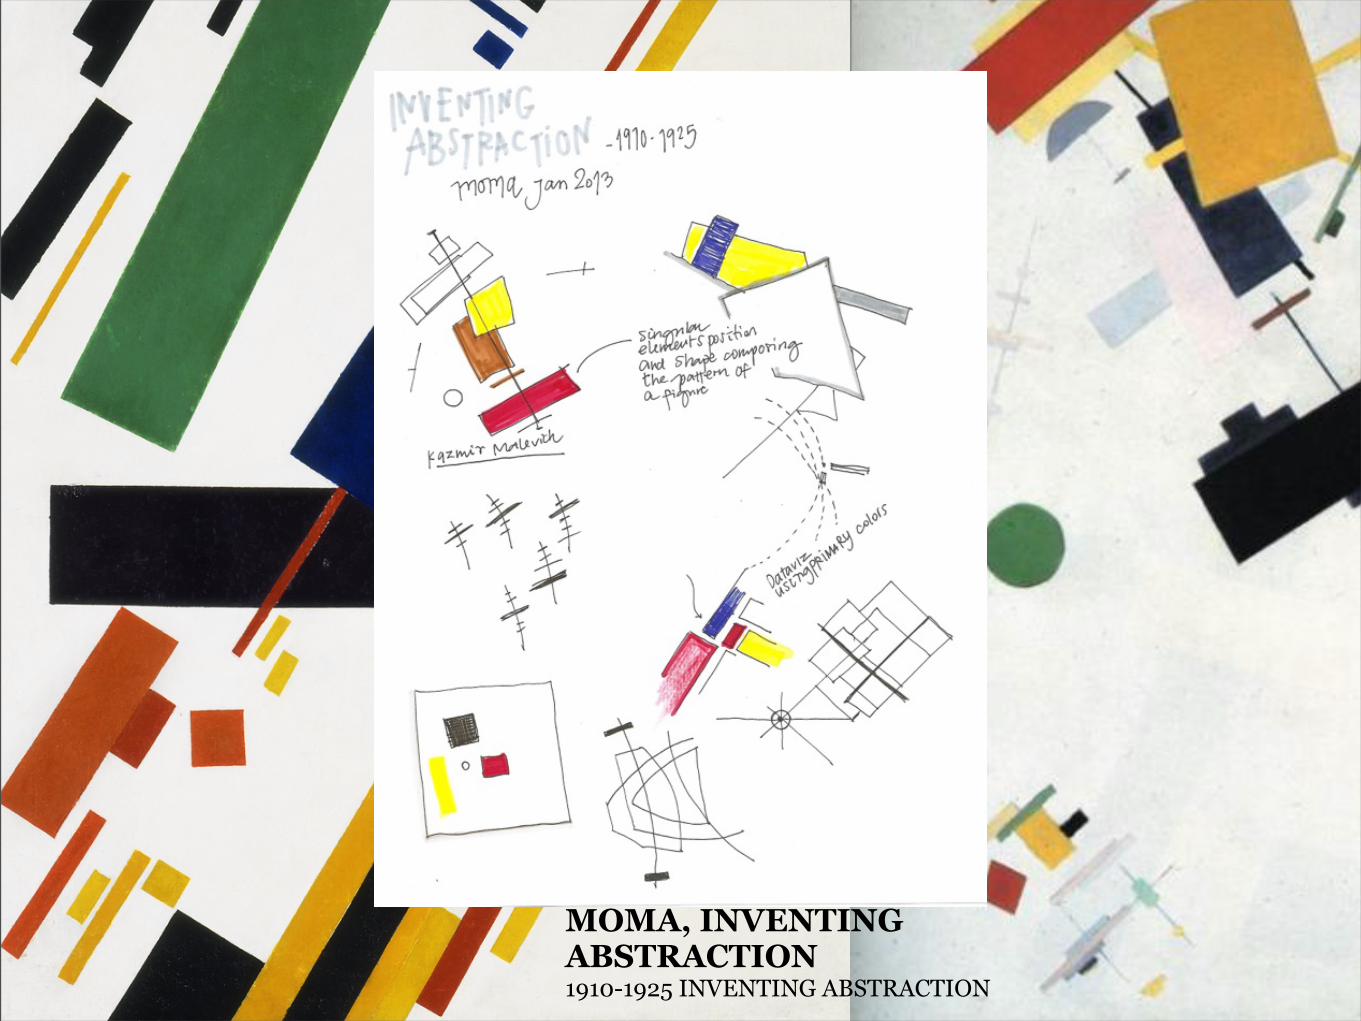
MOMA, INVENTING ABSTRACTION1910-1925 INVENTING ABSTRACTION
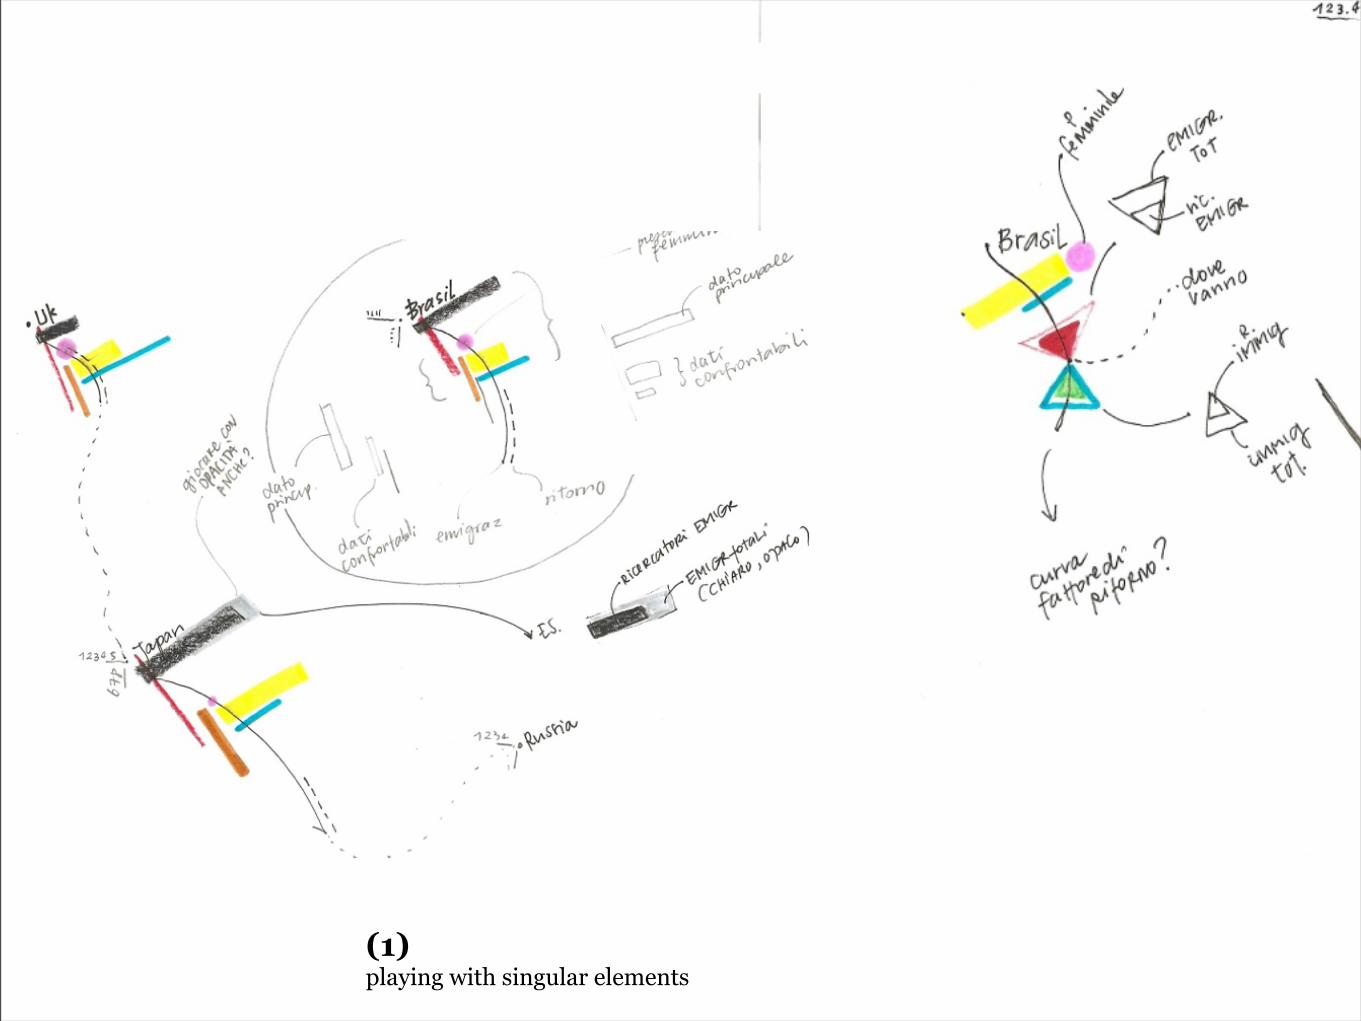
(1)playing with singular elements
123.456 BrasilBras
il
123.456
Brasil Bras
il
Brasil
documenti
disoccupazione disoccupazione
rankingdonne
documentirankingdonne
Brasil
Brasil
Brasil
Brasil
qui ho schiarito
le opacità di tutti
tranne i ricercatori
(storia principale piu chiara) quelli che ritornano
in verde?
(E’ una cosa positiva)
Brasil
*
*
Danimarca
India
Brasile
Italia
Spagna
Olanda
Uk
Canada
Belgio
Francia
Australia
Usa
Germania
Svizzera
Giappone
(-)intermediate steps

Denmark
India
Brazil
Italy
Spain
Netherlands
Great Britain
Canada
Belgium
France
Australia
Usa
Germany
Switzerland
Japan
Sweden
The phenomenon of so-called «brain drain» is explored through a map showing incoming and outgoing flows of researchers in 16 countries. Using a series of parametres, the map is an attempt to discover the motivations that move researchers from one country to another.Each country is visualized through the representation of: GDP per capita, female employment rate, overall unemployment rate, university rankings, percentage of foreign researchers, percentage of overall foreign population, percentage of emigrant researchers, percentage of overall emigrant population, percentage of researchers returning to their country of origin, and the main countries researchers come from and move to.
x axis: % of GDP invested in R&D (1)
y ax
is: n
. of r
esea
rche
rs p
er 1
m p
eopl
e (1
)
female
employment rate % (1)
emigrantresearchers %(2)
foreign researchers % (2)
% emigrants in total population (1)
% foreigners in total population (1)
unemployment
rate (%) (1)
GDP per capita (1)
emigrantresearchers returning to country of origin %(2)
Country
Country
n. researchers
per 1m people (1)
50
100
50
100
>15da 10 a 15
da 5 a 10
<5
5020 10 5
Destination
Origin
University
rankings (3)
How to read itThe countries are positioned according to: % of GDP invested in R&D (x axis)
+ n. of researchers per 1m people (y axis)The analysis is based on the following data sources:
(1) World Bank (2005-2010, worldbank.org)(2) Foreign Born Scientists: Mobility Patterns for Sixteen Countries (2012 paper by
Chiara Franzoni, Giuseppe Scellato and Paula Stephan, nber.org)(3) Times Higher Education World University Rankings (2011-2012
timeshighereducation.co.uk)
4.334
3.946
3.490
2.8172.931
1.690
695
135
3.689
4.258
3.780
3.319
4.683
5.017
5.189
6.390
Ireland3.372
China1.198
Turkey803
Singapore5.833
Norway5.503
Portugal4.307
Luxembourg4.824
Austria4.122
Poland1.597
South Korea4.946
Russia3.091
“braindrain?”
The phenomenon of so-called «brain drain» is explored through a mapshowing incoming and outgoing flows of researchers in 16 countries.Using a series of parametres, the map is an attempt to discoverthe motivations that move researchers from one country to another.their country of origin,and the main countries researchers come from and move to.

latitudeurbanism
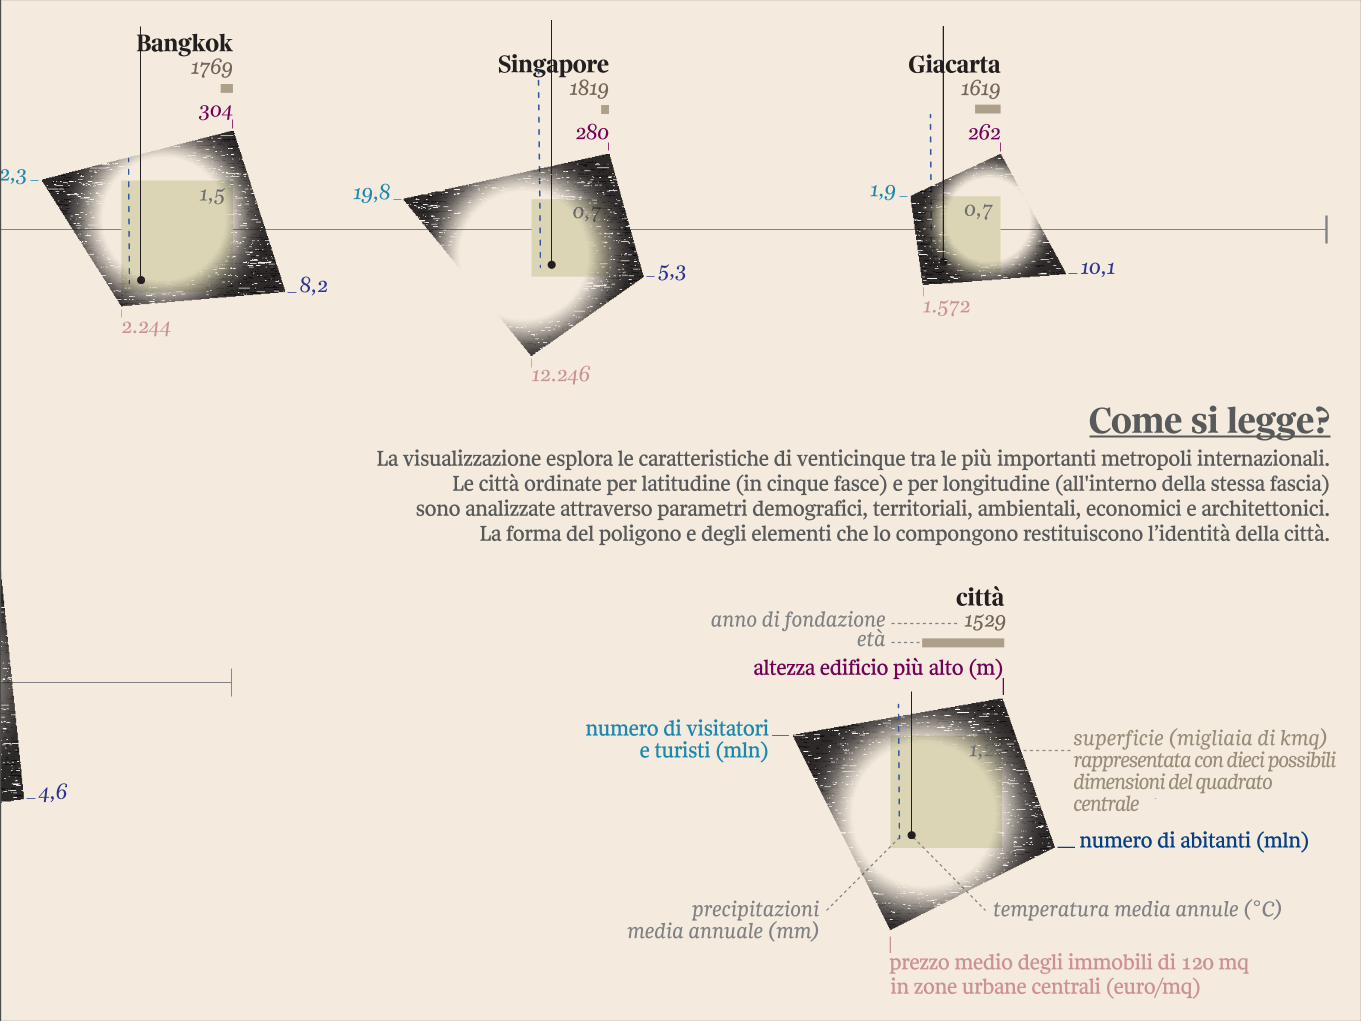
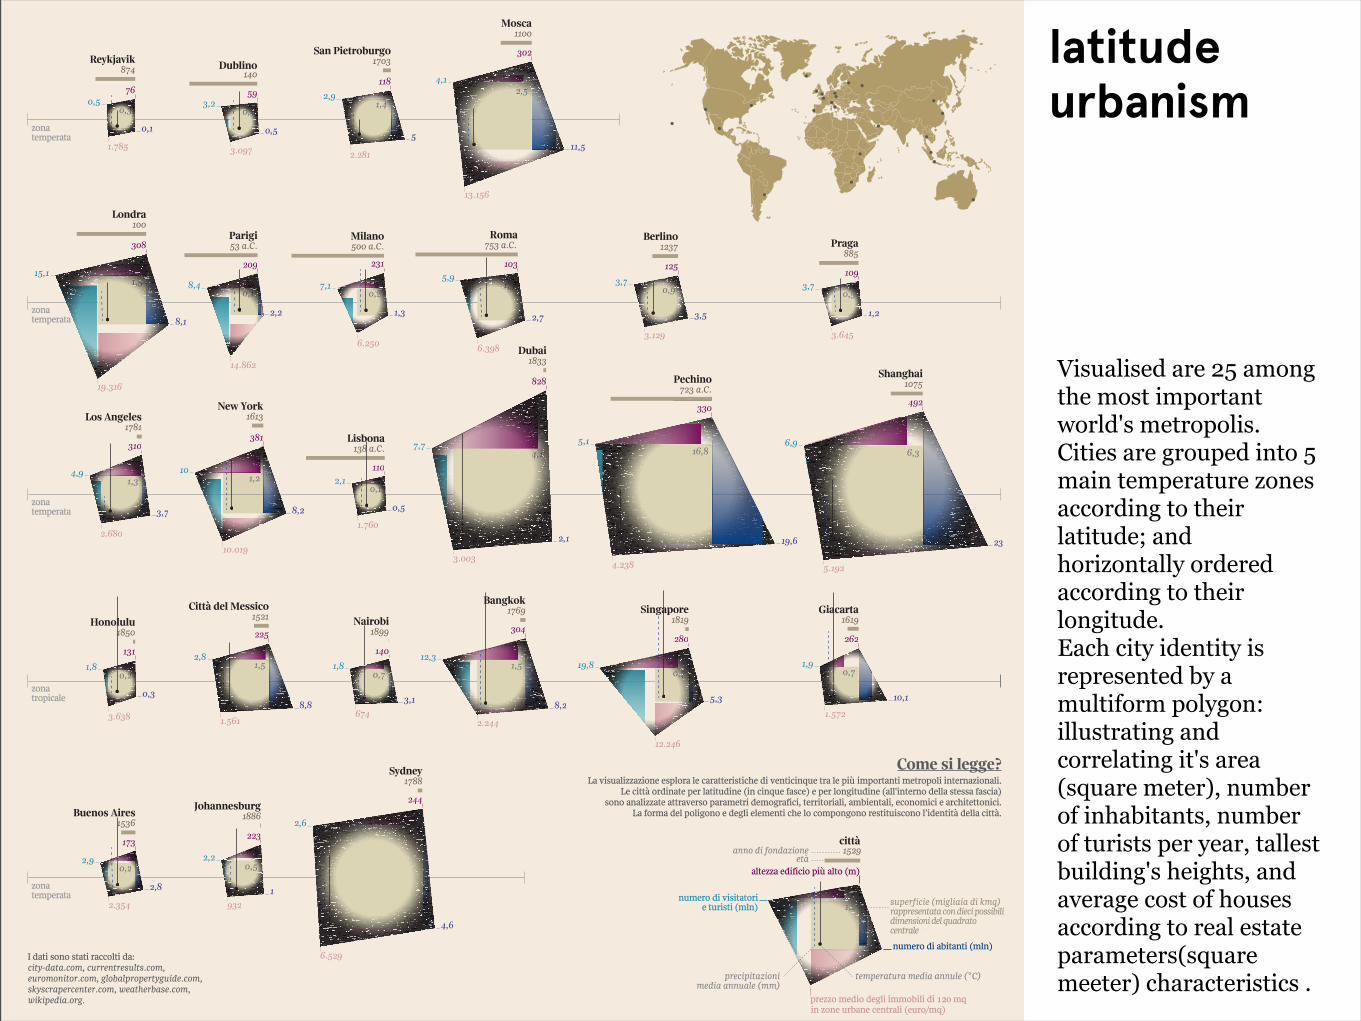
Visualised are 25 among the most important world's metropolis.Cities are grouped into 5 main temperature zones according to their latitude; and horizontally ordered according to their longitude.Each city identity is represented by a multiform polygon: illustrating and correlating it's area (square meter), number of inhabitants, number of turists per year, tallest building's heights, and average cost of houses according to real estate parameters(square meeter) characteristics .
La visualizzazione esplora le caratteristiche di venticinque tra le più importanti metropoli internazionali.Le città ordinate per latitudine (in cinque fasce) e per longitudine (all'interno della stessa fascia)
sono analizzate attraverso parametri demografici, territoriali, ambientali, economici e architettonici.La forma del poligono e degli elementi che lo compongono restituiscono l’identità della città.
Come si legge?
etàaltezza edificio più alto (m)
precipitazionimedia annuale (mm)
temperatura media annule (°C)
anno di fondazione 1529città
superficie (migliaia di kmq) rappresentata con dieci possibilidimensioni del quadratocentrale
zonatemperata
zonatemperata
zonatemperata
zona tropicale
zonatemperata
2,7
6.398
1035,9
1075Shanghai
1619Giacarta
500 a.C.Milano
Pechino
1819Singapore
1100Mosca
11,5
4,1
302
13.156
885Praga
1833Dubai
1769
874Reykjavik
100Londra
1781Los Angeles
1850Honolulu
Buenos Aires1536
53 a.C.Parigi
140Dublino
1613New York
1521Città del Messico
1886Johannesburg
1703San Pietroburgo
5
2,9118
2.281
1237Berlino
Lisbona138 a.C.
1899Nairobi
1788Sydney
244
Bangkok
numero di abitanti (mln)
prezzo medio degli immobili di 120 mq
numero di visitatorie turisti (mln)
753 a.C.Roma
23
5.192
492
6,9
10,1
1,9
1.572
262
1,3
6.250
231
7,1
723 a.C.
19,6
4.238
330
5,1
5,3
19,8
12.246
280
1,2
3,7109
3.645
2,1
3.003
828
7,7
8,2
12,3
2.244
304
76
0,3
1.785
0,1
0,5
8,1
15,1
308
19.316
310
2.680
3,7
4,9
0,3
3.638
131
1,8
2,8
2,9
2.354
173
2,2
8,4
209
14.862
0,5
3,259
3.097
8,2
10.019
381
10
2,8
8,8
1.561
225
1
2,2
932
223
3,5
3,7
125
3.129
0,5
1.760
1102,1
3,1
1,8
674
140
4,6
2,6
6.529
0,11,4
2,5
1,50,1 0,9 0,50,2
1,3
1,3 1,20,1
4,1 16,8 6,3
0,21,5
0,71,5
0,7
1,2
0,7
0,2 0,5
12,1
I dati sono stati raccolti da: city-data.com, currentresults.com, euromonitor.com, globalpropertyguide.com, skyscrapercenter.com, weatherbase.com,wikipedia.org.
in zone urbane centrali (euro/mq)
La visualizzazione esplora le caratteristiche di venticinque tra le più importanti metropoli internazionali.Le città ordinate per latitudine (in cinque fasce) e per longitudine (all'interno della stessa fascia)
sono analizzate attraverso parametri demografici, territoriali, ambientali, economici e architettonici.La forma del poligono e degli elementi che lo compongono restituiscono l’identità della città.
Come si legge?
etàaltezza edificio più alto (m)
precipitazionimedia annuale (mm)
temperatura media annule (°C)
anno di fondazione 1529città
superficie (migliaia di kmq) rappresentata con dieci possibilidimensioni del quadratocentrale
1619Giacarta
1819Singapore1769
1788Sydney
244
Bangkok
numero di abitanti (mln)
prezzo medio degli immobili di 120 mq
numero di visitatorie turisti (mln)
10,1
1,9
1.572
262
5,3
19,8
12.246
280
8,2
12,3
2.244
304
4,6
1,50,7
1,2
0,7
in zone urbane centrali (euro/mq)
latitudeurbanism
Visualised are 25 among the most important world's metropolis.Cities are grouped into 5 main temperature zones according to their latitude; and horizontally ordered according to their longitude.Each city identity is represented by a multiform polygon: illustrating and correlating it's area (square meter), number of inhabitants, number of turists per year, tallest building's heights, and average cost of houses according to real estate parameters(square meeter) characteristics .
La visualizzazione esplora le caratteristiche di venticinque tra le più importanti metropoli internazionali.Le città ordinate per latitudine (in cinque fasce) e per longitudine (all'interno della stessa fascia)
sono analizzate attraverso parametri demografici, territoriali, ambientali, economici e architettonici.La forma del poligono e degli elementi che lo compongono restituiscono l’identità della città.
Come si legge?
etàaltezza edificio più alto (m)
precipitazionimedia annuale (mm)
temperatura media annule (°C)
anno di fondazione 1529città
superficie (migliaia di kmq) rappresentata con dieci possibilidimensioni del quadratocentrale
zonatemperata
zonatemperata
zonatemperata
zona tropicale
zonatemperata
2,7
6.398
1035,9
1075Shanghai
1619Giacarta
500 a.C.Milano
Pechino
1819Singapore
1100Mosca
11,5
4,1
302
13.156
885Praga
1833Dubai
1769
874Reykjavik
100Londra
1781Los Angeles
1850Honolulu
Buenos Aires1536
53 a.C.Parigi
140Dublino
1613New York
1521Città del Messico
1886Johannesburg
1703San Pietroburgo
5
2,9118
2.281
1237Berlino
Lisbona138 a.C.
1899Nairobi
1788Sydney
244
Bangkok
numero di abitanti (mln)
prezzo medio degli immobili di 120 mq
numero di visitatorie turisti (mln)
753 a.C.Roma
23
5.192
492
6,9
10,1
1,9
1.572
262
1,3
6.250
231
7,1
723 a.C.
19,6
4.238
330
5,1
5,3
19,8
12.246
280
1,2
3,7109
3.645
2,1
3.003
828
7,7
8,2
12,3
2.244
304
76
0,3
1.785
0,1
0,5
8,1
15,1
308
19.316
310
2.680
3,7
4,9
0,3
3.638
131
1,8
2,8
2,9
2.354
173
2,2
8,4
209
14.862
0,5
3,259
3.097
8,2
10.019
381
10
2,8
8,8
1.561
225
1
2,2
932
223
3,5
3,7
125
3.129
0,5
1.760
1102,1
3,1
1,8
674
140
4,6
2,6
6.529
0,11,4
2,5
1,50,1 0,9 0,50,2
1,3
1,3 1,20,1
4,1 16,8 6,3
0,21,5
0,71,5
0,7
1,2
0,7
0,2 0,5
12,1
I dati sono stati raccolti da: city-data.com, currentresults.com, euromonitor.com, globalpropertyguide.com, skyscrapercenter.com, weatherbase.com,wikipedia.org.
in zone urbane centrali (euro/mq)
(1)general idea
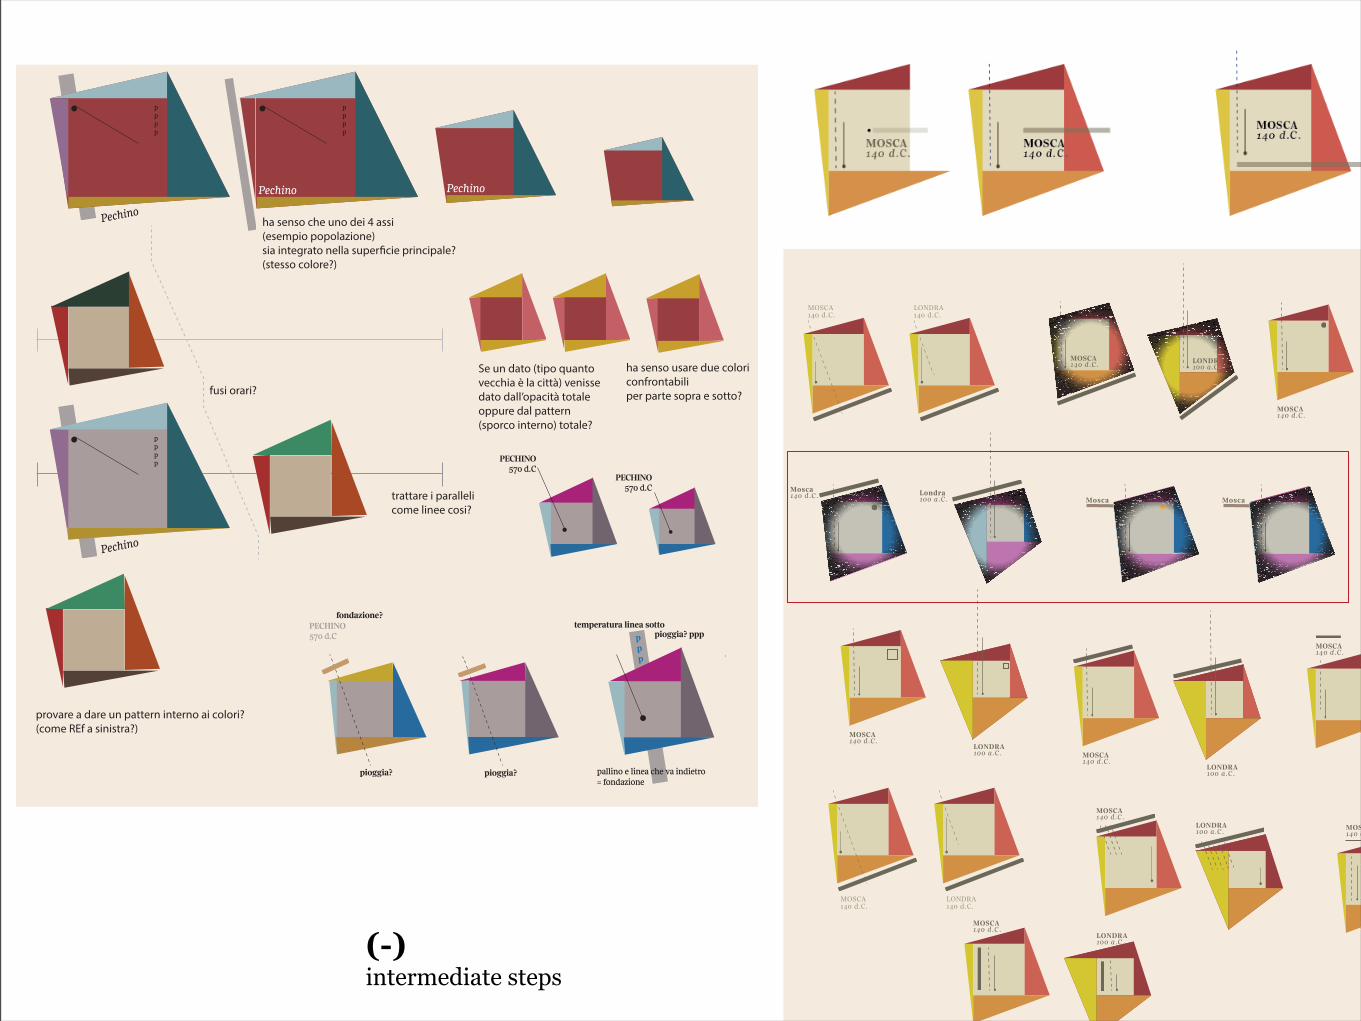
provare a dare un pattern interno ai colori?(come REf a sinistra?)
trattare i paralleli come linee cosi?
fusi orari?
ha senso usare due colori confrontabili per parte sopra e sotto?
Se un dato (tipo quantovecchia è la città) venissedato dall’opacità totaleoppure dal pattern (sporco interno) totale?
ha senso che uno dei 4 assi(esempio popolazione)sia integrato nella super!cie principale?(stesso colore?)
PECHINO570 d.C
PECHINO570 d.C
PECHINO570 d.C
pioggia?
pioggia? ppptemperatura linea sotto
pallino e linea che va indietro = fondazione
ppp
pioggia?
fondazione?
Pechino Pechino
pppp
Pechino
pppp
Pechino
pppp
LONDRA140 d.C.
MOSCA140 d.C.
MOSCA140 d.C. LONDRA
100 a.C.
Londra100 a.C.
MOSCA140 d.C.
LONDRA140 d.C.
MOSCA140 d.C.
MOSCA140 d.C.
Mosca140 d.C.
LONDRA100 a.C. MOSCA
140 d.C.LONDRA100 a.C.
MOSCA140 d.C.
LONDRA100 a.C.
MOSCA140 d.C.
MOSCA140 d.C.
MOSCA140 d.C.
LONDRA100 a.C.
Mosca Mosca
(-)intermediate steps
(1)general idea

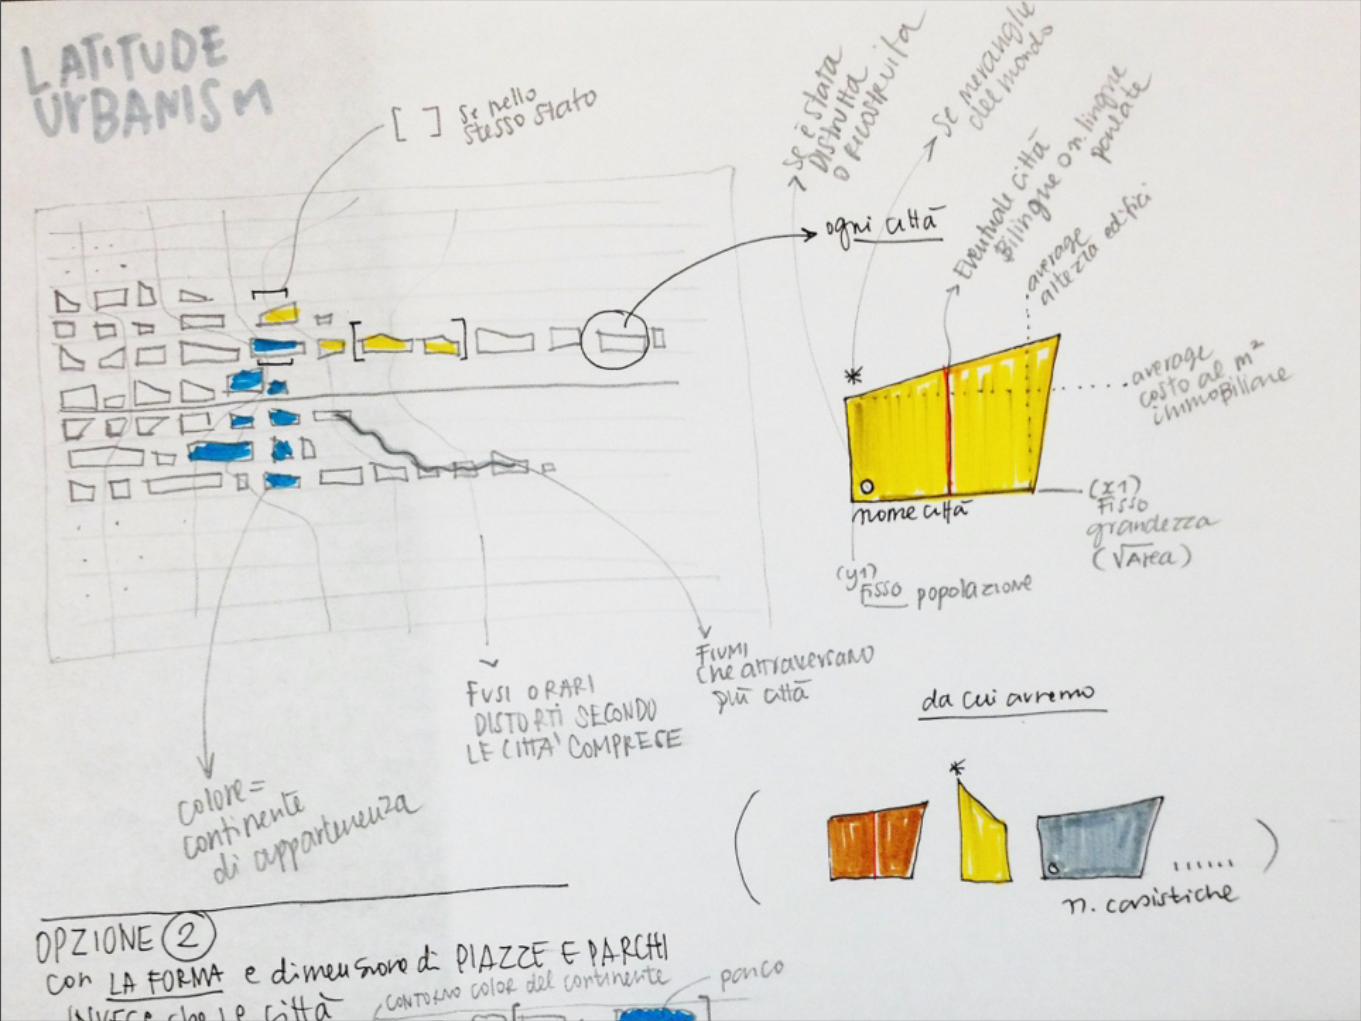
fiding yourown way
My way is:drawing out everything that catches my attention
“The act of reproducing things introduces a level of abstraction that helps focusing on the aspects of the composition that caught my attention. “

fiding yourown way

tw: @giorgialupi
www.giorgialupi.net
(3) INSPIRATION- get ideas from anything, anywhere, anytime
“it is not what you look at that matters, it's what you see”
H.D. Thoreau
www.accurat.it
Related Documents


