q 2001 International Society for Neurochemistry, Journal of Neurochemistry, 78, 339–348 339 Journal of Neurochemistry, 2001, 78, 339–348 Anandamide degradation and N-acylethanolamines level in wild-type and CB 1 cannabinoid receptor knockout mice of different ages Mauro Maccarrone,* Marina Attina `,² ,1 Monica Bari,* Antonella Cartoni,² Catherine Ledent‡ and Alessandro Finazzi-Agro `* Departments of *Experimental Medicine and Biochemical Sciences and ²Chemical Sciences and Technologies, University of Rome ‘Tor Vergata’, Italy ‡IRIBHN, Universite ´ Libre de Bruxelles, Brussels, Belgium Abstract CD1 mice lacking the CB 1 receptors (knockout, KO) were compared with wild-type littermates for their ability to degrade N-arachidonoylethanolamine (anandamide, AEA) through a membrane transporter (AMT) and a fatty acid amide hydro- lase (FAAH). The regional distribution and age-dependence of AMT and FAAH activity were investigated. Anandamide membrane transporter and FAAH increased with age in knockout mice, whereas they showed minor changes in wild-type animals. Remarkably, they were higher in all brain areas of 6-month-old knockout versus wild-type mice, and even higher in 12-month-old animals. The molecular mass (<67 kDa) and isoelectric point (<7.6) of mouse brain FAAH were determined and the FAAH protein content was shown to parallel the enzyme activity. The kinetic constants of AMT and FAAH in the cortex of wild-type and knockout mice at different ages suggested that different amounts of the same proteins were expressed. The cortex and hippocampus of wild-type and knockout mice contained the following N-acylethanola- mines: AEA (8% of total), 2-arachidonoylglycerol (5%), N-oleoylethanolamine (20%), N-palmitoylethanolamine (53%) and N-stearoylethanolamine (14%). These compounds were twice as abundant in the hippocampus as in the cortex. Minor differences were observed in AEA or 2-arachidonoylglycerol content in knockout versus wild-type mice, whereas the other compounds were lower in the hippocampus of knockout versus wild-type animals. Keywords: anandamide hydrolase, anandamide transporter, CB 1 receptor knockout, CD1 mouse, endocannabinoids. J. Neurochem. (2001) 78, 339–348. Endocannabinoids are an emerging class of lipid mediators, isolated from brain and peripheral tissues (Devane et al. 1992; Pop 1999). They are amides and esters of long-chain polyunsaturated fatty acids. N-Arachidonoylethanolamine (anandamide, AEA) and 2-arachidonoylglycerol (2-AG) are the main endogenous agonists of cannabinoid receptors described to date (for reviews, see Pop 1999; Salzet et al. 2000). They bind to both brain (CB 1 ) and peripheral (CB 2 ) cannabinoid receptors, thus mimicking some of the psychotropic and analgesic effects of D 9 -tetrahydrocanna- binol, the psychoactive principle of hashish and marijuana. Moreover, endocannabinoids inhibit gap junction commu- nication in glial cells (Venance et al. 1995), regulate sleep induction (Boger et al. 1998), interact with GABAergic (Tsou et al. 1998), serotonergic (Cheer et al. 1999) and dopaminergic (Beltramo et al. 2000) neurotransmission, and are also formed during glutamate-induced neurotoxicity (Hansen et al. 1999). The activity of AEA at CB receptors depends on its life-span in the extracellular space, which is regulated by AEA degradation. This normally occurs in a Received March 12, 2001; revised manuscript received April 19, 2001; accepted April 20, 2001. Address correspondence and reprint requests to Alessandro Finazzi- Agro ` or Mauro Maccarrone, Department of Experimental Medicine and Biochemical Sciences, University of Rome ‘Tor Vergata’, Via di Tor Vergata 135, I-00133 Rome, Italy. E-mail: [email protected] or [email protected] 1 Deceased October 26, 2000. Abbreviations used: AEA, N-arachidonoylethanolamine (ananda- mide); 2-AG, 2-arachidonoylglycerol; AMT, AEA membrane transpor- ter; AM404, N-(4-hydroxyphenyl)-arachidonoylamide; FAAH, fatty acid amide hydrolase; GC/MS, gas chromatography-mass spectrometry; NAE, N-acylethanolamines; OEA, N-oleoylethanolamine; PBS, phosphate- buffered saline; PEA, N-palmitoylethanolamine; pI, isoelectric point; SDS2PAGE, sodium dodecyl sulfate polyacrylamide gel electrophoresis; SEA, N-stearoylethanolamine; SIN-1, 3-morpholinosydnonimine; SNAP, S-nitroso-N-acetylpenicillamine; SNP, sodium nitroprusside.

Welcome message from author
This document is posted to help you gain knowledge. Please leave a comment to let me know what you think about it! Share it to your friends and learn new things together.
Transcript

q 2001 International Society for Neurochemistry, Journal of Neurochemistry, 78, 339±348 339
Journal of Neurochemistry, 2001, 78, 339±348
Anandamide degradation and N-acylethanolamines level in
wild-type and CB1 cannabinoid receptor knockout mice of
different ages
Mauro Maccarrone,* Marina AttinaÁ,²,1 Monica Bari,* Antonella Cartoni,² Catherine Ledent³ andAlessandro Finazzi-AgroÁ*
Departments of *Experimental Medicine and Biochemical Sciences and ²Chemical Sciences and Technologies, University of Rome
`Tor Vergata', Italy
³IRIBHN, Universite Libre de Bruxelles, Brussels, Belgium
Abstract
CD1 mice lacking the CB1 receptors (knockout, KO) were
compared with wild-type littermates for their ability to degrade
N-arachidonoylethanolamine (anandamide, AEA) through a
membrane transporter (AMT) and a fatty acid amide hydro-
lase (FAAH). The regional distribution and age-dependence of
AMT and FAAH activity were investigated. Anandamide
membrane transporter and FAAH increased with age in
knockout mice, whereas they showed minor changes in
wild-type animals. Remarkably, they were higher in all brain
areas of 6-month-old knockout versus wild-type mice, and
even higher in 12-month-old animals. The molecular mass
(<67 kDa) and isoelectric point (<7.6) of mouse brain FAAH
were determined and the FAAH protein content was shown to
parallel the enzyme activity. The kinetic constants of AMT and
FAAH in the cortex of wild-type and knockout mice at different
ages suggested that different amounts of the same proteins
were expressed. The cortex and hippocampus of wild-type
and knockout mice contained the following N-acylethanola-
mines: AEA (8% of total), 2-arachidonoylglycerol (5%),
N-oleoylethanolamine (20%), N-palmitoylethanolamine (53%)
and N-stearoylethanolamine (14%). These compounds were
twice as abundant in the hippocampus as in the cortex. Minor
differences were observed in AEA or 2-arachidonoylglycerol
content in knockout versus wild-type mice, whereas the other
compounds were lower in the hippocampus of knockout
versus wild-type animals.
Keywords: anandamide hydrolase, anandamide transporter,
CB1 receptor knockout, CD1 mouse, endocannabinoids.
J. Neurochem. (2001) 78, 339±348.
Endocannabinoids are an emerging class of lipid mediators,
isolated from brain and peripheral tissues (Devane et al.
1992; Pop 1999). They are amides and esters of long-chain
polyunsaturated fatty acids. N-Arachidonoylethanolamine
(anandamide, AEA) and 2-arachidonoylglycerol (2-AG) are
the main endogenous agonists of cannabinoid receptors
described to date (for reviews, see Pop 1999; Salzet et al.
2000). They bind to both brain (CB1) and peripheral (CB2)
cannabinoid receptors, thus mimicking some of the
psychotropic and analgesic effects of D9-tetrahydrocanna-
binol, the psychoactive principle of hashish and marijuana.
Moreover, endocannabinoids inhibit gap junction commu-
nication in glial cells (Venance et al. 1995), regulate sleep
induction (Boger et al. 1998), interact with GABAergic
(Tsou et al. 1998), serotonergic (Cheer et al. 1999) and
dopaminergic (Beltramo et al. 2000) neurotransmission, and
are also formed during glutamate-induced neurotoxicity
(Hansen et al. 1999). The activity of AEA at CB receptors
depends on its life-span in the extracellular space, which is
regulated by AEA degradation. This normally occurs in a
Received March 12, 2001; revised manuscript received April 19, 2001;
accepted April 20, 2001.
Address correspondence and reprint requests to Alessandro Finazzi-
AgroÁ or Mauro Maccarrone, Department of Experimental Medicine and
Biochemical Sciences, University of Rome `Tor Vergata', Via di Tor
Vergata 135, I-00133 Rome, Italy. E-mail: [email protected] or
[email protected] October 26, 2000.
Abbreviations used: AEA, N-arachidonoylethanolamine (ananda-
mide); 2-AG, 2-arachidonoylglycerol; AMT, AEA membrane transpor-
ter; AM404, N-(4-hydroxyphenyl)-arachidonoylamide; FAAH, fatty
acid amide hydrolase; GC/MS, gas chromatography-mass spectrometry;
NAE, N-acylethanolamines; OEA, N-oleoylethanolamine; PBS, phosphate-
buffered saline; PEA, N-palmitoylethanolamine; pI, isoelectric point;
SDS2PAGE, sodium dodecyl sulfate polyacrylamide gel electrophoresis;
SEA, N-stearoylethanolamine; SIN-1, 3-morpholinosydnonimine;
SNAP, S-nitroso-N-acetylpenicillamine; SNP, sodium nitroprusside.

two-step process, including: (i) cellular uptake by the AEA
membrane transporter (AMT; Maccarrone et al. 2000a), and
(ii) intracellular degradation by the enzyme anandamide
hydrolase (fatty acid amide hydrolase, FAAH; Maccarrone
et al. 2000d). Recently, a functional link has been
demonstrated in vitro between CB1 receptors and AMT,
suggesting that activation of the receptors triggers AEA
degradation by enhancing AMT activity (Maccarrone et al.
2000a). Mutant mice lacking the CB1 receptor gene
represent a powerful tool to investigate the role of a putative
CB12AMT coupling in vivo, and to ®nd out whether the
CB1-dependent regulation of AEA degradation might be
compensated when the CB1 gene is deleted. Here, we
studied the regional distribution of AMT and FAAH in
different brain areas of CB1 knockout (KO) and wild-type
mice (Ledent et al. 1999). We also measured the levels of
AEA and 2-AG, as well as of the other N-acylethanolamines
[N-oleoylethanolamine (OEA), N-palmitoylethanolamine
(PEA) and N-stearoylethanolamine (SEA)], and looked for
a possible age dependence of endocannabinoid degradation
by wild-type and CB1 knockout animals.
Materials and methods
Materials and animals
All chemicals were of the purest analytical grade. Anandamide,
oleic, palmitic and stearic acids, ethanolamine and sodium
nitroprusside (SNP) were from Sigma Chemical Co. (St. Louis,
MO, USA). The N-acylethanolamines (NAE) of oleic (OEA),
palmitic (PEA) and stearic (SEA) acids were synthesized by
reacting the corresponding fatty acyl chloride with ethanolamine,
as described previously (Van der Stelt et al. 1997). [3H]AEA
(223 Ci/mmol) was purchased from NEN Dupont de Nemours
(KoÈln, Germany). Deuterated anandamide (AEAd4) was synthe-
sized from d4-ethanolamine (isotopic purity � 98%; Isotec Inc.,
Miamisburg, OH, USA) according to Schmid et al. (1995). The
unlabelled/labelled ratio of AEAd4 was � 0.02. 2-Arachidonoyl-
glycerol (2-AG), S-nitroso-N-acetylpenicillamine (SNAP) and
N-(4-hydroxyphenyl)-arachidonoylamide (AM404) were from
Research Biochemicals International (Natick, MA, USA).
3-Morpholinosydnonimine (SIN-1) was from Alexis Corporation
(LaÈufel®ngen, Switzerland). Linvanil (a-linolenoyl-vanillyl-amide)
was a kind gift of Dr V. Di Marzo (Consiglio Nazionale delle
Ricerche, Arco Felice, Italy). The identity and chemical purity of
NAEs and 2-AG standards were determined by 1H NMR and mass
spectrometric analysis under electron impact mode (Maccarrone
et al. 2001). Anti-FAAH polyclonal antibodies were elicited in
rabbits against the conserved FAAH sequence VGYYETDNY
TMPSPAMR (Giang and Cravatt 1997), conjugated to ovalbumin,
and were prepared by Primm S.r.l. (Milan, Italy). Goat anti-rabbit
alkaline phosphatase conjugates were purchased from Bio-Rad
(Richmond, CA, USA). Non-immune rabbit serum was from
Nordic Immunology (Tilburg, The Netherlands).
The generation of CD1 mice lacking the cannabinoid CB1
receptors (knockout mutants) was described earlier (Ledent et al.
1999). In order to homogenize the genetic background of the mice,
®rst-generation heterozygotes (CB1 1/2) were bred for ®ve
generations on a CD1 background, with selection for the mutant
CB1 gene at each generation. Fifth-generation heterozygotes were
bred together, to generate the homozygous mice, either wild-type
(CB11/1, WT) or knockout (CB12/±, KO), used in this study.
Mice were maintained for the indicated periods under standard
animal housing conditions in a 12 h dark/light cycle with free
access to food and water. Equal numbers of male and female
animals were tested in all biochemical analysis and the data were
pooled, because there were no statistically signi®cant differences in
the results obtained with males and females. Animal care was in
accordance with ethical guidelines (Directive 86/609/EEC; Council
of Europe November 24, 1986) and all experimental procedures
were approved by the local animal care committees.
Determination of anandamide uptake
Synaptosomes were prepared from the different areas of mouse
brain as described (Barbaccia et al. 1983). Tissues were
resuspended in ice-cold 0.32 m sucrose, 5 mm Tris2HCl buffer
(pH 7.4) and were gently disrupted by 10 up-and-down strokes in a
Te¯on-glass homogenizer (1 : 20 w/v). The homogenates were
centrifuged at 1000 g for 5 min, at 48C, the supernatants were then
centrifuged again at 17 000 g for 15 min, at 48C. The ®nal pellets
were resuspended in 136 mm NaCl, 5 mm KCl, 0.16 mm CaCl2,
0.1 mm EGTA, 1.3 mm MgCl2, 10 mm glucose, 10 mm Tris2HCl
buffer (pH 7.4), at a protein concentration of 3 mg/mL. The
activity of the AEA membrane transporter (AMT) was measured as
described (Maccarrone et al. 2000a). Synaptosomes (100 mL/test)
were incubated for different time intervals, at 378C or 48C, with
300 nm [3H]AEA, they were washed three times in 2 mL
phosphate-buffered saline (PBS) containing 1% bovine serum
albumin and were ®nally resuspended in 200 mL PBS. Membrane
lipids were then extracted (Maccarrone et al. 2000a), resuspended
in 0.5 mL methanol, mixed with 3.5 mL Sigma-Fluor liquid
scintillation cocktail for non-aqueous samples (Sigma), and radio-
activity was measured in a LKB1214 Rackbeta scintillation counter
(Amersham Pharmacia Biotech, Uppsala, Sweden). To discriminate
non-carrier-mediated from carrier-mediated transport of AEA
through cell membranes, [3H]AEA uptake at 48C was subtracted
from that at 378C (Hillard et al. 1997). Incubations (15 min) were
also carried out with different concentrations of [3H]AEA, in the
range 0±1000 nm, in order to determine apparent Km and Vmax
values of the uptake (also in this case, the uptake at 48C was
subtracted from that at 378C). The experimental points were
analysed by non-linear regression with a prism 3 program
(GraphPAD Software for Science, San Diego, CA, USA).
Anandamide membrane transporter activity was expressed as
pmol of AEA taken up per min per mg protein. The Q10 value
was calculated as the ratio of AEA uptake at 30 and 208C
(Hillard et al. 1997). The effect of various compounds on AMT
activity was determined by adding directly each substance to the
assay buffer, at the indicated concentrations, and incubating for
15 min at 378C.
Anandamide hydrolase assay
Anandamide hydrolase (arachidonoylethanolamide amidohydro-
lase, EC 3.5.1.4) activity was assayed in mouse brain homogenates
by RP-HPLC, incubating the samples for 15 min with 5 mm
[3H]AEA (Maccarrone et al. 1998). Anandamide hydrolase activity
340 M. Maccarrone et al.
q 2001 International Society for Neurochemistry, Journal of Neurochemistry, 78, 339±348

was expressed as pmol of arachidonate released per min per mg
protein. Kinetic studies were performed using different concentra-
tions of [3H]AEA (in the range 0±15 mm), and the kinetic constants
(Km, Vmax) were calculated by ®tting the experimental points to a
non-linear regression plot, as described above for [3H]AEA uptake.
For immunochemical analysis, sodium dodecyl sulfate±poly-
acrylamide gel electrophoresis (SDS2PAGE; 12%) was performed
under reducing conditions in a Mini Protean II apparatus (Bio-Rad),
with 0.75 mm spacer arms (Maccarrone et al. 1998). Rainbow
molecular mass markers (Amersham Pharmacia Biotech) were
phosphorylase b (97.4 kDa), bovine serum albumin (66.0 kDa) and
ovalbumin (46.0 kDa). Native IEF was performed in the Mini
Protean II apparatus, using a 5% polyacrylamide gel containing
ampholytes in the pH range 5.0±9.0 (Sigma), as described
(Robertson et al. 1987). IEF was calibrated by running the
following isoelectric point (pI) markers (Sigma): lentil (Lens
culinaris) lectin (8.8, 8.6 and 8.2), myoglobin from horse heart (7.2
and 6.8), carbonic anhydrase I from human erythrocytes (6.6) and
carbonic anhydrase II from bovine erythrocytes (5.9). Mouse brain
homogenates (20 mg/lane) were subjected to either SDS2PAGE or
IEF, slab gels were then electroblotted onto 0.45 mm nitrocellulose
®lters (Bio-Rad), using a Mini Trans Blot apparatus (Bio-Rad) as
reported (Maccarrone et al. 1998). Immunodetection of FAAH on
nitrocellulose ®lters was performed with anti-FAAH polyclonal
antibodies (diluted 1 : 200), which have previously been shown to
speci®cally recognize FAAH in human brain (Maccarrone et al.
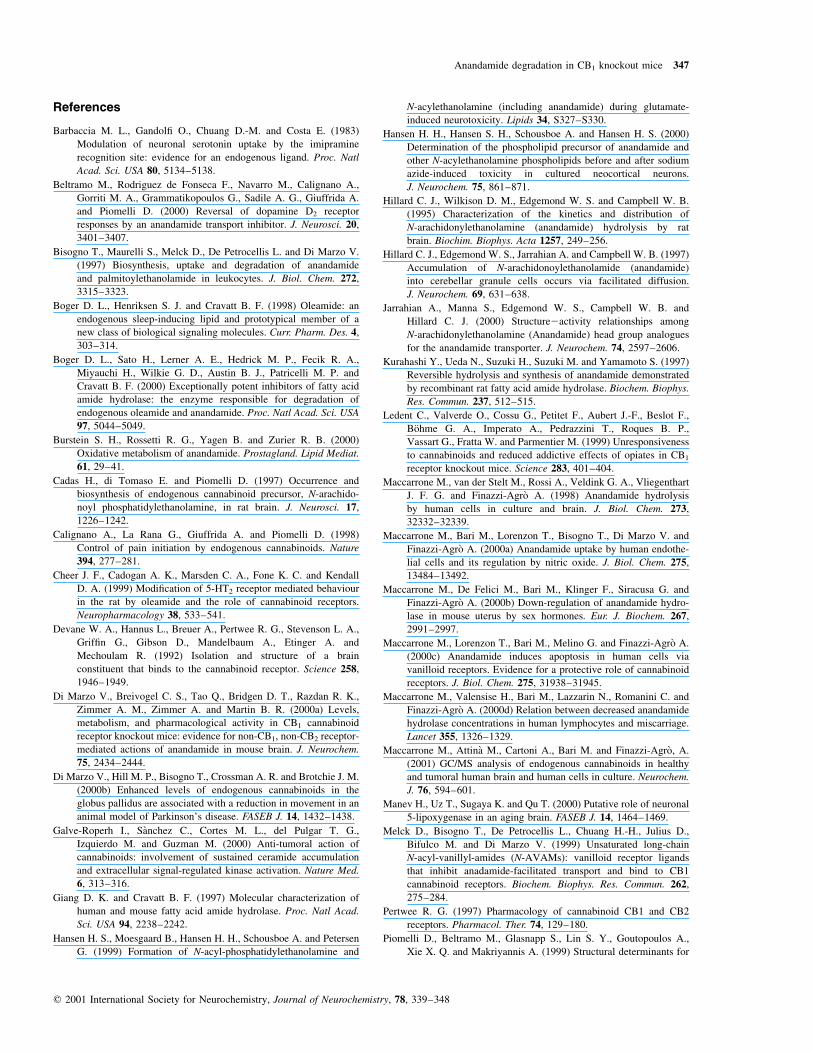
Fig. 1 Anandamide hydrolysis and uptake
in wild-type and CB1 receptor knockout
(KO) mice of different ages. Anandamide
hydrolase (FAAH) activity (a) and protein
content (b), and anandamide membrane
transporter (AMT) activity (c) were mea-
sured in different mouse brain areas. Anan-
damide hydrolase activity and AMT activity
were measured using 5 mM and 300 nM
[3H]AEA, respectively, with 15 min incuba-
tions. In (b), 100% � 0.250 ^ 0.030 absor-
bance units at 405 nm. Vertical bars
represent SD values. *p , 0.05 versus
corresponding WT; **p , 0.01 versus cor-
responding WT (n � 4 in all cases).
Anandamide degradation in CB1 knockout mice 341
q 2001 International Society for Neurochemistry, Journal of Neurochemistry, 78, 339±348

1998), human lymphocytes (Maccarrone et al. 2000d) and mouse
uterus (Maccarrone et al. 2000b). Goat anti-rabbit alkaline
phosphatase conjugates (diluted 1 : 2000) were used as the second
antibody. Immunoreactive bands were stained with the alkaline
phosphatase staining solution according to the manufacturer's
instructions (Bio-Rad). ELISA was performed by coating the plate
with mouse brain homogenates (20 mg/well), reacted with anti-
FAAH polyclonal antibodies (diluted 1 : 300) and then with goat
anti-rabbit alkaline phosphatase conjugate (diluted 1 : 2000).
Colour development of the alkaline phosphatase reaction was
measured at 405 nm, using p-nitrophenylphosphate as substrate.
Controls were carried out by using non-immune rabbit serum and
included wells coated with different amounts of bovine serum
albumin.
GC/MS analysis
Immediately after decapitation, mouse brains were washed in PBS,
pre-cooled at 48C, dissected, frozen in liquid nitrogen, and kept at
2708C until processed. A maximum of 8 min elapsed between
mouse decapitation and freezing of dissected tissues, a time not
suf®cient to cause arti®cial increases in endocannabinoid levels (Di
Marzo et al. 2000a; Maccarrone et al. 2001). Lipids were extracted
from frozen tissues and analysed by gas chromatography-electron
impact mass spectrometry (GC/MS), as described (Maccarrone
et al. 2001). Lipid extracts were injected into a Carlo Erba model
HRGC5160 gas chromatograph (Rome, Italy), equipped with a BP5
silica capillary column (30 m � 0.25 mm i.d.) from SGE (Milan,
Italy), and interfaced with a VG Micromass model QUATTRO
spectrometer (Manchester, UK). Analyses were performed in
`splitless' mode at temperatures increasing from 70 to 2508C, at a
rate of 308C/min. The identity of NAEs was assessed by
comparison of the retention times and the mass spectra recorded
at 70 eV with those of authentic standards. A full scan spectrum of
NAEs and 2-AG in brain samples, and electron impact mass spectra
of these compounds and the corresponding standards, have been
recently reported (Maccarrone et al. 2001). Quanti®cation of AEA
was achieved by isotope dilution with AEAd4, whereas the other
NAEs and 2-AG were quanti®ed by the internal standard method
with AEAd4. Calibration solutions were prepared by adding a ®xed
amount of AEAd4 (5 nmol) to samples containing various amounts
of NAEs (up to 80 nmol) or 2-AG (up to 40 nmol), all analysed in
the selected ion monitoring (SIM) mode. Calibration curves were
obtained by plotting the area ratios of each characteristic selected
ion (m/z � 85, 98 for AEA; 85, 98, 154 for NAEs; 79, 91, 105 for
2-AG) to the fragment of the internal standard AEAd4 (m/z � 89 or
102), as a function of the nmol amount of AEA, of the other NAEs
or of 2-AG (Maccarrone et al. 2001). The quantitative data for each
compound were calculated after correction for the recovery of all
NAEs and 2-AG from the extraction procedure, which was < 60%
in all cases. Moreover, for each sample all characteristic selected
ions of each compound were monitored simultaneously, and each
injection of samples into GC was followed by injection of pure
solvent, in order to avoid signal disturbance by the background
noise. The detection limit, calculated with standard solutions of
NAEs or of 2-AG, was 20 ^ 10 pmoles (Maccarrone et al. 2001).
Statistical analysis
The data reported here are the mean (^ SD) of at least
four independent determinations, each performed in duplicate.
Statistical analysis was performed by the non-parametric Mann±
Whitney test, elaborating experimental data by means of the Instat
program (GraphPad Software Inc., San Diego, CA, USA).
Results
Anandamide degradation in CB11/1 and CB1±/± mice
of different ages
Anandamide hydrolase activity was measured in different
areas of mouse brain, and was found in the order
hippocampus, cerebellum, cortex, striatum (Fig. 1a). The
same regional distribution of FAAH activity was observed
in CB1 wild-type and in CB1 knockout animals at all ages
tested (2, 6 or 12 months). Such a distribution is in keeping
with previous reports on rat brain FAAH (Hillard et al.
1995) and correlates with the distribution of cannabinoid
receptor binding sites (Hillard et al. 1995; Tsou et al. 1998).
In wild-type mice, FAAH activity was not age dependent,
whereas it increased signi®cantly with ageing in knockout
animals (Fig. 1a). In this latter group, hippocampus showed
the most remarkable increase in FAAH activity compared
with wild-type mice of the same age, followed by cortex,
cerebellum and striatum (Fig. 1a). The increase of FAAH
activity in knockout versus wild-type mice reached
statistical signi®cance in 6-month-old animals and was
even higher at 12 months (Fig. 1a).
Western blotting showed that anti-FAAH polyclonal
antibodies speci®cally recognized a single immunoreactive
band in homogenates of whole mouse brain, corresponding
to a molecular mass of < 67 kDa and an pI of < 7.6 (Fig. 2).
These molecular properties of mouse brain FAAH, reported
here for the ®rst time, resemble those of FAAH in human
brain (Maccarrone et al. 1998). The anti-FAAH antibodies
were used to quantify FAAH protein content in the different
Fig. 2 Electrophoretic properties of mouse brain FAAH. Mouse
brain extracts (20 mg/lane) were subjected to either SDS2PAGE
(left) or IEF (right). Slab gels were then electroblotted on nitrocellu-
lose ®lters and FAAH was detected with speci®c anti-FAAH polyclo-
nal antibodies. Molecular mass markers and pI markers are shown.
342 M. Maccarrone et al.
q 2001 International Society for Neurochemistry, Journal of Neurochemistry, 78, 339±348

areas of mouse brain by ELISA (Fig. 1b). Anandamide
hydrolase protein was shown to follow the same regional
distribution as the enzyme activity (compare Fig. 1a and b),
suggesting that the same FAAH was differently expressed in
the different brain areas.
In pilot experiments, synaptosomes prepared from the
cortex of wild-type, 2-month-old mice were found to take up
[3H]AEA in a dose-, temperature- (Q10 < 1.5) and time- (t1/2
< 5 min) dependent manner (Fig. 3a, b and data not shown),
suggesting that an AMT was responsible for [3H]AEA
uptake (Bisogno et al. 1997; Hillard et al. 1997; Maccarrone
et al. 1998, 2000a; Jarrahian et al. 2000). The uptake of
300 nm [3H]AEA by AMT was inhibited by 10 mm AM404
or 10 mm linvanil (Fig. 3c), previously shown to selectively
inhibit AEA uptake by cultured cells (Piomelli et al. 1999;
Melck et al. 1999). Conversely, nitric oxide donors SNP and
SNAP, and even more peroxynitrite donor SIN-1, activated
AMT in cortex synaptosomes (Fig. 3c). Sodium nitroprus-
side, SNAP and SIN-1 were used at 5, 2.5 and 1 mm,
respectively, concentrations shown previously to activate
AMT in human cells in culture (Maccarrone et al. 2000a). In
contrast, 1 mm 2-AG inhibited almost completely the uptake
of 300 nm [3H]AEA by AMT in cortex synaptosomes
(Fig. 3c), again extending previous observations on cultured
cells (Maccarrone et al. 2000a). To our knowledge, this is
the ®rst report showing AMT activity ex vivo, i.e. in syn-
aptosomes prepared from brain areas. The same methodol-
ogy was used to investigate the regional distribution of AMT
Fig. 3 Anandamide membrane transporter
(AMT) in the brain cortex of wild-type,
2-month-old mice. Dependence of AMT
activity on anandamide (AEA) concentration
(a) and temperature (b). (c) Effect of differ-
ent compounds on the activity of AMT at
378C. *p , 0.01 versus controls; **p , 0.05
versus controls (n � 4). In (b) and (c),
300 nM [3H]AEA was used as substrate. In
all experiments synaptosomes were incu-
bated with [3H]AEA for 15 min.
Anandamide degradation in CB1 knockout mice 343
q 2001 International Society for Neurochemistry, Journal of Neurochemistry, 78, 339±348
activity, which was found to follow the order striatum .
hippocampus . cortex � cerebellum (Fig. 1c). In wild-type
animals, AMT activity decreased (striatum and hippocam-
pus) or remained unchanged (cortex and cerebellum) with
ageing, whereas in knockout mice it increased remarkably at
older ages (Fig. 1c). The molecular properties of AMT are
unknown and there are no anti-AMT antibodies available.
Therefore, it was not possible to quantify AMT protein in
mouse brain areas. However, from saturation curves such as
that shown in Fig. 3(a), it was possible to calculate the
kinetic parameters, i.e. apparent Michaelis2Menten constant
(Km) and maximum velocity (Vmax), of AMT in the cortex of
wild-type and knockout mice of different ages (Table 1).
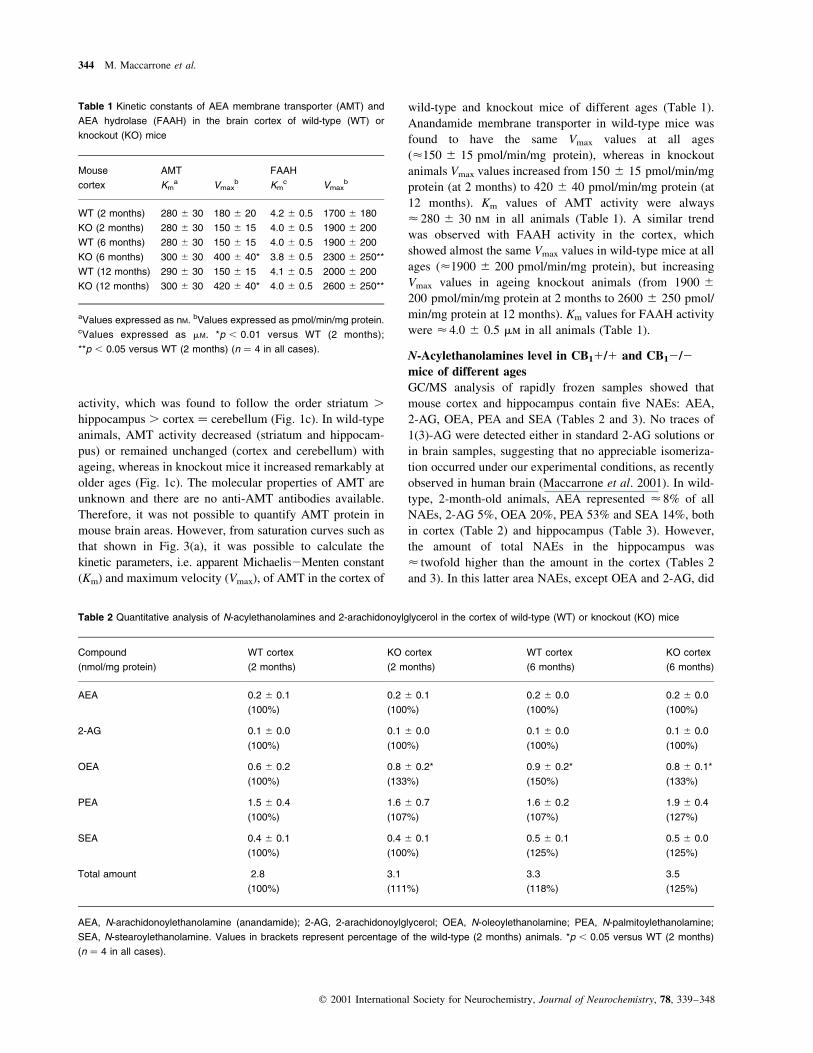
Anandamide membrane transporter in wild-type mice was
found to have the same Vmax values at all ages
(<150 ^ 15 pmol/min/mg protein), whereas in knockout
animals Vmax values increased from 150 ^ 15 pmol/min/mg
protein (at 2 months) to 420 ^ 40 pmol/min/mg protein (at
12 months). Km values of AMT activity were always
< 280 ^ 30 nm in all animals (Table 1). A similar trend
was observed with FAAH activity in the cortex, which
showed almost the same Vmax values in wild-type mice at all
ages (<1900 ^ 200 pmol/min/mg protein), but increasing
Vmax values in ageing knockout animals (from 1900 ^
200 pmol/min/mg protein at 2 months to 2600 ^ 250 pmol/
min/mg protein at 12 months). Km values for FAAH activity
were < 4.0 ^ 0.5 mm in all animals (Table 1).
N-Acylethanolamines level in CB11/1 and CB12/2
mice of different ages
GC/MS analysis of rapidly frozen samples showed that
mouse cortex and hippocampus contain ®ve NAEs: AEA,
2-AG, OEA, PEA and SEA (Tables 2 and 3). No traces of
1(3)-AG were detected either in standard 2-AG solutions or
in brain samples, suggesting that no appreciable isomeriza-
tion occurred under our experimental conditions, as recently
observed in human brain (Maccarrone et al. 2001). In wild-
type, 2-month-old animals, AEA represented < 8% of all
NAEs, 2-AG 5%, OEA 20%, PEA 53% and SEA 14%, both
in cortex (Table 2) and hippocampus (Table 3). However,
the amount of total NAEs in the hippocampus was
< twofold higher than the amount in the cortex (Tables 2
and 3). In this latter area NAEs, except OEA and 2-AG, did
Table 1 Kinetic constants of AEA membrane transporter (AMT) and
AEA hydrolase (FAAH) in the brain cortex of wild-type (WT) or
knockout (KO) mice
Mouse
cortex
AMT
Kma Vmax
b
FAAH
Kmc Vmax
b
WT (2 months) 280 �̂ 30 180 �̂ 20 4.2 �^ 0.5 1700 �̂ 180
KO (2 months) 280 �^ 30 150 �̂ 15 4.0 �^ 0.5 1900 �̂ 200
WT (6 months) 280 �̂ 30 150 �̂ 15 4.0 �^ 0.5 1900 �̂ 200
KO (6 months) 300 �^ 30 400 �̂ 40* 3.8 �^ 0.5 2300 �̂ 250**
WT (12 months) 290 �̂ 30 150 �̂ 15 4.1 �^ 0.5 2000 �̂ 200
KO (12 months) 300 �̂ 30 420 �̂ 40* 4.0 �^ 0.5 2600 �̂ 250**
aValues expressed as nM. bValues expressed as pmol/min/mg protein.cValues expressed as mM. *p , 0.01 versus WT (2 months);
**p , 0.05 versus WT (2 months) (n � 4 in all cases).
Table 2 Quantitative analysis of N-acylethanolamines and 2-arachidonoylglycerol in the cortex of wild-type (WT) or knockout (KO) mice
Compound
(nmol/mg protein)
WT cortex
(2 months)
KO cortex
(2 months)
WT cortex
(6 months)
KO cortex
(6 months)
AEA 0.2 �̂ 0.1 0.2 �^ 0.1 0.2 �^ 0.0 0.2 �^ 0.0
(100%) (100%) (100%) (100%)
2-AG 0.1 �̂ 0.0 0.1 �^ 0.0 0.1 �^ 0.0 0.1 �^ 0.0
(100%) (100%) (100%) (100%)
OEA 0.6 �̂ 0.2 0.8 �^ 0.2* 0.9 �^ 0.2* 0.8 �^ 0.1*
(100%) (133%) (150%) (133%)
PEA 1.5 �̂ 0.4 1.6 �^ 0.7 1.6 �^ 0.2 1.9 �^ 0.4
(100%) (107%) (107%) (127%)
SEA 0.4 �̂ 0.1 0.4 �^ 0.1 0.5 �^ 0.1 0.5 �^ 0.0
(100%) (100%) (125%) (125%)
Total amount 2.8 3.1 3.3 3.5
(100%) (111%) (118%) (125%)
AEA, N-arachidonoylethanolamine (anandamide); 2-AG, 2-arachidonoylglycerol; OEA, N-oleoylethanolamine; PEA, N-palmitoylethanolamine;
SEA, N-stearoylethanolamine. Values in brackets represent percentage of the wild-type (2 months) animals. *p , 0.05 versus WT (2 months)
(n � 4 in all cases).
344 M. Maccarrone et al.
q 2001 International Society for Neurochemistry, Journal of Neurochemistry, 78, 339±348

not signi®cantly change in wild-type (6 months) versus
wild-type (2 months), or in knockout (6 months) versus
knockout (2 months) mice, or in knockout versus wild-type
mice at either age (Table 2). However, OEA increased
signi®cantly in wild-type (6 months) versus wild-type
(2 months) and in knockout (2 months) versus wild-type
(2 months) mice (150 and 133% of the control, respec-
tively), but not in knockout (6 months) versus knockout (2
months) or in knockout (6 months) versus wild-type
(6 months) animals (Table 2). Interestingly, mouse hippo-
campus showed a marked decrease in OEA, PEA and
SEA content in knockout (2 months) versus wild-type
(2 months) mice, and an even larger decrease in
knockout (6 months) versus wild-type (6 months) animals
(Table 3). The decrease in OEA, PEA and SEA was also
signi®cant in wild-type (6 months) versus wild-type (2
months) and in knockout (6 months) versus knockout
(2 months) mice (Table 3). However, AEA decreased
signi®cantly only in knockout (6 months) versus wild-type
(6 months) animals, whereas the content of 2-AG in the
hippocampus was the same in all groups of mice tested
(Table 3).
Discussion
This study describes presence and kinetic properties of the
AMT in synaptosomes from different brain areas, con®rm-
ing ex vivo the model of AEA transport already described in
cultured cells. The activity of AMT from cortex synapto-
somes was enhanced by nitric oxide donors SNP and SNAP,
and even more by peroxynitrite donor SIN-1 (Fig. 3c). This
®nding, which con®rms previous in vitro data (Maccarrone
et al. 2000a), needs to be emphasized, because nitric oxide
and peroxynitrite have already been shown to couple CB1
receptor and AMT in human endothelial cells, where AEA
binding to CB1 induces release of nitric oxide, which in turn
activates AEA uptake by AMT and intracellular degradation
by FAAH (Maccarrone et al. 2000a). A functional link
between the AEA receptor and AEA degradation might form
a regulatory loop, because activation of CB1 stimulates AEA
removal from the extracellular space, thus terminating AEA
signalling at the receptor itself. Mutant mice lacking the
gene encoding for CB1 receptors (knockout mice) represent
a useful model in which this putative CB12AMT coupling
is disrupted. In contrast, AEA has been shown to have
neurotoxic potential, because of its ability to induce
programmed cell death of neuronal cells in vitro (Maccar-
rone et al. 2000c) and in vivo (Galve-Roperh et al. 2000).
Endocannabinoid formation has been observed consistently
during glutamate-induced neurotoxicity (Hansen et al.
1999). Therefore, it can be speculated that suppressing the
CB1 receptor gene, and thus CB12AMT coupling, might
reduce neuron survival, unless some kind of compensatory
mechanism takes place. Such a compensation should keep
AEA levels under control, thus explaining how CB1
knockout mice remain healthy and fertile (Ledent et al.
1999; Zimmer et al. 1999). The results reported here suggest
that indeed a more ef®cient degradation of AEA occurs
when the CB1 gene is disrupted (Fig. 1). Both AMT and
FAAH activity increased in knockout but not in wild-type
mice, and kinetic analysis (Table 1) suggests that this was
caused by increased amounts of just the same AMT and
Table 3 Quantitative analysis of N-acylethanolamines and 2-arachidonoylglycerol in the hippocampus of wild-type (WT) or knockout (KO) mice
Compound
(nmol/mg protein)
WT hippocampus
(2 months)
KO hippocampus
(2 months)
WT hippocampus
(6 months)
KO hippocampus
(6 months)
AEA 0.5 �^ 0.1 0�.4 ^ 0.0 0�.4 ^ 0.0 0�.3 ^ 0.0**²
(100%) (80�%) (80�%) (60�%)
2-AG 0.3 �^ 0.1 0�.3 ^ 0.1 0�.3 ^ 0.1 0�.3 ^ 0.1
(100%) (100�%) (100�%) (100�%)
OEA 1.3 �^ 0.3 1�.0 ^ 0.3 0�.9 ^ 0.1** 0�.3 ^ 0.1*³
(100%) (77�%) (69�%) (23�%)
PEA 3.0 �^ 1.0 1�.1 ^ 0.3* 1�.4 ^ 0.3* 0�.3 ^ 0.0*³
(100%) (37�%) (47�%) (10�%)
SEA 0.8 �^ 0.2 0�.4 ^ 0.0** 0�.5 ^ 0.1** 0�.1 ^ 0.0*³
(100%) (50�%) (62�%) (13�%)
Total amount 5.9 3�.2** 3�.5** 1�.3*³
(100%) (54�%) (59�%) (22�%)
AEA, N-arachidonoylethanolamine (anandamide); 2-AG, 2-arachidonoylglycerol; OEA, N-oleoylethanolamine; PEA, N-palmitoylethanolamine;
SEA, N-stearoylethanolamine. Values in brackets represent percentage of the WT (2 months) animals. *p , 0.01 versus WT (2 months);
**p , 0.05 versus WT (2 months); ²p , 0.05 versus WT (6 months); ³p , 0.01 versus WT (6 months) (n � 4 in all cases). The statistics of KO
(6 months) versus KO (2 months) showed p , 0.01 for OEA, PEA and SEA, and was omitted for the sake of clarity.
Anandamide degradation in CB1 knockout mice 345
q 2001 International Society for Neurochemistry, Journal of Neurochemistry, 78, 339±348

FAAH, rather than to different isoforms. The observation
that FAAH expression at the protein level was enhanced in
KO mice (Fig. 1b) strengthens this concept. Remarkably,
AMT and FAAH activity increased further in ageing
animals, suggesting that AEA degradation might become
more critical. This observation can be explained by recalling
that AEA can be converted into noxious hydroperoxy-
derivatives by lipoxygenase and cyclooxygenase (Burstein
et al. 2000), which are more active in the brain of ageing
animals (Manev et al. 2000).
Quantitative analysis of NAEs and of 2-AG content in the
cortex and hippocampus of wild-type and knockout mice of
different ages yielded the results shown in Tables 2 and 3.
We were not able to extend our GC/MS analysis to other
brain areas or ages, because of the limited number of
animals available. We chose to normalize the amounts of
NAEs and 2-AG to the protein content of the samples, in
order to better compare different tissues, and also in
consideration of the fact that determination of protein is
much more signi®cant than that of fresh weight. Cortex and
hippocampus showed a similar composition in AEA and
congeners in wild-type, 2-month-old mice: PEA was the
most abundant NAE (53% of total), AEA (8%) and 2-AG
(5%) were in the lowest amounts (Tables 2 and 3). It is
noteworthy that AEA and 2-AG were detected in similar
nmol/mg protein concentrations, extending to mouse pre-
vious observations on human and rat brains (Maccarrone
et al. 2001). This is at variance with pmole per g values for
AEA and nmole per g values for 2-AG reported in rat (Stella
et al. 1997) and mouse (Di Marzo et al. 2000a) brain,
although it is in keeping with similar nmole per g values for
AEA and 2-AG reported in rat substantia nigra and globus
pallidus (Di Marzo et al. 2000b). We do not have an
explanation for this discrepancy on NAE quanti®cation, but
we have already ruled out that arti®cial increases in
endocannabinoid level might occur during our sample
preparation and analysis (Maccarrone et al. 2001), e.g.
because of post-mortem lipid breakdown and AEA accu-
mulation (Schmid et al. 1995; Stella et al. 1997). In this
context, it seems noteworthy that the amounts found here are
compatible with a role for AEA and 2-AG in the CNS not
only as modulatory substances (Cadas et al. 1997), but also
as true neurotransmitters (Self 1999). At any rate, an
important ®nding of this investigation is the observation that
AEA and 2-AG showed only minor changes (if any) in
ageing wild-type or knockout mice and, most notably, in
knockout versus wild-type animals (Tables 2 and 3).
Anandamide decreased in a statistically signi®cant way
only in the hippocampus of knockout versus wild-type mice
aged 6 months (Table 3). This seems interesting, if one
recalls that AEA and 2-AG are the most biologically active
endocannabinoids known to date (Pop 1999; Salzet et al.
2000) and can also exert non-CB receptor-mediated actions
(Pertwee 1997). In contrast, OEA, PEA and SEA decreased
markedly in the hippocampus of ageing mice (either wild-
type or knockout) and, most notably, in the hippocampus of
knockout versus wild-type animals. These ®ndings are
consistent with the increased FAAH activity in the
hippocampus of knockout animals (Fig. 1a), because OEA
and PEA are hydrolysed by FAAH (Boger et al. 2000).
However, because AEA and 2-AG are also hydrolysed by
FAAH, the steady level of these endocannabinoids might
imply an increased synthesis. The enhancement of synthesis
in CB1 knockout mice remains to be con®rmed, as does
its mechanism. Indeed, it is not yet clear whether
N-acylethanolamine phospholipid-speci®c phospholipases
D or N-acyltransferases might represent the rate-limiting
step of AEA synthesis (Hansen et al. 2000; references
therein), and even FAAH may play a role in this process
(Kurahashi et al. 1997). Therefore, further work is required
to address the contribution of these synthetic activities to
AEA homeostasis in CB1 knockout animals. The picture is
complicated further by the fact that the endocannabinoid
system plays a role in GABAergic (Tsou et al. 1998),
serotonergic (Cheer et al. 1999) and dopaminergic
(Beltramo et al. 2000) neurotransmission, and in pain
initiation (Calignano et al. 1998), making it likely that
endocannabinoid homeostasis is under the control of a
complex network of signalling molecules. At any rate, the
above data seem to represent a useful biochemical back-
ground to understanding the molecular mechanism(s)
responsible for the control of the activity of endocannabi-
noids in brain, as well as for the different behaviour of
CB1 knockout versus wild-type mice. During the
preparation of this manuscript, an article appeared showing
that FAAH activity, as well as AEA and 2-AG levels, were
unchanged in 2-month-old CB1 knockout versus wild-type
mice (Di Marzo et al. 2000a). Our investigation con®rms
and extends these data to the analysis to all NAEs known to
date, and to the activity of FAAH and AMT at different
ages.
Acknowledgements
Dr Francesca Klinger and Mr Giuseppe D'Arcangelo are
gratefully acknowledged for their excellent technical
assistance. Dr Vincenzo Di Marzo (Istituto per la Chimica di
Molecole d'Interesse Biologico, CNR, Arco Felice, Italy) is
gratefully acknowledged for the kind gift of linvanil. This
investigation was supported by Istituto Superiore di SanitaÁ (III
AIDS Program) and by Ministero dell'UniversitaÁ e della
Ricerca Scienti®ca e Tecnologica, Rome. CL was supported
by the Interuniversity Poles of Attraction (Belgian State,
Prime Minister's Of®ce, Federal Service for Science,
Technology and Culture), by the Fondation MeÂdicale Reine
Elisabeth, by the Fonds de la Recherche Scienti®que MeÂdicale
and by the EU BIOMED II program. Marina AttinaÁ is sadly
missed.
346 M. Maccarrone et al.
q 2001 International Society for Neurochemistry, Journal of Neurochemistry, 78, 339±348
References
Barbaccia M. L., Gandol® O., Chuang D.-M. and Costa E. (1983)
Modulation of neuronal serotonin uptake by the imipramine
recognition site: evidence for an endogenous ligand. Proc. Natl
Acad. Sci. USA 80, 5134±5138.
Beltramo M., Rodriguez de Fonseca F., Navarro M., Calignano A.,
Gorriti M. A., Grammatikopoulos G., Sadile A. G., Giuffrida A.
and Piomelli D. (2000) Reversal of dopamine D2 receptor
responses by an anandamide transport inhibitor. J. Neurosci. 20,
3401±3407.
Bisogno T., Maurelli S., Melck D., De Petrocellis L. and Di Marzo V.
(1997) Biosynthesis, uptake and degradation of anandamide
and palmitoylethanolamide in leukocytes. J. Biol. Chem. 272,
3315±3323.
Boger D. L., Henriksen S. J. and Cravatt B. F. (1998) Oleamide: an
endogenous sleep-inducing lipid and prototypical member of a
new class of biological signaling molecules. Curr. Pharm. Des. 4,
303±314.
Boger D. L., Sato H., Lerner A. E., Hedrick M. P., Fecik R. A.,
Miyauchi H., Wilkie G. D., Austin B. J., Patricelli M. P. and
Cravatt B. F. (2000) Exceptionally potent inhibitors of fatty acid
amide hydrolase: the enzyme responsible for degradation of
endogenous oleamide and anandamide. Proc. Natl Acad. Sci. USA
97, 5044±5049.
Burstein S. H., Rossetti R. G., Yagen B. and Zurier R. B. (2000)
Oxidative metabolism of anandamide. Prostagland. Lipid Mediat.
61, 29±41.
Cadas H., di Tomaso E. and Piomelli D. (1997) Occurrence and
biosynthesis of endogenous cannabinoid precursor, N-arachido-
noyl phosphatidylethanolamine, in rat brain. J. Neurosci. 17,
1226±1242.
Calignano A., La Rana G., Giuffrida A. and Piomelli D. (1998)
Control of pain initiation by endogenous cannabinoids. Nature
394, 277±281.
Cheer J. F., Cadogan A. K., Marsden C. A., Fone K. C. and Kendall
D. A. (1999) Modi®cation of 5-HT2 receptor mediated behaviour
in the rat by oleamide and the role of cannabinoid receptors.
Neuropharmacology 38, 533±541.
Devane W. A., Hannus L., Breuer A., Pertwee R. G., Stevenson L. A.,
Grif®n G., Gibson D., Mandelbaum A., Etinger A. and
Mechoulam R. (1992) Isolation and structure of a brain
constituent that binds to the cannabinoid receptor. Science 258,
1946±1949.
Di Marzo V., Breivogel C. S., Tao Q., Bridgen D. T., Razdan R. K.,
Zimmer A. M., Zimmer A. and Martin B. R. (2000a) Levels,
metabolism, and pharmacological activity in CB1 cannabinoid
receptor knockout mice: evidence for non-CB1, non-CB2 receptor-
mediated actions of anandamide in mouse brain. J. Neurochem.
75, 2434±2444.
Di Marzo V., Hill M. P., Bisogno T., Crossman A. R. and Brotchie J. M.
(2000b) Enhanced levels of endogenous cannabinoids in the
globus pallidus are associated with a reduction in movement in an
animal model of Parkinson's disease. FASEB J. 14, 1432±1438.
Galve-Roperh I., SaÁnchez C., Cortes M. L., del Pulgar T. G.,
Izquierdo M. and Guzman M. (2000) Anti-tumoral action of
cannabinoids: involvement of sustained ceramide accumulation
and extracellular signal-regulated kinase activation. Nature Med.
6, 313±316.
Giang D. K. and Cravatt B. F. (1997) Molecular characterization of
human and mouse fatty acid amide hydrolase. Proc. Natl Acad.
Sci. USA 94, 2238±2242.
Hansen H. S., Moesgaard B., Hansen H. H., Schousboe A. and Petersen
G. (1999) Formation of N-acyl-phosphatidylethanolamine and
N-acylethanolamine (including anandamide) during glutamate-
induced neurotoxicity. Lipids 34, S327±S330.
Hansen H. H., Hansen S. H., Schousboe A. and Hansen H. S. (2000)
Determination of the phospholipid precursor of anandamide and
other N-acylethanolamine phospholipids before and after sodium
azide-induced toxicity in cultured neocortical neurons.
J. Neurochem. 75, 861±871.
Hillard C. J., Wilkison D. M., Edgemond W. S. and Campbell W. B.
(1995) Characterization of the kinetics and distribution of
N-arachidonylethanolamine (anandamide) hydrolysis by rat
brain. Biochim. Biophys. Acta 1257, 249±256.
Hillard C. J., Edgemond W. S., Jarrahian A. and Campbell W. B. (1997)
Accumulation of N-arachidonoylethanolamide (anandamide)
into cerebellar granule cells occurs via facilitated diffusion.
J. Neurochem. 69, 631±638.
Jarrahian A., Manna S., Edgemond W. S., Campbell W. B. and
Hillard C. J. (2000) Structure2activity relationships among
N-arachidonylethanolamine (Anandamide) head group analogues
for the anandamide transporter. J. Neurochem. 74, 2597±2606.
Kurahashi Y., Ueda N., Suzuki H., Suzuki M. and Yamamoto S. (1997)
Reversible hydrolysis and synthesis of anandamide demonstrated
by recombinant rat fatty acid amide hydrolase. Biochem. Biophys.
Res. Commun. 237, 512±515.
Ledent C., Valverde O., Cossu G., Petitet F., Aubert J.-F., Beslot F.,
BoÈhme G. A., Imperato A., Pedrazzini T., Roques B. P.,
Vassart G., Fratta W. and Parmentier M. (1999) Unresponsiveness
to cannabinoids and reduced addictive effects of opiates in CB1
receptor knockout mice. Science 283, 401±404.
Maccarrone M., van der Stelt M., Rossi A., Veldink G. A., Vliegenthart
J. F. G. and Finazzi-AgroÁ A. (1998) Anandamide hydrolysis
by human cells in culture and brain. J. Biol. Chem. 273,
32332±32339.
Maccarrone M., Bari M., Lorenzon T., Bisogno T., Di Marzo V. and
Finazzi-AgroÁ A. (2000a) Anandamide uptake by human endothe-
lial cells and its regulation by nitric oxide. J. Biol. Chem. 275,
13484±13492.
Maccarrone M., De Felici M., Bari M., Klinger F., Siracusa G. and
Finazzi-AgroÁ A. (2000b) Down-regulation of anandamide hydro-
lase in mouse uterus by sex hormones. Eur. J. Biochem. 267,
2991±2997.
Maccarrone M., Lorenzon T., Bari M., Melino G. and Finazzi-AgroÁ A.
(2000c) Anandamide induces apoptosis in human cells via
vanilloid receptors. Evidence for a protective role of cannabinoid
receptors. J. Biol. Chem. 275, 31938±31945.
Maccarrone M., Valensise H., Bari M., Lazzarin N., Romanini C. and
Finazzi-AgroÁ A. (2000d) Relation between decreased anandamide
hydrolase concentrations in human lymphocytes and miscarriage.
Lancet 355, 1326±1329.
Maccarrone M., AttinaÁ M., Cartoni A., Bari M. and Finazzi-AgroÁ, A.
(2001) GC/MS analysis of endogenous cannabinoids in healthy
and tumoral human brain and human cells in culture. Neurochem.
J. 76, 594±601.
Manev H., Uz T., Sugaya K. and Qu T. (2000) Putative role of neuronal
5-lipoxygenase in an aging brain. FASEB J. 14, 1464±1469.
Melck D., Bisogno T., De Petrocellis L., Chuang H.-H., Julius D.,
Bifulco M. and Di Marzo V. (1999) Unsaturated long-chain
N-acyl-vanillyl-amides (N-AVAMs): vanilloid receptor ligands
that inhibit anadamide-facilitated transport and bind to CB1
cannabinoid receptors. Biochem. Biophys. Res. Commun. 262,
275±284.
Pertwee R. G. (1997) Pharmacology of cannabinoid CB1 and CB2
receptors. Pharmacol. Ther. 74, 129±180.
Piomelli D., Beltramo M., Glasnapp S., Lin S. Y., Goutopoulos A.,
Xie X. Q. and Makriyannis A. (1999) Structural determinants for
Anandamide degradation in CB1 knockout mice 347
q 2001 International Society for Neurochemistry, Journal of Neurochemistry, 78, 339±348

recognition and translocation by the anandamide transporter. Proc.
Natl Acad. Sci. USA 96, 5802±5807.
Pop E. (1999) Cannabinoids, endogenous ligands and synthetic analogs.
Curr. Opin. Chem. Biol. 3, 418±425.
Robertson E. F., Dannelly H. K., Malloy P. J. and Reeves H. C. (1987)
Rapid isoelectric focusing in a vertical polyacrylamide minigel
system. Anal. Biochem. 167, 290±294.
Salzet M., Breton C., Bisogno T. and Di Marzo V. (2000) Comparative
biology of the endocannabinoid system. Possible role in the
immune response. Eur. J. Biochem. 267, 4917±4927.
Schmid P. C., Krebsbach R. J., Perry S. R., Dettmer T. M., Maasson J. L.
and Schmid H. H. (1995) Occurrence and postmortem generation
of anandamide and other long-chain N-acylethanolamines in
mammalian brain. FEBS Lett. 375, 117±120.
Self D. W. (1999) Anandamide: a candidate neurotransmitter heads for
the big leagues. Nature Neurosci. 2, 303±304.
Stella N., Schweitzer P. and Piomelli D. (1997) A second endogenous
cannabinoid that modulates long-term potentiation. Nature 388,
773±778.
Tsou K., Brown S., SaoÁudo-PeoÁa M. C., Mackie K. and Walker J. M.
(1998) Immunohistochemical distribution of cannabinoid CB1
receptors in the rat central nervous system. Neuroscience 83,
393±411.
Van der Stelt M., Paoletti A. M., Maccarrone M., Nieuwenhuizen W. F.,
Bagetta G., Veldink G. A., Finazzi-AgroÁ A. and Vliegenthart J. F.
G. (1997) The effect of dioxygenation of N-linoleoylamides on
their cannabinomimetic properties. FEBS Lett. 415, 313±316.
Venance L., Piomelli D., Glowinski J. and Giaume C. (1995) Inhibition
by anandamide of gap junctions and inercellular calcium
signalling in striatal astrocytes. Nature 376, 590±594.
Zimmer A., Zimmer A. M., Hohmann A. G., Herkenham M. and
Bonner T. I. (1999) Increased mortality, hypoactivity, and
hypoalgesia in cannabinoid CB1 receptor knockout mice. Proc.
Natl Acad. Sci. USA 96, 5780±5785.
348 M. Maccarrone et al.
q 2001 International Society for Neurochemistry, Journal of Neurochemistry, 78, 339±348
Related Documents