147 Asian Journal of Economics and Empirical Research Vol. 5, No. 2, 147-154, 2018 ISSN (E) 2409-2622 / ISSN (P) 2518-010X DOI: 10.20448/journal.501.2018.52.147.154 Analyzing the Savings-Investment Trend in a Panel of G-7 Countries Abdul Mansoor 1 Baserat Sultana 2 Romana Saeed 3 ( Corresponding Author) 1,2,3 Department of Economics, University of Wah, Pakistan Abstract This study examined the relationship between savings and investment in the G-7 countries for the period of 1970 to 2015. The stationary analysis of the data has been done by adopting the panel Levin, Lin & Chu, Breitung, Pesaran & Shin, ADF-Fisher & PP-Fisher criteria while the long run relationship has been tested by employing the Pedroni residual test of co-integration. The results neglected the existence of a long run correlation between saving and investment in G-7 countries. Further, joint causality between the savings and investment has also been tested using the fixed effect VAR model. Wald test explains that the two consecutive lags i.e. S (-1) and S (-2) of savings is jointly causing savings in the current year in the G7 countries. While the same two lags of investment i.e. I (-1) and I (-2) does not jointly granger cause savings in the G7 economies. The results are in line with Feldstein and Horioka (1980) that there is a stable and significant association between the increasing rates of savings and investment in the short run while this relationship weaken in the long run. Keywords: Savings, Investment, Panel co-integration, Panel VAR, G-7 countries. JEL Classification: E21; E22. Citation | Abdul Mansoor; Baserat Sultana; Romana Saeed (2018). Analyzing the Savings-Investment Trend in a Panel of G-7 Countries. Asian Journal of Economics and Empirical Research, 5(2): 147-154. History: Received: 13 June 2018 Revised: 30 July 2018 Accepted: 18 August 2018 Published: 27 September 2018 Licensed: This work is licensed under a Creative Commons Attribution 3.0 License Publisher: Asian Online Journal Publishing Group Contribution/Acknowledgement: All authors contributed to the conception and design of the study. Funding: This study received no specific financial support. Competing Interests: The authors declare that they have no conflict of interests. Transparency: The authors confirm that the manuscript is an honest, accurate, and transparent account of the study was reported; that no vital features of the study have been omitted; and that any discrepancies from the study as planned have been explained. Ethical: This study follows all ethical practices during writing. Contents 1. Introduction .................................................................................................................................................................................... 148 2. Review of Literature ...................................................................................................................................................................... 148 3. Econometric Methodology .......................................................................................................................................................... 149 4. Result and Discussions ................................................................................................................................................................. 150 5. Conclusion ....................................................................................................................................................................................... 153 References ............................................................................................................................................................................................ 153 brought to you by CORE View metadata, citation and similar papers at core.ac.uk provided by Asian Online Journal Publishing Group (AOJPG)

Welcome message from author
This document is posted to help you gain knowledge. Please leave a comment to let me know what you think about it! Share it to your friends and learn new things together.
Transcript
147
Asian Journal of Economics and Empirical Research Vol. 5, No. 2, 147-154, 2018
ISSN (E) 2409-2622 / ISSN (P) 2518-010X DOI: 10.20448/journal.501.2018.52.147.154
Analyzing the Savings-Investment Trend in a Panel of G-7 Countries
Abdul Mansoor1
Baserat Sultana2
Romana Saeed3
( Corresponding Author)
1,2,3Department of Economics, University of Wah, Pakistan
Abstract
This study examined the relationship between savings and investment in the G-7 countries for the period of 1970 to 2015. The stationary analysis of the data has been done by adopting the panel Levin, Lin & Chu, Breitung, Pesaran & Shin, ADF-Fisher & PP-Fisher criteria while the long run relationship has been tested by employing the Pedroni residual test of co-integration. The results neglected the existence of a long run correlation between saving and investment in G-7 countries. Further, joint causality between the savings and investment has also been tested using the fixed effect VAR model. Wald test explains that the two consecutive lags i.e. S (-1) and S (-2) of savings is jointly causing savings in the current year in the G7 countries. While the same two lags of investment i.e. I (-1) and I (-2) does not jointly granger cause savings in the G7 economies. The results are in line with Feldstein and Horioka (1980) that there is a stable and significant association between the increasing rates of savings and investment in the short run while this relationship weaken in the long run.
Keywords: Savings, Investment, Panel co-integration, Panel VAR, G-7 countries.
JEL Classification: E21; E22.
Citation | Abdul Mansoor; Baserat Sultana; Romana Saeed (2018). Analyzing the Savings-Investment Trend in a Panel of G-7 Countries. Asian Journal of Economics and Empirical Research, 5(2): 147-154. History: Received: 13 June 2018 Revised: 30 July 2018 Accepted: 18 August 2018 Published: 27 September 2018 Licensed: This work is licensed under a Creative Commons
Attribution 3.0 License Publisher: Asian Online Journal Publishing Group
Contribution/Acknowledgement: All authors contributed to the conception and design of the study. Funding: This study received no specific financial support. Competing Interests: The authors declare that they have no conflict of interests. Transparency: The authors confirm that the manuscript is an honest, accurate, and transparent account of the study was reported; that no vital features of the study have been omitted; and that any discrepancies from the study as planned have been explained. Ethical: This study follows all ethical practices during writing.
Contents 1. Introduction .................................................................................................................................................................................... 148 2. Review of Literature ...................................................................................................................................................................... 148 3. Econometric Methodology .......................................................................................................................................................... 149 4. Result and Discussions ................................................................................................................................................................. 150 5. Conclusion ....................................................................................................................................................................................... 153 References ............................................................................................................................................................................................ 153
brought to you by COREView metadata, citation and similar papers at core.ac.uk
provided by Asian Online Journal Publishing Group (AOJPG)

Asian Journal of Economics and Empirical Research, 2018, 5(2): 147-154
148
1. Introduction All economists support the equality between savings and investment but their ideas differ from each other in a
way of how the balance between savings and investment will occur. The discussion over this issue is spread over a long range of time starting from the classical theory of full employment. Classicals are of the view that equality between savings and investment will bring about by the rate of interest. Classicals documented a positive response of investment towards the interest rate and inversely proportional to the savings in the economy. Keynesian are somehow think differently upon this issue. Keynes theory support the equilibrium of savings and investment via income adjustments in the economy. Secondly Keynes also suggests that the interest rate not only effect the investment level but also the savings pattern of the people of the country. The most important point of the Keynesian theory is that the full employment in the economy is rare to find rather there is urge of suitable policy implications that will bring about equilibrium in the economy. Therefore, the saving-investment patterns must be investigated in order to brought them down to equality at the best.
The takeoff point for the researcher on the association between savings and investment is based on Feldstein and Horioka (1980) who documented a direct relationship between the increasing rate of saving and investment as a measure of capital mobility .
According to their study if capital is assumed to be perfectly mobile, then domestic savings would raise out the returns in the capital market and by the same way capital market would carter the domestic investment needs. Can such results be replicated for other historic data and countries? To sort out this study intends to investigate the saving-investment relationship in a cross panel of 17 OECD countries. This theory generates a voluminous literature over the last couple of decades. This theory is tested by a series of researchers (see (Schmidt, 2003; Narayan, 2005; de Vita and Kyaw, 2009)) one of the important feature of the extant literature that saving-investment nexus is investigated for developing countries and only few studies e.g. Abbott and Vita (2003) and Baranov and Kohler (2018) investigate this issue for developed countries.
This study differs from the previous studies in two aspects. First this study examines the saving investment nexus in the panel of developed economies of the globe and this group encircles France, Germany, Italy, Japan Us, UK and Canada. This chunk of country interestingly shows a relative balance pattern of saving and investment as per the statistics of world bank. The saving arte to GDP in the panel of G7 countries is 20.159% while that of investment to GDP ratio is 20.118% (World Bank Group, 2015). This balance growth rates of savings and investment compels us to reexamined the theory of Feldstein and Horioka (1980); Feldstein (1982). Secondly, this study is a comparative analysis of cross country sample of developed nations. As developed nations are very sensitive to any change in the policy variable by the central authority, Tesar (1991). The early literature suggests the importance of savings and investment nexus in the stability of any economy; however, it is not obvious. Several problems with approach highlights that the high level correlation between saving and investment is some time shows non consistency with the integrated financial markets. in order to view this idea we try to reinvestigate the co relationship between saving and investment in the relative stable economies of the Globe e.g. the group of G-7 countries. Saving economic growth and investment have a very close relationship. They analyze the open economy structure of New Zealand and found that foreign and domestic saving enhances the way of growth and the desired investment. It was found that there is a close link between saving, investment and growth in a small economy of New Zealand. The country managed to reach to foreign capital in efficient way and able to meet the needs of investment, Claus and Thomas (2001). Feldstein-Horioka technique of measuring financial condition of the economy through capital mobility is a puzzle as it has created many problems in the economy as suggested by Tsoukis and Alyousha (2001). They found that savings and investment has a positive relationship in Australia and United Kingdom but it is in opposite direction in Germany.
The concept savings identity or the investment savings identity is a conception in macro economics stating that the specific quantity which saved in any economic system will be the quantity invested in new physical, machinery and new inventories etc. The diagrams presented in appendix of this study shows the correlation between the said variables i.e. saving and investment for the G-7 economies like Canada, Germany, France, Italy, Japan, United Kingdom and United States of America respectively.
2. Review of Literature Relatively a few studies have been carried out to analyze the panel data of the countries to estimate the
behavior of savings-investment relationship. Some notable contribution in this regard. Schmidt (2003) studied the short and long run relationship between saving and investment by using Feldstein-Horioka (FH) test for twelve countries over a long period of time using time series and cross sectional data since 1850. He found that the internal mobility of capital largely vary within different countries. The selected countries showed that during the period of war or time of great depression the internal mobility of capital was very low.
Pelgrin and Schich (2014) analyzed the association between saving and investment to over view the level of investment at international level. They found that in the long run capital mobility passes through the lines of closed attachment although that is slow but not restricted. They also workout the short run estimates of these variables through panel error correction technique for 20 Organization for Economic Co-operation & Development (OECD) countries over the time period of 1960 to 1999. It was documented that short run variables when turns to long run variables follows a solvency constraint.
Lewis (1955) while explaining a hypothetical growth model found the linkages among the investment and saving with the help of accumulation of capital. In the light of Harrod (1939) and Domar (1946) model the growth rate of output in an economy has direct relationship with savings and investment. While the exogenous growth model of Solow (1956) and Swan (1956) which attempts to enlighten the long run economic growth with the help of accumulation of capital, productivity and technological progress has confirmed that saving has no significant impact on the growth of an economy in the long run. According to Romer (1986); Lucas (1988) and Barro (1990) physical capital increase the economic growth in the long period. So, all theories regarding growth and development concludes that savings and investment can play a vital role in prop up and enhancing the economic growth in an economy.
Asian Journal of Economics and Empirical Research, 2018, 5(2): 147-154
149
Esso and Yaya (2010) analyzed the panel data for the saving investment nexus in seven developing economies i.e. Benin, Burkina Faso, Côte d‘Ivoire, Mali, Niger, Senegal and Togo West African Economic and Monetary Union (UEMOA). They found that saving only active in three economies i.e. Benin, Côte d‘Ivoire and Burkina Faso. Two different approaches Pesaran Bounds co integration approach and Toda-Yamamoto Granger causality test were used in their analysis.
Saving, investment and economic growth have a close relation with each other it was studied by Jangili (2011) who analyzed the data for the period spread over 1950-2008 for India. He found the long-run association between saving and investment in India. Further they documented that in India investment mainly comes through the channel of household saving. India is also lagging a bit in the field of innovation and technology so there is no significant role of technology in the economy of India. Augmented Dickey Fuller (ADF) Test was used for the stationary of the data while Co-integration Johansen-Juselius technique was used to check the long run correlation in the variables. For Causality vector error correction model (VECM) and vector autoregressive distribution model (VAR) has been used.
Onafowara et al. (2011) found the correlation between saving and investment in eight advance European countries. They used Autoregressive Distributed Lag model (ARDL) for the co-integration. They used unrestricted error correction model (ECM) and vector autoregressive distributive model for the analysis of data. They found that in Denmark, Germany and Luxemburg there is long run causality exist between saving and investment. In these economies investment granger causes saving and hence government expenditures should be minimized. While those economies where the saving granger cause investment; tax should be controlled and people should be given tax relief in order to attract them towards savings.
Adebola and Dahalan (2012) analyzed the saving and investment relationship for Tunisia using Feldstein and Horioka technique. They used longitudinal time series data for the time span between 1970 and 2009. Zivot-Andrews unit root test was used for the stationary of the data. Bound test was used for co integration among these variables while Granger causality was also used for casualty. It was found that there is low level relationship exists between savings and investment in Tunisia.
Bibi et al. (2012) concluded that investment is not determined by domestic saving in Pakistan They used time series data for the period of 1970-2009 through ADF and Johnson co integration technique. Investment was taken as a function of domestic saving while undertaking the Johansen‘s Maximum Likelihood Test. It was documented that savings and investment has no long-run relationship in Pakistan economy.
Ogbokor and Musilika (2014) studied about the relationship of saving and investment for Namibia. They documented that there is no significant relationship exists between the potential savings and investment in Namibia neither in the long nor in the short run. Augmented dickey fuller unit root test was used for testing the stationary. Johansen test of co-integration and Granger causality test is employed for the joint causality of the variables. It is suggested that by increasing government expenditures and reduction in taxation cultures can put economy on right direction.
Ucan (2014) analyzed the role of investment in G7 countries taking panel data for the period of 1994-2010. In developing and developed countries the intend of increasing the volume of capital is to enhance international trade, motivate economic growth and capital inflows. For empirical analysis panel unit root tests, Kao and Pedroni residual test of co-integration has been employed. He found that saving was used in terms of recession in advance countries while in developing countries it was used for imports of the goods.
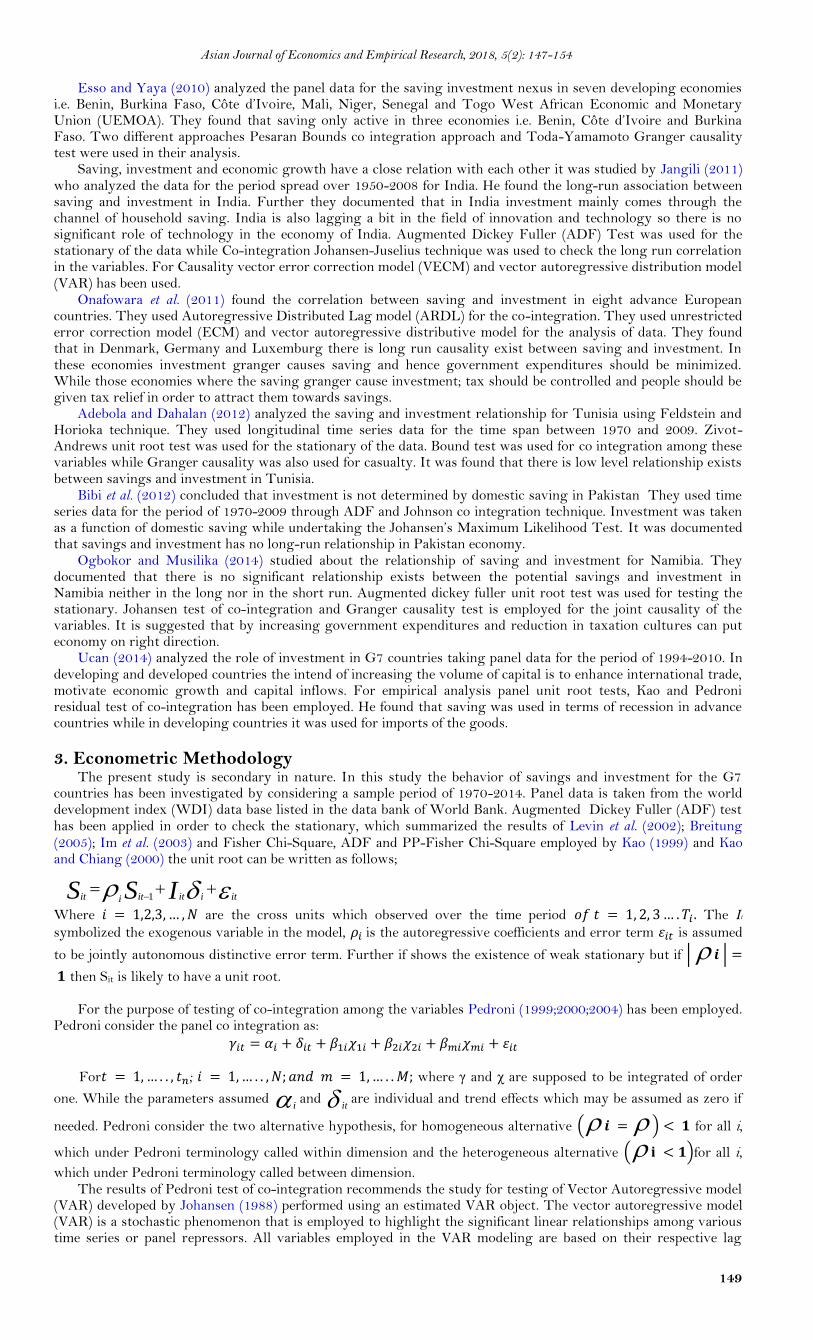
3. Econometric Methodology The present study is secondary in nature. In this study the behavior of savings and investment for the G7
countries has been investigated by considering a sample period of 1970-2014. Panel data is taken from the world development index (WDI) data base listed in the data bank of World Bank. Augmented Dickey Fuller (ADF) test has been applied in order to check the stationary, which summarized the results of Levin et al. (2002); Breitung (2005); Im et al. (2003) and Fisher Chi-Square, ADF and PP-Fisher Chi-Square employed by Kao (1999) and Kao and Chiang (2000) the unit root can be written as follows;
Where are the cross units which observed over the time period The It
symbolized the exogenous variable in the model, is the autoregressive coefficients and error term is assumed
to be jointly autonomous distinctive error term. Further if shows the existence of weak stationary but if | | then Sit is likely to have a unit root.
For the purpose of testing of co-integration among the variables Pedroni (1999;2000;2004) has been employed.
Pedroni consider the panel co integration as:
For ; where γ and χ are supposed to be integrated of order
one. While the parameters assumed iand it
are individual and trend effects which may be assumed as zero if
needed. Pedroni consider the two alternative hypothesis, for homogeneous alternative ( ) for all i,
which under Pedroni terminology called within dimension and the heterogeneous alternative ( )for all i,
which under Pedroni terminology called between dimension. The results of Pedroni test of co-integration recommends the study for testing of Vector Autoregressive model
(VAR) developed by Johansen (1988) performed using an estimated VAR object. The vector autoregressive model (VAR) is a stochastic phenomenon that is employed to highlight the significant linear relationships among various time series or panel repressors. All variables employed in the VAR modeling are based on their respective lag
itiititiit ISS 1

Asian Journal of Economics and Empirical Research, 2018, 5(2): 147-154
150
values, lag values of other explanatory variables along with the random error term of the model. This model does not need any sort of theoretical support about the force that is causing the changes to the variables. Sims (1980) documented the VAR model as a robust model that is theory free method to estimate the economic relationships. VAR model adopted in this study is given as follows;
Where ytis the vector of non-stationary (I) variables
tis the vector of deterministic variables and t
is the
vector of innovations. This VAR model may be rewritten as:
tpt
p
iiitt
yyy1
1 t
Where
∏ = - (I -
p
iiA
1
)
p
ijji A
1
And ―I‖ is an identity matrix. If all the variables are integrated of order 1 i.e. non stationary of same order, than ∆yt are stationary. The estimated coefficients of equation (2) are consistent if the assumption that variables are co-
integrated, are not violated, and then xt 1is also stationary or integrated of order zero.
4. Result and Discussions In order to discuss the results let‘s have a bird‘s eye view of the overall glimpse of the saving-investment
trends in the group of G-7 countries.
Figure-1. Trend in Saving and Investment in Canada
Developed by Authors using data given in World Development Indicators (WDI)
Figure-2. Trend in Saving and Investment in France
(Developed by Authors using data given in World Development Indicators (WDI)
Figure-3. Trend in Saving and Investment in Germany
(Developed by Authors using data given in World Development Indicators (WDI)

Asian Journal of Economics and Empirical Research, 2018, 5(2): 147-154
151
Figure-4. Trend in Saving and Investment in Italy
(Developed by Authors using data given in World Development Indicators (WDI)
Figure-5. Trend in Saving and Investment in Japan
(Developed by Authors using data given in World Development Indicators (WDI)
Figure-6. Trend in Saving and Investment in United Kingdom
(Developed by Authors using data given in World Development Indicators (WDI)
Figure-7. Trend in Saving and Investment in USA
Source: (Developed by Authors using data given in World Development Indicators (WDI)
The graphs show the trends savings and investments in the G-7 countries over the selected time period in this study. Both of the variables are taken in US billion dollars. The diagrams show a gradual upward movement in saving and investment ratio for all the G-7 countries. Figure 1, depicts the overall investment ratio tends to increase more than saving in Canada. Similar trend is shown in Figure 2, regarding saving and investment ratio that increases over time in France. Saving and investment increase in Germany much more than any European country over the course of time as shown in Figure 3. In Italy saving and investment are comparatively low than other G-7 countries. This can be picture out from Figure 4; Japan among all the G-7 countries has a higher ratio of investment as compared to savings. According to Figure 5, therefore, there is a slight disequilibrium in Japanese economy as per theory of Keynes. A stable and solid increase in saving and in investment has found in UK economy. Figure 6, depicts the high trend of investment compared with savings in UK while in Figure 7, saving and investment is very much high in United States as compared to other G-7 countries where investment ratios are

Asian Journal of Economics and Empirical Research, 2018, 5(2): 147-154
152
much more as compared to savings. If we give a bird‘s eye view to the overall picture, savings has declined as compared to investment in the economies of Canada, France, Italy, UK and USA.
The problem of unit root is considered to be the most common issue of panel and time series data sets. As we employed the panel data in our study so it is essential to prior confirm the presence of stationary in the present sample of the data in the study. We have used various testing criteria to figure out the footprints of a unit root in the data. The results summary is documented in Table 1.
Table-1. Results of Panel Unit Root Test for Investment
Methods
At-Level with Intercept At-first difference with Intercept
t-Stat Prob.** t-Stat Prob.**
Levin, Lin & Chu 0.95146 0.8293 -14.9612 0.000
Pesaran & Shin 3.23985 0.9994 -12.9758 0.000
ADF-Fisher 3.13474 0.9988 157.956 0.000
PP-Fisher 3.00477 0.9991 161.971 0.000
Author‘s Calculations using E.views-9
Table-2. Summary of the Panel Unit Root Test for Savings
Methods
At-Level with Intercept At-first difference with Intercept
t-Stat Prob.** t-Stat Prob.**
Levin, Lin & Chu 0.75299 0.7743 -12.3223 0.000 Pesaran & Shin 3.02128 0.9987 -13.2885 0.000
ADF-Fisher 2.95694 0.9991 162.263 0.000
PP-Fisher 2.87474 0.9993 170.211 0.000
‗**‘ shows significance at 5 % significance level
Table 1 and Table 2 shows the results of panel unit root tests. The results are assessed at level and at 1st
difference for both savings and investment. Using panel unit root tests, intercept has been considered as a bench mark with automatic selection criterion of lags in order to test the presence of stationary issue in the data set. Table 1 and Table 2 confirm that the data regarding investment and savings for the G-7 countries is non stationary (presence of a unit root) at level while this issue is solved after taking its first difference. As the
corresponding probability values of all the test statistic i.e. Levin, Lin & Chu, Pesaran & Shin, ADF-Fisher and
PP-Fisher are more than 5% and hence the results shows that the data is non stationary at level therefore, in order to remove the unit root we take the corresponding first and second differences of the variable. While the probability values regarding all tests are significant at first difference. This means that the data is stationary at its first difference.
Table 3 of the study shows the results of Pedroni residual of panel co-integration test considering no deterministic trend as a bench mark. Table 3 possess the corresponding statistic value and corresponding probabilities. Furthermore, we employed various test methods such as panel V-Statistic, Panel Rho Statistic, Panel PP-Statistic, Panel ADF Statistic, Group Rho Statistic, Group PP Statistic and Group ADF Statistic and having eleven statistic values with the corresponding probability values. All these seven methodologies possess eleven outcomes. Out of eleven outcomes only five corresponding probability values are significant which less than 5% level of significance is while six are not significant, and hence, their corresponding probabilities are more than 5% level of significance. In this scenario majority must be guaranteed hence there is no considerable co-integration among the explanatory variables. On the basis of this we cannot reject the null hypothesis; rather we accept the null hypothesis that there is no co integration among the variables included in this study.
Table-3. Pedroni Residual Co-integration Test with No Deterministic Trend
Methods Statistic P-value Weighted Statistic P-value
Within Dimension Panel V Statistic 8.067432 0.0000 3.332678 0.0004
Panel φ (rho) Statistic -8.409846 0.0000 -1.213517 0.1125
Panel PP Statistic -6.315322 0.0000 -0.626820 0.2654
Panel ADF Statistic -6.378627 0.0000 -0.867836 0.1927 Author‘s Calculations using E.views-9
As the decision of Pedroni residual panel test of co-integration negated the presence of co- integration among the variables so research forwarded for the testing of panel Vector Auto Regressive (VAR) model. Panel VAR model could be the panel Random effect model and panel Fixed effect model and then the results of Haussmann test statistic could suggest the significance of the model.
Table-4. Result of Panel VAR Fixed Effect Model
Variable Coefficient Std. Error t-Statistic Prob.
C (C1) 27.66372 7.800737 3.546296 0.0005
SAVINGS (-1) (C2) 1.037031 0.066330 15.63436 0.0000
SAVINGS (-2) (C3) -0.078763 0.075481 -1.043481 0.2976 INVESTMENT (-1) (C4) -0.014355 0.064911 -0.221150 0.8251
INVESTMENT (-2) (C5) 0.037763 0.058953 0.640570 0.5223 Author‘s Calculations using E.views-9 Table 4 shows the results of panel VAR fixed effect model. From the result, the joint causality is checked
among the variables along with their lags i.e. Savings (-1), Savings (-2), Investment (-1) and Investment (-2) as shown in Table 4. The coefficients of the variables are denoted by (C1), (C2), (C3), (C4) and C (5) respectively. In

Asian Journal of Economics and Empirical Research, 2018, 5(2): 147-154
153
other words we are going to check either the first and second lags of saving and investment can cause the dependent variable or not? To answer this question Wald test criterion is applied and the results are shown in Table 5.
Table-5. Result of Wald Test of Joint Causality C (2) = C (3) =0
Test Statistic Value Prob.
F-Statistic 236.9681 0.0000 Chi Square 473.9362 0.0000
Author‘s Calculations using E.views-9
Table-6. Summary Results of Wald Test of Joint Causality C (4) =C (5) =0
Test Statistic Value Prob.
F-Statistic 0.275679 0.7579 Chi Square 0.551357 0.7991
Author‘s Calculations using E.views-9
The outcome of the Wald test shown by Table 5 explains that the joint causality is running from savings (-1) and savings (-2) towards saving in the current year. Less than 5% corresponding probability value of F-statistic rejects the null hypothesis which means that C (2) =C (3) are not equal to zero. It means that savings (-1) and savings (-2) jointly can cause savings in the current year in the G7 countries. Table 6 documents the results about the joint causality running from Investment (-1) and Investment (-2) towards the investment in the current period. It means that the trend of saving and investment in the G7 economies has a strong association with the previous year trends of savings and investment. More than 5% corresponding probability value of F-statistic can‘t reject the null hypothesis. Which means that investment (-1) and investment (-2) does not jointly granger cause Savings in the G7 nations.
5. Conclusion This paper endeavors to employ the panel data co-integration tests in order to test the long run association
among the savings and investment in the G-7 countries from the period over 1970 to 2015. Panel unit root test confirms that savings and investment of G-7 countries are non-stationary at level and stationary at its first difference. The empirical results of Pedroni residual test of co-integration suggest that that there is no co-integration among the savings and investment in the G-7 countries. As the decision of Pedroni residual panel test of co-integration negated the presence of co-integration among the savings and investment in the G-7 countries so the study further employed the testing of panel VAR model. Furthermore the joint causality among the savings and investment has also been tested using fixed effect VAR model. Wald test statistic explains that the lags of savings jointly can granger cause savings of current period in the G7 countries. While the lags of investment do not jointly granger causes savings in the G7 nations.
The results of the study lead to the results that saving and investment have no long run relationship with each other in the said economies. These results are in-line with the results documented by Ramakrishna and Rao (2012), who documented that there is no long run relationship among the savings and investment in Ethiopia and other industrial countries.
The fundamental reason for the absence of long run equilibrium relationship among the savings and investment in the economies of G-7 countries is that savings has declined overtime. It is the need of the time that plans of investment should be modified in such a way that it could encourage employment and it may help out to dropping down the inflationary figures in the economy. The pattern of savings should be encouraged after introducing some sort of incentives such as relief in the income tax and higher bank deposit rates should be realize.
The plans of investment should be modified in such a way that it may encourage employment and it may help out to drop down the inflationary rate in these countries. The pattern of savings should be modified in such a way that the people are encouraged towards savings and also utilize these funds in the form of investment by adopting the Keynesian theory of savings and investment, in which the economy will be in equilibrium if the planned savings become equal to the planned investment. For this, the government should make some provisions of incentives such as relief in the income tax and higher bank deposit rates to its potential masses.
References Abbott, A.J. and G.D. Vita, 2003. Another piece in the Feldstein—Horioka puzzle. Scottish Journal of Political Economy, 50(1): 69-
89.Available at: https://doi.org/10.1111/1467-9485.00255. Adebola, S.S. and J. Dahalan, 2012. Capital mobility: An application of savings-investment link for Tunisia. International Journal of
Economics and Financial Issues, 2(1): 1-11. Baranov, V. and H.-P. Kohler, 2018. The impact of AIDS treatment on savings and human capital investment in Malawi. American
Economic Journal: Applied Economics, 10(1): 266-306.Available at: https://doi.org/10.1257/app.20150369. Barro, R.J., 1990. Government spending in a simple model of endogeneous growth. Journal of Political Economy, 98(5, Part 2): S103-
S125.Available at: https://doi.org/10.1086/261726. Bibi, S., U.A. Khan and A. Bibi, 2012. Determinants of investment in Pakistan. Academic Research International, 2(2): 517. Breitung, J., 2005. A parametric approach to the estimation of cointegration vectors in panel data. Econometric Reviews, 24(2): 151-
173.Available at: https://doi.org/10.1081/etc-200067895. Claus, J. and J. Thomas, 2001. Equity premia as low as three percent? Evidence from analysts' earnings forecasts for domestic and
international stock markets. The Journal of Finance, 56(5): 1629-1666.Available at: https://doi.org/10.1111/0022-1082.00384. de Vita, G. and K.S. Kyaw, 2009. Growth effects of FDI and portfolio investment flows to developing countries: A disaggregated analysis by
income levels. Applied Economics Letters, 16(3): 277-283.Available at: https://doi.org/10.1080/13504850601018437. Domar, E., 1946. Capital expansion, rate of growth, and employment. Econometrica, 14(2): 137-147.Available at:
https://doi.org/10.2307/1905364. Esso, J.L. and K.E.H.O. Yaya, 2010. The savings-investment relationship: Co integration and causality evidence from Uemoa countries.
International Journal of Economics and Finance, 2(1): 174-181.Available at: https://doi.org/10.5539/ijef.v2n1p174. Feldstein, M., 1982. Domestic saving and international capital movements in the long run and the short run. No. 0947. National Bureau of
Economic Research, Inc. Feldstein, M. and C. Horioka, 1980. Domestic saving and international capital flows. Economic Journal, 90(358): 314-329.Available at:
https://doi.org/10.2307/2231790.
Asian Journal of Economics and Empirical Research, 2018, 5(2): 147-154
154
Harrod, R.F., 1939. An essay in dynamic theory. Economic Journal, 49(193): 14-33.Available at: https://doi.org/10.2307/2225181. Im, K.S., M.H. Pesaran and Y. Shin, 2003. Testing for unit roots in heterogeneous panels. Journal of Econometrics, 115(1): 53-74.Available
at: https://doi.org/10.1016/s0304-4076(03)00092-7. Jangili, R., 2011. Causal relationship between saving, investment and economic growth for India, what does the relation imply? Munich
Personal RePEc Archive Paper No. 40002. Johansen, S., 1988. Statistical analysis of co-integration vectors. Journal of Economic Dynamic and Control, 2(2-3): 231-254. Kao, C., 1999. Spurious regression and residual-based tests for co integration in panel data. Journal of Econometrics, 90(1): 1–44.Available at:
https://doi.org/10.1016/s0304-4076(98)00023-2. Kao, C. and M.H. Chiang, 2000. On the estimation and inference of a co integrated regression in panel data. Advances in Econometrics, 15:
179-222. Levin, A., C.F. Lin and C.S. Shu, 2002. Unit root tests in panel data: Asymptotic and finite-sample properties. Journal of Econometrics,
108(1): 1–24.Available at: https://doi.org/10.1016/s0304-4076(01)00098-7. Lewis, W.A., 1955. The theory of economic growth. Homewood, Ill: Irwin. Lucas, J.R.E., 1988. On the mechanics of economic development. Journal of Monetary Economics, 22(1): 3-42. Narayan, P.K., 2005. The saving and investment nexus for China: Evidence from cointegration tests. Applied Economics, 37(17): 1979-
1990.Available at: https://doi.org/10.1080/00036840500278103. Ogbokor, A.C. and A.O. Musilika, 2014. Investigating the Relationship between aggregate savings and Investment in Namibia: A causality
analysis. Research Journal of Finance and Accounting, 5(6). Onafowara, A.O., O. Owoye and F. Huart, 2011. The temporal relationship between saving and investment: Evidence from advanced EU
countries. International Journal of Business and Social Science, 2(2). Pedroni, 1999. Critical values for co integration tests in heterogeneous panels with multiple repressors. Oxford Bulletin of Economics and
Statistics, 61(s1): 653-670.Available at: https://doi.org/10.1111/1468-0084.0610s1653. Pedroni, 2000. Fully modified OLS for heterogeneous co integrated panels. Advances in Econometrics, 15: 93–130.Available at:
https://doi.org/10.1016/s0731-9053(00)15004-2. Pedroni, P., 2004. Panel cointegration: Asymptotic and finite sample properties of pooled time series tests with an application to the PPP
hypothesis. Econometric Theory, 20(3): 597-625.Available at: https://doi.org/10.1017/s0266466604203073. Pelgrin, F. and S. Schich, 2014. National saving-investment dynamics and international capital mobility. Ramakrishna, G. and S.V. Rao, 2012. The long run relationship between savings and investment in Ethiopia: A cointegration and ECM
approach. Developing Country Studies, 2(4): 1-7. Romer, P.M., 1986. Increasing returns and long-run growth. Journal of Political Economy, 94(5): 1002-1037.Available at:
https://doi.org/10.1086/261420. Schmidt, M.B., 2003. Savings and investment in Australia. Applied Economics, 35(1): 99-106.Available at:
https://doi.org/10.1080/0003684022000015928. Sims, C.A., 1980. Macroeconomics and reality. Econometrica, 48(1): 1-48. Solow, R.M., 1956. A contribution to the theory of economic growth. Quarterly Journal of Economics, 70(1): 65-94. Swan, T.W., 1956. Economic growth and capital accumulation. Economic Record, 32(2): 334-361. Tesar, L.L., 1991. Savings, investment and international capital flows. Journal of International Economics, 31(1-2): 55-78.Available at:
https://doi.org/10.1016/0022-1996(91)90056-c. Tsoukis, C. and A. Alyousha, 2001. The Feldstein-Horioka puzzle, saving-investment causality and international financial market
integration. Journal of Economic Integration, 16(2): 262-277.Available at: https://doi.org/10.11130/jei.2001.16.2.262. Ucan, O., 2014. The determinants of investment: A panel data analysis of G7 countries. European Scientific Journal, 10(7). World Bank Group, 2015. World development indicators 2015. World Bank Publications.
Asian Online Journal Publishing Group is not responsible or answerable for any loss, damage or liability, etc. caused in relation to/arising out of the use of the content. Any queries should be directed to the corresponding author of the article.
Related Documents


![Should We Use the Sample? Analyzing Datasets Sampled …callan/Papers/tweb15-YazheWang.pdfsurveillance [Sofean and Smith 2012], and popular trend detection [Mathioudakis and Koudas](https://static.cupdf.com/doc/110x72/5ed36a2cc2fb686a33539514/should-we-use-the-sample-analyzing-datasets-sampled-callanpaperstweb15-surveillance.jpg)