1 Analyzing Reliability and Validity in Outcomes Assessment (Part 1) Robert Lingard and Deborah K. van Alphen California State University, Northridge

Welcome message from author
This document is posted to help you gain knowledge. Please leave a comment to let me know what you think about it! Share it to your friends and learn new things together.
Transcript

1
Analyzing Reliability and Validity in
Outcomes Assessment
(Part 1)
Robert Lingard and Deborah K. van Alphen
California State University, Northridge

Overview
Introduction
Fundamental Concepts
Group Problem
Statistical Preliminaries
Software Tools
Probability
Inferential Statistics
Hypothesis Testing
Summary
April 15 - 17, 2010 2 Lingard & van Alphen

Introduction – Basic Questions
How can we make assessment easier?
Minimize the effort required to collect data
How can we design an assessment to
provide useful information?
Use tools to evaluate the approach
How can we learn more from the
assessment results we obtain?
Use tools to interpret quantitative data
April 15 - 17, 2010 3 Lingard & van Alphen

Making Assessment Easier
Depend on assessments at the
College or University level.
Assess existing student work rather
than creating or acquiring separate
instruments.
Measure only a sample of the
population to be assessed.
April 15 - 17, 2010 4 Lingard & van Alphen

Designing Assessments to Produce
Useful Information
How should the students or student work
to be measured be selected?
Is the assessment approach stable and
consistent?
Does the assessment instrument
measure what is intended to be
assessed?
April 15 - 17, 2010 5 Lingard & van Alphen

Learning More from Assessment
Results
Was the sample used representative
and large enough?
Were the instrument and process
utilized dependable?
Were the results obtained meaningful?
Is a difference between two results
significant?
April 15 - 17, 2010 6 Lingard & van Alphen
Fundamental Concepts
Sampling
Reliability
Validity
Correlation
April 15 - 17, 2010 7 Lingard & van Alphen

8
Definition of Terms Related to
Sampling
Data: Observations (test scores, survey responses) that have been collected
Population: Complete collection of all elements to be studied (e.g., all students in the program being assessed)
Sample: Subset of elements selected from a population
Parameter: A numerical measurement of a population
Statistic: A numerical measurement describing some characteristic of a sample
April 15 - 17, 2010 8 Lingard & van Alphen

9
Sampling Example
There are 1000 students in our program,
and we want to study certain
achievements of these students. A subset
of 100 students is selected for
measurements.
Population = 1000 students
Sample = 100 students
Data = 100 achievement measurements
April 15 - 17, 2010 9 Lingard & van Alphen

10
Methods of Sample Selection
Probability Sampling: The sample is representative of the population
Non-Probability Sampling: The sample may or may not represent the population
April 15 - 17, 2010 10 Lingard & van Alphen

Probability Samples
Random sample: Each member of a population
has an equal chance of being selected.
Stratified random sample: The population is
divided into sub-groups (e.g., male and female)
and a random sample from each sub-group is
selected.
Cluster sample: The population is divided into
clusters and a random sample of clusters is
selected.
April 15 - 17, 2010 11 Lingard & van Alphen

Non-Probability Samples
Convenience sample: The sample that is
easily available at the time.
Network sample: The sample is constructed
by finding members of the population
through the contacts of a known member.
Quota sample: The sample takes available
subjects, but it attempts to ensure inclusion
of representatives from certain elements of
the population.
April 15 - 17, 2010 12 Lingard & van Alphen

Problems with Sampling
The sample may not be representative
of the population.
The sample may be too small to
provide valid results.
It may be difficult to obtain the desired
sample.
April 15 - 17, 2010 13 Lingard & van Alphen

Reliability and Validity
Reliability refers to the stability,
repeatability, and consistency of an
assessment instrument. (i.e., how good are
the operational metrics and the
measurement data).
Validity refers to whether the measurement really measures what it was intended to measure (i.e., the extent to which an empirical measure reflects the real meaning of the concept under consideration).
April 15 - 17, 2010 14 Lingard & van Alphen

Reliability
Tests of stability: If an instrument can be
used on the same individual more than once
and achieve the same results, it is stable.
Tests of repeatability: If different observers
using the same instrument report the same
results, the instrument is repeatable.
Tests of internal consistency: If all parts of
the instrument measure the same concept,
it is internally consistent.
April 15 - 17, 2010 15 Lingard & van Alphen

Validity
Self-evident measures: Does the
instrument appear to measure what it is
supposed to measure.
Face validity: “It looks all right on the face of it.”
Content validity: The validity is estimated from a
review of literature on the topic or through
consultation with experts.
April 15 - 17, 2010 16 Lingard & van Alphen
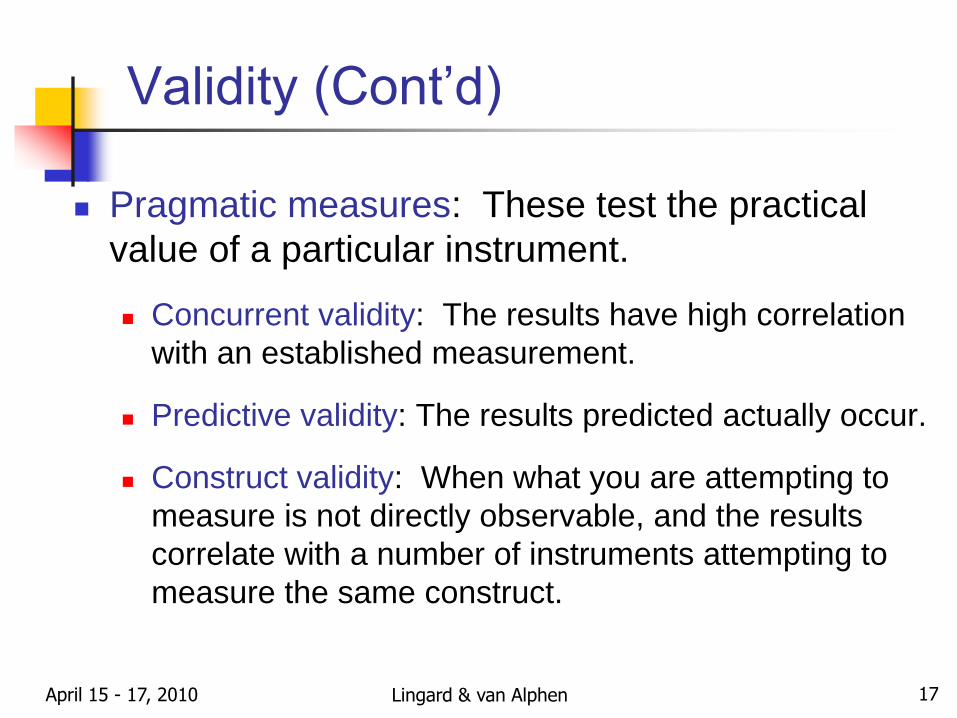
Validity (Cont’d)
Pragmatic measures: These test the practical
value of a particular instrument.
Concurrent validity: The results have high correlation
with an established measurement.
Predictive validity: The results predicted actually occur.
Construct validity: When what you are attempting to
measure is not directly observable, and the results
correlate with a number of instruments attempting to
measure the same construct.
April 15 - 17, 2010 17 Lingard & van Alphen

Reliability and Validity
Reliable but
not valid
Valid but
not reliable
Reliable
& valid
April 15 - 17, 2010 18 Lingard & van Alphen

Correlation
Correlation is probably the most widely used
statistical method to assess relationships
among observational data.
Correlation can show whether and how
strongly two sets of observational data are
related.
Can be used to show reliability or validity by
attempting to correlate the results from
different assessments of the same outcome.
April 15 - 17, 2010 19 Lingard & van Alphen

Example Correlation
0
2
4
6
8
10
12
6 7 8 9 10 11 12
WP
E S
co
re
Department Writing Assessment
April 15 - 17, 2010 20 Lingard & van Alphen

Group Problem
Assume your goal is to assess the written
communication skills of students in your
program. (Assume the number of students
in the program is large and that you already
have a rubric to use in assessing student
writing.)
Working with your group devise an approach
to accomplish this task.
April 15 - 17, 2010 21 Lingard & van Alphen
Group Problem (Cont’d)
Specifically, who would you assess and what student produced work items would you evaluate, i.e., how would you construct an appropriate sample of students (or student work) to assess?
Identify any concerns or potential difficulties with your plan, including issues of reliability or validity.
What questions are you likely to have regarding the interpretation of results once the assessment is completed?
April 15 - 17, 2010 22 Lingard & van Alphen
Objective of This Presentation
Show how statistical analysis can be
used to:
Simplify assessment using sampling
Measure reliability of assessment
instruments and approaches
Measure validity of assessment results
Quantify program improvements through
comparison of assessment results
April 15 - 17, 2010 23 Lingard & van Alphen

Basic Statistical Concepts
Central tendency for data
Frequency distribution of data
Variation among data
April 15 - 17, 2010 24 Lingard & van Alphen

Measure of Central Tendency:
Mean
n = number of observations in a sample
x1, x2, …, xn denotes these n observations
, the sample mean, is the most common
measure of center
(a statistic) is the arithmetic mean of the n
observations:
µ represents the population mean, a parameter
x
xi
i 1
n
n
x
x
April 15 - 17, 2010 25 Lingard & van Alphen
Frequency Distribution of Data
The tabulation of raw data obtained
by dividing the data into groups of
some size and computing the
number of data elements falling
within each pair of group boundaries
April 15 - 17, 2010 26 Lingard & van Alphen
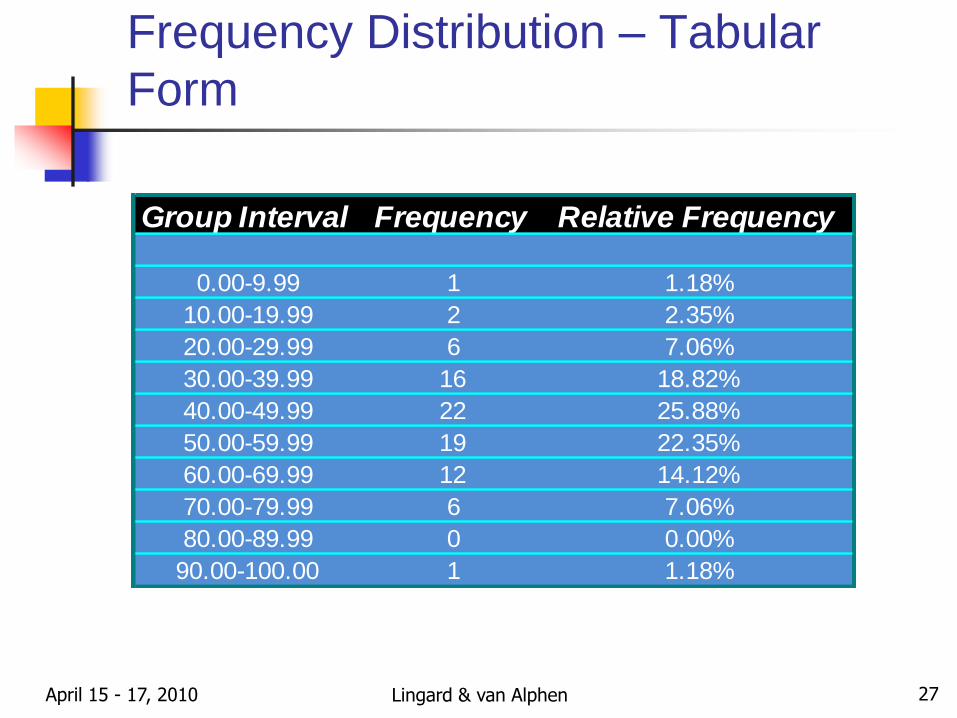
Frequency Distribution – Tabular
Form
Group Interval Frequency Relative Frequency
0.00-9.99 1 1.18%
10.00-19.99 2 2.35%
20.00-29.99 6 7.06%
30.00-39.99 16 18.82%
40.00-49.99 22 25.88%
50.00-59.99 19 22.35%
60.00-69.99 12 14.12%
70.00-79.99 6 7.06%
80.00-89.99 0 0.00%
90.00-100.00 1 1.18%
April 15 - 17, 2010 27 Lingard & van Alphen

Histogram
A histogram is a graphical display of statistical information that uses rectangles to show the frequency of data items in successive numerical intervals of equal size. In the most common form of histogram, the independent variable is plotted along the horizontal axis and the dependent variable is plotted along the vertical axis.
April 15 - 17, 2010 28 Lingard & van Alphen
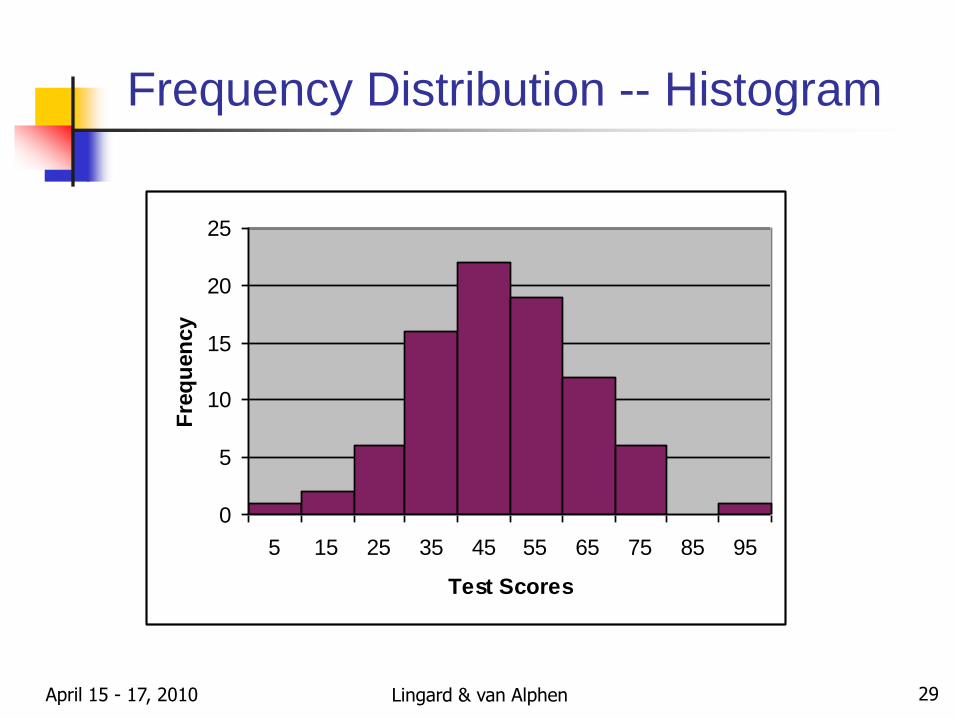
Frequency Distribution -- Histogram
0
5
10
15
20
25
5 15 25 35 45 55 65 75 85 95
Test Scores
Fre
qu
en
cy
April 15 - 17, 2010 29 Lingard & van Alphen

Variation among Data
The following three sets of
data have a mean of 10:
{10, 10, 10}
{5, 10, 15}
{0, 10, 20}
A numerical measure of their variation is needed to describe the
data.
The most commonly used measures of data variation are:
Range
Variance
Standard Deviation
April 15 - 17, 2010 30 Lingard & van Alphen

Measures of Variation: Variance
Sample of size n: x1, x2, …, xn
One measure of positive variation is
Definition of sample variance
(sample size = n):
Definition of population variance
(population size = N):
xi x2
s2
xi x2
i 1
n
n 1
2
xi
2
i 1
N
N
April 15 - 17, 2010 31 Lingard & van Alphen

Measures of Variation: Standard
Deviation
Sample Standard Deviation:
Population Standard Deviation:
The units of standard deviation are the same as the units of the
observations
s s2
xi x2
i 1
n
n 1
2
xi
2
i 1
n
n
April 15 - 17, 2010 32 Lingard & van Alphen

The following data sets each have a mean of 10.
Measures of Variation: Variance and
Standard Deviation
Data Set Variance Standard Deviation
10, 10, 10 (0+0+0)/2 = 0 0
5, 10, 15 (25 + 0 + 25)/2 = 25 5
0, 10, 20 (100 + 0 + 100)/2 = 100 10
Good measure of
variation
April 15 - 17, 2010 33 Lingard & van Alphen

34
Analyzing Reliability and Validity in
Outcomes Assessment
(Part 2)
Robert Lingard and Deborah K. van Alphen
California State University, Northridge

Lingard & van Alphen April 15 - 17, 2010 35
Overview – Part 2
Statistics
Descriptive Inferential
Software Perspective
& Assessment Applications
Lingard & van Alphen April 15 - 17, 2010 36
Software Tools for Statistical Analysis
MATLAB, with the Statistics Toolbox
“MATrix LABoratory,” produced by The Mathworks, Inc.
Complete package includes many math functions, visualization
tools, and special-purpose toolboxes
Excel, with the Add-In: Analysis Toolpak
Part of Microsoft Office Suite
Other choices: Minitab, SPSS, Mathematica, …

Lingard & van Alphen April 15 - 17, 2010 37 37
Using MATLAB to Generate a Histogram
>> centers = 0 : 10; % bin centers at 0, 1, …, 10
>> hist(datlarge, centers)
- Constructs a histogram with bin centers specified in the vector
centers
0 1 2 3 4 5 6 7 8 9 100
5
10
15
20
25Histogram for "datlarge"
Scores
Fre
quen
cies
Set of 95 scores,
ranging from 1 to 10

Lingard & van Alphen April 15 - 17, 2010 38 38
Using MATLAB to Calculate
the Means and Standard Deviations
>> mean(datlarge)
ans =
5.9895
>> std(datlarge) % use for sample data
ans =
1.9433
>> mle(datlarge) % use for mean and st. dev. of population data
ans =
5.9895 1.9331
0 1 2 3 4 5 6 7 8 9 100
5
10
15
20
25Histogram for "datlarge"
Scores
Fre
quen
cies

Lingard & van Alphen April 15 - 17, 2010 39
Samples of students’ writing were
scored by two evaluators, using
the same rubric, with scores from
one evaluator in set “dat”, and
scores from the other in set “dat2”
Scatter plot: scores given to
each sampled student by the two
evaluators.
Correlating the scores:
>> R = corrcoef(dat,dat2)
R =
1.0000 0.9331
0.9331 1.0000
Correlation coefficient of .93 between the two
data sets is an indicator of the pair-wise
reliability of the data from the two evaluators.
Assessment Situation
Reliability of Subjective Performance Data
0 2 4 6 8 100
20
40
60
80
100
Scores, datS
core
s, d
at2
Scatter Plot
(6, 4) (Eval. #1)

Lingard & van Alphen April 15 - 17, 2010 40
A sample of students have scores
in set “dat” on one test (assumed
to be valid), and scores in set
“dat2” on another test measuring
the same learning outcome.
Scatter plot: scores obtained by
each sampled student on the 2
tests
Correlating the scores:
>> R = corrcoef(dat,dat2)
R =
1.0000 0.9331
0.9331 1.0000
Correlation coefficient of .93 between
the two data sets is an indicator of
the validity the results in dat2.
Assessment Situation
Validity of Test Results
0 2 4 6 8 100
20
40
60
80
100
Scores, datS
core
s, d
at2
Scatter Plot
(6, 4) (valid)

Lingard & van Alphen April 15 - 17, 2010 41
Overview
Statistics
Descriptive Inferential
Probability

Lingard & van Alphen April 15 - 17, 2010 42
Random Variables (RV’s)
Intuitive Definition: A random variable is a variable whose value is
determined by the outcome of an experiment.
Often denoted by a capital bold letter, say X
Example:
The scores on an embedded assessment test question

Lingard & van Alphen April 15 - 17, 2010 43
Probability - Notation
Notation: P(….) denotes the probability of the event described in the
parentheses
Example
If X is the RV denoting the scores on an embedded assessment test
question
P(X > 8) denotes the probability of a student obtaining a score
greater than 8

Lingard & van Alphen April 15 - 17, 2010 44
Probability Density Functions
The probability density function (pdf), f(x), for a random variable X
gives the spread of probability on the real number line. Thus,
Since the total probability is always 1, the area under the pdf is 1.
b
a
dx)x(f)ba(P X (area under the pdf between a & b)
Example:
P(1 < X < 2)
-4 -2 0 2 4
f(x)

Lingard & van Alphen April 15 - 17, 2010 45
Gaussian Random Variables
Definition: Random variable X is Gaussian (or Normal), with mean
and variance 2, if its probability density function is:
2
2
2 2
)x(exp
2
1)x(f
“Bell-shaped
curve”
-4 -2 0 2 40
0.1
0.2
0.3
0.4
0.5
x
f(x)
Mean: = 0;
Standard
Deviation: = 1
Lingard & van Alphen April 15 - 17, 2010 46
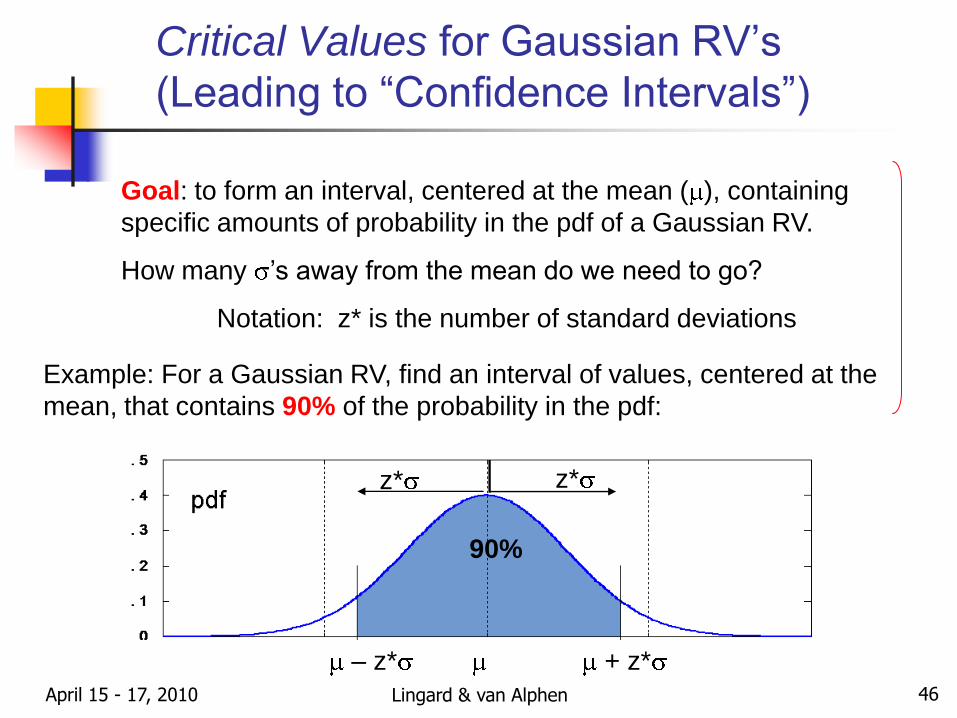
Critical Values for Gaussian RV’s
(Leading to “Confidence Intervals”)
Goal: to form an interval, centered at the mean ( ), containing
specific amounts of probability in the pdf of a Gaussian RV.
How many ’s away from the mean do we need to go?
Notation: z* is the number of standard deviations
Example: For a Gaussian RV, find an interval of values, centered at the
mean, that contains 90% of the probability in the pdf:
90%
– z* + z*
z*z*

Lingard & van Alphen April 15 - 17, 2010 47
Critical Values for Gaussian RV’s
-4 -2 0 2 40
0.1
0.2
0.3
0.4
0.5
90%
-1.645 + 1.645
Claim:
The number z* = 1.645 is the critical value required to contain 90%
of the probability.
For all Gaussian RV’s, 90% of the probability is contained within
a distance of 1.645 standard deviations from the mean.
– 1.645 + 1.645
Lingard & van Alphen April 15 - 17, 2010 48
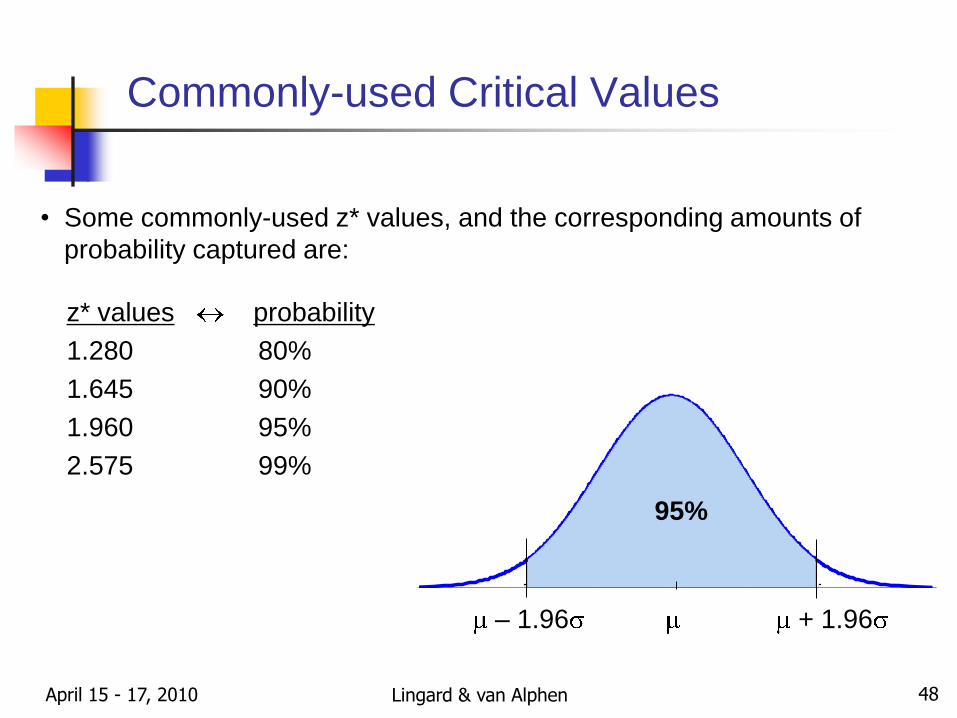
Commonly-used Critical Values
• Some commonly-used z* values, and the corresponding amounts of
probability captured are:
z* values probability
1.280 80%
1.645 90%
1.960 95%
2.575 99%
-4 -3 -2 -1 0 1 2 3 40
0.05
0.1
0.15
0.2
0.25
0.3
0.35
0.4
0.45
0.5
95%
– 1.96 + 1.96

Lingard & van Alphen April 15 - 17, 2010 49
Inferential Statistics
Statistics
Descriptive Inferential
Parameter
Estimation
Hypothesis
Testing
Given:
Random samples of data
Sample statistics: mean, median,
…
Goal:
Determine population parameters:
mean, median, …
Quantify the confidence we
have in the estimates
Formulate hypotheses to
interpret the population data
Lingard & van Alphen April 15 - 17, 2010 50
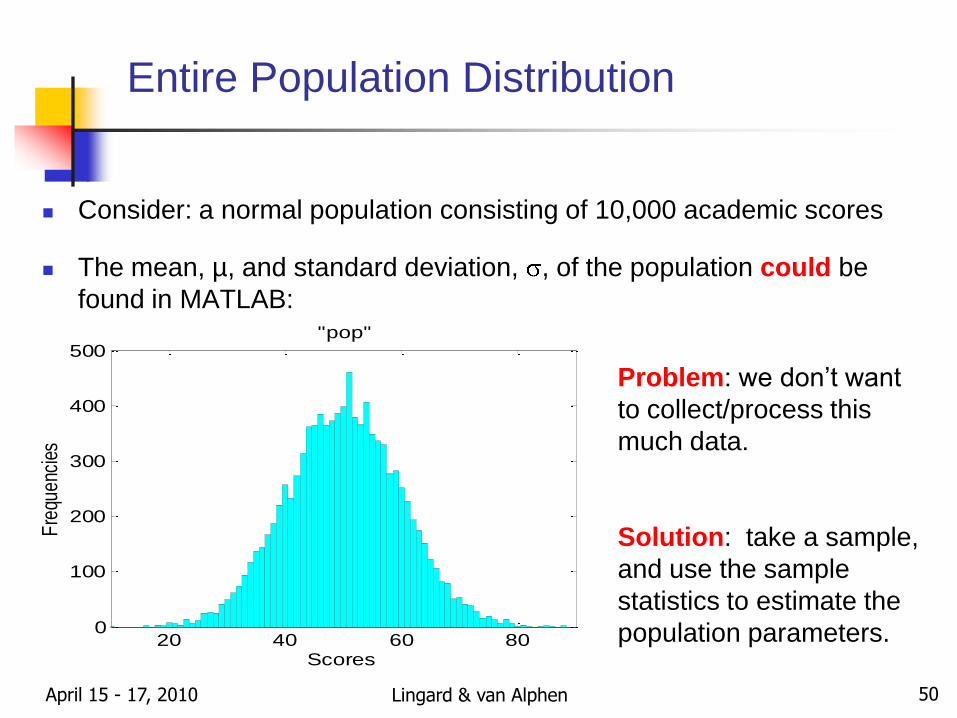
Entire Population Distribution
Consider: a normal population consisting of 10,000 academic scores
The mean, µ, and standard deviation, , of the population could be
found in MATLAB:
20 40 60 800
100
200
300
400
500
Scores
Fre
quen
cies
"pop"
Problem: we don’t want
to collect/process this
much data.
Solution: take a sample,
and use the sample
statistics to estimate the
population parameters.

Lingard & van Alphen April 15 - 17, 2010 51
Point Estimates & Confidence Intervals
Each sample statistic is a point estimate of the corresponding
population parameter.
A confidence intervals
quantify our level of confidence or belief in the point estimates;
show an interval of probable values for the population parameter;
indicate the precision of the point estimate.
( )
( ) x
Wide confidence
interval
x
Narrow confidence
interval

Lingard & van Alphen April 15 - 17, 2010 52
Confidence Intervals and Levels
Confidence level, %: A measure of the degree of reliability of the
confidence interval
A confidence level of 95% implies that 95% of all samples (taken
from the population) would produce an interval that includes the
population parameter being estimated
Intuitively: the higher the confidence level, the more likely that the
population parameter lies within the interval.

Lingard & van Alphen April 15 - 17, 2010 53
Example: Meaning of the 95% Confidence
Interval About the Sample Mean
Suppose that we take multiple samples from the population, and
obtain the sample mean and standard deviation for each.
Example: take 100 samples, each of size 100, from the population “pop”
Sample 1: Calculate sample mean , sample st. dev. s1
…
Sample 100: Calculate sample mean , sample st. dev. s100
Calculate the 95% confidence interval for each of the 100 sample
means; and
Plot one horizontal line for each confidence interval (and thus for
each sample)
1x
100x
53

Lingard & van Alphen April 15 - 17, 2010 54
The Meaning of a Confidence Interval
Population
Sample #100, n = 100
Normal
10,000 Scores
Mean: = 50.04
S.D.: = 10.01
0 20 40 60 80 1000
5
10
15
20
x = 49.55
s = 9.44
Sample #1, n = 100
…
x = 49.47
s = 10.08

Lingard & van Alphen April 15 - 17, 2010 55
95% Confidence Intervals (CI) About the
Mean for Data: “pop”
95 out of 100
confidence
intervals include
the population
mean, µ =
50.04
1st sample:
x = 49.55
CI = (47.7, 51.4)

Lingard & van Alphen April 15 - 17, 2010 56
Finding a Confidence Interval for the Mean
For populations with:
normal distributions; or
non-normal distributions with large sample size (n ≥ 30)
Finding the 95% Confidence Interval for the Mean
For a given sample of size n:
Compute x and s
Determine the 95% confidence interval using the equations for the
endpoints in (*) above
n/sx 1.96 n/sx 1.96
( ) x
(*)
Lingard & van Alphen April 15 - 17, 2010 57
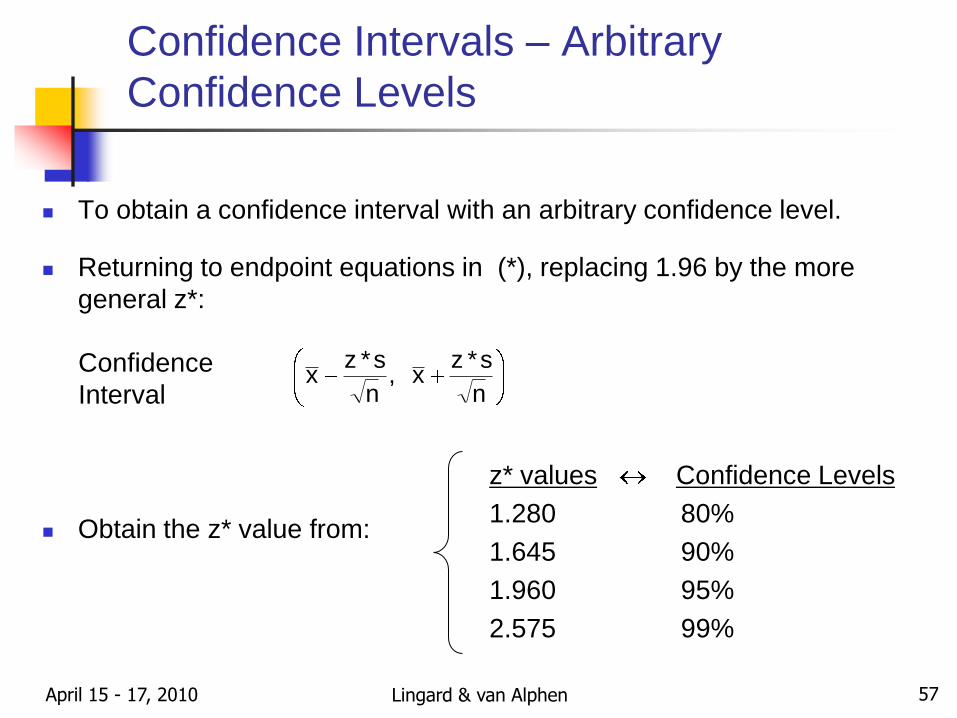
Confidence Intervals – Arbitrary
Confidence Levels
To obtain a confidence interval with an arbitrary confidence level.
Returning to endpoint equations in (*), replacing 1.96 by the more
general z*:
Obtain the z* value from:
n
s*zx,
n
s*zxConfidence
Interval
z* values Confidence Levels
1.280 80%
1.645 90%
1.960 95%
2.575 99%
Lingard & van Alphen April 15 - 17, 2010 58
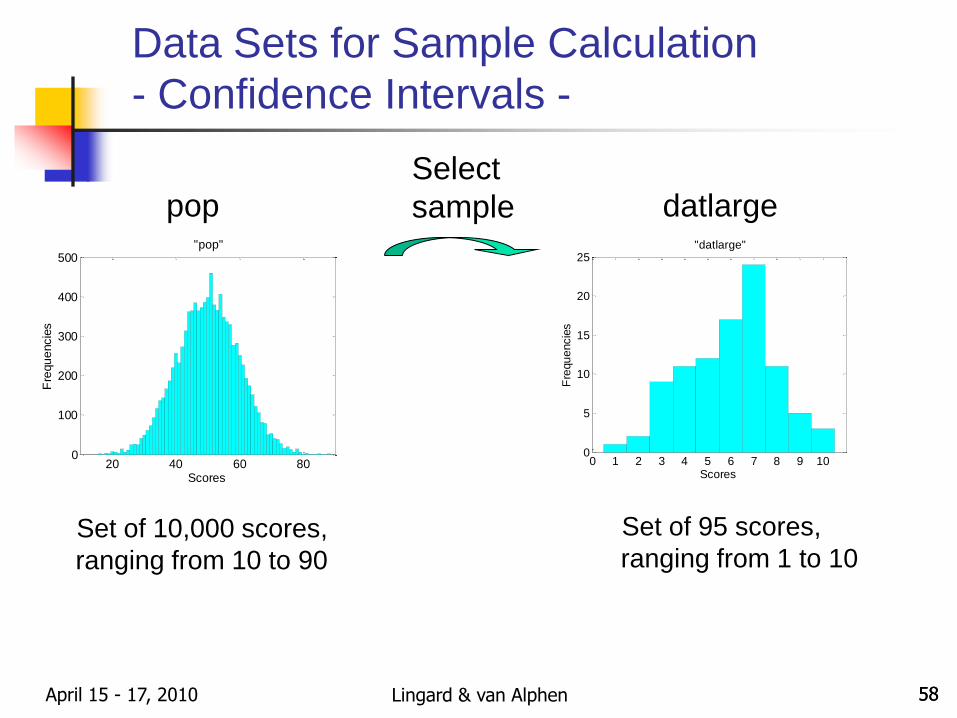
Data Sets for Sample Calculation
- Confidence Intervals -
Set of 10,000 scores,
ranging from 10 to 90
20 40 60 800
100
200
300
400
500
Scores
Fre
qu
encie
s
"pop"
0 1 2 3 4 5 6 7 8 9 100
5
10
15
20
25
Scores
Fre
qu
encie
s
"datlarge"
pop datlarge
Set of 95 scores,
ranging from 1 to 10
Select
sample
58

Lingard & van Alphen April 15 - 17, 2010 59
MATLAB Example: 95% Confidence
Intervals for datlarge
The normfit MATLAB command finds the sample mean and sample
standard deviation, and the 95% confidence interval about the mean.
[xbar, s, xbarci] = normfit(datlarge)
xbar = sample mean (5.99)
s = sample standard deviation (1.94)
xbarci = confidence interval for sample mean: (5.59, 6.39)
5.59 5.99 6.39
95% Confidence
Interval for mean:

Lingard & van Alphen April 15 - 17, 2010 60
Confidence Interval: Effect of Sample Size
Let B be a bound on the “acceptable” estimation error – i.e., on the
acceptable difference between the sample mean and the population
mean.
To ensure that: for (Conf. Level)% of the samples, the difference
between the sample mean and population mean is no bigger than B:
the required sample size is:
2
B
s*zn
(use the z* associated with
the desired confidence level)

Lingard & van Alphen April 15 - 17, 2010 61
Example: Selecting Sample Size
(Based on data: ‘’pop”)
Suppose that we want a 95% confidence that our estimate of the mean
population score is within 2 points of the true mean population score
Calculate n with: s = 10, B = 2, z* = 1.96
Problem: s, the sample standard deviation is not available until the
sample is selected.
Alternative (Rule of Thumb): Divide the range (largest possible value
minus smallest possible value) by 4, for a conservative estimate of s
(usually too large)
97n04.962
10*96.1
B
s*zn
22
Lingard & van Alphen April 15 - 17, 2010
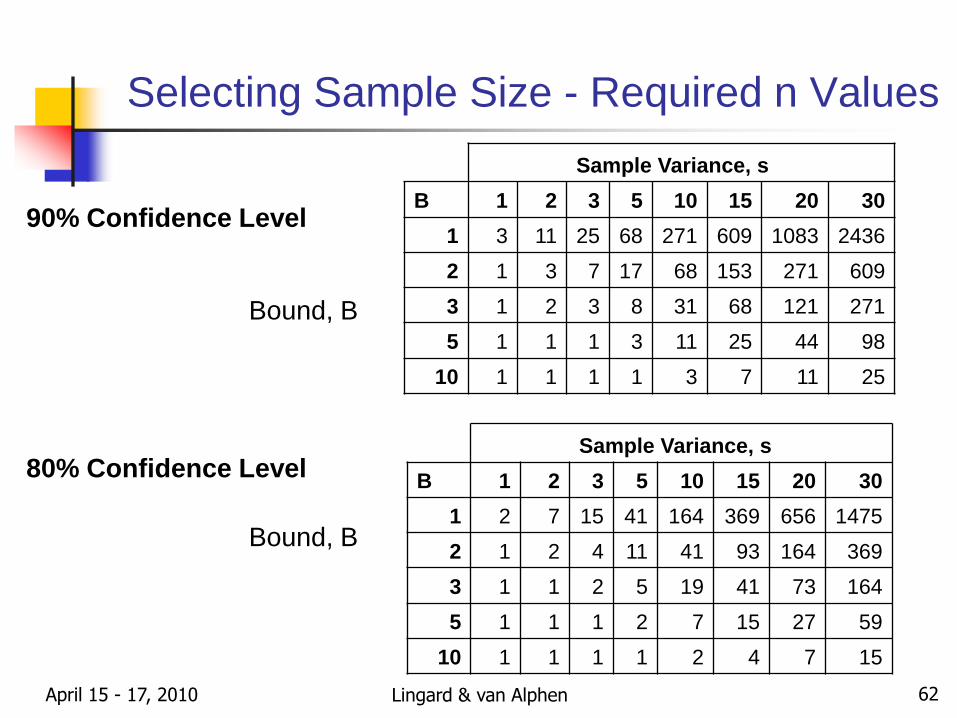
Selecting Sample Size - Required n Values
Bound, B
90% Confidence Level
Bound, B
80% Confidence Level
Sample Variance, s
B 1 2 3 5 10 15 20 30
1 3 11 25 68 271 609 1083 2436
2 1 3 7 17 68 153 271 609
3 1 2 3 8 31 68 121 271
5 1 1 1 3 11 25 44 98
10 1 1 1 1 3 7 11 25
Sample Variance, s
B 1 2 3 5 10 15 20 30
1 2 7 15 41 164 369 656 1475
2 1 2 4 11 41 93 164 369
3 1 1 2 5 19 41 73 164
5 1 1 1 2 7 15 27 59
10 1 1 1 1 2 4 7 15
62
Lingard & van Alphen April 15 - 17, 2010 63
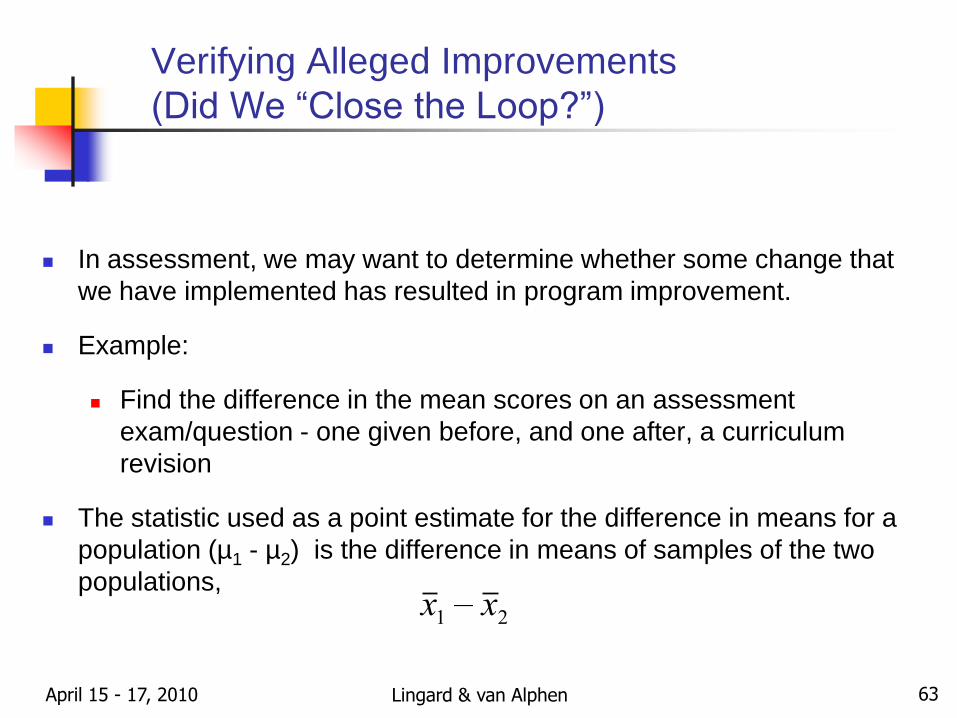
Verifying Alleged Improvements
(Did We “Close the Loop?”)
In assessment, we may want to determine whether some change that
we have implemented has resulted in program improvement.
Example:
Find the difference in the mean scores on an assessment
exam/question - one given before, and one after, a curriculum
revision
The statistic used as a point estimate for the difference in means for a
population (µ1 - µ2) is the difference in means of samples of the two
populations,
x1 x2
Lingard & van Alphen April 15 - 17, 2010 64
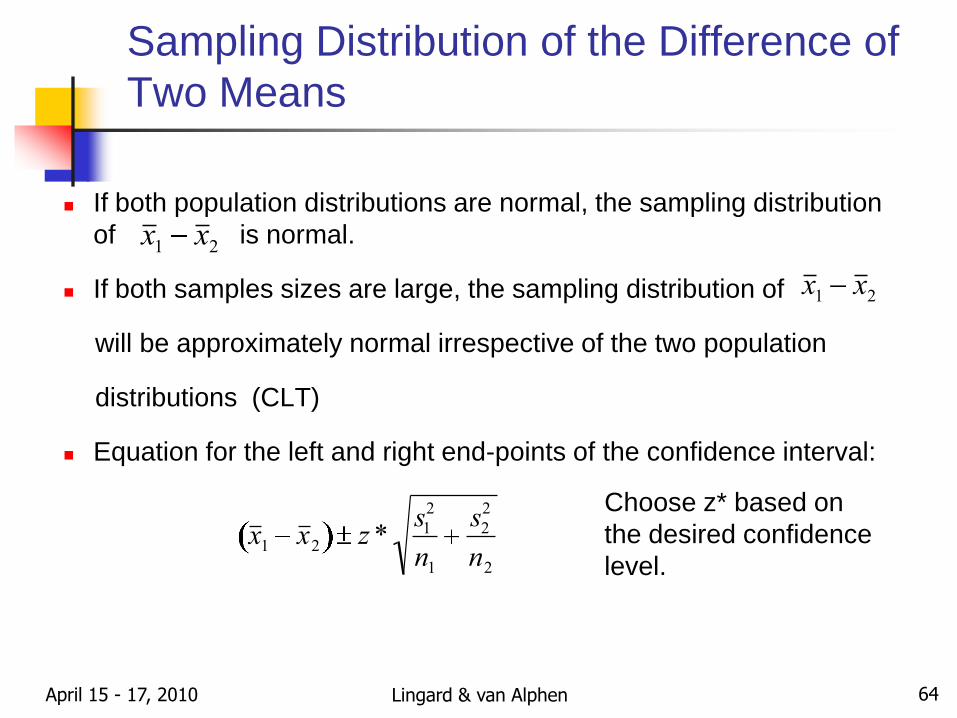
Sampling Distribution of the Difference of
Two Means
If both population distributions are normal, the sampling distribution
of is normal.
If both samples sizes are large, the sampling distribution of
will be approximately normal irrespective of the two population
distributions (CLT)
Equation for the left and right end-points of the confidence interval:
x1 x2
x1 x2
x 1 x 2 z *s1
2
n1
s2
2
n2
Choose z* based on
the desired confidence
level.

Lingard & van Alphen April 15 - 17, 2010 65
0 1 2 3 4 5 6 7 8 9 100
5
10
15
20
25
Scores
Fre
qu
encie
s
Suppose that we want to estimate the difference between two sets of
test scores – one given before a curriculum change, and one after.
Find the point estimate for the difference, and a 99% confidence
interval.
Example: Verifying Alleged Improvements
0 1 2 3 4 5 6 7 8 9 100
5
10
15
20
25
Scores
Fre
qu
encie
s
"datlarge"datlarge: before datlarge2: after
x2: 7.16
s2: 1.81
x1: 5.99
s1: 1.94

Lingard & van Alphen April 15 - 17, 2010 66
Repeating:
Point Estimate for 2 – 1:
Confidence Interval:
Example: Verifying Alleged Improvement
x2: 7.16
s2: 1.81
x1: 5.99
s1: 1.94
17.199.516.7xx 12
x 1 x 2 z *s1
2
n1
s2
2
n2
7009.17.1
.47 1.17 1.87
99% Confidence
Interval for difference
in means:
99% confident: “after”
– “before” = pos.
“after” > “before” improvement
Lingard & van Alphen April 15 - 17, 2010 67
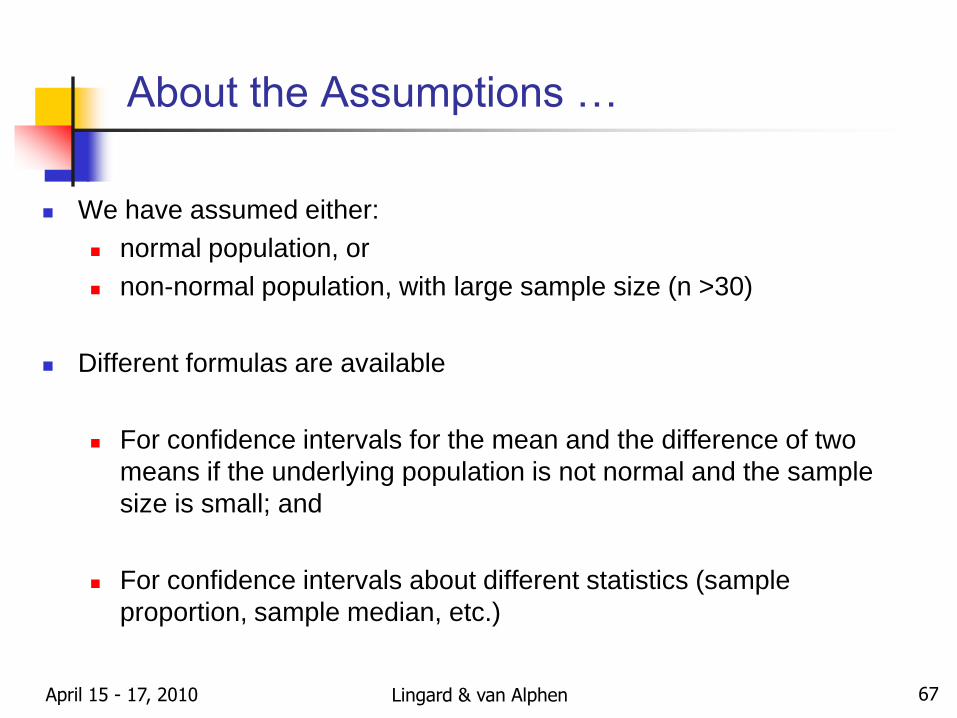
About the Assumptions …
We have assumed either:
normal population, or
non-normal population, with large sample size (n >30)
Different formulas are available
For confidence intervals for the mean and the difference of two
means if the underlying population is not normal and the sample
size is small; and
For confidence intervals about different statistics (sample
proportion, sample median, etc.)

Lingard & van Alphen April 15 - 17, 2010 68
Overview of Statistics
Statistics
Descriptive Inferential
Parameter
Estimation
Hypothesis
Testing
Lingard & van Alphen April 15 - 17, 2010 69
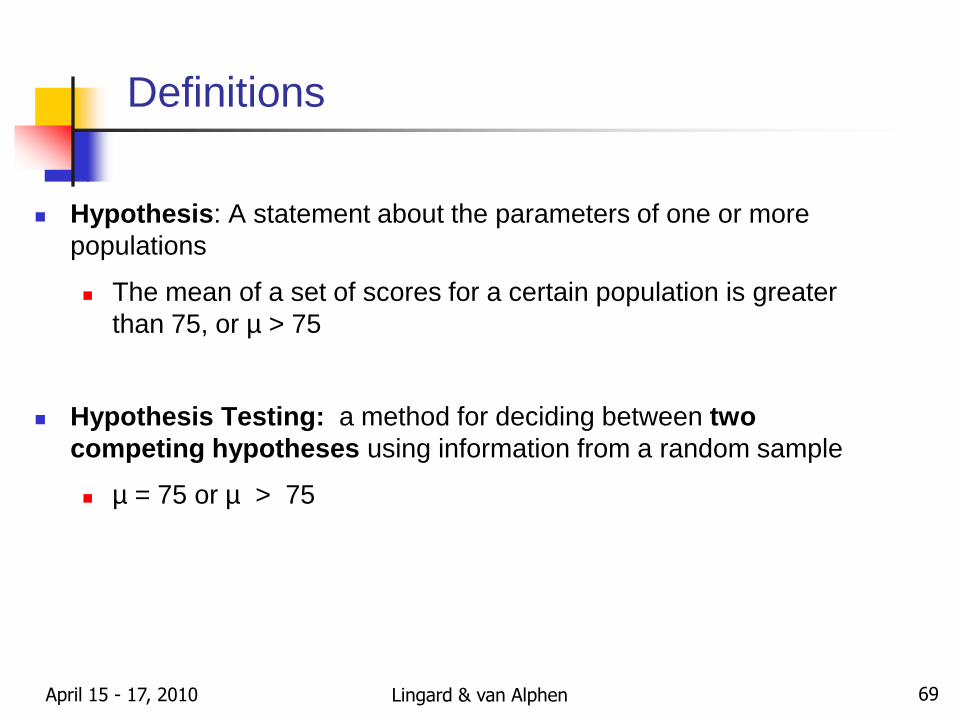
Definitions
Hypothesis: A statement about the parameters of one or more
populations
The mean of a set of scores for a certain population is greater
than 75, or µ > 75
Hypothesis Testing: a method for deciding between two
competing hypotheses using information from a random sample
µ = 75 or µ > 75

Lingard & van Alphen April 15 - 17, 2010 70
The Null and Alternative Hypotheses
Null Hypothesis (H0)
Statement that the value of a population parameter is equal to
some claimed value.
Assertion that is initially assumed to be true (based on prior
belief/measurement)
Alternative Hypothesis (Ha)
Statement that the population parameter has a value that differs
from that claimed by the null hypothesis, H0.

Lingard & van Alphen April 15 - 17, 2010 71
Decision Making About the Hypotheses
Decision: to reject or accept H0
If the data is “consistent” with the H0, we conclude H0 is true.
Otherwise: we conclude H0 is false.
The data has to be very inconsistent with H0 (highly unlikely) to
warrant rejecting H0.
Criminal Trial Analogy: H0 - The defendant is innocent.
The jury assumes the defendant is innocent until proven guilty.
The jury rejects H0 only if there is compelling evidence against it.
Lingard & van Alphen April 15 - 17, 2010 72
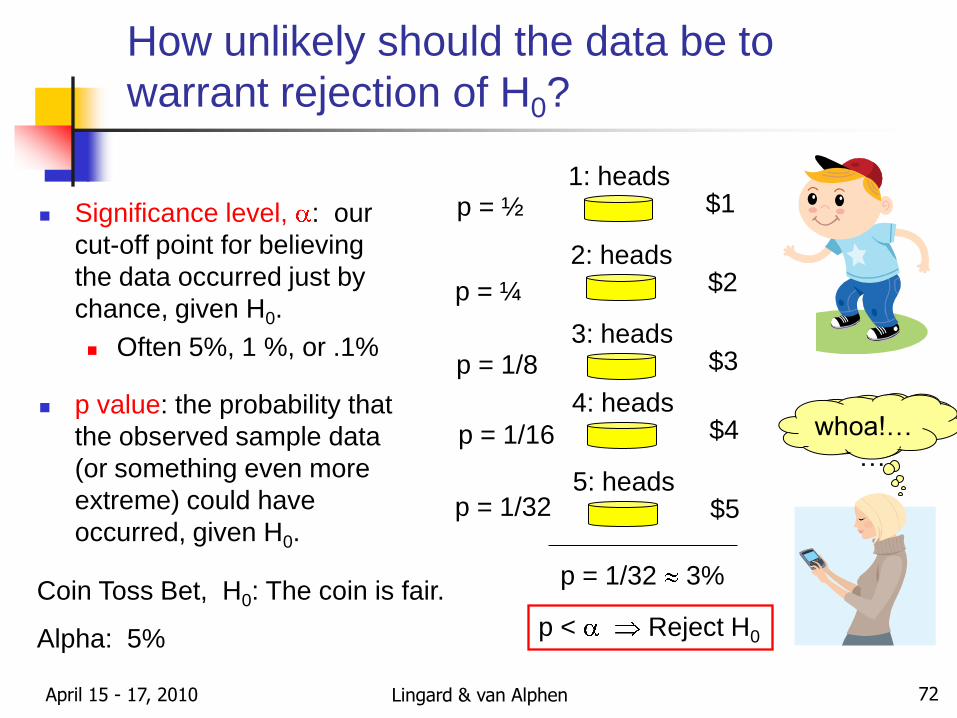
How unlikely should the data be to
warrant rejection of H0?
Significance level, : our
cut-off point for believing
the data occurred just by
chance, given H0.
Often 5%, 1 %, or .1%
p value: the probability that
the observed sample data
(or something even more
extreme) could have
occurred, given H0.
1: heads $1
2: heads $2
3: heads $3
4: heads $4
5: heads $5
p = 1/32 3%
hmm
…
Coin Toss Bet, H0: The coin is fair.
Alpha: 5%
whoa!…
p < Reject H0
p = ½
p = ¼
p = 1/8
p = 1/16
p = 1/32

Lingard & van Alphen April 15 - 17, 2010 73
Hypothesis Testing in Assessment
Situation: Historically, test scores for a particular learning outcome
indicate = 5. We “improve” the curriculum, and administer a test on
that outcome to a sample of students. We would like to claim that the
score has improved, based on our new test results.
Hypothesis Testing:
H0: = 5; Ha: > 5 (1-tailed test) = .05
0 1 2 3 4 5 6 7 8 9 100
5
10
15
20
25
Scores
Fre
qu
encie
s
"datlarge"
“New test
data”, datlarge
Set of 95 scores,
ranging from 1 to 10

Lingard & van Alphen April 15 - 17, 2010 74
Hypothesis Testing with MATLAB: ztest
ztest: Performs a hypothesis test on the mean of a normal
population with known variance (or unknown variance if n large)*
[h, p] = ztest(x, m, sigma, alpha, tail)
x = sample of data
m = mean under null hypothesis
sigma = variance of population (use s if sigma unknown)
Tail: ‘right’ for one- sided test (Ha: µ > µo)
Output h = 1 reject H0; Output h = 0 accept H0
Output p: the p-value for our data
* ztest also allows you to output the confidence interval about the population
mean

Lingard & van Alphen April 15 - 17, 2010 75
Hypothesis Testing with MATLAB: ztest
Returning to our example - Hypotheses: H0: = 5; Ha: > 5
= .05
Tail = ‘right’, since Ha: u > 5
MATLAB
>> std(datlarge)
ans =
1.9433
>> [h p] = ztest(datlarge, 5, 1.9433, .05, 'right')
h =
1 ( reject H0; performance did improve)
p =
3.4751e-007 (prob. of sample data occurring if H0 true)
“Significant
improvement”

Lingard & van Alphen April 15 - 17, 2010 76
Statistically Significant Improvements
A result is said to be statistically significant if it is not likely to have
occurred by chance.
Since the p-value of a test is the probability that the data occurred by
chance (given H0), the smaller the p-value, the greater the statistical
significance.
Statistically significant at the 1% Level: The p-value of the data is
less than .01.
small p-value “statistically significance”
Reject H0 if = .01

Lingard & van Alphen April 15 - 17, 2010 77
Summary of Assessment Applications
for Statistics – What Have We Shown?
Use of descriptive statistics and data visualization with histograms
Verification of reliability with
High correlation between 2 sets of scores
Lack of significant difference between 2 sets of scores
Verification of validity with
High correlation between scores obtained from a new instrument
and those from an established standard;
Lack of significant difference between scores obtained from a new
instrument and those from an established standard

Lingard & van Alphen April 15 - 17, 2010 78
Summary of Assessment Applications
for Statistics
Simplifying Program Assessment with Sampling
Choosing an appropriate sample size for estimating the mean
Finding confidence levels for the (point) estimate
Claiming Improvement – estimates of the difference in means
Finding confidence levels for the (point) estimate
Determining whether the difference is significant
Applications discussed in the context of test scores also occur in the
context of surveys
April 15 - 17, 2010 78 Lingard & van Alphen

Lingard & van Alphen April 15 - 17, 2010
Questions??? & Contact Information
Email: [email protected] (Bob Lingard)
[email protected] (Debbie van Alphen)
“Not everything that counts can be counted, and not everything that can be counted counts.”
(Sign hanging in Einstein's office at Princeton)
“98% of all statistics are made up.” ~Author Unknown
79
Related Documents


