Hunger Games: Analyzing Relationships between Food Insecurity and Violence A DISSERTATION SUBMITTED TO THE FACULTY OF THE GRADUATE SCHOOL OF THE UNIVERSITY OF MINNESOTA BY Ore Koren IN PARTIAL FULFILLMENT OF THE REQUIREMENTS FOR THE DEGREE OF Doctor of Philosophy Adviser: John R. Freeman March 2018

Welcome message from author
This document is posted to help you gain knowledge. Please leave a comment to let me know what you think about it! Share it to your friends and learn new things together.
Transcript

Hunger Games:
Analyzing Relationships between Food
Insecurity and Violence
A DISSERTATION SUBMITTED TO THE FACULTY OF THE GRADUATE
SCHOOL OF THE UNIVERSITY OF MINNESOTA BY
Ore Koren
IN PARTIAL FULFILLMENT OF THE REQUIREMENTS
FOR THE DEGREE OF
Doctor of Philosophy
Adviser: John R. Freeman
March 2018

c© 2018 by Ore Koren
All rights reserved

Acknowledgements
The author wishes to thank John Freeman, Benjamin Bagozzi, Anoop Sarbahi,
Terry Roe, Benjamin Valentino, and Marc Bellemare for their invaluable support
and input. Additional thanks go to the United States Institute of Peace and the
Department of Political Science and the University of Minnesota for supporting
the author’s research and international fieldwork, and to the Dickey Center for
International Understanding at Dartmouth College for providing office space and
access to the College’s resources during the final year of writing.
i

Abstract
What impact does food security have on patterns of conflict within developingstates? Does increasing local food security levels exacerbate or help to quell vi-olence in these areas? Answering these questions using both high-resolution andglobal data on conflict and food production, as well as a large variety of analyticaltechniques designed to address the different reciprocal and sequential relationshipsbetween food production and conflict, my dissertation shows that—contrary toprevious expectations—conflict in the developing world is frequently driven, onaverage, by abundance and not by scarcity.
The dissertation establishes two mechanisms to explain this relationship. Thefirst involves conflict designed to secure local food resources for the group’s ownconsumption, and is hence termed “possessive conflict” over food security. Thesecond relates to situations where armed groups use violence to regulate the foodsupply available to other groups by preventing access to and destroying theseresources, and is hence termed “preemptive conflict” over food security.
Original archival evidence from the Mau Mau rebellion in Kenya highlightsthe microlevel importance of controlling food resources and increasing group—andcommunity—resilience; different armed actors might therefore gravitate into food-abundant areas, increasing the frequency of local armed conflict and incidents ofviolence against civilians. This archival evidence also shows that some food re-sources, such as maize and wheat, are much more valuable as an input of rebellion,and are thus more likely to and more frequently attract conflict locally.
Finally, the role of highly nutritional food resources in engendering and perpet-uating rebellions is evaluated on a global sample consisting of all rebellions. Thedata used in these macrolevel cross-national models builds on food types and otherfactors deemed especially salient in the microlevel analyses. Substantively, the ef-fect of nutritious food resources is shown to surpass that of other benchmark ex-planations of conflict such as economic development and political openness. Thesefindings suggest that food resources and their impact on rebellions should be takenseriously by academics and policymakers alike.
ii

Contents
Acknowledgements i
Abstract ii
Contents iii
List of Figures vi
List of Tables viii
Chapter 1: Introduction 1
Motivation . . . . . . . . . . . . . . . . . . . . . . . . . . . . . . . . . . . 1
Food and Rebellion: Concepts and Theory . . . . . . . . . . . . . . . . . 5
Contributions to Extant Research . . . . . . . . . . . . . . . . . . . . . . 18
Theoretical Contributions . . . . . . . . . . . . . . . . . . . . . . . 19
Policy Contributions . . . . . . . . . . . . . . . . . . . . . . . . . . 30
The Plan of the Dissertation . . . . . . . . . . . . . . . . . . . . . . . . . 32
Chapter 2: Food Abundance and Possessive Conflict over Food Se-
curity 37
Food Security and Possessive Conflict Over Time . . . . . . . . . . . . . 40
Background . . . . . . . . . . . . . . . . . . . . . . . . . . . . . . . 40
Food Security Vulnerabilities . . . . . . . . . . . . . . . . . . . . . . 44
Staple Crop Yields and Local Possessive Conflict . . . . . . . . . . . 46
Data and Methods . . . . . . . . . . . . . . . . . . . . . . . . . . . . . . 52
Data . . . . . . . . . . . . . . . . . . . . . . . . . . . . . . . . . . . 52
iii

Identification Strategy . . . . . . . . . . . . . . . . . . . . . . . . . . . . 63
Results . . . . . . . . . . . . . . . . . . . . . . . . . . . . . . . . . . . . . 70
Sensitivity Analyses and Competing Mechanisms . . . . . . . . . . . . . 76
Sensitivity Analyses . . . . . . . . . . . . . . . . . . . . . . . . . . . 76
Competing Mechanisms . . . . . . . . . . . . . . . . . . . . . . . . 80
Discussion and Conclusion . . . . . . . . . . . . . . . . . . . . . . . . . . 91
Chapter 3: Food Security and Strategic Preemptive Conflict 98
Background Discussion . . . . . . . . . . . . . . . . . . . . . . . . . . . . 102
The Model . . . . . . . . . . . . . . . . . . . . . . . . . . . . . . . . . . . 106
Model Primitives . . . . . . . . . . . . . . . . . . . . . . . . . . . . 106
Equilibrium Results . . . . . . . . . . . . . . . . . . . . . . . . . . . 110
Empirical Analysis . . . . . . . . . . . . . . . . . . . . . . . . . . . . . . 116
Model Specification and The Dependent Variable . . . . . . . . . . 118
Regressors . . . . . . . . . . . . . . . . . . . . . . . . . . . . . . . . 122
Results . . . . . . . . . . . . . . . . . . . . . . . . . . . . . . . . . . . . . 126
Main Findings . . . . . . . . . . . . . . . . . . . . . . . . . . . . . . 126
Robustness Analyses . . . . . . . . . . . . . . . . . . . . . . . . . . 129
Predictive Analysis . . . . . . . . . . . . . . . . . . . . . . . . . . . . . . 138
Conclusion . . . . . . . . . . . . . . . . . . . . . . . . . . . . . . . . . . . 142
Chapter 4: Food and Rebellion – Evidence From Micro and Macro
Level Analyses 144
Introduction . . . . . . . . . . . . . . . . . . . . . . . . . . . . . . . . . . 144
The Mau Mau Rebellion: A Disaggregated Analysis . . . . . . . . . . . . 146
Background . . . . . . . . . . . . . . . . . . . . . . . . . . . . . . . 147
Analysis . . . . . . . . . . . . . . . . . . . . . . . . . . . . . . . . . 149
Macrolevel Analysis: Global Evidence on Rebellions, 1961-1989 . . . . . 163
Data . . . . . . . . . . . . . . . . . . . . . . . . . . . . . . . . . . . 163
Results . . . . . . . . . . . . . . . . . . . . . . . . . . . . . . . . . . 173
Sensitivity Analyses . . . . . . . . . . . . . . . . . . . . . . . . . . . . . 178
Instrumental Variable Regression . . . . . . . . . . . . . . . . . . . . . . 182
Identification and Methodology . . . . . . . . . . . . . . . . . . . . 183
iv

Two-Step Probit Analysis Results . . . . . . . . . . . . . . . . . . . 188
Selection Issues . . . . . . . . . . . . . . . . . . . . . . . . . . . . . . . . 191
Conclusion . . . . . . . . . . . . . . . . . . . . . . . . . . . . . . . . . . . 192
Conclusion: Food Insecurity and Violence in the Developing World194
Summary of Findings . . . . . . . . . . . . . . . . . . . . . . . . . . . . . 194
Theoretical and Empirical Contribution . . . . . . . . . . . . . . . . . . 200
Policy Lessons and Broad Implications . . . . . . . . . . . . . . . . . . . 205
Potential Limitations . . . . . . . . . . . . . . . . . . . . . . . . . . . . . 210
Future Directions of Research . . . . . . . . . . . . . . . . . . . . . . . . 212
Appendix 217
Proof of Lemma 1 . . . . . . . . . . . . . . . . . . . . . . . . . . . . . . . 217
Proof of Proposition 1 . . . . . . . . . . . . . . . . . . . . . . . . . . . . 218
Proof of Proposition 2 . . . . . . . . . . . . . . . . . . . . . . . . . . . . 219
Bibliography 220
v

List of Figures
1.1 Civil War and Wheat Yields in Eastern Africa . . . . . . . . . . . . 10
1.2 Conflict and Staple Food Crops (% of 0.5◦ Grid Cell Coverage) in
Africa . . . . . . . . . . . . . . . . . . . . . . . . . . . . . . . . . . 11
1.3 The Natural Resources Availability–Access Spectrum . . . . . . . . 29
2.1 Average levels of violent conflict from ACLED Version 6 dataset by
0.5 ◦ grids (Raleigh et al., 2010). . . . . . . . . . . . . . . . . . . . 58
2.2 Average wheat yields by 0.5 ◦ grids (Ray et al., 2012). . . . . . . . 59
2.3 Average maize yields by 0.5 ◦ grids (Ray et al., 2012). . . . . . . . . 60
2.4 The linear correlation between annual wheat (left) and maize yields
(right) and conflict by 0.5 ◦ grids, 1998-2008. Conflict measures are
presented in natural log form. . . . . . . . . . . . . . . . . . . . . . 62
2.5 Nonparamteric regression plots of annual nighttime light emissions
on violent conflict over the range of (left) wheat yields and (right)
maize yields by grid cell in Africa, 1998-2008. . . . . . . . . . . . . 83
3.1 The Regional Distribution of Attacks by Raiders and Responses by
Defense Forces, 1998-2008 . . . . . . . . . . . . . . . . . . . . . . . 121
3.2 The Distribution of Raider Attacks and Defense Forces Response by
Grid Cell and Cell-Year, 1998-2008 . . . . . . . . . . . . . . . . . . 121
3.3 Predicted Probabilities From Preemptive Conflict . . . . . . . . . . 130
3.4 The Regional Distribution of Attacks by Raiders and Responses by
Defense Forces, 2009-2010 . . . . . . . . . . . . . . . . . . . . . . . 139
3.5 The Forecasting Accuracy of the Statistical Strategic Model on Out-
of-Sample Data, 2009-2010 . . . . . . . . . . . . . . . . . . . . . . . 139
3.6 ROC Curves for Each Stage in The Statistical Strategic Model . . . 140
vi

4.1 Administrative Areas Affected by the Uprising . . . . . . . . . . . . 153
4.2 Maps of Violence, Cropland, and Drought Levels for the Kajido,
Machakos, and Narok Districts . . . . . . . . . . . . . . . . . . . . 155
4.3 Predicted Probability and Violence and Civilian Victimization in
Kajido, Machakos, and Narok . . . . . . . . . . . . . . . . . . . . . 158
4.4 Conflict Duration (Years), 1961-1988 . . . . . . . . . . . . . . . . . 169
4.5 Maize, 1961 – 1988, KG per capita . . . . . . . . . . . . . . . . . . 169
4.6 Percentage Change in the Annual Expected Probability of Rebellion
– Maize (Kg per capita) . . . . . . . . . . . . . . . . . . . . . . . . 177
4.7 Kaplan-Meier Curves of Cox PH Models – Full Model . . . . . . . . 178
vii

List of Tables
1.1 The Global Distribution of Civil War, Atrocities, and Cropland . . 27
2.1 Summaries of conflict events, average wheat, and average maize
yields by grid cell, total values for all countries analyzed, 1998-2008 61
2.2 Summary Statistics of All Variables . . . . . . . . . . . . . . . . . . 64
2.3 OLS regression models for total number of conflict events per grid
cell, 1998-2008 . . . . . . . . . . . . . . . . . . . . . . . . . . . . . . 72
2.4 IV regression models for total number of conflict events per grid cell,
1998-2008 . . . . . . . . . . . . . . . . . . . . . . . . . . . . . . . . 73
2.5 IV regression models for total number of violent events per grid cell,
1998-2008 – first stage estimates . . . . . . . . . . . . . . . . . . . . 76
2.6 IV regression models for total number of conflict events per grid cell,
LTZ simulations . . . . . . . . . . . . . . . . . . . . . . . . . . . . . 78
2.7 GMM IV regression models for total number of conflict events per
grid cell, 1998-2008 . . . . . . . . . . . . . . . . . . . . . . . . . . . 81
2.8 IV regression models for total number of conflict events per grid cell,
additional robustness models . . . . . . . . . . . . . . . . . . . . . . 92
2.9 IV regression models for total number of conflict events per grid cell,
additional robustness models (cont.) . . . . . . . . . . . . . . . . . 93
2.10 IV regression models for total number of conflict events per grid cell,
additional robustness models (cont.) . . . . . . . . . . . . . . . . . 94
2.11 IV regression models for total number of conflict events per grid cell,
additional robustness models (cont.) . . . . . . . . . . . . . . . . . 95
2.12 IV regression models for total number of conflict events per grid cell,
additional robustness models, alternative drought thresholds . . . . 96
viii

3.1 A Partial List of Preemptive Conflicts over Food Security . . . . . . 105
3.2 Summary Statistics of All Variables Used in Chapter 3 (1998-2008) 126
3.3 Player Utilities for Raids and Defenses, 1998-2008 . . . . . . . . . . 127
3.4 Player Utilities for Raids and Defenses, 1998-2008, With Urbanization132
3.5 Player Utilities for Raids and Defenses, 1998-2008, With State Ca-
pacity Indicators . . . . . . . . . . . . . . . . . . . . . . . . . . . . 133
3.6 Player Utilities for Raids and Defenses, 1998-2008, With Spatial Lag
Attacks . . . . . . . . . . . . . . . . . . . . . . . . . . . . . . . . . 134
3.7 Player Utilities for Raids and Defenses, 1998-2008, With Lagged
Independent Variables . . . . . . . . . . . . . . . . . . . . . . . . . 135
3.8 Player Utilities for Raids and Defenses, 1998-2008, With Military
Expenditure . . . . . . . . . . . . . . . . . . . . . . . . . . . . . . . 136
3.9 Player Utilities for Raids and Defenses, 1998-2008, Baseline Model . 137
3.10 Comparison of Prediction Strength, LQRM and Logit Models, 1998-
2008 . . . . . . . . . . . . . . . . . . . . . . . . . . . . . . . . . . . 141
3.11 Comparison of Prediction Strength, LQRM and Logit Models, Out-
of-Sample Data (2009-2010) . . . . . . . . . . . . . . . . . . . . . . 141
4.1 Summary Statistics of Microlevel Analysis Variables . . . . . . . . . 156
4.2 Violent Events in Three Kenyan Districts, 1952-1956 . . . . . . . . 159
4.3 Maize As Total Caloric Intake For Selected Countries∗ . . . . . . . 168
4.4 Summary Statistics of Country Level Variables, 1961–1988 . . . . . 172
4.5 Determinants of Rebellions, 1961-1988 . . . . . . . . . . . . . . . . 176
4.6 Determinants of Rebellions – Sensitivity Analyses . . . . . . . . . . 181
4.7 Determinants of Rebellions – Sensitivity Analyses (Continued) . . . 182
4.8 Determinants of Rebellions, IV Probit Results – Second Stage . . . 190
ix

Chapter 1: Introduction
Motivation
Despite Napoleon’s famous maxim that, “the army marches on its stomach,” con-
flict scholars rarely if ever consider the imperative to secure food resources for mil-
itary operations in their theories. Research on rebellions—civil and anti-colonial
wars—frequently emphasizes issues related to the distribution of natural resources
(Collier and Hoeffler, 1998; Blattman and Miguel, 2010; Buhaug, Gates and Lu-
jala, 2009; Deiwiks, Cederman and Gleditsch, 2012). Yet, this perspective focuses
specifically on lucrative resources such as oil, drugs, or diamonds (Collier and Ho-
effler, 1998; Wood, 2010; Weinstein, 2007) that are very rare, or completely absent
from many conflict-afflicted countries. As a result, later research questioned the
importance of some profitable resources in generating rebellions (Ross, 2004a).
Food, in contrast, is a necessary input of rebellion. While rebel groups can op-
erate without these rare resources, they must guarantee access to food. Because
food is a necessary input, research on conflict largely treats it as constant: groups
must secure food in every rebellion, therefore it should not be treated as a variable
in conflict analysis, especially as proxies such as population densities or geospatial
features already capture some factors affecting food access (Fearon and Laitin,
1

2003; Buhaug, Gates and Lujala, 2009).
In this dissertation, I advocate a different perspective. I argue that securing
food supplies is more challenging than previously thought. I further claim and
show that different types of food support exist, and that the variation between the
food types accessible to armed groups has a strong impact not only on the group’s
ability to physically feed its troops, but also on the latter’s fighting capability and
morale. Groups that can access more nutritious food can feed more troops, and
can also guarantee that these troops’ morale levels are high, which helps the group
to motivate its members to fight toward a common goal. Therefore, more access
to local food resources—especially nutritious, durable staple crops—explains more
variation in the onset, conduct, and outcome of violent conflict than is currently
appreciated.
This perspective centers on the fighting capacity of armed groups, rather than
governments or states, which have been the tenet of some previous prominent
studies. Fearon and Laitin, for instance, test a large number of potential inputs
of conflict, and conclude that “financially, organizationally, and politically weak
central governments render insurgency more feasible and attractive due to weak
local policing or inept and corrupt counterinsurgency practices” (2003, 75-76).
While this is an insightful finding, it is focused on how regime-centric attributes
influence conflict, rather than what inputs are especially important for the groups
themselves. Local food availability is such an input. For example, a close look
at data on total annual production of maize—one of the most important and
prevalent staple crops grown worldwide (Food and Agricultural Organization of
the United Nations, 2013; Oerke and Dehne, 2004)—by country, which are used
in the macrolevel analysis presented in Chapter 4, shows that it positively and
2

considerably correlates (r = 0.227) with the number of years that these countries
experienced rebellions over the Cold War (specifically, 1961–1988) period. For
comparison, over the same period, GDP per capita, a widely-used measure of
state capacity and a strong predictor of a rebellion in Fearon and Laitin (2003),1
shows practically no correlation, with r = 0.078 value.
Qualitative evidence further supports the importance of the role food plays in
conflict, as suggested by these quantitative correlations. For instance, Weinstein
finds that a crucial aspect of the National Resistance Army’s (NRA) success in
Uganda was its ability to effectively organize food contribution from the local pop-
ulation (2007, 175-180). This allowed the NRA to provide credible commitment
to both rebels and civilians, a system that “reduced the potential for corruption
and ensured that the demand for food was not unmanageable” (2007, 179). From
a complementary perspective, research into the motivations of armies to use a
“scorched earth” policy during insurgencies found that states frequently use these
tactics to thwart the ability of rebels to obtain food supplies from the local popu-
lation, as happened, for instance, in Guatemala and Eritrea (Valentino, Huth and
Balch-Lindsay, 2004; Downes, 2008; Valentino, 2004). Even less violent campaigns
that do not involve mass killing still rely on efforts to limit the ability of rebels
to access food resources by better guarding these resources and relocating popula-
tions that might provide food to the rebels, as happened, for instance, in Malaya
(Ramakrishna, 2002) and Uganda (Doom and Vlassenroot, 1999).
The cross-national and anecdotal evidence reported above suggests the exis-
tence of an important pattern of conflict, while the relative rarity of research on
linkages between food and civil war highlights the need for a more systematic anal-
1Referred to as “income per capita” (Fearon and Laitin, 2003, 83).
3

ysis of these features. Why do armed conflicts, civil wars, and rebellions occur and
persist in some countries but not in others? What impact do food resources have
on local and global conflict patterns? In this dissertation, I develop a theory that
answers both questions. The need to sustain a continuous supply of food is per-
haps the most acute aspect of deficiency in logistic support available to both rebel
groups and—frequently—state forces. I suggest that overcoming these deficiencies
and, moreover, securing wide access to nutritious food resources will have a strong
and positive impact, both on the organization’s strength and its troops’ morale.
Regular access to food also allows groups to overcome collective action problems
by providing troops with credible commitment to fight a long war. Troops who
know they will be supported are more motivated to fight (Weinstein, 2007, 174-175;
178-179).
While securing regular access to food resources is a crucial aspect of warfare
in the developing world, the effect of food on conflict begins at the most funda-
mental level, with the behavior of troops, atrocity perpetrators, and even innocent
civilians. As I show in Chapters 2 and 3, locally, food resources generate a large
number of social conflicts, many of which are not part of the standard rebel vs.
government logic; communities living in rural areas where they subside on food
sourced locally must frequently use violence to guarantee their survival. In Chap-
ter 4, I also show that food resources also have a strong effect on the likelihood
of rebellions—such as civil and anti colonial wars and coups d’etat—and conflict
duration, much more so than previously thought. These are the central empirical
finding presented in this dissertation, and a novel contribution to the growing lit-
erature in political science, economics, geography, and environmental science on
relationships between the environment, climate, and war. This dissertation, how-
4

ever, provides much more than just establishing these relationships. It explores
different mechanisms linking food abundance and violence at both the micro- and
macrolevels, and provides new theoretical frameworks and data to stimulate future
research on these issues. In doing so, it also highlights possible means and useful
strategies of conflict mitigation.
Food and Rebellion: Concepts and Theory
In this section, I posit a theory that links (i) access to food resources as a crucial
aspect of warfare with, (ii) armed groups’ strategic behavior during conflict. At
the heart of this theory is the imperative to secure food supplies, a critical input for
warfare. Unlike profit-generating natural resources such as oil and diamonds, which
do not exist in many rebellion-afflicted countries and regions, food is necessary for
all rebel groups to operate. Even if the group has many motivated recruits willing
to fight, without being able to feed these troops, it cannot wage and sustain a long
conflict. Moreover, I further claim that the group’s ability to provide its troops
with regular access to nutritious and durable food resources has a strong positive
effect on the troops’ morale, making them more willing and able to fight a long
rebellion, thus allowing military and rebel leaders to induce compliance from group
members.2
The term “food security” as used in this dissertation thus refers to the ability
of groups, households and individuals to secure adequate levels of food resources
2In the theory of warfare, specifically, developed here, whether food is obtained using coercionor enticement is not pertinent, because the model is agnostic with respect to apportionmentdynamics as highlighted by, e.g., Kalyvas (2006); Wood (2003). Nevertheless, as discussed in thenext section, the focus on food abundance has some important implications for research on thecauses of civilian victimization.
5

for self sustenance (Barrett, 2010; Hendrix and Brinkman, 2013). Correspond-
ingly, “food insecurity” refers to situations where food security levels are low,
inadequate, or unstable, and thus highly susceptible to negative shocks caused
by environmental and political conditions. In these contexts, the amount of food
resources required to guarantee sufficient dietary intake for all individuals in the
region might decrease as a result distributional limitations or production short-
ages (Barrett, 2010). Empirically, this dissertation analyzes variations in food
resources, staple crop yields, and food production to approximate food security
and its effect on different warring groups. These concepts are applied to derive a
better understanding of the strategic motivations of armed actors, and how these
motivations are influenced by variation in food production and resources availabil-
ity. This theoretical framework allows me to construct explanations for violent
conflict that draw on terms and concepts from the food security literature. These
frameworks also mean that the food production indicators used here are derived
based on specific theoretical expectations. These indicators are hence good proxies
for the specific aspects of food security I seek to empirically capture in the different
analyses of local and global conflicts conducted in this dissertation. Importantly,
while the specific mechanisms at play are validated on high-resolution data for
Africa as the world region most susceptible to the effects of climate change and
food insecurity (Food and Agriculture Organization of the United Nations, 2008;
Burke et al., 2009), these microlevel findings are validated on a global sample in
the cross-national macrolevel analysis presented in Chapter 4.
As the reader will be repeatedly reminded in the ensuing chapters, when food is
discussed in the context of conflict in current research, the emphasis is usually on
the labor aspect of food security. Decreases in agricultural output are associated
6

with more labor flexibility, which results in cheaper labor and more recruits being
available to rebels. This approach thus equates conflict with an oversupply of
labor. This is a reasonable argument, and there are several reasons to assume that
it is valid.
First, numerous studies established that lower economic development is a quite
robust indicator of civil war (e.g., Hegre and Sambanis, 2006; Fearon and Laitin,
2003; Blattman and Miguel, 2010). The largest sector in most civil war-afflicted
economies is agriculture (De Soysa et al., 1999). As a result, diminishing agricul-
tural output substantively shrinks the economy, and hence leads to more civil war
(Miguel, Satyanath and Sergenti, 2004; Burke et al., 2009).
Second, lower economic returns in the labor-intensive agricultural sector, often
followed by rising unemployment and lower wages in primarily rural economies,
facilitate rebel recruitment and strengthen civilian support for rebel movements.
Fjelde (2015), for instance, shows that negative changes to the value of local agri-
cultural output, which combines sub-national crop production maps and data on
movements in global agricultural prices, substantially increase the risk of violent
events, presumably as more unemployed labor is available for recruitment.
Third, local shrinkages in food production in countries and regions already
afflicted by conflict are unlikely to be addressed via affective state-level interven-
tions and smoothing mechanisms. As Wischnath and Buhaug (2014) argue, in the
absence of alternative modes of living, people living off the land are forced to pur-
sue unconventional coping strategies when drought strikes or other environmental
conditions severely impact agricultural production. Facing insecure revenue from
agriculture lowers the opportunity cost of joining an ongoing conflict (as well as
criminal behavior and looting more generally). Under these conditions, violent
7

action emerges as a tempting alternative source of income to sustain one’s life and
livelihood.
Despite these important insights, however, the focus on food scarcities alone
falls short of explaining why, as shown below, conflict frequently show a positive
association with food resources (see, also, e.g., Koren and Bagozzi, 2016; Crost and
Felter, 2016). After all, having a higher number of potential recruits at the rebel
group’s disposal means little if the group cannot be certain that these recruits
will become good and effective rebels, let alone be able to physically support
them. Moreover, from an empirical perspective, an important feature of many
of these scarcity-centric explanations is that the data used to support them is
frequently measured at the country or, at best, state/province level (see, e.g., Burke
et al., 2009; Miguel, Satyanath and Sergenti, 2004; Buhaug, 2010; Wischnath and
Buhaug, 2014). Even studies that rely on a higher levels of disaggregation, such as
the 0.5◦ x 0.5◦ grid level, almost exclusively rely on static and general measures
of cropland as “green” areas (e.g., Koren and Bagozzi, 2016; O’Loughlin et al.,
2012), or attempted to coerce such constant measures into being time-varying via
extrapolation, using, for example, global food price (e.g., Fjelde, 2015; Hendrix
and Haggard, 2015).
A I show throughout this dissertation, these empirical choices have important
implications. Indeed, a close examination of data at higher levels of disaggregation
or information on crops that does vary over time suggest a different trend, which
does not support the scarcity-centric argument. For instance, Figure 1.1 plots the
area affected by civil war (operationalized as the number of affected 0.5◦ x 0.5◦
grid cells, or squares of approximately 55km x 55km, which decrease in size as one
moves toward the Poles) with at least 25 combatant casualties (Tollefsen et al.,
8

2012), against the total annual level of wheat yields (operationalized as average,
yearly yield levels by 0.5◦ x 0.5◦ grid cell) (Ray et al., 2012)3 in Eastern Africa, the
world region most heavily analyzed by studies of the climate-conflict nexus (e.g.,
O’Loughlin et al., 2012; Maystadt and Ecker, 2014; Adano et al., 2012; Raleigh and
Kniveton, 2012). Moreover, Figure 1.2 additionally correlates the average levels
of staple food crops, specifically, in Africa,4 with the total frequency of conflict
events by 0.5◦ x 0.5◦ grid cell for 1998-2008 as measured by the Armed Conflict
Event and Location Version 6 Dataset (Raleigh et al., 2010), with 95% confidence
intervals.
As both figures show, at the highly localized level, food crops productivity
exhibits a positive and relatively strong (when observational data are concerned)
correlation with conflict frequency within the world region most closely associated
with scarcity. These correlations might simply be coincidental, but I argue that
they are evidence of a broader trend, which requires different micro- and macrolevel
approaches to understanding the relationship between food and conflict.
An alternative perspective is thus to look at food as a valuable, and indeed a
crucial, natural resource, used to satisfy armed groups’ demand for effective and
dependable troops. This perspective builds on research into the impact of prof-
itable natural resources on conflict. For instance, Collier and Hoeffler argue that,
“the incentive for rebellion conditional upon victory, is determined by the capacity
of a future rebel government to reward its supporters” (1998, 564). Indeed, the
idea that access to natural resources influences rebel groups’ strength and strategic
behavior is firmly established in the extant literature (e.g., Hazen, 2013; Collier
3A more detailed discussion of this variable is provided in Chapter 2.4Measured at the highly disaggregated 0.08◦ x 0.08◦ level, or 1km x 1km at the equator for
the year 2000, and averaged to the 0.5◦ x 0.5◦ level.
9

●
● ●
●
●●
●
●
●
●
●
●
●
●
●
●
●
●
●
●
Conflict and Wheat Yields (Eastern Africa)
200
400
600
800
1000
Are
a (N
o 0.
5 G
rids)
Affl
icte
d by
Civ
il C
onfli
ct
1990 1992 1994 1996 1998 2000 2002 2004 2006 2008
Years
● Civil ConflictTotal Wheat Yield
Figure 1.1: Civil War and Wheat Yields in Eastern Africa
10

● ● ● ●●
●
●
●
●●●●●● ●● ●
●
● ●
●
●
●
● ●●● ●●●● ● ●●
●
● ●●●● ● ●●●●●● ● ●● ●●● ● ● ● ●● ●● ● ●●●●●●●●● ● ●●●● ● ● ●●
●●
● ●●●●●● ●●●● ●●●● ●●
●
●● ●
●
●● ●●●●●●●●●●● ●●●● ● ●● ●●●●
●
●●● ●●●●●●●●●●●●●●● ●● ● ●● ●● ● ●
●
●●● ●●●●●●●●●●●●● ●●● ● ●● ●● ● ●
●
●● ●●●●●● ●●●●●● ●● ● ●● ● ● ●● ●●● ●
● ●
●●●●●●●● ●●
●
● ●●● ● ● ●● ●●●● ●● ● ●
● ●
●
●●●●●●●●●●●●●● ● ●● ● ●
●
●
●
●
●
●
●
●
● ● ● ●●●●●●●●●●●●●●●● ●●
●
● ●● ● ●● ●●
●●
●
●
●
●
●
●●●●●●●●●●●●●●●
●
●● ● ●●● ● ● ●●●●
●●
●
●
●
●
●●●●●●●●●● ●●●●●●●●●● ● ●●●● ● ●●●●●
●
●●
●
●●●●●●●●●●● ●●●●●●●●● ● ● ●●● ● ● ●●●●●● ●●●●●●●●●●●●●●●●●●●● ●● ●
●
● ●
●
● ●
●
●●●● ●●●
●
● ●●●●●●●●●●●●●●●●●● ●● ●●●● ● ● ●●
●
●
●
●●●●
●
● ● ●●●●●● ●●●●●●●●●● ●● ● ●●●● ●●●
●
●
●
●
●
●●●● ●
●
●
● ●●●●●● ●●●●●●●●●● ● ●● ●● ●●● ● ●● ●●● ●
●●● ●
●●●
●
●
● ●●●● ● ●●●●●●●● ●●●●●●●● ●●●●● ●●●
●
●● ● ●●●
●
● ●●
●
●● ●●●●●● ●●●●●● ● ●●●●●●●●●●●●●●●●●●●●●●●●●● ● ● ● ●●●
●
● ●●●● ●●●●●●●● ● ●● ●●●●●●●●●●●●●●●●●●●●●●●●●●●●●● ●● ●●
●
●● ●
●
●●● ● ●● ● ●● ●● ● ●●●● ● ●●●●● ●●●●●●●● ●●●●●●●●●●● ●● ● ● ● ●
●
●●●●●●●●●●●●● ●●
●
● ●●
●
●● ● ●●●●●● ●
●
●●●●●●●●●●●●●●●●●●● ●● ●● ●●●● ●●● ●●●●● ●●● ●●
●
●●●● ●●●●● ● ●● ●●●●●●●●●●●●●●●●●●●●●● ● ● ●
●
●●●●● ●●●●●●●● ●● ● ●●●● ●●●●●●● ● ●●●●●●●●●●●●●●●●●●●●●●●● ●
●
●●● ●
●
●●● ●●●●●●●● ● ● ●●●● ●●●●●● ● ●●●●● ●●●●●●●●●●●●●●●●●● ●
●
● ● ●●●
●
●
●
●●● ●●●●● ●● ● ● ● ●●
●
● ●●●●●● ●●●●●●●●●●●●●●●●●●●●● ●●●
●
● ●
●
●
● ●
●●●●●● ●●●●● ● ● ●●●● ● ●●●●●●● ● ●●●●●●●●●●●●●●●●●●●●●● ● ●●
●
● ●
●
●
●
●
●
●
●
●
● ●●
●
●● ●●●●● ●●●●●●●● ● ●●●●●●●●●●● ●●●●●●●●●●●●● ●● ●
●●
●
●
●●
●
●
●
●
●●
●
●
●● ● ● ●●●● ● ●●●●●● ● ●●●●●● ●●●●●●● ●●●●●●●●●●●●● ●
●
●
●
●
●
●
●
●
●
●
●
●
●●●●●●● ●●●●● ● ●● ●●● ●●●●●●●●● ●●●
●
●●●●●●●●●●● ● ●● ● ●
●
●●
●
●
●
●
●●
●
●
●●
●
●●● ●●●● ●●●● ●
●
● ●●●● ● ●●●● ● ●●●●●●●●●●
●
●
●
●●●●●● ● ●
●
● ●●●
●
●
●
●●
●
●
●
●
●●●
●
●
●
●●● ●●●● ●●●● ●
●
●● ●●●●
● ●●
●●●●
●
●
●
●
●●●
●●
●
●●●
● ●
●
● ●
●
● ●
● ● ●
●
●
●
●
●
●●●
●
●
●
●●●●●●● ●● ● ●●● ●
●
● ●●●● ●●●●● ●
●
●●●●
●
●●●●●●●●●●●● ●● ●●●
●
●●●
●
●
●●
●
●
●
●
●●● ●
●
●●●●●●●●●
●
● ●● ● ●●●●● ●●●● ●● ●●●●●●●●●●●●●●●●●●●●●●
●
●●●● ●●●
●
●
●
●
●
●
●
●
●●● ● ●●●● ●●●
●
● ●●●● ●● ● ● ●● ●● ●●●●● ● ● ●●●●●●●●●●●●●●●●●●●● ●● ● ●●●●●● ●●● ●●
●●
● ●●●
●
● ●
●
●●● ●●●●●
●
●●●●● ●● ● ●●● ●●●● ● ● ●●●●●●●●●●●●●●●●●●● ●● ●● ●●●● ●● ● ●
●
●●● ●●● ●● ● ●
●
●● ●●●
●
●●●●●●●●
●
●● ● ●●●●●● ●●●●●●●●●●●●●●● ●●●●
●
● ●● ●● ●● ●●●●
●
● ●●●●● ●●● ●● ●
●
●●● ●● ●●●
●
●●
●
● ●● ● ●●●● ●●●●●●●● ●●●●●●●●●●●●● ●●● ● ● ●
●
●●● ●●●●● ●● ●●● ●●● ● ● ●●
●
●
●●● ●●
●
●● ●●● ● ● ●●● ●● ●●●● ● ●●●●●●●●●●●●● ●● ● ● ●● ● ●●●●●●● ● ●●●●●●● ●● ●●●
●
●●●● ●● ●●●●● ● ●●● ●●● ●●●●●●● ●●●●●●●●●● ●●●● ●● ● ● ●●●● ● ●● ●● ●●●●●● ● ●
●
● ● ●●●●● ●●● ●●●●● ●●● ● ●●● ●
●
●●●●●●●●●●●●● ●●●
● ●
●● ● ● ●●● ● ● ●●● ● ●●●●● ● ●● ● ●●●● ●● ●●●●● ●●● ●●
●
●●●● ●●●●● ● ●●●●●●●●●●●●●●● ● ●●● ●●
●
●
●●
● ● ●●●● ● ●● ●●●●● ●● ●●● ●●
●
● ● ●●● ●●● ●●●● ●●●●●●● ●●●●●●● ● ●● ●●● ●●● ●● ●●● ●●
●
● ●●● ●●● ●●●●●●● ● ●●●●● ●
●
●● ●● ●●●●●●●●● ●● ● ●●●●●
●
●
● ●● ●●
●
●●● ●●● ● ●●● ● ●
●
● ●●●●●●●● ● ●●
●
●●●● ●●●● ●●●●●●●● ● ●●● ●●●● ●●●●
●
● ● ● ●● ●●● ● ●●●●●
●
●●● ●●●●●● ● ●●● ●●● ●●●● ●● ●●●●●● ●● ●● ●
●
●● ● ● ●● ●● ●● ●● ●●●●●● ●● ● ●● ●●● ● ●● ●●●●●● ●●●●● ●●● ●●●●●● ●●●●● ●●●●●● ● ● ●
●
●● ●● ● ●●●●●●● ● ●● ●● ●●●●●● ●●●●● ●●●● ● ●●●● ●●●● ●●●● ●● ●●● ● ●● ● ●
●●
● ●● ●● ● ● ●●●● ●● ●●●●● ●● ●● ●●●●●● ●●●● ●●● ●●● ● ● ●●● ● ●●●● ●●●
●
● ●●● ●● ● ● ●● ●●●● ●● ●●●●●●● ●●●●●●●
●
● ●● ● ●●●● ●●●● ●● ●● ●●● ● ●● ●●●
●
●
●
●
●
●
●● ●● ●
●
●● ● ●●●●●● ●● ●●● ●●●●●●
●
● ●●
●
●● ●● ●●● ● ●
●
● ●● ●● ●●●●● ●
●
●
●
●
●
●
●●●●● ●●● ●●● ●●●● ●●●●●●● ●● ●●● ●●●●●● ●● ●●
●
● ● ●● ●●
●
●●● ●●●
●
●●●● ●● ● ●●● ●
●
●● ●●● ●●●●●●● ●●● ● ●● ● ●●
●
● ●●● ●
●
●● ●●●● ● ● ●
●
●
●
●
●
●
●
●● ●●● ● ●● ●● ● ●
●
●●●●●●● ●●●● ●●●● ●● ●●● ● ● ●●
● ●
●●●
● ●●
●
●●
●●●●● ● ●●● ●●●●●●●● ● ●● ●
●
● ●●
●
● ●●●● ●●●● ●●● ●●●
●
● ●●●●●●●
●
●
●
●
●
●
●
●●●●
●
● ●● ●●●●● ●●
●
●●●●●● ●●
●
●
●●
●●
●
●
●
● ●●●●●● ●● ●●●
●
●●
●
●●
●
● ● ●●●●
●
●
●
● ●● ●●●●●●●● ●●●● ● ● ●
●
●
● ●●●● ● ● ●●●●● ● ●
●
●●●●●●●●●
●
●
●
●
●
●●
●
●
●
●● ● ●●
●
●●●●●●●●●●●● ● ●● ●
●
●
●
●
●●●
●
●● ●
●●● ●●
●●
●●●●●●
●●●
● ●
●
●
●
●●
●●●
●●
●
● ●●●● ●●●● ●●● ● ●●●●●●● ●●
●
●
●
●●
●
●
●●●●●●●● ●●●●●●
●
●
● ●
● ●● ●●● ●
● ●
●
●
●
●●●●● ● ●●●●
●
●● ● ●●●
●
●
● ●●
●
●
● ●●
●
●
●●●●● ●●●●
●
●● ●●●●●
●
●●●●
●
●●●
●
●
●
●
●
● ●
●
●
●
● ●●●●●
●
●●
●
●●
●
● ●●●●
●●
●
● ●
●●●●
●
●●●●●●●● ●●●
●
● ●●●
●●
●●●
●
●
●
●●
●
●●● ● ●●●● ●
● ●
●●
●
●
●●●● ●●●●
●
●
●
● ●●
●
● ●●●●●●●●● ●●●●●●● ●●●●
●
●
●
●
●
●
●
●●
●
●●
● ●
●
●●●●●● ●●
●
● ● ●● ●
●●
● ●●●● ●●
●
● ●●●●●●
●
●●●●●●●●
●
●●●●● ●●● ●●●●
●
●
●
●
●
●
●
● ●● ● ●●●●●
●
●
●
●
●
● ●● ●
●
● ● ●● ●●● ●●● ●● ●●●
●
●
●
● ● ●●●●●●●●●●●●●●● ●
●
●
●
●●
●
●
●
●
●●●● ● ●●●
●
● ●
●
●
●
●● ●
●
●
●
●●
●
● ●●●●●●●● ● ● ●●●●
●
●●●●●●●●●●●●●
●
●●●● ●
●
●●●
●
●
●
●
●●
●
●●●● ●
●
●
●
●
●
●
●
●● ●●●
●
●
●
●
●● ●●●● ●●●● ● ●●●●●● ● ●
●
●●●●●
●
●
●
●●●●● ● ●●●●●●
●
● ●
●
●
●
●●●●●
●
●
●
●
●
●
●
●
●
● ●● ●●●
●
● ●●●●● ●●●●● ●●●●●● ● ●●●● ●●●●
●
●●●●●●
●
●●●●●
●
●
●
●
●
●
●
●
●●●
●
●
●
●
●●
●●
●
● ●
●
●
● ●
●
●
●
●
●●
●
● ●●●●●●●●● ●● ●● ●●●
●
●●
●●
●
●●●
●
●●●●●
●
●●
●
●●●
●
●
●
● ● ●
●
●
●
●
●
●
●
●
●
●
●
●
●
●
●●
●
●
●
●
●
●
●
●
●●● ●●● ●●●● ●●●● ●●●●●●●
●
●●●●●●
● ●●
●
●●●●●●●●
●
●
●
● ●
●
● ●
●
●
●
●
●
●
●
●●
●
●
●
●
●
●
●●
●
●
●
● ● ●● ●●●●●●●●●●● ●●● ●
●
●●
●
●●●●●● ●●●●●●●●
●
●
●
●●
●
●
● ●
● ●● ● ●
●
●
●
●
●
●
● ●
●
●
●● ● ●●●●
●
●
●
●
●
●
● ●● ●● ●● ●●●●● ●●●● ●●
●
●● ●●●● ●●●●●
●
●●●●●●
●
●
●
●
●
●
● ●
●
●
●
●
●
●
●
● ●
●●●● ●●
●
●●●
●
●
●●
●
●
●● ● ●●●● ●●●●● ●● ●●●●
●
●
●
●●●●● ●●
●
●●●●●●●●●●●●
●
●
●
●
●
●
●
●
●
●
●
●
●
● ●
●
●
●
● ●● ● ●
●
●
●
●
● ●●
●
●
●
● ● ●● ●●●● ●●●●●● ●●●●
●
●
●
●●●●●●●●
●
●●
●●●
●
●
●
●●
●
●
●
●
●
●
●
●
●
●
●
●
●
●
●
●
●
● ●
● ●
●
●
●
●
●
●
●
●
●
●
●
●
●
●
● ●
●
●●●●●●●● ●●●●●●●●
●
● ●●
●
●●
●●● ●●●● ● ●●●
●
●●●●
●
●
●
●●
●
●
●
●
●
●
●●
●
●
●
● ●
● ●
● ●
●
●●
●
●
●
●
●
●●
●
●
●●● ●●●●●●●
●
●●●●● ●●●●●●
●
●
●● ●●●●●●●
●
●
●
●●●
● ●
●
●
●
●
●
●
● ●
●●
●
● ●
●
●
●●●●
●
●
● ●
●
●
●●●
●
●
●●
●●●
●
●
●
●
●
●
●
●
●
●
●
●
● ● ●
●
● ● ●●●●● ●●● ●●●● ●●●
●
●● ● ●
●
●●●●●●●●● ●●●
●
●
●●
● ●
●
● ●
●
●
●
●
●
●
●
●
●
●
●●●●●●● ●
●
●
●
●
●
●
●
●●
●●
●●
●
● ● ●
●
●
●
●●● ●
●
●
●
●
●
●
●
●●
● ●● ● ●●●●● ●●●●●●●●●
●
● ●●● ●●
●
●●
●●
●●● ●●●●
●
●
●
● ●
● ●●
●
●
●●
●
●●●
●
●●●
●●●
●●● ●●● ●●●
●
●●
●
●
●
●
●
●
●
●
●
● ●
●
● ●●●●●
●
● ●●● ● ●●
●
●
● ●
●
●
●
●
●● ●
●
●● ● ●●●
●
●●●●●●●●●● ● ●● ●●●●●●●●●●●
●
●
●
●
●
● ● ●
●
●●● ●●●
●
● ●●
●
● ●●● ●● ●●●●●● ●●●● ● ●
●
●
●●●
●
●
●
●●
● ●●● ● ●●●
●
●
●
● ● ●●● ● ●
●
●
●● ●
●
●
●
●
●
●
●
●
●
●
●
●●● ●●●●● ●●
●
●●●●●●
●
●
● ●
●●●●●●●●●●●● ●●● ● ●●●●●● ●● ●●● ●● ●● ● ●●●● ●●●●● ●
●
● ●● ●●●●
●●
●●
●●
●
●
●
●
●
●
●
●
● ●
●
●●●● ●
● ●
●● ● ●●●
●
●●
●
●
●
●
●
●
●
●
●
●
●
●
●
●
●
●
●●●● ●
●
●●●●
●
●
●
●
●
●
● ●●● ●●●●●●●●●
●
●●● ● ● ● ●●
●
●●
●●
● ● ●●●●● ●●●● ●●●●
●
●●●●● ● ●● ●●●●
●
●
●
●
●
●
●●
●
●
●
●
●
● ●
●
●
●
●
●
●
●●●● ●●
●
● ● ● ●●●● ● ●
●●
● ●●
●
●
●
●
●
●
●
●
●
● ●
●
● ●●●●
●
●
●●●●
●
●●●
●
●● ● ●
●
●● ●●●●●● ● ● ●●●●●
●
●
●●
●
● ● ●●
●
●● ● ●● ● ●
●●
● ●
●
●●●●●●● ●●
●
●●●
●
●●●●
●
●
●●
●
●
●
●
●
●
●
●
●
●●●
●● ●●
● ●
● ●● ●
●
●● ●
● ●
●
●
●
●
●
●
●
● ●●
●
●
●
●●
● ●● ● ● ● ●●●●
●
●
●●●
●
●●●●●●●●● ●●● ●●
●
● ● ●●●
●●
●
●●
●
●● ●● ●● ●● ●
●
● ● ●
●●
●●●●●● ● ●● ●●●●●●●
●●●
●
●
●
●●
●
●●
●
● ●●
●● ●
●
●●
●
●●●● ● ● ●●●
●●
●● ●● ● ●
●
●
● ●
●●
●
●
●●
●
●
●
●
●
●
● ●● ● ●●●●●●●●
●
●
●
● ●●●●●●● ● ● ● ●● ●
● ●
●
●
●
●
●●
●
● ●
●
●●
●
●●●●● ●
●
● ● ●
●
●●●●●●●●●
●
●
●
●●●●●
●
●●●●
●
●
●●
●
●
●●
● ● ● ● ● ●●●●●●●●
●
●●●
●
● ● ●● ●●
●
●
●
●
●
●●●
●
●
●
●
●
●
●
●● ●●
●
● ●●●●●
●
●●●
●
●
●
●● ●●●●● ● ● ●● ● ●
●●
●●
●
●
●
●●
●
● ●
●
●
●●●
●
●
●● ●● ●
●
● ●●●●●●●
●
●●●●●●●
●
●
●
●
●
●●●●
●
●
●●
●
●
●
● ●
●● ● ● ●●● ● ●●● ●●● ●●● ● ● ●●●● ●
●
●
●●
●● ●● ●
●
●
●
●
●
●●
●
● ●●●
●
●● ●●
●●
●●●●● ●●●●●●
●
●● ●●●●● ●
●
●
●
●●
●
●● ●●●
●
●
●
●
●
●● ●● ● ●
●
●●●● ●●●●●●●●●
●
●
●
●
●
●●●●●●●●
●
● ●●
● ●
●
● ●● ● ● ● ●●
●
●●●● ●● ● ●●
●
●
●
● ●●●● ●●●●●● ●●
●
●
●
●
●
●
●● ●
●
●
●● ●●●● ●●●●●●●●●
●
●●●● ● ●●
●
●●● ●
●
● ●●
●
●
●
●
●●
●●
● ●
●
●● ●● ●● ●●
●
●
●
●
●
●
●
●
●●
●●●●
●
●●●●●
●
●●●
●●
●
●
● ●
●
● ●
●●●● ● ●
●
●●
●
●
●
●●●●● ● ●● ●
●
●●●● ●●● ●● ● ●
●
●
●
● ●
●
●
●
●
●●
●
●
●
● ● ●●●●●●●● ●●
●
●●●
●
●
●●
●●●●● ●●●●●●
●●
● ●●●●
●
●● ●
●
● ●● ●●
●
● ●
● ●
● ●●●●
●
● ●
●●
●
●
●
●
●●
●●
●
●
●
●
●●● ●
●●
● ●● ●
●
●●● ● ● ●●●● ●●●●●
●
●● ● ● ●●
●
●●● ●● ●
●
●
● ●
● ● ●● ●●
●●
●
●●
●
●●
●
● ●●●●●●●●●●●●
●
●●●
●
●
●
●● ●● ● ●●● ● ● ●●● ●
●
●●●
●
●●
●●
● ● ●●● ● ●● ●
●
●●
●
●●●●
●
●● ●
●
●●●
●
●●●●●
●
●
●
● ●
●
●● ●● ●●●●●●●● ●●●● ●● ●●●
●
●● ●● ● ●
●
●●● ● ●●● ● ●● ●● ●
●
●●● ● ●●●●
●●●
●
● ●
●●●
●
●● ●● ●●●●●●● ●●● ●●
●
●
●●● ●
●
●●
●●
●● ●● ●
●
●
●
●
● ●● ● ● ● ● ●
●
● ●● ●●●●●●●●●●●●
●
●●●●●●●
●
●● ● ●●●●●● ● ●●●● ●●●● ●●● ●●● ●●● ●●● ● ●
●
● ●● ●●●● ● ●● ● ●● ●
●
●
●
●
●
●●●●●●
●
●
● ●
●●
●●●●●
●
●●●
●
● ●
●
●
●
●
●
●
●
●
● ●
●
●● ●●●
●
●
●
●
● ● ●●●●
●
● ●● ● ● ●●●●
●
●●●
●
●●●●●●
●
●
●
●
●●
●
●
●
●
●●●●●● ●●●●●●●● ●● ●● ●
●
●●● ●● ●● ● ● ●●● ● ●●● ● ● ●● ●●● ●
●●
●
● ● ●
●●
●●
● ●
●
●
●
●
●
●●●
●
●
●●
● ●●●
●
●
● ●
●
●
●●
●
●
●
●
●
●
●
●●
●
●
●
● ● ●
●
●●
●
● ●● ● ●
●
●●●●
●
●● ●●● ●●
●
●
●
●
●
●
●
●●●●●●●●●●●●● ● ●●
●
●
●
● ●●● ● ●
●●
● ●●●●●● ●●● ●
●
●●
● ●
●
● ●
●
●
●
●
●
●
●● ●
●
●●● ●
●
● ●● ●
●
●●
●
●●●
●
●
●
●
●
●
●
●
●
●
●●
●
●● ●●
●
● ●● ●● ● ● ●
●
● ●●● ● ●
●
● ●● ●●●●●●●●
●
●
●
●
●
●
●●●●● ●●● ●●● ●
●
● ●●● ● ●● ●● ● ●● ●●●●
●
● ●
●
●● ●●● ●●●
●
●
●
● ●●●
●
●●● ● ●●●●●● ●●●● ● ●●
●
●
●
●
● ● ●
●
●
●
●
●
● ●
● ●
●
●
●
●●● ●●
●
●●
●
● ●
●●●
●
●●
●
●●● ●●●●●●●●●
●
●
●
●
●●●
●●●●●●● ●●● ●●●● ● ●●●
●
● ●● ●● ●● ●● ●
●
● ●
● ●
●●●
●
● ● ●
●
●●● ●●●●●● ●
●
●●●
●
●●●
●
●●●●●
●
●
● ●
●
●
●
●
●●
●
●
●
● ●●
●
● ● ● ●
●
● ●
●
●
●● ●● ● ●●●● ● ●●● ●●●●●
●
●● ● ● ●●●●
●
●● ●● ●●●● ● ●● ●●●
●
●●●● ● ●● ● ● ●● ● ● ●●●
●
● ● ●●● ●● ● ●●● ●● ● ● ●●●● ●●●● ●●●●●● ●●●
●
●●
●
●
●
●
●
●
●●
●
●
●
●●
●
● ●● ●●●
●●
●●● ●● ● ● ● ● ●●● ●● ● ● ●●●●●●●● ● ● ●●●● ●●●
●
●●● ●● ●● ● ● ●●
●
●●● ● ● ●● ● ●●● ●●
●●
●● ● ● ●
●
● ● ● ● ●●●● ●● ● ●●●●● ●●● ●●● ●●● ● ●● ●● ●●●
●
●
●
●
●●
●
●
●
●●
●●● ● ●●● ●●● ● ●
● ●
●●●
●
●
●
●
● ●
●
● ●●
●●●●●●●●●
●
●
●● ●●●● ● ●
●
●●● ● ●●● ● ●●●
●
● ●●●●● ●● ●●● ● ● ●●●● ● ●● ● ●
●
● ● ●●●●
●
●●
●
● ●●●●●● ●●●●●●●●● ●●● ●
●
● ● ●
●
●
●
●●●●●●●
●
●●●●
●
● ●● ● ●
●
● ● ●●
●
● ● ●●
●
●
●
●●●●●●●● ●
●
●● ●●●●●●●●
●
●
●
●
●●● ●● ●●● ●●●● ● ●●●●● ●
●
●●●
●
● ● ● ●● ● ● ●●●●●●●● ●●●●●●●
●
●●●●●●●●●●●● ●● ●
●
●●●●●●●
●
●●●●● ●●
●
●●
●
●
●
●●●● ● ●
●
●
●●● ● ●●●● ● ●● ●●●●●●● ● ●●●●●
●●
●●●●● ● ●●● ●●●●●●● ●●●●
●
● ● ● ● ● ● ●●●●●●●●●●●●●●●●●●●
●
●●●●●●●●●●●●●●
●
●●
●
●●●●●●●●●●●●●●
●
●
●
●●●● ●●
●
●●● ●●●●●●●● ● ● ●●●●●●● ● ●●●●●●●●● ●●●●● ●● ●●●●
●
●
●
● ●●●●●●●● ●● ●●●●●●●●●●●●●●●●●●●●●●●●●●●●●●●●●●●●●●●
●
●●●●●●●●●●●●●● ●●●●●●●
●●
● ●●●●●●●● ● ●●●●●● ●● ●●●●●●● ●●●●●●●●●●
●
●●●●●
●
● ●●●●●●●●●●●●●●
●
●●●●●●●●●●●●●●●●●●●●●●●●●●●●●●●●●●●●●●●●●●●●●●●●●● ●●●●●●●
●
● ●●●●●●●● ●● ●●●●●●●●●●●●●●●●●●●●●●●●●●●●●
●
●●●●●●●●●●●●●●
●●
●●●●●●●●●●●●●●●●●●●●●●●●●●
●
●●●●●●●●●●
●
●●●●●●●●●●●● ●●●●●●
●
●● ●●●●●●●●●●●●●●●●●●●●●●●●●●●●●●●●●●●●●●●●●●●●●●●●●●●●
●
●●●●●●●●●●●●●●●●●●●●
●
●
●
●●●●●●●●●●●●●●●●●●●●●● ●●●●● ●●●●●●●● ●
●
●
●
●●●●●●●●●●●●●●●●●●●●●●●●●●●●●●●●●●
●
●●●●●●●●●●●
●●
●●●●●●●●●●●●●●●●●●●●●●●●●●●●●●●●●●●●●●●●●●●●● ●● ●●●● ●●●●●
●
●●
●●
●●●●●●●●●●●●●●●●●●●●●●●●●●●●●●●●●●●●●●●●●●●●
●
●●●●●●●●●●●●●●
●
●●●●●●●●●●●●●●●●●●●●●●●●●●●●●●●●●●●●● ●●
●
●●●●●●●● ●●●●●●●●●●●●●●●●●●●●●●●●●●●●●●●●●●●●●●●
●
●●●●●●●●●●●●
●
●●●●●●●●●●●●●●●●●●●●●●●
●
●●●●●●●●●●●●●●●●●●● ●●●●●●●
●
●●●●●● ●
●
●●●●●●●●●●●●●●●●●●●●●●●●●●●●●●●●●●●●●
●
●●●●●●●●●●●●●●●●●●●●●●●●●●●●●●●●
●
●●●●●●●●●●●●●●●●●●
●
●● ●●●●●●●●●●●●●●
●
●●●●●●●●●●●●●●●●●●●●●●●●●●●●●●●●●●
●
●●●●
●
●●●●●●●●●●●●●●●●●●●●●●●●●●
●
●●●●●●●●●●●●●●●●●●●●●●●●●●●●●●●●●●●●●●●●●●●●●●●●●●●●●●●●●●●●●●●●●●●●●●●●●●●●●●●●●●●●●●●●●●●●●●●●●●●●●●●●●●●●●●
●
●
●
●
●●●●●●●●●●●●●●●●●●●●●●●●●●●●●●●●●●●●●●●●●●●●●●●●●●●●●●●●●●●●●●●●●●●●●●●●●●●●●●●●●●●●●●●●●●●●●●●●●●●●●●●
●
●
●
●
●●●●●●●●●●●●●●●●●●●●●●●●●●●●●●●●●●●●●●●●●●●●●●●●●●●●●●●●●●●●●●●●●●●●●●●●●●●●●●●●●●●●●●●●●●●●●●●●●●●●●●●●●●●●
●
●
●
●●●●●●●●●●●●●●●●●●●●●●●●●●●●●●●●●●●●●●●●●●●●●●●●●●●●●●●●●●●●●●●●●●●●●●●●●●●●●●●●●●●●●●●●●●●●●●●●●●●●●●●●●●●●●●●●●●●●●●●●●●●●●●●●●●●●●●●●●●●●●●●●●●●●●●●●●●●●●●●●●●●●●●●●●●●●●●●●●●●●●●●●●●●●●●●●●●●●●●●●●●●●●●●●●●●●●●●●●●●●●●●●●●●●●●●●●●●●●●●●●●●●●●●●●●●●●●●●●●●●●●●●●●●●●●●●●●●●●●●●●●●●●●●●●●●●●●●●●●●●●●●●●●●●●●●●●●●●●●●●●●●●●●●●●●●●●●●
●
●●●●●●●●●●●●●●●●●●●●
●
●●●●●●●●●●●●●●●●●●●●●●●●●●●●●●●●●●●●●●●●●●●●●●●●●●●●●●●●●●●●●●●●●●●●●●●●●●
●
●●●●●●●●●●●●●●●●●●●●●●●●●●●●●●●●●●●●●●●●●●●●●●●●●●●●●●●●●●●●●●●●●●●●●●●●●●●●●●●●●●●●●●●●●●●●●●●●●●●●●●●●●●
●
●●●●●●●●●●●●●●●●●● ●●●●●●●●●●●●●●●●●●●●●●●●●●●●●●●●●●●●●●●●●●●●●●●●●●●●●●●●●●●●●●●●●●●●●●●●●●●●●●●●●●●●●●●●●●●●●●●●●●● ●●●● ●●●●●●●●●●●●●●●●●●●●●●●●●●●●●●●●●●●●●●●●●●●●●●●●●●●●●●●●●●●●●●●●●●●●●●●●●●●●●●●●●●●●●●●●●●●●● ●●●● ●●● ●●●●●●●●●●●●●●●●●●●●●●●●●●●●●●●●●●●●●●●●●●●●●●●●●●●●●●●●●●●●●●●●●●●●●●●●●●●●●●●●●●●●●●●●●●●●● ● ●●●●●● ●
●
●●●●●●●●●●●●●●●●●●●●●●●●●●●●●●●●●●●●●●●●●●●●●●●●●●●●●●●●●● ●●●● ●●●●●●●●●●●●●●●●●●●●●●●●●● ●●●●●●●●
●
●●●●●●●●●●●●●●●●●●●●●●●●●●●●●●●●●●●●●●●●●●●●●●●●●●●●●●●●● ●●●● ●●●●●●●●●●●●●●●●●●●●●●●●●●● ●●●●●●● ●
●
●●●●●
●
●●●●●●●●●●●●●●●●●●●●●●●●●●●●●●
●
●●●●●●●●●●●●●●●●●●●●●●●● ●●●●●●●●●●●●●●●●●●●●●●●●●● ●●●●●●
●
●
●●●●●●●●●●●●●●●●●●●●●●●●●●●●●●●
●
●●●●●●●●●●●●●●●●●●●●●●●●●●●● ●●●●●●●●●●●●●●●●●●●●●●●●●●●●●●●●●
●
●●●●●●
●
●●●●●●●●●●●●●●●●●●●●●●●●●●●●●●●●●●●●●●●●●●●●●●●●●●●●●●●●●●●●●●●●●●●●●●●●●●●●●●●●●●● ●●●●
●
●●●●●●●●●●●●●●●●●●●●●●●●●●●●●●●●●●●●●●●●●●●●●●●●●●●●●●●●●●●●●●●●●●●●●●●●●●●●●●●●●●●●●●●●●●● ●●●●●●●●●●●●●●●●●●●●●●●●●●●●●●●●●●●●●●●●●●●●●●●●●●●●●●●●●●●●● ●●●●●●●●●●●●●●●●●●●●●●●●●●●●● ● ●●●●●●
●
●●● ●●●●●●●●●●●●●●●●●●●●●●●●●●●●●●●●●●●●●●●●●●●●●●●●●●●●●●●●●●●●●●●●●●●●●●●●●●●●●●●●● ●●●●●●●● ● ● ● ●●●●● ● ●●●●●●●●●●●●●●●●●●●●●●●●●●●●●●●●●●●●●●●●●●●●●●●●●●●●●●●●●●●●●●●●●●●●●●●● ● ●
●
●●●●
●
● ● ●● ●●●● ●●●●●●●●
●
●●●●●●●●●●●●●●●●●●●●●●●●●●●●●●●●●●●●●●●●●●●●●●●●●●●●●●●●●●●●● ● ● ● ●
●●●
●●●● ● ● ●● ●●● ●●●●●●●●●●●●●●●●●●●
●
●●●●●●●●●●●●●●●●●●●●●●●●●●●●●●●●●●●●●●●●●●●●●●●● ● ● ● ●
●
●
●●
●
●●● ●
●
●●●●● ●●●●●
●
●●●●●●●●●●●●●●●●
●
●●●●●●●●●●●●●●●●●●●● ●●●●●●●●
●
●●●●●● ●● ●●
●
●● ●● ●●● ●●●●●●●●●●●●●●●●
●●
●●●●●●●●●●●●●●●●●●● ● ●●●
●
●●●●●●●●● ●●●● ●●●●●●●●●●●●●●●●●●●●●●●●●●●●●●●●●●●●●●● ●●●●●●● ●●●●●● ● ●●●●●●●●● ●●●●●●●●●●●●●●●●●●●●●
●
●●●●●●●●●●
●
● ●●
●
●●●● ●●●●●●●●●
●
●●
●
●●●●● ●●●● ●●●●● ●
●
● ● ● ●●●●● ●● ●●●
●
●●●●●
●
●●
●
●●●●●●●●●●●●●● ● ●●●●● ● ●●
● ●
●
●
●
●●
●●●
●
●
●
● ● ●
●
●●●
●
●●●●●● ● ●●● ● ● ● ●●●●
●●
●
●
●
●
●
●●
●
●●●●
●
●
●
●
●
●●●●●●●
●●
●
●
●
●
●
●
●
● ●●
● ●
●
●●
●
● ●●● ● ●● ●●● ●
●
●
●
●
●
●
●●
●
●
● ●
●
●
●● ● ●● ●
●● ●
●
●
●
●●
●
●
●
●
●
● ●
●
● ● ●
●
●●●
●
●●● ● ● ●● ●
Correlation = 0.20
0.00
0.25
0.50
0.75
1.00
0.00 0.25 0.50 0.75 1.00Average Staple Crop Yields
Ave
rage
Num
ber
of C
onfli
cts
Figure 1.2: Conflict and Staple Food Crops (% of 0.5◦ Grid Cell Coverage) inAfrica
and Hoeffler, 1998; Wood, 2010). Previous studies linked natural resources to con-
flict through pathways such as perceived economic injustice (Deiwiks, Cederman
and Gleditsch, 2012) and limitations on access (Hazen, 2013), and argued that or-
ganizational capacities interact with geographic factors to maximize these groups’
ability to fight long conflicts (Buhaug, Gates and Lujala, 2009). Access to these
resources improves the group’s capacity to recruit and support more individuals,
although in doing so leaders might also risk attracting opportunistic, undependable
volunteers (Weinstein, 2005).
A key natural resource, yet one that is practically absent from many of these
studies, is food. If, as Collier and Hoeffler (1998) argue, the incentive for rebellion
is conditional on the probability of victory, then higher access to nutritious food is
practically a prerequisite for victory. Moreover, profitable resources such as oil or
diamonds are not present in a large number of rebellion cases. For instance, within
11

the state-level sample analyzed in Chapter 4, of the 64 countries that experienced
rebellion, 31 did not have any level of, or no information was available on, oil
production. Food resources, in contrast, represent a different category.
For example, in their study of relationships between food and conflict in the
Sahel, Hendrix and Brinkman state that, “[r]ebel movements typically do not grow
their own food and depend on voluntary or coerced contributions from the pop-
ulation” (2013, 4). Somewhat more nebulously, Messer claims that “[t]he exact
sequence by which food insecurity contributes to conflict tends to involve com-
plex factors, including environmental scarcities and identity-based competition for
access to and control over what are perceived to be limited resources. These fac-
tors combine to deepen a sense of unjust deprivation and unfairness” (2009, 18).
Indeed, food is even more important than other natural resources for different
warring factions in developing countries, where logistic support is a rarity, and
frequently does not exist, meaning that forces must rely on food sourced locally
for survival (Kress, 2002; Koren and Bagozzi, 2016; Henk and Rupiya, 2001). The
amount of potential recruits available, a key aspect emphasized in previous studies
(e.g., Fjelde, 2015; Burke et al., 2009; Wischnath and Buhaug, 2014), is irrelevant
if a group lacks the ability to actively recruit and support these individuals. From
this perspective, food abundance corresponds to the availability of ample capital
in regions where measures such as economic production do not adequately capture
true microeconomic incentives or means of wealth.
Broadly, at least three factors distinguish food from other natural resources.
First, food is a compulsory resource. Without food, armies cannot march and
insurgents cannot recruit. Wars cannot be won if access to locally produced food
resources does not exist and persist (Weinstein, 2007). Nor—as I show in Chapters
12

2 and 3—can rebellions be easily quashed if rebel groups can guarantee and protect
local food support points that allow these organizations to operate in different
regions for long periods of time. Sufficient access to locally sourced food is thus
crucial in facilitating the success of a an armed group, even in the case of more
durable foods; the ability of different armed actors to control key food provision
points is paramount. This was recognized by the NRA in Uganda, which aimed to
establish committees in areas of relative food abundance, to guarantee regular flow
of those resources to its members (Weinstein, 2007, 174-175). Similarly, in eastern
India, Communist Naxiliate rebels operate primarily in the agricultural districts of
Chattisgarh, especially Bastar and Dantewada, where rice fields are predominant
(Singh, 2006). And in Iraq, “[t]he jihadist manual The Management of Savagery
(idarat al-tawahhush) that has a cult following among ISIS supporters identifies
access to territories with food production as vital for control of conquered areas”
(Jaafar and Woertz, 2016, 15).
Second, because food is necessary and compulsory, it is also agnostic; the need
to obtain regular food support as a mobile group outweighs whatever particular
motivations, food-related or otherwise, that led a group member to join the group.
Granted, as with other profitable resources, in different regions, civilians might
cite various incentives for joining or supporting different sides, or fighting against
them. In some places, potential recruits might be motivated by “grievances,” for
example, if the government’s response to famine is politicized and relief funds are
diverted. For instance, Hendrix and Brinkman (2013) claim that, in the Sahel,
“food insecurity can be a source of grievances that motivate participation in rebel-
lion” (2013, 2). In other locations, participation might be motivated by “greed,”
for example because recruits seek to consolidate control over a larger share of agri-
13

cultural resources, especially if prices of these resources increase significantly due
to conflict (Crost and Felter, 2016). Nevertheless, once an individual has joined the
group, his or her motivations with respect to food matter less compared with the
need to be fed regularly while participating, which often involves frequently mov-
ing from place to place. This differentiates food from other natural resources. In
the latter case, as Weinstein argues, “resource-rich rebel groups are overwhelmed
by opportunistic joiners” (2005, 605), who share no commitment to the group’s
aims and joined simply to make a profit. In the case of food, however, the original
payoff is not as high (say, a bag of rice vs. revenue from oil or diamonds), and
might not even offset the opportunity costs of joining, while the value of food after
a recruit joins increases substantially due to the fact that these groups are mobile
rather than stationary (Koren and Bagozzi, 2016; Mkandawire, 2002). Eating on
a regular basis is vital, regardless of the value of food outside the group’s context,
and even more so because groups are frequently unable to grow their own food due
to their mobile nature.
Finally, because food is a compulsory and agnostic resource, it is also binding.
Individuals who join the group and fight an ongoing conflict must do what is
expected in order to be fed. Correspondingly, if the troops are not fed, then their
social contract with the group as a whole is undermined. Thus, in addition to its
impact on physical performance, food access has a psychological effect on bringing
group members closer together and increasing their fighting morale. For instance,
the Holy Spirit Movement in Uganda, a precursor of the Lord’s Resistance Army
(LRA), emphasized the role of food as an instrument of group building, instructing
its troops that “you shall not eat food with anybody who has not been sworn in
by the Holy Spirit” (Doom and Vlassenroot, 1999, 18). Indeed, as Boring writes
14

in his study of American troops during the Second World War, physically, for
experienced troops, “pride in the ability to keep going on little, plus realization
of the military necessity of so doing, offsets in considerable degree the tendency
to a lowering morale” (1945, 328). At the same time, however, “[i]f the needs of
troops for water and food are not satisfied, if they are thirsty and hungry, then
morale goes down. Men tend to become irritable and jittery; they are likely to
be aggressive and quarrelsome, projecting their troubles on others, finding fault
where no fault lies ” (1945, 327).
Thus, armed groups are expected to frequently move into—or actively fight
over—areas where more food is accessible in order to possess these resources for
consumption, and possibly to guarantee control over these areas for the long term.
This allows group leaders to ensure their troops are well-fed, and thus an effective
warriors who are bound together to fight toward a common goal. It also gives these
commanders tools to credibly commit to their members that they can fight and win
a long conflict. Because this behavior is concerned primarily with the necessity
to secure food for personal consumption, I term it possessive conflict over food
security. I discuss possessive conflict and its causes in great detail and empirically
illustrate its validity at the highly-localized level in Chapter 2.
The salient role of nutritious food as a morale builder for armed troops, espe-
cially rebels, has not gone unnoticed by counterinsurgency operation commanders.
For instance, the British colonial forces in Malaya (and, as described in great de-
tail in Chapter 4, in Kenya), embarked on food denial campaigns, which involved
relocating particular civilian populations that might provide food to the rebels,
or harvesting crops in areas susceptible to rebel raids. This was done not only to
limit the rebels’ access to food supplies and keep the group’s size small, but also to
15

hurt rebel troops’ morale. In such campaigns, “underlying the food denial concept
was an innate appreciation of terrorist psychological vulnerabilities. Hence food
denial was premised on creating ‘cumulative pressures,’ both mental and physical,
over a period produced by privation, fear, and hopelessness” (Ramakrishna, 2002,
141).
Similarly, in Vietnam, during Operation Ranch Hand, the United States sprayed
herbicides over large sections of South Vietnam and Laos, an effort done, in large
part, to limit the availability of nutritious cereals accessible to the Viet Cong (West-
ing, 1972). In large part, this effort was “directed against rice and other crops as
an important component of the US resource denial programme. Rice was the tar-
get for destruction in their first known herbicide attack in November of 1961, and
rice was the target for destruction in the last US attack, prior to the suspension of
direct US involvement in this manner in early May of 1971” (Westing, 1972, 322).
Like in Malaya, food denial efforts during the Vietnam campaign were intended
to damage the Viet Cong’s morale and fighting capability. For instance, the 1st
Divisional Intelligence Unit of the Australian Task Force concluded in April 1970
that, “[t]he problems caused by hunger or starvation among [enemy] troops in the
field, manifest themselves in almost every conceivable manner resulting ultimately
in an almost complete breakdown in operational effectiveness” (Ross, Hall and
Griffin, 2015, 241). And in Uganda, as part of the government’s campaign against
the LRA, “some 75,000 were forced to move into so-called ‘protected villages,’” in
a “classical counter-insurgency maneuver designed to deny rebels access to food
by scorched-earth tactics” (Doom and Vlassenroot, 1999, 31). As these examples
demonstrate, food binds the group members to each other, and helps to form the
social contract underlying the group’s very existence. Correspondingly, reducing
16

the group’s ability to regularly access nutritious food weakens these binds, and is
hence a powerful counterinsurgency strategy.
These counterinsurgency strategies, while extreme, highlight a second linkage
between food and violence, which relates to the necessity to regulate the amount
of resources accessible to other groups. Moreover, such strategies should not neces-
sarily involve extreme “scorched earth” policies, such as mass killing and the total
destruction of resources; they can simply be focused on controlling specific food
abundant focal points. I accordingly term this interaction preemptive conflict over
food security, and discuss it in great detail and evaluate its validity empirically
at the highly-localized level in Chapter 3. According to this logic, armed groups
might initiate conflict in food abundant areas not (only) to possess these crucial
food resources, but rather to prevent rival groups from gaining access to them.
Like possessive conflict, these preemptive tactics do not have to take place solely
between government and rebel groups. As shown in Table 3.1 in Chapter 3, mili-
tias representing different communities and ethnic groups are also likely to initiate
conflict over cropland or pastureland to prevent rival groups from accessing these
resources, rather than for the purpose of possessing them.
Taking a more holistic (i.e., less “grassroots” oriented) view on conflict, the
three aforementioned aspects of food as a natural resource—that it is compulsory,
agnostic, and binding—make it a crucial element of the group leadership’s capacity
to commit to its members, and vice versa. As illustrated in Chapter 4, which
focuses on how food resources condition rebellions both locally and globally, the
ability to show to its troops that they are fed and can expect to be fed as the
rebellion progresses illustrates the group’s credibility, and hence its ability to (i)
fight a long conflict, and (ii) win it.
17

Moreover, this ability to provide ample food support can have long-term ex-
ternalities in other areas that also increase the group’s credibility. For instance,
UNITA, a former Angolan rebel group, provided its members with levels of suste-
nance that were far more impressive than those allocated to government troops.
By the end of the war, “[i]nsufficient food has lowered morale in many areas, prin-
cipally among the more numerous government forces, some of whom sleep on the
damp ground,” while many UNITA rebels were able to, “live in impressively con-
structed grass thatched houses, retrieve water from a specially designed reservoir,
and have built schools and health posts for their members” (Finkel, 1992, 62).
A strong group can illustrate that its troops are able to work together toward a
common goal as long as all group members (and ideally their families) are taken
care of, which allows such groups to improve their internal cohesion and reduce the
probability of “free-riding” among their members. Overall, these different features
of food in rebellion suggest that conflict patterns should, on average, closely fol-
low access to locally sourced food, with higher access at the local level and higher
availability at the national level translating into more violence.
Contributions to Extant Research
Does the focus on food abundance offers new, relevant insights, or is it simply
stating what was obvious to scholars and military leaders since prehistoric times?
From an alternative perspective, does the emphasis on the role of food abundance
simply sets up a “straw man,” considering that war-prone countries also tend
to suffer from acute scarcity due to both environmental and political reasons,
including conflict (see, e.g., The Economist, 2017)? I believe that the emphasis on
18

food abundance and its relationship to conflict yields new and important insights
into the causes of armed conflict and political violence. This model also has some
important policy implications.
Theoretical Contributions
While relatively little research directly addresses the relationship between food
insecurity and conflict specifically, numerous studies have implied that such a rela-
tionship exists. For instance, in their analysis of the relationship between climate
variability and conflict in Sub-Saharan Africa, Burke et al. find that “[t]emperature
variables are strongly related to conflict incidence over our historical panel (2009,
20670. See also Miguel, Satyanath and Sergenti, 2004; Koubi et al., 2012). They
further hypothesize that, “[t]emperature can affect agricultural yields both through
increases in crop evapotranspiration (and hence heightened water stress in the ab-
sence of irrigation) and through accelerated crop development...reducing African
staple crop yields by 10%–30% per ◦C of warming” (ibid. 20672). Somewhat
more cautiously, O’Loughlin et al. conclude that “[o]ur study and other studies
question the evidence that climatic variability is uniformly driving up the risk of
conflict in sub-Saharan Africa,” while also noting that “the positive association
between instability and temperature may result from the harmful effects of high
temperatures on food products such as maize” (2012, 18347).
While these conclusions are supported by subsequent studies (e.g., Raleigh and
Kniveton, 2012; Hendrix and Salehyan, 2012; Hsiang and Meng, 2014; Reuveny,
2007), other scholars question the validity of these findings and show that the
incidence of conflict is primarily related to political and economic conditions (e.g.,
Buhaug, 2010). In common to all these studies, however, is the insight that a
19

major mechanism by which climate change can increase the likelihood of conflict
is through affecting food supplies.
One important shortcoming of existing research on the relationship between
climate and conflict is that extant studies rarely if ever evaluate the role of medi-
ating factors, or analyze how resource scarcity impacts conflict at the local level
(Theisen, Gleditsch and Buhaug, 2013). To some extant, this gap has been at least
partly filled by a small number of studies that highlight the importance of food
scarcity. By and large, the emphasis of these studies is on the manners in which
improving food security can mitigate conflict. For example, as was noted above,
Hendrix and Brinkman (2013 Brinkman and Hendrix, 2011) claim that in the Sa-
hel, grievances over food motivate some individuals to join rebellions, while food
denial can also be used as a tool for counter-insurgency. The potential pacifying
effects of food security have also not gone unnoticed by senior policy makers. For
instance, the U.S. State Department officially declared in a recent publication that
“pursuing a range of specific initiatives in areas such as food security and global
health that will be essential to the future security and prosperity of nations and
peoples around the globe” (US Department of State, 2010, 33).
While these case-specific studies and policy statements highlight the poten-
tial saliency of the relationship between food resources and violence, little has
been done in the way of examining this relationship systematically across differ-
ent contexts, especially at the highly localized levels. This deficiency is now being
addressed by recent research into the relationship between food import prices and
political stability, especially in developing countries. For instance, when studying
the relationship between food prices and social unrest globally, Bellemare finds that
“rising food prices appear to cause food riots” (2014, 18). Hendrix and Haggard
20

(2015) expand on Bellemare’s study by focusing on the role of political institu-
tions in mitigating the effect of global food prices on instability. They find that,
“[g]lobal food prices are correlated with urban unrest in democracies, but not in
autocracies” because “food policy in democracies is less biased in favor of urban
constituencies” (Hendrix and Haggard, 2015, 145). From a different perspective,
Weinberg and Bakker (2015) utilize domestic food prices to operationalize citizen
wellbeing. The authors find that social unrest is indeed more prevalent during
periods of heightened food prices, with larger price increases being associated with
more pronounced increases in social unrest (Weinberg and Bakker, 2015, 320).
These studies highlight an important mediating factor by which variation in
food production can affect political instability, but they are also limited in two
respects. First, the reliance on food imports may not capture the true effect of
food insecurity in countries and regions where locals must, to a large extent, live
off locally produced food. Second, the focus on the state as the unit of analysis
limits one’s ability to account for global and regional variations that might affect
food security. In this respect, I echo Theisen, Gleditsch and Buhaug’s contention
that “more work needs to be put into the geographical disaggregation of the effects
of climate change since these effects will not follow national boundaries especially
as [a]ctors and agency tend to be vaguely portrayed, or outright ignored, in the
relevant empirical literature” (2013, 621-622).
This dissertation complements these existing studies by focusing on one impor-
tant (mediating) factor, food resources, and the geographic variation of conflict
both cross-nationally and at the very local level. Whereas extant research on food
prices and imports expands our understanding of the relationship between food,
a staple commodity, and political resistance, our understanding of food security’s
21

relationship with violent outcomes such as armed conflict is predominately sub-
sumed under the hypothesized effects of trade and/or climate change. However,
the implications of food insecurity for conflict are not only a feature of climate
change and trade shocks, but also the result of population growth (e.g., Urdal,
2005; Homer-Dixon, 1998), local traditions, global increases in consumption, and
droughts, all of which exhibit significant amounts of variation independently of
climatic factors.
The focus on geographical variation at the highly disaggregated level thus pro-
vides an important complement to existing studies that focus on the nation-state
as the main geographic unit of interest, while the emphasis on local food security
as an independent variable highlights an important, yet understudied, potential
correlate of armed conflict. It is therefore unsurprising that some recent studies
have attempted to dedicate more attention these localized effects (e.g., Koren and
Bagozzi, 2016, 2017; Wischnath and Buhaug, 2014; Fjelde, 2015; O’Loughlin et al.,
2012). These studies, however, suffer from two limitations. From an empirical per-
spective, these analyses tend to favor static or quasi-static (i.e., made to vary
over time by incorporating food prices) measures of cropland as an approximation
of local food availability and access. More importantly, these studies (i) do not
identify and validate specific mechanisms linking food resources to conflict, both
locally and globally, and thus rarely, if ever, (ii) connect their findings to broader
theoretical frameworks on conflict and rebellion.
By theorizing and validating specific mechanisms—namely how the local abun-
dance of food resources generates both possessive and preemptive conflict in high-
access areas—and by creating and validating a broad theoretical framework linking
local interactions over food to global rebellion patterns, this dissertation thus pro-
22

vides an important contribution to the study of violent conflict. The original
high-resolution data used in Chapters 2 and 3 provide an empirical extension to
current research, while the theory developed here can be easily applied to current
dominant theories that seek to understand the causes of rebellions and civil wars.
The focus on food abundance’s role in warfare relates not only to these bodies
of research on intrastate conflict, as well as research on the impact of natural re-
sources on civil war discussed in more detail below (e.g., Bannon and Collier, 2003;
Collier and Hoeffler, 1998; Le Billon, 2001), but also to studies that are focused
on other forms of political violence, such as civilian victimization. Specifically,
“instrumentalist” studies of violence against civilians focus on the motivations of
state, insurgent, rebel, militia, and terror groups to use violence against civil-
ians, and the factors that influence these groups’ tendency to perpetrate atroc-
ities (e.g., Weinstein, 2007; Wood, 2010; Kalyvas, 2006; Hultman, 2007; Fjelde,
2015; Kydd and Walter, 2002). This “instrumentalist” approach emphasizes situa-
tions in which violence is used rationally as a means of generating civilian support
(e.g., Kalyvas, 2006; Balcells, 2010; Raleigh, 2012), consolidating territorial control
(e.g., Valentino, Huth and Balch-Lindsay, 2004), or removing a potential threat
(Valentino, 2004). From this perspective, leaders use violence against civilians
“when they perceive it to be both necessary and effective” (Valentino, 2004, 67).
Some scholars have applied the logic of strategic violence to non-state ac-
tors. Such studies focus on different motivations for violence by non-state ac-
tors, including resource extraction (e.g., Salehyan, Siroky and Wood, 2014; Wood,
2010), “contracting” violence (e.g., Raleigh, 2012; Mitchell, Carey and Butler,
2014; Koren, 2017a), costly signaling and a display of resolve (e.g., Kydd and Wal-
ter, 2002), increasing the costs governments incur from conflict (e.g., Hultman,
23

2007; Koren, 2017b; Wood, 2010), or ethnic motivations (e.g., Fjelde and Hult-
man, 2014). Similar research also linked violence against civilians natural resources
abundance (Azam and Hoeffler, 2002; Esteban, Morelli and Rohner, 2010), and—
more recently—to agricultural resources and food security (Koren and Bagozzi,
2017; Bagozzi, Koren and Mukherjee, 2017).
The focus on food resources and the close associations between locally sourced
food and atrocities helps can also increase our understanding of the causes of
civilian victimization. Many civilian killings during peaceful times might be per-
petrated in food abundant regions by groups seeking to strengthen themselves and
prepare for future conflicts. Koren and Bagozzi (2017), for instance, find that vio-
lence in cropland regions by both state and nonstate groups significantly decreases
compared with non-cropland regions during times of relative peace, because armed
actors have longer time horizons in respect to interaction with the local popula-
tion, and thus prefer a strategy of cooptation. However, this tendency reverses
itself when conflict intensifies. Time horizons in respect to cooperation shrink,
while troops must obtain food for immediate use and the local civilians wish to
renege on previous agreements.
Considering that, according to the food abundance and conflict logic, armed
conflict and violence against combatants are closely related, I incorporate violence
against civilians alongside armed conflict into both the theories developed in the
different substantive chapters, and the empirical analyses conducted therein. I
do recognize, however, that—in respect to food resources—civilian victimization
(during rebellion or otherwise) might arise due to different reasons than those
explaining armed conflict between combatant. Therefore, wherever appropriate,
I make sure to distinguish between different conflict types, as well as between
24

different actor types. Nevertheless, I do believe—and show—that the focus on food
resources and the dynamics of appropriation and preemption can explain a large
number of civilian victimization incidents that current research cannot adequately
explain.
My food-abundance approach to local and global conflict has several implica-
tions to the different bodies of research mentioned above. First, many scholars
emphasize the rural nature of civil war, rebellions, and violence against civilians.
Kalyvas, for instance, contends that, “most civil conflicts are rural wars, fought
primarily in rural areas by predominantly peasant armies” (2004, 2). Yet, as recent
studies show (e.g., Bagozzi, Koren and Mukherjee, 2017; Koren and Bagozzi, 2017;
Anderson, Johnson and Koyama, 2017), armed conflict—and political violence
more broadly—arise not only in rural regions, as many scholars would expect, but
also and specifically in agricultural areas. Indeed, to illustrate this latter point,
Table 1.1 reports the ratio of 0.5◦ grid cells (as discussed above) that annually
experienced (i) civil war with at least 25 combatant deaths observed during the
1990-2008 period (Tollefsen et al., 2012; Gleditsch et al., 2002), and (ii) atrocities
with at least five intentional civilian killings occurring within a 24 hour period ob-
served during the 1995-2008 period (PITF, 2009), to different thresholds of a given
grid cell’s agricultural production, across the entire globe (data from Ramankutty
et al., 2008).5
As Table 1.1 shows, the annual geo-spatial concentration of civil war and atroc-
ities is heavily skewed toward food producing agricultural areas. Cells with any
levels of staple cropland constitute only a little more than half of all annual ter-
5The two periods, 1990-2008 and 1995-2008, respectively, correspond to years where data foreach indicator were available.
25

restrial grid cells (not counting Antarctica and the Arctic), yet they experienced
nearly 90% of all civil wars during the 1990-2008 period, and nearly 100% of all
atrocities against civilians with at least five civilian deaths during the 1995-2008
period. This directed relationship persists as the sample is continuously limited to
higher and higher thresholds of staple cropland as percent of annual cell coverage.
So, for instance, cells in the top 95th percentile of all staple croplands—i.e., where
68.6% or more of the total cell’s area is covered with staple cropland—consist only
a minute portion of all global annual sample cells (2.8%). Yet, these locations and
years experienced nearly one tenth of all civil war events and atrocities against
civilians during the temporal periods of concern. Moreover, a very significant
portion—38.3%—of atrocities against civilians during the period occurred in areas
and years that did not experience active conflict. Considering that the lion share
of political violence analyses discussed above equates civilian victimization with
(civil) war, this observed empirical pattern is puzzling, unless one uses food access
to explain it. These linkages thus strongly suggest that both armed conflict and
violence against civilians are closely linked to food resources and related dynamics.
Another theoretical contribution of a food-abundance approach is in providing
an easily-expendable theoretical framework for analyzing the effect of different
natural resources on conflict. As mentioned above, previous research linked access
to different lucrative resources, such as diamonds and precious ores, to a higher
probability of civil war (e.g., Bannon and Collier, 2003; Cilliers, 2000). From this
perspective, food can be viewed as lying on a spectrum alongside other important
natural resources. Building on research into different “pillars” of food security
Barrett (e.g., 2010) or extant FAO frameworks (Food and Agriculture Organization
26

Tab
le1.
1:T
he
Glo
bal
Dis
trib
uti
onof
Civ
ilW
ar,
Atr
oci
ties
,an
dC
ropla
nd
Ag.
Cel
lsP
ass
ing
Tota
lS
tap
leC
rop
lan
dC
ivil
War
inA
g.
Atr
oci
ties
inA
g.
Th
resh
old
(%T
ota
l)C
over
age
(%)
Are
as,
1990–2008
(%)
Are
as,
1995–2008
(%)
Any
stap
lecr
op
lan
d735,7
20
(56.8
%)
c>
0%
86.6
%96.6
%(o
ut
of
all
terr
estr
ial
cells)
25th
per
centi
lecr
op
cover
age
551,8
00
(42.6
%)
c>
=2.6
%73.7
%89.8
%(o
ut
of
all
crop
lan
dce
lls)
50th
per
centi
lecr
op
cover
age
367,8
60
(28.4
%)
c>
=10.5
%49.5
%69.8
%(o
ut
of
all
crop
lan
dce
lls)
75th
per
centi
lecr
op
cover
age
183,9
40
(14.2
%)
c>
=31.3
%26.7
%39.2
%(o
ut
of
all
crop
lan
dce
lls)
95th
per
centi
lecr
op
cover
age
36,8
00
(2.8
%)
c>
=68.6
%7.5
%9.1
%(o
ut
of
all
crop
lan
dce
lls)
Nu
mb
erof
ob
serv
ati
on
s:N
=1,
296,3
60
27

of the United Nations, 2008), as well as previous research into the relationship
between food and war (Koren and Bagozzi, 2016), in Figure 1.3 I conceptualize
this spectrum as the hypothetical distance between locations of availability—e.g.,
fields, mines, wells—and points of access where the final, usable product could be
obtained—e.g., ports, lumberyards, markets.6
So, for instance, degradable food resources such as vegetables are consumed lo-
cally wherever they are grown, without any need for further processing. Similarly,
gem stones such as diamonds are found in mines, but then could be placed in one’s
pocket and carried across the border, where they can be sold in their relatively raw
form (although more processing can add value to the final product). Cereals such
as maize and potatoes are somewhat different, as they would benefit from some
form of processing, although it is not always necessary. Wheat, in contrast, re-
quires processing prior to consumption. This processing can be done at the village
level, where a gristmill will turn raw wheat into flour. Timber is similar to wheat
in that, again, the raw product must be mobilized to a lumberyard to be processed
before being used. Sugar and coffee, in contrast, require regional processing facili-
ties before the final products can be sold on domestic or–more likely—international
markets, and even though the agricultural land might be owned by local farmers,
processing is usually controlled by the export company (Crost and Felter, 2016).
The same is true for precious metals, which necessitate significant levels of in-
frastructure to be mobilized from the mine to a point where these metals can
be processed, and then mobilized gain to a location where the final product can
be converted into revenue. Finally, oil is unlikely to be obtained, processed, and
sold without establishing control over the entire supply chain, i.e. the state ap-
6These framework is valid even if sometimes, as in the case of gems, processing adds value.
28

Figure 1.3: The Natural Resources Availability–Access Spectrum
paratus back in the capital and far away from the fields (see, e.g., Englebert and
Ron, 2004), although groups such as the Islamic State (IS) highly benefited from
oil-related revenues obtained via racketeering and “protection” services (Solomon,
Chazan and Jones, 2015).
Linking different natural resources to food and other agricultural resources
based on infrastructural traits and parts of the supply chain that need to be con-
trolled can help to identify new directions of research into the “resource course”
and its effects (Bannon and Collier, 2003), as well as into the relationship between
scarcity, abundance, and conflict more broadly. Moreover, food-based conceptu-
alizations could prove instrumental in cases where measures of local wealth are
poorly captured by GDP per capita and related constructs, as is the case for areas
where populations earn little income but own large amounts of crop or livestock
(e.g., rural Rwanda).7 In shifting the focus towards alternative ways of conceptu-
alizing wealth and theorizing the role of natural resources, the theoretical frame-
work developed in this dissertation, and especially the emphasis on the impact of
abundance, points to new ways in which the political, economic, and geographic
approaches to conflict can be synthesized. This can have potential implications not
7See, for instance, the concerns raised by the authors of the G-Econ dataset, who emphasizethat the quality of their data for developing regions—and especially Africa—is unreliable due topoor resolution and lack of data availability (Nordhaus et al., 2006).
29

only to research into the causes an consequences of conflict and political violence,
but also policymakers working to ameliorate conflict and prevent conflict renewal
locally.
Policy Contributions
Brandt, Freeman and Schrodt correctly argue that, “[s]cholars and policymakers
want to anticipate intra- and international conflicts. They also want to evaluate
what might have occurred if certain actions had been taken in the past and (or)
what might happen if governments take certain actions in a given conflict in the
future” (2011, 41). Through archival research and detailed statistical analysis,
this dissertation presents the opportunity to develop new quantitative tools for
researchers and policymakers concerned with conflict prevention and the broad
implications of food insecurity. The mixed-methods approach used here is designed
to aid policymakers in determining the level of impact various food insecurity issues
have on conflict and rebel violence across the developing world. This information
can directly assist in protecting vulnerable populations and inform policymakers
and others working for peace about triaging and addressing critical issues related
to food insecurity. Moreover, as shown in Chapter 3, information on the local
dynamics of food and conflict can also be leveraged to forecast future violence at
the highly-localized level.
Many researchers and policymakers will likely find the notion that food re-
sources impact conflict unsurprising, perhaps even somewhat trite. Yet, a more
nuanced understanding of the micro-dynamics at work in specific regions will al-
low for a more meaningful policy application to take place. The measures used
to approximate food abundance can also be used to identify in advance whether
30

conflict might occur in a given region during a given period, and whether any
region or country, conflict-afflicted or not, will experience high levels of civilian
victimization. Highlighting the salience of food insecurity indicators in our ability
to understand and predicting different forms of violence thus directly relates to
the emphasis placed by many non-governmental organizations such as the United
States Institute of Peace (USIP) on “groundbreaking work and training on con-
flict analysis, electoral violence prevention, early warning systems, and preventing
genocide and mass atrocities.”
The focus on food abundance can also serve to enhance work intended to
counter violent extremism by informing common practices of conflict management
related to violence between two non-state armed groups. Scholars and policy-
makers tend to focus on conflict between states or between a state and a rebel
group, but have paid relatively little attention to conflicts in which both groups
are not affiliated with the state, such as rival ethnic militias. Yet, examples of
recent conflicts from Sierra Leone (Keen, 2005) and the Horn of Africa (Mkutu,
2001; Sundberg, Eck and Kreutz, 2012), among others, show that armed non-state
groups do fight each other often.
Moreover, this model can also illuminate some less-understood aspects of the
peace-building processes in regions that are in danger of experiencing violence or
conflict renewal. By highlighting the more violent aspects of competition over food
resources, the abundance model suggest that complementing traditional peace-
building practices with improvements to food resource access (e.g. resources man-
agement of grazing land by the state, building water reservoirs and dams) can help
conflict-prone regions overcome food insecurity, reducing the need to compete over
food resources by violent means. Indeed, the potentially pacifying effects of food
31

security have also not gone unnoticed by senior policy makers. In addition to the
statement by the U.S. State Department mentioned above, the Food and Agricul-
ture Organization of the United Nations stresses the importance of food system
resilience and warns that, “[i]ncreasing incidence of drought may force people to
migrate from one area to another, giving rise to conflict over access to resources in
the receiving area. Resource scarcity can also trigger conflict and could be driven
by global environmental change” (2008). The theories and empirical models devel-
oped in this dissertation can thus help to inform policy-related work to focus not
only on the linear relationship between scarcity and conflict—so prevalent in poli-
cymaking circles—but also on the complex realties of food resources-based conflict,
which might exhibit the opposite trends to these expected by policymakers.
The Plan of the Dissertation
Drawing on the theoretical framework laid out in this introductory chapter, the en-
suing chapters develop and test different interrelated theories, and identify specific
mechanisms linking food abundance with conflict, both locally and globally. Con-
sidering the potential role of scarcity-based, socioeconomic, and macro-political
explanations as crucial confounders, these chapters also account—both theoret-
ically and empirically—for a variety of different mechanisms implied by these
alternative approaches. Hence, many of the empirical analyses are focused on
(sub-Saharan) Africa, the world region most frequently analyzed by scarcity cen-
tric studies. Nevertheless, when evaluating the impact of food resources at the
macrolevel in Chapter 4, I rely on a global sample so as to illustrate the validity
of a food resources-based conflict framework to an international scale, and across
32

all world regions.
Chapter 2 is a comprehensive study of the impact of local variations in staple
crop yields on conflict in Africa. I apply the framework of food abundance to iden-
tify and evaluate the validity of the most fundamental mechanism hypothesized
by this argument, a mechanism I term, as mentioned above, “possessive conflict”
over food security. I first develop a theory to explain why and when food resource
abundance generates conflict, as different groups seek to obtain food resources
for personal consumption, the most fundamental mechanism hypothesized in the
theoretical discussion presented in this chapter. I provide historical background
showing that such conflict is rather prevalent in the developing world; and discuss
how the need to obtain food resources shapes local conflict trends, focusing on four
different actor types with different motivations to initiate possessive conflict over
food resources. I then evaluate this theoretical framework empirically on highly-
localized, time varying data on conflict and staple crop yields in Africa, which
provides a novel contribution to the research on civil war. Because food produc-
tion cannot be claimed to be exogenous to conflict, I use negative rainfall shocks,
droughts, to identify the direct relationship of food production on conflict, while
illustrating—both empirically and theoretically—this instrument’s robustness to
violations of the exclusion restriction.
Empirically, this chapter provides quantitative evidence linking past internal
armed conflict incidence to food yields at the very local level while incorporating
variations in climatic trends, specifically droughts. Using 0.5 decimal degree grid
cells (10,674 cells for Africa) (Tollefsen et al., 2012), the influence of annual local
wheat and maize yields (Ray et al., 2012) on violence is estimated using ordinary
least squares (OLS) and two-stage least squares (2SLS) regressions with grid-cell
33

(i.e., unit of analysis) fixed effects. Unlike previous analyses, which employ only
climate-related variables, focus on specific countries, or employ only binary indica-
tors of conflict (Burke et al., 2009; Maystadt and Ecker, 2014; Koren and Bagozzi,
2016; O’Loughlin et al., 2012), this chapter relies on subnational analysis of the
annual effect of local food crop production in Africa on continuous measures of
conflict within all 0.5 ◦ grid cell for the years 1998-2008.
In Chapter 3 I consider a different mechanism linking conflict to food resource
abundance. As mentioned above, I term this mechanism “preemptive conflict”
over food security, because it involves actors using violence primarily to cut their
rivals off from accessing necessary food resources, either by seizing control over
these resources or by destroying them. Using a game-theoretic commitment prob-
lem model backed by statistical analysis and systematically collected anecdotal
evidence, I show that the aim of preemptive conflict is to increase one’s overall
chances of victory against the armed forces of other communities, governments,
or rebels by draining their sources of food support. This model revolves around
the strategic calculi of (i) the first group, or defense forces, (ii) the second group,
or raiders, and (iii) the civilian producers that provide local food support to the
defense forces. When the local civilians increase their level of food support, they
correspondingly increase the probability that the defense forces will win in com-
bat. Moreover, this level of support cannot be known to the raiders in advance.
In equilibrium, the raiders anticipate that if more food support is available to the
defense forces, their own chances of victory will diminish.
The implication is that above a certain probability threshold of the defense
forces’ victory, the possibility of high food support levels becomes a grave threat.
I find that in the model, this incentivizes the raiders to preemptively target regions
34

with more food resources in order to cut the defense forces off from these sources
of support, and increase their (the raiders’) overall probability of victory. I use this
model to derive a statistical-strategic model to empirically test this mechanism by
modeling the behavior of armed groups and civilians as a game with sequential
moves. I use similar data to those used in Chapter 2 to test this model, although
with different conceptualizations of the dependent and independent variables. In
illustrating that this strategic model also improves the predictive strength of fore-
casting models of localized conflict compared with a non-strategic model, I also
show that this model has substantive value.
Similarly to Chapters 2 and 3, Chapter 4 begins with a microlevel evaluation of
the historical role of food in one important context: the Mau Mau rebellion in 1950s
Kenya. This case has the advantage of (i) containing detailed information on the
conduct of a food denial campaign by the colonial forces, specifically (which is not
easy to come by), and (ii) the fact that few studies have made use of these sources,
which means that many of the documents, especially those related to food denial,
are revealed here for the first time. Both factors thus allow me not only to provide
a detailed discussion of the role played by nutritious, durable resources during the
rebellion, but also to set these interactions in a historical context. Therefore, to
generate microlevel evidence and validate pertinent mechanisms operating locally, I
analyzed archival resources from the British National Archives as part of a mixed-
methods approach to this research. Combined with historical literature, these
archival resources—some of which became available only recently—allow me to
construct a comprehensive case study and explore the historical role food resources
play in rebellion.
Documents from deliberations of British officials during the campaign illustrate
35

that these officials were acutely aware of how important food resources—and espe-
cially nutritious, calorie-rich staple crops—were to the Mau Mau fighting efforts.
Importantly, these officials understood that these resources were critical not only
because they allowed the group to adequately feed its members, as hunting and
foraging could provide similar sustenance levels, but also because regular access
to staple crops enabled the Mau Mau to support its members more efficiently,
which contributed to the group’s cohesion and improved its troops’ morale. Using
an original geo-spatial dataset I constructed from additional archival documents,
geographic patterns of violence during the Mau Mau rebellion are also tested quan-
titatively to evaluate these claims.
To complement these microlevel findings, the second part of Chapter 4 includes
an examination of whether the localized patterns identified in the microlevel models
are relevant to explaining the (i) probability and (ii) duration of rebellions world-
wide over the same period. These two expectations are tested using a maize-based
indicator of food production, while accounting for a large number of alternative
explanations. Maize was chosen to approximate food production because, as a
highly nutritious staple, it was identified in archival sources as having substantial
impact on the behavior of Mau Mau rebels, although I also show that this effect
persists across other cereals. Robustness models are used to additionally account,
to the extent possible, for the potential endogeneity between food and rebellion
using relevant instrumental variables. These different models confirm both hy-
potheses derived from my microlevel analysis: nutritious staple crops significantly
and substantively increase the likelihood and duration of rebellions. This chapter’s
findings thus validate the theoretical argument developed above, and shows that
conflict scholars should account for food resources in their theories and analyses.
36

Chapter 2: Food Abundance and
Possessive Conflict over Food Security
In Chapter 1, I laid out and explained the economic rationale behind the broad ar-
gument that, contrary to previous expectations (e.g., Burke et al., 2009; Maystadt
and Ecker, 2014; Miguel, Satyanath and Sergenti, 2004; Homer-Dixon, 1998), con-
flict is driven by higher food productivity, on average, and not by scarcity. In this
chapter, I identify and evaluate the validity of the most fundamental mechanism
hypothesized by this argument, a mechanism I term possessive conflict. I first de-
velop a theoretical framework to explain why and when food abundance generates
conflict in order to allow different groups to secure food for personal consumption.
I then evaluate this theoretical framework empirically on highly-localized data on
conflict and staple crop yields in Africa, which are used to approximate local food
resource availability in a manner similar to that used in past research (O’Loughlin
et al., 2012; Koren and Bagozzi, 2016, 2017).
One challenge in empirically evaluating the role of staple crop yields in driving
conflict is that local food production variables are inherently endogenous; food
output can influence the propensity of violence, but the associated feedback effects
from conflict can in turn influence food output (Homer-Dixon, 1998; Messer, 2009).
37

To address this concern, the local staple crop yield indicators used here are instru-
mented using drought intensity levels, which—as recent studies have posited—can
influence conflict through food production. The causal relationship between local
food production and violent conflict is thus identified using this climatic variable
(Miguel, Satyanath and Sergenti, 2004; Bellemare, 2015). It is important to stress
that previous research has suggested that rainfall variations mightnot be an ideal
instrumental variable of income shocks (Sarsons, 2015). While the argument de-
veloped here does not necessarily equate local yields with income, I address this
concern in two main ways. Theoretically, I discuss some distinctions of African
agriculture systems, the empirical focus on analysis. Empirically, I show that
my drought-based instrumental variable is at least “plausibly exogenous” (Conley,
Hansen and Rossi, 2012).
This chapter provides quantitative evidence linking past internal armed conflict
incidence to food yields at the very local level while incorporating variations in cli-
matic trends, specifically droughts. Using 0.5 ◦ grid cells (10,674 cells for Africa)
(Tollefsen et al., 2012), the influence of annual local wheat and maize yields (Ray
et al., 2012) on violence is estimated using ordinary least squares (OLS) and two-
stage least squares (2SLS) regressions with grid-cell (i.e., unit of analysis) fixed
effects.1 Conflict measures were obtained from the Armed Conflict Location and
Event Dataset (ACLED) Version 6, which provides exceptional disaggregated cov-
erage of political violence in Africa at the very local level (Raleigh et al., 2010).
Unlike previous studies, which employ only climate-related variables, focus on spe-
cific countries, or employ only binary indicators of conflict (Burke et al., 2009;
1I show that my decision to rely on this model is reasonably robust by re-estimating a seriesof Generalized Method of Moments (GMM) regressions to obtain more efficient estimates fordynamic panel data (Blundell and Bond, 1998; Arellano and Bond, 1991).
38

Maystadt and Ecker, 2014; Koren and Bagozzi, 2016; O’Loughlin et al., 2012),
this study relies on sub-national analysis of the annual effect of local food crop
production in Africa on continuous measures of conflict within all 0.5 ◦ grid cell
for the years 1998-2008.2
The focus on Africa as the world region currently most susceptible to the ef-
fects of food insecurity—through climatic variability or otherwise—corresponds to
previous studies on climatic variation, food security, and conflict, which similarly
focus on the same region (Burke et al., 2009; Buhaug, 2010; O’Loughlin et al.,
2012). Moreover, the availability of localized data on political violence is also the
best for Africa, as the world region most susceptible to conflict. Indeed, the Armed
Conflict and Location and Event Data (ACLED) Version 6 dataset (Raleigh et al.,
2010) used here covers a wide variety of violence types at the highly localized, vil-
lage level (as discussed in more detail below). Importantly, although this analysis
is focused on Africa, its lessons are applicable to other global contexts, as shown
in Chapter 4.
The findings presented here contribute significantly to our understanding of
the relationship between food security, violent conflict, inequality, and environ-
mental variability. The estimation procedure accommodates both the non-random
assignment of observations and the possible concurrent relationship between cli-
mate, food production, and conflict. Overall, the empirical models provide new
and nuanced evidence that locally grown food resources have a particularly strong
influence on the frequency of conflict in Africa. In the IV models, where the effect
of food resources is exogenized with respect to conflict, higher levels of food crop
2The temporal period for which information on all variables was available. See also Adhvaryuet al. (2016) for a study that relies on similar resolution levels for analyzing conflict across sub-Saharan Africa.
39

yields are shown to have a substantive effect on violent conflict, all else equal.
These findings challenge the notion that rising food scarcities increase conflict
simply by forcing communities and armed groups to compete over a shrinking pool
of food resources. Rather, empirical evidence suggests that—on average—violent
conflict is not the direct result of food scarcity, but of abundance; areas with
more food resources are more valued by different actors, and as a result attract
more conflict. Moreover, these associations are robust to a variety of alternative
explanatory mechanisms and specifications. The relationships between climatic
variability, food, and violence are therefore complex and warrant careful interpre-
tation. Indeed, as shown in the next chapter, other mechanisms exists that can
also explain violence over food resources, and which are distinct for the simple
necessity to secure resources solely for possession.
Food Security and Possessive Conflict Over Time
In many parts of the world, conflict over possessing food resources is not a re-
cent phenomenon, engendered by climate change, but rather a persistent historical
occurrence.
Background
The association of food and violence has always been part of the human narra-
tive. Throughout history, armies and militias living off the land were a regular
characteristic of warfare. In ancient and medieval times, before the development
of modern logistic support technologies, living off the land, foraging, and relying
on the local population was a military necessity (e.g., Kress, 2002, 10-15). Al-
though the utilization of logistic supply chains has significantly reduced the need
40

of modern militaries to rely on local populations for support, the bureaucratic and
economic capabilities required to maintain such systems has ensured that the vast
majority of armed groups in Africa lack regularized support (Koren and Bagozzi,
2016).
Deficiencies in access to food have forced many contemporary armed actors to
routinely live off the land in times of war and peace. During the Civil War in Sierra
Leone, for instance, regular Sierra Leone Army (SLA) troops were paid not with
money, but with bags of rice, a meager payment usually appropriated by generals
located back in the capital, Freetown. This lack of support pushed the SLA to fight
over areas with higher levels of food resources and to perpetrate atrocities against
local populations in order to extract sustenance (Keen, 2005). The appropriation
of food and the abuse of power by military officials was not unique to Sierra
Leone, and very similar situation existed in other African countries such as Angola
(Cilliers, 2000, 8-9). In some instances, leaders actively encouraged troops to
commandeer such supplies from the population. In Zaire, for instance, Mobutu
Sese Seko notoriously replied to his troops when the latter complained about not
being paid their wages: “you have guns; you don’t need a salary” (Stearns, 2011,
115).
The importance of securing food resources in face of unequal access is not the
unique domain of groups that are part of the government vs. rebel logic. Indeed,
ethnic and tribal militias and other irregular forces representing local communities
and different ethnic groups might be even more likely to initiate conflict over food
resources. As discussed below, these communities might be especially dependent
on locally grown food resources, and hence more susceptible to the adverse effect
of distributional differentials between the core and the periphery (Reardon and
41

Taylor, 1996; Pitt, Rosenzweig and Hassan, 1990). This situation is especially
likely in countries and regions where little or no protection of property rights by
the government exists, which leads to the formation of these irregular militias
(Koren and Bagozzi, 2017).
In the extant literature, conflict between rebel and irregular groups over food
resources is usually attributed to competition over livestock, especially cattle. For
instance, Rockmore (2012) finds that in Uganda, populations residing in areas of
persistent conflict shift from large cattle herds and open grazing to small livestock
that can be kept in closed compounds, as well as labor intensive and drought
intensive crops.3 Similar patterns appear in Colombia, where households reduce
land allocated to perennial crops and increase production of seasonal crops and
pasture in regions with an intense conflict (Arias, Londono and Zambrano, 2014).
Indeed, scholars that study cattle theft in Africa argue that “[t]he practice is
causing great havoc in the area in terms of loss of human lives, destruction of
property, stealing of livestock and dislocation of populations” (Osamba, 2000).
For instance, in South Sudan, where “[e]thnic groups have fought each other over
cattle—a vital part of the indigenous economy—for centuries” (Reuters, 2011),
cattle theft and reprisals are responsible for a large portion of combatant and
noncombatant casualties. These dynamics are by no means unique to South Sudan.
As a result of similar dynamics, in the Horn of Africa states applied significant
force to combat violent raiders, who attempt to steal food resources or secure
access to fertile regions (Leff, 2009; Maystadt and Ecker, 2014). Even in relatively
stable countries such as Ghana, competition between farmers and Fulani herders
frequently leads to localized conflict (Tonah, 2006).
3See also Finnstrom (2003) for an anthropological perspective.
42

By attributing livestock and violence dynamics to competition over access to
water resources, some studies have drawn links between environmental change,
conflict, and food resource abundance (e.g., Butler and Gates, 2012; Adano et al.,
2012).4 For instance, in their analysis of conflict in Kenya and Ethiopia, Adano
et al. find that “more conflicts and killings take place in wet season times of
relative abundance, and less in dry season times of relative scarcity, when people
reconcile their differences and cooperate” (2012, 77). Somewhat in line with this
argument, Rowhani et al. find “that conflicts are more frequent in regions with
more vegetation,” presumably because vegetation increases the ease with which
raiders can approach cattle pens unnoticed (2011, 221).
These studies and their emphasis on abundance are thus in line with research
into the positive impact of profitable natural resources on civil war and civilian
victimization (e.g., Bannon and Collier, 2003). In other words, just like areas and
countries with abundance of profitable resources such as diamonds or oil attract
violence, so should be the case in areas with higher food available—these areas offer
more of an especially valuable resource, which not only can be traded for profit, but
is also necessary to guarantee survival. Regional narratives, especially analyses of
Uganda (Rockmore, 2012) and Colombia (Arias, Londono and Zambrano, 2014),
highlight violence resulting not only from cattle raids, but also from food crop
resources. Some additional examples include Angola (Cilliers, 2000), Sudan and
Ethiopia (Leff, 2009), Somalia (Ahmed and Green, 1999), Sierra Leone (Keen,
2005), and Nigeria (Ofuoku, 2009), and Mozambique (Hultman, 2009). Forces
initiating conflict in regions where food resources are abundant or moving into
4Other studies, however, identify a negative relationship. For instance, Maystadt and Ecker(2014) associate droughts with more civil war in Somalia.
43

these areas in order to control these resources is therefore a modern-day affliction
in many African, and other developing, countries and regions (Koren and Bagozzi,
2016).
Food Security Vulnerabilities
Constraints on food access are unlikely to lead to acute violence within advanced
industrialized democracies due to the existence of safeguards to those in need and
a high degree of infrastructure that can transfer more food when needed. However,
in many developing African countries and regions, widespread limitations to food
access can affect armed conflict. This is because such food insecurity-prone areas
are likely to be characterized by three main attributes.5 First, rural regions in
many African countries have poor infrastructure, including an absence of paved
roads and refrigeration, which have especially parlous implications in relation to
food security (Food and Agriculture Organization of the United Nations, 2008).
Individuals in these regions are therefore at a higher risk of having their immediate
access to food impaired.
A second attribute of regions with a high risk of food insecurity is a relative
lack of sophisticated agricultural technology, such as heavy machinery and efficient
fertilizers (Barrett, 2010; Kastner et al., 2012). This technological gap is narrow-
ing, but current technology is still limited, and the impact of inadequate farming
technology is much more severe in underdeveloped regions (Barrett, 2010; Lybbert
et al., 2007; Kastner et al., 2012). Without technological improvements, less food
can be produced in these regions, and thus they are more prone to food shortages.
5The term “food insecurity” refers to situations where food security levels are dangerouslylow, and there are not enough food resources, due to either distributional or production shortages,to guarantee sufficient dietary intake for all individuals in the region (Barrett, 2010).
44

Lastly, rural regions in the developing world, and especially in Africa, are ar-
guably most vulnerable to the negative impact of climatic variability on food acces-
sibility (Food and Agriculture Organization of the United Nations, 2008; Reardon
and Taylor, 1996). The weak infrastructure that characterizes many of these re-
gions (e.g. dirt roads) is much more likely to be destroyed due to extreme climatic
effects such as flood. For instance, a report by the Food and Agricultural Orga-
nization of the United Nations states that, “climate variables also have an impact
on physical/human capital—such as roads, storage and marketing infrastructure,
houses, productive assets, electricity grids, and human health—which indirectly
changes the economic and socio-political factors that govern food access” (2008,
12).
Taking into account these three issues, people in many developing regions are
forced to rely on food produced and sold locally and grown using relatively simple
technology, which increases asymmetries in access to food, both between urban
and rural areas (Pitt, Rosenzweig and Hassan, 1990), and—within rural areas—
between commercial producers and smallholders (Jayne et al., 2003). Moreover,
although numerous studies highlight the potentially salient effect of food imports
on production (Bellemare, 2015; Hendrix and Haggard, 2015), food imports are less
relevant to the daily diet of many individuals in these regions compared with food-
stuff that are locally grown and sold (see, e.g, Barrett, 2010; Koren and Bagozzi,
2017). This places these individuals at a high risk of experiencing food insecurity
(Barrett, 2010; Rowhani et al., 2011), especially from a distributional perspective
(Reardon and Taylor, 1996; Pitt, Rosenzweig and Hassan, 1990).
45

Staple Crop Yields and Local Possessive Conflict
This historical evidence illustrates that the linkage between conflict and food
resources is not a recent phenomenon, engendered by climate change, but rather—
in many parts of the world—a persistent historical occurrence. Yet, when dis-
cussing possessive conflict over food resources, and conflict over food resources
more broadly, it is important to distinguish between four different categories, each
with different motivations to initiate food-related conflicts, or to move into areas
with more food during times of ongoing war. The first category includes official
military and auxiliary state forces that do not receive (regular) support from the
state, a fact which distinguishes them from other, better organized state forces.
This category includes most official state forces in Africa (Henk and Rupiya, 2001),
as well as political militias. Indeed, numerous militia groups such as the janjaweed
in Sudan or the interahamwe in Rwanda were especially likely to be sent to pray
upon the local population, sometimes with logistic support being withdrawn from
them intentionally to push them toward violent appropriations of food resources
(Koren and Bagozzi, 2017). Unsupported state actors are thus likely not only to
initiate conflict in areas with abundant food resource, but also gravitate toward
these areas in search of necessary food support during times of war.
The second category of actors includes all rebel groups and similar nonstate
actors operating against the government. These groups might attack areas with
more food in order to possess these resources not only to support themselves or
challenge state strongholds, but also to exploit local food resources for profit (Crost
and Felter, 2016), which sometimes results with high levels of civilian victimization
(Koren and Bagozzi, 2017). For instance, in Uganda, rebels are likely to appropri-
46

ate and kill profitable cattle, leading to a shift in local populations’ agricultural
portfolios (Rockmore, 2012). Similarly, the Islamic State in Syria and Iraq (ISIS)
fought to establish and maintain control over fertile agricultural areas due to the
group’s reliance on agricultural income (Jaafar and Woertz, 2016).
The third category covers militias and civil defense forces representing agricul-
turalist communities in rural regions. The agriculturalist lifestyle is more charac-
teristic of areas where access to water resources is relatively stable, allowing these
communities to grow crops for consumption and to be sold locally (O’Loughlin
et al., 2012). Individuals and groups in these localities thus live a stationary
lifestyle, and procure livestock mostly as a means of wealth accumulation (i.e., as
an equivalent of a savings account) (Rockmore, 2012; Roncoli, Ingram and Kirshen,
2001). In many countries these communities are less likely to be defended by the
state due to the costs involved with sending and supporting armed groups. This
in turn means that property rights are rarely enforced (Barrett, 2010), pushing
many of these communities to resort to self-help. Such self-defense militias can
be used not only to defend against potential raids, but also to attack neighboring
communities in order to establish control over more arable land and food resources.
Indeed, this last point is supported by ample anecdotal evidence, as was shown
above.
The fourth category includes all militias representing pastoralist communities.
Pastoralists are highly mobile groups that live in mostly arid regions. As a re-
sult, these groups are forced to rely on mobile livestock, especially cattle, rather
than on crops, meaning that in this case owning cattle is not a luxury but rather
a necessity dictated by their (semi-)nomadic lifestyle (Lybbert et al., 2007). Pas-
toralists have been at the heart of many previous studies connecting food resources
47

to conflict, with some associating increases in precipitation with higher frequencies
of raids (e.g., Adano et al., 2012; Butler and Gates, 2012), while others showing
the opposite relationship (O’Loughlin et al., 2012; Maystadt and Ecker, 2014). In
many cases, regional narratives emphasize how the prevalence of violent conflict
is shaped by local conditions such as the precedence of civil war, which floods the
region with firearms (Koren and Bagozzi, 2017), or the collapse of state author-
ity, especially if external actors move into the vacuum and fund raids (Rockmore,
2012). Pastoralist militias might therefore both raid other pastroalists in order
to replenish their herds, and attack agriculturalist communities in order to both
steal livestock and obtain food crops, which—due to their mobile lifestyle and the
arid regions where they reside—pastoralist communities are generally incapable of
growing independently.
All four actor categories, which—it is important to acknowledge—might exhibit
significant overlap, have different motivations to fight over food resources. In the
first two cases, given that troops are frequently mobile rather than stationary, they
do not have the ability to grow food for personal consumption, and as a result
must rely on food grown locally in the region in which they operate (Koren and
Bagozzi, 2016). Agricultural land can be owned by local civilians who grow food
for personal consumption only or by larger producers who grow food for trade,
both internationally and domestically. Especially in regions without developed
infrastructure and where mobilizing food resources or appropriating food aid is
less possible, both government and rebel troops are forced to move into areas that
offer access to food in order to support their operations. These limitations intensify
the incentives for troops to seek out the few remaining areas that do have high food
access for sustenance, and potentially also for rent-extraction (Jaafar and Woertz,
48

2016; Crost and Felter, 2016).
In the latter two cases, while agriculturalist and pastoral communities can
produce food for personal consumption, they are also under a constant threat of
experiencing acute food insecurity (as discussed in the “Food Security Vulnerabil-
ities” subsection above). The eruption of a disease or the onset of drought can
suddenly kill crops and decimate herds, placing these communities at the sudden
and immediate risk of starvation. Without government support or other safety nets
that can mitigate the effects of these unexpected shortages, acute food insecurity
is a Damocles Sword over the heads of these groups (Barrett, 2010). For example,
during the drought in Burkina Faso, “farmers strove to minimize cash investments
in agriculture, but in some cases they were unable to do so because many had con-
sumed all their seed before planting” (Roncoli, Ingram and Kirshen, 2001, 128).
Such shocks jeopardize immediate food security; assuming the community survives
this adverse period, it should be able to restore food supply levels. This suggests
that cooperation might emerge as a preferred strategy in these contexts (Adano
et al., 2012; Toft, 2006; Butler and Gates, 2012). However, to increase overall re-
silience, improve capabilities, and be better prepared to the brutal effect of shocks,
such groups will be expected to increase competition during periods of abundance.
Without the ability to purchase drought-resistant seeds or livestock, and with-
out government or international support—which in many cases cannot arrive in
time or be received by those who need it— that provides safety net against sud-
den shocks, the only alternative to free market or aid solutions is to obtain food
using violent means. Moreover, the tendency for conflict might also be affected
by population growth (Homer-Dixon, 1998) or migration (Dell, Jones and Olken,
2014), which increase the pressure to secure more resources just to keep the same
49

level of sustenance, leading to a zero-sum, “Red Queen” scenario.6 To increase
overall resilience, communities must obtain the necessary access to enough food
resources during periods of plenty, when more assets could be mustered and when
time horizons in respect to the competition over food are relatively long, i.e., ac-
tors perceive that more resources will make them more resilient in the future. This
directly relates to the notion of time horizons in interstate war, as put by Toft: “if
both actors discount the present but see their fate provided for in the future, then
violence is likely” while “[i]f both actors discount the future highly, then violence
is unlikely” (2006, 56).
Finally, it is important to emphasize that while conflict frequency might in-
crease with higher yields, food is not always necessarily the cause. For instance,
government or rebel troops might be stationed in more fertile areas in order to
protect these areas or to support themselves. Consequently, other armed actors
seeking to attack enemy strongholds will move into these areas not to obtain food
resources, but simply because these regions are likely to offer a valuable target.
In these contexts, the impact of food resources is indirect; a military base might
have been formed in this particular region to protect local food resources or simply
because support is more likely there, and fighting arose as enemy forces attacked
this base. Moreover, while food resources might be a direct cause of armed conflict
in some cases, conflict—especially full-scale civil war—is frequently the result of
political and socioeconomic issues (Fearon and Laitin, 2003). In these situations,
troops gravitate into areas with more food resources during ongoing war to secure
6Building on Lewis Carroll’s apt description, a “Red-Queen” race is a competitive scenario,in which every actor must match or exceed the current expenditures of rivals, so that each isforced by the others to invest even more resources only to maintain the same position (Baumol,2004, 238).
50

food or prevent these resources from being consumed by the enemy (Koren and
Bagozzi, 2016). Therefore, while I make the argument that conflict concentrates
in areas with high staple crop yields, I also recognize that groups do not fight
necessarily over these resources; locations with more food resources might simply
attract and sustain a large portion of ongoing violence.
Whether competition over food resources is the direct cause of conflict, or
whether it directly or indirectly fuels ongoing violence, in contrast to some pre-
vious studies of the climate-conflict nexus (Burke et al., 2009; O’Loughlin et al.,
2012; Maystadt and Ecker, 2014) the expectation here is that conflict should be
positively associated with more food resources, all else equal. However, although
multiple studies have suggested that such positive associations exist (e.g., Ko-
ren and Bagozzi, 2016; Adano et al., 2012; Butler and Gates, 2012), making a
causal statement with respect to food resources is more challenging because, un-
like temperature or precipitation, at the local level, food crops are likely to have
an endogenous relationship with conflict. In other words, just as higher local food
outputs can cause conflict, conflict can destroy crops and reduce yields.
For instance, as Messer argues, “[f]ood poverty may be exacerbated as violence
disrupts migratory labor and remittance patterns over wide regions, as has been
the case across multiple African areas, also Afghanistan and Iraq, whose violence,
and interruptions to livelihood and security, impact neighboring countries” (2009,
15). Violent conflict can destroy infrastructure, displace large populations, and
increase population pressures via movement of different groups and troops into
the region (Koren and Bagozzi, 2017). Moreover, food insecurity can be used as a
weapon of conflict in-and-of itself, as adversaries deliberately starve opponents into
submission by siege or destruction of crops, livestock, and markets, and divert food
51

relief from intended beneficiaries to armed groups and their supporters. Indeed,
research into the impact of conflict on food choices found significant changes in
livestock and crop growing patters in Uganda (Rockmore, 2012) and Colombia
(Arias, Londono and Zambrano, 2014). Establishing the causal effect of food on
conflict—or come as close to it as possible when observational data are concerned—
necessitates an identification strategy and effective data that allow the researcher
to isolate the causal arrow flowing from food resources to conflict rather than the
other way around. Such a strategy would allow me to evaluate the hypothesis that,
at the highly localized level, conflict should (on average) be more frequent in years
of abundance.
Data and Methods
This section discusses the data to be analyzed, the equations to be estimated
and the identification strategy to be used to establish the causal impact of food
resources on armed conflict.
Data
For Africa, a grid cell sample encompassing 11 years of data from 1998 to 2008
is used to evaluate the relationship between local food crop yields and violent
conflict. The geolocated data used for this analysis were obtained from the PRIO-
Grid dataset (Tollefsen et al., 2012). The PRIO-Grid dataset measures a variety of
spatial data at the 0.5 ◦ resolution, or a geographic squared “cell” of roughly 55 ×
55 kilometers at the equator (3025 square kilometers area), which decreases with
higher latitudes. This dataset thereby allows one to capture the variation of specific
geographic and economic phenomena globally (excluding oceans, Antarctica, and
52

the Arctic) at the very local level. All variables were aggregated to the same grid
level and integrated into this dataset for the years analyzed.
The dependent and continuous conflict variable was obtained from the ACLED
Version 6 dataset and measures all incidents of political violence (including those
that ended without casualties), with a focus on civil and communal conflicts, vio-
lence against civilians, remote violence, rioting and protesting that occurred both
within and outside the civil war context (Raleigh et al., 2010). The actors covered
by this dataset are official state forces, rebels, political militias, ethnic and tribal
militias, protesters, and rioters, which means that more than any other available
dataset, the ACLED Version 6 data corresponds directly to the different actor cat-
egories discussed in the previous section. The ACLED dataset covers incidents at
the village/town level, which were aggregated to the annual 0.5 ◦ grid level. The
ACLED dataset also provides information on geographic specificity, i.e., whether
an incident was coded at the village/town, district, or province level. To ensure
comparability across different cases and variables, I analyze only events coded as
occurring at the village/town level, which most closely correspond to my grid-cell
level of analysis.
The resulting conflict indicator is therefore defined inclusively as the total
number of political violence incidents among and between different state and non-
state actors within a given cell during a given year coded by the ACLED dataset.
This indicator captures many nuances of political violence—including events that
ended without casualties, such as strategic developments—and hence provides an
improvement over other studies that employ binary indicators of conflict or focus
exclusively on the state vs. rebel logic. Additionally, and again in line with the
argument presented above, these data capture both instances of conflict onset and
53

violence occurring as part of ongoing campaigns. For summary purposes, averaged
values by grid cell of conflict are plotted for the 1998-2008 period in Figure 2.1
below.
The effect of local food availability on the number of conflict events is evaluated
using the annual local productivity of wheat and maize—two cereals that together
compose the lion’s share of all staple crops consumed in African households (Food
and Agricultural Organization of the United Nations, 2016). These continuous
wheat yield and maize yield indicators measure average annual levels of wheat and
maize productivity at the highly localized, ∼0.08 ◦ grid level, or approximately
9km x 9km at the equator (Ray et al., 2012).7
To identify local areas where cropland is grown, Ray et al. (2012) relied on
an earlier high resolution geospatial global cropland map for year 2000 created by
Ramankutty et al. (2008). Ramankutty et al. (2008) utilized two sources of data to
create their map. The first source were global satellite-based land cover data ob-
tained from two previous datasets, BU-MODIS and GLC2000 (Ramankutty et al.,
2008, 7-8). The second source were national and subnational census data on crop-
land area and food inventories. The authors then used regression techniques to
train the satellite land cover data against the census data. The resulting estimates
along with the satellite data allowed Ramankutty et al. (2008) to then map crop-
land areas at the high-resolution 5 minute (∼0.08 ◦) level. In the second step,
Ramankutty et al. (2008, 11-12) further adjust their high-resolution maps, scaling
up or down all pixels within an administrative unit to exactly match the census
data.
7For detailed information on the sources and methods used to compile these data, see, Mon-freda, Ramankutty and Foley (2008, 4-9), Ramankutty et al. (2008, 6-10), and Ray et al. (2012,Supplementary Information, 11-15).
54

To interpolate their time-varying measure of crop-specific area and yield by 0.08
◦ grids for wheat and maize, Ray et al. (2012) then expanded the dataset developed
by Ramankutty et al. (2008) in two steps. First, Ray et al. (2012, Supplementary
Information, 6-12) collected an exceptionally large number of datasets crop area
and yields at the subnational and national level, going back to 1961. The average
number of census observations over the 1961-2008 period was 600,000 per crop,
although the number of observations varied geographically.8
Ray et al. (2012) then use the high-resolution cropland map created by Ra-
mankutty et al. (2008) as a spatial reference to disaggregate wheat and maize area
and yield data within each administrative unit. The grid of staple crop yields was
created “by disaggregating the yield from the smallest political unit with avail-
able data in the agricultural inventory by distributing the inventory data for each
administrative unit uniformly to each pixel [i.e., 0.08 ◦ grid] within that adminis-
trative unit” (Monfreda, Ramankutty and Foley, 2008, 10). For wheat and maize
yields, the process developed by Monfreda, Ramankutty and Foley (2008) was
repeated annually over the 1961-2008 period (Ray et al., 2012, Supplementary In-
formation, 11-12). The crop area in each 0.08 ◦ grid of the final map was set to
zero when no reference to a crop existed in the inventory data. Information on
these missing points was then interpolated from the latest five years if at higher
administrative units crops reports were present (Ray et al., 2012, Supplementary
Information, 12).9
It is important to note that data quality might be poor in some countries,
8Crop inventory information became more easily available after 1990, the period analyzedhere (Ray et al., 2012, Supplementary Information, 11).
9While Ray et al. (2012) also calculate changes in staple crop yield trends using categoricaltrend indicators, the present article relies on the raw high-resolution yield information underlyingthe analyses conducted in Ray et al. (2012).
55

sometimes due to ongoing political strife, which means that some countries do not
provide annual reports. These issues, however, are unlikely to affect the specific
data used here. First, the geospatial and temporal interpolation of missing data
as discussed above should help ameliorate some missing-ness issues resulting from
ongoing strife. Moreover, the authors created a useful metric (presented in Ray
et al., 2012, Supplementary Information, 12) to evaluate overall data quality for
each political unit. As shown in Ray et al. (2012, Supplementary Information, 1),
the data quality for Africa is generally high at the reported administrative level
(averaging within the top 90th percentile) and—with a data quality level that is
nearly identical to North America’s—is better than any other world region. It is
important to emphasize, however, that the vast majority of crop output data on
Africa were available only at the national level. Thus, for most African countries
Ray et al. (2012) interpolate localized changes in wheat and maize yields within
each particular 0.08 ◦ grid based on national averages, which is less than ideal.
These limitations notwithstanding, the resulting wheat yield and maize yield
indicators provide “a dramatically improved understanding of crop yield and area
changes across regional and global scales, which are otherwise often obscured using
only national census statistics” (Ray et al., 2012, 2), especially in world regions
where subnational statistics are missing or nonexistent, such as Africa. Indeed, as
highlighted by 24 food-system experts, a salient problem with current attempts
to assess local food security is that, “the data collected are rarely comparable
across ecological zones because of inconsistencies in methodologies or in the spa-
tial scale at which observations are made” (?, 558). From this perspective, the
high-resolution data produced by Ray et al. (2012) provide a significantly and
substantively better fit for observed local food production trends, even when com-
56

pared with other high-resolution datasets such as BU-MODIS or GLC2000. Using
a dataset that combines satellite-derived imagery and staple crop inventory data
also allows scholars “to capitalize on whichever satellite-based land cover data set
is best suited to each region,” compared with the constituent datasets, which on
their own would provide “reasonably good global results, but would lose accuracy
in some regions” (Ramankutty et al., 2008, 10).
To ensure comparability to the other data used in this present study, both the
wheat yield and maize yield indicators were averaged to the 0.5 ◦ grid cell level
to ensure comparability across observations. A value of one thus corresponds to a
grid-cell whose total area is entirely covered by wheat or maize crops, respectively,
during a given year. For summary purposes, averaged values for wheat yield and
maize yield (by grid cell) are plotted for the 1998-2008 period in Figure 2.4 below,
and summary statistics of wheat yields, maize yields, and conflict for each African
country in the sample are reported in Table 2.1. These figures all strongly sug-
gests that, as hypothesized above, higher conflict frequency correlates with food
abundance, not scarcity.
57

●
Variation in Conflict FrequencyHigh IntensityMedium IntensityLow IntensityNo Conflict
Figure 2.1: Average levels of violent conflict from ACLED Version 6 dataset by0.5 ◦ grids (Raleigh et al., 2010).
58

Variation in Wheat YieldsHigh YieldMedium YieldLow YieldNo Yield/No Information
Figure 2.2: Average wheat yields by 0.5 ◦ grids (Ray et al., 2012).
59

Variation in Maize YieldsHigh YieldMedium YieldLow YieldNo Yield/No Information
Figure 2.3: Average maize yields by 0.5 ◦ grids (Ray et al., 2012).
The instrument used to identify the direct effect of the effect of food on conflict
(or, in other words, to “exogenize” it), drought, is operationalized using a Stan-
dardized Precipitation Index (SPI) that aggregates monthly precipitation data to
the cell-year level (Guttman, 1999). This SPI-based indicator classifies drought
severity as the number of standard deviations below average precipitation levels
in a particular grid cell during a given year. The resulting drought variable is an
ordinal indicator (it can take the values of 0, 1, 1.5, and 2.5 standard deviations
60

Tab
le2.
1:Sum
mar
ies
ofco
nflic
tev
ents
,av
erag
ew
hea
t,an
dav
erag
em
aize
yie
lds
by
grid
cell,
tota
lva
lues
for
all
countr
ies
anal
yze
d,
1998
-200
8
Con
flic
tA
verage
Average
Con
flic
tA
verage
Average
Cou
ntr
yevents
wh
eat
yie
ldm
aiz
eyie
ldC
ou
ntr
yevents
wh
eat
yie
ldm
aiz
eyie
ld
Cab
over
de
00
0B
uru
nd
i2,4
63
0.0
423
0.4
780
Sao
Tom
e0
00
Rw
an
da
230
0.0
380
0.3
720
Gu
inea
-Bis
sau
147
00.0
817
Som
alia
3,3
97
0.0
135
1.0
068
Eq.
Gu
inea
14
00.0
241
Dji
bou
ti24
00.0
002
Gam
bia
56
00.0
506
Eth
iop
ia794
3.0
997
4.5
400
Mali
82
0.0
353
1.1
529
Eri
trea
343
0.1
095
0.0
841
Sen
egal
305
7.1
1E
-05
0.4
805
An
gola
2,5
94
0.0
106
3.2
023
Ben
in21
0.0
001
2.5
372
Moza
mb
iqu
e155
0.0
103
5.9
677
Mau
rita
nia
57
0.0
019
0.0
478
Zam
bia
420
0.0
505
2.3
872
Nig
er190
0.0
189
0.1
412
Zim
babw
e3,5
99
0.1
884
5.6
793
Cote
d’I
voir
e846
01.2
375
Mala
wi
98
0.0
258
6.4
863
Gu
inea
356
01.0
685
Sou
thA
fric
a757
3.8
579
12.9
092
Bu
rkin
aF
aso
103
1.9
1E
-05
1.2
364
Nam
ibia
156
0.0
076
0.1
231
Lib
eria
775
00.0
259
Les
oth
o6
0.1
118
0.6
114
Sie
rra
Leo
ne
3,4
16
00.1
278
Bots
wan
a25
0.0
075
0.2
449
Gh
an
a66
02.8
605
Sw
azi
lan
d60
0.0
008
0.1
913
Togo
61
01.7
980
Mad
agasc
ar
210
0.0
200
1.3
267
Cam
eroon
107
0.0
016
2.0
153
Com
oro
s0
00
Nig
eria
1,9
78
0.1
621
12.6
989
Mau
riti
us
00
0G
ab
on
23
1.6
5E
-06
0.2
436
Sey
chel
les
00
0C
en.
Af.
Rep
.319
0.0
002
0.5
243
Moro
cco
188
18.0
346
1.6
961
Ch
ad
406
0.0
080
0.6
261
Alg
eria
1,3
48
16.8
551
0.0
116
Rep
.C
on
go
196
9.2
1E
-05
0.1
506
Tu
nis
ia47
5.3
266
0D
em.
Rep
.C
on
.3,0
23
0.0
304
7.3
598
Lib
ya
61
2.5
095
0.0
188
Ugan
da
3,2
55
0.0
474
2.7
439
Su
dan
2,2
56
1.6
689
0.3
036
Ken
ya
2,0
95
0.4
928
5.8
295
Egyp
t367
7.9
396
5.7
286
Tan
zan
ia245
0.2
256
8.4
878
Note
:A
valu
eof
“1”
corr
esp
ond
sto
aqu
anti
tyth
at
iseq
ual
toon
e0.5×
0.5
deg
ree
gri
dce
llth
at
isen
tire
ly(i
.e.,
100%
)co
ver
edby
maiz
eor
wh
eat
pro
du
cin
gcr
op
lan
d,
resp
ecti
vely
.
61

● ● ● ●
●
●
●
●●●●●
●
●
●
●●
●
●●
●
●
●
●●●●●●●●●●●
●
●
●●●● ● ●●
●
●●●●●●●●●●●●●
●
●
●
● ●●●●●●●●●●●●●●●●●●
●
●●
●
●
●●●●●●●●●●●●●●●●●●
●
●●● ●●●●●●●●●●●●●●●●●
●
●●●
●
●
●●●●●●●●●●●●●●●●●●
●
●
●●●●●●
●
●●●●●●●●●●●●●●●●●●●●●●●
●
●●
●
●●●●●●●●●●●●●●●●●●●●●●●●
●
●●
●
●
●●●●●●●●●●●●●●●
●
● ●● ●●●●●●●●
●●
●
●●●●●●●●●●●●●●●●● ●●
●
●
●
●
●
●
●●
●
●●
●●●●●●●●●●
●
●●●●●●
●
●
● ●
●
● ●
●
●●
●●
●
●
●
●
●
●●●●●●●●●●●●●●●
●
●●
●
●●● ●
●
●
●
●
●
●●
●
●
●
●
●●●●
●
●●●●●●●●●●●●●●●
●
●
●
●
● ● ●
●
●
●
●●
●●
●
●●●●●●●●●●●●●●●●●●●●●●
●
●
●
●
●●
●
●●
●
●●
●
●●●●●●●●●
●
●●●●●●●●●●●
●
●
●
●
●
●
●
●
●●
●
●
●●
●
●●●●●●●●●●
●
●●●●●●●●●●●●●●●
●
●
●
●
●
●
●
●●●
●
●
●
●
●●●●●●●●●●●●●●●●●●●●●●
●
●
●
●
●
●
●
●
●●●
●●
●
●
●●●●●●●●●●●●●●●●●●●●●●●●●●●●●
●
●
●●
●
●
●
●
●●
●
●
●●●●●●●●●●●●●●●●●●●●●●●●●●●●
●
●
●
●●●●●●
●●●
●
●
●●
●
●
●●
●●●●●●●●●●●●●●●●●
●
●●●●●●●●●●●●●●●●●●●●●●●
●●
●●
●
●●●●●●
●
●●●●
●
●●●●●●●●●●●●●●
●
●●●●●●●●●●●●●
●
●●●●
●
●
●
●●
●
●●●●●●●
●
●●●●●●●●●●●●●●●●●●●●●●●●●●●●●●●●●●●●●●●
●●
●●
●
●●●●●●●●
●
●●
●
●●●
●
●●●●●
●
●●●●
●
●●●●●●●●●●●●●●●●●●●●●●●●●●●●●●●●●●●●●●●●
●
●●●●●
●
●●●●●●●●●
●
●●●●●●●●●●●●●●●●●●●●●
●
●●●●●●●●●●●●●●●●●●●●●●●●●●●●●●
●
●●●●●●●●●●●●●●●●●●●●●●●●●●●
●
●●●●●●
●
●●●●●●●●●●●●●●●●●
●
●●
●
●●●●●●●●●●●●●
●
●
●
●
●●●
●
●●●●●
●
●
●
●●●●●●●●●●●●●●
●
●
●●●●●●●●●●●●●●●●●●●●●●●●●●●●●●●
●
●
●
●
●
●
●
●●●●●●●●●●●●●●●●
●
●●●●●●●●●●●●●●●●●●●●●●●●●●●●●●●●●●
●●
●
●
●
●
●
●●
●
●
●●●
●
●●●●●●●●●●●●●●●●●●●●●●●●●●●●●●●●●●●●●●●●●●
●
●●
●
●
●●
●
●
●
●
●●
●
●
●●●
●
●●
●
●
●●●●●●●●●●●●●●●●●●●●●●●●●●●●●●●●●●●
●
●
●
●
●
●
●
●
●
●
●
●
●
●●●●●●●●●●●
●
●
●●●●●●●●●●●●●●●●
●
●●●●●●●●●●●●●●●●
●
●
●
●
●
●
●
●
●
●
●
●●
●
●●●●●●●●●●●●
●
●●●●●●●
●
●●●●●●●●●●●●●
●
●
●
●●●●●●●
●
●
●●●●
●
●
●●
●
●
●
●
●
●●●
●
●
●
●●●●●●●●●●●●
●
●●●●●●
●●●
●
●●●
●
●
●
●●
●
●
●●
●
●
●
●
●
●
●
●●
●
●●
●
●
●
●
●
●
●
●
●●●
●
●
●
●●●●●●●●●●●●●●
●
●●●●●●●●●●●
●
●●●●●●●
●
●●●●●
●
●●●●●●
●
●
●
●●●
●
●
●
●
●
●
●
●
●●●●
●●
●●●●●●●●
●
●●●●●●●●●●●●●●●●●●●●●●●
●
●
●●●●●●●●●●●●
●
●●●●●●●
●
●
●
●
●
●
●
●
●
●
●●●●●●●●●
●
●●●●●●●●●●●●●●●●●●●●●●●●●●●●
●
●●●●●●●●●
●
●●●●●●●●
●
●
●
●
●●●
●
●
●●●●
●
●●
●
●●●●●●●●
●
●●●●●●●●●●●●●●●●●●●●●●●●
●
●●●●●
●
●●●●●
●
●●●●●●●●●●●●●●●●●●●
●
●●
●
●
●●●●
●
●●
●
●●●●●
●
●●●●●●●●
●
●●●●●●●
●
●
●●●●
●
●●●●●
●
●
●
●●●●●●●●●
●
●●●●●●●●●●●●
●
●
●●●●●●●
●
●●
●
●●●●●●●●●●●●
●
●
●
●●
●●
●●
●
●●●
●
●●●●●●●●●
●
●●●●●
●●
●●●●●●●●●●●●●
●
●
●●●●●
●
●●●●●●●
●
●●
●
●●●●
●
●
●
●
●
●
●●●●●●●●
●
●●●●●●●●●●●●●
●
●●●●●●●●●●●●●
●
●●●●●●●●●●●●●●●●●●●●
●
●
●
●
●
●
●
●●●●●●●●●●●●
●
●●●●●●●●●●●●●●●●●
●
●
●
●
●
●
●●●●●●●●●●●●●●●●
●
●●
●●●
●
●
●
●
●
●●●
●
●●●●●●●
●
●
●●●●●●●●
●
●
●●●
●
●
●●●●
●
●●●●●●●●●●●●●●●
●
●●
●
●
●
●
●
●
●
●
●
●
●
●
●
●
●●●●
●
●●●
●
●●●●●●●●●
●
●
●
●
●●●●●●●●●●●●●●●●●●●●●
●
●●●●●
●
●
●●
●
●
●
●
●
●
●
●●●●●●●●
●
●●●
●
●
●
●●●●●●●●●●●
●
●●●●●●●●●●●●●●●
●
●●●●●
●
●●
●
●
●
●
●
●
●
●●●●
●
●●
●●
●
●
●
●●
●●●●●
●
●●●●●●●●●●●●
●
●
●●●●●●●●●●●
●
●●●●
●●
●●
●
●
●●
●●●
●
●●●
●
●●●
●
●
●●●
●
●●●●
●
●●●●●●●●●
●
●●●●●●●●●●●●
●
●●●●
●
●
●●
●
●
●●
●
●
●●●
●
●
●
●
●●●●●●
●
●●●●●●●●●●●●●●●●●●
●
●●●●●●●●●●●
●●
●
●●●●●
●
●
●
●
●●●●●●●●●●●●●●
●
●
●●
●
●●●●
●
●●
●
●●●●●●●●●
●
●●●●●●●●
●
●●
●
●
●
●
●
●
●●
●
●
●
●
●●●●●●●●
●
●
●●
●●●
●
●●●●●●●
●
●
●●●●●●●●●●●●●
●
●
●●
●
●
●
●
●
●
●
●
●
●
●
●
●
●●●●●●●●
●
●●●●●●●●●●●●●
●
●● ●●●●●●●●●●●●●●
●
●●●
●
●●
●
●
●
●●●●
●
●●●●●●●●
●
●●
●
●
●
●
●
●
●●●●●●●●●●●●●●●●●●●●●●●
●
●
●
●●
●
●
●●
●
●
●
●
●
●
●
●●
●●●
●
●●●●●●●
●
●
●
●●●●●●●●●●●●●●●●●●●●●
●
●
●
●
●
●
●
●●●●●●●●
●
●
●●
●
●●●●●●
●
●
●
●●
●
●
●
●●●●●●●●●●●
●
●●●●●●●●
●
●
●
●
●
●
●
●●●●●●
●
●
●●●
●●
●●
●
●
●●●●
●
●
●
●
●
●
●
●
●●●●●●●●●●●●
●
●●●●●●●
●
●●●
●
●
●
●
●●●●●●●●●
●●
●●●
●
●●
●
●
●
●
●●●●●●●●●●●●●●●●●●●●
●
●●
●
●
●
●
●●
●
●
●
●
●
●●●●●●
●
●●●●●●●
●
●
●
●
●
●
●
●
●●●●
●
●●●●●●●●●●
●
●●●●●●●●
●
●
●
●
●
●
●
●
●
●●●●●●
●
●
●●●
●
●
●
●
●
●
●
●
●
●
●●●●
●
●
●
●●●●●●●●●●●
●
●●●●●●
●
●
●
●
●●
●
●
●
●●●●●
●
●
●
●
●
●
●●●
●
●
●
●
●
●
●●
●
●●
●
●
●
●●●●
●
●●●●●●●●●●●●●
●
●
●
●
●
●
●
●●●
●
●
●
●
●●●●●
●
●
●●●●●●
●
●
●
●●
●
●
●
●
●
●
●●
●
●●
●●●●●●●●●●●●●●●●●
●
●●●●
●
●
●
●●
●
●
●
●●
●
●
●●●●●●
●
●●
●
●
●
●
●●
●
●
●●●
●
●
●
●
●●●●●●●●●●●
●
●●●●●●
●
●
●●●
●
●
●●●
●
●
●●●●●●●●●
●
●●●●
●
●●
●
●●●●
●
●●●
●
●
●
●
●
●●
●
●
●
●●●●●●
●
●●
●
●
●
●
●●●●●
●
●
●
●●
●●●●
●
●●●●●●●
●
●●●
●
●●●●
●
●
●
●
●
●
●
●
●
●
●
●●●●●●●●●
●
●
●
●
●
●●
●
●
●
●●●●
●
●
●
●
●
●
●
●●●●●●●●●●●●●●●●●●●●●
●
●
●
●
●
●
●
●
●
●
●
●
●●
●
●●●●●●●●
●
●
●●●●
●
●
●●●●
●
●●
●
●●●●●●
●●
●
●●●●●
●
●
●
●●●
●
●●●●
●
●●●
●
●
●
●
●
●
●
●●●●●●●●●
●
●●●
●
●●●●
●●
●●●
●
●●●●●●●●●●
●
●●●●●●●●●●●●●●●●●●●●
●
●
●
●
●
●
●
●
●
●●●●●●●●
●
●●
●
●●
●●●
●
●
●
●●
●
●●●●●●●
●
●●●●●●●
●
●●●●●●●●●●●●●
●
●●●●●
●
●●●
●
●
●
●
●
●
●
●
●
●
●●
●
●
●
●
●
●
●
●
●
●●●●●●
●
●
●●●●●●●●●●●●●
●
●●●●
●
●
●
●●●
●
●
●
●
●●
●
●●●●
●
●
●●
●
●
●
●
●
●
●●●●●
●
●
●
●
●
●
●
●
●
●●●●●●
●●
●●●●●●●●●●●●●●●●●●●●●●●●
●
●
●●●●●●
●
●●●●●
●●
●
●
●●
●
●
●●●
● ●
●
●
●
●
●
●●
●●
●
●
●●
●
●
●
●
●●
●
●●●●●●●●●●●●
●
●●●●
●
●
●
●●
●
●●
●●
●
●
●
●●
●
●●
●
●
●
●
●
●
●
●
●
●
●
●
●
●
●
●
●
●
●
●
●
●
●●
●●
●
●●
●●
●
●●●●●●●●●●●●●●●●●●●●●●●
●
●
●●●●●
●
●●
●
●●●●●●●
●
●
●
●●
●
●
●
●
●
●
●
●
●
●
●
●
●●
●
●●●
●
●
●
●
●●
●●●●●●●●●●●●●●●●●●●
●
●●
●
●
●
●
●●●●
●
●●●●●●
●
●
●
●
●
●
●
●
●●●●●
●
●
●
●
●
●
●
●●
●
●
●●●●●●●
●
●●
●
●
●
●●
●
●●●●●●●
●
●●●●●●●
●
●●●●●●●●●●●
●
●●●●●
●
●●
●
●
●
●
●
●
●
●
●
●
●●
●
●
●
●●●●●●
●
●●●
●
●●●
●
●
●●●●●●●●●●●●●●●●●●
●
●
●
●●●●●●●
●
●●●●●●
●
●
●
●●●
●
●
●
●
●
●
●
●●
●●
●
●
●●
●●
●
●●●●●
●
●
●
●
●
●●
●
●
●
●●●●●●●●●●●●●●●●●●●●
●
●●●●●
●
●●
●
●
●
●●●●
●
●
●
●
●
●
●
●
●
●
●
●
●
●
●
●
●
●
●●●●●
●●
●
●
●
●
●
●
●
●
●
●
●●
●
●
●●
●
●●●●●●●●●●●●●●●●
●
●
●
●
●
●
●
●●●●
●
●●●●●●
●
●●●●
●
●
●●
●
●
●
●
●
●
●
●●
●
●
●
●
●●
●
●
●
●●●●
●
●
●
●
●
●
●
●
●●●
●
●●●●●
●
●
●●●●●●●●●●●●
●
●●●●●●●
●
●
●
●
●
●●●
●
●●
●
●
●
●
●
●
●
●
●
●
●
●
●
●
●●●●
●●
●
●
●
●●
●●
●
●
●●
●●●
●
●
●●
●
●
●
●
●
●
●
●
●●
●
●
●●●●●●●
●
●●
●●
●●●●●
●
●
●●●
●
●●●●●●●●●
●
●●
●
●
●
●
●●
●
●
●
●
●
●
●
●
●
●
●
●
●
●●
●
●●●●●●●●●●
●
●
●
●●●
●●●●●
●
●
●
●
●●●●
●
●
●
●
●
●
●
●
●
●
●●●●●●●●●●●●●●●
●
●
●
●
●
●
●●●
●
●●
●
●●●●●●●●●
●
●
●
●●
●
●
●
●
●
●
●
●●●●●●●
●●●
● ●
●
●●●●●●
●
●●
●
●●
●●
●
●
●
●
●●
●
●
●●●●●
●
●●
●●●
●
●
●
●
●
●
●
●
●
●
●●●
●
●●●●●●
●
●
●
●
●●●
●
●
●
●
●
●
●●●●●
●
●●●●
●
●
●
●●●
●
●●●
●
●
●●
●
●●
●
●●●
●
●●●●●● ●●●●●
●
●
●
●●●●●
●
●●●
●●
●
●
●
●●●●
●
●●
●●●
●
●●●●●●●
●
●●
●●
●
●
●
●
●
●●
●
●
●
●
●●●●●●●●●●
●
●
●
●●
●
●
●
●
●
●
●●●●
●
●●●●●●●●●●●●●
●
●
●●●●●●●●●●●●●●● ●●●●●●●
●
●●
●
●●●●
●
●
●
●
●●
●
●
●●
●●
●
●
●
●
●
●●●●●
●
●
●●●●●
●
●
●
●
●
●
●
●
●
●
●
●
●
●
●
●
●
●●●●
●●●●
●
●●●●
●
●
●
●
●
●
●
●
●●●●
●
●●●●●●
●
●●
●
●●●●●●●●
●
●
●●●●
●
●●●●●●●
●
●●
●
●●
●
●●
●
●
●●
●
●●●
●
●●●●●●
●
●
●●
●
●
●
●
●
●
●
●
●
●●●●●●
●
●●●
●●
●
●
●●
●
●
●●●
●
●
●
●
●
●
●
●
●
●●
●
●●●●●
●●
●
●
●
●●
●
●
●
●
●●●●
●
●●●●●●●●●●●●●●●
●
●
●
●
●
●●●●
●
●●
●
●●●●
●●
●●
●
●
●
●●●●●
●
●
●
●●●
●
●●●●●
●
●
●
●
●●
●
●
●
●
●
●●
●●
●●
●●●
●
●●●●
●
●●●●●
●
●
●
●
●
●
●
●
●●
●●
●
●
●
●
●●●●●●●●●
●●
●
●
●
●
●
●●●●●
●
●●●●●●●
●
●●●●●
●
●
●
●●
●
●●●● ●●●
●
●
●
●
● ●
●●
●●●
●
●
●●
●●
●
●
●●●●●
●
●
●●
●●●
●
●
●●
●
●
●●
●
●
●
●
●
●
●
●
●
●
●
●●●●●
●
●
●●●●●●
●
●
●
●
●
●●
●
●
●
●
●
●
●
●
●
●●●●●●●●●●●●
●
●
●
●●●●●●●●●●●●●●
●
●
●
●
●●
●
●
●
●●
●
●
●
●
●●
●
●●●
●
● ●
●
●
●●●●●●●●
●
●●
●
●
●●●●
●
●●
●
●
●
●
●
●
●
●
●●
●
●
●
●
●●●●●●●●●
●
●●●
●
●●●●●●●
●●
●
●
●●●
●●
●●
●
●
●
●●●●
●
●●●●●●
●
●●●
●
●
●
●●●
●
●
●
●
●●●●●●
●
●
●●
●
●
●
●●
●
●
●●
●
●●●
●
●
●
●
●
●●
●
●●●●●
●
●●
●
●
●
●
●
●●●
●
●
●
●
●
●●●●
●
●●
●
●
●
●
●
●
●
●●●●●●●●●●
●
●●●●●●●●
●
●●●
●
●
●
●
●●●●●
●●
●
●
●
●●
●
●●●●
●●
●●●
●●
●●●●
●
●●●●●●
●
●●●●●●●
●
●
●
●
●
●●●●●●●
●
●
●●
●
●
●
●
●
●
●
●
●
●
●●
●
●
●
●●●●●●
●
●●●
●
●●●●●●●●
●
●
●
●
●
●
●
●●●
●
●●●●
●
●●●●●●●●●
●
●
●
●●●●●●●●●●●
●
●
●
●
●
●
●
●
●●●
●
●
●●●●
●
●●●●●●
●
●●●●●●●●
●
●●
●
●●●●
●
●●●
●
●
●
●
●
●
●
●
●●
●●
●
●●
●
●
●●
●
●
●
●
●
●
●
●
●
●
●
●●●●●●●●●
●
●●●
●
●●
●
●
●
●●
●
●
●●●●●
●
●●
●
●
●
●●●●●●●●●
●
●●
●
●●●●●●●●●●
●●
●
●
●
●
●
●●
●
●
●
●●●●●●●●●●●●
●
●●●
●
●
●
●
●●●●●●●●●●●
●
●
●
●
●●●
●
●●●
●
●●
●
●
●
●●
●
●
●
●
● ●
●
●
●
●
●
●
●
●
●●
●
●●●
●
●
●
●●
●●●●
●
●●●
●
●
●
●●
●
●●
●●●●
●
●●●●●●●●●●●
●
●●●●●●
●
●
●
●
●●●●●●
●
●
●
●●
●
●●
●
●●●
●
●●●●●●●●●●●●●●
●
●
●
●●●
●
●●●●●●●●●
●
●●●
●
●●
●
●●
●●
●
●●●● ●
●
●●
●
●●●●
●
●●●
●
●●●●●●●
●
●
●
●
●
●●
●
●
●
●●●
●
●●●●●●●●●●●●
●
●●
●
●●●●●●●●●●●●●●●
●
●●●●
●
●●●●●●●●●
●
●●●●
●
●
●
●
●●●●●●●●●●●●●
●
●●
●
●
●●●●
●
●●
●
●●●●●●
●
●●
●
●●●
●
●●●●
●
●●●●●●●●●●●●●●●
●
●●●●●●●●●●●●●
●
●●
●
●●●●●●●●●●●●
●
●●
●
●●●●●●●●●●●●●●●●●●●●●●
●
●
●
●
●
●●●●●●
●
●
●
●
●
●
●●●●●
●
●
●
●
●
●●
●
●
●
●
●
●
●
●
●●
●
●
●
●●●
●
●●●●●
●
●●●
●
●●●●
●
●
●
●
●
●
●●●
●
●
●●
●●●
●
●
●
●
●●
●
●
●
●
●●●●●●●●
●
●
●●●●●●●●●
●
●●●●●●●●●
●
●●●●●●●●●●●●●●
●
●
●
●
●
●●●
●
●
●●
●
●
●
●
●
●
●
●
●
●
●
●●●●●
●●
●●
●
●
●
●
●
●
●
●
●●●●●●●
●
●
●●
●
●●●●●●●●
●
●● ●●●●●●
●
●
●
●
●
●
●
●
●
●
●
●
●
●
●
●
●
●●●●●●●●●●
●
●
●
●●●●●●
●
●
●
●●●●●●●●
●
●
●
●
●●
●
●
●●
●
●
●
●
●
●
●●●
●
●●
●
●
●
●●●●
●
●
●
●
●●●
●
●
●
●
●
●
●
●
●●●●
●
●
●
●●
●
●●● ●●●●
●
●
● ●●●●●
●
● ●●
●
●●●●●●●
●
●
●
●
●
●●
●●●●●●●●●●
●
●
●●●●●●●●●
●
●
●
●●
●●
●
●●
●
●●●●●●●●
●
●
●
●●●●
●
●●
●
●●●●●●●●●●●●●●
●
●
●
●
●
●
●
●
●
●
●
●
●●
●
●
●
●
●
●●●●●
●
●●
●
●●●●●●
●●
●
●●●
●
●
●●●●●●●
●
●
●
●
●
●
●
●●●●●●●●●●●●●●●●●●●●●●●●
●
●●●●
●●
●
●
●
●●●
●
●●●
●
●●●●●●●●●
●
●●●●●●●●
●
●●●●●
●
●
●
●
●
●
●
●
●●
●
●●
●●●
●
●●●●
●
●●
●
●●
●●
●
●●●●●
●
●●●
●
●●●●
●
●
●
●●
●
●
●●
●
●●●●●●●●●●●●●●●●●●●●●●
●
●●●●●●●●
●
●●●●●●●●●●●●●
●
●●●
●
●●●●●●●●●●●●●●
●
●●
●
●
●
●
●
●
●●
●
●
●
●●
●
●●●●●●
●●
●●●●●
●
●●●●
●
●
●
●●●●
●
●●●●●●
●●
●●●●●●●
●
●●●●●●●●●●●
●
●●
●
●●●●●●●●●●
●
●
●●●●●
●
●●●●●●●●●●●●●●●●●
●
●●●●●●●●●●●●●●●
●
●
●
●
●●
●
●
●
●●
●●●●●●●●●●●●
●
●
●
●●●●
●
●
●
●
●
●
●
●●●●●●●●●●
●
●
●●●●●●●●●●●●●●●●●●●●
●
●●●●●●
●
●●●●●●●●●●●●●●●
●
●
●●●●●
●
●●
●
●●●●●●●●●●●●●●●●●●●●
●
●●●
●
●
●
●
●
●
●
●
●●
●
●●●●
●
●
●
●●●
●
●●●●
●
●
●
●
●
●
●
●
●●●●●●●●●
●
●●●●●●●●●●
●
●
●
●
●●●●●●●●●●●●●●●●●●●
●
●●●
●
●●●●●●●●●●●●●●●●●●●●
●
●●●●●●●●●●●●●●●●
●●
●
●
●●●●●●●●●●●●●
●
●●
●
●
●
●●●
●
●●
●
●
●
●
●
●
●
●
●●●
●
●●●●●●●●●●●●●●
●
●●●●●●●
●
●●●●
●
●●●●
●
●●●
●
●●●●●●●●●●●●●●●●●●●●●●●●●
●
●●●●●●●●●●
●
●●●
●
●●
●
●
●
●●●●●●●●●●●●
●
●
●
●●●●●●
●
●
●●●●
●
●
●
●●●●●●●●●●●●●●●●●●●●●●●●●●●●● ●●●●
●
●
●
●●●●●●●●●●●●●●●●●●●●●●●●●●●●●●●●●●●●●●●●●●●●●●●●●●
●●
●●●●●●●●●●●●● ●●●●●●●
●
●
●●
●
●●●●●●●●●●●●●●●●●●●●●●●●●●●●●●●●
●
●●●●●
●
●●●●●●●●
●
●●●●●●
●
●●●●●●●●●●●●●●●●●●●●●●●●●●●●●●●●●●●●●●●●●●●●●●●●●● ●●●●●●●
●
●●●●●●●●●●●●●●●●●●●●●●●●●●●●●●●●●●●●●●●●
●
●●●●●●●●●●●●●●
●●
●●●●●●●●●●●●●●●●●●●●●●●●●●
●
●●●●●●●●●●●●●●●●●●●●●●● ●●●●●●
●
●●●●●●●●●●●●●●●●●●●●●●●●●●●●●●●●●●●●●●●●●●●●●●●●●●●●●●
●
●●●●●●●●●●●●●●●●●●●●
●
●
●
●●●●●●
●
●●●●●●●●●●●●●●● ●●●●● ●●●●●●●●●●●
●
●●●●●●●●●●●●●●●●●●●●●●●●●●●●●●●●●●
●
●
●
●●●●●●●●●
●●
●●●●●●●●●●●●●●●●●●●●●●●●●●●●●●●●●●●●●
●
●●●●●●● ●● ●●●●
●
●●●●●●●●●●●●●●●●●●●●●●●●●●●●●●●●●●●●●●●●●●●●●●●●●●●●●
●
●●●
●
●●●●●●●●●●
●
●●●●●●●●●●●●●●●●●●●●●●●●●●●●●●●●●●●●● ●●
●
● ●●●●●●●●●●●●●●●●●●●●●●●●●●●●●●●●●●●●●●●●●●●●●●
●
●●●●●●●●●●●●
●
●●●●●●●●●●●●●●●●●●●●●●●
●
●●●●●●●●●●●●●●●●●●● ●●●●●●●
●
●●●●●●●
●
●●●●●●●●●●●●●●●●●●●●●●●●●●●●●●●●●●●●●
●
●●●●●●●●
●
●●●●●●●●●●●●●●●●●●●●●●●
●
●●●●●●●●●●●●●●●●●●
●
●● ●●●●●●●●●●●●●●
●
●●●●●●●●●●●●●●●●●●●●●●●●●●●●●●●●●●
●
●●●●
●
●●●●●●●●●●●●●●●●●●●●●●●●●●
●
●●●●●●●●●●●●●●●●●●●●●●●●●●
●
●●●●●●
●
●●●●●●●●●●●●●●●●●●●●●●●●●●●●●●●●●●●●●●●●●●●●●●●●●●●●●●●●●●●●●●●●●●●●●●●●●●●●
●
●
●●
●●●●●●●●●●●●●●●●●●●●●●●●●●●●●●●●●●●●●●●●●●●●●●●●●●●●●●●●●●●●●●●●●●●●●●●●●●●●●●●●●●●●●●●●●●●●●●●●●●●●●●●
●
●
●
●
●●●●●●●●●●●●●●●●●●●●●●●●●●●●●●●●●●●●●●●●●●●●●●●●●●●●●●●●●●●●●●●●●●●●●●●●●●●●●●●●●●●●●●●●●●●●●●●●●●●●●●●●●●●●
●
●●●●●●●●●●●●●●●●●●●●●●●●●●●●●●●●●●●●●●●●●●●●●●●●●
●
●●●●●●●●●●●●●●●●●●●●●●●●●●●●●●●●●●●●●●●●●●●●●●●●●●●●●●●●●●●●●●●●●●●●●●●●●●●●●●●●●●●●●●●●●●●●●●●●●●●●●●●●●●●●●●●●●●●●●●●●●●●●●●●●●●●●●●●●●●●●●
●
●●●●●●●●●●●●●●●●●●●●●●●●●●●●●●●●●●●●●●●●●●●●●●●●●●●●●●●●●●●●●●●●●●●●●●●●●●●●●●●●●●●●●●●●●●●●●●●●●●●●●●●●●●●●●●●●●●●●●●●●●●●●●●●●●●●●●●●●●●●●●●●●●
●
●●●●●●●●●●●●●
●
●
●●●●●
●
●●●●●●●●●●●●●●●●●●●●●●●●●●●●●●●●●●●●●●●●●●●●●●●●●●●●●●●●●●●●●●●●●●●●●●●●●●●●●●●●●●●●●●●●●●●●●●●●●●●●●●●●●●●●●●●●●●●●●●●●●●●●●●●●●●●●●●●●●●●●●●●●●●●●●●●●●●●●●●●●●●●●●●●●●●●●●●●●●●●●●
●
●●●●●●●●●●●●●●●●●● ●●●●●●●●●●●●●
●
●●●●●●●●●●●●●●●●●●●●●●●●●●●●●●●●●●●●●●●●●●
●
●●●●●●●●●●●●●●●●●●●●●●●●●●●●●●●●●●●●●●●●●● ●●●● ●●●●●●●●●●●●
●
●●●●●●●●●●●●●●●●●●●●●●●●●●●●●●●●●●●●●●●●●●●●●●●●●●●●●●●●●●●●●●●●●●●●●●●●●●●●●●●●●●●●●●● ● ●●●●●●●●●●●●●●●●●●●●●●●●●●●●●●●●●●●●●●●●●●●●●●●●●●●●●●●●●●●●●●●●●●●●●●●●●●●●●●●●●●●●●●●●●●●● ● ●●●●●
●
●
●
●●●●
●
●●●●●●●●
●
●●●●●●●●●●●●●●●●●●●●●●●●●●●●●●●●●●●●●●●●●●●● ●●●● ●●●●●●●●●●●●●●●●●●●●●●●●●●●●●●●●●●
●
●
●
●●●●●●●
●
●●●●●●●●●●●●●●●●●●●●●●●●●●●●●●●●●●●●●●●●●●●●●●● ●●●● ●●●●●●●●●●●●●●●●●●●●●●●●●●●●●●●●●● ●
●
●●●●●
●
●●●●●●●●●●●●●●●●●●●●●●●●●●●●●●●●●●●●●●●●●●●●●●●●●●●●●●● ●●●●●●●●●●●●●●●●●●●●●●●●●●●●●●●●
●
●
●●●●●●●●●●●●●●●
●
●●●●●●●●●●●●●●●
●
●●●●●●●●●●●●●●●●●●●●●●●●●●●● ●●●●●●●●●●●●●●●●●●●●●●●●●●●●●●●●●
●
●●●●●●
●
●●●
●
●●●●●●●●●●●●●●●●●●●●●●●●●●●●●●●●●●●●●●●●●●●●●●●●●●●●●●●●●●●●●●●●●●●●●●●●●●●●●●●●●●●
●
●●●●●●●●●●●
●
●●●●●●●●●●●●●●●●●●●●●●●●●●●●●●●●●●●●●●●●●●●●●●●●●●●●●●●●●●●●●●●●●●●●●●●●●●●●●●● ●●●●●●
●
●●
●
●●●●●●●●●●●●●●●●●●●●●●●●●●●●●●●●●●●●●●●●●●●●●●●●●●● ●●●●●●●●●●●●●●●●●●●●●●●●●●●●● ●
●
●
●●●●
●
●●● ●●●●●●●●●●●●●●●●●●●●●●●●●●●●●●●●●●●●●●●●●●●●●●●●●●●●●●●●●●●●●●●●●●●●●●●●●●●●●●●●● ●
●
●●
●
●●●● ●●●●●●● ● ●●●●●●●●●●●●●●●●●●●●●●●●●●●●●●●●●●●●●●●●●●●●●●●●●●●●●●●●●●●●●●●●●●●●●●●●●
●
●
●●●●
●
● ● ●● ●●●● ●●●●●●●●
●
●●●●●●●●●●●●●●●●●●●●●●●●●●●●●●●●●●●●●●●●●●●●●●●●●●●●●●●●●●●●● ● ●
●
●
●
●
●
●●●● ● ● ●● ●●● ●●●●●●●●●●●●●●●●●●●
●
●●●●●●●●●●●●●●●●●●●●●●●●●●
●
●●●●●●●●●●●●●●●●●
●
●●●
●
●
●
●
●
●
●●
●
● ● ●
●
●
●●●●● ●●●●●
●
●●●●●●●●●●●●●●
●
●
●
●●●●●●●●●●●
●
●●
●
●●●●● ●●●●●●●●●●●●●●●
●
● ●●
●
●● ●● ●●● ●●●●●●●●●●●●●●●●
●
●
●●●●●●●●●●●●●●●●●●● ● ●
●
●
●
●●●●●●
●
●● ●● ● ● ●●●●●●●●●●●●●●●●●●●●●●
●
●●●●●●●●●●●●●●●● ●
●
●
●●●● ●●●●
●
● ● ● ●●●●● ●●● ●●●●●●●●●●●●●●●●●●●●
●
●
●●●●●●●●●●
●
●
●●
●
●
●
●● ●●●●●●●●●
●
●●
●
●●●●●
●
●
●
●●●●●● ●
●
●
●
● ●●
●●
● ●●
●
●●
●
●●●●●
●
●
●●●●●●●●●●
●●
●●●● ● ●●●●●● ● ●
●
●
●
●
●
●●
●●●
●
●
●
●
●
●
●●
●●
●●●●●
●
● ● ●●●●
●
●
●
●
●
●
●
●
●
●
●
●
●
●●
●
●●
●
●
●
●
●
●
●
●● ●●●●●
●
●
●
●
●
●
●
●
●
●
●
●
●
●
●
●●
●
●
●●● ●●● ●●● ●
●
●
●
●
●
●
●
●
●
●
●
●
●
●
●
●
●●●●
●
●
●
●
●
●
●
●
●
●
●
●●
●
●
●
● ●●
●
●●●
●
●●● ● ●●● ●
Correlation = 0.06
0
1
2
3
4
0.0 0.2 0.4 0.6 0.8Average Wheat Yield Levels
Ave
rage
Num
ber
of C
onfli
cts
●●●●
●
●
●
●●●●●
●
●
●
●●
●
●●
●
●
●
●●●●●●●●●●●
●
●
●●●●●●●
●
●●●●●●●●●●●●●
●
●
●
●●●●●●●●●●●●●●●●●●●
●
●●
●
●
●●●●●●●●●●●●●●●●●●
●
●●●●●●●●●●●●●●●●●●●●
●
●●●
●
●
●●●●●●●●●●●●●●●●●●
●
●
●●●●●●
●
●●●●●●●●●●●●●●●● ●●●●●●●
●
●●
●
●●●●●●●●●●●●●●●●● ●● ● ● ●●●
●
●●
●
●
●●●●●●●●●●●●●●●
●
● ●● ●●●● ●●●●
●●
●
●●●●●●●●●●●●●●●● ● ● ●
●
●
●
●
●
●
●●
●
● ●
●●●●●●●●●●
●
●●●●●●
●
●
● ●
●
● ●
●
●●
●●
●
●
●
●
●
●●●●●●●●●●●●●●●
●
●●
●
●●● ●
●
●
●
●
●
●●
●
●
●
●
●●●●
●
●●●●●●●●●●●●●●●
●
●
●
●
● ● ●
●
●
●
●●
●●
●
●●●●●●●●●●●●●●●●●●●● ● ●
●
●
●
●
● ●
●
●●
●
● ●
●
●●●●●●●●●
●
●●●●●●●●●● ●
●
●
●
●
●
●
●
●
●●
●
●
●●
●
●●●●●●●●●●
●
●●●●●●●● ●● ●●●● ●
●
●
●
●
●
●
●
●●●
●
●
●
●
●●●●●●●●●●●●●●●● ● ● ●●●●
●
●
●
●
●
●
●
●
●●●
● ●
●
●
● ●●●●●●●●●●●●●●●●●●●●●●● ● ● ●● ●
●
●
●●
●
●
●
●
● ●
●
●
● ●● ● ●●●●●●●●●●●●●●●●●●●●●●●●
●
●
●
●●●●●●
●● ●
●
●
●●
●
●
●●
● ●●●●●●●●●●●●●●●●
●
●●●●●●●●●●●●●●●●●●●●●●●
●●
●●
●
● ● ●●● ●
●
●●●●
●
●●●●●●●●●●●●●●
●
●●●●●●●●●●●●●
●
●●●●
●
●
●
●●
●
●● ● ●●●●
●
●●●●●●●●●●●●●●●●●●●●●●●●●●●●●●●●●●●●●●●
●●
●●
●
●●●●●●●●
●
●●
●
●●●
●
●●●●●
●
●●●●
●
●●●●●●●●●●●●●●●●●●●●●●● ●●●●●●●●●●●● ●●●●●
●
●●●●●
●
●●●●●●●●●
●
●●●●●●●●●●●●●●●●●●●●●
●
●● ●●●●●●● ● ●●●●●●●●●●●●●●●●●●●●
●
●●●●●●●●●●●●●●●●●●●●●● ● ●●● ●
●
●●● ●●●
●
●●●●●●●●●●●●●●●●●
●
●●
●
●●●●●●●●●●●●●
●
●
●
●
●●●
●
● ●● ● ●
●
●
●
●●● ● ●●●●●●●●●●
●
●
●●●●●●●●●●●●●●●●●●●●●●●●●●●●●●●
●
●
●
●
●
●
●
●● ●●●● ● ●●●●●● ●●●
●
●●●●●●●●●●●●●●●●●●●●●●●●●●●●●●●●●●
● ●
●
●
●
●
●
●●
●
●
● ●●
●
●●●● ●●●●●●●●●●●●●●●●●●●●●●●●●●●●●●●●●●●● ●●
●
●●
●
●
● ●
●
●
●
●
●●
●
●
●●●
●
● ●
●
●
●●●●●●●●●●●●●●●●●●●●●●●●●●●●●●●●●● ●
●
●
●
●
●
●
●
●
●
●
●
●
●
●● ●●●●●● ● ●●
●
●
●●●●●●●●●●●●●●●●
●
●●●●●●●●●●●●●●● ●
●
●
●
●
●
●
●
●
●
●
●
●●
●
●●●●●●●●● ●●●
●
●●●●●●●
●
●●●●●●●●●●●●●
●
●
●
●●●●●●●
●
●
●●●●
●
●
●●
●
●
●
●
●
●●●
●
●
●
●●●●●●●●● ●●●
●
●●●●●●
●●●
●
●●●
●
●
●
●●
●
●
●●
●
●
●
●
●
●
●
● ●
●
●●
●
●
●
●
●
●
●
●
●●●
●
●
●
● ●●●●●●●●●●●●●
●
●●●●●●●●●●●
●
●●●●●●●
●
●●●●●
●
●●●●●●
●
●
●
●●●
●
●
●
●
●
●
●
●
●●●●
● ●
●●●●●●●●
●
●●●●●●●● ●●●●●●●●●●●●●●●
●
●
●●●●●●●●●●●●
●
●●●● ●●●
●
●
●
●
●
●
●
●
●
●
●● ● ●●● ●● ●
●
●●●●●●●●●●●●●●●●●●●● ●●●●●●●●
●
●●●●●●●●●
●
●●●● ●●●●
●
●
●
●
● ●●
●
●
● ●●●
●
● ●
●
●● ●●●●●●
●
●●●●●●●●●●●●●●●●●●●●●●●●
●
●●●●●
●
●●●●●
●
●●●●●●● ●● ●●●●●●●●●●
●
● ●
●
●
●● ●●
●
●●
●
●●●●●
●
●● ● ●●●●●
●
●●●●●●●
●
●
●●●●
●
●●●●●
●
●
●
●●●●●●●●●
●
●●●● ●●●●● ●● ●
●
●
●●●● ●●●
●
●●
●
●●●●●●●●●●●●
●
●
●
●●
●●
●●
●
●●●
●
●●●●●●●●●
●
●●● ● ●
●●
●●● ● ●●●●●● ● ●●
●
●
●●● ●●
●
●● ●●●●●
●
●●
●
●●●●
●
●
●
●
●
●
●●●●●●●●
●
●●●●●●●●●●● ●●
●
●●● ● ●●●● ●● ● ●●
●
●●●● ●●●●●●●●●●●●●● ●●
●
●
●
●
●
●
●
●●●●●●●●●●●●
●
●●●●●●● ● ●●●● ●●● ●●
●
●
●
●
●
●
●●●●● ●●●●●●●●●●●
●
● ●
● ● ●
●
●
●
●
●
●●●
●
●●●●●●●
●
●
●●●●●●●●
●
●
●●●
●
●
● ●● ●
●
● ●●●● ●●●●●●●●●●
●
●●
●
●
●
●
●
●
●
●
●
●
●
●
●
●
●●●●
●
●●●
●
●●●●●●●●●
●
●
●
●
●●●●● ● ● ●● ●● ●●● ●●●●●●●
●
●●●●●
●
●
●●
●
●
●
●
●
●
●
●●●●●●●●
●
●●●
●
●
●
●●●●●●●●●●●
●
● ●● ●●●● ●●●●●●●●
●
●●●●●
●
●●
●
●
●
●
●
●
●
●●●●
●
●●
●●
●
●
●
●●
●●●●●
●
●●●●●●●●●●●●
●
●
●●●●●●●●●●●
●
●●●●
●●
●●
●
●
●●
●●●
●
●●●
●
●●●
●
●
●●●
●
●●●●
●
●●●●●●●●●
●
●●● ●●●●●●●●●
●
●●●●
●
●
● ●
●
●
●●
●
●
●●●
●
●
●
●
●●●●●●
●
●●●●●●●●●●●●● ● ●●●●
●
● ●●●●●●●●●●
●●
●
●●●●●
●
●
●
●
●●●●●●●●●●●●●●
●
●
●●
●
●●●●
●
●●
●
● ●●●●●●●●
●
●●●●●● ●●
●
●●
●
●
●
●
●
●
●●
●
●
●
●
●●●●●●●●
●
●
●●
●●●
●
●●●●●●●
●
●
●●●●●●● ●● ●●●●
●
●
●●
●
●
●
●
●
●
●
●
●
●
●
●
●
●●●●●●●●
●
●●●●●●●●●●●●●
●
●● ●●●●●●● ●●●●●●●
●
●●●
●
●●
●
●
●
●●●●
●
●●●●●●●●
●
●●
●
●
●
●
●
●
●●●● ●●●● ● ●●●●●● ●● ●●● ●●●
●
●
●
●●
●
●
● ●
●
●
●
●
●
●
●
●●
●●●
●
●●●●●●●
●
●
●
●● ● ●●●●● ●●● ●●●●●●●●●●
●
●
●
●
●
●
●
●● ●●●●●●
●
●
● ●
●
●●●●●●
●
●
●
●●
●
●
●
● ●●● ●● ● ●●● ●
●
●●●●●●●●
●
●
●
●
●
●
●
●● ● ● ●●
●
●
● ●●
●●
●●
●
●
●●●●
●
●
●
●
●
●
●
●
●●●●● ● ●● ●● ● ●
●
●●●●●●●
●
●●●
●
●
●
●
●● ●●● ● ● ●●
●●
●●●
●
●●
●
●
●
●
●●●●●● ●● ●●●●●●●●● ●● ●
●
● ●
●
●
●
●
●●
●
●
●
●
●
● ●● ●●●
●
● ●●●●●●
●
●
●
●
●
●
●
●
●●●●
●
●● ● ●●●●● ●●
●
●●●●●●●●
●
●
●
●
●
●
●
●
●
● ●●●●●
●
●
● ●●
●
●
●
●
●
●
●
●
●
●
●●●●
●
●
●
● ●● ●●●●●●●●
●
●●● ● ●●
●
●
●
●
●●
●
●
●
●●●●●
●
●
●
●
●
●
●●●
●
●
●
●
●
●
● ●
●
●●
●
●
●
● ● ●●
●
●●●●●●●●●●●● ●
●
●
●
●
●
●
●
●●●
●
●
●
●
●●● ●●
●
●
●●●●●●
●
●
●
● ●
●
●
●
●
●
●
●●
●
●●
● ●●●●●●●● ●●● ● ●●●●
●
●●●●
●
●
●
●●
●
●
●
●●
●
●
●●● ●●●
●
●●
●
●
●
●
●●
●
●
●● ●
●
●
●
●
● ●● ●●● ● ●●●●
●
●● ● ●●●
●
●
●●●
●
●
●●●
●
●
● ●●●● ●●●●
●
●● ●●
●
●●
●
●●●●
●
●●●
●
●
●
●
●
● ●
●
●
●
● ●●●●●
●
●●
●
●
●
●
●●●●●
●
●
●
●●
●●●●
●
●●●●●●●
●
●●●
●
● ●●●
●
●
●
●
●
●
●
●
●
●
●
● ●● ● ●●●● ●
●
●
●
●
●
●●
●
●
●
●●●●
●
●
●
●
●
●
●
●●●●●●●●●●●●●●●●● ●●●●
●
●
●
●
●
●
●
●
●
●
●
●
● ●
●
●●●●●● ●●
●
●
● ●●●
●
●
●●●●
●
●●
●
●●●●●●
●●
●
●●●●●
●
●
●
●●●
●
● ●●●
●
●●●
●
●
●
●
●
●
●
● ● ● ● ●●●●●
●
●●●
●
● ●● ●
●●
●●●
●
●●●●●●●●●●
●
● ●●● ●●●●●●●●●●●●●●● ●
●
●
●
●
●
●
●
●
●
●●●● ●●●●
●
● ●
●
●●
●● ●
●
●
●
●●
●
●●●●●●●
●
●●●●●●●
●
●● ●●●●●●●●●●●
●
●●●● ●
●
●●●
●
●
●
●
●
●
●
●
●
●
● ●
●
●
●
●
●
●
●
●
●
●●● ●●●
●
●
●●●●●●●●●●●●●
●
●●●●
●
●
●
●●●
●
●
●
●
●●
●
● ● ●●
●
●
●●
●
●
●
●
●
●
●●●●●
●
●
●
●
●
●
●
●
●
● ●● ●●●
●●
●●●●●●●●●●●●●●●●● ● ●●● ●●●
●
●
●●●●●●
●
●●●●●
●●
●
●
●●
●
●
●●●
● ●
●
●
●
●
●
●●
● ●
●
●
● ●
●
●
●
●
●●
●
●●●●●●●●●●●●
●
● ●●●
●
●
●
●●
●
●●
●●
●
●
●
●●
●
●●
●
●
●
●
●
●
●
●
●
●
●
●
●
●
●
●
●
●
●
●
●
●
●●
●●
●
●●
●●
●
●●●●● ●●●●●●●●●●● ●●●●●●●
●
●
●●●●●
●
●●
●
●●●●●●●
●
●
●
●●
●
●
●
●
●
●
●
●
●
●
●
●
● ●
●
● ● ●
●
●
●
●
●●
●● ●●●●●●●●●●●●●●●● ●
●
●●
●
●
●
●
●●● ●
●
●●●●●●
●
●
●
●
●
●
●
●
●●●●●
●
●
●
●
●
●
●
● ●
●
●
●● ● ●●●●
●
●●
●
●
●
●●
●
●●●●●●●
●
● ●●●●● ●
●
●● ●●●● ●●●●●
●
●●●●●
●
●●
●
●
●
●
●
●
●
●
●
●
●●
●
●
●
●●●● ●●
●
●●●
●
●●●
●
●
●●●●●●●●●●●●●● ●●●●
●
●
●
●●●●● ●●
●
●●●●●●
●
●
●
●●●
●
●
●
●
●
●
●
●●
● ●
●
●
● ●
● ●
●
●●● ● ●
●
●
●
●
●
●●
●
●
●
●●●●●●●●●●●●●●●●●● ●●
●
●●●●●
●
●●
●
●
●
●●●●
●
●
●
●
●
●
●
●
●
●
●
●
●
●
●
●
●
●
● ●●● ●
● ●
●
●
●
●
●
●
●
●
●
●
●●
●
●
●●
●
●●●●●●●●●●●●●●●●
●
●
●
●
●
●
●
●●● ●
●
●● ●●●●
●
●●●●
●
●
● ●
●
●
●
●
●
●
●
●●
●
●
●
●
●●
●
●
●
●●●●
●
●
●
●
●
●
●
●
●●●
●
●●●●●
●
●
●●●●●●●●●●●●
●
●● ●●●●●
●
●
●
●
●
●●●
●
●●
●
●
●
●
●
●
●
●
●
●
●
●
●
●
●●●●
●●
●
●
●
● ●
●●
●
●
●●
●●●
●
●
●●
●
●
●
●
●
●
●
●
●●
●
●
● ● ●●●●●
●
●●
●●
●● ●●●
●
●
● ● ●
●
●●●●●●●●●
●
●●
●
●
●
●
●●
●
●
●
●
●
●
●
●
●
●
●
●
●
●●
●
●●●● ●●●●●●
●
●
●
●●●
●●●●●
●
●
●
●
●●● ●
●
●
●
●
●
●
●
●
●
●
●● ● ●●●●● ●●●●●●●
●
●
●
●
●
●
●●●
●
●●
●
● ●●●●●●●●
●
●
●
●●
●
●
●
●
●
●
●
●●●●●● ●
●●●
●●
●
●●●●●●
●
●●
●
●●
●●
●
●
●
●
●●
●
●
●●●●●
●
●●
● ● ●
●
●
●
●
●
●
●
●
●
●
●● ●
●
●● ● ●●●
●
●
●
●
●●●
●
●
●
●
●
●
●●●●●
●
●●●●
●
●
●
●●●
●
●●●
●
●
●●
●
●●
●
●●●
●
●●●●●●●●●●●
●
●
●
●●●●●
●
●●●
●●
●
●
●
●●●●
●
●●
●●●
●
●● ●●● ● ●
●
●●
● ●
●
●
●
●
●
●●
●
●
●
●
●●●●●●●●●●
●
●
●
●●
●
●
●
●
●
●
●●●●
●
●●●●●●●●●●●●●
●
●
●●●●●●●●●●● ● ●●●●●●●●●●
●
●●
●
●●●●
●
●
●
●
●●
●
●
●●
●●
●
●
●
●
●
●●●● ●
●
●
●●● ●●
●
●
●
●
●
●
●
●
●
●
●
●
●
●
●
●
●
●● ● ●
●●●●
●
●●●●
●
●
●
●
●
●
●
●
●●●●
●
●●●●●●
●
●●
●
●●●●●●●●
●
●
●●●●
●
●● ●●●● ●
●
●●
●
●●
●
●●
●
●
●●
●
●●●
●
●●●●●●
●
●
●●
●
●
●
●
●
●
●
●
●
●●●●● ●
●
●●●
● ●
●
●
●●
●
●
● ●●
●
●
●
●
●
●
●
●
●
● ●
●
●●●●●
●●
●
●
●
●●
●
●
●
●
●●●●
●
●●●●●●●●●●●●●●●
●
●
●
●
●
●●●●
●
●●
●
●● ● ●
●●
●●
●
●
●
●●●●●
●
●
●
●●●
●
●●●●●
●
●
●
●
●●
●
●
●
●
●
●●
●●
●●
●●●
●
● ●●●
●
● ● ●● ●
●
●
●
●
●
●
●
●
●●
●●
●
●
●
●
●●●●●●●●●
●●
●
●
●
●
●
●●●●●
●
●●●●●●●
●
●●●●●
●
●
●
●●
●
●●●●●●●
●
●
●
●
● ●
●●
●●●
●
●
●●
●●
●
●
●●●●●
●
●
●●
●● ●
●
●
●●
●
●
●●
●
●
●
●
●
●
●
●
●
●
●
● ● ●●●
●
●
●● ● ●●●
●
●
●
●
●
●●
●
●
●
●
●
●
●
●
●
●●●●●●●●●●●●
●
●
●
●●●●●●●●●●●●●●
●
●
●
●
●●
●
●
●
●●
●
●
●
●
●●
●
●●●
●
● ●
●
●
●●●●●●●●
●
●●
●
●
●●●●
●
●●
●
●
●
●
●
●
●
●
●●
●
●
●
●
●●●●●●●●●
●
●●●
●
● ● ●●● ● ●
● ●
●
●
●●●
●●
●●
●
●
●
●● ● ●
●
●●●●●●
●
●●●
●
●
●
●●●
●
●
●
●
●●●●●●
●
●
●●
●
●
●
●●
●
●
●●
●
●●●
●
●
●
●
●
●●
●
●●●●●
●
●●
●
●
●
●
●
●●●
●
●
●
●
●
●●●●
●
●●
●
●
●
●
●
●
●
● ●●●●●●●●●
●
●●●●●●● ●
●
● ● ●
●
●
●
●
●● ●● ●
●●
●
●
●
●●
●
● ●●●
●●
●●●
●●
●●●●
●
●●●●●●
●
●●●●●●●
●
●
●
●
●
●●●●●●●
●
●
●●
●
●
●
●
●
●
●
●
●
●
●●
●
●
●
●●●●●●
●
●●●
●
●●●●●●●●
●
●
●
●
●
●
●
●●●
●
●●●●
●
●●●●●● ●●●
●
●
●
●●● ●●●●●● ●●
●
●
●
●
●
●
●
●
●●●
●
●
●●●●
●
●●●●●●
●
●●●●●●●●
●
●●
●
●●●●
●
●●●
●
●
●
●
●
●
●
●
●●
●●
●
●●
●
●
●●
●
●
●
●
●
●
●
●
●
●
●
●●●●●●●●●
●
●●●
●
●●
●
●
●
●●
●
●
●●●● ●
●
●●
●
●
●
●●●● ●● ●●●
●
●●
●
●●●● ●● ● ●●●
●●
●
●
●
●
●
●●
●
●
●
●●● ●●●●●●●●●
●
●●●
●
●
●
●
●●●●●●●●●●●
●
●
●
●
●●●
●
●●●
●
●●
●
●
●
●●
●
●
●
●
●●
●
●
●
●
●
●
●
●
●●
●
●●●
●
●
●
●●
●●● ●
●
●● ●
●
●
●
●●
●
● ●
●●●●
●
● ●●●●●●● ●●●
●
●●●●● ●
●
●
●
●
● ● ●● ●●
●
●
●
●●
●
●●
●
●●●
●
●●●●●●●●●●●●●●
●
●
●
●●●
●
●●●●●●●●●
●
●●●
●
●●
●
●●
●●
●
●●●● ●
●
●●
●
●●●●
●
●●●
●
●●●●●●●
●
●
●
●
●
●●
●
●
●
●●●
●
●●● ● ●● ●●●● ●●
●
●●
●
●●●●● ●●●● ●●●●● ●
●
● ●● ●
●
●●●● ●●●●●
●
●●● ●
●
●
●
●
●●●●●●●●●●●●●
●
●●
●
●
●●●●
●
●●
●
●●●●●●
●
●●
●
●●●
●
● ●●●
●
● ●●●●●●●●●●●●●●
●
●●●●●●●● ●●●●●
●
● ●
●
●●●●● ● ●●● ●●●
●
●●
●
● ● ●●●● ● ●●●●●●●●●●● ●●● ●
●
●
●
●
●
● ●●●● ●
●
●
●
●
●
●
●●●●●
●
●
●
●
●
●●
●
●
●
●
●
●
●
●
●●
●
●
●
●●●
●
●●●●●
●
●●●
●
●●● ●
●
●
●
●
●
●
●●●
●
●
●●
●●●
●
●
●
●
●●
●
●
●
●
●●●● ●●●●
●
●
● ●●●●● ●● ●
●
●●●●●●● ● ●
●
●●●●●●●●●●●●●●
●
●
●
●
●
● ●●
●
●
● ●
●
●
●
●
●
●
●
●
●
●
●
●●●●●
●●
●●
●
●
●
●
●
●
●
●
●●●●●●●
●
●
●●
●
●●●● ●●● ●
●
●●●●●●●●
●
●
●
●
●
●
●
●
●
●
●
●
●
●
●
●
●
●●●●●●● ●●●
●
●
●
●●●●● ●
●
●
●
● ●●●●●●●
●
●
●
●
●●
●
●
● ●
●
●
●
●
●
●
●● ●
●
●●
●
●
●
●●●●
●
●
●
●
●●●
●
●
●
●
●
●
●
●
●●●●
●
●
●
●●
●
●●●●●●●
●
●
● ●●● ● ●
●
●●●
●
●●●●●●●
●
●
●
●
●
●●
●●●●●●●●●●
●
●
●●●●●●●●●
●
●
●
●●
●●
●
●●
●
●●● ●●●●●
●
●
●
●●●●
●
●●
●
● ●●●●●●●●●●●●●
●
●
●
●
●
●
●
●
●
●
●
●
●●
●
●
●
●
●
●●●●●
●
●●
●
●●●●● ●
●●
●
●●●
●
●
●●●●●●●
●
●
●
●
●
●
●
●●●●●●●●●● ●● ●●●●●●●●●● ●●
●
●●●●
●●
●
●
●
● ●●
●
●●●
●
●●●●●●●●●
●
● ●●● ●●●●
●
●●●●●
●
●
●
●
●
●
●
●
●●
●
●●
●●●
●
●●●●
●
●●
●
●●
●●
●
●●●● ●
●
●●●
●
●●●●
●
●
●
● ●
●
●
●●
●
●●●●●●●●●●●●●●●●●●●●● ●
●
●●●●●●●●
●
●●●●●●●●●●●●●
●
●●●
●
●●● ●● ●●●●●●●●●
●
●●
●
●
●
●
●
●
●●
●
●
●
●●
●
●●●●●●
●●
●●●●●
●
●●●●
●
●
●
● ● ●●
●
●●●●●●
●●
● ●●●●●●
●
●●●●●●●●●●●
●
●●
●
●●●●●●●●●●
●
●
●●●●●
●
●●●●●●●●●●●●●●●●●
●
● ●●●●●●●●●●●●●●
●
●
●
●
●●
●
●
●
●●
●●●●●●●●●●●●
●
●
●
●●●●
●
●
●
●
●
●
●
●●●●●●●●●●
●
●
●●●●●●●●●●●●●●●●●●●●
●
●●●●●●
●
●●●●●●●●●●●●●●●
●
●
●●●●●
●
●●
●
●●●●●●●●●●●●●●●●●●●●
●
●●●
●
●
●
●
●
●
●
●
●●
●
●●●●
●
●
●
●●●
●
●●●●
●
●
●
●
●
●
●
●
●●●●●●●●●
●
●●●●●●●●●●
●
●
●
●
●●●●●●●●●●●●●●●●●●●
●
●●●
●
●●●●●●●●●●●●●●●●●●●●
●
●●●●●●●●●●●●●●●●
●●
●
●
●●●●●●●●●●●●●
●
●●
●
●
●
●●●
●
●●
●
●
●
●
●
●
●
●
●●●
●
●●●●●●●●●●●●●●
●
●●●●●●●
●
●●●●
●
●●●●
●
●●●
●
●●●●●●●●●●●●●●●●●●●●●●●●●
●
●●●●●●●●●●
●
●●●
●
●●
●
●
●
●●●●●●●●●●●●
●
●
●
●●●●●●
●
●
●●●●
●
●
●
●●●●●●●●●●●●●●●●●●●●●●●●●●●●●●●●●
●
●
●
●●●●●●●●●●●●●●●●●●●●●●●●●●●●●●●●●●●●●●●●●●●●●●●●●●
●●
●●●●●●●●●●●●●●●●●●●●
●
●
●●
●
●●●●●●●●●●●●●●●●●●●●●●●●●●●●●●●●
●
●●●●●
●
●●●●●●●●
●
●●●●●●
●
●●●●●●●●●●●●●●●●●●●●●●●●●●●●●●●●●●●●●●●●●●●●●●●●●●●●●●●●●
●
●●●●●●●●●●●●●●●●●●●●●●●●●●●●●●●●●●●●●●●●
●
●●●●●●●●●●●●●●
●●
●●●●●●●●●●●●●●●●●●●●●●●●●●
●
●●●●●●●●●●●●●●●●●●●●●●●●●●●●●
●
●●●●●●●●●●●●●●●●●●●●●●●●●●●●●●●●●●●●●●●●●●●●●●●●●●●●●●
●
●●●●●●●●●●●●●●●●●●●●
●
●
●
●●●●●●
●
●●●●●●●●●●●●●●●●●●●●●●●●●●●●●●●
●
●●●●●●●●●●●●●●●●●●●●●●●●●●●●●●●●●●
●
●
●
●●●●●●●●●
●●
●●●●●●●●●●●●●●●●●●●●●●●●●●●●●●●●●●●●●
●
●●●●●●●●●●●●●
●
●●●●●●●●●●●●●●●●●●●●●●●●●●●●●●●●●●●●●●●●●●●●●●●●●●●●●
●
●●●
●
●●●●●●●●●●
●
●●●●●●●●●●●●●●●●●●●●●●●●●●●●●●●●●●●●●●●
●
●●●●●●●●●●●●●●●●●●●●●●●●●●●●●●●●●●●●●●●●●●●●●●●
●
●●●●●●●●●●●●
●
●●●●●●●●●●●●●●●●●●●●●●●
●
●●●●●●●●●●●●●●●●●●●●●●●●●●
●
●●●●●●●
●
●●●●●●●●●●●●●●●●●●●●●●●●●●●●●●●●●●●●●
●
●●●●●●●●
●
●●●●●●●●●●●●●●●●●●●●●●●
●
●●●●●●●●●●●●●●●●●●
●
●●●●●●●●●●●●●●●●
●
●●●●●●●●●●●●●●●●●●●●●●●●●●●●●●●●●●
●
●●●●
●
●●●●●●●●●●●●●●●●●●●●●●●●●●
●
●●●●●●●●●●●●●●●●●●●●●●●●●●
●
●●●●●●
●
●●●●●●●●●●●●●●●●●●●●●●●●●●●●●●●●●●●●●●●●●●●●●●●●●●●●●●●●●●●●●●●●●●●●●●●●●●●●
●
●
●●
●●●●●●●●●●●●●●●●●●●●●●●●●●●●●●●●●●●●●●●●●●●●●●●●●●●●●●●●●●●●●●●●●●●●●●●●●●●●●●●●●●●●●●●●●●●●●●●●●●●●●●●
●
●
●
●
●●●●●●●●●●●●●●●●●●●●●●●●●●●●●●●●●●●●●●●●●●●●●●●●●●●●●●●●●●●●●●●●●●●●●●●●●●●●●●●●●●●●●●●●●●●●●●●●●●●●●●●●●●●●
●
●●●●●●●●●●●●●●●●●●●●●●●●●●●●●●●●●●●●●●●●●●●●●●●●●
●
●●●●●●●●●●●●●●●●●●●●●●●●●●●●●●●●●●●●●●●●●●●●●●●●●●●●●●●●●●●●●●●●●●●●●●●●●●●●●●●●●●●●●●●●●●●●●●●●●●●●●●●●●●●●●●●●●●●●●●●●●●●●●●●●●●●●●●●●●●●●●
●
●●●●●●●●●●●●●●●●●●●●●●●●●●●●●●●●●●●●●●●●●●●●●●●●●●●●●●●●●●●●●●●●●●●●●●●●●●●●●●●●●●●●●●●●●●●●●●●●●●●●●●●●●●●●●●●●●●●●●●●●●●●●●●●●●●●●●●●●●●●●●●●●●
●
●●●●●●●●●●●●●
●
●
●●●●●
●
●●●●●●●●●●●●●●●●●●●●●●●●●●●●●●●●●●●●●●●●●●●●●●●●●●●●●●●●●●●●●●●●●●●●●●●●●●●●●●●●●●●●●●●●●●●●●●●●●●●●●●●●●●●●●●●●●●●●●●●●●●●●●●●●●●●●●●●●●●●●●●●●●●●●●●●●●●●●●●●●●●●●●●●●●●●●●●●●●●●●●
●
●●●●●●●●●●●●●●●●●● ●●●●●●●●●●●●●
●
●●●●●●●●●●●●●●●●●●●●●●●●●●●●●●●●●●●●●●●●●●
●
●●●●●●●●●●●●●●●●●●●●●●●●●●●●●●●●●●●●●●●●●●●●●● ●●●●●●●●●●●●
●
●●●●●●●●●●●●●●●●●●●●●●●●●●●●●●●●●●●●●●●●●●●●●●●●●●●●●●●●●●●●●●●●●●●●●●●●●●●●●●●●●●●●●●●● ●●●●●●●●●●●●●●●●●●●●●●●●●●●●●●●●●●●●●●●●●●●●●●●●●●●●●●●●●●●●●●●●●●●●●●●●●●●●●●●●●●●●●●●●●●●●●●●●●●
●
●
●
●●●●
●
●●●●●●●●
●
●●●●●●●●●●●●●●●●●●●●●●●●●●●●●●●●●●●●●●●●●●●●●●●●●●●●●●●●●●●●●●●●●●●●●●●●●●●●●●●●●●
●
●
●
●●●●●●●
●
●●●●●●●●●●●●●●●●●●●●●●●●●●●●●●●●●●●●●●●●●●●●●●●●●●●●●●●●●●●●●●●●●●●●●●●●●●●●●●●●●●●●● ●
●
●●●●●
●
●●●●●●●●●●●●●●●●●●●●●●●●●●●●●●●●●●●●●●●●●●●●●●●●●●●●●●●●●●●●●●●●●●●●●●●●●●●●●●●●●●●●●●●
●
●
●●●●●●●●●●●●●●●
●
●●●●●●●●●●●●●●●
●
●●●●●●●●●●●●●●●●●●●●●●●●●●●●●●●●●●●●●●●●●●●●●●●●●●●●●●●●●●●●●
●
●●●●●●
●
●●●
●
●●●●●●●●●●●●●●●●●●●●●●●●●●●●●●●●●●●●●●●●●●●●●●●●●●●●●●●●●●●●●●●●●●●●●●●●●●●●●●● ●●●●
●
●●●●●●●●●●●
●
●●●●●●●●●●●●●●●●●●●●●●●●●●●●●●●●●●●●●●●●●●●●●●●●●●●●●●●●●●●●●●●●●●●●●●●●●●●●●●● ●●●●●●
●
●●
●
●●●●●●●●●●●●●●●●●●●●●●●●●●●●●●●●●●●●●●●●●●●●●●●●●●●●●●●●●●●●●●●●●●●●●●●●●●●●●●●● ●
●
●
●●●●
●
●●●●●●●●●●●●●●●●●●●●●●●●●●●●●●●●●●●●●●●●●●●●●●●●●●●●●●●●●●●●●●●●●●●●●●●●●●●●●●●●●●●● ●
●
●●
●
●●●●●●●●●●● ●●●●●●●●●●●●●●●●●●●●●●●●●●●●●●●●●●●●●●●●●●●●●●●●●●●●●●●●●●●●●●●●●●●●●●●●●●
●
●
●●●●
●
● ●●●●●●● ●●●●●●●●
●
●●●●●●●●●●●●●●●●●●●●●●●●●●●●●●●●●●●●●●●●●●●●●●●●●●●●●●●●●●●●● ● ●
●
●
●
●
●
●●●● ●●●●●●●●●●●●●●●●●●●●●●●●●●
●
●●●●●●●●●●●●●●●●●●●●●●●●●●
●
●●●●●●●●●●●●●●●●●
●
●●●
●
●
●
●
●
●
●●
●
●●●
●
●
●●●●● ●●●●●
●
●●●●●●●●●●●●●●
●
●
●
●●●●●●●●●●●
●
●●
●
●●●●●●●●●●●●●●●●●●●●
●
● ●●
●
●●●●●●● ●●●●●●●●●●●●●●●●
●
●
●●●●●●●●●●●●●●●●●●●●●
●
●
●
●●●●●●
●
●● ●●●● ●●●●●●●●●●●●●●●●●●●●●●
●
●●●●●●●●●●●●●●●●●
●
●
●●●●●●●●
●
● ●●●●●●●●●●●●●●●●●●●●●●●●●●●●●●
●
●
●●●●●●●●●●
●
●
●●
●
●
●
●●●●●●●●●●●
●
●●
●
●●●●●
●
●
●
●●●●●●●
●
●
●
●●●
●●
●●●
●
●●
●
●●●●●
●
●
●●●●●●●●●●
●●
●●●●●●●●●●●●●
●
●
●
●
●
●●
●●●
●
●
●
●
●
●
●●
●●
●●●●●
●
●●●●●●
●
●
●
●
●
●
●
●
●
●
●
●
●
●●
●
●●
●
●
●
●
●
●
●
●●●●●●●
●
●
●
●
●
●
●
●
●
●
●
●
●
●
●
●●
●
●
●●●●●●●●●●
●
●
●
●
●
●
●
●
●
●
●
●
●
●
●
●
●●●●
●
●
●
●
●
●
●
●
●
●
●
●●
●
●
●
●●●
●
●●●
●
●●●●●●●●
Correlation = 0.17
0
1
2
3
4
0.0 0.2 0.4 0.6Average Maize Yield Levels
Ave
rage
Num
ber
of C
onfli
cts
Figure 2.4: The linear correlation between annual wheat (left) and maize yields(right) and conflict by 0.5 ◦ grids, 1998-2008. Conflict measures arepresented in natural log form.
below the mean) providing a straightforward measure of rainfall shocks and—
correspondingly—their impact on food production. This variable and its validity
is discussed in great detail in the next section.
The main models reported below also employ different controls for important
potential confounders. First, considering the potential impact of population pres-
sures on food availability and the number of conflict events as raised by previous
studies (e.g., Homer-Dixon, 1998), I account for population density in a given cell
during a given year using the variable population (Nordhaus, 2006). This cell-
level variable was originally measured for the years 1995, 2000, and 2005 and then
interpolated to the yearly level using a last-value-carried-forward approach (Tollef-
sen et al., 2012). To control for spatial correlation, I include a binary spatial lag
of the dependent variable, conflict (spatial), denoting whether any conflict events
62

occurred in the first-order neighboring cells. I also include a one-year lag of the de-
pendent variable, conflict (lag), to control for the temporal dependence of conflict
events, alongside annual and grid cell fixed effects.
Crucially, these variables are all measured at the grid cell, and not country,
level. Furthermore, the crop yield measures used for analysis are time varying,
which provides a major improvement over past studies of this sort that have fa-
vored static measures of cropland at comparable levels of geographic resolution
(e.g., Koren and Bagozzi, 2016; O’Loughlin et al., 2012). Nevertheless, to account
for alternative explanations (e.g., Fearon and Laitin, 2003; Bannon and Collier,
2003), several country level indicators were also included in analysis. The democ-
racy measure is the ordinal Polity2 indicator, with higher values corresponding
to more democratic regimes (Marshall, Jaggers and Gurr, 2013). The gross do-
mestic product (GDP) per capita measure, GDP per capita, was obtained from
the World Bank (2012). Finally, a large number of alternative mechanisms are
evaluated in the Competing Mechanisms section below. For summary purposes,
all variables—including those used in sensitivity analyses —are reported in Table
2.2.
Identification Strategy
Local food yields cannot be argued to be exogenous to localized conflict, because
the latter might devastate infrastructure in the region and generate more popula-
tion pressures (e.g., via troops moving in). This suggests that the estimates pro-
vided by OLS regressions are likely to be biased due to simultaneity between the
main explanatory variable and the dependent variable. The identification strategy
63

Table 2.2: Summary Statistics of All Variables
Minimum Median Mean Max SD
Grid Cell Level VariablesConflict 0 0 0.228 334 2.854Wheat yield 0 2.63e-05 0.009 0.930 0.047Maize yield 0 0.004 0.016 0.667 0.034Drought 0 0 0.229 2.5 0.654Conflict (lag) 0 0 0.182 334 2.523Conflict (spatial) 0 0 0.091 1 0.287Population1 0 9.721 9.369 16.268 2.263Nighttime light 0.021 0.034 0.040 0.941 0.032Ethnic diversity 0 1 1.325 7 1.177Terr. change 0 0 0.007 1 0.081Temperature 3.625 24.675 24.382 32.617 3.774Temperature (lag) 3.625 24.658 24.364 32.617 3.778Wheat yield (lag) 0 2.58e-05 0.009 0.930 0.047Maize yield (lag) 0 0.004 0.016 0.642 0.034Violent conflict 0 0 0.069 220 1.209Violent conflict (lag) 0 0 0.055 220 1.038Military conflict 0 0 0.103 286 1.726Military conflict (lag) 0 0 0.081 286 1.550Conflict1 0 0 0.062 5.814 0.320Conflict (lag)1 0 0 0.047 5.814 0.289Any drought 0 0 0.123 1 0.328Severe drought 0 0 0.088 1 0.283Extreme drought 0 0 0.062 1 0.241Country Level VariablesDemocracy -9 0 0.214 10 5.084GDP per capita1 5.517 7.350 7.547 10.341 1.106Food imports (%) 0.474 16.493 17.313 62.416 7.510Agricultural imports (%) 0.146 1.175 1.870 42.322 3.040Foreign aid1 15.713 20.040 19.947 23.240 1.269Oil production1 0 13.592 9.170 18.690 8.075Gas production1 0 0 1.663 7.192 2.369Military expenditure1,2 0 12.612 12.536 15.350 1.645Cereal prod. index 0.015 91.957 99.050 882.89 57.648Meat prod. index 0.032 91.620 93.835 737.38 52.157
1 natural log2 This variable is only available for the years 1998-2007
64

used in this article therefore relies on the use of an instrumental variable (IV), i.e.,
a variable that is correlated with food production but arguably uncorrelated with
the error term of violent conflict. This framework is in line with previous studies
of the relationship between agriculture and economic growth, climate, and conflict
(e.g., Miguel, Satyanath and Sergenti, 2004; Sarsons, 2015; Bellemare, 2015).
Recall that an IV must satisfy two requirements. First, it must be correlated
with food production at the local level. To this extent, Table 2.4 shows that the
instrument is not weak, excluding, perhaps, the Full specifications. Second, the
IV must only affect violent conflict through food production, a requirement that
is also known as meeting the exclusion restriction (Angrist and Pischke, 2009).
To account for the potentially endogenous relationship and “feedback effects”
between violent conflict and food production, and obtain consistent estimates, I
rely on the ordinal drought indicator discussed above, which is crucially measured
at the annual grid level, in a manner consistent with previous research (e.g., Miguel,
Satyanath and Sergenti, 2004; Crost and Felter, 2016). As a climatic indicator,
this instrument is highly unlikely to be directly endogenous with violent conflict.
At the same time, this instrument is likely to be highly correlated with local wheat
and maize yields, which means that the IV models identify the true relationship
between food security and conflict, conditional on droughts, and are thus preferred
to their OLS counterparts. This is easily ascertained with statistical tests—in
effect, tests of the null hypothesis that the instrument is weak—the results of
which are shown in Table 2.4. Moreover, the effect of droughts on food production
and on increasing food scarcities has been the tenet of previous studies of the
climate-conflict nexus (e.g., O’Loughlin et al., 2012).
The use of the IV drought combined with unit-of-analysis fixed effects also
65

helped to tackle concerns related to unobserved heterogeneity, measurement error,
and reverse causality. First, in addition to the two requirements from a valid
IV—that it is exogenous to the dependent variable and that it is correlated with
the endogenous explanatory variables, both of which have been discussed and
analyzed both qualitatively and quantitatively in the main paper—one can add
a third requirement; that the IV will have a monotonic effect on the dependent
variable (Angrist and Pischke, 2009; Sovey and Green, 2011). The term “monotonic
effect” refers to the notion that the instrument does not impact the instrumented
endogenous variable differently in different locations, and not produces a positive
impact in some and a negative impact in other locations. If this requirement is
satisfied, then the average LATE of food yields is weighted in respect to conflict
throughout the entire sample.
This requirement highlights one advantage of using droughts as the instrument;
as mentioned above, drought ought to decrease yields everywhere in Africa, and not
causes decreases in some grid cells, but increases in others. The effect of drought
on conflict through maize and wheat yields is thus monotonic, because in every
grid cells and years where drought effected conflict through food production, it did
so in the same way, with higher levels of drought translating to lower food crop
yields, while the absence of drought causes higher yields. Moreover, while the use
of rainfall shocks as an IV to approximate shocks to growth has been questioned by
some due to its predictability (as discussed in detail below), the annual variation in
droughts—strong, negative shocks—is less predictable, and the use of annual fixed
effects controls for increases in droughts that are time dependent. Last, recall that
although it is plausible that conflict can affect food crop yields, a reverse causality
between conflict and drought is quite implausible; rather, the causal arrow most
66

likely flows from droughts to conflict.
It is important to recognize, however, that previous research suggested that—in
some situations—rainfall shocks might not necessarily pass the exclusion restric-
tion. Sarsons (2015), for instance, relies on information on dam construction in
India to illustrate that while income in downstream areas is less sensitive to rainfall
fluctuations, rainfall shocks remain a strong predictor of riots in these contexts. As
this is not a trivial concern, I address it both theoretically and empirically. First,
note that, perhaps even more so than in India (the focus of Sarson’s study), most
agriculture in Africa (especially Sub-Saharan Africa) during the ten-year period
analyzed here depended almost exclusively on rainfall (Food and Agriculture Or-
ganization of the United Nations, 2008; Kastner et al., 2012). As a result of this
high dependence on precipitation, the amount of land required to produce food in
these regions actually increased over time, as opposed to Asia, where researchers
observed notable decreases in the amount of land required to support a certain
number of people (Kastner et al., 2012).
These context-specific differences suggest that, at least from a theoretical per-
spective, the use of drought as an instrument for the impact of local food yields
on conflict in Africa is defensible. Moreover, rainfall can impact conflict through
both positive and negative deviations from the mean, with too much precipitation
causing overly high levels of soil moisture, thus increasing the risk of crop disease
(Food and Agriculture Organization of the United Nations, 2008). This suggests
that the impact of being located down- vs. upstream from irrigation dams as
identified by Sarsons (2015) is more likely during positive rainfall shocks. To help
accounting for this concern, I restrict my drought instrument to focus only on neg-
ative rainfall shocks as discussed above. This approach also builds on Dell, Jones
67

and Olken, who note that, “[a] promising direction for research on droughts would
construct a drought definition based solely on exogenous environmental variables
such as precipitation” (2014, 755).
I also address this concern empirically. First, note that Sarsons shows that the
violation of the exclusion restriction for rainfall-based instruments is the results
of location, specifically, rather than issues such as conflict spillovers or migration
(2015, 67-68). This in contrast to the latter’s impact of economy-wide effects at
the country level, where these and other channels might be at play (Carleton and
Hsiang, 2016; Dell, Jones and Olken, 2014). To account for constant factors such
as geographic locations at the highly disaggregated geo-spatial level, I include fixed
effects for each grid-cell in my sample and cluster standard errors at a similar level
to address heterogeneities. Considering the relatively small size of this unit of
analysis (0.5 x 0.5 grid) compared with, say, the province or even district levels,
this approach should help fix much of the geo-spatial variance within my sample,
including variance resulting from upstream vs. downstream locations.
More importantly, however, I rely on the method developed by Conley, Hansen
and Rossi (2012) to allow for departures from the exclusion restriction, i.e., allow-
ing the IV to have some direct effect on conflict that is not exclusively restricted
to food yields, to show that this IV is still “plausibly exogenous.” Briefly, Conley,
Hansen and Rossi (2012) identify that, often, the exclusion restriction is suspect
because many IVs are endogenous to some extent. To test how much a given IV
violates the exclusion restriction, they accordingly present several practical meth-
ods for performing inference while relaxing the exclusion restriction and showing
that an IV can pass a certain threshold of endogeneity but still remain exogenous
enough for the purpose of inference. Indeed, as shown in Table 2.6 and discussed
68

in more detail below, the IV drought survives local-to-zero approximation tests for
“plausible exogeneity,” suggesting that—empirically—the use of this IV is defen-
sible (Conley, Hansen and Rossi, 2012).
If the instrument is valid and effectively exogenizes food production relative
to conflict, then the coefficients for wheat yield and maize yield are the weighted
average, covariate specific local average treatment effects (“average LATE”) of food
production on violent conflict, i.e., the increase in the extent of violent conflict
(as measured by the continuous dependent variable) due to food production in
those grid cells and years where droughts induce a change in maize and wheat
yields, accounting for other covariates (Angrist and Pischke, 2009, 130). Hence,
the relationship between food production and conflict at the local level is identified
using the following two-equation system in the IV models:
yit = α1 + β1f fit + β1yyi,t−1 + β1syst + β1XXit + Φ1i + Ψ1t + ε1it (2.1)
fit = α2 + β2ccit + β2yyi,t−1 + β2syst + β2XXit + Φ2i + Ψ2t + ν2it (2.2)
Where yit is a vector of violent conflict incidents by grid cell for each year;
yi,t−1 is the temporal lag of the dependent variable; yst denotes whether conflict
occurred in neighboring cells or not each year; Xit is a matrix of control variables;
Φi are Ψt are fixed effects by grid cell and year, respectively; α are the constants
for each equation;10 ε1it is the error term for the second stage regression and ν2it is
10These intercepts are not included in the regression outputs below as all variables are de-meaned and the “within transformation” is applied to multiple factors (Gaure, 2013).
69

the error term of the first stage regression. In this system, fit is the instrumented
effect of wheat or maize yields as estimated by equation 2, i.e., the increase in the
extent of violent conflict (as measured by the dependent variable) due to wheat
or maize yields in grid cells and years where drought, captured by the vector cit,
induces a change in crop yields. Due to the panel nature of the data, heterogeneity
of errors across years is a possibility, and hence grid cell-clustered standard errors
for all models are used to assess statistical significance.
To treat the observed quantities on all variables for each cell as non-random,
fixed effects for each grid cell were included in all models; and fixed effects for each
year covered in the data (1998-2008) were also included to account for potential
time dependencies. The use of unit of analysis fixed effects—i.e., including binary
variables for the units of analysis, in this case grid cells, to capture observed
and unobserved influences on an outcome of interest (the frequency of conflict in
this case) that are constant over time—is a well-established statistical procedure
for identifying causal relationships (Angrist and Pischke, 2009). This approach,
combined with the use of a valid instrument to “exogenize” the effects of the
endogenous explanatory indicators, allows the IV models to isolate localized food
production effects and make the case for a consistently significant higher risk of
conflict with increased yields.
Results
To evaluate the effect of local food yields on conflict I estimate two separate spec-
ifications for each crop. These models build on the availability and access aspects
of food security as described by Barrett, two concepts that are “inherently hi-
70

erarchical, with availability necessary but not sufficient to ensure access” (2010,
825). Considering that food availability is “typically measured in daily calories per
person” (Barrett, 2010, 825), the Baseline—or availability—model includes only
food yields, i.e. the total amount of wheat or maize available in a given grid cell
during a given year (exogenized by drought in the IV models) in addition to grid
cell and year fixed effects to account for constant observed and unobserved con-
founders. Building on the definition of food access as “the range of food choices
open to the person(s), given their income, prevailing prices, and formal or informal
safety net arrangements through which they can access food” (Barrett, 2010, 825),
the Full specifications incorporate a variety of controls (discussed in the previous
section) alongside food yields to account for the impact of salient political and
socioeconomic conditions.
Table 2.3 reports the coefficient estimates of four OLS models that each assesses
the likelihood of cell-year conflict in Africa. The effect of these variables is then
compared to their average LATE in Table 2.4. The first-stage regression estimates
for the IV models are reported and discussed in Table 2.5 below. The hypothesized
relationship between food productivity and conflict is evaluated against benchmark
explanations of conflict risk: socioeconomic and political indicators, and conflict
history (Fearon and Laitin, 2003; Bannon and Collier, 2003). The linear effect of
wheat and maize yields on conflict without accounting for endogeneity concerns
is estimated in Models 1-4. The exogenized effect of these indicators on localized
conflict is then estimated in a series of IV regressions in Models 1E-4E.
In Model 1, wheat yield has a negative but statistically insignificant effect on
conflict. However, by destroying infrastructure, causing civilian producers to flee,
71

Table 2.3: OLS regression models for total number of conflict events per grid cell,1998-2008
Wheat Yield Maize Yield1) Baseline 2) Full 3) Baseline 4) Full
Wheat yield -0.517 -0.528 – –(0.464) (0.472)
Maize yield – – -3.749** -3.111***(1.682) (1.188)
Conflict (lag) – 0.202** – 0.202**(0.084) (0.084)
Conflict (spatial) – 0.337*** – 0.336***(0.083) (0.083)
Population1 – -0.663*** – -0.633***(0.190) (0.187)
Democracy – -0.022** – -0.022**(0.010) (0.010)
GDP per capita1 – 0.019 – 0.024(0.173) (0.172)
Observations 72,213 68,204 72,213 68,204R2 0.454 0.429 0.454 0.429Adjusted R2 0.400 0.370 0.400 0.370
* indicates p < 0.1; ** indicates p < 0.05; *** indicates p < 0.01 (two-tail test).Cell values are OLS regression coefficient estimates with standard errors clustered by grid-cellin parentheses. Grid cell and year fixed effects included in each regression though not reported
here.1 Natural log
or through “scorched earth” tactics, conflict might also negatively impact food
production. This coefficient estimate might thus reflect, at least partly, the effect
of conflict on food yields, which obscures the true effect of local yields on violence.
Model 1E, where the effect of local food production with respect to conflict is
instrumented using drought, accounts for this likely scenario. Here, wheat yield is
positively and significantly associated with the incidence of conflict, which suggests
that conditional on average conflict in a given cell, localized conflicts arise more
often during years of high yields.
The Full (or “access”) specification presented in Models 2 and 2E include a
variety of controls to show that these results are indeed consistent with the addition
of a large number of socioeconomic, political, and spatial-temporal confounders.
Here, the effects of GDP per capita, democratization levels, population density, as
72
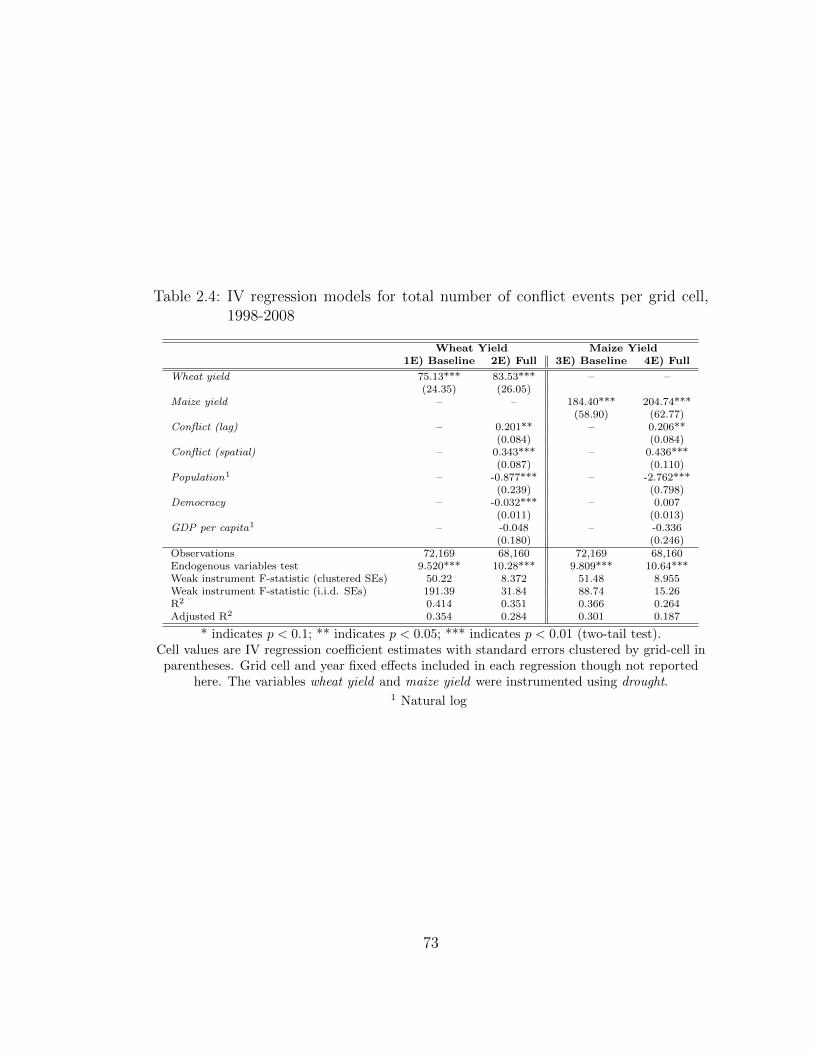
Table 2.4: IV regression models for total number of conflict events per grid cell,1998-2008
Wheat Yield Maize Yield1E) Baseline 2E) Full 3E) Baseline 4E) Full
Wheat yield 75.13*** 83.53*** – –(24.35) (26.05)
Maize yield – – 184.40*** 204.74***(58.90) (62.77)
Conflict (lag) – 0.201** – 0.206**(0.084) (0.084)
Conflict (spatial) – 0.343*** – 0.436***(0.087) (0.110)
Population1 – -0.877*** – -2.762***(0.239) (0.798)
Democracy – -0.032*** – 0.007(0.011) (0.013)
GDP per capita1 – -0.048 – -0.336(0.180) (0.246)
Observations 72,169 68,160 72,169 68,160Endogenous variables test 9.520*** 10.28*** 9.809*** 10.64***Weak instrument F-statistic (clustered SEs) 50.22 8.372 51.48 8.955Weak instrument F-statistic (i.i.d. SEs) 191.39 31.84 88.74 15.26R2 0.414 0.351 0.366 0.264Adjusted R2 0.354 0.284 0.301 0.187
* indicates p < 0.1; ** indicates p < 0.05; *** indicates p < 0.01 (two-tail test).Cell values are IV regression coefficient estimates with standard errors clustered by grid-cell inparentheses. Grid cell and year fixed effects included in each regression though not reported
here. The variables wheat yield and maize yield were instrumented using drought.1 Natural log
73

well as spatial and temporal conflict dependencies are evaluated, in addition to the
wheat yield variable included in Models 1 and 1E. While the effect of within-grid cell
wheat production on violent conflict in Model 2 is again statistically insignificant,
the instrumented effect of wheat yield is positive and statistically significant in
Model 2E, even with the inclusion of these alternative explanations. This again
confirms the argument that, on average, years with higher yields increase the
frequency of conflict within a given cell.
Models 3-4 and 3E-4E estimate the same specifications, this time using maize
as an approximation of local food availability. The effect of maize yields is negative
and significant in the Baseline and Full models for the OLS regressions. Yet, in
the IV models maize yield is consistently positive and significant across both the
Baseline and Full specifications. These findings again support the hypothesis that
conflict within a given grid cell is likely—on average—to arise during years with
higher yields, when the conditional impact of droughts on annual yields by grid
cell is estimated. Moreover, diagnostic regressions of the instrument drought on
the yield variables presented in Table 2.5 below, are significant, suggesting that
the IV estimates are indeed informative (Angrist and Pischke, 2009).11
The estimated impact of staple crop yields on local conflict frequency is sizable:
focusing on Model 1E as the benchmark, the average marginal effect for wheat yield
indicates that a 0% to 100% change in wheat yields increases the predicted num-
ber of conflict events in a given grid cell during a given year by approximately 75
incidents. This suggests that for a mere 1% increase in wheat yield, the predicted
number of conflict events by cell increases by approximately 0.75 incidents. Con-
11For all specifications, statistically significant (to the five percent level) Hausman test es-timates suggest the random effects assumption is less likely to be supported by the data, thussupporting the use of a fixed effects framework.
74

sidering that the average number of conflict events for an average grid cell, during
a given year for the entire 1998-2008 period, is 0.228, this effect is substantial.
More broadly, endogenous variable tests are significant, suggesting that endo-
geneity between the dependent and explanatory variables likely exists and thus
supporting the use of IV models. In Models 1E and 3E the F-statistic for a weak
instrument far exceeds the threshold of 10 (Stock and Yogo, 2002) for an IV not
to be considered weak, while in Models 2E and 4E the instrument is borderline
weak when clustered standard errors are used, suggesting that this model might
be marginally biased toward OLS estimates. Thus, this analytical framework and
the consistency of the results across different specifications suggest that positive
local food yields have a strong impact on localized conflict in Africa. This effect is
not unique to one crop, but rather characterizes at least two distinct staple foods.
Crucially, Models 2E and 4E clearly show that this finding is not the result of local
population densities, higher levels of state presence, or economic development, all
of which are controlled for by these models.
Before proceeding to the sensitivity analysis, the first stage regression estimates
of the 2SLS models from Table 2.4 are provided in Table 2.5. As can be clearly
observed, drought has a highly statistical effect (to the 1 percent level) on both
wheat yield and maize yield. Moreover, the R2 values of all models are exceptionally
high, with the (adjusted) R2 of the Baseline models being higher than that of the
Full models, suggesting that drought is an especially good fit for instrumenting food
yields in Africa. Additionally, the fact that the instrument drought ’s effects on both
food yield indicators is significant to the 1% level is important, because instruments
with no observable correlation with the endogenous explanatory variable cannot
be considered truly valid (Angrist and Pischke, 2009, 87-89).
75

Table 2.5: IV regression models for total number of violent events per grid cell,1998-2008 – first stage estimates
Wheat Yield Maize Yield1E) Baseline 2E) Full 3E) Baseline 4E) Full
Drought -8.539e-04*** -8.966e-04*** -3.478e-04*** -3.658e-04***(1.205e-04) (1.265e-04) (4.848e-05) (4.990e-05)
Conflict (lag) – 6.456e-06 – -1.998e-05*(1.197e-05) (1.204e-05)
Conflict (spatial) – -1.043e-04 – -4.947e-04***(2.444e-04) (1.448e-04)
Population1 – 2.153e-03*** – 1.009e-02***(5.726e-04) (1.067e-03)
Democracy – 1.230e-04*** – -1.418e-04***(1.099e-05) (1.779e-05)
GDP per capita1 – 9.749e-04*** – 1.807e-03***(1.489e-04) (4.081e-04)
Observations 72,169 68,160 72,169 68,160R2 0.959 0.958 0.972 0.972Adjusted R2 0.954 0.954 0.970 0.969
* indicates p < 0.1; ** indicates p < 0.05; *** indicates p < 0.01 (two-tail test).Cell values are IV regression coefficient estimates with standard errors clustered by grid-cell inparentheses. Grid cell and year fixed effects included in each regression though not reported
here. The variables wheat yield and maize yield were instrumented using drought.1 Natural log
Sensitivity Analyses and Competing Mechanisms
Below I evaluate the sensitivity of my findings to the plausible exogeneity assump-
tion, modeling choices, and a large number of competing mechanisms.
Sensitivity Analyses
I begin by assessing the robustness of my IV regression results to small departures
from the strict exogeneity assumption required for those results to be identified.
Having discussed these issues theoretically above, I apply the method developed
by Conley, Hansen and Rossi (2012) to deal with plausibly—but not strictly—
exogenous instruments. In applying this methodology, it is necessary to impose
some sort of prior on said departures from strict exogeneity, with the trade-off
being that the less precise the prior, the less precise the resulting models’ estimates
76

will be. I thus utilize Conley et al’s intermediate local-to-zero (LTZ) method,
which only requires one to impose a prior on the mean and standard deviation
for the parameter measuring the magnitude of the presumed departure from strict
exogeneity. In this case, I assume a mean of a zero (i.e., no direct effect) and a
standard deviation of 0.1, thus allowing for relatively wide departures from strict
exogeneity. However, the LTZ approach relies on particular specifications and a
large number of computer simulations. Due to the size of my sample and the
complications involved with using grid cell fixed effects under this framework, it
was impossible to run LTZ models with available computer resources.
Considering these complications, each LTZ model was estimated on a collapsed
sample for the entire 11-year period of analysis. In this sample, a binary indicator
for drought, denoting whether a given grid cell experiences drought with one or
more standard deviations below the mean of a given cell’s precipitation levels,
is used as an IV, while all other variables were averaged for the entire period
(excluding conflict, which was summed). This time-invariant grid cell framework
thus nullifies the need for grid cell fixed effects. Additionally, because the LTZ
approach requires the inclusion of at least one exogenous variable alongside the
endogenous one in the model, all Baseline models include population in addition
to wheat yield and maize yield. The results of the Conley, Hansen and Rossi’s LTZ
estimations presented in Table 2.6 then show that both food indicators are robust
to substantive departures from the assumption of strict exogeneity of drought on
conflict.
Another methodological concern relates to the structure of my data, which in-
clude a large number of units, but a relatively low number of time periods. This
77

Table 2.6: IV regression models for total number of conflict events per grid cell,LTZ simulations
Wheat Yield Maize Yield5) Baseline 6) Full 7) Baseline 8) Full
Wheat yield 261.17*** 150.19** – –(77.48) (59.96)
Maize yield – – 312.11*** 210.58**(90.24) (81.22)
Population1 1.259*** -0.752* 0.541 -1.285**(0.326) (0.383) (0.474) (0.595)
Conflict (spatial) – 36.19*** – 35.37***(3.327) (3.139)
Democracy – 0.406*** – -0.112(0.128) (0.086)
GDP per capita1 – -2.184** – -0.644*(0.840) (0.340)
Constant -11.85*** 20.22** -6.973* 13.65*(3.008) (9.171) (3.878) (7.167)
Observations 6,680 6,429 6,680 6,429Endogenous variables test 11.69*** 7.437*** 12.33*** 7.174***Weak instrument F-statistic (clustered SEs) 22.303 9.404 25.56 7.284Weak instrument F-statistic (i.i.d. SEs) 11.12 5.931 19.59 5.581R2 -0.191 0.063 -0.101 0.069Adjusted R2 -0.192 0.062 -0.1012 0.068
* indicates p < 0.1; ** indicates p < 0.05; *** indicates p < 0.01 (two-tail test).Cell values are IV regression coefficient estimates with standard errors clustered by grid-cell in
parentheses. The variables wheat yield and maize yield were instrumented using a collapsedbinary version of drought.
1 Natural log
78

might suggest susceptibility to estimation bias when linear fixed effect models—
implying unobserved heterogeneity—are used (Blundell and Bond, 1998). On a
related note, the time demeaning operation of fixed effects in these models means
that the error terms of the dependent variable and its lag are correlated, causing an
inconsistency in such estimator, which is referred to as the “Nickel Bias” (Blundell
and Bond, 1998, 128). Although the use of standard IV regressions within panel-
time-series data is a standard practice (e.g., Miguel, Satyanath and Sergenti, 2004;
Sarsons, 2015), to show that my IV model results are robust to these concerns, I
additionally estimate a series of generalized method of moments (GMM) models
below (Blundell and Bond, 1998). A key assumption of these GMM models is
that the necessary instruments are “internal;” that is, based on lagged values of
the instrumented variable(s). The model is accordingly specified as a system of
equations, one per time period, where the instruments applicable to each equation
differ (in later time periods, additional lagged values of the instruments are avail-
able). With the individual fixed effects swept out, a straightforward instrumental
variable estimator is available. The system GMM approach also has an advantage
over first-differencing GMM models, as the former is much more susceptible to the
aforementioned Nickel Bias effects (Blundell and Bond, 1998, 128; 138), and was
hence preferred within the context of the present analysis.
Following the procedure established by Blundell and Bond (1998) for using
endogenous instruments in dynamic panel data, I estimate system GMM IV models
that rely on the past values of yields as instruments for the contemporary effect
of yields on conflict. However, to further ensure that these models can claim
exogeneity, and considering that the large size of the grid panel suggests a very
large number of available lagged instruments and thus overfitting (Arellano, 2003;
79

Roodman, 2009, 139-140), I rely on deeper lags of the dependent variable, in
a manner suggested by past research (Arellano, 2003; Blundell and Bond, 1998;
Roodman, 2009, 137). Therefore, in all models reported in Table 2.7 the GMM
instruments are the t− 4 and beyond lags of the dependent variable, conflict.
The results of the Blundell and Bond (1998) system GMM models presented
in Table 2.7 show that both local yields indicators are statistically robust to de-
partures from the 2SLS framework, although marginally so in the full specification
of the maize yield model. While the results are not statistically weakened due to
the inclusion of a large number of endogenous instruments, Sargan tests do offer
evidence of over-identification, even when relying only on deep DV lags, implying
that endogeneity may remain a concern within these GMM models. While this
can be explained by the sheer size of the grid panel (10,674 cells), by providing an
additional way of instrumenting the effect of food on conflict, these GMM mod-
els nevertheless show that the relationship between local yields is positive, which
complements the IV regressions and LTZ models used previously.
Competing Mechanisms
Having shown that the finding presented in Table 2.4 are generally robust to mod-
eling choices, I now turn to empirically evaluating a large number alternative mech-
anisms that could explain the main results.
One of the most robust explanations to the onset of conflict connects low de-
velopment and economic inequalities to conflict frequency (Blattman and Miguel,
2010; Fearon and Laitin, 2003). Considering that such underdeveloped regions are
also more susceptible to limitations on food access and availability (Kastner et al.,
2012), low development, economic inequality, and limitations of food are likely to
80

Table 2.7: GMM IV regression models for total number of conflict events per gridcell, 1998-2008
Wheat Yield Maize Yield9) Baseline 10) Full 11) Baseline 12) Full
Wheat yield 0.610*** 0.231** – –(0.174) (0.108)
Maize yield – – 2.257*** 0.309*(0.530) (0.165)
Conflict (lag) 0.382*** 0.781*** 0.381*** 0.780***(0.090) (0.087) (0.089) (0.087)
Conflict (spatial) – -0.223* – -0.220*(0.127) (0.127)
Population1 – -0.0003 – -0.001(0.002) (0.002)
Democracy – 0.001 – -0.0001(0.001) (0.001)
GDP per capita1 – 0.002 – 0.003(0.003) (0.003)
Observations 72,169 68,160 72,169 68,160Sargan test 73.69*** 612.47*** 75.436*** 613.03***DF (39) (43) (39) (43)R2 0.082 0.088 0.083 0.088
* indicates p < 0.1; ** indicates p < 0.05; *** indicates p < 0.01 (two-tail test).Cell values are IV regression coefficient estimates with robust standard errors in parentheses.
GMM instruments for all models are the t− 4 and beyond lags of conflict.1 Natural log
be highly correlated. From this perspective, grid cells with lower economic activity
are likely to have more unemployment, more disadvantaged individuals, and hence
suffer from more conflict, independently of variation in local yields.
To this end, Model 13 in Table 2.8 replicates the Full IV analysis with the
inclusion of an annual cell-level economic development indicators, nighttime light,
which measures annual nighttime light emissions in a given cell as a proxy of
local development, as used by past studies (see, e.g., Chen and Nordhaus, 2011;
Koren and Sarbahi, Forthcoming; Elvidge et al., 2014). This variable measures the
annual (calibrated) average of nighttime light emissions at the 0.5 degree grid cell
resolution. It captures average visible (i.e., cloud free and stable) nighttime light
emission obtained from the DMSP-OLS Nighttime Lights Time Series Version 4
(Average Visible, Stable Lights, & Cloud Free Coverages).
81

Original DMSP data were collected by US Air Force Weather Agency, and
processed by the NOAA’s National Geophysical Data Center (see, e.g., Elvidge
et al., 2014). While numerous nighttime light measures are available, the indicator
I chose to employ for approximating localized development was calibrated using
values from Elvidge et al. (2014) to account for differences between data from
different satellites and sensor decay over time, making these measures especially
useful for time-series analysis (Tollefsen et al., 2012). Values are standardized to
be between zero and one, where one is the highest observed value in the entire
time-series, and zero is the lowest for the years 1992-2012, and aggregated to the
0.5 degree grid cell level.
As can be observed, the variables wheat yield and maize yield maintain their
sign and significance across all models, suggesting that their impact is not (only)
the result of low development levels and inequalities. Moreover, in addition to
illustrating the validity of this mechanism by the process of elimination—i.e. by
empirically accounting for a variety of alternative mechanisms— Figure 2.5 fur-
ther highlights the interactions between economic inequality, food resources, and
conflict. These plots report nonparametric regressions, i.e. regressions where the
predictor does not take a predetermined form but is constructed according to in-
formation derived from the data (see, e.g., Fan, 1992). The shape of the functional
relationships between the response (dependent) and the explanatory (independent)
variables in these models are thus not predetermined, but can be adjusted to cap-
ture unusual or unexpected features of the data.
As Figure 2.5 shows, nonparametric regression plots—which do not enforce
a modeling structure on the data and hence provide a more flexible method of
visualizing relationships between different factors—show the correlations of local
82

yields and conflict in respect to economic development as approximated using
nighttime light levels. As shown, conflict occurs more frequently in cells with more
yields but relatively low levels of productivity and development, where—based on
anecdotal evidence at least—limitations on food access are more likely (Roncoli,
Ingram and Kirshen, 2001).
Wheat Yields
0.0
0.2
0.4
0.6 Nighttim
e Lig
ht
0.2
0.4
0.6
0.8
Conflict
0
50
100
150
200
250
Maize Yields
0.00.1
0.2
0.3
0.4
0.5
Nighttim
e Lig
ht
0.2
0.4
0.6
0.8
Conflict
0
20
40
60
80
100
Figure 2.5: Nonparamteric regression plots of annual nighttime light emissions onviolent conflict over the range of (left) wheat yields and (right) maizeyields by grid cell in Africa, 1998-2008.
Model 14 in Table 2.8 examines whether the observed effects of the crop yield
variables is driven by abundance of lucrative resources such as oil and oil exports
(Ross, 2011), which previous research connected to higher frequency (e.g., Bannon
and Collier, 2003; Blattman and Miguel, 2010). The variable oil production ap-
proximates annual oil production by country (in metric tones), starting in 1932.
The variable gas production measures annual gas production by country (also in
metric tones), starting in 1955. For 1970 to 2000, these data originally obtained
83

from the World Bank’s “Wealth of Nations” database, while 2000–2011 data are
taken from the US Energy Information Administration website (Ross, 2011). The
effect of localized food production remains positive and significant in these models,
suggesting that the availability of other profitable natural resources is not driving
the results.
Third, some scholars have highlighted the potential effect of food imports and
food aid on conflict (e.g., Bellemare, 2015; Nunn and Qian, 2014). From this per-
spective, higher levels of food imports and food aid might increase competition
between armed groups over expropriating these resources, and hence explain the
pattern observed in Table 2.4. To account for the impact of food and agricultural
imports more broadly, as well as total aid, Model 15 includes three additional
controls—food imports and agricultural imports, aid, all taken from World Bank
(2012). The first variable, food imports, measures the annual total share (in per-
cents) of a given country’s total food merchandise imports according to the World
Bank (2012). The second variable agricultural imports, measures raw materials
imports (excluding fuel, fertilizer, minerals, and ores), and again operationalized
as the annual share of total imports during the same calendar year according to
the World Bank (2012). Finally, the variable aid is operationalized as the annual
net of repayments involving all official development assistance (ODA) and other
official aid flows (in constant 2008 USD) provided to a given country (World Bank,
2012).
Although the variable agricultural imports has a statistically significant effect
across all models and food imports in all models excluding one, the inclusion of
these variables does not diminish the sign and significance of wheat yield and
maize yield. The impact of local food yields on the propensity of conflict is again
84

shown to be independent of that of other factors, in this case agricultural and aid
dependencies at the national level.
Fourth, recall that my dependent variable incorporates all conflict types and
related developments occurring within a given cell during a given year, with or
without casualties. A competing explanation might be that the number of conflicts
without casualties “inflates” the variable conflict, thus affecting the results. To
address this concern, Model 16 re-estimates the Full analyses on a dependent
variable that captures only violent incidents, i.e., recorded events at the village
level with at least one combatant or civilian fatality. This variable, violent conflict,
as well as its one-year lag were operationalized from the same ACLED Version 6
dataset (Raleigh et al., 2010), where only incidents that included at least one
combatant or noncombatant fatality were counted. Like all other conflict variables
used in the main and sensitivity analyses, this variable includes only recorded
events whose geographic precision was the village—and not district, province, or
country—level. The coefficients of both wheat yield and maize yield maintain their
sign, significance, and size (within one order of magnitude), suggesting that the the
findings are robust to inclusion of nonviolent conflict events within the dependent
variable.
Fifth, previous research has drawn strong linkages between ethnic enmities and
localized political violence (e.g., Fjelde and Hultman, 2014). To evaluate whether
the primary findings were the result of such ethnic enmities, Model 17 in Table 2.9
includes two additional controls. The first, ethnic diversity, is operationalized as a
count of the number of politically relevant ethnic groups settled in a particular cell
during a given year (Wucherpfennig et al., 2011). This indicator thus accounts for
the number of distinct ethnic groups found within each individual cell, and control
85

for the possibility that conflict was the result of preexisting inter-ethnic divisions.
The second variable, territorial change, is a binary variable denoting a whole or
part of a grid cell exchanged hands between different noncombatants during a fiven
year (Raleigh et al., 2010). This variable accounts for some persistent enmities
between different groups and the possibility that some armed actors might initiate
conflict or move into these regions to recover territories previously lost. As Model
17 shows, the coefficients of both wheat yield and maize yield maintain their sign,
significance, and size.
Sixth, recall that my argument does not suggest that scarcity never impacts
conflict, but rather that—on average—violence would be more frequent in ar-
eas with abundant food. To provide a more empirically thorough evaluation of
scarcity’s role in driving conflict, Model 18 incorporates two additional controls,
temperature and temperature (lag). This variables measure the average and lagged
average annual temperature, respectively, in a given cell (in Celsius) (Fan and
Van den Dool, 2008; Tollefsen et al., 2012) to account for the effect of heat waves
on local scarcity, and correspondingly, conflict. Model 19 adds two production
index indicators to the model, capturing production levels of meat and cereals,
respectively (Food and Agricultural Organization of the United Nations, 2016).
The FAO indices of agricultural production show the relative level of the aggre-
gate volume of agricultural production for each year in a given country (normalized
per capita) in comparison with the base period 1999-2001. These two variables are
based on the sum of price-weighted quantities of meat products and cereals, respec-
tively, produced after deductions of quantities used as seed and feed (also weighted
against the same base period). The resulting aggregate variables, meat prod. in-
dex and Cereal prod. index, thus capture disposable production for immediate or
86

long-term consumption (i.e., not as seed or feed). Model 20 then incorporates both
temperature measures and both indexes.
As evidenced by Table 2.9, doing so does not diminish the sign or significance
of wheat yield and maize yield. This, again, lends support to the argument that, at
least at the local level, on average, food abundance impacts conflict. Additionally,
the coefficients signs of temperature and temperature (lag) change from positive
to negative as one moves from the wheat models to the maize models. Consid-
ering that R2 scores suggest that both wheat models are preferred to their maize
counterparts, it might be that conflict is more frequent in regions that previously
experienced both higher yields and higher temperatures, although these results are
far from definite. Alternatively, wheat might be simply more sensitive to higher
temperatures.
Interestingly, when the cereal and meat production indexes (obtained from
Food and Agricultural Organization of the United Nations, 2016) are added to the
models (for countries and years for which information is available), the former’s
effect is positive and significant, while the latter’s effect is negative and significant.
These results can help reconcile some of this paper’s seemingly-counterintuitive
findings with previous research that emphasizes the role of scarcity. For instance,
Maystadt and Ecker (2014) find that droughts induce higher food prices, which in
turn increases localized frequency of conflict. In contrast, Table 2.4 illustrates that
when the same instruments are used for cereals, the results are the opposite. Inter-
estingly, in both Model 19 and 20, country-level food production indexes exhibit
the same relationship: cereal production has a positive and significant relationship
with conflict frequency, while meat production is negative and significant. This
suggests that future research should focus not necessarily on whether scarcity vs.
87

abundance drives conflict, but rather on the distinct relationships exhibited by
different food resource types with respect to conflict.
Seventh, to address the concern that rebel groups might be more dependent on
locally grown food than official state forces, Model 21 in Table 2.10 reestimates the
Full specifications, where the dependent variable includes only conflicts waged by
official state forces. The dependent variable, military conflict, as well as its one-year
lag, was operationalized as the annual number of all conflict events in a given grid
cell—with and without fatalities—that involved official military forces. In these
models, the dependent variable (and its lag) were operationalized as the annual
number of all conflict events—with and without fatalities—that involved military
forces in given grid cell. The results are robust to this choice of DV, suggesting
that—as previous research (e.g., Koren and Bagozzi, 2016) shows—abundance has
a noticeable impact even on regular state forces, which are generally considered
better organized and well-supported.
Eighth, note that my sample includes a relatively large number of cells with
zero values or missing informations, which might affect the results. To address
these concerns, I first re-estimate the Full models on two subsamples that include
only grid cells where some wheat or maize, respectively, are grown in Model 22.
I then repeat these analysis using a subsample that includes only grid cells that
experienced conflict as some point during the period analysis in Model 23. As
can be observed in both sets of analyses, the coefficients of wheat yield and maize
yield maintain their sign, size, and significance, suggesting that the findings are
not driven by a high number of zero values or missing information on conflict
events. Ninth, considering that some studies suggest larger countries are also more
likely to suffer from protracted conflict (e.g., Fearon and Laitin, 2003), Model 24
88

re-estimates the Full specifications on a sample consisting solely of countries whose
geographic size is bellow the 75% percentile of all African countries.
Table 2.11 accounts for possible biases that might be caused by the distribution
of the dependent variable or the choice of the unit of analysis. To this end, Model 25
re-estimates the full specification using a logged version of the dependent variable
(and its lag) to verify that the effect of wheat yield and maize yield is not driven
by the range of values on conflict (0⇔ 344 annual incidents). Model 26 then re-
estimates the Full specifications on a sample where the top one percent of all values
(including zero values, to make this sensitivity test even more robust) on wheat
yield and maize yield was removed from each model, respectively, as to account
for the effect of outliers.
Next, considering that political violence measured at the 0.5 ◦ x 0.5 ◦ fine-
scale level might exhibit higher levels of spatial and serial correlations besides
the regressors in equations 1 and 2 in the main paper, Model 27 re-estimates the
Full IV models, where standard errors are clustered at the higher, province level of
aggregation. Finally, to account for both observed and unobserved annual country-
level factors, Model 28 re-estimates the Full model with the inclusion of country
× year fixed effects. Note that this procedure is very likely to generate Type II
errors, and indeed, the model issues a warning that the standard errors are likely
to be too high, which did not happen with any of the other (numerous) models
estimated in this chapter. Nevertheless, the results are robust to the inclusion of
country × year fixed effects in the maize model, although the wheat model drops
out of significance (p = 0.17).
Finally, recall that the drought variable used to instrument food yields is an
ordinal measure of different degrees of drought severity. To illustrate that the ef-
89

fect of drought as an instrument for local food yield is robust to more penalizing
thresholds of negative rainfall shocks, several alternative binary IVs are used to
instrument the average LATE of wheat yield and maize yield on conflict in Table
2.12 below. The first alternative instrument used in Model 29, any drought, is a bi-
nary variable operationalized as grid cell years that experienced drought levels of 1
or more standard deviations below average precipitation level, zero otherwise. The
instrument used in Model 30, severe drought, is a binary variable operationalized as
grid-cell years that experienced drought levels of 1.5 or more standard deviations
below average precipitation level, zero otherwise. The instrument used in Model
31, extreme drought, is a binary variable operationalized as grid-cell years that
experienced the worst drought levels of 2.5 standard deviations below average pre-
cipitation level, zero otherwise. The sign, size, and significance of each local food
yield’s coefficient remains practically unchanged, even when droughts are opera-
tionalized using these different negative rainfall shock thresholds. Indeed, across
all models, the coefficients of both wheat yield and maize yield maintain their sign,
significance, and size within a series of robustness specifications that includes these
additional controls.
90

Discussion and Conclusion
The theoretical argument and empirical analyses presented in this chapter suggest
that agricultural regions experience relatively high levels of violent conflict that
are, to a large extent, driven by the type and amount of food resources produced
there. These findings diverge from current conceptualizations in mainstream liter-
ature, which frequently attribute conflict to food shortages (e.g., Burke et al., 2009;
Maystadt and Ecker, 2014). This chapter theorizes and provides empirical evidence
to show that scarcity-based explanations are insufficient in explaining localized con-
flict over food resources, their potential validity notwithstanding. Moreover, the
evidence that the instrument drought have a significant and negative association
with production lends additional support to this argument by showing that con-
flict is significantly less likely during drought, presumably because, as Adano et al.
argue, “in dry season times of relative scarcity...people reconcile their differences
and cooperate” (2012, 77).
Importantly, while the theoretical argument and corresponding empirical anal-
ysis presented here draw and test linkages between conflict and food abundance,
thus isolating the validity of the broad group of mechanisms responsible for these
linkages, they do not test the relative importance of some specific mechanisms.
For instance, one important implication of the value different actors place on food
resources is that denying these resources from one’s rivals can be a useful tac-
tic and an especially powerful weapon not only in localized conflict but also as a
macrolevel strategy designed to win a total war (Messer, 2009). Indeed, it is possi-
ble that this “preemptive” exposition explains a significant number of the conflict
incidents occurring in food resources abundant regions. In the next chapter I turn
91

Tab
le2.
8:IV
regr
essi
onm
odel
sfo
rto
tal
num
ber
ofco
nflic
tev
ents
per
grid
cell,
addit
ional
robust
nes
sm
odel
s
13)
Develo
pm
ent
14)
Reso
urces
15)
Aid
16)
Vio
lent
Wh
eat
Yie
ldM
aiz
eY
ield
Wh
eat
Yie
ldM
aiz
eY
ield
Wh
eat
Yie
ldM
aiz
eY
ield
Wh
eat
Yie
ldM
aiz
eY
ield
Wh
eat
yie
ld83.4
4***
–78.5
0***
–36.0
9***
–25.0
4***
–(2
6.0
10)
(24.7
4)
(12.5
0)
(7.7
18)
Ma
ize
yie
ld–
204.6
5***
–178.7
9***
–79.8
5***
–61.3
1***
(62.7
4)
(54.7
4)
(26.9
3)
(18.4
8)
Nig
htt
ime
ligh
t1-1
9.0
4***
-7.9
45
––
––
––
(6.1
54)
(5.1
85)
Oil
pro
du
ctio
n1
––
0.0
06
0.0
25***
––
––
(0.0
04)
(0.0
09)
Ga
sp
rod
uct
ion
1–
–-0
.133***
-0.2
29***
––
––
(0.0
37)
(0.0
62)
Foo
dim
port
s–
––
–0.0
11***
0.0
03
––
(0.0
04)
(0.0
03)
Agr
icu
ltu
ral
impo
rts
––
––
0.0
06**
0.0
06**
––
(0.0
03)
(0.0
03)
Aid
1–
––
–0.6
98**
-0.0
36*
––
(0.0
20)
(0.0
21)
DV
(la
g)0.2
00**
0.2
05**
0.2
00**
0.2
04**
0.4
23***
0.4
26***
0.3
53**
0.3
57***
(0.0
84)
(0.0
84)
(0.0
84)
(0.0
84)
(0.0
66)
(0.0
66)
(0.0
52)
(0.0
52)
Co
nfl
ict
(spa
tia
l)0.3
41***
0.4
35***
0.3
28***
0.3
93***
0.0
76**
0.0
99**
0.0
67***
0.0
95***
(0.0
86)
(0.1
10)
(0.0
83)
(0.0
99)
(0.0
38)
(0.0
41)
(0.0
19)
(0.0
24)
Po
pu
lati
on
1-0
.892***
-2.7
68***
-0.7
96***
-2.4
14***
-0.4
08**
-1.4
64***
-0.3
53***
-0.9
18***
(0.2
41)
(0.7
98)
(0.2
28)
(0.6
97)
(0.1
59)
(0.0
458)
(0.0
93)
(0.2
43)
Dem
ocra
cy-0
.031***
0.0
08
-0.0
38***
-0.0
07
-0.0
35***
-0.0
18*
-0.0
11**
-0.0
01
(0.0
11)
(0.0
13)
(0.0
11)
(0.0
10)
(0.0
13)
(0.0
10)
(0.0
05)
(0.0
05)
GD
Ppe
rca
pit
a1
-0.0
41
-0.3
33
0.0
84
-0.1
65
-0.0
42**
0.3
46
-0.0
30
-0.1
16
(0.1
80)
(0.2
46)
(0.1
71)
(0.2
17)
(0.2
93)
(0.2
42)
(0.0
64)
(0.0
76)
Ob
s.68,1
60
68,1
60
68,1
60
68,1
60
49,3
62
49,3
62
68,1
60
68,1
60
En
d.
vari
ab
les
10.2
9***
10.6
4***
10.0
7***
10.6
7***
8.3
4***
8.7
94***
10.5
3***
11.0
1***
WI
F-s
tat.
(CS
Es)
7.2
04
7.6
78
6.3
54
7.7
12
5.5
18
7.8
46
8.3
72
8.9
83
WI
F-s
tat.
(IS
Es)
27.4
813.0
824.3
013.5
522.2
414.0
531.8
415.3
0R
20.3
53
0.2
65
0.3
61
0.3
05
0.5
88
0.5
73
0.4
83
0.4
42
Ad
j.R
20.2
85
0.1
88
0.2
94
0.2
32
0.5
40
0.5
24
0.4
29
0.3
84
*in
dic
ate
sp<
0.1
;**
ind
icate
sp<
0.0
5;
***
ind
icate
sp<
0.0
1(t
wo-t
ail
test
).C
ell
valu
esare
IVre
gre
ssio
nco
effici
ent
esti
mate
sw
ith
stan
dard
erro
rscl
ust
ered
by
gri
d-c
ell
inp
are
nth
eses
.G
rid
cell
an
dyea
rfi
xed
effec
tsin
clu
ded
inea
chre
gre
ssio
nth
ou
gh
not
rep
ort
edh
ere.
Th
evari
ab
les
wh
eat
yie
ldan
dm
aiz
eyie
ldw
ere
inst
rum
ente
du
sin
gd
rou
ght.
1N
atu
ral
log
92

Tab
le2.
9:IV
regr
essi
onm
odel
sfo
rto
tal
num
ber
ofco
nflic
tev
ents
per
grid
cell,
addit
ional
robust
nes
sm
odel
s(c
ont.
)
17)
Eth
nic
18)
Tem
peratu
re
19)
Prod
ucti
on
20)
Scarcit
yW
heat
Yie
ldM
aiz
eY
ield
Wh
eat
Yie
ldM
aiz
eY
ield
Wh
eat
Yie
ldM
aiz
eY
ield
Wh
eat
Yie
ldM
aiz
eY
ield
Wh
eat
yie
ld75.5
9***
–96.1
0***
–35.8
6***
–45.3
6***
–(2
3.7
9)
(30.4
7)
(13.8
4)
(17.1
1)
Ma
ize
yie
ld–
186.3
8***
–193.4
8***
–143.3
0**
–132.7
0***
(57.9
7)
(58.6
4)
(57.7
7)
(50.3
9)
Eth
nic
div
ersi
ty0.0
86***
0.2
86***
––
––
––
(0.0
27)
(0.0
74)
Ter
r.ch
an
ge5.8
59***
5.9
18***
––
––
––
(0.8
26)
(0.8
42)
Tem
pera
ture
––
0.1
78***
-0.1
29***
––
0.2
19***
-0.2
83**
(0.0
57)
(0.0
47)
(0.0
73)
(0.0
88)
Tem
pera
ture
(la
g)–
–0.0
49*
-0.1
51***
––
-0.0
39
-0.2
83***
(0.0
26)
(0.0
57)
(0.0
27)
(0.0
99)
Cer
eal
pro
d.
ind
ex–
––
–0.0
01**
0.0
01**
0.0
01**
0.0
01**
(0.0
005)
(0.0
005)
(0.0
005)
(0.0
005)
Mea
tp
rod
.in
dex
––
––
-0.0
06***
-0.0
07***
-0.0
06***
-0.0
07***
(0.0
02)
(0.0
03)
(0.0
02)
(0.0
02)
DV
(la
g)0.1
82**
0.1
86**
0.2
10**
0.2
15**
0.4
15***
0.4
18***
0.4
18***
0.4
21***
(0.0
80)
(0.0
80)
(0.0
90)
(0.0
90)
(0.0
73)
(0.0
74)
(0.0
77)
(0.0
77)
Co
nfl
ict
(spa
tia
l)0.1
82**
0.1
86**
0.3
45***
0.4
56***
0.1
04***
0.1
62***
0.1
08**
0.1
79***
(0.0
80)
(0.0
80)
(0.0
91)
(0.1
17)
(0.0
42)
(0.0
06)
(0.0
46)
(0.0
60)
Po
pu
lati
on
1-0
.675***
-2.3
60***
-1.0
31***
-2.4
88***
-0.4
90***
-2.1
22***
-0.7
18***
-1.6
11***
(0.2
11)
(0.7
14)
(0.2
79)
(0.7
18)
(0.1
98)
(0.7
93)
(0.2
45)
(0.5
82)
Dem
ocra
cy-0
.022**
0.0
10
-0.0
34***
0.0
07
-0.0
36*
-0.0
19
-0.0
43**
-0.0
16
(0.0
11)
(0.0
12)
(0.0
11)
(0.0
13)
(0.0
19)
(0.0
16)
(0.0
21)
(0.0
16)
GD
Ppe
rca
pit
a1
-0.0
33
-0.3
12
-0.0
87
-0.2
85
0.8
47***
1.9
31***
0.8
29***
2.1
83***
(0.1
65)
(0.2
37)
(0.1
94)
(0.2
40)
(0.2
85)
(0.6
65)
(0.2
81)
(0.7
14)
Ob
s.67,7
55
67,7
55
66,0
07
66,0
07
35,9
36
35,9
36
34,2
54
34,2
54
En
d.
vari
ab
les
10.0
9***
10.3
4***
9.9
51***
10.8
9***
6.7
14***
6.1
57**
7.0
31***
6.9
34***
WI
F-s
tat.
(CS
Es)
6.2
69
6.6
65
5.3
64
7.6
56
6.0
15
3.6
64
3.9
12
3.8
71
WI
F-s
tat.
(IS
Es)
24.0
19
11.4
018.8
913.5
422.4
86.9
08
13.5
28
8.1
09
R2
0.3
96
0.3
23
0.3
27
0.2
83
0.5
93
0.5
34
0.5
75
0.5
47
Ad
j.R
20.3
33
0.2
53
0.2
56
0.2
07
0.5
52
0.4
88
0.5
32
0.5
01
*in
dic
ate
sp<
0.1
;**
ind
icate
sp<
0.0
5;
***
ind
icate
sp<
0.0
1(t
wo-t
ail
test
).C
ell
valu
esare
IVre
gre
ssio
nco
effici
ent
esti
mate
sw
ith
stan
dard
erro
rscl
ust
ered
by
gri
d-c
ell
inp
are
nth
eses
.G
rid
cell
an
dyea
rfi
xed
effec
tsin
clu
ded
inea
chre
gre
ssio
nth
ou
gh
not
rep
ort
edh
ere.
Th
evari
ab
les
wh
eat
yie
ldan
dm
aiz
eyie
ldw
ere
inst
rum
ente
du
sin
gd
rou
ght.
1N
atu
ral
log
93

Tab
le2.
10:
IVre
gres
sion
model
sfo
rto
talnum
ber
ofco
nflic
tev
ents
per
grid
cell,ad
dit
ional
robust
nes
sm
odel
s(c
ont.
)
21)
Mil
itary
Con
flic
t22)
Pla
nte
dC
ells
23)
Con
flic
tC
ell
s24)
Large
Cou
nt.
Wh
eat
Yie
ldM
aiz
eY
ield
Wh
eat
Yie
ldM
aiz
eY
ield
Wh
eat
Yie
ldM
aiz
eY
ield
Wh
eat
Yie
ldM
aiz
eY
ield
Wh
eat
yie
ld62.1
5***
–77.4
2***
–226.5
5***
–87.8
1***
–(2
0.3
8)
(26.2
2)
(77.3
1)
(26.1
9)
Ma
ize
yie
ld–
152.4
4***
–191.5
2***
–643.0
8***
–223.0
2***
(49.0
9)
(59.5
6)
(227.8
5)
(63.9
3)
DV
(la
g)0.0
90
0.0
91
0.2
04**
0.2
07**
0.1
97**
0.2
13**
0.1
77
0.1
83**
(0.0
73)
(0.0
74)
(0.1
00)
(0.0
89)
(0.0
85)
(0.0
85)
(0.0
88)
(0.0
89)
Co
nfl
ict
(spa
tia
l)0.2
97***
0.3
66***
0.3
83***
0.4
35***
0.3
51***
0.6
43***
0.4
92***
0.7
29***
(0.0
76)
(0.0
96)
(0.1
14)
(0.1
14)
(0.1
10)
(0.1
93)
(0.1
28)
(0.1
85)
Po
pu
lati
on
1-0
.689***
-2.0
93***
-0.9
91***
-2.6
65***
-4.4
22***
-13.8
4***
-1.0
44**
-3.3
54***
(0.1
93)
(0.6
31)
(0.3
02)
(0.8
02)
(1.2
99)
(4.3
88)
(0.2
70)
(0.9
03)
Dem
ocra
cy-0
.015**
0.0
14
-0.0
42***
0.0
06
-0.0
85***
0.0
20
-0.0
78***
-0.0
52
(0.0
07)
(0.0
10)
(0.0
14)
(0.0
12)
(0.0
29)
(0.0
42)
(0.0
25)
(0.9
05)
GD
Ppe
rca
pit
a1
-0.0
99
-0.3
14
-0.4
45*
-0.4
59*
-0.2
91
-1.1
32
-0.0
05
0.2
41
(0.1
61)
(0.2
18)
(0.2
56)
(0.2
63)
(0.5
49)
(0.8
88)
(0.2
13)
(0.2
27)
Ob
s.68,1
60
68,1
60
50,4
61
65,3
67
19,4
50
19,4
50
47,6
13
47,6
13
En
d.
vari
ab
les
9.3
03***
9.6
44***
8.7
22***
10.3
4***
8.5
87***
7.9
66***
11.2
4***
12.1
7***
WI
F-s
tat.
(CS
Es)
8.3
72
8.9
43
8.3
00
9.4
30
3.9
63
2.9
63
7.9
20
10.2
9W
IF
-sta
t.(I
SE
s)31.8
415.2
329.6
116.1
77.9
61
5.5
32
29.6
319.4
5R
20.1
70
0.0
69
0.3
53
0.2
80
0.0
83
-0.0
77
0.3
10
0.2
52
Ad
j.R
20.0
84
-0.0
28
0.2
85
0.2
06
-0.0
14
-0.1
90
0.2
40
0.1
77
*in
dic
ate
sp<
0.1
;**
ind
icate
sp<
0.0
5;
***
ind
icate
sp<
0.0
1(t
wo-t
ail
test
).C
ell
valu
esare
IVre
gre
ssio
nco
effici
ent
esti
mate
sw
ith
stan
dard
erro
rscl
ust
ered
by
gri
d-c
ell
inp
are
nth
eses
.G
rid
cell
an
dyea
rfi
xed
effec
tsin
clu
ded
inea
chre
gre
ssio
nth
ou
gh
not
rep
ort
edh
ere.
Th
evari
ab
les
wh
eat
yie
ldan
dm
aiz
eyie
ldw
ere
inst
rum
ente
du
sin
gd
rou
ght.
1N
atu
ral
log
2T
his
vari
ab
leis
on
lyavailab
lefo
rth
eyea
rs1998-2
007
94

Tab
le2.
11:
IVre
gres
sion
model
sfo
rto
talnum
ber
ofco
nflic
tev
ents
per
grid
cell,ad
dit
ional
robust
nes
sm
odel
s(c
ont.
)
25)
Logged
DV
26)
Ou
tlie
rs
Rem
oved
27)
Provin
ce
SE
s†28)
Cou
nt.×
Year
FE
s‡
Wh
eat
Yie
ldM
aiz
eY
ield
Wh
eat
Yie
ldM
aiz
eY
ield
Wh
eat
Yie
ldM
aiz
eY
ield
Wh
eat
Yie
ldM
aiz
eY
ield
Wh
eat
yie
ld4.2
39**
–187.1
7***
–83.5
3**
–423.4
1–
(1.8
61)
(57.6
8)
(36.7
6)
(314.4
7)
Ma
ize
yie
ld–
10.3
7**
–249.1
3***
–204.7
4**
–96.4
5**
(4.4
76)
(77.2
8)
(94.8
3)
(46.4
5)
DV
(la
g)0.6
59***
0.6
62***
0.2
03**
0.2
09**
0.2
01**
0.2
06**
0.2
04***
0.2
07***
(0.0
12)
(0.0
12)
(0.0
85)
(0.0
85)
(0.0
84)
(0.0
84)
(0.0
66)
(0.2
43)
Co
nfl
ict
(spa
tia
l)0.0
15**
0.0
19***
0.3
49***
0.4
49***
0.3
43***
0.4
36***
0.1
88**
0.2
28***
(0.0
07)
(0.0
07)
(0.0
88)
(0.1
14)
(0.1
05)
(0.1
44)
(0.0
82)
(0.0
68)
Po
pu
lati
on
1-0
.101***
-0.1
96***
-0.7
74***
-2.7
58***
-0.8
77***
-2.7
62**
0.6
36
0.5
05**
(0.0
18)
(0.0
52)
(0.2
26)
(0.7
98)
(0.3
32)
(1.0
78)
(0.4
13)
(0.2
43)
Dem
ocra
cy-0
.005***
-0.0
03***
-0.0
39***
0.0
10
-0.0
32**
0.0
07
––
(0.0
01)
(0.0
01)
(0.0
12)
(0.0
13)
(0.0
13)
(0.0
21)
GD
Ppe
rca
pit
a1
0.0
12
-0.0
03
-0.1
15
-0.6
12**
-0.0
48
-0.3
36
––
(0.0
13)
(0.0
17)
(0.1
91)
(0.3
05)
(0.3
00)
(0.4
06)
Ob
s.68,1
60
68,1
60
67,4
39
67,4
53
68,1
60
68,1
60
70,9
37
70,9
37
En
d.
vari
ab
les
5.1
86**
5.3
65**
10.5
3***
10.3
9**
5.1
63**
4.6
61**
1.8
13
4.3
19**
WI
F-s
tat.
(CS
Es)
8.3
61
8.9
79
9.6
11
9.5
83
1.9
51
1.3
42
0.7
56
19.2
0W
IF
-sta
t.(I
SE
s)31.8
115.3
130.0
916.0
831.8
415.2
61.0
34
29.2
6R
20.6
61
0.6
47
0.3
45
0.2
76
0.3
51
0.2
64
0.1
14
0.5
10
Ad
j.R
20.6
26
0.6
10
0.2
76
0.2
00
0.2
84
0.1
87
0.0
13
0.4
54
*in
dic
ate
sp<
0.1
;**
ind
icate
sp<
0.0
5;
***
ind
icate
sp<
0.0
1(t
wo-t
ail
test
).C
ell
valu
esare
IVre
gre
ssio
nco
effici
ent
esti
mate
sw
ith
stan
dard
erro
rscl
ust
ered
by
gri
d-c
ell
inp
are
nth
eses
un
less
note
doth
erw
ise.
Gri
dce
llan
dyea
rfi
xed
effec
tsin
clu
ded
inea
chre
gre
ssio
nth
ou
gh
not
rep
ort
edh
ere.
Th
evari
ab
les
wh
eat
yie
ldan
dm
aiz
eyie
ldw
ere
inst
rum
ente
du
sin
gd
rou
ght.
†S
tan
dard
erro
rscl
ust
ered
by
pro
vin
ce/st
ate
inp
are
nth
eses
.‡
Model
warn
ing:
Sta
nd
ard
erro
rsm
ay
be
too
hig
h.
1N
atu
ral
log
95
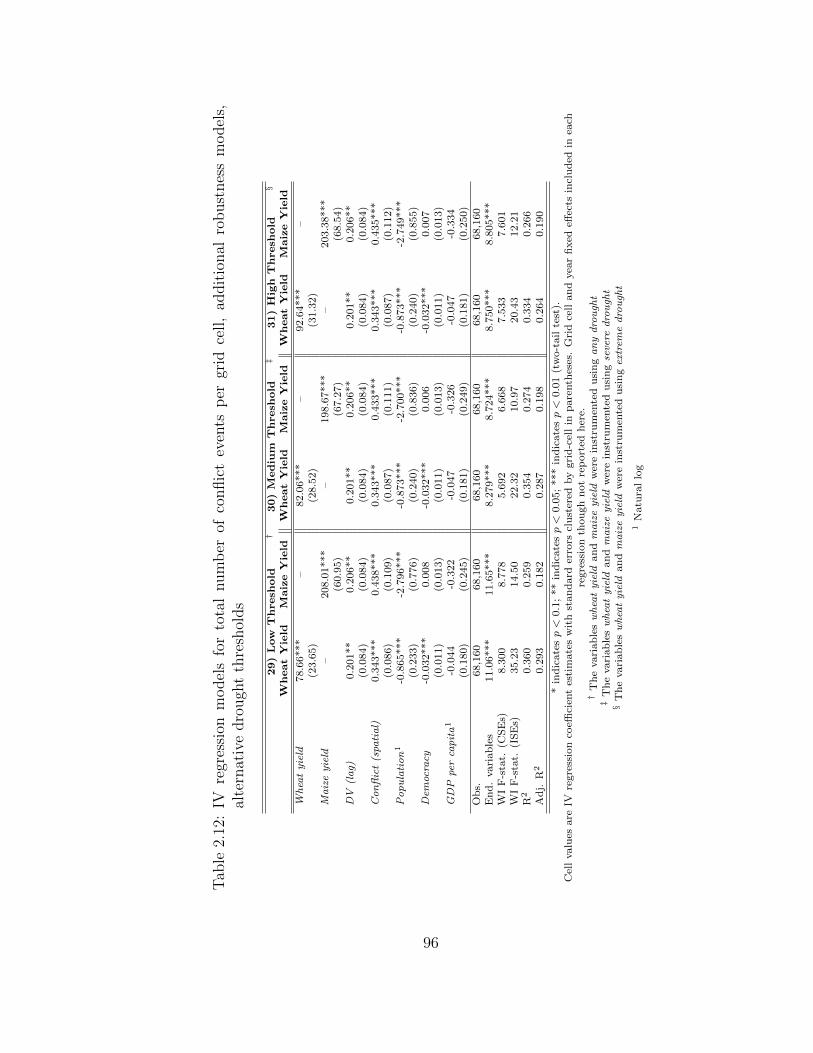
Tab
le2.
12:
IVre
gres
sion
model
sfo
rto
tal
num
ber
ofco
nflic
tev
ents
per
grid
cell,
addit
ional
robust
nes
sm
odel
s,al
tern
ativ
edro
ugh
tth
resh
olds
29)
Low
Th
resh
old
†30)
Med
ium
Th
resh
old
‡31)
Hig
hT
hresh
old
§
Wh
eat
Yie
ldM
aiz
eY
ield
Wh
eat
Yie
ldM
aiz
eY
ield
Wh
eat
Yie
ldM
aiz
eY
ield
Wh
eat
yie
ld78.6
6***
–82.0
6***
–92.6
4***
–(2
3.6
5)
(28.5
2)
(31.3
2)
Ma
ize
yie
ld–
208.0
1***
–198.6
7***
–203.3
8***
(60.9
5)
(67.2
7)
(68.5
4)
DV
(la
g)0.2
01**
0.2
06**
0.2
01**
0.2
06**
0.2
01**
0.2
06**
(0.0
84)
(0.0
84)
(0.0
84)
(0.0
84)
(0.0
84)
(0.0
84)
Co
nfl
ict
(spa
tia
l)0.3
43***
0.4
38***
0.3
43***
0.4
33***
0.3
43***
0.4
35***
(0.0
86)
(0.1
09)
(0.0
87)
(0.1
11)
(0.0
87)
(0.1
12)
Po
pu
lati
on
1-0
.865***
-2.7
96***
-0.8
73***
-2.7
00***
-0.8
73***
-2.7
49***
(0.2
33)
(0.7
76)
(0.2
40)
(0.8
36)
(0.2
40)
(0.8
55)
Dem
ocra
cy-0
.032***
0.0
08
-0.0
32***
0.0
06
-0.0
32***
0.0
07
(0.0
11)
(0.0
13)
(0.0
11)
(0.0
13)
(0.0
11)
(0.0
13)
GD
Ppe
rca
pit
a1
-0.0
44
-0.3
22
-0.0
47
-0.3
26
-0.0
47
-0.3
34
(0.1
80)
(0.2
45)
(0.1
81)
(0.2
49)
(0.1
81)
(0.2
50)
Ob
s.68,1
60
68,1
60
68,1
60
68,1
60
68,1
60
68,1
60
En
d.
vari
ab
les
11.0
6***
11.6
5***
8.2
79***
8.7
24***
8.7
50***
8.8
05***
WI
F-s
tat.
(CS
Es)
8.3
00
8.7
78
5.6
92
6.6
68
7.5
33
7.6
01
WI
F-s
tat.
(IS
Es)
35.2
314.5
022.3
210.9
720.4
312.2
1R
20.3
60
0.2
59
0.3
54
0.2
74
0.3
34
0.2
66
Ad
j.R
20.2
93
0.1
82
0.2
87
0.1
98
0.2
64
0.1
90
*in
dic
ate
sp<
0.1
;**
ind
icate
sp<
0.0
5;
***
ind
icate
sp<
0.0
1(t
wo-t
ail
test
).C
ell
valu
esare
IVre
gre
ssio
nco
effici
ent
esti
mate
sw
ith
stan
dard
erro
rscl
ust
ered
by
gri
d-c
ell
inp
are
nth
eses
.G
rid
cell
an
dyea
rfi
xed
effec
tsin
clu
ded
inea
chre
gre
ssio
nth
ou
gh
not
rep
ort
edh
ere.
†T
he
vari
ab
les
wh
eat
yie
ldan
dm
aiz
eyie
ldw
ere
inst
rum
ente
du
sin
ga
ny
dro
ugh
t‡
Th
evari
ab
les
wh
eat
yie
ldan
dm
aiz
eyie
ldw
ere
inst
rum
ente
du
sin
gse
vere
dro
ugh
t§
Th
evari
ab
les
wh
eat
yie
ldan
dm
aiz
eyie
ldw
ere
inst
rum
ente
du
sin
gex
trem
ed
rou
ght
1N
atu
ral
log
96

to evaluate the role of this preemptive mechanism on conflict in Africa using a
combination of a formal model and a corresponding statistical strategic model to
test the formal theory’s implications.
97

Chapter 3: Food Security and Strategic
Preemptive Conflict
In Chapter 1, I identified a mechanism that I termed possessive conflict, which stip-
ulates that armed actors actively fight over areas with more food to guarantee long
term operations and community resilience to food shortages, or move into these
areas during ongoing war to sustain their operations. I then further developed and
evaluated this argument empirically in Chapter 2 using different methodological
approaches, under the broad assumption that we should expect to see different
types of conflict occurring more frequently during years of abundance, not scarcity.
However, I also recognized that this conflict pattern has several potential expla-
nations, the need to possess food resources (during ongoing war or otherwise)
being only one of which. While my models and sensitivity analyses include a vari-
ety of variables and specifications designed to control for these alternatives, these
approaches cannot adequately account for sequential interactions resulting from
strategic behaviors of different actors in response to other the behaviors of other
grous.
In this chapter I focus on one such strategic interactions and its role in generat-
ing local conflict over food resources. Understanding how this mechanism operates
98

is important given that evidence from countries as diverse as Uganda (Mkutu,
2001), the Democratic Republic of the Congo (Vlassenroot and Raeymaekers,
2008), Peru (Gitlitz and Rojas, 1983), and India (Wischnath and Buhaug, 2014)
suggests that conflict dynamics are closely associated with strategic interactions
over food resources. As I mentioned in the Chapter 1, the focus on scarcity alone
cannot predict where conflict over food will arise within the state. For example,
a close examination of violent conflict data at the disaggregated within-country
“grid-cell year” level in Africa (Raleigh et al., 2010),1 reveals that violent con-
flict predominately arises in regions where at least some food is grown (92% of
all incidents).2 Again, this empirical evidence counter-intuitively suggests that, at
the local level, violent conflict is associated with food resource abundance, and not
scarcity. Fitting explanations for the relationship between food and conflict should
therefore account for how food resource abundance, in addition to food scarcities,
affects local conflict frequency (Koren and Bagozzi, 2016; Butler and Gates, 2012;
Adano et al., 2012).
What impact does food security have on patterns of conflict within develop-
ing states? Does increasing local food security levels exacerbate or help to quell
violence in these areas? To answer these questions, the present chapter advances
a complementary explanation to scarcity-centric theories, which emphasizes the
strategic incentives of actors not only to secure food resources, but also to pre-
vent them from being consumed by others. To achieve strategic advantage, some
1I.e., as described in Chapters 1 and 2, “cells” of approximately 55km x 55km around theequator (Tollefsen et al., 2012). Data on all staple food crops was estimated for the year 2000(Ramankutty et al., 2008).
2The reader can also refer back to Table 1.1 from Chapter 1, which illustrates that thesecorrelations are not unique to the ACLED dataset coded by Raleigh et al. (2010), and persistacross different datasets and conceptualizations of political violence.
99

groups might seek to cut off the supply of other armed actors in order to weaken
them. This incentive should give rise to violence not only between rebel and gov-
ernment troops, but also between different ethnic communities (Adano et al., 2012;
O’Loughlin et al., 2012; Bagozzi, Koren and Mukherjee, 2017). In the developing
world, where the majority of armed groups are unlikely to receive regular logistic
support (Henk and Rupiya, 2001) and must rely on the local population for food,
such a possibility is especially likely.
Reducing rival groups’ access to food resources is a powerful strategy to in-
crease strength and guarantee survival during ongoing war, as being deprived of
food support significantly reduces an enemy group’s fighting ability (Hendrix and
Brinkman, 2013). When an organization—be it the military, a rebel group, or
an ethnic militia—has access to more local food resources, it can easily recruit
individuals and use income from agriculture to purchase weapons (Jaafar and Wo-
ertz, 2016; Crost and Felter, 2016). Most importantly, because the majority of
armed actors in the developing world must frequently rely on locally-grown food
to support their operations, by securing access to such resources an armed actor
can operate for longer periods of time and venture further away from its base of
operations, increasing its durability. Local food resources are therefore vital to
this group and its chances of victory during ongoing war. Correspondingly, to
increase its probability of winning a war, the enemy might seek to preemptively
conquer areas that have more food resources to weaken its opponent. In doing so,
it deprives the first group of these essential resources, thus reducing its durability,
fighting capability, and size. This in turn will push the first group to stage stronger
resistance in these food abundant areas to guarantee continued availability of food
resources.
100
Importantly, theories of conflict rarely if ever incorporate the active roles of
civilians, despite the fact that the latter’s behavior might influence patterns of
political violence (see, e.g., Valentino, 2004; Kalyvas, 2006). Moreover, especially
when food resources are concerned, civilians are a crucial actor. The amount of
food grown and available for the taking in a given region is a function of natural
factors such as climate and soil, but perhaps most importantly of the civilian
producers’ choices. These choices include not only what types of food to grow,
subject to environmental concerns (e.g., cereals, perishables, or livestock), but
also whether to provide food to the different warring sides, and if so how, and how
much.
Accordingly, I develop the argument presented in this chapter in three phases.
First, I derive a formal model to show how food security concerns affect the strate-
gic calculi of (i) the first group, or defense forces, (ii) the second group, or raiders,
and (iii) the civilian producers that provide local food support to the defense forces.
This model posits that when the local civilians increase their level of food support,
they correspondingly increase the probability that the defense forces will win in
combat. Moreover, this level of support cannot be known to the raiders in advance.
In equilibrium, the raiders anticipate that if more food support is available to the
defense forces, their own chances of victory will diminish. The implication is that
above a certain probability threshold of the defense forces’ victory, the possibility
of high food support levels becomes a grave threat. I find that in the model, this
incentivizes the raiders to preemptively target regions with more food resources
in order to cut the defense forces off from these sources of support, and increase
their (the raiders’) overall probability of victory. Moreover, this formal analysis
provides a set of comparative statics that show when the civilian producers are
101

more likely to increase their level of food support in anticipation of this possibility,
which makes it more likely that the defense forces will defeat the raiders. I then
corroborate my formal model’s predictions on high resolution data on conflict and
local food production for the years 1998-2008 (Ray et al., 2012; Ramankutty et al.,
2008) using a statistical strategic model that corresponds to the formal model’s
derivations. Finally, I use the model to forecast conflict on out-of-sample data for
2009-2010.
Overall, the combined theoretical-empirical model developed in this chapter
provides new and nuanced evidence that locally-grown food resources have a strong
influence on the strategic calculi of different groups, which generates intensified pre-
emptive competition over areas with more food resources. Specifically, I show that
raiders strategically attack local communities where more access to food resources
exists, while higher availability of food also makes a response by defense forces
more likely.
Background Discussion
As mentioned in Chapters 1 and 2, the notion that climatic variability affects
armed conflict has received much consideration in recent years (Burke et al., 2009;
Bagozzi, Koren and Mukherjee, 2017). On the other hand, an increasing number
of studies that focus on the subnational level now emphasize that within scarcity-
prone countries, conflict might be more likely to arise in areas with more food
resources (e.g., Koren and Bagozzi, 2016; Butler and Gates, 2012; Adano et al.,
2012). These studies focus on the importance of locally grown resources to main-
taining and improving the fighting capacity of different groups in many (rural)
102

regions of the developing world.
Despite the valuable insights into the motivations governing armed actors’ im-
peratives to secure food resources by violent means provided by the studies dis-
cussed above and the analyses conducted in Chapter 2, we are still missing an
interactive model that (i) is focused on food resources (rather than environmental
conditions or production and price shocks); and (ii) explains when strategic inter-
actions around food-related concerns shape broader conflict patters, between com-
munities as well as between different armed actors. To explain these interactions
and the trend, shown in Chapter 2, that violent conflict concentrates in areas with
more food crops, I design my model around the competition over food resources.
In this context, food (in)security relates to the (in)ability of actors, armed groups
and communities, to secure adequate amount of and/or access to food (Barrett,
2010). Correspondingly, to weaken one’s rivals, possessing and even destroying
food sources is a beneficial strategy that increases the opponents’ levels of food
insecurity, negatively affecting their fighting ability (Hendrix and Brinkman, 2013).
For instance, to return to an example used previously, in Sierra Leone, troops of
the Revolutionary United Front (RUF) burned and destroyed villages not only to
secure food resources for their own consumption, but also to strategically hurt the
government and prevent its troops from accessing these important resources (Keen,
2005). Similarly, in South Sudan, where “[e]thnic groups have fought each other
over cattle—a vital part of the indigenous economy—for centuries” (Reuters, 2011),
livestock raiding is frequently used to humiliate and weaken the enemy. Indeed,
while analyzing every incidence of preemptive conflict over food security is beyond
the scope of this chapter, a partial evaluation of more recent evidence—presented
in Table 3.1—shows that preemptive conflict over food resources occurs relatively
103

frequently. Distinguishing possessive conflict—i.e. conflict designed to increase
one’s own food security levels—from preemptive conflict—i.e., conflict designed to
decrease one’s rivals’ food security levels—is complicated, as most conflict events
over food resources is likely to involve elements of both. Hence, I only included in
Table 3.1 cases where it was explicitly stated that the aim of using violence was to
weaken or hurt other groups by appropriating or destroying locally produced food
resources.
The raiders’ strategy of expropriating and destroying the civilians’ food re-
sources to weaken their rivals during ongoing war combined with the civilians’
strategy of providing their defense forces with varying levels of food support pro-
duce a “commitment problem” in my game model.3 This commitment problem
suggests that as long as the raiders cannot know in advance how much food sup-
port the civilians will provide to their defense forces, they might decide to attack
and conquer areas with more food resources in order to control these focal points
and cut the defense forces off from these resources. The value of the civilians’ land
is observable by all actors, which allows the raiders to estimate how much food is
available in the region (e.g., in open stockpiles, granaries, and cattle pens). The
importance of local food support to the defense forces’ war efforts creates strong
incentives for the raiders to preemptively target areas that offer more access to
food resources, because doing so would weaken the defense forces, who require
these resources to improve their own chances of victory. Preemptive conflict is
3Commitment problems arise when two actors know that they will prefer to renege on theiragreement in the future, meaning that even a mutually beneficial agreement cannot be struckat present (e.g., Fearon, 1995). In the context discussed here, because the civilians decide theirlevels of food only after the raiders attack, neither side has a strong enough incentive to committo finding a peaceful solution in advance.
104

Table 3.1: A Partial List of Preemptive Conflicts over Food Security
Country Target Raiders Resource Source
Angola civilian farmers rebels crops Macrae and Zwi (1992)
East Timor civilians rebels livestock The New Zealand Herald (2002)
El Salvador civilians gov. troops crops Messer and Cohen (2006)
Ethiopia civilians, rebels the Derg crops, livestock Keller (1992)(Tigre and Eritrea)
Ghana herders Farmers crops, livestock Tonah (2006)
India CDF Naxalite rebels crops Sundar (2007)(Bastar) PCI 2008
Italy mafia Mafia families livestock Blok (1969)(Sicily)
Kenya ethnic militias ethnic militias livestock Greiner (2013)
Mozambique civilians, gov. rebels crops Hultman (2009)
Nigeria civilians gov. troops crops, stockpiles Jacobs (1987)(Biafra)
Nigeria herders farmers crops, livestock Ofuoku (2009)
Peru CDF rebels crops, livestock Masterson (1991)(Tacuna and Arequipa) Walker (1999)
Sierra Leone gov./CDF rebels crops Mkandawire (2002)Keen (2005)
Somalia Civilians political militias crops, livestock Ahmed and Green (1999)(Somaliland)
Sudan (Darfur) civilians, rebels gov./militias crops, livestock de Waal (2005)
Sudan ethnic Dinka militias/gov. livestock Barrow (1996)
Sudan S. Sudan pastoralist militia livestock Leff (2009)
Thailand farmers, CDF rebels crops The Nation (2004)(Songkhla) Montesano and Jory (2008)
Uganda civilians, LRA military crops, stockpiles Doom and Vlassenroot (1999)
Vietnam civilians, VC military crops Leebaw (2014)
105

thus about regulating the supply of food available to enemy groups.4
The Model
Model Primitives
Assume three actors interacting in an agricultural region of a developing country:
a set of civilians b (i.e. producers) who work the land to grow crops and livestock;
raiders r (consisting of political or ethnic militias, rebels, etc.); and defense forces
d (ethnic militias, civil defense forces, government troops, etc.). If attacked, the
civilian producers decide the level of food support they provide to their defense
forces θ ∈ [0, 1], which is not revealed to the raiders until they invade the region.
Thus, the civilians face a commitment problem; because they decide their level of
food support only after being attacked, the raiders will always be concerned that
areas with higher levels of food resources are going to improve the defense forces’
chances of victory if the latter decide to open hostilities.5
Let ρ be the total probability that the defense forces defeat the raiders during
war taking the effect of food support into account, such that Pr(victory) ≡ ρ =
p[1 + (1− δ)θω]. In this probability function, p ∈ [0, 1] is the baseline probability
of the defense forces’ victory not accounting for the role played by local food
support, i.e., based on the resources currently available to d. Additionally, let
δ ∈ [0, 1] denote the effect of violence on reducing θ, for example because targeting
4Note that this is not (necessarily) the same as “scorched earth” tactics, which involve thecomplete destruction of all means of production in a given area, whether the raiders conquer theregion or not. As discussed here, “scorched earth” tactics are one extreme type of preemptiveconflict, but they are neither the only one nor the most prevalent.
5In the model developed here, how food resources are provided and whether they are obtainedusing coercion or enticement is irrelevant. Because it revolves around a commitment problem,which relates to the sequential moves of different actors, the model is agnostic with respect toapportionment dynamics as highlighted by, e.g., Kalyvas (2006).
106

a food resource-abundant region enables the raiders to capture a high number of
food stockpiles, kill civilians producers, or—in extreme cases—to employ “scorched
earth” tactics. In this function, ω ≤ 1p− 1 denotes how important food support
is to the defense forces’ overall probability of victory. Both δ and ω guarantee
that p ∈ [0, 1]. Setting ρ in this fashion thus incorporates the effect of local food
support into local conflict patterns.
During war, the raiders r seek to target locations where food resources are
grown and stockpiled to control these areas and prevent the defense forces d from
gaining access to these resources. Let η be the costs the raiders incur from attacking
a given region M , which includes the costs of mobilizing and recruiting individuals
and obtaining firearms, such that η > 0. If r attacks and wins with probability
(1− ρ) it obtains the benefit R+ s, because controlling the region provides r with
the access to both taxation and resource rents R, and the value of the land s,
which includes the food produced and stockpiled by b.6 If the raiders attack and
lose, they receive no benefits, but still face the costs of attacking. If they do not
attack, they simply maintain the status quo and gain a utility of zero. The raiders
r’s utility function from attacking the region (i.e., when M = 1, denoted simply
as M for convenience) is thus: Ur(M) = (1− ρ)× (R + s) + ρ× 0− η, which can
be rewritten as:
Ur(M) = (1− ρ)(R + s)− η (3.1)
Let θ be the amount of locally produced food the civilians b allocate to sup-
porting their defense forces during war. Correspondingly, κ is the cost the civilians
6Because this chapter is focused on food support, the land’s value s corresponds to its fertilityand hence to the total amount of food that can be grown and stored on this land.
107

incur if the raiders attack the region where they live, e.g., through targeted or re-
tributive killings. In addition, c(θ) is the opportunity costs of allocating food
resources to support armed groups rather than keeping them for other uses, such
that c(θ)′ > 0; c(θ)′′ > 0. For convenience, let c(θ) = 12θ2. Because ρ denotes the
total probability with which the defense forces successfully protect the civilians
and their land against the raiders, the civilians’ benefit from victory is the total
value of land (and the food produced and stored therein) in the region, which they
get to keep, ρ× s. If the raiders do not attack, the civilians keep the value of their
land, s. If the raiders attack and the defense forces lose, then the civilians forfeit
the entirety of their land, such that (1− ρ)× 0. The civilians’ b utility function is
thus expressed as:
Ub(M) = ρs− 1
2θ2 − κ (3.2)
The civilian producers’ optimization problem is to maximize Equation 3.2 with
respect to θ, subject to the constraint θ ∈ [0, 1]. Note that, in equilibrium, the
civilians’ action are assumed to reflect those of the defense forces; if they provide
more food, the defense forces will be more likely to move into the region; if not,
then the defenders will be less likely to do so. Thus, despite their importance, the
defense forces are not a strategic actor in this model, and the variations in the
outcome variable associated with the defense forces reflect right-hand side factors
associated with the civilian producers in the strategic-statistical model discussed
below. Nevertheless, for illustration purposes, the defense forces’ utility function
is still discussed here. To start, let ν be the cost the defense forces d incur from
violent conflict in the region M , for example, due to the loss of lives or equipment,
108

such that ν > 0. In addition, if they defeat the raiders with probability ρ, the
defense forces get to keep their rents R, e.g., through taxation, controlling natural
resources production, etc., such that ρ × R. If they lose, then they forfeit access
to these rents, such that (1− ρ)× 0. The defense forces’ d utility function is thus:
Ud(M) = ρR− ν (3.3)
.
The sequence of play is as follows. Nature draws the baseline probability of
the defense forces’ victory p ∈ [0, p], which is revealed to all actors. The raiders
then need to decide whether or not to attack the region, M ∈ {0, 1}. Finally, the
civilians determine the level of support they provide the defense forces, θ ∈ [0, 1].
This order of play thus sets up the commitment problem.
Order of Play
Nature draws p ∈ [0, p]
M = 1
θ ∈ (0, 1] θ = 0
M = 0
Utilities
ρR − ν
(1− ρ)(R + s)− η
ρs− c(θ)− κ ps− κ
R,
0,
s
109

Equilibrium Results
• Lemma 1: In the subgame perfect Nash equilibrium of the game between r,
d, and b:
(i) If attacked, the civilians b will always choose to provide some level of food
support θ, considering its effect on improving the defense forces d′s overall proba-
bility of victory
(ii) The optimal agricultural food resources that the civilian producers b will
allocate for the defense forces’ consumption is θ∗ = (1− δ)ωps
(iii) The utility of the raiders from (a) attacking the region, taking θ∗ into
account, is Ur(M |θ∗) = [1 − p(1 + (1 − δ)2ω2ps)](R + s) − η, and consequentially
(b) the raiders will attack if Ur(M) = [1− p(1 + (1− δ)2ω2ps)](R + s) ≥ η
Proof: see appendix.
Lemma 1 establishes that in regions with some food resources, violent conflict
might arise endogenously, as a consequence of the equilibrium choices between the
civilian producers on the one hand, and the raiders on the other, during war. The
intuition is straightforward in cases of linearly increasing food support θ: high
enough levels of food support levels will guarantee the defense forces d’s victory.
However, as shown in Proposition 2 below, the stronger the effect of violence on
reducing this support δ is, the more inclined the raiders will be to use it and initiate
conflict. For instance, in South Sudan, some tribal militias routinely engage with
the military and civil defense forces of ethnic groups associated with the regime
over cattle theft, which frequently involves abuses against civilians (Reuters, 2011).
These interactions are even more evident in Ethiopia, where large farms and food
producers, which are defended by forces trained and managed by the state or by
110

their own sponsored militias, experience frequent raids both by pastoralist groups—
whose traditional space has been appropriated by these farms—and rebel groups
who seek to challenge the state and its presence in the region (Mkutu, 2001).
The equilibrium results from Lemma 1 can be used to derive two sets of compar-
ative statics to explain when the civilians will increase their level of food support,
and when the raiders will prefer to target regions with more food resources. The
first set of comparative statics is discussed in Proposition 1 below.
Proposition 1: The level of food support θ∗ provided by the civilians will,
(i) increase in the case of stronger defense forces, which have a higher baseline
probability of victory p > 0, (ii) increase when the marginal importance of food
support to the defense forces d’s strength is higher, and (iii) increase when the
value of the food producing cropland in the region s is higher
Proof: see appendix.
Proposition 1 serves as the basis for the ensuing comparative static prediction
developed in Proposition 2, which explains why the raiders choose to target regions
with more food resources. The rational behind Proposition 1 is intuitive. Recall
that more access to food resources provided by the local civilians increases the
ability of troops to operate for longer periods of time and attract more recruits.
Additionally, θ is a finite resource because the civilian producers b cannot provide
more food than they can physically produce and stockpile due to limitations in
infrastructure that force communities and individuals across the developing world
to rely on food produced locally (Paarlberg, 2000; Henk and Rupiya, 2001).
Importantly, military and civil defense forces across the developing world are
also frequently forced to rely on food produced and grown locally during war, due
111
to the relative lack of guaranteed logistic support provided by the state (Koren and
Bagozzi, 2016, 2017). If the defense forces are strong and have a high probability of
victory as captured by the exogenous parameter p, providing food support is more
likely to “pay off” because the civilians will be able not only to keep their remaining
resources for consumption, but also avoid potential retribution. Correspondingly, if
local food support is important to ensuring the defense forces’ victory (as captured
by the ω parameter), it follows that the civilian producers will allocate support
simply because, bushel to bushel, and all else equal, they gain higher marginal
returns with respect to improving the defense forces’ chances of victory for the
same amount of food.
The model’s finding that the civilians will provide higher levels of food support
when the land is more valuable is also intuitive. Valuable land is more fertile, and
allows for more food to be produced. This in turn means that the civilians not
only have a higher incentive to defend this valuable land, but also that they can
provide more food support and gain a higher marginal utility from investing in
defending these resources.
As a result, in equilibrium, the raiders will realize that the civilians residing
in regions with more arable land will always allocate some of these resources to
support the defense forces, and that hence higher levels of food support θ are a
credible threat. Higher allocations of θ decrease the raiders’ overall probability
of victory, and it is this intuition that explains why the raiders would choose to
attack areas with more food crops. This intuition is formalized in Proposition 2
below.
Proposition 2: the higher the effect of attacking on reducing the level of
civilian food support δ is, (i) the utility of the raiders r from attacking will increase;
112

and (ii) the level of the defense forces’ strength above which the raiders will chose
to attack (captured by baseline probability of defender victory) p will increase
Proof: see appendix.
Targeting regions with more food resources allows the raiders to preemptively
weaken the defense forces by limiting their supply of available food during war.
This becomes an especially attractive strategy for the raiders if violence has a
strong effect on reducing this support. Indeed, Proposition 2 explains why the
raiders’ strategic calculations are likely to be affected by food resource-related
concerns, and hence why preemptive violence over food resources might be more
prevalent, perhaps, than initially expected. The first part of this proposition estab-
lishes that preemptively targeting regions with more food resources is an effective
strategy to increase the raiders’ chances of victory. The second part of Propo-
sition 2, however, shows that—if the use of violence to reduce food support is
highly effective—the raiders might attack even regions where the defense forces
are relatively strong, which would otherwise serve to deter potential raiders from
attacking. Thus, the more effective preemptive conflict is in reducing food support
during war, the more prevalent it will be.
This does not necessarily mean that targeting regions where violence has a
strong effect on reducing food support will involve a high number of combatant ca-
sualties. Some wars involve a relatively low number of armed combatants’ deaths,
yet a high number of civilian casualties (Valentino, Huth and Balch-Lindsay, 2004).
The raiders might prefer to use atrocities to directly hurt the defense forces’ chan-
nels of food support in cases when the latter are too strong to be defeated militarily
(Wood, 2010). Atrocities can also be used as a strategy designed to subdue or influ-
113

ence the local population to keep θ at low or zero levels (Kalyvas, 2006), especially
in cases where conflict occurs between different ethnic groups (Fjelde and Hultman,
2014). In both cases, preemptive violence results from the fact that the raiders
must choose the timing and the location for the attack before the civilians decide
on the levels of food support θ they provide. I thus consider civilian victimization
alongside other forms of more traditional armed conflict, both in the theoretical
model and in the empirical section.
Proposition 2 suggests that higher levels of food support θ will be associated
with a higher likelihood of violent conflict, which in turn builds on the logic that
civilians will habitually provide some level of food support to the defense forces
if the raiders attack. Note that the exact levels of θ that the civilians b might
eventually provide to the defense forces d cannot be observed ex ante by the raiders
r. The raiders, however, can observe the value of the land s and extrapolate from
this value whether the civilians will provide θ, and whether food support levels are
likely to be high.
The preemptive conflict framework therefore provides one explanation for why
within the state conflict tends to concentrate in areas with an abundance of food
resources and not where food is scarce. Rather than thinking of conflict over food
resources as a pressure on consumption, which is the focus of numerous studies of
the food-conflict nexus (Burke et al., 2009; O’Loughlin et al., 2012; Bagozzi, Koren
and Mukherjee, 2017), it might therefore also be useful to theorize it as a weapon.
Under this framework, actors seek to possess food resources not for consumption to
improve their own dietary energy availability or to reward supporters, but rather to
worsen their opponents’ fighting capabilities by denying them access to food. Food
denial has been used repeatedly to weaken and defeat one’s opponents throughout
114

history, with some notable instances including the Allied blockade of Germany
during World War I (Downes, 2008), the Soviet Holodomor famine in Ukraine
(Snyder, 2010), and the Ethiopian Derg regime’s intentional starvations of Tigre
and Eritrea (Keller, 1992). These instance, which show that planned famines can
be used as a macro level strategy to destroy one’s opposition, complement my
model and the campaigns documented in Table 3.1 above, which show that the
destruction of food producing lands can also be initiated as micro level tactics to
achieve the same aim at the subnational level.
Building on Propositions 1 and 2, my model suggests that the civilians b are
likely to provide at least some food support to d to increase the latter’s overall
probability of victory, which prompts the raiders r to preemptively target these
regions in order to weaken the defense forces. The raiders cannot know ex ante if
the civilians will provide food support to the defense forces, or—if they do decide
to allocate support—how much food will they provide. However, because the
raiders can observe s, i.e., the value and fertility of the land in the region, they
are more likely to target areas where there are some food resources, and especially
regions where food is abundant, assuming that in these regions more food is likely
to be available to support the defense forces, and hence that (a higher level of)
food support is more likely. They might be especially likely to attack these areas
if violence has a strong effect on reducing food support levels. This accordingly
suggests the following expectation:
• E1: The raiders’ utility from attacks increases in regions where more food
crops are grown
Moreover, the higher the baseline probability of the defense forces’ victory,
115

the greater the marginal benefits the civilians gain from providing food support.
Higher levels of food support thus increases the probability that the defense forces
will be willing or able to respond to attacks by raiders. This suggests the following
expectation:
• E2: The defense forces will be more likely to respond to raider attacks in
areas with more available food for consumption
Empirical Analysis
The equilibrium and comparative static results derived above are statistically eval-
uated on a subnational sample of countries for the years 1998-2008. Moreover, to
verify that any identified effects are also substantively sizable (Greenhill, Ward and
Sacks, 2011), I use the resulting estimates to forecast conflict on a second sample
for the years 2009-2010 and show that local food production is also a significant pre-
dictive indicator of localized conflict. Doing so will add both to research concerned
with the strategic behaviors of different groups during conflict, as well as inform
the work of policymakers concerned with identifying and preventing violence.
The tree game presented above can be expressed in statistical terms. This
statistical strategic model ensures that the interactive nature of preemptive con-
flict over food resources is adequately captured and—importantly—that the model
is correctly identified in respect to these dynamis (Signorino and Yilmaz, 2003;
Carter, 2010). The strategic logit equivalent of this game necessitates making
the plausible assumption that all actors operate rationally within limitations (i.e.
bounded rationality), and that they hence play with some error (Signorino, 1999;
Signorino and Yilmaz, 2003). This allows me to implement the logit quantal re-
116

sponse equilibrium solution concept (LQRE) to analyze the strategic dynamics in
this game (Signorino, 1999; Carter, 2010). A special case of the LQRE in which
there is no uncertainty is used to solve the theoretical model. This empirical model
is thus structurally consistent with the theoretical model but also accommodates
errors to be made by the different actors. This statistical model captures the idea
that the raiders and civilians each make decisions in the game by weighing their
expected utilities for each possible action. In this case, it is useful to begin with
the last step in the game, the decision of the civilians to provide food support
or not, and then move up the tree following each player’s calculations. For each
observation, i = {1, 2, 3...n}, the civilians need to decide the level of food support
they provide if they observe the raiders invading. If the raiders preemptively at-
tack, i.e., if M = 1, then—as illustrated in the proof of Lemma 1—the civilians
make the following comparison:7
pb,i|F = U∗b (F |A) ≥ U∗b (¬F |A) (3.4)
= Ub(F |A) + εF ≥ Ub(¬F |A) + ε¬F
Assuming the error terms are independent and identically distributed (i.i.d.)
Type 1 Extreme Value yields:
pb,i|F =expUb(F |A)
expUb(F |A) + expUb(¬F |A)(3.5)
pb,i|¬F = 1− pb,i|F
7Note that F stands for feed and A for attack.
117

The raiders make their decision to attack or not by comparing, with some er-
ror, their utility from the status quo, Ur(SQ), i.e., the utility they gain from not
initiating conflict, to their utility from attacking, which is calculated by multiply-
ing each of the two possible outcomes with the probability that each is realized.
Assuming, again, that the error terms are i.i.d. Type 1 Extreme Value:
pr,i|A =exp(pb,i|F )Ur(A,F )+(pb,i|¬F )Ur(A,¬F )
exp(pb,i|F )Ur(A,F )+(pb,i|¬F )Ur(A,¬F ) + exp(pr,i|¬A)Ur(SQ)(3.6)
Model Specification and The Dependent Variable
To specify the statistical version of the game with regressors, identification issues
must satisfy theoretical expectations. The utility of at least one possible outcome
at the initial information set for both civilians and raiders, which can thus influ-
ence their utilities, is normalized to zero (Signorino, 1999). As no regressor can be
included in every utility estimation, all coefficients are evaluated with respect to
an outcome where the raiders attack, but the civilians decide not to provide food
support, which is correspondingly normalized to zero (see, Signorino and Yilmaz,
2003). So, for example, a positive coefficient on, say, food crops means that at-
tacking more fertile land increases the raiders’ utility when the civilians decide to
provide food support compared with a situation when they decide not to do so.
The model derived above is tested on subnational data for all countries in
Africa encompassing 11 years (1998-2008) for which information on all variables
was available. Africa was chosen as the focus of empirical analysis for three rea-
sons. Firstly, the Armed Conflict and Location and Event Data (ACLED) Version
6 dataset (Raleigh et al., 2010), which provides one of the most exceptional cov-
118

erages of a wide variety of violence types at the highly localized level (an which
was used for analyses conducted in Chapter 1), covers almost exclusively African
countries. Moreover, the ACLED dataset includes a broad spectrum of dyadic
interactions that go beyond the traditional government vs. rebel logic, which
allows my statistical model to capture manifestations of violence that are more
likely to characterize localized conflict, such as the killing of civilians or inter-
communal attacks. Secondly, the focus on Africa as the world region currently
most susceptible to the effects of food insecurity—through climatic variability or
otherwise—corresponds to previous studies on climatic variation, food security,
and conflict, which similarly focus on the same region (Burke et al., 2009; Buhaug,
2010; O’Loughlin et al., 2012). Finally, considering the size of the dataset and
the necessity to rely on computer simulations for deriving statistical estimation,
any larger sample would have presented significant—and insurmountable, based
on available resources—computational challenges.
The dependent variable must capture the decisions made at each node, by the
raiders on the one hand, and the civilians on the other, which—in respect to food
support—is reflected by the actions of the defense forces. The ACLED dataset
draws on (i) information from local, regional, national and continental media re-
viewed daily; (ii) NGO reports used to supplement media reporting in hard to
access cases; and (iii) Africa-focused news reports and analyses integrated to sup-
plement daily media reporting. Building on the formal model, the defense forces’
actions reflect the civilians’ decision to allocate varying levels of food support. The
defense forces can thus either defend the civilians against raids (play D) or not
(play ¬D). The defense forces—defined as state forces, or as pro-government or
ethnic militias—are coded as playing Defend if they are involved in any type of
119

violent conflict8 against the raiders—where the raiders are coded as the initiating
actor—in a given cell during a given year, not Defend otherwise. Correspondingly,
there are two discrete actions for the raiders: to attack (play A) or not attack
(play ¬A).9 The raiders are defined as having played Attack if they are recorded
to initiate a conflict (including one sided attacks against civilians) in a given cell
during a given year, whether it was responded to by a group identified as defense
forces or not, not Attack otherwise. For summary purposes, the frequencies of
raider attacks and defender responses for the years 1998-2008 are reported in the
Figure 3.1 below.
The violent conflict data from the ACLED Version 6 dataset and all other indi-
cators are structured into a cell-year level dataset wherein cells—my cross-sectional
unit of interest—are measured at the 0.5 x 0.5 decimal degree resolution10 for all
African land areas annually (t) (Tollefsen et al., 2012). There are approximately
10,674 cells observed for any given year within the 1998-2008 sample period, with
the average country containing roughly 201 cells. For summary purposes, the dis-
tribution of raider attacks and defense forces responses are plotted by grid cell for
the entire period and annually in Figure 3.2 below.
8I.e., events not coded by the ACLED Version 6 dataset as: “Headquarters or base estab-lished” or “Non-violent activity by a conflict actor” or “Riots/Protests” or “Non-violent transferof territory” or “Strategic development” (Raleigh and Dowd, 2015).
9In line with theoretical expectations, the raiders were defined as actors “who seek the re-placement of the central government, or the establishment of a new state” or as “ armed agentssupported by political elites of various types, seeking to influence political processes but notchange the government” or as “groups engaged in local political competition, often traditionallybased contests between ethnic, community or local religious groups” (Raleigh and Dowd, 2015,16-17).
10I.e., cells of approximately 55 x 55 kilometers at the equator (3025 square kilometer area).
120

Figure 3.1: The Regional Distribution of Attacks by Raiders and Responses byDefense Forces, 1998-2008
Raider Attacks, 1998-2008 Defender Responses, 1998-2008
Figure 3.2: The Distribution of Raider Attacks and Defense Forces Response byGrid Cell and Cell-Year, 1998-2008
Distribution by Grid Cell Distribution by Grid Cell Year
121

Regressors
The specification of the raiders’ utility for the status quo must include the key
variables that influence their decision to initiate preemptive conflict over food
security. First, potential attackers are likely to employ violence in response to
previous provocations, or in locations where they have attacked previously (e.g.,
Buhaug, Gates and Lujala, 2009). Second, lagged indicators of development and
political openness have been shown to be consistent predictors of conflict (Fearon
and Laitin, 2003). Therefore, to model the raiders’ utility from the status quo,
historical context indicators impacting the raiders’ propensity to initiate conflict
are included in this equation. These indicators include: the number of all political
violence-related events by all types of actors, state and nonstate, that occurred in
a given cell the previous year (Raleigh et al., 2010); the gross domestic product
(GDP) per capita for the previous year (World Bank, 2012); and the level of polit-
ical openness in the previous year as measured by the Polity2 indicator (Marshall,
Jaggers and Gurr, 2013). Cubic, binary, and linear time polynomials are then
added to capture the effect of time trends more broadly (Carter and Signorino,
2010). The expectations is that the raiders will be more likely to attack in ter-
ritories previously lost and following battlefield loses, as well as in countries with
lower levels of state capacity and more politically restrictive regimes. The raiders’
utility from the status quo is thus modeled as:
Ur(SQ) = βSQ,0 + βSQ,1Conflictt−1 + βSQ,2GDPPerCapitat−1+ (3.7)
βSQ,3Polity2t−1 + βSQ,4Time+ βSQ,5Time2 + βSQ,6Time
3 + αSQ
122

To measure s—i.e. the value of land that is observed by all actors—in the
raiders ’ utility function, I employ a highly localized food access indicator, Crop-
land, created by Ramankutty et al. (2008). This indicator measures the total area
of a pixel—i.e., a cell the size of 0.08 x 0.08 degrees—covered by any type of staple
cropland, which was then aggregated to the 0.5 x 0.5 degree level. This variable
was created in a manner similar to that of the maize and yield indicators discussed
in Chapter 2, although it is constant for the year 2000, due to data availability.
Approximating the actual levels of food support provided by the civilians is
more complicated, as such an indicator should, at the very least, closely approx-
imate the actual amounts of food that could be consumed or stored in a given
region during a given year. This means that more perishable resources such as
vegetables are less than ideal for this purpose, and that an adequate indicator of
θ should—at the very least—be based on a more durable food crop. Moreover,
the value of θ is, to some extent, dependent on s, so an effective parametrization
should capture this relationship, again considering that no one regressor can be
present in all utility functions (Signorino and Yilmaz, 2003).
Therefore, to approximate θ I rely on an indicator measuring the annual yields
of wheat by grid cell (Ray et al., 2012). Wheat was chosen because as a staple food
for about 35% of the world’s population, it provides more calories and protein in
the world’s diet than any other crop, and can be stored for relatively long periods
of time (Food and Agricultural Organization of the United Nations, 2016). More-
over, in Africa—and especially sub-Saharan Africa—wheat is in exceptionally high
demand, which cannot be met by production supply (Asfaw Negassa et al., 2013),
making this crop an especially valuable food resource to measure the responsive-
ness of different defense forces. The focus on yields, specifically, approximates
123

better the amounts of food that are immediately available (e.g., in stockpiles) for
consumption. This indicator—the same as the wheat indicator used in Chapter 2—
thus provides an exceptional coverage of the annual variation in food availability at
the highly localized level (∼0.08◦ grids, averaged to the 0.5◦ grid level), which is a
major improvement over past studies of this sort that have favored static measures
of cropland at comparable levels of geographic resolution (e.g., Koren and Bagozzi,
2016; O’Loughlin et al., 2012).
Several additional variables (some of which are not explicitly discussed above)
that might influence parameters in the theoretical model are also included in the
utilities of both actors from conflict. These indicators are all measured at the cell
rather than country level, which adequately accounts for the effects of these vari-
ables at the highly localized level. First, an indicator denoting gross cell product
in a given year (measured in billion USD), GCP (Nordhaus, 2006), is included to
account for the potential effect of valuable rents R, which—as the formal model
shows—might provide added incentives for violence. Second, the number of people
in a given cell, Population (Nordhaus, 2006), is included to account for the po-
tential effect of population density on the raiders’ propensity to employ violence.
Thirdly, because attacks might be more likely in grid cells that were recently
conquered by rival groups (Raleigh et al., 2010), an indicator denoting whether
territorial change has occurred, Terr. Change, is also included. Fourth, consider-
ing that conflict might be more likely in rural areas or regions closer to the border
(Buhaug, Gates and Lujala, 2009), indicators measuring the distance from each
cell to the nearest city with more than 50,000 inhabitants (Travel Time) and to
the nearest border (Border Distance) are also added. Fifth, indicators measuring
average annual temperature (Temperature) and rainfall (Precipitation) levels are
124

included to control for the effect of these factors on food production and corre-
spondingly on conflict; and because these indicators are used by many studies on
the climate-conflict nexus (e.g., Burke et al., 2009; O’Loughlin et al., 2012; Miguel,
Satyanath and Sergenti, 2004). Finally, similarly to Equation 3.7, time polynomi-
als are included to account for time trends in both equations. Thus, the utilities
for conflict outcomes are:11
Ur(AF ) = βr|AF,0 + βr|AF,1Cropland+ βr|AF,2Population+ (3.8)
βr|AF,3GCP + βr|AF,4TerritorialChange+ βr|AF,5TravelT ime+
βr|AF,6BorderDistance+ βr|AF,7Temperature+ βr|AF,8Precipitation+
βr|AF,9Time+ βr|AF,10Time2 + βr|AF,11Time
3 + αr|AF
Ub(AF ) = βb|AF,0 + βb|AF,1WheatY ield+ βb|AF,2Population+ (3.9)
βb|AF,3GCP + βb|AF,4TerritorialChange+ βb|AF,5TravelT ime+
βb|AF,6BorderDistance+ βb|AF,7Temperature+ βb|AF,8Precipitation+
βb|AF,9Time+ βb|AF,10Time2 + βb|AF,11Time
3 + αb|AF
Summary statistics for all variables are reported in Table 3.2 below.
11Because including lagged measures without theoretical justifications can introduce inferentialbiases (Bellemare, Masaki and Pepinsky, Forthcoming), these variables were not lagged. Myfindings are robust to this decision, as demonstrated in Table 3.7 below.
125

Table 3.2: Summary Statistics of All Variables Used in Chapter 3 (1998-2008)
Minimum Median Mean Max SD
Raider Attacks 0 0 0.033 1 0.179Defender Responses 0 0 0.016 1 0.127Cropland 0 0.021 0.085 1 0.154Wheat Yield 0 2.63E-5 0.009 0.930 0.047Population1 0 9.721 9.369 16.268 2.263GCPt
1 0 0.076 0.270 4.455 0.490Terr. Change 0 0 0.007 1 0.081Travel Time1 0 6.127 6.187 8.722 0.855Border Distance1 0 4.913 4.682 7.574 1.137Temperature 3.625 24.675 24.382 32.617 3.774Precipitation1 4.220 6.155 5.981 8.417 1.016Conflictt−1 0 0 0.316 506 3.890GDP Per Capitat−1
1 5.338 7.317 7.523 10.268 1.094Polity2t−1 -9 -1 -0.025 10 5.129Urban 0 0 0.099 51.549 0.901Capital Distance1 1.609 6.319 6.228 7.818 0.795Mountains 0 0 0.123 1 0.243Military Expendituret−1
1 0 12.612 12.525 15.350 1.649Attack Spl. Lag 0 0 0.060 1 0.237
1 Natural log
Results
Main Findings
The regression estimates in Table 3.3 provide strong support for the expectations
derived from the theoretical model. One issue with standard errors in strategic
statistical models is that the use of a choice-based sample might introduce bias,
while the assumption of independence across within-group observations is violated
(Carter, 2010). To account for these potential heterogeneities and other issues, I
use bootstrapping undertaken based on 1,000 draws, with sampling clustered by
each player. Specifically, the standard errors are clustered for each regression stage
by the player whose utilities are captured in this stage. This takes into account
the plausible possibility that errors are heterogeneous between different grid-cells
and years for the same players.
In line with E1, the likelihood of raider attacks significantly increases in areas
126

Table 3.3: Player Utilities for Raids and Defenses, 1998-2008
Ur(AF ) Ub(AF ) Ur(SQ)
Cropland 1.661* – –(0.342)
Wheat Yield – 0.173* –(0.072)
Population1 -2.193* -0.096* –(0.599) (0.016)
GCP1 -6.862* -0.152* –(1.485) (0.025)
Terr. Change 25.486* 0.576* –(3.111) (0.202)
Travel Time1 -2.538* -0.056* –(0.879) (0.022)
Border Distance1 -1.114* -0.019* –(0.360) (0.008)
Temperature 0.551* 0.014* –(0.118) (0.004)
Precipitation1 -4.345* -0.122* –(1.080) (0.021)
Conflictt−1 – – -0.145*(0.022)
GDP Per Capitat−11 – – 0.116*
(0.056)Polity2t−1 – – 0.067*
(0.008)t 6.006 -0.106 6.617
(5.071) (0.096) (5.124)t2 0.225 -0.007 0.124
(0.692) (0.017) (0.676)t3 -0.043 -0.001 -0.039
(0.034) (0.001) (0.032)Constant -90.452* 2.817* -93.224*
(28.427) (0.325) (26.247)
Number of observations: 63,218Akaike Information Criterion: 20,831.61
* indicates p < 0.05.Values in parentheses are standard errors clustered by player and bootstrapped using 1000
iterations.Ub(A¬F ) is the reference node and was normalized to zero.
1 Natural log
127

with more staple cropland. Because the raiders cannot know the levels of food sup-
port the defense forces will receive in advance (if any), attacking areas with more
cropland is a significantly preferred strategy according to the model. These results
hold even with the inclusion of relevant controls. The coefficients of Terr. Change
and Temperature are positive and significant while the coefficients of Population,
Travel Time, Border Distance, GCP, and Precipitation are negative and signifi-
cant, suggesting that these factors also have an observable effect on the utilities of
the raiders from initiating localized conflict. The coefficients in the raiders’ util-
ity from the status quo also follow theoretical expectations. The raiders will gain
from the status quo in locations and years where there is little history of conflict,
which lessens the pressures on groups to initiate preemptive conflict to weaken
their rivals as a defensive strategy; in countries with higher average income, where
it is not necessary for food to be grown locally because it can be easily obtained
via alternative means (e.g., refrigeration, improved transportation due to better
infrastructure); and in countries with more political participation, which allows
different groups to resolve potential conflicts in peaceful ways.
In line with E2, the probability of defense forces responding to attacks signif-
icantly increases in areas and years with higher values of Wheat Yield. Higher
yields correspond to higher levels of food support (as shown in the formal model),
which allow the defense forces to operate freely and for longer periods of time, and
attract more recruits if needed. By capturing the civilians’ incentives to provide
food (as derived in Proposition 1) in addition to the levels of food available in a
given grid cell during a given year, this indicator provides a close approximation
of θ levels. This suggests that providing higher levels of food support is a signif-
icantly preferred strategy by the civilians according to the model. Again, these
128

results hold even with the inclusion of climatic variables. The coefficients of Pre-
cipitation, Population, and GCP, Travel Time, and Border Distance are negative
and significant, while Terr. change and Temperature are positive and significant.
To verify whether these strategic interactions also have a substantive effect
on the probability of raids and defense forces’ responses, I also evaluate how the
level of cropland and wheat yields increases the predicted probabilities of these
phenomena. The predicted change in the probability of raids in based on staple
cropland availability, and the predicted change in the probability of defenders
responding to attacks based on wheat yield values are presented in Figure 3.3,
with bootstrapped 95% confidence intervals, while holding all other variables to
their medians or means. As illustrated by these plots, the utility of raiders from
attacking a given region increases by 2.5% on average across the range of Cropland.
Similarly, the utility of the civilians increases by about 2% across the entire range
of Wheat Yield, as this suggests that higher levels of food support mean that the
defenders are more likely to respond. These quantities are relatively quite sizable
considering the relative rarity of conflict in my sample, and suggest a substantive
impact of locally grown resources on localized conflict.12
Robustness Analyses
To verify the robustness of these findings to alternative mechanisms, in this section
I reestimate this model using six different specifications. First, the effect of ur-
banization on the utilities of the raiders and the civilians is more throughly taken
12From a comparative example, the coefficient for GCP have almost no effect on the decisionof the raiders to attack a given location.
129

Figure 3.3: Predicted Probabilities From Preemptive Conflict
0.02
0.03
0.04
0.05
0.00 0.25 0.50 0.75 1.00% Cropland
Pro
babi
lity
raid
ers
atta
ck
Effect of Cropland on Raids
0.550
0.575
0.600
0.625
0.00 0.25 0.50 0.75Cropland per capita
Pro
babi
lity
defe
nder
s re
spon
d gi
ven
raid
ers'
atta
ckEffect of Wheat Yields on Defenses
into account by including an indicator measuring the level of urbanization in each
grid cell in the equations capture the raiders’ and defense forces’ utilities in Table
3.4. Second, numerous studies have equated a higher likelihood of conflict with
lower state capacity levels (e.g., Fearon and Laitin, 2003). To account for this
possibility, Table 3.5 estimates the primary model with the inclusion of distance
to capital and the percentage of a given cell that is mountainous, in a manner
used in past studies (Fearon and Laitin, 2003; Fjelde and Hultman, 2014). Third,
attacks in certain grid cells might be caused because attacks nearby push raiders
to attack these cells due to their vicinity, i.e., conflict can simply spill over from a
neighboring cell. To account for this possibility, Table 3.6 includes spatial lags of
raider attacks in the raiders’ utility function.
Fourth, recall that none of the independent variables (excluding the lag of the
dependent variable) were lagged due to the potential misspecification issues and in-
130

ferential biases that might result (Bellemare, Masaki and Pepinsky, Forthcoming).
Nevertheless, to show that my results are robust to this decision, a model where
all time varying indicators are lagged by one year is reported in Table 3.7. Fifth,
the size of a given state’s military might influence the raiders’ decision whether
to initiate conflict or pursue more peaceful solutions under the status quo. To ac-
count for this possibility, a model that includes lagged military expenditure in the
raiders’ utility from the status quo (obtained from the Correlated of War dataset
Singer, Bremer and Stucky, 1972) is reported in Table 3.8 to account for the po-
tential effects of military (i.e., defense force) size on the raiders’ decision to attack.
Finally, to show that the results are not driven by my choice of controls or the
number of indicators included in the model, a baseline specification of the primary
analysis using only a small number of variables in the utility functions of the both
the raiders and the civilians. Crucially, the significance and sign of cropland and
wheat yields is consistent across these different specifications, which additionally
confirms the argument developed in the previous section.
131

Table 3.4: Player Utilities for Raids and Defenses, 1998-2008, With Urbanization
Ur(AF ) Ub(AF ) Ur(SQ)
Cropland 1.802* – –(0.331)
Wheat Yield – 0.318* –(0.072)
Population1 -1.224* -0.134* –(0.558) (0.015)
GCP1 -7.051* -0.256* –(1.644) (0.027)
Terr. Change 19.633* 0.808* –(2.934) (0.195)
Travel Time1 -1.636 -0.062* –(0.845) (0.023)
Border Distance1 -0.863* -0.025* –(0.328) (0.008)
Temperature 0.416* 0.020* –(0.128) (0.003)
Precipitation1 -3.010* -0.162* –(1.003) (0.020)
Urbanization 1.023* 0.033* –(0.359) (0.006)
Conflictt−1 – – -0.143*(0.022)
GDP per capitat−11 – – 0.081
(0.057)Polity2t−1 – – 0.066*
(0.008)t -2.195 0.096 -2.230
(8.132) (0.153) (8.088)t2 1.064 -0.043 1.088
(1.097) (0.023) (1.077)t3 -0.073 0.003* -0.075
(0.050) (0.001) (0.048)Constant -35.796 3.157* -39.785
(34.374) (0.378) (30.389)
Number of observations: 63,218Akaike Information Criterion: 20,796.49
* indicates p < 0.05.Values in parentheses are standard errors clustered by player and bootstrapped using 1000
iterations.Ub(A¬F ) is the reference node and was normalized to zero.
1 Natural log
132

Table 3.5: Player Utilities for Raids and Defenses, 1998-2008, With State CapacityIndicators
Ur(AF ) Ub(AF ) Ur(SQ)
Cropland 1.563* – –(0.377)
Wheat Yield – 0.168* –(0.072)
Population1 -2.107* -0.098* –(0.904) (0.018)
GCP1 -1.858 -0.058 –(3.022) (0.067)
Terr. Change 24.296* 0.583* –(3.329) (0.284)
Travel Time1 -1.624 -0.033 –(1.229) (0.034)
Border Distance1 -0.862 -0.016 –(0.498) (0.013)
Temperature 0.950* 0.021* –(0.170) (0.008)
Precipitation1 -3.465 -0.111* –(1.896) (0.045)
Mountains 2.379 -0.010 –(1.282) (0.036)
Capital Distance1 3.592* 0.077* –(1.037) (0.037)
Conflictt−1 – – -0.146*(0.023)
GDP per capitat−11 – – 0.099
(0.056)Polity2t−1 – – 0.050*
(0.008)t 3.806 0.080 4.237
(5.098) (0.100) (5.085)t2 0.443 -0.009 0.337
(0.704) (0.017) (0.672)t3 -0.051 0.001 -0.045
(0.034) (0.001) (0.031)Constant -121.80* 1.830* -80.356
(32.164) (0.904) (27.183)
Number of observations: 62,567Akaike Information Criterion: 20,419.50
* indicates p < 0.05.Values in parentheses are standard errors clustered by player and bootstrapped using 1000
iterations.Ub(A¬F ) is the reference node and was normalized to zero.
1 Natural log
133

Table 3.6: Player Utilities for Raids and Defenses, 1998-2008, With Spatial LagAttacks
Ur(AF ) Ub(AF ) Ur(SQ)
Cropland 1.330* – –(0.380)
Wheat yield – 0.259* –(0.100)
Population1 -1.186* -0.113* –(0.403) (0.022)
GCP1 -3.548* -0.151* –(1.340) (0.037)
Terr. Change 21.832* 1.095* –(5.430) (0.259)
Travel Time1 -1.026 -0.042 –(0.890) (0.032)
Border Distance1 -0.376 -0.005 –(0.332) (0.014)
Temperature 0.406* 0.019* –(0.111) (0.005)
Precipitation1 -2.109* -0.108* –(0.948) (0.041)
Attack Spl. Lag 5.867* – –(0.189)
Conflictt−1 – – -0.065*(0.012)
GDP Per Capitat−11 – – 0.087
(0.061)Polity2t−1 – – 0.049*
(0.009)t -11.822 0.360 -10.821
(9.140) (0.277) (8.759)t2 2.209 -0.071 2.065
(1.439) (0.046) (1.366)t3 -0.113 0.004 -0.107
(0.070) (0.002) (0.066)Constant -26.354 1.691* -18.649
(25.927) (0.662) (20.321)
Number of observations: 63,163Akaike Information Criterion: 19,119.33
* indicates p < 0.05.Values in parentheses are standard errors clustered by player and bootstrapped using 1000
iterations.Ub(A¬F ) is the reference node and was normalized to zero.
1 Natural log
134

Table 3.7: Player Utilities for Raids and Defenses, 1998-2008, With Lagged Inde-pendent Variables
Ur(AF ) Ub(AF ) Ur(SQ)
Cropland 1.455* – –(0.322)
Wheat Yieldt−1 – 0.113* –(0.034)
Populationt−11 4.270* 0.051* –
(0.788) (0.008)GCPt−1
1 7.198* 0.158* –(1.655) (0.022)
Terr. Changet−1 -9.589 -0.224* –(5.647) (0.056)
Travel Time1 1.413 0.036* –(1.185) (0.016)
Border Distance1 1.219* 0.029* –(0.540) (0.007)
Temperaturet−1 -5.700* -0.010* –(0.179) (0.002)
Precipitationt−11 7.842* 0.132* –
(1.298) (0.017)Conflictt−1 – – -0.148*
(0.024)GDP per capitat−1
1 – – 0.140*(0.055)
Polity2t−1 – – 0.080*(0.008)
t 17.486* -0.110* 14.277(8.245) (0.056) (7.738)
t2 -1.512 -0.007 -0.885(0.936) (0.007) (0.817)
t3 0.043 0.001* 0.009(0.040) (0.0004) (0.031)
Constant 315.65* -0.884* -128.40*(86.084) (0.217) (45.501)
Number of observations: 63,163Akaike Information Criterion: 21,693.97
* indicates p < 0.05.Values in parentheses are standard errors clustered by player and bootstrapped using 1000
iterations.Ub(A¬F ) is the reference node and was normalized to zero.
1 Natural log
135

Table 3.8: Player Utilities for Raids and Defenses, 1998-2008, With Military Ex-penditure
Ur(AF ) Ub(AF ) Ur(SQ)
Cropland 1.376* – –(0.324)
Wheat Yield – 0.189* –(0.074)
Population1 -2.257* -0.108* –(0.556) (0.017)
GCP1 -5.856* -0.139* –(1.376) (0.024)
Terr. Change 23.231* 0.568* –(3.224) (0.174)
Travel Time1 -2.066* -0.045* –(0.830) (0.023)
Border Distance1 -0.914* -0.012 –(0.297) (0.008)
Temperature 0.729* 0.020* –(0.131) (0.004)
Precipitation1 -3.871* -0.126* –(1.029) (0.022)
Conflictt−1 – – -0.145*(0.021)
GDP Per Capitat−11 – – 0.257*
(0.055)Polity2t−1 – – 0.056*
(0.008)Mil. Expt−1 – – -0.280*
(0.029)t 3.578 -0.092 4.578
(6.560) (0.125) (6.453)t2 0.568 -0.009 0.361
(0.938) (0.021) (0.901)t3 -0.062 0.001 -0.051
(0.045) (0.001) (0.042)Constant -82.572* 2.713* -78.229*
(29.310) (0.370) (26.043)
Number of observations: 62,527Akaike Information Criterion: 20,303.92
* indicates p < 0.05.Values in parentheses are standard errors clustered by player and bootstrapped using 1000
iterations.Ub(A¬F ) is the reference node and was normalized to zero.
1 Natural log
136

Table 3.9: Player Utilities for Raids and Defenses, 1998-2008, Baseline Model
Ur(AF ) Ub(AF ) Ur(SQ)
Cropland 1.529* – –(0.309)
Wheat Yield – 0.283* –(0.071)
Population1 -2.151* -0.159* –(0.615) (0.020)
Temperature 0.614 0.025* –(0.161) (0.004)
Precipitation1 -1.831* -0.108* –(0.721) (0.018)
Conflictt−1 – – -0.208*(0.027)
GDP Per Capitat−11 – – 0.123*
(0.042)Polity2t−1 – – 0.075*
(0.008)t 6.767 0.008 -17.798
(7.552) (0.130) (15.115)t2 -0.318 -0.044* 3.527*
(0.921) (0.021) (2.101)t3 -0.005 0.003* -0.189**
(0.041) (0.001) (0.096)Constant -76.377 2.859* 61.260
(45.476) (0.337) (36.381)
Number of observations: 62,527Akaike Information Criterion: 20,307.26
* indicates p < 0.05.Values in parentheses are standard errors clustered by player and bootstrapped using 1000
iterations.Ub(A¬F ) is the reference node and was normalized to zero.
1 Natural log
137

Predictive Analysis
Statistical results can provide evidence about the incentives governing the strate-
gic behavior of different actors, but these estimates in-and-of-themselves tell us
little about the generalizability of this strategic model to out-of-sample situations,
and whether the effects identified are truly substantively meaningful in a broader
context (Greenhill, Ward and Sacks, 2011). Given the growing importance of fore-
casting to the study of political violence (Brandt, Freeman and Schrodt, 2011), a
valid strategic model should also possess some predictive power that makes it pre-
ferred to a “coin-flip” model (i.e., a model that has a completely random chance
of predicting a given conflict event). I evaluate the forecasting strength of the
estimates derived by my strategic model for the years 1998-2008 on out-of-sample
data for 2009-2010 (for summary purposes, the frequencies of raider attacks and
defender responses for 2009-2010 are shown in Figure 3.4). To this extent, the
separation plots in Figure 3.5 illustrate the strategic model’s ability to forecast
raids and defenses, respectively. These plots evaluate the model’s predictive fit by
showing the extent to which the actual instances of events (dark colors in these
graphs) are concentrated on the right side of the plot, while instances of no-events
(light colors) are concentrated on the left side (Greenhill, Ward and Sacks, 2011).
As these plots show, the strategic model does a reasonably good job of predict-
ing conflict given that most of the events are clustered on the right-hand side of the
graph. Indeed, the ROC curves for this model, reported in Figure 3.6, show that
it correctly predicts approximately 84% of raider attacks (with a 95% confidence
138

Figure 3.4: The Regional Distribution of Attacks by Raiders and Responses byDefense Forces, 2009-2010
Raider Attacks, 2009-2010 Defender Responses, 2009-2010
Figure 3.5: The Forecasting Accuracy of the Statistical Strategic Model on Out-of-Sample Data, 2009-2010
Foreasting Accuracy: Raids Foreasting Accuracy: Responses
139

interval of 32%⇔ 86%) and 86% of defender responses (with a 95% confidence in-
terval of 84%⇔ 88%) for the years 2009-2010. These quantities can be compared
to the forecasting strength of a completely random “coin flip” model, which should
correctly predict about 50% of all observations. Moreover, as additionally shown
in Tables 3.10 and 3.11, this model provides a significantly better predictive fit to
the data based on DeLong, DeLong and Clarke-Pearson (1988) test compared with
standard logit models that do not account for the strategic nature of preemptive
conflict (i.e., models that include all the regressors in one equation), using both in
and out-of-sample data.
Figure 3.6: ROC Curves for Each Stage in The Statistical Strategic Model
Out-of-Sample ROC:Raider Attacks, 2009-2010
Out-of-Sample ROC:Defender Responses, 2009-2010
Note: The AUCs for each phase are ≈ 95% for raider attacks and ≈ 98% ofresponses by defense forces when the threshold is dichotomized at 0.5 instead of1, as used by numerous studies that employ ROCs.
140

Table 3.10: Comparison of Prediction Strength, LQRM and Logit Models, 1998-2008
Raider Attacks Defender ResponsesLQRM Logit LQRM Logit
AUC 0.83 0.82 0.86 0.85
DeLong et al. test z = 5.373* z = 4.787*
Favors: LQRM LQRM
N 63,218
Note: * indicates p < 0.05.
Null hypothesis for Delong et al.’s Test for two correlated ROC curves: true difference in AUC’s
is equal to zero.
Table 3.11: Comparison of Prediction Strength, LQRM and Logit Models, Out-of-Sample Data (2009-2010)
Raider Attacks Defender ResponsesLQRM Logit LQRM Logit
AUC 0.84 0.83 0.86 0.83
DeLong et al. test z = 2.234* z = 3.602*
Favors: LQRM LQRM
N 14,420
Note: * indicates p < 0.05.
Null hypothesis for Delong et al.’s Test for two correlated ROC curves: true difference in AUC’s
is equal to zero.
In sum, the empirical model makes correct predictions for the vast majority of
violent conflict events. Along with the theoretical model and qualitative evidence
provided in the above, this provides strong indication that preemptive conflict over
food resources is an important aspect of warfare in the developing world.
141

Conclusion
The use of food denial as a weapon is not a recent phenomenon. Throughout
history and well into the 19th century, armies living off the land have been a reg-
ular characteristic of warfare, and—correspondingly—the preemptive destruction
of food resources. By incorporating the insight that food support is crucial in
facilitating military operations in these contexts and using a statistical estimator
that is the structural equivalent of my theoretical model, this chapter confirmed
these expectations at the highly localized level. These interesting findings diverge
from current conceptualizations of food and violence in some prominent studies
(e.g., Burke et al., 2009), but are consistent with a broad historical narrative and
other studies of such attacks (Butler and Gates, 2012; Adano et al., 2012; Koren
and Bagozzi, 2016).
This chapter, and the previous one, establish that food abundance impacts con-
flict patterns at the highly localized level. In both chapters, I developed different
theories and derived relevant expectations that were then tested empirically using
different methodological approaches. Both chapters could be viewed as stand-alone
analyses, yet together they provide ample evidence not only that food matters as
a generator and a compounder of conflict, but also how the two types of conflict—
possessive and preemptive—are linked. To this end, I discussed and evaluated
different relevant mechanisms that operate at the microlevel in contemporary war-
fare in Africa. What is still missing, however, is an answer to the question of
how food resources impact broad rebellion patterns. In other words, how do the
microlevel linkages between food resources and conflict identified in this present
chapter and the previous one affect the likelihood and duration of rebellions at
142

the macrolevel? Building on the insights developed in Chapters 2 and 3, the next
chapter answers this question by using mixed microlevel evidence to derive and
test macrolevel hypotheses. Nevertheless, as I discuss in great detail in the con-
cluding chapter, independently, Chapters 2 and 3 nevertheless inform both our
understanding of the causes of conflict, and how policymakers should approach
these issues locally.
143

Chapter 4: Food and Rebellion –
Evidence From Micro and Macro Level
Analyses
Introduction
In Chapter 1, I constructed a theory linking food resources abundance to social
conflict and civil war in developing countries. I described how armed groups de-
rive strategies according to food security concerns, and how issues of local food
availability and access explains not only how conflict arises locally, but also how
it affects (i) the distribution of violence within the state, and (ii) armed conflict
outcomes. Broadly, rebellions cannot succeed if access to locally-produced food
resources does not exist, or persist. Nor can rebellions be quashed if armed groups
cannot guarantee and protect local food support networks that allow these organi-
zations to operate in different regions for long periods of time. Although modern
armies of developed countries are likely to enjoy regular logistic support, such as-
sistance is relatively rare in the developing world, especially for rebel and militia
groups (Henk and Rupiya, 2001). Access to locally sourced food is thus crucial
in facilitating the success of a rebellion; the ability of different armed actors to
144

control key food provision points is paramount.
In Chapters 2 and 3, I developed and tested complementary, microlevel ex-
planations to scarcity-centric theories by highlighting two broad types of conflict
over food security associated with the local abundance of food resources. In Chap-
ter 2, I showed that groups frequently initiate conflict locally in order to secure
food resources for their own consumption, a strategy I called possessive conflict
over food security. In Chapter 3, I derived a statistical strategic model to show
that armed groups fight over food resources not only to possess them but also to
prevent them from being consumed by others, and to illustrate that local conflict
frequently arises endogenously, as a result of the strategic choices made by different
groups. I accordingly termed this interaction preemptive conflict over food security.
By integrating novel theoretical explanations with quantitative empirical analysis,
these substantive chapters established that the abundance of food resources have a
strong impact on conflict, both within and outside of rebellion confines. This is a
counterintuitive finding, given previous scholars’ understanding of food production
as impacting conflict primarily through increasing local scarcities, which generate
stronger competition and reduce economic output (e.g., Burke et al., 2009; Miguel,
Satyanath and Sergenti, 2004).
Accordingly, the present chapter connects the arguments developed and analy-
ses conducted in Chapters 2 and 3 to the broad framework proposed in Chapter 1.
In the first part of this chapter, I corroborate these claims through a meticulous
mixed-methods analysis of the Mau-Mau rebellion in 1950s Kenya, which employs
archival records originally collected in the National Archives of the United King-
dom. These microlevel analyses allow me to derive two research hypothesis for
how food availability should impact conflict patterns at the macrolevel. Accord-
145

ingly, in the second section of this chapter I test these hypotheses on a sample
of all countries over the 1961–1988 period. In both analysis stages I confirm that
food resources significantly and substantively increase both the probability of re-
bellions, and their duration. I then estimate an extensive number of sensitivity
analysis to illustrate not only the robustness of my analyses, but also the applica-
bility of this theory to contemporary times. Finally, I conduct a set of two-step
probit instrumental regressions to illustrate that my results are reasonably robust
to endogeneity concerns.
The Mau Mau Rebellion: A Disaggregated Analysis
In this section I report on a microlevel, mixed-methods analysis conducted using
data I collected and coded on the Mau Mau rebellion in Kenya to evaluate the
validity of my theoretical expectations and set them in a historical context. The
documents used throughout this section for both the qualitative and quantitative
analyses were collected at the National Archives of the United Kingdom. Some
of these records have only become available within the past few years. Due to
the exceptional level of detail found in these documents, the Mau Mau case is
instrumental in illustrating the critical nature of food resource accessibility in the
context of armed rebellion. Because the strategic decisions and deliberations of
policymakers are extremely well-documented, it is possible to distinguish between
the physical and psychological aspects of regular food support. Qualitatively, I
rely on documents written by British colonial administrators to show that these
officials were aware of both the physical wellbeing and morale-building aspects of
regular access to nutritious food, and thus sought to limit the rebels’ food access,
146

forcing them to spend most of their time hunting or foraging and simultaneously
lowering their morale. Quantitatively, I validate whether the behavior of Mau Mau
rebels followed the patterns one would expect based on these qualitative sources
using an original district-month dataset on different types of violence occurring
locally within three Kenyan districts, and accounting for a variety of confounders.
Background
The Mau Mau rebellion that began in 1952 was one of Britain’s most violent
decolonization wars (Bennett, 2013). The Colony and Protectorate of Kenya, orig-
inally the East Africa Protectorate, had been a British colony since 1895, although
private companies operated in the region since the 1840s. The conflict all but
ended in 1956, after the rebel leader Dedan Kimathi was captured and executed,
although limited skirmishes and small-scale raids continued to occur until the end
of the decade. Casualty estimates for the rebellion, including both combatants
and civilians, range from 5,000 to 20,000 deaths (Bennett, 2013, 18–19). It was
a brutal rebellion involving severe human rights violations by both British and
Mau Mau troops (Branch, 2007). British counterinsurgency operations were ex-
tensive and included the fortifications of villages and police posts, large-scale raids
and patrols, widespread imprisonment of suspects in transitional camps, and even
civilian killings and witch-hunting of Mau Mau oath-takers (Luongo, 2006).
Grievances, especially those related to agriculture and the distribution of land,
were a major motivation for the rebellion. During the war, many Kikuyu, Embu
and Meru—the major ethnic groups in Kenya—were pushed to join Mau Mau
because they were excluded from the means of achieving self-sustenance within
the colonial political economy by settler farmers, colonial administrators, and other
147

“land-hungry” patrons (Branch, 2007). Even prior to the rebellion, these aggrieved
individuals rejected the leadership of chiefs within their respective groups, men who
in practice served as local administrators under the colonial regime, by refusing
to obey and sometimes even directly attacking them. The politics of protest also
became radicalized, especially after those who served in the British armed forces
during the Second World War returned to Kenya. Having served overseas, these
veterans rejected the belief, encouraged by the British, that a European is better
than an African (Branch, 2007).
The Mau Mau rebellion started as a low-intensity conflict, with sporadic at-
tacks against local chiefs and police stations (Bennett, 2013). With security forces
stretched thinly across the region and the loyalist auxiliary Home Guard poorly or-
ganized, however, the majority of Kenyans could not be protected from Mau Mau
and related violence. As a result, the low-intensity emergency quickly morphed
into a full-scale civil war, with the Mau Mau escalating both the number and scale
of its attacks, and adding British military forces and European farmers to its list of
targets. The Mau Mau initiated loyalty oaths, which many civilians—even if they
did not support the rebellion’s aims—took as to avoid being labeled as loyalists
(Branch, 2007). The Mau Mau, however, did not always resort to terror to ob-
tain support. Its appeal to widespread grievances, especially the desire to expand
access to land and food resources, made Mau Mau a popular cause so long that
there was no viable alternative. Violence against civilians was used more to gain
the begrudging endorsement of waverers and guarantee compliance, or to influence
European farmers (Branch, 2007).
The British response was initially unsuccessful. Massive waves of arrests failed
to halt the violence, and patrols and raids achieved no tangible results. This led
148

many to criticize the colonial government as having no real strategy to handle the
increasingly violent rebellion (Bennett, 2013). Slowly, British military retaliation
gained momentum. More local police guards were hired, and arrests became more
effective at weakening the Mau Mau. The British also started a system of “screen-
ing camps,” designed to weed out Mau Mau oath takers and other supporters. At
the same time, Mau Mau attacks became more violent. On March 26, 1953, the
Mau Mau attacked both Lari village and the Naivsha police station. In Lari, the
Mau Mau massacred 120 civilians, while the raid on Naivsha resulted with the
release of many prisoners and the loss of weapons and munitions, which heavily
embarrassed the government (Bennett, 2013, 17-18). The British responded by
heavy arming of the Home Guard and the deployment of the Buffs and Devons
brigades, which signaled to beginning of an organized counterinsurgency campaign.
Analysis
Shortly after the beginning of the rebellion, colonial officials came to recognize
that regular access to food both provided easy fuel to the Mau Mau, and served to
boost the rebel troops’ morale. These officials thus sought to systematically limit
the rebels’ access to locally sourced food, drawing on the active participation of
provincial governors, district committees, the army, and local farmers (Bennett,
2013, 255-257).1 As guided by the high command, army forces and farmers pre-
maturely harvested crops deemed particularly valuable for the Mau Mau, such as
maize and potatoes. Between May and June 1953, the army reaped about 400
bags of potatoes, while units began clearing “shambas” (farms or plots of lands),
preventing crops from being planted close to the forest, concentrating labor near
1For a similar counterinsurgency strategy in Malaya, see Ramakrishna, 2002, 140-143.
149

farms, and enclosing cattle in “bomas,” or pens. These food denial measures were
intended both to reduce the physical capacity of Mau Mau rebels, and lower their
morale. Indeed, both aspects were mentioned in an edition of the East African
Standard, the most widely read newspaper in Kenya and strongly pro-colonial,
from June 1953, which stated that, “the plan has the intention of making the
gangs spend their time and energy searching for food so their raids and killings are
cut down; and at the same time lower their resistance powers and morale as the
offensive is stepped up by striking forces.”2
The same dual logic was apparent in policymaking deliberations. For instance,
the committee responsible for limiting rebel access to food around the Aberdare
mountain range recognized that Mau Mau rebels operating in the region “could, if
so compelled, subsist on game and the natural resources of the forest. For example,
a buffalo cuts up at about 1500 lbs of meat: assuming that the Mau Mau gangs
number approximately 700 men, an average of one buffalo a day would, statisti-
cally, suffice to feed them.”3 However, they believed that limiting rebels’ access
to food grown by local farmers would nevertheless be an advantageous strategy,
because, “[a]lthough the gangs could live on the natural produce of the forests, the
Committee consider that if they were forced to do so, their efficiency for operations
would be much reduced; they would have to spend so much time and energy in
feeding themselves that they would be much less formidable opponents than they
are now. It is therefore worthwhile trying to deprive them of supplies which are
more easily obtainable.”4
2”GANGS BEGIN TO FEEL THE PINCH: Food supplies denied them.” The East AfricanStandard, June 25, 1953.
3Document 7, The National Archives, Foreign and Commonwealth Correspondence and pre-decessors (FCO), series 141/6201.
4Ibid.
150

The decision to impose food denial measures proved effective very quickly.
As Bennett—author of arguably the most authoritative study of the Mau Mau
rebellion from a military perspective—succinctly summarizes, “by mid-September
[1953] Mau Mau redeployments favourable to the security forces appeared to be
caused by food denial,” and as a result, “the 39 Brigade placed greater emphasis
on the policy, making it the second priority, after destroying gangs” (2013, 256).
Senior military officials were quick to recognize the important role food denial
played in their grand counterinsurgency strategy, so much that “[o]ver the summer
of 1955 the new Commander-in-Chief of the British forces, Lieutenant-General
Lathbury, took a direct interest in food denial, meeting farmers to explain the
policy’s rationale” (Bennett, 2013, 256). Many British units stepped up their food
denial operations to guarantee that when the Mau Mau attacked, the army would
be ready. For instance, the “49th Brigade placed food denial on the same footing as
destroying gangs in late February 1955, when gangs were dispersed and depended
on stealing food to survive. The hope was that starving Mau Mau would attack
farms in a desperate bid to survive” (Bennett, 2013, 256).
To broadly evaluate these predictions, I construct a geocoded, within-country
district-month dataset for three contingent districts for which enough data and
documentation were available as to code a relatively large number of cases. These
districts, Kajido, Machakos, and Narok, were part of the large “native reserve”
located on the southern part of the state (see Figure 4.1, appendix), and expe-
rienced some of the highest rates of Mau Mau activity, conflict, and arrests, at
least partly due to their mixed ethnic composition of Masai and Kikuyu. Using
detailed archival resources on casualty statistics by location (also obtained from
the National Archives), I created three dependent variables coded for each month
151

starting January 1952 and ending December 1956. The first variable codes all
violent events recorded in the data; the second variable codes a subset of these
incidents that involved only armed conflict events occurring between combatants;
and the third variable codes a subset of these incidents that involved only attacks
perpetrated by Mau Mau rebels against civilians.
To test how each of these dependent variables was affected by the level of
access to food resources across these three districts, i.e., where staple crops are
grown over more area and hence could be more easily obtained, I created a vari-
able, Cropland, measuring the total area equipped for irrigation within each region
(in hectares) (Siebert et al., 2015), in a manner used in past research (e.g., Koren
and Bagozzi, 2016). Understandingly, the availability of geospatial and environ-
mental data from the period in Kenya—and Africa more broadly—is very limited,
especially at the localized level. However, these localized data on irrigated land at
the highly disaggregated 0.5 x 0.5 degree resolution level are available for 1950 and
were aggregated to the district level to create this explanatory variable. While
a time-varying indicator of food crops at a similar level of aggregation was not
available for these locations and years, using pre-conflict values should help ac-
count for some potential endogeniety concerns. With the implementation of food
denial measures everywhere in the three regions analyzed, lagged localized data
on irrigation provide a good proxy for locations where crops and cattle were avail-
able over wider areas—even after food denial measures were implemented. Indeed,
this is supported by the analyses conducted in Chapter 3, which similarly relied
on a constant measure of localized food crop yields to illustrate that raiders are
152

Figure 4.1: Administrative Areas Affected by the Uprising
Source: Bennett (2013)
significantly more likely to attach food abundant regions during conflict. As they
are constant for the time period of concern, these data capture not only within-
district effects, but also the impact of troops moving between the three contingent
districts, a crucial factor when the importance of access to locally sourced food
153

and the mobility of rebel groups are taken into account.
Despite the poor availability of geolocated data in Kenya for the early 1950s, I
was able to include several important district-level controls in my analysis. First, to
account for the possibility that violence resulted from shocks to local food availabil-
ity, which can increase pressures on available resources and might lead to violence
(Miguel, Satyanath and Sergenti, 2004), I include an annual indicator measuring
drought levels, Drought. This variable codes the annual proportion of months that
are part of the longest streak of consecutive months where precipitation values
were -1.5 or more standard deviations below the mean (out of 12 months) (Be-
guerıa et al., 2014).5 Second, to verify that Cropland indeed captures the effect
of higher food access rather than operates as a proxy for population densities, I
include a control measuring the number of persons within a given district for 1950
(Klein Goldewijk et al., 2011).6 Third, to control for continuous violence trends
from one month to the next, a one-month lag of the dependent variable is included
in the models. Finally, to account for month- or year-specific factors, as well as
temporal dependencies of conflict more broadly, binary variables for each month
and year, respectively, (i.e., month and year fixed effects) were also included in
each regression. For illustration purposes, the variation in conflict events, violence
against civilians, irrigated land, and drought levels for each district over the entire
period are plotted in Figure 4.2. Additionally, summary statistics of all variables
used in this analysis are reported Table 4.1.
5Like Cropland, this variable was measured at the 0.5 x 0.5 degree grid and averaged to thedistrict level.
6This variable was originally measured at the 0.5 x 0.5 grid cell level. Note that these data arenot available for Kenya prior to 1970. For each 0.5◦ grid cell, values for 1950 were extrapolatedbased on information available for the 1970-2000 period, and the total of these results wereaggregated by district. The results remain unchanged when real values for 1970 are used.
154

Figure 4.2: Maps of Violence, Cropland, and Drought Levels for the Kajido,Machakos, and Narok Districts
All Conflict Events
Violence Against Civilians
Cropland
Drought Severity
Table 4.2 reports the estimates of different negative binomial (NB) models used
to assess how violence within the three districts mentioned above was distributed
spatially during the rebellion. Each specification was estimated separately on each
155

Table 4.1: Summary Statistics of Microlevel Analysis Variables
Minimum Median Mean Max SD
Conflict 0 0 0.887 20 2.468Armed conflict 0 0 0.367 5 1.003Civilian victimization 0 0 0.520 15 1.689Conflict t−1 0 0 0.881 20 2.469Armed conflict t−1 0 0 0.362 5 1.002Civilian victimizationt−1 0 0 0.520 15 1.689Cropland1 4.100 4.340 4.983 6.509 1.087Drought 0.010 0.063 0.053 0.104 0.029Population1 12.462 13.584 13.261 13.736 0.570
1 Natural log
of the three different dependent variables. The Baseline model includes only the
main explanatory variable Cropland in addition to fixed effects by month and
year to illustrate that the any observed relationships are not the results of adding
different controls. Across all models and specifications, the coefficient of Cropland
is significant (to a p < 0.01 level) for each of the three dependent variables. This
confirms the argument that localized violence during the Mau Mau rebellion was
significantly more frequent in areas that prior to the rebellion offered more access
to locally sourced food. Importantly, other factors such as variations in drought
severity or population densities, as well as month- or year-specific factors (e.g.,
harvest month), do not have a consistent effect on all three dependent variables
across all models.
Substantively, Figure 4.3 shows the predicted change in the frequency of all
conflict events and civilian victimization, specifically, for the Full model across
the entire range of Cropland, when all other variables are held to their mean val-
ues (estimates were calculated based on repeated 1,000 simulations). The total
number of conflict incidents increased by approximately one incident per month,
156

on average, across the entire range of irrigated land in the Full model, while the
number of civilian victimization events, specifically, increases by approximately
0.4 incidents per month, on average. Considering that the average number of all
violence events in a given district for each month in this dataset is ∼ 0.9 while
the number of civilian victimization incidents is ∼ 0.5, this effect is sizable. These
quantitative findings thus strongly support the expectation that, during ongoing
rebellions, violence dynamics should be positively associated with more access to
locally sourced food. They also suggest that the more recent conflict patterns
identified in Chapters 2 and—to a certain extent—Chapter 3 also characterized
the Mau Mau rebellion. Indeed, these microlevel analysis results combined with
qualitative archival evidence suggest that areas with more access to food experi-
enced higher levels of all violence types by forces moving in or otherwise initiating
conflict and other attacks to obtain food, as was argued in Chapter 2, while the
British defense forces sought to control these access points, which also lead to more
conflict, as was shown in Chapter 3.
157

Figure 4.3: Predicted Probability and Violence and Civilian Victimization in Ka-jido, Machakos, and Narok
4.5 5.0 5.5 6.0 6.5
0.0
0.5
1.0
1.5
Irrigated Land (Natural Log)
Pre
dict
ed N
umbe
r of
Eve
nts
median
ci95
ci80
ci99.9
Conflict
4.5 5.0 5.5 6.0 6.5
0.0
0.2
0.4
0.6
0.8
1.0
Irrigated Land (Natural Log)
Pre
dict
ed N
umbe
r of
Civ
ilian
Vic
timiz
atio
n E
vent
s
median
ci95
ci80
ci99.9
Civilian Victimization
To ensure that food denial measures produced “maximum squeeze”7 on the
Mau Mau, colonial officials placed the highest priority on limiting access to those
food resources considered especially valuable, nutritious, and vulnerable to theft.
For instance, the Rift Valley committee stated that, “[t]he following crops of value
to the terrorists, i.e. maize, potatoes and sweet potatoes may not be grown within
3 miles of the edge of the Aberdares forest.”8 This in contrast to wheat, which
was grown primarily by European farmers. As a result, it was easier to prevent
the theft of wheat, and to quickly harvest wheat fields if needed. In the later part
of 1955, for instance, colonial officials successfully removed 441,000 bags of wheat
7Document 73, The National Archives, Foreign and Commonwealth Correspondence andpredecessors (FCO), series 141/6202.
8Document 48, The National Archives, Foreign and Commonwealth Correspondence andpredecessors (FCO), series 141/6201.
158

Tab
le4.
2:V
iole
nt
Eve
nts
inT
hre
eK
enya
nD
istr
icts
,19
52-1
956
Base
lin
eM
ed
ium
Fu
llC
on
flic
tA
rm
ed
com
.C
iv.
vic
t.C
on
flic
tA
rm
ed
com
.C
iv.
vic
t.C
on
flic
tA
rm
ed
com
.C
iv.
vic
t.
Cro
pla
nd
11.2
45∗∗∗
1.1
17∗∗∗
1.3
38∗∗∗
1.0
49∗∗∗
1.1
24∗∗∗
1.0
63∗∗∗
1.0
70∗∗∗
1.1
15∗∗∗
1.1
08∗∗∗
(0.1
88)
(0.2
25)
(0.2
62)
(0.2
01)
(0.2
57)
(0.2
78)
(0.2
27)
(0.2
90)
(0.3
16)
DV
t−1
––
–0.1
46∗∗∗
0.1
15
0.3
19∗∗∗
0.1
46∗∗∗
0.1
15
0.3
19∗∗∗
(0.0
41)
(0.1
30)
(0.0
80)
(0.0
41)
(0.1
30)
(0.0
80)
Dro
ugh
t1–
––
5.9
22
11.0
67
4.0
24
5.9
22
11.0
67
4.0
24
(6.9
28)
(9.6
86)
(9.0
51)
(6.9
28)
(9.6
86)
(9.0
51)
Po
pu
lati
on
––
––
––
−0.3
02
0.1
20
−0.6
43
(0.4
98)
(0.7
09)
(0.6
82)
Co
nst
an
t−
7.9
26∗∗∗
−7.8
61∗∗∗
−9.4
80∗∗∗
−7.0
24∗∗∗
−8.2
10∗∗∗
−7.9
82∗∗∗
−3.0
11
−9.8
07
0.5
62
(1.2
99)
(1.5
48)
(1.8
26)
(1.4
48)
(1.8
81)
(2.0
05)
(5.7
40)
(8.4
94)
(7.6
74)
Ob
serv
ati
on
s177
177
177
Log
Lik
elih
ood
−149.4
11
−90.0
43
−113.5
71
−144.3
68
−88.8
78
−106.8
95
−144.3
68
−88.8
78
−106.8
95
Akaik
eIn
f.C
rit.
334.8
22
216.0
86
263.1
41
328.7
37
217.7
55
253.7
91
328.7
37
217.7
55
253.7
91
*in
dic
ate
sp<
0.1
;**
ind
icate
sp<
0.0
5;
***
ind
icate
sp<
0.0
1.
Vari
ab
leco
effici
ents
are
rep
ort
edw
ith
stan
dard
erro
rscl
ust
ered
by
dis
tric
tin
pare
nth
eses
.F
ixed
effec
tsby
month
an
dyea
rin
clu
ded
inea
chre
gre
ssio
n,
alt
hou
gh
not
rep
ort
edh
ere.
1N
atu
ral
log
159

to safe storage, where—a durable crop as it was—it could be kept for future use.9
Indeed, the biggest problem with controlling the distribution of wheat was not its
popularity among Mau Mau rebels or the lack of compliance by reluctant farmers,
but rather “the bottle neck over this at present is the Railway whose supply of
bogies is unsatisfactory.”10
By June 1953, guards and police in so-called “squatter shambas”—i.e., plots of
land where local Kenyans, mostly from the Kikuyu ethnic group, lived as hired or
temporary labor—were ordered to, “keep and protect in stores at the homestead
all squatter maize, beans, etc., and that squatters should draw their requirement
daily from these stores.”11 In 1955 it was declared that, “[n]o potatoes, no maize,
and no squatter stock will be permitted on a farm where there is normally no res-
ident European.”12 As late as February 1956, when violence had largely subsided,
military and police forces were instructed to remove potatoes and maize from local
villages, and several councils ordered that no maize will be grown in their respec-
tive districts.13 Frequently, forced laborers were employed in removing crops and
clearing brush within one to five mile of the forest.14
Preventing the rebels from accessing maize supplies, specifically, was impor-
tant for two reasons. First, a high-protein, high-starch crop, maize provided ample
9Document 161/1, The National Archives, Foreign and Commonwealth Correspondence andpredecessors (FCO), series 141/6202.
10Document 88/1, The National Archives, Foreign and Commonwealth Correspondence andpredecessors (FCO), series 141/6202.
11Document 21, The National Archives, Foreign and Commonwealth Correspondence andpredecessors (FCO), series 141/6201.
12Document 176, The National Archives, Foreign and Commonwealth Correspondence andpredecessors (FCO), series 141/6201.
13Document 61, The National Archives, Foreign and Commonwealth Correspondence andpredecessors (FCO), series 141/6202.
14Document 93, The National Archives, Foreign and Commonwealth Correspondence andpredecessors (FCO), series 141/6202.
160

caloric intake, which—combined with the crop’s long durability—meant maize was
the most energy efficient crop Mau Mau rebels could obtain. Because it grows tall
and thick, maize also allowed the rebels to more easily conceal themselves when
moving out of the forest to capture other resources. For instance, in April 1955
colonial officials published “an Emergency Regulation forbidding the planting of
maize...since this crop when planted amoung potatoes affords cover for the easy
removal of the potatoes” (sic.).15 Second, the main staple among the Kikuyu
(Kanogo, 1987, 112), maize was the “major food and cash crop” in Kenya (Kanogo,
1987, 19), especially for “squatter” farmers. By selling it externally and getting
high prices, these farmers acquired socio-economic value as independent producers
during the inter-war period, when the British authorities overall increased their
control over the “squatter” population (Kanogo, 1987, 55-59). Indeed, the colonial
officials were aware of the relative popularity of maize and its importance com-
pared with other staple crops to many Kenyans. For instance, in January 1954,
the Central District provisional commission commented that “[i]t was considered
undesirable to prohibit the ‘long rains’ planting of maize since...[i]t would tend to
lead to a mass civil disobedience campaign on the part of the women; cases oc-
curred in 1953 in South Tetu when short rains planting of maize was forbidden.”16
For the Mau Mau rebels, maize both offered the greatest nutritional “bang for
buck” as a calorie- and protein-rich staple crop that could feed a large number
of troops for a long period of time. Maize was also relatively prevalent in regions
where the Mau Mau could operate with relative ease, or territories where Kikuyu—
15Document 88/1, The National Archives, Foreign and Commonwealth Correspondence andpredecessors (FCO), series 141/6202.
16Document 60, The National Archives, Foreign and Commonwealth Correspondence andpredecessors (FCO), series 141/6201.
161

many of whom were supportive of the Mau Mau’s aims—lived. Maize is thus an
example of a staple crop that encapsulates the maximal level of efficiency troops
can extract from the food resources available to them, and—correspondingly—
to their ability to fight a continuous war. Moreover, as Figures 4.4–4.5 below
show, maize was rather prevalent in rebellion-afflicted countries during the same
time period. As far as the Mau Mau rebellion is characteristic of other, similar
rebellions, it suggests that food is an important—and yet under-analyzed—factor
influencing the likelihood and duration of such conflicts. This begs the question:
How applicable are the relationships identified here to other, similar rebellions? In
other words, how do the patterns observed at the local level translate to macrolevel
outcomes?
The theoretical framework developed in Chapter 1 and the qualitative and
quantitative evidence presented in this section suggest that the prevalence of nu-
tritious food crops facilitates rebellions by allowing rebel groups to recruit, sub-
stantiate their size, and even attract individuals due to food-related grievances
(Hendrix and Brinkman, 2013). Higher access to these resources should also en-
able rebel groups to fight for longer periods of time by ensuring their troop are
well sustained, which increases the group’s credibility to its members, and helps
to guarantee that these troops will fight together toward a common goal. More-
over, as I have shown in Chapter 2, rebellions occur primarily in countries with
relatively low levels of development, where the majority of individuals—including
combatants and potential recruits—depend on locally grown food. In these low
development contexts, the marginal returns from an additional kilogram of staple
crops such as maize available per capita were—on average—quite high (Food and
Agricultural Organization of the United Nations, 2013). This suggests that if one
162

wishes to identify macrolevel linkages between food resources and conflict, rely-
ing on staple crop-based indicators should, from a theoretical perspective, provide
the most observable effects. Building on the quantitative and qualitative evidence
presented in this section and this chapter’s broader theoretical argument, the first
generalizable hypothesis accordingly assumes that access to more nutritious staples
should facilitate recruitment and cohesion among rebel groups:
• Hypothesis H1: The likelihood of rebellions should increase in countries and
years where more nutritious crops are available per capita
Moreover, in addition to facilitating recruitment and enabling rebel groups to
increase their relative size and elicit member participation, higher availability of
nutritious staples should also allow these groups to fight for longer periods by
providing them with both the necessary fuel to support members, and the ability
to credibly illustrate their resilience to their members. This increases internal
group cohesion and commitment to a shared goal, which accordingly suggests a
second, related hypothesis:
• Hypothesis H2: Ongoing rebellions should last longer in countries and years
where more nutritious crops are available per capita
Macrolevel Analysis: Global Evidence on Rebellions,
1961-1989
Data
These two hypothesis are tested on a sample encompassing 28 years (1961–1988),
during which 64 countries experienced civil and anti-colonial war episodes, or re-
163

bellions. Because I relied on a mixed-methods case study of a rebellion from the
Cold War period to test my theoretical argument at the micro level, I chose this
temporal period specifically as to maintain the integrity of my empirical macrolevel
analysis; ensure—from an empirical perspective—that the sample analyzed likely
exhibits similar patterns to those observed in 1950s Kenya; and verify that the
staple crop type tested is the same crop spotlighted by the documents discussed
above. 1961 was the first year for which specific data on food production by country
were available from the Food and Agricultural Organization of the United Nations
(FAO), while 1988 was chosen as the final year before the 1989 Revolutions, the
fall of the Berlin Wall, and the end of the Cold War. This temporal period thus
corresponds to conflicts characteristic of the Cold War, which were broadly similar
to the Mau Mau rebellion, i.e., internal wars frequently fought against relatively
well-armed adversaries—colonial occupiers or others—within the context of low de-
velopment (where the impact of locally sourced food is likely to be the most acute),
and involve the active or passive interferences by Great Powers (Fearon, 2004).17
Moreover, considering that many of the studies on the relationship between cli-
mate and conflict focus on the temporal period after 1980 – i.e., period when the
effects of climatic variability become strongly more noticable (Guha-Sapir, Below
and Hoyois, 2015) – the reliance on earlier decades also allows me to separate the
effect of food from that of climatic variability more broadly, and to set it within
a more historical context. Nevertheless, to show that the theory developed here
is applicable to contemporary rebellions, robustness models estimated on an ex-
tended sample that covers the entire 1961-2011 period are reported in Table 4.6
17Some examples include the Portuguese Colonial Wars (1961-1974), Nigeria (1967), Ethiopia(1974), and Algeria (1954).
164

below.
Global data on rebellion were obtained from the UCDP/PRIO Armed Con-
flict Dataset Version 4-2016 (Melander, Pettersson and Themner, 2016; Gleditsch
et al., 2002), which records all conflicts between two parties—one of which is an
official state government—that resulted in at least 25 combatant deaths. After
creating a subset of conflicts that occurred specifically within my temporal period
of interest, I removed any wars recorded as occurring only between two or more
states to focus specifically on extrasystemic, internal, or internationalized-internal
armed conflicts. The resulting dependent variable, Rebellion, is a binary indicator,
measuring whether a rebellion was recorded as ongoing (coded one) or not (coded
zero) within a given country during a given year, with a mean of 0.149 and a mode
of zero.
To test hypotheses H2, I then create a subset of these data, which includes 65
countries reported as having an ongoing rebellion (including years where the re-
bellion began and ended), i.e., countries where the variable Rebellion took a value
of one. This resulting subset is then structured into a survival analysis frame-
work, where the observations are the years during which each rebellion episode was
recorded as ongoing by the UCDP/PRIO Armed Conflict Dataset Version 4-2016.
Accordingly, a second dependent variable, Rebellion termination, is operationalized
as the final year during which a rebellion episode (as defined above) was observed
in the UCDP/PRIO data. Termination was defined based on whether an event
or a set of events (e.g., peace accords) occurred, or based on the final day/period
when fatalities have been reported jointly (Melander, Pettersson and Themner,
2016). Rebellions that were ongoing in 1989 were treated as right-censored. For
summary purposes, the duration of the longest rebellion (in years) for each country
165

experiencing an ongoing rebellion is reported in Figure 4.4.
To measure food availability, I rely on the annual production levels of maize
for each country worldwide within the 1961-1988 period. Maize was chosen for
several reasons. First, maize is a primary global staple, especially in developing
countries (Food and Agricultural Organization of the United Nations, 2016, 2013),
making it likely that—even without its other advantages and characteristics taken
into account—a good choice to approximate statewide food availability. Indeed,
maize is the main staple crop in Africa, Latin America, and western Asia, regions
that historically were highly susceptible to rebellions (Oerke and Dehne, 2004).
Second, maize fields are prevalent in many rebellion-prone countries, specifically,
which means that they are likely to be the most accessible to a rebel group fighting
in rural areas, which, as Mkandawire argues, “aspires to some form of sedentary
existence or respite in ‘liberated zones’” (2002, 200). As such, regular access to
more maize fields should allow rebel leaders to credibly show that they can support
their members and fight long conflicts, thus increasing group cohesion as the theory
developed above suggests.
Third, unlike many other crops, maize can be easily retrieved, stolen, trans-
ported, and kept for relatively long periods of time without the risk of decomposi-
tion. Maize does not require special preparation or processing, and in fact can eas-
ily be consumed raw. It is also rich in both starches—i.e., energy—and nutritious
proteins, fuel to support hungry rebels and their war efforts (FAO, 2013). Finally,
as the qualitative evidence presented in the previous section shows, British colonial
officials were particularly concerned about highly nutritious crops, and maize was
the staple most frequently mentioned in these documents. Considering that when
moving from micro- to macrolevel analysis I tried to maintain empirical coherence
166

to the best of my ability (as I discussed above), relying on these primary docu-
ments to identify specific food resources that might be especially valuable to rebels
in other contexts follows this very approach. For illustration, caloric intake from
maize as percent of total caloric intake for all countries surveyed by the FAO are
reported in Table 4.3. Nevertheless, to illustrate that my global analyses’ findings
are robust to this focus on maize, a robustness model that relies on an alternative
conceptualization that incorporates all nutritious grain types is reported in Table
4.6 below.
167

Table 4.3: Maize As Total Caloric Intake For Selected Countries∗
Country Maize (kcal/capita/day)† Total Intake (kcal/capita/day)‡ Maize % Total
Malawi 1,163.667 2,236.52 34.224%Zambia 927.667 1,967.49 32.042%Mexico 997.333 2,123.56 31.957%Kenya 695.667 1.798.67 27.890%Guatemala 793.667 2,289.96 25.738%Timor-Leste 598.667 2,180.08 21.544%Togo 569.667 2,158.96 20.877%Mozambique 437.667 1,955.3 18.290%Egypt 567.333 2,629.32 17.748%Moldova 548.667 2,689.94 16.941%Paraguay 519.667 2,836.87 15.482%Venezuela 400.667 2,189.09 15.471%Nepal 372 2,230.92 14.292%Bolivia 291.333 1,866.47 13.501%Uganda 242.667 2,006.2 10.791%Mali 271.667 2,276.33 10.662%Ghana 200.667 2,302.29 8.017%Cote d’Ivoire 182.333 2,104.62 7.973%Haiti 184.333 2,323.93 7.349%Panama 158 2371.33 6.247%Pakistan 110.667 1949.4 5.372%Laos 131.667 2,570.84 4.872%Cambodia 101.667 2,054.87 4.714%Philippines 88.667 1,899.94 4.459%Chad 102 2,461.29 3.979%Viet Nam 84.667 2,115.88 3.848%Thailand 93.333 2,617.22 3.443%Azerbaijan 78 2855.55 2.659%Niger 26.333 1,937.64 1.341%Sudan 23 2,237.72 1.017%Albania 20.667 2,924.91 0.702%Hungary 5 2,449.92 0.204%Bangladesh 3.667 2,119.18 0.173%Lithuania 3.667 2,811.39 0.130%Iraq 3 2,582.48 0.116%
∗ All countries in which the FAO conducted surveys† Average, 2006-08 (FAO estimates)
‡ Data based on FAO surveys conducted in these countries, 1999-2008
Building on previous research on food security (e.g., Barrett, 2010), I code an
indicator, Maize (KgPC), that measures the total amount (in kilograms) of maize
available per capita in each country over the temporal period of analysis. As such,
this indicator measures food availability—i.e., supplies—as commonly conceptu-
alized in extent research (e.g., Koren and Bagozzi, 2016), which are “typically
measured in daily calories per person” (Barrett, 2010, 825). This indicator was
obtained from the FAO (2016). For summary purposes, the average availability
168

of maize by country in kilograms per capita is reported in Figure 4.5. Indeed, a
visual inspection of Figures 4.4–4.5 shows that many of the countries experiencing
the longest rebellions also had medium-to-high levels of maize production.
Figure 4.4: Conflict Duration (Years), 1961-1988
Figure 4.5: Maize, 1961 – 1988, KG per capita
169

The impact of food resources on rebellion is evaluated alongside other impor-
tant confounders highlighted in the literature on internal conflict, socioeconomic
development, and political institutions. First, it might be that food availability
serves as a proxy for population-related consumption pressures such as the need to
feed a large number of civilians and combatants (e.g., Fearon and Laitin, 2003). To
account for these potential effects, I include two variables—Population and Mili-
tary personnel—measuring the number of people living in a given country during a
given year (in 1000s) (Gleditsch, 2002), and the number of people serving annually
in each country’s military forces (Singer, Bremer and Stucky, 1972), respectively.
Second, previous studies have highlighted the importance of economic develop-
ment (as a measure of state capacity) or political openness on the likelihood and
duration of rebellions (e.g., Fearon and Laitin, 2003; Collier and Hoeffler, 1998).
To account for the possibility that the impact of food availability on conflict is
driven by issues related to economic development or democratization, I include two
general proxies for these potentially salient confounders. Economic development
is captured by gross domestic product per capita, GDP PC coded by Gleditsch
(2002). Democratization levels are coded based on the widely used Polity 2 mea-
sure, which ranges from -10 (most autocratic) to 10 (most democratic) (Marshall,
Jaggers and Gurr, 2013). This variable, Democracy, was coded as one if a country
received a score of seven or more on the Polity 2 indicator (i.e., a democracy), zero
otherwise, in a manner used in past research (e.g., Fearon and Laitin, 2003).
Finally, as I argued in Chapters 1 and 2, the effect of food availability on rebel-
lion might be the result of a lack of logistic support provided to the warring troops.
To account for these possibilities, I include an additional indicator, Military ex-
penditure, which codes the total expenditure (in USD) spent on the military in a
170

given country during a given year (Singer, Bremer and Stucky, 1972). As such,
whereas the variable Military personnel accounts for the demand aspect of food
resources, this variable is a proxy for the amount of logistic support available to
feed troops, at least among state forces, and hence for supply levels. I chose to
include these theoretically-motivated variables in my models based on the rec-
ommendations of research on the statistical analysis of observational data, which
recommends including only a small number of additional independent variables
due to the potential biases that might arise from including a large number of po-
tential confounders (Schrodt, 2014). Nevertheless, I illustrate the robustness of my
findings to this empirical choice by reporting models that include a large number
of additional controls in Table 4.6 in the next section. Summary statistics of all
the variables used in this country level analysis (including those used in robustness
models) are reported Table 4.4.
171

Table 4.4: Summary Statistics of Country Level Variables, 1961–1988
Minimum Median Mean Max SD
Cross Sectional AnalysisRebellion 0 0 0.149 1 0.356Maize (KgPC)1 0 1.710 1.881 5.184 1.543Population1 4.701 8.812 8.767 13.902 1.670Military personnel1 0 10.434 10.003 15.3744 2.899GDP PC 1 5.731 8.094 8.186 13.357 1.166Democracy 0 0 0.261 1 0.440Military expenditure1 0 18.698 18.256 26.485 4.126Rebelliont−1 0 0 0.147 1 0.354Oil prod.1 0 0 6.859 20.239 7.700Gas prod.1 0 0 1.259 8.539 1.967Eth. frac. 0.001 0.349 0.399 0.925 0.290Rel. frac. 0 0.374 0.374 0.783 0.220% Mountains 0 9 17.574 94.3 21.200Iron & steel1 0 0 5.963 18.909 7.146Clim. disasters 0 0 0.124 3 0.365Fats from cereals (daily grams) 0 4.130 4.904 17.340 3.472Country area1 5.707 12.459 12.172 16.707 2.034Coupt−1 0 0 0.063 1 0.242Civil dis.t−1 0 0 0.018 1 0.134Mass killingt−1 0 0 0.227 1 0.419Intense rebellion 0 0 0.053 1 0.224Over govt. 0 0 0.074 1 0.262Hyd. disasters 0 0 0.263 10 0.714Bio. disasters 0 0 0.064 5 0.314Met. disasters 0 0 0.232 18 0.873Geo. disasters 0 0 0.106 8 0.424Natural disasters 0 0 0.790 22 1.680Survival AnalysisRebellion termination 0 0 0.268 1 0.443Rebellion duration 1 3 5.829 28 5.965Maize (KgPC)1 0 2.180 2.088 5.156 1.553Population1 4.701 9.414 9.386 13.638 1.494Military personnel1 0 11.002 10.577 14.914 2.581GDP PC 1 5.731 7.745 7.785 12.974 1.028Democracy 0 0 0.217 1 0.413Military expenditure1 0 18.980 18.549 24.591 3.836
1 Natural log
Because my first dependent variable is binary, I rely on logistic regression (i.e.
logit) models for statistically assessing my first hypothesis. To control for time
dependencies unaccounted for by the independent variables, all models include
yearly dummies (i.e., year fixed effects). Because the data for some variables are
duplicated over time, standard errors for all models are clustered by country. Fixed
effects by country were not used for both theoretical—rebel groups frequently move
between different countries (e.g., the Lord Resistance Army operating in Uganda,
172

Sudan, South Sudan, and the DRC)—and practical—the coefficients on all inde-
pendent variables in the fixed effects models where highly significant, suggesting
estimation bias—reasons. Nevertheless, I do account for country-specific factors in
several models that include random effects by country in Table 4.7 below. While
endogeneity is less likely to affect the data because the FAO measures variations in
maize production annually even in rebellion-afflicted countries (FAO, 2016), I take
additional measures to account for this issue. To this end, I identify and estimate
models that rely on the annual number of different types of natural disasters to
instrument the effect of food production on rebellion in Table 4.8 below.
To evaluate my second hypothesis, I rely on the Cox proportional hazard model
(Box-Steffensmeier and Jones, 2004). This model has the advantage of not impos-
ing a functional form on the hazard parameter. A positive coefficient sign in this
model means that the effect of this variable on the hazard of termination makes
rebellion termination more likely. Note that the country year framework is likely
to involve tied events—i.e., terminations occurring in the same value of t—while
the Cox model assumes a continuous time-line. Although this problem is likely to
bias coefficient estimates toward zero (i.e., toward insignificance) rather than the
other way around, the Breslow method was used to handle ties.18
Results
The first three models in Table 4.5 report the results of three specifications used to
evaluated the probability of the first phenomenon of interest, rebellion occurrence.
The Baseline specifications include only the annual maize availability per capita
indicator alongside year fixed effects. These Baseline specifications are followed
18Results remain robust when the Efron and exact methods are used for handling tied events.
173

by comparable models that include key controls for food consumption, Population
and Military personnel, to arrive at a set of Full specifications that includes all the
control variables discussed above. Across all models, Maize (KgPC) has a statis-
tically significant and positive effect on rebellion occurrence during the 1961-1988
period, which lends strong support to hypothesis H1. Additionally, GDP PC is
negative and significant and Military personnel is positive and significant, which
follows theoretical expectations (e.g., Fearon and Laitin, 2003), while Military ex-
penditure and, unexpectedly, Democracy are positive and significant (to at least
the p < 0.1 level).19 Substantively, as Figure 4.6 shows, a change across the entire
range of Maize (KgPC) translates to a first difference change in the probability of
rebellion of approximately 15% (in the Baseline model) to 5% (in the Full model),
when all other variables are held at their median (for ordinal variables), or mean
(for continuous variables) based on 1,000 simulations. These findings thus suggest
that, as illustrated by the analysis of the Mau Mau campaign, rebellion patterns
closely follow food abundance, even as one moves to the macrolevel.
For the second stage of analysis, which examines the impact of maize on rebel-
lion duration, the next three models in Table 4.5 report a set of Cox proportional
hazard models estimated only on countries and years that experienced ongoing
rebellions. Again, the Baseline specification include only Maize (KgPC) and fixed
effects by year, and additional controls are then added to arrive at the Full spec-
ification. All results support the hypothesized effect of staple crop availability on
rebellion duration. Across all models, higher levels of Maize (KgPC) significantly
19The positive coefficient on Democracy is likely the result of “the lengthy (if generally low-intensity) conflicts in the United Kingdom, India, and Israel [that] demonstrate the general re-luctance among democratic regimes to apply massive military force to quell peripheral separatistinsurgencies” (Buhaug, Gates and Lujala, 2009, 563).
174

decrease the hazard of rebellion termination, i.e., making peace less likely. This
lends additional supports to the argument developed above—which emphasize the
relationship between (highly nutritional, durable, and easily transferable) food re-
sources and the length of rebellions—and confirms Hypothesis H2. Moreover, the
effect of food availability per capita is substantial. As the Kaplan-Meier plots pre-
sented in Figure 4.7 illustrate, a change in each maize indicator from its 25th to
its 75th percentile (when all other variables are held at their means) decreases re-
bellion termination rates by ∼ 12% in the 1961-1988 sample. In comparison, GDP
per capita, a widely used indicator of conflict, has almost no observable effect on
rebellion termination rates. These findings again suggest that higher availability of
food resources prolongs rebellions by increasing rebel groups’ fighting effectiveness
and by motivating rebel troops.
Despite the conscious effort done here to ensure empirical comparability be-
tween the micro- and macrolevel analyses and across cases in terms of both the
temporal context and the explanatory variable of interest, I illustrates the the-
ory’s robustness and highlight its generalizablity to other contexts and crops using
a large number of sensitivity analyses. These models, reported in the next sec-
tion, account for numerous alternative confounders, modeling choices, and country-
specific factors. Additional sensitivity models illustrate that the theory’s viability
in respect to contemporary rebellions (1961-2011) and cereals other then maize
cannot be immediately rejected. Crucially, the effect of food availability remains
statistically significant across all these different robustness analyses.
175

Table 4.5: Determinants of Rebellions, 1961-1988
Probability DurationBaseline Medium Full Baseline Medium Full
Maize (KgPC)1 0.233∗∗∗ 0.196∗∗∗ 0.116∗∗∗ −0.171∗∗∗ −0.122∗∗∗ −0.116∗∗∗
(0.030) (0.033) (0.036) (0.046) (0.045) (0.047)
Population1 – 0.290∗∗∗ 0.020 – −0.230∗∗∗ −0.162∗∗
(0.051) (0.066) (0.066) (0.078)
Military personnel1 – 0.074∗∗ 0.120∗∗ – −0.137∗∗∗ −0.106∗∗∗
(0.037) (0.061) (0.027) (0.035)
GDP PC 1 – – −0.721∗∗∗ – – 0.023(0.083) (0.067)
Democracy – – 0.604∗∗∗ – – 0.042(0.150) (0.182)
Military expenditure1 – – 0.182∗∗∗ – – −0.048∗∗∗
(0.058) (0.021)
Constant −3.706∗∗∗ −6.908∗∗∗ −2.349∗∗∗ – – –(0.340) (0.445) (0.675)
Observations 3,931 3,908 3,639 801 796 750Log Likelihood −1,551.789 −1,459.163 −1,346.053 −1,381.388 −1,301.603 −1,199.558Akaike Inf. Crit. 3,163.578 2,982.326 2,762.105 2,764.777 2,609.206 2,411.117
* indicates p < 0.1; ** indicates p < 0.05; *** indicates p < 0.01.Variable coefficients are reported with standard errors clustered by country in parentheses.
Fixed effects by year included, although not reported here1 Natural log
176

Figure 4.6: Percentage Change in the Annual Expected Probability of Rebellion –Maize (Kg per capita)
0 1 2 3 4 5
0.1
0.2
0.3
0.4
Range of maize per capita (in natural log)
Pre
dict
ed p
roba
bilit
y of
reb
ellio
n
median
ci95
ci80
ci99.9
Baseline Model
0 1 2 3 4 50.
050.
100.
150.
200.
250.
300.
350.
40
Range of maize per capita (in natural log)
Pre
dict
ed p
roba
bilit
y of
reb
ellio
n
median
ci95
ci80
ci99.9
Medium Model
0 1 2 3 4 5
0.05
0.10
0.15
0.20
0.25
0.30
Range of maize per capita (in natural log)
Pre
dict
ed p
roba
bilit
y of
reb
ellio
n
median
ci95
ci80
ci99.9
Full Model
177

Figure 4.7: Kaplan-Meier Curves of Cox PH Models – Full Model
0 5 10 15 20 25
0.6
0.7
0.8
0.9
1.0
Years
Pro
port
ion
not t
erm
inat
ed
75th percentile25th percentile
Maize (Kg per capita)
0 5 10 15 20 25
0.6
0.7
0.8
0.9
1.0
Years
Pro
port
ion
not t
erm
inat
ed
75th percentile25th percentile
GDP per capita
Sensitivity Analyses
To evaluate the sensitivity of my findings, Tables 4.6 and 4.7 reports 12 robust-
ness models that account for alternative confounders, specifications, and modeling
choices. Each model relates to the Full logit specifications reported above. I
begin by controlling for important alternative explanations, such as the one-year-
lag of the dependent variable, and oil and gas production—obtained from Ross
(2004b)—to account for the persistence of conflict and the role of other profitable
natural resources in Model 1 in Table 4.6. Model 2 then additionally incorporates
controls for ethnic and religious fractionalization and the percent of mountainous
areas in a given country (obtained from Fearon and Laitin, 2003); iron and steel
production to account for industrial capacity (obtained from Singer, Bremer and
Stucky, 1972); and large-scale climatic disasters such as droughts and wildfires
178

(obtaine from Guha-Sapir, Below and Hoyois, 2015), which can impact both food
production and conflict (Miguel, Satyanath and Sergenti, 2004; Burke et al., 2009).
Next, recall that the theory developed in Chapter 1 and the microlevel evidence
presented above associate rebellion incidence and duration with the efficiency that
rebels can extract from available food resources, i.e., crops that provide that highest
level of “fuel” to the warring troops. Therefore, to account for the role not only of
maize, but of all other cereals in increasing the probability of rebellion, Model 3
replaces my maize-based indicator with a more comprehensive variable measuring
the daily caloric intake from cereal-based fats for all cereal crops, including maize,
rice, wheat, and others. This model thus captures the specific effect of grains in
countries where the population is more dependent on cereals for its daily energy
consumption, and hence in which—as the theoretical argument developed above
suggests—the marginal gains for the rebels from securing access to food are the
greatest. Model 4 re-estimates the Full logit specification over the entire temporal
period for which data on all variables were available (1961-2011) to illustrate that
the main analysis’ findings are not unique to the 1961-1988 period. Because the
effect of food resources might be important only in large countries—where the
necessity to live off the land is greater—Model 5 replicated the Full specification
with the addition of a variable measuring each country’s land area (in square
kilometers). Model 6 then replicates the Full specification while accounting for
historical political violence events, such as coups d’etat (obtained from Powell and
Thyne, 2011), nonviolent civil disobedience (obtained from Chenoweth and Lewis,
2013), and state-led mass killing (obtained from Ulfelder and Valentino, 2008).
Moving to Table 4.7, because the significant coefficient on my maize availability
indicator might be the result of the relatively low casualty threshold chosen to
179

empirically define rebellions (25 or more combatant casualties), Model 7 replicates
the Full specification, where the dependent variable is now operationalized as the
annual incidence of a campaign involving 1,000 or more casualties (coded zero
otherwise). Another alternative conceptualization of the dependent variable, where
only rebellions fought specifically over the state’s government and its institutions
is used in Model 8. This model thus accounts for the possibility that rebel groups
fighting such rebellions might be less dependent on locally sourced food, compared
with rebels that fight to secure or secede a given territory. Next, recall that, as
was mentioned above, fixed effects by country were not used, for both theoretical
and practical reasons. Nevertheless, to account for country-specific random effects
not captured by any of the variables in my model, which might influence rebellion
propensity, Model 9 then re-estimates the Full model with the addition of random
effects at the country level.
Next, to verify that the results are not driven by the reliance on logit regressions,
Models 10 and 11 estimate a probit regression corresponding to the Full specifica-
tion, in both regular (Model 10) and random effects (Model 11) frameworks. Last,
considering that my sample contains relatively few observed instances of rebellion
(∼ 15.2% of the country-years in my 1961-1988 sample), Model 12 replicate the
Full specification using a rare effects logit, which is more suited to handle such
situations (King and Zeng, 2001). Crucially, the effect of food production per
capita on rebellion remains significant (to at least a p < 0.1 level) across all these
alternative models, suggesting that the empirical conclusions derived in this article
cannot be immediately rejected.
180

Table 4.6: Determinants of Rebellions – Sensitivity Analyses
(1) (2) (3) (4) (5) (6)Ctrls. Ext. ctrls. Cereal nutrition 1961–2011 Area Violence
Maize (KgPC)1 0.107∗ 0.111∗ – 0.047∗ 0.102∗∗∗ 0.073∗
(0.063) (0.066) (0.025) (0.036) (0.038)
Nutritious cereals – – 0.065∗∗∗ – – –(0.015)
Population1 0.054 −0.009 0.041 0.099∗∗ −0.067 0.025(0.123) (0.140) (0.064) (0.047) (0.071) (0.071)
Military personnel1 0.024 0.070 0.123∗∗ 0.277∗∗∗ 0.164∗∗ −0.027(0.103) (0.124) (0.060) (0.048) (0.064) (0.062)
GDP PC1 −0.412∗∗∗ −0.299∗ −0.688∗∗∗ −0.644∗∗∗ −0.677∗∗∗ −0.436∗∗∗
(0.145) (0.156) (0.082) (0.055) (0.083) (0.092)
Democracy 0.315 0.486∗ 0.658∗∗∗ −0.045 0.617∗∗∗ 0.940∗∗∗
(0.255) (0.264) (0.151) (0.098) (0.151) (0.164)
Military expenditure1 0.214∗∗ 0.345∗∗∗ 0.160∗∗∗ 0.087∗∗ 0.165∗∗∗ 0.224∗∗∗
(0.091) (0.117) (0.055) (0.042) (0.058) (0.064)
Rebelliont−1 5.212∗∗∗ 5.086∗∗∗ – – – –(0.190) (0.192)
Oil prod.1 0.027 0.024 – – – –(0.018) (0.018)
Gas prod.1 −0.201∗∗∗ −0.212∗∗∗ – – – –(0.076) (0.077)
Eth. frac. – 1.048∗∗∗ – – – –(0.390)
Rel. frac. – −0.881∗ – – – –(0.465)
% Mountains – 0.005 – – – –(0.005)
Iron & steel1 – −0.053∗∗ – – – –(0.023)
Clim. disasters – 0.363∗ – – – –(0.214)
Country area1 – – – – 0.105∗∗∗ –(0.038)
Coupt−1 – – – – – 0.637∗∗∗
(0.199)
Civil dis.t−1 – – – – – −0.008(0.344)
Mass killingt−1 – – – – – 2.054∗∗∗
(0.122)
Constant −5.240∗∗∗ −8.084∗∗∗ −2.510∗∗∗ −3.179∗∗∗ −3.320∗∗∗ −4.652∗∗∗
(1.404) (1.787) (0.673) (0.495) (0.727) (0.760)
Observations 3,473 3,390 3,639 7,056 3,442 3,605Log Likelihood −537.956 −527.136 −1,341.853 −2,649.100 −1,310.854 −1,179.513Akaike Inf. Crit. 1,151.912 1,140.272 2,753.706 5,414.200 2,693.707 2,435.025
* indicates p < 0.1; ** indicates p < 0.05; *** indicates p < 0.01
Variable coefficients are reported with standard errors clustered by country in parentheses
Fixed effects by year included, although not reported here
1 Natural log
181

Table 4.7: Determinants of Rebellions – Sensitivity Analyses (Continued)
(7) (8) (9) (10) (11) (12)Intense Over govt. RE Probit RE probit Rare events
Maize (KgPC)1 0.121∗∗ 0.137∗∗∗ 0.309∗ 0.072∗∗∗ 0.176∗ 0.114∗∗∗
(0.056) (0.047) (0.165) (0.020) (0.093) (0.036)
Population1 −0.457∗∗∗ −0.288∗∗∗ 0.034 0.025 0.043 0.023(0.101) (0.089) (0.276) (0.037) (0.155) (0.066)
Military personnel1 0.279∗∗∗ 0.184∗∗ −0.0002 0.068∗∗ −0.006 0.116∗
(0.107) (0.084) (0.115) (0.032) (0.064) (0.061)
GDP PC1 −1.397∗∗∗ −0.940∗∗∗ −0.977∗∗∗ −0.380∗∗∗ −0.533∗∗∗ -0.708∗∗∗
(0.137) (0.108) (0.256) (0.046) (0.139) (0.0823)
Democracy 0.114 0.369∗ 0.458 0.299∗∗∗ 0.160 0.594∗∗∗
(0.302) (0.218) (0.301) (0.082) (0.164) (0.150)
Military expenditure1 0.335∗∗∗ 0.138∗ 0.605∗∗∗ 0.095∗∗∗ 0.318∗∗∗ 0.179∗∗∗
(0.100) (0.072) (0.098) (0.031) (0.053) (0.058)
Constant 1.461 2.809∗∗∗ −10.840∗∗∗ −1.547∗∗∗ −6.093∗∗∗ -2.302∗∗∗
(1.075) (0.927) (2.930) (0.371) (1.659) (0.675)
Observations 3,639 3,639 3,639 3,639 3,639 3,639Log Likelihood −596.400 −852.153 −778.437 −1,344.084 −784.926 −1346.050Akaike Inf. Crit. 1,262.800 1,774.305 1,576.875 2,758.168 1,589.852 2,762.100
* indicates p < 0.1; ** indicates p < 0.05; *** indicates p < 0.01
Variable coefficients are reported with standard errors clustered by country in parentheses
Fixed effects by year included, although not reported here1 Natural log
Instrumental Variable Regression
As was mentioned above, in this section I take additional measures to account
for the potentially simultaneous relationship between food production and rebel-
lions. Specifically, I re-estimate the Full specification using a two-step probit model
(Rivers and Vuong, 1988). This two-step approach illustrates the probability of
the dependent variable being one given the values of the regressors in the ab-
sence of endogeneity, which makes it possible to trace the effects of changes in the
(potentially endogenous) food production variable on the probability of rebellion.
Each of these analyses relies on a different, theoretically-motivated instrument,
such that the Full specification analysis is repeated six times, once for each in-
strument category. These models reasonably isolate the direct effect flowing from
182

food production to rebellions rather than the other way around, and show that the
main analysis’ findings are unlikely the result of simultaneous relationships between
the two variables, thus providing additional confirmation to the linkages between
higher food availability and rebellion incidence and duration at the country level.
To this end, this section first describes my identification strategy and method-
ology, then reports the results of six two-step probit models replicating the Full
specification from the main dissertation, once for each instrument. This approach
builds on the work of Rivers and Vuong (1988)20 to illustrate the probability of
the dependent variable being one given the values of the regressors, in the ab-
sence of endogeneity, which means that it makes it possible to trace the effects of
changes in the (potentially endogenous) food production variable on the proba-
bility of rebellion. These models reasonably isolate the direct effect flowing from
food production to rebellions rather than the other way around, and to show that
the findings are unlikely the result of simultaneous relationships between the two,
thus providing additional confirmation to the linkages between food abundance
and rebellion developed in this chapter.
Identification and Methodology
The impact of maize resources on rebellion and its duration is evaluated in two
stages. First, note that just as maize production might influence rebellion occur-
rence, it is possible the latter might impact maize production by destroying infras-
tructure, disrupting migratory labor and remittance patterns, and even causing
famines (Messer, 2009). To verify the robustness of my findings to these concerns,
the identification strategy used in this section to evaluate the impact of maize
20See also, Blundell and Powell (2004).
183

production on Rebellion relies on the use of an instrumental variable (IV), i.e.,
a variable that is correlated with food prices but arguably uncorrelated with the
error term of Rebellion. Recall that such an IV must satisfy two requirements.
First, it must be correlated with food production at the country level. This is
easily ascertained with statistical tests—in effect, tests of the null hypothesis that
the instrument is weak—the results of which are shown in Table 4.8 below. Sec-
ond, it must only affect rebellions through food production, a requirement that is
also known as meeting the exclusion restriction (Angrist and Pischke, 2009, 87-
89). Because empirically testing this latter assumption is challenging, especially in
non-linear IV models such as the two-step probit, it is worth discussing its validity
in this context in more detail.
The variable used to identify the causal relationship between maize produc-
tion and rebellions is the number of natural disasters—all droughts, earthquakes,
epidemics, episodes of extreme temperature, floods, insect infestations, mass move-
ments (both dry and wet), storms, volcanic eruptions, and wildfires—in a given
year, coded by the Center for Research on the Epidemiology of Disasters (CRED)
(Guha-Sapir, Below and Hoyois, 2015). This approach builds on previous research
that uses the same disaster to instrument the effect of food prices on urban un-
rest (Bellemare, 2015) or civil war (Miguel, Satyanath and Sergenti, 2004). That
such natural disasters constitute shock to the supply and demand of food should
be relatively uncontroversial, and have hence been used in previous research (e.g.,
Bellemare, 2015). These natural shocks can also all depress economic growth,
which leads to reduced incomes and thus to a decreased demand for food. Nev-
ertheless, to illustrate that the findings are not driven by one particular disaster
type, and because some disasters—such as climatic events—might affect violence
184

via pathways other than impacting food compared with others—e.g., biological
events—where the exclusion restrictions is much more likely to hold, I conduct
a set of analyses that rely on each disaster type separately to instrument food
production.
To identify the relationship between natural disasters, food production, and
rebellions, I rely on the two-step approach developed by Rivers and Vuong (1988).
Whereas linear approaches are disadvantaged in that they may imply probabilities
outside the unit interval, generalized linear models, like probit or logit, are used to
model binary dependent variables in applied research, which allowed Rivers and
Vuong (1988) to extend the probit model to account for endogeneity.21 Thus,
in the first stage, the researcher regresses the instrument and controls on the
endogenous regressor. The resulting residuals (standardized by their standard
deviation, a necessary step in the two-step probit approach) are then included
as an additional regressor instead of the endogenous variable in the second step
when the probit model of interest is estimated. Building on this approach the
identifying assumption is thus that natural disasters, both aggregated and by type,
are uncorrelated with ε1it in equation
Pr(yit = 1) = Φ(α1 + β1f fit + β1XXit + φ1ttt + ε1it) (4.1)
where Φ is the probit function, and fit are the predicted values of fit, i.e., maize
availability per capita, obtained from the first-stage regression of maize production
on climatic disasters and all the control variables X in equation 4.1, such that
21The results remain robust when regular 2SLS models are used.
185

fit = α2 + β2ccit + β2XXit + φ2ttt + ν2it (4.2)
where cit is the annual (t) number of natural disasters in country i; ν2it is an
error term with mean zero; Xit is a matrix of the annual impact of all controls in a
given country i; and tt are the fixed effects by year. If the instrument is valid and
effectively “exogenizes” maize production relative to rebellions, the coefficient β1f
is the local average treatment effects (LATE) of maize production on rebellion, i.e.,
the increase in the extent of global rebellions (as measured by the dependent vari-
able) due to maize production in those years and countries where natural disasters
induce a change in maize production (Angrist and Pischke, 2009, 110-111).
How are natural disasters a good IV for food availability per capita in the
context of Equations 4.1 and 4.2? Within a given year, natural disasters constitute
unpredictable shocks to both the supply of and demand for food.22 Although the
use of rainfall as an IV has recently been questioned due to the predictable nature
of rainfall (see discussion in Sovey and Green, 2011; Sarsons, 2015), the natural
disasters used in this IV analysis are unpredictable. Indeed, although some of
the natural disasters are certainly more likely in certain seasons (e.g., floods in
winter, droughts in summer), the presence of yearly and dummies in Equations 4.1
and 4.2 eliminates the impact of annual natural trends by controlling for annual
predictability. In other words, while it is true that floods are likely on an annual
22Although natural disasters are usually conceived of as shocks to the supply of food (Belle-mare, 2015; Miguel, Satyanath and Sergenti, 2004), the fact that natural disasters can kill ordisplace large numbers of people makes them equally, if not more likely to also affect the demandfor food. Because there are many more consumers of food than producers, exposure to naturaldisasters should affect consumers of food disproportionately more than they affect producers.
186

basis, and thus a priori (somewhat) predictable in a given year, the impact of
variations away from this trend should be unpredictable once the time trend is
controlled for. Similarly, the inclusion of year fixed effects should control for linear
increases in the number of rebellions, maize production, and the number of natural
disasters due to the passage of time.
Natural disasters could also lead to job losses via destroyed capital, which would
make it easier to recruit disaffected and disenfranchised populations as combatants
in rebellions. Once again, this possibility is unlikely to compromises the empirical
results. Indeed, for this to happen, a natural disaster must directly lead to a
full-scale rebellion within the same country in which it takes place (e.g., an earth
quake leads to years of bloody civil war throughout the entire world region), which
would in turn require that devastation levels are so high that they overcome the
effect of food production across this and other countries. This is not impossible,
but it is highly unlikely given the scope of the data; the fact that as the data show
variations in maize yields, even in bad years, tend to be relatively low; and the
inclusion of a large number of countries, only in few of which maize is so susceptible
to natural disasters as to be almost completely eliminated by the impact of a
natural disaster during a given year. Moreover, recent research illustrates that,
while they can serve as a trigger, natural disasters such as droughts are highly
unlikely to directly generate such high levels of violence and do little to induce
massive migrations as previously hypothesized (e.g., Selby et al., 2017), especially
because the relationship between climate and conflict “appear to be scale- and
context-dependent” (Hendrix, 2017). Finally, Equations 4.1 and 4.2 include income
as a control variable, which additionally accounts for the impact of the level of
purchasing power in respect to food on rebellion.
187

Two-Step Probit Analysis Results
Table 4.8 presents the second-stage probit estimates corresponding to the Full logit
model specification from table 4.5. The first model uses the total amount of all
natural disasters occurring within a given country during a given year, with each
subsequent model using only one type of natural disasters according to their clas-
sification in the EM-Dat International Disaster Dataset (Guha-Sapir, Below and
Hoyois, 2015). Thus, hydrological disasters include all events classified as floods,
landslides, and wave actions. Biological disasters include all epidemics, insect infes-
tations (e.g., locust), and other animal accidents. Meteorological disasters include
extreme temperatures, fog, and storms. Climatological disasters are defined, as
mentioned above, as all droughts, wildfires, and glacial lake outbursts. Finally,
geophysical disasters include earthquakes, other mass movements, and volcanic
activity.
As Table 4.8 illustrates, when “exogenized” in respect to rebellion, the coeffi-
cient of the instrumented maize availability per capita indicator Maize (KgPC)
still produces a (highly) statistically significant effect on rebellion. This provides
strong confirmation to the findings presented in Table 4.5 by showing that when the
causal arrow flows from food toward rebellion rather than the other way around,
the main analysis results remain significant and observable. It is important to
stress that while Stock and Yogo (2002) recommend an F -statistic threshold of 10
or more for a variable to be considered not weak, no one (to the author’s knowledge)
have so far attempted to extend the same analysis to two-stage probit analysis.
Nevertheless, Table 4.8 clearly shows that in at least one case (geophysical dis-
asters), the weak instrument F -statistic exceed the threshold of 10 recommended
188

by Stock and Yogo (2002). Thus, the statistical findings presented below and the
theoretical justification for the particular instruments used for analysis show that
the relationship between food abundance and rebellion is not the result of the si-
multaneous relationship between the two phenomena. Rather, higher levels of food
availability per capita impact the probability of rebellion occurrence, which is in
line with both the theoretical argument of the main dissertation, and the micro-
and macrolevel empirical analyses results reported therein.
189

Tab
le4.
8:D
eter
min
ants
ofR
ebel
lion
s,IV
Pro
bit
Res
ult
s–
Sec
ond
Sta
ge
All
Hyd
rolo
gic
al
Bio
logic
al
Mete
orolo
gic
al
Cli
mato
logic
al
Geop
hysi
cal
Maize
(KgPC
)10.0
94∗∗∗
0.0
95∗∗∗
0.0
99∗∗∗
0.0
97∗∗∗
0.0
99∗∗∗
0.0
93∗∗∗
(0.0
27)
(0.0
27)
(0.0
27)
(0.0
27)
(0.0
27)
(0.0
27)
Po
pu
lati
on
10.0
50
0.0
50
0.0
49
0.0
50
0.0
49
0.0
50
(0.0
36)
(0.0
36)
(0.0
36)
(0.0
36)
(0.0
36)
(0.0
36)
Mil
ita
rype
rso
nn
el1
0.0
61∗
0.0
61∗
0.0
61∗
0.0
61∗
0.0
61∗
0.0
61∗
(0.0
32)
(0.0
32)
(0.0
32)
(0.0
32)
(0.0
32)
(0.0
32)
GD
PP
C1
−0.4
03∗∗∗
−0.4
03∗∗∗
−0.4
04∗∗∗
−0.4
04∗∗∗
−0.4
04∗∗∗
−0.4
03∗∗∗
(0.0
46)
(0.0
46)
(0.0
46)
(0.0
46)
(0.0
46)
(0.0
46)
Dem
ocra
cy0.2
76∗∗∗
0.2
76∗∗∗
0.2
75∗∗∗
0.2
75∗∗∗
0.2
75∗∗∗
0.2
75∗∗∗
(0.0
81)
(0.0
81)
(0.0
81)
(0.0
81)
(0.0
81)
(0.0
81)
Mil
ita
ryex
pen
dit
ure
10.0
90∗∗∗
0.0
90∗∗∗
0.0
91∗∗∗
0.0
90∗∗∗
0.0
91∗∗∗
0.0
90∗∗∗
(0.0
31)
(0.0
31)
(0.0
31)
(0.0
31)
(0.0
31)
(0.0
31)
Co
nst
an
t−
1.2
27∗∗∗
−1.2
27∗∗∗
−1.2
27∗∗∗
−1.2
27∗∗∗
−1.2
26∗∗∗
−1.2
29∗∗∗
(0.3
59)
(0.3
59)
(0.3
59)
(0.3
59)
(0.3
59)
(0.3
59)
Ob
serv
ati
on
s3,6
39
3,6
39
3,6
39
3,6
39
3,6
39
3,6
39
Log
Lik
elih
ood
−1,3
44.6
02
−1,3
44.4
34
−1,3
43.9
07
−1,3
44.1
43
−1,3
43.9
60
−1,3
44.7
31
Akaik
eIn
f.C
rit.
2,7
59.2
03
2,7
58.8
67
2,7
57.8
13
2,7
58.2
85
2,7
57.9
20
2,7
59.4
62
Wea
k-i
nst
rum
ent
3.6
58
3.0
57
1.3
32
0.8
24
0.2
28
11.9
10
*in
dic
ates
p<
0.1
;**
ind
icat
esp<
0.05
;**
*in
dic
ate
sp<
0.01
Var
iab
leco
effici
ents
are
rep
orte
dw
ith
stan
dard
erro
rscl
ust
ered
by
cou
ntr
yin
pare
nth
eses
Fix
edeff
ects
by
yea
rin
clu
ded
,al
thou
ghn
otre
port
edh
ere
1N
atu
ral
log
190

Selection Issues
It is important to recognize that a selection problem might arise if access to food
resources influences a group’s decision whether or not to embark upon a rebellion.
However, I believe that this issue does not adversely affect the theoretical, and
consequentially empirical approach advocated here. First, the claim that countries
where more food per capita is available are more likely to experience rebellions
because rebel groups “choose” to be formed there is in-line with the argument
that the probability of rebellion varies according to food availability, because it
suggests that food in not a constant factor across countries. Rebel groups operating
in countries with more food “select” to be formed in these states because they know
that higher local food availability means they can access it more easily, which gives
them an advantage in the probability of fighting longer and eventually winning.
Second, the argument presented in the dissertation asserts that it is the con-
tinuous access to resources that influences the fighting capability of groups, such
that rebel organizations with more access to food resources can, on average, fight
harder and longer. This in contrast to the binary perspective on these issues, ac-
cording to which having any access to food influences fighting capacity, regardless
of how much food is available.
Third, considering that rebellions are dynamic processes, groups can “update”
their level of food access throughout the campaign, which means that even in
countries where groups selected to form and start a campaign, if annual food
availability levels drop during a given year, or if the group loses access to areas
with nutritious food resources during the fighting, then its size and fighting ability
will correspondingly decline. This is because food support varies not only across
191

countries, but also over time.
Finally, the focus on ongoing rebellions as part of my empirical strategy helps
to verify that this selection problem does not effect the main empirical findings,
as groups already engaged in rebellions have managed to secure at least some
adequate access to food. Thus, even if selection problems are responsible for the
results observed in the rebellion probability stages (i.e., logit models), it cannot
explain the findings observed in the duration stage.
Conclusion
In this chapter, I provided an empirical verification of the final part of the theoret-
ical framework developed in Chapter 1 to show that—more than being a generator
of conflict locally—food resources shape the occurrence and outcome of large scale
rebellions. The Mau Mau rebellion remains the canonical example of a large-
scale conflict in a developing country where food resources were crucial in shaping
conflict patterns and their outcome. This was recognized by the British colonial
occupiers, who sought to defeat the Mau Mau by draining their food support. Hav-
ing provided archival qualitative evidence to show the importance British officials
attribute to controlling food resources and reducing their accessibility, I proceeded
to analyze to microlevel datasets compiled using these archival evidence. I found
that, as expected according to the qualitative archival evidence, Mau Mau rebels
moved into districts where more food is grown to obtain food resources for self
sustenance. I then tested the applicability of this microlevel evidence to a other
rebellions occurring globally, to show using different methodological approaches
that food resources have also had a strong effect on rebellion occurrence and du-
192

ration globally during the Cold War period.
The findings presented in this chapter strongly suggest that scholars should bet-
ter account for the role of food resources in contemporary analyses of conflict. From
a theoretical perspective, conflict and rebellions in developing countries are likely
to involve strong food security-related incentives, as both rebels and—frequently—
state forces are forced to rely on locally sourced food (Koren and Bagozzi, 2016).
In such low development contexts, the marginal returns from more food available
per capita are sizable. Moreover, unlike other profitable natural resources, food
is absolutely necessary for rebellions to succeed. These incentives are thus likely
to shape the behavior of armed troops even more than elements such as state ca-
pacity economic development, and should thus be better incorporated into extent
frameworks of conflict analysis.
From an empirical perspective, the effect of food resources on rebellion is shown
not only to be statistically significant, but also sizable, and substantively compa-
rable to that of other benchmark indicators of conflict such as GDP per capita
(Fearon and Laitin, 2003; Ward, Greenhill and Bakke, 2010). As such, scholars
of conflict and political violence more broadly should include food resources-based
indicators in models analyzing conflict occurrence and duration as to verify the
robustness of their findings to these issues. The strong role of food resources is
not related to economic development, although, as mentioned above, these factors
likely play a much greater role in lower development contexts, state capacity, or
political openness. Their viability as an alternative mechanism generating conflict
should thus be taken into consideration.
193

Conclusion: Food Insecurity and
Violence in the Developing World
Summary of Findings
Research on civil war treats food support as constant. The argument developed
in this dissertation asserts that, as a crucial input for conflict, food security has
a varying and substantial impact on its onset, conduct, and outcome. This dis-
sertation laid out a multi-level theory to explain the role of regular access to
locally-sourced nutritious food during conflict, emphasizing not only the physical
importance of regular support, but also its psychological and sociological impact
on troops’ morale. Groups that have access to more nutritious food resources
can improve their performance, increase internal cohesion, and fight harder and
longer. These groups can also operate in larger contingents and embark on more
complex operations, rather than being constrained to fighting only small, limited
skirmishes. Access to more (nutritious) food resources also provides group leaders
with the ability to credibly commit to their troops and illustrate that the group is
resilient and durable. This gives group members, in turn, the motivation to fight
and follow their leaders, and binds troops together to work toward a common goal.
Throughout the dissertation, I developed this argument in several stages. In
194

Chapter 1, I presented the broad framework connecting food abundance to more
violence. I explained that exactly because it is important, current research on civil
war, and political violence more broadly, tends to treat food support as constant. I
defined the term “food security” as used throughout this dissertation and showed
that food is a unique natural resources due to three particular characteristics.
First, securing food resources is compulsory, meaning that groups cannot operate
without food. Second, securing food resources is agnostic, because regardless of
the motivations that lead a person to join an armed group, being fed regularly
is a necessity that trumps all other impetuses for fighting. Finally, because it is
compulsory and agnostic, having ample access to food resources also has binding
features; nutritious, regular access to food brings troops closer together and pro-
vides leaders with credible commitment to illustrate they can fight longer conflicts.
I have also shown that the focus on the role of food security complements a
large number of bodies-of-research on conflict and political violence more broadly.
Indeed, understanding how food security affects dynamics of violence can inform
current approaches that argue climate change has a strong impact on the civil
war in developing countries (e.g., Burke et al., 2009; Miguel, Satyanath and Ser-
genti, 2004; Hsiang, Burke and Miguel, 2013). It also informs our understanding
of how natural resources condition the probability and duration of conflict (e.g.,
Weinstein, 2005; Collier and Hoeffler, 1998), by showing that more than lucrative
natural resources, the imperative to secure food is fundamental. It also provides
a different perspective on how state capacity conditions the geospatial distribu-
tion of conflict (e.g., Fearon and Laitin, 2003; Koren and Sarbahi, Forthcoming;
Buhaug, Gates and Lujala, 2009), by showing that the effect of food on global
rebellions is at least comparable to that of other, heavily studied factors. Finally,
195

I illustrated that incorporating the role of food more throughly into research on
civilian victimization, specifically, can help explain where and when such tragic
incidents are more or less likely to occur, which is in-line with a rapidly expanding
body of research (e.g., Anderson, Johnson and Koyama, 2017; Koren and Bagozzi,
2017; Bagozzi, Koren and Mukherjee, 2017).
Considering that food impacts conflict through different mechanisms, the en-
suing chapters developed some crucial pathways. In Chapter 2 I focused on one
such pathway, arguably the most fundamental one, which I termed possessive con-
flict over food security. I discussed four armed group categories, each with its
own specific motivations to initiate conflict over food resources in order to secure
food for their own consumption. Briefly, official state forces and militias without
regular support from the state would move into food abundant areas in order to
secure food resources to support their operation in the region. Rebel groups might
do the same, but they also frequently do so that they can trade these resources
on the open market to generate revenues. Agriculturalist militias fight to defend
their own property and to take control over food abundant areas to prepare for
periods of scarcity. Pasturalist militias fight to obtain resources they cannot grow
themselves due to their mobile lifestyle.
Considering that food resources might not only impact the frequency of conflict,
but also be affected by it, the local staple crop yield indicators used to validate
this argument were instrumented using drought intensity levels, which—as recent
studies posited—can influence conflict through food production. The causal rela-
tionship between local food production and violent conflict is thus identified using
this climatic variable (Miguel, Satyanath and Sergenti, 2004). It is important to
stress that previous research has suggested that rainfall variations might be not be
196

an ideal instrument of income shocks (Sarsons, 2015). Although the argument de-
veloped in Chapter 2 does not necessarily equate local yields with income, I never-
theless addressed this concern both theoretically—by discussing some distinctions
of African agriculture systems—and empirically, by showing that my drought-based
instrumental variable is at least “plausibly exogenous” (Conley, Hansen and Rossi,
2012).
The findings of the analyses conducted in Chapter 2 suggest that agricultural
regions experience relatively high levels of violent conflict that are, to a large ex-
tent, driven by the type and amount of food resources produced there. These
findings diverge from the current conceptualizations of this relationship in main-
stream literature, which frequently attribute conflict to sudden food shortages (e.g.,
Burke et al., 2009; Maystadt and Ecker, 2014). Thus, Chapter 2 lends support to
the theoretical argument developed in Chapter 1 by theorizing and showing that
scarcity-based explanations are insufficient in explaining localized conflict over food
resources, their potential validity notwithstanding.
In Chapter 3 I turned to examine the notion that a substantial portion of lo-
calized conflict events in food abundant areas arise over the need to control the
amount of food resources available to rival groups. I thus developed the argu-
ment that reducing rival groups’ access to food resources is a powerful strategy to
increase strength and guarantee survival, as being deprived of food support signif-
icantly reduces an organization’s fighting ability (Hendrix and Brinkman, 2013), a
mechanism I termed “preemptive” conflict over food security. Because the major-
ity of armed actors in the developing world must frequently rely on locally-grown
food to support their operations, by securing access to such resources an armed
actor can operate for longer periods of time and venture further away from its base
197

of operations, increasing its durability. Correspondingly, to weaken its opponent
and increase its probability of defeating its rivals, an armed group might seek to
preemptively conquer areas that have more food resources. In doing so, it deprives
the first group of these essential resources, thus reducing its durability, fighting
capability, and size. This in turn will push the first group to stage stronger re-
sistance in these food abundant areas to guarantee continued availability of food
resources.
I then derived a formal model to show how food security concerns affect the
strategic calculi of (i) the first group, or defense forces, (ii) the second group,
or raiders, and (iii) the civilian producers that provide local food support to the
defense forces. I then corroborate my formal model’s predictions on high resolution
data on conflict and local food production for the years 1998-2008 (Ray et al., 2012;
Ramankutty et al., 2008) using a statistical strategic model that corresponds to the
formal model’s derivations, and also used this model to forecast conflict on out-
of-sample data for 2009-2010. In discussing the preemptive imperative to initiate
conflict in food abundant resources and validating it empirically, Chapter 3 thus
advances our understanding of how localized conflict might emerge endogenously
of the strategic choices of different groups, and sets the stage for evaluating how
these two mechanisms—possessive and preemptive conflict over food—impact war
and rebellion patterns at the macrolevel.
Having laid out and validated the two most important mechanisms linking food
abundance to conflict locally, in Chapter 4, I conducted an empirical assessment
of the argument developed in Chapter 1. Microlevel evaluation of archival docu-
ments from the Mau Mau rebellion in Kenya, backed by quantitative analyses of
original within-country data on localized conflict during the rebellion, established
198

this theory’s viability, focusing on the possessive and preemptive conflict dynam-
ics. Documents from deliberations of British officials during the rebellion illustrate
that these officials were acutely aware of how important food resources—and espe-
cially nutritious, calorie-rich staple crops—were to the Mau Mau fighting efforts.
Using an original geo-spatial dataset I constructed from additional archival doc-
uments, geographic patterns of violence during the Mau Mau rebellion are also
tested quantitatively to evaluate these claims.
Having established the microlevel impact of food resources in this specific his-
torical case, the second part of Chapter 4 evaluated whether the probability and
duration of rebellions on a global scale is impacted by annual variations in nutri-
tious food availability at the country level. I found that not only are rebellions
significantly more likely to erupt in countries where more food is available, but
also that—once erupted—rebellions are likely to last significantly and substantially
longer. Indeed, the hazard of conflict termination (i.e., peace) in countries at the
75th percentile of maize production decreased by 12% compared with states in
the 25th percentile. Considering that food resources might exhibit an endogenous
relationship with conflict, even at the country level, I also conducted a two-step
probit regression with instrumental variables to show that the results are likely
robust to such concerns. To do so, I relied on the annual frequency of natural
disasters for each country, both disaggregated to specific categories, and at the
aggregated level. In line with the theoretical expectations developed in Chapter
1 and the findings of the microlevel analyses conducted in Chapters 2, 3, and the
first part of Chapter 4, I found that in countries with higher levels of staple crop
availability, rebellions are more likely to arise, and when they do, last longer.
The rest of this conclusion revolves around four themes. I first discuss this
199

dissertation’s theoretical and empirical contributions, especially in respect to the
reliance on high-resolution data, which allow me to evaluate cross-nationally how
violence varies within states. I then elaborate on the policy implications of my
analysis. In the third section I discuss some of the limitations of my analysis.
Finally, I discuss some potential extensions of this research, including future direc-
tions to pursue and how my findings relate to other bodies of research on conflict
and political violence.
Theoretical and Empirical Contribution
My findings have a number of important implications for the study of conflict
and political violence. Anecdotal narratives, historical analyses, and quantita-
tive empirical evidence all suggest that in many (low development) contexts, food
abundant areas attract a substantive degree of violence by both state and nonstate
actors including rebels, especially during ongoing wars. In recent decades, our un-
derstanding of the causes of conflict has benefited from numerous studies into the
importance of natural resources (e.g., Collier and Hoeffler, 2005; Weinstein, 2005;
Azam and Hoeffler, 2002) and low state capacity (e.g., Fearon and Laitin, 2003), as
well as research that emphasizes the strategic logic behind political violence (e.g.,
Valentino, Huth and Balch-Lindsay, 2004; Wood, 2010; Kalyvas, 2006; Fjelde and
Hultman, 2014). Other research took a step forward by incorporating the notion
that climatic variations (Burke et al., 2009; Miguel, Satyanath and Sergenti, 2004;
Hsiang, Burke and Miguel, 2013) and food prices (Bellemare, 2015; Fjelde, 2015;
Hendrix and Haggard, 2015; Weinberg and Bakker, 2015) impact the probability
and frequencies of different social conflict.
200

Importantly, despite these impressive bodies of research, there are at least
two important areas in the research on civil conflict and political violence where
our understanding remains poor, as highlighted by Blattman and Miguel (2010).
The first is in “analyzing conflict causes, conduct, and consequences at the level of
armed groups, communities, and individuals” (Blattman and Miguel, 2010, 8). The
second is the fact “the empirical evidence that social divisions, political grievances,
and resource abundance are drivers of violence,” currently “remains weaker and
more controversial” (Blattman and Miguel, 2010, 45).
My main contributions to these impressive bodies of research are fourfold. First,
I create a general theory and identify mechanisms that, while being focused on mi-
crolevel dynamics of violence, also has testable macrolevel implications. From a
microlevel perspective, I argue that efforts to understand where conflict and civilian
victimization arise and concentrate should take into consideration the importance
of securing food resources, and the fact that in many countries forces must guar-
antee these resources by violent means. Here, my theory, mixed-methods case
study, and analysis of high-resolution data explain how concerns at the group
and individual troop level shape local conflict patterns, thus allowing me to more
carefully conceptualize my macrolevel analyses and the factors tested therein. My
archival-resources based dataset and the incorporation of high-resolution crop yield
data—both of which are now available to other scholars—also contribute toward
“a major goal of civil war researchers within both economics and political science,”
which “should be the collection of new data, especially extended panel micro-data
sets of economic conditions and opportunities” (Blattman and Miguel, 2010, 46).
Focusing on violent interactions between different groups occurring at the highly-
localized level using a variety of tools, including game theory, yields a rigorous
201

explanation for conflict and political violence more broadly.
Importantly, I am also able to test the viability of these microlevel findings
across a large number of countries by focusing on the expected macrolevel outcome:
violent conflict. Here, the reliance on a global 0.5 degree resolution grids provides
a major advantage. My microlevel theory identifies specific contexts where food
abundance can generate violence, and then extrapolates how these should affect
interactions occurring at the macrolevel. Using my high-resolution grid data, I
am able to test how this contextualized dynamic of violence compares with other
areas within the state, urban or rural. I focus on the geographical manifestations of
specific types of political violence, and how these relate to theoretical expectations.
In doing so, I unpack how some specific features of low-development states that
may vary over time and space, such as economic productivity and agricultural
output, as well as factors that might hinder state access such as mountains and
distance from centers of power, impact armed conflict and other human rights
violation.
Second, by focusing on geospatial variations in violence I am also able to gen-
eralize my theory about the linkages between food abundance and conflict as well
as its underlying mechanisms to contexts that do not involve an ongoing civil war.
By viewing armed group behavior as a byproduct of the conditions of war, many
studies on the causes of conflict and political violence provide relatively few in-
sights into why these phenomena tend to concentrate in specific specific areas or
erupt in moments. The focus on civil war, which is fought primarily in rural areas
(Kalyvas, 2004), also means that these studies often ignore how specific features
of such rural areas might attract significantly higher levels of violence even during
times of peace.
202

A related insight is that in the vast majority of contexts, food is not grown
by the rebels themselves, but by civilians within territories where rebels operates.
This suggests that studying the behavior of civilians as an active actor in rebellion
and the factors underlying their decision to provide food support to rebels or to
state troops can yield important insights into pathways governing the spread of
armed conflict. The decision whether or not to feed the rebels can blur the line
between rebellion supporters and participants as highlighted by, e.g., Wood (2003,
17-18). Explicating the role of food as a builder of pro-rebel communities will likely
generate important insights into the behaviors of civilian, rebels and state troops
during rebellions, and is thus an especially salient future direction of research.
The finding that a large portion of this violence concentrates in areas with
more food abundance, as was preliminarily shown in Table 1.1 in Chapter 1, has
additional theoretical implications. It points to the fact that some types of social
conflict, including civil war and rebellion, are highly context-dependent. For in-
stance, by showing that conflict can also arise endogenously in areas where more
food is grown I am able to explain how food abundance can cause conflict, while
still relying on the strategic violence approach. This adds to “the empirical evi-
dence that social divisions, political grievances, and resource abundance are drivers
of violence,” which currently “remains weaker and more controversial” (Blattman
and Miguel, 2010, 45). Finally, as in detail below discussed below, these identified
linkages can also assist policymakers to better direct their intervention efforts.
Third, while in this dissertation I focus on food as a unique natural resource,
my theory and analysis can be readily expanded to incorporate other types of
resources. For instance, gem stones such as diamonds are found in mines, but then
could be placed in one’s pocket and carried across the border, where they can be
203

sold in their relatively raw form (although more processing can add value to the
final produce). In that regard, these lucrative resources are probably more similar
to nutritious food resources such as maize in that processing, while potentially
beneficial, is not necessary. In contrast, oil is unlikely to be obtained, processed,
and sold if the group is unable to establish control over the entire supply chain,
i.e. the state apparatus back in the capital and far away from the fields (see,
e.g., Englebert and Ron, 2004). The focus on issues of access and availability can
thus inform the field’s understanding of how different natural resources might have
varying effects on the probability and concentration of conflict and violence.
Finally, this dissertation also has implications for scholars studying the effect
of climatic variations, especially in respect to food availability and access, and so-
cial conflict. Recent research into the relationship between climatic variability and
conflict identifies factors such as prolonged heat waves and droughts as potential
causes of conflict and violence (Burke et al., 2009; Miguel, Satyanath and Sergenti,
2004; Bagozzi, Koren and Mukherjee, 2017; von Uexkull et al., 2016). However,
some scholars rightfully highlight the potential pitfalls of placing too much re-
sponsibility for conflict and political violence, with all their complexities, on broad
climatic trends (see, e.g., Buhaug, 2010). Thus, as I emphasize repeatedly through-
out this dissertation, my findings illustrate that negative rainfall shocks and their
associated effects are not uniform drivers of the risk of violence. Indeed, I echo
the warning advanced by Buhaug et al. (2014) that making such brush-stroke ar-
gument can lead to problematic interpretation of the true causes of conflict, and
how they operate.
Yet, I do believe that completely ignoring the potential effect of climatic vari-
ations would be a case of “throwing out the baby with the bathwater.” The
204

theory and analyses advanced in this dissertation identify specific contexts where
droughts can be used to “exogenize” the effect of food on conflict, especially in
rainfall-dependent Africa, although in contrast to its conceptualization in extant
research, this relationships is negative (i.e., more drought are associated with less
conflict). This approach is in line with previous studies that take a similar ap-
proach to explaining linkages between economic development and civil war (e.g.,
Miguel, Satyanath and Sergenti, 2004) or food prices and riots (e.g., Bellemare,
2015), but it fundamentally differs from these studies, in that my analyses associate
abundance, and not scarcity, with more conflict.
My main contribution in this regard is in drawing a direct linkage between the
effect of variations in food availability (due to variations in rainfall) and different
types of conflict. Thus, my theory and analyses are in line with the argument ad-
vanced by Theisen, Gleditsch, and Buhaug, mentioned in Chapter 1, that “more
work needs to be put into the geographical disaggregation of the effects of climate
change since these effects will not follow national boundaries,” especially consider-
ing that “[a]ctors and agency tend to be vaguely portrayed, or outright ignored, in
the relevant empirical literature” (2013, 621-622). Indeed, once one follows these
guidelines to establish a valid micro-to-macrolevel empirical approach, the findings
point, counterintuitively, in the direction of abundance rather than scarcity as a
generator of conflict.
Policy Lessons and Broad Implications
The linkages between food and conflict identified here can also assist policymakers
to better direct their intervention efforts. First, my insights into armed groups’
205

motivations for fighting in, and indeed over, food abundant areas illuminate a
new mechanism through which such violence can be ameliorated: improvements in
food distribution within conflict afflicted zones. In this regard, my findings speak
to extant studies emphasizing the role of the UN in ameliorating conflict and
reducing civilian causalities (see, e.g., Hultman, Kathman and Shannon, 2013), as
food aid is often a relevant UN service in such cases. Likewise, my study may also
help to identify precisely where within a given country UN forces or other external
parties could intervene more generally, so as to most effectively prevent conflict
intensifications during periods of relative peace: in food abundant, agricultural
areas.
Another relevant insight is that the likelihood of conflict and violence is often
influenced by decisions made not only by armed troops, but also by local civilians.
Indeed, as was shown in Chapter 3, whether the civilians choose to support their
“defenders” or not has a noticeable impact on the probability that raiding groups
would attack the region where they live, or even directly attack them. This has
important implications for how policymakers might approach violence mitigation
in ongoing conflicts, such as the recent civil wars in Syria or Iraq. Agriculture
was an important source of income for the Islamic State (Jaafar and Woertz,
2016), which used to rule over large parts of the breadbaskets of the two countries.
Indeed, the group maintained agricultural production levels in these regions despite
ongoing conflict. IS is notorious for its violence against noncombatants, much of
which took place in these regions. Although far from the only explanation for the
group’s brutality, this dissertation sheds light on some of the causes of violence
against civilians in these agricultural areas.
More broadly, with the role of food in conflict gaining widespread attention, it
206

is important for policymakers to understand the nuances of this relationship and
avoid categorical claims and pitfalls. This dissertation thus suggests that under-
standing the role of food in war will change the way both military commanders
and peacebuilders approach conflict along three main lines.
First, it is important to bear in mind that throughout history wars and armed
conflicts have rarely persisted when and where food was scarce. Napoleon and other
great military leaders knew very well that “the army marches on its stomach.”
Sherman’s “March to the Sea” during the American Civil War was designed to
starve the Confederate Army into surrender. As was shown in Chapter 4, the
British military’s strategy of denying food from rebels was crucial to its victories
in Kenya (as well as Malaya, see, Ramakrishna, 2002, 140-143) in the 1950s.
As was shown in Chapter 3 and 4, being able to regulate the food supplies avail-
able to enemy forces is a powerful strategic tool available to military commanders.
Rather than focusing on the fact that countries where food is scarce tend to expe-
rience more conflict, policymakers might thus benefit more from focusing on areas
within these states where insurgents and, correspondingly, violence tend to con-
centrate: in food abundant areas. Knowing where food is produced within devel-
oping, conflict-afflicted countries, where insurgents and—frequently—state troops
are likely to be found, can also point to areas where violence against civilians might
be more or less likely if these troops seek to extract“food quotas.” This is useful
information for international organizations and especially the UN when deciding
where to position peacekeeping troops within conflict-afflicted countries.
A second issue is that food scarcities and famines are frequently not the results
of natural disasters, but are rather manmade. Nobel Laureate Amartya Sen noted
in 1981 that, “starvation is the characteristic of some people not having enough
207

food to eat. It is not the characteristic of there being not enough food to eat”
(1981). Sen was referring to the idea that hunger is not always related to food
supply; even in places where ample food exists, many people do not have regular
access to it. In 2017, four countries were at the risk of experiencing severe famine.
Of these, only one, Somalia, experienced prolonged drought. The food security of
the others—Nigeria, South Sudan, and Yemen—was disrupted mostly by ongoing
violent conflict. War in these countries is destroying crops and cutting off flows of
aid and trade, not only reducing supply but also crippling access to food.
This illuminates another problem with focusing on the seemingly linear rela-
tionship between scarcity and war discussed in Chapter 1: in many cases this
relationship is simultaneous. Scarcity is not necessarily causing violence in many
contexts, but rather results from it. Indeed, to this end, the analyses conducted
in Chapter 2 showed that once this endogeneity is taken into account, the effect
of food on conflict becomes positive rather than negative. While humanitarian ef-
forts and food aid are necessary, they cannot succeed without the “muscle” to back
them up. In the absence of military protection by committed nations, such food
aid efforts fail to help their intended recipients, and in fact often end up hurting
them, as examples from Mogadishu to Yemen soberly illustrate.
Finally, policymakers would benefit from thinking more thoroughly of how the
relationships between food and conflict will be affected by current global trends,
especially climate change. In the coming decades, environmental degradation, cli-
mate change, and population growth will likely reduce food production in some
developing countries (Carleton and Hsiang, 2016; Vidal, 2013). This will increase
the reliance of armed forces on local food resources and could exacerbate the ill-
treatment of civilians during conflict. For example, new behaviors of armed groups
208

might emerge during peacetime, such as a focus on controlling agricultural resource
extraction. This may not necessarily be a bad thing. Occasionally, groups that
control valuable export crops, such as bananas or sugar, seem to treat local farm-
ers more peacefully (Crost and Felter, 2016). Yet, as was shown in Chapter 3,
the peaceful co-option of farmers’ labor can turn violent when these groups feel
threatened by enemy forces.
A set of strategies that can help in these situations focuses on aiding potential
victims of violence before it occurs. Using military forces to halt perpetrators
and protect victims on the ground once violence flares is usually very expensive. A
lower cost approach could be to assist residents living in these areas escape to safer
areas before conflict erupts. Large refugee flows are rightly seen a humanitarian
emergency in themselves, but it is a preferred alternative to refugees that become
so after surviving violence.
Moreover, helping civilians escape can also weaken violent insurgent groups by
draining them of labor required to produce food for consumption and lucrative
purposes. As was shown in Chapter 4, without this necessary input, the size of
insurgent groups must remain small, and they must spend more time foraging for
food or growing it themselves. This allows diverting efforts away from combating
well-supported insurgents or preventing human rights abuses once they started,
and toward allowing would-be victims to reach safety across international borders
and to caring from them once they arrive.
209

Potential Limitations
A likely objection to the conclusions presented here is that one cannot use histor-
ical data to project future trends. The findings presented here might thus not be
representative of future rebellions, where scarcity might play an increasingly impor-
tant role. While these objections have some validity, they ignore technological—
such as DNA manipulation and increased reliance on drought-resistant crops—and
socioeconomic—such as urbanization and economic development—advances that
can mitigate some of these adverse climatic effects. From this perspective, many
armed groups will still be forced to continue to rely on locally grown food in the
coming decades, and those who enjoy more access to these resources will also be
more effective. This claim is at least partly supported by Model 4 in Table 4.6
in Chapter 4, which shows a statistically significant and positive relationship be-
tween maize per capita and rebellion over the last five decades, the increasingly
noticeable impact of climatic variation notwithstanding.
Another limitation relates to the reliance on local food availability, specifically,
rather than food volatility, prices, or alternative routes of obtaining food support.
For instance, some rebel groups and militias are able to trade in lucrative natural
resources or cash crops such as bananas and coffee (e.g., Crost and Felter, 2016;
Jaafar and Woertz, 2016), which allows them to allocate some of these revenues to
purchasing food. This is a valid concern, but I believe that it is less relevant for
two main reasons. First, as numerous studies have shown (e.g., Koren and Bagozzi,
2016, 2017; Bagozzi, Koren and Mukherjee, 2017), many state and nonstate actors
(including militias and rebel groups) are highly unlikely to receive regular support,
and must secure food resources in order to sustain themselves. Indeed, I discussed
210

this issue in great detail in Chapter 2. Second, especially in conflict-prone coun-
tries, trade routes are likely to be limited or completely eliminated, meaning that
the only way to secure food resources is by taking control over “break-basket”
territories, as I discussed in detail in Chapter 1. From an empirical perspective,
the different models used in Chapters 2, 3, and 4 all control—to some extent—for
these alternative pathways, or show that the results are robust to these concerns
using different sensitivity analyses. Thus, this dissertation’s conclusion that local
food access is a crucial variable in understanding the onset, concentration, and
duration of both localized conflict and broad rebellion patterns likely holds.
Third, one might argue that the conceptualization of food security along the
dimensions of access and availability used in this dissertation does not fully cap-
ture several aspects of food security such as refrigerated food, which can increase
the amount of food available per capita and food’s degree of accessibility to dif-
ferent individuals and groups. Although this is unlikely to affect the robustness
of the findings presented here, as the majority of conflicts takes place in countries
and regions where little-to-no refrigeration exists, this concern deserves future con-
sideration. Moreover, the increase in land grabbing for the purposes of non-food
oriented agricultural resources (e.g., ethanol) or exports production since 2008 (see,
e.g., De Schutter, 2011; Crost and Felter, 2016) has potential implications for my
findings.
While 2008 is the final year in the vast majority of the analyses conducted
above, this remains an important area for future research. Nevertheless, as the
different robustness models used in Chapters 2 and 3 clearly show, food and agri-
cultural imports do not substantially diminish the significant effects of localized
food production. This suggests that the access to and availability of food resources
211

grown locally play an important role in conflict, which is independent of that of
food obtained via other means. Examining the interaction between (the distribu-
tion of) food and agricultural imports on the one hand and local food resources
on the other, for example, based upon the dependencies of rebel groups or private
organizations on these resources or lack thereof, is a potential valuable extension
on this study’s conclusions, and might uncover important dynamics of violence
that the present analysis cannot specifically identify.
Finally, as was stated earlier, the effects of food insecurity on conflict, and
indeed conflict in-and-of itself, are the result of complicated interactions between
various factors, and primarily between political and economic features (Hendrix
and Brinkman, 2013; Buhaug, 2010; Hegre and Sambanis, 2006; Fearon and Laitin,
2003; Collier and Hoeffler, 1998). Hence, while interpreting the present findings as
evidence that access to locally grown food resources and food availability shapes
local conflict dynamics, this dissertation does not expound on these findings as
a complete picture of future socioeconomic developments in this arena, nor does
it account for agricultural modifications that might affect or indeed reverse these
trends.
Future Directions of Research
Having delineated the different contributions of this dissertation to extant research,
and having discussed some of the limitations therein, this final section outlines a
future research agenda that builds on this dissertation’s findings. The theory and
findings presented in this dissertation strongly suggest that scholars should better
account for the role of food resources in contemporary analyses of conflict. From
212

a theoretical perspective, as I have argued and shown repeatedly, rebellions in-
volve strong food security-related incentives, as both rebels and—frequently—state
forces are forced to rely on locally sourced food. In such contexts, the marginal re-
turns from more food available for each individual trooper are sizable. Unlike other
profitable natural resources, food is absolutely necessary for rebellions to succeed.
Considering that higher levels of access to staples have positive externalities, such
as improving group cohesion and overcoming barriers on collective action, future
research into the behavior of rebel groups will benefit from analyzing situations
where food matters more or less than other natural resources.
Such studies will also gain from incorporating food access as a proxy of a rebel
group’s capacity levels, or as a measure of its members’ “wealth.” Empirically, the
effect of food resources on conflict was shown not only to be statistically significant,
but also sizable, and substantively comparable to, if not surpassing, that of other
benchmark indicators of conflict such as GDP per capita (Fearon and Laitin, 2003).
As such, scholars of conflict and political violence more broadly should include food
resources-based indicators in models analyzing conflict to verify the robustness of
their findings to these issues. As the effect of food resources is at least partly
independent of that of economic development, state capacity, or democratization,
their viability as a conflict mediator should be taken into consideration.
A second potentially beneficial direction of future research would be to more
thoroughly incorporate the role of food prices and food price volatility, which has
been the tenet of previous studies (e.g., Bellemare, 2015; Hendrix and Haggard,
2015; Weinberg and Bakker, 2015), with the role of local food availability articu-
lated in this dissertation. Indeed, some studies have already taken the lead on this
(e.g., Fjelde and Hultman, 2014; Wischnath and Buhaug, 2014), but I believe more
213

can be gained by using time-varying yield data such as the ones used here with
food price variations. This can help to explain how global economic factors that
affect food prices concatenate with local variations in food production to engender
conflict and civilian victimizations.
Another valid direction would be to take a more macrolevel, historical approach
to understanding how food security has historically affected the frequency of civil
war globally. This would help to set the role of food in a more historical context,
which arguably predates the effects of climate change. It would also enable schol-
ars to understand how macrolevel variations in food security impacted civil war
frequencies globally, rather than within specific countries, considering that some of
food insecurity’s effects are transnational (Theisen, Gleditsch and Buhaug, 2013).
A closely related factor to food security, and one that has attracted significant
attention in the last decade of the 20th century, is “water security” (e.g., Gleick,
1993; Starr, 1991; Amery, 1997). Studies on linkages between water insecurity and
conflict have taken a scarcity-based perspective to argue that in countries where wa-
ter is scarce, actors compete violently over available resources. A fourth direction
of research would thus be to incorporate more throughly the role of water security
in affecting food security and its effects on conflict. Granted, in the vast majority
of cases, the focus on cropland already accounts for the role of water, considering
that water is a necessary input for food production. Nevertheless, there are some
areas where more high-resolution-data-driven research would benefit from better
accounting for the variations in water security. For instance, pasturalist groups
tend to live in arid areas, and are therefore forced to rely mostly on livestock—
especially cattle—for food support (e.g., Mkutu, 2001; Detges, 2014). For these
pastoralist groups, which lead a highly mobile lifestyle, securing access to water
214

is crucial, considering that they livestock needs to drink and eat the grass that
grows near water sources. Indeed, violence in these pastoralist contexts frequently
arises due to competition over oasis, fountains, and pastureland (Theisen, 2012;
Butler and Gates, 2012). From this perspective, future research would benefit from
analyzing whether these dynamics resemble those involving crops.
A final substantive direction of future research is in analyzing how food im-
pacts the incidence of other types of violence, especially sexual violence. In this
dissertation, I focused mostly on armed conflict and the killings of civilians, while
previous studies have focused on atrocities (Koren and Bagozzi, 2017; Bagozzi,
Koren and Mukherjee, 2017) and political mobilization (Bellemare, 2015; Hendrix
and Haggard, 2015; Weinberg and Bakker, 2015). Recent research associates re-
cruitment mechanisms or group type with a higher risk of sexual violence (e.g.,
Cohen, 2013; Cohen and Nordas, 2015). It is therefore highly likely that the need
to secure resources or to expel civilians from their homes and take control over
arable land can motivate armed groups to use sexual violence, either strategically
or as a part of other tactics of victimization.
The future research directions outlined here can yield substantive and impor-
tant findings. Indeed, the analyses conducted in this dissertation illustrate that
scholars and policymakers should take the effect of food security and its localized
and global impact on conflict and political violence seriously, and give it the same
consideration they give other of its important determinants such as economic de-
velopment, state capacity, and ongoing conflict. In a world where armed groups
must rely on local food, and where climate change is inducing more shocks to food
production, the detailed theory developed in this dissertation and the vast spec-
trum of empirical evidence used to support it strongly suggest that we should do
215

more, as scholars, policymakers, and members of the international community, to
guarantee that these changes do not jeopardize the human security of billions of
individuals worldwide.
216

Appendix
Proof of Lemma 1
• To derive the first part, begin by comparing the utilities of the civilian pro-
ducers from providing food support in case the raiders attack, i.e., when
M = 1 to their utility from not doing so. The utility in the first case is
Ub(M |θ) = ρs− 12θ2 − κ. In the second case, the utility of the civilians from
conflict is identical, only θ = 0, and so the probability of defender victory
ρ collapses to the baseline probability of the defense forces’ victory p. The
civilians’ utility in this case is now Ub(M |¬θ) = ps−κ. Setting the equation
such that providing food support is at least as good an option as not provid-
ing it gives Ub(M |θ) ≥ Ub(M |¬θ), then p[1 + (1− δ)θω]s− 12θ2− κ ≥ ps− κ.
This can be solved for p such that p ≥ 2θ(1−δ)ωs . Naturally, from this equation
if θ = 0 then it must be true that p = 0. Hence, in any case, as long as
the raiders are not guaranteed to defeat the defense forces—i.e., p ≤ 1—the
civilian producers will always allocate some level of food support θ to their
defense forces.
• To derive the second part, assign ρ = p[1 + (1 − δ)θω] into the civilian
producers’ utility: Ub(M) = p[1+(1−δ)θω]s− 12θ2−κ. Taking the derivative
217

of this utility function in respect to θ gives ∂U(b)∂θ
= (1 − δ)ωps − θ = 0.
Isolating θ gives θ∗ = (1− δ)ωps.
• To derive the third part, compare the raiders’ utility function for attacking
a food producing region, i.e., when M = 1 and δ > 0 to their utility from
not focusing on food producing areas. The utility function in the first case
is Ur(δ > 0|θ∗) = [1− p(1 + (1− δ)2ω2ps)](R+ s)− η, and in the second case
it is Ur(δ = 0|θ∗) = [1 − p(1 + ω2ps)](R + s) − η. Clearly, as long as δ ≥ 0,
attacking regions with more food production is a preferred strategy for the
raiders.
• Now compare the costs of conflict to the utility from not initiating conflict,
i.e., when M = 0: Ur(δ > 0|θ∗) = [1− p(1 + (1− δ)2ω2ps)](R + s)− η ≥ 0,
and so M = 0: Ur(Mθ∗) = [1− p(1 + (1− δ)2ω2ps)](R + s) ≥ η.
Proof of Proposition 1
To obtain these results take the partial derivative of θ∗ in respect to p, ω, and s
when M = 1.
• In respect to p: ∂θ∗
∂p= s(1− δ)ω ≥ 0 because δ < 1; and so θ∗ increases with
higher probabilities of the defense forces d’s victory.
• In respect to ω: ∂θ∗
∂ω= s(1− δ)p ≥ 0 because δ < 1; and so θ∗ increases when
food support is more important for improving the defense forces’ overall
probability of victory.
• In respect to s, ∂θ∗
∂s= (1− δ)ωp ≥ 0 because δ < 1; and so θ∗ increases with
higher value of land s.
218
Proof of Proposition 2
• To obtain these results, first take the partial derivative of the raiders’ utility
when M = 1 in respect to δ and compare it to 0 (the utility of the raiders
when M = 0). Clearly, ∂U(r)∂δ
= 2ω2p2s(s+R)(1− δ) > 0 because δ < 1; and
so the raiders’ utility from initiating conflict increases the stronger the effect
of violence is on reducing food support.
• To obtain the second part of this proposition and show that the raiders will
be more likely to initiate conflict if it has a stronger effect on diminishing
the defense forces’ probability of victory, take the derivative of the raiders’
utility from conflict in respect to p to isolate p∗, and then take the derivative
of p∗ in respect δ. Taking the derivative of Ur(M |θ∗) in respect to p and
isolating p gives p∗ = − 12(d−1)2sω2 , which shows that—unsurprisingly—the
utility of the raiders from conflict decreases with higher probability of the
defense forces’ victory. The derivative in respect to p∗ should thus show how
the utility from raiding in respect to the probability of the defense forces’
victory changes with higher levels of δ: ∂p∗
∂δ= sω2(1− δ) ≥ 0 because δ ≤ 1,
and so the raiders will initiate conflict even with higher probability of the
defense forces’ victory if conflict has a strong effect on reducing the food
support available to the defense forces.
219

Bibliography
Adano, Wario R, Ton Dietz, Karen Witsenburg and Fred Zaal. 2012. “Climatechange, violent conflict and local institutions in Kenya’s drylands.” Journal ofPeace Research 49(1):65–80.
Adhvaryu, Achyuta, James Fenske, Gaurav Khanna and Anant Nyshadham. 2016.“Resources, Conflict, and Economic Development in Africa.”.
Ahmed, Ismail I and Reginald Herbold Green. 1999. “The heritage of war and statecollapse in Somalia and Somaliland: local-level effects, external interventions andreconstruction.” Third World Quarterly 20(1):113–127.
Amery, Hussein A. 1997. “Water security as a factor in Arab-Israeli wars andemerging peace.” Studies in conflict & terrorism 20(1):95–104.
Anderson, Robert Warren, Noel D Johnson and Mark Koyama. 2017. “Jew-ish Persecutions and Weather Shocks: 1100–1800.” The Economic Journal127(602):924–958.
Angrist, J. D. and J. S. Pischke. 2009. Mostly Harmless Econometrics. Princeton,NJ: Princeton University Press.
Arellano, Manuel. 2003. “Modelling optimal instrumental variables for dynamicpanel data models.” CEMFI Working Paper No. 0310. ftp://193.146.129.
230/wp/03/0310.pdf.
Arellano, Manuel and Stephen Bond. 1991. “Some tests of specification for paneldata: Monte Carlo evidence and an application to employment equations.” Thereview of economic studies 58(2):277–297.
Arias, Marıa Alejandra, Ana Marıa Ibanez Londono and Andres Zambrano. 2014.Agricultural Production Amid Conflict: The Effects of Shocks, Uncertainty, and
220

Governance of Non-State Armed Actors. Universidad de los Andes, Facultad deEconomıa, CEDE.
Asfaw Negassa et al. 2013. “The Potential for Wheat Production inAfrica: Analysis of Biophysical Suitability and Economic Profitability.”Policy paper, International Food Policy Research Institute, July 2013,http://repository.cimmyt.org/xmlui/bitstream/handle/10883/4015/
97365.pdf?sequence=1&isAllowed=y.
Azam, Jean-Paul and Anke Hoeffler. 2002. “Violence Against Civilians in CivilWars: Looting or Terror?” Journal of Peace Research 39(4):461–485.
Bagozzi, Benjamin E., Ore Koren and Bumba Mukherjee. 2017. “Droughts, LandAppropriation, and Rebel Violence in The Developing World.” Journal of Poli-tics 79(3).
Balcells, Laia. 2010. “Rivalry and Revenge: Violence against Civilians in Conven-tional Civil Wars.” International Studies Quarterly 54:291–313.
Bannon, Ian and Paul Collier. 2003. Natural resources and Violent Conflict: Op-tions and Actions. Washington, D.C.: World Bank.
Barrett, Christopher B. 2010. “Measuring Food Insecurity.” Science 327:825–828.
Barrow, Greg. 1996. “ANCIENT CATTLE CULTURE UNDER THREAT FROMWAR.” The Guardian, April 4, 1996.
Baumol, William J. 2004. “Red-Queen games: arms races, rule of law and marketeconomies.” Journal of Evolutionary economics 14(2):237–247.
Beguerıa, Santiago, Sergio M Vicente-Serrano, Fergus Reig and Borja Latorre.2014. “Standardized precipitation evapotranspiration index (SPEI) revisited:parameter fitting, evapotranspiration models, tools, datasets and drought mon-itoring.” International Journal of Climatology 34(10):3001–3023.
Bellemare, Marc F., Takaaki Masaki and Thomas B. Pepinsky. Forthcoming.“Lagged Explanatory Variables and the Estimation of Causal Effects.” Jour-nal of Politics .
Bellemare, Mark F. 2015. “Rising Food Prices, Food Price Volatility, and SocialUnrest.” American Journal of Agricultural Economy 97:1–21.
Bennett, Huw. 2013. Fighting the Mau Mau: The British Army and Counter-Insurgency in the Kenya Emergency. Cambridge University Press.
221

Blattman, Christopher and Edward Miguel. 2010. “Civil War.” Journal of Eco-nomic Literature 48(1):3–57.
Blok, Anton. 1969. “Peasants, Patrons, and Brokers in Western Sicily.” Anthropo-logical Quarterly 42(3):155–170.
Blundell, Richard and Stephen Bond. 1998. “Initial conditions and moment restric-tions in dynamic panel data models.” Journal of econometrics 87(1):115–143.
Blundell, Richard W and James L Powell. 2004. “Endogeneity in semiparametricbinary response models.” The Review of Economic Studies 71(3):655–679.
Boring, Edwin Garrigues. 1945. Psychology for the armed services. Washington:The National Research Council.
Box-Steffensmeier, Janet M and Bradford S Jones. 2004. Event history modeling:A guide for social scientists. Cambridge University Press.
Branch, Daniel. 2007. “The enemy within: loyalists and the war against Mau Mauin Kenya.” The Journal of African History 48(02):291–315.
Brandt, Patrick T., John R. Freeman and Philip A. Schrodt. 2011. “Real Time,Time Series Forecasting of Inter- and Intra-state Political Conflict.” ConflictManagement and Peace Science 28(1):41–64.
Brinkman, Henk-Jan and Cullen S. Hendrix. 2011. “Food Insecurity and ViolentConflict: Causes, Consequences, and Addressing the Challenges.” OccasionalPaper no. 24, World Food Programme.
Buhaug, Halvard. 2010. “Climate not to blame for African civil wars.” Proceedingsof the National Academy of Science 107(38):16477–16482.
Buhaug, Halvard, Jonas Nordkvelle, Thomas Bernauer, Tobias Bhmelt, MichaelBrzoska, Joshua W. Busby, Antonio Ciccone and et al. 2014. “One effect to rulethem all? A comment on climate and conflict.” Climatic Change 127:391–397.
Buhaug, Halvard, Scott Gates and Paivi Lujala. 2009. “Geography, Rebel Ca-pability, and the Duration of Civil Conflict.” Journal of Conflict Resolution53(4):544–569.
Burke, M., E. Miguel, S. Satyanath, J. Dykema and D. Lobell. 2009. “WarmingIncreases the Risk of War in Africa.” PNAS 106:20670–20674.
Butler, Christopher K and Scott Gates. 2012. “African range wars: Climate,conflict, and property rights.” Journal of Peace Research 49(1):23–34.
222

Carleton, Tamma A and Solomon M Hsiang. 2016. “Social and economic impactsof climate.” Science 353(6304):aad9837.
Carter, David B. 2010. “The Strategy of Territorial Conflict.” American Journalof Political Science 54(5):969–987.
Carter, David B. and Curtis S. Signorino. 2010. “Back to the Future: ModelingTime Dependence in Binary Data.” Political Analysis 18(3):271–292.
Chen, Xi and William D. Nordhaus. 2011. “Using luminosity data as aproxy for economic statistics.” Proceedings of the National Academy of Science108(21):8589–8594.
Chenoweth, Erica and Orion A Lewis. 2013. “Unpacking nonviolent campaigns:Introducing the NAVCO 2.0 dataset.” Journal of Peace Research 50(3):415–423.
Cilliers, Jakkie. 2000. Resource Wars—A New Type of Insurgency. In Angola’sWar Economy: The Role of Oil and Diamonds, ed. Jakkie Cilliers and ChristianDietrich. Pretoria: Institute for Security Studies pp. 1–19.
Cohen, Dara Kay. 2013. “Explaining rape during civil war: Cross-national evidence(1980–2009).” American Political Science Review 107(3):461–477.
Cohen, Dara Kay and Ragnhild Nordas. 2015. “Do states delegate shameful vio-lence to militias? Patterns of sexual violence in recent armed conflicts.” Journalof Conflict Resolution 59(5):877–898.
Collier, Paul and Anke Hoeffler. 1998. “On economic causes of civil war.” OxfordEconomic Papers 50(4):563–573.
Collier, Paul and Anke Hoeffler. 2005. “Resource Rents, Governance, and Conflict.”Journal of Conflict Resolution 49(4):625–633.
Conley, Timothy G, Christian B Hansen and Peter E Rossi. 2012. “Plausiblyexogenous.” Review of Economics and Statistics 94(1):260–272.
Crost, Benjamin and Joseph H Felter. 2016. Export Crops and Civil Conflict.Technical report.
De Schutter, Olivier. 2011. “How not to think of land-grabbing: three critiques oflarge-scale investments in farmland.” The Journal of Peasant Studies 38(2):249–279.
De Soysa, Indra, Nils Petter Gleditsch, Michael Gibson and Margareta Sollenberg.1999. To cultivate peace: Agriculture in a world of conflict. International PeaceResearch Institute Oslo.
223

de Waal, Alex. 2005. Famine that Kills: Darfur, Sudan. Oxford: Oxford UniversityPress.
Deiwiks, Christa, Lars-Erik Cederman and Kristian Skrede Gleditsch. 2012. “In-equality and conflict in federations.” Journal of Peace Research 49(2):289–304.
Dell, Melissa, Benjamin F Jones and Benjamin A Olken. 2014. “What do we learnfrom the weather? The new climate–economy literature.” Journal of EconomicLiterature 52(3):740–798.
DeLong, Elisabeth R., David M. DeLong and Daniel L. Clarke-Pearson. 1988.“Comparing the areas under two or more correlated receiver operating charac-teristic curves: a nonparametric approach.” Biometrics 44:837–845.
Detges, A. 2014. “Close-up on renewable resources and armed conflict: the spatiallogic of pastoralist violence in northern Kenya.” Political Geography 42:57–65.
Doom, Ruddy and Koen Vlassenroot. 1999. “Konny’s Message: A New Koine?The Lord’s Resistance Army in Northern Uganda.” African Affairs 98:5–36.
Downes, Alexander B. 2008. Targeting Civilians in War. Ithaca NY: CornellUniversity Press.
Elvidge, Christopher D, Feng-Chi Hsu, Kimberly E Baugh and Tilottama Ghosh.2014. “National trends in satellite-observed lighting.” Global urban monitoringand assessment through earth observation 23:97–118.
Englebert, Pierre and James Ron. 2004. “Primary commodities and war: Congo-Brazzaville’s ambivalent resource curse.” Comparative Politics pp. 61–81.
Esteban, Maria Joan, Massimo Morelli and Dominic Rohner. 2010. “Strategic MassKilling.” Institute for Empirical Research in Economics, University of ZurichWorking Paper.
Fan, Jianqing. 1992. “Design-adaptive nonparametric regression.” Journal of theAmerican statistical Association 87(420):998–1004.
Fan, Yun and Huug Van den Dool. 2008. “A global monthly land surface airtemperature analysis for 1948–present.” Journal of Geophysical Research: At-mospheres 113(D1).
Fearon, James D. 1995. “Rationalist Explanations for War.” International Orga-nization 49(3):379–414.
224

Fearon, James D. 2004. “Why Do Some Civil Wars Last so Much Longer thanOthers?” Journal of Peace Research 41(3):275–301.
Fearon, James D. and David D. Laitin. 2003. “Ethnicity, Insurgency, and CivilWar.” American Political Science Review 97(1):75–90.
Finkel, Vicki R. 1992. “Angola: Brothers in Arms.” Africa Report 37(2):60.
Finnstrom, Sverker. 2003. Living with bad surroundings: war and existentialuncertainty in Acholiland, Northern Uganda PhD thesis Acta Universitatis Up-saliensis.
Fjelde, Hanne. 2015. “Farming or fighting? Agricultural price shocks and civil warin Africa.” World Development 67:525–534.
Fjelde, Hanne and Lisa Hultman. 2014. “Weakening the Enemy: A DisaggregatedStudy of Violence against Civilians in Africa.” Journal of Conflict Research58(7):1230–1257.
Food and Agricultural Organization of the United Nations. 2013. “FAO Statis-tical Yearbook 2013.” Rome 2013, http://www.fao.org/docrep/018/i3107e/i3107e00.htm.
Food and Agricultural Organization of the United Nations. 2016. “Statistics Di-vision.”.URL: http://faostat3.fao.org/home/E
Food and Agriculture Organization of the United Nations. 2008. “Climate Changeand Food Security: A Framework Document.” A Policy Paper. URL: http://www.fao.org/forestry/15538-079b31d45081fe9c3dbc6ff34de4807e4.pdf.
Gaure, Simon. 2013. “lfe: Linear group fixed effects.” The R Journal 5(2):104–117.
Gitlitz, John S and Telmo Rojas. 1983. “Peasant Vigilante Committees in NorthernPeru.” Journal of Latin American Studies 15(1):163–197.
Gleditsch, Kristian Skrede. 2002. “Expanded trade and GDP data.” Journal ofConflict Resolution 46(5):712–724.
Gleditsch, Nils Petter, Peter Wallensteen, Mikael Eriksson, Margareta Sollenbergand Havard Strand. 2002. “Armed Conflict 1946-2001: A New Dataset.” Journalof Peace Research 39(5):615–637.
Gleick, Peter H. 1993. “Water and conflict: Fresh water resources and internationalsecurity.” International security 18(1):79–112.
225

Greenhill, Brian, Michael D. Ward and Audrey Sacks. 2011. “The SeparationPlot:A New Visual Method for Evaluating the Fit of Binary Models.” AmericanJournal of Political Science 4(55):990–1002.
Greiner, Clemens. 2013. “GUNS, LAND, AND VOTES: CATTLE RUSTLINGAND THE POLITICS OF BOUNDARY (RE)MAKING IN NORTHERNKENYA.” African Affairs (112):216–237.
Guha-Sapir, Debarati, Regina Below and Philippe Hoyois. 2015. “EM-DAT: Inter-national disaster database.” Catholic University of Louvain: Brussels, Belgium.
Guttman, Nathaniel B. 1999. “Accepting the standardized precipitation index:a calculation algorithm.” JAWRA Journal of the American Water ResourcesAssociation 35(2):311–322.
Hazen, Jennifer M. 2013. What Rebels Want: Resources and Supply Networks inWartime. Ithaca: Cornell University Press.
Hegre, Haavard and Nicholas Sambanis. 2006. “Sensitivity analysis of empiricalresults on civil war onset.” Journal of Conflict Resolution 50:508535.
Hendrix, Cullen S. 2017. “A comment on “climate change and the Syrian civil warrevisited”.” Political Geography .
Hendrix, Cullen S. and Hen-Jan Brinkman. 2013. “Food Security and ConflictDynamics.” Stability: Internatioal Journal of Security and Development 2(2).
Hendrix, Cullen S. and Idean Salehyan. 2012. “Climate Change, Rainfall, andSocial Conflict in Africa.” Journal of Peace Research 49(1):35–50.
Hendrix, Cullen S. and Stephan Haggard. 2015. “Global food prices, regime type,and urban unrest in the developing world.” Journal of Peace Research 52(2):143–157.
Henk, Daniel W. and Martin Revayi Rupiya. 2001. Funding Defense: Challengesof Buying Military Capability In Sub-Saharan Africa. Carlisle, PA: U.S. ArmyWar College Strategic Studies Institute.
Homer-Dixon, Thomas F. 1998. Environment, Scarcity, and Violence. New York,NY: Basic Books.
Hsiang, Solomon M. and Kyle C. Meng. 2014. “Reconciling disagreement overclimate-conflict results in Africa.” Proceedings of The National Academy of Sci-ence 111(6):2100–2103.
226

Hsiang, Solomon M., Marshall Burke and Edward Miguel. 2013. “Quantifying theInfluence of Climate on Human Conflict.” Science 341:1212.
Hultman, Lisa. 2007. “Battle Losses and Rebel Violence: Raising the Costs forFighting Terrorism and Political Violence.” Terrorism and Political Violence19(2):205–222.
Hultman, Lisa. 2009. “The Power to Hurt in Civil War: The Strategic Aim ofRENAMO Violence.” Journal of Southern African Studies 35(4):821–834.
Hultman, Lisa, Jacob Kathman and Megan Shannon. 2013. “United Nations Peace-keeping and Civilian Protection in Civil War.” American Journal of PoliticalScience 57(4):875–891.
Jaafar, Hadi H. and Eckart Woertz. 2016. “Agriculture as a funding source of ISIS:A GIS and remote sensing analysis.” Food Policy 64:14–25.
Jacobs, Dan. 1987. The Brutality of Nations. New York: Alfred Knopf.
Jayne, T.S., Takashi Yamano, Michael T. Weber, Rui Benfica David Tschirley and,Antony Chapoto and Ballard Zulu. 2003. “Smallholder income and land distri-bution in Africa: implications for poverty reduction strategies.” Food Policy28(3):253–275.
Kalyvas, Stathis N. 2004. “The Urban Bias in Research on Civil War.” SecurityStudies 13(3):1–31.
Kalyvas, Stathis N. 2006. The Logic of Violence in Civil War. Cambridge: Cam-bridge University Press.
Kanogo, Tabitha. 1987. Squatters and the roots of Mau Mau, 1905-63. London:James Curry.
Kastner, T., M. J. I. Rivas, W. Koch and S. Nonhebel. 2012. “Global changes indiets and the consequences for land requirements for food.” Proceedings of theNational Academy of Science 109:6868–6872.
Keen, David. 2005. Conflict and Collusion in Sierra Leone. Suffolk: James Currey.
Keller, Edmond J. 1992. “Drought, War, and the Politics of Famine in Ethiopiaand Eritrea.” The Journal of Modern African Studies 30(4):609–624.
King, Gary and Langche Zeng. 2001. “Logistic regression in rare events data.”Political analysis 9(2):137–163.
227

Klein Goldewijk, Kees, Arthur Beusen, Gerard Van Drecht and Martine De Vos.2011. “The HYDE 3.1 spatially explicit database of human-induced globalland-use change over the past 12,000 years.” Global Ecology and Biogeography20(1):73–86.
Koren, Ore. 2017a. “Means to an End: Pro-Government Militias as a PredictiveIndicator of Strategic Mass Killing.” Conflict Management and Peace Science34(5):461?484.
Koren, Ore. 2017b. “Why insurgents kill civilians in capital cities: A disaggregatedanalysis of mechanisms and trends.” Political Geography 61:237–252.
Koren, Ore and Anoop Sarbahi. Forthcoming. “State Capacity, Insurgency andCivil War: A Disaggregated Analysis.” International Studies Quarterly .
Koren, Ore and Benjamin E. Bagozzi. 2016. “From Global to Local, Food Insecu-rity is Associated with Contemporary Armed Conflicts.” Food Security 8(5):999–1010.
Koren, Ore and Benjamin E. Bagozzi. 2017. “Living Off The Land: The Connectionbetween Cropland, Food Security, and Violence against Civilians.”.
Koubi, V., T Bernauer, A Kalbhenn and G Spilker. 2012. “Climate variability,economic growth, and civil conflict.” Journal of Peace Research 49:113–127.
Kress, Moshe. 2002. Operational Logistic: The Art and Science of SustainingMiltiary Operations. Norwell, MA: Kluwer Academic Publishers.
Kydd, Andrew H. and Barbara F. Walter. 2002. “Sabotaging the Peace: ThePolitics of Extremist Violence.” International Organization 56(2):263–296.
Le Billon, Philippe. 2001. “The political ecology of war: natural resources andarmed conflicts.” Political geography 20(5):561–584.
Leebaw, Bronwyn. 2014. “Scorched Earth: Environmental War Crimes and Inter-national Justice.” Perspectives on Politics 12(4):770–788.
Leff, Jonah. 2009. “Pastoralists at War: Violence and Security in the Kenya-Sudan-Uganda Border Region.” International Journal of Conflict and Violence3(2):188–203.
Luongo, Katherine. 2006. “If you can’t beat them, join them: Government cleans-ings of witches and Mau Mau in 1950s Kenya.” History in Africa 33:451–471.
228

Lybbert, Travis J., Christopher B. Barrett, John G. McPeak and Winnie K.Luseno. 2007. “Bayesian herders: Updating of rainfall beliefs in response toexternal forecasts.” World Development 35(3):480–497.
Macrae, Joanna and Anthony B. Zwi. 1992. “Food as an Instrument of War in Con-temporary African Famines: A Review of the Evidence.” Disasters 16(4):299–321.
Marshall, M. G., T. R. Jaggers and K. Gurr. 2013. “Polity iv project: Politicalregime characteristics and transitions, 1800-2012.” Technical Report.
Masterson, Daniel M. 1991. Militarism and Politics in Latin America: Peru fromSanchez Cerro to Sendero Luminoso. New York: Greenwood Press.
Maystadt, Jean-Francois and Olivier Ecker. 2014. “Extreme Weather and CivilWar: Does Drought Fuel Conflict in Somalia through Livestock Price Shocks?”American Journal of Agricultural Economy 96(4):1157–1182.
Melander, Erik, Therese Pettersson and Lotta Themner. 2016. “Organized vio-lence, 1989–2015.” Journal of Peace Research 53(5):727–742.
Messer, Ellen. 2009. “Rising Food Prices, Social Mobilization, and Violence.”NAPA Bulletin pp. 12–22.
Messer, Ellen and Marc. J. Cohen. 2006. “Conflict, Food Insecurity, and Glob-alization.” FCND Discussion Paper 206, International Food Policy ResearchInstitute.
Miguel, Edward, Shanker Satyanath and Ernest Sergenti. 2004. “Economic Shocksand Civil Conflict: An Instrumental Variables Approach.” Journal of PoliticalEconomy 112(2):725–753.
Mitchell, Neil J., Sabine C. Carey and Christopher K. Butler. 2014. “The Im-pact of Pro-Government Militias on Human Rights Violations.” InternationalInteractions 40(5):812–836.
Mkandawire, Thandika. 2002. “The terrible toll of post-colonial ?rebel movements?in Africa: towards an explanation of the violence against the peasantry.” TheJournal of Modern African Studies 40(2):181–215.
Mkutu, Kennedy. 2001. “Pastoralism and conflict in the Horn of Africa.” AfricaPeace Forum/Saferworld/University of Bradford.
229

Monfreda, Chad, Navin Ramankutty and Jonathan A Foley. 2008. “Farming theplanet: 2. Geographic distribution of crop areas, yields, physiological types, andnet primary production in the year 2000.” Global biogeochemical cycles 22(1).
Montesano, M. and Patrick Jory. 2008. Thai South and Malay North: EthnicInteractions on a Plural Peninsular. Singapore: NUS Press.
Nordhaus, William D. 2006. “Geography and macroeconomics: New data and newfindings.” Proceedings of the National Academy of Sciences 103(10):3150–3517.
Nordhaus, William, Qazi Azam, David Corderi, Kyle Hood, Nadejda MakarovaVictor, Mukhtar Mohammed, Alexandra Miltner and Jyldyz Weiss. 2006. “TheG-Econ database on gridded output: Methods and data.” Codebook,Yale Uni-versity, New Haven. http://gecon.yale.edu/sites/default/files/gecon_
data_20051206.pdf.
Nunn, Nathan and Nancy Qian. 2014. “US food aid and civil conflict.” The Amer-ican Economic Review 104(6):1630–1666.
Oerke, E. C. and H. W. Dehne. 2004. “Safeguarding production?losses in majorcrops and the role of crop protection.” Crop protection 23(4):275–285.
Ofuoku, A.U. 2009. “The Role of Community Development Committees in Farmer-Herder Conflicts in Central Agricultural Zone of Delta State, Nigeria.” Interna-tional Journal of Rural Studies 16(1):1–10.
O’Loughlin, John, Frank D. W. Witmer, Andrew M. Linke, Arlene Laing, An-drew Gettelman, and Jimy Dudhia. 2012. “Climate variability and conflict riskin East Africa, 1990-2009.” Proceedings of the National Academy of Science109(45):18344–18349.
Osamba, Joshia O. 2000. “The Sociology of Insecurity: Cattle Rustling and Ban-ditry in North-Western Kenya.” African Centre for the Constructive Resolutionof Disputes (ACCORD).
Paarlberg, Robert L. 2000. “The Global Food Fight.” Foreign Affairs 79:24–38.
PITF. 2009. “Political Instability Task Force Worldwide Atrocities Event Data Col-lection Codebook Version 1.0B2.” http://eventdata.parusanalytics.com/
data.dir/atrocities.html.
Pitt, Mark M., Mark R. Rosenzweig and Md. Nazmul Hassan. 1990. “Productivity,Health, and Inequality in the Intrahousehold Distribution of Food in Low-IncomeCountries.” The American Economic Review 80(5):1139–1156.
230

Planning Commission of India (PCI. 2008. “Development Challenges in ExtremistAffected Areas: Report of an Expert Group.” Official Report.
Powell, Jonathan M and Clayton L Thyne. 2011. “Global instances of coups from1950 to 2010: A new dataset.” Journal of Peace Research 48(2):249–259.
Raleigh, Clionadh. 2012. “Violence Against Civilians: A Disaggregated Analysis.”International Interactions 38(4):462–481.
Raleigh, Clionadh, Andrew Linke, Haavard Hegre and Joakim Karlsen. 2010. “In-troducing ACLED: An Armed Conflict Location and Event Dataset.” Journalof Peace Research 47(5):651–660.
Raleigh, Clionadh and Caitriona Dowd. 2015. “Armed Conflict Location andEvent Data Project (ACLED) Codebook 2-15.” http://www.acleddata.com/
about-acled/.
Raleigh, Clionadh and Dominic Kniveton. 2012. “Come rain or shine: An analysisof conflict and climate variability in East Africa.” Journal of Peace Research49(1):51–64.
Ramakrishna, Kumar. 2002. Emergency propaganda: the winning of Malayanhearts and minds, 1948-1958. Richmond, UK: Curzon Press.
Ramankutty, N, AT Evan, C Monfreda and JA Foley. 2008. “Farming the planet:1. Geographic distribution of global agricultural lands in the year 2000.” GlobalBiogeochem. Cycles 22:Article N. GB1003.
Ray, Deepak K., Navin Ramankutty, Nathaniel D. Mueller, Paul C. West andJonathan A. Foley. 2012. “Recent patterns of crop yield growth, stagnation,and collapse.” Nature Communications 3:Article N. 1293.
Reardon, Thomas and J. Edward Taylor. 1996. “Agroclimatic Shock, IncomeInequality, and Poverty: Evidence from Burkina Faso.” World Development24(5):901–914.
Reuters. 2011. “Tribal, rebel violence kills 2,300 in South Sudan- U.N.” July 8, 2011. URL: http://uk.reuters.com/article/
uk-sudan-south-violence-idUKTRE7661F920110707.
Reuveny, Rafael. 2007. “Climate change-induced migration and violent conflict.”Political Geography 26:656–673.
231

Rivers, Douglas and Quang H Vuong. 1988. “Limited information estimatorsand exogeneity tests for simultaneous probit models.” Journal of econometrics39(3):347–366.
Rockmore, Marc. 2012. Living within conflicts: risk of violence and livelihoodportfolios. Technical report Households in Conflict Network.
Roncoli, Carla, Keith Ingram and Paul Kirshen. 2001. “The costs and risks of cop-ing with drought: livelihood impacts and farmers’ responses in Burkina Faso.”Climate Research 19:119–132.
Roodman, David. 2009. “A note on the theme of too many instruments.” OxfordBulletin of Economics and statistics 71(1):135–158.
Ross, Andrew, Robert Hall and Amy Griffin. 2015. The Search for Tactical Successin Vietnam, An Analysis of Australian Task Force Combat Operations. Cam-bridge: Cambridge University Press.
Ross, Michael L. 2004a. “How do natural resources influence civil war? Evidencefrom thirteen cases.” International organization 58(01):35–67.
Ross, Michael L. 2004b. “What do we know about natural resources and civilwar?” Journal of peace research 41(3):337–356.
Ross, Michael L. 2011. “Oil and Gas Data, 1932-2011.” http://hdl.handle.net/
1902.1/20369UNF:5:dc22RlDasveOTAJvwIjBTA==V2.
Rowhani, P., O. Degomme, D. Guha-Sapir and E. F. Lambin. 2011. “Malnutri-tion and conflict in East Africa: the impacts of resource variability on humansecurity.” Climate Change 105:207–222.
Salehyan, Idean, David Siroky and Reed M. Wood. 2014. “External Rebel Spon-sorship and Civilian Abuse: A Principal-Agent Analysis of Wartime Atrocities.”International Organization 68(3):633–661.
Sarsons, Heather. 2015. “Rainfall and conflict: A cautionary tale.” Journal ofdevelopment Economics 115:62–72.
Schrodt, Philip A. 2014. “Seven deadly sins of contemporary quantitative politicalanalysis.” Journal of Peace Research 51(2):287–300.
Selby, J, O Dahi, C Frohlich and M Hulme. 2017. “Climate change and the Syriancivil war revisited.” Political Geography 61.
232

Sen, Amrtya. 1981. Poverty and Famines: An Essay on Entitlement and Depriva-tion. London: Oxford University Press.
Siebert, Stefan, Matti Kummu, Miina Porkka, Petra Doll, Navin Ramankutty andBridget R Scanlon. 2015. “A global data set of the extent of irrigated land from1900 to 2005.” Hydrology and Earth System Sciences 19(3):1521–1545.
Signorino, Curtis S. 1999. “Strategic Interaction and the Statistical Analysis ofInternational Conflict.” American Political Science Review 93(3):279–297.
Signorino, Curtis S. and Kuzey Yilmaz. 2003. “Strategic Misspeci?cation in Re-gression Models.” American Journal of Political Science 47(3):551–566.
Singer, J. David, Stuart Bremer and John Stucky. 1972. Capability Distribution,Uncertainty, and Major Power War, 1820-1965. In Peace, War, and Numbers,ed. Bruce Russett. Beverly Hills: Sage.
Singh, Parakash. 2006. The Naxalite Movement in India. New Delhi, India: RupaPublications Ltd.
Snyder, Timothy D. 2010. Bloodlands: Europe Between Hitler and Stalin. NewYork, NY: Basic Books.
Solomon, Erika, Guy Chazan and Sam Jones. 2015. “Isis Inc: how oil fuels thejihadi terrorists.” Financial Times 14.
Sovey, A. J. and D. P. Green. 2011. “Instrumental Variables Estimation in PoliticalScience: A Readers’ Guide.” American Journal of Political Science 55:188–200.
Starr, Joyce R. 1991. “Water wars.” Foreign policy (82):17–36.
Stearns, Jason. 2011. Dancing in the Glory of Monsters: The Collapse of theCongo and the Great War of Africa. New York, NY: Public Affairs.
Stock, J. H. and M. Yogo. 2002. “Testing for Weak Instruments in Linear IVRegression.” Working Paper, National Bureau of Economic Research.
Sundar, Nandini. 2007. Subalterns and Sovereigns: An Anthropological History ofBastar (1854-2006), 2nd Edition. Delhi: Oxford University Press.
Sundberg, Ralph, Kristine Eck and Joakim Kreutz. 2012. “Introducing the UCDPNon-State Conflict Dataset.” Journal of Peace Research 49(2):351–362.
The Economist. 2017. “Daily chart: Impending famines in Africa and Yemen havepolitical causes.” The Economist .
233

The Nation. 2004. “Food fights between BRN-C and Farmers in Songkhla.” TheNation 19 November 2004, pp.A-2.
The New Zealand Herald. 2002. “Timor peacekeepers farewelled as ‘epitome ofmodern force’.” November 15, 2002.
Theisen, Ole Magnus. 2012. “Climate clashes? Weather variability, land pres-sure, and organized violence in Kenya, 1989-2004.” Journal of Peace Research49(1):81–96.
Theisen, Ole Magnus, Nils P Gleditsch and Halvard Buhaug. 2013. “Is climatechange a driver of armed conflict?” Climatic Change 117:613–625.
Toft, Monica Duffy. 2006. “Issue Indivisibility and Time Horizons as RationalistExplanations for War.” Security Studies 15(1):34–69.
Tollefsen, Andreas Forø, Havard Strand and Halvard Buhaug. 2012. “PRIO-GRID:A Unified Spatial Data Structure.” Journal of Peace Research 49(2):363–374.
Tonah, Steve. 2006. “Migration and Farmer-Herder Conflicts in Ghana’s VoltaBasin.” Canadian Journal of African Studies 40(1):152–178.
Ulfelder, Jay and Benjamin Valentino. 2008. “Assessing risks of state-sponsoredmass killing.”.
Urdal, Henrik. 2005. “People vs. Malthus: Population pressure, environmentaldegradation, and armed conflict revisited.” Journal of Peace Research 42(4):417–434.
US Department of State. 2010. “National Security Strategy of the United States.”Office of the President of the United States, Washington, DC.
Valentino, Benjamin. 2004. Final Solutions: Mass Killing and Genocide in theTwentieth Century. Ithica: Cornell University Press.
Valentino, Benjamin, Paul Huth and Dylan Balch-Lindsay. 2004. “‘Draining theSea:’ Mass Killing and Guerilla Warfare.” International Organization 58(2):375–407.
Vidal, John. 2013. “Climate change will hit poor countries hardest, study shows.”The Guardian. 9/27/2013.
Vlassenroot, Koen and Timothy Raeymaekers. 2008. Crisis and food security pro-file: The Democratic Republic of the Congo. In Beyond Relief: Food Securityin Protracted Crises, ed. Luca Alinov, G’unter Hemrich and Luca Russo. War-wickshire: FAO.
234

von Uexkull, Nina, Mihai Croicu, Hanne Fjelde and Halvard Buhaug. 2016. “Civilconflict sensitivity to growing-season drought.” Proceedings of the NationalAcademy of Sciences p. 201607542.
Walker, C.F. 1999. Smoldering Ashes: Cuzco and the Creation of Republican Peru.Durham: Duke University Press.
Ward, Michael D., Brian D. Greenhill and Kristin M. Bakke. 2010. “The Perilsof Policy by P-Value: Predicting Civil Conflicts.” Journal of Peace Research47(4):363–375.
Weinberg, J. and R. Bakker. 2015. “Let them eat cake: Food prices, domesticpolicy and social unrest.” Conflict Management and Peace Science 32:309–326.
Weinstein, Jeremy M. 2005. “Resources and the information problem in rebelrecruitment.” Journal of Conflict Resolution 49(4):598–624.
Weinstein, Jeremy M. 2007. Inside Rebellion: The Politics of Insurgent Violence.Cambridge, UK: Cambridge University Press.
Westing, Arthur H. 1972. “Herbicides in war: Current status and future doubt.”Biological Conservation 4(5):322–327.
Wischnath, Gerdis and Halvard Buhaug. 2014. “On climate variability and civilwar in Asia.” Climatic Change 122:709–721.
Wood, Elisabeth Jean. 2003. Insurgent Collective action and Civil War in ElSalvador. Cambridge, UK: Cambridge University Press.
Wood, Reed M. 2010. “Rebel Capability and Strategic Violence.” Journal of PeaceResearch 47(5):601–614.
World Bank. 2012. World Development Indicators 2012. World Bank Publications.
Wucherpfennig, Julian, Nils B Weidman, Luc Giardin, Lars-Erik Cederman andAndreas Wimmer. 2011. “Politically relevant ethnic groups across space andtime: Introducing the GeoEPR dataset.” Conflict Managment and Peace Science20(10):1–15.
235
Related Documents