ANALYZING MICROARRAY DATA WITH TRANSITIVE DIRECTED ACYCLIC GRAPHS Vinhthuy Phan, Department of Computer Science, The University of Memphis, Memphis, TN 38152, USA, [email protected] E. Olusegun George, Department of Mathematical Sciences, The University of Memphis, Memphis, TN 38152, USA, [email protected] Quynh T. Tran, Department of Biology, The University of Memphis, Memphis, TN 38152, USA Shirlean Goodwin, Department of Biology, The University of Memphis, Memphis, TN 38152, USA Sridevi Bodreddigari, and Department of Biology, The University of Memphis, Memphis, TN 38152, USA Thomas R. Sutter Department of Biology, The University of Memphis, Memphis, TN 38152, USA Vinhthuy Phan: ; E. Olusegun George: ; Quynh T. Tran: [email protected]; Shirlean Goodwin: [email protected]; Sridevi Bodreddigari: [email protected]; Thomas R. Sutter: [email protected] Abstract Post hoc assignment of patterns determined by all pairwise comparisons in microarray experiments with multiple treatments has been proven to be useful in assessing treatment effects. We propose the usage of transitive directed acyclic graphs (tDAG) as the representation of these patterns and show that such representation can be useful in clustering treatment effects, annotating existing clustering methods, and analyzing sample sizes. Advantages of this approach include: (1) unique and descriptive meaning of each cluster in terms of how genes respond to all pairs of treatments; (2) insensitivity of the observed patterns to the number of genes analyzed; and (3) a combinatorial perspective to address the sample size problem by observing the rate of contractible tDAG as the number of replicates increases. The advantages and overall utility of the method in elaborating drug structure activity relationships are exemplified in a controlled study with real and simulated data. Keywords Microarray; clustering; sample size; directed acyclic graph; chemical genomics 1. Introduction Microarray remains the current standard for high throughput chemical genomics, in which microarray experiments are used to compare two chemical treatments 1–5 as well as more than © Imperial College Press Correspondence to: Vinhthuy Phan; Thomas R. Sutter, [email protected]. NIH Public Access Author Manuscript J Bioinform Comput Biol. Author manuscript; available in PMC 2010 February 1. Published in final edited form as: J Bioinform Comput Biol. 2009 February ; 7(1): 135–156. NIH-PA Author Manuscript NIH-PA Author Manuscript NIH-PA Author Manuscript

Welcome message from author
This document is posted to help you gain knowledge. Please leave a comment to let me know what you think about it! Share it to your friends and learn new things together.
Transcript
ANALYZING MICROARRAY DATA WITH TRANSITIVE DIRECTEDACYCLIC GRAPHS
Vinhthuy Phan,Department of Computer Science, The University of Memphis, Memphis, TN 38152, USA,[email protected]
E. Olusegun George,Department of Mathematical Sciences, The University of Memphis, Memphis, TN 38152, USA,[email protected]
Quynh T. Tran,Department of Biology, The University of Memphis, Memphis, TN 38152, USA
Shirlean Goodwin,Department of Biology, The University of Memphis, Memphis, TN 38152, USA
Sridevi Bodreddigari, andDepartment of Biology, The University of Memphis, Memphis, TN 38152, USA
Thomas R. SutterDepartment of Biology, The University of Memphis, Memphis, TN 38152, USAVinhthuy Phan: ; E. Olusegun George: ; Quynh T. Tran: [email protected]; Shirlean Goodwin: [email protected];Sridevi Bodreddigari: [email protected]; Thomas R. Sutter: [email protected]
AbstractPost hoc assignment of patterns determined by all pairwise comparisons in microarray experimentswith multiple treatments has been proven to be useful in assessing treatment effects. We propose theusage of transitive directed acyclic graphs (tDAG) as the representation of these patterns and showthat such representation can be useful in clustering treatment effects, annotating existing clusteringmethods, and analyzing sample sizes. Advantages of this approach include: (1) unique and descriptivemeaning of each cluster in terms of how genes respond to all pairs of treatments; (2) insensitivity ofthe observed patterns to the number of genes analyzed; and (3) a combinatorial perspective to addressthe sample size problem by observing the rate of contractible tDAG as the number of replicatesincreases. The advantages and overall utility of the method in elaborating drug structure activityrelationships are exemplified in a controlled study with real and simulated data.
KeywordsMicroarray; clustering; sample size; directed acyclic graph; chemical genomics
1. IntroductionMicroarray remains the current standard for high throughput chemical genomics, in whichmicroarray experiments are used to compare two chemical treatments1–5 as well as more than
© Imperial College PressCorrespondence to: Vinhthuy Phan; Thomas R. Sutter, [email protected].
NIH Public AccessAuthor ManuscriptJ Bioinform Comput Biol. Author manuscript; available in PMC 2010 February 1.
Published in final edited form as:J Bioinform Comput Biol. 2009 February ; 7(1): 135–156.
NIH
-PA Author Manuscript
NIH
-PA Author Manuscript
NIH
-PA Author Manuscript
two chemical treatments.6–10 A microarray study has typically been divided into three separatesteps: (1) selecting significant genes for further reliable analysis, (2) analyzing significantgenes by grouping them into clusters or classes, and (3) biological interpretation of geneclusters or classes. While there are many approaches proposed to address each step of thisprocess, they are mostly separate approaches. For example, the interpretation of gene clustersusually does not take into account the clustering method, which in turn does not take intoaccount how genes are selected or how sample size is determined.
In selecting significant genes, an important concern, the so-called sample size problem, is todetermine the number of replicates for each treatment to achieve statistical significance of geneexpression.11,12 Too few replicates give misleading results; too many replicates are expensiveas each replicate costs one microarray. Most approaches so far attack this problem naturallyfrom a statistical direction via calculation of power. Another important aspect of microarrayanalysis is clustering. Genes are grouped into clusters according to the similarity of theirexpression values. The advantage of this approach is that it is unsupervised and efficient. Adisadvantage with clustering is that it is hard to interpret clusters biologically or to ascribepharmacological relationships of the treatments. This is mainly due to the fact that purelymathematical measures are used to determine similarity. Another disadvantage is that thenumber of clusters and the association of genes to clusters usually depend on not only theexpression values but also the number of genes considered. This is mainly because genes areplaced into clusters based on how similar their responses are to other genes. This means thatadding a few more genes to the set may cause existing genes to be assigned to different clusters.To improve biological interpretation of microarray responses, another approach is supervisedclassification, in which observed patterns are placed into known profiles or templates, usingsuch computational techniques as decision trees or support vector machines. This approach isdesirable if there is prior knowledge of what classes into which the studied genes should beplaced. This approach, however, generally fails to predict new relationships, new profiles orclasses. Furthermore, the lack of prior knowledge, for example, by providing too few classesor profiles, can distort the results by forcing the data into classes in which they do not belong.
In this paper, we introduce a graph-based approach that touches various important aspects ofall three aforementioned steps: determining sample size, clustering, and annotating clusters forbiological interpretation. This approach is based on a post hoc comparison test that is doneafter step (1) and before step (2). The result of this additional step infers knowledge about thequestion of sufficient sample size, and at the same time allows us to place the genes into clusters,which can be annotated with specific meanings that aid the biological interpretation.Previously, Sutter et al.8 used post hoc comparisons to identify important information aboutstructure activity relationships of three important chemopreventive chemicals by encodinggene response to treatment as a ternary digit, i.e. 0, 1, or 2. Hulshizer and Blalock10 used thesame ternary classification to further assign a significance level to observed patterns usingMonte Carlo simulation. In this paper, we show that by using transitive directed acyclic graphs(tDAG) for post hoc pattern assignment, we retain all advantages of the ternary-systemapproach and at the same time address the important issue of sample size. Specifically, weillustrate how tDAG can be used for clustering gene responses, annotating clusters withmeaning, and thereby effectively classifying gene responses to treatments. Each tDAG can beviewed as a cluster of genes with specific meaning. We also show that a property of tDAGrelates closely to the number of replicates. This approach provides an alternative perspectiveof the important sample size problem, as demonstrated in our recent preliminary study.13 Themain difference between these traditional approaches such as Refs. 11 and 12 and ours is thattraditionally sample size is calculated in terms of statistical power and such estimation iscomputed before the experiment takes place. For instance, in Liu and Hwang’s method,11 theyfirst calculate the rejection region for each sample size based on the desirable proportion ofnondifferentially expressed genes and False Discovery Rate (FDR) control level, then calculate
Phan et al. Page 2
J Bioinform Comput Biol. Author manuscript; available in PMC 2010 February 1.
NIH
-PA Author Manuscript
NIH
-PA Author Manuscript
NIH
-PA Author Manuscript
power for each rejection region, and finally select sample size according to a desirable power.In our approach, sample size is estimated in terms of the rate of contractible tDAG and theestimation is done “in real time” when each sample is added sequentially. The traditionalapproach has an advantage when economic considerations, such as the cost of recruitingexperimental subjects and obtaining samples, are of some importance. For traditional samplesize computations in microarray experimental design, the proportion of nondifferentiallyexpressed genes must generally be estimated and a model of gene dependencies must beassumed before hand. Such model assumptions are not always easy to make, and it is not alwaysclear how to factor in a robust dependence structure into a model. A unique advantage of ourapproach is that it does not need to make an estimate of the proportions of differentiallyexpressed genes, and gene dependencies are encoded in the tDAG clusters.
As a clustering technique, the proposed method was used as a complete analytical process.8Importantly, we suggest that it can also be used as an augmentation of existing statisticaltechniques of determining sample size, clustering techniques, and other ways of interpretinggene clusters. One immediate use is that the tDAG produced by this method can be used asprofiles or classes for training other classification methods. Annotation of clusters producedby clustering techniques is illustrated in Sec. 4.4.
2. Representation of Gene Reponses as Directed GraphsThe initial step in the procedure is selecting significant responses, which can be done by theKruskal–Wallis rank procedure, by using an analysis of variance (ANOVA) model,1,14 orsimilar procedures. Then, every probe is assigned a pattern using a second set of (post hoc)tests for each probe. Let us assume that there are K treatments (including control) and eachtreatment has exactly r replicates. Each Wilcoxon Rank test is performed to determine howthe probe responds to each pair of treatments A and B, whose p-values can be computed exactlyin O(r2) time, where r is the number of replicates of each treatment, using a dynamicprogramming implementation of the recursive procedure by Ross.15 There are K(K − 1)/2 suchtests (and hence K(K − 1) outcomes) for each probe. These outcomes collectively encode thepattern of the probe. For example, if there are four treatments (including control), there willbe six tests to determine the pattern for each gene. Thus, the number of steps to determine thepattern for each gene is O(r2K2). There are three possibilities for each outcome:
• A ~ B, which means H0 is accepted, or there is no statistical difference of expressionof the gene under both treatments.
• A < B, which means H0 is rejected, and the gene is expressed significantly more undertreatment B than under treatment A.
• A > B, which means H0 is rejected, and the gene is expressed significantly more undertreatment A than under treatment B
The outcomes for each probe could be encoded in a straightforward manner using K(K − 1)/2ternary digits. Sutter et al. used 0, 1, 28 while Hulshizer and Blalock used 0, 1, −1.10 In thispaper, we employ a different encoding using directed acyclic graph (DAG). Although bothencodings/representations capture the exact information, there are two advantages to the DAGrepresentation: it is more visually informative, and more importantly, the “contractibility”property of DAG allows analysis of sample size. Vertices of the directed graph representtreatments, and directed edges represent relative responses of genes to pairs of treatments. Theoutcome A > B is represented by the edge A → B; A < B is represented by the edge B → A;and A ~ B implies no edge between vertices A and B.
An important property of this representation is that the observable patterns are not just DAG;they are all a specific subset of DAG called transitive directed acyclic graphs or tDAG. A
Phan et al. Page 3
J Bioinform Comput Biol. Author manuscript; available in PMC 2010 February 1.
NIH
-PA Author Manuscript
NIH
-PA Author Manuscript
NIH
-PA Author Manuscript
tDAG is a DAG with the following property: if there are two edges, A → B and B → C, thereis also an edge A → C, for any three vertices A, B, and C. This property holds because of thenature of consistent pairwise test the observed patterns must obey the rule of transitivity. Thatis, if A > B, and B > C, then A > C. The transitivity property can be seen in Fig. 1.
While all observable patterns are tDAG, a particular subset of such patterns is of importancefor the analysis of sample. We call them contractible tDAG. Formally, a tDAG iscontractible if either
1. It is a complete tDAG: there is an edge between any pair of its vertices; or
2. It is possible to contract equivalent vertices to produce a complete tDAG thatpreserves all vertex-edge relationships in the original tDAG. Vertices A and B of atDAG areequivalent if A ~ B and for all other vertices u, u → A (or A → u) if andonly if u → B (or B → u). In other words, the gene’s relative responses to A and Bto all pairwise treatments are statistically the same. As an example, vertices BNF andD3T of the tDAG in Fig. 1(b) are equivalent.
Intuitively, contracting means placing vertices into groups without distorting the originalrelationship between vertices and edges. Figure 1(a) shows a noncontractible tDAG; Fig. 1(b)shows a contractible tDAG and its contracted form. Contracted tDAG is the most concise formof tDAG. Even if there are 20 vertices with 20 treatments, a contracted tDAG might have muchfewer vertices.
3. Pattern Analyses3.1. Clustering
There are two general approaches to analysis of gene clusters. First, the tDAG patterns can beused to annotate clusters produced by traditional clustering methods. This can be a usefulrefinement of clustering results because each tDAG pattern possesses a unique and informativemeaning in terms of how genes respond to all pairwise treatments. Second, the tDAG patternsthemselves can be viewed as gene clusters. All genes having the same K(K − 1)/2 outcomesare placed into a cluster, represented by the tDAG. This is particularly useful when relativeresponse is more meaningful than absolute values of expression.8 Another advantage is thatstatistical significance can be estimated for each cluster, e.g. using Monte Carlo simulation.10
Because each tDAG pattern carries a unique meaning, levels or hierarchies of clusters can bedefined. The first level of clusters includes all observed tDAG, for instance, the two tDAG inFig. 1. With one control and three treatments, there are maximally 219 tDAG patterns that canbe observed. This number increases rapidly as the number of treatments increases.16 Thesecond level includes clusters with slightly more general meanings indicating more majortreatment effects. For example, both tDAG in Fig. 1 can be classified into the “up-regulated”cluster. Formally, each cluster in the second level consists of genes that have exactly one groupof equivalent treatments. Taking our experiment, for instance, with one control and threetreatments (BNF, D3T, and OLT) experiment, there are 14 clusters at the second level:
1. Control only
2. BNF only
3. D3T only
4. OLT only
5. No difference between Control and BNF
6. No difference between Control and D3T
Phan et al. Page 4
J Bioinform Comput Biol. Author manuscript; available in PMC 2010 February 1.
NIH
-PA Author Manuscript
NIH
-PA Author Manuscript
NIH
-PA Author Manuscript
7. No difference between Control and OLT
8. No difference between BNF and D3T
9. No difference between BNF and OLT
10. No difference between D3T and OLT
11. No difference between Control, BNF, and D3T
12. No difference between Control, BNF, and OLT
13. No difference between Control, D3T, and OLT
14. No difference between BNF, D3T, and OLT
If we account for up-down responses, there would be 28 different clusters at the second level.Each cluster can consist of several tDAG (clusters at the first level). In fact, two differentclusters at the second level can have common tDAG. Consequently, a gene can belong todifferent clusters in the second level; its meanings can be interpreted in a different perspectivedepending on which cluster at the second level we are considering. Clusters at higher levelscan be defined similarly: having two (or three, or more) groups of equivalent treatments andthe exact number of clusters can be similarly enumerated.
3.2. Analysis of sample sizeMicroarray experiments typically require more than two replicates for each treatment toachieve statistical significance of gene expression. Most current approaches are based onstatistical calculation of power to determine the necessary number of replicates.11,12 We arguethat the increasing rate of contractible tDAG can be also used to analyze the sufficient numberof replicates. As an explicit example, the tDAG in Fig. 1(a) and 1(b) represent six outcomesof comparison test of a probe in our data set (which will be discussed later) observed with fourand five replicates, respectively. With four replicates, the tests concluded in particular thatOLT ~ D3T. With an additional replicate, however, the outcome became D3T > OLT, makingthe tDAG contractible. Is the change from a noncontractible pattern to a contractible patternincidental? We suggest that this is not the case and that in general as more replicates are added,more tDAG become contractible. As each test is a comparison of means of expression valuesresponding to pairs of treatments (e.g. Wilcoxon rank test), we can reason formally why tDAGtend to be contractible as more replicates are added as follows:
Proposition—Assuming that the elements of the parameter space consisting of the meanexpression values for each gene are well ordered, the set of all tDAG converges to a set ofcontractible tDAG as the number of replications per treatment increases.
The following reasoning is for three treatments A, B, and C, but it can be extended inductivelyto any arbitrary number of treatments. For gene g, let Ωg = {(µA, µB, µC) : µA, µB, µC ∈ ℛ}represent the parameter space of all possible mean gene expressions. Then the elements ofΩg, are well ordered. The objective for performing multiple comparisons is to resolve whichelements of Ωg are supported by data after the H0 : µA = µB = µC thesis has been rejected.Using a consistent test statistic, the power of the test will converge to one, when true values ofthe mean expressions under treatments A, B, C, are not in the null region. We claim that thepattern of responses will correspond to a contractible tDAG. To see this, we will considerspecific cases in the multiple pairwise comparison tests that follow the global test for significantresponses. First, if µA, µB, µC are all sufficiently different, three pairwise tests will result in atotal ordering of the three means. This pattern corresponds to a complete tDAG with threevertices, which by default is contractible. The second case is if exactly two means are essentiallyidentical, for instance, µA = µB, the outcome of the three pairwise test will either be A ~ B, A
Phan et al. Page 5
J Bioinform Comput Biol. Author manuscript; available in PMC 2010 February 1.
NIH
-PA Author Manuscript
NIH
-PA Author Manuscript
NIH
-PA Author Manuscript
< C, B < C, or A ~ B, A > C, B > C. In either case, the outcome of the multiple comparisontest corresponds to a contractible tDAG, namely either {A, B} ← C or {A, B} → C, with Aand B being equivalent. For more than three treatments, we simply take a subset of three andapply the same reasoning. Then, pairwise comparison tests will result in a pattern that groupsall means that are essentially equivalent into the same vertices, and consequently the tDAG iscontractible.
In practice, it may be possible to have a gene whose observed pattern is the noncontractibletDAG pattern: A > B, A ~ C, and yet B ~ C. We argue that this behavior is very rare in mostcases with a sufficient sample size. The noncontractible pattern A > B, A ~ C, B ~ C impliesthat a gene with that pattern cannot respond to all three treatments, because that would imposean ordering on its responses to the treatments. On the other hand, with a sufficient number ofreplicates, A > B implies that the gene must have responded to either A or B or both. Let ussay, it is A, then, A ~ C implies that it also responds to C. Consequently, B ~ C then implies,it also responds to B as well. This appears to be a contradiction to the assumption that the genecannot respond to all three treatments.
It is also possible that for certain genes and sets of treatments it may take a large number ofreplicates to establish statistically the well ordering of the gene’s response to the treatments.Furthermore, it may even be possible to construct artificial responses such that for any givenfinite number of replicates, pairwise comparison tests will yield a noncontractible tDAGpattern. We stipulate that in practice such an adversary scenario is very rare when the drugtreatments are different. Moreover, most gene responses to treatments are well ordered, andthis ordering can be determined statistically with a sufficient number of replicates. The rate ofcontractible tDAG converges to a limit, which may not be 1, but should be close to 1 in practice.We propose the following procedure, which analyzes the sample size for a given threshold tof contractible tDAG:
1. Start with a small sample size, e.g. 4.
2. count = 0
3. For each gene g:
4. a. Generate a new replicate for g.
b. If g’s response is significant and its tDAG is contractible: count = count + 1
5. If count ÷(total number of genes) ≥t: stop. Else, go to step 2.
This procedure increases the number of replicates incrementally until a threshold is reached.Test of significance for any response and pairwise comparisons can be done using Kruskal–Wallis and Wilcoxon Rank, respectively. An issue is how to generate a new replicate for eachgene. This can come from another microarray experiment, or by simulation based on theexisting real data. Another issue is how to select the threshold t, i.e. the acceptable proportionof contractible tDAG at which the sample size is sufficient. We think that the right thresholdvaries with different experiments. Fortunately, one can observe dynamically the sizes ofnoncontractible tDAG as a hint on when to stop.
4. Experimental Results4.1. Experimental design
We designed a controlled study based on three chemopreventive compounds having relativelywell-understood pharmacological activities: 5,6-benzoflavone (BNF), 3H-1,2-dithiole-3-thione (D3T), and 4-methyl-5-pyrazinyl-3H-1,2-dithiole-3-thione (OLT).8 BNF is known toactivate both Pathways 1 and 2; whereas D3T and OLT are known to activate only Pathway 2
Phan et al. Page 6
J Bioinform Comput Biol. Author manuscript; available in PMC 2010 February 1.
NIH
-PA Author Manuscript
NIH
-PA Author Manuscript
NIH
-PA Author Manuscript
(see Fig. 2). Two families of phase 2 (conjugating) enzyme inducers exist, based upon theircapacity to coordinately elevate phase (functionalizing) enzymatic profiles.17,18 Prochaska andTalalay,18,19 using mutant hepatoma cell lines defective in the regulation of certain phase 1enzymes, were able to experimentally define bifunctional and monofunctional inducersrepresenting these two families. BNF, a bifunctional inducer, is an aryl hydrocarbon receptor(AhR) ligand. In its latent form the cytosolic AhR is associated with 90 kDa heat shock protein(Hsp90). Upon ligand binding, the AhR is activated and translocates to the nucleus where itforms a heterodimer complex with a second basic-helix-loop-helix transcription factor, Arnt.This complex binds to specific DNA sequences termed xenobiotic or dioxin response elements(XRE or DRE) that are found upstream of several known target genes, for example, CYP1A1,and acts to enhance the rates of gene transcription (Pathway 1). Also, BNF can be metabolizedto electrophilic intermediates capable of activating Pathway 2. Dithiolethiones such as D3Tand OLT are monofunctional inducers, and activate only Pathway 2, even though D3T is knownto be more potent and efficacious than OLT for Nrf2 activation.8 These compounds affect thedissociation of a Cap-N-Collar type leucine zipper transcription factor, Nrf2, from its cytosolicprotein partner Keap1. Upon dissociation, Nrf2 translocates to the nucleus where it complexeswith small Maf transcription factors, affecting gene transcription through DNA sequencestermed electrophilic or antioxidant response elements (EpRE or ARE, Pathway 2).
Microarray analysis was performed on samples of livers of Spague-Dawley rats treated witheither control diet or one of three chemopreventive compounds provided by theChemopreventive Branch of the National Cancer Institute. The Affymetrix RG_230 2.0GeneChips were used to analyze the levels of RNA expression. To verify the relationshipbetween the rate of contractible tDAG and sample size, we designed a series of experimentson the same gene set and treatments but with three, four, and five replicates. Significant geneswere selected using the Kruskal–Wallis rank procedure and exact p-values were computedusing Monte Carlo permutation resampling.2 P-values of pairwise tests were computed usinga recursive procedure.15 Control for false discovery rate at 0.05 was computed using theBenjamini and Hochberg procedure.20
With five replicates, the procedure yielded 1,550 significant genes distributed into 111 tDAGplus a no-response tDAG with 10,747 genes.With four replicates, the procedure yielded 557significant genes distributed into 65 tDAG, plus a no-response tDAG with 12,163 genes. Thereare no significant genes found after the Kruskal–Wallis tests with FDR control at the 0.05 levelwith three replicates. The dataset was deposited to the Gene Expression Omnibus database(GEO) with accession number GSE8880.
4.2. Comparison and validationTo compare how our method, multiple pairwise comparisons (MPC), differs from other popularmethods, we first look at the global differences between clusters produced by our method andthose of hierarchical clustering and k-mean clustering. As we obtained 111 tDAG clusters, both(average linkage) hierarchical clustering and k-mean were configured to produce 111 clusters(using correlation as the measure of distance) using Gene Cluster 3.0, originally developed byEisen.21 To compare two sets of clusters, we use the Rand index,22 a well-known objectivemeasure defined as R = (a + b)/(n(n−; 1)/2), where a is the number of pairs of genes that arein the same clusters in both sets, and b is the number of pairs of genes that are in differentclusters in both sets. R = 1 means the two sets of clusters are identical, whereas R = 0 meansthey are totally different.
First, we examined the sensitivity (robustness) of each method to the number of genes used toproduce the clusters. Ideally, if each gene is assigned to a cluster with an implicit indicationof some biological significance, this assignment shoud be unchanged regardless of the numberof genes used to cluster. Unfortunately, this is not true for many clustering methods including
Phan et al. Page 7
J Bioinform Comput Biol. Author manuscript; available in PMC 2010 February 1.
NIH
-PA Author Manuscript
NIH
-PA Author Manuscript
NIH
-PA Author Manuscript
k-mean and hierarchical clustering — the number of genes used to cluster affects the assignmentof genes to clusters. To study sensitivity, seven additional datasets were generated by randomlyremoving 1%, 2%, 3%, 5%, 10%, 15%, and 20% of genes, respectively, from the originaldatasets. For each method, each reduced dataset is clustered using the three methods and eachresulting set of clusters is compared to the clusters produced from the original dataset. Ourmethod assigned genes 100% consistently to the same tDAG clusters in the reduced data setsas in the original data set, which is proper. On the other hand, for hierarchical clustering, theclusters produced from the dataset with 1% of genes removed are different from the clustersproduced from the original dataset [Rand index of about 0.97; Fig. 3(a)]. This means geneswere placed differently with fewer genes. For k-mean, the Rand index is about 0.985. Acrossseven reduced datasets, k-mean is more robust than hierarchical clustering (average Rand indexis about 0.985 versus 0.96).
Second, we looked at the similarity in clusters produced by our method, hierarchical clusteringand k-mean clustering, using the seven reduced datasets described. From a global point of viewacross the seven datasets, clusters produced by our method are more similar to those producedby k-mean clustering. Specific results are shown in Fig. 3(b). Overall, the Rand indices betweenclusters produced by k-mean and those produced by our method is about 0.95, whereas betweenk-mean and hierarchical clustering is about 0.94 and between our method and hierarchicalclustering is about 0.92. Based on these datasets, our clusters are more similar to k-mean andless similar to hierarchical clustering.
Furthermore, to validate the agreement between gene placement in a tDAG and the meaningof the tDAG, we performed real time reverse transcription polymerase chain reaction (RT-PCR) on eight randomly selected genes to validate this. As microarrays are affected withmanufacturing errors, low specificity of probes, alternative splicing etc., RT-PCR has beenused by biologists as one of the most reliable tools for confirming findings from microarraydata. Real time RT-PCR is often referred as the “gold standard” for gene expressionmeasurements.23,24 It is an accurate and reproducible method, even with a limited amount ofRNA. The first four genes, CYP1b1, Aldh 3a1, COX 8h, and Gpnmb, were arbitrarily selectedfrom the 211001 cluster, which consists of genes responding to only BNF. The other four genes,Serpina, Mat 2a, Cfd, and Itgal, were selected because they were not grouped into the 211001cluster by our method; however, both hierarchical clustering and k-mean grouped them intoclusters that overlap greatly with the 211001 genes. Intuitively, both hierarchical clusteringand k-mean partitioned the 211001 cluster into smaller groups. In doing so, they might haveplaced into these groups genes that do not belong there. We expected that RT-PCR wouldconfirm that our method had correctly placed the first four genes into 211001 and the last fourgenes into other clusters. As expected, RT-PCR confirmed that the first four genes respondedsignificantly to BNF only and agreed with their placement into the 211001 cluster. However,both the PCR and statistical analyses show that the last four genes do not belong in the clusterlabeled 211001; (see Fig. 4). This result is in perfect agreement with our analysis of all pairwisecomparisons of the microarray data. In fact, there is a high correlation of 0.9258 between RT-PCR and the microarray data. On the other hand, even though both hierarchical clustering andk-mean placed the first four genes in correct clusters, they mistakenly placed the other fourgenes.
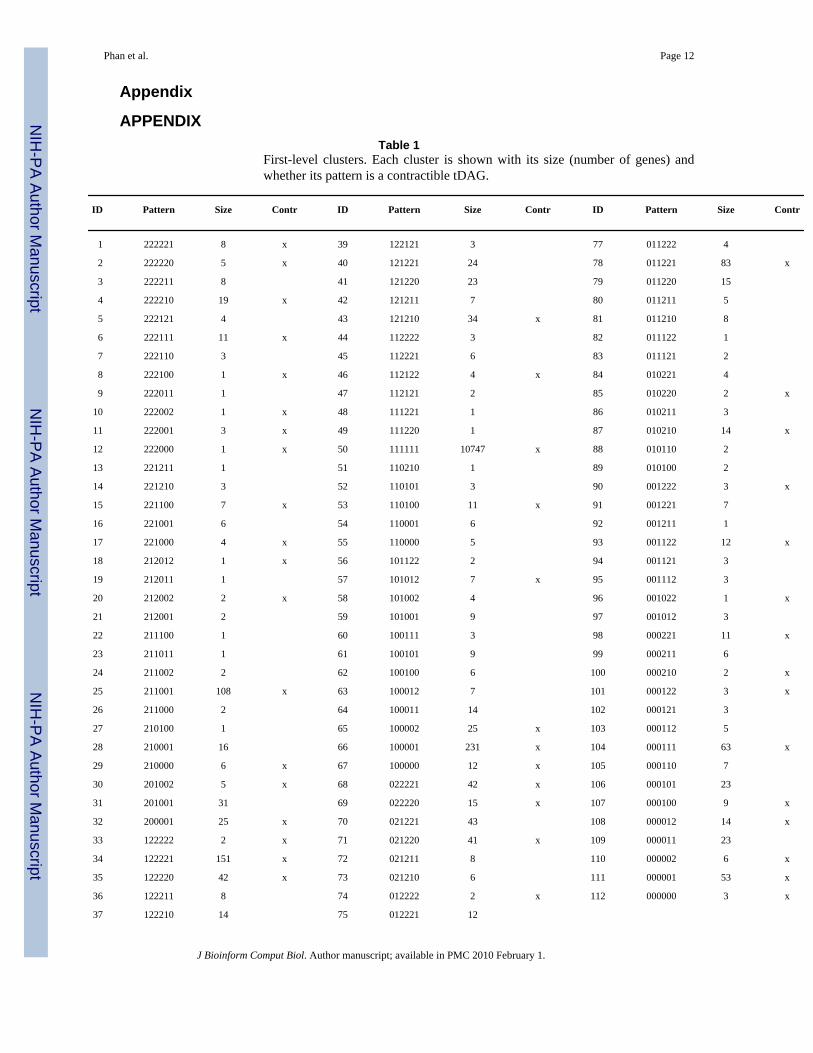
4.3. Identification and interpretation of gene clustersSeveral informative observations can be drawn from the placement of genes into tDAG patterns(or clusters). As was expected, the largest cluster of genes describes the case where the nullhypothesis is accepted for all treatments, i.e. no treatment effect (Appendix Table 1, clusterNo. 50). This corresponds to the “scattered genes”, a notion previously introduced.25 These
Phan et al. Page 8
J Bioinform Comput Biol. Author manuscript; available in PMC 2010 February 1.
NIH
-PA Author Manuscript
NIH
-PA Author Manuscript
NIH
-PA Author Manuscript

genes do not respond to any of the three treatments. Furthermore, we were able to cluster genesin relation to their known pharmacological relationships among the treatment groups.
At the first level (Appendix Table 1), clusters No. 25 and No. 78 identify the largest clustersof genes responding only to treatment with BNF, with increasing or decreasing expressionratios, respectively. The observation of this cluster is consistent with our knowledge that BNFactivates Pathway 1, as well as Pathway 2 (Fig. 2). Furthermore, cluster No. 4 (222210)identifies a set of genes that respond to D3T, but not to either OLT or BNF, exemplifying howthis procedure could be used to explore drug efficacy in dose-response experiments.
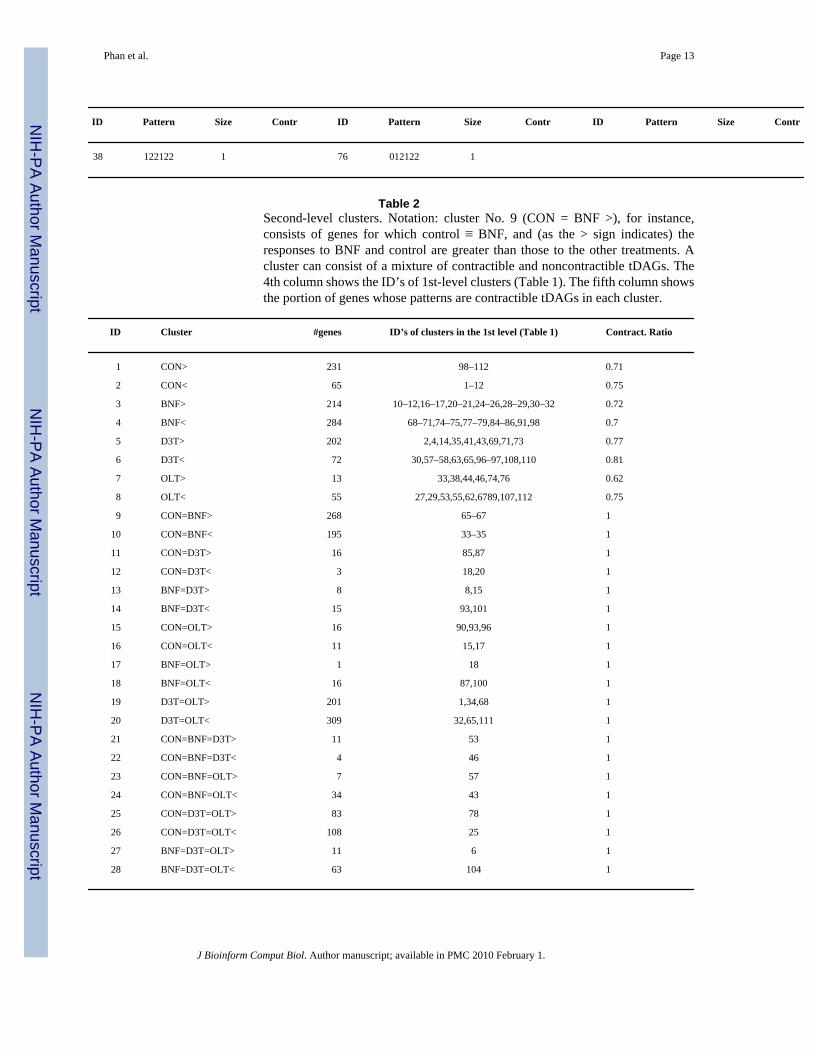
At the second level, showing treatment effects (Appendix Table 2), we can make moregeneralized observations. BNF treatment is associated with two of the largest sets of genes(clusters No. 3 and No. 4). Another large number of genes are identified as responding to allthree treatments (clusters No. 1 and No. 2). Again, this observation is consistent with our priorknowledge of a pharmacological relationship shared among the test compounds, i.e. all threecompounds activate Pathway 2. Additionally, we were also able to identify groups of genescorresponding to previously unknown mechanisms of action. A prominent structure–activityrelationship, indicated by two clusters in the second level (No. 9 and No. 10), identifies genesthat respond to D3T and OLT, but not to BNF. The observation of these clusters was notpredicted by our prior knowledge of the mechanisms of action of these compounds and suggeststhat D3T and OLT share a unique activity that is independent of the Nrf2 pathway (Fig. 2,Pathway 2). However, in 2003, a study of liver gene expression in mice treated with D3Treported that 21% of the 292 D3T-responsive genes were similarly responsive in both wild-type and KeapI-Nrf2 double knockout mice, indicating that these genes were not regulated viaPathway 2.26 Because of differences in the quality of annotation of the earlier mouse GeneChipand the current rat GeneChip, and because the mouse data was not placed into a repository, itis difficult to directly compare the list of genes identified in these two studies. Nonetheless,manual inspection of those genes reported in this paper identified several genes in common,including: amino levulinate synthase, EIB 19K/Bcl-2-binding protein homolog, glutathioneS-transferase theta 2, and sterol regulatory element binding factor 1. Therefore, this analysissuggests that this unique structure–activity relationship for D3T and OLT lies, in part, in Nrf2-independent mechanisms. This result highlights the utility of this method for the analysis ofsamples from rats or human tissues, where production of a null allele is currently not possible.
Another structure–activity relationship (Appendix Table 2, clusters No. 7 and No. 8), identifiesgenes that respond more or only to OLT. This activity was not predicted by our prior knowledgeof the mechanisms of action of these chemopreventive compounds, but was identified in aprevious study of Oltipraz.8 Two mechanisms of action have been proposed for this effect. Thefirst mechanism suggests that Nrf2-independent gene expression occurring in response to OLTis mediated by inhibition of certain cytochrome P450 enzymes by the 5-pyrazinyl substituenton the dithiolethione ring of OLT, resulting in activation of a novel set of genes.27 The secondmechanism suggests that the Ah receptor (Fig. 2, Pathway 1) is activated by OLT.28,29 In ourclassification, we find support for both mechanisms. Clusters No. 17 and No. 18 identify genesresponding equally to OLT and BNF, but not to D3T, supporting the Ah receptor hypothesis.However, clusters No. 21 and No. 22 identify genes responding only to OLT, supporting amechanism independent of the Ah receptor, which is activated by BNF (Fig. 2, Pathway 1).Because the number of genes in each cluster is relatively small and similar, it is not possibleto weight one mechanism over the other. Further molecular analysis of the genes identified inthese clusters could clarify this issue.
4.4. Annotation of other clustering methodsOur method can also be used to annotate clusters of genes that are produced by other methods.We illustrate this with two examples. We show how tDAGs can be used to annotate a dimension
Phan et al. Page 9
J Bioinform Comput Biol. Author manuscript; available in PMC 2010 February 1.
NIH
-PA Author Manuscript
NIH
-PA Author Manuscript
NIH
-PA Author Manuscript
reduction technique such as principle component analysis (PCA), as well as the gene clustersproduced by hierarchical clustering. Both of these have been popular approaches in analyzingmicroarray data.21,30
PCA allows users to visually observe the relationship between the sources of variation andgene expression, and has been used to cluster genes with similar expression profiles. In ourstudy, experimental conditions were considered variables, thus the analysis created four“principal experiment components”. The percentage variance from PCA showed that the firstthree components captured most of the information about the observed variability in theexperiment. Figure 5(b) shows an annotation of these PCA results, overlaying the clustersidentified by our combinatorial procedure. PCA essentially identified two large clusters,making it difficult to discern additional information. This observation accounts for the fact thatthe three compounds have similar activities. The color-coded annotation shows clearly distinctregions of the PCA clusters. For example, clusters 122221 and 100001 were clearly separated.These clusters represent genes that respond to OLT and D3T, either up- or down-regulated.Similarly, cluster 211001, representing genes that respond only to BNF, were also clearlyseparated from the rest of the clusters. This unique ability to identify distinct clusters in a seriesof related chemical structures clearly demonstrates the strength of our procedure for thisapplication and its much higher resolution of important clusters. In addition, the pharmacologicactivity represented by each cluster is obvious in our method.
Using actual tDAG to annotate clusters can provide meaningful annotation far beyond thesimple color coding scheme. Figure 6 shows this annotation on a typical cluster (circled)produced by hierarchical clustering. Here, the cluster is further annotated with tDAGs, resultingin 10 subclusters that show clearly how the genes responded to all pairs of treatments.Annotation with tDAG reveals subtle differences that can easily go unnoticed with unannotatedclusters produced by hierarchical clustering. For instance, by observing the subclustersannotated with tDAG, we see that while the two largest subclusters both identify genes up-regulated by D3T and OLT, they are slightly different: the 34 genes in the first subcluster donot respond to BNF, while the 16 genes in the second subcluster are down-regulated by BNF.Another possible use of tDAGs is in detecting outliers. In this example, we see threesubclusters, each having only one gene. This suggests that these three genes might be outliers,or at least they are more likely to be outliers in comparisons to the other 34 genes in the mostpopulated subcluster among them. As with most clustering methods, hierarchical clusteringdoes not provide any meaning to its clusters, making it hard to interpret the results.Additionally, researchers typically use Venn diagrams to assess pairwise relationships. As thenumber of treatments increases, the number of pairwise comparisons increases quadratically,making the Venn diagram a clumsy way to visualize all pairwise relationships. In contract, thetDAG representation does this nicely.
4.5. Relationship between sample size and contractibility of tDAGIn validating the theoretical reasoning in Sec. 3.2, Analysis of sample size, we look at statisticsfrom both real data (four and five replicates) and synthesized data (6–15 replicates). In doingso, we explore two main questions about increasing the number of replicates: (1) whether ornot more genes adopt contractible tDAG patterns, and (2) whether or not the size ofnoncontractible tDAG patterns decreases.
Real Data—Real data consisted of microarrays with four and five replicates as described inSec. 4.1. Figure 7 shows the answers for the two main questions. Firstly, more genes adoptcontractible tDAG than noncontractible tDAG patterns. Overall, the percentage of genes withcontractible tDAG patterns increases from 67% (four replicates) to 71% (five replicates).
Phan et al. Page 10
J Bioinform Comput Biol. Author manuscript; available in PMC 2010 February 1.
NIH
-PA Author Manuscript
NIH
-PA Author Manuscript
NIH
-PA Author Manuscript
Furthermore, the average number of genes per contractible tDAG increases from 13.4 to 24.6;for noncontractible tDAG the average increase is only from 4.9 to 6.7.
Secondly, for tDAG observed in both the four-replicate and five-replicate experiments, asimilar increase was observed. Unlike tDAG that appeared only in either experiment, these aremore “stable” and thus more likely to be real clusters. There were 28 contractible and 35noncontractible tDAG observed in both experiments. We observed an average increase in sizeof 5.8 fold for contractible patterns, and 2.3 fold for noncontractible patterns.
Thirdly, a gene with a contractible tDAG pattern observed in the four-replicate experiment wasmore likely to remain contractible in the five-replicate experiment. Conversely, a gene with anoncontractible tDAG pattern was more likely to become contractible. Specifically, 92% of361 genes with contractible patterns remained contractible, while only 8% becamenoncontractible. Conversely, 66% of 180 genes with noncontractible patterns adopted newcontractible patterns, while 34% of them remained noncontractible.
Simulated Data—Due to cost, our microarray experiment only consisted of up to fivereplicates. Thus, we simulated gene expressions based on the real microarray data of the five-replicate experiment. For every gene, a new replicate was generated from a normal distribution.The mean and standard deviation of this normal distribution are set to be the sample mean andstandard deviation obtained from the five replicates of that gene.
Using simulated data, we continued to observe the same trend: there are more genes withcontractible tDAG patterns as the number of replicates increases (Fig. 7). With five replicates,71% of genes adopted contractible tDAG response patterns. We saw a monotonic increase inthe percentage of genes adopting contractible patterns; 93% of genes adopted contractibletDAG patterns at 15 replicates. Moreover, the average number of genes with the samenoncontractible tDAG pattern decreased from 6.7 to 3.3. The number of genes having the samenoncontractible tDAG patterns helps in determining when to stop and serves as an indicatorof a sufficient sample size. We stopped at 15 replicates when the average noncontractiblecluster size was less than four.
5. ConclusionThe use of tDAG touches upon three important aspects of microarray studies with multipletreatments: determining sufficient sample size for reliable observed responses, clustering ofgenes, and interpretations of the clusters. The post hoc assignment of tDAG patterns isdependent on but separate from other statistical and clustering procedures; it can supplementthem in predicting sample size, clustering robustly, annotating clusters produced by othermethods, and meaningful visualization of the clusters. Methods such as hierarchical clusteringand k-mean do not possess these properties. Using tDAG, the graphical property ofcontractibility facilitates the analysis of sample size. This facilitation was not available in theprevious works using ternary digit representations of the clusters.8,10 One important aspectopen for future exploration is the relationship between the rate of contractible tDAG andstatistical power in the determination of sample size.
AcknowledgmentsWe thank our collaborators: Drs. Clinton Grubbs (University of Alabama at Birrmingham), Ronald Lubet (NationalCancer Institute), and Thomas Kensler (Johns Hopkins University). Part of this work was funded by the NCI contractN01-CN- 95114-MAO, NIH grants CA39416 and AA13515, Department of Defense grant DMAD17-03-0229, andthe W. Harry Feinstone Center for Genomic Research.
Phan et al. Page 11
J Bioinform Comput Biol. Author manuscript; available in PMC 2010 February 1.
NIH
-PA Author Manuscript
NIH
-PA Author Manuscript
NIH
-PA Author Manuscript
Appendix
APPENDIXTable 1
First-level clusters. Each cluster is shown with its size (number of genes) andwhether its pattern is a contractible tDAG.
ID Pattern Size Contr ID Pattern Size Contr ID Pattern Size Contr
1 222221 8 x 39 122121 3 77 011222 4
2 222220 5 x 40 121221 24 78 011221 83 x
3 222211 8 41 121220 23 79 011220 15
4 222210 19 x 42 121211 7 80 011211 5
5 222121 4 43 121210 34 x 81 011210 8
6 222111 11 x 44 112222 3 82 011122 1
7 222110 3 45 112221 6 83 011121 2
8 222100 1 x 46 112122 4 x 84 010221 4
9 222011 1 47 112121 2 85 010220 2 x
10 222002 1 x 48 111221 1 86 010211 3
11 222001 3 x 49 111220 1 87 010210 14 x
12 222000 1 x 50 111111 10747 x 88 010110 2
13 221211 1 51 110210 1 89 010100 2
14 221210 3 52 110101 3 90 001222 3 x
15 221100 7 x 53 110100 11 x 91 001221 7
16 221001 6 54 110001 6 92 001211 1
17 221000 4 x 55 110000 5 93 001122 12 x
18 212012 1 x 56 101122 2 94 001121 3
19 212011 1 57 101012 7 x 95 001112 3
20 212002 2 x 58 101002 4 96 001022 1 x
21 212001 2 59 101001 9 97 001012 3
22 211100 1 60 100111 3 98 000221 11 x
23 211011 1 61 100101 9 99 000211 6
24 211002 2 62 100100 6 100 000210 2 x
25 211001 108 x 63 100012 7 101 000122 3 x
26 211000 2 64 100011 14 102 000121 3
27 210100 1 65 100002 25 x 103 000112 5
28 210001 16 66 100001 231 x 104 000111 63 x
29 210000 6 x 67 100000 12 x 105 000110 7
30 201002 5 x 68 022221 42 x 106 000101 23
31 201001 31 69 022220 15 x 107 000100 9 x
32 200001 25 x 70 021221 43 108 000012 14 x
33 122222 2 x 71 021220 41 x 109 000011 23
34 122221 151 x 72 021211 8 110 000002 6 x
35 122220 42 x 73 021210 6 111 000001 53 x
36 122211 8 74 012222 2 x 112 000000 3 x
37 122210 14 75 012221 12
Phan et al. Page 12
J Bioinform Comput Biol. Author manuscript; available in PMC 2010 February 1.
NIH
-PA Author Manuscript
NIH
-PA Author Manuscript
NIH
-PA Author Manuscript
ID Pattern Size Contr ID Pattern Size Contr ID Pattern Size Contr
38 122122 1 76 012122 1
Table 2Second-level clusters. Notation: cluster No. 9 (CON = BNF >), for instance,consists of genes for which control ≡ BNF, and (as the > sign indicates) theresponses to BNF and control are greater than those to the other treatments. Acluster can consist of a mixture of contractible and noncontractible tDAGs. The4th column shows the ID’s of 1st-level clusters (Table 1). The fifth column showsthe portion of genes whose patterns are contractible tDAGs in each cluster.
ID Cluster #genes ID’s of clusters in the 1st level (Table 1) Contract. Ratio
1 CON> 231 98–112 0.71
2 CON< 65 1–12 0.75
3 BNF> 214 10–12,16–17,20–21,24–26,28–29,30–32 0.72
4 BNF< 284 68–71,74–75,77–79,84–86,91,98 0.7
5 D3T> 202 2,4,14,35,41,43,69,71,73 0.77
6 D3T< 72 30,57–58,63,65,96–97,108,110 0.81
7 OLT> 13 33,38,44,46,74,76 0.62
8 OLT< 55 27,29,53,55,62,6789,107,112 0.75
9 CON=BNF> 268 65–67 1
10 CON=BNF< 195 33–35 1
11 CON=D3T> 16 85,87 1
12 CON=D3T< 3 18,20 1
13 BNF=D3T> 8 8,15 1
14 BNF=D3T< 15 93,101 1
15 CON=OLT> 16 90,93,96 1
16 CON=OLT< 11 15,17 1
17 BNF=OLT> 1 18 1
18 BNF=OLT< 16 87,100 1
19 D3T=OLT> 201 1,34,68 1
20 D3T=OLT< 309 32,65,111 1
21 CON=BNF=D3T> 11 53 1
22 CON=BNF=D3T< 4 46 1
23 CON=BNF=OLT> 7 57 1
24 CON=BNF=OLT< 34 43 1
25 CON=D3T=OLT> 83 78 1
26 CON=D3T=OLT< 108 25 1
27 BNF=D3T=OLT> 11 6 1
28 BNF=D3T=OLT< 63 104 1
Phan et al. Page 13
J Bioinform Comput Biol. Author manuscript; available in PMC 2010 February 1.
NIH
-PA Author Manuscript
NIH
-PA Author Manuscript
NIH
-PA Author Manuscript
References1. Kerr MK, Martin M, Churchill GA. Analysis of variance for gene expression microarray data. J Comput
Biol 7;2000:819–837.2. Davidson, AC.; Hinkley, DV. Bootstrap Methods and Their Application. Cambridge: Cambridge
University Press; 1997.3. Baldi P, Long A. A Bayesian framework for the analysis of microarray expression data: Regularized
t-test and statistical inferences of gene changes. Bioinformatics 2001;17(6):509–519. [PubMed:11395427]
4. Tusher VG, Tibshirani R, Chu G. Significance analysis of microarrays applied to the ionizing radiationresponse. Proc Natl Acad Sci USA 2001;98:5116–5121. [PubMed: 11309499]
5. Zhao Y, Pan W. Modified nonparametric approaches to detecting differentially expressed genes inreplicated microarray experiments. Bioinformatics 2003;19(9):1046–1054. [PubMed: 12801864]
6. Sawers RJH, Liu P, Anufrikova K, Hwang JTG, Brutnell TP. A multi-treatment experimental systemto examine photosynthetic differentiation in the maize leaf. BMC Genomics 2007;8:12. [PubMed:17212830]
7. Cui X. Statistical tests for differential expression in cDNA microarray experiments. Genome Biol2003;4(4):210. [PubMed: 12702200]
8. Sutter TR, He XR, Dimitrov P, et al. Multiple comparisons model-based clustering and ternary patterntree numerical display of gene response to treatment: Procedure and application to the preclinicalevaluation of chemopreventive agents. Mol Cancer Ther 2002;1(14):1283–1292. [PubMed:12516961]
9. Hedenfalk I, Duggan D, Chen Y, et al. Gene-expression profiles in hereditary breast cancer. N Eng JMed 2001;344(8):539–548.
10. Hulshizer R, Blalock EM. Post hoc pattern matching: Assigning significance to statistically definedexpression patterns in single channel microarray data. BMC Bioinformatic 2007;8:240.
11. Liu P, Hwang J. Quick calculation for sample size while controlling false discovery rate withapplication to microarray analysis. Bioinformatics 2007;23(6):739–746. [PubMed: 17237060]
12. Yang M, Yang J, McIndoe R, She J. Microarray experimental design: Power and sample sizeconsiderations. Physiol Genomics 2003;16(1):24–28. [PubMed: 14532333]
13. Phan V, George EO, Tran QT, Sutter TR. Toward a combinatorial approach to the sample size problemin multiple-treatment microarray studies. Biocomp 2008;2008:175–181.
14. Kerr MK, Churchill GA. Statistical design and the analysis of gene expression microarray data. GenetRes 2001;77:123–128. [PubMed: 11355567]
15. Ross, MS. Simulation. Vol. 3rd ed. San Diego: Academic Press; 2002.16. Brinkmanm G, McKay BD. Posets on up to 16 points. Order 2002;19(2):147–179.17. Kensler T, Groopman J, Sutter T, Curphey T, Roebuck B. Development of cancer chemopreventive
agents: Oltipraz as a paradigm. Chem Res Toxicol 1999;12(2):113–126. [PubMed: 10027787]18. Prochaska H, Santamaria A, Talalay P. Rapid detection of inducers of enzymes that protect against
carcinogens. Proc Natl Acad Sci USA 1992;89(6):2394–2398. [PubMed: 1549602]19. Talalay P. Mechanisms of induction of enzymes that protect against chemical carcinogenesis. Adv
Enzyme Regul 1989;28:237–250. [PubMed: 2696344]20. Benjamini Y, Hochberg Y. Controlling the false discovery rate: A practical and powerful approach
to multiple testing. J R Statist 1995;57(1):289–300.21. Eisen MB, Spellman PT, Brown PO, Botstein D. Cluster analysis and display of genome-wide
expression patterns. Proc Natl Acad Sci USA 1998;95:14863–14868. [PubMed: 9843981]22. Rand WM. Objective criteria for the evaluation of clustering methods. J Amer Statist Assoc
1971;66:846–850.23. Shi L, Tong W, Fang H, et al. Cross-platform comparability of microarray technology: Intra-platform
consistency and appropriate data analysis procedures are essential. BMC Bioinformatics 2005;6:S12.[PubMed: 16026597]
24. Mackay IM, Arden KE, Nitsche A. Real-time PCR in virology. Nucleic Acid Res 2002;30:1292–1305. [PubMed: 11884626]
Phan et al. Page 14
J Bioinform Comput Biol. Author manuscript; available in PMC 2010 February 1.
NIH
-PA Author Manuscript
NIH
-PA Author Manuscript
NIH
-PA Author Manuscript
25. Tseng G, Wong W. Tight clustering: A resampling-based approach for identifying stable and tightpatterns in data. Biometrics 2005;61(1):10–16. [PubMed: 15737073]
26. Kwak M, Wakabayashi N, Itoh K, Motohashi H, Yamamoto M, Kensler T. Modulation of geneexpression by cancer chemopreventive dithiolethiones through the Keap1-Nrf2 pathway.Identification of novel gene clusters for cell survival. J Biol Chem 2003;278(10):8135–8145.[PubMed: 12506115]
27. Langouët S, Mahéo K, Berthou F, Morel F, Lagadic-Gossman D, Glaise D, Coles B, Ketterer B,Guillouzo A. Effects of administration of the chemoprotective agent oltipraz on CYP1A and CYP2Bin rat liver and rat hepatocytes in culture. Carcinogenesis 1997;18(7):1343–1349. [PubMed:9230277]
28. Miao W, Hu L, Kandouz M, Batist G. Oltipraz is a bifunctional inducer activating both phase I andphase II drug-metabolizing enzymes via the xenobiotic responsive element. Mol Pharmacol 2003;64(2):346–354. [PubMed: 12869639]
29. Le Ferrec E-G, Rauch C, Bardiau C, Maheo K, Massiere F, Le Vee M, Guillouzo A, Morel F.Transcriptional induction of CYP1A1 by oltipraz in human Caco-2 cells is aryl hydrocarbon receptor-and calcium-dependent. J Biol Chem 2002;277(27):24780–24787. [PubMed: 11959854]
30. Yeung K, Ruzzo W. Principal component analysis for clustering gene expression data. Bioinformatics2001;17(9):763–774. [PubMed: 11590094]
BiographiesVinhthuy Phan is an Assistant Professor of Computer Science at the University of Memphis.He received his Ph.D. in Computer Science from Stony Brook University in 2003. His researchinterests are bioinformatics and biomolecular computing focusing specifically on microarraytechnologies. He currently concentrates on refining techniques in analyzing microarray data,and developing novel usage of microarray technologies such as for information storage andretrieval.
E. Olusegun George is a Professor of Statistics in the Department of Mathematical Sciencesat the University of Memphis. He holds a Ph.D. degree from the University of Rochester. Hisresearch interests include bioinformatics, biostatistics, analysis of correlated discrete data,distribution theory, statistical risk assessment, and meta-analysis. His current research interestsin bioinformatics include constructing nonparametric and Bayesian procedures for analyzingmicroarray data, and designing meta-analytic procedures for pooling microarray data fromdifferent studies.
Quynh T. Tran is a Ph.D. student in the Department of Biology at the University of Memphis.She received her double M.S. degrees in Bioinformatics and Statistics at the University ofMemphis. Her research focuses on the development of procedures for clustering genes basedon multiple treatment expression profiles.
Shirlean Goodwin is a Research Assistant Professor in the W. Harry Feinstone Center forGenomic Research, where she directs the molecular biology instrumentation core. Her researchfocuses on functional genomics, with emphasis on metal and water stress in plants.
Sridevi Bodreddigari is a research associate at Feinstone Institute of Functional Genomics,Department of Biology, University of Memphis. He had Biology and Molecular Toxicologydegree with Ph.D. and postdoctoral training in genetics and molecular biology. His researchfocuses on chemopreventive agents and their proin-flammatory responses.
Thomas R. Sutter is a Professor of Biology and Feinstone Chair of Funtional Genomics. Hisresearch focuses on cancer causation and prevention. He is currently working on newcomputational approaches to chemical genomic applications.
Phan et al. Page 15
J Bioinform Comput Biol. Author manuscript; available in PMC 2010 February 1.
NIH
-PA Author Manuscript
NIH
-PA Author Manuscript
NIH
-PA Author Manuscript
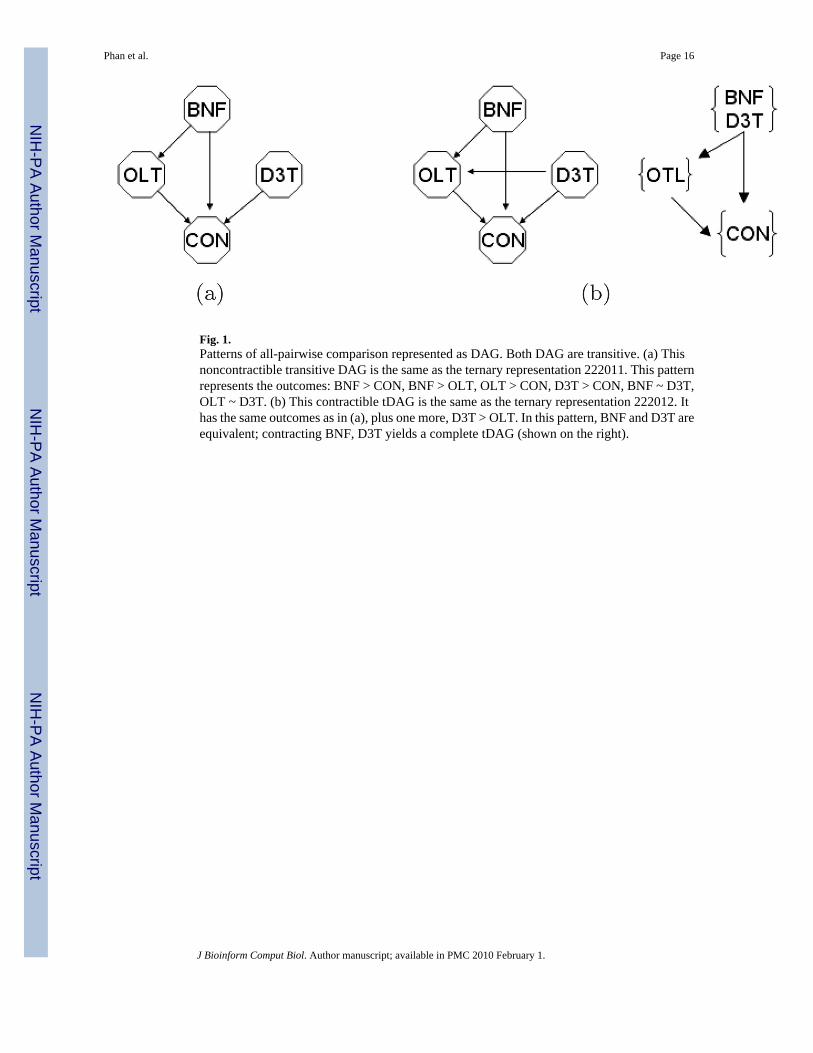
Fig. 1.Patterns of all-pairwise comparison represented as DAG. Both DAG are transitive. (a) Thisnoncontractible transitive DAG is the same as the ternary representation 222011. This patternrepresents the outcomes: BNF > CON, BNF > OLT, OLT > CON, D3T > CON, BNF ~ D3T,OLT ~ D3T. (b) This contractible tDAG is the same as the ternary representation 222012. Ithas the same outcomes as in (a), plus one more, D3T > OLT. In this pattern, BNF and D3T areequivalent; contracting BNF, D3T yields a complete tDAG (shown on the right).
Phan et al. Page 16
J Bioinform Comput Biol. Author manuscript; available in PMC 2010 February 1.
NIH
-PA Author Manuscript
NIH
-PA Author Manuscript
NIH
-PA Author Manuscript
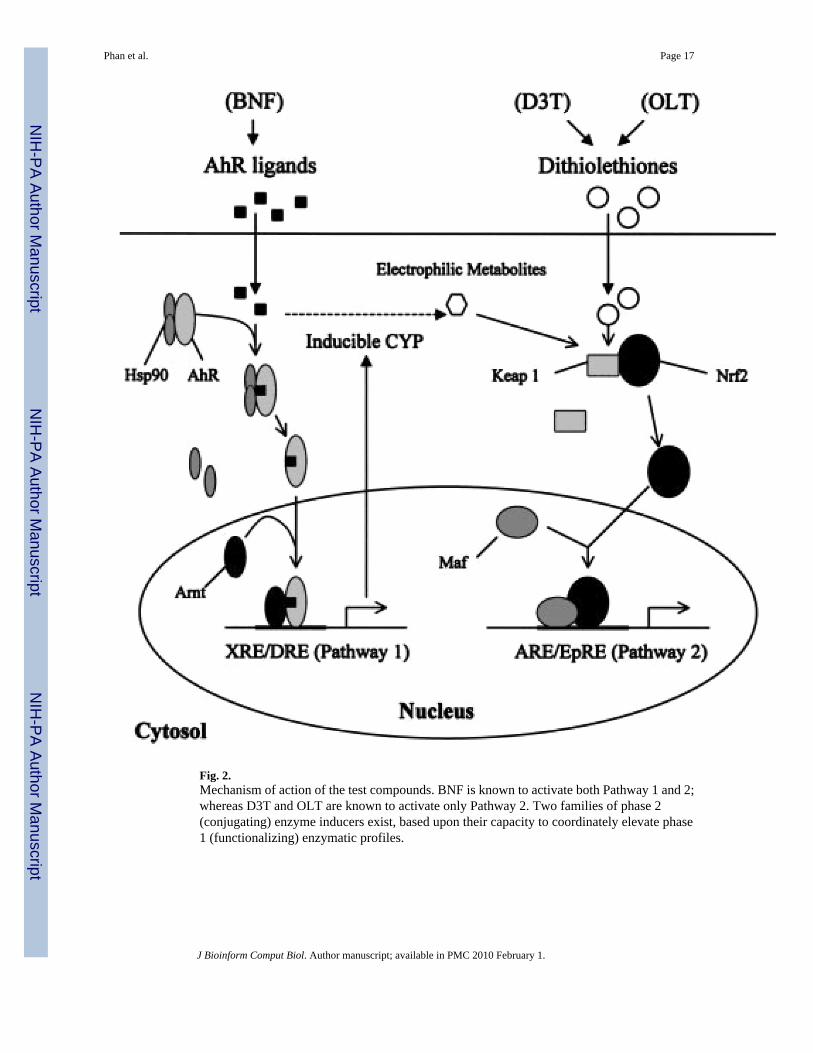
Fig. 2.Mechanism of action of the test compounds. BNF is known to activate both Pathway 1 and 2;whereas D3T and OLT are known to activate only Pathway 2. Two families of phase 2(conjugating) enzyme inducers exist, based upon their capacity to coordinately elevate phase1 (functionalizing) enzymatic profiles.
Phan et al. Page 17
J Bioinform Comput Biol. Author manuscript; available in PMC 2010 February 1.
NIH
-PA Author Manuscript
NIH
-PA Author Manuscript
NIH
-PA Author Manuscript
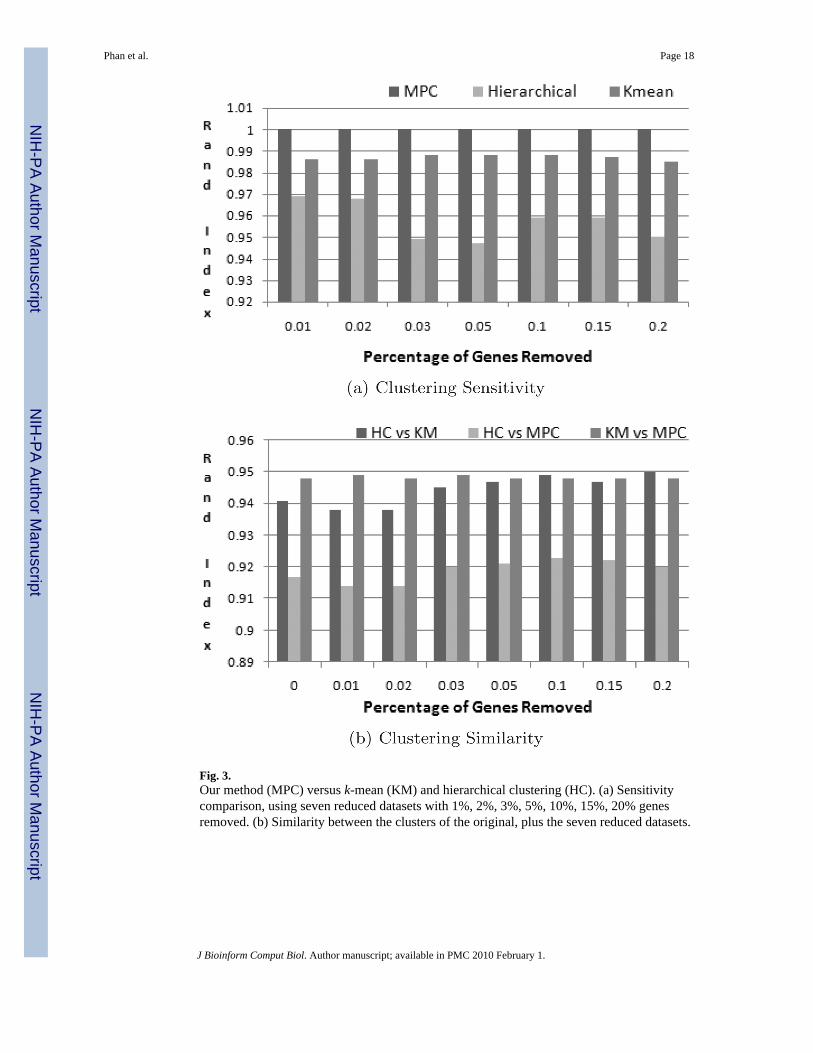
Fig. 3.Our method (MPC) versus k-mean (KM) and hierarchical clustering (HC). (a) Sensitivitycomparison, using seven reduced datasets with 1%, 2%, 3%, 5%, 10%, 15%, 20% genesremoved. (b) Similarity between the clusters of the original, plus the seven reduced datasets.
Phan et al. Page 18
J Bioinform Comput Biol. Author manuscript; available in PMC 2010 February 1.
NIH
-PA Author Manuscript
NIH
-PA Author Manuscript
NIH
-PA Author Manuscript
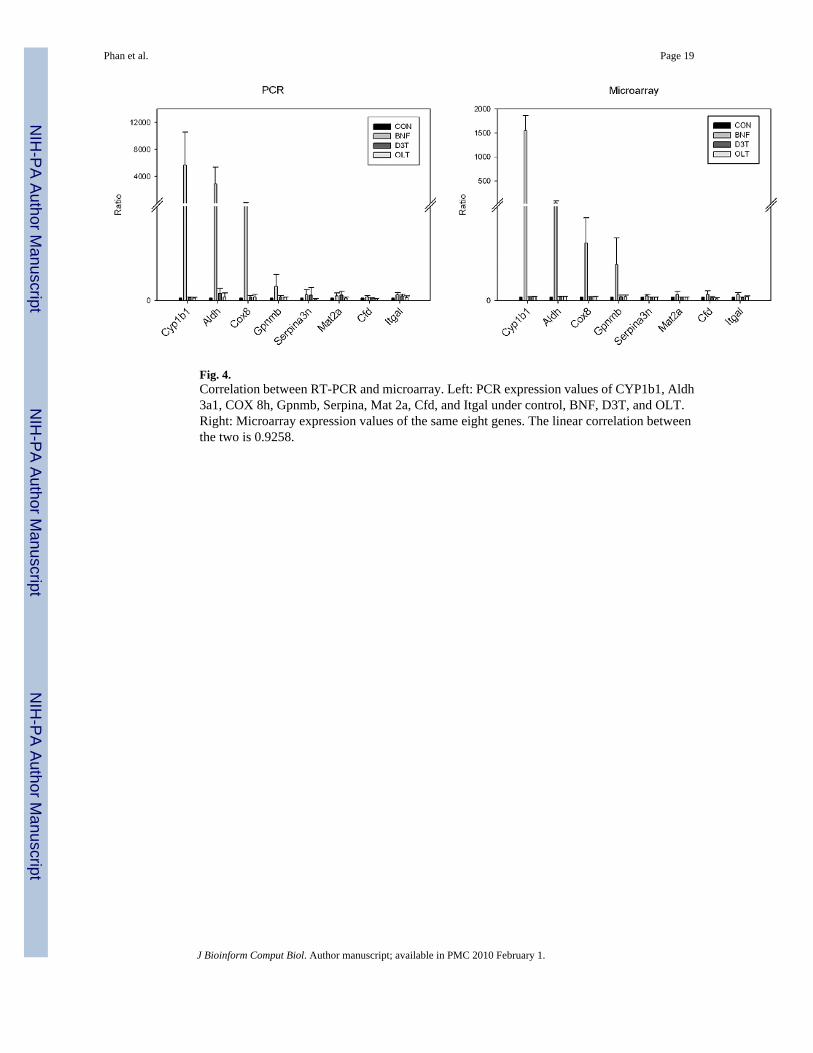
Fig. 4.Correlation between RT-PCR and microarray. Left: PCR expression values of CYP1b1, Aldh3a1, COX 8h, Gpnmb, Serpina, Mat 2a, Cfd, and Itgal under control, BNF, D3T, and OLT.Right: Microarray expression values of the same eight genes. The linear correlation betweenthe two is 0.9258.
Phan et al. Page 19
J Bioinform Comput Biol. Author manuscript; available in PMC 2010 February 1.
NIH
-PA Author Manuscript
NIH
-PA Author Manuscript
NIH
-PA Author Manuscript
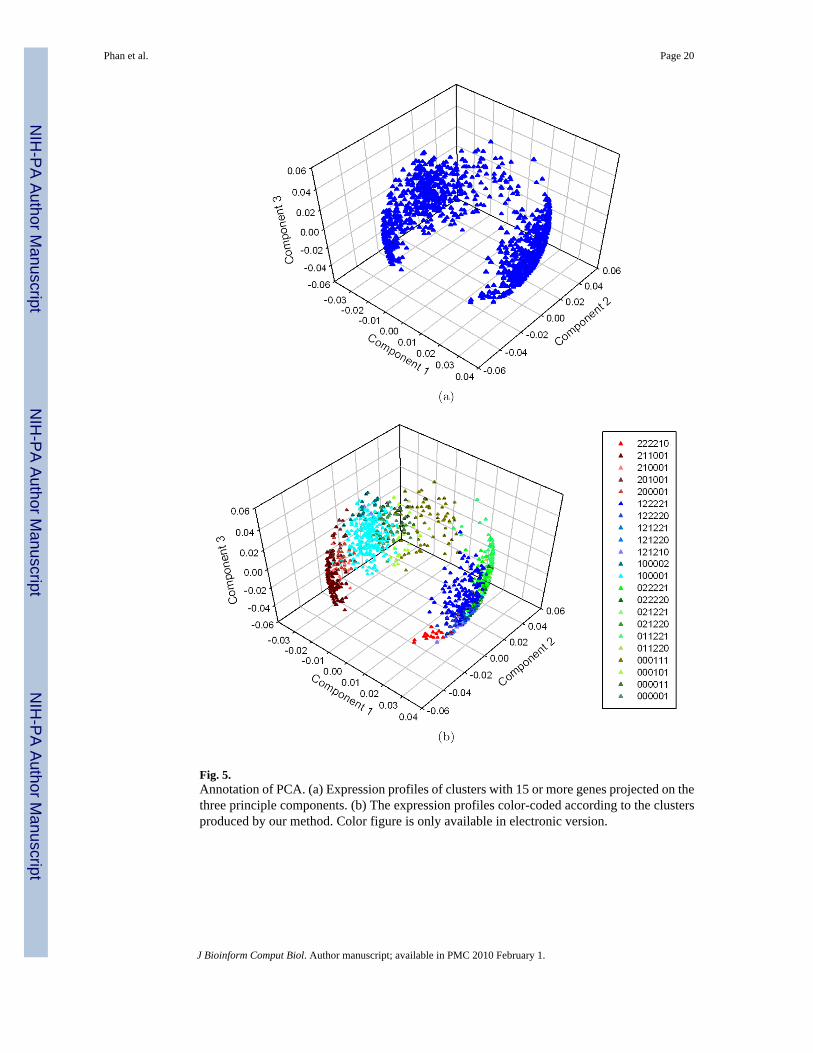
Fig. 5.Annotation of PCA. (a) Expression profiles of clusters with 15 or more genes projected on thethree principle components. (b) The expression profiles color-coded according to the clustersproduced by our method. Color figure is only available in electronic version.
Phan et al. Page 20
J Bioinform Comput Biol. Author manuscript; available in PMC 2010 February 1.
NIH
-PA Author Manuscript
NIH
-PA Author Manuscript
NIH
-PA Author Manuscript
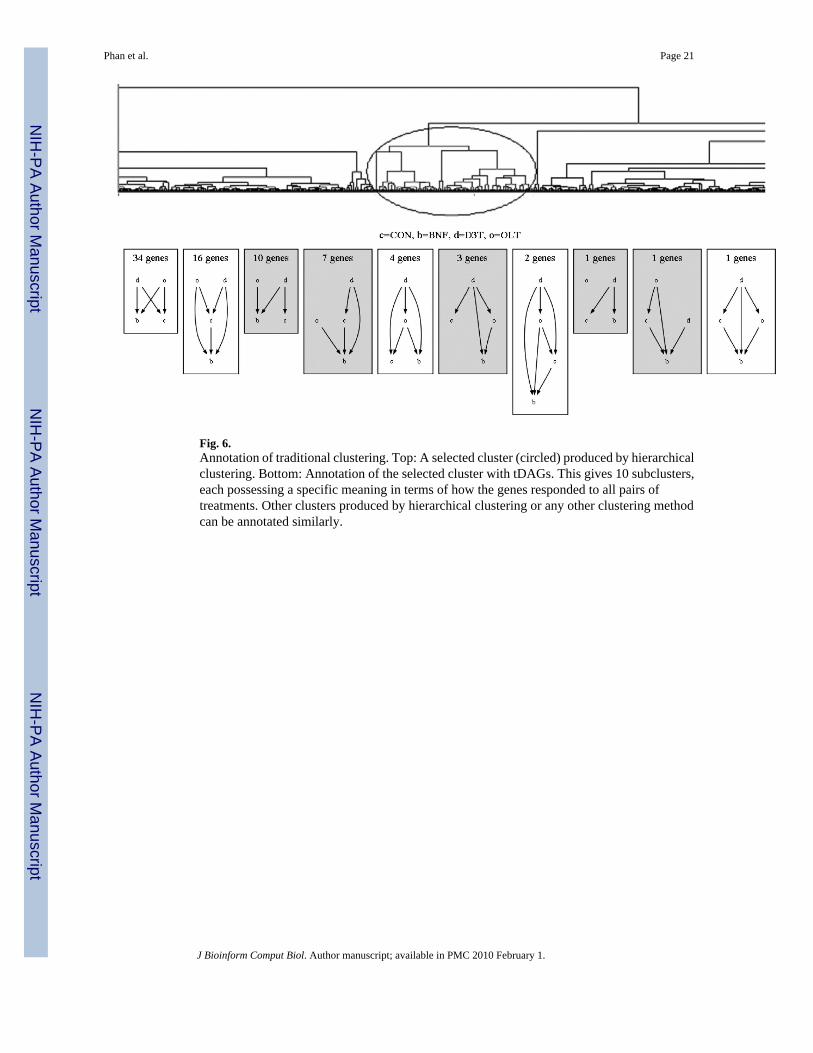
Fig. 6.Annotation of traditional clustering. Top: A selected cluster (circled) produced by hierarchicalclustering. Bottom: Annotation of the selected cluster with tDAGs. This gives 10 subclusters,each possessing a specific meaning in terms of how the genes responded to all pairs oftreatments. Other clusters produced by hierarchical clustering or any other clustering methodcan be annotated similarly.
Phan et al. Page 21
J Bioinform Comput Biol. Author manuscript; available in PMC 2010 February 1.
NIH
-PA Author Manuscript
NIH
-PA Author Manuscript
NIH
-PA Author Manuscript
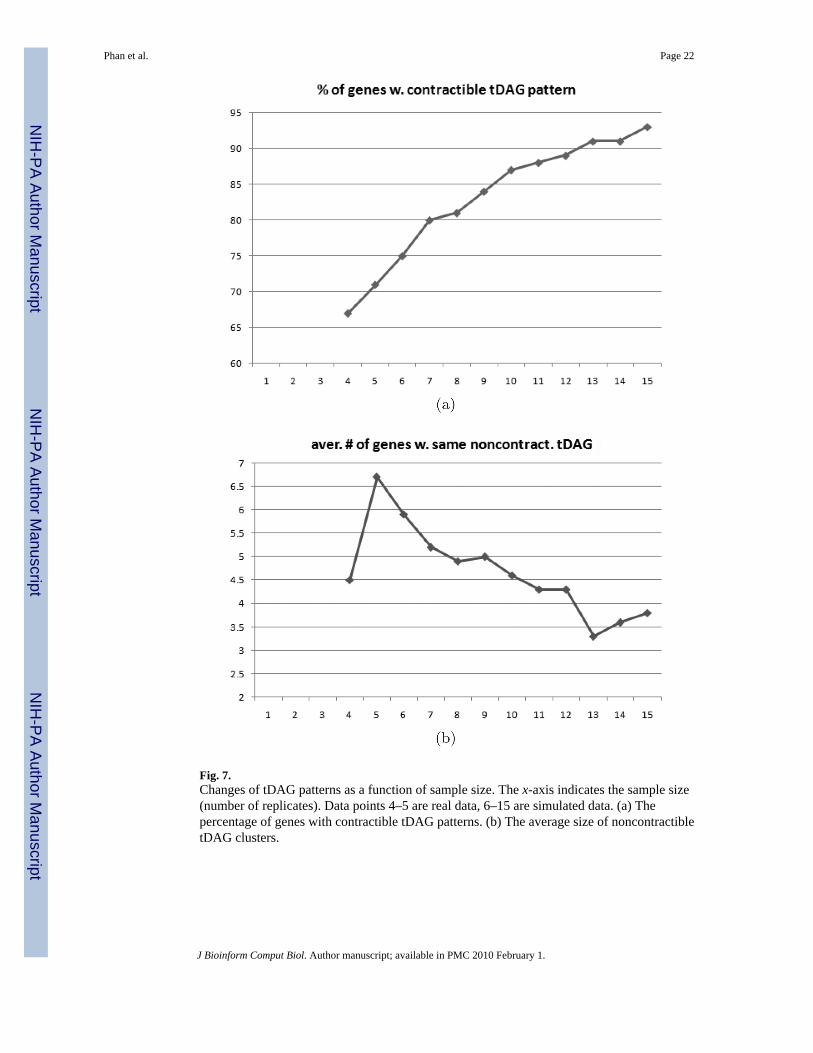
Fig. 7.Changes of tDAG patterns as a function of sample size. The x-axis indicates the sample size(number of replicates). Data points 4–5 are real data, 6–15 are simulated data. (a) Thepercentage of genes with contractible tDAG patterns. (b) The average size of noncontractibletDAG clusters.
Phan et al. Page 22
J Bioinform Comput Biol. Author manuscript; available in PMC 2010 February 1.
NIH
-PA Author Manuscript
NIH
-PA Author Manuscript
NIH
-PA Author Manuscript
Related Documents