Analyzing the extent of flooding impacts using a site specific analysis and user generated depth grids Analyzing Flood Damages in North Dakota Jesse Rozelle Risk Analyst/Regional GIS Coordinator FEMA Region VIII Minot, North Dakota – June 28 th , 2011 Photo courtesy of Pictometry

Welcome message from author
This document is posted to help you gain knowledge. Please leave a comment to let me know what you think about it! Share it to your friends and learn new things together.
Transcript

Analyzing the extent of flooding impacts using a site specific
analysis and user generated depth grids
Analyzing Flood Damages in
North Dakota
Jesse Rozelle
Risk Analyst/Regional GIS Coordinator
FEMA Region VIII
Minot, North Dakota – June 28th, 2011
Photo courtesy of Pictometry

Extensive Flooding in Minot, North Dakota – Rapid
Turnaround Damage Assessment Needed
Accomplished using the following:
•USGS High Water Mark Collections
•Pictometry Oblique Aerial Imagery
•New Light/ImageCAT Damage Assessment
Results:
Number of Structures Impacted
HAZUS Site Specific Derived Financial Impacts
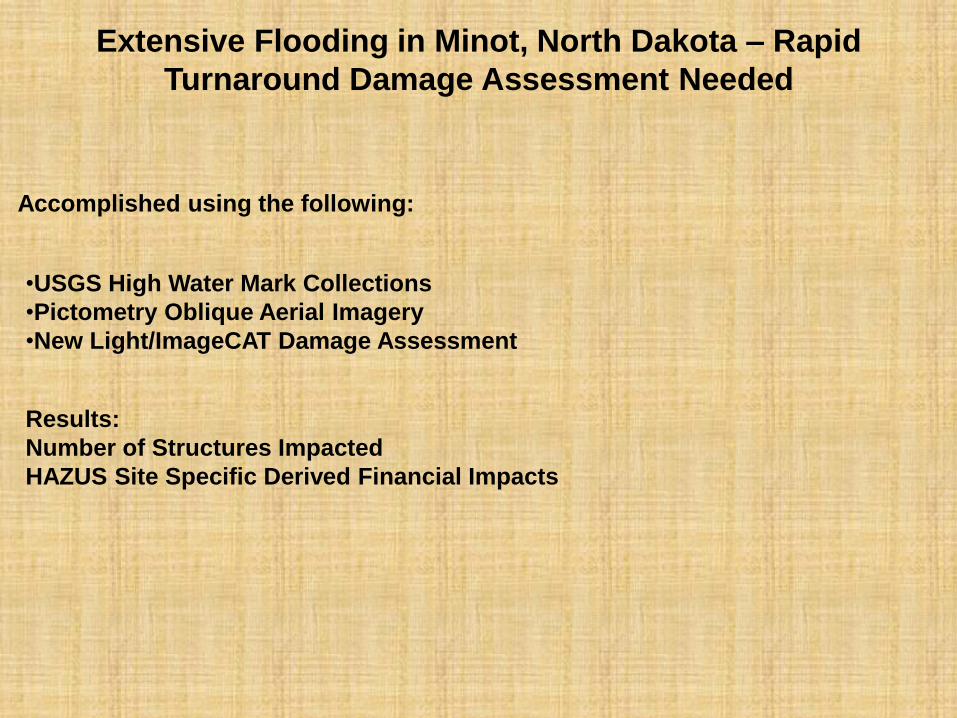
USGS High Water Mark
Collection
• Helped to calibrate H&H modeled outputs
used to determine depth at structure
• USGS/FEMA field crews visually verified
areas “protected”
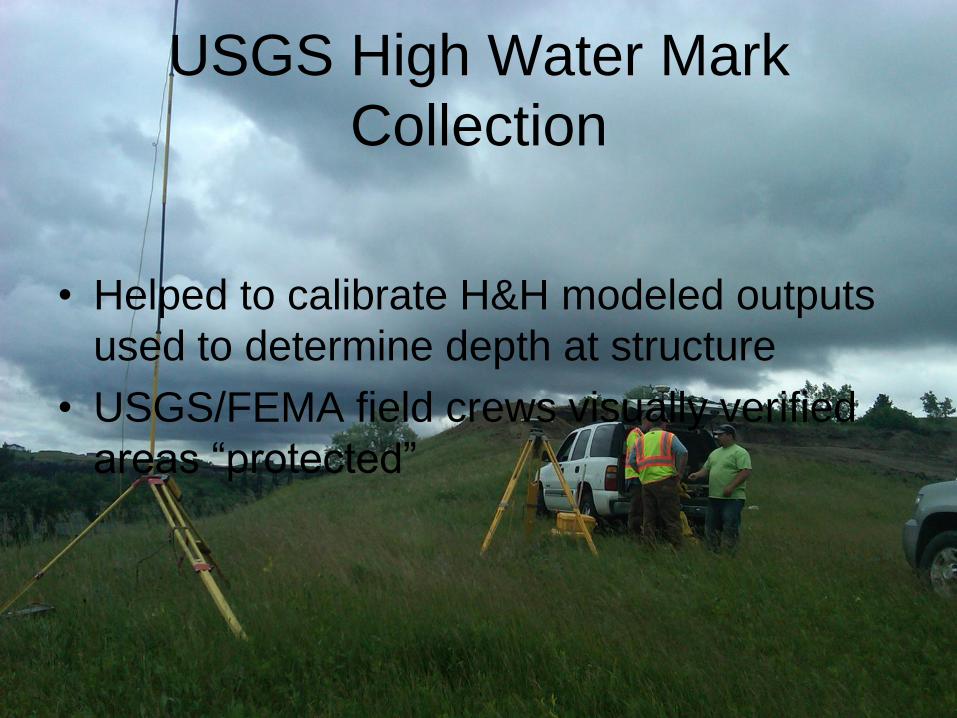
Pictometry Oblique Imagery
• Includes 5 angle oblique aerial imagery,
and Orthophoto
• Assisted in obtaining structure attributes
required for HAZUS financial losses

Satellite Imagery Copyright
GeoEye 2011 NextView License

Satellite Imagery Copyright
GeoEye 2011 NextView License

Satellite Imagery Copyright
GeoEye 2011 NextView License

Satellite Imagery Copyright
GeoEye 2011 NextView License


A Comparison: Site Specific vs. Aggregated Flood Loss
Modeling Approach
Case Study – Fargo, ND


Aggregated Flood Losses
Approach – Possible
Reasons for Overestimation
of Losses
Site Specific Loss Approach (8
structures affected)
Area Weighting Estimation – Assumes
Uniform distribution of Structures
Many homes are at higher elevations
than the street or surrounding areas

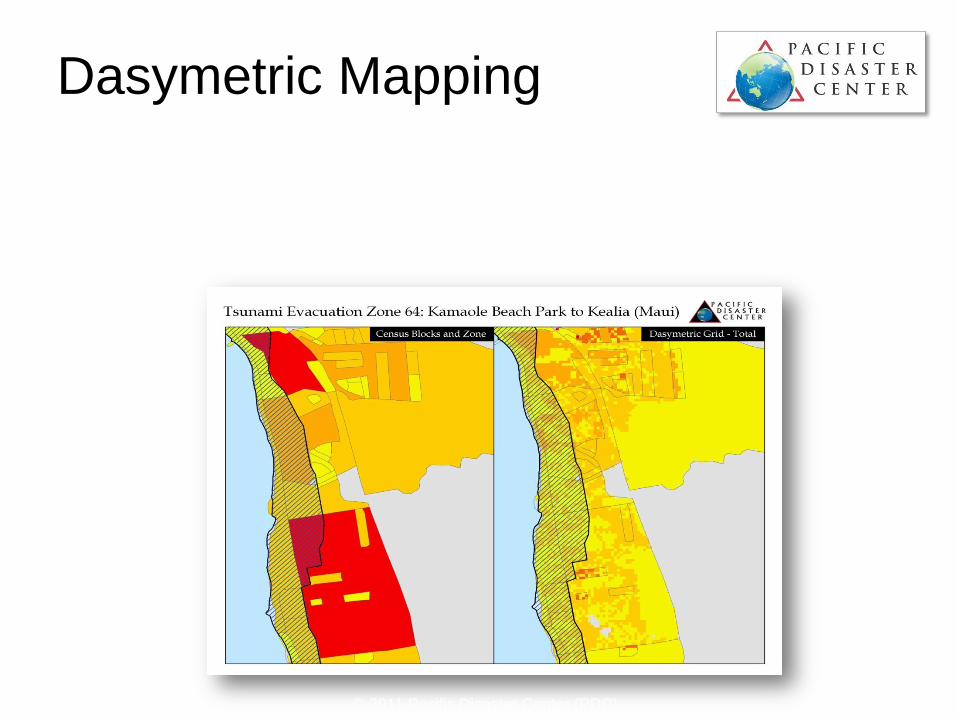
Dasymetric Mapping
• General Definition: Redistributes data from
one spatial unit to a new spatial geography
using an ancillary data source
• Components:
– Land Use/Land Cover Imagery
– Census Population Data
© 2011 Pacific Disaster Center (PDC)

Dasymetric Mapping
© 2011 Pacific Disaster Center (PDC)

» Population Distribution (Census Block)
Dasymetric Mapping
© 2011 Pacific Disaster Center (PDC)

• Population Distribution (Dasymetric)
Dasymetric Mapping
© 2011 Pacific Disaster Center (PDC)

Dasymetric Mapping
Census Block Dasymetric Distribution
© 2011 Pacific Disaster Center (PDC)

Dasymetric Mapping
Census Block Dasymetric Distribution
© 2011 Pacific Disaster Center (PDC)
Honolulu Honolulu
Dasymetric Mapping
Result: Dasymetric mapping allows for more accurate population mapping
in HAZUS and RiskMap, resulting in more accurate estimations of impacts
and losses related to population and the general building stock.
© 2011 Pacific Disaster Center (PDC)

Questions?
Related Documents