Analytical Reporting of Travel Forecasts Using Summit Nazrul Islam Office of Planning & Environment Federal Transit Administration

Analytical Reporting of Travel Forecasts Using Summit Nazrul Islam Office of Planning & Environment Federal Transit Administration.
Dec 13, 2015
Welcome message from author
This document is posted to help you gain knowledge. Please leave a comment to let me know what you think about it! Share it to your friends and learn new things together.
Transcript
Analytical Reporting of Travel Forecasts Using
Summit
Nazrul IslamOffice of Planning & Environment
Federal Transit Administration
12th TRB National Transportation Planning Application Conference 2May 2009
FTA Motivations for Summit
FTA interest in analytical reporting of forecasts FTA evaluation measures for New Starts Quality control Information for decision making Cases for projects
Summit – a tool for analytical reporting Other tools available Key is good reporting, not the reporting tool(s)

12th TRB National Transportation Planning Application Conference 3May 2009
Analytical Reporting
Information from travel forecasts Trip tables Impedance tables Volumes on facilities
Volumes routinely reported; tables less so Insights from trips tables & impedance tables
Relevant travel markets Sources and impacts of errors Causes and incidence of benefits
12th TRB National Transportation Planning Application Conference 4May 2009
Analytical Reporting
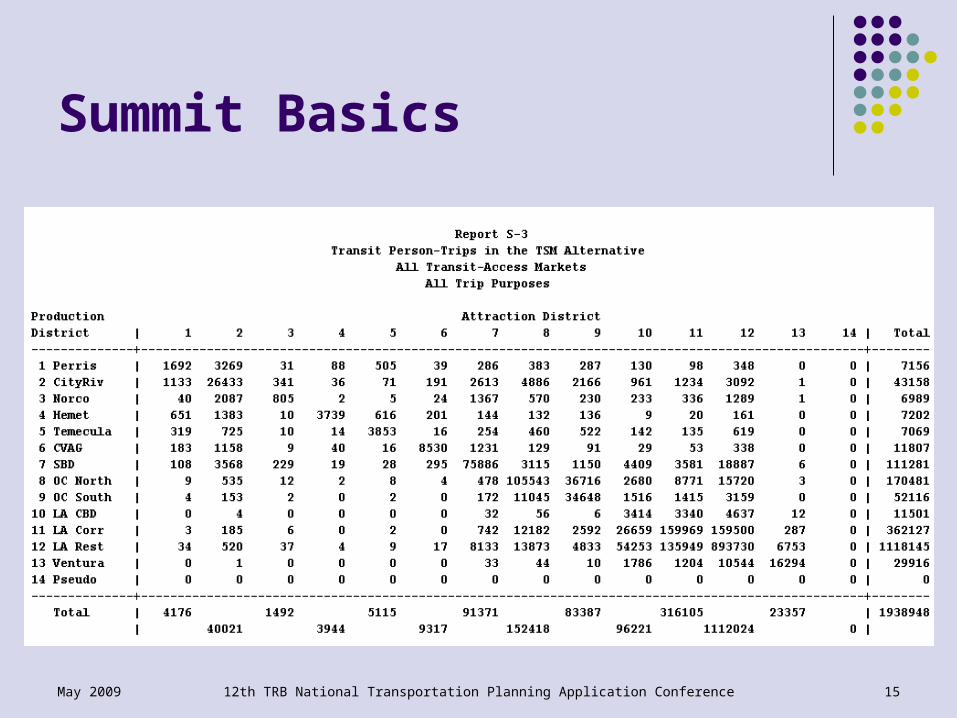
Trip tables District-to-district summaries District-to-district deltas and ratios Row-percents and column-percents

12th TRB National Transportation Planning Application Conference 5May 2009
Analytical Reporting
Urbanville
Summary Districts
N
5 miles
1 d1
d
“squeeze”
1
Z
from
1 Z
totable 8
Trip tables Summary districts Aggregation (“squeeze”)
report
12th TRB National Transportation Planning Application Conference 6May 2009
Analytical Reporting
Trip tables – reports and applications District-to-district totals, deltas, and ratios; e.g.:
Person-trip flows and person-trips flows by modeNew transit tripsMode sharesAverage auto-occupancies
Row-percents and column-percentsCalibration of trip-distribution modelsTravel markets to the CBD and other activity centers

12th TRB National Transportation Planning Application Conference 7May 2009
Analytical Reporting
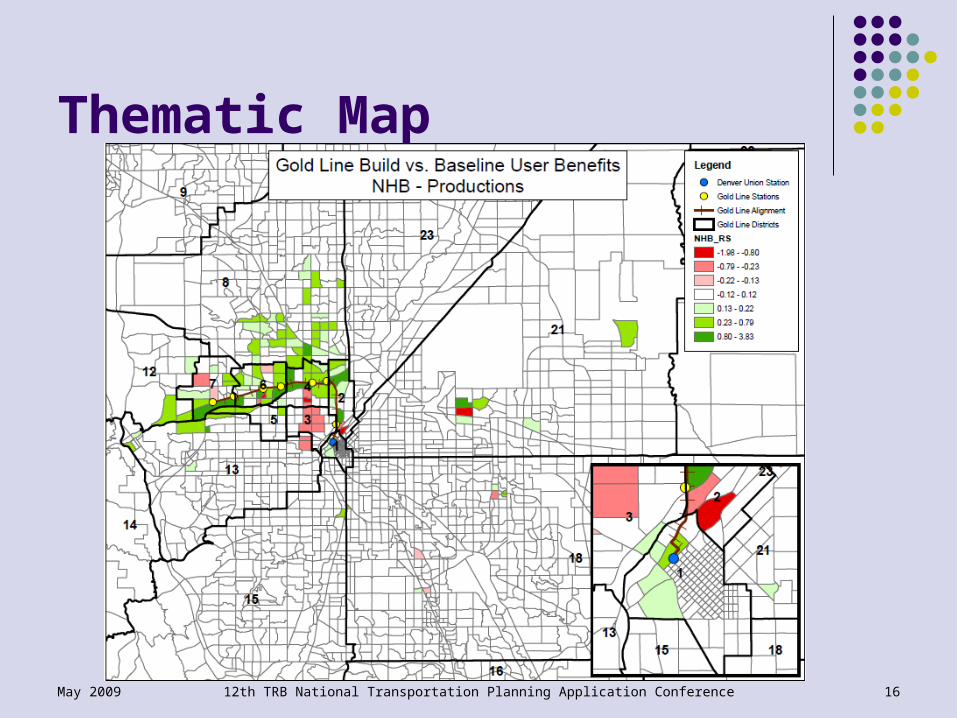
Impedance tables – a whole new ballgame Thematic maps Trip length frequency distributions Stratified tables

12th TRB National Transportation Planning Application Conference 8May 2009
Analytical Reporting Impedances in thematic maps
i to all Z; all Z to j Totals or deltas No information on #trips
1
Z
from
1 Z
to
Table 11
ΔIVT
5
16
`
GIS thematic mapping
12th TRB National Transportation Planning Application Conference 9May 2009
Analytical Reporting
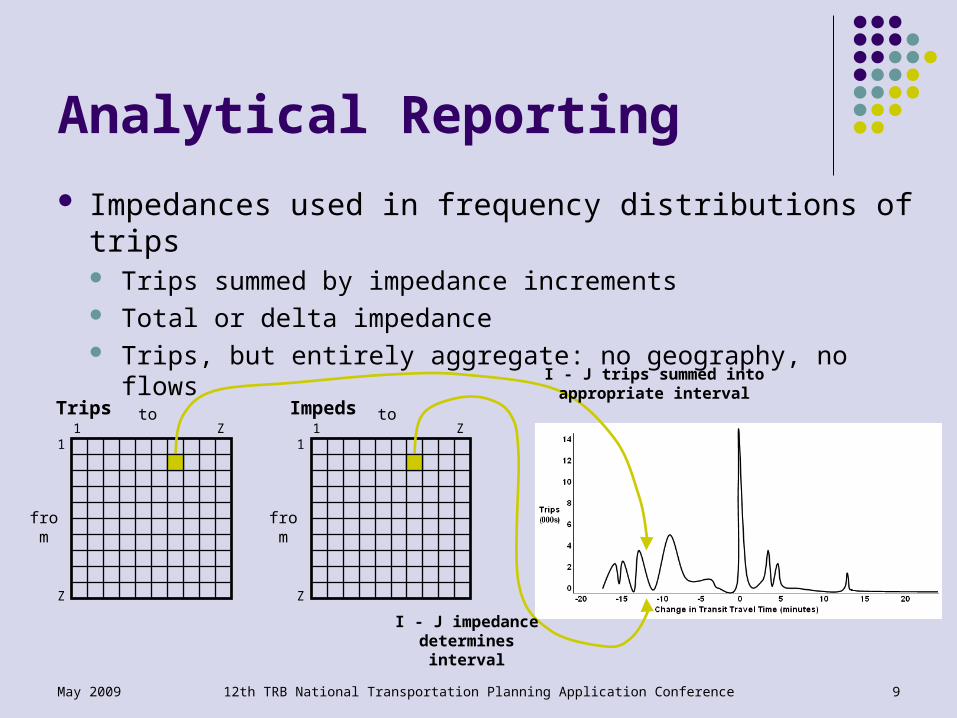
Impedances used in frequency distributions of trips Trips summed by impedance increments Total or delta impedance Trips, but entirely aggregate: no geography, no flows
from
1 Zto
1
Z
from
Trips1 Z
to
1
Z
Impeds
I - J impedance determines interval
I - J trips summed into appropriate interval
12th TRB National Transportation Planning Application Conference 10May 2009
Analytical Reporting
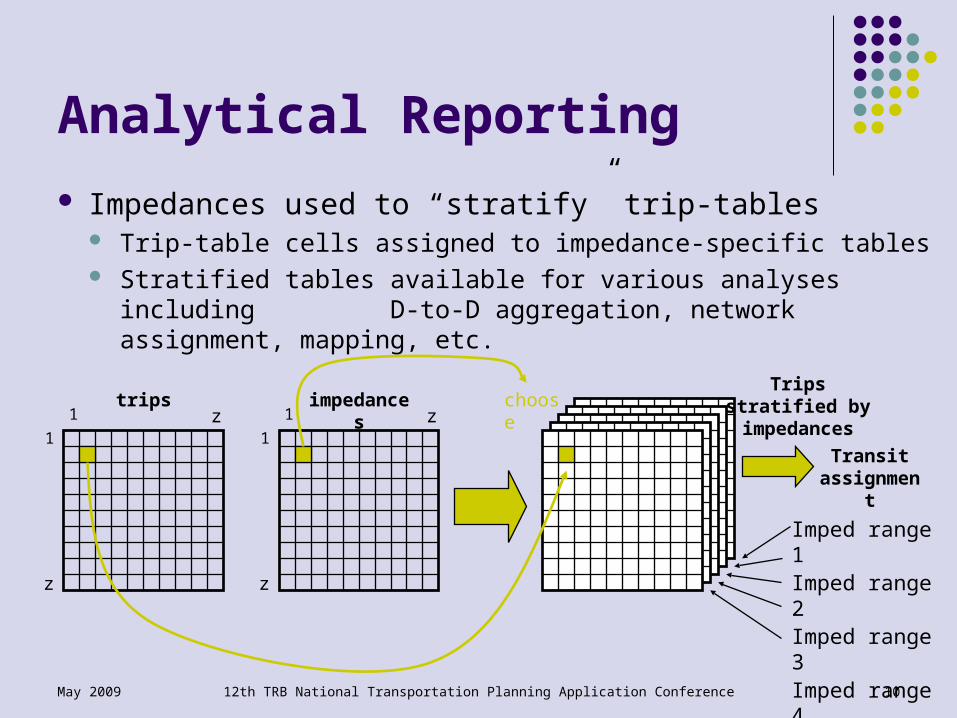
Impedances used to “stratify” trip-tables Trip-table cells assigned to impedance-specific tables Stratified tables available for various analyses including
D-to-D aggregation, network assignment, mapping, etc.
1 z1
z
1 z1
z
trips impedances
Imped range 1Imped range 2Imped range 3Imped range 4Imped range 5
chooseTrips stratified by impedances
Transit assignment

12th TRB National Transportation Planning Application Conference 11May 2009
Analytical Reporting
Impedance tables – summary Thematic maps (for totals and for deltas)
Impedances to/from individual zonesLots of detail but individual focus and nothing on trips
Trip length frequency distributions (for Σs and Δs)Useful summary of impedances and tripsNo geography
Stratified tables (largely for deltas)Lots of detail and opportunity for further analysisPowerful differentiation of trips by impedance ranges
12th TRB National Transportation Planning Application Conference 12May 2009
Summit Basics
Overview Two functions
Analytical reporting of forecasts Calculation and reporting of user benefits
Philosophy Embedded reporting step in model-application stream Summit computations no change to applications Less reporting effort more time for QC and insights
12th TRB National Transportation Planning Application Conference 13May 2009
Summit Basics
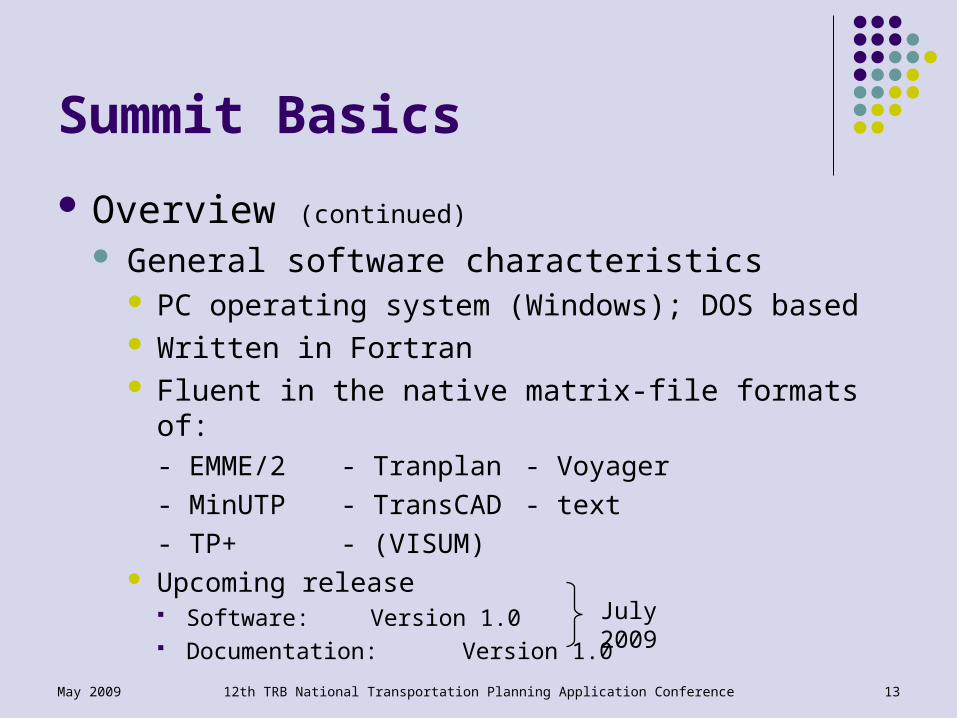
Overview (continued)
General software characteristics PC operating system (Windows); DOS based Written in Fortran Fluent in the native matrix-file formats of:
- EMME/2 - Tranplan - Voyager
- MinUTP - TransCAD - text
- TP+ - (VISUM) Upcoming release
Software: Version 1.0 Documentation: Version 1.0
July 2009
12th TRB National Transportation Planning Application Conference 14May 2009
Summit Basics
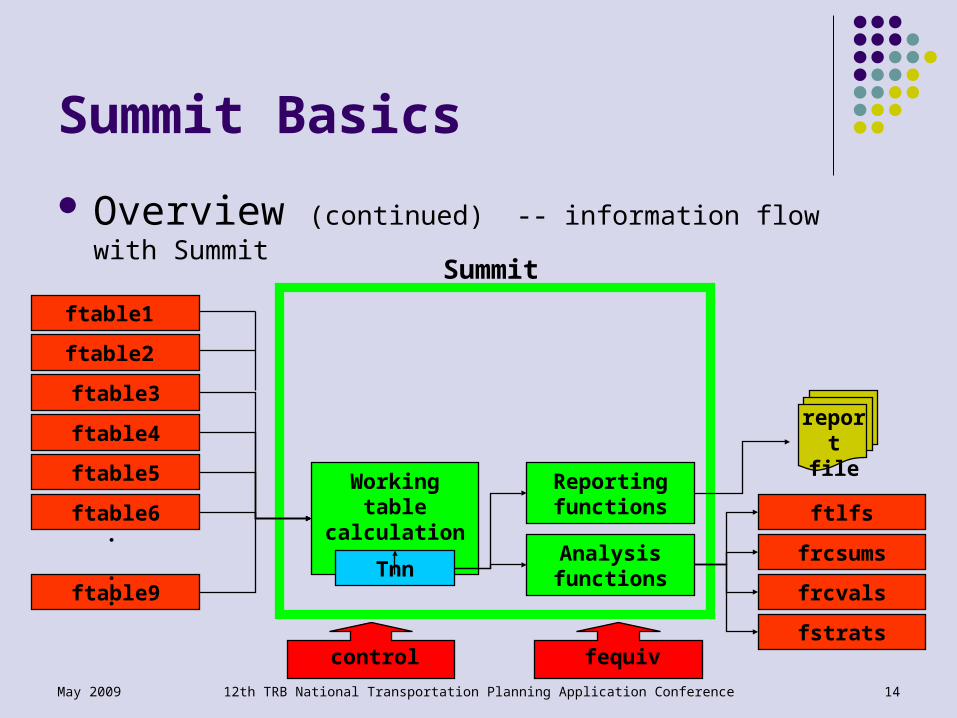
ftable1
ftable2
ftable3
ftable4
ftable5
ftable6
ftable9
Working table calculations
. . . Tnn
Reporting functions
Analysis functions
ftlfs
frcsums
frcvals
fstrats
Summit
control
report file
fequiv
Overview (continued) -- information flow with Summit
12th TRB National Transportation Planning Application Conference 15May 2009
Summit Basics
12th TRB National Transportation Planning Application Conference 16May 2009
Thematic Map

12th TRB National Transportation Planning Application Conference 17May 2009
Example Analyses of Forecasts
Highway congestion changes between Today and Future-Year
Negative impacts that are hiding behind positives
Benefits from the project/bus changes Travelers with significant benefits Unhappy travelers
12th TRB National Transportation Planning Application Conference 18May 2009
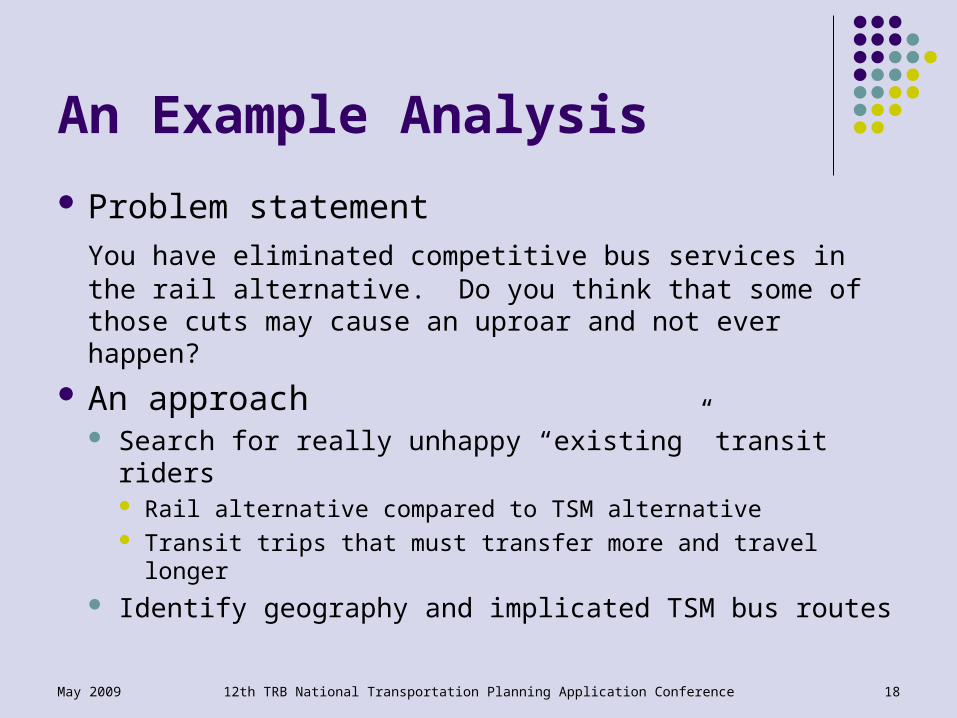
An Example Analysis
Problem statement
You have eliminated competitive bus services in the rail alternative. Do you think that some of those cuts may cause an uproar and not ever happen?
An approach Search for really unhappy “existing” transit riders
Rail alternative compared to TSM alternative Transit trips that must transfer more and travel longer
Identify geography and implicated TSM bus routes
12th TRB National Transportation Planning Application Conference 19May 2009
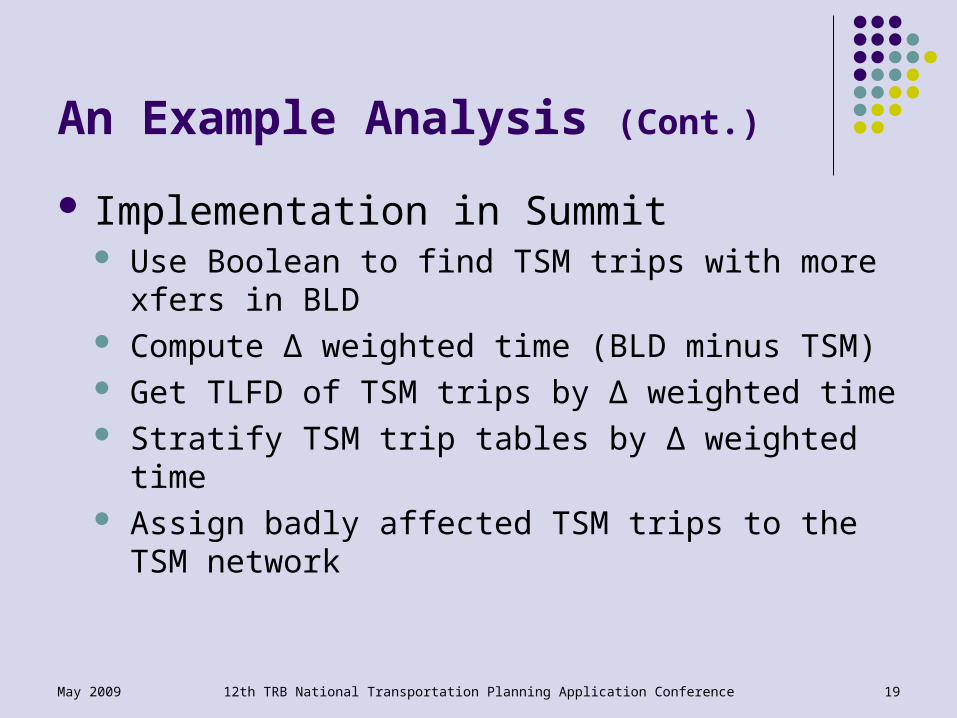
An Example Analysis (Cont.)
Implementation in Summit Use Boolean to find TSM trips with more xfers in BLD Compute Δ weighted time (BLD minus TSM) Get TLFD of TSM trips by Δ weighted time Stratify TSM trip tables by Δ weighted time Assign badly affected TSM trips to the TSM network

12th TRB National Transportation Planning Application Conference 20May 2009
An Example Analysis (Cont.)
12th TRB National Transportation Planning Application Conference 21May 2009
An Example Analysis (Cont.)
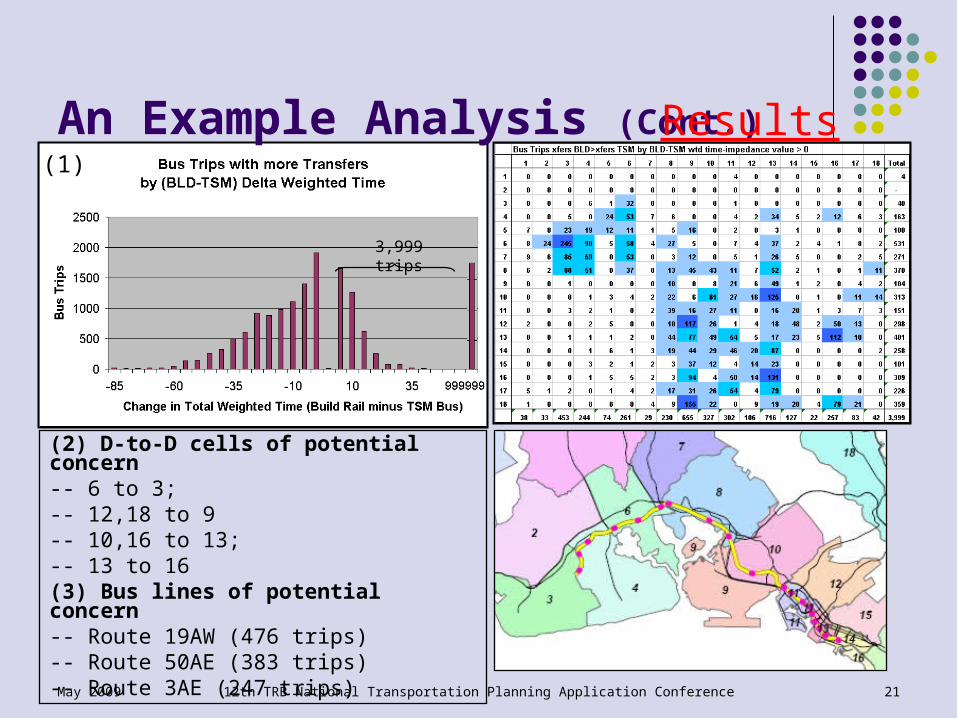
(2) D-to-D cells of potential concern-- 6 to 3; -- 12,18 to 9-- 10,16 to 13; -- 13 to 16(3) Bus lines of potential concern-- Route 19AW (476 trips)-- Route 50AE (383 trips)-- Route 3AE (247 trips)
Results(1)
3,999 trips
12th TRB National Transportation Planning Application Conference 22May 2009
Concluding Thoughts
Roles of travel forecasts Tradition: some grand totals but few insights Better: answers to real-world questions Best: information for decision-making
Analytical reporting of forecasts Quality control and quality assurance Insights into problems, markets, impacts, benefits Possible in any software setting Possible only through analytical thinking
12th TRB National Transportation Planning Application Conference 23May 2009
http://www.fta.dot.gov/planning/newstarts/planning_environment_9547.html
Thanks!
Related Documents