Analytical models of pre-stressed and reinforced glulam beams A competitive analysis of strengthened glulam beams Master of Science Thesis in the Master’s Programme Structural Engineering and Building Performance Design MARTIN PERSSON SEBASTIAN WOGELBERG Department of Civil and Environmental Engineering Division of Structural Engineering Steel and Timber Structures CHALMERS UNIVERSITY OF TECHNOLOGY Göteborg, Sweden 2011 Master’s Thesis 2011:52

Welcome message from author
This document is posted to help you gain knowledge. Please leave a comment to let me know what you think about it! Share it to your friends and learn new things together.
Transcript

Analytical models of pre-stressed and reinforced glulam beams
A competitive analysis of strengthened glulam beams
Master of Science Thesis in the Master’s Programme Structural Engineering and
Building Performance Design
MARTIN PERSSON SEBASTIAN WOGELBERG Department of Civil and Environmental Engineering Division of Structural Engineering
Steel and Timber Structures CHALMERS UNIVERSITY OF TECHNOLOGY Göteborg, Sweden 2011 Master’s Thesis 2011:52

MASTER’S THESIS 2011:52
Analytical models of pre-stressed and reinforced glulam
beams
A competitive analysis of strengthened glulam beams
Master of Science Thesis in the Master’s Programme Structural Engineering and
Building Performance Design
MARTIN PERSSON
SEBASTIAN WOGELBERG
Department of Civil and Environmental Engineering Division of Structural Engineering
Steel and Timber Structures
CHALMERS UNIVERSITY OF TECHNOLOGY
Göteborg, Sweden 2011


Analytical models of pre-stressed and reinforced glulam beams
A competitive analysis of strengthened glulam beams
Master of Science Thesis in the Master’s Programme Structural Engineering and
Building Performance Design
MARTIN PERSSON
SEBASTIAN WOGELBERG
© MARTIN PERSSON, SEBASTIAN WOGELBERG, 2011
Examensarbete/Institutionen för bygg- och miljöteknik, Chalmers tekniska högskola2011:52
Department of Civil and Environmental Engineering
Division of Structural Engineering
Steel and Timber Structures
Chalmers University of Technology
SE-412 96 Göteborg
Sweden
Telephone: + 46 (0)31-772 1000
Cover: Stress-Strain distribution for a pre-stressed beam in plastic phase, see Figure 4.8. Chalmers Repro Service / Department of Civil and Environmental Engineering Göteborg, Sweden 2011


CHALMERS Civil and Environmental Engineering, Master’s Thesis 2011:52 I
Analytical models of pre-stressed and reinforced glulam beams
A competitive analysis of strengthened glulam beams
Master of Science Thesis in the Master’s Programme Structural Engineering and
Building Performance Design
MARTIN PERSSON
SEBASTIAN WOGELBERG
Department of Civil and Environmental Engineering Division of Structural Engineering Steel and Timber Structures Chalmers University of Technology
ABSTRACT
Timber has been an important material in construction for a long period of time. Engineered timber products have enhanced their properties significantly and introducing strengthening with stiffer and stronger materials has also showed positive effects. New methods of reinforcement with improved performance from the strengthened material are now possible, since materials used for strengthening have been developed and become cheaper. This master thesis focuses on finding the effects of pre-stressing and thereby hopefully enhancing these properties further.
To investigate the different aspects of pre-stressed glulam beams a model was created. The model was created to handle unreinforced, reinforced and pre-stressed glulam beams. It was made in such way that it could handle both the linear elastic phase as well as the plastic phase and compensate for any plasticisation in the reinforcement.
To verify the design model using pre-stressing calculations, the model was compared with the test results acquired from two pre-stressed beams that were loaded until failure. The result from the two beams calculated by the created model coincided with the results from their tested counterpart quite well. But with just two test beams to compare, it is not statistically determined that the model is correct. The calculated beams reached higher ultimate values than their tested counterparts.
One of the advantages of adding reinforcement to a beam is the ability to reduce the cross-section, with a maintained flexural capacity in the beam. This was examined in the thesis and it was shown that the magnitude of the pre-stressing force was greatly influential on the strength enhancement.
An economic analysis was made to compare unreinforced glulam beams with pre-stressed beams. The comparison showed that long beams (18-25 m) with 0.5-1.5 per cent reinforcement were the most profitable.
It is obvious that the beams that were pre-stressed gain an increased flexural resistance. However, if it is more economical depends on the type, geometry and load on the beams. It is however, almost always, an economic gain for the entire construction if pre-stressed glulam beams are used.
Keywords: Pre-stressed Glulam, FRP reinforcement, Steel Reinforcement, Flexural Resistance, Modelling Glulam beams, Economical Glulam Construction

CHALMERS, Civil and Environmental Engineering, Master’s Thesis 2011:52 II
Analytisk modellering av förspända och förstärkta limträbalkar
En granskning av användningsområden för förstärkta limträbalkar
Examensarbete inom Mastersprogrammet Structural Engineering and Building
Performance Design
MARTIN PERSSON
SEBASTIAN WOGELBERG
Institutionen för bygg- och miljöteknik
Avdelningen för Konstruktionsteknik
Stål- och Träbyggnad
Chalmers tekniska högskola
SAMMANFATTNING
Trä har varit ett viktigt byggnadsmaterial under en väldigt lång tid. Skapade träprodukter, som limträ, har skapats för att förbättra de bärande förmågorna som trä inne har såväl som att minska förekomsten av defekter i materialet. Eftersom materialen som används vid förstärkningar har både blivit bättre och billigare öppnar det nya möjligheter inom förstärkningsmöjligheterna för limträ. Det här examensarbetet har fokuserat på förspänningens effekter på ett förstärkt limträ tvärsnitt i en förhoppning om att kunna ytterligare öka limträbalkars bärförmåga.
För att kunna undersöka förspänningens olika fördelar skapades en modell i matlab. Med hjälp av modellen kan man studera oförstärkta, förstärkta och förspända limträtvärsnitt och jämföra dem med varandra. Modellen hanterar både den elastiska och den plastiska fasen för limträ och tar hänsyn till om förstärkningsmaterial kan flyta.
För att verifiera de förspända beräkningarna så jämfördes modellens resultat med resultaten från två förspända limträbalkar som tryckt belastats till brott på Chalmers Tekniska Högskola. Resultaten från de två testade balkarna och resultaten från modellen stämde väl överens, men med bara två balkar kan det inte fastställas med statistisk säkerhet att modell är korrekt.
En av fördelarna med att förstärka tvärsnitt är möjligen att kunna minska på dimensionerna med bibehålla den önskade kapaciteten i balken. Det visade sig att med en pålagd förspänningskraft kunde det skäras ner markant in armeringsmängden vilket gjorde det intressant att göra en ekonomisk analys huruvida besparingar kan göras med förspända förstärkningsmaterial.
En ekonomisk analys gjordes för att jämföra oförstärkta med förspända limträbalkar. Analysen visade att långa balkar (18-25m) med 0.5-1,5 % armering är de mest lönsamma.
Det har visats att förspända förstärkningsmaterial i ett limträ tvärsnitt ger en stor ökning av balkens maximala böjmotstånd. Dock beror det på balkens typ, dimensioner och laster om en förspänd balk är billigare att framställa. Det finns dock nästan alltid en kostnads besparing att hämta om hela byggnaden, med en lägre konstruktionshöjd, räknas in.
Nyckelord: Förspänt limträ, kolfiber förstärkning, stål förstärkning, böjmotstånd, Modellering av förstärkta limträbalkar, Ekonomiska limträbalkar

CHALMERS Civil and Environmental Engineering, Master’s Thesis 2011:52 III
Contents
ABSTRACT I
SAMMANFATTNING II
CONTENTS III
PREFACE V
NOTATIONS VI
ABBREVIATIONS VII
1 INTRODUCTION 1
1.1 Background 3
1.2 Purpose 3
1.3 Objectives and methodology 3
1.4 Limitations 4
2 MATERIALS 5
2.1 Glulam 5
2.1.1 Glulam manufacturing 6
2.1.2 Mechanical properties 7
2.2 Reinforcement materials 10
2.2.1 Steel 10
2.2.2 Fibre Reinforced Polymers (FRP) 11
2.2.3 Adhesives 13
3 REINFORCEMENT METHODS 14
3.1 Unreinforced beam 14
3.2 Reinforced beam 14
3.2.1 Strengthening of glulam 15
3.3 Pre-stressed beam 16
3.3.1 Pre-stressed strengthened glulam 17
4 THE MODEL 18
4.1 Unreinforced beam 18
4.1.1 Elastic phase 18
4.1.2 Plastic phase 19
4.2 Reinforced beam 20
4.2.1 Elastic phase 20
4.2.2 Plastic phase 23
4.3 Pre-stressed beam 25
4.3.1 Elastic phase 25
4.3.2 Plastic phase 27
CHALMERS, Civil and Environmental Engineering, Master’s Thesis 2011:52 IV
4.4 Yielding of the reinforcement 28
4.4.1 Elastic phase 29
4.4.2 Plastic phase 29
4.5 Shear failure 30
5 VERIFICATION OF THE MODEL 31
5.1 The four point bending test 31
5.2 Adjustments to the model 32
5.3 Results 33
6 HEIGHT REDUCTION WITH MAINTAINED FLEXURAL RESISTANCE (ULS) 36
6.1 Results 37
6.2 Increased pre-stressing force 38
6.3 Reduced glulam quality 40
7 ECONOMICAL COMPARISON 43
7.1 Comparison of various beam lengths 44
7.1.1 Single beam comparison 44
7.1.2 Project comparison 46
7.2 Comparison of various beam widths 47
7.2.1 Single beam comparison 47
7.2.2 Project comparison 49
7.3 Comparison with various grades on the pre-stressing force 50
7.4 Single beam comparison 50
7.5 Project comparison 51
8 CONCLUSION AND RECOMMENDATION FOR FURTHER RESEARCH 53
8.1 Conclusion 53
8.2 Recommendation for further research 54
9 REFERENCE 55
10 APPENDICES 1
10.1 Appendix A: The MathCAD for the model 1
10.2 Appendix B: The Matlab code for the model 39
10.3 Appendix C: Calculation sheet – economy 67
10.4 Appendix D: Economical diagrams 72

CHALMERS Civil and Environmental Engineering, Master’s Thesis 2011:52 V
Preface
This master’s thesis was carried out at the Division of structural Engineering, department of Civil and Environmental Engineering at Chalmers University of Technology, Sweden, during the spring of 2011.
We first want to thank our examiner and supervisor Professor Robert Kliger and our industrial supervisor Rolf Jonsson for the support and guidance throughout this whole process. We also want to thank Associate Professor Mohammad Al-Emrani for his extensive help with the large equations as well as for his great general guidance through this project.
We also would like to thank Professor Björn Engström and Associate Professor Mario Plos for their invaluable help with the pre-stressing equations and its definitions.
Further, we would like to thank Research student Alann André for sharing his model with us and for his estimation of glulam strength parameters. We also extend our thanks to Erik Gulbrandsen at Tenroc Technologies for his help with the economic aspects of our study and to our opponents and roommates, Daniel Näkne and Joakim Kvist, for their suggestive second opinions.
Finally, we want to thank Neil Townson for his excellent and greatly appreciated help with the English language in this report.
Gothenburg, July 2011
Martin Persson & Sebastian Wogelberg

CHALMERS, Civil and Environmental Engineering, Master’s Thesis 2011:52 VI
Notations
Roman upper case letters
A Cross-section area [mm2] AGL Cross-section area for the glulam [mm2] Aeq Equivalent glulam cross-section area [mm2] ARF Cross-section area for the reinforcement [mm2] ARF,c Cross-section area for the compressive reinforcement [mm2] ARF,t Cross-section area for the tensile reinforcement [mm2] E Young’s modulus [MPa] EGL Young’s modulus for glulam [MPa] ERF Young’s modulus for reinforcement [MPa] F Force [N] FGL,c Force from compressive zone for the glulam [N] FGL,c1 Force from compressive rectangular zone for the glulam [N] FGL,c2 Force from compressive triangular zone for the glulam [N] FGL,t Force from tensile zone for the glulam [N] FRF,c Force from compressive zone for the reinforcement [N] FRF,t Force from tensile zone for the reinforcement [N] I Moment of inertia [mm4] L Span length [m] M Moment [Nm] N Pre-stressing force when in Navier’s formula [N] Nbreak Tensile force required for yielding [N] P Pre-stressing Force [N] V Shear force [N]
Roman lower case letters
b Width of cross-section [mm]
e Lever arm from the pre-stressed reinforcement [mm] fGL,t Tensile yield limit for glulam [MPa] fRF,t Tensile yield limit for reinforcement [MPa] fyd Reinforcement yield strength [MPa] h Height of cross-section [mm] L Length of the beam [mm]

CHALMERS Civil and Environmental Engineering, Master’s Thesis 2011:52 VII
x Height of the plasticising [mm] xpl Height of neutral axis in plastic phase [mm] z Navier’s lever arm from centre of gravity [mm] zNA Height of the neutral axis [mm] Zc Length from compressive reinforcement to edge [mm] Zt Length from tensile reinforcement to edge [mm]
Greek lower case letters
α Equivalent cross-section factor [-] ε Strain [-] εc Maximum compressive strain [-] εt Maximum tensile strain [-] εc,e Maximum compressive elastic strain in glulam [-] εt,e Maximum tensile elastic strain in glulam [-] εRF,c Tensile strain in the reinforcement [-] εRF,t Compressive strain in the reinforcement [-] εp0∞ The strain due to the pre-stressing force [-] ∆εp The strain due to loading, same as εRF,t. [-] φt Creep factor [-] σ Stress [MPa] τ Shear stress [MPa] τmax Maximum shear stress [MPa]
Abbreviations
Glulam Glued Laminated Lumber FRP Fibre Reinforced Polymer CFRP Carbon Fibre Reinforced Polymer EC5 Euro Code, Chapter 5 (EN 1995-1-1:2004(E)) SLS Service Limit State ULS Ultimate Limit State

CHALMERS, Civil and Environmental Engineering, Master’s Thesis 2011:52 VIII

CHALMERS, Civil and Environmental Engineering, Master’s Thesis 2011:52 1
1 INTRODUCTION
Timber has been an important material in construction for a long period of time. A reason is that it is a natural material and it has been available in the surroundings of man since the dawn of civilization. Timber has however during the last centuries been replaced, in larger and more demanding structures, with “newer” and better materials, such as concrete and steel. The reason for this is that concrete and steel have been engineered to be applicable in specific structural situations, and therefore does not exhibit the same disadvantages as timber.
Glulam has inherent defects and weaknesses since it is a naturally grown material. This results in large variations in most of its properties. Steel and concrete, the two other main construction materials, are man-made. This gives them a smaller likelihood of inherent defects and weaknesses compared to timber. There has however been increased interest in timber during the last decades because of its favourable properties. Compared to concrete and steel, timber is a cheap, light-weight and an unlimited material. These favourable properties have led to research and development of new, engineered timber products, which aim to minimize variations and improve the properties compared to natural timber. One of these engineered wooden products is glued laminated timber, or glulam.
Glulam is an engineered wooden product which consists of several lamellae of building timber glued together under pressure. A positive effect of this manufacturing method is that the likelihood of defects is reduced, compared to standard building timber. This is because of the use of many smaller and independent parts, thereby increasing the strength and decreasing the spread of strength characteristics between beams, Figure 1.1.
Figure 1.1 Strength properties of timber and glulam. f is the strength and n is the
number of specimens. Notice the higher average strength fm, higher
characteristic strength fk (0.05 per centile) and the smaller spread of
strength for glulam.
Another positive effect of manufacturing glulam is the possibility to create different types of cross-sections and shapes, thereby tailor-making them for different applications and structural systems. Today, glulam is produced as curved beams, single and double tapered beams, pitched cambered beams, regular prismatic beams with or without pre-camber and different types of cantilever beams, Figure 1.2.

CHALMERS, Civil and Environmental Engineering, Master’s Thesis 2011:52 2
Except from beams glulam is also used in columns, a variety of frames, arches, trusses and composite systems. The application of glulam is thus vast and is increasing continuously.
a
b
c
d
e
f
Figure 1.2 Different types of glulam beams: (a) regular prismatic beam; (b)
pitched cambered beam; (c) single tapered beam; (d) double tapered
beam; (e) curved beam; (f) cantilever beam on two supports.
Glulam beams are suitable for long spans since they possess a high strength to weight ratio. The prismatic beam is preferred for shorter spans while the double tapered beam is preferred for wider spans, for both material usage and economic reasons. This is an effective way of engineering glulam since the depth is larger at midspan; hence the strength is higher, where the load bearing capacity is needed to be at its highest. By constructing the beam with this shape the material costs can be reduced without having to sacrifice load bearing capacity in the process.
Even though glulam has an excellent strength and stiffness to weight ratio the governing limitation is usually deflection, which is governed by the stiffness properties of the beam. To get acceptable deflections for a long span the designer has the possibility to increase the height of the beams to get acceptable deflections. This solution increases the material usage, which is uneconomical and also non-sustainable. Another problem with timber is its failure mode, which has a brittle behaviour in tension, which is a common failure mode for beams with long spans (L>12h). This is an unfavourable property since the rupture of a brittle material happens more quickly and harder to predict. The increasing load bearing capacity demand of the structures, due to changes in design models and increasing imposed loads, is also a major problem that has to be dealt with.
In an effort to solve these problems, without increasing the cross-section and thereby increasing the total height of the structure/building, research has been done to find ways to enhance the stiffness and strength properties of glulam beams by means of strengthened glulam beams. This concept is not new. In the early 1960’s A. Sliker, F.F. Wandgaard and E.J. Biblis proposed different ways of strengthening timber. Since then, the research has continued but the reinforcement of glulam has never become a commercial success. Some of the reasons were that the materials used as reinforcement where either too expensive or lacked a sufficient strength. It was also usual that the production method was not practically or economically viable.

CHALMERS, Civil and Environmental Engineering, Master’s Thesis 2011:52 3
The advancements made in materials, both reinforcement materials and adhesives, has now enabled a commercial competitiveness of reinforced timber products. Many of the present reinforcement methods have been created to strengthen existing structures, which has led to these methods mainly consists of reinforcing material being attached to the timber’s surface. This can be done either on the sides of, or beneath the beam. These methods can increase both the shear and flexural capacity, depending on where the reinforcement is placed. There are also methods including drilled glued-in rods to strengthen the properties perpendicular to the grain and increasing the shear capacity.
When producing new strengthened glulam beams the reinforcement material is no longer restricted to the timber’s surface. Recent methods that incorporate the reinforcement either horizontally between the timber lamellae or vertically in grooves have been proposed and both have proven successful in increasing the flexural capacity.
1.1 Background
Engineered timber products have enhanced these properties significantly and introducing strengthening with stiffer and stronger materials has also showed positive effects. It has been possible to create new methods of strengthening glulam, since the strengthening materials have been improved becoming both stronger and cheaper. This opens up the possibility of more advanced strengthening solutions, which previously were too expensive or lacked materials with the correct properties.
The improvement of timber is needed for it to be a competitive material, since the demands on structures have increased significantly over recent years. Today, the focus has shifted towards finding the beneficial effects when the strengthening material is subjected to pre-stressing. Some tests and research has been done, but so far no general method for either the calculation of or the production of pre-stressed glulam beams has been established.
1.2 Purpose
For timber to be a more competitive material the deviations and weaknesses needs to be reduced. This master thesis focuses on finding the effects of pre-stressing the strengthening material and thereby hopefully enhancing the beam’s properties further. When the effects have been evaluated the competitiveness of pre-stressed glulam beams compared to un-strengthened beams will examined. This investigation will show which pre-stressed beams are most suitable to replace un-strengthened beams. The investigation will consider both the performance and the economic aspect to give a more complete picture of the pre-stressed beams competitiveness.
1.3 Objectives and methodology
The aim of this master thesis is to examine the performance and benefits of different strengthened glulam beams compared to un-strengthened glulam beams and which parameters govern that performance. The results should be able to be implemented in an economic analysis, to find out the competitiveness for the different strengthened beams, with the focus on pre-stressed beams.

CHALMERS, Civil and Environmental Engineering, Master’s Thesis 2011:52 4
This will be achieved by:
• Developing a method to calculate performance in terms of bending strength and deflection of pre-stressed glulam beams.
• With this method, together with existing design models for un-strengthened and strengthened beams, make a parametric study to determine which parameters that govern the load bearing capacity of the beams.
• Determine which types of beam have advantage in different applications.
• Determine which, and for what purpose, the strengthened beams can be competitive as to un-strengthened beams.
In order to complete these objectives, the following methods will be used:
• An analytical model for pre-stressed glulam beams will be established.
• A mathematical program will be created in MathCAD for the different types of beams.
• A calculation programme will be created in Matlab to perform the iterative calculations required for comparing multiple beams.
• The material and production costs determine the competitiveness of strengthened glulam beams will be included.
1.4 Limitations
Limitations that will be used in the performed study are listed below:
• The study will be adapted to a simply-supported beam.
• The study will only take creep in to consideration using modification factors.
• In SLS calculations, only deflection will be the governing criteria (based on EC5).
• The failure mode of adhesives will not be considered.
• Shear reinforcement will not be considered.
• Relaxation of the reinforcement will not be considered.
• Durability and environmental effects will only be considered using kmod from EC5.
• The reinforcement will not be allowed to yield before the plastic phase for the glulam has been reached.

CHALMERS, Civil and Environmental Engineering, Master’s Thesis 2011:52 5
2 MATERIALS
2.1 Glulam
Glulam, or glued laminated timber, is an engineered wood product, which means that it has been developed and improved compared to regular sawn timber. It consists of individual strength-graded timber lamellae of regular structural timber, which are glued together under pressure and controlled conditions. This method is an effective way of utilising, and optimising, timber’s natural properties. The information in this chapter is mainly taken from Svenskt Limträ AB (2007).
Glulam consist of at least two timber lamellae that are joined together with an adhesive. If there are fewer than four lamellae it is usually referred to as glued structural timber. The thickness of the laminations needs to be between 6 and 45 mm. The grains are orientated in the longitudinal direction of the structural member it represents. With this system of laminated timber it is possible to obtain larger cross-section than with solid timber. By the usage of several lamellae within one structural member, the defects of the solid timber become distributed more evenly along the structural member. This gives the glulam an increase in the overall strength classification when compared to solid timber.
The lamellae are glued together to the desired depth of the beam and the lamellae are finger-jointed to achieve the desired length. Due to this production method it is possible to create structural glulam members of large cross-section, long length and in any shape. As an example, it is easy to create a pre-camber in the beams to reduce its final deflection when it becomes loaded. The size limitation comes from the manufacturing equipment’s size and the possibilities to transport large members. To get around this, when considering the length of the beam, long beams are assembled together from smaller parts by the means of finger joints at the construction site. A good quality finger joint will have inherent design strength compared to the rest of the member, thus not reducing the long beams performance. This is possible because these types of joints create a large contact surface which gives the adhesive a large area to act on.
The glulam-method was developed at the end of the ninetieth century in Germany, and in 1906 a patent was issued in the same country, which is considered as the real starting point of this technology. The technology reached Scandinavia via Norway in the beginning of the twentieth century and some of the first structures in Sweden were erected in the 1920s. Ever since the 1960s the production has increased continuously in Scandinavia, nowadays the total production is over 200 000 m3, and about half of this is exported.
Glulam has many advantages and properties which make it a competitive material in the building sector.
• Excellent strength to weight ratio: This property enables glulam to be used when long spans are required. Glulam has a higher strength and stiffness than structural timber and compared to steel it is stronger when consideration to own weight is taken into account.
• Environmental: Glulam does not affect the environment significantly during its lifetime and when its purpose has been fulfilled it can either be reused in other structures or used for energy production. Timber is a natural material

CHALMERS, Civil and Environmental Engineering, Master’s Thesis 2011:52 6
and thereby an unlimited material. As long as the regrowth is at least the same as the harvested amount, it is considered to be a sustainable material.
• Low weight: This makes the structure or components cheaper to produce and transport and lighter buildings require lower foundation costs.
• Flexible production: Glulam can during production, be formed in to many shapes and sizes. Regular beams, tapered beams, curved beams, long beams, deep beams etc.
• Appearance: Timber and therefore glulam is considered an aesthetically pleasing material and compared to concrete and steel it is perceived as a warm material.
• Easy erection: Glulam is easily and quickly erected because of its low weight and simple joints, consisting of bolts, nails and screws. Another advantage is that the structure can take its full load directly after erection.
• Durability: Glulam has a high tolerance towards chemically aggressive environments.
• Fire resistance: Glulam has a high fire resistance because charcoal is produced at the surface and insulates the rest of the beam. It will not melt, spall, flake, buckle or explode and it burns at a steady rate and is therefore predictable.
• Good building physics properties: Timber has good insulating properties which reduce cold bridges.
2.1.1 Glulam manufacturing
The manufacturing process of glulam starts with the harvesting of the trees and cutting the logs in to sawn timber, which is then dried and strength graded. The timber type used in the Scandinavian countries is often Norway spruce, but if the timber is planned to be subjected to an environment with high moisture content over a long period of time, pressure treated pine is used. For the glue line between the lamellae to be optimal in strength, the moisture content should be between 8 and 15 per cent, and the difference between the two connecting lamellae no more than 5 per cent. The target moisture content within the laminate is 12 per cent.
The sawn timber is finger jointed and then cut to the desired length. After the adhesive in the finger joints has hardened, the laminates are planed and then immediately glued and placed on top of each other, until the desired depth is reached. The depths of the beams are restricted by the production machines to about two meters, but theoretically there is no restriction. The cross-section can be either homogeneous, which means that all the lamellae have the same strength, or combined, which uses a weaker timber in the inner lamellae and a stronger timber in the outer lamellae where the stresses are higher. The latter method is an economical and effective way to optimize the usage of timber.
The lamellae, which are glued and placed to the desired cross-section, are then placed in the gluing bench where the pressure of about 1 MPa is applied. This has to be done before the adhesive hardens. After the pressure is applied, the laminates are bent to the desired camber or curve, or kept straight. The adhesive then hardens under controlled moisture and temperature conditions. When the adhesive has hardened the pressure is removed and the glulam is ready for the finishing work, which consists of cutting of arises, planing and preparing holes for passages and connectors. Then, the

CHALMERS, Civil and Environmental Engineering, Master’s Thesis 2011:52 7
glulam component is visually controlled, marked, wrapped and prepared for transportation.
The production process needs to be precise and the product must be able to withstand the stresses that it is exposed to. This placed high demands on the manufacturers. To be able to guarantee an even and high product quality the manufacturers need to have an extensive and well-documented quality control. Lamellae, finger joints and adhesives must be tested regularly to check that they are up to standard.
Glulam production is a low energy-demanding process and waste in the form of, for example, sawdust is being reused in the process when drying the timber or raising the temperature during the glue hardening. The making of glulam would be an environmentally friendly process if it were not for the adhesives, which are made of non-renewable raw materials. The amount of adhesive compared to timber is very low, about one per cent, which still makes glulam a very environmentally friendly construction material.
2.1.2 Mechanical properties
Glulam hold several distinct benefits compared to other structural materials. It has one of the highest strength to weight ratio which makes it an excellent material for structural members with a long span. It is highly fire resistant, aesthetically appealing and has a good insulating property. As all wooden materials glulam has an anisotropic behaviour, which makes wooden materials strong when a force is applied parallel to its grains but much weaker if the force is aimed perpendicular to them. Also its flexural resistance is still low compared to other structural materials with the same dimensions, Dolan (1997).
2.1.2.1 Failure modes
There are numerous ways a structural member can fail. The failure modes and strength characteristics depend on many things such as material parameters, material composition, load variation and duration, moisture content, craftsmanship and cross-sectional appearance to mention but a few. All possible failure modes are important to consider when the members are being designed.
Which failure mode becomes the governing one, often depends on the different defects that the glulam beam might have inherent. This will not however be considered in this report. The material for this section is taken from Jacob and Garzon (2007).
Tensile failure
The tensile failure, usually appearing at the bottom of a beam, is the most common failure mode for un-reinforced glulam beams loaded in bending, due to the fact that the tensile resistance of glulam is lower than its compressive counterpart. The tensile failure is a brittle one and there is no, unlike for compressive failure, plastic deformation possible. This fact also further enhances the chance of a tensile failure since there is no increase in the possible maximum possible strain through plastic deformation.

CHALMERS, Civil and Environmental Engineering, Master’s Thesis 2011:52 8
A tensile failure is said to occur when any point in the beam reaches the maximum tensile capacity.
There are two main types of tensile failure. Firstly, while still being in the linear elastic phase, the beam fails at the tension side. This happens primarily to un-strengthened beams where the lower tensile capacity becomes the governing factor for the failure.
Then there is the tensile failure while the compressive zone has entered the plastic phase. This happens mainly to beams that have been strengthened. Due to the plastic behaviour in the compressive zone the beam behaves somewhat more ductile. The failure in itself is still brittle since it is a tensile failure.
Compressive failure
For this failure mode to become governing one, is requires a large amount of over-strengthening on the tensile side because of glulam’s plastic deformation capabilities in compression. It is assumed that a compressive failure has occurred when any point in the beam has reached the compressive plastic stress capacity of the beam. The compressive failure is, due to the plastic deformation, a ductile failure.
Shear failure
Short beams or beams that have been over-strengthened on both the tensile and compressive side will instead experience a shear failure. Shear failure is induced when the shear force from the load exceeds the beam shear capacity. A shear failure occurs at the supports of the beam and very quickly propagates in the direction of the fibres, effectively splitting the beam in two. The shear failure is governed to a high extent by the size of the cross-section.
Buckling - Lateral-torsional buckling
Buckling is a failure mode which is caused by an axial compression of a structural component. The force does not have to be a purely axial compression force, it could be bending where a part of the cross-section is subjected to compression stress and the other to tension or both bending and pure axial compression force. The stresses cause a stability problem which results in a lateral deformation of the component. The amount of compression stress needed to cause buckling is lower than the ultimate stress capacity of the component. If the component is subjected to flexure a twisting deformation will occur together with the lateral deformation, this is called lateral-torsional buckling.
2.1.2.2 Stress/strain – Creep and stress relaxation
There are different types of deformation, the instantaneous are divided into elastic and plastic deformations, the long term are considered as either creep or stress relaxation. The difference between the elastic and plastic deformation is that the elastic is reversible whereas the plastic is irreversible. This means that the elastic deformation does not have a permanent effect on the component/structure and it will disappear when the load is removed. The plastic deformation will have a permanent effect on

CHALMERS, Civil and Environmental Engineering, Master’s Thesis 2011:52 9
the component/structure even after the load is removed. Creep and stress relaxation are two different ways to describe the phenomenon that occurs when a stress is imposed on a structural member for a long period of time (Burström, 2007).
Creep
Figure 2.1 A five variable creep curve. The deformation is normally greater in the
beginning and reduces with time.
The deformation increases when a member is permanently loaded. The definition of creep is the part of the deformation that increases with time if a load is imposed for over a long period of time, which makes the strain increase further over that specific period of time. The creeps deformation is normally greater in the beginning and later it reduces with time, see Figure 2.1, when the load is kept constant. Creep also has a reversible and an irreversible effect. The reversible effect doesn’t disappear instantaneously when the stress is withdrawn; it reduces with time similar to the
increase of strain. The creep effect can be described with the creep factor φ, which generally can be calculated using the following equation
�� � ����� ��� �!"#$ % "# #$!� #&'"(#$) ��� �!"#$ % (2.1)
This factor is very useful because the creep deformation can be calculated when the elastic deformation is known (Burström, 2007)
Stress relaxation
The definition of stress relaxation is that when the strain level is kept constant, the stress level in the material will reduce with time Burström (2007). This phenomenon is important to consider with pre-stressed construction components because the pre-stressing force will decrease with time, which leads to a reduced positive effect from the pre-stressing method.

CHALMERS, Civil and Environmental Engineering, Master’s Thesis 2011:52 10
2.2 Reinforcement materials
The material chosen for the strengthening has to have superior mechanical properties compared to the base material. As it also should have a much higher Young’s modulus and, assuming perfect bond between the glulam then the strengthening material, therefore carries more stress then the glulam at equal strain. This implies that the strengthening material needs to have a higher yield limit then the base material to be able to take care of the additional stress it is exposed to without yielding.
2.2.1 Steel
Steel is a widely used material in the building sector. It is used both as a strengthening material, for example in concrete, and individually in structural components such as beams, columns, frames and suspension cables to mention but a few. Steel has proven to be a very useful material with many positive properties, for example high strength to weight ratio, bending resistance and ductility. Steel has some disadvantages, for example it is prone to chemical corrosion and has poor fire resistance. The material for this section is mainly taken from Owens (1992).
A big advantage of steel is its versatility. It can be manufactured in different strengths, material properties, shapes and product forms. Steel can be produced with yield limits from about 250 to about 2000 MPa, for common structural applications, and product forms spanning from thin plates/sheets to large beams. This versatility also makes steel an economically sound material since it can be tailored to any given situation.
Steel is today one of the most used materials for strengthening purposes. Due to its strength and ductile behaviour it is used in most concrete structures to strengthen its rather poor tensile cracking limit (Engström, 2010A).
2.2.1.1 Mechanical properties
Steel is normally a ductile material, which is an advantage in construction components since failure can be predicted because of large deformations before the member collapses. It also inhabits good fracture toughness and it behaves as an elastic material, with a high elastic modulus, until the yield limit is reached. After the yield limit is reached it can withstand large plastic deformations, due to its ductile behaviour. However steel can break in a brittle failure mode if the structural component has been exposed to fatigue, where cyclically variable stresses cause defects and cracks.
Steel can be considered to be an isotropic material, i.e it has the same properties in all directions, as opposed to timber. Thereby steel has about the same strength in tension as in compression. The shear strength however, is somewhat lower.
The steel used for strengthening is usually hot rolled steel with a high tensile strength, since it is the tensile properties that predominantly need to be strengthened in the base material. The hot rolling process increases the steels’ strength and at the same time keeps large portions of the original ductility, which are favourable effects for reinforcing steel (Engström, 2010A).
Steel that is used for pre-stressed members is instead cold-worked steel, which is a very high strength steel. This procedure comes with some drawbacks. The steel gets a reduced plastic zone and becomes more vulnerable to corrosion and high temperatures

CHALMERS, Civil and Environmental Engineering, Master’s Thesis 2011:52 11
(Engström, 2010A). The higher yield limit acquired from cold-worked steel is needed to reduce the effects of relaxation in the steel after it has been pre-stressed.
Figure 2.2 The difference between pre-stressing and reinforcing steel (Engström,
2010A))
2.2.2 Fibre Reinforced Polymers (FRP)
Fibre reinforced polymers, further referred to as FRPs, are engineered materials where strengthened fibres are placed in a resin matrix to create a material with extraordinary properties. The FRPs were most commonly used in the aerospace and military applications, but an increased choice in raw materials, which is better, cheaper and with simpler manufacturing methods have enabled FRPs to be competitive in more areas. FRP is today already used on structures like bridges, mainly to strengthen weakening structural parts. But there is a lot of research going on in to finding new applications for FRP in structural design. The material for this section is mainly taken from Peters (1998).
2.2.2.1 FRP manufacturing
Structural composites like FRPs are a mixture of two or more components. One of them being a long (compared to the diameter) and stiff fibre and the other an adhesive, resin or matrix, between the fibres. The fibres are generally stronger and stiffer than the matrices. The fibres also show anisotropic behaviour, which means that they have different properties in different directions.
In the composite the fibres and matrices will keep their individual properties and thereby directly influence the properties of the final product. The composites are designed to acquire the properties demanded for the given usage. The fibres can be oriented in different directions in different lamellae to achieve an isotropic behaviour of the composite. The composites can also be tailored to specific properties, for example temperature-resistance and electrical conductivity, by a correct choice of fibres and matrices.

CHALMERS, Civil and Environmental Engineering, Master’s Thesis 2011:52 12
The production process itself varies depending on the final product. There is a general production method which is the same for all composites. The difference is in how each step of the process is performed for different composites.
The first step of the manufacturing process is wetting (or mixing) of the fibres with the resins, which are in a liquid state. Thereafter the structure/design of the composites is built up, both in micro- (fibre orientation) and macrostructure (for example shaping of a reinforcement bar). The third step is compaction of the mix to decrease the voids between fibres and thereby decrease the amount of defects. The final step is curing or hardening of the composite.
To ensure the quality and properties of the composites a three-level testing method is applied. The method consists of testing the raw materials before production, testing the composite during the process and testing of the final product.
2.2.2.2 Mechanical properties
The mechanical properties of FRPs are determined by the raw materials in the composite and the structure of them and thereby general properties are hard to distinguish. However, all FRPs show high strength and stiffness-to-weight ratio. There are several fibres and resins with different properties to choose from which affect the final product in different ways. Some commonly used fibres are fibreglass, graphite/carbon fibres and aramids. While the fibres’ function is to carry the load the matrices’ main functions are to keep the fibre in place, transfer the loads, protect the fibres and carry inter-laminar shear. Some commonly used matrices/resins are polyester and vinyl esters and epoxy resins. The mechanical properties of these fibres and resins are briefly stated below.
2.2.2.3 Matrices
Polyester is the most commonly used matrix in combination with glass fibres. Vinyl ester is a related plastic with higher and better mechanical properties then polyester. Epoxy is the unquestionable strongest matrix material. It is commonly used together with carbon fibres or aramid fibres to create materials with extremely high strength (Jacob and Garzon, 2007).
2.2.2.4 Fibres
Glass fibre is made by creating long fibres from melted glass. It exists in a large variety and is electrically insulating. It is cheap to produce, which makes it a well-used material. It has a relatively low Young’s modulus, which makes it less interesting as a strengthening material (Jacob and Garzon, 2007).
FRP made with carbon fibre in combination with either epoxy or vinyl ester resins creates one of the strongest FRPs there is. It has a high Young’s modulus and generally has an equal compressive and tensile strength. It also has a high resistance to fatigue. It is however sensitive to impact and has a sudden and brittle failure. It is very conductive material and can create galvanic cells when it comes in to contact with metals (Jacob and Garzon, 2007).
Aramid fibres are in a FRP matrix better known as Kevlar. Kevlar is just a product name that DuPont have for their products which contain aramid fibres. Being an

CHALMERS, Civil and Environmental Engineering, Master’s Thesis 2011:52 13
organic polymer it has a distinct golden colour and compared to carbon fibre has a very high impact resistance. It is also very resistant to heat and chemicals. It has a somewhat lower Young’s modulus and strength properties than carbon fibre and it deteriorates in sunlight, which makes is less desirable for beam strengthening purposes (Jacob and Garzon, 2007).
2.2.3 Adhesives
Adhesives have an important part in both glulam and strengthened glulam products. They are used both between the lamellae in glulam and between the strengthening material and glulam. The adhesives used for these purposes have high demands on them in strength, stiffness and how they are affected by temperature and moisture changes. Further demands are put on adhesives used in strengthened beams, since they need to have good bond strength to two different materials.
The idea of strengthening is to introduce a material with higher stiffness and thereby make it receive higher stress at a given strain. It is imperative that the adhesives used can transfer the stress between the two components. The ability to do so requires high strength (shear strength in this application) and stiffness. It also has to be able to be deformed and elongated without failing, since large deformations can be expected before either the timber or the reinforcement fails. These two properties, stiffness and elongation, are however generally opposites as can be seen in Figure 2.3. The solution of this problem requires a good design and selection of the adhesive.
Figure 2.3 Relation between stiffness and elongation for some commonly used
adhesives

CHALMERS, Civil and Environmental Engineering, Master’s Thesis 2011:52 14
3 REINFORCEMENT METHODS
There are several different ways a beam can be strengthened. In this thesis the glulam beam will be strengthened with rectangular plates where spaces have been sawn out in advance, see Figure 4.3. The strengthening material can be chosen to be either steel or FRP. The glulam beam can be un-strengthened, reinforced or pre-stressed. In this chapter these methods will be briefly demonstrated. This will be done by having a homogenous glulam beam subjected to a tensile force until failure occurs. This way of presenting these strengthening methods have been acquired from Engström (2010A). There will be a summary of the work done so far on each method included at the end of each sub-chapter.
3.1 Unreinforced beam
A plain glulam beam, seen in Figure 3.1, subjected to a tensile force will be able to resist a tensile force N equal to its tensile capacity. If more force is applied the beam will break in a tensile failure. The failure load can be calculated through (3.1).
*+,-./ � ��,01201 (3.1)
Figure 3.1 A glulam member subjected to a tensile force N (Engström, 2010A).
3.2 Reinforced beam
A glulam beam that has been symmetrically reinforced will behave differently from a plain glulam beam. The reinforcement increases the overall resistance by making the beam stiffer, since a material with a higher Young’s modulus will carry more stress at equal strain. When the glulam, at a higher load, yields the strengthening material will carry the entire applied load by itself, see Figure 3.2. This assumes there is sufficient strengthening material placed in the beam to withstand the stress increase applied when the glulam fails. If there is not enough reinforcement, the entire beam, i.e. the glulam and the reinforcement, will yield when the glulam fails in tension.

CHALMERS, Civil and Environmental Engineering, Master’s Thesis 2011:52 15
Figure 3.2 Reinforced glulam member loaded by an axial tensile force N
(Engström, 2010A).
To calculate a reinforced cross-section the section is recalculated as an equivalent glulam cross-section. The cross-section is thereby transformed by the following formula.
2-3 � 201 4 56 7 192:; (3.2)
<=��� 6 � &:;&01 (3.3)
The reinforced cross-section’s ultimate load carrying capacity depends on whether the reinforcement yields together with the glulam or if it can keep carrying the applied load after the glulam fails. As seen in (3.4) the lower of these two capacities becomes the governing one.
*+,-./ � !$% >��,012-3��,:;2:; ? (3.4)
3.2.1 Strengthening of glulam
“Conventional glued-laminated (glulam) beams often fail in bending-induced tension” (Silva-Henriquez, 2009). Glulam beams with long spans (L>12h) loaded in bending commonly fail in a tension failure, since a glulam beam can plasticise in its compressive zone. If this failure mode can be delayed the glulam beam can utilise its plasticising ability to a higher extent. This will give a higher maximum flexural resistance in the ultimate limit state. If there can be achieved a method to increase this material property in glulam, a lot more constructions will be able to incorporate glulam into their structural design.
There have been a large number of experiments, FEM models and trials made to try to reinforce glulam beams. The aim has been to be able to either reduce the height of the beams or to improve the flexural resistance. “Fibre reinforcement may also allow lower grades of lumber to be used effectively in advanced structural members.” (Dolan, 1997). But also “to enhance further the strength of beams made

CHALMERS, Civil and Environmental Engineering, Master’s Thesis 2011:52 16
from good quality timber” (Guan, 2005). The beams have been reinforced in numerous different ways. There are beams that have been reinforced on the tension side only (Silva-Henriquez, 2009), (Dolan, 1997). Both are with reinforcing steel rods, the same way concrete is being reinforced today. Sheets of FRP being glued to the bottom of the cross-section is another method. This method is also applicable to existing structures in need of strengthening, since there is no altering of the existing cross-section of the beam.
Then there have been trials where both the tension and compressive side have been reinforced. According to Jacob and Garzon (2007), the choice of using 25% of the overall amount of reinforcement on the compressive side yields the best results. Both the flexural resistance and the overall stiffness were increased when the reinforcement was added in this way. With the compressive reinforcement additional stiffness is added, but the beam is forced to a brittle failure on the tensile side. This due to the fact that the compression strength of the beam is enhanced with compressive reinforcement and thereby far exceeds the tensile capacity. When examining the different material used as reinforcement Jacob and Garzon (2007) showed that CFRP was the strengthening material which made the glulam beams the stiffest. The reinforcing steel also increases the stiffness, to a slightly lesser extent, and it decreases with added loading due to yielding of the steel. The beam reinforced with steel showed an overall more ductile behaviour due to the plastic yielding capacity of the reinforcing steel.
It was not possible for Jacob and Garzon (2007) to determine which reinforcing material increased the ultimate load capacity the most, because all failure modes where governed by the defects of the timber. Despite this Jacob and Garzon (2007) could show that the tested beams did experience an increase in ultimate load capacity of between 57-95.8%. It is also important, according to Jacob and Garzon (2007), to not over reinforce the beams since the reinforcement will then not be fully utilized before a shear failure occurs.
3.3 Pre-stressed beam
Figure 3.3 Principal model of a pre-stressed member, before loading and when
subjected to a tensile load N (Engström, 2010A).
The beam has four external rods as reinforcement, as seen in Figure 3.3.This does not represent a realistic case for a pre-stressed beam, but is an arrangement made to more

CHALMERS, Civil and Environmental Engineering, Master’s Thesis 2011:52 17
easily visualise the pre-stressed effect. These rods are given an initial tensile force, a pre-stressing force, and are then fastened to the object. This creates a uniformly compressive force that applies to the glulam. The tensile force N is then applied and increased until a failure of the beam occurs.
The transformed cross-section in this example is defined slightly different than (3.2), as can be seen in (3.5).
2-3 � 201 4 62:; (3.5)
As with the reinforced beam, the failure occurs either when the glulam fail and the reinforcement cannot take the added stress created by the glulam´s failure, or at that time when the reinforcement yields after the glulam has yielded. The lower of these two forces becomes the governing one according to (3.4).
3.3.1 Pre-stressed strengthened glulam
The concept of pre-stressing glulam is not a new idea, in 1991 Thanasis, Triantafillou and Deskovic presented a report of an innovative method of pre-stressing glulam. Some studies have followed and even though all studies have presented positive results, pre-stressed glulam has failed to have an impact on the production market and even in research, which the amount of material that can be found on the subject bears witness to.
The concept of pre-stressing a beam, no matter what material is being used is that an axial compressive force is applied to the cross-section. This compression force is applied using a reinforcing material that has been subjected to a tensile force before it is introduced and bonded to the beam. The compression force from the tendon shifts the stress distribution in the cross-section and places the compression side of the beam in tension and vice versa. The application of load must now first exceed the subjected pre-stressing stress and then the capacity of the beam for the beam to reach its maximum flexural resistance.
The studies made have included different types and different placements of the strengthening material. The results from the experimental and analytical methods have varied because of this. A common denominator is that all results have shown an improvement compared to both regular glulam and reinforced glulam. Both the reinforced and the pre-stressed show an increase in modulus of elasticity and modulus of rupture compared to a regular glulam beam. All studies shows that the pre-stressed beam has a higher modulus of rupture than the reinforced beams, but the studies vary in the results of modulus of elasticity. Some studies show higher modulus of elasticity in pre-stressed and some show approximately equal values (Dolan, 1997); (Silva-Henriquez, 2009); (Triantafillou, 1992); (Yahyaei-Moayyed, 2010A).
A difficulty in pre-stressing timber is the placement of the tendon. In some studies the tendon is glued to the outside of the outmost lamella on the tension side. This leaves the tendon unprotected against, for example mechanical damage and fire. A solution to this problem is to cover the tendon with an additional wood-lamella, a so-called “bumper”. This solution protects the tendon, but the beams load-carrying capacity drops considerably after the initial failure of the bumper (Yahyaei-Moayyed, 2010A).

CHALMERS, Civil and Environmental Engineering, Master’s Thesis 2011:52 18
4 THE MODEL
To investigate the different aspects of strengthened glulam beams an analytical model was established. By predefining the highest compressive strain εc other strains of interest could be obtained in the cross-section through strain compatibility. The entire sequence of events during the beam’s loading was analysed. This became possible to do since the εc was step-wise increased from zero strain until a failure criterion for the beam became fulfilled. There where however some cases where the general shape of the strain distribution were varying. For these cases a direct application of Navier’s formula was needed instead, see Chapter 4.3.1.
The model was created to handle unreinforced, reinforced and pre-stressed glulam beams and to be able to compare different properties between them, given a complete set of geometrical and material input data. It was established in such way that it could handle the linear elastic phase as well as the plastic phase for glulam and compensate for any yielding in the reinforcement. The model could handle any chosen configuration of compressive and tensile reinforcement. The full calculations are presented as a number of MathCAD-, found in Appendix A, and Matlab codes, found in Appendix B.
4.1 Unreinforced beam
4.1.1 Elastic phase
If a homogenous and even-sided beam is subjected to a bending moment imposed by a distributed load the centre of gravity and the neutral axis both becomes located in the centre of the beam’s cross-section. When the neutral axis is situated in the middle of the beam the outermost tensile strain and compressive strain become equal, since strain compatibility is assumed in a linear elastic analysis. An un-strengthened glulam beam with sufficient cross-section will, in linear elastic calculations, fail in bending induced tension, since in most cases glulam’s tensile yield limit is lower than its compressive yield limit.
For a real beam there are many different failure modes that can be expected to occur depending on what defects the particular beam has inherent and where they are located.
Figure 4.1 The stress and strain distribution of an ordinary glulam beam subjected
to a uniform flexural moment, elastic phase.

CHALMERS, Civil and Environmental Engineering, Master’s Thesis 2011:52 19
@A � @� (4.1)
With these assumptions there is a geometric problem left to calculate the resisting bending moment. The geometry, seen in Figure 4.1, for the bending moment can be retrieved as defined in (4.2). From this resisting bending moment, different loads for load cases can be calculated.
B � @A & C =D 12 4 @� & C =D12 (4.2)
4.1.2 Plastic phase
Unreinforced glulam beams rarely starts to plasticise since the compression yield limit in most beams exceeds the tensile yield limit.
If the plasticisation phase for an unreinforced beam is to be considered, it occurs when the glulam has reached its elastic compressive strain limit and thus no longer will carry any further stress at that point in the cross-section. The strain will continue to increase until a failure occurs in the beam. This results in a stress distribution with a rectangular shaped plasticisation zone seen in Figure 4.2. To calculate the resisting bending moment for this beam, the force equilibrium seen in (4.3) must first be defined from Figure 4.2.When the force equilibrium is defined the individual forces can be derived from Figure 4.2, as can be seen in (4.4).
Figure 4.2 The stress and strain distribution of an unreinforced beam subjected to
a uniform flexural moment, plastic phase.
F01,AG 4 F01,AD � F01,� (4.3)
F01,AG � 2AGC&01@A,-
F01,AD � 2ADC&01@A,-
F01,� � 201,�C&01@�
(4.4)

CHALMERS, Civil and Environmental Engineering, Master’s Thesis 2011:52 20
With the plasticisation in the glulam the new shape in the form of a rectangle emerges. The height of this rectangle, denoted x in Figure 4.2, is dependent on how much of the cross-section has started to plasticise. x can be derived from (4.13) which defines the difference between the present step of εc and the present level of εc,e.
H � @A 7 @A,-@A HIJ (4.5)
With x defined the only unknown parameter in the cross-section is xpl. xpl is derived from the force equilibrium. For that to be possible all forces in the force equilibrium need their associated strains calculated. As εc is initially the only known strain, since it is predefined as the chosen strain to stepwise increase, all other strains must be redefined to reflect its relationship with εc through strain compatibility. The strains, seen in (4.6), become redefined by means of εc and xpl and known cross-sectional geometry.
@� � = 7 HIJHIJ @A
@A,- � HIJ 7 HHIJ @A
(4.6)
xpl can then be extracted through the force equilibrium equation, by inserting (4.6) into (4.4). With xpl calculated the resisting bending moment is found by calculating moment equilibrium around xpl, as seen in (4.7).
B � F01,AG KHIJ 7 H2L 4 23 F01,ADNHIJ 7 HO
4 23 F01,�N= 7 HIJO
(4.7)
4.2 Reinforced beam
To strengthen the glulam beam a chosen amount of strengthening material is be added to the beam. This adds maximum flexural resistance, stiffness and deflection resistance to the beam.
4.2.1 Elastic phase
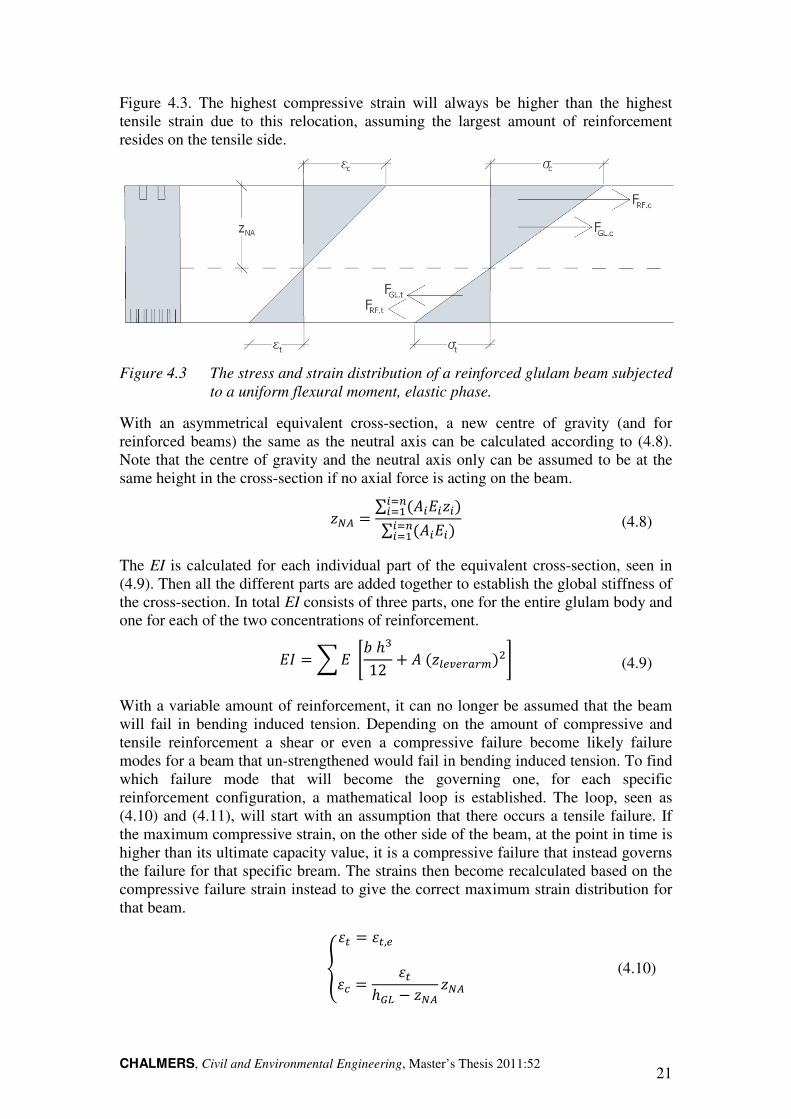
The calculations for a reinforced beam get several additions due to the reinforcement, compared to the un-strengthened beam. First the cross-section will be recalculated into an equivalent cross-section to account for the superior material properties the reinforcement has inherent. With the equivalent cross-section the reinforcement will be recalculated into an equivalent amount of glulam. The centre of gravity no longer resides at the centre of the beam due to this. It has instead been relocated toward the point where the highest concentration of reinforcement resides, as can be seen in
CHALMERS, Civil and Environmental Engineering, Master’s Thesis 2011:52 21
Figure 4.3. The highest compressive strain will always be higher than the highest tensile strain due to this relocation, assuming the largest amount of reinforcement resides on the tensile side.
Figure 4.3 The stress and strain distribution of a reinforced glulam beam subjected
to a uniform flexural moment, elastic phase.
With an asymmetrical equivalent cross-section, a new centre of gravity (and for reinforced beams) the same as the neutral axis can be calculated according to (4.8). Note that the centre of gravity and the neutral axis only can be assumed to be at the same height in the cross-section if no axial force is acting on the beam.
PQR � ∑ 52T&TPT9TUVTUG∑ 52T&T9TUVTUG (4.8)
The EI is calculated for each individual part of the equivalent cross-section, seen in (4.9). Then all the different parts are added together to establish the global stiffness of the cross-section. In total EI consists of three parts, one for the entire glulam body and one for each of the two concentrations of reinforcement.
&W � X & YC =Z12 4 2 5PJ-[-,.,\9D] (4.9)
With a variable amount of reinforcement, it can no longer be assumed that the beam will fail in bending induced tension. Depending on the amount of compressive and tensile reinforcement a shear or even a compressive failure become likely failure modes for a beam that un-strengthened would fail in bending induced tension. To find which failure mode that will become the governing one, for each specific reinforcement configuration, a mathematical loop is established. The loop, seen as (4.10) and (4.11), will start with an assumption that there occurs a tensile failure. If the maximum compressive strain, on the other side of the beam, at the point in time is higher than its ultimate capacity value, it is a compressive failure that instead governs the failure for that specific bream. The strains then become recalculated based on the compressive failure strain instead to give the correct maximum strain distribution for that beam.
^@� � @�,- @A � @�=01 7 PQR PQR ? (4.10)

CHALMERS, Civil and Environmental Engineering, Master’s Thesis 2011:52 22
_a`b@� � c @A,-PQR 5=01 7 PQR9 $� @A d @A,-
@� #=��<$(� ?@A � e@A,- $� @A d @A,- @A #=��<$(� ?
? (4.11)
Two more forces have appeared in the force equilibrium equation due to the reinforcement, see Figure 4.4 and (4.12). They are located at the centre of the concentrations of reinforcement and are defined by the strengthening material’s parameters, as can be seen in (4.13).
Figure 4.4 The stress and force distribution for the moment created by the applied
load.
F:;,A 4 F01,A � F01,� 4 F:;,� (4.12)
F:;,A � 2:;,A &:;@:;,A
F01,A � 2AGC&01@A
F01,� � 201,�C&01@�
F:;,� � 2:;,�&:;@:;,�
(4.13)
@:;,A � fV. 7 fAfV. @A
@:;,� � = 7 fV. 7 f�fV. @A
@� � = 7 fV.fV. @A
(4.14)

CHALMERS, Civil and Environmental Engineering, Master’s Thesis 2011:52 23
With these forces defined the resisting moment can be calculated through moment equilibrium around zna, as seen in (4.15)
B\.g � 13 @A&01CPQRD 4 @:A&:; 2:A hPQR 7 =012 i
4 13 @�&01C5= 7 PQR9D 4 @:�&:;2:� h= 7 PQR 7 =012 i
(4.15)
4.2.2 Plastic phase
For further calculations for a reinforced beam in the plastic phase it is recommend to look at Jacob and Garzon (2007), since one of their objects is to establish this as an analytical model.
As for the unreinforced beam the plastic phase occurs when εc reaches εc,e. When this condition is met, the glulam can no longer carry more stress as the strain increases further. When this occurs, the constitutive relationship between the strain and stress distribution through Young’s modulus ceases to be valid and distribution gets a new appearance, as seen in Figure 4.5
Figure 4.5 Stress and strain distribution of a reinforced beam subjected to a
uniform flexural moment, plastic phase.
The constitutive relationship can no longer be directly applied, but the force and moment equilibrium conditions must still be fulfilled. The maximum stress the glulam can tolerate is known; hence the rectangular stress block created by the increasing plasticisation of the glulam can be calculated. It should be noted that the reinforcement does not have to cease carrying more stress when the glulam does. Although the top reinforcement lies within the rectangular compressive zone that is not able to carry any additional stress, this reinforcement will continue to carry an increasing amount of stress until its yielding limit is reached. The force equilibrium from Figure 4.5 becomes defined as shown in (4.16) and its associated forces are defined in (4.17).
F:;,A 4 F01,AG 4 F01,AD � F01,� 4 F:;,� (4.16)
CHALMERS, Civil and Environmental Engineering, Master’s Thesis 2011:52 24
F:;,A � 2:;,A &:;@:;,A
F01,AG � 2AGC&01@A,-
F01,AD � 2ADC&01@A,-
F01,� � 201,�C&01@�
F:;,� � 2;:,�&:;@:;,�
(4.17)
FGLc1 and FGL,c2 are defined by the maximum elastic strain for glulam and the FRF,c instead has its strain derived from εc at that chosen step, which can be much larger then εc,e when the plastic phase goes on. The strains needed for (4.16) are defined as displayed in (4.18).
@:;,A � HIJ 7 fAHIJ @A
@:;,� � = 7 HIJ 7 f�HIJ @A
@� � = 7 HIJHIJ @A
@A,- � HIJ 7 HHIJ @A
(4.18)
H � @A 7 @A,-@A HIJ (4.19)
With the addition of the height x in (4.19), the height of the plastic zone, the remaining unknown parameter xpl can now be extracted from the force equilibrium as it is now the only unknown parameter left. The extraction is identical to that described in Chapter 4.1.2.
The solution of xpl is preferably done with the Matlab command “solve” as it changes appearance depending on the glulam having a plastic zone or if any part of the reinforcement reaching its yielding strength.
When the plastic neural axis xpl has been found, the resisting bending moment can be calculated by moment equilibrium around xpl, as seen in (4.20).

CHALMERS, Civil and Environmental Engineering, Master’s Thesis 2011:52 25
B � F01,AG KHIJ 7 H2L 4 23 F01,ADNHIJ 7 HO
4F:;,ANHIJ 7 fAO 4 23 F01,�N= 7 HIJO
4F:;,�5= 7 HIJ 7 f�)
(4.20)
4.3 Pre-stressed beam
A pre-stressing force can be seen as an axial force acting on the cross-section. This force will act as a compressive force and be applied at the middle of the tensile reinforcement. If this force would have been applied at the centre of gravity it will only add a uniformly spread compressive stress across the beam. When this force does not act in the centre of gravity an additional moment will be applied to the cross-section which depends on the lever arm e, see Figure 4.6. Together, these two stress distribution produce the total stress distribution imposed on the cross-section by the pre-stressing force.
The pre-stressing force has several positive effects. The compressive force of the pre-stressing increases the load bearing capacity in the ultimate limit state. This is only valid if a tension failure occurs, since the added compression does not increase any other yield limits. The second part of the pre-stressing force, the bending moment that occurs due to the lever arm e, creates an upward directed deflection of the beam. This reduces the overall deflection of the beam, which is the most common service limit state requirement. With this pre-camber additional load can be applied before the service limit state requirements are met.
Figure 4.6 The stress distributions created by a pre-stressing force
4.3.1 Elastic phase
For this thesis, the pre-stressing force cannot be greater than the maximum axial force than what EC5 allows for. If a greater pre-stressing force is applied the beam, according to EC5, will experience a lateral torsional buckling. This has been chosen because the beam at full compression should still be able to be handled and moved.

CHALMERS, Civil and Environmental Engineering, Master’s Thesis 2011:52 26
The beam would be able to sustain sometimes several hundred percent more before yielding, but without constant bracing this would not be able to be sustained.
With the initial stress distribution from the pre-stressing load, an increasing additional moment is applied to the cross-section. This moment represents the pure bending moment created by the load after the pre-stressing force is applied. The stresses at the top and at the bottom of the beam can assume both compressive and tensile stresses during the elastic phase, as can be seen in Figure 4.7. A sign convention must therefore be upheld during the elastic phase. In this thesis the sign convention from Al-Emrani (2008) is used.
• Axial - force-positive if in tension
• Moment - positive if there is tension at the bottom side.
• Coordinate z is measured from the equivalent cross-sections centre of gravity – positive downwards
• The eccentricity of the axial force is measured from the equivalent cross-sections centre of gravity – positive downwards.
• Calculated stress – positive if tension
Figure 4.7 All different strain distributions a pre-stressed glulam beam can
experience in the elastic phase.
To calculate the elastic phase Navier’s formula has been used. This is the least complicated way to calculate the elastic phase, since there is no way in advance to know what shape the stress distribution will assume when the load increases. Navier’s formula is valid for all linear elastic distribution forms, thus making it the most efficient way to calculate the resisting moment.
Through Navier’s formula we can, for each increased strain, extract the moment that the load applied by changing (4.21) into (4.22).
@A&01 � *2 4 * � 4 BW P (4.21)
Then since the strain εc gets prescribed each time, it together with its representative z
makes it possible to extract M, the moment imposed by the load.
B � 5& @A 2 7 * 9W2P 7 * � (4.22)

CHALMERS, Civil and Environmental Engineering, Master’s Thesis 2011:52 27
@� � B&01W P�
@:;,� � B&01W P:;,�
@:;,A � B&01W P:;,A
@A � B&01W PA
(4.23)
When this moment is calculated it is used to extract its associated strains seen in (4.23). With these strains the load resisting moment can be calculated by (4.15). It should be noted that if N=0 the same resisting moment calculated in Chapter 4.2.1 will be obtained. This ability will be used later in the computer program to minimise computer calculations.
4.3.2 Plastic phase
The elastic model ends when the compressive strain reaches the elastic strain limits. After that has occurred, the glulam in the compressive zone starts to plasticise and gain the stress distribution seen in Figure 4.8.
Figure 4.8 Stress and strain distribution for a pre-stressed beam subjected to a
uniform flexural moment, plastic phase.
The pre-stressed beam has an addition to the strain distribution, when compared to (4.18). This strain εp0∞, as it is called in an equivalent pre-stressed concrete cross-section (Engström, 2010A), is the pre-existing strain in the pre-stressed reinforcement due to the pre-stressing force. With this addition to account for the pre-stressing force, xpl can now be calculated through the force equilibrium.
F:;,A 4 F01,AG 4 F01,AD � F01,� 4 F:;,� (4.24)
The force equilibrium has the same definition as in Chapter 4.2.2, hence the definitions of the different forces become the same.

CHALMERS, Civil and Environmental Engineering, Master’s Thesis 2011:52 28
F:;,A � 2;:,A &:;@:;,A
F01,AG � 2AGC&01@A,-
F01,AD � 2ADC&01@A,-
F01,� � 201,�C&01@�
F:;,� � 2;:,�&:;@:;,�
(4.25)
From this equilibrium condition and the fact that εc is always known the xpl will be able to be calculated if the strains are expressed with εc. In (4.26) the difference should be noted in εRF,t where the εp0∞ is present, compared to (4.18).
@;:,A � HIJ 7 fAHIJ @A
@:;,� � = 7 HIJ 7 f�HIJ @A 4 @Ijk
@� � = 7 HIJHIJ @A
@A,- � HIJ 7 HHIJ @A
(4.26)
H � @A 7 @A,-@A HIJ (4.27)
With these functions defined and εc as the stepping parameter xpl can be extracted through the force equilibrium. The resisting moment can be calculated by moment equilibrium around xpl, as seen in (4.28).
B � F01,AG KHIJ 7 H2L 4 23 F01,ADNHIJ 7 HO
4F:;,ANHIJ 7 HO 4 23 F01,�N=l 7 HIJO
4F:;,�5= 7 HIJ 7 f�)
(4.28)
4.4 Yielding of the reinforcement
The reinforcement can reach its yield point before the beam fails in ultimate limit state. In this case the reinforcement, if it has a plastic capability like for example steel, is assumed to have a bilinear stress-strain curve, cf. Figure 4.9. With the bilinear assumption, the reinforcement can experience an infinite amount of additional strain

CHALMERS, Civil and Environmental Engineering, Master’s Thesis 2011:52 29
after reaching the yield limit, without being able to carry any more stress above this limit.
4.4.1 Elastic phase
If the reinforcement should start to yield during the elastic phase the Navier’s formula no longer remains valid. When that happens the case must be viewed by the means of the force equilibrium from the stress distribution.
If the beam is reinforced the force equilibrium is obtained from Figure 4.4. It will become as (4.29), where depending on which reinforcement is yielding (4.30), (4.31) or (4.32) should become inserted.
F:;,A 4 F01,A � F01,� 4 F:;,� (4.29)
If the beam is pre-stressed, several cases exist. The different cases of stress distribution in the elastic phase due to the pre-stressing force are showed in Figure 4.7. The more cases that are permitted into the calculations the more general the calculations can be considered to be.
When any part of the reinforcement starts to yield the present stress distribution must first be determined. When the stress distribution has been determined the force equilibrium can be found as (4.29) with (4.30), (4.31) or (4.32) inserted depending on which part of the reinforcement is yielding.
4.4.2 Plastic phase
Figure 4.9 A bilinear work curve for steel
When the reinforcement reaches its maximum stress level it will either start to plasticise or get a brittle failure. If the reinforcement has the ability to plasticise it will, after reaching its maximum stress level, not take any more stress with the

CHALMERS, Civil and Environmental Engineering, Master’s Thesis 2011:52 30
increasing strain. When this occurs the xpl must be recalculated with the condition stated in (4.30), (4.31) or (4.32) depending on which part of the reinforcement has reached its yielding point.
If the compressive reinforcement has reached its yielding strength, then (4.29) is only valid if (4.30) is used to replace the force for the compressive reinforcement.
F:;,A � �mn2:;,A (4.30)
If instead the tensile reinforcement has reached its yielding strength, then inserting (4.31) into (4.29) for the tensile reinforcement makes the equation valid.
F:;,� � �mn2:;,� (4.31)
If both the compressive and the tensile reinforcement have reached the yielding strength equation (4.32) makes (4.29) valid.
_abF:;,A � �mn2:;,A F:;,� � �mn2:;,�
? (4.32)
4.5 Shear failure
Disregarding the various types and amount of reinforcement, the shear failure appears at the same load, since the size of the cross-section and the length of the beam determine the shear failure. In this thesis, either evenly distributed loads or the four point bending test has been used. For the cases with a uniformly-distributed load, the equation (4.33) can be used to define the maximum shear force before shear failure occurs. Equation (4.34) represents the counterpart for the concentrated point load combination.
o � 3p2C=
o q o\.g
(4.33)
o � 3r4C=
o q o\.g
(4.34)
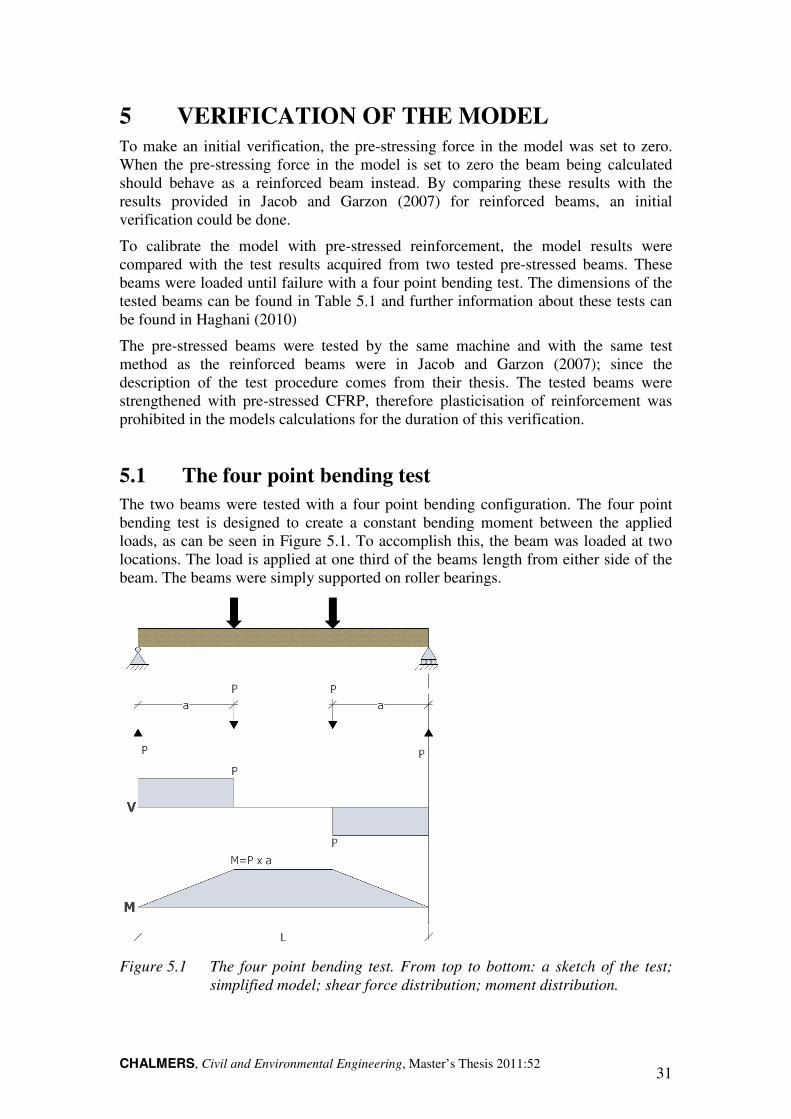
CHALMERS, Civil and Environmental Engineering, Master’s Thesis 2011:52 31
5 VERIFICATION OF THE MODEL
To make an initial verification, the pre-stressing force in the model was set to zero. When the pre-stressing force in the model is set to zero the beam being calculated should behave as a reinforced beam instead. By comparing these results with the results provided in Jacob and Garzon (2007) for reinforced beams, an initial verification could be done.
To calibrate the model with pre-stressed reinforcement, the model results were compared with the test results acquired from two tested pre-stressed beams. These beams were loaded until failure with a four point bending test. The dimensions of the tested beams can be found in Table 5.1 and further information about these tests can be found in Haghani (2010)
The pre-stressed beams were tested by the same machine and with the same test method as the reinforced beams were in Jacob and Garzon (2007); since the description of the test procedure comes from their thesis. The tested beams were strengthened with pre-stressed CFRP, therefore plasticisation of reinforcement was prohibited in the models calculations for the duration of this verification.
5.1 The four point bending test
The two beams were tested with a four point bending configuration. The four point bending test is designed to create a constant bending moment between the applied loads, as can be seen in Figure 5.1. To accomplish this, the beam was loaded at two locations. The load is applied at one third of the beams length from either side of the beam. The beams were simply supported on roller bearings.
Figure 5.1 The four point bending test. From top to bottom: a sketch of the test;
simplified model; shear force distribution; moment distribution.

CHALMERS, Civil and Environmental Engineering, Master’s Thesis 2011:52 32
The two upper loading cells slowly increases their applied force, thus creating two reaction forces, in opposite direction, in static roller supports. It is these four forces the name “four point bending test” is intended to reflect. For each load increment from the loading cells the deflections at chosen points were measured and recorded.
5.2 Adjustments to the model
The final applied pre-stressing force to the reinforcement in the two tested beams far exceeded the highest allowed force for equivalent beams calculated in the model. To compensate for this the definition of the pre-stressing force in the model was overridden and replaced by the fixed value given in Haghani (2010) for each of the beams, see Table 5.1.
Table 5.1 Material parameters for the tested and the calculated beams.
Test beam 1 Test beam 2 Calculated beam 1
Figure 5.2
Calculated beam 2
Figure 5.3
Height 200 mm 200 mm 200 mm 200 mm
Width 115 mm 115 mm 115 mm 115 mm
Length 3600 mm 3600 mm 3600 mm 3600 mm
Pre-stressing force
50 kN 70 kN 50 kN 70 kN
FRP plate
reinforcement 30x1.2 mm 30x2.4 mm 30x1.2 mm 30x2.4 mm
The calculated beams were given the same strength parameters as supplied to Jacob and Garzon (2007), since these beams were from the same set of glulam beams delivered to Chalmers. Jacob and Garzon (2007) had tested the beams and shown that the modulus of elasticity was lower than the values supplied, but since these specific beams had not been tested the originally supplied values were chosen.
Table 5.2 Strength parameters for the tested glulam beams, from Jacob and
Garzon (2007). These values are most likely mean, not characteristic,
values.
ft,0,k fc,0,k fv,k E Gmean ρk
44MPa 46MPa 7MPa 13.5GPa 760MPa 400kg/m3
The reinforced and unreinforced reference beams in Figure 5.2 and Figure 5.3 are created from the reinforced model, the same as in Jacob and Garzon (2007), where if the reinforcement is set to zero an unreinforced beam can be calculated.

CHALMERS, Civil and Environmental Engineering, Master’s Thesis 2011:52 33
5.3 Results
The result from the model agreed well with the results from their tested counterpart, as can be seen in Figure 5.2 and Figure 5.3. There were however some tangible differences that are going to be addressed in this chapter.
The two beams that were tested by Haghani (2010) both ended up with a tension induced bending failure just as the beams that where calculated by the model did. But as can be seen in Table 5.3 as well as in Figure 5.2 and Figure 5.3, the calculated beams reached a higher maximum load then their tested counterparts.
The calculated beams have a higher load bearing capacity because the values in Table 5.2 are too high. If characteristic values would be used instead, the load bearing capacity would become lower. The load bearing capacity for the calculated beams would then be considered to be on the “safe side”.
Figure 5.2 Tested beam together with calculated beam with identical settings as
test beam 1. Test beam 2, reinforced and unreinforced beams are added
for visualization.
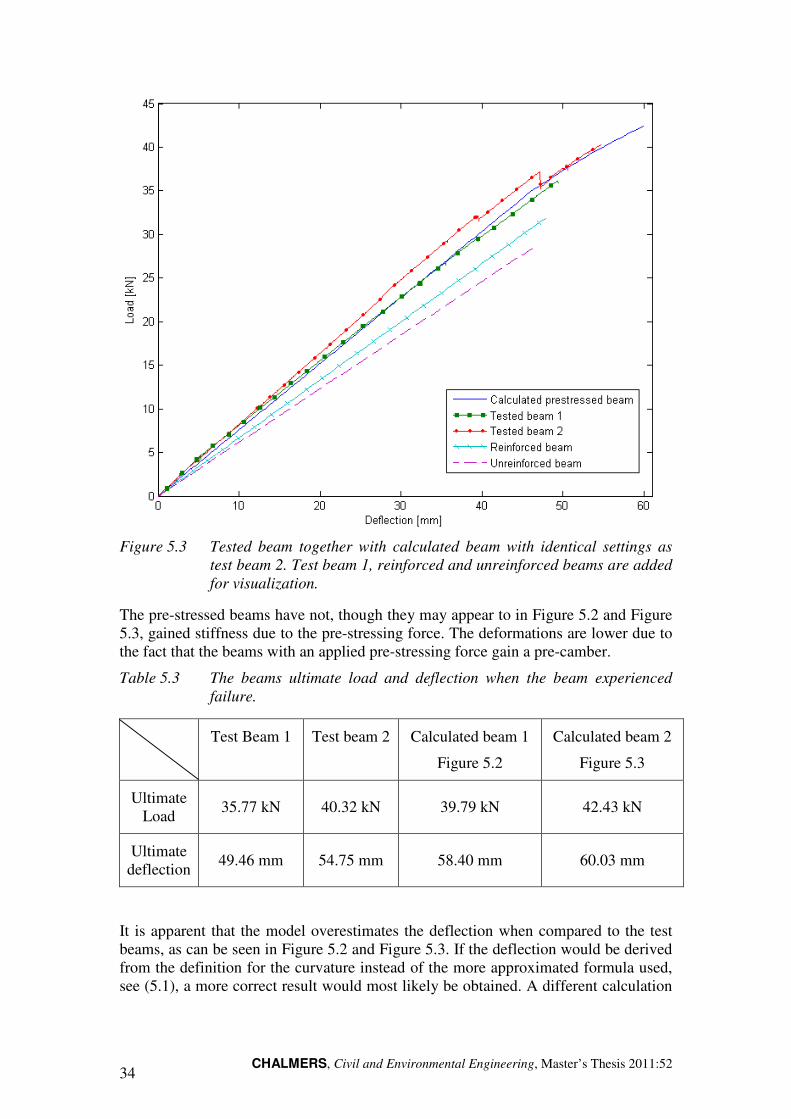
CHALMERS, Civil and Environmental Engineering, Master’s Thesis 2011:52 34
Figure 5.3 Tested beam together with calculated beam with identical settings as
test beam 2. Test beam 1, reinforced and unreinforced beams are added
for visualization.
The pre-stressed beams have not, though they may appear to in Figure 5.2 and Figure 5.3, gained stiffness due to the pre-stressing force. The deformations are lower due to the fact that the beams with an applied pre-stressing force gain a pre-camber.
Table 5.3 The beams ultimate load and deflection when the beam experienced
failure.
Test Beam 1 Test beam 2 Calculated beam 1
Figure 5.2
Calculated beam 2
Figure 5.3
Ultimate Load
35.77 kN 40.32 kN 39.79 kN 42.43 kN
Ultimate deflection
49.46 mm 54.75 mm 58.40 mm 60.03 mm
It is apparent that the model overestimates the deflection when compared to the test beams, as can be seen in Figure 5.2 and Figure 5.3. If the deflection would be derived from the definition for the curvature instead of the more approximated formula used, see (5.1), a more correct result would most likely be obtained. A different calculation
CHALMERS, Civil and Environmental Engineering, Master’s Thesis 2011:52 35
program than Matlab should then be chosen, since Matlab does not possess a built-in function to handle integrals.
t � rJu.n 1Z h3vD 7 4 K1ZLDi24&W
rJu.n � 3Bv
(5.1)
The calculated beams have, as mentioned before, gained their strength parameters from the Table 5.2, which are mean values for these types of glulam beams. With just two beams to compare with, it does not statistically prove that these values are the correct ones for these beams. It is, because of this, not possible to conclude that the model can predict all pre-stressed beams’ behaviour when loaded until failure. It does however provide a strong indication that the model created for this master thesis is able to quite accurately predict a real beam’s behaviour strengthened with pre-stressed reinforcement.

CHALMERS, Civil and Environmental Engineering, Master’s Thesis 2011:52 36
6 HEIGHT REDUCTION WITH MAINTAINED
FLEXURAL RESISTANCE (ULS)
One of the advantages of adding reinforcement to a beam is the ability to reduce the cross-section but maintain the flexural capacity in the ultimate limit state. Reducing the cross-section of the beam can give a lower cost for manufacturing that particular beam, thus becoming a more appealing choice. There would also be an economical cost reduction for the whole construction, since the entire wall can be shortened due to the lower height of the beams.
To produce a calculation that would give these values, the model was slightly rewritten. A new start program was created that originated from a chosen un-strengthened beam’s height. The start program then calculated the reinforced beam and the pre-stressed beam with a chosen reduced height. The reinforcement in these beams was gradually increased until the same resisting moment was achieved in the strengthened beams as in the original un-strengthened beam. The beams where then given a further height reduction and the corresponding reinforcement amount was found to achieve an equivalent flexural capacity. This iteration continued until the strengthened beams could not reach the original un-strengthened beam’s strength with less than 3% reinforcement. The 3% level was chosen since above this value is no economic gain to be made from strengthening due to the vast amount of reinforcement required.
The beams were given strength parameters according to Table 6.1 or Table 6.2 depending on what was examined. Table 6.1 contains the strength parameters for a standard beam. Table 6.2 shows the same parameters but for a glulam beam constructed out of lower quality timer.
Table 6.1 Characteristic value for the calculated GL40c beams.
fm,k ft,0,k fc,0,k fv,k E0.05 Gmean ρk
30,8MPa 17,6MPa 25,4MPa 2,7MPa 10.5GPa 760MPa 400kg/m3
Table 6.2 Characteristic value for the calculated GL24h beams.
fm,k ft,0,k fc,0,k fv,k E0.05 Gmean ρk
24MPa 16.5MPa 24MPa 2.7MPa 9400GPa 720MPa 380kg/m3
Figure 6.1 and Figure 6.2 are created from this program and are presenting calculations for a slightly enlarged verification sized beam and a large in practice used beam. The verification beam needed to be enlarged to a height of 500 mm since its original size had too few lamellae to create good results for the analysis. With an increased height the width and length were also enlarged so the beam proportions remained unchanged.
The reinforcement percentages shown in all these type of graphs are relative to its corresponding cross-sectional size. This means that one percent reinforcement for a

CHALMERS, Civil and Environmental Engineering, Master’s Thesis 2011:52 37
smaller size is a lesser amount of reinforcement than one percent for a greater cross-section.
6.1 Results
All the pre-stressed beams with a reduced height needed a lesser amount of reinforcement than a reinforced beam with the same reduction to gain the original un-strengthened beam’s maximum flexural resistance in ultimate limit state.
When comparing these two beams curves it can be seen that the smaller and shorter beam from Figure 6.1 has an increasing difference between what the reinforced and pre-stressed beams need for reinforcement. When comparing this to the more constant difference in Figure 6.2 there are some conclusions to be drawn. For the larger beam, due to its length, it has a low and fairly constant maximum pre-stressing force capability for all the tested heights.
When the pre-stressing force remains constant the difference between the reinforced and the pre-stressed beam also seems to remain constant. This is due to that most other parameters are kept the same, such as location and geometry of the reinforcement. The smaller beam gets, with increased amount of reinforcement, a possibility to increase its pre-stressing force without having to sacrifice significant amounts of its tensile strength. This would explain the increased difference in reinforcement needed as the general reinforcement amount in the beams increases.
Figure 6.1 Reinforcement needed to obtain the same resisting moment in ULS with
reducing beam height. The original beam had the starting height of 500
[mm] and a length of 5 meters.

CHALMERS, Civil and Environmental Engineering, Master’s Thesis 2011:52 38
Figure 6.2 Reinforcement needed to obtain the same maximum resisting moment
in ULS with reducing beam height. The original beam had a starting
height of 1360 [mm] and a length of 18 meters.
Another notable effect can be seen in the very first height reduction steps in these figures. The reinforced beam needs a certain amount of reinforcement when the first glulam lamella is removed. The pre-stressed beam however needs almost no reinforcement at all to compensate for the removal of the first lamellae. The maximum allowed pre-stressing force comes from the beams lateral torsional demands, which is a fixed value that is completely unrelated, at least for the amount of reinforcement present in these beams. When a very small amount of reinforcement is added to the beam, this reinforcement will be tensioned to a very high stress level. Although it loses its ability to add tension strength to the beam its contributing pre-stressing effect is enough to allow the beam to reach the same maximum resisting bending moment as the original unreinforced beam.
The pre-stressed beam is, in these calculations, a duplicate of the reinforced beam. A further increased reduction in the need for reinforcement would be achieved by an optimisation of the reinforcement geometry and location within the beam for the pre-stressed beam. This, due to the effects from the pre-stressing force, is dependent on a number of geometry parameters, such as for example the lever arm e. If optimised for each beam configuration, it would create an even bigger gap between the two curves. Hence a more positive result for the pre-stressed beam would be obtained.
6.2 Increased pre-stressing force
The pre-stressing force applied by Haghani (2010) exceeds the maximum allowed pre-stressing force generated by the model. It is possible that the requirement that was set on the pre-stressing force in the model is too strict. For this reason the effects of an increased pre-stressing force above the pre-allowed limit was examined.

CHALMERS, Civil and Environmental Engineering, Master’s Thesis 2011:52 39
Figure 6.3 Reinforcement needed to obtain the same maximum resisting moment in
ULS with reducing beam height. The original beam had the starting
height of 500 [mm] and a length of 5 meters. 1.5 times the pre-stressing
force is applied.
Figure 6.4 Reinforcement needed to obtain the same maximum resisting moment in
ULS with reducing beam height. The original beam had the starting
height of 1360 [mm] and a length of 18 meters. 1.5 times the pre-
stressing force is applied.

CHALMERS, Civil and Environmental Engineering, Master’s Thesis 2011:52 40
If the pre-stressing force was allowed to be 1.5 times larger, the difference between the reinforced and the pre-stressed beam increases with an almost identical amount, see Table 6.3. The precision of the calculated values are limited to entire lamellae’ being removed which is 45 mm at a time. A reference point at one per cent of reinforcement amount was set to create Table 6.3. The heights were then interpolated between the height results closest to one per cent, thus being less accurate. An increase in the difference of height between the reinforced and pre-stressed beam are shown in Table 6.3. The difference is clearly visible if the numbers of removed lamellae with zero per cent needed reinforcement is compared between Figure 6.4 and Figure 6.2.
Table 6.3 The difference in height reductions with 1,5 times the pre-stressing
force and amount of reinforcement corresponding to 1 percent of the
beam’s cross-section.
1360x215
1,0*P
1360x215
1,5*P
500x200
1,0*P
500x200
1,5*P
Reinforced 1040mm 1040mm 392mm 392mm
Pre-stressed 982mm 955mm 365mm 360mm
6.3 Reduced glulam quality
With the reduced strength parameters, seen in Table 6.2, the glulam has been given the strength properties equivalent to a glulam beam produced of lower quality timber.
Using lower quality timber in the glulam beam cuts productions cost, thus becoming a competitive choice if the difference in maximum flexural resistance in ultimate limit state is low compared to a stronger beam made from graded timber.
The difference between the higher and lower quality beam are relative small in comparison to the difference between the pre-stressed and reinforced beam, as can be seen in Figure 6.5 and Figure 6.6
The difference for the two main factors governing for failure of the beam, the tensile limit for the glulam and the difference between the compressive and the tensile limits are quite low. This contributes to the low difference between the beams. The compressive limit in itself plays only a subordinate role since the plasticisation possibility of the compressive side makes it almost impossible to reach a compressive failure, unless the beam is extremely over-reinforced on the tensile side. This low difference can be viewed in Table 6.1 and Table 6.2.
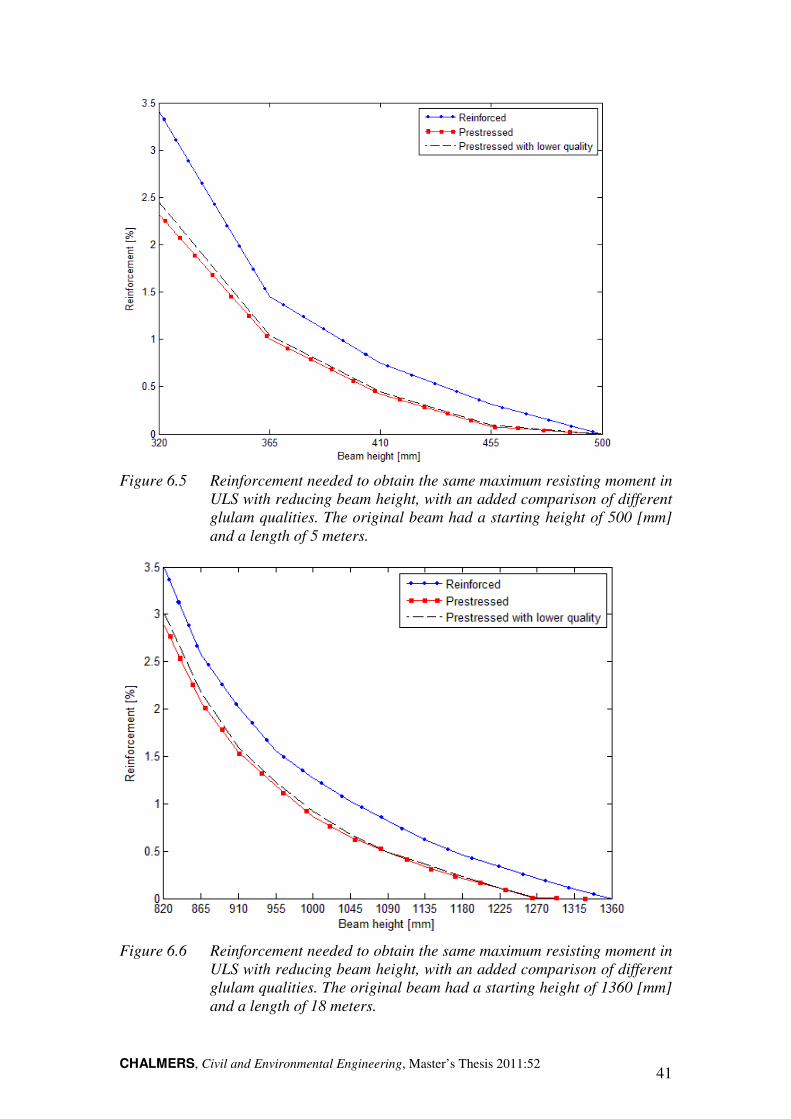
CHALMERS, Civil and Environmental Engineering, Master’s Thesis 2011:52 41
Figure 6.5 Reinforcement needed to obtain the same maximum resisting moment in
ULS with reducing beam height, with an added comparison of different
glulam qualities. The original beam had a starting height of 500 [mm]
and a length of 5 meters.
Figure 6.6 Reinforcement needed to obtain the same maximum resisting moment in
ULS with reducing beam height, with an added comparison of different
glulam qualities. The original beam had a starting height of 1360 [mm]
and a length of 18 meters.

CHALMERS, Civil and Environmental Engineering, Master’s Thesis 2011:52 42
With the most common failure mode for these beams being bending induced tension failure, the glulam fails at almost identical loading. The glulam with the lower quality gains a larger compressive strain due to the pre-stressing force. This increase in compressive strain reduces the difference in the different glulam’s tensile yield limit. This causes the beams to gain similar maximum flexural resistance in the ultimate limit state.
With lower quality timber in the pre-stressed beam a small amount of flexural resistance is sacrificed. This makes it a less attractive choice as seen from its structural behaviour. With the lower production cost of lower quality glulam, this beam might still prove be an economically viable choice, if a deeper investigation is conducted.
CHALMERS, Civil and Environmental Engineering, Master’s Thesis 2011:52 43
7 ECONOMICAL COMPARISON
When glulam is strengthened many of the member’s properties becomes enhanced. Raised stiffness properties of the beam, higher maximum capacity and a more predictable failure mode are some of them. But for the method to have a real impact in the building sector it must also be economically viable and profitable. For this to be achieved, the savings in timber and construction materials must be bigger than the additional costs for reinforcement.
For this economical comparison the height reduction method, used in Chapter 6, is utilized to obtain the material savings for different chosen scenarios. From this model the difference in cross-section is also gathered and compared. With the different cross-sections analysed, the costs for the pre-stressed beams are added together and compared with the cost for an un-strengthened beam, thus giving the economical difference for the different beams with the same flexural resistance.
To be able to perform this analysis, costs and savings values for the different parameters is needed. Erik Gulbrandsen (2011) at Tenroc Technologies has supplied these values, see Table 7.1. With the given values, the comparison could only be made with steel as the strengthening material and only pre-stressed and not regular reinforced beams could be compared to an un-strengthened beam. The price of glulam varies with supply and demand and therefore no fixed cost can be assumed. In this comparison the minimum and the maximum values for GL40c, as this quality was used for the two tested beams, will be considered.
There are two scenarios that have to be considered when doing this comparison. The first is to compare the costs for one un-strengthened glulam beam with the cost of one pre-stressed beam, where the two beams have the same maximum flexural resistance in the ultimate limit state. There is also an interest in finding out which economic effects pre-stressed beams would have on a building. A simple structure with four roof beams and a length of 30 m has, for this case, been analysed. The savings that can be made for this building, except for the reduction in cost per beam, is the reduction in wall material, since the total height of the building is reduced due to the smaller cross-section of the pre-stressed beam. In the building or project comparison transportation, is also being considered as an economic factor.
All comparisons have been made for five fixed beam heights; 1620, 1350, 1260, 990 and 720 mm. This generates many results and for visual reasons, some will not be shown in the report. The full diagrams can be found in Appendix D and the calculation sheets for these diagrams in Appendix C. All beams have been calculated with 0.5, 1.0, 1.5, 2.0, 2.5 and 3.0 per cent of reinforcement. For some beams the results ends before the reinforcement reaches 3.0 per cent. In these beams the higher amounts of reinforcement could not be utilized fully due to shear failure.
It should also be noted that savings are negative values, which means that a negative value is a positive result for the pre-stressed beam. The y-axes were inverted in the diagrams to make it easier to visualize the positive or negative effect of pre-stressing.

CHALMERS, Civil and Environmental Engineering, Master’s Thesis 2011:52 44
Table 7.1 Cost values, supplied by Erik Gulbrandsen (2011) at Tenroc
Technologies
Cost category Description Value
Glulam Material cost 3000-5000 SEK/m3
Steel Material cost 9 SEK/kg
Adhesive Material cost 34 SEK/kg
Production, unreinforced
Is included in the material cost for glulam.
0 SEK/m3
Production, pre-stressed
Salaries, machines 185 SEK/m3
Factory Loans and other costs tied to the property 105 SEK/m3
Operation and maintenance
Electricity etc. to machines and service 34 SEK/m3
Wall material Savings caused by reduced wall area 750 SEK/m2
Transport Considers a truck with capacity to carry 28 tons between Gothenburg and Stockholm.
12000 SEK
7.1 Comparison of various beam lengths
This analysis purpose is to examine whether the pre-stressing method is suited for long or short beams. Un-strengthened glulam beams have practically no fixed maximum length since they can be finger jointed during construction. Pre-stressed beams manufactured in factories do have practical restraints concerning their length, since they have to be transported as one unit and cannot be finger-jointed after the reinforcement has been put in place. Therefore the longest beam analysed is 25 metres. All beams compared have a width of 215 mm.
7.1.1 Single beam comparison
The price of glulam influences the results drastically, as seen in Figure 7.1 and Figure 7.2. When glulam is at its most expensive, the pre-stressed beams are profitable when using 0.5-1.5 per cent reinforcement. At higher reinforcement amounts the cost for reinforcement outweighs the gain in glulam reduction. Even though all lengths show profitable results, when glulam is the most expensive and are within the recommended reinforcement span, it is the longer and higher beams that produces the best results. When the price of glulam is low all beams show poor results.
The comparison shows that when considering the cost per beam, longer beams are more profitable. With the requirement that glulam must be at its most expensive level and that the reinforcement amount does not exceed approximately 1.5 per cent. The best reinforcement configuration is at 1.0 per cent.

CHALMERS, Civil and Enviro
Figure 7.1 Beam length comparison; width = 215mm, L=length [m], h=height
[mm]
Figure 7.2 Beam length comparison; width = 215mm, L=length [m], h=height
[mm]
Civil and Environmental Engineering, Master’s Thesis 2011:52
Beam length comparison; width = 215mm, L=length [m], h=height
Beam length comparison; width = 215mm, L=length [m], h=height
45
Beam length comparison; width = 215mm, L=length [m], h=height
Beam length comparison; width = 215mm, L=length [m], h=height

CHALMERS46
7.1.2 Project comparison
Compared to the cost per beam analysis the project savings show very promising results, which can be seen in has a large influence, all beams show profitable results, except for one when the beam is highly reinforced. As for tshow best results when the glulam price is higher and tconfiguration is at 1.5 per cent
When the glulam price is set to the lowest price the best reinforcement configuration for the longer beams are at 1.0 becomes less profitable then the 18 metre, which depends oncost compared to project saving is higher for the longer beams
The project analysis showis the longer and higher beams that show the highest profitshorter and lower beams are positive as well. The results are optimized when the reinforcement amount is 1.0
Figure 7.3 Beam length comparison; width = 215mm, L=length [m], h=height
[mm]
CHALMERS, Civil and Environmental Engineering, Master’s Thesis
Project comparison
Compared to the cost per beam analysis the project savings show very promising results, which can be seen in Figure 7.3 and Figure 7.4. Even though the glulam price
all beams show profitable results, except for one when the beam is highly reinforced. As for the single beam analysis the longer and higher beams
when the glulam price is higher and the best reinforcement per cent.
When the glulam price is set to the lowest price the best reinforcement configuration e longer beams are at 1.0 per cent. After this amount the 25 metre long beam
becomes less profitable then the 18 metre, which depends on the fact cost compared to project saving is higher for the longer beams
analysis showed good results regardless of which price the glulam has. is the longer and higher beams that show the highest profit but the results from the shorter and lower beams are positive as well. The results are optimized when the reinforcement amount is 1.0-1.5 per cent of the original cross-section area.
Beam length comparison; width = 215mm, L=length [m], h=height
, Master’s Thesis 2011:52
Compared to the cost per beam analysis the project savings show very promising . Even though the glulam price
all beams show profitable results, except for one when the beam he single beam analysis the longer and higher beams
he best reinforcement
When the glulam price is set to the lowest price the best reinforcement configuration . After this amount the 25 metre long beam
that the beams’
d results regardless of which price the glulam has. It the results from the
shorter and lower beams are positive as well. The results are optimized when the section area.
Beam length comparison; width = 215mm, L=length [m], h=height
CHALMERS, Civil and Enviro
Figure 7.4 Beam length comparison;
[mm]
7.2 Comparison
This comparison is made to find out whether the for wider or narrower beams. The lengths of the beams are 18 metres. It has to be noted that this analysis still uses the height reduction method, but widths.
7.2.1 Single beam comparison
The results for this comparison are highly affected by the price of glulam. This analysis also shows that the largestprice is high and when there is between 0.5 and 1.5 shown in Figure 7.5. As before, when the glulam hasare the most expensive and no beam is profitable, as can be seen in
Civil and Environmental Engineering, Master’s Thesis 2011:52
Beam length comparison; width = 215mm, L=length [m], h=height
Comparison of various beam widths
This comparison is made to find out whether the pre-stressing method is more suitable beams. The lengths of the beams are 18 metres. It has to be
this analysis still uses the height reduction method, but
Single beam comparison
he results for this comparison are highly affected by the price of glulam. This ysis also shows that the largest beams are the most profitable, w
price is high and when there is between 0.5 and 1.5 percent reinforcement, which is . As before, when the glulam has its lowest price the
are the most expensive and no beam is profitable, as can be seen in Figure
47
width = 215mm, L=length [m], h=height
thod is more suitable beams. The lengths of the beams are 18 metres. It has to be
this analysis still uses the height reduction method, but with different
he results for this comparison are highly affected by the price of glulam. This beams are the most profitable, when the glulam
reinforcement, which is the larger beams
Figure 7.6.

CHALMERS48
Figure 7.5 Beam width comparison; length = 18m, w=width [mm], h=height [mm]
Figure 7.6 Beam width comparison; length = 18m, w=width [mm], h=height [mm]
CHALMERS, Civil and Environmental Engineering, Master’s Thesis
Beam width comparison; length = 18m, w=width [mm], h=height [mm]
Beam width comparison; length = 18m, w=width [mm], h=height [mm]
, Master’s Thesis 2011:52
Beam width comparison; length = 18m, w=width [mm], h=height [mm]
Beam width comparison; length = 18m, w=width [mm], h=height [mm]

CHALMERS, Civil and Enviro
7.2.2 Project comparison
The project savings comparison show similar results as for the beam length comparison. The best reinforcement configuration, when glulam is at its most expensive level, as seen in narrower beam the best configuration is at 2.0 show the best result, when glulam is at its mossmaller beams reduce their crossgreater for the larger beams thapositive results is of mostbeam, since this gives the competitive in.
When the glulam is at its lowest similar. At higher amountprofitable, shown in Figure results become.
Figure 7.7 Beam width comparison; length = 18m, w=width [mm], h=height [mm]
Civil and Environmental Engineering, Master’s Thesis 2011:52
Project comparison
The project savings comparison show similar results as for the beam length comparison. The best reinforcement configuration, when glulam is at its most expensive level, as seen in Figure 7.7, is at 1.5 percent for the wider beams. For the narrower beam the best configuration is at 2.0 per cent. Once again the show the best result, when glulam is at its most expensive level. If the largersmaller beams reduce their cross-section with the same percentage the savings will be
beams than for the smaller ones. The fact that all beams show most importance for the competitiveness for the
beam, since this gives the pre-stressed beams a large section of market to be
its lowest price the profits at 1.0 percent reinforcement aret higher amounts of reinforcement the narrowest beam is the mos
Figure 7.8, but also that the higher the beam is
Beam width comparison; length = 18m, w=width [mm], h=height [mm]
49
The project savings comparison show similar results as for the beam length comparison. The best reinforcement configuration, when glulam is at its most
for the wider beams. For the . Once again the larger beams
t expensive level. If the larger and the the savings will be
he fact that all beams show for the pre-stressed
beams a large section of market to be
reinforcement are of reinforcement the narrowest beam is the most
he higher the beam is, the better the
Beam width comparison; length = 18m, w=width [mm], h=height [mm]

CHALMERS50
Figure 7.8 Beam width comparison; length = 18m, w=width [mm], h=height [mm]
7.3 Comparison with various grades o
force
The method established in this force, compared to the force applied to the beams that were used to verify the model. The verification beams had approximately 200% of the the model, without any buckling problems.can therefore be higher. How much higherin is examined in this sub-
In this part the analysis wasstressing force the model showed as the maximum
7.4 Single beam comparison
The results from the cost per beam analysis are shown in The results show an expected behaviourbecomes the greater the profitconfiguration that generates best results, for the beams with increased force, is at 0.5 per cent. The important part the results are positive, unlike
CHALMERS, Civil and Environmental Engineering, Master’s Thesis
Beam width comparison; length = 18m, w=width [mm], h=height [mm]
son with various grades on the pre
The method established in this thesis allows for quite small amount of force, compared to the force applied to the beams that were used to verify the model. The verification beams had approximately 200% of the pre-stressing force
any buckling problems. The in practice used pre-therefore be higher. How much higher and what economic consequences it results
-chapter.
In this part the analysis was made with 100%, 200% and 300% of the calculated force the model showed as the maximum pre-stressing force.
Single beam comparison
results from the cost per beam analysis are shown in Figure 7.9 and expected behaviour pattern. The higher the pre-
the profits become. Compared to earlier results the reinforcement nerates best results, for the beams with increased force, is at 0.5
. The important part in this comparison is that when the glulam price is low the results are positive, unlike the seen results in the previous analysis.
, Master’s Thesis 2011:52
Beam width comparison; length = 18m, w=width [mm], h=height [mm]
pre-stressing
allows for quite small amount of pre-stressing force, compared to the force applied to the beams that were used to verify the model.
force applied in -stressing force
what economic consequences it results
made with 100%, 200% and 300% of the calculated pre-
and Figure 7.10. -stressing force
. Compared to earlier results the reinforcement nerates best results, for the beams with increased force, is at 0.5
this comparison is that when the glulam price is low

CHALMERS, Civil and Enviro
Figure 7.9 Various pre
of calculated acceptable
Figure 7.10 Various pre
of calculated acceptable
7.5 Project comparison
In Figure 7.11 and Figure good results. The thing to be noted is the reinforcement configuration. For the best
Civil and Environmental Engineering, Master’s Thesis 2011:52
pre-stressing force; length=18 m, width=215 mm, P= amount
of calculated acceptable pre-stressing force, h=height [mm]
pre-stressing force; length=18 m, width=215 mm, P= amount
of calculated acceptable pre-stressing force, h=height [mm]
Project comparison
Figure 7.12 the project savings are displayed. All beams show hing to be noted is the reinforcement configuration. For the best
51
force; length=18 m, width=215 mm, P= amount
force, h=height [mm]
th=18 m, width=215 mm, P= amount
force, h=height [mm]
the project savings are displayed. All beams show hing to be noted is the reinforcement configuration. For the best

CHALMERS52
result the configuration varies between the different levels of force applied. When the force is 300% of the calculated value the best reinforcement configuration is at 0.5%, for 200% it is at 1.0 % and for 100% it is at 1.5 %.
Figure 7.11 Various pre
of calculated acceptable
Figure 7.12 Various pre-stressing
calculated acceptable
CHALMERS, Civil and Environmental Engineering, Master’s Thesis
result the configuration varies between the different levels of force applied. When the force is 300% of the calculated value the best reinforcement configuration is at 0.5%,
% and for 100% it is at 1.5 %.
pre-stressing force; length=18 m, width=215 mm, P= amount
of calculated acceptable pre-stressing force, h=height [mm]
stressing force; length=18 m, width=215 mm, P= amount of
calculated acceptable pre-stressing force, h=height [mm]
, Master’s Thesis 2011:52
result the configuration varies between the different levels of force applied. When the force is 300% of the calculated value the best reinforcement configuration is at 0.5%,
force; length=18 m, width=215 mm, P= amount
force, h=height [mm]
force; length=18 m, width=215 mm, P= amount of
force, h=height [mm]
CHALMERS, Civil and Environmental Engineering, Master’s Thesis 2011:52 53
8 CONCLUSION AND RECOMMENDATION
FOR FURTHER RESEARCH
8.1 Conclusion
The created model for pre-stressed glulam beams gain in the end a large span of functions and can handle many different types of settings for the glulam beams. It can calculate unreinforced, reinforced and pre-stressed beams given the beam’s geometry and reinforcement amount and placement. The model can also handle both the elastic and plastic phases which the glulam can experience, as well as detect and counter for yielding in the reinforcement. This gave a very flexible base model to conduct the different analyses that were chosen to be done.
The base model was verified through the results of two empirically-tested pre-stressed glulam beams. When the results from the tested beams were compared to the results from the model, with identical input parameters, the results were very much alike. The model was seen as verified for this thesis although only two beams are not enough to statistically prove the verification, but do however produce a satisfactory indication. The model gave however a higher maximum deflection than both of the tested beams.
From the model it has been shown that pre-stressed reinforcement increases the flexural resistance for the strengthened beam. The exact amount of increased maximum flexural resistance in ultimate limit state varies depending on the beams geometry and the amount of pre-stressing force allowed to be applied to the beam. As can be seen in Chapter 6, the amount of pre-stressing force greatly influences the amount of gained flexural resistance.
To more easily show the improved behaviour from the pre-stressing force and at the same time to provide a numerical basis for the economic analyses, the height reduction addition to the model was created. The height reduction calculation show that compared with an unreinforced beam, a pre-stressed beam of lower height required a lesser amount of reinforcement then a reinforced beam needed for the same height. This model also showed that the difference in maximal flexural resistance between pre-stressed beams with different quality glulam is very low.
In the economic analysis a comparison of costs and savings was made between a regular glulam beam and a pre-stressed glulam beam. With the given input parameters the pre-stressed beams showed good profitability. The pre-stressed beams generally showed their strongest competitiveness when the glulam was expensive, they had long spans and large cross-sections. The results showed that no more than 1.5 percent of reinforcement should be used, when considering the economical aspect.
The economic analysis considered two cases, one with cost per beam and one case were the beams were integrated in a project or building. Generally the pre-stressed beams showed negative results when only considering the cost per beam of the same quality and when the glulam was least expensive. However when introducing a higher pre-stressing force, than the limitation according to EC5 sets, the pre-stressed beams were economical competitive to regular glulam beams. The analysis showed that, for almost all beams analysed, pre-stressed beams were more economical than unreinforced beams when integrated into a building project. It might however be hard to influence the producers and the users if the cost per beam is not more competitive then we were hoping for.

CHALMERS, Civil and Environmental Engineering, Master’s Thesis 2011:52 54
8.2 Recommendation for further research
Adding the reinforcement on the compressive side of the beam, should have an additional positive effect for the beam. The distribution recommended by Jacob and Garzon (2007) assigns too much of the reinforcement to the compressive side. A similar study to that made by Jacob and Garzon (2007) but for pre-stressed glulam beams would perhaps give a better indication, though the number will most likely not be fixed as was the case for the reinforced beam.
In the pre-stressed beams, the reinforcement was placed in the same position as the reinforced beams. This however might not be the most beneficial position due to the lever arm e. Studies to find a better location for the reinforcement might also improve the beam’s performance.
As discussed in Chapter 5.3, a more advanced calculation method for the deflection would most likely improve the deflection results from the model.
In the model the limitations for the magnitude of the pre-stressing force are probably too rigid, at least compared to other work done in this field. A further analysis of the beam´s behaviour, when pre-stressed, might give a possibility to reduce these limitations and thereby increase the maximum allowable pre-stressing force.
Taking creep and relaxation into account would give the model a possibility to calculate long term loads and deflections, which it cannot now do.
In the economic analysis different widths of the beams were compared. However theses were made using our height-reduction model. The cost per beam might be more competitive if an analysis was made with a determined height and a reduction of the width instead. An analysis of different glulam classes is also of interest. The performance analysis showed that the pre-stressing effect varied little with different glulam properties. Therefore a low-grade glulam with a small material cost would be highly competitive.
The cost of GL24h and the difference in price to GL40c should be examined. Since it was shown that the difference in maximum flexural resistance in ULS was very low when the beams were pre-stressed, there might be further savings to be made by using lower quality timber.
If the price for GL40c becomes very high, it might also be cost efficient to instead strengthen a lower quality beam with pre-stressed reinforcement to take the GL40c’s place.

CHALMERS, Civil and Environmental Engineering, Master’s Thesis 2011:52 55
9 REFERENCE
Al-Emrani, M., Engström, B., Johansson, M., Johansson, P.,(2008): Bärande
Konstruktioner,del 2{Load bearing Constructions, part 2. In Swedish} Department of Civil and Environmental Engineering, Chalmers University of Technology, Göteborg, Sweden, 2008, B232pp
Brunner, M., Schnueriger, M., (2005): Timber beams strengthened by attaching
prestressed carbon FRP laminates with a gradiented anchoring device.
Internationel Institute for FRP in Counstruction, Hong Kong, 2005
Burström, P G. (2007): Byggnadsmaterial – Uppbyggnad, tillverkning och
egenskaper{(Building materials – In Swedish)}. Studentlitteratur, Lund, {Sweden}, {2007}, 562 pp
Dolan, C.W., Galloway, T.L., Tsunemori, A. (1997): Pre-stressed Glued-Laminated
Timber Beam – Pilot Study.ASCE Journal of Composites for Construction, Vol. 1, No. 1, February 1997, pp. 10-16
Engström, B. (2010A): Design and analysis of pre-stressed concrete
structures.Department of Civil and Environmental Engineering, Chalmers University of Technology,Göteborg, Sweden, 2010, 191pp
Engström, B. (2010B): Design and analysis of continuous beams and
columns.Department of Civil and Environmental Engineering, Chalmers University of Technology,Göteborg, Sweden, 2010, 131pp
Gulbrandsen, E (2011) Tenroc Technologies; oral information during consecutive meetings
Guan, Z.W., Rodd, P.D., Pope, D.J. (2005): Study of glulam beams pre-stressed with pultruded GRP. Computers and Structures, Vol. 83, 2005, pp. 2476-2487
Haghani, R, (2010): Anchorage of pre-stressed FRP laminates used to strengthen
structural members. Department of Civil and Environmental Engineering, Chalmers University of Technology, Göteborg, Sweden. (2010)
Illston, J.M., Domone, P.L.J. (2001): Construction materials – their nature and
behavior. Spon Press, London and New York, {England and USA}, {2001}, 554 pp
Jacob, J., Garzon, O.L. (2007): Flexural Strengthening of Glued Laminated Timber
Beams with Steel and Carbon Fiber Reinforced Polymers. Master´s Thesis. Department of Civil and Environmental Engineering, Chalmers University of Technology, Publication no. 2007:28, Göteborg, Sweden, 2007, 152 pp.
Peters, S.T., (1998): Handbook of composites – Second edition, Chapman & Hall, {ISBN: 0-412-54020-7}, London, {United Kingdom}, {1998}, 1118 pp
Porteous, J., Kermani A. (2007):Structural Timber Design to Eurocode 5, Blackwell Publishing Ltd, Oxford, UK, (2009), 542pp
Ritter, M.A., Wacker, J.P., Duwadi, S.R. (1995): Field Performance of Stress-
Laminated Timber Bridges on Low-Volume Roads. Proceeding of 6th International Conference of Low-Volume Roads, Vol. 2, {June} 1995, pp. 347-356

CHALMERS, Civil and Environmental Engineering, Master’s Thesis 2011:52 56
Silva-Henriquez, R., Gray, H., Dagher, H.J., Davids, W.G., Nader, J. (2009): Strength Performance of Pre-stressed Glass Fiber-Reinforced Polymer, Glued-Laminated Beams. Forest Products Journal, Vol. 60, No. 1, June 2009, pp. 33-39
Svenskt Limträ AB (2007): Limträguide {Guide toglulam. In Swedish}, Svenskt Limträ AB, {ISBN: 91-630-3868-4}, Stockholm,{Sweden}, {2007}, 66 pp
The steel construction institute (1992): Steel Designer’s Manual – Fifth Edition, Blackwell Science Ltd, {ISBN:0-632-03877-2}, London, {United Kingdom}, {1992}, 1266 pp.
Triantafillou, T.C., Deskovic, N (1992): Pre-stressed FRP Sheets as External Reinforcement of Wood Members. ASCE Journal of Structural Engineering, Vol. 118, No. 5, May 1992, pp. 1270-1284
Yahyaei-Moayyed, M., Taheri, F. (2010A): Creep response of glued-laminated beam reinforced with pre-stressed sub-laminated composite. Construction and Building
Materials (2010), doi:10.1016/j.conbuildmat.2010.11.078, 12 pp.

CHALMERS, Civil and Environmental Engineering, Master’s Thesis 2011:52 1
10 APPENDICES
10.1 Appendix A: The MathCAD for the model
1. Input
1.1 Load and service class
Load
Loads considered to be permanent, such as roof joists and cladding
Loadcases 1 = Uniformly distributed load 2 = Concentrated load at mid span 3 = Triangular load (load Q at one end and zero load at the other end)
Type of imposed load 1 = Domestic, residential areas 2 = Office areas 3 = Congregation areas 4 = Shopping areas 5 = Storage areas 6 = Traffic area, vehicle weight < 30kN 7 = Traffic area, 30kN < vehicle weight < 160kN 8 = Snow loads on buildings, Finland, Iceland, Norway, Sweden
Load duration class 1 = Permanent action (self-weight) 2 = Long term action (storage) 3 = Medium term action (imposed floor load, snow) 4 = Short term action (wind) 5 = Instantaneous action (accidental load)
Service class Service class 1 = 20*C and RH<65% 2 = 20*C and RH<85% 3 = Worse than class 2
1.2 Material data
Glulam
Gperm 0N
m:=
Loadcase 1:=
Load_type 8:=
Load_duration 3:=
Service_class 2:=
ρGL 380kg
m3
:= γ M.GL 1.25:=
fm.k.GL 28MPa:= fv.0.k.GL 2.7MPa:= fc.90.k.GL 2.7MPa:=
fc.0.k.GL 24MPa:= ft.0.k.GL 36.5MPa:=
E0.k.GL.mean 11.6GPa:= E0.k.GL.0.05 9.4GPa:= Gk.GL.mean 0.72GPa:=

CHALMERS, Civil and Environmental Engineering, Master’s Thesis 2011:52 2
Reinforcement
1.3 Geometry and cross-section properties
General beam dimensions
Slack-reinforced glulam beam
Number of reinforcement rods in compression and tension side
Dimensions of reinforcement rods
Pre-stressed glulam beam
Number of reinforcement rods in compression and tension side
Dimensions of reinforcement rods
1.4 SLS limits
Accepted deflections
Instantaneous Final Final with consideration to pre-camber
2. Material and geometry properties
2.1 Load and service class
2.2 Material data
Glulam
(EN 1995-1-1:2004 (3.2))
ρRF 1400kg
m3
:= γ M.RF 1.15:=
E0.k.RF 165GPa:= ft.0.k.RF 2800MPa:= fy.RF.d 500MPa:=
h 0.7m:= w 0.215m:= Ls 10m:=
nc.RF.s 1:= nt.RF.s 2:=
hRF.s 70mm:= wRF.s 10mm:= %ARF.slack
nc.RF.s nt.RF.s+( ) hRF.s⋅ wRF.s⋅
h w⋅1.395 %⋅=:=
nc.RF.p 1:= nt.RF.p 2:=
hRF.p 70mm:= wRF.p 10mm:= %ARF.pre
nc.RF.p nt.RF.p+( ) hRF.p⋅ wRF.p⋅
h w⋅1.395 %⋅=:=
δlim.inst
Ls
400:= δlim.fin
Ls
250:= δlim.net.fin
Ls
250:=
kmod 0.8= kdef 0.8= ψ0 0.7= ψ1 0.5= ψ2 0.2=
kh 1.0 h 0.6m≥if
min0.6m
h
0.1
1.1,
otherwise
:=
kh 1=

CHALMERS, Civil and Environmental Engineering, Master’s Thesis 2011:52 3
Reinforcement
2.3 Geometry and cross-section properties
General
Regular glulam beam
G0.k.GL.0.05
E0.k.GL.0.05
160.588 GPa⋅=:=
fm.d.GL
fm.k.GL
γ M.GL
kh⋅ kmod⋅ 17.92 MPa⋅=:= fv.0.d.GL
fv.0.k.GL
γ M.GL
kmod⋅ 1.728 MPa⋅=:=
fc.0.d.GL
fc.0.k.GL
γ M.GL
kmod⋅ 15.36 MPa⋅=:= ft.0.d.GL
ft.0.k.GL
γ M.GL
kh⋅ kmod⋅ 23.36 MPa⋅=:=
fc.90.d.GL
fc.90.k.GL
γ M.GL
kmod⋅ 1.728 MPa⋅=:=
E0.d.GL.mean
E0.k.GL.mean
γ M.GL
9.28 GPa⋅=:= Gd.GL.mean
Gk.GL.mean
γ M.GL
0.576 GPa⋅=:=
εc.k.ult
fc.0.k.GL
E0.k.GL.mean
2.069 103−
×=:= ε t.k.ult
ft.0.k.GL
E0.k.GL.mean
3.147 103−
×=:=
εc.d.ult
fc.0.d.GL
E0.d.GL.mean
1.655 103−
×=:= ε t.d.ult
ft.0.d.GL
E0.d.GL.mean
2.517 103−
×=:=
E0.d.RF
E0.k.RF
γ M.RF
143.478 GPa⋅=:=ft.0.d.RF
ft.0.k.RF
γ M.RF
2.435 109
× Pa=:=
αk
E0.k.RF
E0.k.GL.mean
14.224=:=αd
E0.d.RF
E0.d.GL.mean
15.461=:=
Abeam h w⋅ 0.15m2
=:=
Areg Abeam 0.15m2
=:= Wy.regw h
2⋅
60.018 m
3⋅=:=
Iy.regw h
3⋅
126.145 10
3−× m
4=:= Iz.reg
h w3
⋅
125.797 10
4−× m
4=:=
zNA.d.regh
20.35m=:=

CHALMERS, Civil and Environmental Engineering, Master’s Thesis 2011:52 4
Slack-reinforced glulam beam
Transformation of the section with reinforcement
Creating the ekvalent section for the beam
Calculating neutral axies (from top fiber and down)
Calculating Iy, Iz and Wy, design values
Aslack.RF nc.RF.s nt.RF.s+( ) hRF.s⋅ wRF.s⋅ 2.1 103−
× m2
=:=
Ac.RF.s hRF.s wRF.s⋅ nc.RF.s⋅:= At.RF.s hRF.s wRF.s⋅ nt.RF.s⋅:=
Aslack.GL Abeam Aslack.RF− 0.148m2
=:=
Ad.trans.s h w⋅ αd 1−( ) nc.RF.s hRF.s⋅ wRF.s⋅ nt.RF.s hRF.s⋅ wRF.s⋅+( )⋅+ 0.181m2
=:=
Zc.s
hRF.s
20.035m=:= Zt.s
hRF.s
20.035m=:=
zNA.d.slack
Ac.RF.s E0.d.RF⋅hRF.s
2⋅ At.RF.s E0.d.RF⋅ h
hRF.s
2−
⋅+1
2w⋅ h
2⋅ E0.d.GL.mean⋅+
E0.d.RF Ac.RF.s⋅ E0.d.RF At.RF.s⋅+ w h⋅ E0.d.GL.mean⋅+0.369m=:=
Iy.d.slackw h
3⋅
12h w⋅ zNA.d.slack
h
2−
2
⋅+
αd 1−( )nc.RF.s wRF.s⋅ hRF.s
3⋅
12
Ac.RF.s zNA.d.slack
hRF.s
2−
2
⋅+
nt.RF.s wRF.s⋅ hRF.s3
⋅
12At.RF.s h zNA.d.slack−
hRF.s
2−
2
⋅++
...
⋅+
...:=
Iz.c.d.slack αd 1−( )hRF.swRF.s
3⋅
12⋅ nc.RF.s 1if
αd 1−( )1
nc.RF.s
2
n
2hRF.swRF.s
3⋅
12
hRF.swRF.s⋅w
2 nc.RF.s 1+( )⋅2n 1−( )⋅
2
⋅+
...
∑=
nc.RF.s
2
∈Zif
αd 1−( )hRF.swRF.s
3⋅
12
2
nc.RF.s 1+
2
n
2hRF.swRF.s
3⋅
12
hRF.swRF.s⋅w
nc.RF.s 1+( )n 1−( )⋅
2
⋅+
∑=
+
...
otherwise
:=

CHALMERS, Civil and Environmental Engineering, Master’s Thesis 2011:52 5
Pre-stressed glulam beam
Transformation of the section with reinforcement
Iz.t.d.slack αd 1−( )hRF.s wRF.s
3⋅
12⋅ nt.RF.s 1if
αd 1−( )1
nt.RF.s
2
n
2hRF.s wRF.s
3⋅
12
hRF.s wRF.s⋅w
2 nt.RF.s 1+( )⋅2n 1−( )⋅
2
⋅+
...
∑=
nt.RF.s
2
∈ Zif
αd 1−( )hRF.s wRF.s
3⋅
12
2
nt.RF.s 1+
2
n
2hRF.s wRF.s
3⋅
12
hRF.s wRF.s⋅w
nt.RF.s 1+( )n 1−( )⋅
2
⋅+
∑=
+
...
otherwise
:=
Iz.d.slackh w
3⋅
12Iz.c.d.slack+ Iz.t.d.slack+:=
zmax.d.slack max zNA.d.slack h zNA.d.slack−, ( ) 0.369m=:= Wy.d.slack
Iy.d.slack
zmax.d.slack
0.025m3
⋅=:=
Stop.d.slack zNA.d.slack w⋅zNA.d.slack
2⋅ 0.015 m
3⋅=:=
Sbot.d.slack h zNA.d.slack−( ) w⋅h zNA.d.slack−
2⋅ 0.012 m
3⋅=:=
Sd.slack max Stop.d.slack Sbot.d.slack, ( ) 0.015 m3
⋅=:=
Iy.d.slack 9.115 103−
× m4
⋅= Iz.d.slack 6.06 104−
× m4
= Wy.d.slack 0.025 m3
⋅=
Sd.slack 0.015 m3
⋅=
Apre.RF nc.RF.p nt.RF.p+( ) hRF.p⋅ wRF.p⋅ 2.1 103−
× m2
=:=
Ac.RF.p hRF.p wRF.p⋅ nc.RF.p⋅:= At.RF.p hRF.p wRF.p⋅ nt.RF.p⋅:=
Apre.GL Abeam Apre.RF− 0.148m2
=:=
Ad.trans.p h w⋅ αd 1−( ) nc.RF.p hRF.p⋅ wRF.p⋅ nt.RF.p hRF.p⋅ wRF.p⋅+( )⋅+ 0.181m2
=:=

CHALMERS, Civil and Environmental Engineering, Master’s Thesis 2011:52 6
Creating the ekvalent section for the beam
Calculating neutral axies (from top fiber and down)
Calculating Iy, Iz and Wy, design values
Zc.p
hRF.p
20.035m=:= Zt.p
hRF.p
20.035m=:=
zNA.d.pre
Ac.RF.pE0.d.RF⋅hRF.p
2⋅ At.RF.p E0.d.RF⋅ h
hRF.p
2−
⋅+1
2w⋅ h
2⋅ E0.d.GL.mean⋅+
E0.d.RFAc.RF.p⋅ E0.d.RF At.RF.p⋅+ w h⋅ E0.d.GL.mean⋅+0.369m=:=
Iy.d.prew h
3⋅
12h w⋅ zNA.d.pre
h
2−
2
⋅+
αd 1−( )nc.RF.p wRF.p⋅ hRF.p
3⋅
12
Ac.RF.p zNA.d.pre
hRF.p
2−
2
⋅+
nt.RF.p wRF.p⋅ hRF.p3
⋅
12At.RF.p h zNA.d.pre−
hRF.p
2−
2
⋅++
...
⋅+
...:=
Iz.c.d.pre αd 1−( )hRF.pwRF.p
3⋅
12⋅ nc.RF.p 1if
αd 1−( )1
nc.RF.p
2
n
2hRF.pwRF.p
3⋅
12
hRF.pwRF.p⋅w
2 nc.RF.p 1+( )⋅2n 1−( )⋅
2
⋅+
...
∑=
nc.RF.p
2
∈Zif
αd 1−( )hRF.pwRF.p
3⋅
12
2
nc.RF.p 1+
2
n
2hRF.pwRF.p
3⋅
12
hRF.pwRF.p⋅w
nc.RF.p 1+( )n 1−( )⋅
2
⋅+
∑=
+
...
otherwise
:=

CHALMERS, Civil and Environmental Engineering, Master’s Thesis 2011:52 7
Calculating the bending resistance
2.4 Self-weights and other load considered as permanent load
Self-weight - regular beam
Self-weight - slack-reinforced beam
Iz.t.d.pre αd 1−( )hRF.pwRF.p
3⋅
12⋅ nt.RF.p 1if
αd 1−( )1
nt.RF.p
2
n
2hRF.pwRF.p
3⋅
12
hRF.pwRF.p⋅w
2 nt.RF.p 1+( )⋅2n 1−( )⋅
2
⋅+
...
∑=
nt.RF.p
2
∈ Zif
αd 1−( )hRF.pwRF.p
3⋅
12
2
nt.RF.p 1+
2
n
2hRF.pwRF.p
3⋅
12
hRF.pwRF.p⋅w
nt.RF.p 1+( )n 1−( )⋅
2
⋅+
∑=
+
...
otherwise
:=
Iz.d.preh w
3⋅
12Iz.c.d.pre+ Iz.t.d.pre+ 6.06 10
4−× m
4=:=
zmax.d.pre max zNA.d.pre h zNA.d.pre−( ), 0.369m=:=Wy.d.pre
Iy.d.pre
zmax.d.pre
0.025 m3
⋅=:=
Stop.d.pre zNA.d.pre w⋅zNA.d.pre
2⋅ 0.015 m
3⋅=:=
Sbot.d.pre h zNA.d.pre−( ) w⋅h zNA.d.pre−
2⋅ 0.012m
3⋅=:=
Sd.pre max Stop.d.pre Sbot.d.pre, ( ) 0.015m3
⋅=:=
Iy.d.pre 9.115 103−
× m4
⋅= Iz.d.pre 6.06 104−
× m4
= Wy.d.pre 0.025 m3
⋅=
Sd.pre 0.015 m3
⋅=
Greg Areg ρGL⋅ g⋅ Gperm+ 560.842N
m⋅=:=
Gslack g Aslack.GLρGL⋅ Aslack.RF ρRF⋅+( )⋅ Gperm+ 581.848N
m⋅=:=

CHALMERS, Civil and Environmental Engineering, Master’s Thesis 2011:52 8
Self-weight - pre-stressed beam
2.5 Calculated material parameters
Regular glulam beam
Slack-reinforced glulam beam
Pre-stressed glulam beam
Gpre g Apre.GL ρGL⋅ Apre.RF ρRF⋅+( )⋅ Gperm+ 581.848N
m⋅=:=
EId.ef.reg E0.d.GL.mean Iy.reg⋅ 5.703 107
× N m2
⋅⋅=:=
EId.ef.slack E0.d.GL.meanw h
3⋅
12h w⋅ zNA.d.slack
h
2−
2
⋅+
⋅
E0.d.GL.mean αd 1−( )⋅
nc.RF.s wRF.s⋅ hRF.s3
⋅
12
Ac.RF.s zNA.d.slack
hRF.s
2−
2
⋅+
...
nt.RF.s wRF.s⋅ hRF.s3
⋅
12
+
...
At.RF.s h zNA.d.slack−hRF.s
2−
2
⋅+
...
⋅+
...:=
EId.ef.slack 8.459 107
× N m2
⋅⋅=
EId.ef.pre E0.d.GL.meanw h
3⋅
12h w⋅ zNA.d.pre
h
2−
2
⋅+
⋅
E0.d.GL.mean αd 1−( )⋅
nc.RF.p wRF.p⋅ hRF.p3
⋅
12
Ac.RF.p zNA.d.pre
hRF.p
2−
2
⋅+
...
nt.RF.p wRF.p⋅ hRF.p3
⋅
12
+
...
At.RF.p h zNA.d.pre−hRF.p
2−
2
⋅+
...
⋅+
...:=
EId.ef.pre 8.459 107
× N m2
⋅⋅=

CHALMERS, Civil and Environmental Engineering, Master’s Thesis 2011:52 9
3. Capacity
3.1 Capacity of regular glulam beam
3.1.1 Bending
The beam is fully suported against lateral movements
3.1.2 Bending with consideration to lateral torsional stability
The beam is restrained against torsional rotation at ends, prevented from moving laterally at ends
3.1.2 Bending using our model
Elastic phase
fm.d.reg fm.d.GL 1.792 107
× Pa=:= Mcap.EC5.d.reg fm.d.reg Wy.reg⋅ 3.146 105
× N m⋅⋅=:=
Itorw
3h⋅
31 0.63
w
h
⋅−
⋅ 1.87 103−
× m4
=:=
Lef 0.9 Ls⋅ 2 h⋅+ Loadcase 1if
0.8 Ls⋅ 2 h⋅+ Loadcase 2if
0.53 Ls⋅ 2 h⋅+ Loadcase 3if
10.4m=:=
My.crit
π E0.k.GL.0.05 Iz.reg⋅ G0.k.GL.0.05⋅ Itor⋅⋅
Lef
7.392 105
× N m⋅⋅=:=
σm.crit
My.crit
Wy.reg
4.21 107
× Pa=:=
λrel.m
fm.k.GL
σm.crit
0.816=:=
kcrit 1 λrel.m 0.75≤if
1.56 0.75 λrel.m⋅− 0.75 λrel.m< 1.4≤if
1
λrel.m2
1.4 λrel.m<if
0.948=:=
fm.buck.d.reg fm.d.GL kcrit⋅:=
Mcap.buck.d.reg fm.buck.d.reg Wy.reg⋅:=
fm.buck.d.reg 1.699 107
× Pa= Mcap.buck.d.reg 2.984 105
× N m⋅⋅=
εc.limit.e.r
fc.0.d.GL
E0.d.GL.mean
1.655 103−
×=:=

CHALMERS, Civil and Environmental Engineering, Master’s Thesis 2011:52 10
Plastic phase
ε t.limit.r
ft.0.d.GL
E0.d.GL.mean
2.517 103−
×=:=
εc.init.e.r 109−
:=
εadd.r
εc.limit.e.r
1001.655 10
5−×=:=
Mcap.re.e
εc.GL.reg.e
ε t.GL.reg.e
Failure_modereg.e
i 0←
εc εc.init.e.r←
ε th
zNA.d.reg
1−
εc⋅←
Mεc E0.d.GL.mean⋅ w⋅ zNA.d.reg
2⋅
3
ε t E0.d.GL.mean⋅ w⋅ h zNA.d.reg−( )2⋅
3+
...←
bi
εc←
ci
ε t←
break ε t ε t.limit.r>if
ai
M1
J⋅←
i i 1+←
εc εc εadd.r+←
εc εc.limit.e.r<while
d "Tension" ε t ε t.limit.r>if
"Plastic phase" otherwise
←
a
b
c
d
:=
Mcap.reg.e Mcap.re.e J⋅:=
Failure_modereg.e "Plastic phase"=
Mcap.reg.el max Mcap.reg.e( ) 266.999kN m⋅=:=
εc.limit.pl.r 3εc.limit.e.r 4.966 103−
×=:=

CHALMERS, Civil and Environmental Engineering, Master’s Thesis 2011:52 11
εc.init.pl.r max εc.GL.reg.e( ) 1.639 103−
×=:=
Mcap.re.pl
εc.GL.reg.pl
ε t.GL.reg.pl
Failure_mode reg.pl
i 0←
εc εc.init.pl.r←
x fc.0.d.GL w⋅εc εc.limit.e.r−( )
εc
⋅
fc.0.d.GLw
2⋅ 1
εc εc.limit.e.r−
εc
−
⋅+
...
εcw
2⋅ E0.d.GL.mean⋅
−+
...
←
y εc w⋅ h⋅ E0.d.GL.mean⋅←
z εcw
2h
2⋅ E0.d.GL.mean⋅
−⋅←
zNA.ply− y
24 x⋅ z⋅−+
2 x⋅←
zpl
εc εc.limit.e.r−
εc
zNA.pl⋅←
ε th
zNA.pl
1−
εc⋅←
M fc.0.d.GL w⋅ zpl⋅ zNA.pl
zpl
2−
⋅
fc.0.d.GL
zNA.pl zpl−
2⋅ w⋅
2 zNA.pl zpl−( )3
⋅+
...
ε t E0.d.GL.mean⋅h zNA.pl−
2⋅ w⋅
2 h zNA.pl−( )3
⋅+
...
←
bi
εc←
ci
ε t←
break ε t ε t.limit.r>if
ai
M1
J⋅←
i i 1+←
εc εc εadd.r+←
εc εc.limit.pl.r<while
d "Tension" ε t ε t.limit.r>if
"Compression" otherwise
←
a
b
c
d
:=

CHALMERS, Civil and Environmental Engineering, Master’s Thesis 2011:52 12
3.1.4 Shear
3.2 Capacity of slack-reinforced glulam beam
3.2.1 Bending
Elastic phase
Mcap.reg.p Mcap.re.pl J⋅:=
Failure_modereg.pl "Tension"=
Mcap.reg.pl max Mcap.reg.p( ) 380.417kN m⋅=:=
Mcap.d.reg max Mcap.reg.el Mcap.reg.pl, ( ) 380.417kN m⋅⋅=:=
Vcap.d.reg
fv.0.d.GL Abeam⋅
1.51.734 10
5× N=:=
fv.d.reg fv.0.d.GL 1.728 106
× Pa=:= Vcap.d.reg 1.734 105
× N=
εc.limit.e.s
fc.0.d.GL
E0.d.GL.mean
1.655 103−
×=:=
ε t.limit.s
ft.0.d.GL
E0.d.GL.mean
2.517 103−
×=:=
εc.init.e.s 109−
:=
εadd.s
εc.limit.e.s
1001.655 10
5−×=:=

CHALMERS, Civil and Environmental Engineering, Master’s Thesis 2011:52 13
Mcap.slac.e
εc.GL.slack.e
ε t.GL.slack.e
σc.RF.slac.e
σt.RF.slac.e
Failure_modeslack.e
i 0←
εc εc.init.e.s←
ε th
zNA.d.slack
1−
εc⋅←
εRF.c
zNA.d.slack Zc.s−
zNA.d.slack
εc⋅←
εRF.t
h zNA.d.slack− Zt.s−
zNA.d.slack
εc⋅←
Mεc E0.d.GL.mean⋅ w⋅ zNA.d.slack
2⋅
3εRF.c E0.d.RF⋅ Ac.RF.s⋅ zNA.d.slack Zc.s−( )⋅+
...
ε t E0.d.GL.mean⋅ w⋅ h zNA.d.slack−( )2⋅
3+
...
εRF.t E0.d.RF⋅ At.RF.s⋅ h zNA.d.slack− Zt.s−( )⋅+
...
←
bi
εc←
ci
ε t←
di
εRF.c E0.d.RF⋅1
Pa⋅←
ei
εRF.t E0.d.RF⋅1
Pa⋅←
break ε t ε t.limit.s>if
ai
M1
J⋅←
i i 1+←
εc εc εadd.s+←
εc εc.limit.e.s<while
f "Tension" ε t ε t.limit.s>if
"Plastic phase" otherwise
←
a
b
c
d
e
f
:=

CHALMERS, Civil and Environmental Engineering, Master’s Thesis 2011:52 14
Plastic phase
Mcap.slack.e Mcap.slac.e J⋅:= σc.RF.slack.e σc.RF.slac.e Pa⋅:= σt.RF.slack.e σt.RF.slac.e Pa⋅:=
Failure_modeslack.e "Plastic phase"=
Mcap.slack.el max Mcap.slack.e( ) 383.779kN m⋅=:=
εc.limit.pl.s 3εc.limit.e.s 4.966 103−
×=:=
εc.init.pl.s max εc.GL.slack.e( ) 1.639 103−
×=:=
σRF.c.pl.init.s max σc.RF.slack.e( ) 2.128 108
× Pa=:=
σRF.t.pl.init.s max σt.RF.slack.e( ) 1.89 108
× Pa=:=

CHALMERS, Civil and Environmental Engineering, Master’s Thesis 2011:52 15
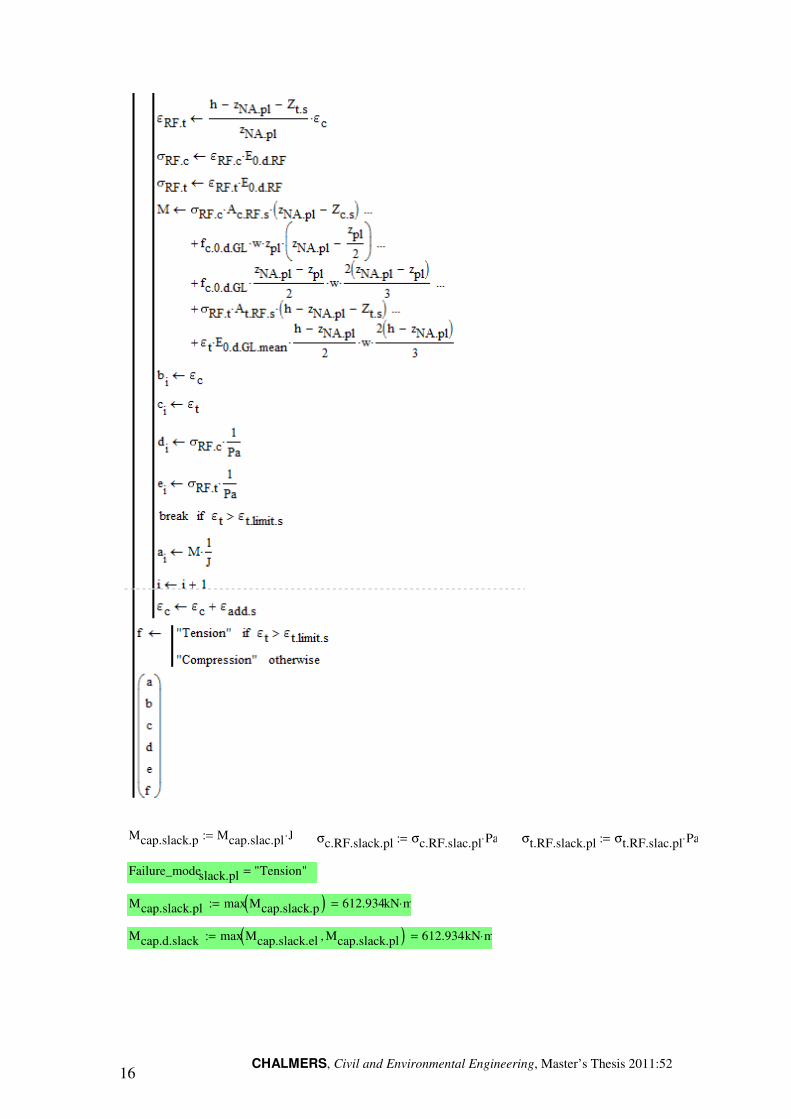
CHALMERS, Civil and Environmental Engineering, Master’s Thesis 2011:52 16
Mcap.slack.p Mcap.slac.pl J⋅:= σc.RF.slack.pl σc.RF.slac.pl Pa⋅:= σt.RF.slack.pl σt.RF.slac.pl Pa⋅:=
Failure_modeslack.pl "Tension"=
Mcap.slack.pl max Mcap.slack.p( ) 612.934kN m⋅=:=
Mcap.d.slack max Mcap.slack.el Mcap.slack.pl, ( ) 612.934kN m⋅⋅=:=

CHALMERS, Civil and Environmental Engineering, Master’s Thesis 2011:52 17
Shear
3.3 Capacity of pre-stressed glulam beam
3.3.1 Bending
Critical pre-tensioning force P.pre.d
Using linear elastic model
Tension capacity in reinforcement
Using EC5
fv.d.slack fv.0.d.GL 1.728 106
× Pa=:=
Vcap.d.slack
fv.d.slack Iy.d.slack⋅ w⋅
Sd.slack
2.318 105
× N=:=
εbot.preload.d εc.d.ult−:=
σbot.preload.d εbot.preload.d E0.d.GL.mean⋅ 15.36− MPa⋅=:=
eN.d h zNA.d.pre−hRF.p
2− 0.296m=:=
zgc.d zNA.d.pre 0.369m=:=
Ppre.linear.d σbot.preload.d
Abeam Iy.d.pre⋅
eN.d h zgc.d−( )⋅ Abeam⋅ Iy.d.pre+
⋅ 8.818− 105
× N⋅=:=
σtop.preload.d
Ppre.linear.d
Abeam
Ppre.linear.d eN.d⋅
Iy.d.pre
zgc.d−⋅+ 4.71 MPa⋅=:=
Ppre1.d Ppre.linear.d σtop.preload.d ft.0.d.GL<if
ft.0.d.GL−Abeam Iy.d.pre⋅
eN.d zgc.d⋅ Abeam⋅ Iy.d.pre+
⋅ otherwise
:=
Ppre1.d 8.818− 105
× N=
ft.0.d.RF 2.435 109
× Pa=
Ppre2.d ft.0.d.RF− nt.RF.p⋅ hRF.p⋅ wRF.p⋅:=
Ppre2.d 3.409− 106
× N=
Le Ls:= βc 0.1:= km 0.7:=
iy.d
Iy.d.pre
Abeam
0.246m=:=

CHALMERS, Civil and Environmental Engineering, Master’s Thesis 2011:52 18
iz.d
Iz.d.pre
Abeam
0.063m=:=
λy.d
Le
iy.d
40.634=:=
λz.d
Le
iz.d
157.593=:=
λrel.y.d
λy.d
π
fc.0.k.GL
E0.k.GL.0.05
⋅ 0.654=:=
λrel.z.d
λz.d
π
fc.0.k.GL
E0.k.GL.0.05
⋅ 2.535=:=
ky.d 0.5 1 βc λrel.y.d 0.3−( )⋅+ λrel.y.d2
+
⋅ 0.731=:=
kz.d 0.5 1 βc λrel.z.d 0.3−( )⋅+ λrel.z.d2
+
⋅ 3.824=:=
kc.y.d1
ky.d ky.d2
λrel.y.d2
−+
0.944=:=
kc.z.d1
kz.d kz.d2
λrel.z.d2
−+
0.15=:=
Pd.cr.EC5.y1
1
kc.y.d fc.0.d.GL⋅ Abeam⋅
eN.d
fm.d.GL Wy.d.pre⋅+
8.873 105
× N=:=
Pd.cr.EC5.z1
1
kc.z.d fc.0.d.GL⋅ Abeam⋅km
eN.d
fm.d.GL Wy.d.pre⋅⋅+
2.975 105
× N=:=
Ppre3.d max Pd.cr.EC5.y− Pd.cr.EC5.z−, ( ):=
Ppre3.d 2.975− 105
× N=
Ppre.d max Ppre1.d Ppre2.d, Ppre3.d, ( ):=
Ppre.d 2.975− 105
× N=

CHALMERS, Civil and Environmental Engineering, Master’s Thesis 2011:52 19
Elastic phase
σtop.init
Ppre.d
Ad.trans.p
Ppre.d eN.d⋅
Iy.d.pre
zNA.d.pre−( )⋅+ 1.921 106
× Pa=:=
σbot.init
Ppre.d
Ad.trans.p
Ppre.d eN.d⋅
Iy.d.pre
h zNA.d.pre−( )⋅+ 4.85− 106
× Pa=:=
εc.init.e.p
σtop.init
E0.d.GL.mean
2.07 104−
×=:=
ε t.init.p
σbot.init
E0.d.GL.mean
5.227− 104−
×=:=
εc.limit.e.p
fc.0.d.GL
E0.d.GL.mean
− 1.655− 103−
×=:=
ε t.limit.p
ft.0.d.GL
E0.d.GL.mean
2.517 103−
×=:=
εadd.p
εc.limit.e.p
1001.655− 10
5−×=:=

CHALMERS, Civil and Environmental Engineering, Master’s Thesis 2011:52 20
Plastic phase
σc.RF.pre.e σc.RF.pr.e Pa⋅:= σt.RF.pre.e σt.RF.pr.e Pa⋅:=Mcap.pre.e Mcap.pr.e J⋅:=
Failure_modepre.e "Plastic phase"=
Mcap.pre.el max Mcap.pre.e( ) 434.174kN m⋅=:=
εc.limit.pl.p 3εc.limit.e.p( )− 4.966 103−
×=:=
εc.init.pl.p min εc.GL.pre.e( )( )− 1.647 103−
×=:=

CHALMERS, Civil and Environmental Engineering, Master’s Thesis 2011:52 21
εc.limit.e.p εc.limit.e.p− 1.655 103−
×=:=
εadd.pl.p
εc.limit.e.p
1001.655 10
5−×=:=
εP
Ppre.d
E0.d.RF At.RF.p⋅− 1.481 10
3−×=:=
σRF.c.pl.init.p max σc.RF.pre.e( ) 2.407 108
× Pa=:=
σRF.t.pl.init.p max σt.RF.pre.e( ) 2.138 108
× Pa=:=
zav
Ppre.d
Ad.trans.p
−
Iy.d.pre⋅
max Mcap.pre.e( ) Ppre.d eN.d⋅+0.043m=:=
zNA.pl.init zNA.d.pre zav+ 0.412m=:=

CHALMERS, Civil and Environmental Engineering, Master’s Thesis 2011:52 22

CHALMERS, Civil and Environmental Engineering, Master’s Thesis 2011:52 23
Mcap.pre.p Mcap.pr.pl J⋅:= σc.RF.pre.pl σc.RF.pr.pl Pa⋅:= σt.RF.pre.pl σt.RF.pr.pl Pa⋅:=
Failure_modepre.pl "Tension"=
Mcap.pre.pl max Mcap.pre.p( ) 715.173kN m⋅=:=

CHALMERS, Civil and Environmental Engineering, Master’s Thesis 2011:52 24
Camber
Camber - at midspan
(Negative value gives a positive camber - upwards)
Shear
4. Maximum load capacity
Functions and values needed for analysis
4.1 Regular glulam beam - ULS
Functions and values needed for analysis
Mcap.d.pre max Mcap.pre.el Mcap.pre.pl, ( ) 715.173kN m⋅⋅=:=
δcamb.pre.d x( ) Ppre.d eN.d⋅( )Ls x−( ) Ls⋅
6 EId.ef.pre⋅⋅ 1
Ls x−( )2
Ls2
−
⋅
Ppre.d eN.d⋅( )x Ls⋅
6 EId.ef.pre⋅⋅ 1
x2
Ls2
−
⋅Gpre x⋅ Ls
3⋅
24 EId.ef.pre⋅1
2 x2
⋅
Ls2
−x3
Ls3
+
⋅++
...:=
δcamb.mid.pre.d δcamb.pre.d
Ls
2
0.012− m=:=
δcamb.mid.pre.d 0.012− m=
fv.d.pre fv.0.d.GL 1.728 106
× Pa=:=
Vcap.d.pre
fv.d.pre Iy.d.pre⋅ w⋅
Sd.pre
2.318 105
× N=:=
γ Q.ULS 1.5:= γ G.ULS 1.35:=
γ Q.SLS 1:= γ G.SLS 1:=
Lsq Ls1
m⋅ 10=:= xinit 0.4 Lsq⋅:= Qinit 1:=
MQ.tri x Qq, ( )γ Q.ULS Qq⋅ Lsq⋅ x⋅
61
x2
Lsq2
−
⋅:=
Gregq Gregm
N⋅ 560.842=:=
Mself.regq x( )γ G.ULSGregq⋅ Lsq⋅ x⋅
2
γ G.ULSGregq⋅ x2
⋅
2−:=
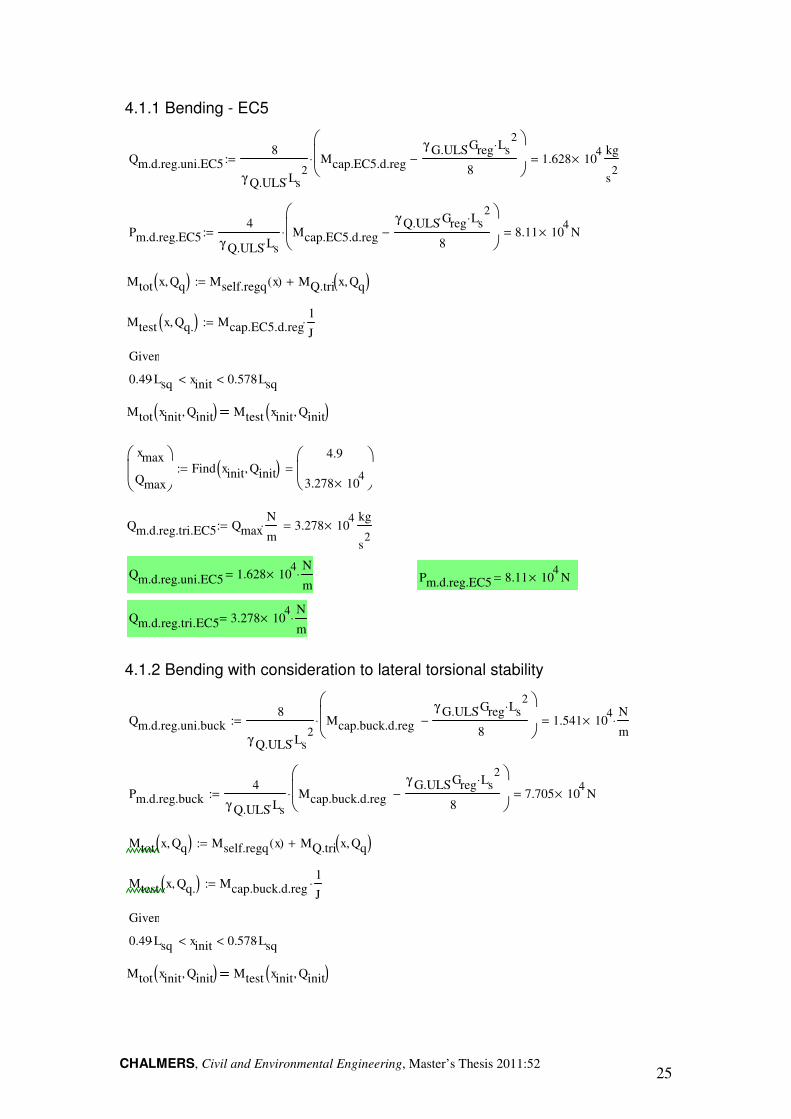
CHALMERS, Civil and Environmental Engineering, Master’s Thesis 2011:52 25
4.1.1 Bending - EC5
4.1.2 Bending with consideration to lateral torsional stability
Qm.d.reg.uni.EC58
γ Q.ULS Ls2
⋅
Mcap.EC5.d.reg
γ G.ULSGreg⋅ Ls2
⋅
8−
⋅ 1.628 104
×kg
s2
=:=
Pm.d.reg.EC54
γ Q.ULS Ls⋅Mcap.EC5.d.reg
γ Q.ULS Greg⋅ Ls2
⋅
8−
⋅ 8.11 104
× N=:=
Mtot x Qq, ( ) Mself.regq x( ) MQ.tri x Qq, ( )+:=
Mtest x Qq., ( ) Mcap.EC5.d.reg1
J⋅:=
Given
0.49 Lsq⋅ xinit< 0.578Lsq⋅<
Mtot xinit Qinit, ( ) Mtest xinit Qinit, ( )
xmax
Qmax
Find xinit Qinit, ( )4.9
3.278 104
×
=:=
Qm.d.reg.tri.EC5 QmaxN
m⋅ 3.278 10
4×
kg
s2
=:=
Qm.d.reg.uni.EC5 1.628 104
×N
m⋅= Pm.d.reg.EC5 8.11 10
4× N=
Qm.d.reg.tri.EC5 3.278 104
×N
m⋅=
Qm.d.reg.uni.buck8
γ Q.ULS Ls2
⋅
Mcap.buck.d.reg
γ G.ULSGreg⋅ Ls2
⋅
8−
⋅ 1.541 104
×N
m⋅=:=
Pm.d.reg.buck4
γ Q.ULS Ls⋅Mcap.buck.d.reg
γ G.ULSGreg⋅ Ls2
⋅
8−
⋅ 7.705 104
× N=:=
Mtot x Qq, ( ) Mself.regq x( ) MQ.tri x Qq, ( )+:=
Mtest x Qq., ( ) Mcap.buck.d.reg1
J⋅:=
Given
0.49 Lsq⋅ xinit< 0.578 Lsq⋅<
Mtot xinit Qinit, ( ) Mtest xinit Qinit, ( )

CHALMERS, Civil and Environmental Engineering, Master’s Thesis 2011:52 26
4.1.3 Bending using our model
4.1.4 Shear force
xmax
Qmax
Find xinit Qinit, ( )4.9
3.104 104
×
=:=
Qm.d.reg.tri.buck QmaxN
m⋅ 3.104 10
4×
kg
s2
=:=
Qm.d.reg.uni.buck 1.541 104
×N
m⋅= Pm.d.reg.buck 7.705 10
4× N=
Qm.d.reg.tri.buck 3.104 104
×N
m⋅=
Qm.d.reg.uni8
γ Q.ULS Ls2
⋅
Mcap.d.reg
γ G.ULSGreg⋅ Ls2
⋅
8−
⋅N
m⋅=:=
Pm.d.reg4
γ Q.ULS Ls⋅Mcap.d.reg
γ G.ULSGreg⋅ Ls2
⋅
8−
⋅ =:=
Mtot x Qq, ( ) Mself.regq x( ) MQ.tri x Qq, ( )+:=
Mtest x Qq., ( ) Mcap.d.reg1
J⋅:=
Given
0.49 Lsq⋅ xinit< 0.578Lsq⋅<
Mtot xinit Qinit, ( ) Mtest xinit Qinit, ( )
xmax
Qmax
Find xinit Qinit, ( )5.78
3.857 104
×
=:=
Qm.d.reg.tri QmaxN
m⋅ 3.857 10
4×
kg
s2
=:=
Qm.d.reg.uni 1.978 104
×N
m⋅= Pm.d.reg 9.892 10
4× N=
Qm.d.reg.tri 3.857 104
×N
m⋅=
Qv.d.reg.uni2
γ Q.ULS Ls⋅Vcap.d.reg
γ G.ULSGreg⋅ Ls⋅
2−
⋅ 2.261 104
×N
m⋅=:=
Pv.d.reg2
γ Q.ULS
Vcap.d.reg
γ G.ULSGreg⋅ Ls⋅
2−
⋅ 2.261 105
× N=:=

CHALMERS, Civil and Environmental Engineering, Master’s Thesis 2011:52 27
4.2 Slack-reinforced glulam beam - ULS
Functions and values needed for analysis
4.2.1 Bending using our model
4.2.2 Shear force
Qv.d.reg.tri3
γ Q.ULS Ls⋅Vcap.d.reg
γ G.ULSGreg⋅ Ls⋅
2−
⋅ 3.392 104
×N
m⋅=:=
Qv.d.reg.uni 2.261 104
×N
m⋅= Qv.d.reg.tri 3.392 10
4×
N
m⋅=
Pv.d.reg 2.261 105
× N=
Gslackq Gslackm
N⋅ 581.848=:=
Mself.slackq x( )γ G.ULSGslackq⋅ Lsq⋅ x⋅
2
γ G.ULSGslackq⋅ x2
⋅
2−:=
Qm.d.slack.uni8
γ Q.ULS Ls2
⋅
Mcap.d.slack
γ G.ULSGslack⋅ Ls2
⋅
8−
⋅ 3.217 104
×N
m⋅=:=
Pm.d.slack4
γ Q.ULS Ls⋅Mcap.d.slack
γ G.ULSGslack⋅ Ls2
⋅
8−
⋅ 1.608 105
× N=:=
Mtot x Qq, ( ) Mself.slackq x( ) MQ.tri x Qq, ( )+:=
Mtest x Qq., ( ) Mcap.d.slack1
J⋅:=
Given
0.49 Lsq⋅ xinit< 0.578 Lsq⋅<
Mtot xinit Qinit, ( ) Mtest xinit Qinit, ( )
xmax
Qmax
Find xinit Qinit, ( )5.78
6.27 104
×
=:=
Qm.d.slack.tri QmaxN
m⋅ 6.27 10
4×
kg
s2
=:=
Qm.d.slack.uni 3.217 104
×N
m⋅= Pm.d.slack 1.608 10
5× N= Qm.d.slack.tri 6.27 10
4×
N
m⋅=
Qv.d.slack.uni2
γ Q.ULS Ls⋅Vcap.d.slack
γ G.ULSGslack⋅ Ls⋅
2−
⋅ 3.039 104
×N
m⋅=:=

CHALMERS, Civil and Environmental Engineering, Master’s Thesis 2011:52 28
4.3 Pre-stressed glulam beam - ULS
Functions and values needed for analysis
4.3.1 Bending using our model
4.3.2 Shear force
Pv.d.slack2
γ Q.ULS
Vcap.d.slack
γ G.ULSGslack⋅ Ls⋅
2−
⋅ 3.039 105
× N=:=
Qv.d.slack.tri3
γ Q.ULS Ls⋅Vcap.d.slack
γ G.ULSGslack⋅ Ls⋅
2−
⋅ 4.558 104
×N
m⋅=:=
Qv.d.slack.uni 3.039 104
×N
m⋅= Pv.d.slack 3.039 10
5× N= Qv.d.slack.tri 4.558 10
4×
N
m⋅=
Gpreq Gprem
N⋅ 581.848=:=
Mself.preq x( )γ G.ULSGpreq⋅ Lsq⋅ x⋅
2
γ G.ULSGpreq⋅ x2
⋅
2−:=
Qm.d.pre.uni8
γ Q.ULS Ls2
⋅
Mcap.d.pre
γ G.ULSGpre⋅ Ls2
⋅
8−
⋅ 3.762 104
×N
m⋅=:=
Pm.d.pre4
γ Q.ULS Ls⋅Mcap.d.pre
γ G.ULSGpre⋅ Ls2
⋅
8−
⋅ 1.881 105
× N=:=
Mtot x Qq, ( ) Mself.preq x( ) MQ.tri x Qq, ( )+:=
Mtest x Qq., ( ) Mcap.d.pre1
J⋅:=
Given
0.48 Lsq⋅ xinit< 0.578 Lsq⋅<
Mtot xinit Qinit, ( ) Mtest xinit Qinit, ( )
xmax
Qmax
Find xinit Qinit, ( )5.78
7.333 104
×
=:=
Qm.d.pre.tri QmaxN
m⋅ 7.333 10
4×
kg
s2
=:=
Qm.d.pre.uni 3.762 104
×N
m⋅= Pm.d.pre 1.881 10
5× N= Qm.d.pre.tri 7.333 10
4×
N
m⋅=

CHALMERS, Civil and Environmental Engineering, Master’s Thesis 2011:52 29
4.4 Regular glulam beam - SLS
Functions and values needed for analysis
Instantaneous
Uniformly distributed load
Point load
Triangular distributed load
Qv.d.pre.uni2
γ Q.ULS Ls⋅Vcap.d.pre
γ G.ULSGpre⋅ Ls⋅
2−
⋅ 3.039 104
×N
m⋅=:=
Pv.d.pre2
γ Q.ULS
Vcap.d.pre
γ G.ULSGpre⋅ Ls⋅
2−
⋅ 3.039 105
× N=:=
Qv.d.pre.tri3
γ Q.ULS Ls⋅Vcap.d.pre
γ G.ULSGpre⋅ Ls⋅
2−
⋅ 4.558 104
×N
m⋅=:=
Qv.d.pre.uni 3.039 104
×N
m⋅= Pv.d.pre 3.039 10
5× N= Qv.d.pre.tri 4.558 10
4×
N
m⋅=
E0.d.GL.meanq E0.d.GL.mean1
Pa⋅ 9.28 10
9×=:= E0.k.GL.meanq E0.k.GL.mean
1
Pa⋅ 1.16 10
10×=:=
Iy.regq Iy.reg1
m4
⋅ 6.145 103−
×=:=
Qδ.d.reg.uni.inst
384E0.d.GL.mean Iy.reg⋅
5 Ls4
⋅
δlim.inst
5 Greg Ls4
⋅⋅
384E0.d.GL.mean Iy.reg⋅−
⋅ 1.039 104
×N
m⋅=:=
Pδ.d.reg.inst
48 E0.d.GL.mean⋅ Iy.reg⋅
Ls3
δlim.inst
5 Greg Ls4
⋅⋅
384E0.d.GL.mean Iy.reg⋅−
⋅ 6.493 104
× N=:=
δinst.perm.tri.reg.d x( )Gregq x⋅ Lsq
3⋅
24 E0.d.GL.meanq⋅ Iy.regq⋅1
2 x2
⋅
Lsq2
−x3
Lsq3
+
⋅:=
δinst.var.tri.reg.d x Qq, ( )Qq x⋅ Lsq
3⋅
360 E0.d.GL.meanq⋅ Iy.regq⋅7
10 x2
⋅
Lsq2
−3 x
4⋅
Lsq4
+
⋅:=
δinst.reg.d x Qq, ( ) δinst.perm.tri.reg.d x( ) δinst.var.tri.reg.d x Qq, ( )+:=
δtest x Qq, ( ) δlim.inst1
m⋅:=
Given
0.49 Lsq⋅ xinit< 0.578 Lsq⋅<
δinst.reg.d xinit Qinit, ( ) δtest xinit Qinit, ( )
xmax
Qmax
Find xinit Qinit, ( ):=

CHALMERS, Civil and Environmental Engineering, Master’s Thesis 2011:52 30
Final
Uniformly distributed load
Point load
Triangular distributed load
Max load
4.5 Slack-reinforced glulam beam - SLS
Functions and values needed for analysis
Qδ.d.reg.tri.inst QmaxN
m⋅ 2.083 10
4×
N
m⋅=:=
Qδ.d.reg.uni.fin
384E0.d.GL.mean Iy.reg⋅
1 ψ2 kdef⋅+( ) 5⋅ Ls4
⋅
δlim.fin
5 Greg Ls4
⋅⋅
384E0.d.GL.mean Iy.reg⋅
1 kdef+( )⋅−
⋅:=
Qδ.d.reg.uni.fin 1.423 104
×N
m=
Pδ.d.reg.fin
48 E0.d.GL.mean⋅ Iy.reg⋅
1 ψ2 kdef⋅+( ) Ls3
⋅
δlim.fin
5 Greg Ls4
⋅⋅
384E0.d.GL.mean Iy.reg⋅
1 kdef+( )⋅−
⋅:=
Pδ.d.reg.fin 8.895 104
× N=
δfin.reg.d x Qq, ( ) 1 kdef+( ) δinst.perm.tri.reg.d x( )⋅ 1 ψ2 kdef⋅+( ) δinst.var.tri.reg.d x Qq, ( )⋅+:=
δtest x Qq, ( ) δlim.fin1
m⋅:=
Given
0.49 Lsq⋅ xinit< 0.578 Lsq⋅<
δfin.reg.d xinit Qinit, ( ) δtest xinit Qinit, ( )
xmax
Qmax
Find xinit Qinit, ( ):=
Qδ.d.reg.tri.fin QmaxN
m⋅ 2.853 10
4×
N
m⋅=:=
Qδ.d.reg.uni min Qδ.d.reg.uni.inst Qδ.d.reg.uni.fin, ( ):=
Pδ.d.reg min Pδ.d.reg.inst Pδ.d.reg.fin, ( ):=
Qδ.d.reg.tri min Qδ.d.reg.tri.inst Qδ.d.reg.tri.fin, ( ):=
Qδ.d.reg.uni 1.039 104
×N
m⋅= Pδ.d.reg 6.493 10
4× N= Qδ.d.reg.tri 2.083 10
4×
N
m⋅=

CHALMERS, Civil and Environmental Engineering, Master’s Thesis 2011:52 31
Instantaneous
Uniformly distributed load
Point load
Triangular distributed load
Final
Uniformly distributed load
Point load
EId.ef.slackq EId.ef.slack1
N m2
⋅
⋅ 8.459 107
×=:=
Qδ.d.slack.uni.inst
384EId.ef.slack
5 Ls4
⋅
δlim.inst
5 Gslack Ls4
⋅⋅
384EId.ef.slack
−
⋅ 1.566 104
×N
m⋅=:=
Pδ.d.slack.inst
48 EId.ef.slack⋅
Ls3
δlim.inst
5 Gslack Ls4
⋅⋅
384EId.ef.slack
−
⋅ 9.787 104
× N=:=
δinst.perm.tri.slack.d x( )Gslackq x⋅ Lsq
3⋅
24 EId.ef.slackq⋅1
2 x2
⋅
Lsq2
−x3
Lsq3
+
⋅:=
δinst.var.tri.slack.d x Qq, ( )Qq x⋅ Lsq
3⋅
360 EId.ef.slackq⋅7
10 x2
⋅
Lsq2
−3 x
4⋅
Lsq4
+
⋅:=
δinst.slack.d x Qq, ( ) δinst.perm.tri.slack.d x( ) δinst.var.tri.slack.d x Qq, ( )+:=
δtest x Qq, ( ) δlim.inst1
m⋅:=
Given
0.49 Lsq⋅ xinit< 0.578 Lsq⋅<
δinst.slack.d xinit Qinit, ( ) δtest xinit Qinit, ( )
xmax
Qmax
Find xinit Qinit, ( ):=
Qδ.d.slack.tri.inst QmaxN
m⋅ 3.139 10
4×
N
m⋅=:=
Qδ.d.slack.uni.fin
384EId.ef.slack
1 ψ2 kdef⋅+( ) 5⋅ Ls4
⋅
δlim.fin
5 Gslack Ls4
⋅⋅
384EId.ef.slack
1 kdef+( )⋅−
⋅ 2.15 104
×N
m⋅=:=
Pδ.d.slack.fin
48 EId.ef.slack⋅
1 ψ2 kdef⋅+( ) Ls3
⋅
δlim.fin
5 Gslack Ls4
⋅⋅
384EId.ef.slack
1 kdef+( )⋅−
⋅ 1.344 105
× N=:=

CHALMERS, Civil and Environmental Engineering, Master’s Thesis 2011:52 32
Triangular distributed load
Max load
4.6 Pre-stressed glulam beam - SLS
Functions and values needed for analysis
Functions and values needed for analysis
Instantaneous
Uniformly distributed load
δfin.slack.d x Qq, ( ) 1 kdef+( ) δinst.perm.tri.slack.d x( )⋅ 1 ψ2 kdef⋅+( ) δinst.var.tri.slack.d x Qq, ( )⋅+:=
δtest x Qq, ( ) δlim.fin1
m⋅:=
Given
0.49 Lsq⋅ xinit< 0.578 Lsq⋅<
δfin.slack.d xinit Qinit, ( ) δtest xinit Qinit, ( )
xmax
Qmax
Find xinit Qinit, ( ):=
Qδ.d.slack.tri.fin QmaxN
m⋅ 4.31 10
4×
N
m⋅=:=
Qδ.d.slack.uni min Qδ.d.slack.uni.inst Qδ.d.slack.uni.fin, ( ):=
Pδ.d.slack min Pδ.d.slack.inst Pδ.d.slack.fin, ( ):=
Qδ.d.slack.tri min Qδ.d.slack.tri.inst Qδ.d.slack.tri.fin, ( ):=
Qδ.d.slack.uni 1.566 104
×N
m⋅= Pδ.d.slack 9.787 10
4× N= Qδ.d.slack.tri 3.139 10
4×
N
m⋅=
EId.ef.preq EId.ef.pre1
N m2
⋅
⋅ 8.459 107
×=:=
Ppre.dq Ppre.d1
N⋅ 2.975− 10
5×=:=
eN.dq eN.d1
m⋅:=
δcamb.pre.dq x( ) Ppre.dq eN.dq⋅( )Lsq x−( ) Lsq⋅
6 EId.ef.preq⋅⋅ 1
Lsq x−( )2
Lsq2
−
⋅
Ppre.dq eN.dq⋅( )x Lsq⋅
6 EId.ef.preq⋅⋅ 1
x2
Lsq2
−
⋅+
...
Gpreq x⋅ Lsq3
⋅
24 EId.ef.preq⋅1
2 x2
⋅
Lsq2
−x3
Lsq3
+
⋅+
...
:=
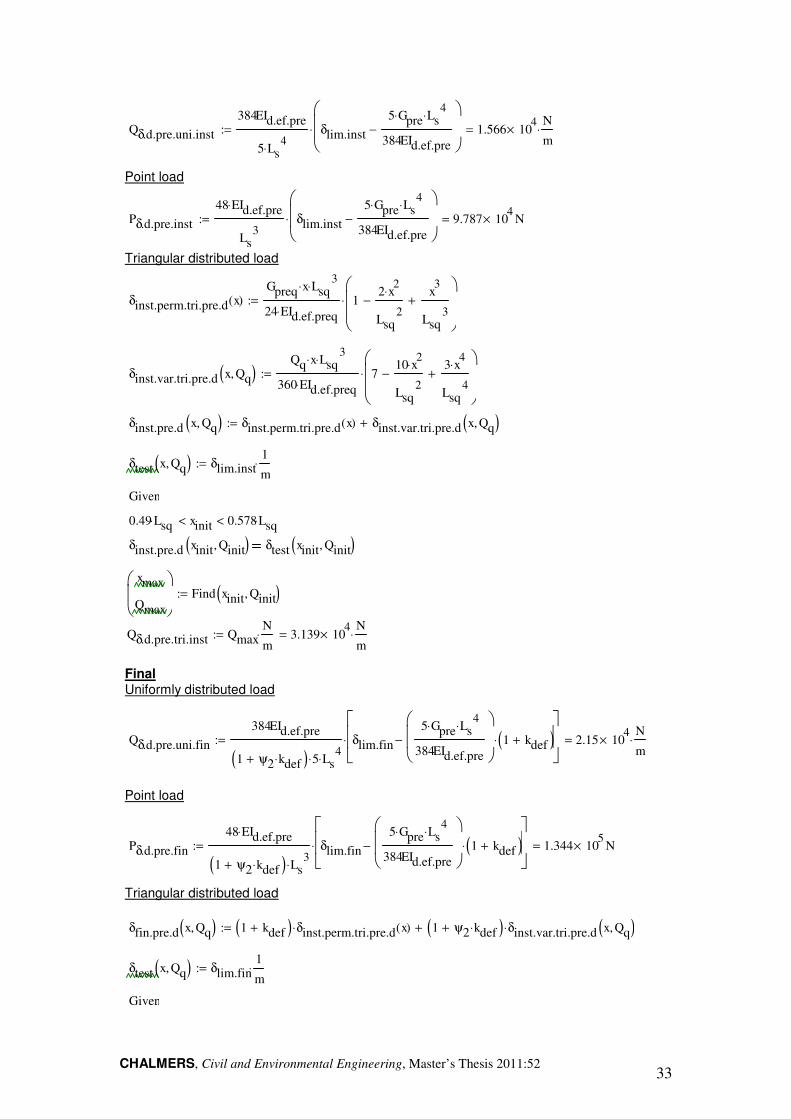
CHALMERS, Civil and Environmental Engineering, Master’s Thesis 2011:52 33
Point load
Triangular distributed load
Final Uniformly distributed load
Point load
Triangular distributed load
Qδ.d.pre.uni.inst
384EId.ef.pre
5 Ls4
⋅
δlim.inst
5 Gpre Ls4
⋅⋅
384EId.ef.pre
−
⋅ 1.566 104
×N
m⋅=:=
Pδ.d.pre.inst
48 EId.ef.pre⋅
Ls3
δlim.inst
5 Gpre Ls4
⋅⋅
384EId.ef.pre
−
⋅ 9.787 104
× N=:=
δinst.perm.tri.pre.d x( )Gpreq x⋅ Lsq
3⋅
24 EId.ef.preq⋅1
2 x2
⋅
Lsq2
−x3
Lsq3
+
⋅:=
δinst.var.tri.pre.d x Qq, ( )Qq x⋅ Lsq
3⋅
360 EId.ef.preq⋅7
10 x2
⋅
Lsq2
−3 x
4⋅
Lsq4
+
⋅:=
δinst.pre.d x Qq, ( ) δinst.perm.tri.pre.d x( ) δinst.var.tri.pre.d x Qq, ( )+:=
δtest x Qq, ( ) δlim.inst1
m⋅:=
Given
0.49 Lsq⋅ xinit< 0.578 Lsq⋅<
δinst.pre.d xinit Qinit, ( ) δtest xinit Qinit, ( )
xmax
Qmax
Find xinit Qinit, ( ):=
Qδ.d.pre.tri.inst QmaxN
m⋅ 3.139 10
4×
N
m⋅=:=
Qδ.d.pre.uni.fin
384EId.ef.pre
1 ψ2 kdef⋅+( ) 5⋅ Ls4
⋅
δlim.fin
5 Gpre Ls4
⋅⋅
384EId.ef.pre
1 kdef+( )⋅−
⋅ 2.15 104
×N
m⋅=:=
Pδ.d.pre.fin
48 EId.ef.pre⋅
1 ψ2 kdef⋅+( ) Ls3
⋅
δlim.fin
5 Gpre Ls4
⋅⋅
384EId.ef.pre
1 kdef+( )⋅−
⋅ 1.344 105
× N=:=
δfin.pre.d x Qq, ( ) 1 kdef+( ) δinst.perm.tri.pre.d x( )⋅ 1 ψ2 kdef⋅+( ) δinst.var.tri.pre.d x Qq, ( )⋅+:=
δtest x Qq, ( ) δlim.fin1
m⋅:=
Given

CHALMERS, Civil and Environmental Engineering, Master’s Thesis 2011:52 34
Net deflection - final
Uniformly distributed load
Point load
Triangular distributed load
Max load
Given
0.49 Lsq⋅ xinit< 0.578Lsq⋅<
δfin.pre.d xinit Qinit, ( ) δtest xinit Qinit, ( )
xmax
Qmax
Find xinit Qinit, ( ):=
Qδ.d.pre.tri.fin QmaxN
m⋅ 4.31 10
4×
N
m⋅=:=
Qδ.d.pre.uni.net.fin
384EId.ef.pre
1 ψ2 kdef⋅+( ) 5⋅ Ls4
⋅
δlim.net.fin
5 Gpre Ls4
⋅⋅
384EId.ef.pre
1 kdef+( )⋅−
δcamb.mid.pre.d−( )+
...
⋅:=
Qδ.d.pre.uni.net.fin 2.829 104
×N
m=
Pδ.d.pre.net.fin
48 EId.ef.pre⋅
1 ψ2 kdef⋅+( ) Ls3
⋅
δlim.net.fin
5 Gpre Ls4
⋅⋅
384EId.ef.pre
1 kdef+( )⋅−
δcamb.mid.pre.d−+
...
⋅ 1.768 105
× N=:=
δnet.fin.pre.d x Qq, ( ) 1 kdef+( ) δinst.perm.tri.pre.d x( )⋅
1 ψ2 kdef⋅+( ) δinst.var.tri.pre.d x Qq, ( )⋅ δcamb.pre.dq x( )++
...:=
δtest x Qq, ( ) δlim.net.fin1
m⋅:=
Given
0.49 Lsq⋅ xinit< 0.578 Lsq⋅<
δnet.fin.pre.d xinit Qinit, ( ) δtest xinit Qinit, ( )
xmax
Qmax
Find xinit Qinit, ( ):=
Qδ.d.pre.tri.net.fin QmaxN
m⋅ 5.672 10
4×
N
m⋅=:=
Qδ.d.pre.uni min Qδ.d.pre.uni.inst Qδ.d.pre.uni.fin, Qδ.d.pre.uni.net.fin, ( ):=
Pδ.d.pre min Pδ.d.pre.inst Pδ.d.pre.fin, Pδ.d.pre.net.fin, ( ):=
Qδ.d.pre.tri min Qδ.d.pre.tri.inst Qδ.d.pre.tri.fin, Qδ.d.pre.tri.net.fin, ( ):=

CHALMERS, Civil and Environmental Engineering, Master’s Thesis 2011:52 35
5. Results
5.1 Moment capacity
5.1.1 Unreinforced beam
According to EC5
Moment capacity
Maximum load
Uniformly distributed Concentrated load at midspan
Triangular distributed
According to EC5 - consideration taken to lateral torsional buckling
Moment capacity
Maximum load
Uniformly distributed Concentrated load at midspan
Triangular distributed
Our calculation model
Moment capacity
Maximum load
Uniformly distributed Concentrated load at midspan
Qδ.d.pre.uni 1.566 104
×N
m⋅= Pδ.d.pre 9.787 10
4× N= Qδ.d.pre.tri 3.139 10
4×
N
m⋅=
Mcap.EC5.d.reg 3.146 105
× N m⋅=
Qm.d.reg.uni.EC5 1.628 104
×N
m= Pm.d.reg.EC5 8.11 10
4× N=
Qm.d.reg.tri.EC5 3.278 104
×N
m=
Mcap.buck.d.reg 2.984 105
× N m⋅=
Qm.d.reg.uni.buck 1.541 104
×N
m= Pm.d.reg.buck 7.705 10
4× N=
Qm.d.reg.tri.buck 3.104 104
×N
m=
Mcap.EC5.d.reg 3.146 105
× N m⋅=
Qm.d.reg.uni 1.978 104
×N
m= Pm.d.reg 9.892 10
4× N=

CHALMERS, Civil and Environmental Engineering, Master’s Thesis 2011:52 36
Triangular distributed
5.1.2 Rerinforced beam
Our calculation model
Moment capacity
Maximum load
Uniformly distributed Concentrated load at midspan
Triangular distributed
5.1.3 Pre-stressed beam
Our calculation model
Moment capacity
Maximum load
Uniformly distributed Concentrated load at midspan
Triangular distributed
5.2 Shear capacity
5.2.1 Unreinforced beam
Shear capacity
Maximum load
Uniformly distributed Concentrated load at midspan
Qm.d.reg.tri 3.857 104
×N
m=
Mcap.d.slack 6.129 105
× N m⋅=
Qm.d.slack.uni 3.217 104
×N
m= Pm.d.slack 1.608 10
5× N=
Qm.d.slack.tri 6.27 104
×N
m=
Mcap.d.pre 7.152 105
× N m⋅=
Qm.d.pre.uni 3.762 104
×N
m= Pm.d.pre 1.881 10
5× N=
Qm.d.pre.tri 7.333 104
×N
m=
Vcap.d.reg 1.734 105
× N=
Qv.d.reg.uni 2.261 104
×N
m= Pv.d.reg 2.261 10
5× N=

CHALMERS, Civil and Environmental Engineering, Master’s Thesis 2011:52 37
Triangular distributed
5.2.2 Rerinforced beam
Shear capacity
Maximum load
Uniformly distributed Concentrated load at midspan
Triangular distributed
5.2.3 Pre-stressed beam
Shear capacity
Maximum load
Uniformly distributed Concentrated load at midspan
Triangular distributed
5.3 Maximum load due to deflection requirements
5.2.1 Unreinforced beam
Uniformly distributed Concentrated load at midspan
Triangular distributed
5.2.2 Rerinforced beam
Qv.d.reg.tri 3.392 104
×N
m=
Vcap.d.slack 2.318 105
× N=
Qv.d.slack.uni 3.039 104
×N
m= Pv.d.slack 3.039 10
5× N=
Qv.d.slack.tri 4.558 104
×N
m=
Vcap.d.pre 2.318 105
× N=
Qv.d.pre.uni 3.039 104
×N
m= Pv.d.pre 3.039 10
5× N=
Qv.d.pre.tri 4.558 104
×N
m=
Qδ.d.reg.uni 1.039 104
×N
m= Pδ.d.reg 6.493 10
4× N=
Qδ.d.reg.tri 2.083 104
×N
m=

CHALMERS, Civil and Environmental Engineering, Master’s Thesis 2011:52 38
Uniformly distributed Concentrated load at midspan
Triangular distributed
5.2.3 Pre-stressed beam
Uniformly distributed Concentrated load at midspan
Triangular distributed
Qδ.d.slack.uni 1.566 104
×N
m= Pδ.d.slack 9.787 10
4× N=
Qδ.d.slack.tri 3.139 104
×N
m=
Qδ.d.pre.uni 1.566 104
×N
m= Pδ.d.pre 9.787 10
4× N=
Qδ.d.pre.tri 3.139 104
×N
m=

CHALMERS, Civil and Environmental Engineering, Master’s Thesis 2011:52 39
10.2 Appendix B: The Matlab code for the model
The line break for the matlab code is set to matlab standards. A “Copy and Paste” to a clear m-file will create a more legible code. The line break was not change to the thesis size due to the errors that would occur when “Copy and Paste” will be attempted.
%%%%%%%%%%%%%%%%%%%%%%%%%%%%%%%%%%%%%%%%%%%%%%%%%%%%%%%%%%%%%%%%%%%%%
%%%%%%
% The indata file
%
% By S.W March 2011
%
%
%
%%%%%%%%%%%%%%%%%%%%%%%%%%%%%%%%%%%%%%%%%%%%%%%%%%%%%%%%%%%%%%%%%%%%%
%%%%%%
clear all
close all
clc
%% The new indata program
% This is the control program for the elastic and plastic analysis of
the
% reinforced glulam beams.
%The program differs on the main beam geometry and the settings of
each
%specific beam. e.i the diffrent beam type can be examned in an
optional
%amount of diffrent sizes.
%At the present the code can handle 8 diffrent beam configurations
and an
% enless amount of cross-sections, although a lot of cross-sections
% makes for very small plots.
%
%it is important to fill in all vectors !
%the code wont work otherwise!
%% Beams that are examined are;

CHALMERS, Civil and Environmental Engineering, Master’s Thesis 2011:52 40
% #1, Unreinforced glulam beam
%
% #2, Beam 9 from exjobb
%
% #3, New beam 1 unreinforced in compression side - heavily
reinforced in
% tension side
% #4, Beam 9 from ex jobb, but Pre-stressed.
%
% #
%% The different beams that are to be tested
hg=[200 230 400]; %#ok<*NBRAK> %[mm] Height
bg=[115 115 115]; %[mm] width
L=[5000-400 5000-400 5000-400]; %[mm] Length
%% Glulam
Eg=[9490 9100 9000 9100]; %[MPa] youngs modulus
Gg=[850 850 850 850]; %[MPa] Shear modulus
ft=[40 45 40 45]; %[MPa] tensile strength
fc=[35 35 40 35]; %[MPa] compressive
strength
to=[3 3 3 3]; %[MPa] Shear strength
% reinforcement is to be pre-stressed pre=2 normal re=1 otherwise =0
re=[0 1 1 2];
% increment number to plot the strain/stress curves in different
diagram
nr=[1 2 3 4];
%% Reinforcement
%Compresive reinforcement
Erc=[165000 165000 200000 165000]; %[MPa] Youngs modulus
bc=[1.4 1.4 1.4 1.4]; %[mm] width of laminate

CHALMERS, Civil and Environmental Engineering, Master’s Thesis 2011:52 41
hc=[30 30 30 30]; %[mm] hight of laminate
nc=[0 3 0 3]; %[-] number laminates
Arc=nc.*bc.*hc; %[mm2]area of reinforcement
Zc=hc./2; %[mm] dist. to GC
% tensile reinforcement
Ert=[165000 165000 165000 165000];
bt=[1.4 1.4 1.4 1.4]; %[MPa] Youngs modulus
ht=[30 30 30 30]; %[mm] width of laminate
nt=[0 6 10 6]; %[mm] hight of laminate
Art=nt.*bt.*ht; %[mm2]area of reinforcement
Zt=ht./2; %[mm] dist. to GC
%ekvivalent tvärrsnitt
alfa=Ert/Eg;
%Zgv=(bg*hg*hg*Eg/2+Arc*Zc*Erc+Art*Ert*(hg-
Zt))/(bg*hg*Eg+Arc*Erc+Art*Ert);
%eN=hg-Zgv-Zc;
%% The sending of the data
dim=length(hg); %nummer of dimentions to be tested
antal=length(nr); %nummer of beams to be tested in each dimention.
for a=1:length(hg)
for f=1:length(nr)
if re(f)==2
main_pre-
stressed(Eg(f),Gg(f),ft(f),fc(f),to(f),bc(f),hc(f),...
nc(f),bt(f),ht(f),nt(f),Ert(f),Erc(f),nr(f),hg(a),bg(a),...
L(a),Arc(f),Art(f),Zc(f),Zt(f),re(f),dim,antal,a,f);
else
main_reinforced(Eg(f),Gg(f),ft(f),fc(f),to(f),bc(f),hc(f),...
nc(f),bt(f),ht(f),nt(f),Ert(f),Erc(f),nr(f),hg(a),bg(a),...

CHALMERS, Civil and Environmental Engineering, Master’s Thesis 2011:52 42
L(a),Arc(f),Art(f),Zc(f),Zt(f),re(f),dim,antal,a,f);
end
end
end
%%%%%%%%%%%%%%%%%%%%%%%%%%%%%%%%%%%%%%%%%%%%%%%%%%%%%%%%%%%%%%%%
% %% inparametrar som kan användas när underfilerna skall skapas
eller kollas
% clear all
% close all
% clc
%
% %% The beams basic geometry
%
% hg=200 ; %[mm] Height
% bg=115 ; %[mm] width
%
% L=5000-400 ; %[mm] Length
%
% %% Glulam
%
% Eg=9490 ; %[MPa] youngs modulus
% Gg=850 ; %[MPa] Shear modulus
%
% fm=30;
% ft=[25]; %[MPa] tensile strength
% fc=[25] ; %[MPa] compressive strength
% to=[3]; %[MPa] Shear strength
%
% %% Reinforcement
%
% %Compressive reinforcement
%
% Erc=[200000]; %[MPa] Youngs modulus
% bc=[1.4]; %[mm] width of laminate
% hc=[30]; %[mm] hight of laminate
% nc=[2]; %[-] number laminates
% Arc=nc.*bc.*hc; %[mm2]area of reinforcement
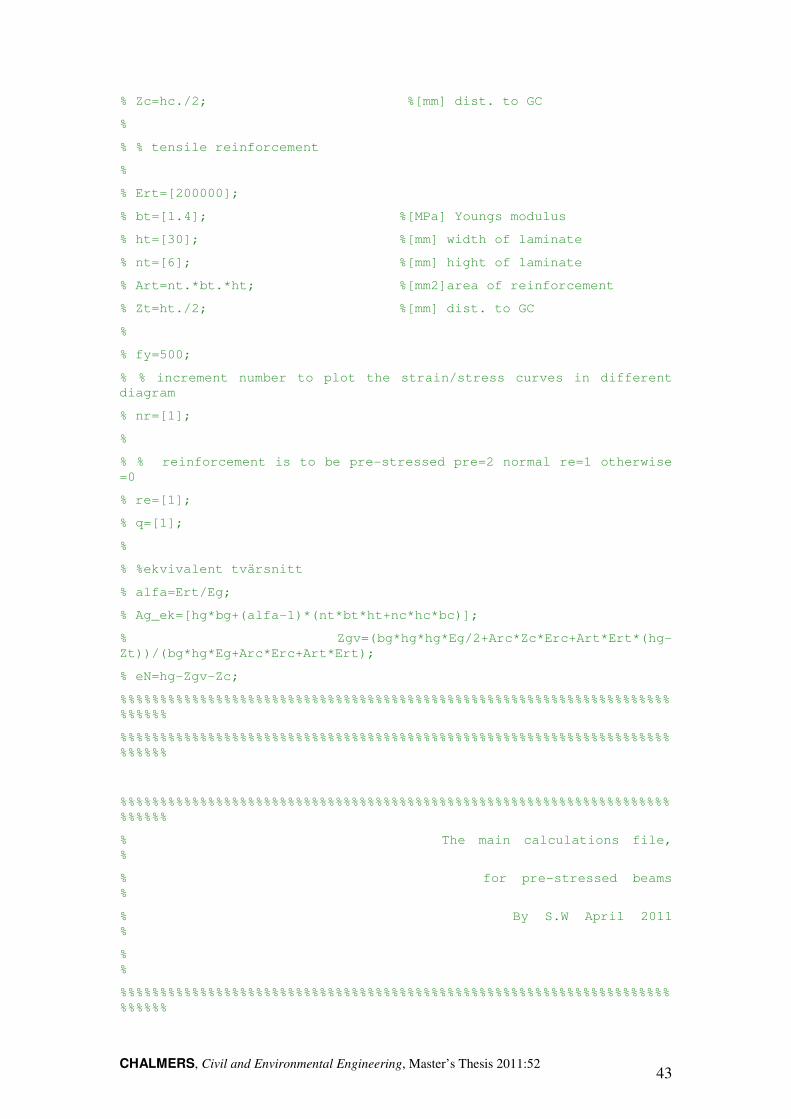
CHALMERS, Civil and Environmental Engineering, Master’s Thesis 2011:52 43
% Zc=hc./2; %[mm] dist. to GC
%
% % tensile reinforcement
%
% Ert=[200000];
% bt=[1.4]; %[MPa] Youngs modulus
% ht=[30]; %[mm] width of laminate
% nt=[6]; %[mm] hight of laminate
% Art=nt.*bt.*ht; %[mm2]area of reinforcement
% Zt=ht./2; %[mm] dist. to GC
%
% fy=500;
% % increment number to plot the strain/stress curves in different
diagram
% nr=[1];
%
% % reinforcement is to be pre-stressed pre=2 normal re=1 otherwise
=0
% re=[1];
% q=[1];
%
% %ekvivalent tvärsnitt
% alfa=Ert/Eg;
% Ag_ek=[hg*bg+(alfa-1)*(nt*bt*ht+nc*hc*bc)];
% Zgv=(bg*hg*hg*Eg/2+Arc*Zc*Erc+Art*Ert*(hg-
Zt))/(bg*hg*Eg+Arc*Erc+Art*Ert);
% eN=hg-Zgv-Zc;
%%%%%%%%%%%%%%%%%%%%%%%%%%%%%%%%%%%%%%%%%%%%%%%%%%%%%%%%%%%%%%%%%%%%%
%%%%%%
%%%%%%%%%%%%%%%%%%%%%%%%%%%%%%%%%%%%%%%%%%%%%%%%%%%%%%%%%%%%%%%%%%%%%
%%%%%%
%%%%%%%%%%%%%%%%%%%%%%%%%%%%%%%%%%%%%%%%%%%%%%%%%%%%%%%%%%%%%%%%%%%%%
%%%%%%
% The main calculations file,
%
% for pre-stressed beams
%
% By S.W April 2011
%
%
%
%%%%%%%%%%%%%%%%%%%%%%%%%%%%%%%%%%%%%%%%%%%%%%%%%%%%%%%%%%%%%%%%%%%%%
%%%%%%

CHALMERS, Civil and Environmental Engineering, Master’s Thesis 2011:52 44
% function main_pre-stressed(Eg,Gg,ft,fc,to,bc,hc,...
% nc,bt,ht,nt,Ert,Erc,nr,hg,bg,...
% L,Arc,Art,Zc,Zt,re,dim,antal,a,f);
%% inparametrar som kan användas när underfilerna skall skapas eller
kollas
clear all
close all
clc
%% The beams basic geometry
hg=200 ; %[mm] Height
bg=115 ; %[mm] width
L=5000-400 ; %[mm] Length
%% Glulam
Eg=9490 ; %[MPa] youngs modulus
Gg=850 ; %[MPa] Shear modulus
fm=30;
ft=[25]; %[MPa] tensile strength
fc=[25] ; %[MPa] compressive strength
to=[3]; %[MPa] Shear strength
%% Reinforcement
%Compressive reinforcement
Erc=[200000]; %[MPa] Youngs modulus
bc=[1.4]; %[mm] width of laminate
hc=[30]; %[mm] hight of laminate
nc=[0]; %[-] number laminates
Arc=nc.*bc.*hc; %[mm2]area of reinforcement
Zc=hc./2; %[mm] dist. to GC
% tensile reinforcement

CHALMERS, Civil and Environmental Engineering, Master’s Thesis 2011:52 45
Ert=[200000];
bt=[1.4]; %[MPa] Youngs modulus
ht=[30]; %[mm] width of laminate
nt=[6]; %[mm] hight of laminate
Art=nt.*bt.*ht; %[mm2]area of reinforcement
Zt=ht./2; %[mm] dist. to GC
fy=500;
% increment number to plot the strain/stress curves in different
diagram
nr=[1];
% reinforcement is to be pre-stressed pre=2 normal re=1 otherwise =0
re=[1];
q=[1];
%ekvivalent tvärsnitt
alfa=Ert/Eg;
Ag_ek=[hg*bg+(alfa-1)*(nt*bt*ht+nc*hc*bc)];
Zgv=(bg*hg*hg*Eg/2+Arc*Zc*Erc+Art*Ert*(hg-
Zt))/(bg*hg*Eg+Arc*Erc+Art*Ert);
eN=hg-Zgv-Zc;
Arc
procent=((Art+Arc)/(hg*bg))*100
%%%%%%%%%%%%%%%%%%%%%%%%%%%%%%%%%%%%%%%%%%%%%%%%%%%%%%%%%%%%%%%%%%%%%
%%%%%%
%%%%%%%%%%%%%%%%%%%%%%%%%%%%%%%%%%%%%%%%%%%%%%%%%%%%%%%%%%%%%%%%%%%%%
%%%%
%%%%%%%%%%%%%%%%%%%%%%%%%%%%%%%%%%%%%%%%%%%%%%%%%%%%%%%%%%%%%%%%%%%%%
%%%%%%
%% inparametrar
% saker som behövs innan sjävla lopparna skall starta upp
%ekvivalent tvärrsnitt
alfa=Ert/Eg;
Ag_ek=[hg*bg+(alfa-1)*(nt*bt*ht+nc*hc*bc)];
% elastiska tyngdpunkten

CHALMERS, Civil and Environmental Engineering, Master’s Thesis 2011:52 46
Zgv=(bg*hg*hg*Eg/2+Arc*Zc*Erc+Art*Ert*(hg-
Zt))/(bg*hg*Eg+Arc*Erc+Art*Ert);
eN=hg-Zgv-Zc;
%behöver ju P,I och alfa och den mostvarande startspänningen i
toppen.
[eps_top_preload,Nek_max]=Preload(L,Eg,ft,fc,fm,bc,hc,nc,bt,ht,nt,...
Ert,hg,bg,Ag_ek,Arc,Art,Zc,Zt,Zgv);
P=Nek_max;
I=((bg*hg^3/12)+hg*bg*(Zgv-(hg/2))^2)+...
(alfa-1)*(((nc*bc*hc^3)/(12))+Arc*(Zgv-Zc)^2+...
((nt*bt*ht^3)/(12))+Art*(hg-Zgv-Zt)^2);
%%%%%%%%%%%%%%%%%%%%%%%%%%%%%%%%%%%%%%%%%%%%%%%%%%%%%%%%%%%%%%%%%%%%%
%%%%%
%% Elastiska beräkingarna, här används teckenkonvertering
%räknevärden och annat intressant för loppen
% töjningar
eps_e_t=ft/Eg; % elastic strain limit in tension
eps_e_c=-fc/Eg; % elastic strain limit in compression
% eps_top_preload=0;
% Nek_max=0;
% P=0;
% välj stegstorlek,
delta_eps_c=(eps_e_c)/100
%fördefinerar kontrollvariabler.
shear_failure=0;
tension_failure=0;
%startar med ett steg så inget blir noll.
eps_c=eps_top_preload+delta_eps_c;
e(1)=eps_c;
i=2;
ner(1)=0;

CHALMERS, Civil and Environmental Engineering, Master’s Thesis 2011:52 47
bb=0;
%FIRE UP THE LOOP!
while abs(eps_c)<=abs(eps_e_c)
% Enligt beräkningarna i arbetet så;
M_last=((Eg*eps_c)*Ag_ek*I-P*I)/(Ag_ek*(-Zgv))-P*eN;
%med denna M så kan vi räkna ut töjningsfördelningen
z_c=(-Zgv);
z_rc=(-Zgv+Zc);
z_rt=(hg-Zgv-Zt);
z_t=(hg-Zgv);
eps_c_3=(-1)*(M_last/(Eg*I))*z_c;
eps_rc_3=(-1)*(M_last/(Eg*I))*z_rc;
eps_rt_3=(M_last/(Eg*I))*z_rt;
eps_t_3=(M_last/(Eg*I))*z_t;
M(i)=1/2*eps_c_3*Eg*2/3*bg*Zgv^2+eps_rc_3*Erc*Arc*(Zgv-Zc)...
+1/2*eps_t_3*Eg*2/3*bg*(hg-Zgv)^2+eps_rt_3*Ert*Art*(hg-Zgv-
Zt);
qq(i)=(M(i)*8)/L^2;
V=(qq(i)*L/2);
%för tensile kollen
eps_t=((P/(Eg*Ag_ek))+(((P*eN)+M_last)/(Eg*I))*z_t);
% för nerböjningen
%plockar ut en fiktiv last för P*e
M_pre=P*eN;
eps_c_fik=(-1)*(M_pre/(Eg*I))*z_c;
eps_rc_fik=(-1)*(M_pre/(Eg*I))*z_rc;
eps_rt_fik=(M_pre/(Eg*I))*z_rt;
eps_t_fik=(M_pre/(Eg*I))*z_t;

CHALMERS, Civil and Environmental Engineering, Master’s Thesis 2011:52 48
M_fik=1/2*eps_c_fik*Eg*2/3*bg*Zgv^2+eps_rc_fik*Erc*Arc*(Zgv-
Zc)...
+1/2*eps_t_fik*Eg*2/3*bg*(hg-Zgv)^2+eps_rt_fik*Ert*Art*(hg-
Zgv-Zt);
q_fik=(M_fik*8)/L^2;
% EI, kanske inte helt nödvändigt här.
%z_av(i)=(((-(P/Ag_ek))*I)/(M(i)+P*eN)) %fungerar inte helt okey
%z_0=(Zgv)+z_av(i)
%phi(i)=(-1)*eps_c/z_0;
%EI(i)=M(i)/phi(i);
ner(i)=(5*(qq(i)+q_fik)*L^4)/(384*Eg*I);
%för tvärkraften
shear(i)=3*V/(hg*bg*2);
if(eps_t>=eps_e_t);
disp('tensile failure')
tension_failure=1;
break;
end
if(shear(i)>=to);
disp('shear failure');
shear_failure=1;
tension_failure=1;
break;
end
e(i)=eps_c+delta_eps_c;
eps_c=eps_c+delta_eps_c ;
i=i+1;
end
% trix för att fixa till saker
M_el=M(i-1)/1e6;
CHALMERS, Civil and Environmental Engineering, Master’s Thesis 2011:52 49
tension_failure;
shear_failure;
z_av=(((-(P/Ag_ek))*I)/(M(i-1)+P*eN)); %fungerar inte helt okey
z_0=(Zgv)+z_av;
%fixa nerböjningen vektor då den inte börjar på nollan.
ner(1)=(5*(qq(1)+q_fik)*L^4)/(384*Eg*I);
%% kopiera in plot commandon!!
%% Plastiska beräkningar, här avänds ingen teckenkonvertering
% töjningar
eps_e_t=ft/Eg; % elastic strain limit in tension
eps_e_c=fc/Eg; % elastic strain limit in compression
% plastisk töjning
eps_p_c=3*eps_e_c; % ultimate plastic strain
% varibaler som först måste defineras.
eps_p_0=(-1)*P/(Ert*Art)
%eps_p_0=0;
%0/0 är inte så trevligt, däeför görs eps_c positiv och lägger på en
liten
%spänning
eps_c=(eps_c*(-1))+(1*10^(-12));
% välj stegstorlek,
delta_eps_c=(eps_e_c)/100
%då kör vi
% start neutral axeln blir den sista neutralaxeln i elastiska.
x_pl_prev=z_0;
if tension_failure ~= 1
while eps_c<=eps_p_c
x_pl=plast_x(fc,eps_c,eps_e_c,eps_p_0,hg,...
bg,Arc,Art,Zt,Zc,Eg,Erc,Ert,x_pl_prev,fy);

CHALMERS, Civil and Environmental Engineering, Master’s Thesis 2011:52 50
%plastiseringsgraden
x=((eps_c-eps_e_c)/eps_c)*x_pl;
% lite räknevektorer för att kolla fel
pl(i)=x_pl;
xx(i)=x;
%spänningar, för momentet
sig_e_c=Eg*eps_c*((x_pl-x)/(x_pl));
sig_rc=Erc*eps_c*((x_pl-Zc)/(x_pl));
sig_P=Ert*(((eps_c*(hg-x_pl-Zt))/(x_pl))+eps_p_0);
sig_t=Eg*eps_c*((hg-x_pl)/(x_pl));
Ac1=bg*x;
Ac2=(1/2)*(x_pl-x)*bg;
At=(1/2)*(hg-x_pl)*bg;
M(i)=sig_t*At*(((2/3)*(hg-x_pl)))...
+sig_e_c*Ac1*(x_pl-x/2)...
+ sig_e_c*Ac2*((2/3)*(x_pl-x))...
+(sig_rc*Arc*(x_pl-Zc))...
+sig_P*Art*(hg-x_pl-Zt);
qq(i)=(M(i)*8)/L^2;
V=(qq(i)*L/2);
%nerböjningen
phi(i)=eps_c/x_pl;
EI(i)=M(i)/phi(i);
ner(i)=(5*(qq(i)+q_fik)*L^4)/(384*EI(i));
% kollarna, för tensil
eps_t=((hg-x_pl)/(x_pl))*eps_c;
if(eps_t>=eps_e_t);
disp('tensile failure')
break;
end

CHALMERS, Civil and Environmental Engineering, Master’s Thesis 2011:52 51
%för shear
shear(i)=3*V/(hg*bg*2);
if(shear(i)>=to);
disp('shear failure');
shear_failure=1;
tension_failure=1;
break;
end
%räkna upp räkneverken
e(i)=eps_c+delta_eps_c;
eps_c=eps_c+delta_eps_c;
xpl_prev=x_pl;
i=i+1;
% bb=bb+1;
%
% if bb == 8
% break
% end
end
end
M_pl=M(i-1)/1e6;
Q=qq.*L;
figure(1)
plot(M)
%figure(2)
%plot(ner)
%%%%%%%%%%%%%%%%%%%%%%%%%%%%%%%%%%%%%%%%%%%%%%%%%%%%%%%%%%%%%%%%%%%%%
%%%%%%
% The main calculations file,
%
% for reinforced an un-reinforced beam
%
% By S.W April 2011
%
%
%

CHALMERS, Civil and Environmental Engineering, Master’s Thesis 2011:52 52
%%%%%%%%%%%%%%%%%%%%%%%%%%%%%%%%%%%%%%%%%%%%%%%%%%%%%%%%%%%%%%%%%%%%%
%%%%%%
%
% function main_reinforced(Eg,Gg,ft,fc,to,bc,hc,...
% nc,bt,ht,nt,Ert,Erc,nr,hg,bg,...
% L,Arc,Art,Zc,Zt,re,dim,antal,a,f);
%% inparametrar som kan användas när underfilerna skall skapas eller
kollas
clear all
close all
clc
%% The beams basic geometry
hg=200 ; %[mm] Height
bg=115 ; %[mm] width
L=10000-400 ; %[mm] Length
%% Glulam
Eg=9490 ; %[MPa] youngs modulus
Gg=850 ; %[MPa] Shear modulus
ft=[40]; %[MPa] tensile strength
fc=[35] ; %[MPa] compressive strength
to=[3]; %[MPa] Shear strength
%% Reinforcement
%Compressive reinforcement
Erc=[165000]; %[MPa] Youngs modulus
bc=[1.4]; %[mm] width of laminate
hc=[30]; %[mm] hight of laminate
nc=[2]; %[-] number laminates
Arc=nc.*bc.*hc; %[mm2]area of reinforcement
Zc=hc./2; %[mm] dist. to GC
% tensile reinforcement
Ert=[165000];
bt=[1.4]; %[MPa] Youngs modulus

CHALMERS, Civil and Environmental Engineering, Master’s Thesis 2011:52 53
ht=[30]; %[mm] width of laminate
nt=[6]; %[mm] hight of laminate
Art=nt.*bt.*ht; %[mm2]area of reinforcement
Zt=ht./2; %[mm] dist. to GC
% increment number to plot the strain/stress curves in different
diagram
nr=[1];
% reinforcement is to be pre-stressed pre=2 normal re=1 otherwise =0
re=[1];
q=[1];
%ekvivalent tvärsnitt
alfa=Ert/Eg;
Ag_ek=[hg*bg+(alfa-1)*(nt*bt*ht+nc*hc*bc)];
Zgv=(bg*hg*hg*Eg/2+Arc*Zc*Erc+Art*Ert*(hg-
Zt))/(bg*hg*Eg+Arc*Erc+Art*Ert);
eN=hg-Zgv-Zc;
%%%%%%%%%%%%%%%%%%%%%%%%%%%%%%%%%%%%%%%%%%%%%%%%%%%%%%%%%%%%%%%%%%%%%
%%%%%%
%%%%%%%%%%%%%%%%%%%%%%%%%%%%%%%%%%%%%%%%%%%%%%%%%%%%%%%%%%%%%%%%%%%%%
%%%%
%%%%%%%%%%%%%%%%%%%%%%%%%%%%%%%%%%%%%%%%%%%%%%%%%%%%%%%%%%%%%%%%%%%%%
%%%%%%
%% inparametrar
% saker som behövs innan sjävla lopparna skall starta upp
%ekvivalent tvärrsnitt
alfa=Ert/Eg;
Ag_ek=[hg*bg+(alfa-1)*(nt*bt*ht+nc*hc*bc)]
% neutral axeln för det elastiska fallet.
x_el=(bg*hg*hg*Eg/2+Arc*Zc*Erc+Art*Ert*(hg-
Zt))/(bg*hg*Eg+Arc*Erc+Art*Ert);
y_tp=x_el;
% töjningar
eps_e_t=ft/Eg; % elastic strain limit in tension

CHALMERS, Civil and Environmental Engineering, Master’s Thesis 2011:52 54
eps_e_c=fc/Eg; % elastic strain limit in compression
% plastisk töjning
eps_c_p=3*eps_e_c; % ultimate plastic strain 1
%gör valet av start pkt för top spänningen
eps_c0=eps_e_c/100;
% välj stegstorlek, osäker på att jag behöver denna.
delta_eps_c=eps_e_c/100;
%%%%%%%%%%%%%%%%%%%%%%%%%%%%%%%%%%%%%%%%%%%%%%%%%%%%%%%%%%%%%%%%%%%%%
%%%%%%
%% Elastiska modellen
%fördefinerar kontrollvariabler.
shear_failure=0;
tension_failure=0;
eps_c=eps_c0;
e(1)=eps_c;
i=2;
% dåså, då kör vi, elastiska loopen defineras som
while eps_c<=eps_e_c
%räknar ut motsvarande botten töjning
eps_t=((hg/x_el)-1)*eps_c;
%tar fram töjningarna i armeringslagrerna
eps_rc=((x_el-Zc)/x_el)*eps_c;
eps_rt=((hg-x_el-Zt)/x_el)*eps_c;
%kontrollerar så botten töjning ligger innin gränserna
if(eps_t>=eps_e_t);
display('tensile failure');
tension_failure=1;
break;
end

CHALMERS, Civil and Environmental Engineering, Master’s Thesis 2011:52 55
%beräknar krökningen
phi(i)=eps_c/x_el
%beräknar resisterande momentet
M(i)=1/2*eps_c*Eg*2/3*bg*x_el^2+eps_rc*Erc*Arc*(x_el-Zc)...
+1/2*eps_t*Eg*2/3*bg*(hg-x_el)^2+eps_rt*Ert*Art*(hg-x_el-Zt);
EI(i)=M(i)/phi(i);
q(i)=(M(i)*8)/L^2;
EI(i)=M(i)/phi(i);
u(i)=(5*q(i)*L^4)/(384*EI(i));
V=(q(i)*L/2);
shear(i)=3*V/(hg*bg*2);
if(shear(i)>=to);
display('shear failure');
shear_failure=1;
tension_failure=1;
break;
end
e(i)=eps_c+delta_eps_c;
eps_c=eps_c+delta_eps_c;
i=i+1;
end
%fixar till vektorerna
phi_el=phi(i-1)*1000;
M_el=M(i-1)/1e6;
q_el=q(i-1)/1000;
u_el=u(i-1);
%% elastiska ploter
set(0,'DefaultFigureWindowStyle','docked')
%för att få töjningsdigrammet
eps_h(1)=eps_c;
h_sec(1)=0;
eps_h(2)=-((hg-x_el)./x_el)*eps_c;

CHALMERS, Civil and Environmental Engineering, Master’s Thesis 2011:52 56
h_sec(2)=hg;
figure(nr+2)
subplot(2,1,1)
plot(eps_h,h_sec,'b-');
grid on
set(gca,'YDir','reverse');
xlabel('Strains')
ylabel('Depth [mm]')
hold on
plot([0 0],[0 hg],'k-');
%plotar spännings diagrammet för elstiska fasen
sigma_h(1)=eps_c*Eg;
sigma_h(2)=eps_h(2)*Eg;
figure(nr+2)
subplot(2,1,2)
plot([sigma_h(1) sigma_h(2)],[h_sec(1) h_sec(2)],'b-');
set(gca,'YDir','reverse');
xlabel('Stress[N/mm2]')
ylabel('Depth [mm]')
grid on
hold on
plot([0 0],[0 hg],'k-');
%%%%%%%%%%%%%%%%%%%%%%%%%%%%%%%%%%%%%%%%%%%%%%%%%%%%%%%%%%%%%%%%%%%%%
%%%%%%
%% plastisk model
%anser start för den plastiska modellen
x_pl=0;
%0/0 är inte så trevligt
eps_c=eps_c+0.00000001;
%då kör vi
if tension_failure ~= 1
while eps_c<=eps_c_p

CHALMERS, Civil and Environmental Engineering, Master’s Thesis 2011:52 57
a=fc*bg*(eps_c-eps_e_c)/eps_c+...
fc*bg/2*(1-(eps_c-eps_e_c)/eps_c)-...
eps_c*bg/2*Eg;
b=eps_c*(Erc*Arc+bg*hg*Eg+Art*Ert);
c=eps_c*(Zt*Art*Ert-Zc*Erc*Arc-(bg/2)*Eg*hg^2-hg*Art*Ert);
x_pl=(-b+sqrt(b^2-4*a*c))/(2*a);
x_test(i)=x_pl;
% ypl_prev=x_pl;
eps_t=((hg/x_pl)-1)*eps_c;
if(eps_t>=eps_e_t);
display('tensile failure')
break;
end
eps_rc=(1-Zc/x_pl)*eps_c;
eps_rt=((hg-x_pl-Zt)/x_pl)*eps_c;
sigma_c_lam=eps_rc*Erc;
sigma_t_lam=eps_rt*Ert;
Zp=(((eps_c-eps_e_c)/eps_c))*x_pl;
phi(i)=eps_c/x_pl;
%beräknar restisterande moment
M(i)=sigma_c_lam*Arc*(x_pl-Zc)+fc*bg*Zp*(x_pl-Zp/2)+...
1/2*fc*(x_pl-Zp)*bg*2/3*(x_pl-Zp)+...
sigma_t_lam*Art*(hg-x_pl-Zt)+...
1/2*(eps_t*Eg)*(hg-x_pl)*bg*2/3*(hg-x_pl);
q(i)=(M(i)*8)/L^2;
EI(i)=M(i)/phi(i);
u(i)=(5*q(i)*L^4)/(384*EI(i));
V=(q(i)*L/2);
shear(i)=3*V/(hg*bg*2);

CHALMERS, Civil and Environmental Engineering, Master’s Thesis 2011:52 58
if(shear(i)>=to);
display('shear failure');
shear_failure=1;
tension_failure=1;
break;
end
e(i)=eps_c;
i=i+1;
eps_c=eps_c+delta_eps_c;
end
end
phi_pl=phi(i-1)*1000;
M_pl=M(i-1)/1e6;
q_pl=q(i-1)/1000;
u_pl=u(i-1);
%% plota den plastiska töjning och spänningen.
%för töjningen blir det samma som den elastiska
eps_h(1)=eps_c;
h_sec(1)=0;
eps_h(2)=-((hg-x_el)./x_el)*eps_c;
h_sec(2)=hg;
figure(nr+2)
subplot(2,1,1)
plot(eps_h,h_sec,'r-');
set(gca,'YDir','reverse');
xlabel('Strains')
ylabel('Depth [mm]')
hold on
plot([0 0],[0 hg],'k-');
%för spännningen så behövs det 3 pkt för att beskriva kurvan.

CHALMERS, Civil and Environmental Engineering, Master’s Thesis 2011:52 59
sigma_h(1)=eps_c*Eg;
sigma_h(2)=eps_h(2)*Eg;
h_sec(2)=Zp;
h_sec(3)=hg;
figure(nr+2)
subplot(2,1,2)
plot([sigma_h(1) sigma_h(1)],[h_sec(1) h_sec(2)],'r-');
hold on
plot([sigma_h(1) sigma_h(2)],[h_sec(2) h_sec(3)],'r-');
set(gca,'YDir','reverse');
xlabel('Stress[N/mm2]')
ylabel('Depth [mm]')
grid on
hold on
plot([0 0],[0 hg],'k-');
%% resultat
%%%%%%%%%%%%%%%%%%%%%%%%%%%%%%%%%%%%%%
% huvudplotar
%%%%%%%%%%%%%%%%%%%%%%%%%%%%%%%%%%%%%%
figure(1)
% M(1)=0;
% phi(1)=0;
% q(1)=0;
plot(phi,M,'--')
title('Moment Curvature Relation');
grid on;
xlabel('\phi')
Ylabel('Moment [kNm]')
figure(2)
plot(u,q,'-.')
title('Load Displacement Relation');
grid on;

CHALMERS, Civil and Environmental Engineering, Master’s Thesis 2011:52 60
xlabel('\delta')
ylabel('Load [kN]')
%%%%%%%%%%%%%%%%%%%%%%%%%%%%%%%%%%%%%%%%%%%%%%%%%%%%%%%%%%%%%%%%%%%%%
%%%%%%
% Pre-stressed Beam,
%
% plastic yielding, neutral axies
%
% By; S.W, March 2011
%
%%%%%%%%%%%%%%%%%%%%%%%%%%%%%%%%%%%%%%%%%%%%%%%%%%%%%%%%%%%%%%%%%%%%%
%%%%%%
function x_pl=plast_x(fc,eps_c,eps_e_c,eps_p_0,hg,...
bg,Arc,Art,Zt,Zc,Eg,Erc,Ert,x_pl_prev,fy,nc,M);
%% för de olika flytkriterierna
eps_rc=((x_pl_prev-Zc)/x_pl_prev)*eps_c;
eps_rt=(((hg-x_pl_prev-Zt)/x_pl_prev)*eps_c)+eps_p_0;
sig_rc=eps_rc*Erc;
sig_rt=eps_rt*Ert;
if sig_rc >= fy
sig_rc = fy;
end
if Arc == 0
sig_rc=0;
end
if sig_rt >= fy
sig_rt = fy;
end
sig_rc;
sig_rt;
test=0;

CHALMERS, Civil and Environmental Engineering, Master’s Thesis 2011:52 61
%% om inget flyter
if sig_rc<fy && sig_rt<fy
%a1=(Eg*eps_c*bg*((eps_c-eps_e_c)/(eps_c))*(1-((eps_c-
eps_e_c)/(eps_c)))+...
% (1/2)*Eg*bg*eps_c*(1-((eps_c-eps_e_c)/(eps_c)))^2-...
% (1/2)*Eg*bg*eps_c);
a1=(fc*bg*(1-((eps_e_c)/(eps_c)))...
+((fc*bg)/(2))*((eps_e_c)/(eps_c))...
-(eps_c*bg/2)*Eg);
b1=(-Ert*Art*(-eps_c+eps_p_0)+...
Eg*bg*hg*eps_c+...
Erc*Arc*eps_c);
c1=eps_c*(-Ert*Art*(hg-Zt)-...
(1/2)*Eg*bg*(hg^2)+...
Erc*Arc*(-Zc));
% length(M)
x_pl=(-b1+sqrt(b1^2-4*a1*c1))/(2*a1);
test=test+1;
disp('inget flyter')
end
%% Om topp armeringen flyter
if sig_rc == fy && sig_rt < fy
a1=(fc*bg*(1-((eps_e_c)/(eps_c)))...
+(fc*bg)/(2)...
-(((fc*bg)/(2))*((eps_c-eps_e_c)/(eps_c)))...
-(eps_c*bg/2)*Eg);
b1=(sig_rc*Arc...
+Eg*eps_c*bg*hg...
-Ert*Art*(-eps_c+eps_p_0));

CHALMERS, Civil and Environmental Engineering, Master’s Thesis 2011:52 62
c1=((-eps_c*((bg*hg^2)/(2))*Eg)...
-(eps_c*Ert*Art*(hg-Zt)));
x_pl=(-b1+sqrt(b1^2-4*a1*c1))/(2*a1);
test=test+1;
% length(M)
disp('top flyter')
end
%% Om bottenarmeringen flyter
if sig_rc < fy && sig_rt == fy
%a1=1/2*fc*bg*(eps_c-eps_e_c)/eps_c+1/2*fc*bg-1/2*eps_c*Eg*bg;
% b1=eps_c*Erc*Arc-sig_rt*Art+1/2*eps_c*Eg*bg*2*hg;
%
% c1=-1/2*eps_c*Eg*bg*hg*hg-eps_c*Erc*Arc*Zc;
a1=(fc*bg*(1-((eps_e_c)/(eps_c)))...
+((fc*bg)/(2))...
-(((fc*bg)/(2))*((eps_c-eps_e_c)/(eps_c)))...
-((eps_c*bg)/(2))*Eg);
b1=(+eps_c*Erc*Arc...
+Eg*eps_c*bg*hg...
-(sig_rt)*Art);
c1=(-eps_c*((bg*hg^2)/(2))*Eg...
-eps_c*Erc*Arc*Zc);
% length(M)
x_pl=(-b1+sqrt(b1^2-4*a1*c1))/(2*a1);
test=test+1;
disp('botten flyter')
end
%% om båda flyter

CHALMERS, Civil and Environmental Engineering, Master’s Thesis 2011:52 63
if sig_rc == fy && sig_rt == fy
a1=1/2*fc*bg*(eps_c-eps_e_c)/eps_c+1/2*fc*bg-1/2*eps_c*Eg*bg;
b1=(sig_rc*Arc...
+Eg*eps_c*bg*hg...
-sig_rt*Art);
c1=-1/2*eps_c*Eg*bg*hg*hg;
x_pl=(-b1+sqrt(b1^2-4*a1*c1))/(2*a1);
% length(M)
test=test+1;
disp('dubbel flyt')
end
%% loop koll
if test>1
disp('mer än en plastiskmöjlighet har räknats')
end
%%%%%%%%%%%%%%%%%%%%%%%%%%%%%%%%%%%%%%%%%%%%%%%%%%%%%%%%%%%%%%%%%%%%%
%%%%%%
% Pre-stressed Beam,
%
% Preload calcualtions
%
% By; S.W, March 2011
%
%%%%%%%%%%%%%%%%%%%%%%%%%%%%%%%%%%%%%%%%%%%%%%%%%%%%%%%%%%%%%%%%%%%%%
%%%%%%
function
[eps_top_preload,Nek_max]=Preload(L,Eg,ft,fc,fm,bc,hc,nc,bt,...
ht,nt,Ert,hg,bg,Ag_ek,...
Arc,Art,Zc,Zt,Zgv)
% Function file for the Alann André file to be able to calculate
% pre-stressed beams too.
%The sign rules given in "bärande konstruktioner",del2 s.B231. has
been
CHALMERS, Civil and Environmental Engineering, Master’s Thesis 2011:52 64
%applied.
%The same approch as in the MathCAD file has been applied here.
%For further information look in the MathCAD file or the Thesis.
%%%%%%%%%%%%%%%%%%%%%%%%%%%%%%%%%%%%%%%%%%%%%%%%%%%%%%%%%%%%%%%%%%%%%
%%%%%%
%% finding the strain diffrence casused by the pre-stressing force.
%following the MathCAD file.
eN=hg-Zgv-Zc;
% Need a I and alfa
alfa=Ert/Eg;
I=((bg*hg^3/12)+hg*bg*(Zgv-(hg/2))^2)+...
(alfa-1)*(((nc*bc*hc^3)/(12))+Arc*(Zgv-Zc)^2+...
((nt*bt*ht^3)/(12))+Art*(hg-Zgv-Zt)^2);
%there, now we will follow the MathCAD file again.
eps_bot_preload=-(fc/Eg)/10;
Nek_max=(eps_bot_preload*Eg)*((Ag_ek*I)/(eN*(hg-Zgv)*Ag_ek+I));
sigma_ek=Nek_max/Art;
eps_top_preload=((Nek_max/Ag_ek)+((Nek_max*eN)/(I))*-Zgv)/Eg;
% eps_top_diff=abs(eps_top_preload-(-fc/Eg));
% eps_bot_diff=abs(eps_bot_preload-(ft/Eg));
%% vippningskravet
%geezus, jag är glad att det inte var jag som behövde defineria den.
%I_z för toparmeringen
if nc == 0
I_z_c=0;
elseif nc == 1

CHALMERS, Civil and Environmental Engineering, Master’s Thesis 2011:52 65
I_z_c=(alfa-1)*((hc*bc^3)/12);
elseif nc/2 == round(nc/2)
for i=1:1:nc/2
PP(i)=(2*((hc*bc^3/12)+hc*bc*((((bc)/(2*(nc+1)))*(2*(i-1)))^2)));
end
I_z_c=(alfa-1)*sum(PP);
else
for j=2:1:(nc/2)
PPP(j-1)=(2*(((hc*bc^3)/(12))+hc*bc(((bc)/(nc+1))*(j-1))^2));
end
I_z_c=(alfa-1)*((hc*bc^3/12)+sum(PPP));
end
%samma för bottenarmeringen
if nt == 0
I_z_t=0;
elseif nt == 1
I_z_t=(alfa-1)*((ht*bt^3)/12);
elseif nt/2 == round(nt/2)
for k=1:1:nt/2
PP(k)=(2*((ht*bt^3/12)+ht*bt*((((bt)/(2*(nt+1)))*(2*(k-1)))^2)));
end
I_z_t=(alfa-1)*sum(PP);
else
for m=2:1:(nt/2)
PPP(m-1)=(2*(((ht*bt^3)/(12))+ht*bt(((bt)/(nt+1))*(m-1))^2));
end
I_z_t=(alfa-1)*((ht*bt^3/12)+sum(PPP));
end
I_z=((hg*bg^3)/(12)+I_z_c+I_z_t);
zmax=max(Zgv,hg-Zgv);

CHALMERS, Civil and Environmental Engineering, Master’s Thesis 2011:52 66
Wy=I/zmax;
%dåsså, då kör vi EC vippnings formel jox.
beta_c=0.1;
km=0.7;
iz=sqrt(I_z/(hg*bg));
lam_z=(L/iz);
lam_rel_z=(lam_z/pi)*sqrt(fc/Eg);
k_z=(1/2)*(1+beta_c*(lam_rel_z-0.3)+lam_rel_z^2);
k_c_z=1/((k_z)+(sqrt(k_z^2+lam_rel_z^2)));
P=1/((1/(k_c_z*fc*(hg*bg)))+(km*(eN/(fm*Wy))));
Nek_max=max(Nek_max,-P);%*(1.4);
sigma_ek=Nek_max/Art
eps_top_preload=((Nek_max/Ag_ek)+((Nek_max*eN)/(I))*-Zgv)/Eg;

CHALMERS, Civil and Environmental Engineering, Master’s Thesis 2011:52 67
10.3 Appendix C: Calculation sheet – economy
Beam length L [m] 18 % RF Reinforced Gain Prestressed Gain
Width w [m] 0,215 0.5% 1,391 0,229 1,305 0,315
Height h [m] (without RF) 1,62 1.0% 1,244 0,376 1,183 0,437
1.5% 1,146 0,474 1,095 0,525
2.0% 1,078 0,542 1,038 0,582
Density [kg/m3] 400 2.5% 1,030 0,590 1,000 0,620
3.0% 0,997 0,623 0,973 0,647
Density [kg/m3] 7850 % RF Reinforced Gain Prestressed Gain
0.5% 0,215 0,000 0,215 0,000
1.0% 0,215 0,000 0,215 0,000
Density [kg/m3] 1650 1.5% 0,215 0,000 0,215 0,000
% of RF C-S area [%] 28% 2.0% 0,215 0,000 0,215 0,000
2.5% 0,215 0,000 0,215 0,000
3.0% 0,215 0,000 0,215 0,000
Reinforcement - Steel
Glulam
General
Glue
Input
Reduced heitght due to RF [m]
Reduced width due to RF [m]
Glulam (GL28) 3000 SEK/m3
4000 SEK/m3
5000 SEK/m3
Steel (460) 9 SEK/kg
Glue 34 SEK/kg
Unreinforced
Pre-stressed 185 SEK/m3
Reinforced (estimated) 93 SEK/m3
Factory - loans etc. 105 SEK/m3
Maintenance and operation 34 SEK/m3
Material
Other costs
Production
Costs
(Included in material)
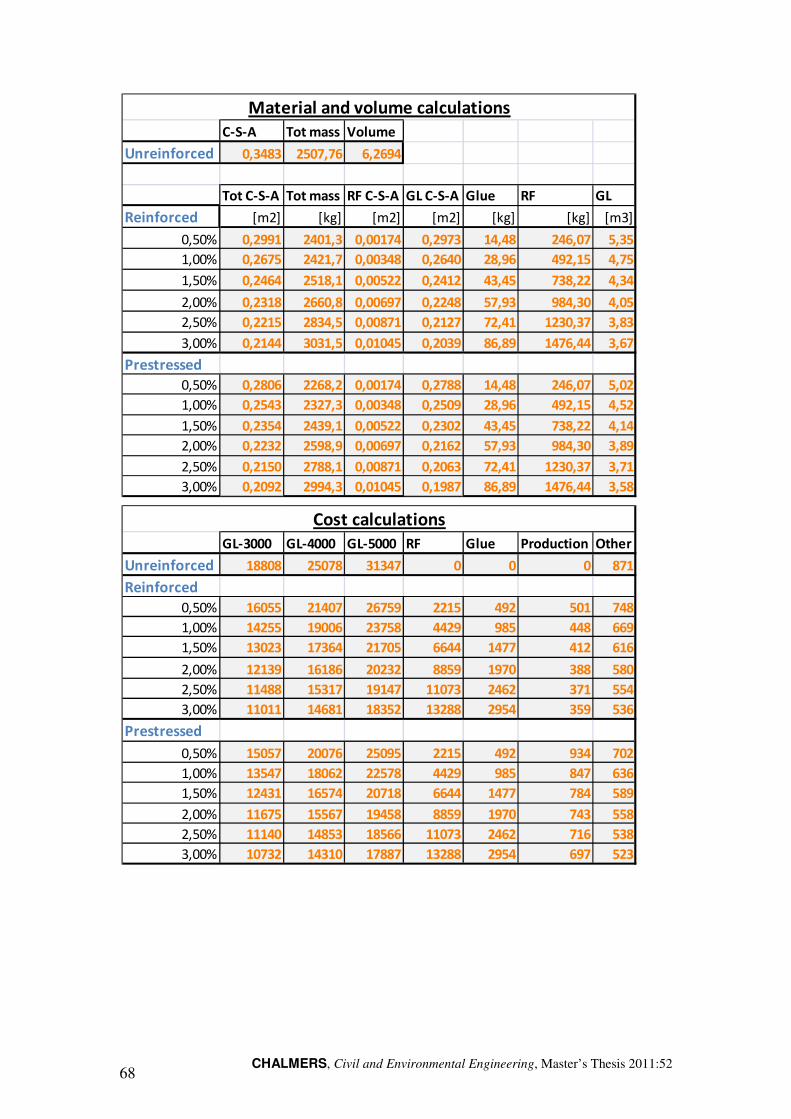
CHALMERS, Civil and Environmental Engineering, Master’s Thesis 2011:52 68
C-S-A Tot mass Volume
Unreinforced 0,3483 2507,76 6,2694
Tot C-S-A Tot mass RF C-S-A GL C-S-A Glue RF GL
Reinforced [m2] [kg] [m2] [m2] [kg] [kg] [m3]
0,50% 0,2991 2401,3 0,00174 0,2973 14,48 246,07 5,35
1,00% 0,2675 2421,7 0,00348 0,2640 28,96 492,15 4,75
1,50% 0,2464 2518,1 0,00522 0,2412 43,45 738,22 4,34
2,00% 0,2318 2660,8 0,00697 0,2248 57,93 984,30 4,05
2,50% 0,2215 2834,5 0,00871 0,2127 72,41 1230,37 3,83
3,00% 0,2144 3031,5 0,01045 0,2039 86,89 1476,44 3,67
Prestressed
0,50% 0,2806 2268,2 0,00174 0,2788 14,48 246,07 5,02
1,00% 0,2543 2327,3 0,00348 0,2509 28,96 492,15 4,52
1,50% 0,2354 2439,1 0,00522 0,2302 43,45 738,22 4,14
2,00% 0,2232 2598,9 0,00697 0,2162 57,93 984,30 3,89
2,50% 0,2150 2788,1 0,00871 0,2063 72,41 1230,37 3,71
3,00% 0,2092 2994,3 0,01045 0,1987 86,89 1476,44 3,58
Material and volume calculations
GL-3000 GL-4000 GL-5000 RF Glue Production Other
Unreinforced 18808 25078 31347 0 0 0 871
Reinforced
0,50% 16055 21407 26759 2215 492 501 748
1,00% 14255 19006 23758 4429 985 448 669
1,50% 13023 17364 21705 6644 1477 412 616
2,00% 12139 16186 20232 8859 1970 388 580
2,50% 11488 15317 19147 11073 2462 371 554
3,00% 11011 14681 18352 13288 2954 359 536
Prestressed
0,50% 15057 20076 25095 2215 492 934 702
1,00% 13547 18062 22578 4429 985 847 636
1,50% 12431 16574 20718 6644 1477 784 589
2,00% 11675 15567 19458 8859 1970 743 558
2,50% 11140 14853 18566 11073 2462 716 538
3,00% 10732 14310 17887 13288 2954 697 523
Cost calculations

CHALMERS, Civil and Environmental Engineering, Master’s Thesis 2011:52 69
GL-3000 GL-4000 GL-5000 GL-3000 GL-4000 GL-5000
Unreinforced 19680 25949 32218
Reinforced
0,50% 20011 25363 30715 332 -586 -1503
1,00% 20786 25537 30289 1106 -412 -1929
1,50% 22173 26514 30855 2493 565 -1363
2,00% 23936 27982 32028 4256 2033 -190
2,50% 25948 29778 33607 6269 3829 1388
3,00% 28148 31819 35489 8469 5870 3271
Prestressed
0,50% 19400 24419 29438 -279 -1530 -2780
1,00% 20444 24960 29475 764 -990 -2743
1,50% 21925 26069 30212 2245 120 -2006
2,00% 23805 27696 31588 4125 1747 -630
2,50% 25929 29642 33356 6249 3693 1137
3,00% 28195 31772 35350 8515 5823 3131
Total cost per beam Savings per beam
Beam costs and savings
Width [m] 18
Length [m] 30
Nr. of beams 4
Input - Project
Building
Wall material -750 SEK/m2
Max load 28000 kg
Cost/transport 12000 SEK
Structural
Transport
Savings - Project

CHALMERS, Civil and Environmental Engineering, Master’s Thesis 2011:52 70
Beams/trans. Cost/beam
Unreinforced 11 1091
Reinforced
0,50% 11 1091
1,00% 11 1091
1,50% 11 1091
2,00% 10 1200
2,50% 9 1333
3,00% 9 1333
Prestressed
0,50% 12 1000
1,00% 12 1000
1,50% 11 1091
2,00% 10 1200
2,50% 10 1200
3,00% 9 1333
Transport calculations
Structural Transport
Reinforced GL-3000 GL-4000 GL-5000 GL-3000 GL-4000 GL-5000
0,50% 1327 -2343 -6013 -16488 0 -15161 -18831 -22501
1,00% 4425 -1647 -7718 -27072 0 -22647 -28719 -34790
1,50% 9974 2260 -5454 -34128 0 -24154 -31868 -39582
2,00% 17024 8132 -760 -39024 436 -21564 -30456 -39347
2,50% 25074 15314 5554 -42480 970 -16436 -26196 -35956
3,00% 33875 23479 13083 -44856 970 -10011 -20407 -30804
Prestressed
0,50% -1117 -6119 -11120 -22680 -364 -24161 -29162 -34164
1,00% 3057 -3958 -10974 -31464 -364 -28770 -35786 -42801
1,50% 8981 478 -8025 -37800 0 -28819 -37322 -45825
2,00% 16501 6990 -2521 -41904 436 -24967 -34478 -43989
2,50% 24997 14773 4548 -44640 436 -19206 -29431 -39655
3,00% 34060 23292 12524 -46584 970 -11554 -22322 -33090
Saving
Savings calculations
Beams

CHALMERS, Civil and Environmental Engineering, Master’s Thesis 2011:52 71
Costs
Length Width Height Width Length Nr. of beams Reinforced
18 0,215 1,62 18 30 4 93
Glulam
0,50% 1% 1,50% 2% 2,50% 3% 0,50% 1% 1,50% 2% 2,50% 3%
Height gain 0,229 0,376 0,474 0,542 0,590 0,623 0,315 0,437 0,525 0,582 0,620 0,647
Width gain 0,000 0,000 0,000 0,000 0,000 0,000 0,000 0,000 0,000 0,000 0,000 0,000
Beam cost
GL-3000 18808 16055 14255 13023 12139 11488 11011 15057 13547 12431 11675 11140 10732
GL-4000 25078 21407 21407 21407 21407 21407 21407 21407 21407 21407 21407 21407 21407
GL-5000 31347 26759 26759 26759 26759 26759 26759 26759 26759 26759 26759 26759 26759
Beam saving
GL-3000 332 1106 2493 4256 6269 8469 -279 764 2245 4125 6249 8515
GL-4000 -586 -412 565 2033 3829 5870 -1530 -990 120 1747 3693 5823
GL-5000 -1503 -1929 -1363 -190 1388 3271 -2780 -2743 -2006 -630 1137 3131
Project saving
GL-3000 -15161 -22647 -24154 -21564 -16436 -10011 -24161 -28770 -28819 -24967 -19206 -11554
GL-4000 -18831 -28719 -31868 -30456 -26196 -20407 -29162 -35786 -37322 -34478 -29431 -22322
GL-5000 -22501 -34790 -39582 -39347 -35956 -30804 -34164 -42801 -45825 -43989 -39655 -33090
Reinforced Prestressed
Results
InputBeam Building

CHALMERS72
10.4 Appendix D: Economical diagrams
Figure 10.1 Beam length comparison; width = 215mm, L=length [m], h=height
[mm]
Figure 10.2 Beam length c
CHALMERS, Civil and Environmental Engineering, Master’s Thesis
Appendix D: Economical diagrams
Beam length comparison; width = 215mm, L=length [m], h=height
Beam length comparison; width = 215mm, L=length [m], h=height [mm]
, Master’s Thesis 2011:52
Beam length comparison; width = 215mm, L=length [m], h=height
omparison; width = 215mm, L=length [m], h=height [mm]

CHALMERS, Civil and Enviro
Figure 10.3 Beam length comparison; width = 215mm, L=length [m], h=height
[mm]
Civil and Environmental Engineering, Master’s Thesis 2011:52
Beam length comparison; width = 215mm, L=length [m], h=height
73
Beam length comparison; width = 215mm, L=length [m], h=height

CHALMERS74
Figure 10.4 Beam length comparison; width = 215mm, L=length [m], h=height
[mm]
Figure 10.5 Beam width comparison; length = 18m, w=width [mm], h=height [mm]
CHALMERS, Civil and Environmental Engineering, Master’s Thesis
th comparison; width = 215mm, L=length [m], h=height
Beam width comparison; length = 18m, w=width [mm], h=height [mm]
, Master’s Thesis 2011:52
th comparison; width = 215mm, L=length [m], h=height
Beam width comparison; length = 18m, w=width [mm], h=height [mm]

CHALMERS, Civil and Enviro
Figure 10.6 Beam width comparison; length = 18m, w=width [mm], h=height [mm]
Figure 10.7 Beam width comparison; length = 18m, w=width [mm], h=height [mm]
Civil and Environmental Engineering, Master’s Thesis 2011:52
width comparison; length = 18m, w=width [mm], h=height [mm]
Beam width comparison; length = 18m, w=width [mm], h=height [mm]
75
width comparison; length = 18m, w=width [mm], h=height [mm]
Beam width comparison; length = 18m, w=width [mm], h=height [mm]

CHALMERS76
Figure 10.8 Beam width comparison; length = 18m, w=width [mm], h=height [mm]
Figure 10.9 Various pre
of calculated acceptable
CHALMERS, Civil and Environmental Engineering, Master’s Thesis
width comparison; length = 18m, w=width [mm], h=height [mm]
pre-stressing force; length=18 m, width=215 mm, P= amount
of calculated acceptable pre-stressing force, h=height [mm]
, Master’s Thesis 2011:52
width comparison; length = 18m, w=width [mm], h=height [mm]
force; length=18 m, width=215 mm, P= amount
force, h=height [mm]

CHALMERS, Civil and Enviro
Figure 10.10 Various pre
of calculated acceptable
Figure 10.11 Various pre
of calculated acceptable
Civil and Environmental Engineering, Master’s Thesis 2011:52
pre-stressing force; length=18 m, width=215 mm, P= amount
of calculated acceptable pre-stressing force, h=height [mm]
re-stressing force; length=18 m, width=215 mm, P= amount
of calculated acceptable pre-stressing force, h=height [mm]
77
force; length=18 m, width=215 mm, P= amount
force, h=height [mm]
force; length=18 m, width=215 mm, P= amount
force, h=height [mm]

CHALMERS78
Figure 10.12 Various pre
of calculated acceptable
CHALMERS, Civil and Environmental Engineering, Master’s Thesis
pre-stressing force; length=18 m, width=215 mm, P= amount
ated acceptable pre-stressing force, h=height [mm]
, Master’s Thesis 2011:52
force; length=18 m, width=215 mm, P= amount
force, h=height [mm]
Related Documents