Analytical modeling of PEM fuel cell gas diffusion layers deformation under compression: Part1-Linear behaviour region V. Norouzifard a , M. Bahrami a a Laboratory for Alternative Energy Conversion (LAEC), Mechatronic Systems Engineering, Simon Fraser University, BC, Canada, V3T 0A3 In the Proton exchange membrane PEM fuel cell stack, transport characteristics of the porous gas diffusion layer (GDL) change due to the GDL microstructural parameters variation in a result of compressive loading. GDL provides mechanical support for the membrane assembly against the compressive loads imposed by bipolar plates. In the compressive loads more than a critical pressure, GDL has a linear mechanical behaviour and its compressive modulus reaches a constant value. Using unit cell approach and assuming a simplified geometry for the complex and random microstructure of the GDL, a new mechanistic model is developed that can accurately predict the mechanical behaviour of GDL. A comparison between the present model and the GDL stress-strain data shows that the model can predict accurately the mechanical behaviour of the GDL material. The nonlinear behaviour of GDL will be addressed in the second part of this study. Introduction A proton exchange membrane (PEM) fuel cell consists of a five-layered structure called the membrane electrode assembly (MEA), which is sandwiched between bipolar plates (1). The gas diffusion layer (GDL), one of the main components in the membrane electrode assembly (MEA), is a carbon fiber based highly porous media in the form of paper or cloth. Figure 1 shows the microstructure of a typical GDL sample captured by scanning electron microscope (SEM). Acting as a mechanical support, providing electronic conductivity between components, providing reactant access to catalyst layers as well as removing generated heat and reaction products are the main duties of the GDL in a fuel cell stack (2). To collect generated electricity and heat from the cell, an appropriate contact between the membrane layers with low thermal and electrical contact resistances is essential. During the MEA assembling process, the MEA layers are compressed between the bipolar plates by an initial normal pressure applied to insure proper contact between layers and also to seal the cell. In addition to the assembly pressure, hygro-thermal stresses, result from membrane swelling during the fuel cell operation, apply extra compressive loads on the GDL (3–9). The flexible, porous microstructure of the GDL deforms considerably when subjected to such compressive loads. The deformation results in significant changes in the GDL’s properties such as porosity, permeability, diffusivity, electrical and thermal bulk conductivities and contact resistances (1). These property changes can significantly impact the transport phenomena, overall performance and life of the fuel cell stack. Therefore, the mechanical behaviour of GDL under compression must be understood. In recent years, a number of studies 10.1149/06111.0001ecst ©The Electrochemical Society ECS Transactions, 61 (11) 1-12 (2014) 1 ) unless CC License in place (see abstract). ecsdl.org/site/terms_use address. Redistribution subject to ECS terms of use (see 207.23.222.103 Downloaded on 2014-12-04 to IP

Welcome message from author
This document is posted to help you gain knowledge. Please leave a comment to let me know what you think about it! Share it to your friends and learn new things together.
Transcript
Analytical modeling of PEM fuel cell gas diffusion layers deformation under compression: Part1-Linear behaviour region
V. Norouzifard a, M. Bahrami a
a Laboratory for Alternative Energy Conversion (LAEC), Mechatronic Systems
Engineering, Simon Fraser University, BC, Canada, V3T 0A3
In the Proton exchange membrane PEM fuel cell stack, transport characteristics of the porous gas diffusion layer (GDL) change due to the GDL microstructural parameters variation in a result of compressive loading. GDL provides mechanical support for the membrane assembly against the compressive loads imposed by bipolar plates. In the compressive loads more than a critical pressure, GDL has a linear mechanical behaviour and its compressive modulus reaches a constant value. Using unit cell approach and assuming a simplified geometry for the complex and random microstructure of the GDL, a new mechanistic model is developed that can accurately predict the mechanical behaviour of GDL. A comparison between the present model and the GDL stress-strain data shows that the model can predict accurately the mechanical behaviour of the GDL material. The nonlinear behaviour of GDL will be addressed in the second part of this study.
Introduction
A proton exchange membrane (PEM) fuel cell consists of a five-layered structure
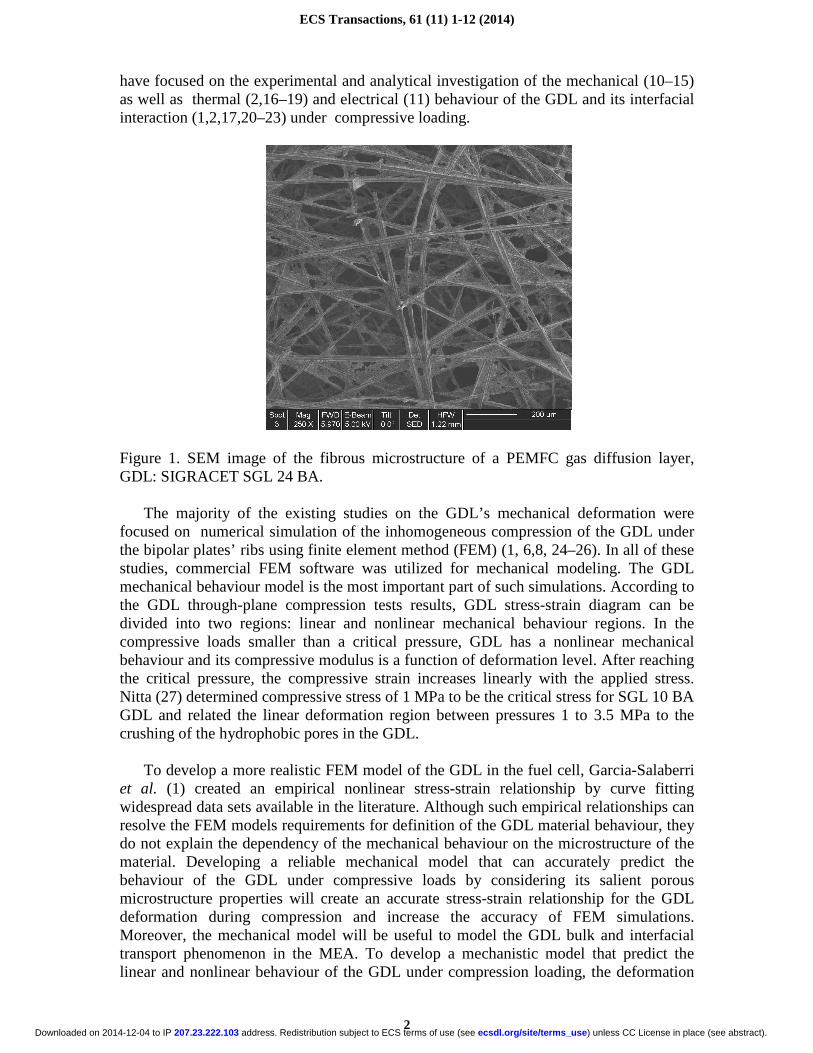
called the membrane electrode assembly (MEA), which is sandwiched between bipolar plates (1). The gas diffusion layer (GDL), one of the main components in the membrane electrode assembly (MEA), is a carbon fiber based highly porous media in the form of paper or cloth. Figure 1 shows the microstructure of a typical GDL sample captured by scanning electron microscope (SEM). Acting as a mechanical support, providing electronic conductivity between components, providing reactant access to catalyst layers as well as removing generated heat and reaction products are the main duties of the GDL in a fuel cell stack (2). To collect generated electricity and heat from the cell, an appropriate contact between the membrane layers with low thermal and electrical contact resistances is essential. During the MEA assembling process, the MEA layers are compressed between the bipolar plates by an initial normal pressure applied to insure proper contact between layers and also to seal the cell. In addition to the assembly pressure, hygro-thermal stresses, result from membrane swelling during the fuel cell operation, apply extra compressive loads on the GDL (3–9). The flexible, porous microstructure of the GDL deforms considerably when subjected to such compressive loads. The deformation results in significant changes in the GDL’s properties such as porosity, permeability, diffusivity, electrical and thermal bulk conductivities and contact resistances (1). These property changes can significantly impact the transport phenomena, overall performance and life of the fuel cell stack. Therefore, the mechanical behaviour of GDL under compression must be understood. In recent years, a number of studies
10.1149/06111.0001ecst ©The Electrochemical SocietyECS Transactions, 61 (11) 1-12 (2014)
1) unless CC License in place (see abstract). ecsdl.org/site/terms_use address. Redistribution subject to ECS terms of use (see 207.23.222.103Downloaded on 2014-12-04 to IP
have focused on the experimental and analytical investigation of the mechanical (10–15) as well as thermal (2,16–19) and electrical (11) behaviour of the GDL and its interfacial interaction (1,2,17,20–23) under compressive loading.
Figure 1. SEM image of the fibrous microstructure of a PEMFC gas diffusion layer, GDL: SIGRACET SGL 24 BA.
The majority of the existing studies on the GDL’s mechanical deformation were
focused on numerical simulation of the inhomogeneous compression of the GDL under the bipolar plates’ ribs using finite element method (FEM) (1, 6,8, 24–26). In all of these studies, commercial FEM software was utilized for mechanical modeling. The GDL mechanical behaviour model is the most important part of such simulations. According to the GDL through-plane compression tests results, GDL stress-strain diagram can be divided into two regions: linear and nonlinear mechanical behaviour regions. In the compressive loads smaller than a critical pressure, GDL has a nonlinear mechanical behaviour and its compressive modulus is a function of deformation level. After reaching the critical pressure, the compressive strain increases linearly with the applied stress. Nitta (27) determined compressive stress of 1 MPa to be the critical stress for SGL 10 BA GDL and related the linear deformation region between pressures 1 to 3.5 MPa to the crushing of the hydrophobic pores in the GDL.
To develop a more realistic FEM model of the GDL in the fuel cell, Garcia-Salaberri
et al. (1) created an empirical nonlinear stress-strain relationship by curve fitting widespread data sets available in the literature. Although such empirical relationships can resolve the FEM models requirements for definition of the GDL material behaviour, they do not explain the dependency of the mechanical behaviour on the microstructure of the material. Developing a reliable mechanical model that can accurately predict the behaviour of the GDL under compressive loads by considering its salient porous microstructure properties will create an accurate stress-strain relationship for the GDL deformation during compression and increase the accuracy of FEM simulations. Moreover, the mechanical model will be useful to model the GDL bulk and interfacial transport phenomenon in the MEA. To develop a mechanistic model that predict the linear and nonlinear behaviour of the GDL under compression loading, the deformation
ECS Transactions, 61 (11) 1-12 (2014)
2) unless CC License in place (see abstract). ecsdl.org/site/terms_use address. Redistribution subject to ECS terms of use (see 207.23.222.103Downloaded on 2014-12-04 to IP
mechanism of the GDL porous media should be investigated first. This paper focuses on the modeling of the GDL mechanical behaviour in the pressure higher than 1MPa which is the pressure range of the linear behaviour and the stress range below this value (nonlinear region) will be addressed in the next part.
This paper presents a mechanistic analytical model that predicts the compressive
linear mechanical behaviour of carbon paper GDLs from their microstructural parameters such as fiber diameter and elastic modulus, pore size distribution and porosity. A unit cell approach is used in which the random and complex microstructure of real materials is modelled by a simplified geometry that is assumed to be repeated throughout the media. The unit cell approach has been successfully used by our group for modeling GDL’s thermal conductivity, thermal contact resistance, and permeability (2,18,28,29). The unit cell carbon fiber bending is considered as the main deformation mechanism. GDL deformation is calculated from summation of all unit cells’ deformations. To determine the effective unit cell length, the distance between adjacent fiber intersections and pore area are measured optically at random locations on several off-the-shelf sample GDLs. The effective unit cell length is determined using a statistical analysis by calculating parameters such as the mean, standard deviation and coefficient of variation of each GDL sample.
Analytical model development
Paper-based carbon fiber GDLs have a layered structure in which each layer consists
of randomly distributed carbon fibers. An appropriate geometrical model is needed to represent the random and complex structure of the GDL as simply as possible. Figure 2 shows the proposed unit cell for the GDL modeling. This simple geometric model includes all the GDL microstructural characteristics needed to capture the mechanical behaviour under compression. As shown in Figure 2, each fiber acts as a bending beam. In this geometrical model, for the fibers of each layer, the fibers in the adjacent blew layer act as mechanical supports and the fibers in the adjacent above layer apply concentrated forces. Each fiber in a unit cell can be divided into small parts with two supports at the ends and one concentrated load between them, see the dashed line in Figure 2c. According to the interaction between neighboring unit cells, the boundary condition shown in Figure 2d can be considered with good approximation. Deflection of the unit cell beam,δ , under a specified load, F, can be determined by well-known beam bending theory (30) as:
( )3
6 5 4 34
643 3
3
Fln n n n
Edδ
π= − + − + [1]
where, l, E and d are the unit cell length, carbon fibers elastic modulus in longitudinal direction and fiber diameter, respectively and n is the fraction that shows the location of the bending load on the beam, as shown in Figure 3. n is a random parameter with its value between zero and one. Therefore, the average value of 6 5 4 3( ) 3 3f n n n n n= − + − + in the domain of 0 1n≤ ≤ can be calculated by integration of f. Substituting the average value of f in Eq. [1] gives:
ECS Transactions, 61 (11) 1-12 (2014)
3) unless CC License in place (see abstract). ecsdl.org/site/terms_use address. Redistribution subject to ECS terms of use (see 207.23.222.103Downloaded on 2014-12-04 to IP

3
4
16
105
Fl
Edδ
π= [2]
A A
d
A-A
l
M M
unitcell
FF
N=
b) a)
c) d)
Figure 2. Schematics of the proposed geometrical model for the GDL a) isometric view, b) top view, c) cross view section and d) unit cell beam and boundary condition.
A mechanical model is needed to relate the GDL total behaviour to the unit cell
deflection. Figure 3 presents a schematic of the GDL layered structure under compressive loads in which the layers act as stacked disc springs each of which has an effective stiffness of kl. Assuming equal stiffness for all layers of the GDL, the total through thickness deformation of GDL can be written as:
1
M
GDL ll
MF
kδ δ= =∑ [3]
where, lδ and M are the layer deformation and number of the GDL layers, respectively.
The number of layers can be obtained from the GDL thickness and fibers diameter, by:
tM
d= [4]
Each layer is composed of unit cell beams that act as parallel springs under
compressive load, as shown in Figure 3. Therefore, the stiffness of a GDL layer is equal to summation of the unit cells stiffness. Using Eq. [2] to calculate the stiffness of the unit cell, the effective stiffness of a GDL layer is calculated as:
ECS Transactions, 61 (11) 1-12 (2014)
4) unless CC License in place (see abstract). ecsdl.org/site/terms_use address. Redistribution subject to ECS terms of use (see 207.23.222.103Downloaded on 2014-12-04 to IP

4
31 1
105
16
N Ni
l ii
dEk k
l
π= =∑ ∑ [5]
where, N and li are the number and length of the unit cell beams in each layer, respectively. N is estimated by calculating the number of pores in one layer.
F
F
k1 k2 k3 k4
kN
* FF
N=
l
(1-n)l nl
A B
C
L1
L2
L3
.
.
.
.
.
.
LM
F
F
Figure 3. GDL mechanical deformation model schematic.
0
0.001
0.002
0.003
0.004
0.005
0.006
0.007
0.008
0.009
0.01
10 30 50 70 90 110
130
150
170
190
210
230
250
270
290
310
330
350
370
Por
abab
ility
den
sity
l [µm]
SIGRACET SGL 25AASEGRACET SGL 24AA
APore
li l
i
b) a)
Fig. 4. a) Microscopic image of TGP-H-60 GDL with 78% porosity, measurement of the unit cell length and pore area between fibers and b) probability density of the measured data versus unit cell length for SGL 25AA and SGL 24AA samples.
Microscopic images show that both d and li have random distributions and vary throughout GDL layers. In this paper, a comprehensive study is performed to estimate the appropriate number of measurements to statistically determine the effective unit cells length using an optical microscope, as shown in sample pictures presented in Figure 4a. Figure 4b shows the probability density of the measured data versus unit cell length for two commercially available GDL samples SGL 25AA and SGL 24AA. A random distribution is found for the effective unit cell length for a GDL material.
ECS Transactions, 61 (11) 1-12 (2014)
5) unless CC License in place (see abstract). ecsdl.org/site/terms_use address. Redistribution subject to ECS terms of use (see 207.23.222.103Downloaded on 2014-12-04 to IP
The correlation between statistical parameters of independent random variables with their simple algebraic products can be found in the literature (31), therefore, the summation appeared in Eq. [5] can be calculated by unit cell length distribution statistical parameters such as mean value and coefficient of variation as:
( ) ( )4
3
4 42 2
3 31
1 6 1 6N
i dl dd
i ll
dN N C C
l
µµ
µ= = + +∑ [6]
where,µ and C are the random variable mean and coefficient of variation, l and d are indices for the unit cell length and fiber diameter, respectively. Appendix A explains procedure of developing Eq. [6].
According to the GDL geometrical model presented in Figure 2, each pore composed of four unit cell beams that belong to two neighboring layer. Therefore, each pore has two unit cells from the same layer and shares them with the neighbour pores. Then, the number of unit cells in one layer can be estimated by the total number of pores in the sample area. Considering the fact that the summation of all pore areas and the area occupied by fibers should be equal to the sample area, the number of unit cells in one layer can be calculated as:
Apore
sAN
εµ
= [7]
where, As, ε and
Aporeµ are the sample area, porosity, and pore area mean value,
respectively. Substituting Eqs. [4], [5], [6] and [7] into Eq. [3] gives:
( )( )
3
5 2 2
16
105 1 6 1 6
Aporel
GDL
d s l d
tF
E A C C
µ µδ
π µ ε=
+ + [8]
After non-dimensionalization of Eq. [8], a new compact relationship between the
compressive strain, e, and stress, σ, is obtained as follows:
516
105 eff
le
E d
σπ
=
[9]
where
( )( )
13 5
5 2 21 6 1 6
Aporel
eff d l d
l
d C C
µ µ
εµ
= + + [10]
In the next section, the developed analytical results are compared with experimental data.
ECS Transactions, 61 (11) 1-12 (2014)
6) unless CC License in place (see abstract). ecsdl.org/site/terms_use address. Redistribution subject to ECS terms of use (see 207.23.222.103Downloaded on 2014-12-04 to IP

Results and discussion
Statistical measurements
Figure 4a shows an optical image taken from a GDL sample TGP-H-60 GDL; the unit cell lengths and pore area are marked. The microstructure parameters of the GDL varies from type to type, thus, optical microscopic measurements and the statistical analysis should be performed for each new material. A sensitivity analysis is performed to determine a sufficient number of measurements for each sample. We systematically increased the number of optical measurements by increments of 150 and calculated the variation of the mean and standard deviation. Figures 5a shows the unit cell length mean versus the number of optical measurements for SGL 24AA and 25AA, and Toray TGP-H-120 GDL samples. As seen in Figures 5a, the value of the statistical parameter becomes independent from the statistical population size beyond approximately 600 random optical measurements. The standard deviation of the measured unit cell length shows the same trend during increasing the population size, as seen in Figure 5b. All the measured statistical and previously reported properties as well other geometrical characteristics of the SIGRACET SGL 24AA, 25AA, and 10 BA and Toray TGP-H-060 and TGP-H-120 GDLs needed in the present model, Eqs. [9] and [10], are listed in Table I.
70
80
90
100
110
120
130
140
150
0 200 400 600 800
Uni
t cel
l len
gth
mea
n [µ
m]
Number of measurements
SIGRACET SGL 24AASIGRACET SGL 25AATORAY TGP-H-120
25
30
35
40
45
50
55
60
65
0 200 400 600 800
stan
dard
dev
iatio
n [µ
m]
Number of measurements
SIGRACET SGL 24AASIGRACET SGL 25AATORAY TGP-H-120
b) a)
Figure 5. Measured a) mean and b) standard deviation value for unit cell length versus number of optical measurements for SGL 24 AA, SGL 25 AA and TORAY TGP-H-120 GDLs. TABLE I. The mechanical properties and geometrical characteristics of the SIGRACET and TORAY GDL samples used in this study.
GDL type ε (%) lµ (µm) lC poreAµ (µm2)
dµ (µm) dC E (GPa) (32) C
SGL 24AA 88 (18) 130 0.414 9091 6.95 0.0812 225 -1.07 SGL 25AA 92 (18) 135.8 0.433 11284 6.95 0.0812 225 -1.12 SGL 10BA 88 (27) 118.5 0.376 8949 6.95 0.0812 225 -1.02 TGP-H-060 78 (18) 97.24 0.387 6870 6.13 0.106 225 -1.35 TGP-H-120 78 (18) 83.95 0.413 6357 6.13 0.106 225 -1.30
ECS Transactions, 61 (11) 1-12 (2014)
7) unless CC License in place (see abstract). ecsdl.org/site/terms_use address. Redistribution subject to ECS terms of use (see 207.23.222.103Downloaded on 2014-12-04 to IP
Model validation
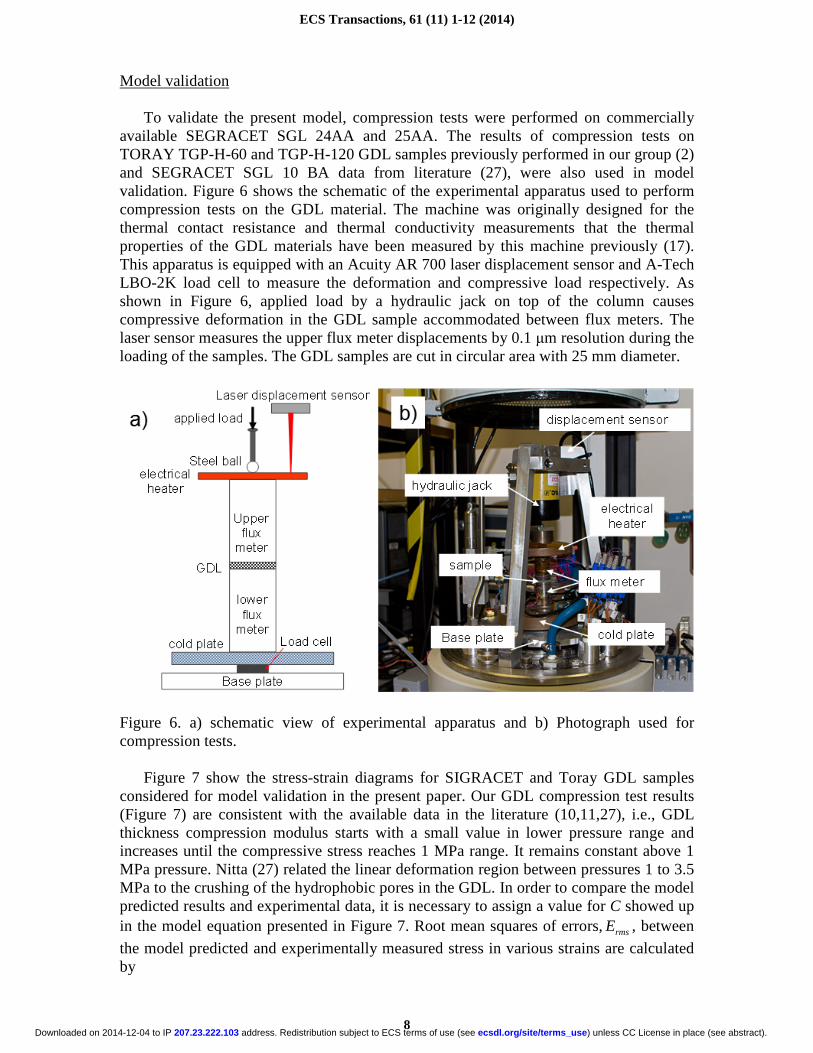
To validate the present model, compression tests were performed on commercially available SEGRACET SGL 24AA and 25AA. The results of compression tests on TORAY TGP-H-60 and TGP-H-120 GDL samples previously performed in our group (2) and SEGRACET SGL 10 BA data from literature (27), were also used in model validation. Figure 6 shows the schematic of the experimental apparatus used to perform compression tests on the GDL material. The machine was originally designed for the thermal contact resistance and thermal conductivity measurements that the thermal properties of the GDL materials have been measured by this machine previously (17). This apparatus is equipped with an Acuity AR 700 laser displacement sensor and A-Tech LBO-2K load cell to measure the deformation and compressive load respectively. As shown in Figure 6, applied load by a hydraulic jack on top of the column causes compressive deformation in the GDL sample accommodated between flux meters. The laser sensor measures the upper flux meter displacements by 0.1 µm resolution during the loading of the samples. The GDL samples are cut in circular area with 25 mm diameter.
Figure 6. a) schematic view of experimental apparatus and b) Photograph used for compression tests.
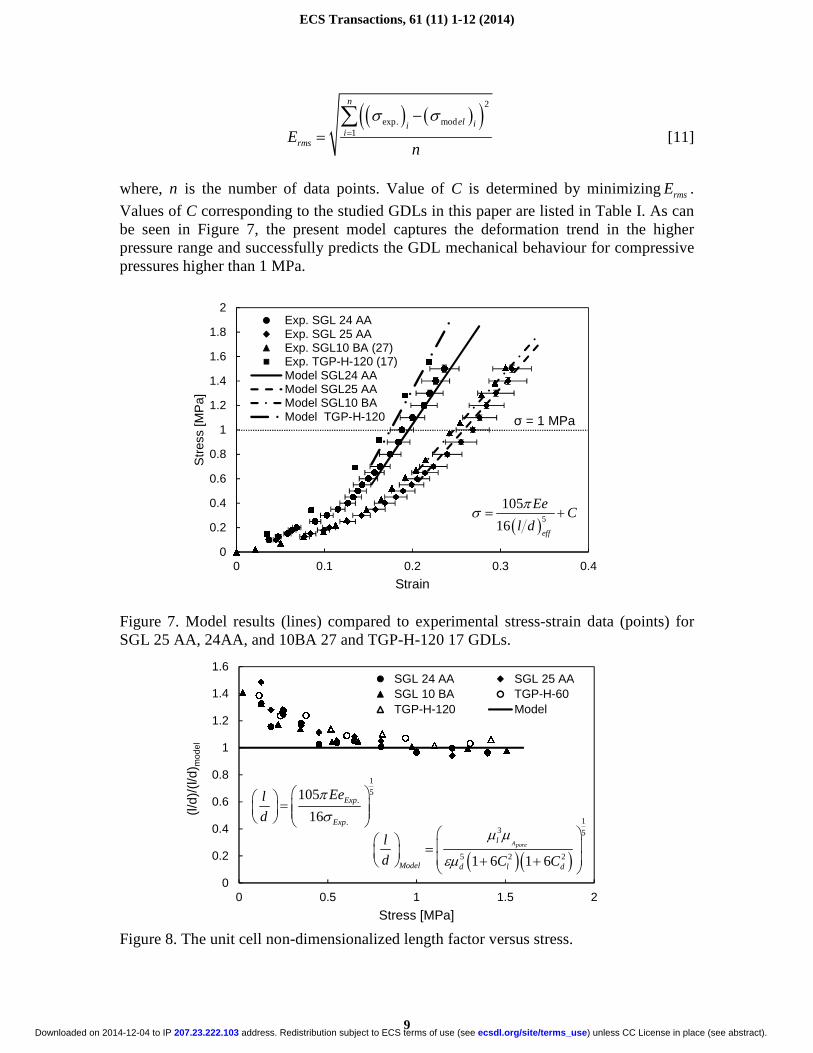
Figure 7 show the stress-strain diagrams for SIGRACET and Toray GDL samples considered for model validation in the present paper. Our GDL compression test results (Figure 7) are consistent with the available data in the literature (10,11,27), i.e., GDL thickness compression modulus starts with a small value in lower pressure range and increases until the compressive stress reaches 1 MPa range. It remains constant above 1 MPa pressure. Nitta (27) related the linear deformation region between pressures 1 to 3.5 MPa to the crushing of the hydrophobic pores in the GDL. In order to compare the model predicted results and experimental data, it is necessary to assign a value for C showed up in the model equation presented in Figure 7. Root mean squares of errors,rmsE , between
the model predicted and experimentally measured stress in various strains are calculated by
ECS Transactions, 61 (11) 1-12 (2014)
8) unless CC License in place (see abstract). ecsdl.org/site/terms_use address. Redistribution subject to ECS terms of use (see 207.23.222.103Downloaded on 2014-12-04 to IP
( ) ( )( )2
exp. mod1
n
el iii
rmsEn
σ σ=
−=∑
[11]
where, n is the number of data points. Value of C is determined by minimizingrmsE .
Values of C corresponding to the studied GDLs in this paper are listed in Table I. As can be seen in Figure 7, the present model captures the deformation trend in the higher pressure range and successfully predicts the GDL mechanical behaviour for compressive pressures higher than 1 MPa.
0
0.2
0.4
0.6
0.8
1
1.2
1.4
1.6
1.8
2
0 0.1 0.2 0.3 0.4
Str
ess
[MP
a]
Strain
Exp. SGL 24 AAExp. SGL 25 AAExp. SGL10 BA (27)Exp. TGP-H-120 (17)Model SGL24 AAModel SGL25 AAModel SGL10 BAModel TGP-H-120 σ = 1 MPa
( )5105
16eff
EeC
l d
πσ = +
Figure 7. Model results (lines) compared to experimental stress-strain data (points) for SGL 25 AA, 24AA, and 10BA 27 and TGP-H-120 17 GDLs.
0
0.2
0.4
0.6
0.8
1
1.2
1.4
1.6
0 0.5 1 1.5 2
(l/d)
/(l/d
) mod
el
Stress [MPa]
SGL 24 AA SGL 25 AASGL 10 BA TGP-H-60TGP-H-120 Model
15
.
.
105
16Exp
Exp
Eel
d
π
σ
=
( )( )
13 5
5 2 21 6 1 6
Aporel
Model d l d
l
d C C
µ µ
εµ
= + +
Figure 8. The unit cell non-dimensionalized length factor versus stress.
ECS Transactions, 61 (11) 1-12 (2014)
9) unless CC License in place (see abstract). ecsdl.org/site/terms_use address. Redistribution subject to ECS terms of use (see 207.23.222.103Downloaded on 2014-12-04 to IP

The effective non-dimensionalized unit cell length (l/d) calculated by substituting the GDL optically measured microstructural parameters in Eq. [10] and the experimental stress-strain data in Eq. [9] are compared in Figure 8. The effective non-dimensionalized unit cell length (l/d) converges to the experimental data in the compressive pressures higher than 1 MPa, as seen in Figure 8. One potential reason for this non-linear behaviour in low compressive stress could be the existence of ‘gaps’ and binder material between the fibers in the GDL microstructure. In fact, in the low pressure the gaps between layers fibers cause the unit cell beam length to take larger values than optically measured data. Gaps between carbon fibers and their effects on the GDL deformation are discussed in detail in the second part of this study.
Uncertainty analysis
From definition of the engineering stress, F Aσ = , uncertainties in the force measurement and sample area can cause uncertainty in the stress. The uncertainty of the stress, included in the plots, is calculated as follows (33):
2 2
( ) ( )( )
E F E AE
F Aσ = +
[12]
where, ( )E ⋅ indicates the uncertainty associated with the involved parameters, F and A are the measured force and the sample area, respectively. According to the technical specifications of the load cell and the amplifier provided by associated manufacturers, the uncertainty in the measured force was less than 1%. A circular cutter is used to cut the samples from the GDL sheets. The diameter of the cutter is about 1/16 of inch larger than the flux meters diameter. Therefore, the area of the flux meters is determinant. The dimensions of the flux meters can change due to temperature variation during the experiments. Since, the temperature variations was not considerable, the area uncertainty is negligible.
For the strain, 1 t tε ′= − , uncertainty sources are the deformed GDL thickness, t′ , measurement and the GDL initial thickness, t . The GDL thickness during deformation was measured using a laser displacement sensor that has resolution of 0.005% of the measurement span based on the manufacturer technical data. Therefore, the strain uncertainty arises from displacement sensor is negligible. Another source is the GDL initial thickness variation which is determined about ±7.89 % according to the GDL’s data sheet provided by manufacturer. The uncertainty of the strain, included in the plots as well, is calculated as follows (33):
2 2
( ) ( )( )
E t E tE
t tε
′ = + ′ (14)
where, t′ and t are the GDL compressed and initial thicknesses, respectively. Then, 7.89% uncertainty is calculated for the strain.
ECS Transactions, 61 (11) 1-12 (2014)
10) unless CC License in place (see abstract). ecsdl.org/site/terms_use address. Redistribution subject to ECS terms of use (see 207.23.222.103Downloaded on 2014-12-04 to IP

Conclusion In this paper, a novel analytical model was developed to predict the linear mechanical
behaviour of carbon fiber based GDLs under through plane compression. To model the geometry of the GDL microstructure a unit cell approach was used. Bending of carbon fibers was considered as the main mechanism responsible for the deformation of the GDL. The present model takes into account GDL microstructural characteristics and properties such as carbon fibers diameter, elastic modulus, pore size distribution, and porosity. A comprehensive optical measurement study was performed to statistically determine effective geometric parameters needed in the proposed unit cell model. Compressive strain-stress diagrams for a number of commercially available SGL GDL samples were determined performing compression tests. Comparison between the model results with the experimental stress-strain data showed that the model can accurately predict the linear mechanical behaviour of the GDL, where the compressive pressures are higher than 1 MPa. Therefore, the model can be used for GDL deformation simulations as well as investigation of the GDL structural parameters (e.g. fibers diameter, pore size and porosity) effects on the mechanical behaviour strength. It can also provide guidelines and engineering insight for manufacturing more efficient gas diffusion layers.
Appendix A
According to the relations given by Mischke (31) for mean and standard deviation of
simple algebraic operations on the independent random variables, following equations can be written:
xy x yµ µ µ= (A.1)
( )4
4 21 6x xxCµ µ= + (A.2)
( )3
21 3
11 6 x
xx
Cµµ
= + (A.3)
where, C is the coefficient of variation and can be calculated as
ˆ xx
x
Cσµ
= (A.4)
where, µ and σ̂ are the mean and standard deviation, respectively. Considering Eqs.
(A.1) to (A.3), 4
3
d
l
µ can be written as
( ) ( )4 4
33
4 2 21 3
11 6 1 6d d ld d
lll
C Cµ µ µ µµ
= = + + (A.5)
References
ECS Transactions, 61 (11) 1-12 (2014)
11) unless CC License in place (see abstract). ecsdl.org/site/terms_use address. Redistribution subject to ECS terms of use (see 207.23.222.103Downloaded on 2014-12-04 to IP
1. P. A. García-Salaberri, M. Vera, and R. Zaera, Int. J. Hydrogen Energy, 36, 11856–11870 (2011). 2. E. Sadeghi, N. Djilali, and M. Bahrami, J. Power Sources, 195, 8104–8109 (2010). 3. A. Kusoglu, M. H. Santare, A. M. Karlsson, S. Cleghorn, and W. B. Johnson, J. Electrochem. Soc., 157, B705 (2010). 4. A. Kusoglu, A. M. Karlsson, M. H. Santare, S. Cleghorn, and W. B. Johnson, J. Power Sources, 161, 987–996 (2006). 5. R. Solasi, Y. Zou, X. Huang, K. Reifsnider, and D. Condit, J. Power Sources, 167, 366–377 (2007). 6. Z. Lu, C. Kim, A. M. Karlsson, J. C. Cross, and M. H. Santare, J. Power Sources, 196, 4646–4654 (2011). 7. M. N. Silberstein and M. C. Boyce, J. Power Sources, 196, 3452–3460 (2011). 8. Y. Zhou, G. Lin, a. J. Shih, and S. J. Hu, J. Power Sources, 192, 544–551 (2009). 9. A. Kusoglu, A. M. Karlsson, M. H. Santare, S. Cleghorn, and W. B. Johnson, J. Power Sources, 170, 345–358 (2007). 10. S. Escribano, J.-F. Blachot, J. Ethève, A. Morin, and R. Mosdale, J. Power Sources, 156, 8–13 (2006). 11. J. Kleemann, F. Finsterwalder, and W. Tillmetz, J. Power Sources, 190, 92–102 (2009). 12. K. K. Poornesh, C. D. Cho, G. B. Lee, and Y. S. Tak, J. Power Sources, 195, 2718–2730 (2010). 13. V. Radhakrishnan and P. Haridoss, Mater. Des., 32, 861–868 (2011). 14. M. F. Serincan and U. Pasaogullari, J. Power Sources, 196, 1314–1320 (2011). 15. I. Nitta, T. Hottinen, O. Himanen, and M. Mikkola, J. Power Sources, 171, 26–36 (2007). 16. E. Sadeghi, M. Bahrami, and N. Djilali, J. Power Sources, 179, 200–208 (2008). 17. E. Sadeghi, N. Djilali, and M. Bahrami, J. Power Sources, 196, 246–254 (2011). 18. H. Sadeghifar, M. Bahrami, and N. Djilali, J. Power Sources, 233, 369–379 (2013). 19. I. Nitta, O. Himanen, and M. Mikkola, Fuel Cells, 8, 111–119 (2008). 20. Z. Wu, S. Wang, L. Zhang, and S. J. Hu, J. Power Sources, 189, 1066–1073 (2009). 21. Z. Wu, Y. Zhou, G. Lin, S. Wang, and S. J. Hu, J. Power Sources, 182, 265–269 (2008). 22. Y. Zhou, G. Lin, a. J. Shih, and S. J. Hu, J. Power Sources, 163, 777–783 (2007). 23. I. Nitta, O. Himanen, and M. Mikkola, Electrochem. commun., 10, 47–51 (2008). 24. P. Zhou, C. W. Wu, and G. J. Ma, J. Power Sources, 159, 1115–1122 (2006). 25. P. Zhou, C. W. Wu, and G. J. Ma, J. Power Sources, 163, 874–881 (2007). 26. P. Zhou and C. W. Wu, J. Power Sources, 170, 93–100 (2007). 27. I. Nitta, thesis, Helsinki University of Technology (2008). 28. A. Tamayol, F. McGregor, and M. Bahrami, J. Power Sources, 204, 94–99 (2012). 29. A. Tamayol, K. W. Wong, and M. Bahrami, Phys. Rev. E, 85, 026318 (2012). 30. J. Shigley, C. Mischke, and R. Budynas, Mechanical Engineering Design, Eighth Edi., McGraw−Hill, (2006). 31. C. R. Mischke, Mathematical Model Building, Iowa State University Press, (1980). 32. M. Mathias, J. Roth, J. Fleming, and W. Lehnert, in Handbook of fuel cells, vol. 3, John Wiley & Sons (2003). 33. J. R. Taylor, An introduction to error analysis: The study of uncertainties in physical measurements, second., Univercity Science Books, Sansalito, (1997).
ECS Transactions, 61 (11) 1-12 (2014)
12) unless CC License in place (see abstract). ecsdl.org/site/terms_use address. Redistribution subject to ECS terms of use (see 207.23.222.103Downloaded on 2014-12-04 to IP
Related Documents