Human Journals Research Article June 2021 Vol.:21, Issue:3 © All rights are reserved by Pramod kumar et al. Analytical Method Development and Validation for Particle Size Distribution of Antiinflammatory Corticosteroid (Loteprednol Etabonate) in Combination Dosage Form www.ijppr.humanjournals.com Keywords: Particle Size Distribution, Loteprednol Etabonate ABSTRACT A rapid and robust Particle Size Distribution method was developed and validated for determination of particle size of Loteprednol etabonate in combination of anti- inflammatory corticosteroid and anti-infective combination ophthalmic suspensions by using Malvern Mastersizer 3000. Particle size is a critical quality parameter for pharmaceutical products in which the drug product a solid dosage form or liquid containing undissolved drug substance. In solid or suspension drug products, particle size can have a significant effect on dissolution rates, bioavailability, and/or stability. In such instances, testing for particle size distribution should be carried out using an appropriate procedure, and acceptance criteria should be provided. The present combination ophthalmic suspension having one solubilised drug, and another is suspended form. The undisclosed drug particle would play critical in bioavailability studies. The aim of this paper was to develop a new method to characterize the undissolved drug particle size distribution (PSD), by using Malvern Master Sizer 3000. Water was selected as bring the appropriate dispersant to measure PSD of undisclosed drug particle (Loteprednol Etabonate). Also, the influences of refractive index, Absorption Index, Stirrer speed and measurement time of the particle size distribution were systematically studied. The instrument condition was as follows that are, Particle Refractive Index:1.53, Absorption Index: 0.005, Measurement Duration: 10 Sec, and Stirrer speed 2000 rpm. The optimized Particle Size Distribution method is accurate, simple, repeatable and suitable for determination of the particle size analysis of Loteprednol Etabonate in combination of anti-inflammatory corticosteroid and anti- infective combination ophthalmic dosage form. Pramod kumar* 1 , Rohit Saraswat 2 , Girish Nihalani 3 1 Research scholar OPJS University, Churu, Rajasthan, India 2 Research Guide OPJS University, Churu, Rajasthan, India 3 Teva Pharmaceuticals USA Inc., FL, USA. Submitted: 20 May 2021 Accepted: 26 May 2021 Published: 30 June 2021

Welcome message from author
This document is posted to help you gain knowledge. Please leave a comment to let me know what you think about it! Share it to your friends and learn new things together.
Transcript
Human Journals
Research Article
June 2021 Vol.:21, Issue:3
© All rights are reserved by Pramod kumar et al.
Analytical Method Development and Validation for Particle Size
Distribution of Antiinflammatory Corticosteroid (Loteprednol
Etabonate) in Combination Dosage Form
www.ijppr.humanjournals.com
Keywords: Particle Size Distribution, Loteprednol
Etabonate
ABSTRACT
A rapid and robust Particle Size Distribution method was developed and validated for determination of particle size of Loteprednol etabonate in combination of anti-inflammatory corticosteroid and anti-infective combination ophthalmic suspensions by using Malvern Mastersizer 3000. Particle size is a critical quality parameter for pharmaceutical products in which the drug product a solid dosage form or liquid containing undissolved drug substance. In solid or suspension drug products, particle size can have a significant effect on dissolution rates, bioavailability, and/or stability. In such instances, testing for particle size distribution should be carried out using an appropriate procedure, and acceptance criteria should be provided. The present combination ophthalmic suspension having one solubilised drug, and another is suspended form. The undisclosed drug particle would play critical in bioavailability studies. The aim of this paper was to develop a new method to characterize the undissolved drug particle size distribution (PSD), by using Malvern Master Sizer 3000. Water was selected as bring the appropriate dispersant to measure PSD of undisclosed drug particle (Loteprednol Etabonate). Also, the influences of refractive index, Absorption Index, Stirrer speed and measurement time of the particle size distribution were systematically studied. The instrument condition was as follows that are, Particle Refractive Index:1.53, Absorption Index: 0.005, Measurement Duration: 10 Sec, and Stirrer speed 2000 rpm. The optimized Particle Size Distribution method is accurate, simple, repeatable and suitable for determination of the particle size analysis of Loteprednol Etabonate in combination of anti-inflammatory corticosteroid and anti-infective combination ophthalmic dosage form.
Pramod kumar*1, Rohit Saraswat2, Girish
Nihalani3
1Research scholar OPJS University, Churu, Rajasthan,
India
2Research Guide OPJS University, Churu, Rajasthan,
India
3Teva Pharmaceuticals USA Inc., FL, USA.
Submitted: 20 May 2021
Accepted: 26 May 2021
Published: 30 June 2021
www.ijppr.humanjournals.com
Citation: Pramod kumar et al. Ijppr.Human, 2021; Vol. 21 (3): 115-129. 116
INTRODUCTION:
Particle size and size characterization knowledge act as a prerequisite for all the processes
which are involved in the production of a formulation. They influence mechanical strength,
electrical and thermal properties of the finished product. Within the pharmaceutical industry,
the particle size distribution (PSD) of an active pharmaceutical ingredient (API) may have a
significant impact on both the manufacturability (flowability, packing properties, mixing,
etc.) and quality attributes of the drug product (dissolution rate, bioavailability, content
uniformity, etc.)[1]. Massive production losses can occur if particle sizes of the materials
being used in the process are not appropriately monitored [1]. Particle size characterization is
about describing particle sizes in a formulation that helps in understanding, predicting and
optimizing pharmacokinetic properties of that formulation. Accurate determination of particle
size is necessary for pharmaceutical industry. It is a physical parameter that must be
specified, examined and managed right from the starting material to the finished product. For
some new drug substances intended for use in solid or suspension drug products, particle size
can have a significant effect on dissolution rates, bioavailability, and/or stability. In such
instances, testing for particle size distribution should be carried out using an appropriate
procedure, and acceptance criteria should be provided [1]. Despite the modern
instrumentation, there are some challenges faced in the field of particle size characterization.
An appropriate method development specific to drug type, form, and delivery shall be
required. Problems shall be occurring during the analytical method development time and at
measurements like agglomeration or de-stabilization. For effective particle size
characterization, it is important to understand the suitable instrumentation first. It is advised
to use most robust and sensitive technique to obtain accurate results. The main objectives of
the present study are to understand the particle size characterization techniques by using
commercially used common techniques.
Loteprednol etabonate is an etabonate ester, chloromethyl (8S,9S,10R,11S,13S,14S,17R)-17-
ethoxycarbonyloxy-11-hydroxy-10,13-dimethyl-3-oxo-7,8,9,11,12,14,15,16octahydro-6H-
cyclopenta[a]phenanthrene-17-carboxylat. It has a role as an anti-inflammatory drug. It
derives from a loteprednol. Loteprednol Etabonate is the etabonate salt form of loteprednol,
an ophthalmic analog of the corticosteroid prednisolone with anti-inflammatory activity.
Loteprednol etabonate exerts its effect by interacting with specific intracellular receptors and
subsequently binds to DNA to modify gene expression. This results in an induction of the
synthesis of certain anti-inflammatory proteins while inhibiting the synthesis of certain
www.ijppr.humanjournals.com
Citation: Pramod kumar et al. Ijppr.Human, 2021; Vol. 21 (3): 115-129. 117
inflammatory mediators. Loteprednol etabonate specifically induces phospholipase A2
inhibitory proteins (collectively called lipocortin’s), which inhibit the release of arachidonic
acid, thereby inhibiting the biosynthesis of potent mediators of inflammation, such as
prostaglandins and leukotrienes. [2].
This compound was designed based on prednisolone and to reduce side effects, carboxylic
ester functionality was introduced at 17b-position, in the expectation that hydrolysis by non-
specific esterases would transform it into the indicative steroid carboxylic acid metabolite.
Loteprednol etabonate is used in the topical management of inflammatory and allergic
disorders of the eye. It is usually employed as eye drops containing 0.2 or 0.5%. Coffey and
co-workers describe a novel ophthalmic gel formulation of loteprednol etabonate in the
treatment of ocular inflammatory conditions. Prolonged application to the eye of preparations
containing corticosteroids has caused raised intra-ocular pressure and reduced visual
function. A literature survey revealed that there no such methods were available for
determination of particle size distribution of Loteprednol Etabonate bulk drug as well
ophthalmic dosage form [3].
This paper describes a simple, precise, accurate and robust, specific to particle size
distribution of Loteprednol etabonate in combination eye drops. The proposed PSD method
utilizes economically available common instrument and solvent system. The method was
validated as per International Conference on Harmonization (ICH) [4] suggestions.
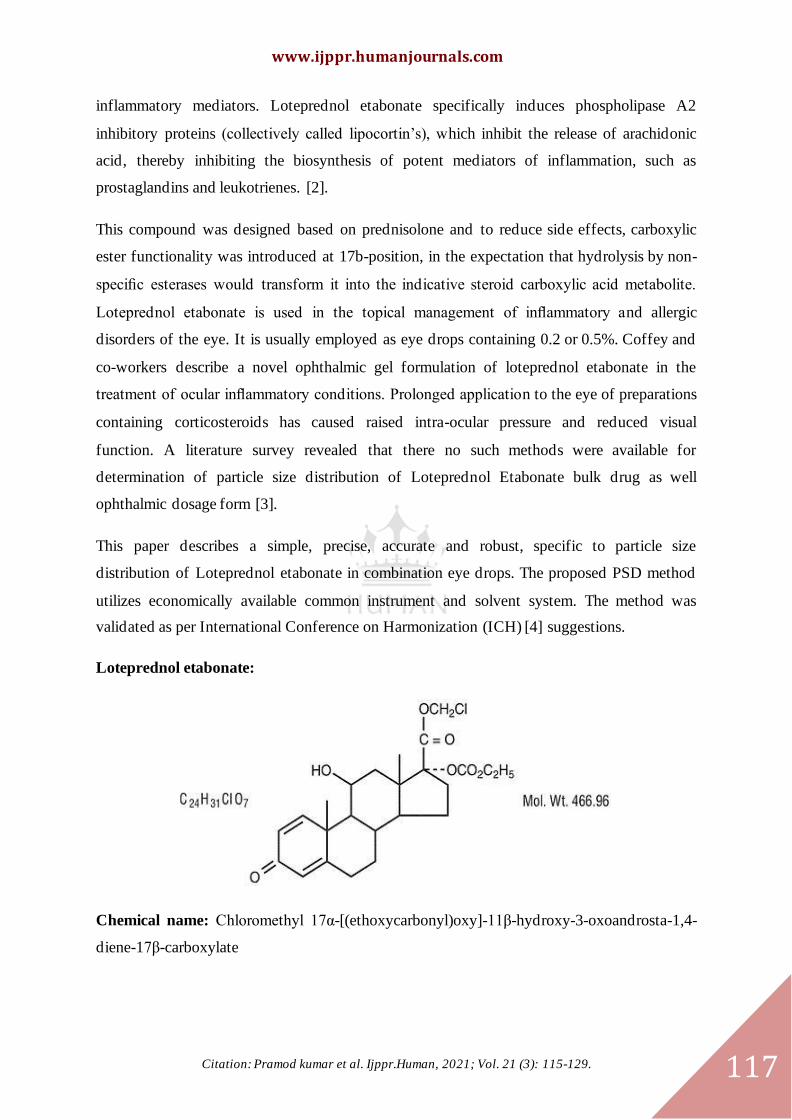
Loteprednol etabonate:
Chemical name: Chloromethyl 17α-[(ethoxycarbonyl)oxy]-11β-hydroxy-3-oxoandrosta-1,4-
diene-17β-carboxylate
www.ijppr.humanjournals.com
Citation: Pramod kumar et al. Ijppr.Human, 2021; Vol. 21 (3): 115-129. 118
INSTRUMENTATION AND PRINCIPLE:
For a successful Particle Size Distribution method development, the understanding of the
basic principles of laser diffraction is essential. Laser diffraction is an ensemble particle-
sizing technique, which means it provides a result for the whole sample, rather than building
up distributions from data for individual particles. Particles illuminated in a collimated laser-
beam scatter light over a range of angles. Large particles generate a high scattering intensity
at relatively narrow angles to the incident beam, while smaller particles produce a lower
intensity signal but at much wider angles. Using an array of detectors, laser-diffraction
analyzers record the pattern of scattered light produced by the sample. The Mastersizer range
of laser diffraction particle size analyzers set the standard for delivering rapid, accurate
particle size distributions for both wet and dry dispersions. From assessing product
uniformity and solubility, through to optimizing packing density to improve final product
performance and controlling powder flowability to increase manufacturing efficiency,
particle size analysis is critical to understanding and controlling a wide range of properties. In
a laser diffraction measurement, a laser beam passes through a dispersed particulate sample
and the angular variation in intensity of the scattered light is measured. Large particles scatter
light at small angles relative to the laser beam and small particles scatter light at large angles.
The angular scattering intensity data is then analyzed to calculate the size of the particles that
created the scattering pattern using the Mie theory of light scattering. The particle size is
reported as a volume equivalent sphere diameter.
MASTERSIZER 3000:
The Mastersizer 3000 is the latest generation of the world’s most widespread particle sizing
instrument, used by many thousands of companies and research institutes across a wide range
of industries. Malvern’s considerable experience and applications know-how has gone into
every stage of the design of the Mastersizer 3000 instrument, from fundamental particle
sizing performance right through to user ergonomics and method advice. A completely new
optical core design delivers fast measurement times for high sample throughput and a
measurement size range from 10 nm to 3.5 mm. Combined with a range of wet and dry
dispersion accessories this opens up more applications than ever before. The Mastersizer
3000 uses the technique of laser diffraction to measure particle size distributions from 10 nm
up to 3.5 mm [5].

www.ijppr.humanjournals.com
Citation: Pramod kumar et al. Ijppr.Human, 2021; Vol. 21 (3): 115-129. 119
LASER DIFFRACTION:
In a laser diffraction measurement, a laser beam passes through a dispersed particulate
sample and the angular variation in intensity of the scattered light is measured. Large
particles scatter light at small angles relative to the laser beam and small particles scatter light
at large angles. The angular scattering intensity data is then analysed to calculate the size of
the particles that created the scattering pattern using the Mie theory of light scattering. The
particle size is reported as a volume equivalent sphere diameter [5].
MATERIALS AND METHODS:
Malvern Mastersizer 3000 equipped with Hydro MV accessory and Mastersizer software
version no. 1.70 was used. A Milli-Q purification system (Millipore, Bedford, MA, USA)
was used to further purify demineralized water. Loteprednol Etabonate was purchased from
Sigma-Aldrich. Loteprednol etabonate and tobramycin ophthalmic suspension was purchased
from market.
Mastersizer 3000 Instrument specification:
Mastersizer 3000 is equipped with Hydro MV accessory. Hydro MV - A medium volume
automateddispersion unit specifically designed for applications where sample is in short
supply and/or non-aqueous dispersants are necessary [5].

www.ijppr.humanjournals.com
Citation: Pramod kumar et al. Ijppr.Human, 2021; Vol. 21 (3): 115-129. 120
Parameter Specification
Pump speed range 0-3500 rpm
Pump speed resolution +/- 10 rpm
Pump speed accuracy +/- 50 rpm
Maximum flow rate 2.0L/min
Sonication power & frequency 40W max, 40kHz (nominal)
Maximum volume 120mL
Materials in contact with sample
316 stainless
Borosilicate glass
Tygon®
FKM (cell seal only - FFKM upgrade
available)
PTFE
PEEK
FEP
Titanium Nitride
Aluminium (tubing connectors only)
Acrylic (splash guard only)
Maximum particle size 1500μm
Minimum time between measurements less than 60 sec
Dimensions 280mm x 180mm x 300mm (L x W x H)
Mass 5kg
RESULTS:
Method development:
The primary goal was to develop a method to obtain the most stable, reproducible, consistent
method. Loteprednol Etabonate active materials solubility is about 0.000693 mg/mL [6].
Hence saturation solution of Loteprednol Etabonate in water was selected as dispersant.
Varies trials were tried for optimization of stirring speed, RI and obscuration range. The
finalised method parameters were as follows.
www.ijppr.humanjournals.com
Citation: Pramod kumar et al. Ijppr.Human, 2021; Vol. 21 (3): 115-129. 121
Sr. No Instrument Parameter Value
1 Particle Refractive Index 1.53
2 Absorption Index 0.005
3 Dispersant Name Water
4 Dispersant Refractive Index 1.330
5 Level Sensor Threshold 3
6 Measurement Duration 10 sec.
7 Number of Measurements 3
8 Report Average of Measurements Yes
9 Obscuration About 15.0%
10 Stirrer speed 2000 rpm
11 Distribution model Volume based distribution
Sample preparation: Used as such formulation product.
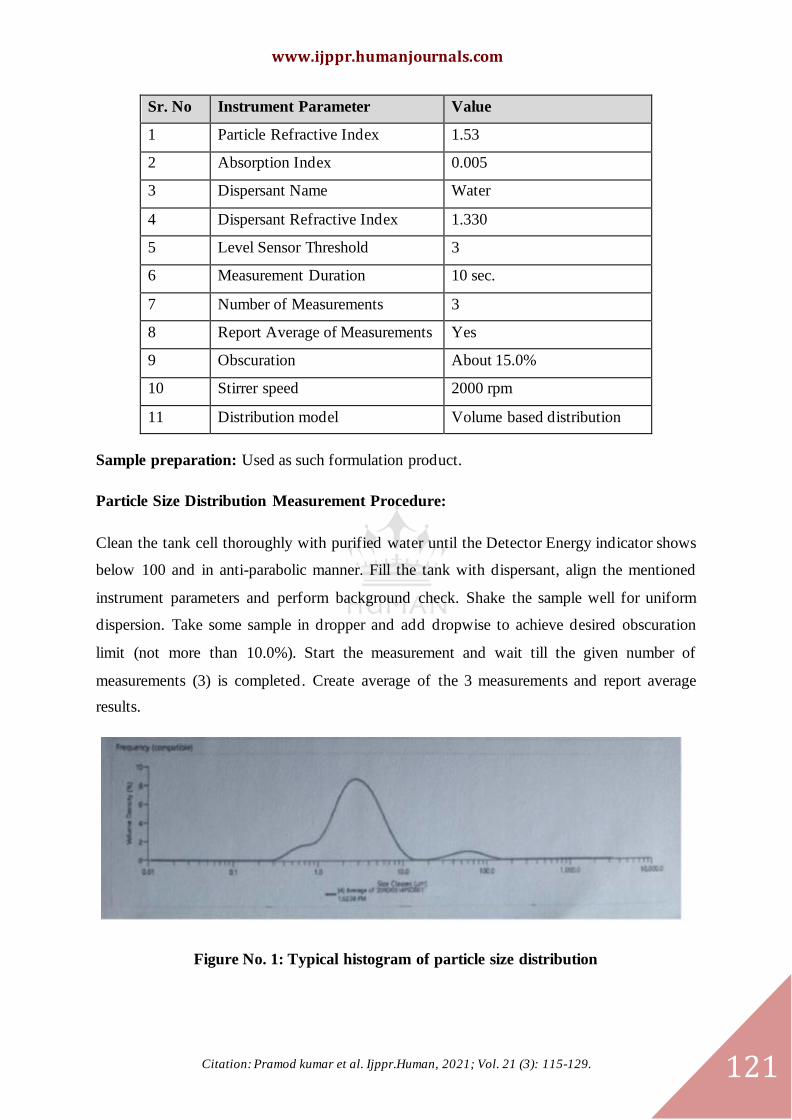
Particle Size Distribution Measurement Procedure:
Clean the tank cell thoroughly with purified water until the Detector Energy indicator shows
below 100 and in anti-parabolic manner. Fill the tank with dispersant, align the mentioned
instrument parameters and perform background check. Shake the sample well for uniform
dispersion. Take some sample in dropper and add dropwise to achieve desired obscuration
limit (not more than 10.0%). Start the measurement and wait till the given number of
measurements (3) is completed. Create average of the 3 measurements and report average
results.
Figure No. 1: Typical histogram of particle size distribution

www.ijppr.humanjournals.com
Citation: Pramod kumar et al. Ijppr.Human, 2021; Vol. 21 (3): 115-129. 122
Validation:
After successful method development, method validation was performed. For method
validation the following parameters were considered [8].
1. Method precision
2. Intermediate precision
3. Robustness
3.1 Change in the stirrer speed to ± 200 rpm
3.2 Change in the Obscuration % to ± 5%
3.3 Change in the measurement duration ±2sec.
Precision:
Repeatability should be evaluated for assessment of precision. Repeatability was determined
by six repetitive sample preparations of Loteprednol and tobramycin formulation product.
The particle size distribution of six samples preparation were determined as per above
method and recorded the particle size for d(0.1), d(0.5) and d(0.9).
Acceptance criteria: The % RSD of d(0.1) particle size values is should not be more than
30, for d(0.9) particle size values is should not more than 30 and d(0.5) particle size values is
should not more than 20[7]. The results were tabulated below.
Table No. 1: Method precision results
Sample preparation Avg. (n=3) Particle size (in µm)
d(0.1) d(0.5) d(0.9)
Preparation - 1 1.085 2.344 5.916
Preparation – 2 1.095 2.519 5.473
Preparation – 3 1.094 2.692 5.531
Preparation – 4 1.019 2.466 5.863
Preparation – 5 1.041 2.682 5.377
Preparation – 6 1.104 2.623 5.999
Average 1.073 2.554 5.693
% RSD 3.22 5.35 4.63

www.ijppr.humanjournals.com
Citation: Pramod kumar et al. Ijppr.Human, 2021; Vol. 21 (3): 115-129. 123
RESULTS: The % RSD for d(0.1), d(0.5) and d(0.9) are well within the acceptance criteria.
The % RSD for (0.1) is 3.22, for d(0.9) is 4..63 and d(0.5) is 5.35.
Intermediate Precision:
Intermediate precision was performed on different day. The Intermediate precision of particle
size distribution were determined for six sample preparations as per above method and
recorded the particle size for d(0.1), d(0.5) and d(0.9).
Acceptance criteria: The % RSD of d(0.1) particle size values is should not be more than
30, for d(0.9) particle size values is should not more than 30 and d(0.5) particle size values is
should not more than 20[7]. The cumulative % RSD of d(0.1) particle size values is should
not be more than 30, for d(0.9) particle size values is should not more than 30 and d(0.5)
particle size values is should not more than 20. The combined method precision and
intermediate precision results were tabulated below.
Table No. 2: Intermediate precision results
Sample preparation Avg. (n=3) Particle size (in µm)
d(0.1) d(0.5) d(0.9)
IP Preparation - 1 1.024 2.639 5.352
IP Preparation – 2 1.092 2.515 5.521
IP Preparation – 3 1.178 2.213 5.645
IP Preparation – 4 1.055 2.399 5.521
IP Preparation – 5 1.127 2.401 5.638
IP Preparation – 6 1.089 2.788 5.484
Average 1.094 2.493 5.527
% RSD 4.94 8.11 1.96
MP Preparation - 1 1.085 2.344 5.916
MP Preparation – 2 1.095 2.519 5.473
MP Preparation – 3 1.094 2.692 5.531
MP Preparation – 4 1.019 2.466 5.863
MP Preparation – 5 1.041 2.682 5.377
MP Preparation – 6 1.104 2.623 5.999
Cumulative Average 1.084 2.523 5.610
Cumulative % RSD 4.12 6.64 3.76
RESULTS: The % RSD for d(0.1), d(0.5) and d(0.9) are well within the acceptance criteria.
The % RSD for (0.1) is 3.22, for d(0.9) is 4..63 and d(0.5) is 5.35.
www.ijppr.humanjournals.com
Citation: Pramod kumar et al. Ijppr.Human, 2021; Vol. 21 (3): 115-129. 124
The cumulative % RSD for d(0.1)is 4.12, for d(0.9) id 3.76 and for d(0.5) is 6.64. All the
results were well within the acceptance criteria.
Robustness:
As per ICH guidelines [4], the robustness of an analytical method is its ability to withstand
small but deliberate changes in the experimental variables. In this study, the robustness was
evaluated by an experimental design examining the simultaneous influence of change in
stirring speed, change in the Obscuration and change in the measurement duration on the
determination of particle size distribution. Robustness was performed by varying the above
said parameters and particle size distribution determined in triplicates. The results were
discussed in the following tables.
Acceptance criteria:
The % RSD for d(0.1) particle size values is should not be more than 30, for d(0.9) particle
size values is should not more than 30 and d(0.5) particle size values is should not more than
20 for all variable conditions in robustness. The cumulative % RSD with method precision
values and variable condition of robustness parameter data of d(0.1) particle size values is
should not be more than 30, for d(0.9) particle size values is should not more than 30 and
d(0.5) particle size values is should not more than 20.
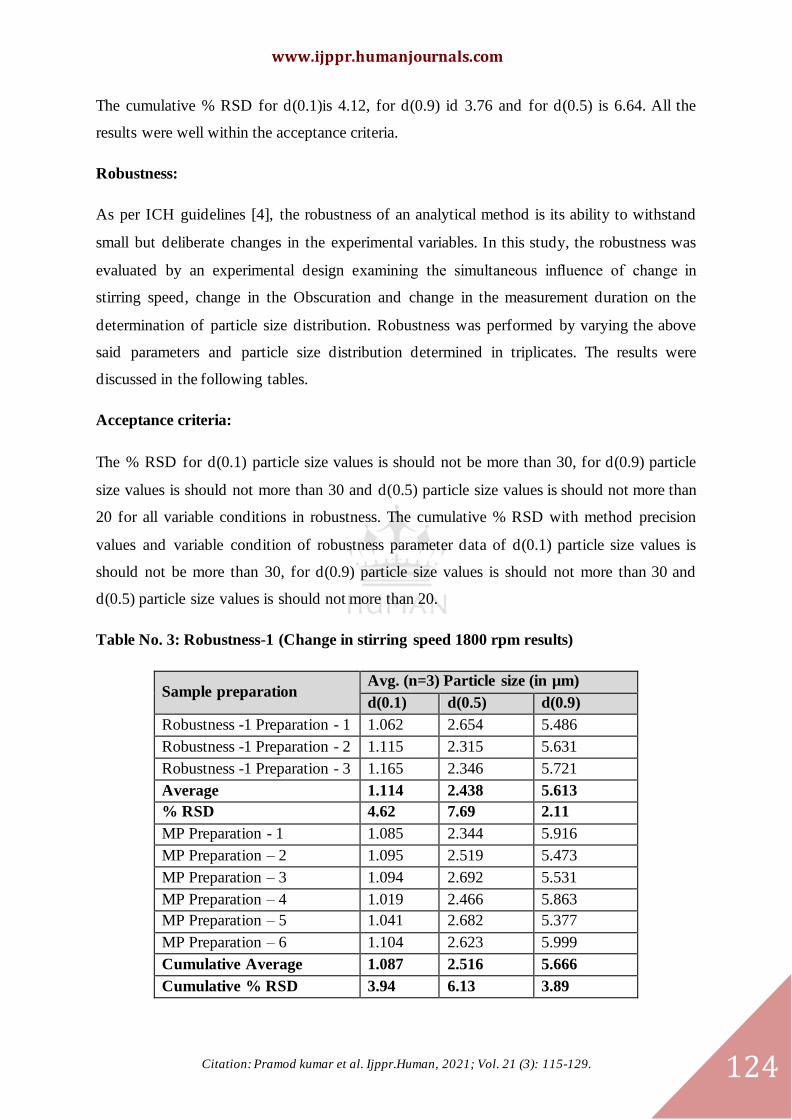
Table No. 3: Robustness-1 (Change in stirring speed 1800 rpm results)
Sample preparation Avg. (n=3) Particle size (in µm)
d(0.1) d(0.5) d(0.9)
Robustness -1 Preparation - 1 1.062 2.654 5.486
Robustness -1 Preparation - 2 1.115 2.315 5.631
Robustness -1 Preparation - 3 1.165 2.346 5.721
Average 1.114 2.438 5.613
% RSD 4.62 7.69 2.11
MP Preparation - 1 1.085 2.344 5.916
MP Preparation – 2 1.095 2.519 5.473
MP Preparation – 3 1.094 2.692 5.531
MP Preparation – 4 1.019 2.466 5.863
MP Preparation – 5 1.041 2.682 5.377
MP Preparation – 6 1.104 2.623 5.999
Cumulative Average 1.087 2.516 5.666
Cumulative % RSD 3.94 6.13 3.89
www.ijppr.humanjournals.com
Citation: Pramod kumar et al. Ijppr.Human, 2021; Vol. 21 (3): 115-129. 125
RESULTS: The % RSD for d(0.1), d(0.5) and d(0.9) are well within the acceptance criteria.
The % RSD for (0.1) is 4.62, for d(0.9) is 2.11 and d(0.5) is 7.69.
The cumulative % RSD for d(0.1)is 3.94, for d(0.9) id 3.89 and for d(0.5) is 6.13. All the
results were well within the acceptance criteria.
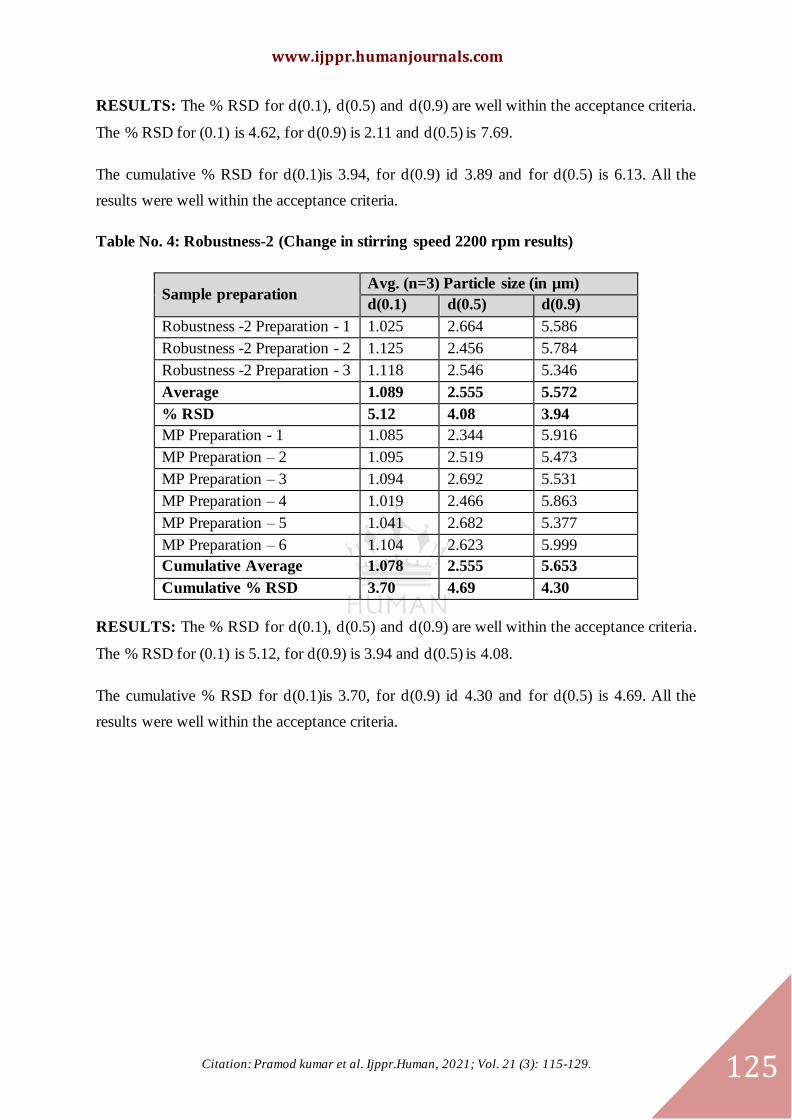
Table No. 4: Robustness-2 (Change in stirring speed 2200 rpm results)
Sample preparation Avg. (n=3) Particle size (in µm)
d(0.1) d(0.5) d(0.9)
Robustness -2 Preparation - 1 1.025 2.664 5.586
Robustness -2 Preparation - 2 1.125 2.456 5.784
Robustness -2 Preparation - 3 1.118 2.546 5.346
Average 1.089 2.555 5.572
% RSD 5.12 4.08 3.94
MP Preparation - 1 1.085 2.344 5.916
MP Preparation – 2 1.095 2.519 5.473
MP Preparation – 3 1.094 2.692 5.531
MP Preparation – 4 1.019 2.466 5.863
MP Preparation – 5 1.041 2.682 5.377
MP Preparation – 6 1.104 2.623 5.999
Cumulative Average 1.078 2.555 5.653
Cumulative % RSD 3.70 4.69 4.30
RESULTS: The % RSD for d(0.1), d(0.5) and d(0.9) are well within the acceptance criteria.
The % RSD for (0.1) is 5.12, for d(0.9) is 3.94 and d(0.5) is 4.08.
The cumulative % RSD for d(0.1)is 3.70, for d(0.9) id 4.30 and for d(0.5) is 4.69. All the
results were well within the acceptance criteria.
www.ijppr.humanjournals.com
Citation: Pramod kumar et al. Ijppr.Human, 2021; Vol. 21 (3): 115-129. 126
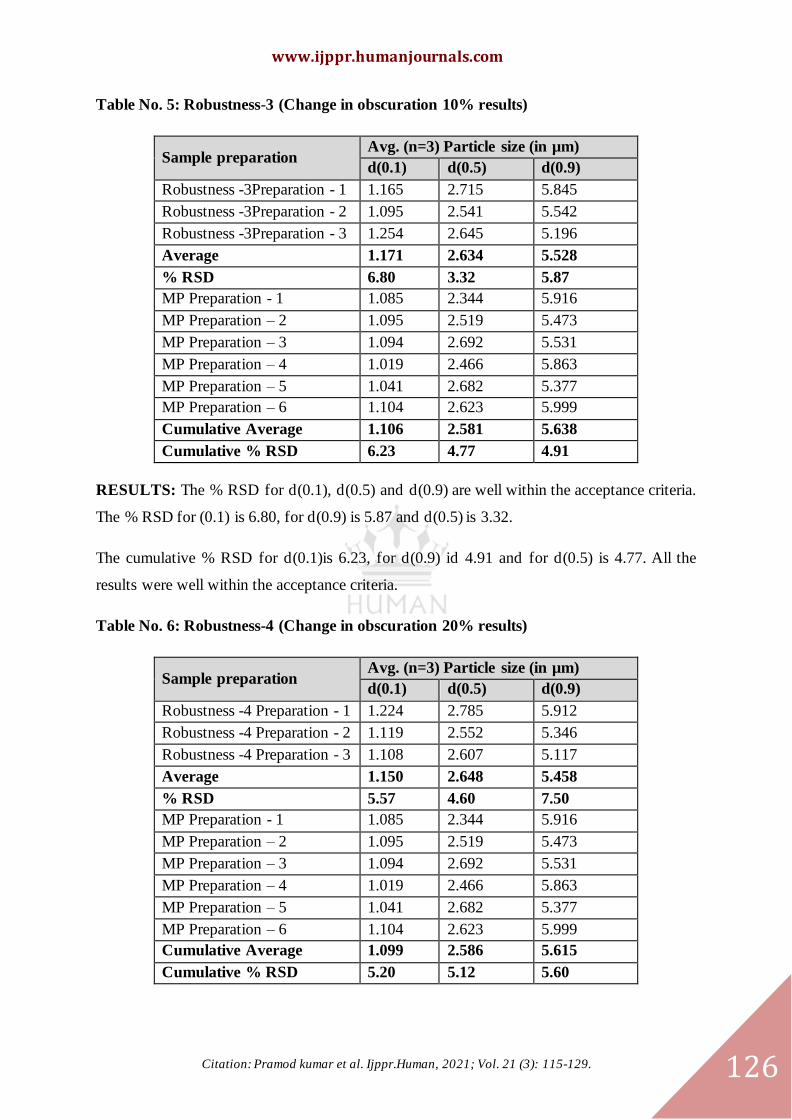
Table No. 5: Robustness-3 (Change in obscuration 10% results)
Sample preparation Avg. (n=3) Particle size (in µm)
d(0.1) d(0.5) d(0.9)
Robustness -3Preparation - 1 1.165 2.715 5.845
Robustness -3Preparation - 2 1.095 2.541 5.542
Robustness -3Preparation - 3 1.254 2.645 5.196
Average 1.171 2.634 5.528
% RSD 6.80 3.32 5.87
MP Preparation - 1 1.085 2.344 5.916
MP Preparation – 2 1.095 2.519 5.473
MP Preparation – 3 1.094 2.692 5.531
MP Preparation – 4 1.019 2.466 5.863
MP Preparation – 5 1.041 2.682 5.377
MP Preparation – 6 1.104 2.623 5.999
Cumulative Average 1.106 2.581 5.638
Cumulative % RSD 6.23 4.77 4.91
RESULTS: The % RSD for d(0.1), d(0.5) and d(0.9) are well within the acceptance criteria.
The % RSD for (0.1) is 6.80, for d(0.9) is 5.87 and d(0.5) is 3.32.
The cumulative % RSD for d(0.1)is 6.23, for d(0.9) id 4.91 and for d(0.5) is 4.77. All the
results were well within the acceptance criteria.
Table No. 6: Robustness-4 (Change in obscuration 20% results)
Sample preparation Avg. (n=3) Particle size (in µm)
d(0.1) d(0.5) d(0.9)
Robustness -4 Preparation - 1 1.224 2.785 5.912
Robustness -4 Preparation - 2 1.119 2.552 5.346
Robustness -4 Preparation - 3 1.108 2.607 5.117
Average 1.150 2.648 5.458
% RSD 5.57 4.60 7.50
MP Preparation - 1 1.085 2.344 5.916
MP Preparation – 2 1.095 2.519 5.473
MP Preparation – 3 1.094 2.692 5.531
MP Preparation – 4 1.019 2.466 5.863
MP Preparation – 5 1.041 2.682 5.377
MP Preparation – 6 1.104 2.623 5.999
Cumulative Average 1.099 2.586 5.615
Cumulative % RSD 5.20 5.12 5.60

www.ijppr.humanjournals.com
Citation: Pramod kumar et al. Ijppr.Human, 2021; Vol. 21 (3): 115-129. 127
RESULTS: The % RSD for d(0.1), d(0.5) and d(0.9) are well within the acceptance criteria.
The % RSD for (0.1) is 5.57, for d(0.9) is 7.50 and d(0.5) is 4.60.
The cumulative % RSD for d(0.1)is 5.20, for d(0.9) id 5.60 and for d(0.5) is 5.12. All the
results were well within the acceptance criteria.
Table No. 7: Robustness-5 (Change in Measurement Duration -8 sec results)
Sample preparation Avg. (n=3) Particle size (in µm)
d(0.1) d(0.5) d(0.9)
Robustness -5 Preparation - 1 1.119 2.642 6.012
Robustness -5 Preparation - 2 1.208 2.574 5.741
Robustness -5 Preparation - 3 1.138 2.496 5.426
Average 1.155 2.571 5.726
% RSD 4.06 2.84 5.12
MP Preparation - 1 1.085 2.344 5.916
MP Preparation – 2 1.095 2.519 5.473
MP Preparation – 3 1.094 2.692 5.531
MP Preparation – 4 1.019 2.466 5.863
MP Preparation – 5 1.041 2.682 5.377
MP Preparation – 6 1.104 2.623 5.999
Cumulative Average 1.100 2.560 5.704
Cumulative % RSD 4.96 4.46 4.47
RESULTS: The % RSD for d(0.1), d(0.5) and d(0.9) are well within the acceptance criteria.
The % RSD for (0.1) is 4.06, for d(0.9) is 5.12 and d(0.5) is 2.84.
The cumulative % RSD for d(0.1)is 4.96, for d(0.9) id 4.47 and for d(0.5) is 4.46. All the
results were well within the acceptance criteria.
www.ijppr.humanjournals.com
Citation: Pramod kumar et al. Ijppr.Human, 2021; Vol. 21 (3): 115-129. 128
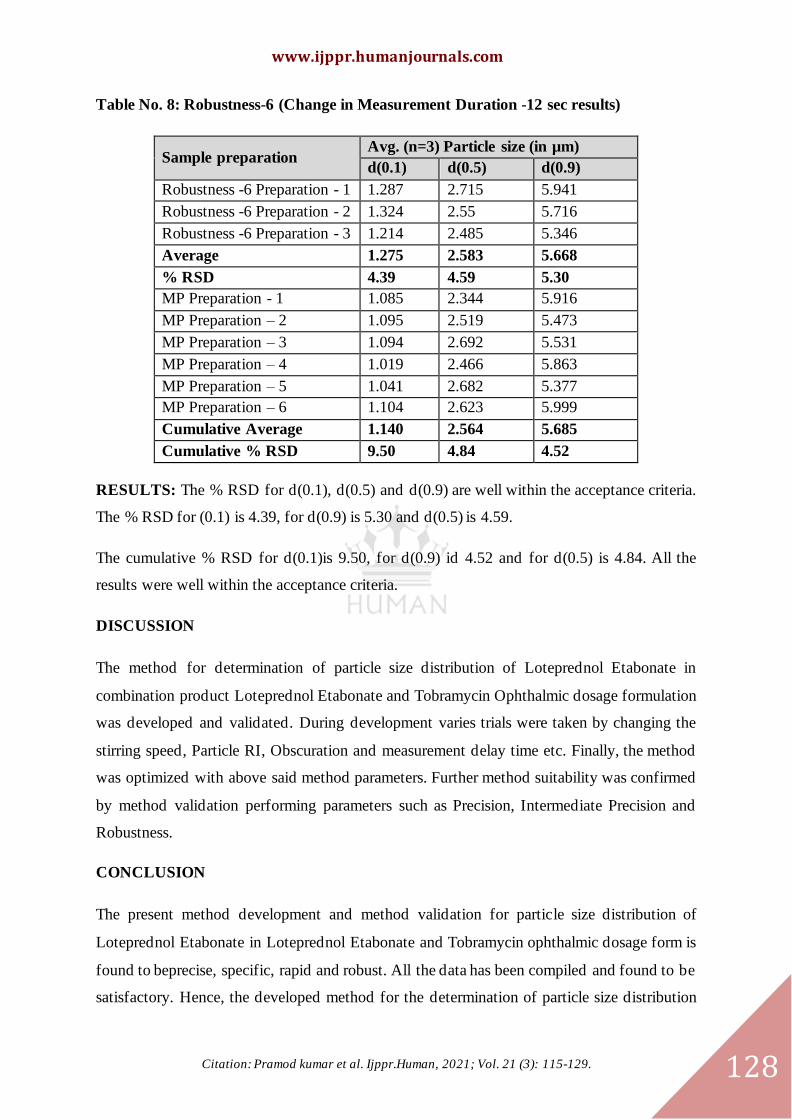
Table No. 8: Robustness-6 (Change in Measurement Duration -12 sec results)
Sample preparation Avg. (n=3) Particle size (in µm)
d(0.1) d(0.5) d(0.9)
Robustness -6 Preparation - 1 1.287 2.715 5.941
Robustness -6 Preparation - 2 1.324 2.55 5.716
Robustness -6 Preparation - 3 1.214 2.485 5.346
Average 1.275 2.583 5.668
% RSD 4.39 4.59 5.30
MP Preparation - 1 1.085 2.344 5.916
MP Preparation – 2 1.095 2.519 5.473
MP Preparation – 3 1.094 2.692 5.531
MP Preparation – 4 1.019 2.466 5.863
MP Preparation – 5 1.041 2.682 5.377
MP Preparation – 6 1.104 2.623 5.999
Cumulative Average 1.140 2.564 5.685
Cumulative % RSD 9.50 4.84 4.52
RESULTS: The % RSD for d(0.1), d(0.5) and d(0.9) are well within the acceptance criteria.
The % RSD for (0.1) is 4.39, for d(0.9) is 5.30 and d(0.5) is 4.59.
The cumulative % RSD for d(0.1)is 9.50, for d(0.9) id 4.52 and for d(0.5) is 4.84. All the
results were well within the acceptance criteria.
DISCUSSION
The method for determination of particle size distribution of Loteprednol Etabonate in
combination product Loteprednol Etabonate and Tobramycin Ophthalmic dosage formulation
was developed and validated. During development varies trials were taken by changing the
stirring speed, Particle RI, Obscuration and measurement delay time etc. Finally, the method
was optimized with above said method parameters. Further method suitability was confirmed
by method validation performing parameters such as Precision, Intermediate Precision and
Robustness.
CONCLUSION
The present method development and method validation for particle size distribution of
Loteprednol Etabonate in Loteprednol Etabonate and Tobramycin ophthalmic dosage form is
found to beprecise, specific, rapid and robust. All the data has been compiled and found to be
satisfactory. Hence, the developed method for the determination of particle size distribution
www.ijppr.humanjournals.com
Citation: Pramod kumar et al. Ijppr.Human, 2021; Vol. 21 (3): 115-129. 129
of Loteprednol Etabonate in Loteprednol Etabonate and Tobramycin ophthalmic dosage form
can be suitably used for analysis. Therefore, this method could easily be used in a wide range
of analytical laboratories.
REFERENCES:
1. International conference on harmonisation guidelines on “specifications: test procedures and acceptance
criteria for new drug substances and new drug products: chemical substances” ICH (Q6A).
2. Loteprednol Etabonate. National Centre for Biotechnology Information. PubChem Compound Database.
[Last accessed on 2020 March 30]. p. CID= 444025. Available from:
https://pubchem.ncbi.nlm.nih.gov/compound/Loteprednol-etabonate
3. A Validated Specific Stability-Indicating RP-HPLC Assay Method for the Determination of Loteprednol
Etabonate in Eye Drops by Yong K. Han and Adriana I. Segall. Journal of Chromatographic Science
2015;53:761–766 doi:10.1093/chromsci/bmu121 Advance Access publication September 18, 2014.
4. International conference on harmonisation guidelines on validation of analytical procedures: text and
methodology Q2(R1), November 2005.
5. Mastersizer broucher and Mastersizer 3000 Smart Particle Sizing user manual.
6. Drug bank-Loteprednol Etabonate. Available from:https://www.drugbank.ca/drugs/DB14596.
7. USP40 <429>Light Diffraction Measurement of Particle Size.
8. Development and Validation of New Analytical Method for the Determination of Particle Size Distribution
of Metformin Hydrochloride Using Laser Based Particle Size Analyzer by Amit Gosar, Shivaji Folane, Sanjay
Pawar, Mithun Gharat, Amit Lalge, and Shivaji Jadhav. Journal of Pharmaceutical Research International 17(5):
1-9, 2017; Article no. JPRI.33911, DOI: 10.9734/JPRI/2017/33911.
9. SAP #: 10013710 Measurements of Particle Size Distribution by Wet & Dry Laser Diffraction, Performed
by: Mae Gackstetter, Malvern Inc, 10 Southville Road, Southborough, MA 01772
([email protected]) Dates of analysis: 5th July 2007.
10. Particle Size Characterization- Techniques, Factors and Quality-by-design Approach, Rupinder Kaur
Dhamoon, Harvinder Popli, Geeta Aggarwal, Madhu Gupta. International Journal of Drug Delivery
2018;10(1):01-11, DOI: 10.5138/09750215.2204.
11. Particle size distributions by laser diffraction: sensitivity of granular matter strength to analytical operating
procedures, F. Storti and F. Balsamo, Solid Earth, 1, 25–48, 2010.
12. Analytical method development of the Particle size distribut ion methodology for Exemestane API, Parag
Das*, Abrar Mansuri, Animesh Maity. J Pharm Adv Res, 2019; 2(3): 506-511.e – ISSN: 2581-6160 (Online).
Related Documents