NOVEMBER 1, 1995

Welcome message from author
This document is posted to help you gain knowledge. Please leave a comment to let me know what you think about it! Share it to your friends and learn new things together.
Transcript
NOVEMBER 1, 1995

a..dl &...... _ • 1953 Sod! HIrWr $teet • Musllegon, .. 49Wl~1&4• 6UI.72U171 • 8OO.368.0lI60 EST • FAX: 616.72U22tA~"__",
CAClE '3 ON FEAOtJI S8MCE CAAIl
~ -:--=-~._- -.... ..~:.. ':.. .,..-:;:,....=..••";';::=.:-..__~~ =7'-:::.,.
It~..........
11~

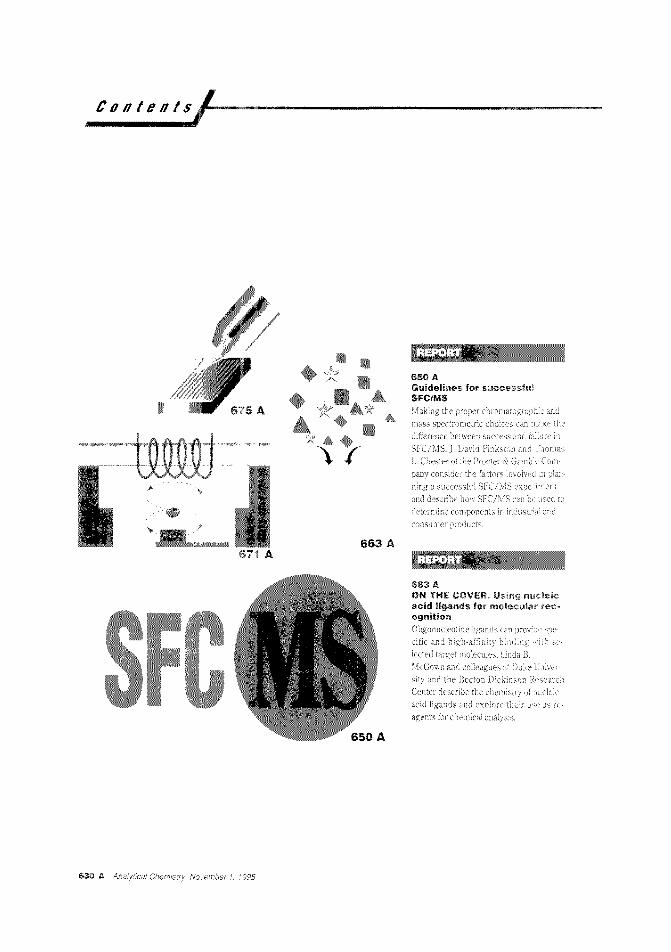
Con / e n / s ,,,1 _
I
663 A
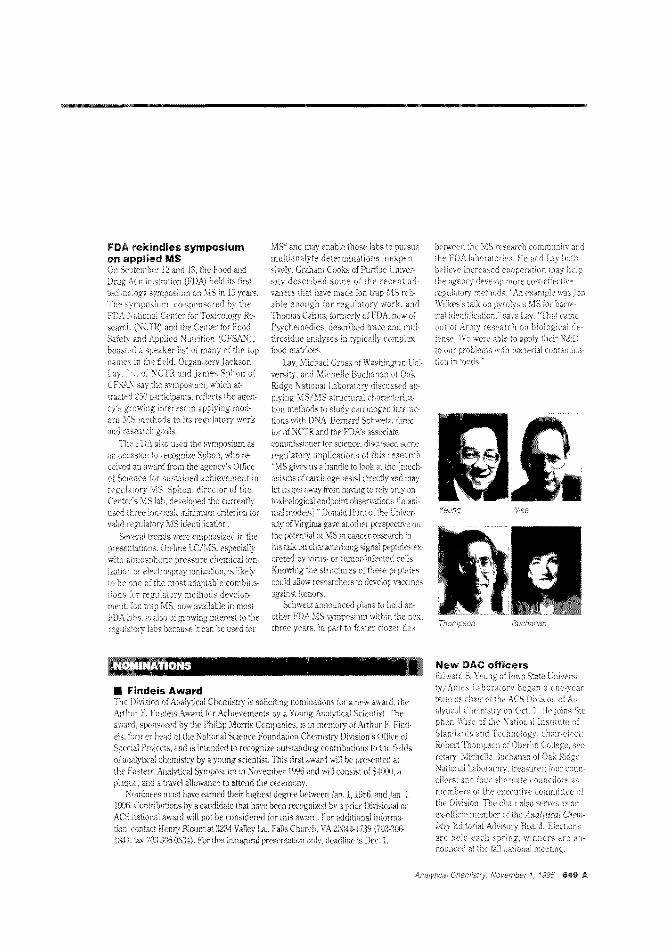
6SCI AGuidelines for successfulSFC/MS
NOVEMBER 1, 1995
ANCHAM67(21) 629 A-B86 Ai3829-4032 (1995)ISSN 0003·2700
Registered in U.S. Patent and Trademark Office©Copyright 1995 by the American Chemical SOciety
-63311.In AI; Research
641 AEditorial
Off-shore authors welcome. Cuttingedge analytical chemistl~1 has no national
ity, and in 1994 37% of the papers published in Analytical Chemistr) were by nonresident authors.
64311.Analytical Currents
64BANews
Laboratory profile: Making cuttingedge technology work for day-to-dayuse. II FDA rekindles symposium on ap
plied MS • Division of Analytical Cbemistty officers for 1995-96.• Nominationssolicited for DAC's Findeis Award.
65BASoftware
Tracking calibration records. CalibratiDn Manager, a relational database package for managing calibr2.tion of analytical instnLTIentation, is reviewed by F. C.McElroy of Exxon Research and Engineering Company.• Software released.
660 ABooks
Predicting retention in Le. Retentianand Selectivity in LC is reviewed by C. H.Lcchmtiller of Duke University. 0 Determining drugs of abuse. Analysis a/Addictive and Misused Drugs is reviewed byJohn T. Cody of Lackland Air Force Base.• Books received.
669 AMeetings
671 AFocus
MRFM. Combining magnetic resooancewirh atomic force microscopy results ina new technique with the potential for providing single-spin sensitivity for 3-D characterization of individual molecules in situ.
675 AProduct Review
X-ray photoelectron spectroscopy.Small-area analysis, imaging, and deptl1profiling capabilities have broadened thescope of research instruments for XPS. vVe
review rece~nt innovation and differences
in instrument design for advanced technic;ues.
68DANew Products
An X-ray imaging module for SEM, a multidimensional XRF spectrometer, and a
triple-quaclrupde mass spectrometer arefeatured.• Instrumentation. 0 Literature.• Catalogs.
68411.Information Express
1CAC Research Contents
3829-4031AC Research
4032Author Index
Analytical Chemistry November 1, 1995 631 A
Do You NeedA Comprehensive GC/MS Solution?The SbbDadm ocn.tS QP-MOO. The DeW aeneration.Compld IIId complete,.Regard1ells ofwhether you work in water, air, or lIOilanalysis, or whether you are~forwviroomental~
additives in food, ex forensics drugabuse, our new G(;/MS QP·5000is sure to exceed your expectations. Its mass spectrometer,covering the range 10 amu to700 amu, is coupled to the provenperformance of the G(;·17Agas chromatograph, includingAFC for setting carrier relatOOflows and pressures. Our newG(;/MS QP·5000 has been designed for the moststringent analytical methodology ~ well as routineana1yticallaboratory work. Its compactness and ranae
of features are truly imprea;ive. The overall width ofthe GC and MS is just '12..6 an (28.5"). All $ySI'.em C¥'.I""atioos are rontldled by~Wmdows'" -based 110ft
ware. The GClMS QP-{\()()() is abigh1y sensitive bench-topGCIMS with oomputer-simuJatioo-optimir.ed ion optics andfully automated VlICtIum controL
Available options include a jetseporator interface, a high capac·ity tutbomolecular pump, chemicaI·ionization, and a direct inletsystem for low volatiles. Callyour nearest ShimadzuRepreeentati'Ye today for more
details on the GCIMS QP-5000. You can count on aprompt respollSe from us.__-io........_~~_WA.1&.
::=:..~3,~l<1lcmo,~ tokyo 1~.JIpon
Pllonr. 81(3)321~1 Fa<.: 81(3}321$-5710
8tIMADlU ICWm'IC~ IIIC.TIQ2 __ ~eour.t>Io,~21~U.SA
Pllonr.1(410)311.1227 F-.:1(4101381-1222
~ EUAOfltlo.tIPllonr. 4$(2O:ll788100 Fa<.:~~ GemlIny.
.-ullIN lAllA MCIRCI Pn Lll).Pllonr. &5-m fo2lIO FIX.: &5-m 2935 so-SIWAMII 0CZAIII0\ 'fY. Lm.Pllonr. .t(2)SS4·~ FIX.: 11(:2)684-056 ...........
CIlCl.E 3 ON READER SSlVn CNID
~ SI-IIMADZU.sofutionsfor .$tiena
sJnce 1875
I n A eRe sea I C h,,.( _
Brief introductions to the research articles appearing in the November 1 issue andtentatively scheduled to appear in the November 15 Issue
Accelerated Article
Measuring the more toxic PCBs byimmunoassayMost ,malyses of polychlorinated biphenyls (PCBs) d,'leclthe congeners most abundant in commercial formulationssuch as the Aroclors. However, PCBs differ in their toxicology. and determining the environmental ilnpact by measuring the more toxic of these po!lutants is generally difficultand expensive. Alexander E. Karu and co!leagues at IheUniversity of California-Berkeley and ECOCHEM Researchreporl deriving a monoclonal antibody that is the basis ofhighly selective enzyme immunoassays for nonortho
substituted. coplanar PCBs including the velY toxic PCBs77 and 126. ("A Monoclonal Immunoassay for the CoplanarPolychlorinated Biphenyls"; AC950675Y; p. 3829)
Drug dispersion in amedicinal patchTime-release drug delivery systems,such as skin patches, are becoming moreimportant as peptide hormone drugsare deveioped to regulate growth, immune response, blood pressure, andother physiological processes. However,
the rate and efficiency of drug delivery depends on how thedrug is c:istributed b the polymer matrix 0' the carrier. R W.Odom and colleagues at the University of California-San Francisco. Charles Evans & Associates, and Abbott Laboratoriesam IFC the distribution of a peptide hormone in a skin patchusing TOF-SIMS and X-ray photoelectron spectroscopy. ("XPSand TOF-SIMS Microanalysis of a Peptide/Polymer Drug Delivery Device"; AC950439N; p. 3871)
Clinical impedance sensorElecu-ochemical sensors for clinically important analytes havebeen based on amperometric or potentiometric measurementsusing enzyme electrode~ that have disadvantages for certain an~
alytes. Calum J. McNeil and colleagues at the University ofNewcastle upon Tyne (U.K.) and Cambridge Life Sciences pic(J.K.) construct sensors based on enteric polymer coatings thatdissolve in the presence of the analyte, causing a change in impedance in the underlying electrode. The utility of this tochnique is demonstrated by applying it to the measurement ofurea and enyzme immunoassay_ ("Electrochemical SensorsBased on Impedmce Measurement of Enzyme-Catalyzed Polymer Dissolution: Theory and Applications"; AC950386+;p.3928)
Aldehyde biosensorTo lessen the large overpotentials encountered when l\ADH isdirectly oxidized ar electrodes, there is much interest in developing materials capable of clectrocatalytically oxidizing thecompound. H. D. Abrufia anel colleagces at Cornell University and the Universidad Aut6noma de Madrid (Spain) developan aldehyde biosensor by combining the electrocatalytic activity ofglassy carbon electrodes (modified with electro;Jolymerized 'l,4-dihydroxybenzaldehyele film) with the enzymatic activity of immobilized aldehyde dehydrogenase. The detectionlimit is 5.0 pM anel the response time is ~ 1 min. ("AldehydeBiosensor Based on the Determination of NADH EnzymaticallyGenerated by Aldehyde Dehydrogenase"; AC9502070;p.3936)
Detecting DNA hybridizationThe most direct way to determine DNA sequences is to probethe unknown D\JA specimen with probe DNA of a known sequence and monitor the occurrence of hybridization usingseparation techniques. Linda B. McGown and colleagues atDuke University and the Becton Dickinson Research Centeruse steady-state fluorescence anisotropy to monitor hybridization of f1uorescein-iabeled DNA oligomers in situ without a priorseparation step. The oligomers included a binding site for theEcoRl restriction enzyme, which binds to double-stranded DNAand is used to enhance the difference between the anisotropies of the single-stranded and double-stranded oligomers("Hybridization of Fluorescein-lAbeled DNA Oligomers Detected by Fluorescence Anisotropy with Protein BindingEnhancement". AC950478Z; p. 3945)
Sequencing proteins from the C-terminalThe C-terminus is a region of proteins and peptides often notanalyzed because of the lack of methods that could provide reliable information, Stephen.A. Martin and colleagues at PerSeptive Biosystems discuss C-terminal sequencing using a timedependent carboxypeptidase YdigestioE coupled with MALDITOFMS analysis of the resulting peptide ladders. Of22 peptides tested with the method, sequence information was derived from 19. ("C-Terminal Ladder Sequencing via MatrixAssisted lAser Desorption Mass Speetrometly Coupled withCarboxypeptidase YTime-Dependent and Concentration-Dependent Digestions"; AC950501G; p. 3971)
New method for characterizingphospholipidsPhospholipids are principal components of biological cell membranes and various subcellular organelles. Alan G. Marshalland colleagues at Florida State University and The Ohio StateUniversity demonstrate structural analysis of several key phospholipids using MAiD! FT-lCR'vIS. Both positive and negative molecular or quasimolecular ions are generated in highabundance. ("Structural Characterization ofPhospholipicls by
Analytical Chemis;ry November 1. 1995 633 A
In AC Research'
Matrix-Assisted Laser Desorption/Ionization Fourier Transform Ion Cyclotron Resonance Mass Spect:-ometry";AC950440M; p. 3979)
Determining enrichment of ['5N]leucine byGC/MSGC/MS is often used to determine the abu'dance ofi"N]leucine and other amino acids in isotopic tracer experi-ments. Guyon and colleagues at the Univcrsitc ReneDescartes study the effect of hydrogen rearrange-ment on the determination of the enrichment of the measured ratio of ;"N/1'N-labeled leucine using 11 esters of 15N_labeled and nonlabeled N-(heptafluorobutyryl)ieucine. Theytind that the labeling ratio increases with the length of the alkylchain of the ester and the number of hydroger atoms on thechain. ("Effect of Hydrogen Rearrangement on the Determination of the Enrichment of [l'N!Leucine by GC/MS";AC950434Q; p. 4(00)
Testing drugs for electrolyticdegradation.Nonoral and nonintravenous delivery systems are needed forsome ofthe new peptide drugs, which wou:d otherwise be digested or oxidized by the liver before reaching their targets. Delivery of ionic drugs through the skin can be achieved by applying a low-level electric current and could be used in a numberof controlled-release drug delivery schemes. However, somedrugs may degrade under an applied voltage. Hung-YuanCheng and co-workers at SmithKline Beechar:1 Pharmaceuticals evaluate electrolytic degradation of growth-hormone-releasing peptide in a prototype transdermal iontophoresis system,using cyclic voltammetry, bulk electrophoresis, HPLC, LC/MS/MS, and spin-trapping EPR for structural ("StructuralStudy of Electrolysis-Induced Degradation Growth Hor-mone Releasing Peptide His-D-Trp-_AJa-Trp-D-Phe-Lys-NH/;AC950607B)
Interactions of bile saits with heavy metalions.It has been postulated that bile salts can acl as metal ion buffersand prevent precipitation of heavy metal salts with other anions, but experimental evidence is limited. Using polarography,P. Zuman and colleagues at Clarkson University and the Universit" di Bologna (Italy) study ,he interaction of dihydroxy bileacid anions with divalent metal ions. They measure equilibrium constants for metal ion cOr:1plexes with small bile acid aggregates, finding that the solubility depends primarily on thenature of the metal ion. ("Interaction between Dihydroxy BileSalts and Divalent Heavy Metal Ions Studied by Polarography"; AC940519B)
Trace electrochemical measurement ofRNA.Few studies have been devoted to electroanalysis of RNAJoseph Wang and colleagues at New Mexico State Universityand the Academy of Sciences of the Czech Republic investigatethe adsorptive accumulation of low levels of RNA on a carbonpaste electrode combined with constant current potentiometricstripping analysis. They find that picogram quantities of RI'lAcan Je detected without a mercury surface or an oxygen removal step. (''Trace Measurements of R1\JA by PotentiometricStripping Analysis at Carbon Paste Electrodes"; AC950520Q)
A modular detector forfluorideIntegration of several steps into a complex module is often used as a way ofsimplifying and analyti-cal methods. M. D Luque de antiL Papaefstathiou of the University ofCordoba (Spain) cevelop a method for
determining fluoride that integrates pervaporation with potentiometric detection in a laboratory-built module. The methocl issuccessfully applied to determination of fluoride in orange treeleaves. ("Integrated Pervaporation/Detection; Continuous andDiscontinuous Approaches for Treatment/Determination ofFluoride in Liquid and Solid Samples"; AC950357Z; p. 3916)
Biosensor for phenol vaporNonbiological gas-phase sensors such as electrochemicai, coiorimetric, or semiconducting sensors afe widely available butare often somewhat nonspecific and generally require analytevapors to be reactive. Enzymes and antibodies have high selectivity for their substrates or target antigens and can be incorporated into electrode systems, but they require water for activityand gas-phase scnsbg is usually too dry for them. Anthony P.F. Turner and colleagues at Cranfield University (U.K.) fabricate a microbiosensor for phenol vapor by incorporating polyphenol oxidase in a water-retaining gel on a microelectrode. Thesensor is stable for at least five days at room temperature andachieves 30 ppb detection limits. ("Gas-Phasc Microbiosensorfor Monitoring Phenol Vapor at ppb Levels"; AC950443Z;p.3922)
Making troublesome polymers work asSAW sensorsJay W. Grate of the Naval Research Laboratory and R. AndrewMcGill of Geo-Centers report that well-behaved surface acoustic wave vapor sensors can be prepared using previously troublesome polymers. They observe that thin polymer films sometimes dewet the sensor surface, leading to isolated droplets ofmaterial and a degradation in sensor performance. In generaLplasma precleaning methods alleviate these problems. ("Dewetting Effects on Polymer-Coated Surface Acoustic Wave VaporSensors"; AC950262X; p. 4(15)
Decreasing stray capacitance inultramicroelectrodesStray capacitance effects are a problem in fast-scan cyclic voltammetry 'Jsing ultramicroelectrodes. J. Heinze and P. Tschunckyof the Universitiit Freiburg (Germany) discuss new methods forconnecting the electrode microwire and development of shieldings that result in a fivefold drop in capacitive CU1Tents in a standard electrode solution. Electrodes with radii down to 1 ~m areconstructed. ("An Improved Method for the Construction of illtramicroelectrodes"; AC950183L; p. 4(20)
Fabricating ultrasmall carbon diskelectrodes.Although disk-shaped microelectrodes with radii as small as10 Ato 20 \lm have been constructed, they arc still teo large formicroenvironments such as the extraceJular region of thebrain or the cytoplasm of single cells. Danny K Y. Wong andLisa Y. F. Xu of Macquarie University (Australia) fabricatecarbon disk electrodes with tip diameters approachh,g 100 nm.
634 A Analytical Chemisiry, November 1, 1995 • Denotes articles that are tentatively scheduled ior tle November 15 issue
The microelectrodes show a well-defined signcoidal responsefor tlw oxidation of dopamJ1e with minimal background charging current. ("Voltammetrie Studies of Carbon Disk Electrodes with Subrnicromeler-Sized Structural Diameters";AC950521I)
Microdisk voltammetry with a twist.Microelect:odes oHer several advantages including quantitativeelectrochemical measurements in solutions with low ionicstrengths. Henry S. White and Xiaoping Gao 0' the University ofUtah investigate using a rotating microdisk electrode forsteady state vc]tanl11etric studies in ~ow-ionic-strength solutions. They i1nd that fluid convection causes an increase ir: poLemia! drop, resulting, for some reactions, in a dramaticdeere-ase in the voltammetric current as the rotation rate increases. ("Rotating Microdisk Voltammet!y"; AC9:;04124)
Tandem TOFMSMS/MS structural confirmation is beCOIyjng more important for chromato
~ graphic methods. particularly in regula-tory applicatims. However, GC peaksare so narrow that very rapid massspectral collection is necessary. Singlereflectron TOF mass spectrometers col-
lect spectra very ra"idly an~ have been adapted for MS/MSusing photodissociation of precursor ions in the flight tube. butso far I-.ave not achieved unit mass resolution for bob precursor and product ion spectra to mlz 1000. Christie G. Enke andcolleagues at Michigan State University perform TOFMS/TOFMS with unit mass resolution for both stages using adual-reHectron mass spectrometer and a timed pulsed laser forphotodissociation of selected precursor ion packets. ("Tandem Reflectron Time-of-Flight Mass Spectrometer UtilizingPhotod!ssociation"; AC9502880; p. 3952)
Detecting neutral analytes by electrosprayMSTo utili:y 01 electrospray MS, a number of recentstudies have investigated the various processes that generategas-phase ions. Gary J Van Berkel and Feimeng Zhou of OakRidge National Laboratory show that an electrospray ion sourceis anaiogolls to a controlled-current electro~yticflow cell. Basedon this model, they find that by meeting three key operatingrequirements even difficult-to-oxidize neutral analytes can beetiierently ionized and detected in the gas phase by electrospray MS. Neutral melallocenes, metalioporphyrins, and polycyclic arc,ma-jc hydrocarbons 2re presented as model com-
("Electrospray as a Controlled-Current ElectrolyticEiectrochemical Ionization of Net:!ral Analytes for Detec
tion by Eleerrospray Mass Spectromet:ry"; AC950426+; p. 3958)
Flame-retarding additives by FT-ICRMSPyrolysis IT-lC~i\1S has many features that make it a poweJiullechmque for identifying polymer additives. Ron M. A Heerenand colleagJes at the FOM-Institute for Atomic and MolecularPhysics (The Netherlands) evalurIte direct temperature re-solved in-source FT-ICRMS using polymers con~
!jn,-rc,taI'dants spiked with antimony-containing synergists. obtain resolution sufficient to separate the nominallyisobaric ions from the aJ.tilTony (III) oxide synergist and the nbutyl derivative of tetrabromoBisphenol-A. ("Direct Tem-
perature Resolveci HRlVIS of FIre-Retarded Polymers by In-SourcePyMS on an External Ion Source Fourier Transfom: Ion Cyclotron Resonance I\i~ass Spectrorneler"; AC950294K; p. 3965)
Determining purity of ginseng productsBecause of the widespread interest in ginseng as an unconventional herbal me-rHeine. analytical :neboc1s are needed to determine the integrity of the~;e products. Richard B. van Breemen and colleagues at the University of IlEnois-Chicagodescribe an electl'ospray LC/lvIS method for the analysis of ginseng saponins (ginsenosicles) from ginseng root extracts.They find that Korean and American ginseng exLracls displaysubstantionil] differences between the relative amounts of eachginsenoside. ("Eectrospray Liquid Chro:natography/MassSpectrometry of C;insenosicies"; AC950420K; p. 3985)
MALDI-TOF fragmentation of peptidesMALDl is best hown as a "soft" ionization method that leavesproteins and other large molecules intact. However, reflectronTOFMS reveals t!Jat these molecules can undergo significantpostsQurce decay in the i1igiYL tube. Delayed pulsed Ion ex:.:rac-tion can be used observe "{(lst metastable fragmentation in alinear TOF Robert S. Brown and John]. Len-nor_ of Utah University use delayed pulsed ion extractionin a linear system W take advantage of fast metastable decay as aprotein-sequencing method, They obtain overlapping fragment sequence information from both the C- ant N-terminalends of several pro:eins. ("Sequence-Specitic FragmeJ'tation ofMatrix-Assisted Laser-Desorbed Protem/Peptide IonsAC9504225, p. 3%0)
Measuring self-exchange rates by ICPMSKnowiJ'g the accuracy of electron transfer self-exchange rateconstants is important for comparing tl~eoreticaland experirneIltCll values for cross-reactions. I-Iowever, because no net chemical change takes place during self-excl-.ange, direc'_ determination of kJl values is difficult. Michael E. Ketterer and Michael AFiorentino of)ohn Carroll University peliorm tim€wise separation ofTI redox species in aqaEOus HClO.1using enriched stable isotope labeling andlCPMS for determination of electrontransfer self-exchange rates between TI(IlI) and T(I). ("IV:easurement of '1'1 (111/1) Electron Self-Exchange Rates Using Enricl:ed Stable Isotope Labels and Inductively Coupled PlasmaMass Spectromet-y"; AC950285B: p. 4(04)
Oligosacc:harides by ESIMSResearchers have altempted to overcome poor ionization efficiency in ESIMS s:udies of carbohydrate stmeture by using :hromophores or fJuorophores. 1'os11if1'mi Takao and colleagues atOsaka University Clapan) report on a method that uses 4_am,nobenzoic acid 2-(dicthylamino)-etby! ester. resulting in a deIivativewith high proton affinity, which enhances ionization efficiency.The detection limL for clerivatized maltohf:xaosf' is 10 fmol, whichrepresents 2 5000-folcl improvement in over underivatized maltohexaose. ("Use of the Det-iv,"ti"inff A,ger!t 4-ArninlobenzoieAcicl2-(Dielhylarnino)ethyl Ester for Hig'h-Sensitivity Detection of Oligosacd:arides by Electrospray Ionization Mass Spectrometr/'; AC950250B; p. 4028)
Making MAUll MS better.The ion trap/reTOF device combines the storage capabilities ofthe ion trap with speed and high mass capabilities ofTOF
• DenoI9s articles that are tentativeiy scheduled tcr the November 15 issue Anaiytical Chemistry, November 1. 1995 635 A
In AC Researchl
to produce an instrument that has several potential advantagesfor MALDI MS. David M. Lubman and colleagues at The University of Michigan use a continuous-flow probe to introducepeptide solutions into an ion trap/reTOF mass spectrometerfor MALDI analysis. They demonstrate the ability of the trap tooperate efficiently at the elevated pressures required for direct liquid introduction, obtain picomole-level sensitivity, anddiscuss the conditions required to optimize the instrument.("Continuous-Flow MALDl Mass Spectrometry Using an IonTrap/Reflectron Time-of-Flight Detector"; AC950605R)
Comparing LC/MS interfaces.The main problem with LC/MS of polycyclic aromatic compounds is finding the right interface to do the job. Robert K.Boyd and colleagues at Dalhousie University (Canada), HealthCanada, and the National Research Council of Canada compare the moving belt, particle beam, and heated pneumatic nebulizer interfaces for reversed-phase LC/MS of a carbon blacksample. The advantages and disadvantages of each interface arediscussed, although the heated pneumatic nebulizer interfaceprovided the best overall performance. ("Comparison of LiquidChromatography/Mass Spectrometry Interfaces for the Analysis of Polycyclic Aromatic Compounds"; AC950616K)
Mass analysis of biomolecules at aUomolelevels.Alan G. Marshall and colleagues at Florida State Universitydescribe IT-ICR mass analysis of MALDI-generated ions fromamol amounts of several different biomolecule samples. Toachieve the higher sensitivity, they use microscope-monitoredsample deposition onto the probe tip and multiple remeasurement of ions from a single laser shot. The authors report detection limits as low as 8 amol of sample. ("Attomole BiomoleculeMass Analysis by Matrix-Assisted Laser Desorption/IonizationFourier Transform Ion Cyclon'on Resonance"; AC950615S)
Detecting reaction intermediates withESMS.Because on-line ESMS is particularly useful for identification ofunstable reaction products or short-lived intermediates, it haspotential for use in reaction monitoring. Ryuichi Arakawa andcolleagues at Osaka University (Japan) and Kagawa NutritionUniversity Oapan) use ESMS to detect photobyproducts of(polypyridinelruthenium (II) complexes. Intermediates witha monodentate ligand are detected for the first time in the electrospray mass spectra. ("Detection of Reaction Intermediates;Photosubstitution of (Polypyridine)ruthenium (II) ComplexesUsing On-Line Electrospray Mass Spectrometry"; AC9504272)
Remeasuring stored ions in a quadrupoleion trap.In the commonly used mass-selective instability mode of iontrap operation, further manipulation of the original ion packet isprecluded by ion ejection and subsequent collision with the detector surface. Douglas E. Goeringer and colleagues at OakRidge National Laboratory demonstrate multiple remeasurement of the same population of storee ions in an rf quadrupoleion trap. For a collection of C,F; ions produced via a single electron ionization event, the remeasurement efllciency during 24scans, as judged by the scan-to-scan loss in signal, was> 99%.("Ion Remeasurement in the Radio Frequency QuadrupoleIon Trap"; AC9506185)
Relating orthogonality and"",<J.~RATIIJ~,., peak capacity in 2-D
v separationsTwo-dimensional separations need a basis on which they can be evaluated andthe anaiytical performance of differentsystems compared. Zaiyou Liu and colleagues at the Centers for Disease Con-
tral and Brigham Young University describe a three-step procedure that computes correlation and peak spreading angle matrices for a set of data, calculates peak capacities in eachdimension and estimates theoretical peak capacity, and calculates practical peak capacity. Using data from a 2-D GC separation, they demonstrate the usefulness of the equations. ("Geometric Approach to Factor Analysis for the Estimation of Orthogonality and Practical Peak Capacity in Comprehensive TwoDimensional Separat'ons"; AC9412286; p. 3840)
Identifying the source of underground fuelspillsThe possible contamination of groundwater by fuels stored inleaking underground tanks or pipelines has prompted the development of methods for identifying fuel materials recoveredfrom subsUliace environments. Barry K. uvine of Clarkson University and colleagues at Tyndall Air Force Base use patternrecognition methods to classify high-speed gas chromatogramsof weathered and unweathered jet fuels. A total of 228 neat jetfuel samples representing common aviation fuels sold in theUnited States are characterized by 85-peak gas chromatograms. ("Source Identification of Underground Fuel Spills byPattern Recognition Analysis of High-Speed Gas Chromatograms"; AC950475M; p. 3846)
Atmospheric gas sampling for IC·like CEIon suppression, which is widely used in ion chromatography, hasbeen adapted to CE of small ions as suppressed conductometricCEo However, application ofthis CE method to atmospheric gasanalysis has been hindered by the lack of a sample collection device that is compatible with the small scale of the capillaries.Purnendu K. Dasgupta and Satyajit Kar ofTexas Tech University use a small wire loop with a liquid film in communication withthe capillary as the gas sampling interface to determine 1ppbS02 by suppressed conductomettic CE. ("Measurement of Gasesby a Suppressed Conductometric Capillary Electrophoresis Separation System"; AC950622G; p. 3853)
Separating latex aggregatesBecause of the importance of nonspherical particles in manyfields, it is important to better understand their sterie behavior. J.Calvin Giddings and Bhajendra N. Barman of the University ofUtah use sedimentation FFF of aggregated poly (methyl methaclYlate) latex beads to examine sterie perturbations of clusters of different mass and clusters of various shapes "ithin a fixed masscategory. They discuss the change in peak spacing as n increasesand the factors affecting the transition from normal mode tosteric mode. ("Separation of Colloidal Latex Aggregates by Cluster Mass and Shape Using Sedimentation Field-Flow Fractionation with Steric Perturbations"; AC950219+; p. 3861)
Polymer CE for chiral separationsThe presence oflinear poly (vinylpyrrolidine) in a CE electrolytesolution enhances stereoselectivity for separation of diaste-
636 A Analytical Chemistry, November 1, 1995 • Denotes articles that are tentatively scheduled for the November 15 issue
reomers in 2. racemic mixture. In addition to its hydrophobicity,the poiY:11el-'S aromatic and IT-eiectron-rich moieties may play a signitIcant role in he separation_ Andreas Rizzi and colleagues atthe University of Vienna (Austria) and the Istituto di CromatograGa del C'lR (Italy) obser,e the stereoselectivity enha~cemem effeels of these propeliies and the effects of chain length in threet!'l)es of polymer additives for CE of diastereometic derivativesof a.-arDino and a.-hydroxy adds. ("Separation ofDiaslereomers byCapillmy Zone Eiectrophoresis with Polymer Additives: Effect ofPolymer Type and Chain Length"; AC950310D; p. 3866)
Using spacers in a stationary phaseThe separation of organic bases is 2. problem for chromatogra]hers using reversed-phase LC because these bases adsorb tolnreacted silanols, leading to peak tailing. Marj ]. Wirth andcolleagles the University of Delaware use methyl spacers ina mixed horizontally polymerized stationary phase Lo reduce"ilanal <Ttivity. Baseline resolution of a mixture ofthree cyto-chrome c vaiants is used to demonstrcte the high ef-5ciency C,,/C, stationary phase. ("Use of Methyl Spac-ers 'n a Mixed Horizontally Polymerized Stationary Phase";AC9504934; p. 3879)
A quaternized PEl-zirconia stationaryphaseThe recently developed polyethyleneimine (rEI)-coated zirconia stationary phase is useful for the separation of proteins but is
unstable at extreme pHs. Peter W. Carr and Clayion McNeff ofthe University of Minnesota describe the synthesis of an acidand alkali-sLable quate:-nized PEl-coated zirconia stationaryphase for use in anion-exchange chromatography. Becausethe quarernized PEl-zirconia phase does not shrink or swell appreciably upon addition of organic 'TIodifiers, such modifierscan be used to attenuate hydrophobic interactions or to effect achange in ColulT.n selectivity. ("Synthesis and Cse of Quaternized Pclyethylenirr.ine-Coated Zirconia for High-PerformanceAnion-Exchange Chromatography"; AC950278N; p. 3886)
Measuring traces of uranium in nuclearfuel reprocessingAlthougi1 most "unburned" uranium is recovered during thenuclear fuel reprocessing procedure, trace amounts remain inthe last organic phase. Constant M. G. van den Berg and colleagues at the University of Liverpool (U.K.) and BNFL (U.K.)describe an in-hne stripping procedure for extracting U(VI)
from a mixture of tributjl phosphate and kerosene into aqueous soc!iJm sulfate with detecticn by on-line cathod'c strippingvoltammetry. Constant recoveries of ~ 50W are obtained. ("AulomatprJ Tn-Line Extraction of Uranium (VI) from RaffinateStreams with On-Line Detection by Cathodic Stripping Voltammetry": AC9S0071U; p. 3903)
Detection of sulfur-containing peptidesElectrochemical detection ofeasily oxidized and sulfur-eontainingamino acids, peptides, and proteins separated by reversed-phaseHPLC has been hindered by incompatibility between the analytesand the detector solvem requirements and detector fouling.Pulsed electrochemical detection (PED) reduces fouling at noblemetai electrocles and has been used to detect sulfur-conta'ningamino acids at a gold electrode. Cornelis O1ieman anc Jol-,annesA. M. van Riel of the Netherlwds Institute of Dairy Research evaluate oxidative PED 0: sulfur-containing amino acirl.s ar ;J Pt elec-
trode at low pH and achieve linearity over two orders of magnitude with picomole sensitivity. ("Selective Detection in RP-HPLCofTyr-, Trp-, and Sulfur-Containing Peptides by Pulsed Arnperametry at Plat!Eum"; AC950127K; p. 3911)
Amperometric detector for CE_t\.lthough satisfactory results can be obtained from off-eolumn andend-column detectors in CE, they are no: yet applicable to routine analysis. Hsnan-lung Huang and Mel-Cheng Chen of the National Sun Vat-sen University (Republic of China) demonstratean eiectrochemical cell assembly similar to the off-coiumn detec'or but used as an end-column detector. Detection limits of3.0 amol for dopamine and 5.2 amol for catechol are obtained.("An Electrochemical Cell for Errl-Colu11111 Amperomettic Detection in Capillary Electrophoresis"; AC950428U; p. 4010)
Crown ethers for optical detection ofmercury.The use of crown ethers for selective compiexation with smallions in aqueous solutim has lecl to the synthesis of numerousanalogues tailored to speeifle applications. The addition ofchromophorcs or l1uorophores as side anns on the main ring allows for optical detection of tl-,e crown ether-ion complexMarc D. Porter and co-workers at the DOE Ames Laboratory atIowa State Universi1' and Richard A. Bartsch and co-workersat Texas Tech University determine extraction constants for twosuch analogues designed for selective extraction of Hg(II)from aqueous solution. Both crown ethers exhibit ~ millionfold selectivity for Hg(II) over the next most extractable divalent cation. ("Chromogenic and Fluorogenic Crown Ether Compounds for the Selective Extraction and Determination ofHg(II)"; AC950619X)
Determining methylsulfonyl-containingmetabolites ..Methylsulfonyl-containing metabolites of PCBs and DDE havereceived little attention as environmental contaminants, in contrast to their parent compounds. Ross]. Norstrom and colleagues at Carleton University (Canada), the Canaclian WildlifeService, and Stockholm University (Sweden) report or. a GCmethod for determining PCBs, methylsulfonyl-containing metabolites of PCBs and DDE, and tris(4-chlorophenyl)methanolspiked into biological tissues. Overall mean recovery relative tothe internal standard is 103% independent of analyte, substrate, and lipid extract weights up to ~ 0.7 g. MS results arealso presented. ("An Integrated Analyiical Method for Determination of Polychlorinated Aryl Methyl Sulfone Metabolites andPolychlorinated Hydrocarbon Contaminants in Biological Matrices"; AC95046SL)
Separations on a microchip.Miniaturization of liquid phase separation devices is particularlyattractive because analytical separation performance often i:n~
proves when components decrease in size.]. M'chael Ramseyand colleagues at Oak Ridge National Laboratory report on micellar electrokinetic capillary chromatography of three neutralcoumarin dyes performed on glass microchips. Using laserinduced fluorescence detection, they find that at low appliedelectric field strengths on-chip injections yield separations withhighly reproducible peak areas and migration times. ("Microchip Separations of Neutral Species via Micellar ElectrokineticCapillary Chromatography"; AC950629Y)
,Denotes articles that are tentatively scheduled for the November 15 issue Analyticai Chemistry November"J 1995 637 A
Ii
III At 8,s',feJ (
Not moving the p_k inliquid sclntil"tion spect...10 liqyid sdntilJatiQo iDaJysi~. interactionof the sample rtltlrix aM analYte couldaffect response. Colln G. Ong and colleagues at Stanlord University investi~te ,he effects Qf pH, NaCl, and coe\l;tail~ection on the liqukl sdntilUtion spec
tra ofWU. They find that pH has a smaIld'ect and that NaClhas aI~. but oot deJ~mou.s. effect on the position of the ana·lyte peak. ("Effect of pH. NaCl. and Cocktail Sdection on muliquid SciotiIJatiQn Spectra"; AC950504T; p. 3893)
Spectroea.ctrochemical cell for ATR"FT·IRBecause of the close4o-ideal flow pattern developed with aehanntl-type electrode, Daniel A. SChenon and coneagues ate-W¢S!(I'l)~ University ~fylhe same ceI1 to rcOOethe llOlutiol'l past the electrode SUJ'fac:e IIrith attellUated tou! relleolion FT·IR spectroscopy. The Cf'1l is assessed using the reduction of 2 Mbi$ulfite in an unbuffered aQ.ueous electrolyte at pH52S. The spedJUm isdominated by negative- and poSilive..point.ing cootributions from bisulfue, dithiooite. and sulfi.te. iC~1Aow Cell for Attenuated Total Rdlection Fourier Transform Infra,red ~ocbemlst:ry"; AC9S0436A; p. 4024)
The RON, MON, pump, _net RVP of gauBased on seasonal and geographlc considerations. gasoline mustmeet stringent environmental requirements, yet still provide anacceptable level of drMngperf~. John B. Cooper and COt
leagues at Old Doolinion University and Ashland l'et.roleum desaihe the use of IT-Raman speetroseOllY and partial leastsquares regression analysis to build~1s for detenniniog theresearch octane number. motor OCUrle number, pump octanenumber. and Reid vapor pressure of208 commercial fuel blends.("[)ettmlioation of O<une Numbers and Reid Vapor Pressure ofComllltltiall'ettoleum Fuel$ Using IT·Raman Spectroscopyand Partiall.east-Sq= Regression AtWysis"; At95(4631)
AftIltyzlng solid etllt. NMR spectra.When magic angle spinning NMR samples contain a mixture ofchemically similiar components with nearly identical isotropicchcmicalshifts, analysis of the resultant Spec1lllm's line~ isoften complex. JeffM. Koons of the University of South Car0lina and Paul D. Ellis of Pacific Northwest Laboratory descn'bean ab5tnct factor analysis target transformation technique thatcan d~termine th.e ll'umbo' oJ constituents present and thecomponen\ MAS NMR spectra.~ to tbe OJoventionalleast"SCI,uares appr-oach. the new technique provides improvedprecision a.nd aCC\lracy. (",Applicability of F~tOl' Anajysis inSolid State NMR"; AC950499'T)
Dy•• for O. _nd CO.Deledion methods for O. and CO. range from rolotimetty to amperometIy, an<! advances in fiber-op(ic technology have made simultalleOus ddectioII of the two gases possible. However. no sin·gle iOO.ica(or dye systeI:n has been developed to determine bothgases along with pli. Ming FatChoi and Peter Hawldns of the University of the West of England tuX) optimize 211 aniline dye.-so!Yent solution that senses both gases iMependrotly and reversibly, based on contact charge traIisfer. iNovel Dye-Solvent SoTIUtiOllS for the Simultaneous Detection of Oxygen and CarbonDioxide"; AC9409849; p. 'JfW)ChemService
PO Sox 3106' sao lower laneWest Cl\e$ter • PA 19381
Orderyour NEW~ c. t
Pesticidel ~._~.....,.Metabolite r.·Catalog NOWI ~)..
for a tree oopy, oontact us al800-452-9994.
Produoed biemialty, the Chern Service Pestici:IeI
Metabolite Catalog cootains Ihe world's largest
selection ot pesticide standards. Included in the
ntNi expanded isting are the trst A2.LA Certified
pestiCide reference ma1eriaJs ava~abIe anywhere.All Chern Service pesticide/metabolite standards
are purity oertified and expiration dated. Eaoh
chemical is cross referenced by generic, trade and
chemical name, with metabolites listed under theirbase compound.
Convert Scanned Imagesto (x,Y) Data
wllIt
UN-SCAtHr:"~~4
138 A ~Ctwrtistry. No~ 1,1995
Discover four solutionsto your analysis problems
Low pressure prep LC
Let us show how you can put acomplete I.e system ononly about 40 x 40 em of bench or coldtlxlnl space.Fractionate your protetns by time, c:lrop CQ\lll(, oe peaksh2pc. AutOIDOIte entire~With a supcr-smanFQxr- fract100 collectoc, and soI~ diIJk:\llt scparati<>nproblall5 with optiooaI gradient programming..With our~ rangeofLC~, we aImIdyhave the right one Cor you. r\
<:irde runller "-!-.J
HPLC
Robust. n:1bNc HPLC systans gJ"ve you IOOduIarllcxibiIity at a fair price - 50 you ca.n stil get greatHPLC ~1Ie even on a tight budget. OUt PtoTeam LeeInen opOOn assures maximum b1ooompatll1ily and<Xln"QSioo rcsi5tmce. And~~. ISO50Itwate makes it easier than t:Vet 10~your data and autonwe your entire system.
dtde IU'nbtr QPrecision uid delivery
An I.5co srrtnse pump beat5 reciprocating pumps coldfor spttiaI jobs like precision reagent addition, low!low and pulsatioIHeDsitl LC, and 5Upcrcritica1 II'*'techniques. Then: an: no cbedc: Vltve$ to cause ft<>wl'IQlsc, poorp~ooat low ftow rateS, or failure atbigh VisCositie5. You'U get pul5d1tt delivery~~ opentinS ranges: 0.1ltl/mlnto 200 mllmin; 0 to 10,000 psi. r\
cifde nurrber~
Supercritical fluid extraction
Now SFE can man super fast exttaCtlon! Exdu5lve toolfree sample cartridges help make lsco sFX- the faskstand II105t productive sn systemS aV3ilable. Manual SFXsy$tems give you top throughput with their duI1 cJwn.ben and 00 Wli.tlng foe b.eat-up oe 00<Jl.d00wn betweenextrliCtion5- Our new fully autOltWod system lUIl5 24samples ovcmight. And It's all done With non-haZatdous, oon-pollutlng CO2! r\
drde tllJ11ller \E..J
Pbonetoday(800)228-42501IKo, IDe. • 1'.0. 80x S}47 •~ Nf 68SOS~(~2~1' FlX:(~l*

Copyright permission: Reprographic copying beyond that permitted by Section 107 or < 08 of the U.S, CopyrightAct IS allowed, proVided that the fee of $9.00 per article copy is paid directly to the Copyright Clearance Center
(CeG), 222 Rosewood Dr., Danvers, MA 01923, USA. A ece code printed at the bottom of the first page of anarticle indicates that ACS owns copyright or has permission to collecllhe copying fee for that article. A record of
that code should accompany payment. Direct reprint permission requests to ACS Copyright Office, PublicationsDivision, 1155 Sixteenth St.. N.W.. Washington, DC 20036,
Registered names and trademarks, etc" used in this publication, even without specific indication themof. are not
to be considered unprotected by law.
1995 SUbscription rates inclUde air delivery outside the U,S., Canada, and Mexico. Canadian subscriptions aresubject to 7% GST,
EDITOR ROYCE W. MURRAYUniversity of North Carolina
ASSOCIATE EDITORS .. Catherine C,Fenselau, University of Maryland Baltimore
William S. Hancock, HewlettJames W. Jorgenson,
North Carolina. Robert A. Osteryoung,Carolina State University, Edward S. Yeung,Iowa State University/Ames laboratory
u.s,Canada and MexicoEuropeOther countries
Members
$ 4077
123148
Nonmembers(personal)
$ 85122163193
Nonmembers(institutional)
$ 570607653678
Editorial Headquarters, research sectonDeoartment of ChemistryVelable and Kenan Laboratories
Nor:h CarolinaChapel NC 27599-3290Phone 919-9622541
919-9622542
E-l1ail: analyt. [email protected]
Editorial Headquarters, A-page section
1155 Sixteenth 5l.. N.W
Washington, DC 20036Phone: 202-872·4570Fax 202-872-4574E·mail: [email protected]
Managing Editor: Mary Warner
Associate Editors: Alan R. Newman FeliciaWach
Editorial Assistant: Deborah Noble
Contributing Editor: Marcia Vogel
Head Graphics and Production' Leroy L
Corcoran
DIvision Art Director' Alan Kahan
Art Director: Michele Telschow
Manager, Copy Editing' Elizabeth Wood
Production Editor: John W, Laine
Eiectronic COfTipos/tion: Wanda R Gordon
Journals Dept., Columbus, Ohio
Editorial Office Manager: Mary E. Scanlan
Journals Editing Manager: Kathleen E.
DulfyAssociate Editor: Lorraine Gibb
Assistant Editor' Stephanie L Mallon
Advisory Board: Phyllis Brown, Karl
Cammann, Brian Chall Bruce ChaseJoseph G, Gordon. David M
Haa!and Peter Kissinger
E, Maciel. Unda B. McGown. Scott
Milos v. Novotny. JeannePemberton, J. Michael Ramsey, James A
Yergey Ex Officio: Henry Blount. III
A-page Advisory Panel: F-ank V. BrightThprese M, Cctton. C. EngstromCurtis Marcott, P McNally
JDnathan V Thomas Tiernan.Vicki Wysocki. Robert D. Voyksner
PUblications Division
Director Robert H. Marks
Director Publishing Operar/ons:Anthony
Director. Journal PUblishing Opera!ions.Charles R. Bertsch
Head. Publieaf/ans Marketing' David
Schulbaum
Members may share/donate their personal subscriptions wilhlto libraries and the like but only after 5 years from
publication.
Nonmember rates in Japan: R.ates above do not apply to nonmember subscribers in Japan, who must enterorders with Maruzen Company Ltd., 3-10. NihQnbashi 2-chome, Chuo-ku. Tokyo 103, JapiOm. Tol:
For mUlti-year and other rates, call toll free 800-227 -5558 in the U.S. and Canada; in the Washington. DC,metropolitan area and outside the U.S., call 202-872-4363: fax 202-872-4615.
Single issues, current year. $24.00 except review issue, $50.00, and LabGuide, $50.00: back issues and
volumes and microform editions available by single volume or back issue collection. For information or to order.call the number listed for subscription orders; or write the Microform & Back Issues Office at the Washingtonaddress.
Subscription orders by phone may be charged to VISA MasterCard, or American Express. Cailtoll free800-333-9511 in the continental U.S.; in the Washington, DC, metropolitan area and outside the continental U.S.call 202-872-8065. Mail orders for new and renewal subscrptions should be sent with payment to AmericanChemical SOCiety. Department L-0011, Columbus, OH 43268-0011.
Changes of address must include both old and new addresses with ZIP code and a recent mailing jabeL Send all
address changes to the ACS Columbus address. Please allow 6 weeks tor change to become effective. Claims for
missing issues will not be allowed if loss was due to failure of notice of change of address to be received in thetime specified: if claim is dated (a) North America-more than 90 days beyond issue date, (b) all other foreignmcre than 180 days beyond issue date. Hard copy claims are handled at the ACS Columbus address.
Instructions for authors of AC Research and guidelines for the Instrumentation, Report. Analytical Approach, andAle Interface features are published in the .Jan_ 1 issue. p. 229, or can be obtained from our e-mail re'lector'[email protected]'· using the keyword phrases "ac research" or "ac apguide," respectivey. Please consult theseinstructions prior to submitting a manuscript for consideration for publication.
Manuscripts for pUblication in AC Research (4 copies of lext and illustrative material) should be submitted to theEditor at the University of North Carolina address. Please ;orm' !hisdo:::ument appears on p. 235 of the Jan. 1 Issue. Manuscripts for publication in
submitted to the Washington editorial staff,
Supporting information is noted in the table of contents with a -. It is available aspages and $1,50 per page for additional pages, plus $2.00 for foreign postage) ($12,00, plus
$1.00 for foreign postage). Canadian residents should add 7% GST. See supporting information notice al the endof journal article for number of pages, Orders must give complete title of article, names of authors, journal, issue
date, and page numbers. Prepayment is required and prices are subject to change. In 1995, electronic supportinginformation is available to currerlt journal subscribers via the Internet using either gopher or World Wide Web
protocols. Most often, the material is available as PDF files. which may be viewed using Adobe's Acrobat Reader, a
program that is freely available on the Internet However, some articles lTay include computer programs. PostScript
files, word-processing files, experimental data in a standard format (e.g., crystallographic parameters in CIFformat), etc. In nrder to downlcad the supplementary material files, users will neec to subscribernumber, which can be found on the mailing label. Detailed instructions fo' using this seNice on the
jnternet. With gcpher, connect to pubs.acs.org, go to the "ACS Publications" selection, then to the "SupportingInlormation" selection. Read the README fi'e in this directory for detailed instructions. When using a WWW client(e,g., Mosaic, Netscape), conrecl to the URL ''http://pubs.acs.orgl'' and select the Info. for Journals'link. For further information on electronic access, send electronic mail to or phone (202)872-4434. For information on microforms. contact Microforms & Back Issues at the ACS Washington address or
phone (202) 872-4554. Suppcrting information, except structure factors, also appears in the microfiche edition.
The American Chemical Society and its editors assume no responsibility for the statements and opinions advancedby contributors. Views expressed in the editorials are those of the editors and do not necessarily represent theofficial position of the American Chemical Society
Journals Department, American Chemical Society, 2540 Olentangy River Road, P.O. Box 3330, Columbus. OH43210 (614-447-3600, Ext. 3-71; TELEX 6842086; Fax 614-447-3745)
Member & Subscriber Services: American Chemical Society, P.O. Box 3337, Columbus, OH 43210(614-447 -3776; 800-333-9511)
Advertising Management: Centcom, Ltd., 1599 Post Rd. East, P.O. Box 231, Westport, CT 06881(203-256-8211; fax 203-256-8175)
640 A Analytical Chemistry, November 1. 1995

Ed i lor i a /#.1 _
Off-Shore Authors AreWelcome
A few months ago an article in a popular science magazine made the claim that authorsliving outside the United States have special
difficulty publishing their science in U.S. journals. Theproportion of articles published in American Chen:icalSociety journals by non-U.S. scholars suggests thatthis premise is incOlTect. In 1989, 36% and, in 1994, 45%of the papers published in ACS journals were by nonresident authors. (Here, nonresident author refers to acorrespondi"g (i.e., senior) author at an institutioncutside the United States; the above percentages wouldbe much larger if the contributions of foreign students working at U.S. institutions were i"c1uded. ) ForAnalytical Chemistry, the comparable numbers weresmaller but still considerable; 26% and 37% of the papers published in 1989 and 1994, respectively, were bynonresident authors. Tl-e proportion of foreign seniorauthorship is increasing; in 1994, Analytical Chemistrypapers included research from 32 countries, signifyinga broad geographical distribution of high-quality measuremenl science. This means to me that AnalyticalChemist,,,! is pub:ishing an increasing worldwide porlion oi excellent analytical chemistry research. That'sgood.
Publication in Analytical Chemistry, a:ld other ACSjournals, is substantially guided by peer-review evalua
tions of submitted research manuscripts. My percep
tion of reviewers is that there are no "favorite" countries. "Cutting-edge" analytical chemistry has no nationality. Revlewers are often non-U.S. residents. Oureclitorial responsihility is to identify and disseminate toour readership the most significant advances in chern-
ical measurement science. For those fine scholars and
potential authors a1 non-U.S. institutions who suspect
that Analytical Chemistry has a national bias, I wouldlike to persuade you that is not the case.
It is important to realize that a potential author, anywhere, who is unfamiliar with a journal can best cometo understand its requirements and standards with re
gard to quality of experiments, novelty oi concepts andtheory, and significance of the applications only hy acareful reading of articles published in the journal, aswell as its published instructions to authors. A potentialauthor can he handicapped by lack oi equipment orproper facilities, bul in the above respect can be especially handicapped by a poor library resource. I examine each paper submitter! to Analytical Chemistry before assigning it to an Associate Editor (or myself) forpeer evaluation. Several times a month, I see paperssubmitted by non-U.S. authors that clearly reflect anincomplete and out-of-date awareness of the current literature and state of intellectual development of thesubject at hand. To those authors I can only say tryharder to find and reacl copies orAna!ytical Chemistryand other sources of good chemistry, and show this editorial to the local authorities who, if they wish to support analytical chemistry research, shoule' provide themeans for better access 1u the chemicallilerature.
Analytical Chemistry November I, 1995 641 A
Analytical currents,,.'------------
Synopses of significant analyticalarticles from other publications
DetectingDNA strandbreaksduringapoptosisApoplosis, a physiological proc('s~
for control anelnaintt'!lrlllCe of ti:-;suc hOlllCIJslasis, is ill
creasinp:'y heing recognizee] as a factor indis('as("' proress(\s. During[)NA fr"lgm(:]]ls :1rs1 illt(: 300- soukb and ultimately into inter-nuclcosol1lal fr<lg"lllE':ll's of ISO bp by enclogenOl!S (,lJ(I()!lucl('a~;(' activit\'. Gregory'
J. Gore;.; and col]cague's at tl1\" l'vlayoClinic anc] Foundatioll have dt'vC-"]oj)ed aCjuiJnlitaLivc assay' for determining frag
Ilwntativl in apoj)lO:-is by eIlf:ylG-l.licaIl:ylabeling the :r-()Jl enels oftht, D\iA with a11110n'S\'ult didt'(JXYllUClt'otidc.
B(~l~aus(' unly Olle bbt'lc'd di{L'oxynu-(';l!l be added per :Y-U!-1 (-'nel of tIll'
I!NA, (hi' llcol"esct':1ce intellsity is dir('dly propot1iollillto the number of DNAstrand I)I"C<1I\::. researchers firs1 es-t,-\bJishctltbl' ~t'Jlsitivity of the nwthco using isoLtkd l'illf thm",s D\iA treakd
\\'ith ':hv vncJonllcle;:ise DNase J and obSc'r'v\'d t'xcdlt'nt correlation betwecnthe re~ulis obtained by l1uorophoJT cndlahclinJ!: ('mel lhos;~' obtained using an isotopic approach. 'rIley' then used the new assay to Cjuantitate DNA stnmcl breaks inIluclei isolatl'd (rom lwpatocytes undergoin,V; apopi Ilsis llsing tluoresccllt digitizedJl1icr(lscop~V, 11mv l'yimllclry', and l1uoronw-tn', r~'sE-'(jn:hers believe tllat the as-S,',}'" will bt' ust'ful in studying th(-' l1lolcculur rncchmlis1ll5lcacling tl) DNA c!eavagtduring apoptosis. (Anal. i1iof'f'fln. 1995.229. 22,H5)
Magic angle spinning ofphotosynthetic reactioncentersThe pholDsylllhl'lic \'caction center of[(/wdobacicr sphacroidfs E2() i~ a translllt'lllhralll:' pro!('in complex that consit')tsof !hn-'(' po]ypt'ptide chail:s and n:ne <.'0
factors: 1\\0 ubiquinoTles-l(), four -JacleriochJorop]l> lIs, 1\v() bactt'rii)pheophytills,and 01)(' j]1)l\lWlllC' Fc~, Ur:on iJ1ulllinalion
of the protein comp',ex, Elll elcctroll j:;
tnlnsportc(! from a ba<:tcriochlorophy'llpair aT the pcriplasmic side of thl" membralle 10 the primary quinone Q,.\, Becausequinones gl>l1f'rally' undcrgo lw()-"l<:"jJ n"ductioll to tIlt' cnrrc,:,pondir.g qLlino!cs,
ral11(--'r than the one-skp reaction to thesemiquinone slale observed here. it hasbecn postul,neclthal specific proreilJcdador interactiolls arc responsible forthe 'Jropcrties. I-U.M. de Grontand at Leidcn Llniv"r"t,· (TheNelherlards) have tlSecl L;C magic' .:mglt,spinning NMR to l'l1arackrize Ihe~(' protein-O ..\ intC'n::clion~
!<(--'action centers dispersed ill LDAOdetergent \\'crt' studied at lenlJWrilturt'~
bl"1 \vl'erJ ISO and 240 K. whcn-'as reactiollcenters precipitated by removal of thl
dctc-"-rg'cnt were studied a1 ambient temperature and at 1Cmperaturt's as low as 180K The NMR elata revl'al an apolar ()\and sho\\/ no t'vidc!1<.T fOI- cJccl)"ostali([)olariJ.:ation of the quinoid rillg by a P<111 il'-
strong int('rac~ion of lhtrIw 'Suggest that tile
detailed charactcrizatioL of the redoxproce-ss requires an in-de'ptll :~Jlldy usingbolh l-ll ilnel2-ll NMR li'chniqul's <lttlitferent temperalures (Hiochtmistry 1995.34, l0229-3(j)
MS tells which end is up forproteinsIVIS/iVIS methods for protein ~('qll('ncin,Q'
can eletermine peptide fraglTwut onkJalong with amino 2cicl S(-'fj1H'J1ces for individual fragmellts so that large peptic:es
and prokins don't have to be ckaw>d aoelmapped during sample preparation. How~
ever, being able to t<:,llthe NtermillU;-;frol1l the (-tcrmirms of each peptide orfragnwnt ion i~ cssl'Il1ial and rt'Cjuin's adistinction between tilt" c(ln1plemf'l1ta1)'and y-iotls :"orJ1wd during df'i1vage of th('amide bonds. Peptide and small proteinstu~lil's have shown b-ions to be less stabk than y-ions. Fn'd W_ McLafferty ant'co-workers ;-!t Comell University llsl'clESI-FrMS to extenclthe'se studies to a 2~L
kDa protein.Tiley ""'d both Jl< lllllllip]lOtOIJ (1R
NIP!)} ilnd llOzzlch;kimnHT dissociation
to iragment cal-bonk anhYllrase and mea-~lJ red ["elative abundances of com-plcmentary b- anel y-ion pairs against irra~
diatioll time' or potential difference, respectively. to determine ion stabilities. ForDoth methods. b-ions weft' almost unhrCfsally less slabIf' than y-ions for all primarycomplel11ental" pairs studied; with IRMI'IJ. 1Ii1' abundance fur b-ions began todeereas(' ;jO 111S before that of the y-ions. Th0 researchers propose thatamide bond l']eavaJ~"(' involves charge migration from the C-terminus to the N-terminus <Inc] increases thE' charge densityof b-ions at the expense of yions. (Rapid
COII/JIIUII Mass Spcrlrmn. 1995. 87]76)
Opioid peptides bypreparative and analyticalCZEi\.1though n'sean'h bas shed some-light onthe IlltTh<JIlisms cf opioid peptidE'S inlllaI1lJllal~, lll;lny of their clinical and phar
metrological aspects are not yet well UI1
elehtoucl. Accuratciy elC'lermining traceamounts of llwse compounds in biologicaltissm's is therefore critical to the understanding of tlwir physiological (-'jTccts andpossible t]wrapeutic value. Dominic M.])e'idcrio and colleaglles al the Universityof T(,Jlnc'~st'f'have used preparative andanalytic,Ji C7F followed by liquid SIMS ton:so1vc;] \.~omplE'x mixture of opioid pel}ticles IBE], methionine en-
[MEl. and leucine enkephalin[I.E]) ('xtr~lct('cl from bovine pituitary.
After precipitation and solid-phase c'xIraction. the pc'ptide-enriched bovine pituitary homogenate was subjected to pre·Jarative CZE pH 2.5 and 3.5, "!lei frac:.ion:' Wf'j"(' rollectc:d within defined timewindows Jor BE. ME. anel I.E. PreparativeCZE was ;hen performed at pH 2.5 fortractions mIke-red at pH 5.5. ISIMS of the"-lJ CZE fral'lion revealed the appropriak protonatc'd moJecular ion of LE at an!IIlz of 551l.J. The authors note thet thiswork shows the usefulness of preparativeand analytica] eZE, in combination withIvIS, for analyzing COJl1P:,f'X biological tis~ue mixtures. Vinal. Riochef)l. 1995,229,IKK-~)7)
Analytical Cheml5tlj. November 1. 1995 643 A
Analytical Currents {
Sol-gelderivedenzymebiosensorsAmperonlc\tric biosensors containactiv<:' enlynws im-mobilized within,
or attached to. a supporting matrix. Although many' methods of Tnass-proclucinglow-cost. disposable biosensors have])("('11 devclopt'cl, only two l~iI}{-'S of rt'IWW
able bioscnsors, carbon paste and carbonepoxy composite material sensors, havebeen successfully implemented. O. Levand!. Pankratov of Hlt' l-kbrt'w Universityof krusakm (Israel) hav(' described anew class of renewable-surface allljJcrometric biosel1sors based on the ncwly developed field of sol-gel biucframics.
The sol-gl'1 biosensors consist of enzymes immobilized in organically moclilieclsilica-carbon matric{~s.Thl' silka backbone provides rigidity, the organically modified surfact' guarantees that vvakr will nutpelletrate into the bulk of the (~1l'ctrode, thepercolating carbon j)mvder provides elec~
tric conductivity and shield, the enzymcfrom the hostile environment cluling thesol-gelmolcling proc<::'~s, and the t'I1CapSll
lated enzyme provides biocatalysis andspecificity'. The researchers show that anamperol1wtric sol-goel Rlucost' biosensorhas a linear rang'e of 0-lS mM, \-vhill coincides with th" rcquired detection f<Ulge formedical applications, and a d:v"lla111ic rangeof up to 25 mM. (f Electmrwal. Chem.1995,393,3,>-41)
Clay complexes in oxygensensorsI\tlany attempts have been madC' to designrnetalloporphYTin-moclified electrode systems based on oxygen reduction of thetwo-electron transfer mechanism for usc asoxygen sensors at ambient tell1jwratUl"eand atmospheric pressure, including lixingmetalloporphyrins using polymer suppolis. polymer ligands, and self-polYllll'ri:;.ation. Isao Sekillf' and colleagues at the Science University of Tokyo and Osaka SaIlsoKogyo Co. Ltd. (japan) comp!exc<! cobaltporphyrin~ with monmorilonite, vermiculite, and acid-washed kaolin clays in 2!l effort to modify pyrolytic ,graphite elec:rodesfor usc as oxygen sensors.
In lhe monlllorilonite and vermiculitesystems. the cobalt-porphyrins wert' incorporated into the interlayc'red regions.and in the acid-washed kaolin, tlwy wl.;'rt'adsorbed onto the surface. To improvc' thestability and increase conductance, tht
researchers also added poly(vinyl akohol)and poly (2-vinylpyridine) as polymer supports and ,ilver colloid as a mediator. Theyfound that the peak current density increased linearly with the concentr<.tion ofoxygen, the response was reversible andrapid, and the electrodt's llsing monlllOrilonite and vermiculite were stable formore than 6 h. The most effective electrodes were those modified with Co[:i,lO.15,20- tetrakis (N-methyl-4 -pyr:dy l)purphyrin[ and Co[:i,1II1:;,20-tetraki,14'(trimethylammonio) plwnyII-porphyrin [vermiculite-silver colloid-poly (viny1aleohol)-poly(2-vinylpyriditll'l. (j. Elretrochem. Soc. 1995.142,2612-17)
Isomerization flips a singleion channelProtein ion channels in cdIl1lembran{'~
arC' difficult to characterize because theysii in a lipid environment and their adioninvolves small conformational changes. Artificial ion channel-forming moleculessteh as gramicidin are easier to ~ynthe
size and study. G. Andrew Woolley andD:)Ininic C. J. Jaikaran of the University ofToronto (Canada) used single-channelClllTtHt measurement to study he cistrans isomerization of a carbamate bondin gramicidin-ethylenediamine moleculesincorporated into a lipid bilayer
Alipid bilaver film was fonned acrOSSthe hole in a pipet tip containing electrodesand filled and surrounded with electrolyle in a cell. Gramicidin-t'ihylenedial11illewas added ancl, as dimers of the peptide incorporated into the bilayer and formed ionchannels, channel events v..'ere ddl'decl asdiscrete steps for measurements taken overseveral hours at It'mperatul"es from:2 1\)3; ;'l'. Bond configurations for the carbamate viere assigned based on molecularmodeling of the channel and NMR ::studiPSwith small molecules. As the tCl11peratureincreased, the lifetimes of the individual cisand trans stalC's for the carbamate bond decreast'{l. The calculated activation paranlt't('rs agreed with those found for simple carbamates using dynamic NMH :-;pectrosc·O])Y· I}. Phys. Olein 1995,99.133,)2-55)
Single-trapelectrode forFT·ICRMSIn H-ICR1VlS, theOpt'n-cell configuradOll is uSl-"d 10 in-crease external ioninjection dticicllCY.
inprove gas conductance, eliminate tht'formation and charging of dielectric stlr-
faces. and eliminate ion trajectory perturbations. David A. Laude and Victor fI.Vartanian of the University of TexasAustin rf'])(Jrtcd on an opcn-geoIl1etntrapped ion cell with a single- annular trapelectrode located at thc c('nter of thc'excitation and detection re.u:ion t11at lTC
ates a trapping \vell b~" applying ;.;laticpotential of a polarity that is ()PPl),,;itl~ thecharge of the ion to be trapped.
The cen uses a combination o( appliedelectric fields to eliminate Ill(' axial ejeclion of ions and gentTatc;s a recluct'd radialelectric field throughDut a signinl',ml portion of the trapping' \/oluI1w, A ll1a~s resolving power of 1A·;) x 10/; wa~ achiC"vt'd forbenzent", the highesl amun,C; ntl cellsevaluated. Because tlwre is no electrostatic barrier, ions can be externally generated and injected into the cC':J \\·'ilhouldiscrimination on the basis of translational energy. HO\vever. continuous ion injt"clioll into the cell can Ul'l'Ur siIlllll1a
lleously. This success of lhis opcn-geometry cell configuration dC!l10nstnHl'd thaLthrough the appropriate selection of electrodes and location, cell performance l'anbe improved without increasing its complexity. U Am. Soc. Mass Spcrtrum.1995,6, KI2-2ll
Laser-desorption FT-MSreveals new fulvic acidmolecular weightsFulvic acid. heterogeneous mixture uforganic substances found in suils andpeats, plays a key role in many geochemical processes. However. fulvic ,H,:icfs molecular I,l;Tight distributioll has 11(-'Ver bt'ellunambiguously dl'lt'l"mincd. James A.Rice and colleagw:s at SDuth Dakota StateUniversity and the :)[vl Corporation haven-:,pOlied the molecular weight of livC" fulvic acid ~alllp1es using la::;,cT-c:\':",orpri()llH-MS.
The values were compared to lllO!cCll
lar weights determined by gel fll1ratit)!lchromatography or vapor prt':isure osmonwtrv. The authors foulld th,," LDFT-ivIS consis1cntly yie](lec1l1umi)vr-averaged molecular \veights S(Ykl l()v'i(T tharthe other !l1clllOds. To l'llsurc t11at theMS results arc correct, th(.>y used 100r laser pO\ver ((1.05 J) to prevellt formation orfragments and demonstrated that thetechnique could determine !l1ok'l'ules inthe higher mass rangc. The auth()rs. (oncluck that the LD-FT-I'vIS values are currect and lhat other methods Ilwasureonly" a small proportion oftlw substancesin fulvic acid. (Enviroll, Sri. Techno{1995. 29. 2404-liC)
644 A Analytical Chemistry. November 1 1995
Borane salts byelectrospray MSAlthough analysis of biochemical compounds by electrospray MS has received agreat deal of attention, analysis of inorganic compounds has received little. Re·cently. Cornelis E.e.A. Hop and colleagues at the University of WisconsinMadison demonstrated that clectrosprayMS in the ion mode can be usedto identify salts. which cannot beanalyzed by other conventional :vIS techniques such as electron impact ionization,
chemical ionization. and liquid secondcry ion J\1S. In a continuation of their earlier work, these authors have reported theprdirninary results of an examination of
liMe) ,N] IB,JU and Cs[B"H~J by electro~pray I'vIS in the positive ion mode andshowed that the solvent is a critical parameter in these experiments.
They dissolved the borane s~:lts in ace...lCmitrilc. methanol. water, and tetrahydrofurac and found that the acetonitrile solutions provided EI mass spectra that werecharacteristic of the borane and that virtually all signals corresponded to cationicduster ions of the general formulaJ[cation"'·]x!anion"-I ,I 'mx-"y) , . In contrast,be methanol solutions produced onlyB(OCH::>:; cluster ions. The researchersnote that this was the first demonstrationof an electrochemical reaction between ananalyte and solvent in e'ectrospray MSand concluded that, under certain conditions electrospray is not a mild ionization1lldhod. (j. Am. Soc. Mass Spectrom.1995. 6. 86C-651
Electron affinities of PAHsby the kinetic methodElectron affinity is aD important thennochelric(l] properlY, and several methodsfor determining value'S cxe available. Thekinetic method is an approximate methodbased on the rates of competitive dissociation of nlas%elected cluster ions. Guodong Chen and R. Graham Cooks of Purcbe University have used the kineticmethod to determine the electron affinitiesof several polycyclic aromatic hydrocarbons. Electron-bound dimers of PAHs aregenerated in the ion source and fragmented cJlnpetitively to yield monomericmolecular radical anions, and the ratio oft1:e resulting ion abundances reflects dif[('renee's in electron aftlnities
To collect the data. the researchersused electron attachment desorptionchemical ionization MS and triple-quadnJpole tandem \-IS. They found that alkylsubstituted PAHs have lower electron ai-
linities than unsubstimted PAB" in agreement with other stud:es. VaJ ues forhalogenated PABs are also reported. Onekey finding is that chemically similarspecies must be used for generating theeh'tron-bound dimers. U Mass Spectrom.1995,30, llf;7-73)
Kinetict"tJ,~UTIIJJ:r studies in a
nanolitervolumeWith the growingintnest in determining kinetic parameters in small-
volume- biochemical reac1ioIIS or singlecells, there is a need for ana1)1ical methods that monitor multiple chemical spe·cies in realtime in these nanoliter-volume,complex matrices. Spectroscopic methods and miniaturized electrochcmical sell
sors meet some of these requirements,but they fail to measure a number of biochemically important compounds. 1'iMing Liu and Jonathan V. Sweedler ofthe University of Illinois at UrbanaChampaign have developed an electrophoretic method for these lypes of measurements nsing a thin rectangularseparation channel constl1leted from standard microscope slides.
Samples are inu'oduced onto the separation channel by a capillary sanlpler. Movenwnt of this sampling capilliuy is carefullyconu-olled along the separation channel'swidth and provides a time axis for the reaction. Anaiytes were separated as they migrated along lhe channel's length and detected in this study by fluorescence. 'TIle authors demonstrated th" new technIque hyfollowing the tirst-order kinetics of a reaction taking place in a 20o-nL solution. andfound that this new system yielded> 10.000theoretical plates and offered time resolution as fast as 100 ms. (j Am. ehem. Soc.1995,117.8871-72)
Studying the surfacepolarity of silicaSilica and silica-based materials are themost important stationary phases in I.eand, although the surface properties of silica have been studied extensively. therean' still many controversies and ambiguities about the origin of the surface acidity, the molecular interactions betwt't'll solutes and the silica surface, and the SUf
face polarity of silica. Sarah C. l\utan andZengiao Li of Virginia Commonwealth Ulliversity havt' used the solvatochromicmethod to quantify the dipolarity-polarj;.s-
ability, hyclrogen-bonciing acidity, and hydrogen-bonding basicity of the surfaceof silica under normal-phase chromatographic conditions.
The r('se;:m~hersobtained (~Iectrollic
absorption spectra Llshg a 110w cell with al-Dm path1cngth packed with the Slil
tionary phasr of interest. These spectrawere then Llsed in conjunction with solution-phase dye spectra and rneasurenWllbofth(' retention of dyes on the stationaryphase to calculate the vm-ious solvatochromic parameters. Rutan and 1.i fOUI:d ticatin /l-hexaIw-rhloroform mixtures, the surface dipolarity-polarizabilily and hydrogen-bonding acidity of silica are high andnot afi'ccred by the composition of the mixture. The hydrogen-bonding basicity ojsilica is much lowt'r ancI decreases as Jwconcentration of c111oroforl1l increases inthe mobik phase. l;lllal. Chim. Acta1995.312. 127<19)
Postcapillaryelectrophoresis columnderivatizationBecause ofib. sensitivity, laser-induced tluorescence has become a popular detection method for biological analytes separated by capillary electrophoresis.However, many amJytes ofintt'n"'st UO notfluoresce and herefore require derivatization to be detected by UF. S. Douglass Gilman and Andrew G. Ewing of Penn StateUniversity developed a postcolumn derivatization technique for CE using naphtnalene-2.3-dicarboxaldehyde (NDA) and2-mercaptoethanol to label anal)1es.
Although the NDA/2-mercaplot'thanolreaction products art' ullstable, they formquickly and are very fluOreSCE'IlL CompOlinds marked with \IDA were excitedwith a He-Cd laser (442 nm Ene). Thepostcolumn approach avoided sfvcral problems of pr('column methods including dilution of low-volume sanplcs. labeling Illultiple specie, in the U1J'eparatecl mixture.and changes in the de-rivatization reactiondue to the matrix. The authors demonstrated "heir kchniqne by detecting amolamounts of glycine and transferrin. Theyalso used the postcolUIYJl method for L1Fdetection ofhol11ogefmk samples of a ~mal1
brain and 1he ,.;epan1tion of components in
a single human elytnrocy1e. (Anal. MethodsInstrum. 1995.2, J?,3--41)
Ionic polymers as micellarmediaMicellar electrokinetic chromatography(MEKC) has limited separation Cil(;abili:ies for strongly' hydrophobit· C0111j)()lllld:-.,
Analytical Chemistry. November 1, 1995 645 A

fDA rek.indles symposiumon applied MS
• Findeis Award
New DAC officers
649

Rep 0 r t ,,.1 _
Putting Oppositesn the early days of on-line LC/MS,Arpino likened the union of these twoinstruments to the unlikely mar-
riage of a bird and a fish: "Many believethis coupling is even more difficult toachieve than the love-match ... betweentwo creatures that are at ease in their ownenvironments but are not at home inboth" (1). At first consideration, this combination of high-pressure and vacuumtechniques does seem preposterous. Removing a molecule from its high-pressuresolvent, transporting it preferentiallyover vaporized solvent to a partial vacuum, and imparting a charge on the analyte does seem a challenging feat However, great progress was made andLC/MS applications have become routine.
But what if the analyte were dissolvedin a fluid that, at high pressure, solvatedlike a traditional liquid but transformed toan easily removed gas when the pressure dropped, leaving the analyte free to"fly like a bird"? TIlis was the promise offered by supercritical fluid chromatography (SFC) /MS when research in thearea began in the late 1960s (2-5). Admittedly, the analogy should not be carriedtoo far. Nevertheless, the commonly usedmobile phases in SFC/MS, such as CO2,
are much more easily pumped from a highto moderate vacuum system than are
J. David PinkstonThomas L. ChesterThe Procter & Gamble Company
The properchromatographic and
mass spectrometriccrunCI?S can make the
difference betweensuccess and failure
common LC mobile phases. Althoughmodern instrumentation provides nearlyroutine LC/MS, SFC/MS still offers distinct advantages, some chromatographic,some mass spectrometric.
For example, the supercritical fluid mobile phase provides liquid-like interactionswith solutes so that species with volatilities too low for GC can be eluted in SFC(6) In addition, because diffusion coefficients are generally higher in supercriticalfluids than in liquids, separations of rela
tively nonpolar species can be perrormedmarc quickly in packed-column SFC thanin LC (7). Similarly, because viscositiesof supercritical fluids are lower than thoseof common solvents, the pressure droprequired to produce mobile-phase flow islower, and therefore longer packed columns can be used in SFC than in LC(with correspondingly higher total plate
counts [8]). In the MS realm, the effluentfrom open-tubular SFC columns can beintroduced directly into electron ioniza-
tion (E1) or chemical ionization (CD ionsources with a very simple interrace. EIand CI have been studied for years and offer great versatility in characterizingunknown mixtures.
Despite these advantages, there are relatively few practitioners of SFC/MS, although the range of potential applications
warrants greater interest, particularly inindustries such as consumer products, fossil fuels, food, and pbarmaceuticals. Theproper chromatographic and mass spectrometric choices made by the analystcan make the difference between successand failure.
SFC guidelinesFactors that must be considered for a successful SFC/MS marriage include thetypes of analytes, injection method, andhardware. Most of our experience hasinvolved using open-tubular SFC combined with the direct fluid introduction(DFI) interface on a triple quadrupolemass spectrometer with an m/z range of
4000 Da per unit charge. Packed-columnSFC/MS is possible with this interface andinstrument but requires additional pumping or flow splitting to accommodate thelarger mobile-phase mass flow rate, especially with a traditionaI4.6-mm-i.d. packed
column.Analytes. Open-tubular SFC with CO2
mobile phase works best for low-tomedium-polarity solutes. Analytes that aremore polar can be eluted using CO, modified with a polar solvent, or ti1ey can often
650 A Analytical Chemistry, November 1, 1995 0003-2700/95/0367 -650A/$09.0010© 1995 American Chemical Society

be cIeriv;::tized and then separated using
pure CO,. The disadvantage althis approach not the derivatization but themass of ~he ~lerivatives-those deriva-
tives are dOlble the mass of the origi-
nat solute effectively halve the solute upper mass limit from the MS perspective.
Nonetheless, this approach is very effective. and the added moiejes may also aid
and/or stll1cture elucidation.Becarse SFC can be performed at low
temperdlJres. so~utes too labile f:.>r GC can
b2 separned. A160ugh be nominal ~em
perature's at the tip of he interface and
within the ion source are usually higher
than :n chromatographic oven, the ac-
tli<:l! tel1~peratures experienced by the an-
a]ytes mllch lower because of Jou]e-Thompson cooiing. In addition, be ana
lytes experience these temperatures foronly ~, bri:::J rr:oment. Thus, any observed
degradation usually occurs in the chro
matographic column rather than in the interface or mass spectrometer
Injection. Injections of up to ~ 10)::"are usually not difficult with packedcolumn SfC. Direct il~ection in a slyle essentially identical to that used in LC usu
ally works well, even on microbore packedcolumns, as long as the analyst remembers that the injection solvent Is usuallystronger than the mobile phase. Injectionconditions must be mild enough that so]utes will be initially retained on the sta
tionary phase in the presence of injection
solvent modifier. In some cases. the addition of well-swept volume between ti,einjector and the column may improve
the peak sl1apes by providing a meansdiluting the injection solvent with mobile
phase, weakening the binary mixture, aLd
improving the solute focusing. However,
time lTIus't be allowed far transpoli of the
solute through this extra volume
Because the effects of sample inhomogeneity are greatly exaggerated by sub
microliter injection volumes, the solventmust completely dissolve tie sample, andthe transport behavior of the solvent in
the mobile ph(lse must be understood.
This canno" be neglected or underestimated in open-lubuiar SFC. Solvents thatare miscible in all proportions with liquld
CO" are oHen chosen, and it is en-oneously assumed that they stay mixed on
transport to the oven. This is not necessar
i1y the case, depending on the rrosentemperature and pressure.
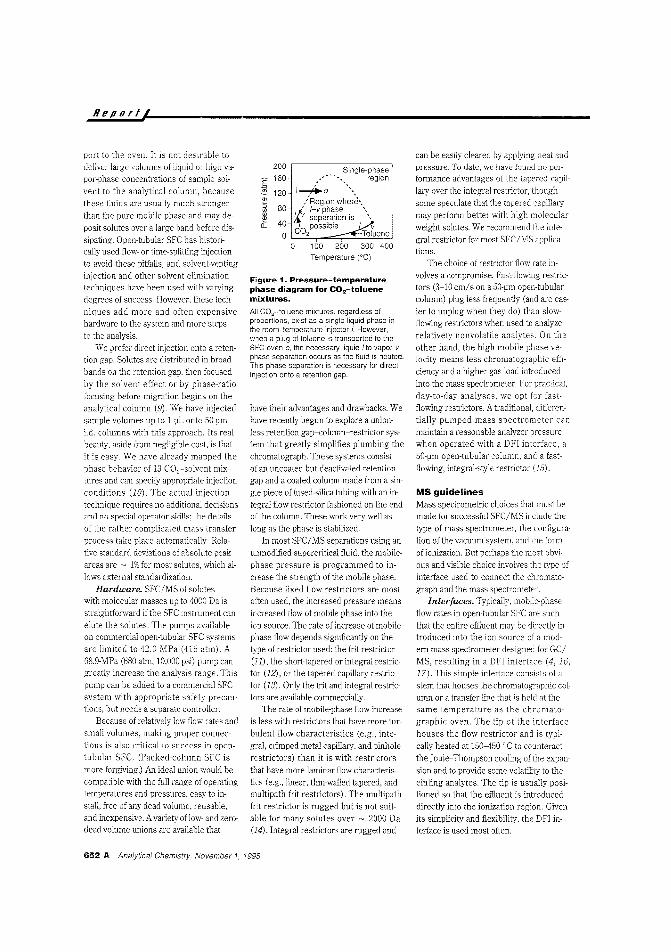
?igurc is a pressure-temperature
phase diagram that shows how binary mix
tures GIll exiSt in a single phase in the injector (at room temperature) and subse
quently split into NO ph<1ses upon trans-
Anaiytical Chemistry. November 1. 1995 651 A.
Reportl
port to the oven. It is not desirable todeliver large volumes of liquid or high vapor-phase concentrations of sample solvent to the analytical column, becausethese fluids are usually much strongerthan the pure mobile phase and may de
posit solutes over a large band before dissipating. Open-tubular SFC has historically used flow- or time-splitting injectionto avoid these pitfalls, and solvent-ventinginjection and other solvent eliminationtechniques have been used with varyingdegrees of success. However, these tech
niques add more and oiten expensivehardware to the system and more stepsto the analysis.
We prefer direct injection onto a retention gap. Solutes arc distributed in broadbands on the retention gap, then focusedby the solvent effect or by phase-ratiofocusing before migration begins on theanalytical column (9). We have injectedsample volumes up to 1 \1l onto 50-\1mi.d. columns with this approach. Its realbeauty, aside from negligible cost, is thatit is easy. We have already mapped thephase behavior of 13 CO,-solvent mixtures and can specify appropriate injectionconditions (10). The actual injectiontechnique requires no additional decisionsand no special operator skills; the detailsof the rather complicated mass transferprocess take place automaticalJy. Relative standard deviations of absolute peakareas are ~ 1% for most solutes, which allows external standardization.
Hardware. SFClMS of soluteswith molecular masses up to 4000 Da isstraightforward if the SFC instmment can
elute the solutes. The pumps availableon commercial open-tubular SFC systemsare limited to 42.0 MPa (415 atm). A68.9-MPa (680 atm, 10,000 psi) pump cangreatly increase the analysis range. Thispump can be added to a commercial SFCsystem with appropriate safety precautions, but needs a separate controller.
Because of relatively low flow rates andsmaIJ volumes, making proper connections is also critical to success in opentubular SFC, (Packed-column SFC is
more forgiving.) An ideal union would becompatible with the full range of operatingtemperatures and pressures, easy to install, free of any dead volume, reusable,and inexpensive. A variety of low- and zerodead-volume unions are available that
200 Single-phase
E 160 region
:§. 120 1----"'0
~ 80':Region wher~'.
12 ~' I-v phase "E: 40
f v separation is ..0.. C02Possibie ITo~enea
100 200 300 400
Temperature ('C)
Figure 1. Pressure-temperaturephase diagram for CO2-toluenemixtures.
All CO2-toluene mixtures, regardless ofproportions, exist as a single liquid phase inthe room -temperature injector i. However.when a plug of toluene is transported to theSFC oven 0, the necessary liquid I to vapor vphase separation occurs as the fluid is heated.This phase separation is necessary for directinjection onto a retention gap.
have their advantages and drawbacks. Wehave recently begun to explore a unionless retention gap-column-restrictor system that greatly simplifies plumbing thechromatograph. These systems consistof an uncoated but deactivated retentiongap and a coated column made from a single piece of fused-silica tubing with an integral flow restrictor fashioned on the endof the column. These work very well aslong as the phase is stabilized.
ln most SFC/MS separations using anunmodified supercritical fluid, the mobilephase pressure is programmed to increase the strength of the mobile phase.Because fixed flow restrictors are mostoiten used, the increased pressure meansincreased flow of mobile phase into theion source. The rate of increase of mobilephase flow depends significantly on thetype of restrictor used: the frit restrictor(11), the short-tapered or integral restrictor (12), or the tapered capillary restrictor (13). Only the frit and integral restrictors are available commercially.
The rate of mobile-phase flow increase
is less with restrictors that have more turbulent flow characteristics (e.g., integral, crimped metal capillary, and pinhole
rostrictors) than it is with restrictorsthat have more laminar flow characteristics (e.g., linear, thin-waHed tapered, andmultipath frit restrictors). The multipathfrt restrictor is rugged but is not suitable for many solutes over ~ 2000 Da(14).lntegral restrictors are rugged and
can be easily cleared by applying heat andpressure. To date, we have founc1no performance advantages of the tapered capil
lary over the integral restrictor, thoughsome speculate that the tapered capillary
may perform better with high molecularweight solutes. We recommend ihe integral restrictor for most SFC/MS applications.
The choice of restrictor flow rate involves a compromise. Fast-flowing restrictors (3-10 cmls on a 50-]lm open-tubularcolumn) plug less frequently (and are easier to unplug when they do) than slowflowing restrictors when used to analyzerelatively nonvolatile analytes. On theother hand, the high mobile-phase velocity means less chromatographic effi
ciency and a higher gas load introducedinto the mass spectrometer. For practical,day-to-day analyses, we opt for fast
flowing restrictors. A traditional, differentially pumped mass spectrometer canmaintain a reasonable analyzer pressurewhen operated with a DFI interface, a50-\1m open-tubular column, and a fastflowing, integral-style restrictor (15).
MS guidelinesMass spectrometric choices that must bemade for wccessful SFC/MS include thetype of mass spectrometer, the configuration of the vacuum system, and the formof ionization. But perhaps the most obvious and visible choice involves the type ofinterface used to connect the chromatograph and the mass spectrometer.
Interfaces. TypicaHy, mobile-phaseflow rates in open-tubular SFC are suchthat the entire effluent may be directly introduced into the ion source of a modern mass spectrometer designed for GCIMS, resuiting in a DFI interface (4, 16,17). This simple intenace consists of astem that houses the chromatographic col
umn or a transfer line that is held at thesame temperature as the chromato
graphic oven. The tip of the interfacehouses the flow restrictor and is typically heated at 150-450 'C to counteract
the Joule-Thompson cooling of the expansion and to provide some volatiJily to theeluting analytes. The tip is usually positioned so that the effluent is introduceddirectly into the ionization region. Givenits simplicity and flexibility, the DFl interface is used most often.
652 A Analytical Chemislry, November 1. 1995
Because the mobile-phase flow rates ofconventional packed, microbore, andpacked-capillary SFC columns are typically too high for direct introduction tothe ion source, a variety of mobile-phase
elimination and flow-splitting lnterfaces
(based on similar LC/MS interfaces)have been devised for packed-columnSFC/MS. The ('010 primary mobile-phaseelimination interfaces are the moving-belt(18) and partic'c-beam (19) interfaces.The advantage of these interfaces is thatthey can "divorce" the chromatographfrom the mass spectrometer. Chromatographic separation, analyte ionization, andmass analysis can each be performed un:ler opti:nized conditions.
Once transported into the ion source,'he aneiytes are volatilized by heating themoving belt or the particle, so thermallylabile aralyles may suffer some degrada:ion. Most attempts to use the particleJeam interface for SFC/MS have usedinterfaces designed for LC/MS with fewmodifications (19). These attempts havegeneraiiy resulted in markedly poor limitsof detection, which l1ave been attributedto the differences between solvent evaporation and particle formation in LC and inSFC A recenl ",lrlicle-beam inlerface designed specifically for S?C/MS performsmuch better (20).
The simplest splltting interface is thepre-expmsian splitting interface, in whicha portion of the chromatographic effluent from the packed column is directed tothe mass spectrometer using a DFI interface (27). Tbe balance of the effluent goesto other detectors or is discarded. Othecpacked-column interfaces may be characterized as postexpansion splitting interfaces, in which the entire expanded effluent is d:rected to an ionization regiun.Much of the effluent, as we]' as many ofthe ions formed, is pumped from the ionization region and never reaches the massmalysis region of the mass spectrometer. Prominent members of this particularclass of ~nterfaces are the thermospray(22,23), the heated neJulizer for atmospheric pressure CI (24, 25), the electrospray (26), and the "high-flaw-rate" interfaces (27, 28) ,
These interfaces have an advantageever the pre-expansion interfaces in thatfocusing fields in the ion-sampling regionmay enhance the total number of ions di-
rected to the mass analysis region. Of thepostexpansion interfaces, the thermospray and heated nebulizer, used for atmospheric pressure ionization (API), areused most often. They are both reasonably simple and have good peIiormancecharacteristics. Because the heated nebulizer operates at atmospheric pressure,the chromatograph and mass spectrometer can operate more independently, andmaking alterations w adjustments to theinterlace is easier.
Instrumentation_ The quadrupolemass spectrometer (4, 17) still holds thewinner's hand of positive attributes forSFC/MS. High sensitivity, reasonablem/z range (up to 4000 for research-gradeinstruments), moderate cost, and straightforward interfacing are among ~he reasons most practitioners have chosen quadrupole instruments for their laboratories.
The most obviousand visible choice
is the type ofJUS inteiface.
However, MS/MS is a sequentiaLin-spaceexperiment with a quadrupole-based in
strument and requires multiple quadrupoles, which raises the cost of quadrupole-based MS/MS instruments significantly. This stands in sharp contrast to thesequential-in.time MS/MS available atrelatively little additional cost on the Fourier transform (FT) and Paul ion trap i:1struments. The low-energy (generally upto 200-eV) collision-induced dissociation(Cm) availahle on quadrupole MS/MSinstruments is sufficient for most analyteswith m/z below a few thousand.
Modern sector mass spectrometer~
provide high sensitivity, high resolution,anel higher m/z range (up to 8000-10,000for research-grade instruments) than typical Paul ion 'rap or quadrupole massspectrometers. They also provide highenergy cm for MS/MS, which can becritjcal for molecules with molecular
weight greater than a few thousand. Interfacing SFC to the ion source of sectormass spectrometers, which generally operate at voltages of 3-10 kV, has beenaccomplished will! carefully designed
probes (16,29). The vacuum systems ofmost modern sector instruments can easily handle the gas load of opeL-tubularSFC. Traditionally, the primaly disadvantage of sector instmments has been theirhigh cost relative to that of quadrupole instruments. This d'fferential is shrinkingas lower cost sector instruments reach the
market.The FT-MS instrument offers ultrahigh
resolution, simultaneous detection of allions. anel a wide mass range. Yet, the performance Df most SFC/FT-MS cOl11binations described in the literature suffersfrom the high SFC gas load and a longerthan-usual interface line (30,31). A differentially pumped external ion source wouldremove these obstacles. The cost of anFT-MS instrument has traditionally beenhigher than that of many other mass spectrometers
The Paul ion trap can provide high sensitivity anel a reasonable mass range, desp'te its small size and relatively low cost.However, when used for SFC/MS. it hasproblems dealing with the high SFC gas
load (32, 33), Ion traps usually operatewith a rela'.ively high pressure ofreliul11 asdamping gas within the trap. Mas': SFCmobile phases are not good dampinggases. As with the FT instrument, a differentially pumped external ion source coupleel to a Paul ion trap should provide goodperformanrf'
Although time-of-flight (TOF) massspectrometers designed for the detectionof chromatographic effluents are notwidely avadable tday, advances in highspeed electronics and technology may
soon give the nod to TOFMS for sensitivity. cost, and versatility (34,35) However, even when th choice of mass spectrometer has been made, other choices remain that are at least as, if not :nore,crilical to success. The two most important are the vacuum system anel the m/zrang·e of the instrument.
Vacuum system. Differential pumping became popular in the early GC/MSinstruments, In this approach, the ionsource and mass analyzer vacuum regions arc isolated from each other, with
Analytical Chemistry November 1, 1995 653 A
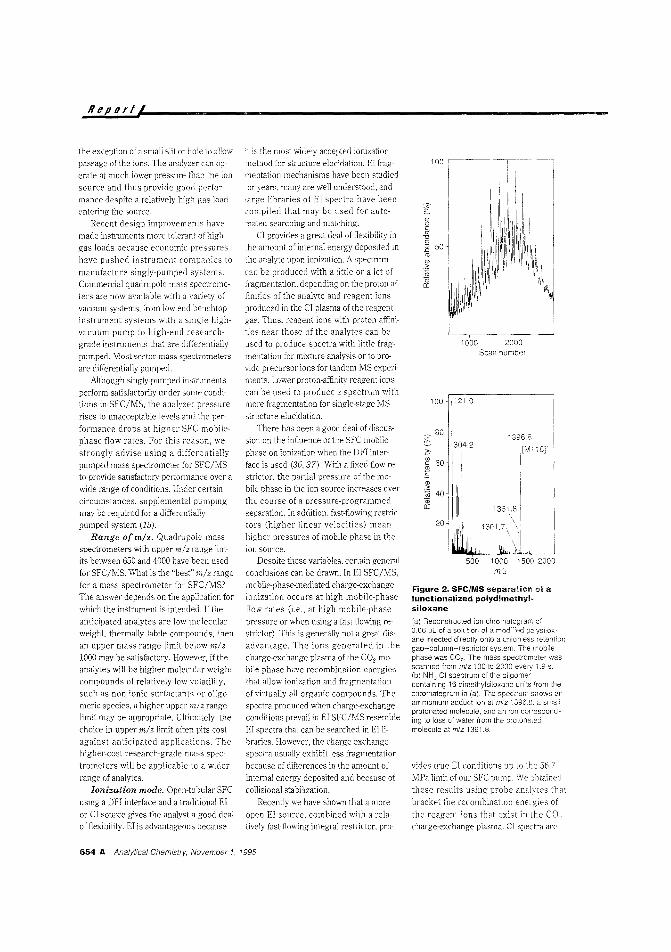
Report'
100
1396.8304.2
I
100- 121.0
20
_ 80
~,.,'wc 60Q)
.£Q)
>iii 40Q)a:
Figure 2, SFC/MS separation of alunctionalized polydimethyl.siloxane
:a) Reconstructed ion of:l.06 j.JL of a solution of a poysi!ox-ane injected directly onto a unionless retentiongap-column-restrictor system, The mobilephase was CO2 , The mass spectrometer wasscanned from m/z 100 to 2000 every 1.9 s.(b) NH3 CI spectrum at the aligomeccontaining 16 dimethylsiloxane units from thechromatogram in (a). The snows anammonium adduct ion at 1396.8 a smaliprotonated molecule, and an ion corcesPollding to loss of water from themolecule at mlz 1361.8.
500 1000 1500 2000m/z
vides true EI conditions up to the 56.7MPa limit of our SFC ]Jump. We obtainee!these results using probe anclytes thatbracket the recombination energies of
the reagent ions that exist in CO,charge-exchange plasma. CI spectra arc
1000 2000Scan number
't is the most widely accepted ionizationmethod for structure elucidation. EI frag
mentation mechanisms have been studiedror years, many are well understood, and,arge libraries of EI spectra have beencon,piled that may be used for automated searching and matching.
CI provides a great deal of flexibility inthe amount of internal energy deposited inthe analyte upon ionization. A spectmmcan be produced with a 'ittle or a lot offragmentation, depending on the proton affinities of the aDalyte and reagent ionsproduced in the CI plasma of the reagentgas. Thus, reagent ions with proton affini
ties near those of the analytes can beused to produce spectra with little fragmentation for mixture analysis or to provide precursor ions for tandem MS experiments. Lower proton-affinity reagen: ionscan be used to produce a spectrum withmore fragmentation for single-stage MSstn:cture elucidation.
There has been a good deal 01 discussion on the influence otthe SFC mobileph,'se on ionization when the DFI interface is used (36, 37). Wi:h a fixed flow restrictor, the partial pressure of the mo
bile phase in the ion source increases overthe course of a pressure-programmedseparation. In addition, fast-flowing restric
tors (higher linear velocities) meanhigher pressures of mobile phase in theion source.
Despite these variables, certain generalconclusions can be drawn. In El SFC/MS,mebile-phase-mediated charge-exchangeionization occurs at high mobile-phaseflow rates (i.e., at high mobile-phasepressure or when using a fast-Hawing restrictor). This is generally not a great disadvantage. The ions generated in thecharge-exchange plasma of the CO, mobile phase h2.ve recombination energies
that allow ionization and fragmentationof virtually all organic compounds. Thespectra produced when charge-exchanReconditions prevail in EI SFC/MS resembleEI spectra that can be searched in Ellibraries. However, the charge-exchangespectra usually exhibit less IraRmentationbecause of differences in the amount ofinternal energy deposited and because ofcollisional stabilization.
Recently we have shown that a moreopen EI source, combined with a relatively fast-flowing integra] restrictor, pro-
the exception of a sman slit or hoie to allowpassage of the ions. The analyzer can 0:)
erate at much lower pressure than the ionsourcc and thus provide good performance despite a relatively high Ras loadentering the source.
Recent design improvements havemade instruments more tolerant or hiRhgas loads because economic pressureshave pushed instrument companies tomanufacture singly-pumped systems.Commercial quadrupole mass spectraneters are now available with a variety ofvacuum systems, from low-end benchtopinstrument systems with a single high
vacuum pump to high-end researchgrade instruments that are differentiallypumped. Most sector mass spectrometers
are differentially pumped.Although singly-pumped instnlments
perform satisfactorily under some conditions in SFC/MS, the analyzer pressurerises to unacceptable levels and the performance drops at higher SFC mobilephase flow rates. For this reason, westrongly advise using a differentiallypumped mass spectrometer for SFC/MSto provide satisfactory performance over awide range of conditions. Under certaincircumstances, supplemental plimpinRmay be required for a differentialiy
pumped system (15).Range ofm/z. Quadrupole mass
spectrometers with upper mJz range lim
its between 650 and 4000 have been usedfor SFClMS. What is the "best" m/z rangefor a mass spectrometer lor SFC/MS?The answer depends on the application forwhich the instrument is intended. If theanticipated analytes are low molecularweight, thermally labile compounds, thenan upper mass range limit below m/z1000 may be satisfactory. However, iftheanalytes will be higher molecular weight
compounds of relatively low volatility,such as non-ionic surfactants or oligomeric species, a higher upper mlz range
limit may be appropriate. Ultimately, thechoice in upper m/z limit often pits costagainst anticipated applications. Thehigher-cost research-grade mass spectrometers will be applicable to a widerrange of analytes.
Ionization mode. Open-tubular SFCusing a DFI interface and a traditional EIor Cl source gives the analyst a good dealof flexibility. EI is advantageous because
654 A Analytical Chemistry November 1. 1995
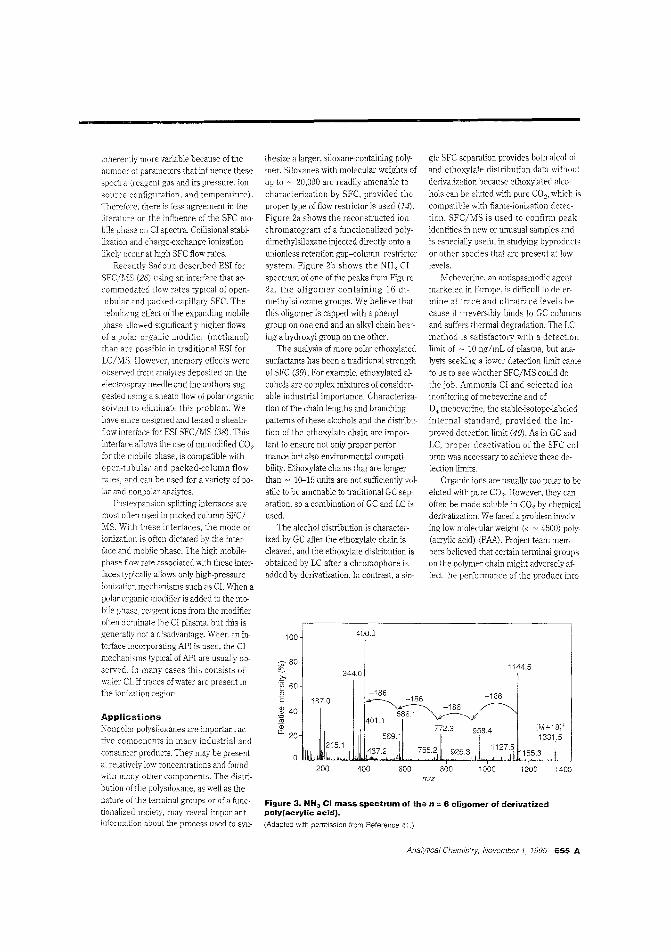
Figure 3. NH3 CI mass spectrum of the n = 6 oligomer of derivatizedpoly(acrylie acid).
(Adapted with permission from Reference 41.)
thesize a larger, siloxane-containing polymer. Siloxanes with molecular weights ofup to ~ 20,000 are readily amenable tocharacterization by SFC, provided theproper type of flow restrictor is used (] 4)Figure 2a shows the reconstructed ionchromatogram of a functionalized polydImethylsiloxane Injected directly onto aunlonless retention gap-column-restrictorsystem. Figure 210 shows the NR, CIspectrum of one of the peaks from Figure2a, fhe oligomer containing 16 dlmethylsiloxane groups. We believe thatthis oligomer is capped with a phenylgroup on one end and an alkyl chain bearing a hydroxyl group on the other.
The analysis of more polar ethoxylatcdsuJiactants has been a traditional strengthof SFC (39). For example, ethoxylated alcohols are complex mixtures of considerable industrial importance. Characterization of the chain lengths and branchingpattems of these akohols and the distribution of the ethoxylate chain are important to ensure not only proper peJiormance but also environmental compatibility. Ethoxylate chains that are longerthan ~ 10-15 units are not sufficiently volatile to be amenable to traditional GC separation, so a combination of GC and LC isused.
The alcohol distribution is characterized by GC after the ethoxylate chain iscleaved, and the ethoxylate distribution isobtained by LC after a chroClophore isadded by dcrlvatization. In contrast, a sin-
gle SFC separation provides both akoholand ethoxylate distribution data withoutderivatization because ethoxylated alcohols can be eluted with pure CO2, which iscompatible with flame-ionization detec~
tion. SFC/MS is used to confirm peakidentities in new or unusual sampies andis especially useM in studying byprocuct,or other species that are present at lowlevels.
Mebeverine, an antispasmodic agent
marketed in Europe, Is difficult to determine at trace and ultratrace levels because it irreversibly binds 10 GC columnsand suffers thermal degradation. The LCmethod is satisfactory with a detectionlimit of c~ 10 ng/mL of plasma, but analysts seeking a lower detection limit cameto us to see whether SFC/MS could dothe job. Ammonia CI ane' selected ionmonitoriDg of mebeverine and ofD4-mebeverine, the stable-isotope-Iabeledinternal standard, provided the improved detection limit (40). As in GC andLC, proper deactivation of the SFC column was necessary to achieve these detectionlim'ts.
Organic ions are usually too polar to beeluted with pure CO2, However, they canoften be made soluble in CO2 by chemicalderivatization. We faced a problem involv
ing low molecular weight « ~ 4500) poly(acrylic acid) (PAA). Project team members believed that certain terminal groupson the polymer chain migh adversely affect the performance of the product into
14001200
1144.5
1000800mlz
600
400.0
400
344.0
200
100
l80>,
~ 60
.~g: 40
·70(i)
II 20
inherently more variable because of thenumber of parameters that influence thesespectra (reagent gas and its pressure, iOIl
source configuration, and temperature).
Therefote, there is less agreement in the
literatur= on the influence of the SFC mobile phase on Cf spectra. Collisional stabilization and charge-exchange ionizationlikely occur at high SFC flow ra'es.
Recently Sadoun described ESI forSFC/MS (26) using an interface that accommodated flow rates typical of opentubular and packed-capi11ary SFC. Thenebulizing effect of the expanding mobilephase allowed significantly higher flowsof a polar organic modifier (methanol)
than are possible in traditIonal ESI forLCrVIS. However, memory effecfs wereobserved from analytes deposited on theelectrospray needle and the authors suggested using a sheath flow of polar organicsolvent to elimillate 1h;8 problem. Wehave since designed and tested a sheathflow inteJiace for ESI SFC/MS (38) ThisinteJiace allows the use of unmodified CO2
tor the mobile phase, is compatible withopen-tll bular and packed-column flowrates, and can be used for a variety of polar and nonpolar analytes.
PostexpaJ.sion splitting interlaces areClost often used in packed-column SFC/MS. With these interfaces, the mode ofionIzation is often dictated by the interface and mobile phase. The high mobilephase flow f2Je associated with [lese inter
faces typically allows only high-pressureionization mechanisms such as CI. When apolar organic modifier is added to the mobile phase, reagent ions from the modifieroften dominate the CI plasma, but this Isgenerally not a disadvantage. When an interface incorporating API is used, the CImechanisms typical of API are usually observed. In many cases this consists ofwater C1, if traces of water are present inthe ionization region.
ApplicationsNonpolar polysiloxar:es are important ac
tive C0l1100nents in many industrial andconsumer products. They may be present
at relatively low concentrations and foundwith many other components. The distri
bution of the polysiIoxanc, as well as thenature of the terminal groups or of a func~
tionalized moiety, may reveal importantinformation about the process used to syn-
Analylical Chemistry, November 1 1995 655 A
ChromatographicCharacterization ofPolymers:Hyphenated andMultidimensionalTechniques[i] his important new volumeT presents an overview of some
of the significant developmentsin the use of hyphenated multidimensioni'll separation methods for polymercharacterization. Divided into threesections, the book covers:
• general CO'lsiderations
• light scattering and viscometry
• analysis of compositionalheterogeneity and blends.
I Among the chromatographic separationtechniques discussed are: size-exclusionchromatography, liquid chromatography,and field-flow fraction methods used inconjunction with information-richdetectors such as molecular sizp.- orcomoositional-sensitive detectors andthat 'are coupled in cross-fractionmodes.
Valuable reading for both academic andindustriai scientists developingchromatographic methods for pOiymersor conducting polymer research
Theodore. Provdor, The GliddenCompany, Editor
Howard G. Barth, DuPont, EditorMarek W, Urban, North Dakota StateUniversity. Editor
Advances in Chemistry Series No. 2/-+7314 pages (1995) ClothboundISBN 0-8412-3132-X$124.95
.",31's,ji,l"uMAmerican Chemical Society1155 Sixteenth Street. NWWaShington, DC 20036
Or CALL TOLL FREE
1-800-227-5558(in Washington, OC 872-4363) and use
your credit card!FAX: 202-872-6067.
ACS PUblications Catalog now availableon Internet:
gopher acsinfo.acs.org orURl http://pubs.acs.org
Report (
which the PM was incorporated, but thePM supplier would not (or could not) reveal the nature of the terminal groups. Weperformed an SFC separation of the PMafler formation of the tert-butyldimethylsilyl (I'BDMS) derivative (41).
Figure 3 shows the NHa CI SFC/MSspectrum of one of the oligomers. Noticethe snccessive losses of 186 Da, corresponding to TBDM5-derivatized acrylicacid, the oligomeric unit. (The most abundant isotope ofthe ammonium-adduction cluster is shifted by one mass unit because of the silicon isotopes,) Usingdata from the EI and CI SFC/MS separations, we postulated that the terminalgroups were sulfonate and hydrogen,which was subsequently confirmed by thesupplier.
Certain choices favor a more successful marriage between SFC and MS.SFC/MS has some distinct advantages,especially in applications where GC/MSand LC/MS are difficult. Complex mixtues, such as surfactants, emUlsifiers,low molecular weight polymers, fats, oils,and waxes, that have relatively low volatility can benefit from the versatility offeredbySFC/MS,
References
(1) Arpino, P. J TrAC 1982,1, 154--58.(2) Milne, T. A. Int. I Mass Spectrom. Ion
Phys. 1969, 3, 153-55.(3) Giddings, J. C; Myers, M. N.; Wahrhaftig,
A LInt.]. Mass Spectrom. Ion Phys.1970, 4, 9-20.
~4) Smith, R D.; Felix, W. D,; Fjeldsted,]. C,;Lee, M. LAnai. Chem. 1982,54, 188385.
(5) Smith, R D.; Kalinoski, H. T; Udseth, H.R Mass Spectrom. Rev. 1987,6,445-96.
(6) Chester, T L; Pinkston, J. D.; Owens,G. D. Carbohydr. Res. 1989,194,273-79.
(7) Schleimer, M.; Schurig, V, In Analysis withSupercritical Fluids: Extraction and Chromatography, Wcnclawiak, R, Ed,; Springer-Veriag; Berlin, 1992; pp. 134-50.
(8) Berger, T A; Wilson, W. H. Anal. Chem.1993,65,1451-55.
(9) Chester, T L.; Innis, D. P. Anal. Chem.1995,67,3057-63.
(10) Ziegler, J w.; Dorsey, J G.; Chester, T L;Innis, D. P. Anal. Chem. 1995, 67, 45661.
(11) Cortes, H.].; Pfeiffer, C. D,; Richter, R E.;Stevens, T, S. U.s. Patent 4793920, 1988.
(12) Guthrie, E. J.; Schwartz, H. E.]. Chromatogr. Sci. 1986,24,236-41.
(13) Chester, T, L; Innis, D. P,; Owens, G. D.Anal. Chem. 1985,57,2243-47,
(14) Pinkston, J D.; Hentschel, R. T.j. HighResolut. Chromatogr. 1993,16,269-74.
(15) Pinkston,]' D.; Bowling, D.]. Anal. Chem.1993, 65, 3534--39.
(16) Huang, E. c,; Jackson, R J.; Markides,K E.; Lee, M. LAnai. Chem. 1988,60,2715-19.
(17) Pinkston,]. D. et aL Anal. Chem. 1988,60,962-66.
(18) Berry, A. l; Games, D. E.; Perkins,]. R].Chromatogr. 1986,363, 147-58.
(19) Edlund, P.O.; Henion, J. D.]. Chromatogr. Sci. 1989, 27, 274--82.
(20) Jedrzejewski, P. T; Taylor, L T. I Chromatogr. A 1995, 703, 489-501.
(21) Holzer, G.; Deluca, S.; Voorhees, K].BRCCC 1985, 8, 528-31.
(22) Balse,och,]. et aL I Nat. Prod. 1988,51,1173-77.
(23) Saunders, C. W.; Taylor, L T,; Wilkes, J.;Vestal, M. Am. Lab. 1990,22,46-53.
(24) Huang, E. C; Wachs, T.; Conboy, J.]'; Henion,]. D. Anal. Chem. 1990,62,713 A724 A
(25) Tyrelors, LN.; Moulder, R. X.; Markides,K E. ,4nal. Chem, 1993,65,2835-40.
(26) Sadoun, F.; Virelizier, H.; Arpino, P. J IChromatogr. 1993,647,351-59.
(27) Smith, R. D.; Udseth, H. R. Anal. Chem.1987,59,13-22.
(28) Cousin, l; Arpino, P. J. I Chromatogr.1987,398,125-41.
(29) Kalinoski, H. T; Udseth, H. R.; Chess,E. K; Smith, R. D.j. Chromatogr. 1987,394,3-14.
(30) Lee, E. D.; Henion, ]. D.; Cody. R. R; Kinsinger.]. A Anal. Chem. 1987, 59, 130912.
(31) Baumeister, E. R; West, C D.; Ijames,C F.; Wilkins, C LAnaI. Chem. 1991,63,251-55.
(32) Todd,].FJ et aL Rapid Commun. MassSpectrom. 1988, 2, 55-58.
(33) Pinkston,]' D.; Delaney, T E.;K L; Cooks, R. G, Anal. Chem. 1992,1571-77.
(34) Sin, C; Pang, H.; Lubman, D. M.; Zorn,].Anal. Glum. 1986, 487-90.
(35) Schultz,G.AetaLI 1992,590, 329-39.
(36) Houben, R.].; Leclercq, P. A; Cramers,C, AI Chromatogr. 1991,554,351-58.
(37) Kalinoski, H. T; Hargiss, L 0.]. Chromatogr. 1990,505, 199-213.
(38) Pinkston, J, D.; Baker, T R Rapid Commun. Mass Spectrom., in press.
(39) Pinkston, l D.; Bowling, D. l; Delaney,T, E.j. Chromatogr. 1989,474,97-111.
(40) Pinkston,]. D. etal.]. Chromatogr. 1993,622,209-14.
(41) Pinkston,]. D.; Delaney, T. E.; Bowling,D. J.]. Microcol. Sep. 1990,2,181-87.
]. David Pinkston, ofProcter & Gamble'sCorporate Research Division, focuses onSFC and coupling microcolumn separations to MS, Thomas 1. Chester, head ofProcter & Gamble's Separations and Optical Spectroscopy Section, focuses his work onanalytical uses ofsupercritical fluids, highresolution chromalography, and separations theory. Address correspondence aboutthis article to Pinkston at Procter & Gamble, Corporate Research Division, MiamiValley Laboratories, PO. Box 538707, Cincinnati, OR 45253-8707.
656 A Analytical Chemistry, November 1. 1995

METROHM RAISESMOISTURE ALYSIS
TO A NEW LEVEL.
o
Brinkmann bring you two new etrohmKarl FISCher litrators for the highest levels ofquality data and com'enience.
EW Cou/omerric Karl F"lScher Model m for trace mo' lureanal' low 1 ppm.Titration cell h no diaphragm,allo\\oing quick and easy cleaning and minimum downtim .
EW Volwnmic Karl Fischer Model 720 delerminmo' ture quickly and ccuralely frOID 10 ppm to 100%. Store upto 60 tit(lltiOD methods. Perlorm direct or back titrations.
OW hove an ecorwmical, easy-la-use Karl FIScher worksJation.Connect ither instrument to a balance, printer, or your PC withreDdy-to-un suftwart for an acwrate automatic tern.
For a demonstration.calll~S-3050 (fax 1-516-334-75(6).Ira canada, call800-263-871S (fax 905-826-5424).
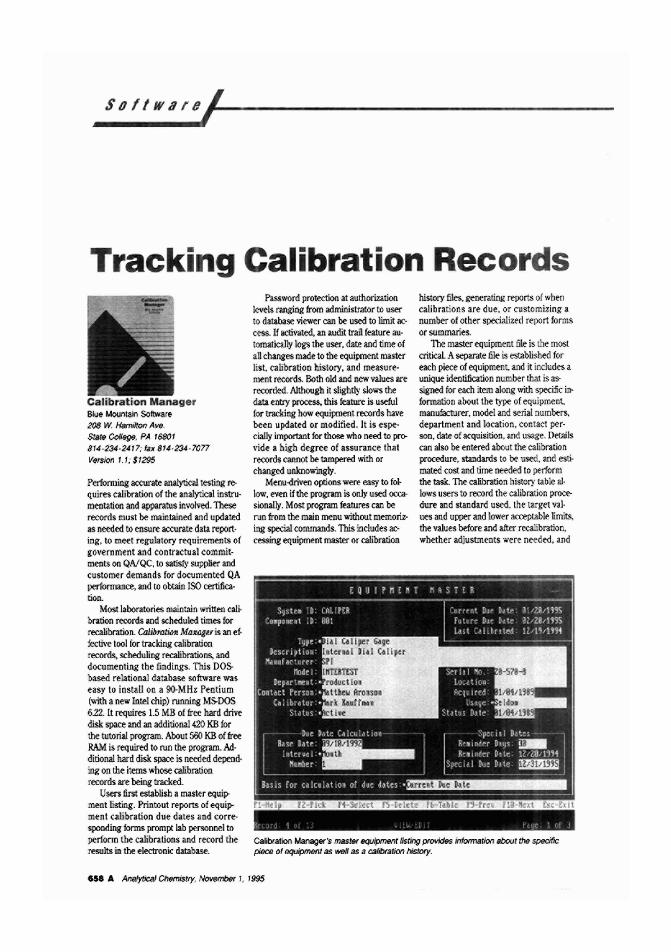
So f I war eJ--------------------
Tracking Cal-bration Recor 5
Galibration Manager's mas'" lIqJiproont listing prcMdfls inlor(IJIJ1ion IIbout the specific~ oloquipment as well as a calibration history.
Calibration Manager8Iue Mountain Software2C8 w. HttmiIton Ave.Stattl Cc~, PA 16801
814-234-2417; lax 814·234-7077V.mion 1.1; $129S
Perfonning accurate analytical te$tiJlg requires calibration of the analytical instrumentation and apparatus involved_ Theserecords must be maintained and updatedas needed to ensure accurate data reporting, to meet regulatory requirements ofgovernment and contractual commitments on QAlO':-, to satisfy suppHer andcustomer demands for documented QAperformance, and to obtain ISO certifica.tion.
Most W>oratories mAintain written calibration records and scheduled times forrecalibration. Calibratio1l MlWJgtr is an e1fective tool for tracking calibrationrecords, scheduling recalihrations, anddocumenting the findings. This DOSbased relational database software waseasy to install on a OO·MHz Pentium(..mil a new Intel chip) running MS-DOS6.22. It requires 1.S MB of free hard drivedisk space and an addltional420 KB forthe tutorial program. About 560 KB of freeRAM is required to run~ program. Additional hard disk space is needed depending on the items whose calibrationrecords are being tracked.
Users first establish a master equipmentlisting. Printout reports of equipment calibration due dates and corresponding bnns prompt lab personnel toperform the calibrations and record theresults in the electronic datablSe..
PassWQrd protection at authorizationlevels nnging trom administrator to userto database viewer can be used to limit ac·cess. If activated, an audit trail feature 0lU
toma~ly logs the user, date and time ofall changes made to~ equipment masterlist, calibration history, and mea.sure·ment records. Both old and new values arerecorded. A!thoIlgh it slightly slows thedata entry process. this feature is usefulfor tnlckJng how equipment rWlrds havebeen updated or modified. It is especially important for those who need to pr~
vide a high degree of assurance thatrecords cannot be tanlpej'ed with orchanged unknowingly.Menu~en options were easy to fol
low, even if the program is only used occasional1y. Most program features can berun from the main menu without memoriz·ing special commands. This includes accessing equipment master or calibration
history files, generating reports of whencalibrations are due. or customizing anumber of other specialized report formsor summaries.
The master equipment file is the mostcritical Aseparate file is established for~h piece of equipment, and it includes aunique identification number that is assigned for each item along with specific infonnation about the type of equipment.manufacturer. model and serial numbers,department and location. contact person, date of acquisition. and usage. Detailscan also be entered about the calibrationprocedure. standard.s to be used. and estimated cost and time needed to performthe task. The calibration history table al·lows users to rWlrd the calibration procedure and standard used. the target val·ues and upper and lower acceptable limits,the values before and after recalibration,whether adjustments were needed, and
otherc()rnmellt~; ~c.g., whether the instrumellt wa~ in or out of calibration).
Data sorting by 1a) location, individualowner, vlhen calibrations are due, ormany Olher parameters was straightforward logically laid out. Files ':hat areno longe:" needed can be archived ontodisk storage, thus imp:-oving ~he
overall pcrformacce of the program speedwhen conducting searches. Archivedrt:con]s can be reloaccd if needed.
Bc,th beginners and advanced userswill appreciate the well-organized manual.The tutor:al addresses all the initial questions a beg-inner would have in setting upthe information for all the instrull1en~ation
to be T,u.<.;:ed by' the program. After spending a Jew llou:-':) learning the basics of thepackage, novice users s~10uld be able tocLlstomize the package for their individual1ab. Examples in the Utoria!' togetherw~th the templates, are excellent forhands-or: dC:11onstrations of all majorfeatures.
I encountered one software confictwhen I tried to delete records while running Calibratio'!'l }1;fanager in a DOS win-cloyv Windows 3.1. I consider thisa minor disadvantage in an othETw'ise goodsoftwc.re pack:lge. AJbough many usersrnay be able to use the package with minimal training, going through the tutorialis imp8rt;:mt, in part because some of theirrponanl features require certain commands that are not easily found in thehelp menus. The audit trail and passwordprotection ;:;re especially valuable features.
All program functions perfoll11ed well.Although ('nte,-ing all the data for each insLrumem 'lakes time in setting up the files,labs that are aiming for ISO certtficationwould 112'/e already assembled theserecords. lnfo1111ation on when instrumentation is due for recalibrc:tion and the recordsassociated with performing the recalibrations are logically :aid out in the series ofpages for each piece of equipment.
ReViewed by F C McElroy, Exxon Research and Engineering Company
-ChemWebSoltshell International
1600 Ute Ave.Grand Junction, CO 81501-4614
970-2~2-7502'fax 800-240-6469Version 1.0; free. or $29 with phone sup-
port and manuals
Chem Web is a chemistry drawing progra:Tintended to allow publication of cbemistry files on the World Wide Web: thesefile8 can then be downloaded and editedby other llsers. The program, which canbe downloaded from SoftShell Online(http://www.softshe11.com). is similar toChem WindDw or ChemIntosh but cannot De
used to copy and paste graphics to otherapplications or villt. Chem Window orChemIntosh users can download a freepatch that adds Chem Web features to theirexisting softvvare.
Accord for AccessSynopsis Scientific Systems175 Woodhouse La.Leeds LS2 3AR. UK44-113-245-3339: fax 44-113-243-8733
a-mail [email protected] I.C; $895. $537 academic
Accord for Access is an add-in to theMicrosoft Access desktop relational database designed to provide chemists withthe ability to manage, analyze. and searchchemistry and associated data directlywithin the Access environment. Databasescontaining thousands of chemical structures can be searcted by substructure inseconds on a standard desktop PC, anelboth chemical and nonchemira1 dataqueries can be phrased in a single SQLstring. The program offers full cut-andpaS'le compatibility with desktop chemicaleditors such as ChemDraw, ISIS/Draw.and Chem Window, and individual structures or whole chemical data tables canbe imparted and exported in a variety of
staedard (ormats, including SD, SMD, andSMII ,ES. Sy'st-em requirements include
Microsoft Access 2.0 or higher and Windows 3.1 or higier.
Snap-Master GeneralAnalysisHEM Data Corporaton17336 12-lvIile Rd.Southfield. M148076-2123810-559-5607.' fax 810-559-8008
Version 3.0; $495
Snap-Master General Analysis providespowerful time-domain data analysis, including built-in event detection for intelligent calculations, Boolean logic, filtermodels, a:lel more than 50 mathematicalfunctions. The equation builder allowscomp]px eqnations to be written using a
simple point-and-click dialog interface andguides the user through each function.The number o( data pobts that can be processed sirnultaneously is limited only bythe computer's available memory or diskspace. Dala can be imported in ASCll, binary, or CSV formals or through dynamicdata exchange. System requirements include an IBM PC or cOrl]l8tib1e with a 386or faster processor and Windows 3.1 orhigher.
Bookends ProWesting Soflware134 Reawood kle.
Corte Madera. CA 94925415-945-3870: lax 415-945-3877, e-mail
lIersion 3.2: $129. $49 upgrade
This upgrade of Bookends Pro bibliography :11anage:1wnt software features a redesigned interface. improved Find and Replace capabilities, user-defined imports,expanded printing capabilities, and theabilities to attach any file (e.g., word processor file. spreadsheet, PDF file) to a reference anc! by cloub;e-clicking open it inthe application that created it.
Analytical Chemistry, November 1, 1995 659 A
800 k s,., _____.'
Predicting Retention in LC
Retention and Selectivity inLiquid Chromatography:Prediction, Standardisationand Phase ComparisonsRoger M. Smith, Ed.Elsevier Science Publishers
655 Avenue of the AmericasNew York, NY 10010
1995, 478 pp., $265.75
One althe goe15 althe many efforts to predict retention is to relate physical andchemical factors to the observed changesin selectivity and retention with solventand column type, These efforts overlapand parallel those that use chemometricmethods such oS factor analytical targetprediction methods and heavily modeledformalisms based on linear, free-energy assumptions. The goal is both scholarly andpracticaL
From a scholarly View, the iniluence ofmolecular weight, size, structure, andfuncIionality on retention is a fascinatingtopic. For the practicing scientist whose interest in any chemical separation methodis the outcome, the goal is to minimize theeffort involved in designing a new ormodified separation method. Certainly,the vast majority of chromatography usersfall into this category. They want quantitative enswers or separate vials of compound A, B, C, and so on.
This book will fill a gap for the practicing scientist curious about progress in retention prediction based on chemicalstructure or chemically related parameters. The introductory chapter is especially well written. The majority of chapters relate some form of retention index
method to the prediction of behavior. Addto this the chapters by Sanders and Wiseon their work in RPLC phase structure andselectivity for polyaromatic hydrocarbons, Pesek and Williamsen on novelphases, and a final chapter by Bolek andSmilde on multivariate methods, and youhave a valuable tertiary reference.
This book discusses recent progress intransferring the Kovats method developedfor GC to LC, and especially RPLC, an effort that began in the early days of modern HPLC. Retention indices help identify compounds, confirm the identity of anticipated compounds, and determine theinfluence of the branching of chains,changing functionality, and positionalisomerism. Unfortunately, because there
is no simply defined void volume forRPLC, using retention indices is complicated.
Many workers have demonstrated thateach molecular type has its unique deadvolume. However, as the total retentionvolume grows large and the net retentionvolume grows with respect to any rangeof void volumes, this becomes less of aproblem, and it is possible to calibrate agiven column with homologs of a givenchemical class and then confirm the identily of one of those homo10gs relative toits behavior. But the dead volume is a function of solvent composition, the manufacturer afthe column packing (all ClK
columns are not the same), and otherparameters. Therefore, the transfer of calibration methods, lab to lab or columnsource to column source, is rather diffi-
cult. One of the reasons that compendia1methods now specify a column type (e.g.,USP Type Ll) and thn require the userto obtain at least a minimum set value ofresolution between main component andcommon impurities is the difficulty oftransferring methods between labs andlor columns.
The introductory paragraphs of Chapter 12 deal with the use of multivariatemethods. This chapter also gives a goodexplanation of the techniques used and the"soft-model" nature of factor-analyticalapproaches, shows some examples of successes, and discusses some of the toolsavailable. The very nature of factor analy1ical methods (that the observed variationcan be explained by a progression of eigenvectors) makes it the least directiy"molecular" in its results. But then thesesame methods are the basis of many of thecommonly used molecular structure prediction programs now preferred by practicing chemists.
The reader should remember that correlation does not guarantee a causal relationship. Models such as topological shapeand surface area correlate to molar volume, which correlates to polarizability andthe London force contribution to sorption energetics in RPLC. Sorption is a freeenergy change-descrihed process. Linearfree-energy relations prove little exceptthat things related to the total freeenergy change in a given process are proportional to each other and that they correlate. This does not imply that one factorcauses the other. Hence, it is possible torelate octanol-water partition values (K,,w)to net retention in RPLC and to correlateoctanol-water partition to hydrophobicitymeasured in other ways. One finds, however, that such correlations a"t only forcompound classes in any prec'se sense.Families of straight lines are found in plotsof many different compounds: K"w valuesversus their RPLC retention values.
A good book, worth having at hand.Reviewed by C. H. Lochmiiller, Duke
University, Durham, Ne
660 A Analytical Chemistry, November 1. 1995
DeterminingDrugs of Abuse
Analysis of Addictive andMisused DrugsJohn A. Mamovics, Ed.Marcel Dekker
270 Madison Ave,
New York, NY 100161995,660 pp, $195
This book is a compilation of 10 chapterscovel'ng the detennir.ation of drugs, ranging from descriptions of assay systems fordmg'2 of abuse (enzyme imrnunoassays,TLC, HPLC, CE, GC/MS), to testing athletes and :'orensic drug testing in SoutoA11elica. Amajor portion of the book,nearly haU the printed pages, is an appendix. More than 400 drugs are presented intable form, along with a list of appropriatemethods of determination and associatedreferences. This appendix provides a quickstart to becoming familiar with some of theavailable procedures.
The quality of the chapters varies dramatically. The chapter on enzyme immunoassays contains severai errors and oftenrefers to the drug when the me-tabolite be discussed. In the listingof drugs tested under NIDA (more appropriateiy referred to as the Departmentof Health and Human Services' NationalLaboratory Certification Program), severai that are mentioned are not actuallypart of that program.
For example, the screening test is actually the test for a cocaine metabolite andnot for cocaine, and the test for marijuana
is for the "'·9-acid metabolite and not theLI-8-acid metabolite, as listed in the table.Although some immunoassay> cross-reactwith some of the compounds listed, thetext is not dear on what the program specifies for testing. It is unfortunate thatthese kinds of errors pervade an otherwise good description of how the immunoassays work.
Two chapters discuss resurging oremerging technology. The discussion ofthe potential use of biosensors is interesting, even though it describes an assaythat is not used for drugs normally associated with ahuse. The chapter on robotics describes an emerging area with th epotential for some dramatic technologicaladvances, taking rohotics into the mainstream of drug testing.
Other chapters provide a good discussion on reversed-phase and unmodified silica HPLC. The hook would be valuable toa wider audience, however, if there were asinilarly well-written detailed chapterdescribing the determination of drugs inbiological samples by HPLC. The chapteron South Ame"ica not only provides useful information on determining drugs ofabuse, it also presents the reader withsome interesting insights into the precesses and procedures used in anotherpart of the world.
Reviewed byJohn T Cody, Wilford HallMedical Center, Lackland AFE, TX
BOOKS RECEIVED
Particle-Induced X.RayEmission Spectrometry(PIXE)Sven A. E. Johansson, John L. Campbell.
and Klas G. Malmqvist, Eds.John Wiley & Sons605 Third Ave.
New York, NY 10158
1995, 451 pp., $79.95
This book is intended as a complete handbook on FIXE. The chapter topics cover
basic instrumentation specimens; quantitative analysis; accuracy and detection iimits; and applications in medicine, atmospheric chemistry, geochemistry, andart conservation. Each of its eight contributed chapters contains a bibliography,and a subject index is included at the endof the book
Quality Assurance inAnalytical Chemistryw. Funk, V. Dammann,
and G. Donnever~
VCH
220 East 23rd SI.
New York. NY ,0010
1995,238 pp., $80
This voiume is a revised and updated English version of the original Germ:m edition first published in 1992, It presents afour-phase strategy for quality assurance(establishing new analyiical procedures,preparatOly QA, routine QA, and externalanalytical QA) and describes all of thenecessary calculations as well as interpretations for quality parameters and statistica: data.
Modern Practice of GasChromatography, 3rd ed.Robert L. G'ob, Ed.John Wiley & Sons
605 Third Ave.
New York. NY 10158
1995, 888 PrJ., $89.95
This book is intended both as a comprehensive treatise for experienced chromatographers and as a reference text forbeginners. More than one-third of thehook is new to this edition. Additions include detailed coverage of instrumentation, update:J chapters on detectors andquantitative and qualitative analysis, newchapters on gas chromatography/massspectrometry, and new applications in forensics and environmental monitoring. Anextensive (25 pp.) subject index is included.
Analytical Chemistry, November 1. 1995 661 A

DISCOVER SOMETHINSTUNNINGLY SMALL
WITH OUR NEW LCIMS S...
.. .ITS PRICE.
FFinn~QnmAT
THE !\IASS SPECTROMETRY COMPANY
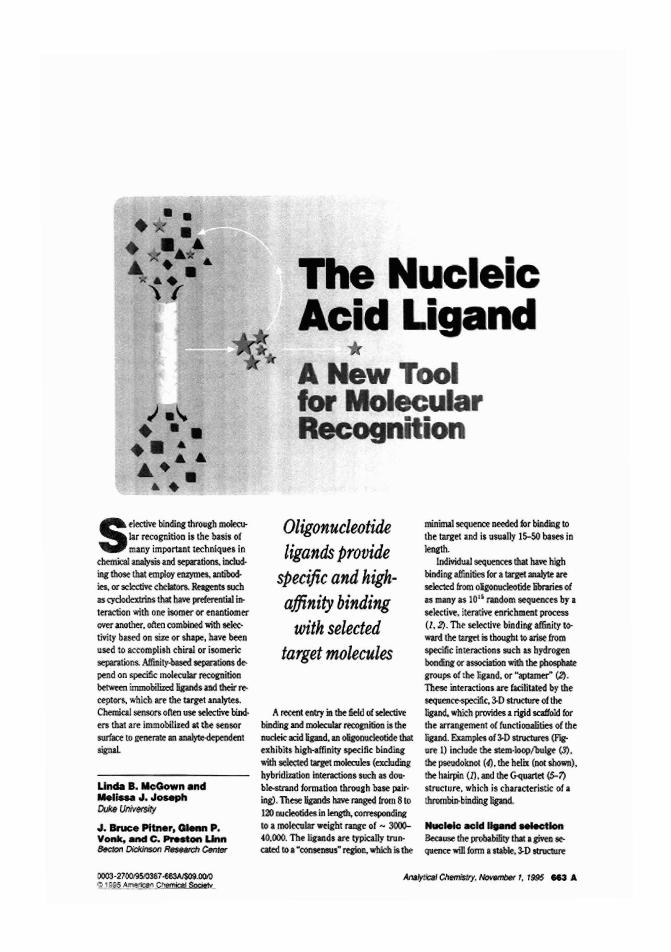
r
cleici and
electiVe lindina thl\l~gh m0lecular recognition is the basis ofmany important techniques In~~ and sepntions., lnc:hJd.ing those that employ eD%)'IIIe$, antibc»ies. or selectiVe eheJators.~ls suchas cyclodextrins that have prdertntial i&teraction with- one isQmer or emntiomerfNer another, otten combiood with selec"twily based on s~ or shape, have beenused til accomplish chiral or isomericsepar2funs.. AffiIlity~~ depend on s.peOOc molecular recognitionbetwmI immobilired igands aDd their receptors, which are the tar~t analytes.Chemicsl seDSQ1'll oflto usese~ bind·e.rs tha1 are immobiliud at tbe sensorsurface to generate an anal)1Ie-dependentsignal.
UncIa I. IIcQown 8nd...1..........0 ...."I::IcJM UniVersity
J. Bruce Pitner, cu..n P.YOftik. 8nd C. ......011 LInn8«fon~R~CMW
Oligonucleotideligands provide
specific and highaffinity binding
with selectedtarget molecules
Arec:ent elllry in the 6eId of seledivebindinI and moleadat recoa:nmon is thenuclei<: acid igand, ano&eooo~ thatexhibits hielHffinity specific bindingfth seleJ;ted~moimlles {excludmghybridization iDterar:tlons sllCh as dOlI.blMtr2nd fotmatioo throueh base pair·ill&l. These Iipods have raoge<l from 8 to120 lmleotides in length,co~to a molecular ...eight raIlge of - 3000(0,000. The lig.llls .,e tJp.ic&1Jy truncated to a"CiOlllleIlSUS· rtiion, which is \lie
rrmiNl sequence needed for binding tothe lariet and is usually 1&-50 bases inlength.
IndlriduaJ sequences that have hilrhbinding affinities for a target anaIyte areselect.ed from olgooueleotide ibrariesofas many as 101~ random sequences by aselective, iterative fllrichlllent process0,2). The selective binding affinity toward the taliet is thought 100 arise (romspecific interactioos such IS hydrogenbon4tlt or association with the~groups oftbe ligand. or"aptamer" ~.These interactioos are facilitated by the$eqll.enCMpecific, 3-D~ of theligand, which provides a rilid scaffold tMthe arralliement of fu.nctiOllllities of theJiIand. Examples of 3-D strudum (F'1g'urt; 1) illdud~ the st~m·1oop/bu~ (3),
the pseudoknot (i), the helix (Jl(lt shown),the hairpin (I), aDd the ~uartd (5-7)$tMlctur~, which is chara.ctmstk 01 athrombilt'biDdiog ligand.
Nucleic aclel"""" ..I,e'lonBecause the JrObabiIity that a giYeo sequence will fonn aSlaNe,~D structure
0003·270019510387~.()()'I)~'Sj' Am~' .
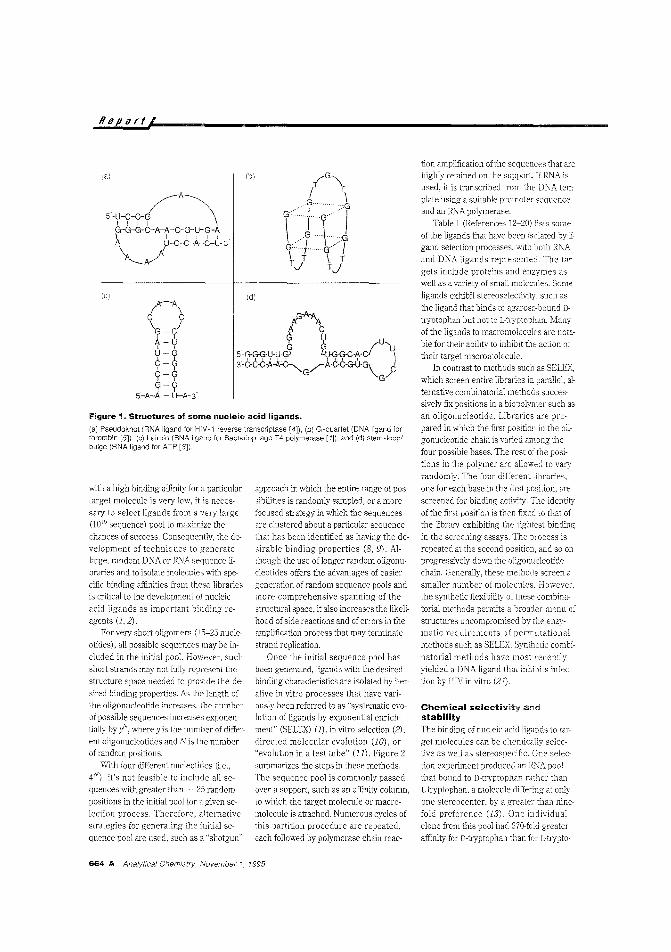
Figure 1 ~ Structures of some nucleic acid ligands.
(a) Pseudoknot (RNA ligand lor HIV,1 reverse transcriptase [4]), (b) G-quartet (DNA ligand forthrombin [5]), (c) hairpin (RNA ligand for Bacter-iopilage T4 polymerase [1];, and (d) stem-Ioop/bulge (RNA ligand for ATP [31),
Report (
13)
5~U_C_C_~A~I I I I \G-G-G-C-A-A-C-G-U-G-A\ I t I I I IA U-G-G-A-C-U' 3'\ r/'A"-A/
~ c)A-A
I \C c\G-C/
I IA-UI IU-G9-~«-<;>
, <f - « ,5-A-A - U-A-3
with a high binding affinity for a particular
target molecule is very low, it is neces~
sary to select ligands from a very large(1015 sequence) pool to maximize the
chances of success, Consequently, the development of techniques to generatelarge, random DNA or R\lA sequence libraries and to isolate molecules wit'! spe
cific binding affinities from these librariesis critical to the development of nucleic
acid ligands as important binding reagents (1, 2),
For very short oligomers (15-25 nucle
otides), all possible sequences may be in
cluded in the initial pool. However, sucl'short strands may not fully represcnt thc
structure space needed to provide the de
sired binding properties, As the length ofthe oligonucleotide incretJ.sps, the number
of possible sequences increases exponentially by yv, where y is the nUll1ber of differ
ent oligonucleotides and N is the numberof random positions,
With four different nucleotides (i,e"
4N), it's not feasible to include all se
quences with greater than ~ 25 random
positions in the initial pool for a given se
lection process, Therefore, alternativestrategies for generating the ilIiiial se
quence pool are used, such as a "shotgun"'
(b)
(d)
approach ir, which the entire range of pos
sibilities is randomly sampled, or a more
focused strategy in which the sequences
are clustered ahout a particular sequencethat has been identified as having the de
sirable binding properties (8,9), Al:hough the nse of longer random oligonucleotides offers the advantages of easier
generation of random seqnence pools andmore comprehensive spanning of the
structural space, it also increases the likeli
hood of side reactions and of errors in theamplification process that may terminate
strand replication,
Once the initial seqnence pool has
been generated, ligands with the desiredbinding characteristics are isolated by iter
ative in vitro processes that have varionsly been referred to as "systematic evolution of ligands by exponential enrichment" (SELEX) (1), in vitro selection (2),
directed molecular evolution (10), or"evolution in a test tube" (11), Figure 2
summarizes the steps in these methods,
The sequence pool is commonly passedover a support, such as an aftjnity column,
CO which the target 1Y,0lecule or macro
molecule is attached_ Numerous cycles of
this partition procedure arc repeated,each followed by polymerase chain reac-
tion amplification of the sequences that arehighly retained on the support. If RNA is
used, it is transcribed from the DNA tem
plate using a suitable promoter sequenceand an RNA polymerase,
Table 1 (References 12-20) lists some
of the ligands that have been isolated by ligand selection processes, with both RNA
and DNA ligands represented, The tar
gets include proteins and enzymes aswell as a variety of small molecules. Some
ligands exhibit stereoselectivily, such as
the ligand that binds to agarose-bound Dtryptophan but not to L-tryptophan, Many
of the ligands to macromolecules are notable for their ability to inhibit the action of
their target macromolecule,ln contrast to metbods such as SELEX,
which screen entire libraries in parallel. al
ternative combinatorial methods succes·sively fix positions in a biopolymer such as
an oligonucleotide, Libraries are prepared in which the first position in the oligonucleotide chain is varied among the
four possible bases, The rest of the posi
tions in the polymer are allowed to vary
randomly, The four different libraries,
one for each base in the first position, are
screened for binding activity, The identity
of the first position is then fixed \0 that ofthe library exhibiting the tightest binding
in the screening assays, The process is
repeated at the second position, and so onprogressively down the oligonucleotide
chain, Generally, these methods screen a
smaller number of molecules, However.the syntbetic flexibility of these combina
torial methods permits a broader menu of
structures uncompromised by enzy-matic requirements of permutational
methods such as SELEX Synthetic combi
natorial methods have most recentlyyielded a DNA ligand that inhibits infec
tion by HlV in vitro (21),
Chemical selectivity andstability
The binding of nucleic acid ligands to tar
get molecules can be chemically selective as well as stereospecific, One selec,
tion experiment produced an RNA pool
that bound to IHryptophan rather thanL-tryptophan, a molecule differing at only
one stereocenter, by a greater than ninefold preference (13), One individual
clone from this pool had 670-fold greater
affinity for D-tryptophan than for L-trypto-
664 A Analytical Chemistry, November 1995
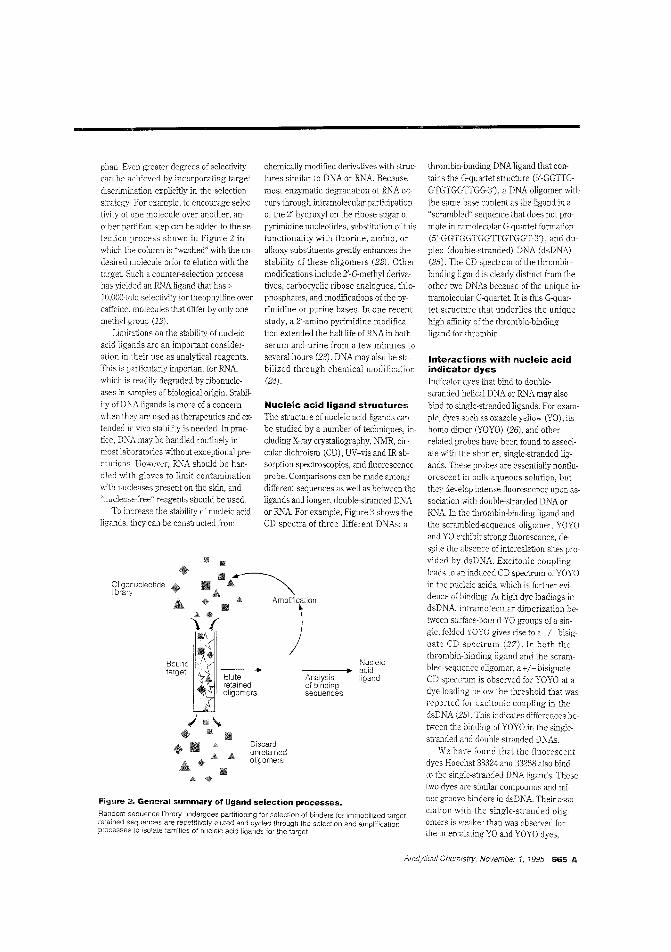
Figure 2, General summary of ligand selection processes.
Random sequence iibrary undergoes partitioning for selection of binders fo" immobilIzed target:re:ained sequ.e,1ces are repetitively eluted and cycled through the selection and ampJificatiorprocesses to Isolam families of nucleiC aCid ligands for the target.
Discarjunretainedoligomers
Analysisof oindingsequences
thrombin-binding DNA ligand that con·tains the G-quartet structure (5'-GGTIGGTGTGGTIGG-3'), a DNA oligomer withthe same base content as the ligand in a"scrambled" sequence that does not promote intranolecular G-quartet formation(5'-GGTGGTGGTIGTGGT·3'), and duplex (double-stranded) DNA (dsDNA)(25). The CD spectrum of the thrombinbinding ligand is clearly distinct from theother two DNAs because of the unique intramolecular G-quartet. It is this G-quartet structure that underlies the uniquehigh affinivj of tbe thrombin-bindingligand for thrombin.
Interactions with nucleic acidindicator dyesIndicator dyes that bind to doublestranded helical DNA or RNA may alsobind to single-stranded ligands. For example, dyes sucb as oxazole yellow (YO), itshomo dimer (YOYO) (26), and otherrelated probes have been found to associate witb the shorter, single-strandedligands. These probes are essentially nontJuorescent in bulk aqueous solution, butthey develop intense fluorescence upon association with double-stranded DNA orRNA. In the thrombin-binding ligand andthe scrambled-sequence oligomer. YOYOand YO exhibit strong t1uorescence, de·spite the absence of intercalation sites provided by dsD NJ\. Excitonic couplingleads to an induced CD spectrum of YOYOin the nucleic acids. which is further evidence of binding. At high dye loadings indsDNA, intramolecular dimerization between surface-bound YO groups of a single, folded YOYO gives rise to a -/+ bisignate CD spectrum (27). In 'Joth thethrombin-binding ligand and the scrambled-sequence oligomer, a +/- bisignateCD spectrum is observed for YOYO at adye loading below the threshold that wasreported fur excitonic coupling in the
dsDNA (25). This indicates differences be·tween the binding of YOYO in the sing:estrancled and double·stranded DNAs.
We have found that the fluorescentclyes Hoechst 33324 and 33258 also bindto the single-stranded DNA ligands. Thesetwo dyes are similar compounds and minor groove binders in dsDNA. Their asso
ciation with the single-stranded olig·omers is weaker than was observed for,he intercalating YO and YOYO dyes,
Nucleic-----•• acid
ligand
chemically modified derivatives with structures similar ~o DNA or RNA. Because
most enzymatic degradation of RNA occurs through intramolecular participationof the 2' hydroxyl on the ribose sugar ofpyrimidine nucleotides, substitution ofthisfunctionality with fluorine, amino, oralkoxy substituents greatly enhances thestability of these oligomers (22). Othermodifications include 2'-O·methyl derivatives, carbocyclic ribose analogues, thirrphosphates, and modifications of the pyrimidine or purine bases. In one recentstudy, a 2'-amino pyrimidine modifica·tien extended the half-life of RNA in bothserum and urine from a few minutes toseveral hours (23). DNA may also be stabilized through chemical modification(24).
Nucleic acid ligand structuresThe structure of nucleic acid ligands canbe studied by a number of techniques, including X-ray crystallography, NMR, cir·cular dichroism (CD), UV-vis and !Rabsocption spectroscopies, and fluorescenceprobe. Comparisons can be made amongdifferent sequences as well as between theligands and longer, double-stranded DNAor RNA. For example, Figure 3 shows theCD spectra of three different DNAs: a
phan. Even greater degrees of sclcctivitycan be achieved by incorporating target
discrimir.ation explicitly in the selectionserategy. For example, to encourage selectivity of one ~10lecule over another, another partition step can be addeo to the selection process shown in Figure 2 inwhich the co:umn is "washed" with the undesired molecule prior to elution with thetarget. Such a counter-selection processhas yielded an RNA ligand that has>1O,000-fold selectivity for theophylline overcaffeine, molecules that differ by only onemethyl g:-oup (12).
Limitations on the st2biJity of nucleicacid ligands are an important consideration in their use as analytical reagents.This is particularly important for RNA,which is readly degraded by ribonucleases in samples of biological origin. Stabil
ity of DNA ligands is more of a concernwhen they are used as therapeutics and extended in vivo stabili:y is needed. In practice, DNA may be handled routinely inmost laboratories without exceptional precautions. However, RNA should be handled with gloves to limit contaminationwith nucleases present on the skin, and"nuclease·free" reagents should be used.
To increase the stability of nucleic acidligands. ehey can be constructed from
OIigorucleotidelibrary
Analytical Chemistry, November 1, 1995 665 A
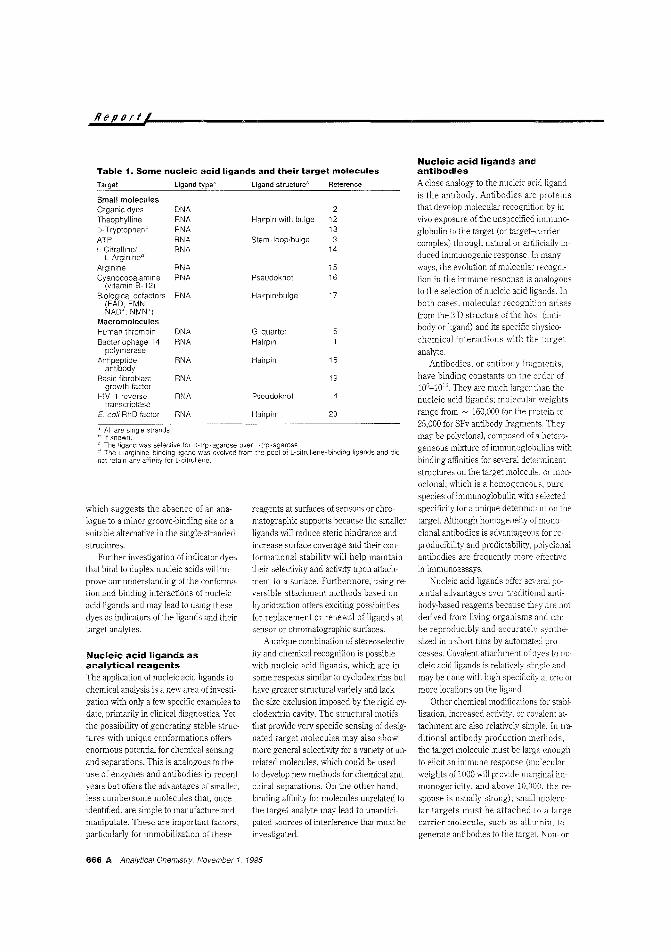
Report (
Nucleic acid ligands andantibodies
A close analogy to the nucleic acid ligandis the antibody. Antibodies are proteinsthat develop molecular recognition by invivo exposure of the unspecitied immunoglobulin to the target (or target-carriercomplex) through natural or artificially induced immunogenic response. In manyways, the evolution of molecular recognition in the immune response is analogousto the selection of nucleic acid ligands. Inboth cases, molecular recognition arisesfrom the 3-D structure of the host (antibody or ligand) and its specific ')hysicochemical interactions with the targetana1yle.
Antibodies, or antibody fragments.have binding constants on the order of10"_1012
. They are much largerthan thenucleic acid ligands; molecular weightsrange from ~ 160,000 for the protein to25,000 for SFv antibody fragments. Theymay be polyclonal, composed of a heterogeneous mixture of immunoglobulins withbinding affinities for several determinantstructures on the target molecule, or monoclonal, which is a homogeneous, purespecies of immunoglobulin with selectedspecificity for a unique determinant on thetarget. Although hooogeneity of monoclonal antibodies is advantageous for reproducibility and predictability, polyclonalantibodies are frequently more eltectivein immulloassays.
Nucleic acid ligands oltcr several potential advantages over traditional anti
body-based reagents because they are notderived from living organisms and canbe reproducibly and accurately synthesized in a short time by automated processes. Covalent attachment of elyes to nucleic acid ligands is relatively simple andmay be done with high specificity at one ormore locations on the ligand.
Other chemical modifications for stabilization, increased activity, or covalent attachment are also relatively siople. In traditional antibody production methods,the target molecule must be large enoughto elicit an immune response (molecularweights of 1000 will provide marginal immunogenicity, and above 10,000, the response is usually strong); small molecular targets must be attached to a largecarrier molecule, such as albumin, to
generate antibodies to the target. Non- or
reagents at surfaces of sensors or chrorr.atographic supports because the smallerligands will reduce steric hindrance andincrease surface coverage and their conformational stability will help maintaintheir selectivity and activity upon allachrrent to a surface. Furthermore, using reversible attachment methods based onhybridization offers exciting possibilitiesfor replacement or renewal of ligands atsensor or chromatographic sutiaces.
Aunique combination of stereoselectivity and chemical recognition is possiblewith nucleic acid ligands, which are insome respects similar to cyclodextrins buthave greater structural variety and lackthe size exclusion imposed by the rigid cyciadextrin cavity. The structural motifsthat provide very speci;]c sensing of designated target molecules may also showmore general selectivity for a variety of unrelated molecules, which could be usedto develop new methods for chemical andc:1iral separations. On the other hand,binding affinity for molecules unrelated tothe target analyte may lead to unanticipated sources of inteJierence that must beinvestigated.
D- trp -a~ar,ose ov,,, L-trp -agarose.tile pool of L-citrullene-binding ligands and did
Table 1. Some nucleic acid ligands and their target molecules
Target Ligand type'" Ligand structureb Reference
Small moleculesGrganic dyes DNA 2Theophylline RNA Hairpin with bulge 120- Tryptophan" RNA 13ATP RNA Stem -loop/bulge 3L-Citralline/ RNA 14
L-Arginined
Arginine RNA 15Cyanocobalamine RNA Pseudoknot 16
(vitamin B-12)Biological cofactors RNA Hairpin/bulge 17
(FAD, FMN,NAD', NMW)
MacromoleculesHuman thrombin DNA G-quarfetBacteriophage T4 RNA Hairpin
polymeraseAntipeptide RNA Hairpin 18
antibodyBasic fibroblast RNA 19
growth factorhlV -1 reverse RNA Pseudoknot
transcriptaseE. coli RhD factor RNA Hairpin 20
which suggests the absence of an analogue to a minor groove-binding site or asuitable alternative in the single-strandedstructures.
Further investigation of indicator dyesthat bind to duplex nucleic acids will improve our understanding of the conformation and binding interactions of nucleicacid ligands and may lead to using thesedyes as indicators of the ligands and theirtarget analytes.
Nucleic acid ligands asanalytical reagentsThe application of nucleic add ligands tochemical analysis is a new area of investigation with only a few specific examples todate, primarily in clinical diagnostics. Yetthe possibility of generating stable structures with unique conformations offersenormous potential for chemical sensingand separations_ This is analogous to theuse of enzymes and antibodies in recentyears but offers the advantages of smaller,less cumbersome molecules that, onceidentified, are simple to manufacture andmanipulate. These are important factors,
particularly for immobilization of these
666 A Analytical Chemistry, November 1, 1995
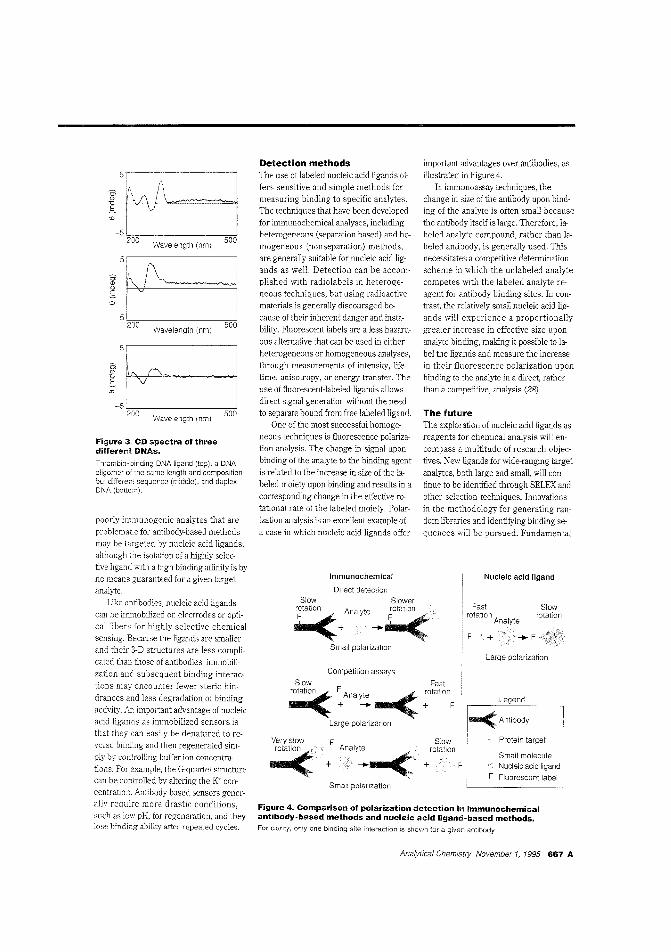
Figure 4. Comparison of polarization detection in immunochemicalantibody-based methods and nucleic acid ligand-based methods.For clarity, only one binding site interaction is shown for a given antibody.
Nucleic acid ligand
Slowrotation
F
Legend
Small moleculeNucleic acid ligand
F Fluorescent label
Large polarization
1-<:Antibody
Protein tareet
F
S.owrotation
+
important advantages over antibodies, asillustrated in Figure 4.
In immunoassay techniques, thechange in size of the antibody upon binding of the analyle is often small becausethe antibody itself is large. Therefore, labeled analyte compound, rather than labeled antibody. is generally used. This
necessitates a competitive determinationscheme in which the unlabeled analytecompetes with the labeled analyte reagent for antibody binding sites. In contrast, the reiatively smal: nucleic acid lig
ands will experience a proportionally
greater increase in effective size uponanalyte binding, making it possible to la
bel the ligands and measure the increasein their fluorescence polarization uponbinding to the analytc in a direct, rathertban a competitive, analysis (28).
The futureThe exploration of nucleic acid ligands asreagents for chemical analysis wit en
compass a multitude of research objectives, New ligands for wide-ranging target
analytes, both large and small, \\@ continue to be identified through SELEX and
other selection techniques. Innovationsin the methodology for generating random libraries and identifying binding se
quences will be pursued. Fundamental
: AnaIY:-<
Small polarization
Small polarization
Competition assays
Direct detectionSlow Slowerratio
(:.+Analyte -+ rati<Slow Fast
~ : Anal~-< ~otationF
Large polarizalion
Very slow
rotati(:
Detection methodsThe use of labeled nucleic acid ligands ofe
fers sensitive and simple methods formeasuring binding to specific analytes.The techniques thai have been developedfor immunochemical analyses, includingheterogeneous (separation based) and ho
mogeneous (nonseparation) methods,are generally suitable for nucleic acidligands as welL Detection can be accomplished with radiolabels in heterogeneous techniques, but using radioactivematerials is generally discouraged be
cause of their inherent danger and insta
bility. Fluorescent labels are a less hazard
ous alternative that can be used in eitherheterogeneous or homogeneous analyses,through measurements of intensity, lifetime, anisotropy, or energy transfer. Theuse of fluorescent-labeled ligands allows
direct signal generation without the needto separate bound from free labeled ligand.
One of the most successful homogeneous techniques is fluorescence polarization analysis. The change in signal uponbinding of the analyte to the binding agent
is related to the increase in size of the labeled moiety upon binding and results in a
corresponding change in the effective rotational rate of the labeled moiety. Polarization analysis is an exce]]ent example of
a case in which nucleic acid ligands offer
Immunochemical
-5200
Wavelength (nm)500
5
6i,I
(J) i'n.s
-5'200 Wavelength (nm) 500
-51,,2"'00,--------""50::-;:10Wavelength (nm)
5,I
~ I~~~J--=:':::=::::::::::::::::::::::::~.s
Figure 3. CD spectra of threedifferent DNAs.
Thrombin-binding DNA ligand (tcp), a DNAoligomer of the same length and compositionbut dlfferen' sequence (middle), and duplexDNA (bottom).
poorly immunogenic analytes that areproblema!:c for antibody-based methodsmay be targeted by nucleic acid ligands,albough tie isolation of a highly selective ligand with a high binding affinity is byno means guaranteed for a given targetanalyte.
Like antibodies, nucleic acid ligandscan be immobilized on electrodes or optical fibers for highly selective chemicalsensing. Because the ligands are sma]]erand their 3-D structures are less complicated than those of antibodies, immobilization and subsequent binding interactions may encour:ter fewer steric hin~
drances and less degradation of bindingactivity. An important advantage of nucleicacid ligands as immobilized sensors isth"t they can easily be denatured to reverse binding andihen regenerated simply by conlro]]ing buffer-ion concentrations. For example, the G-quartet stmcturecan be controlled by altering the K+ concentration. Antibody-based sensors generally require more drastic conditions,such as low pH, for regeneration, and they10se hinding ability after repeated cycles.
Analytical Chemistry. November 1. 1995 667 A
Suggested reading
Edgington, S. M. Bio/Technology 1993. 11.285.
The RNA World; Gesteiand, R F., Atkins.]. F.,Eds.; Cold Spring HarborPress' Cold Spring Harbor, NY,Chapters 19 and 20.
Burke, ]. M.; Berzal-Herranz, A. FASEB j.1993,7,106-12.
Ellington. A. D. Curro Bioi. 1994, 427.Klug, S. J.; Famulak, M.Mol. Bioi. 1994.
20,97.
(13) Famulak. M.; Szostak.]. W.]. Chem.Soc. 1992,114.3990.
(14) Famulok, M.]. Am. Chem. Soc. 1994.116, 1698.
(15)
Linda B. McGown, professor ofchemistry,performs research in fluorescence lifetimetechniques, DNA detection and sequencing, molecular probe techniques, and organized media. Mel.issa]. Joseph recently completed her Ph.D. in chemist,y at Duke University and is now a research chemist atLorillard Tobacco Company in Greensbora, NC Glenn P. Vonk uses organic chemistry to develop novel systems for biochemical analysis; ]. Bruce Pitner performsresearch in bioconjugation, molecular recognition, and combinatorial chemistry; andC. Preston Linn develops novel chemicaldetection methods in the Molecular BiologyDepartment at Beetan Dickinson Research Center. Address comments to McGown at Department ofChemistry, Box90346, Duke University, Durham, NC27708-0346.
M.(16) Lorse!'.,]. R;
1994,33,973.(17) Burgstaller, P.; Famolok. M.
Chem. Int. Ed. Engl. 33,(18) Tsai, D. Kenan, D. ].;
Nat!. Sci. USA 1992, 89(19) ]ellinek, D.; C. K.: Rifkin. D. B.:
Janjic, N. Proc. Acad. Sci. USA1993, 90, 11227.
(20) Schneider, D.: Gold, 1..; Platt, FASEB].1993,7,201.
(21) Wyatt, J. R. et aJ. Proc. Nat!. Acad. Sci.USA 1994,91,1356.
(~~) Piecken, W. A.; Olsen, D.Aurup, H.; Eckstein, F.253,314.
(23) Lin, Y; Qiu, Q.; Gill, S. C. S. Nu-cl.eic Acids Res. 1994. 22.
(24) Shaw,]. P.; Kent, Fishbac!'., J.: Froe!'.-ler. B 1991. 19.747.
(25) Joseph. M. J.; McGown.L. B.; Pitner,]. B.; C submittedfor publication in ]. Phys. Chem.
(26) Rye, H. S. et a1. Nuc!.eic Acids Res. 1992.20,2803.
(27) Larsson. A.; Carlsson.binsson, B.]. Am. Chem.8459.
(28) Hsier.. H. V. Biophys]. 1995. 68. A298
F.W.;Sci.
comments.
Report l
References
(1) Tuerk. C; Gold, L. Science 1990.249.505.
(2) Ellington. A D.; Szostak,]. W. Nature1990, 346, 818.
(3) Sassanfar, M.; Szostak, J. W. Science1993,364. 550.
(4) Tuerk. C; MacDougal, S.; Gold. L. Proc.Nat!. Acad. Sci. USA 1992. 89, 6988.
(5) Bock, L. C.; Griffin, L. c.; Latham,]. A.;Vermaas, E. H.; Toole, J.]' Nature 1992,355.564.
(6) Wang, K. Y.; McCurdy, S.:Swaminatban, S.; Bolton, P. H.try 1993, 32, 1899.
(7) Macaya, R F.; Schultze, P.;Roe,]. A.; FeigoIl, ]. Proe. NatLUSA 1993,90,3745.
(8) Wilson, C.; Szostak.], W. Nature 1995,374,777.
(9) Nieuwlandt. D.; Wecker, M.; Gold, L. Bio-1995,34,5651.
(10) Joyce, Sci. Am 1992,269, 90.ill) Schmidt, K. F. Sci. News 1993, 144, 90.(12) Jenison, R D. et a1. Science 1994,263.
1425.
studies of the nature of molecular recognition by the ligands, and the dependenceof binding strength and selectivity on thesequence, structure, and conformation ofthe ligands, will be investigated. as will theeffects of experimental conditions andcremical modifications. Further identification and characterization of structuralmotifs and physicochemical interactionsmay lead to more rational and efficient approaches to the design of new ligands.
Applications of nucleic acid ligandswill expand beyond clinical diagnosticsand therapeutic monitoring to a broaderarena of analytical chemistry. Immobilization chemistry, including reversible attachment and denaturation schemes, willfacilitate the use of ligands as reagents atsensor or chromatographic support surfaces. Explorations of chiral recognitionmay lead to applications in the separationoJ enantiomers. Development of novel detection strategies will playa key role inthe utilization of nucleic acid ligands tomaximize the effectiveness of these reagents. Because methods for isolation,characterization, and modification of nucleic acid ligands are still at the embryonic stage, new properties and applications of these uniquely versatile reagents will unfold with further study.
The authors are grateful to Bob Hanson ofBecton Dickinson for c1e~igning the figure
and to Lany Gold and Bany PoliskyPharmaceuticals for their helpful
Industry's Future:Changing Patternsof IndustrialResearch
ACS Publications C.ltalog now available oninternet: gopher acsinfo.acs.org
American Chemical SocietyDistribution Office Dept. 741155 Sixteenth Street, NW
Washjngton, DC 20036
Or Call TOLL FREE 1-800-227-5558(in Washington, D.C. 872-4363)
and use your credit card!FAX, 202-872-6067.
Order trom
Thisfascinatingvolumeprovides thereaders withan understanding ofthe dynamicprocessesthat makeindustrialresearch aprincipaldriving force
in creating technical change,producing economic growth, andstrengthening the technical institutions in society.
It describes and analyzes the majorfactors that shape the conduct andorganization of industrial research/including the internationalization ofR&D, restructuring of industry,declining defense expenditures andthe pressure to develop access tosources of technical change outsidethe corporation.
The volume presents approachesfor improved industry relations withgovernment and academia, discussescomplex conditions for conductingindustrial research effectively andanalyzes potential new conditionsthat can shape future industrialresearch. The experiences of specificcorporations with modern management of technology are also described.Herbert I. Fusfeld384 pages (1994)Clothbound: ISBN 0-8412-2983-X$39.95Paperbound: ISBN 0-8412-2984-8$24.95
668 A Analytical Chemistry, November I,. 1995

Incomparable Optics.Very Comparable Price.
8ruJ<er AntJJytjsche MflssttJdr1il( GmbHWikingerstr. 13. D-76189~
Till. 0721/952fMFax0721/952EP12
~e Klday's routine FT-IR spectre>melJlr and you"~ /hat )W oftert
Il8Y8 to sacrifice either perlorrr\MIce oraffordabiJity. We a/8ruker believe thalour superior optics shot.Jd be avatfable
to ail users. Leo/< IntoVE~ 22ft~. tli(Jh pM«fI'l8f'tCt1 FT-lRsystem withewa~ sample cxxnpartment ROCK$OI.JO-a~, llIXe!XJokor PC C(J8ftJti«l wiftI e8SY 0PUS1.Tsd!.W81f'6. An opfiona/ 8eIrnBender- mM<tJ'S
fTIIJItIpIe potl$8~ for extfJfllal~. sudlas GC. TGA ormicr~. And buiIt·in~ICSand 8tAO-C8/ibr~lion~ it opBf81ing
rBiiabJy al optimum {)6ff<xrn8rlce.So. wily c:orrprcmise al sIf? l.cx:>k inloVECTOR 22 and tlrn}(l(X FT-IR work
into 8!lighI~pustTbuftonopeIation. For 800./fa/e. ()(rflC()$(J(l$6
r9Wlf.s AsK rOf oefiW 00 VECTOR 22and ccmpare 10 see how afforcJabieBrli<9fqQality has become.

Biochem' .Critical research.
target.•tune.your
must-rmd list!Biochemistry is a must-read for researchers in chemistry, biochemistry, andmolecular and cell biology. Every week(in over 12,000 pages a year), Biochemistry gives you fast-breaking, state-of-the-artresearch articles on a variety of importanttopics such as:
• Bioenergetics• Carbohydrate chemistry• Enzyme and protein biochemistry• Gene structure and function• Immunochemistry• Lipid and cell membrane
biochemistry• Molecular and cell biology• Virology
Before you begin your next researchproject or write your next proposal,subscribe to Biochemistry for the mostrelevant theories and methodologies inyour field of endeavor.
EditorGordon G. Hammes
Duke University Mediccl Cl:nter
Associate EditorsMarv Barklev
j.ouisian~, .Slale [/niversilyMarc G. Carol!
Duke Umversily Mediccl CenterEar! 'vV. Davie
Univfrsit), (~r WashingtonA.
iHadisrJnArnoL.
Duke University Mediad Cen/aPaul L. Modrich
Duke University Media;,! CenterWilliam \\'. Parson
Leslie WilsonUniversity 4 California, Santa Barbara
ACS IIIPUBUCATIONSFJ'-'O!ful! N"J'/Jllri'i'_,./ill" tI,,- C/I<'!I//(ti/ S(I(ll(<,'
1995 Subscription RatesCanada & All Other
U.S. l\.lexlcoACS Members
One Yeal 11:) S '22" 46kTwo Years $ 207 S 913
NonmembersOne 'leal 51,.517 SI,62b 1.870
-'\ir Senice Included
Call toll tree 1-800-333-9511 today.Outside the U.S., please call 614-447-3776.Or mail or fax J)'] .your order to: .lloe lCnnstrvAmericanChemicalSociety,Member &SubscriberServices,P.O. Box 3337,Columbus, OH43210 FAX614-447-3671.

All eel in!l s,,.1 _
37th Experimental NMR ConferenceMarch 17-22, 1996.Pacific Grove, CAContact: ExperimentalNMR Conference,1201 Don Diego Ave.,Santa Fe, NM 87505
(505-989-4573; fax 505-989-1073)
7th International Symposium onLuminescence Spectrometry inBiomedical Analysis: DetectionTechniques and Applications inChromatography and CEApril 17-19, 1996. Sophia AntzpoLis, FmnceContact: Willy R. G. Baeyens, Univer,;ity ofGhent Pharmaceutical Institute, Dept. ofPharmaceutical Analysis, LaboratOlY of DrugQuality Control. Hare1bekestraat 72, D-9000Ghent. Belgium (32-9-221-8951; fax 32-9-2214175; e-mail: \[email protected])
International Conference on Pharmaceutical Applications of Near-IRSpectroscopyfune 13-15, 1996. Stocililolm, SwedenContact The Swedish Chemicalvmlllnt,al<m "'", 3 tf, S-11124 Stockholm,den fax 46-8-106-678)
EUROPTIRIODE '96March 31-April 3, 1996. Zurich, SwitzerlandContact: Sergio Bellucci, \.1anagement andTechnology Institute, Technopark ZJric~'1,
PfingstwPidstr8sse 30, CH-8005 Zurich,Switzerland (41-1-445-1200; fax 41-:-4451202)
HPLC '96June 16-21,1996. San Fnmcisco, CAContact: Janet Cunningham, Barr Enterprises, 10120 Kelly Rd., Box 279, Walkersville, MD 21793 (301-898-3772; fax 301-898·5596)
60601 (312-527-2011)
18th International Symposium onCapillary ChromatographyMay 20-24. 1996. Rioa del Garda. ItalyContact P. Sandra, l.O.PM.S., Kennedypark20. 3-8500 Kortrijk, Belgium (32-56-204960; fax 32-56-204-859)
7th International Symposium onSFC and SFEMarch 31-April4. 1996. Indianapolis. INContact: Janet Cunningham, Barr Entet"prises, 10120 Kelly Rd., Box 279, Walkersville, MD 21793 (301-898-3772; fax 301-8985596)
8th InternationalSymposium onHPCEjan. 21-25. 1996.Orlando, FLContact:Schlessinger,1015,400 East Randolph Dr., Cllicago, IL
8th Sanibel Conference on Mass
~ Spectrometry~ jan. 20-23, 1996.;..« Sanibel Island. FL
Contact: American So-ciety for Mass Spectrome:ry, 1201 DonD:ego Ave., Santa Fe,
NM 87505 (505-989-4517; fax 505·989-1073)
6th Symposium on EnvironmentalToxicology and Risk Assessment:Modeling and Risk AssessmentApril 14-18, 1996. Orlando, FLContact: F. James Dv.,;yer, National BiologicalServicp, 4200 New Haven Rd., Columbia,MO 65201 (314-875-5399; fax 314-876-1896;e-mail: or Thomas R.Doane, Centerview, Suite 260,San Antonio, TX 78228 (210-738-8771, ext.109; fax 210-737-5928; e-mail; doane@battelle.or-g)
5th International Conference onAutomation, Robotics, and Artifi.cial Intelligence Applied to Analytical Chemistry and LaboratoryMedicinejan. 15-20. 1996. San Diego, CAContact: R. A. Felder, Dept. of Pathology, University of Virginia, Dox 168, Charlottesville,VA 22908 (804-924-5151: fax 804-924-5718) orJ. van del' Greet, TNO and Universitf of LeicIe:l, P.O. Box 360, 3700AJ Zeist, The Netherland, (:J1-:':404-44144; fax 31-3404-57224)
Conferences
Pitteon ~96
March 3-8, 1996. Chicago, ILContact: .Alma Johnson. Theference, Suite 332, 300 PennPiHsburgb, PA lS23:i-SS03 (412-825-3220; [ax412-825-3224)
Eastern Analytical Symposiumand ExpositionNov. 12-17.Somerset. NjContact: Eastern Analytical SYillP()silJm,P.O.Mon,chanin. DE
19710-063:J (302-738-6218; fax 302-738-5275)
26th International Symposium onEnvironmental Analytical ChemistryApril 9-12, 1996. henna, AustriaContact M. Grasserbauer, Institute for Ana-lytical Vienna of Tech-nology, Getrei,:len1arl{t 9/Ei1, i~-1I)60
Austria (4-31-58801-4824; fax 431-5867813)
Materials Research Society 1996Spring MeetingAp,·il 8-12. 1996. San Francisco, CACnntact: WRS, Meetings Dept.. 9800 McKnight Rd., Pittsburgh, FA 15237 (.02-3673003; fax 412-367-4373)
Analytical Chemistry, November 1, 1995 669 A

When you1re going from zero to 17,000 mph,the last thing you want is dirty fuel.
Scott Specialty Gases8141 e.abd.P.O.b310,~PA 1~T.-21So~1FI.e 2'lSol'elS432O
No wondef NASA sciermts chose ScoIlIO help them deYaIopthe standardS lor ~Zing sIUtle kJels.
Alter all, Sc::ol1I\as also established standards lor~enlssions. ~YQlaije organic ai" poIIIJanls, andltle meISI.J'e
ment 01 C8Ibon dioxide in the attnO$phel$, 10 name a1fJ«. we'vesupplied the specialty gases and equipment needed 10 meetthose standards, induditV;l par1S-)leI'-tIiIion rrixtures~~pore zero gases. ArK! we hrfe 8MBys suppI:ed them qliddy.~onearth.~iI~
As to spacesh~ \ulc:hIs, SC:oCt gases haYebeel1 "rrissioncrliclIl.· gecauseNiST-traoea.bIe Soot! gases are wnono 1tlo$eused to c:aItIl1\te Ile spedr<JmeIer on thelalXlCh pad. The spectrometer dleOO the negnty of the shL(tJe's erUe fuel sys1em.Ar;j ilit d9lecIs a fuel~, the rNssion is ClW'lOeIIed.
When jOelmi$$ion is orD:aI. dIpend on gases lh8t set the$l;Ildards be~ and pettlrrnlwICe: SCOtt speciaRy gases.
caJ 1-iOO-21SCOTT lor a~ calalog01 OU" speddy gases WId equipmeft
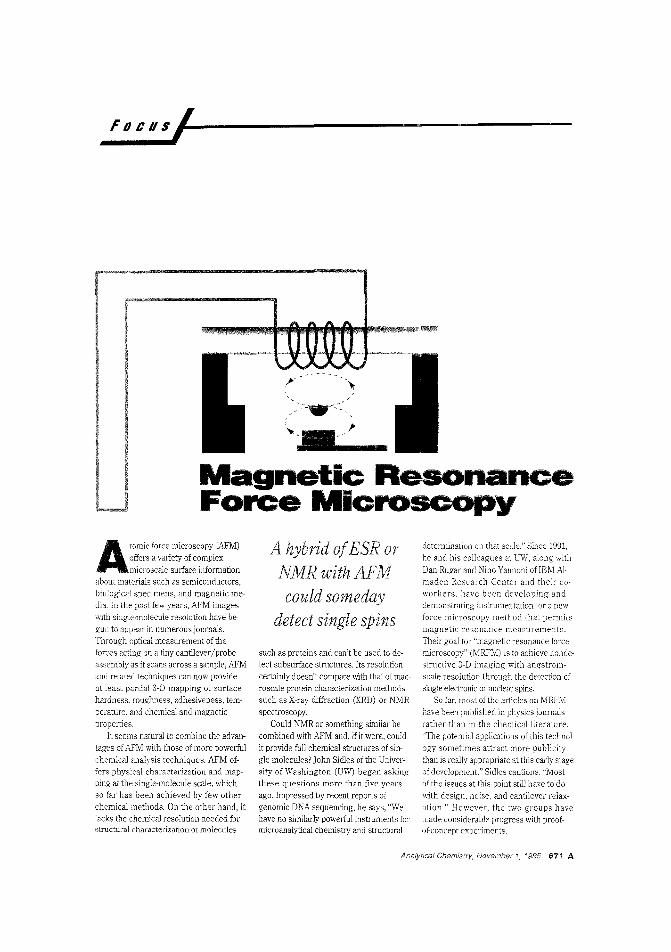
Foe us,1.(;..-------------------
, --.--"'"'~~
Magnetic ResonanceForce Microscopy
Atomic force microscopy (AFM)offers a variety of complexmicroscale surface information
about materials such as semiconductors,biological specimens, and magnetic media. In the past few years, AFM imageswith single-molecule resolution have begun to appear in numerous journals.Through optical measurement of theforces acting on a tiny cantilever/probeassembly as it scans across a sample, AFMand related techniques can now provideat least partial 3-D mapping of surfacehardness, rol1ghness, adhesiveness, tem
perature, and chemical and magneticproperties.
It seems natural to combine the advantages of AfM with those of more powerfulchemical analysis techniques. AfM offers physical characterization and mapping at the single-molecule scale, whichso far has been achieved by few otherchemical methods. On the other hand, itlacks the chemical resolution needed forstructural characterization of molecules
hybrid ofESR orNMRwithAFMcould someday
detect single spins
such as proteins and can't be used to detect subsurface structures. Its resolutioncertainly doesn't compare wifh that of macroscale protein characterizatioIl melhodssuch as X-ray diffraction (XRD) or NMRspectroscopy.
Could NMR or something similar becombined with AFM and, if it were, couldit provide full chemical structures of single molecules? John Sidles of the University of Washington (UW) began askingthese questions more than five yearsago. Impressed by recent reports ofgenomic DNA sequencing, he says, "Wehave no similarly powerful instruments formicroanalytical chemistry and structural
determination on that scale." Since 1991,he and his colleagues at UW, along withDan Rugar anel Nino Yannani of IBM Almaden Research Center and their coworkers, h2ve been developing anddemonstratir:g instrumentation for a newforce microscopy method tha'~ permitsmagnetic resonance measureme:1ts.
Their goal for "magnetic resonance forcemicroscopy" (MRFM) is to achieve 11Ondestructive 3-D imaging with angstromscale resolution through the detection ofsingle electronic or nuclear spins.
So far, most of the articles on MRFMhave been published in physics journalsrather than ln the chemical literature."The potential applications of this technology sometimes attract 'Dare pu blicitythan is really appropriate at this early stage0: development," Sidles cautions. "Most
of the issues at this point still have to dowith design, noise, and cantilever relaxation." However, the two groups have:1]ade considerable progress with proofof-concept experimer:ts.
Analytical Chemistry, November 1. 1995 671 A
Focus'
In 1991, using an adapted magneticforce microscope, Rugar and visiting sci
entist Othmar Zuger performed ESR imag
ing with micrometer resolution. Sincethen, the groups have performed NMR im
aging at the same resolution with a sensitivity of 1012 nuclei. "We've actuaily quite a
long way to go before we can detect sin
gle spins, but the good news is, that's a
thousandfold more sensitive than conventional NMR," says Rugar.
Squeezing NMR onto acantilever tipHow do you put an NMR spectrometer on
an AFM cantilever? Obviously, miniatur
ization is not the answer. Instead, MRFMis based on the magnetic field gradients
used for magnetic resonance imagingand on the Stern-Gerlach effect (the ideathat extremely small groups of spins are ef
fectively self-polarizing). In current de
signs, the sample material is mounted onthe cantilever with epoxy and placed close
to a very small permanent magnet, which
creates a field gradient. A radio frequency(rf) coil that modulates the sample magnetization at the resonant frequency of the
cantilever sits nearby.
This configuration is the reverse of the
one used for conventional AFM or mag
netic force microscopy. In those me~hods,
the cantilever contains the sensing instrumentation and rasters across a ~arnple
mounted on a stage. "Ultimately, we want
to put the permanent magnet on the canti
lever," Rugal' explains, "but the magnetic
tips that are suited to our current condi
tions are too large to lit. They have to be~ : mm in diameter to develop gradientsthat are compatible with the current sen
sitivity of lhe instrument, but the cantilever is only 0.1 mm in length, so puttingthe sample on the cantilever is an expedi
ent first step."
The gradient created by the permanent magnet provides the spatial resolu
tion for imaging, says Yannoni. "A perma
nent magnet has a strong magnetic fieldthat falls off rapidly. The smaller the mag
net, the larger the gradient it will have."
Current magnets generate gradients aslarge as 10 G/l'm to give a spatial resolution of ~ 2 pm. Eventually, very small
magnets should be able to generate gradients of ~ 100 G/lA, which in principle
could improve spatial resolution to 0.1 A.
lVlRFM exploits the gradient for "sliceselective" imaging of the sample in a man
ner similar to that of medical MRI but on
a much smaller scale.Because of the gradient created by the
magnet, the field at various points sur
rounding the magnet tip is either toostrong or too weak for resonance with the
sample. Only a specific cross-section of
the sample lies at the right distance from
the magnet for its spin precession to be onresonance and to cause deflection in thecantilever tip. As the radio frequency is
scanned in steps, the position of this resonance zone moves aloJg the sample inthe z direction and allows imaging of the
entire sample in slices. "For each frequency step. the cantilever with the sam
pie is physically raster scanned in x and ywith respec~ to the permanent magnet toachieve full 3-D imaging," Rugar says.
magnet provideshigh enough
Most of the rf modulation techniques
being used for MRFM are analogous to
continuous-wave (CW'; NMR, says Yannoni. "In normal NMR and ESR [electron
spin resonance], you have direct detection
of spin precession at frequencies of a fewhundred MHz or GHz, respectively. However. the cantilevers can't oscillate fast
enough to keep up with the precession, so
we have to match the spin freque~cies bymethods such as cyclic saturation for ESR
and cyclic adiabatic inversion for NMR
We've also done some pulse experimentsfollowed by CW measurement."
MRFM differs from conventional NMR,
ESR, and MRI in that the rf coil is usedonly for manipulating the sample spins,
~ot for detection. Based on current un
derstanding, says Sidles, it appears that
neither rf coils nor superconducting quantum interference detectors (SQUIDs),
another possibility he considered early on,are adaptable to detect spins at such a
small scale. "I mention this to provoke the
SQUID community to design one thatcan," he says. Optical detection of cantile
ver response to small forces is muchmore sensitive, he says. In this case, a ti
ber-optic intetierometf:r registers the har
monic cantilever deflections after deconvolution produces images of the sample on
the cantilever.
Forcing the issueThe main limitation to the use oi MRFIViis its force sensitivity. "It turns out that de
tecting a single spin requires a force sen
sitivity 0' ~ IO- lli \J for unpaired electrons and rv 10-H
) N for pro tollS," Sidles
says. MRFM currently detects forces at~ 10-16 N, which he and Rugar point out
is 104-106 times more sensitive than con
ventional AFM. It's just sensitive enoughto try for single-spin ESE. the current
focus of the IBM group's experiments,but it's still between 100-fold and lOOO-fold
less sensitive than it needs to be forsingle-spin NMR.
Increasing the force sensitivity of
MRFM will require a decrease in noise
picked up by the optical interferometer
and increases in cantilever relaxation time
and sensitivity. In practice, the experi
ments '11'11 probably have to be run atcryogenic temperatures (3-10 K) to re
duce thermal noise. The current experi
ments are usually run at room temperatureand at mimtorr vacuum.
Increasing the cantilever sensitivity willalso require ways to make the cantilever
thinner md more flexible. "CommercialAFM cantilevers are 0.5-1 p111 thick,"
says Rugar. "We've borrowed an inte
grated circuit fabrication technique whereyou lay down thin layers of silicon nitride
in the shape of a cantilever on a silicon
substrate and then etch the substrate out
from under the cantilever. One of our post
docs, Storrs Hoen, has made cantilevers
0.09 pm thick for our NMR experiments.We've even made some cantilevers thatare only 0.02 pm thick."
The thinner and more sensitive camilevers should accommodate the ll~e of
higher magnetic field gradients as well asshorter distances between the cantile
ver and magnet for greater gradient resolution. Currently, the cantilever-magnet
672 A Analytical Chemistry. November 1. 1995
Editor: Robert W. Lenz~ Universify of Massachusetts
$1,312
S 209S 401
$1.270
$ t36$ 255
$1,197
$ 84$ lSI
S1.145One Year
ACS Members One YearTwo Years
Nonmembers
(Member rates are for personal use only. Jour1aI sut,scr'lptioos start January 1995.For nonmember subscriptions in Japan, contact Maruzen Ltd.)
ACS IIIPUBUCATIONSAmerican Chemical Society
Member and Subscriber ServicesP.O. Box 3337
Columbus, OR 43210, Outside the U.S. dial (614) 447-3776, or you may fax your order to 614-447-3671.
MACROMOLECULES -
To place your order simply call1-800-333-9S11 in the U.S!, orsend your order to:
...Is Yours Today With MACROMOLECULES
n~0\~::e~h~:rsr~~i1~~:~e not!'
~~:~r~~~~:~:?~;u~~~~i;ues.•... iregard as the most authoritative, .'in-depth coverage anywhere. '
Each biweekly issue of ,MACROMOLECULES will bringyou up-to-date, peer-reviewedcoverage of all aspects of polymerchemistry including:
'" synthesis
'" polymerizationmechanisms and kinetics
'" chemical reactions
'" solution characteristics
'" bulk properties of -- Jorganic polymers, inorganicpolymers and biopolymers
For information you can trust to keep you on the cutting edge of thescience of polymer chemistry, you simply cannot afford to do without asubscription to :MACROMOLECULES,
•• TheFuture......11. of Polvmer.J'- (e' '1.&:---__ ResearchSeeking out potential
After five years and much publicity, the
researchers at lTW and IBM are cautious
about making too many claims for MRFM.
'"T1ere arc so many competing imagingtechnologies and other good techniques
for single-molecule detection that develop
ing MRFlvl for those purposes alone
makes no sense," Sidles says. On the other
hand, Yannoni says, "We've already made
a lot of progress. Because of the improve
ment in smsltivity, the NIvlR community
is really following M~RM closely."
The ability to characterize individual
protein structures in sItu rather than puri
fied in solution or in crystallized form for
NMR or XRD would be extremely valu
able. Sidles says. especially for trans
membrane proteins Lhat are highly li
pophil'c and hard crystalllze. These
proteins tmd to have active sites for hor
mone or drug reception or ion transport
channels. "Force :nlcroscopes don't see
into the channels and active si',es, but
NMR COUld," says Sid'es.
Because electron spins are easier to de
tect than nuclear spins, ESR applications
of iVIRI"M might come first. "ESR is not as
useful for structural determination as
NMR," Rugar says. but it could be useful
[or spi~-jabejing techniques. Some of the
suggested applicatioIls include the obser
va~ion of receptor-ligand binding or the
lattice stl1lcture of lipid membrane bilay
ers. Sidles adds that many metalleproteins
have single electron spins and tht the
component su'Junits or strands ofblologi
cal molecules such as DNA, RNA, and
proteins could be spin labeled for observa
tion of the self-assembly process. "1 see
these uses of MRFiVI as a key bridge tech
nology that can lead to more difficult pro
ton spin applications iJ the long term," he
says. "Scanning probe microscopy in general is a fertile technology. and this adds
one more wrinkle," Deborah Noble
Suggested reading
distance is typically 0.1-1 mm, Rugar says.
"For single-spin experiments, we'll need
to decrease that to a few hundred ang
str'Jms."
Analytical Chemistry. November 1. 1995 673 A

ACSSTUDENTMEMBERS
Advance ACS Abstracts (Semi-monthly) Co-published with CASStudent MembetS $ 30.00 $ 53.00 $ 81.00 $ 100.00
All OthersAirSvc.
$144.50
EuropeAirSvc.
$122.50
Canada!Mexicous.Print 1995
Journal ofChemical information and Computer Sciences (Bimonthly)Student Members $ 17.25 $ 25.25 $ 34.25 $ 39.25
Journal ofMedicinal Chemistry (Biweekly)Student Members $ 43.50 $ 74.50
All OthersAirSvc.
$ 31.50
EuropeAirSvc.
$ 27.50
Canada!Print 1995 US. Mexico
New editor!Accounts ofChemical Research (Monthly)Student Members $ 14.50 $ 23.50
Biochemistry (Weekly) Also available on CD-ROM'Student Members $ 86.25 $ 195.25 $ 355.25 $ 439.25
Analytical Chemistry (Semi-monthly)Student Members $ 30.00 $ 67.00 $113.00
The Journal ofOrganic Chemistry (Biweekly)$ 138.00 Student Members $ 57.00 $ 107.00
The Journal ofPhysical Chemistry (Weekly)Student Members $ 81.00 $ 183.00
$ 179.00
$ 293.00
$ 219.00
$ 360.00
JouTlUllofAgricultural and Food Chemistry (Monthly)Student Members $ 26.25 $ 45.25 $ 68.25
Environmental Science & Technology (Monthly)Student Members $ 33.00 $ 57.00 $ 85.00
lndustrinl & Engineering Chemistry Research (Monthly)Student Members $ 48.75 $ 72.75 $ 100.75
Bioconjuga1£ Chemistry (Bimonthly)Student Members $ 23.25 $ 32.25 $ 38.25
More issues!Chemical Research in Toricology (8 Issues/Year)Student Members $ 35.25 $ 44.25 $ 53.25
Chemical Reviews (8 IssuesfYear)Student Members $ 27.00 $ 43.00 $ 67.00
Chemistry ofMaterials (Monthly)Student Members $ 37.50 $ 56.50 $ 76.50
CHEMTECH (Monthly)Student Members $ 21.00 $ 31.00 $ 38.00
Energy & Fuels (Bimonthly)Student Members $ 36.75 $ 45.75 $ 53.75
Chemistry & industry (Semi-monthly)Published bY the Society of Chemical IndustryACS Members $ 61.00 $ 61.00
Journal ofPharmaceutical Sciences (Monthly) Co-published with APhAACS Members $ 30.00 $ 45.00 $ 65.00 $ 74.00
$ 230.00
$122.75
$ 188.00
$ 107.75$ 75.75
$115.00
Organometallics (Monthly)Student Members $ 60.00 $ 91.00 $ 137.00 $ 160.00
ALSO AVAILABLE AT ACS MEMBER RATES ...Angewantlte Chemie (Semi-monthly) A publication of the GDChFirst Class $ 168.00 $ 168.00Air Mail $ 198.00 $ 198.00
Biotechnology Progress (Bimonthly) Co-published with AIChEACS Members $ 32.00 $ 37.00 $ 43.00 $ 47.00
New!Chemical Health & Safety (Bimonthly) Co-published with CHAS DivisionACS Members $ 25.00 $ 30.00 $ 34.00 $ 36.00
Langmuir (Monthly)Student Members $ 51.75
New editor!Macromolecules (Biweekly)Student Members $ 63.00
$ 114.75
$ 82.25
$ 192.25
$ 102.00
$ 58.75
$ 77.00
$ 43.00
$ 88.50
$ 57.25
$ 42.25
$ 162.25$ 109.25Inorganic Chemistry (Biweekly)Student Members $ 68.25
$ 41.75 $ 65.00$ 65.00
JOUTIUlI ofPhysical and Chemical Reference Data (Bimonthly)Jointly published by ACS, AlP and NISTACS Members $ 93.00 $ 103.00 $ 118.00 $ 118.00
Today', Chemist at Work (Monthly)ACS Members $ 17.00 $ 17.00
More issues!Journal oftheAmerican Chemical Society (Weekly) Also available on CD-ROM'Student Members $ 80.25 $ 149.25 $ 261.25 $ 321.25
Journal ofChemical & Engineering Data (Bimonthly)Student Members $ 27.75 $ 33.75 $ 39.75
PUBLISHED BY THE CHEMICAL SOCIETYOF JAPAN, AVAILABLE FROMACS ...
Bulletin ofthe Chemical Society ofJapan (Monthly)ACS MembersjNonmembers in North America:
$552.00
Chemistry Letters (Monthly)ACS Members/Nonmembers in North America:
$298.00
PriceTitlePriceTitle
---------------------------,Sewe .:t.:t.:t~~
Start my one-year subscription to the ACS journals listed below at ~.the special price indicated. My satisfaction s completely guaranteed with ACS'srefund-in-full cancellation policy. (Please allow 45 days for delivery to begin.)
Expires Signature _
Name/Address _
o Enclosed is $ (Payable to American Chemical Society)
o Bill me.o Charge my VISNMasterCard.Acet. # _
NOTE: Member rates are for personal use only.Journal subscriptions are based on a calendaryear. Member subscriptions to Advance ACSAbstracts, Analytical Chemistry. ChemicalHealth & Solely, CHEMTECH, EnvironmentalScience & Technology, Journal ofPharmaceutical Sciences, and Today's Chemist at Work maystart any month and expire one year later: Pleaseindicate starting month.
o I am a student member.o Please send me infonnation on how to become a student member.
Order TOLL FREE 1-800-333-9511.Outside the U.S. call 614-447-3776. FAX: 614-447-3671.
MAIL TO: American Chemical Society· Publications Marl<eting Department1155 Sixteenth Street, N.W. • Washington, D.C. 20036 0954X
, To find out about ACS Publications on DISCcall 1-800-333-9511 or 614-447-3776.
ACS IIIPUBllCKI10NSErrmtiQ[ RrruuTces fir Iht Ch~mic4[Scimces
Pro due IRe vie IV ,,.L _
I
X-ray phowelectron spectroscopy (XPS),or electron spectroscopy for chemical an21ysis (ESCA), as it is also known_ can beused to c'1aracterize the elemental andchemical composition of materials at theirextreme surface, at depths nogreater than 10 nm (l00 although withspnttering it can be used for depth profiling. Applications include :J.uantitative surface analysis, stoichiometric determinations, detection of oxidation stat~s, andthe obsclvation of layer growth, interfacestructures, and surface modifications. Inthe past 15 years, these applications havebecome increasingly important to the semi-conductor, polymer, and magneticmateriais
All elements except hydrogen andhelium are detectable by XPS Ar X-raytube or syncllrotron beamllne sends abeam of X-rays onto the sample surface,causing the ejection of core and valence~
level eIee-rons (photoelectrons). The photoelectrons arc focused into 2n electronenergy aLalyzcr and then onto a detector,all under ultrahigh vacuum. The photonelectron energy is characteristic not onlyof the element but also of the chemical en-
new yc',c(rYI"n
so new
vironment of the ato111s from which theelectrons were ejected.
Roufine applications ofXPS have beenestablished to the point where XPS can bea modular add-on feature for a materiabprocessing line. By contrast, resea:-chgrade instrurrents are becoming bothmore powerful and more diverse in theirdesigns. In the past five years. newer capabilities such as imaging have been incorporated into most of the commercialsearch-grade instf'lments. However, different manufacturers use widely varyingstrategies and instrumentatior to attainthe same goals.
\Ve asked Julia Fulghurr: of Kely. StateUniversity for her com:nents on recenttrends in XPS instrumentation and her advice for potential buyers. Table l, al:hough :1Ol intended to be comprehensive,features a selection of representative instruments. ?or more information, circ:e~he appropriate number on the :eacer service card, use the Information Express;)age, or send an e-mail message [email protected] wi:~h a subject 1inccontaining one of the renecor keywordslisted at the boltom of the table.
Sources"Recent1y, some significant differenceshave developed in XPS source design,"says F'uIghum, whose IaboratolY hc:s beena development site for some of :he XPSinstll.1mer ts from Krafos Analytical 1'h2most common X-ray sources for XPS areMg and Al KQ sources, with monochromatic Al Ku sources becoming increas-
popuhr.monochromator decreases the X
ray linewidth for improved energy resolution and filters out the Bremsstrahlungand X-ray satellite background. Mono-
Analytical ChemisIW November 1, 1995 675 A
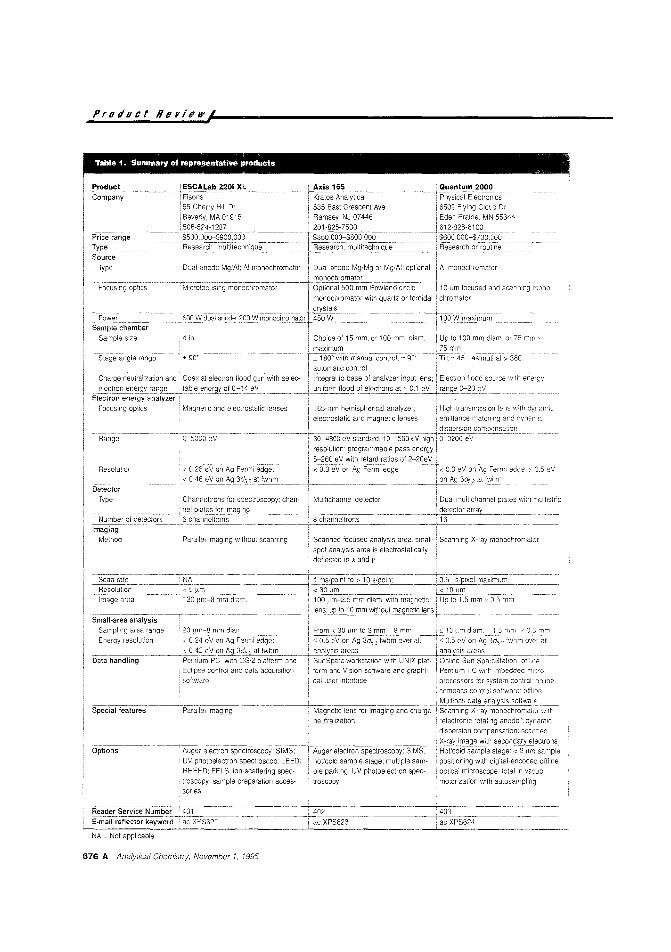
Prot/uel Review'
Table 1. Summary of representative products
ac
hot/cold sample stage; multiple sample parking" UV photoelectron spectroscopy
neutra ization
NA ~ Not applicable
616 A Analytical Chemistry, November 1, 1995
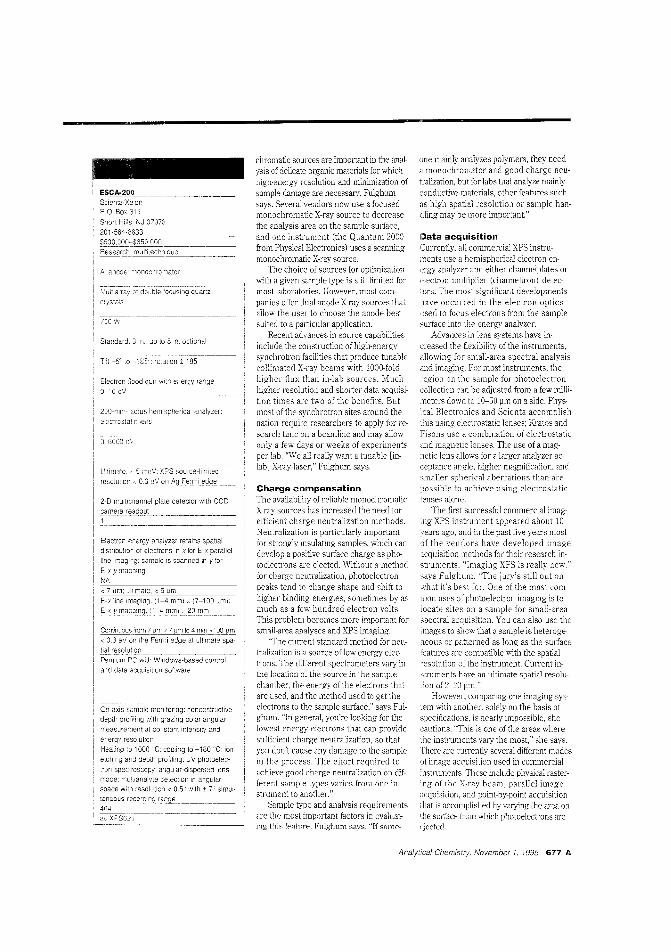
Data acquisitionCurrently, all comme:cial XPS instruments use a hemispherical electron energy analyzer and either channe1plates orelectron multiplier (channe1tron) detec'ors. The most significant developments!lave occurred in the electron opticsClsed to focus electrons from the samplesurface into the energy analyzer.
Acvances in lens systems have increased the flexibility of the instruments,allowing for small-area spectral analysisand imaging. For most instruments, theegio:l on the sample for photoelectron
collection can be adjusted from a few millimeters down to 10-50 pm on a side. Physical Electronics and Scienta accomplishihis using electrostatic lenses; Kratos andFisons use a combination of electrostaticand magnetic lenses. The use of a magnetic lens allows for a larger analyzer acceptance angle, higher magnification, andsmaller spherical aberrations than arepossible to achieve using electrostaticienses alone.
The firs1 successful commercial imagjng XPS lnstrument appeared abou11Oyears ago, and in the past five years mostof the venelors have developed imageacquisition methods for their research instruments. "lmaging XPS is really new,"says Fulghum. "The jury's still out onwhat it's best for. One of the most common uses of photoelectron imagbg is tolocate sites on a sample for small-areaspectral acquisition. You can also use theimages to shew that a sample is heterogeneous or patterned as long as the surfacefeatures are compatible with the spatial·-esolution of the instrument. Current instruments have an ultimate spatial resolujon of 2-20 pm"
However, comparing one imaging sysLem with another, solely on the basis ofspecitications, is nearly impossible, shecautions. "This is one of the areas whereLhe instruments vary the most," she says.There are currently several different moelesof image acqllisition used in commercialinstruments. These include physical rastering of i"he X-relY beam, para11eI imageacquisition, and point-loy-point acquisitionlhat is accomplished by valying the area onLhe surface ti-om which photoelectrons areejected.
one mainly analyzes polymers, they needa monochromator and good charge neu1ralization, but for labs that analyze mainlycandective materials, other features suchas high spatial resolution or sample han(lling may be more important"
chromatic sources are important in the analysis of delicate organic materials for whichhigh-energy resolution and Elinimization ofsample damage are necessary, Fulghumsays. Several vendors now use a focusedmonochromatic X-ray source to decreasethe analysis area on the sample surface.and onc instrumcnt (thc Quantum 2000fi-om Physical Electronics) uses 2 scanningmonochromatic X-ray source.
The choice of sources for optimizationwith a given sample type is stil11imited formost laboratories. However, most companies ojer dual-anode X-ray sources thatallow the user to choose the anode bestsuited to a particular application.
Recent advances in source capabilitiesinclude the construction of high-energysynchrotron facilities that produce tunablecollimated X-ray beams with 1000-foldhigher flux than in-lab sources. Muchhigher resolution and shorter data acquisi
tion times are two of the benefits. Butmos1 olthe synchro1ron sites around thenation require researchers to apply for research time on a beamliJ.e and may allowonly a few days or weeks of experimentsper lab. "We all really want a 1unable [inlabl X-ray laser," Fulghum says_
Charge compensation"n, d"ctU<WlldCy of reliable monochromaticX-ray sources increased the need forefficient charge neutralization methods.Neutralization is particularly importantfor strongly insulating samples, which candevelop a positive surface charge as photoelectrons are ejected. Wibollt a methoclfor charge neutralization, pr;otoelectronpeaks tend to change shape and shift tohigher binding energies, sometimes by asmuch as a few hundred electron vo11s.This problem becomes more important forsmall-area analyses and XPS imaging.
'The cUl-"ent standard method for neutralization is a source of low-energy electrons_ The different spectrometers vary inthe loca1ion of the source in the samplechamber, the energy afthe electrons thatare used, and the method used to get theelectrons to the sample sUliace," says Fulghum. "In general, you're looking for thelowest energy electrons that can pmvidesufficient charge neutralization, so thatyou don't cause any damage to the samplein tte p:ocess. The effort required toachieve good charge neutralization on different sample types varies from one instrument to another."
Sample type and analysis requirementsc.re the mosl important factors in evaluating this fpature, Fulghum says. "If some-
quartz
and data acquisition software
E!ectron energy analyzer retains spatialdistributior of electronsn x lor E·x parallelline imagirg: sample is scanned in y br
E-x-y mappingNA
2-D multichannel plate aelector with CCD
< 7 fln; ultlmaI8~.<=5"~,,,m _E-x line Imaging, (1-4 mm) (7-100 ~lm):
~-:<..::Y mClFping...:J1--.:-4 mm) /20 mm
Ultimate 5 meV XPS source-limited
resolution 5 0.3 e~~g Fermi e29..~__"
06000
Electron frood gun with energy range0-10 eV------_ ---_ _.__._ _--_._ .._.._._-
Tit -5'" to ... 185' ro',ation ± 185
On-axis sample m01itoring: nondestructivedepth profiiing with grazing polar angularrreasurement at constant int'3nsity and
Standard, :3 in . up to 8 in. o~tional
I ~~p~~o _SClentaiXeionPO.Box311Slort Hills, NJ ,J7078
Analytical Chemistry. November 1. 1995 677 A

Product Review'
The best method of comparison h'these instruments is to see images acquired on a sample that is typical for thelab. "Comparing acquisition times and justlooking at images may not teIl you verymuch, since you clon't know how muchfort was required to set up the instru·ment to acquire the image and ary smalIarea spectrrJ," Fulghum notes. ''The rcaltrick is to find a good imaging instruoent which can acquire small-area, highenergy resolution spectra."
Other considerationsInformation about elemental or chemicaldistributions with depth can be obtainedusing one of two depth profiling methods. An ion gun can be used either to cleanthe sample sunace or to remove layers ofsample for additional XI'S analyses. Des~mctive depth profiling capabilities havebeen improved for some of the current research instruments through the use ofsmaIl-area depth profiling and/or samplerotation during a depth profile. "Either ofthese methods has the potential to imp:-ove depth resolution sigmficantly," Fuighum comments.
Angular-resolved XI'S can be used todetermine layer thicknesses or concentration gradients nondestructively in thefirst ~ 10 nm oUhe sample. This methodis becoming increasingly important formicroelectronics applications as gate oxides become thinner. The sample is tiltedwith respect to the analyzer to vary the angie at which photoelectrons are detected.Photoelectrons from the extreme surfaceatoms are emitted at glancing angles,whereas those from subsunace layers areernitted at angles approaching normal tothe swiace.
The drawback to this method, says Fulghum, lies in data handling and interpretation. "The problem is that there's nounique mathematical solution to determine how something is distributed over asurface using these data. It's a question ofhow well you can do using assumptions.The appropriate aigorithms for dataanalysis are an area of current research.
She notes that multitechnique instmments that combine XPS with Auger electron spectroscopy or SIMS go in and outof style. "Six to eight years ago, the vendors' motto seemed to be 'You name it,
we can do it,' ane multitechnique instruments were standard. Then there was ageneration of stmd-alone research-gradeXPS instruments. Now we're seeingmore multitechnique systems rlgain, although generaIly just combining two techniques. The problem with combination instruments is that you can't optimize bothmethods. On the other haneL these instmments are usually less expensive thantwo stand-alone moclels would be."
Shopping aroundFulghum's general advice to potential buyers of research XI'S instruments is tolook for the features that are most important for their applications and sampietypes. "vVhen evaluating instruments, besure to take samples that are :-epresent"tive of your routine requirements as wellas samples that are a rea] chal1enge. If atall possible, don't try to do science duringyour instrument demonstrarjon. You'lllearn a lot more about the instrument fromnmning six very different sample typesthan you will by looking- for subtle diiIerences among six similar samples."
Deborah Noble
ContentsDrugs: Historical BeginningsEarly Modern MedicinesNaming DrugsBiomedical ResearchModern Drug Discovery and DevelopmentMaleeular Modification of Prototype DrugsDrug Use and AbuseNeurohormanes and Drugs That Affect the
Central Nervous SystemDrugs for the Relief from PainLocal Anesthetics, Antispasmodics, and
AntihistaminesDrugs That Act on the Blood Pressure and
the HeartIntestinal Tract MedicationsHormones and VitaminsDrugs for the Treatment of CancerDrugs Affecting the Immune ResponseDrugs for Infectious DiseasesAntiparasitic DrugsAntiviral DrugsComputer Assistance in Medicinal
ResearchAntiseptics and Disinfectantswhors Next?
n this Dr Alfrecl fOllnding editor of thejournal rransJatt's topics into clear andunderstandahle terms for nonexpert. information he proVideswill hoth stimulate and .«ltisfy re~ldl'rs" curiosity.
Covering the fate Df chemica! drugs of abuse, drug interactior:s.drug incompatibilities, the role nurrition and diet in the control ordiseases, and over-lhe-('()llnter C'nderstClJ1ding ..tledications ansvversmany asked explains the mode of action of mostmajor drugs, ;lCtion of 101'1110nes, vitamins, enzy'mes, andother hiocataly:-;ts, and (.:-'xphres t:1<-' economic. ethicaL and medical factorsof drugs.Dr. 13uH;er also \\TiIes ,lhour the \\.·ork of biologists, chemotherapists, andother n~edicinal re.searchers, ,mel presents a ' of thediscovery of drugs, including digiuli.'i, aspirin.Valuable reading for ,-llly/one interested in the history. uses, and action of
medications. ORDER FROM: American Chemical Society, 1155 Sixteenth Street,Wmhingtan, DC 20036
Or CAll TOll FREE 1-800-227-5558(in Washington, DC 872·43631 and use your credit cordi
FAX: 202-872-6067.ACS Publications Catalog now available on internet: gopher acsinfo,acs.org or
URL http://pubs.acs.org
Alfred Burger, University of Virginia206 (It)l»))
uc"",,,,,,,,,,, ISB:\ U-H-;-112-52 [0-')
$39-95Paperhound ISH:'\ O-Ki 12-52-16-()
$21.95
Understanding Medications:What the label Doesn'tTell You
678 A Analytical Chemistry, November 1, 1995

OFINSeR BLEDISQUIsmONThe task of keeping up with the relate recent advances to earlierlatest adv"nces in chemical research work, and project their futurecan be daunting. significance.
However, rhere is "11. easy way Place your order today byto pin a vital overview of basic calling 1-800-333-9511. Outside theresearch and applications in all areas U.S. call 614-447-3776.of chemistry. Subscribe to Accounts Accounts ofChemical Researcho!Chemzcal Research (ACR). ACR is published monthly by the Ameri-Dublishes leading researchers' can Chemical Society. Joan S.
:'eports of their own work~...... Valentine, University of California,Concise, critical aIticles t. ';'(" LOS. Ang. eles, EdItor. Paul F. Barbara.:1elp end controversies /j:~.~.
. -~
It:;e-.! h_
Universitv of Minnesota, andChristopher S. Foote, University ofCalifornia l Los Angeles, AssociateEditors. Subscription rates in theU.S. for ACS Members are $29 forone year, 552 for two years.Nonmembers are 5204 for oneyear. Call for rates outside the U.S.
A0) IIIPUBUCATIONS
-;==-:
-&
§
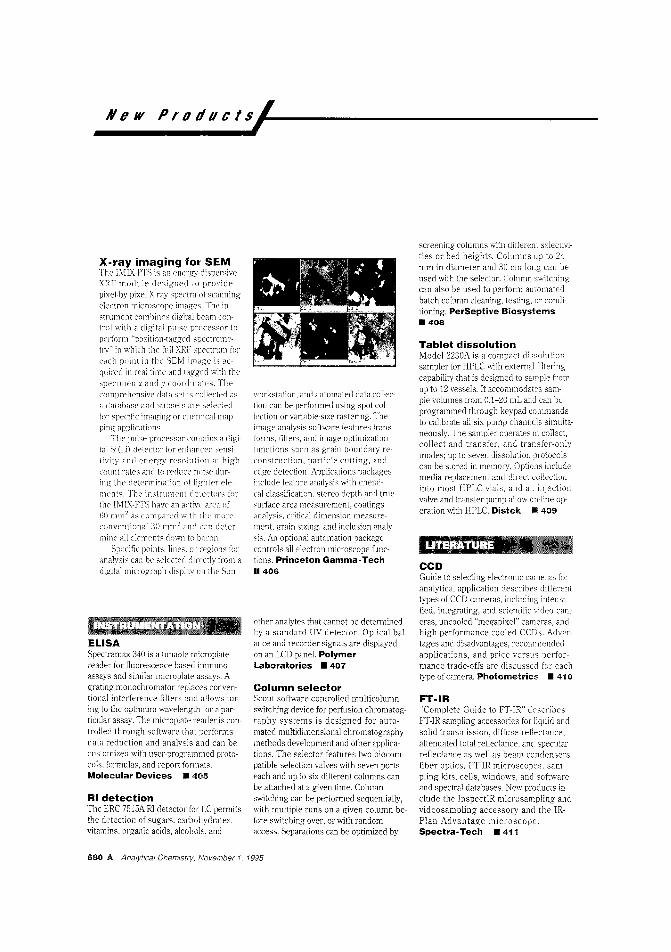
New prOdUCls,~L~ __
X-ray imaging for SEMThe IMIX-ITS is an energy-dispersiveXEF lI]()ch,k (1esigrled to provide
pixel-hy-pixel X-ray spectra of scanningelectron microscope images. The instrument combines digital beam control with a digital pulse processor toperform "position-tagged spectrometry" in which the full XEF spectrum foreach point in the SEIvI illli:1ge is acquired in real time and tagged with thespecinwll x and y coordinates. Thecomprehensive data set is collected asa database and su bsets are selectedfor specific imaging or chemical lllappinR" applications.
The pulse processor contains a digital Si(Li) dnector for enhanced ,,'nsitivity and energy resolution at high
count rates and to reduce noise during the determination of lighter f'ie11wnts. The instrument detectors forthe IMIX-PTS have an active area ofGO llllll? as compared \vith moreconventional :iO mm:! and ('an determine all elements down to boron.
Specific points, lines, or regions foranalysis can be selected directly from adigitalminograph display on the Sun
ELISASpectramax 340 is a tunahle microplatereader for fluorescence-based immunoassays and similar microplate assays. Agrating monochromator replaces conventional interference filters and allows tuning to the optimum wavelength for a particular assay. The micropiate reader is controlled through software that performsdata reduction and analysis and can becustomized with user-programmed protocols. formulas, and report formats.Molecular Devices • 405
RI detectionThe EEC 7515.1'. RI detector for LC permitsthe detection of sugars, carbohydrates,vitamins, organic acids, alcohols, and
workstation, and automated data collection can be performed using spot collection or variable-size rastering. Theimage analysis softv..rare features transforms, filters, and image optimizationfunctions such as grain boundalY reconstruction, particle cutting, andedge detection. Applications packagesinclude feaUre analysis with chemi-cal classiJicatinn, stereo depth and truesurface arcal11casurement, coatings<lnalysis, critical dimension measurement, grain sizing, and inclusion analysis. An o]Jtiona1 automation packagecontrols all electron microscope functions. Princeton Gamma-Tech11406
other analytes that cannot he determined];y a standard UV detector. Optical balance and recorder signals are displayedon an LCD panel. PolymerLaboratories • 407
Column selectorScout software-controlled multicolumnswitching device for peliusion chromatography systems is designed for automated multidimensional chromatographymethods development and other applications. The selector features two biocompatihle selection valves with seve" portseach and up to six different columns canbe attached at a given time. Columnswitching can be performed sequentially,with multiple runs on a given column before switching over, or with randomaccess. Separations can he optimized by
screening columns with differem seleclivities or hed heights. Columns up to 24mm in diameter and 30 em long can beused with the selector. Column switchingcan also be used to perform automatedhatch column cleaning, testing, or conclilioning. PerSeptive Biosystems.408
Tablet dissolutionModel 2230A is a compact dissolutionsampler for HPLC with external filteringcapahility that is designed to sample fromup to 12 vessels. It accommodates sample volumes from 0.1-20 mL and can beprogrammed through keypad commandsto calibrate all six pump channels simultaneously. The sampler operates in collect,collect and transfer, and transfer-onlymodes; up to seven dissolution protocolscan he stored in memOlY. Options includemedia replacement and direct collectioninto most HPLC vials, and an injectionvalve and transfer pump anow on-line operation with HPLC. Distel< II 409
mms~CCDGuide to selecting elecrronic carneras foranalytical application describes differenttypes of CCD cameras, including intensified, integrating, and scientiJic video can:eras, uncooled "megapixel" cameras, andhigh-performance cooled CCDs. Advantages and disadvantages. recommendedapplications, and price versus performance trade-offs are discussed for eachtype of camera. Photometries • 410
FT-IR"Complete Guide to FT-IR" (",scribesIT-IR sampling accessories for liquid andsolid transmission, diffuse reflectance,attenuated total reflectance, and specularreflectance as wen as beam condensers,fiber optics, IT-IR microscopes, sampling kits, cells, windows, and softwareand spectral databases. New products include the InspectlR microsampling anc.videosampling accessory and the IRPlan Advantage microscope.Spectra-Tech • 411
680 A Analytical Chemistry. November 1. 1995
Chromatography1995/1996 chromatography catalog listsvials, caps, seals, crimping tools, and sample racks. The cataiog is illustrated withphotograpl~s and comparison charts andcontains numecous tables on vial compatibility with commercial instruments.Chromacol .412
TOFMSCatalog featuring ti:ne-of-flight mass spectrometers includes complete systemsand subassemblies with flexible levels ofsystem automation. Both EI- and MALDIbased instruments are featured, as are
MS::;F/PIC :-)elits quad111pole mass spectrometers for low-mass compound characterization are designed for researchapplications ranging from fast-event: iHV gas studies and then11a1 desOllrlion to linH'-resolvpd I1wasurrments.
radical cmalysis, and mass analysis ofions. l1w systems include a
lriple-slage quadrupole nass niter with aselection of integral electron impactonization sources including radially
symlllct"ic and cross-beam dC'signs, andan clcc'tron multiplier detector with 24)i1 resolution and detector gating with'('solution to 1 ps.
The :ripk mass tilter is designed to')rovide enhanced sensitivity for highllass fraglIlellts in d 7*decade cOIltinu
,'HIS dynamic rangE'. ThreE' versionsare available for I11cl'dmum masses of'100.5111. or !OliO Da. Short Ii-only filtersections precede and follow the pri111al")' mass filter for control of electrostatic fringe fields and efficient high'nass transmission. The rf prefilteralso gUi:lrds the main mass tilter fromcontamination for longer stability.
\Vindows-based software controlsJle ion source and mass tilter scanningdectronics for real-time tuning of fiia'llelll voltage. lIlass selectiun, lIlass res·
unusual configuratiuns and modlles suchas TOFMS combined with electrostaticenergy analyzers for serial or parallel energy and mass analysis. The catalog includes selection guides for matching theappropriate instruments and componentswith nscr applications. Comstock.413
Postcolumn derivatizationCatalog of postcolumn products for HPLCincludes postcolumn reactors, columnheaters, columns, mobile phases, and derivatlzation reagents. Product specioicatons and a guide to postcolumn derivatization methods are included. Pickering.414
ulutiun, sensitivity, gain, scan times.and dwell times. Data are stored withthe operating parameters on a scan-byscan basis so that interactive tuningoperations are saved throughout theExperiment.
More than 100 mass channels canbe monitored in multiple ion detectionmode. Other modes include analogdisplay amllllullitoring uf UStT-defill
able mass peaks with respect to energy ancl other scanned parameters forapplications such as radicals analysisvia threshold ionization MS.The software provides interactive peak oVt>rlap \I,'arnings and suggests alternativcmass numbers from the spectral library for analyses of complex mixtures. Hiden Analytical • 415
Multidispersive XRF'111(, MDX I0011 is a compact XRF spectromt'ter tlesigllecl [or simultaneousmeasurement of both light and heavyelements in routine applications. Itcombines energy-dispersive andwavelength-dispersive XRF detectionsystems for uptimization of both lightand heavy'-e1C'nH:'nt determinations.Elements from fluorine to uraniLllllare detectaiJe at cOllcentrations ranging from suu-part-pcr-mil1ion to 100%.
A200-W end window I,h target xray tube is used for excitation. Wavelel1!,rth-dispersive nlonochromators areavailable with nat or curved crysta),for the lixed-dement channds. The2-channel cllcTgy-disversive Si detectordoes not require liquid nitrogen coolingand the system can be configured forup to 10 detector channels.
ThE' instrument can be controlled either manually or with full automationthrough \Villdo'NS software. Preset parameters for common applications areincluded in the soft\varc, as is a spcctrallibrary for qualitative enel semiquantitative analysis. The spectronwtel' handles a variety of sample types inc1udillg solids, liquids, granules, andpowders. anel an optional autosJll1pleraccoJllmodates up to 72 samples.Oxford .416
For more information,please circle the appropriate
numbers on one of ourReader Service Cards.
Analytical Chemistry November 1. J995 681 A

ClaSSilied,~I------------------
ASSISTANT PROFESSOR POSITION INENVIRONMENTAL CHEMISTRY
The Department of Chemistry invites applications for a tenure-trackfaculty position at the Assistant Professor rank to commenceSeptember 1, 1996.The Department seeks candidates with a background in environmental chemistry to promote an excellent teaching program in thatarea. The successful candidate will be expected to develop a vigorous research program in environmental chemistry, or in a closelyrelated area, supported by external funding.Applicants should send a complete resume, a proposal of researchand a list of three individuals willing to act as referees with theiraddresses, telephone and/or fax numbers and, if possible, e-mailaddresses to:
Professor Ralph KortelingChair, Department of ChemistrySIMON FRASER UNIVERSITY
Burnaby, B.C. CANADA V5A 156Fax: (604) 291-5424
Evaluation of applications will begin on December 4, 1995, butapplications will be considered until the position' is filled.Simon Fraser University is an equal opportunity employer andstrongly encourages applications from women and minorities. Inaccordance with Canadian immigration requirements, this advertisement is directed to Canadian citizens and permanent residentsof Canada. The appointment is subject to final budgetary authorization.
Hthis researchsucceeds~you~ll
be the next toknow
HELP WANTED ADS
ROP display at ROP rates. Rate based on number ofinsertions within contract year. Cannot be combinedfor frequency. .
ANALYTICAL CHEMISTRY1599 Post Road East
P.O. Box 231Westport, CT 06881
203-256-8211/FAX: 203-256-8175
Unit
1" (25 mm)
loTi
8230
12-Ti
8200
6-Ti
$210
24-Ti
$190
As a subscribel-, You'llvaluable access t~)studies exploring the rclcltio,"shipbetween molecular structurebiological activity. And,edge information on n,."O" desi,n)
and allied activities \Iv'ill 'lOU
il1crease your research scope' and
;';i:;itd:,;;'jCh;,'r;j,;r;~~;r;;~,;htsthemost significant researchin the world uives vounew infonndtion with ll~~prec"cdented speed!
Be the next in line for criticalinformation.
Subscribe to theJournal ofMedicinal Chemistry today!
Call Toll-Free 1-800-333-9511
AC3 IIIPUBUCATIONSAmerican Chemical Society
1155 Sixteenth Street N.\V.Vv'ashingloll, DC ~OO;)6
682 A Analytical Chemistry. November 1. 1995
Laboratory Service Center,.L-----------------
laboratory Service Center (Equipment, Materials, Services, Instrumertsfor Leasing). Maximum space - 4 inches per advertisement. Columnwidth, 2-3/16"; two celumn width, 4-9/16", Artwork accepted, No combination of directory rates with ROP advertising. Rates based on number ofinches used within 12 months from first date of first insertion. Per inch: 1"- $200; 12" - $195; 24" - $190; 36" - $185; 48" - $180,
Call or write Jane Gatenby
ANALYTICAL CHEMISTRY1599 Post Road East
P.O. Box 231Westport, CT 06BB1
203-256-B211 ; FAX: 203-256-B175
• Material ~ Labware .. ApparatusWe are ~ele~an special!sts in rTachini~g
and fabrication, Dr repair and modiflcallon,cf your customab apparatus.
Sen1 for our latest catalog tQs;@l.
~'V TECHNICAL GLASS PRODUCTS,~' 8720 Twmbrook • Mentor, OH 44D60
21(';/974-2600 • FAX 216/974-1292
FREE DATA, FASTTo quickly amass data on all of the products you need, consult the Lab Data Service Section on our Analytical Chemistryreader reply card insert.
Index to Advertisers,,.l-----------
7. .. ~Hamiton Company OBC
Advertisirg Management for the Amencan Chemical SOCiety Publications
9-12. . . ... ~lsco, Inc. 639AFarneaux Associates
ADVERTIS,NG PRODUCTION MANAGER
Jane F. Gatenby
DIRECTOR, ADVERTISING SALES. LABOPATORY PRODUCTSBruce E. Poorman
SALES REPRESENTATIVES
Philadelphia, PA.... CENTCOM, LTO., The Meadows, 485 Devon ParkDrive, Suite 106. Wayne, PA 19087. Telephone: 610-964-8061, FAX:610-964-807
New YorklNew Jersey ... Dean A. Baldwin, John F. Raftery, CENTCOM,LTD., Schoolhouse Plaza, 720 King Georges Post Road, Fords, NJ08863. Telephone: 908-738-8200, FAX: 908-738-6128
Westport, CT./Boston. MA.... Dean A. Baldwin, Michael J. Pak, CENTCDM,LTD., 1599 Post Road East, P.O. Box 231, Westport, CT 06881~0231.
Telephone: 203-256-8211, FAX: 203-256-8175Cleveland, OH.... Bruce E. Poorman, Dean A. Baldwin, CENTCOM, LTD.,
19035 Old Detroit Road, Suite 203. Rocky River, OH 44116, Telephone:216-331~51S1.FAX: 216~331-3432
Chicago, IL. ... Michael J. Pak, CENTCOM, LTD., 540 Frontage Rd., Northfield, lL. 60093. Telephone: 708-441 w 6383, FAX: 708-441~6382
Houston, TXJAtlanta, GA. . Edward M. Black, CENTCOM, LTD., P.O. Box820956, Houston, TX 77062-0966. Telephone: 713·493-1560, FAX: 713493-6673
West Coast ...Bob LaPointe, CENTCOM, LTD., Suite 808, 2672 BayshoreParkway, Mountain View, CA 94043-1010. Telephone: 41Sw 969-4604,FAX: 415-969-2104
Denver, CO. . .Bob LaPointe, CENTCOM, L.TD_, Suite 808. 2672 BayshoreParkway, Mountain View, CA 94043-1010. Telephone: 415-969-4604,FAX: 415-969-2104
United Kingdom, Scandinavia and Europe (Except: Germany, Switzerland,Austria, France, Italy, Spain) ... Malcolm Thiele, Technomedia Ud.,Wood Cottage, Shurlock Row, Reading RG10 DOE, BerkShire, England.Telephone: 1734-343-302, FAX: 1734-343-848
Germany, Switzerland, Austria ... IMP InterMediaPartners, GmbH, DeutscherRing 40, 42327 Wuppertall, Germany. Telephone: (0202) 711091, FAX:(0202) 712431
France ... Gerard Lecoeur, Aidmedia, 31-33 Grand rue de Saint-Rambert,69009 Lyon, France. Telephone: 78-64-20-37, FAX: 78-83-56-67
Italy, Spain ... Tess Serranti, Serranti Communications, 43 Van Sant Road.New Hope, PA 18938. Telephone: 610-598-0668, FAX: 610w 598-0670
Hong Kong...SEAVEX, LIMITED, 503 Wilson House, 19 Wyndham Street,Central, Hong Kong, Telephone: 2868-2010, FAX: 2810-1283
Japan... Shigeyuki Yasui, Intercommunications (Japan), Inc. 2F GinzaElwaBldg. 8-18-7 Ginza, Chuo-ku, Tokyo 104, Japan. Telephone: (03)5565w 0861, FAX; (03) 5565w 0860.
Korea. , .DooBee International Limited, Center Building (Byulgwan), 1-11Jeong~dong, Choong~ku C.P.O. Box 4557, seOUl, Korea, Telephone:822-776-2096, FAX: 822-755-9860
Singapore....SEAVEX, LIMITED, 400 Orchard Road, #10-01 Orchard Towers, Singapore 0923, Telephone: 734-9790, FAX: 732w 5129
Taiwan...Epoch Limited, 2F No.3, Lane 52, Nanking East Road, Section 4,P.O. Box 1642, Taipei, Taiwan, R.O.C. Telephone: 577-5441, FAX: 578w
4308South America ...Bruce E. Poorman, GENTCOM, LTD., 19035 Old Detroit
Road, Suite 203, Rocky River, OH 44116. Telephone: 216-331-5151.FAX: 216~331-3432
638A
6688
PAGE NO
IFC
657A
ADVERTISERS
· ~B&J, inc.
is.. . Scott Specialty Gases, Inc. 670A8ecker/Jani, Inc
3.. . .... *Shimadzu Scientific Instruments, Inc.. 632A
West & Brady. Inc.
1599 Post Road EastP.O. Bex 231Westport, Connecticut 06881-0231(Area Code 203) 256-8211Fax No 203-256·8175
CENTCOM, LTD,Pres/clent
James A. ByrneExecutive Vice President
Benjamin W. JonesJoseph P. Stenza, ,Production Director
Laurence J. Doyle, Director Of Marketmg
2 ..
6. LPA 629ALaMotte Company
8. . .. *Mallinckrodt Baker, Inc. 647ASJegler, Wells & Brunswick. Inc.
......... *Perkin-Elmer Corporation. . 642AV3G
CIRCLE
iNCUIRY NO.
13. ,
· Brinkmann Instruments, Inc...
Lyons LavEy Nickel Swift. Inc .
.... . **Bruker Analy1she Messtechnik GmbH ..Haller Werbemlll1ung
· 'Chem Service. Inc..Bremble & Sewforth
14 . .. Finnigan MAT, Inc. 662ACommunications West
16..
Analytical Chemislry. Vol. 67, No, 21. November 1, 1995 683A

AN4LYrIOtLA.... ;I§I;V;I ...~I;V Information Express
Get the product data you need fast...By Phone: Use the reference list below, and contact the companies to fill an immediate need, or..
By Fax: Use the fax form on the opposite page to send a direct written request.
Company Pa e Issue RSN Data+ Phone Fax' ,.~ ':J "'" mi % ~
623 A 10/1/95 415 215-638-7078 215-638-7096 Jim McCornacf;Aldrich !FC 10/15/95 none • 414-273-3850 414-273-2095 Rich GrossB&J IFe 11/1/95 13 • 616-726-3171 616-728-8226 Kennerh L. CiarkBeckman Instruments 622 A 10/1/95 410 • 800-742-2345 714-773-8186Bioanalytical 56-" A 9/1/95 408 • 317-403-4572 317-497-1102Brinkmann 657 A 11/1/95 2 • 800-645-3050 516-334-7506Bruker Instruments 560 A 9/1/95 401 • 508-667-9580 508-66-3954Bruker Instruments 668 S' 11/1/95 16 0721/9528-0 0721/9528-712Carl Zeiss 565 A 9/1/95 415 800-356-1090 914-681-7443Carl Zeiss Jena GmbH 623 A 10/1/95 417 49-3641 -64-2500 49-3641-64-3311Chem Ser\/lce 538 A 9/1/95 1 800-452-9994 610-692-8729Chem Service 638 A 11/1/95 1 800-452-9994 610-692-8729Chromocol 681 A 11/1/95 412 203·261-7582 203-261-7319Comstock 68\ A 11/1/95 413 615-483-7690 615-481-3884Distek 680 A 11/1/95 409 908-422-7585 908-422-7310EG&G Instruments (Princeton) 610 A 1O/1/S5 10,11 60S-530-1000 609-883-7259Finngan MAT 529 A 9/1/95 9 408-433-4800 408-433-4823Finn:gan MAT 574 A 10/1/95 9 408-433-4800 408-433-4823Finn'gan MAT 662 A 11/1/95 14 408-433-4800 408-433-4823
565 A 9/1/95 411 512-251-1555 512-251-1597Fisons 622 A 1011/95 413 508-524-1000 508-524-1100Fisons Instruments 618 A 10/1i95 401 508-524-1000 508-524-1100Fisons Instruments 676 A 11/1/95 401 508-524-1000 508-524-1100Fluka Chemie 509 A 9/1/95 5 41-81-7552511 41-81-7565449Fluka Chemle 5r A 10/1/95 1 41-81-7552511 41-81-7565449Hamilton 03C 9/1/95 8 800-648-5950 702-856-7259Hamilton 03C 11/1/95 7 800-648-5950 702-856-7259Hewlett-Packard 618 A 10/1/95 402 415-857-5603 415-857-8228Hiden 623 A 10/1/95 416 44-1925-445225 44-1925-416518 I,"Hiden 68': A 11/1/85 415 44-1925-445225 44-1925-416518 Ian D. NealaHinds Instruments 564 A 9/1/95 410 • 503-690-2000 503-690-3000 TedHI-Tech Scientilic 55'<; A 9/1/95 409 • 44-722·323643 44-722-412153 DavidINIUS Systems 622 A 10/1/95 407 • 800-875-4687 813-620-3708 John HnizdilIsco 639 A 11/1/95 9-12 • 402-464-C231 402-464-0318 John R.Jeol USA 56", A 9/1/95 402 • 508-535-5900 508-536-2205 RabenJeol USA Inc OBC 10/1/95 7 • 508-535-5900 508-536-2205 BrianJohn Sons 58, A 10f1/95 5 • 212-850-6137 212-850-6264 S. Nelson
676 A 11/1/95 402 • 201 -825-7500 201-825-8659 David SurmanLabsphere 622 A 10/1/95 412 • 603-927-4266 603-927-4694 Joan A, BeauiieuLPA 629 A 11/1/95 6 703-836-1360 708-836-6644
580 A 10/1/95 2 (02421) 969-199647 A 8 908-859-9318622 A 409 800-835-2626 714-261-7589
Metrohm 512 A 9/1/95 2 41-071 -538-585 41-071-538-9041Metrohm 584 A 10/1/95 3 41-071-538-5 41-071538-90Melrohm 6e 10115195 nc-ne 41-071-538-5 41-071538-90Mettler-Toledo 565 A 9/1/95 412 800-638-6537 609-426-0121Molecular DeVices 680 A 11/1/95 405 415-322-4700 415-322-2069Oxford Instruments 681 A 11/1/95 416 508-371-9009 508-371-0204Molecuiar Dynamics 56.:1 A 9/1/95 407 800-333-5703 408-773-1493PE Nelson 618 A 10/1/95 403 408-577-2200 408-894-9307Perkin-Elmer OBC 9/15/95 203-761-2574 203-762-6000Perkin-Elmer IBC 9/15/95 415-570-6667 -115-638-6199Perkin-Elmer 589 A 10/1/95 415-570-6667 415-638-6199Perkin-Elmer OBC 10/15/95 none 203-761-2574 203-762-6000Perkin-Elmer IBC 10/15/95 none 415-570-6667 415-638-6199Perkin-Elmer 642 A 11/1/95 5 415-570-6667 4"15-638-6199PerSepbve Biosystems 680 A 11/1/95 408 • 800-899-5858 508-383-7885Photometries 564 A 9/1/95 405 • 602-889~9933 602~573-1944
Photometries 680 A 1111/95 410 • 602-889-9933 602-573-1944Physical Electronics 676 A 11/1/95 '03 612-828-6100 612-828-6109Pickering Laboratories 681 A 11/1/95 414 • 415-694-6700 415-968-0749Polymer Laboratories 680 A 11/1/95 407 • 413-253-9554 413-253-2476Princeton Gamma-Teen 6eQ A 11/1195 '06 • 609-924-7310 609-924-1729Sapidyne Instruments 622 A 10/1/95 408 208-345-7677 208-392-4985Scott Specialty Gases IFe 9/1/95 7 • 215- 766-8861 215-766-0320Scott Specialty Gases 599 A 10/1/95 8 • 215-766-8861 215-766-0320Scott Specialty Gases 670 A 1111/95 15 • 215-766-8861 215-766-0320Shandon Lipshaw 565 A 9/1/95 413 800-547-7429 412-788-1138Shimadzu Scientific Instruments IFC 9/15/95 none • 800-477-1227 410-381-1222Shimadzu Scientific Instruments IFe 10/1/95 4 • 800A77-1227 410-381-1222 Roger Grectl1eadShimadzu Scientific Instruments SC 10/15/95 none • 800-477-1227 410-381-1222 Roger Gre2theadShimadzu Scientific Instruments 632 A 11/1/95 3 • 800-447-1227 410-381-1222Siemens Industrial Automation 622 A 10/1/95 411 • 404-740-3931 404-740-3998Spectra-Tech 680 A 11/1/95 411 203-926-8998 203-926-8909 Debbie Es~osito
Supeico 623 A 10/1/95 414 • 800-247-6628 800-447-3044 Michael GrayTeledyne Electronic Technologies 521 A 9/1/95 3 • 415-962-6526 415-967·4353 Sharon GomezThermo Separation Products 619 A 10/1/95 404 • 800-532-4752 408-526-9810 Brent DavisTopac Scientific Instruments 565 A 9/1/95 414 617-740-8778 617-740-8779 AntoniVarian Associates 561 A 9/1/95 403,404 • 415-424-6786 415-858-0480 CarlVarian Associates 619 A 10/1/95 405 • 415-242-6880 510-945-2335Varlen Instruments 56J. A 9/1/95 406 800-729-4447 815-729-3700 Steve KlingerWaters 619 A 10/1/95 406 • 800-252-L752 508-482-2674 Tony Lewtz.sXelon 677 A 11/1/95 404 201-564-8833 201-564-8657 Jerry Rosenthal
Data+ Column: A bullet indicates that additional product and company intornalion is available in the 1996 Analytical Chemistry LabGUlde Edition
RSN: Reader Service Number; -International Edition Only

ANCHAM 67(21: 3829-4032 (1995)ISSN 0003-2700
Registered in the Us. Patentand Trademark Office
Copyright 1995 by theAmerican Chemical Society
Yo-Wen Chiu, Robert E, Car~on, *Karen L. Marcus, and
Alexander E. Karn *
Zaiyou Liu, *Donald G. Patterson, Jr., and
Milton L. Lee
Barry K. Lavine. * Howard Mayfield,Paul R. KrDmann, and
Abdullah Faruque
Purnendu K. Dasgupta * andSatyajit Kar
Bhajendra N Barman andJ Calvin Giddings *
WD@,ang Schi<tzner, Salvatore Fanali,Andreas Rizzi, ,. and Ernst Kenndler
C. 1\1. John, R W Odom, * L. Salvati,A. Annapragada, and M Y Fu Lu
R. W Peter Fairbank,Yang Xiang. and Mary J Wirth *
Clayton McNeffand Peter W Carr*
Colin G. Ong, ,. Amresh Prasad, anaJames 0. uckie
J1l1ing Fat Choi x- and Peter Hawllins
3829
3840
3846
3853
3861
3866
3871
3879
3886
3893
3897
ANALYrIQL®
NOVEMBER 1, 1995Volume 67, Number 21
ACCELERATED ARTICLES
A Monoclonal Immunoassay for the Coplanar PolycWorinated Biphenyls
ARTICLES
Geometric Approach to Factor Analysis for the Estimation of Orthogonality andPractical Peak Capacity in Comprehensive Two-Dimensional Separations
Source Identification of Underground Fuel Spills by Pattern RecognitionAnalysis of High-Speed Gas Chromatograms
Measurement of Gases by a Suppressed Conductometric CapillatyElectrophoresis Separation System
Separation of Colloidal Latex Aggregates by Cluster Mass and Shape UsingSedimentation Field-Flow Fractionation.with Stenc Perturbations
Separation of Diastereomers by Capillary Zone Electrophoresis with PolymerAdditives: Effect of Po!}mer Type and Chain Length
XPS and TOF-8IMS Microanalysis of a Peptide/Po!}mer Drug Delivery Device
Use ofMethyl Spacers in a~ Horizontally Polymerized Stationary Phase
Synthesis and Use of Quatemized Polyethylenimine-Coated Zirconia forHigh-Performance Anion-Exchange Chromatography
Effect of pH, NaCl, and Cocktail Selection on 232U Uquid Scintillation Spectra
Novel Dye-Solvent Solutions for the Simultaneous Detection of Oxygen andCarbon Dioxide
johannes T van Elleren,Constant M. G. van den Berg, *
Hao Zhang, Trevor D. Martin, andEric P Achterberg
johannes A. M van Riel andCamelis Olieman *
1. Papaefttathiou andM. D. Luque de Castro *
Manus J Dennison,jennifer M Hall, and
Anthony P F Turner*
Calum J McNeil, * Dale Athey,Mark Rail. Wah On Ro, Steffi Krause,Ron D. Armstrong, J Des Wright. and
Keith Rawson
F Pariente, E. Lorenzo,F. Tobalina, and H D. Abruiia *
Michael U Kumke, Guang Li,Linda B. McGown, *
G. Terrance Walker, * andC Preston Linn
Douglas J Beussman, Paul R. Vlasak,Richard D. McLane,
Mary A. Seeterlin, andChristie G. Enlce *
GaryJ Van Berkel * andFeimeng Zhou
Ron M A. Heeren, *Chris G. de Koster, and jaap J Boon
Dale H Patterson, George E. Torr,Fred E. Regnier, andStephen A. Martin *
jarrod A. Marta, Forest M White,Staei Seldomridge, and
Alan G. Marshall*
Richard B. van Breemen, *Chao-Ran Huang, Zhi-Zhen Lu,
Agnes Rimando,I-fany H S. Fang, and john F Fitzlo!!
Robert S. Brown * and John J Lennon
3903
3911
3916
3922
3928
3936
3945
3952
3958
3965
3971
3979
3985
3990
Automa1ed In-line Extraction of Uranium(VI) from Raffinate Streams withOn-line Detection by Calliodic Stripping Voltammetry
Selective Detection in RP-HPLC ofTyr-, Trp-, and Sulfur-Conteining Peptidesby Pulsed Amperometry at Platinum
Integrated Pervaporation/Detection: Continuous and DiscontinuousApproaches for Treatment;IDetermination of Fluoride in Liquid and SolidSamples
Gas-Phase Microbiosensor for Monitoring Phenol Vapor at ppb Levels
Electrochemical Sensors Based on hnpedance Measurement ofEmyme-Catalyzed Polymer Dissolution: Theory and Applications
Aldehyde Biosensor Based on llie Determination ofNADH EnzymaticallyGenera1ed by Aldehyde Dehydrogenase
Hybridization of Fluorescein-Labeled DNA Oligomers Detected byFluorescence Anisotropy willi Protein Binding Enhancement
Tandem Reflectron Tlme-of-Flight Mass Spectrometer UtilizingPhotodissociation
Electrospray as a Controlled-Current Electrolytic Cell: ElectrochemicalIonization of Neutral Analytes for Detection by Electrospray Mass Spectrometry
Direct Temperature Resolved HRMS of Fire-Retarded Polymers by In-SourcePyMS on an External Ion Source Fourier Transform Ion Cyclotron ResonanceMass Spectrometer
C-Terminal Ladder Sequencing ~ia Matrix-Assis1ed Laser Desorption MassSpectrometry Coupled willi Carboxypeptidase Y Tnne-Dependent andConcentration-Dependent Digestions
Structural Characterization of Phospholipids by Matrix-Assisted LaserDesorption/lonization Fourier Transform Ion Cyclotron Resonance MassSpectrometry
Electrospray Liquid Chromatography/Mass Spectrometry of Ginsenosides
Sequence-Specific Fragmentation of Matrix-Assisted Laser-Desorbed Protein!Peptide Ions
2C Analytical Chemistry, Vol. 67. No. 27, November 1, 1995
Annabeile Dugay, Bien Dang-Vu,Jean Christophe Moreau, and
Fran,ois Guyon'
lvIichael E. Ketterer'" andMichael A Fiorentino
Mei-Cheng Chen andHsuan-]ung Huang *
Jay W Grate* andR. Andrew McGill'
P. Tschuncky andJ Heinze *
Rachael Barbour, Zhenghao Wang,In Tae Bae, Yuriy V Tolmachev, and
Danie! /l. Scherson *
Ken-£chi Yoshino, Toshilumi Takao, *Hiroshi Murata, and
Yasutsugu Shimonishi
4000
4004
4010
4015
4020
4024
4028
EKect of Hydrogen Rearrangement on ihe Determination of ihe Enrichment of[15N1Leucine by GC/MS
Measurement ofTI(IIIII) Electron Self-Exchange Rates Using Enriched 5mbleIsotope Labels and Inductively Coupled Plasma Mass Spectromeny
TECHNICAL NOTES
An Electrochemical Cell for End-Column Amperometric Detection in Capi1laIyElectrophoresis
Dewetting EKects on Polymer-Coated Surface Acoustic Wave Vapor Sensors
An hnproved Meihod for ihe Construction of Ultramicroelectrodes
Channel How Cell for Attenuated Total Reflection Fourier Transform InfraredSpectroelectrochemisny
Use of the DerivatizingAgent 4-Aminobenzoic Acid 2-(Dicthylamino)ethyl Esterfor High-Sensitivity Detection of Oligosaccharides by E1ectrospray loni7"'tionMass Spectrometry
There is no supporting infonnation for this issue.
" In papers with more than one author, the asterisk indicates the name of the author to whom inquiries aboutthe paper should be addressed.
Analytical Chemistry, Vo! 67, No. 21, November 1, 1995 3C

AeRe $ ear C h(#L _
Accelerated Articles
Anal. Chem. 1995, 67,3829-3839
A Monoclonal Immunoassay for the CoplanarPolychlorinated Biphenyls
Va-Wen Chiu,t Robert E. Carlson,*,t Karen L. Marcus,t and Alexander E. Karu*,t
Hybridoma Facility, College of Natural Resources, University of California, Berkeley, 1050 San Pabio Avenue,Albany, California 94706, and ECOCHEM Research, Inc., Suite 510, 1107 Hazeltine Bouievard,Chaska, Minnesota 55318-1043
Polychlorinated biphenyls (PCBs) arc ubiquitous environmental pollutants with diverse toxic, teratogenic, reproductive, immunotoxic, and tumorigenic effects. Threeofthe least abundant of the 209 PCB isomers (congeners)are the most toxic and most difficult to quantify. Theseare 3,4,3',4'-tetrachlorobiphenyl, 3,4,3',4',5'-pentachlorobiphenyl, and 3,4,5,3',4',5'-hexachlorobiphenyl (IVPAC No. 77, 126, and 169, respectively). An immunizinghapten was designed to retain the 3,4,3',4' chlorinesubstitution pattern and copianarity characteristic ofthesetoxic congeners. The optimal competitors for immunoassay were weaker binding distinctive single-ring fragmentsof the PCBs. A monoclonal antibody designated S2B1was derived and used in direct (antibody-capture) competitive enzyme immunoassays (EIAs). The EIAs arehighly specific for non-ortho-substituted congeners anddo not recognize the more prevalent but much less toxicnoncoplanar PCB congeners or 2,3,7,8-tetrachlorodibenzo-p-dioxin, 2,3,7,8-tetrachlorodibenzofuran, ordichlorobenzenes. Hapten and competitor design for thisassay suggests a basis for development of sensitive EIAsfor other classes of PCB congeners.
The polychlorinated biphenyls (PCBs) are among the mosthazardous and ubiquitous man-made toxic compounds. Theywere in extremely wide use in numerous industrial applicationsfrom the 1930s until their toxicity, ability to bioaccumulate, and
Com:::sponcLng authors. R.E.C.: telcpbone, 612-448-4337; FAX, 612-4480-maiL [email protected]. AE.K.: telephone, 510-643-7746; FAX, SIC
1342-087::;: e-mail.University () Berkel~y.
ECOCHEM Research. Inc
0003-2700/95/0367-382959.0010 :g 1995 American Chemica: Society
carcinogenic potential were recognized. Their manufacture vmsdiscontinued in the 1970s. PCBs are distributed so widely thatthey have been classified as global chemical pollutants. Thisgroup of compounds has from 1 to 10 chlorines on the biphenylnucleus, with a total of 209 possible combinations (congeners).The chemical and physical properties of PCBs make analysisdifficult. They are highly persistent, they adsorb to soils andcolloidal materials. they leach very slowly, and they bioaccumulateup the food chain. Large amounts of these compounds remainin the environment, in use or in waste.
The toxicology and the carcinogenic, mutagenic, teratogenic.and immunotoxic properties of various congeners are detailed inan extensive literature. Recent volumes published by theU.N.-World Health Organization lntemational Program on Chemical Safety are particularly comprebensive summaries of the currentunderstanding of the distribution and toxicology of PCBs andpolybrominated biphenyls (PBBs).:·2 Some congeners and theirmetabolites have been implicated as estrogen mimics, with effectson postnatal development and reproductive ability. J-5 The copianar and noncoplanar PCBs differ in their toxicological properties.[The terminology in the literature is not consistent with the
nuclear magnetic resonance (NMR) data. Coplanarity implies adihedral angle of 0' between the phenyl rings. All PCBs tend tobe noncoplanar to some extent in solution. The congenersreferred to as "coplanar" in the literature are coplanar in crystalsused for X-ray crystallography. These congeners have minimaLbut nonzero dihedral angles in solution.] The three most toxiccongeners, 3,4,3',4'-tetrachlorobiphenyl (PCB 77). 3,4.3',4'.5'-
(1) Dobson, S.: van Esch. G. ]. Polychion'nated biphenyls and terphcnyls, 2nded.; World Health G~neva, 1993
(2) Gross, W,; Melber, C. Polybrominated biphenyls; World Hc<,.1thOrgwization: Gcnev2, 1993
Analytical Chemistry Vol. 67. No. 21, November 1, 1995 3829
pentachlorobiphenyl (PCB 126), and 3,4,5,3',4',5'-hexachlorobiphenyl (pCB 169) are coplanar and structurally resemble dioxin.'}These congeners are minor mole fractions of commercial PCBfonnulations,' Their primary mode of actior. is binding to thearyl hydrocarbon (Ah) receptor, which leads to induction ofcytochrome P450-associated enzyme activities.',,9 The much more
abundant noncoplanar, ortho-chlorinated congeners have differentmechanisms of toxicity that have not been well defined,
Analysis of PCBs is generally based on detecting the group ofcongeners that is most abundant in commercial fonnulations suchas the Aroclors, There is increasing recognition that quantitationof the most toxic congeners is essential for evaluating theenvironmental impact of PCBs, However, gas chromatography
of these congeners with electron capture detection (GC-ECD) ormass spectrometry (GC/MS) is particularly difficult becausecoe/uting ortho-substituted congeners are typically present inmuch greater amounts" Instrumental toxic congener analysismay cost as much as $1000 per sample, -This greatly limits thescope of regulatory and research sampling. llJ
Congener-specific analysis has several advantages for regulatory as well as research applications. Commercial formulationseach have relatively consistent mole fractions of certain congenersthat provide a distinctive "signature". Draperll demonstrated thatmost of the Aradar mixtures could be identified by capillary GC
analysis of only 12 congeners, Nine congeners were classifiedas the most hazardous by McFarland and Clarke.' Thirty to fiftycongeners are found in various tissue samples, but fewer predominate.'·" Canadian regulatory agencies use a referencemixture of 51 congeners for capillary GC analysisn A series ofindicator congeners for contamination of foods has been proposed14 The World Health Organization has emphasized thecontinuing need for long-term studies of the toxicity, epidemiology,and mechanisms of action of speciiic congeners and the value ofidentifying sensitive and speciiic biomarkers fo~ some of the moresubtle aspects of PCB toxicity,l' Monoclonal antibodies and animmunoassay specific for the toxic congeners could be particularlyvaluable for this type of researcb. They could be used asindependent screening methods or in conjunction with instrumental analysis.
(:-n Jacobsen,]. L.; Jacobsen, S. W. In Prenatal exposure to toxicants: Developmental consequences; Needleman, H. L., Bellinger. D., Eds.; The JohnsHopkins Press: Baltimore, MD, 1994; pp 130~147
(4) Colboll1, T.; Clement C. Chernically induced altrratinns sexual andfunctional development-the wildlife/human com.'ection; Advances 1:1. ModemEnvironmental Toxicology 21: Princeton Scientifi.c Publishing Co.: Princeton
1992.(5) Korach, K S.; Sarver, P.; Chae. K.: Mclachlan.]. A; McKinney. J. D. Mol.
Pharmacal. 1988, 33, 120-126.(6) Safe. S. CRe Crit. Rev. Taxicol. 1984, 13, 319-396.(7) Creaser, C. S.; Krokos, F.; Sl:2rtin. J. R Chemosphere 1992, 25,1981-2008.(8) Bandiera. S.: Safe, S.; Okey, A. B. Chern. BioI. Interact. 1982,39,259-277.(9) Mcfarland, V. A; Clarke,]. LT. Environ. Health Peyspect. 1989,81,225-239.
(0) Schwartz, T. R; Stalling, D. L Arch. Environ. Contcm. Toxieol. 1991,20,195-219.
(11) Draper, vV. M. In Proceedings oftite EPA SixtJ: AnllUal WasteQuality Assuranrp Sympnsium: American Chemical Society:DC, 1990; pp Il·124-Il·138,
(2) Mes,J.; Conacher, H. B. S.: Malcolm, S.Int.]. Environ. Alla!. Chern. 1993,285-297.
(13) National Research Counci: of Canada. Reference material no. CLB-l, MarineAnalytical Standards Program, Atlantic Research Lab., Halifax Nova Scotia.
(14) Jones. K C. Sci. Total EJ!viro1l. 1988,68,141-159.(5) World Health Organization. Polychlorinated BiphenylS (PCBs) and Polychlo-
rinated Health and Safety Guide: International Program onChemical (IPeS) Health and SaJety G'Jide No. 68; Wor:d HealthOrganizati01:: Geneva, 1992.
3830 Analytical Chemistry, Va!, 67, No. 27, Ncvember 7, 1995
The molecular heterogeneity, low aqueous soiubilily, lack offunctional groups for derivatization, and other chemical propertiesof PCBs make design of immunoassays a daunting problem Allof the published PCB immunoassays we are aware of weredesigned to detect "Arodor equivalents" or the most abundan tnoncoplanar PCB congeners, lIi-21 To date we have not found any
published reports of monoclonal antibodies for sensitive detectionof PCB congeners or mixtures, The design and performancecriteria for a toxic PCB congener immunoassay are exceptionallydemanding. The assay must perfonn with sufficient sensitivity,accuracy, and precision despite the extremeiy low water solubilityof the compounds, It must be speciiic for the coplanar congeners.There should be no signiiicant cross-reaction with other halogenated biphenyls, dibenzofurans, dioxins, halowa.x (chlorinatednaphthalene), or single-ring halogenated compounds, includingchlorinated benzenes and phenols that may be present with PCBsin hazardous waste. Compounds such as DDT, DDE, andchlorophenoxy herbicides should not be recognized,
The immunizing hapten and competitor reagents for thisproject were synthesized expressly to derive a speciiic antibodyand a sensitive assay for the most loxic PCB congeners. Ourapproach was based on the hypothesis that we could design animmunizing hapten to evoke high-affinity antibodies to thecoplanar PCB structure, while molecules designed to mimic halfof the PCB could serve as competitors of lower binding affinity incompetition immunoassays, In the course of this work it became
evident that polyclonal antisera would be unlikely provide thespecificity or sensitivity needed for single congener analysis andthat monoclonal antibodies (MAbs) would be required.
This paper describes direct enzyme immunoassays (ETAs) thatare highly selective for PCBs 77 and 126, utilizing one lVLA.bdeveloped with this strategy. An EIA using tubes coated with acapture antibody gives the most sensitive limit of detection,However, a fonnat using streptavidin-coated microwells to capturebiotinylated MAb is more reproducible for samples in more than5% organic solvent In 5% methanol, only PCBs 77 and 126 arerecognized with a limit of detection at or below t ppb. Othercongeners are less than 3% cross-reactive. In 10% DMSO, fiveortha-substituted congeners are detected \vith 1,,, values less than100 ppb, and five others including PCB 169 react with 1,0 values
of 100-500 ppb, Mono-ortho-chlorination reduces or eliminates
binding and di-ortho-chlorinated PCBs are not bound.
EXPERIMENTAL SECTIONReagents and Materials. All reagents were purchased Ii·om
Fisher Scientific, Aldrich Chemical Co" or Sigma Chemical Co.unless otherwise indicated. Only deionized, glass-distilled waterwas used, and Spectrograde methanoi, DMSO, and 2-propanolwere used as PCB solvents. PCB congeners > 99% pure and ail
(16) Franek, M.; Hruska, K; Sisak M.; Diblikov2., 1.]. Agn·c. Food Chem. 1992.40, 1559-1565.
(17) Luster, M. L; Albro, P, W.; Clark, G.; Chae, K: Chaudhary. S. K; Lawson.L. D.; Corbett,]. T.; McKinney, J. D. Taxieo!. llpp!. Phaymacol. 1079.50,147-155.
(18) Newsome, W. H.: Shields, l B. Int.]. E1!viron. Anal. 1981.10295-304.
(19) Goon, D. J. W.; Nagasawa, H. T.: Keyler. D. E.: Ross. C Pente!' P. RChern, 1994,5,418-422,
(20) Keyler, E.: Goon. D.]. W.: Shelver, W. L.; Ross, C. A: Nagasawa,51. Peter,]. V,; Pente], P. R. Biochem. Pharmacal. 1994,48. 767-7T;.
(21) P.: McKenzie, K.; Stewart, T. N,: McClelland, L. R.: SLudabaker.W. Manning, W. E.: Friedman. S. B. Bull. Environ. Contain. Taxieol1993,50,219-225,
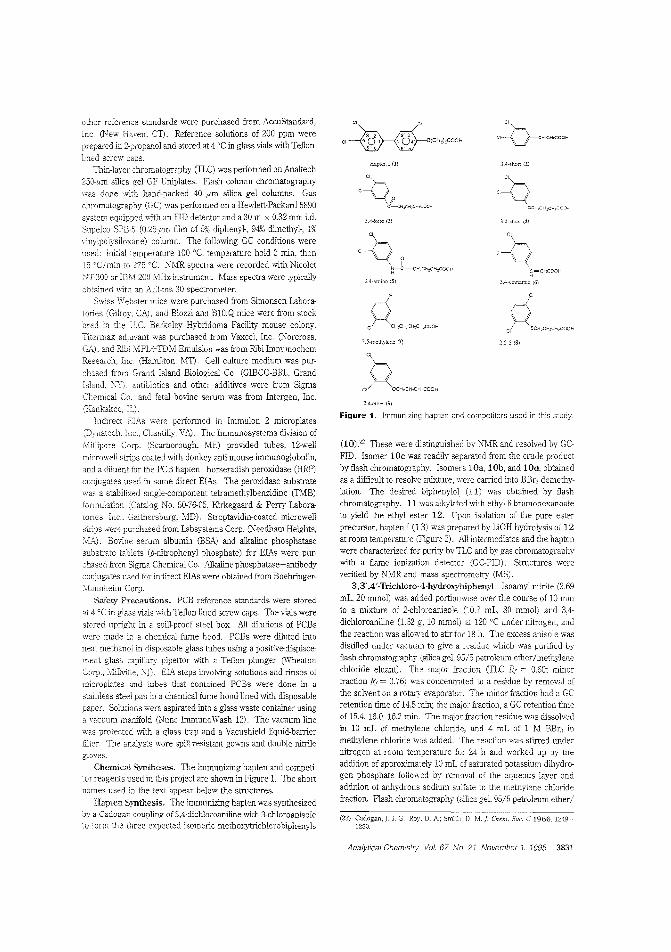
Figure 1. Immunizing hapten 2nd Gom:Jetitors used in this study.
(10).22 These were distinguished by NMR and resolved by GCFID. Isomer 10c was readily separated from the crude productby flash chromatography. Isomers 10a, lOb, and 10d, obtainedas a difficult to resolve mixture, were carried into BBr" demethylation. The desired biphenylol (11) was obtained by flashchromatography. 11 was alirylated with ethyl &-bromohexanoateto yield the ethyl ester 12. Upon isolation of the pure esterprecursor, hapten I (13) was prepared by LiOH hydrolysis of 12at room temperature (Figure 2). All intermediates and the haptenwere characterized for purity by TIC and by gas chromatographywith a flame ionization detector (GC-FlD). Structures wereverified by NMR and mass spectrometry (MS).
3,3',4'-Trichloro-4-hydroxybiphenyl. Isoamyl nitrite (2.69
mL, 20 mmo1) was added portionwise over the course of 10 minto a mixture of 2-chloroanisole (10.7 mL, 80 mmol) ar~d 3,4dichloroaniline (1.62 g, 10 mmol) at 120 'C under nitrogen, andthe reaction was allowed to stir for 18 h. The excess anisole wasdi:stilled under vacuum to give a residue which was purified byflash chromatography (silica gel. 95/5 petroleum ether/methylenechloride eluant). The major fraction (fLC Rr = 0.60; minorfraction Rr = 0.76) was concentrated to a residue by removal ofthe solvent on a rotary evaporator. The minor fraction had a GCretention time of 14.5 min; the major fraction, a GC retention timeof 15.4, 16.0, 16.2 min. The major fraction residue was dissolvedin 10 mL of methylene chloride, and 4 mL of 1 M BBr" inmethylene chloride was added. The reaction was stirred undernitrogen at room temperature for 24 h and worked up by theaddition of approximately 10 mL of saturated potassium dihydrogen phosphate followed by removal of the aqueous layer andaddition of anhydrous sodium sulfate to the methylene chloridefraction. 1'1ash chromatography (silica gel, 95/5 petroleum ether/
3,4-cther (4)
3.4-short (Z)
3A-cinnaj"rjc (6)
I. G.: Roy. D. A; Smith. D. M.]. Chern. Soc. C 1966.1249-
Hapten! (l)
3.4-kcto (3)
3,4-amino (5)
2,4_t'lh"r (9)
l,S.methylene: (7)
(22)
other reference standards were purchased from AccuStandard,Inc (New Haven, en. Reference solutions of 200 ppm wereprepared in 2-propa.T\01 and stored at 4 'C in glass vials with Teflonlined screw caps.
Thin-layer chromatography (Tl,C) was performed on Analtech250,um silica gel GF Uniplates. Flash column chromatographywas done with hand-packed 40 j-lm silica gel columns. Gaschromatography (GC) was peJiormed on a Hewlett-Packard 5890
system equipped with an FID detector and a 30 m x 0.32 mm i.d.Supeico SPB-5 (0.25-,um film of 5% diphenyl-, 94% dimethyl-, 1%vinylpolysiloxane) column. The following GC conditions wereused: initial temperature 100 'C; temperature hold 2 min, then15 'C/min to 275'C. NMR ,peclra were recorded with NicoletNT-300 or IBM 200 MHz instrument. Mass spectra were typicallyobtained ",ith an f\El-ms 30 spectrometer.
Swiss Webster mice were purchased from Simonsen laboratories (Gilroy, CAl. and Biozzi and BI0.Q mice were from stockbred in the D.C. Berkeley Hybridoma Facility mouse colony.Titennax adjuvant was purchased from Vaxcel, Inc. (Norcross.GA), and Ribi :vIPL+TDM Emulsion was from Ribi ImmunochemResearch, Inc (Hamilton, MT). Cell culture medium was purchased from Grand Island Biological Co. (GIBCO-BRl, GrandIsland, NY). antibiotics and other additives were from SigmaChemical Co" and fetal bovine serum was from lntergen, Inc.(Kankakee, IL).
Indirect EIAs were performed in Immulon 2 microplates(Dynatech. Inc., Chantilly, VA). The lmmunosystems division of:vIillipore Corp. (Scarborough, :vIE) provided tubes, 12-well
microwell snips coated with donkey anti-mouse immunoglobulin,and a diluent for the PCB hapten-horseradish peroxidase (HRP)conjugates used in some direct EIAs The peroxidase substratewas a stabilized single-component tetramethylbenzidine (fMB)fonl1ulation (Catalog No. 5()-76-05, Kirkegaard & Perry laboratories, Inc., Gaithersburg, MD). Strcptavidin-coated microwellstrips were pu'chased from Labsystems Corp. (Needham Heights,:vIA). Bovine serum albumin (BSA) and alkaline phosphatasesubstrate tablets (p-nitTophenyl phosphate) for ElAs were purchased from Sigma Chemical Co. Alkaline phosphatase-antibodyconjugates used for indirect EIAs were obtained from Boehringer::vIannheim Corp.
Safety Precautions. PCB reference standards were storedat 4 'C in glass vials 'hith Teflon-lined screw caps. The vials werestored upright in a spill-proef steel box. All dilutions of PCBswere made a chemical fume hood. PCBs were diluted intoneat methanoi in disposable glass tubes using a positive-displacement glass capillary pipettor with a Teflon plunger (WheatonCorp" Millville, NJ). EIA steps involving solutions and rinses ofmicropiates and tubes that contained PCBs were done in astainless steel pan in a chemical fume hood lined with disposablepaper. Soiutions were aspirated into a glass waste container usinga vacwm manifold (Nunc ImmunoWash 12). The vacuum linewas protectec with a glass n-ap and a Vacushield liquid-barriertilter. The analysts wore spill-resistant gO'hns and double nin~ile
gloves.
Chemical Syntheses. The immunizing hapten and competitor reagents used in this project are shown in Figure L The shortnames used in the text appear below the structures.
Hapten Synthesis, The immunizing hapten was synthesizedby a Cadogan coupling of 3,4-dichloroaniline with 3-chloroanisole
to form the three expected isomeric metho>.)'1:richlorobiphenyls
Analytical Chemistry 'Vol. 67, No. 21. November 1, 1995 3831
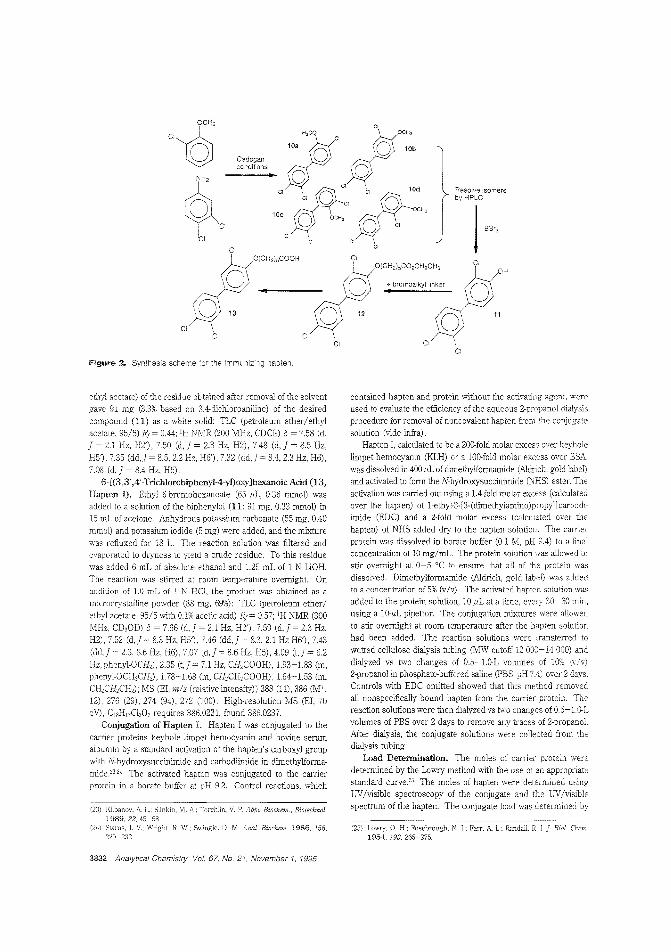
•
H,CO JiC' OCH,C,
10a 0 0 10b
o 0
!It'CH'10e 0 OCH3 o C,
C,CI CI \
0'
Figure 2. Synthesis scheme for the immunizing hapten.
ethyl acetate) of the residue obtained after removal of the solventgave 91 mg (3.3% based on 3,4-dichloroanibe) of the desiredcompound (11) as a white solid: TLC (petroleum ether/ethylacetate, 95/5) R/ = 0.44; IH NMR (200 MHz, CDCb) 0 = 7.58 (d,] = 2.1 Hz, H2') , 7.50 (d,] = 2.3 Hz, H2), 748 (d,] = 8.5 Hz,
H5j, 7.35 (dd,f =85, 2.2 Hz, H6') , 732 (dd,] =8.4, 23 Hz, H6),708 (d,] = 8.4 Hz, H5).
6-[(3,3',4'-Trichlorobiphenyl-4-yl)oxy]hexanoicAcid (13,Hapten I). Ethyl 6-bromohexanoate (65 f.lL, 0.36 mmo!) wasadded to a solution of the biphenylol (11: 91 mg, 0.33 mmol) in15 mL of acetone. Anhydrous potassium carbonate (55 mg, 0.40
nUllo!) and potassium iodide (5 mg) were added, and the mixturewas refluxed for 18 h. 1110 reaction solution was filtered andeva~oratel1 to dryness to yield a crude residue. To this residuewas added 6 mL of absolute ethanol and 1.25 mL of 1 N LiOH.The reaction was stirred at room temporatLre overnight. Onaddition of 1.0 mL of 1 N HCI, the product was obtained as amicrocrystalline powder (88 mg, 69%): TLC (petroleum ether/ethyl acetate, 95/5 with 0.1% acetic acid) R; = :l.57; IH NMR (300
MHz, CD,OD) 0 = 7.66 (d,] = 2.1 Hz, H2'), 7.59 (d,] = 2.' Hz,H2), 7.52 (d,] = 8.3 Hz, H5'), 7.46 (dd,] = 8.3, 2.1 Hz H6') , 7.43
(dd,] = 2.3, 86 Hz, H6), 7.07 (d,] = 86 Hz, H5), 4.09 (t,] = 6.2
Hz, phenyl-OCH,), 2.35 (t,] = 7.1 Hz, CH,COOH), 1.93-1.83 (m,phenyl-OCH,CH,J, 1.78-1.68 (m, CH,CH,COOH), 1.64-1.53 (m,CH,CH,CH,); MS (El, m!z (relative intensity» 388 (ll), 386 (M+,12), 276 (29), 274 (94), 272 (100). High-resolution MS (EI, 70eV), C18H17Ci:JO" requires 386.0231, found 386.0237.
Conjugation of Hapten L Hapten I was conjugated to the
canier proteins keyhole limpet hemocyanin and bovine serumalbumin by a standard activation of the hapten's carboxyl groupwitb N-hydroxysuccinimide and carbodiimide in dimethylformamiCe.'I.24 The activated hapten was conjugated to the carrierprotein in a borate buffer at pH 9.2. Contrd reactions, which
(23) Klilianov. A L SlInkln. M. Torchlln, V. P. App,. Biochem., Biotechnol.1989.22.45-58.
(24) Slaros, J \ohight R. W.; Swingle, D. M. AnaL. Biochem. 1986,156.220-2:32
3832 Analytical Chemistry. Vol. 67. No.2'. November 1, 1995
contained hapten and protein without the activating agent, wereused to evaluate the efficiency of the aqueous 2-propanol dialysisprocedure for removal of noncovalent hapten from the conjugatesolution (vide infra).
Hapten I, calculated to be a 200-fold molar excess over keyholelimpet hemocyanin (KLH) or a 100-fold molar excess over BSA.
was dissolved in 400 f.lL of dimethylforman1ide (Aldrich. gold label)and activated to form the N-hydroxysuccinimide (NHS) ester. Theactivation was carried out using a 1.4-fold molar excess (calculatedover the hapten) of 1-ethyl·3-[3-(dimethylan1ino)propyl]carbodiimide (EDC) and a 2-fold molar excess (calculated over thehapten) of NHS added dry to the hapten solution. The carrierprotein was dissolved in borate buffer (0.1 M, pH 9.4) to a finalconcentration of 10 mg/mL. The protein solution was allowed tostir overnight at 0-5 °C to ensure that all of the protein wasdissolved. Dimethylformamide (Aldrich, gold label) was addedto a concentration of 5% (vIv) The activated hapten solution wasadded to the protein solution, 10 f.lL at a time, every 30-60 min,using a 10-,uL pipettor. The conjugation mixtures were allowedto stir overnight at room temperature after the hapten solutionhad been added. The reaction solutions were transferred towetted cellulose dialysis tubing (MW cutoff 12 000-14 000) and
dialyzed vs two changes of 0.5-1.o-L volumes of 10% (v!v)2-propanol in phosphate-buffered saline (PBS, pH 7.4) over 2 days.Controls with EDC omitted showed that this method removedall nonspecifically bound hapten from the carrier protein. Thereaction solutions were then dialyzed vs two changes of 0.5-1.o-Lvolumes of PBS over 2 days to remove any traces of 2-propanol.After dialysis, the conjugate solutions were collected from thedialysis tubing.
Load Determination. The moles of carrier protein weredetermined by the Lowry method with the use of an appropriatestandard curve." The moles of hapten were determined usingUV!visible spectroscopy of the conjugate and the UV/visiblespectrum of the hapten. The conjugate load was determined by
(25) Lowry, O. H.: Rosebrough, N. J: FaIT, A L: Rc'lndalL R. J I Bio!. Chem1954,193,265-275.
dividing the moles of hapten present by the moles of carrierprotein (KLH, 300000 daltons; BSA, 67000 daltons),
The KiH conjugate used for immunization had an average of89 mol of hapten lImol of KIR No hapten association with KlHwas decected in a control reaction that omitted activating agentThe BSA conjugate used for indirect ElAs had approximately 48mol of hapten [fmol of protein, with 2.2 mol/mol of nonspecificassociation in the absence of activating agent Hapten I- KlHand hapten 1-BSA both tended to aggregate when stored at 4 °Cfor several weeks, possibly due to the high hapten load, Aliquotswere elarified by centrifugation (12 OOOg, 5 min), and only solubleconjugate was used for immunizations and ElAs.
Synthesis of Competitors, The syntheses involved additionof a linker moiety by all{'jlation or acylation to an appropriatechlorophenyl synthon, similar to the conversion of 11 to 13 inFig;ure 2, Competitor 2 (3,4-short) was purchased from TransWorld Chemicals (Kensington, MD). Preparation of the 3,4-ketocompetitor 3 utilized the Friedel-Crafts acylation of o-dichlorobenzene with glutaric anhydride, essentially as described byRosowsky.26 The precursor compounds were all commerciallyavailable. Competitor 4 (3,4-ether) was prepared as describedby Tandon et al.27 Competitor 5 (3,4-amino) was prepared asdescribed by Rashid2s Competitor 6 (3,4-cinnamic) was purchased from Aldrich Chemical Co. (St Louis, MO). Synthesis ofcompetitor 7 (2.~methylene) was described elsewhere.'" Competitor 8 (2,~S) was prepared as reported by Kukalenko,30 andcompetitor 9 (2,4-ether) was purchased from Aldrich ChemicalCo. Competitor slructure and purity were determined by TLC,GC-FID, UV/visible spectrophotometry, NMR, and/or MS.
Synthesis of Competitor-BSA and Peroxidase Conjugates. Competitors 2-9 were conjugated to BSA or aminomodified HRP using the carbodiimide-mediated carboxyl activationprocedure described above to couple hapten I to BSA and KlH.HRP conjugates of hapten I were also prepared. The HRP(Catalog No. P-6782, Sigma Chemical Co.) was modified asdescribed by Hsiao31 to give 6-24 free amines, The conjugatestock solutions typically had a concentration of 5-10 mg/mL HRP,and they were stored at 4 0(,
Prepa.ration of Biotinylated MAb. Immunoglobulin fromMAb S2B1 (lgG) was purified to near-homogeneity by affinitychromatography of ascites fluid on protein A-Sepharose using aI-mL HiTrap column (pharmacia Biotech, Piscataway, NJ). The19G was dialyzed overnight against three changes of 0.02 M KPO,(pH 7)/0.01 EDTA/O,05 M Nae!. Protein concentration wasdetermined by absorbance at 280 TIm. A I-mg sample of a biotinspacer arm ester C'JHS-XX-biotin; Calbiochem, La Jolla, CAl wasdissolved in 0.5 mL of DMSO. Approximately 25 ng of ester wasadded in aliquots, with gentle shaldng, to 1 mg of S2Bl IgG in0.55 mL of 0.02 M Na2C03/NaHC03 (pH 9) in a I mL glass vial.After 2 h at room temperature the solution was dialyzed againstthree changes of the KP0 4/EDTA/NaCl buffer overnight. Aliquots were stored at -70 'C or as a 50% glycerol solution at -20
(26) Rosowsky, A: Chen, K K. N.; Li1., M.; Nadel, M. E.; St. Annand, R; Yeager,S. A]. Heterocycl. Own. 1971,8, 789-795.
(27) Tandon, V. Kr.anna.1. M.; Anand. N.lndian]. Chern. 1977, 15B, 264-266.
(28) Rashid, K. A.rjrnancl, M.; Sandermann, H.; Mumma, R D.]. Environ.Sci. Hea!th 1987, B22, 721-729.
(29) Carison. R: Chamerlik-Cooper, M.; Swanson, T.; Buirge, A, submitted forpublication Anal. Chem.
(>:0) Kukalenko, S. Zh Khim. 1970, 6, 680-684.en) Hsiao. Fe.: Royer, H. Biuchem. BiuPhys. 1979, 198, 379-385.
0(, The extent of bioclnylation and ability to bind PCB-HRPcompetitor were determined by EIA
Immunization and Monitoring ofMice, Four mice each ofthree strains (Swiss Webster, Biozzi, BI0.Q) were imrnunized withthe hapten I-KLH conjugate. The immunizing doses consistingof approximately 50 I'g of conjugate (as carrier protein) in 0.08mL of physiological saline, emulsified with one mouse dose ofTItermax adjuvant (Vaxcel, Inc.), were delivered subcutaneouslyin three or four sites on the back of the mouse. Identical doseswere given 7, 22,106, and 133 days after the initial injection, exceptthat Ribi adjuvant was used instead of Titermax on days 106 and133, The adjuvant was changed because the Titermax adjuvantused in the first three injections had accumulated at the injectionsites, and Ribi adjuvant is cleared from the sites. Serum sampleswere taken from the tail vein on days 29, 120, and 137. Antihapten titers were determined on day 29 serum by indirect ELI\on wells coated with hapten 1-BSA All 12 mice developed astrong anti-hapten response (signal at serum dilutions> 50 000).At this stage, four BIO.Q and three S/W mice had developed aweak competitive binding response to PCB 77 as measured byindirect ElA with 2,5-S-BSA (competitor 8). An indirect competition ElA with three of the sera taken on day 120 showed animproved competitive binding of 3,4,3',4'-tetrachlorobiphenyl vs2,5-S-BSA However, the day 137 sera from only one mouse, aS,rW, showed competitive binding responses specific for PCBs77 and 126 in this assay. On day 154, 3 days plior to cell fusion,this mouse was given a subcutaneous boost with l00l'g of haptenI-KLH in Ribi adjuvant. To lessen the risk of anaphylactic ordelayed-riPe hypersensitivity responses, this mouse received asubcutaneous injection of antihistamine and antivasospasm drugs1 h before the boost."
Hybridoma Production, All components of the cell culturemedia, electrical cell fusion procedures, and cryopreservationmethods were as previously described."3 Hybridoma colonieswere screened by automated sampling between 12 and 18 dayspostiusion. Samples of 0.12 mL of supernate were transferredonto 96-we11 culture plates. Aliquots (0.05 mL) were transferredonto ElA plates coated with hapten 1-BSA a,~d plates coated with2,~S"BSA (competitor 8) conjugate. A total of 628 colonies werescreened in three groups. Of these, 161 reacted only with hapten1-BSA and 123 reacted with both hapten 1-BSA and 2,~S-BSANone of the MAbs bound exclusively to 2,5-S-BSA All 284cultures were expanded to 24-well culture dishes. Two aliquorsof each cell line were frozen and stored in liquid nitrogen. Culturesuperrlates that bound hapten were tested for competitive bindingof PCB congeners in direct EL".s as descIibed in Results andDiscussion. Only one !'IlAb. designated S2Bl, gave the desiredresults, This celi line was subeloned by limiting dilution, a,"1d 11stable subelones were expanded and frozen. One subelone wasexpanded to produce culture medium and ascites, The asciteswas prepared in irradiated Swiss Vvebster mice as describedpreviously.33 Immunoglobulin subclass was determined by ElAusing a commercial kit (Southern Biotechnology Associates.Binningham, AL).
Enzyme Immunoassay Methods. Indirect (immobilizedcompetitor conjugate) and direct (immobilized antibody) EIAs
(32) Kam, A. E. In Hazard Assessment 0/ Chemicals CurrentSaxena,]., Ed.; Taylor & Francis Inti. Publishers: Washir:gton, 1992,;VoL 8, pp 205-321
(33) Kam, A E.; Goodrow, M. H.; Schmidt, D. J.; Hammock, B. D.; Bigelow,M. W. J. Agric. Food Chern. 1994, ,;2, 301-309.
Analytical Chemistry. Vol. 67'. No. 21. November 1, 1995 3833
(34) Vol1er, A: Bidwell, D.: Bartlett, A Rose,Friedman, H., Eds.: American Society fo; Microbiology:
DC 1976: pp 506-512.
Aliquots of sera or hybridoma culture supernates diluted in PBST
(1:100 to 1:40000) were allowed to stand in the tubes or weJlsovernight at room temperature. The antibody solution wasdecanted and the tubes or wells were washed four times with
distilled water. Nonspecific binding was prevented by additionof blocking buffer for 3 4 h at room temperature or overnight at
4 'c. The blocking buffer was decanted and the tubes or wells
used for evaluating responses of mice and for primary screeningof MAbs utilized reagents anel procedures of Voller et al.," as
modified in !\aru et at'B Secondary screening and subsequentcharacterization of the Milbs was done by direct EIA using plastic
12 x 75 mm tubes or microwells coated ",ith donkey anti-mouseIgG (DAM). Where indicated, the direct EIA was done with
biotinylated MAb S281 captured on streptavidin coated microwelis. Tubes and plates containing PCBs were handled asdescribed above in Safety Precautions.
Indirect competition EIAs were performed by coating wells
with amounts of hapten- BSA or competitor-BSA conjugate thatwere determined to be subsaturating by a checkerboard EIAWens were blocked with PBST- BSA:l3 Mixtures for competition
(0.1 mL) containing a limiting dilution of antiserum or hybridomaculture fluid and PCB standards (0.01-5000 ppb, diluted in PBST
BSA) were incubated overnight at room temperature in sealed
glass tubes. The competition mixtures were added to the blocked
plates for 2 h at room temperature, the wells were washed, alkaline
phosphatase conjugated goat anti-mouse IgG was added, and the
remainder of the assay was performed as previously described.Direct EIAs (soluble competitor-enzyme conjugate; immobi
lized antibody) were perfornled in 12 x 75 mm polystyrene tubes
or microwell strips coated with donl<ey anti-mouse IgG. The sameprocedures and incubation intervals were used for the coatedtube and microweJl EIAs. The PBST used in these EIAs con
tained only 0.01% (w/v) Tween 20 because higher concentrations
of Tween 20 reduced the sensitivity. The blocking reagent was1% (w/v) BSA/0.05 g/mL sucrose in PBS. All dilutions of PCBs
were first made into neat methanol, in glass tubes. Aliquots ofthese were taken into an "assay diluent" consisting of 0.005%
Tween 20 in glass distiJled water and methanol to give a final
methanol concentration of 5%. These dilutions were made directly
in the antibody-coated tubes or made in a gless tube and added
to coated weJls. Transfers were made using a positive-displacement glass capillary pipettor ",ith a Teflon plunger. The diluent
for PCB competitor-HRP conjugates was a proprietary solutionobtained from the Immunosystems division of Millipore Corp.
Stopping solutions for end-point assays were 1% HCI for tube EIAsand 2.5% HCI for microwell ElAs. The volumes used in each EIA
are summarized below:
step
coating with MAbblockinganalyte (standard or sample) sDlutioncompptitor-HRP conjugateHRP substrate (chromogen)stop solution
0.50.60.510.20.50.5
microwell
0.20.250.20.20.20.05
could then be used immediately for EIA or they could be airdried overnight at room temperature and stored for severai weeksat 4 'C in Zip-lock bags.
The assay was performed by adding the PCB sample in assaydiluent to the required number of antibody-coated tubes or wellsand incubating 15 min at room temperature. The fluids were t'lenaspirated into a waste reservoir, and the tubes/wells were rinsed
four times with 0.5 mL of deionized water and shaken dry. DilutedPCB-HRP conjugate was then added for 5 min at room temper
ature. This solution was then aspirated and the tubes/wells were
washed four times as before. Chromogen solution was then addedto the tubes or wells. Color development was stopped by addition
of HCI stopping solution. Aliquots of 0.1 mL were taken from
tube EIAs into a microplate. Absorbance at 450 nm was recordedon a microplate reader. Nonspecific binding was determined
using tubes or wells coated with nonimmune mouse serum or
complete IMDM cell culture medium. Results were expressedas the ratio of B (A450 for the sample) to Bo (that obtained with
diluent containing no PCB). Competition EIA dose-response
ourves (B/Bovs log analyte concentration) were fitted using thefour-parameter logistic model, and the data were analyzed asdescribed previously.:;5
Direct EIAs were also performed in microwells purchased ",ith
covalently attached streptavidin (160 ng/well). Dilutions (7.5 ng/well) of biotinyl-S2Bl IgG in PBST were allowed to bind for 1 h
at rOOm temperature. The wells were washed. blocked for 30 min
with PBST/0.01% gelatin, and the remainder of the assay wasconducted as described above. Where indicated, the assay diluent
was adjusted to methanol concentrations up to 25% (vIv) to take
advantage of this format's solvent tolerance.
RESULTS AND DISCUSSIONImmunizing Hapten and Competitors. Design of the
immunizing hapten to evoke toxic congener-specific antibodieswas based on three considerations. First, we retained the 3,3',4,4'
chlorine-substitution pattern and coplanarity that are characteristic
of the most toxic congeners. Second, an ether was used as achlorine mimic for attachment of the spacer arm to the biphenyl.Third, the ether moiety spacer was attached to the biphenyl at
the para position. Use of the ether linkage and para substitutionwas previously successful in deriving antibodies specific for thenoncoplanar PCBs.'') Most previously published PCB haptens
used an amide spacer which was attached at the ortho position.The cross-reaotion of antibodies raised by those haptens suggestedthat steric differences and noncoplanarily result from ortho
placement of the amide spacer. Mattingly" used several para
substituted linkers, but none with the 3,3',4,4'-substitution pattem.
Molecular models clearly showed that the para-substituted hapten
used for this project (Figure 1) presents the coplanar biphenyl
moiety extended distally from the linker. By contrast, arthaattachment places the linker moiety in a central position on the
hapten.." Accordingly, we hypothesized that para orientation of
the linker would lead to a combining site that would be morespecific for the coplanar PCBs.
The competitors for EtA. development were designed from
different criteria. Our previous success developing an EIA for
(35) Schmidt, D.].; Clarkson, C. E.; Swanson, T. A.: Egger. \rIo L.; Carbon, RE.: Van Emon,]. M.: F?od Chem. 1990,38, 1763-1770.
(36) Mattingly, P. U.5. Patent 1992(37) Carlson, R E. In Immunoanalysis ofAgrochemicals: Emerging Technologies;
Nelson, ]., Karu, A. E., R, Eds.; ACS Symposium Series 58!';;American Chemica! Society DC. 1995; pp 140-152.
3834 Analytical Chemistry, Vol. 67, No. 21, November 1, 1995
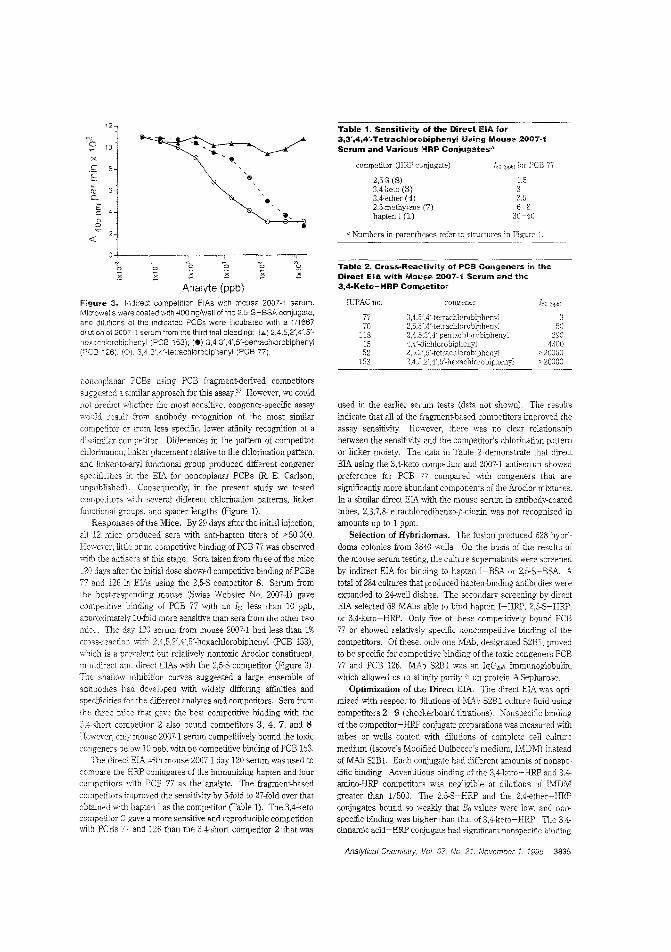
12
C'J0 10 .....>< ..c'E ..OJ0- •E
c: .,'D0
"""«10 i
~b b °0 a '"b~x x x x
Analyte (ppb)
Table 1. Sensitivity of the Direct EIA for3,3',4,4'..YetrachiorobiphenyM Using Mouse 2007-1Serum and Various HRP Conjugates'
competitor (HRP conjugate) [fiQ (j)pb) for PCB 77
2,58 (8) 1.53,4-keto (3) 33,4-ether (4) 3.52.5-methylene (7) 6-8hapten I (1) 30-40
a Numbers in parenth::;ses refer structures in f<\gure 1.
Table 2. Cross"Reactivity of PCB Congeners in theDirect EIA with Mouse 2007·1 Serum and the3,4.Keto-HRP Com"etitor
Figure 3. Indirect competition EIAs with mcuse 2007-1 serum.Microwells were coated with 400 ng/well of the 2,5-S-BSA conjugate,and dilutions 01 the indicated PCBs were incubated with a 1/1667dilution of 2007-1 serum from the third trial bleeding: (.A) 2,4,5,2~,4',5'
he;(achlo,robiph,enyl (PCB 153); (e) 3,4,3',4',5'-oentach iorobiphenyl(PCB 126); 3,4,3',4'-tetrachlorobiphenyl (PCB 77).
IUPACno.
7770
1181552
153
congener (ppb)
:J50
2904300
>20000>20000
noncoplanar PCBs using PCB fragment-derived competitorssuggested a similar approach for this assay.37 However, we couldnot predict whether the most sensitive, congener-specific assaywould result from antibody recognition of the most similar
compe"itor or from less specific, lower affinity recognition of adissimilar con,petitor. Differences in the pattern of competitorchlorination, bker placement relative to the chlorination pattern,and linker-to-aryl functional group produced different congenerspecificities in the EIA for noncoplanar PCBs (R. E. Carlson,unpublished). Consequently, in the present study we tested
competitors with several different chlorination patterns, linkerfunctional groups, and spacer lengths (Figure 1).
Responses of the Mice. By 29 days after the initial injection,all 12 mice produced sera with ant,-hapten titers of > 50 000.However, little or no competitive binding of PCB 77 was observedwith the antisera at this stage. Sera taken from three of the mice
,20 days after the initial dose showed competitive binding of PCBs
77 and 126 in ErAs using the 2,5-S competitor 8. Serum fromthe best-responding mouse (Swiss Webster No. 2007-1) gavecompetitive binding of PCB 77 with an Iso less than 10 ppb,approximately la-fold more sensitive L'1an sera from the other twomice. The 120 serum from mouse 2007-1 had less than 1%cross-reactioD with 2,4,5,2',4',5'-hexachlorobiphenyl (PCB 153),
whioh is a prevalent but relatively nontoxic Aroclor constituent,in indirect and direct ErAs with the 2,5-S competitor (Figure 3),The shallow inhibition curves suggested a large ensemble ofantibodies had developed with widely differing affinities andspecificities fo" the different analytes and competitors. Sera fromthe three mice that gave the best competitive binding with the
3,4-short competitor 2 also bound competitors 3, 4, 7, and 8
However, only mOllse 2007-1 serum competitively bound the toxiccongeners below 10 ppb, with no competitive binding of PCB 153,
The direct ELi\. "ith mouse 2007-1 day 120 serum was used tocompare the HRP cunjugates of the immunizing hapten and four
competitors with PCB 77 as the analyte. The fragment-basedcompetitors improved the sensitivity by 5-fold to 27-fold over thatobtained with hapten i as the competitor (Table 1). The 3,4-ketocompetitor 3 gave a more sensitive and reproducible competitionwith PCBs 77 and 126 than L1e 3,4-short competitor 2 that was
used in the earlier serum tests (data not shown). The results
indicate that all of the fragment-based competitors improved theassay sensitivity. However, there was no clear relationshipbetween the sensitivity and the competitor's chlorination patternor linker moiety. The data in Table 2 demonstrate that directEIA using the 3,4-keto competitor arlu 2007-1 arltiserum showedpreference for PCB 77 compared with congeners that aresignificantly more abundant components of the _!\roclor mixtures.In a similar direot EIA "ith the mouse serum in antibody-coatedtubes, 2,3,7,8-tetrachlorodibenzo-p-dioxin was not recognized inamounts up to 1 ppm.
Selection of Hybridomas. The fusion produced 628 hybridoma colonies from 3840 wells, On the basis of the results ofthe mouse serum testing, the culture supernat;mts were screened
by indirect EIA for binding to hapten 1-BSA or 2,5-5-BSA Atotal of 284 cultures that produced hapten-binding antibodies wereexpanded to 24-well dishes. The secondary screening by directEIA selected 69 MAbs able to bind hapten I-HRP, 2,5-S-HRP,or 3,4-keto-HRP. Only five of these competitively bound PCB77 or showed relatively specific noncompetitive binding of thecompetitors. Of these, only one MA.b, designated S2Bl, provedto be specific for competitive binding of the toxic congeners PCB77 and PCB 126. MAb S2Bl was an IgG2bK immunoglobulin,which allowed us 1O affinity puriiy it on protein A-Sepharose.
Optimization of the Direct EIA. TIle direct EIA was optimized with respect to dilutions of MAb S2B1 oulture fluid using
competitors 2-9 (checkerboard titrations). Nonspecific bindingof the competitor-HRP conjugate preparations was measured withtubes or wells coated with diiutions of complete cell culture
medium (lscove's Modified Dulbeeco's medium, IMDM) insteadof MAb 52B1. Each conjugate had different amounts of nonspecific binding, Adventitious binding of the 3,4-koto-HRP and 3,4amino-HRP competitors was negligible at dilutions of IMDM
greater than 1/500. The 2,5-S-HRP and the 2,4-ether-HRPconjugates bound so weakly that Bo values were low, and nonspecific binding was higher than that of 3,4-keto-HRP. The 3,4cinnamic acid-HRP conjugate had significant nonspecific binding
Analytical Chemistry, Vol 67, No, 21, November 1, 1995 3836
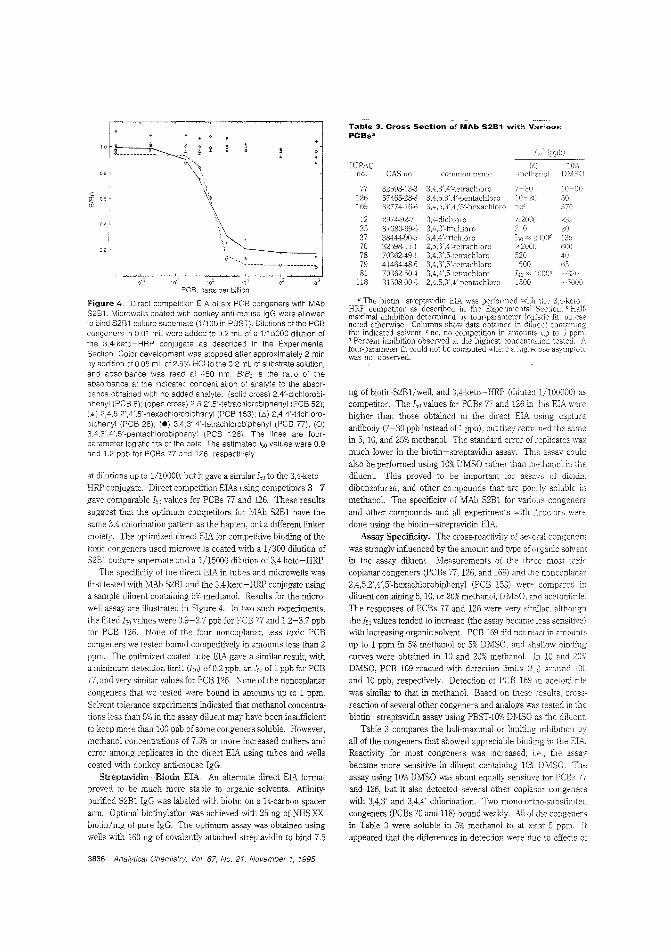
· . Table 3. Cross Section of MAb 52B1 with VariousPCBS3
IUPACno. CAS no. common name
77 32598-13-3 7-30 10-90126 57465-28-8 10-20 50169 32774-16-6 ncr 370
12 2974-92-7 ,,2000 23535 37680-69-6 310 2037 38444-90-5 ;::::: 20006 13510 32598-11-1 60078 70362-49-1 520 '1079 41464-48-6 1500 6581 70362-50-4 1000d -320
118 31508-00-6 ~"50()O
ng of biotin-S2B1/well, and 3,4-keto-HRP (diluted 1/100000) ascompetitor. The I,o values for PCBs 77 and 126 in this EIA werehigher than those obtained in the direct EIA using capture
antibody (7-30 ppb instead of 1 ppb), but they remained the samein 5, 10, and 25% methanol. The standard error of replicates wasmuch lower in the biotin-streptavidin assay. This assay could
also be performed using 10% DMSO rather than methanol in thedilucnt. This proved to be important for assays of dioxin.
dibenzofuran, and other compounds that are poorly soluble in
methanol. The specificity of MAb S2B1 for various congeners
and other compounds and all experiments with /lJ"Oclors were
done using the biotin-streptavidin ErA.
Assay Specificity. The cross-reactivity of several congeners
was strongly influenced by the amount and type of organic solventin the assay diluent. Measurements of the three most toxic
coplanar congeners (pCBs 77, 126, and 169) and the noncoplanar2,4,5,2',4',5'-hexachlorobiphenyl (pCB 153) were compareddiluent containing 5,10, or 20% methanol, DMSO, and acetonible.
The responses of PCBs 77 and 126 were very similar. although
the 150 values tended to increase (the assay became less sensitive)with increasing organic solvent PCB 169 did not react in amounts
up to 1 ppm in 5% methanol or 5% D1\1S0. and shallow bindingcurves were obtained in 10 and 20% methanol. In 10 and 20W,DMSO, PCB 169 reacted with detection limits (L,) around 100
and 10 ppb, respectively. Detection of PCB 169 In acetonitrile
was similar to that in methanol. Based on these results. cross
reaction of several other congeners and analogs was tested in thebiotin-streptavidin assay using PBST-lO% DMSO as the diluent.
Table 3 compares the half-maximal or limiting inhibition by
all of the congeners that showed appreciable binding in the El.t>".Reactivity for most congeners was increasedi i.e., the assaybecame more sensitive in diluent containing 10% D1\1S0. The
assay using 10% DMSO was about equally sensitive for PCBs 77and 126, but it also detected several other coplanar congeners
with 3,4,3' and 3,4,4' chlorination. Two mono-ortho-substituted
congeners (pCBs 70 and 118) bound weakly. All of the congenersin Table 3 were soluble in 5% methanol to at least 5 ppm. It
appeared that the differences in detection were due to effects of
(I The biotin-streptavidin ELA.. wasHRP competitor as described in the EXI)erlm"nta!maximal inhibition determined by four-parameternoted otherwise. Columns show dat:'l obtained in um'eucc'umilu,mgthe indicated solvent. ene, no competition in amountsd Percent inhibition observed at the highest corlcentr:lllc,nfour-parameter fit could not be computed \vherewas not observed.
0',... 0
'- ------ ----<iJ-- --------0
10" 100
PCB, parts 'Jer billion
figure 4. Direct compet:tlon EIA of six PCB congeners with MAbS2B1. Microwells coated with donkey anti-mouse Ig8 were allowedto bind S2B1 culture supernate (1/100 in PBST). Dilutions of the PCBcongeners in 0.01 mL were added to 0.2 rnL of a 1/15000 dilution ofthe 3,4-keto-HRP conjugate as described In the ExperimentalSecllon. Color development was stopped aHer approximately 2 minby addition of 0.05 mL of 2.5% HCI to the 0.2 mL of substrate solution,and absorbance was read at 450 nm. B!Bo IS the ratio of theabsorbance at the indicated concentration of aralyte to the absorbance obtained with no added analyte: (solid cross) 2,4'-dichlorobiphenyl (PCB 8); (open cross) 2,5,2',5'-tetrachlorcbiphenyl (PCB 52);(A) 2,4,5,2',4',5'-hexachlorobiphenyl (PCB 153); (,,) 2,4,4'-trichlorobiphenyl (PCB 28); (.) 3,4.3',4'-tetrachloroblphenyl (PCB 77); (0)3A.3'A',5'-pentachlorobiphenyl (PCB 1261. The lines are fourparameter logistic fits of the data. The estimated 150 values were 0.9and 1.2 ppb for PCBs 77 and 126, respectively.
at dilutions up to 1/10000, but it gave a similar ho to the 3,4-ketoHRP conjugate. Direct competition EIAs using competitors 3-7
gave comparable leo values for PCBs 77 and 126. These results
suggest that the optimum competitors for MAb S2B1 have the
same 3,4 chlorination pattern as the hapten, but a different linker
moiety. The optimized direct EIA for competitive binding of the
toxic congeners used microwells coated with a 1/300 dilution ofS2B1 culture supernate and a 1/15000 dilution of 3,4-keto-HRP.
The specificity of the direct EIA in tubes and microwells was
first tested with MAb S2B1 and the 3,4-keto-HRP conjugate usinga sample diluent containing 5% methanol. Results for the micro
well assay are illustrated in Figure 4. In two such experiments,
the fitted lin values were 0.9-2.7 ppb for PCB 77 and 1.2-3.7 ppbfor PCB 126. None of the four noncoplanar, less toxic PCB
congeners we tested bound competitively in amounts less than 2
ppm. The optimized coated tube EIA gave a similar result, witha minimum detection limit (1](1) of 0.2 ppb. an 150 of 1 ppb for PCB
77, and very similar values for PCB 126. None of the noncoplanar
congeners that we tested were bound in amounts up to 1 ppm.
Solvent tolerance experiments indicated that methanol concentrations less than 5% in the assay diluent may have been insufficient
to keep more than 100 ppb of some congeners soluble. However,
methanol concentrations of 7.5% or more increased outliers anderror among replicates in the direct EIA using tubes and wells
coated with donkey anti·mouse IgG.
Streptavidin- Biotin EM. An alternate direct EIA formatproved to be much more stable to organic solvents. Affinity
purified 52B1 IgG was labeled with biotin on a 14-carbon spacer
arm. Optimal biotinylation was achieved with 25 ng of NHS-XXbiotin/mg of pure IgG. The optimum assay was obtained usingwells with 160 ng of covalently attached streptavidin to bind 7.5
~----------~---- ---t, I.
' ""
~ \'~
3836 Analytical Chemistry, Vol. 67 No. 21, November 1, 1995
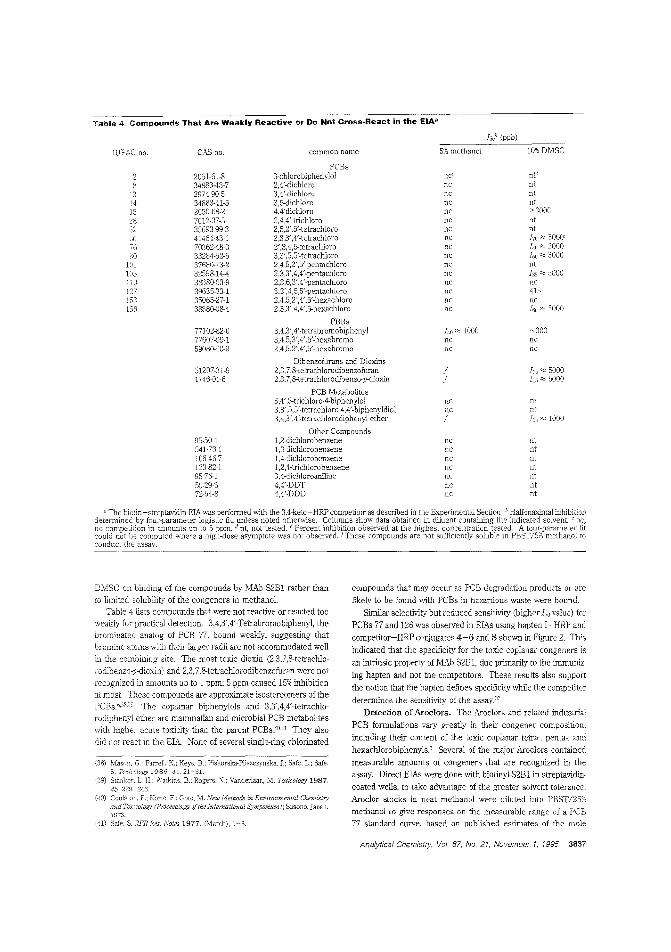
Table 4 .. Compounds That Are Weakly Reactive or Do Not Cross.React in the EIAa
IUPAC no. CAS no. common name 5% methanol 10% DMSO
28
1314152852
76SO
10110.5no
1;")3156
2051-61-83488343-72971-90-53488341-52050-68-27012-37-535693-99-34146443-170362-48-033284-52-537680-73-232598-14-43SS8(}03-939635-33-135065-27-138380-08-4
77102-82-077607-09-159080--!0-9
51207-31-91746-01-6
95-50-1541-73-1106-46-7120-82-1%76-150-29-372·54-8
PCBs3-chlorobiphenylol2A'-dichloro3A'-dichloro3,5-dichloro4,4'dichloro2,4,4'-trichloro2,5,2',5'-tetrachloro2,3,3' ,4'-tetrachloro2',3,4,5-tetrachloro3,3',5,5'-tetrachloro2,4,5,2',5'-pcntachloro2,3,3',4,4'-pentachloro2,3,6,3',4'-pentachloro3,3'A,5,5'-pentachloro2A,5,2',4',5'-hexachloro2,3.3',4,4'.5-hexachloro
PBBs3,4,3',4'-tetrabromobiphenyl3A.5,3',4',5'-hexabromo2A.5,2',4',5'-hcxabromo
Dibenzofurans and Dioxins2,3.7,8-tetrachlorodibenzofuran2,3,7,8-tetrachlorodibenzo~p-dioxin
PCB Metabolites3A',5-trichloro-4-biphenylol3,3',5,5'-tetrachlor04A'-biphenyldiol3,4,3',1'-tetrachlorodiphenyl ether
Other CompoundsL2-dichlorobenzene1,3-dichlorobenzene1,4-dichlorobenzene1,2,4-trichlorobenzene3,4-dichloroaniline4A'-DDT4A'-DDD
nc~ ntd
ne ntnc ntnc ntnc >300Cne ntnc ntnc 170'" 5000'nc 1M, '" 3000nc he'" 3000nc ntnc h'" 5000nc ncnc 415nc ncnc Iou'" 5000
1M) '" 1000 -300nc ncnc ne
I [,5'" 5000I [,5'" 5000
nc ntnc ntI hs'" 1000
nc ntnc ntnc ntnC ntHe III
nc ntnc nt
'The ljioiin--su-eoltavidin EIA was perfonned with the 3.4-keto-HRP competi:or as described in the Experimental Section. b Ha1f~maxima]!our-p,u'arneler IO.br1slic fit, unless nNed o-cherNise. Columns show data obtained in diluent containing the indicated solvent. nc,
to 5 ppm. d nt, not tested. C Percent inhibition observed at the highest concentration tested. A four-parameter .fithigh-dose asymptote was not observed. fThese compounds are not sufficiently soluble in PEST/5% methanol to
compounds that may occur as PCB degradation products or are
likely to be found with PCBs in hazardous waste were bound.
Similar selectivity but reduced sensitivity (higher Iso value) for
PCBs 77 and 126 was observed in ErAs using hapten I-HRP and
competitor-HRP conjugates 4-6 and 8 shown in Figure 2. This
indicated that the specificity for the toxic coplanar congeners is
an intrinsic property of MAb S2B1, due primarily to the immuniz
ing hapten and not the competitors. These results also support
the notion that the hapten defines specificity while the competitor
determines the sensitivity of the assay.37
Detection of Aroclors. The Arodors and related industrial
PCB formulations vary greatly in their congener composition,
induding their content of the toxic coplanar tetra-, penta-. and
hexachlorobiphenylsl Several of the major Arodors contained
measurable amounts of congeners that are recognized in the
assay. Direct ErAs were done with biotinyl-S2Bl in streptavidin
coated wells, to take advantage of the greater solvent tolerance.
Arodor stocks in neat methanol were diluted into PBST/25%
methanol to give responses on the measurable range of a PCB77 standard curve, based on published estimates of the mole
Farrell. K.; Keys, E.: Piskorska-Pliszezynska, ].; Safe, L.; Safe,1986,11,21-31.
Watkins, B.; Rogers, \T.: Vanderlaan, M. Toxicology 1987,
(38) Mason.s.
(39) Stanke,'.45,229-243.
(40) Coulstor.. F.; Kane, F.; Goto. M. New Methods in EnvirnnmeJdal Chemistryand Toxicology (Proceedings afthe International Symposium); Susona, Japan,1973.
(H) Safe, S. i?FR Res. Notes 1977, (March), : -3.
DMSO on binding of the compounds by MAb S2Bl rather than
10 limited soLubilitY of the congeners in methanol.
Table lists compounds that were not reactive or reacted too
weakly for practical detection. 3,4,3',4'-Tetrabromobiphenyl, the
brominated analog of PCB 77, bound weakly, suggesting that
bromine atoms with their larger radii are nol accommodated well
in the combining site. The most toxic dioxin (2,3,7,8-tetrachlo
rodibenzo-p-dioxin) and 2,3,7,8-tetrachlorodibenzofuran were not
recognized in amounts up to 1 ppm; 5 ppm caused 15% inhibition
at most. These compounds are approximate isostereomers of the
PCBs.",""" The coplanar biphenylols and 3,3',4,4'-tetrachlo
rodiphenyl ether are mammalian and microbial PCB metabolites
with higher acute toxicity than the parent PCBs."'! They also
did not react in the ErA None of several single-ring chlorinated
Analytical Chemisiry, Vol. 67, No. 21, November 1, 1995 3837
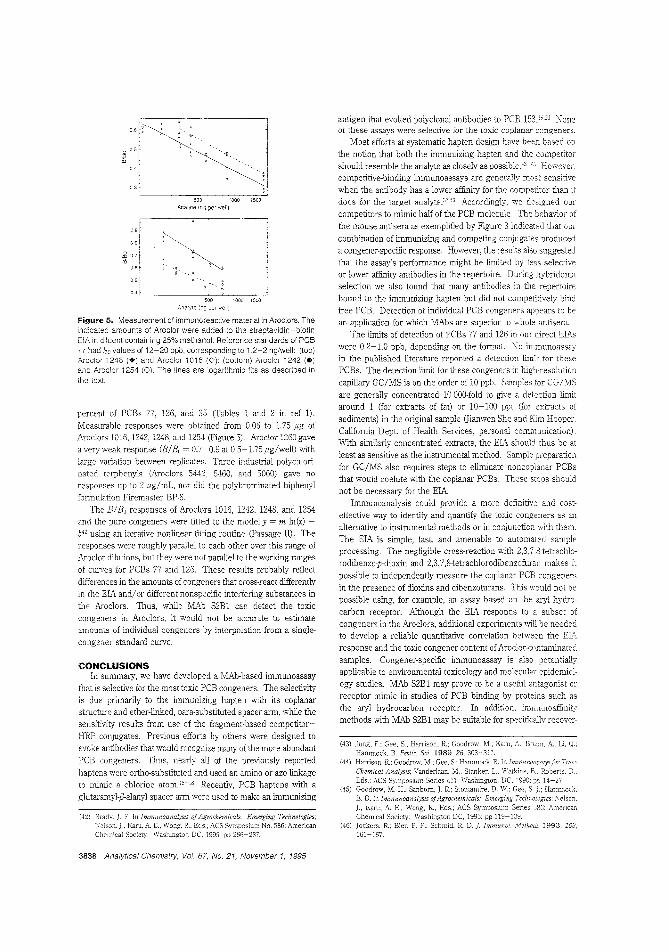
Analyte (ng per well)
Anaiyle (0g per ;veil)
Figure 5. Measurement of immunoreactive material in Aroclors. Theindicated amounts of Aroclor were added to the streptavidin-biotinEIA in diluent containing 25% methanol. Reference standards of PCB77 had 15G values of 12-20 ppb, corresponding to 1,2-2 ng/well: (top)Aroclor 1248 (+) and Arocior 1016 (0); (bottom) Arodor 1242 (e)and Arodor 1254 (0), The lines are iogarithmic tits as described inthe text.
percent of PCBs 77, 126, and 35 (Tables 1 and 2 in ref 1),Measurable responses were obtained from 0,06 to L75 ,ug ofArodors 1016, 1242, 1248, and 1264 (Figure 6), Arodar 1260 gavea very weak response (BIB" = 0,7-0,9 at 0.5- 1.75 j1g/well) withlarge variation between replicates, Three industrial polyohlorinated terphenyls (Aroolors 5442, 5460, and 5060) gave noresponses up to 2 j1g/mL, nor did the polybrominated biphenylformulation Firemaster BP-6,
The BIBII responses of Aroclors 1016, 1242, 1248, and 1254and the pure congeners were fitted to the model y = m In (x) +b'12 using an iterative nonlinear fitting routine (passage II), Theresponses were roughly parallel to eaoh other over this range ofi,,roclor dilutions, but they were not parallel to the working rangesof curIes for PCBs 77 and 126, These results probably reflectdifferences in the amounts of congeners that cross-react clifferentlyin the EL'i and/or different nonspecific interfering substances inthe Aroclors, Thus, while MiI,b S2B1 can detect the toxiccongeners in Aroclors, it would not be accurate to estimateamounts of individual congeners by interpolation from a singlecongener standard curve,
CONCLUSIONSln summary, we have developed a MAb-based immunoassay
that is selective for the most toxic PCB oongeners, The selectivityis due primarily to the immunizing hapten ",ith its coplanarstructure and ether-linked, para-substituted spacer arm, while thesensitivity results from use of the fragment-based competitorHRP conjugates, Previous efforts by others were designed toevoke antibodies that would recognize many of the more abundantPCB congeners, Thus, nearly all of the previously reportedhaptens were ortho-substituted and used an amino or 020 linkageto mimic a chlorine atom1HS Recently, PCB haptens with aglutaramyl-j3-alanyl spacer arm were used to make an immunizing
(42) Brady, 1. F. In lmmunoanalysis ofAgrochemicals Technologies;Nelson,]., Karu, A. E., Wong, R., 586; AmericanChemical Society: Washington DC, 1995; pp 266-287.
3838 Analytical Chemislry, Vol. 67, No, 21, November I, 1995
antigen that evoked polyclonal antibodies to PCB Noneof these assays were selective for the toxic coplanar congeners.
Most efforts at systematic hapten design have been based onthe notion that both the immunizing hapten and the competitcrshould resemble the analyte as closely as possible,4:H' However,competitive-binding immunoassays are generally most sensitive
when the antibody has a lower affinity for the competitor than itdoes for the t.arget analyte.37.-:6 Accordingly, we designed our
oompetitors to mimic half of the PCB molecule. The behavior ofthe mouse antisera as exemplified hy Figure 3 indicated that ouroombination of immunizing and oompeting conjugates produceda congener-specific response, However, the results also suggestedthat the assay's performance might be limited by less selectiveor lower affinity antibodies in the repertoire, During hybridomaselection we also found that many antibodies in the repertoirebound to the immunizing hapten but did not competitively bindfree PCB. Detection of individual PCB congeners appears to bean application for which MAbs are superior to whole antisera,
The limits of detection of PCBs 77 and 126 in our direct ErAswere 0.2- LO ppb, depending on the format No immunoassayin the published literature reported a deteotion limit for thesePCBs, The detection limit for these congeners in high-resolutioncapillary GC/MS is on the order of 10 ppb, Samples for CG/MSare generally concentrated 1000o-fold to give a detection limitaround 1 (for extracts of fat) or 10-100 ppt (for extracts ofsediments) in the original sanlple Gianwen She and Kim Hooper.California Dept of Health Services, personal communication),With similarly concentrated extracts, the EIA should thus be atleast as sensitive as the instrumental method, Sample preparationfor GC/MS also requires steps to eliminate noncoplanar PCBsthat would coelute with the coplanar PCBs. These steps shouldnot be necessary for the ElA
Immunoanalysis could provide a more definitive and costeffective way to identify and quantify the toxic congeners as analternative to instrumental methods or in conjunction ",ith them.The EIA is simple, fast, and amenable to automated sampieprocessing. The negligible cross-reaction "'ith 2,3,7,8-tetrachlorodibenzo-p-dioxin and 2,3,7,8-tetrachlorodibenzofuran makes itpossible to independently measure the coplanar PCB congenersin the presence of dioxins and dibenzofurans. This would not bepossible using, for example, all assay based on the aryl hydrocarbon receptor. Although the EIA responds to a subset ofcongeners in the Aroclors, additional experiments will be neededto develop a reliable quantitative correlation between the Ell""response and the toxic congener content of Aroclor-contaminatedsamples, Congener-specific immunoassay is also potentiallyapplicable to environmental toxicology and molecular epidemiology studies. MAb S2B1 may prove to be a useful antagonist orreceptor mimic in studies of PCB binding by proteins such asthe aryl hydrocarbon reoeptor. In addition, immunoaffinitymethods with MAb S2B1 may be suitable for speoifically recover-
(43) Jung, F.; Gee. S.; Harrison, R.; Goodrow, M.; Ran:, A.: Bra:lI1, A.: Li, Q.;
Hammock, B. Pestic. Sci. 1989,26.303-317.(44) Hanison, R; Goodrow, M.; Gee, S.; Hammock, B. In !mmunoassaysjor Trace
Chemical Analysis; Vanderlaan, ::vI .. Stanker, L, \Vatkins, R. Roberts, D.,Eds.; ACS Series Washington, DC :990; 14·-27.
(45) Goodrow, Sanborn, J R; Stoutamire, D. Gee, S.].; Hammock.B. D. In Immunoanalysis ofAgrochemicals' Nelson,]., Karu, A E., Wong, R, Eds.; ACS 536: AmericanChemical Society; Washington DC, PP 119-139.
(46) Jockers, R; Bier, F. L Schmid. R. D. I Immuno!. /'vlethods 1993, 163.161-167.

ing residues of the toxic congeners from complex field samples.Our labor"tories are presently exploring these and other applicatio~s.
ACKNOWLEDGMENTThis research was sponsored in part by NIH SBIR Phase I
Grant lR43 CA62679-01 to RE.C. AE.K is an Investigator in theNIEHS Health Sciences Center at D.C. Berkeley (NIEHS Grant2 P30 £S01896-16). A summary of this work was presented at
the 15th International Symposium on Chlorinated Dioxins andRelated Compounds, Edmonton, Canada, August 21 - 25, 1995.
Received for review July 7, i 995. Accepted August 25,1995-"
AC950675Y
o Abstract published in Advance ACS Abstracts, September 15, 1995.
Analytical Chemistry, Vol. 67, No. 2t. November t. 1995 3839
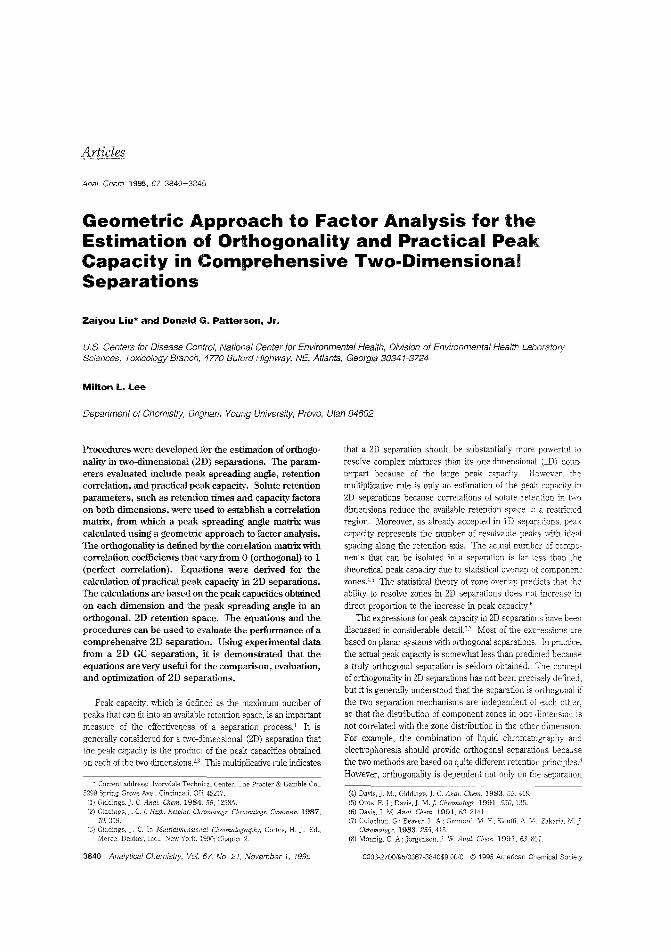
Articles
Anal. Chern. 1995, 67, 3840-3845
Geometric Approach to Factor Analysis for theEstimation of Orthogonality and Practical PeakCapacity in Comprehensive Two-DimensionalSeparations
Zaiyou Liu* and Donald G. Patterson, Jr.
u.s. Centers for Disease Control, National Center for Environmental Health, Division of Environmental Health LaboratorySciences, Toxicology Branch, 4770 Buford Highway, NE, Atlanta, Georgia 30341-3724
Milton L. Lee
Department of Chemistry, Brigham Young University, Provo, Utah 84602
Procedures were developed for the estimation of orthogonality in two-dimensional (2D) separations. The parameters evaluated include peak spreading angle, retentioncorrelation, and practical peak capacity. Solute retentionparameters, such as retention times and capacity factorson both dimensions, were used to establish a correlationmatrix, from which a peak spreading angle matrix wascalculated using a geometric approach to factor analysis.The orthogonality is defined by the correlation matrix withcorrelation coefficients that vary from 0 (orthogonal) to 1(perfect correlation). Equations were derived for thecalculation of practical peak capacity in 2D separations.The calculations are based on the peak capacities obtainedon each dimension and the peak spreading angle in anorthogonal, 2D retention space. The equations and theprocedures can be used to evaluate the performance of acomprehensive 2D separation. Using experimental datafrom a 2D GC separation, it is demonstrated that theequations are very useful for the comparison, evaluation,and optimization of 2D separations.
Peak capacity, which is defined as the maximum number ofpeaks that can fit into an avllilable retention space, is an importantmeasure of the effectiveness of a separation process1 It isgenerally considered for a two-dimensional (2D) separation thatthe peak capacity is the product of the peak capacities obtainedon each of the two dimensions. '.3 This multiplicative rule indicates
Current address: Ivorydale Technical Center, The Procter & Gamble Co.,
5299 Spring Grove Ave., Cincinnati. OB 452~7.
(1) Giddings. ]. C. Anal. Chern. 1984. 56. 1258A.(2) Giddings,j. c.j. High. Resolut. Chromatogr. Chmmatogr, Commun. 1987,
10,319.(3) Giddings, j. C. In Multidimensional Chromatography; Cortes, H. ]., Ed.;
Mercel Dekker. Inc.: New York, 1990; Chapter 2.
3840 Analytical Chemistry, Vol. 67, No. 21, November 1, 1995
that a 2D separation should be substantially more powerful toresolve complex mixtures than its one-dimensional (ID) counterpart because of the large peak capacity However. I:h emultiplicative rule is only an estimation of the peak capacity in2D separations because correlations of solute retention in twodimensions reduce the available retention space to a restrictedregion. Moreover, as already accepted in ID separations, peakcapacity represents the number of resolvable peaks with idealspacing along the retention axis. Tne actual number of components that can be isolated in a separation is far less than thetheoretical peak capacity due to statistical overlap of componentzones.'·5 The statistical theory of zone overlap predicts that theability to resolve zones in 2D separations does nOl increase indirect proportion to the increase in peak capacity."
The expressions for peak capacity in 2D separations have beendiscussed in considerable deWI,3-7 Most of the expressions arebased On planar systems with orthogonal separations. In practice,the actual peak capacity is somewhat less than predicted becausea truly orthogonal separation is seldom obWned, The conceptof orthogonality in 2D separations has not been precisely defined,but it is generally understood that the separation is orthogonal ifthe two separation mechanisms are independent of each other,so that the distribution of component zones in one dimension isnot correlated with the zone distnbution in the other dimension.For example, the combination of liquid chromatography andelectrophoresis should provide orthogonal separations becausethe two methods are based on quite different retention principles.'However, orthogonality is dependent not only on the separation
(4) Davis,]. M.; Giddings, J. c. Anal. Chern. 1983.55,418.(5) Oros. F.].; Davis, J. M. j. Chromatogr. 1991,550, 135.(6) Davis, J M. Anal. Chern. 1991, 63, 2141.(7) Guiochon, G.; Beaver, L. A; Gonnard, M. F.; Siouffi. A. Zakaria, Yr, j.
1983,255,415.(8) Monnig, A; Jorgenson,]. W. Anal. Chem. 1991, 63, 807.
0003-2700/95/0367-3840$9.0010 © 1995 American Chemical Society
where N is the number of entries found in each data vector, whichis also the number of components in a multidimensional ohro-
kn kI2 kIj
k2l kZ2 k2jk= (1)
kil k'2 kij
(2)
(3)
where mi is the mean of the original entries of the ith vector, and5i is the standard deviation of the original entries of the ith vector.The new scaled matrix is represented by k', and the transposedmatrix is defined as 1<"'. The sample by sanlple con-elation matrixis then given as
peak widths, The small boxes represent resolution units in the2D space. The theoretical or maximum peak capacity, therefore.is equal to the number of boxes in the plane, which is N, x N2.
The area of the plane is then defined as the theoretical peal,capacity,' NT.
Retention correlations between dimensions shrink the retentionspace, which makes some of the area in Figure 1 unaccessible tocomponent zones; therefore, the actual peak capacity, NI' , issmaller than NT· An assumption is made here that the practicalpeak capacity, Np, is equal to the available area determined bythe retention correlation in the space.
Calculation of Correlation and Peak Spreadling i\.n.g1e
Matrices. Io For simplicity, the following discussion is generalizedfor a multidimensional retenlion space, and so the proceduresdeveloped herein should be applicable to an ,,-dimensionalretention space involving n independent retention vectors, wheren is equal to or greater than 2.
For an i-dimensional separation, there are i sets of retentiondata generated from each run, which can be represented in amatJix form k as
where the element iii; is the retention value of the ccmponentj inthe ith dimension. One of the main purposes of factor analysisis to provide a represemation of data vectors in a space with alower dimensionality, while preserving the original informationcontent. Reducing the measurement dimensionality allows a
better understa.nding of the phenomenon under consideration.Factor analysis could be useful in multidimensional separationsbecause more than one retention vector and several soluteproperty vectors could be involved, A geometric approach tofactor analysis could be used to calculate correlations between apair of vectors. Because the correlation between any two unitlength vectors is the cosine of the angle between them, the entriesin eq 1 must be scaled, such that their mean is zero and theirvariance is one. The scaled matrix can be calculated according
to
I-e-
I
N,
Figure Orthogonal, 2D retention plane defined by the peakcapacities M and N2.
THEORYAssumptions. In comprehensive 2D chromatographic sepa
rations, two sets of independent retention data (either in the formof tR or k) arc generated simultaneously. We assume that eachset Jf retention data can be considered as an independent vectorwhi,:h represents the interactions between solutes and thestationary phase under a given set of conditions. This set ofvectors can be manipulated mathematically for various calcula
tions.Wnen more than one vector are generated in an analytical
measurement, sl:ch as from gas chromatography/mass spectrometry or multichannel spectrometry, factor analysis has heen usedto determine the number of independent components within theset of measured vectors. We assume that there are two retentionvectors associated with any given 2D chromatogram; then, as inother applications of factor analysis, correlations of the tworetention vectors can be calculated.
To formllate the practical peak capacity, an orthogonal, 2Dretention space is assumed in which a number of component zonesspread. As illustrated in Figure 1, we assume that the peak
capacity in the first dimension is NI and the peak capacity in thesecond dimension fl.;,. On each retention coordinate, the peaksare evenly s;oaced with a Gaussian-shaped profile. The horizontaland vertical lines across the plane divide the retention space into
resolution units '0lith spacing approximately equal to the respective
mechanism but also on the properties of the solutes and theseparation conditions. Orthogonal separations have been demonstrated even when the principal separation mechanisms arealike.'
It is necessary establish a basis on which the performanceof a comprehensive 2D separation can be evaluated and theanalytical performance of different systems can be compared. Peak
capacit, and orthogonality are interrelated parameters describingthe resolving power of 2D separations. The degree of orthogonality :letem1ines the available retention space in which the componert zones spread. A procedure is developed in this paper torelate orthogonality and peak capacity ill 2D separations. The
procedure involves three steps: first, correlation and peak spread
ing angle matrices are computed using a set of 2D retention data;secJnd, the peak capacities in each dimension are calculated, andthe theoretical peak capacity is estimated: and third, the degreeof orthogonality is used to calculate the practical peak capacity,which is the appropriate measure for the resolving power of 2Dseparation systems.
(9) z.: Phillips, J. B. j. Chromatogr. Sci. 1991,29,227.(10) Sharf, M. A: Illman. D. L.: Kowalski. B. R. Chemometries; John Wiley &:
Sons: New York, 1992.
Analytical Chemistry, Vol. 67. No. 21, November 1. 1995 3841
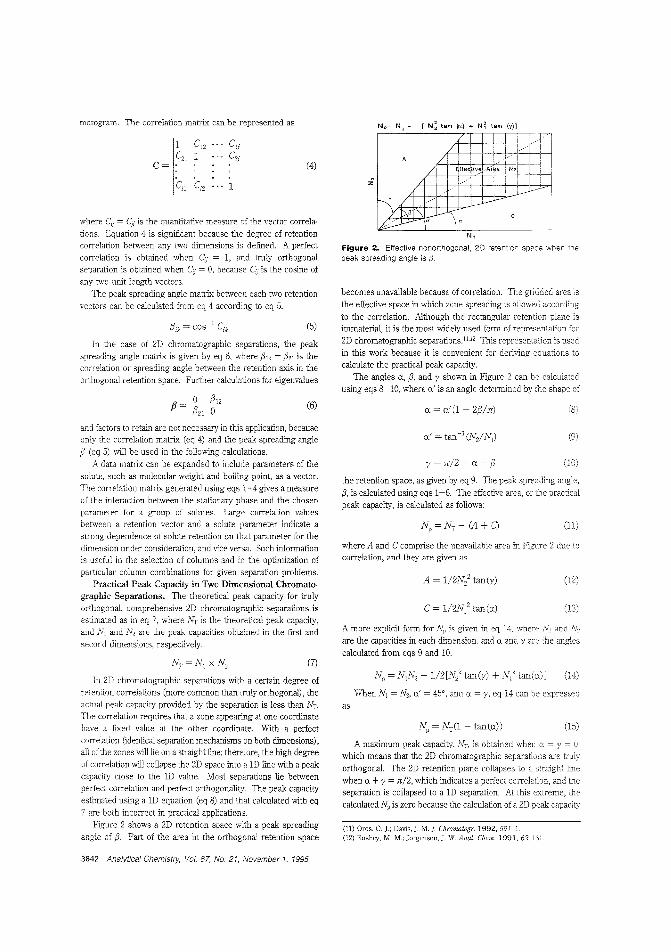
matogram. The correlation matrix can be represented as
In the case of 2D chromatographic separations, the peakspreading angle matrix is given by eq 6, where /312 = /321 is thecorrelation or spreading angle between the retention axis in theorthogonal retention space. Further calculations for eigenvalues
(9)
(8)
(15)
(12)
(13)
(11)
(10)
tan(y)
y = n/2 a - (3
a. = a'(1 - 2,B/n)
C = l!2N/ tan (a)
A=
/ I" IA /
/ fle IV~ .A·r' a N,
A _l,...--"
i'Z/I.- L--
YNI" -\a C
~n'
Np = N j N2 - l/2[N/ tan(y) + N,2 tan (a) ] (14)
When N j = N2, a.' = 45', and a. = y, eq 14 can be expressed
as
where A and C comprise the unavailable area in Figure 2 due tocorrelation, and they are given as
(11) Oros. o. J: Davis, j. M. f. Chromatogr. 1992.591, 1.(12) Bushey, M. M.; Jorgenson,]. W. Anal. Chem. 1991, 62.
A more explicit form for N" is given in eq 14, where N, andare the capacities in each dimension, and a. and yare me angies
calculated from eqs 9 and 10.
A maximum peak capacity, N r , is obtained when a. = y = 0,which means that the 2D chromatographic separations are truiyorthogonal. The 2D retention plane collapses to a straight line
when a. +y = n/2, which indicates a perfect correlation, and theseparation is collapsed to a ID separation. At this extreme, the
calculated Np is zero because the calculation of a 2D peak capacity
N,
Figure 2. Effective nonorthogonal, 20 retention space when the
peak spreading angle is I).
the retention space, as given by eq 9. The peak spreading angle,
(3, is calculated using eqs 1-6. The effective area, or the practicalpeak capacity, is calculated as follows:
becomes unavailable because of correlation. 'D,e gridded area is
the effeotive space in which zone spreading is allowed accordingto the correlation. Although the rectangular retention plane isimmaterial, it is the most widely used form of representation for2D chromatographic separations.]]'!2 This representation is used
in this work because it is convenient for deriving equations tocalculate the practical peak capacity.
The angles a., /3, and y shown in Figure 2 can be calculatedusing eqs 8-10, where a.' is an angle determined by the shape of
(7)
(6)
(4)
(5)
1 C,2 C1j
CZl 1 C21c=Cil (2
In 2D chromatographic separations with a certain degree ofretention correlations (more common than truly orthogonal), theactual peak capacily provided by the separatior is less than NT.The correlation requires that a zone appearing at one coordinatehave a fixed value at the other coordinate. With a peliectcon'eiation (identical separation mechanisms on both dimensions),all of me zones will lie on a straight line; therefore, the high degreeof correlation will collapse the 2D space into a 10 line with a peakcapacity close to the 1D value. Most separations lie betweenpeliecl correlation and perfect orthogonality The peak capacityestimated using a 10 equation (eq 8) and that calculated with eq7 are both incorrect in practical applications.
Figuro 2 shows a 2D retention space with a peak spreading
angle of /3. Part of the area in the orthogonal retention space
p=IO /3121
(3Z1 0
and factors to retain are not necessary in this application, becauseouly the correlation matrix (eq 4) and the peak spreading angle
(3 (eq 5) will be used in the following calculations.A data matrix can be expanded to include parameters of the
solute, such as molecular weight and boiling point, as a vector.The correlation matrix generated using eqs 1-4 gives a measureof the interaction between the stationary phase and the chosenparameter for a group of solutes Large correlation values
between a retention vector and a solute parameter indicate astrong dependence of solute retention on that parameter for thedimension under consideration, and vice versa. Such informationis useful in the selection of columns and in the optimization ofparticular column combinations for given separation problems.
Practical Peak Capacity in Two-Dimensional Chromatographic Separations, The theoretical peak capacity for trulyorthogonal, comprehensive 2D chromatographic separations isestimated as in eq 7, where NT is the theoretical peak capacity,and N j and N2 are the peak capacities obtained in the first and
second dimensions, respectively.
where Ci) = Cl' is the quantitative measure of the vector correlations. Equation 4 is significant because the degree of retentioncorrelation between any two dimensions is defined. A peliectcorrelation is obtained when Cij = 1, and truly orthogonalseparation is obtained when Ci} = 0, because Cj is the cosine ofany two unit length vectors.
The peak spreading angle matrix between each two retentionvectors can be calculated from eq 4 according to eq 5.
3842 Ana/ytica! Chemistry, Vol. 67. No. 21. November 1. 1995
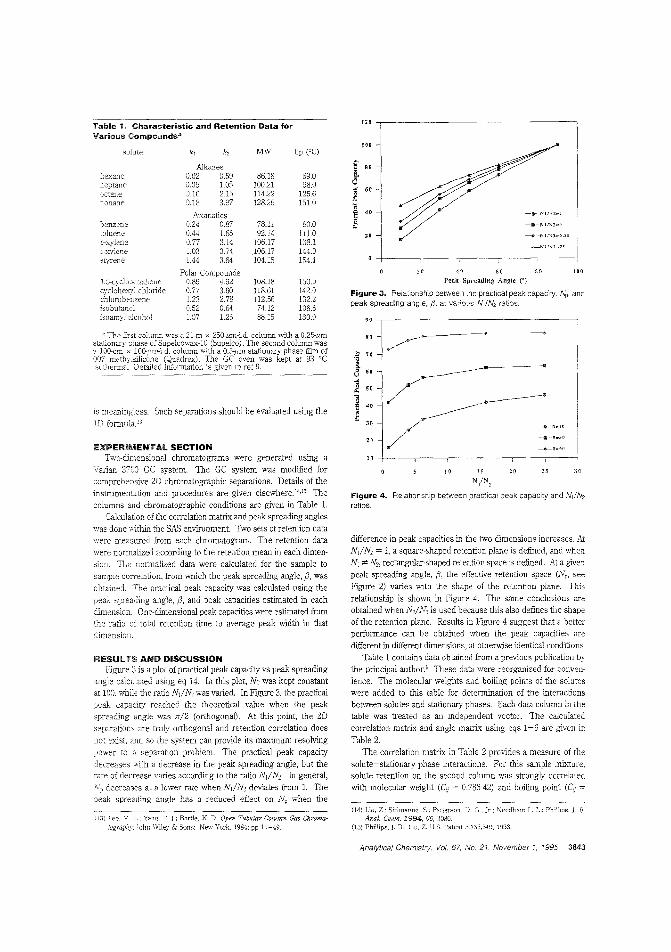
Figure 4. Relationship between practical peak capacity and MIN2
ratios.
20 4Q 60 80 HO
Peak Spreading Angle nFigure 3. Relationship between ;he practical peak capaci:y, Np, andpeak spreading angle, fj, at various N,/N2 ratos.
25 30
--+-n",/Jo
90
8. .~.!i" 7.·0
8 6. ..------------l 5. /]'" 4'
~30
2'
10
10 15 2.N/N',
110
100
t'1J BO-Il.a~
6.p.,
11 4.iJ -o-Nlr-lZ.. J
~ -a---N 1I~2,,,Ap.,
2' ---+---N1 I:-<Z.,6.25
difference in peak capacities in the two dimensions increases. AtN I / N, = 1, a square-shaped retention plane is defined, and whenN '" N2, rectangular-shaped retention space is defined. At a givenpeak spreading angle, {J, the effective retention space (N", seeFigure 2) varies with the shape of the retention plane. This
relationship is shown in Figure 4. The same conclusions areobtained when NjN, is used because this also defines the shapeof the retention plane. Results in Figure 4 suggest that a betterperformance can be obtained when the peak capacities aredifferent in different dimensions, at otherwise identical conditions.
Table 1 contains data obtained from a previous publication bythe principal author.' These claIR were reorganized for conven
ience. The molecular weights and boiling points of the soluteswere added to this table for determination of the interactionsbetween solutes and stationary phases. Each data column in thetable was treated as an independent vector. The calculatedcorrelation matrix and angle matrix using eqs 1-6 are given in
Table 2.
The correlation matrix in Table 2 provides a measure of Ihesolute-stationary phase interactions. For this sample mixture,solute retention on the second column was strongly correlatedwith molecular weight (C,i = 0.78642) and boiling point (eij =
EXPERIMENTAL SECTIONTwo-dimensional chromatograms were generated using a
Varian 3700 GC system. The GC system was modiJied forcomprehensive 2D chromatographic separations. Details of theinstrllmentation and procedures are given elsewhere. 14,15 Thecolumns and chromatographic conditions are given in Table l.
Calculation of the correlation matrix and peak spreading angleswas done within the SAS environment. Two sets of retention datawere measured from each chromatogram. The retention datawere normalized according to the retention mean in each dimensioll. The normalized data were calculated for the sample tosample correlation, from which the peak spreading angle, {J, wasobtained. The practical peak capacity was calculated using the
pea" spreading angle, {J, and peak capacities estimated in eachdimension. One-dimensional peak capacities were estimated from'ile ratio of total retention time to average peak width in thatdimenslon.
RESULTS AND DISCUSSIONFigure 3 is a plot of practical peak capacity vs peak spreading
angle calcu·!ated using eq 14. In this plot, NT was kept constantat 100, while the ratio NI/N2 was varied, In Figure 3, the practical)eak capacity reached the theoretical value when the peal,spreading angle was ,,/2 (orthogonal). At this point, the 2Dseparations are truly orthogonal and retention correlation does
not exist, and so the system can provide its maximum resolvingpower to a separation problem. The practical peak capacity
decreases with a decrease in toe peak spreading angle, but therate of decrease varies according to the ratio NIlN,. In general,Np decreases at a lower rate when NdN2 deviates from 1. Thepeak spreading angle has a reduced effect on Ny when the
C The iirs.t column was a 21-m x 250-,um-i.d. column with a O.25-,umstallonary phase of Supelcowax-:O (Supelco). The second column wasa IOO-em x lO()..pm-i.d. column w-ith a D.5-pm stationary phase film of007 methylsilicone (Quadrex). The GC was kept at 93 'cisuthermal. Detailed infonnation is given in
Table 1. Characteristic and Retention Data forVarDous CompoiLmds3
solute k, k2 MW bp (0C)
Alkaneshexane 0.02 0.59 86.18 69.0heptane J.05 1.05 100.21 98.0octane J.10 2.15 114.22 125.6nonane J.18 3.97 128.26 151.0
ArOD16.ticsbenzene 0.24 0.87 78.11 80.0toluene 0.44 1.65 92.14 111.0
0.77 3.14 106.17 138.11.03 3.74 106.17 144.0
slyrene 1.44 3.64 104.15 154.4
Polar Compounds0.89 4.92 108.18 150.0
chloride 0.77 3.60 118.61 142.01.23 2.78 112.56 132.2
isobutanc,l 0.52 0.64 74.12 108.3isoamyl alcohol :.07 1.25 88.15 130.0
is meaningless. Such separations should be evaluated using the1D formula. 13
(3) Lee, \1. L; Ya:l,l:;:. F. ].; Bartle, K D. Open Tubular Column Gas Chromatography: .'ohn Wiley & Sons: New York, 1984; pp 14-49.
Sinmanne, S.: Patterson. D. G., :r.; t\eedham L. L PhiUips,]. B1994, 66, 3086.
(15) Phillips, J. B.; Liu, Z. U.S. Palent 5,135,:'549,1993.
Analytical Chemislry Vol. 67. No. 21, November 1, 1995 3843
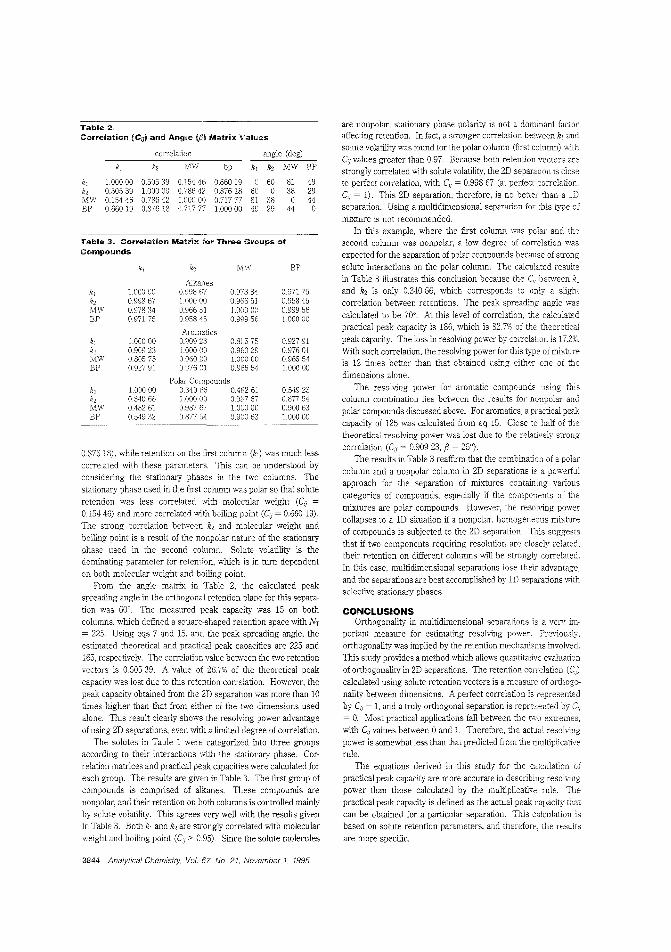
Table 3. Correlation Matrix for Three Groups of
Compounds
Table 2.Correlation (C;j) and Angie !P) Matrix Vailles
correlation angle (dog)
k, k2 MW bp k, k2 IvlW BP
1.00000 0.50539 0.15446 0.660 19 60 81 490.50539 1.00000 0.78642 0.876 18 60 0 38 290.15446 0.78642 1.00000 0.71777 81 38 0 44
BP 0.660 19 0.876 18 0.717 77 1.00000 49 29 44 0
0.87618), while retention on the first column (k) was much lesscorrelated with these parameters. This can be understood byconsidering the stationary phases in the two columns. Thestationary phase used in the first column was polar so that soluteretenaon was less correlated with molecular weight (Cij =0.15446) and marc correlatcd with boiling point (Cij ~ 0.660 19).
The strong correlation between k, and molecular weight andboiling point is a result of the nonpolar nature of the stationaryphase used in the second column. Solute volatility is thedominating parameter for retention, which is in tum dependenton both molecular weight and bOiling point.
From the angle matrix in Table 2, the calculated peakspreading angle in the orthogonal retention plane for this separation was 60°. The measured peak capacity was 15 On bothcolumns, which defined a square-shaped retention space with NT
225. Using eqs 7 and 15, and the peak spreading angle, theestimated theoretical and practical peak capacities are 225 and165, respectively. The correlation value between the two retentionvectors is 0.50539. A value of 26.7% of the theoretical peakcapacity was lost due to this retention correlation. However, thepeak capacity obtained from the 2D separation was more than 10times higher than that from either of the two dimensions usedalone. This result clearly shows the resolving power advantageof using 2D separations, even with a limited degree of correlation.
The solutes in Table 1 were categorized into three groupsaccording to their interactions with the statiorary phase. Correlation matrices and practical peak capacities were calculated foreach group. The results are given in Table 3. The first group ofcompounds is comprised of alkanes. These compounds arenonpolar, and their retention on both columns is controlled mainlyby solute volatility. This agrees very well with the results givenin Table 3. Both k, and k2 are strongly correlated with molecularweight and boiling point (C,j > 0.95). Since the solute molecules
BP
BP
BP
ki k2 MW BP
Alkanes1.00000 0.99867 0.97834 0.97" 750.99867 100000 0.96651 0.958450.97834 0.96651 1.00000 0.999560.971 75 0.958 /15 0.99956 1.00000
Aromatics1.00000 0.90923 0.80575 0.927910.90923 100000 0.96029 0.976010.80575 0.960 :29 1.00000 0.965540.92791 0.97601 0.96554 1.00000
Polar1.0C)() 00 0.340 0.48261 0.549230.34066 1.00000 0.98767 0.877540.482 61 0.98767 1.00000 0.900630.54932 0.877 54 0.90063 1.00000
are nonpolar, stationary phase polarity is not a dominant factoraffecting retention. In fact, a stronger correlation between k, andsolute volatility was found for the polar column (first column) withCij values greater than 0.97. Because both retention vectors arestrongly correlated with solute volatility, the 2D separation is closeto pertect correlation, with Cij = 0.998 67 (at pertect correlation,CI = 1). This 2D separation, therefore, is nO better than a 1Dseparation. Using a multidimensional separation for this type ofmixture is not recommended.
In this example, where the first column was polar and thesecond column was nonpolar, a low degree of correlation was
expected for the separation of polar compounds because of strongsolute interactions on the polar column. The calculated resultsin Table 3 illustrates this conclusion because the C; between k,
and k2 is only 0.34066, which corresponds to only a slightcorrelation between retentions. The peak spreading angle wascalculated to be 70'. At this level of correlation, the calculatedpractical peak capacity is 186, which is 82.7% of the theoreticalpeak capacity. The loss in resolving power by correlation is 17.3%.With such correlation, the resolving power for this type of mixtureis 12 times better than that obtained using either one of thedimensions alone.
The resolving power for aromatic compounds using thiscolumn combination lies between the results for nonpolar andpolar compounds discussed above. For aromatics, a practical peakcapacity of 125 was calculated from eq 15. Close half of thetheoretical resolving power was lost due to the relatively strong
correlation (C;, = 0.90923, fJ = 25°).The results in Table 3 reaffirm that the combination of a polar
column and a nonpolar column in 2D separations is a powerfulapproach for the separation of mixtures containing variouscategories of compounds, especially if the compOnents of themixtures are polar compounds. However, the resolving powercollapses to a ID situation if a nonpolar, homogeneous mixtureof compounds is subjected to the 2D separation. This suggeststhat if two components requiring resolution are closely related,their retention On different columns will be strongly correlated.In this case, multidimensional separations lose their advantage,and the separations are best accomplished by ID separations withselective stationary phases.
CONCLUSIONSOrthogonality in multidimensional separations is a very im
portant measure for estimating resolving power. Previously,orthogonality was implied by the retention mechanisms involved.This study provides a method which allows quantitative evaluationof orthogonality in 2D separations. The retention correlation (CJcalculated using solute retention vectors is a measure of orthogonality between dimensions. A pertect correlation is representedby Cli = 1, and a 1ruly orthogonal separation is represented by C;I= O. Most practical applications fall between the two extremes,with Cil values between 0 and 1. Therefore, the actual resolvingpower is somewhat less than that predicted from the multiplicativerule.
The equations derived in this study for the calculation ofpractical peak capacity are more accurate in describing resolvingpower than those calculated by the multiplicative rule. 11,epractical peak capacity is defined as the aetual peak capacity thatcan be obtained for a particular separation. This calculation isbased on solute retention parameters, and therefore, the resultsare mOre specific.
3844 Analytical Chemislry, Vol 67. No 21, November 1, 1995

The method is not only useful in the evaluation of theperronnance of multidimensional separations but also applicableto optimization methods, such as the selection of correct columncombinations for a given separation problem. Work is presentlyunderway to test t'le application of this method in the evaluationand optimization of multidimensional separations, including column selections for different separation problems, tuning of
separation conditions for a specific separation, and optimizationfor achieving maximum orthogonality.
Received for review Decemer 21, 1994. Accepted June 20,1995.°
AC9412286
oAbstract publishec in Advance ACS Abstracts, September 15, 1995.
Analytical Chemistry, Vol. 67, No. 21, November 1, 1995 3845
Anal. Chem. 1995, 67. 3846-3852
Source Identification of Underground Fuel Spills byPattern Recognition Analysis of High-Speed GasChromatogramsBarry K. Lavine*
Department of Chemistry, Box 5810, Clarkson University, Potsdam, New York 13699-5810
Howard Mayfield, Paul Fl. Kromal1n, and Abdullah Faruque
AUEQ, 139 Barnes Drive, Suite 2, Tyndall AFB, Florida 32403-5323
Pattern recognition methods have been used to classifyhigh-speed gas chromatograms ofweathered and unweathered jet fuels. A total of 228 neat jet fuel samplesrepresenting common aviation fuels sold in the UnitedStates were characterized by 85-peak gas chromatograms.Discriminants were developed by parametric and nonparametric pattern recognition procedures that correctlyclassified the gas chromatograms of neat jet fuels according to fuel1ype (JP-4, Jet-A, JP-7, JPIS, or JP-5), andthese discriminant functions were successfully used toclassify gas chromatograms of jet fuels which had undergone weathering in a subsurface environment. Thisapproach for identification of weathered fuels was takenbecause tile physical and chemical interactions of jet fuelcomponents with the subsurface environment are not yetfully understood.
More than half of the individual households and communitiesin the United States rely on groundwater as their primary potablewater resource l The possible contamination of this essentialnatural resource by fuels stored in leaking underground tanks orpipelines has prompted the U.s. Air Force (USAF) to develop newmethods for the identification of fuel materials recovered fromsubsurface environments. Growing interest in techniques whichcan establish the type of fuel responsible for the contaminationof an underground well or aquifer is motivated in part by thecleanup costs, legal fees, and fines incurred by the polluter.However, determining the type of fuel recovered from a subsurfacesite near an underground well or aquifer is not a simple task. Aprocessed fuel is a highly complex mixture, and the action of thcenvironment is another complicating factor that must be takeninto account, since it can alter the composition of the fuel.
TIle potential of gas chromatography for correlating hydrocarbon spills to suspected fuel sources is recognized by manyworkers2.:! in the field of environmental chemistry. Typically, gaschromatograms of the fuel spill and a number of suspectedsources are compared visually in order to obtc.in a best match.However, visual analysis of gas chromatograms can be subjectiveand usually cannot take into account the effects of weathering
(1) Cohen, S. Z.: Creeger. S. M.; Carse!' R. F.; Enfield, C. G. In Treatment andDisposal of Pesticide Wastes: Kruager, R. F., Seiber, ]. N., Eds.; ACSSymposium Series 259; American Chemical Socie~y: Viiashinb,rton. DC, 1984;pp 297-:325.
(2) Kawahara, F. K.]. SCI. 1972, 10, 629-635.(3) Kawahara, K.; Yang, Y. Chem. 1976,48,651-656.
3846 Analytical Chemistry, Vol. 67, No. 21. November 1, 1995
onthe overall GC profile of the fuel. Therefore, evidence basedon visual analysis of gas chromatograms is not always persuasivein a court of law, especially in cases involving an unweatheredfuel identified as the source of a fuel spill, becallse of the markeddifferences between gas chromatograms of weathered and unweathered jet fuels.
Due to the complexity of the mixture which constitutes aprocessed fuel, a systematic comparison of gas chromatogramsis often necessary to ensure that differences in compositionbetween various types of fuels are consistent;' which is whypattern recognition methods offer a better approach to lhe problemof matching gas chromatograms of jet fuels than visuai analysis.Pattern recognition methods can identify fingerprint patterns inthe gas chromatographic (GC) data characteristic off.lcl type eventhough the fuel samples in the training set have becn subjectedto a variety of conditions. Hence, classifiers can be developedfrom the GC data that are relatively insensitive to changes in theoverall GC profile of the original fuel due to contamination,analytical error, or weathering. Furthermore, the discriminatoryinformation that is sought in the chromatographic data oftenconsists of subtle variations in relative peak intensities distributedacross several peaks in the gas chromatograms. Pattern recognition methods are especially well suited for extracting this type ofinformation from the large anlounts of qualitative and quantitativedata present in the gas chromatograms.
In this study, pattern recognition methods have been used to
classify the gas chromatograms of weathered and unweatheredjet fuels, A data base of 228 gas chromatograms of neat jet flelsamples representing common jet fuels found in the United Stateswas developed. Employing pattern recognition methods, the gaschromatograms of jet fuels that had undergone weathering in asubsurface environment have been correctly classified by typeusing discriminants developed from the gas chromatograms ofneat jet fuels. This approach has been taken because the physicaland chemical interactions of jet fuel components with thesubsurface environment arc not yct fully understood. The studydescribed here is a logical extension of an earlier effort,'·6 whichemphasized the development of graphical and statistical patternrecognition methods for interpretation of GC profile data.
(4) Lavine, B. K; Qin, X.; Stine, A; Mayfield, H. T. Process Control Qual. 1992,2,347-355.
(5) Lavine, B. K; Stine, A.; Mayfield, H. T. A.nal. Chim. Acta 1993, 227. 357367.
(6) Lavine, B. K. Chemolab 1992, 15.219-230.
0003-2700/95/0357-3846$9.00/0 © 1995 American ChAmical Society
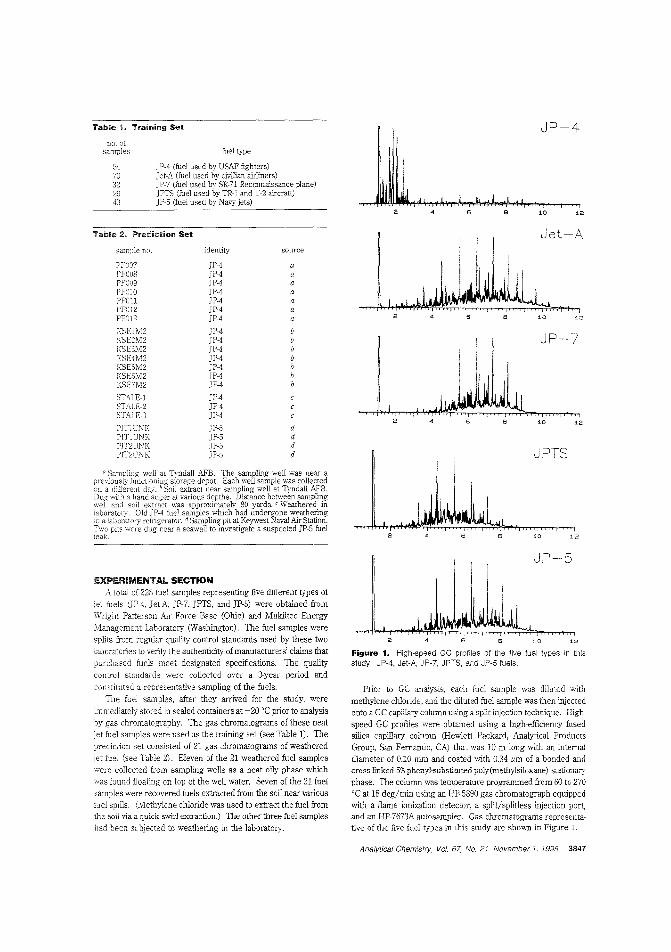
Table 1. Training Set JP-4no.
olel type
54 JP·4 (fuel used by USAF jghters)70 jet-A (fuel used by civilian airliners)32 JP-7 (fuel used by SR-71 Reconnaissance plane)29 JPTS (fuel used by TR-l and U-2 aircraft)43 jP-5 (fuel used by _N_avy~j_et_s) _
2 6 8 10 '2
12it
'0
JPTS
862
Prior to GC analysis, each fuel sample was diluted withmethylene chloIide, and the diluted fuel sample was then injectedonto a GC capillary column using a split injection technique. Highspeed GC profiles were obtained using a high-efficiency fusedsilica capillary column (Hewlett Packard, Analytical ProductsGroup, San Fernando, CA) that was 10 m long with an internaldiameter of 0.10 mm and coated with 0.34 I'm of a bonded andcross, linked 5% phenyl-substituted poly (methylsiloxane) stationaryphase. The column was temperature programmed from 60 to 270'C at 18 deg/min using an HP-5890 gas chromatograph equippedwith a flame ionization detector, a split/splitless injection port,and an HP-7673A autosampler. Gas ohromatograms representative of the five fuel types in this study are shown in Figure 1.
J""'I~Figure 1. High-speed GC profiles of the live luel types in thissfudy: JP-4, Jet-A, JP-7, JPTS, and JP-5 fuels.
IJP-5
,"",.,A.,2 4 6 10 12
dddd
aaaaaaa
source
jP-1jP-4IP-4JP·4JP-4JP-4JP-4
JP-4JP·4JP-4JP-4JP-4JP-4JP-4
JF-4JP-4JP-4
JP-5JP-5JP-5JP·5
identity
FF007FFOOSPF009PFO:OPFO:!P:r012FFOJ3
KSE!M2KSE2M2KSE3M2KSElM2KSE5M2KSE6M2KSE7M2
STALE-!STALE-2STA.LE-3
PITlUNKPITJUNK
sample no.
EXPERIMENTAL SECTIONA lotal of 228 fuel samples representing five different types of
jet fuels UP-4, JetA, JP-7, JPTS, and JP-5) were obtained fromWright Paleerson Air Force Base (Ohio) and Mukilteo Energy
Manageme~t Laboratory (Washington). The fuel samples weresplits from regular quality control standards used by these twolaboratories to verif] the authenticity of manufacturers' claims thatpurchased fuels meet designated specifications. The qualityconcrol stH.ndards were collected over a 3-year period andconstituted a representative sampling of the fuels.
The fuel samples, after they arrived for the study. wereimmediately stored in sealed containers at -20 'C prior to analysis'oy gas chromatography. The gas chromatograms of these neatjet fuel samples were used as the training set (see Table 1). TI,eprediction set consisted of 21 gas chromatograms of weatheredjet felel (see Table 2). Eleven of the 21 weathered fuel sampleswere collected from samplmg wells as a neat oily phase which
was found tloating on top of the well water. Seven of the 21 fuelsamples were recovered fuels extracted from the soil near variousfuel spills. (Methylene chloride was used to extract the fuel fromthe soil via a quick sVY'irl extraction.) The other three fuel samples
had been slbjetted to weathering in the laboratory.
AFB. The sampling well was near alJrel-/ie,;,iv illnrti011in" si'on,<,o depot. Each well sample was collected
d~~;e~(:~;,,~a;;;,;;:~~t ~:;~~~~near sampling well at Tyndall AFB.w depths. Distance bernreen sampling
approximately 80 yards. C Weathered insa'TIples which had undergone weathering
in,lla1J;ratoty ,:efrigerat",- d Sampling pit at Keywest Naval Air Station.f.car a seawall to investigate a suspected JP-5 fuel
Table 2. Prediction Set
Analytical Chemisiry Vol. 67, No. 21. November 1, 1995 3847
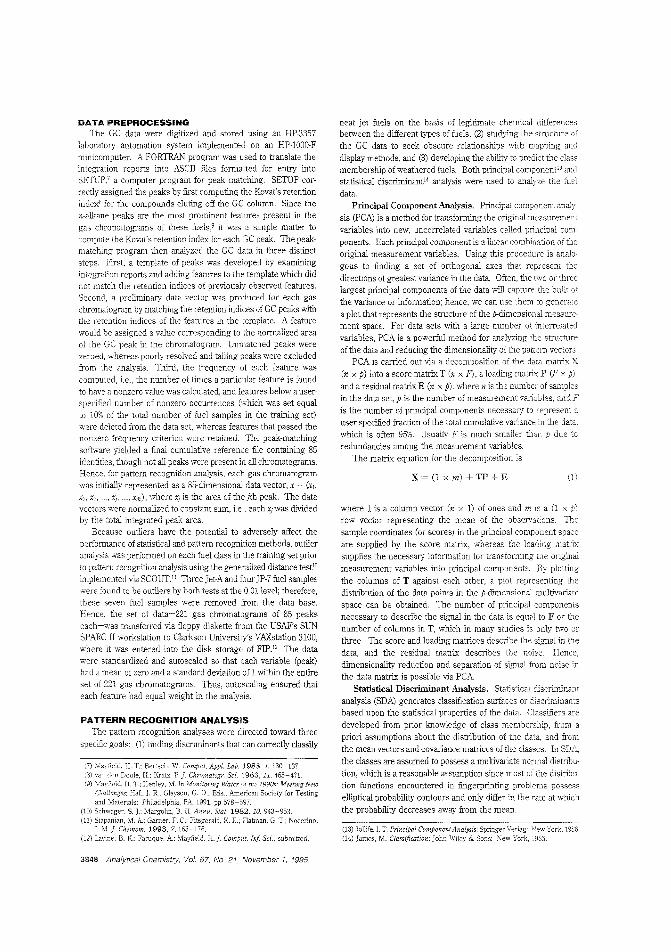
(13) Jallife, I. T. Principal Component Analysis: Springer Verlag: j\.~ew York, 1986.(14) James, M. Classification: John Wiley & Sons: New York,
where 1 is a column vector (n x 1) of ones and m is a (1 x p)row vector representing the mean of the observations. Thesample coordinates (or scores) in the principal component space
are supplied by the score matrix, whereas the loading matrix
supplies the necessary information for transforming the miginal
measurement variables into principal components. By plotting
the columns of T against each other, a plot representing thedistribution of the data points in the p-dimensional multivariate
space can be obtained. The number of plincipal components
necessary to descrihe the signal in the data is equal to F or thenumber of columns in T, which in many studies is only two orthree. The score and loading matrices desclibe the signal in the
data, and the residual matrix describes the noise. Hence,
dimensionality reduction and separation of signal from noise inthe data matrix is possible via PCA
Statistical Discriminant Analysis. Statistical discriminant
analysis (SDA) generates classification suriaces or discriminantsbased upon the statistical properties of the data. Ctassifiers are
developed from plior knowledge of class membership, from a
priori assumptions about the distribution of the data, and from
the mean vectors amI covariance matrices of the classes. In SDA.,
the classes are assumed to possess a multivariate normal distribu
tion, which is a reasonable assumption since most of the distribution functions encountered in fingerprinting problems possess
elliptical probability contours and only differ in the rate at which
the probability decreases away from the mean.
neat jet fuels on the basis of legitimate chemical differencesbetween the different types of fuels, (2) studying the structure
the GC data to seek obscure relationships \vith mapping ar.d
display methods, and (3) developing the ability to predict the classmembership of weathered fuels. Both principal component" andstatistical discriminant" analysis were used to analyze the fuel
data.PIincipal Component Analysis. Principal component analy
sis (PCA) is a method for transforming the original measurement
variables into new, uncorrelated variables called principal components. Each principal component is a linear combiniltion of the
original measurement variables. Using this procedure is analogous to finding a set of orthogonal axes that represent the
directions of greatest variance i."1 the data. Often, the two or threelargest principal components of the data ',vill capture the buil-> ofthe variance or information; hence, we can use them to generate
a plot that represents the structure of the p-dimensional measurement space. For data sets with a large number of interrelated
variables, PCA is a powerful method for analyzing the structure
of the data and reducing the dimensionality of the pattern vectors.PCA is carried out via a decomposition of the data matrix X
(n x P) into a score matrix T (n x F), a loading matJix P (F x p),
and a residual matrix E (n x P), where n is the number of samplesin the data set, p is the number of measurement variables, and Fis the number of principal components necessary to represent a
user-specified fraction of the total cumulative variance in the data.which is often 95%. Usually F is much smaller than p due toredundancies among the measurement variables.
The matrix equation for the decomposition is
DATA PREPROCESSINGThe GC data were digitized and stored using an HP-3357
laboratory automation system implemented on an HP-100Q-Fminicomputer. A FOlITRAN program was used to translate theintegration reports into ASCI! files formatted for entry intoSETUP,' a computer program for peak matching, SETUP correctly assigned the peaks by first computing the Koval's retentionindex' for thc compounds eluting off the GC column, Since then-alkane peaks are the most prominent features present in thegas chromatograms of these fuels,9 it was a simple matter tocompute the Kovat's retention index for each GC peak, The peakmatching program then analyzed the GC data in three distinctsteps, First, a template of peaks was developed by examining
integration reports and adding features to the template which didnot match the retention indices of previously observed features,Second, a preliminary data vector was produced for each gaschromatogram by matching the retention indices of GC peaks withthe retention indices of the features in the template, A featurewould be assigned a value corresponding to the normalized areaof the GC peak in the chromatogram. Unmatc;led peaks werezeroed, whereas poorly resolved and tailing peaks were excludedfrom the analysis. Third, the frequency of each feature was
computed, i.e., the number of times a particular feature is foundto have a nonzero value was calculated, and features below a userspecified number of nonzero occurrences (which was set equalto 10% of the total number of fuel samples in the training set)were deleted from the data set, whereas features that passed thenonzero frequency criterion were retained. 11,e peak-matchingsoftware yielded a final cumulative reference file containing 85identities, though not all peaks were present in all chromatograms.Hence, for pattern recognition analysis, each gas chromatogramwas initially represented as a 85-dimensional data vector, x = (Xl,
X1, x;, ... , Xj, .. " X8S) , where Xj is the area of the jth peak. The datavectors were normalized to constant sum, i.e., each xjwas dividedby the total integrated peak area.
Because outliers have the potential to adversely affect theperiormance of statistical and pattern recognition methods, outlieranalysis was performed on each fuel class in the training set priorto pattern recognition analysis using the generalized distance test"implemented via SCOlJTll Three Jet-A and four JP-? fuel sampleswere found to be outliers by both tests at the 0.01 level; therefore,these seven fuel samples were removed from the data base.Hence, the set of data-22l gas chromatograms of 85 peakseach-was transferred via floppy diskette from the USAF's SUNSPARC II workstation to Clarkson University's VAXstation 3100,where it was entered into the disk storage of FIpT2 The data
were standardized and autoscaled so that each variable ipeak)had a mean of zero and a standard deviation of 1 within the entireset of 221 gas chromatograms. Thus, autoscaling ensured thateach feature had equal weight in the analysis.
PATTERN RECOGNITION ANALYSISThe pattern recognition analyses were directed toward three
specific goals; (I) finding discriminants that can correctly classify
(7) Mayfield, H. T; Bertsch, W. Comput. Appt, Lab. 1983,1,130-137.(8) van den Doole, R; Kratz, P.]. Sci. 1963, 11, 463-471.(9) Mayfield, I-I, 1'.; Henley, M. In th~ lY"V" Meetm.g New
Oallenges: Hall,]. R.. Glayson, G. D., Eds.; American Societyand Materials: Philadelphia, PA, 1991; pp 578-597.
(10) Schwager, S.].; Margolin, B. H. Annu. Stat. 1982, 10, 943-953.(1) M. A.; Gamer, F. c.: K. E.; Flatman, G. T.: Nocerino,
]. 1993,7,(12) Lavine, B. K.: Faruque, A: Maytield, H. f. Comput. hi Sci., submitted.
3848 Analytical Chemistry, Vol. 67, No. 21, November 1, 1995
x = (1 x m) + TP + E (1)
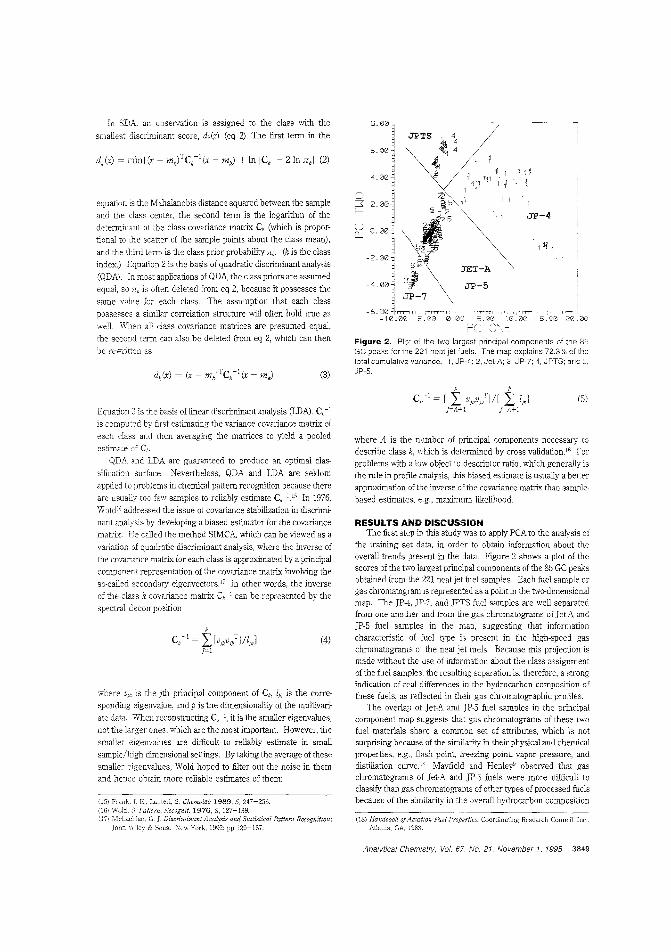
In SDA, an observation is assigned to the class with the
smallest discriminant score, d,(x) (eq 2). The first term in the
equation is the Mahalanobis distance squared between the sample
ar,d the class center, the second term is the logarithm of the
determinant of the class covariance matrix Ck (which is propor
tional to the scatter of the sample points about the class mean),
ar,d the tbrd term is the class prior probability J[k. (k is the class
index.) Equation 2 is the basis oi quadratic discriminant analysis
(QDA). In most applications of QDA, the class priors are assumed
equal, so J[, is oilen deleted irom eq 2, because it possesses the
same value ior each class. The assumption that each class
possesses a similar correlation structure win oilen hold true as
welL When an class covariance matrices are presumed equal,
the second tern1 can also be deleted from eq 2, which can then
be rewritten as
(3)
Equation 3 is the basis oilinear discriminant analysis (IDA). C,-I
is computed by first estimating the variance covariance matrix oi
each class aIllI tben averaging the matrices to yield a pooled
estimate of C/:.QDA and LDA are guaranteed to produce an optimal cla&
silication sunace. Nevertheless, QDA and LDA are seldom
applied to problems in chemical pattern recognition because there
are usually too few samples to reliably estimate Ck-115 In 1976,
WoWs addressed the issue of covariance stabilization in discrimi
nant analysis by developing a biased estimator for the covariance
matJix. He called the method SIMCA, which can be viewed as a
variation of quadratic discriminar;t analysis, where the inverse of
the covariance matrix for each class is approximated by a principal
component representation of the covariance matrix h-Ivolving the
so-called secondary eigerNectors. I7 In other words, the inverse
of the class k covariance matrix Ck-I can be represented by the
spectral decomposition
(4)
where is the jlh principal component of C" Ii' is the corresponding eigenvalue, and Pis the dimensionality of the multivari
ate data. When reconstructing Ck I, it is the smaller eigenvalues,
not the larger ones, which arc the most important. However, the
smaller eigenvalues are difficult to reliably estimate in small
sample/high dimensional settings. By taking the average of these
smaller eigenvalues, Wold hoped to filter out the noise in themand hence obtain more reliable estimates oi them:
(15) Frank. E.; Lantto, S. Chemolab 1989,5, 247-256.(16'1 Wold, S, Patiern. 1976,8,127-139.(17) McLachian. G. J. j)~cnimi"ant A,wlysis "nd Sta,tistieal Pa,'len, R"cognilion;
John Wiiey & Sons: New York 1992; pp 129-167.
,.0
== 2.r--
U 0.CL
-2.
-4.
-6.
Figure 2. Plot of the two largest principal components of the 85GC peaks for the 221 neat jet fuels. The map explains 72.3% of thetotal cumulative variance. 1, JP-4; 2, Jet·A; 3, JP-7; 4, JPTS; anc 5.JP-5
(5)
where A is the number of principal components necessary todescribe class k, which is determined by cross validation. Iii Forproblems with a low object to descriptor ratio, which generally isthe rule in profile analysis, this biased estimate is usually a better
approximation of the inverse of the covariance matrix than samplcbased estimates, e.g., maximum likelihood.
RESULTS AND DISCUSSIONThe first step in this study was to apply PCA to the analysis oi
the training set data, in order to obtain information about theoverall trends present in the data. Figure 2 shows a plot of thescores oi the two largest principal components of the 85 GC peaksobtained from the 221 neat jet fuel samples. Each fuel sample orgas chromatogram is represented as a point in the two-dimensionalmap. The JP-4, JP-7, and JPTS fuel samples are well separatedfrom one another and from the gas chromatograms oi Jet-A andJP-5 fuel samples in the map, suggesting that informationcharacteristic of fuel type is present in the high-speed gaschromatograms oi the neat jet fuels. Because this projection ismade without the use of information about the class assignmentoi the fuel samples. the resulting separatiun is, therefore, a strongindication of real differences in the hydrocarbon composition ofthese fuels, as reflected in their gas chromatographic profiles.
The overlap of Jet-A and JP-5 fuel samples in the principalcomponent map suggests that gas chromatograms of these twofuel materials share a common set of attributes, which is notsurprising because of the similarity in their physical and chemicalproperties., e.g_, flash point, freezing point, vapor pressure, anddistillation curve. L' Mayfield and Henley" observed that gaschromatograms oi Jet-A and JP-5 fuels were more difficult toclassify than gas chromatograms of other types of processed fuelsbecause oi the similarity in the overall hydrocarbon composition
(18) Handbook ofAviatioiZ Fuel Properties; Coordinating Research CounciL Inc.:Atlanta, GA 1983.
Analytical Chemistry, Vol. 67. No. 21, November 1, 1995 3849
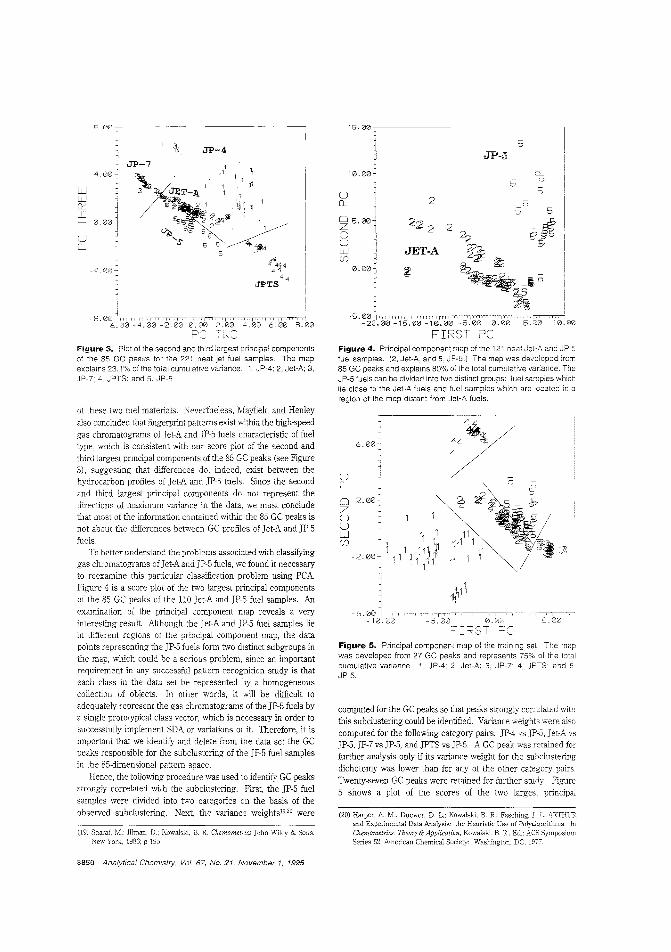
8 ()()~----------------~
JP-5
15.00 j
10.00
U2~
~ 5.00 2;2 2 20Uw JET-A(f)
0,00~
-5'~~0,00 -15.00 -10.00 -5.00 0.00 "5.00
FIRST PC
JPTS4 4
JP-41<1T~111'1
JP-74.
WW[l'
I0.
U~
Figure 3. Plot of the second and third largest principal componentsof the 85 GC peaks for the 221 neat jet fuel samples. The mapexplains 23.1 % of the total cumulative variance. 1, JP-4; 2, Jet·A; 3,JP-7; L, JPTS; and 5, JP-5.
Figure 4. Principal component map of the 121 neat Jet-A and JP·5fuel samples. (2, Jet-A, and 5, JP-5.) The map was developed from85 GC peaks and explains 80% of the total cumulative variance. TheJP-5 fuels can be divided into two distinct groups: fuel samples whichlie close to the Jet-A fuels and fuel samples which are located in aregion of the map distant from Jet-A fuels.
of these two fuel materials. Nevertheless, Mayfield and Henley
also concluded that fingerprint patterns exist ;vithin the high-speed
gas chromatograms of Jet-A and JP-5 fuels characteristic of fueltype, which is consistent with aUf score plot of the second andthird largest principal components of the 85 GC peaks (see Figure3), suggesting that differences do, indeed, exist between thehydrocarbon profiles of ]et·A and JP-5 fuels. Since the secondand third largest principal components do not represent thedirections of maximum variance in the data. we must concludethat most of the information contained within the 85 GC peaks isnot about the differences between GC profiles of ]et-A and JP-5
fuelsTo better understand the problems associated with classifying
gas chromatograms of Jet-A and JP-5 fuels, we found it necessaryto reexamine this particular classification problem using PCAFigure 4 is a score plot of the two largest principal componentsof the 85 GC peaks of the 110 ]et-A and JP-5 fuel samples. Anexamination of the principal component map reveals a veryinteresting result. Although the ]et-A and JP-5 fuel samples liein different regions of the principal component map, the datapoints representing the JP-5 fuels form two distinct subgroups inthe map, which could be a serious problem, since an importantrequirement in any successful pattern recognition study is thateach class in the data set be represented by a homogeneous
collection of objects. In other words, it will be difficult toadequately represent the gas chromatograms of the JP-5 fuels bya single prototypical class vector, which is necessary in order tosuccessfully implement SDA or variations of it. Therefore, it isimportant that we identify and delete from the data set the GCpeaks responsible for the subc1ustering of the JP-5 fuel samplesin the 85-dimensional pattern space.
Hence, the following procedure was used to identify GC peaksstrongly correlated with the subclustering. First, the JP-5 fuelsamples were divided into two categories on the basis of the
observed subclustering. Next, the variance weightsl9.2o were
(19) Sharaf, M.: Illman, D.; Kowalski, B. R Chemometrics John Wiley & Sons:York, 1986; p 195.
6. :vu~
C)
~S-
O 2.Z 1 ,-'0U
~ ,1 ,111W(f)
1 111 ~ 111' 1 15-2.
1 1 11 1
1~ 111 1" 1 1 ~
=- RST PCFigure 5. Principal component map of the training set The mapwas developed from 27 GC peaks and represents 75% of the totalcumulative variance. " JP-4; 2, Jet-A; 3, JP-7; 4, JPTS; and 5.JP-5.
computed for the GC peaks so that peaks strongly correlated withthis subclustering could be identified. Variance weights were alsocomputed for the following category pairs; JP-4 'IS JP·5, Jet-A 'IS
JP-5, JP-7 'IS JP-5, and JPTS 'IS JP-5. A GC peak was retained forfurther analysis only if its variance weight for the subclustering
dichotomy was lower than for any of the other category pairs.Twenty-seven GC peaks were retained for fuliher study. Figure
5 shows a plot of the scores of the two largest principal
(20) Harper, AM.; Duewer, D. L.; Kowafski, B. R; j. L. ARTHURand Experimental Data Analysis: the Heuristic Use InChemometries: Theor:/ & Application; Kowalski, B. R,Series 52; American Chemical Society: Washington, DC, 1977.
3850 Analytical Chemistry, Vol. 67, No. 21, November 1, 1995
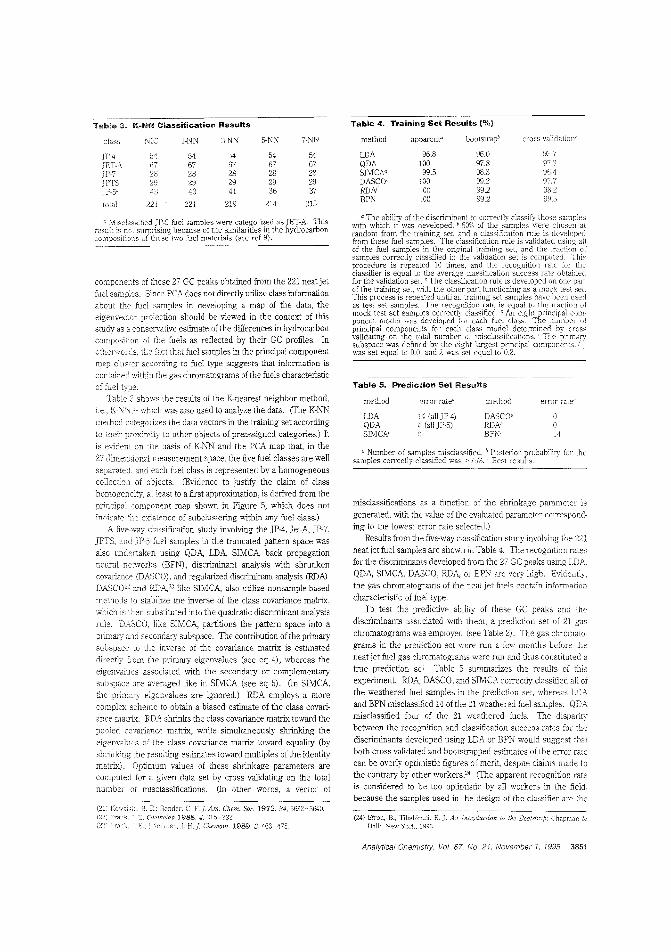
Table 3. K..NN Classification Results Table 4. Training Set Results l%)
class NIC 1-NN 3-NN 5-NN 7-NN method apparenta bootstrapb cross validation'
~4 54 54 54 54 LDA 96.8 96.0fi7 fi7 S7 fi7 fi7 QDA 100 078 97..328 28 28 28 28 SIMCA' 99.5 98.3 %.429 29 29 29 29 DASCO' 100 99.2 97.7
43 43 41 36 37 RDN 100 99.2 982
lotal 221 221 219 214 215 BPN 100 99.2 9:.i.S
misclassifications as a functior, of the shlinkage parameter isgenerated, with the value of the evaluated parameter corresporcling to the lowest error rate selected.)
Results from the five-way ciassification study involving the 22ineat jet fuel samples are shown in Table 4. The recognition ratesfor tlle discriminants developed from the 27 GC peaks using LDAQDA, SIMClI., DASCO, RDA, or EPN arc very high. Evident'ythe gas chromatograms of the neat jet f1Wls contain informationcharacteristic of fuel type.
To test the predictive ability of these GC peaks and thediscriminants assoc'ated with them, a prediction set of 21 gas
chromatograms was employed (see Table 2). The gas chromatograms in the prediction set were run a few months before theneat jet fuel gas chromatograms were run and thus constituted a
true prediction set. Table 5 summarizes the results of thisexperiment. RDA, DASCO, and SIMCA correctly classified all ofthe weathered fuel samples in the prediction set, whereas LDAand BPN misclassified 14 of the 21 weathered fuel samples. QDAmisclassified four of the 21 weathered fuels. The disparitybetween the recognition and classification success rates for thediscriminants developed using LDA or EPN would suggest thaiboth cross validated and bootstrapped estimates of the error ratecan be overly optimistic figures of merit, despite claims made tothe contrary by other workers"') (The apparent recognition rateis considered to be too optimistic by ali workers in the field.because the samples used in the design of the classifier arc the
for
oo14
errur fale'!method
DASC:Ob
RDA"BPN'
{:-:ITor rate
(all JP-41" (aIlJP-5)
method
lOAQDASIMCAb
Table 5. Prediction Set Results
compane!:ts of these 27 GC peaks obtained from the 221 neat jetfud samples. Since PCA does not directly utilize class infonnationabout the fuel samples in deve:oping a map of the data, theeigenvector proje,ction sr.ou]d be viewed in the context of thisstudy as a conservative estimate of the differences in hydrocarboncomposition of the fuels as reflected by their GC profiles. Inotherwonls, the (act Lhat fuel samples in the principal componentmap cluster according to fuel type suggests that information is
contained within the gas chromatograms of the fuels characteristicof fuel type.
Table 3 shows the results of the K-nearest neighbor method,i.e., which was also used to analyze the data. (The K-NNmethod categorizes the data vectors in the training set accordingto their proximity to other objects of preassigned categories.) It
is evicent on the basis of K-NN and the PCA map that, in the
27-dimensiom.l measurement space, the five fuel classes are wellseparated. and each fuel class is represented by a homogeneouscollection of objects. (Evidence to justify the claim of classhomogeneity. at least to a first approximation, is derived from theprincipal component map shown in figure 5, which does notindicate existence of subolustering "ithin any fuel class.)
A five-way c1assifioation study involving the .lP-4, .let-A, .lP-7,.lPIS, and .lP-5 fuel samples in the truncated pattern space wasaiso undeliaken using QDA, LDA, SIMCA, back propagationneural nelworks (EPN), discriminant analysis with shrunkencovariance (DASCO), and regulmized wscriminmlt analysis (RDA).DASCO" and RDA,23 like SIMCA, also utilize nonsample-based
methods stabilize the inverse of the class covariance matrix,wbeh is then substituted 'nto the quadratic discriminant analysismle. DASCO, like SIMCA, partitions the pattern space into a
primary and secondary subspace. The contribution of the primarysubslJace La the inverse of the covariance matrix is estimateddirectly crom the primary eigenvalues (see cq 4), whereas theeigenvaluES associated ¥lith the secondary or complementarysubspace are averaged like in SIMCA (see eq 5). (In SIMCA,the primacy eigenvalues are ignored.) RDA employs a morecomplex scheme La obtain a biased estimate of the class covariance matr'L~. RDA shrinks the class covariance matrix toward thepooled conriancc matrix, while simultaneous]y shrinking theeigenvalues of the class covariance matrix toward equality (by
shlinking 'the resulting esdmates toward multiples of the identitymatrix). Optimum values of these shrinkage parameters arecomputed for a given data set by cross validating on the totalnumber misclassiiications. (In other words, a vector of
B. R.: Bender. C Am. Chern. Soc. 1972, 94,5632-5640.E. Chemoiab 1988. 4,E.: Friedman, j. H.]. Chemom, 1989. 3, 463-475
(24) Efron, B.; Tibshinmi, R. J Introduction to the Bootstnp; Chapman &Hall: \'ew York, 1993.
Analytical Chemistry, Vol. 67. No. 21, November I, 1995 3851
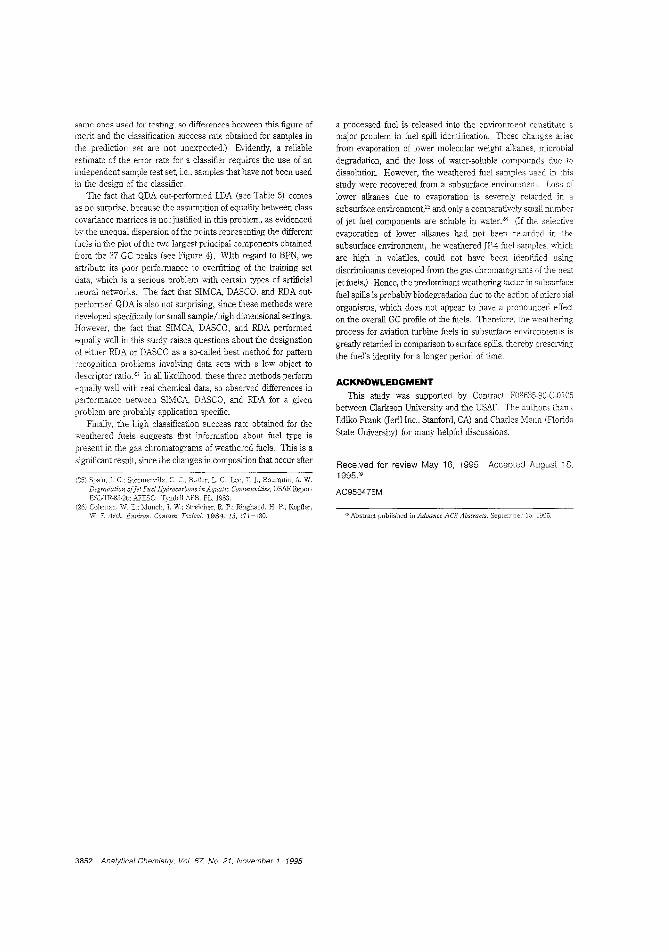
same ones used for testing, so differences between thi~ figure ofmerit and the classification success rate obtained for samples inthe prediction set are not unexpected.) Evidently, a reliableestimate of the error rate for a classifier requires the use of anindependent sample test set, i.e., samples that have not been usedin the design of the classifier.
The fact that QDA out-performed LDA (see Table 5) comesas no surprise, because the assumption of equality between classcovariance matrices is not justified in this problem, as evidencedby the unequal dispersion of the points representing the differentfuels ill the plot of the two largest principal components obtainedITom the 27 GC peaks (see Figure 4). WIth regard to BPN, weattribute its poor performance to overfitting of the training setdata, which is a serious problem with certain types of artificialneural networks. The fact that SIMCA, DASCO. and RDA outperformed QDA is also not surprising, since these methods weredeveloped specifically for small sample/high dimensional settings.However, the fact that SIMCA, DASCO, and RDA performedequally well in this study raises questions about the designationof either RDA or DASCO as a so-<:alled best method for patternrecognition problems invohing data sets with a low object todescriptor ratio." In all likelihood, these three methods performequally well with real chemical data, so observed differences inpeliormance between SIMCA, DASCO, and RDA for a givenproblem are probably application specific.
Finally, the high classification success rate obtained for theweathered fuels suggests that information about fuel type ispresent in the gas chromatograms of weathered fuels. This is asignificant result, since the changes in composition that occur after
(25) Spain, J c.; Sommerville, C. c.: Butler, L. c.: Lee, T. J; Bourquin, A. W.
D;!r:~~a~~;,~~: ~;:~~lf;:;;~::~~;~:~~:I~I~~CO",ml"'ities; USAF ReportE AFESC: AFB. 1'1, 1983.
(26) Coleman, W. E.; Munch, ]. Vi.; Streicher, R. P.; Ringhand, H. P.; KopIler,:. Arch. Environ. Contam. Toxicot. 1984, 13, 171-180.
3852 Analytical Chemistry, Vol. 67, No. 21, November 1, 1995
a processed fuel is released into the environment constitute amajor problem in fuel spill identification. These changes arisefrom evaporation of lower molecular weight alkanes, microbialdegradation, and the loss of water-soluble compounds due todissolution. However, the weathered fuel samples used in thisstudy were recovered from a subsurface environment. Loss oflower alkanes due to evaporation is severely retarded in asubsurface environment,25 and only a comparatively small numberof jet fuel components are soluble in water.2ii (If the selectiveevaporation of lower alkanes had not been retarded in thesubsurface environment, the weathered JP-4 fuel samples. whichare high in volatiles, could not have been identilled usingdiscriminants developed from the gas chromatograms of the neatjet fuels.) Hence, the predominant weathering factor in subsurfacefuel spills is probably biodegradation due to the action of microbialorganisms, which does not appear to have a pronounced effecton the overall GC profile of the fuels. Therefore, the weatheringprocess for aviation turbine fuels in subsurface environments isgreatly retarded in comparison to surface spills, thereby preservingthe fuel's identity for a longer period of time.
ACKNOWLEDGMENTThis study was supported by Contract F08635-90-C-0105
between Clarkson University and the USAF. The authors thankndiko Frank Oerll Inc., Stanford, CAl and Charles Mann (FIOlidaState University) for many helpful discussions.
Received for review May 16, 1995. Accepted August 18.1995.'"
AC950475M
o Abstract published in Advance ACS Abstracts, Sept.ember
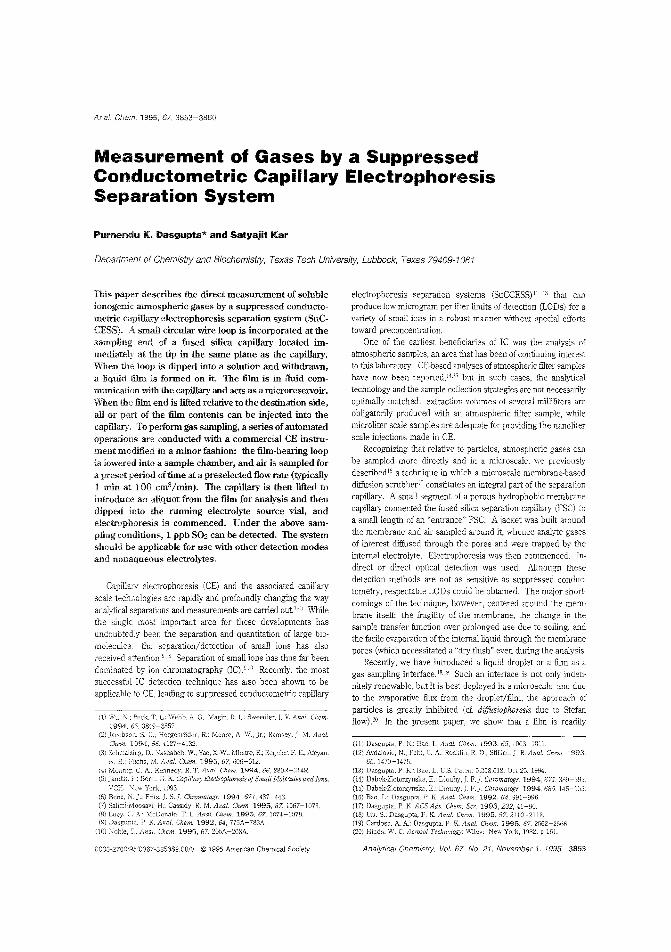
Ar;al. Chem. 1995, 67, 3853-3860
Measurement of Gases by a SuppressedConductometric Capillary ElectrophoresisSeparation System
Pumendu K. Dasgupta* and Satyajit Kar
Department of Chemistry and Biochemistry, Texas Tech University, Lubbock, Texas 79409-1061
This paper describes the direct measurement of solubleionogenic atmospheric gases by a suppressed conductometric capillary electrophoresis separation system (SuCCESS). A small circular wire loop is incorporated at thesampling end of a fused silica capi.llary located immediately at the tip in the same plane as the capi.llary.When the loop is dipped into a solution and withdrawn,a liquid film is formed on it. The film is in fluid communication with the capi.llary and acts as a microreservoir.When the film end is lifted relative to the destination side,all or part of the film contents can be injected into thecapi.llary. To perform gas sampling, a series of automatedoperations are conducted with a commercial CE instrument modified in a minor fashion: the film-bearing loopis lowered into a sample chamber, and air is sampled fora preset period of time at a preselected flow rate (typically1 min at 100 cm3/min). The capillary is then lifted tointroduce an aliquot from the film for analysis and thendipped into the running electrolyte source vial, andelectrophoresis is commenced. Under the above sampling conditions, 1 ppb SOz can be detected. The systemshould be applicable for use with other detection modesand nonaqueous electrolytes.
Capillaxy electrophoresis (CE) and the associated capmary
scale techrologies are rapidly and profoundly changing the way
analytical separations a.I1d measurements are canied out. H Whilethe single most important area for these developments hasundoubted:y been the separation and quantitation of large biomolecules. the separation/detection of small ions has alsoreceived 8trention.s-s Separation of small ions has thus far been
dominated by ion chromatography GC) 9,10 Recently, the most
successful IC detection technique has also been shown to beapplicable to CE, leading to suppressed conductometric capillary
(1) Wu, N.; Peck, T. L: Webb, A. G.: Ylagin, R. L.; Sweedler,]. V. Anal. Ckern.66,3849-3857.
S. C.; Hcrgenroder, R; Moore, A W" Jr.; Ramsey, J. :.1. Anal.Cham 1991.,66, -1127-4132.
(3) ocrlmalzmg, LJ.;J'laSf,aDE'h. W.; y,ao, .x..·"'.;J""hatre,K;Ke,:mer,l- E.; Afeyan.M. Anal. 1995, 67, 606-612.
C. A: R. T. A~lfll. Cherrl. 1994,66, 280R-314R.Bonn, G. K Cal'il'a:ry l'!1ectrop'horesisof~;malillrole"ules a"d I,ms;
York. 1993(6) Benz, Fritz, j. S.J 1994,671,437-443.(7) Salimi-Moosavi. H.; Chem, 1995,57, 1067-1073.(8) Lucy. C. A,; McDonald, _-'lIte!. Chem. 1995, 67, 1074-:078.(9) Dasgupla, P. K. Anal. Chem. 1992,64, 775A-783A
nO) N'ob:e, Anal. Chern. 1995, 67, 205A-208A.
0003-2700/95/0367-3853$8,00/0 © '1995 American Chemical Society
electrophoresis separation systems (SuCCESS)l'-lJ that can
produce low microgram per liter limits of detection (LODs) for avariety of small ions in a robust manner v,.ithcut special efforts
toward preconcentratior.One of the earliest beneficiaries of IC was the analysis of
atmospheric samples, an area that has been of continuing interestto this laboratory. CE-based analyses of atmospheric filter sar"11pleshave now been reported,14.1S but in such cases, the analyticaltechnology and the sample collection strategics arc not necessarily
optimally matched: extraction volumes of several milliliters areobligatorily produced with an atmospheric filter sample, while
microliter scale samples are adequate far providing the nanoliterscale injections made in CE.
Recognlzing that relative to particles, atmospheric gases C81
be sampled more directly and in a microscale, we previouslydescribed 16 a technique in which a microscale membrane-based
diffusion scrubber" constitutes an integral prot of the separationcapillary. A small segment of a porous hydrophobic membrar,ecapillary connected the fused silica separation capillary (FSC) toa small lengrb of an "entrance" FSC. A jacket was built aroundthe membrane and air sampled around itl whence analyte gasesof interest diffused through the pores and were trapped by theinternal electrolyte. Electrophoresis was then commenced. In
direct or direct optical detection was used. Although thesedetection methods are not as sensitive as suppressed conductametry, respectable LODs could be obtained. The major shortcomings of tlle technique, however, centered around the membrane itself: the fragiJitj of the membrane, the change in thesample transfer function over prolonged use due to soiling, andthe facile evaporation of the internal liquid tllrough the membranepores (which necessitated a "dry flush" even during the analysis.
Recently, we have introduced a liquid droplet or a film as agas sampling interface. 1S." Such an interface is not only indefinitely renewable, but it is best depioyed in a microscale and dueto the evaporative flux from the droplet/film, the approach of
particles is greatly inhibited (cl. di/fusiophoresis due to Stefanflow).20 In the present paper, we show that a film is readily
(11) Dasgupla, P. 8<:10,1. Anal. Chem. 1993.65, lO03-10lL(12) Avdalovic, N.; PohL C. A; Roc:din, R. D.; StilEan, l R. Ana!. Chem 1993.
65,1470-1475.(13) P. K.~ Bzo. L. U.S. Patent 5,358.612, Oct 25, 1994.
(14) E.; Chromatogr. 1994,671,389-39;;(15) Dabek-Zlotorz:,llsk", E.; Chromatogr. 1994,685.(6) Ban, L; P. K Anal. 1992,64, 991-996.
(17) Dasgupta, P. Chern. Ser. 1993,232,41-90.(18) Liu, S.; Dasgupta, P. K AnaL. Chan. 1995,67,2110-2118.(9) Cardo$), A. A; P. K flnal. Chern. 1995, 67. 2562-2566.(20) Hinds. W. \Vi1cy: New York, 1982: p 161.
Analytical Chemistry, Vol. 67, No. 21, November I, 1995 3853
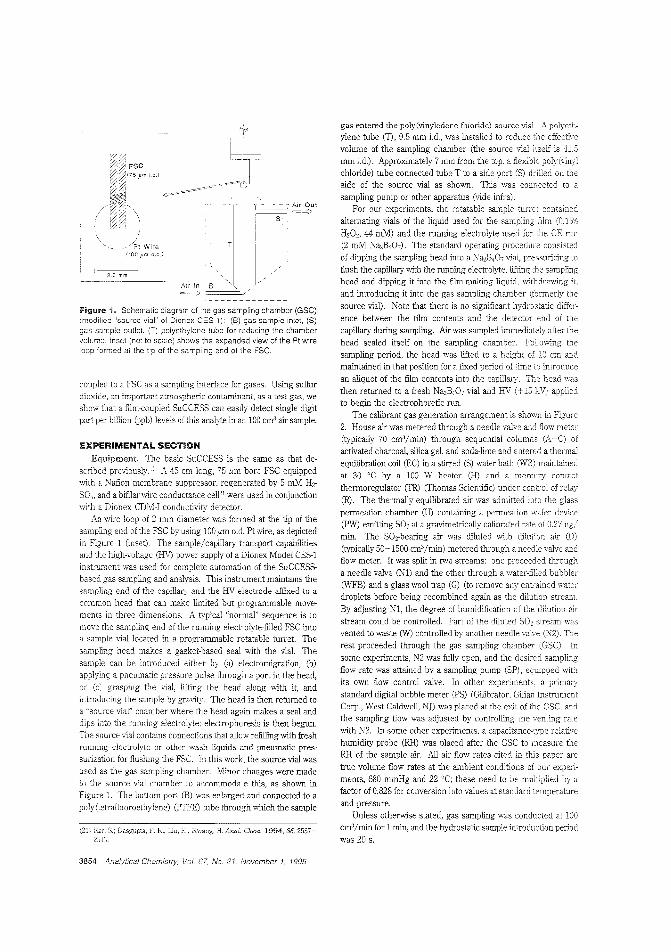
(21) Kar, S.; Dasgupta, P. K.; Liu, H.; Hwang, H. AnaL Chern. 1994,66,2537-
coupled to a FSC as a sampling interlace for gases. Using sulfurdioxide, an important atmospheric contaminant, as a test gas, weshow that a film·coupled SuCCESS can easily detect single digitpart per billion (Ppb) levels of this analyte in an 100 cm3 air sample.
gas entered the poly(vinyledene fluoride) source vial. A polyethylene tube m, 9.5 mm 1.d., was installed to reduce effective
volume of the sampling chamber (the source vial itself is 41.5mm 1.d.). Approximately 7 mm from the top. a flexible poly(vinylchloride) tube connected tube T to a side port (5) drilled on t'1eside of the source vial as shown. This was connected to a
sampling pump or other apparatus (vide infra).For our experiments, the rotatable sample turret contained
alternating vials of the liquid used for the sampling film (0.15%
H20" 44 mM) and the running electrolyte used for the CE run(2 mM Na,B,O,). The standard operating procedure consisted
of dipping the sampling head into a Na,B,O, vial, pressurizing to
flush the capillary with the running electrolyte, lifdng the samplinghead and dipping it into the film-making liquid, withdrawing it,
and introducing it into the gas sampling chamber (formerlv the
source vial). Note that there is no siguificant hydrostatic differ
ence between the film contents and the detector end of thecapillary during sampling. Air was sampled immediately after the
head sealed itself on the sampling chamber. Following the
sampling period, the head was lifted to a height cf 10 em andmaintained in that position for a fixed period of time to introduce
an aliquot of the film contents into the capillary. The head was
then returned to a fresh Na,B'lO, vial and HV (+15 kV) appliedto begin the electrophoretic run.
The calibrant gas generation arrangement is shoWTI in Figure
2. House air was metered through a needle valve and flow meter(typically 70 cm'/min) through sequential columns ~""-C) of
activated charcoal, silica gel, and soda-lime and entered a thermal
equilibration coil (EC) in a stirred (S) water bath (WE) maintained
at 30 'C by a 100 W heater (H) and a mercurY contact
thermoregulator (TR) (Thomas Scientific) under conlT~1 of relav
(R). The thermally equilibrated air was admitted in to the glas~permeation chamber (U) containing a perrneation \vafer device(PW) emitting S02 at a gravimetrically calibrated ratc of 0.27 ng/
min. The SO,..bearing air was diluted with dilution air (D)
(typically 50-1500 em3/min) metered through a neeelle valve andflow meter. It was split in two streams: one proceeded througha needle valve (N1) and the other through a water-filled bubbler
(WFB) and a glass wool trap (G) (to remove any entrained water
droplets before being recombined again as the dilution stream.
By adjusting Nl, the degree of humidification of the dilution air
stream could be controlled. Part of the diluted SO, stream wasvented to waste ryf) controlled by another needle valve (N2). Tntrest proceeded through the gas sampling chamber (GSC). In
some experiments, N2 was fully open, and the desired sampling
flow rate was attained by a sampling pump (SP), equipped ,vith
its own flow control valve. In other experiments, a primarY
standard digital bubble meter (PS) (Gilibrator, Gilian Instrume;tCorp., West Caldwell, NJ) was placed at the exit of the GSC. andthe sampling flow was adjusted by controlling the venting rate
with N2. In some other experiments, a capacitance·type relativehumidity probe (RH) was placed after the GSC to measure theRH of the sample air. All air flow rates cited in this paper are
true volume flow rates at the ambient conditions of our experi
ments, 680 mmHg and 22 'C; these need to be multiplied by a
factor of 0.828 for conversion into values at standard temperatureand pressure.
Unless otherwise stated, gas sampling was conducted at DOcm'/min for 1 min, and the hydrostatic sample introduction period
was 20 s.
'~'AirOut'--=Co_-,=>
Air In B~
Wire(100,urn o.d.)
2,0 mm----
Figure 1. Schematic diagram of the gas sampling chamber (GSC)(modified "source vial" of Dionex CES-1): (B) gas sample inlet, (S)gas sample outlet, (T) polyethylene tube for reducing the chambervolume. Inset (not to scale) shows the expanded view of the Pt wireloop formed at the tip of the sampling end of the FSC.
EXPERIMENTAL SECTION
Equipment. The basic SuCCESS is the same as that de
scribed previouslyIl A 45 em long, 75 I'm bore FSC equipped
with 2 Nafion membrane suppressor, regenerated by 5 mM H,..
SO,;, and a bifilar wire conductance cell" were used in conjunction
with a Dionex CDM-I conductivity detector.An wire loop of 2 mm diameter was formed at the tip of the
sampling end of the FSC by using 100 ,urn o.d. Pt 'wire, as depicted
in Figure 1 (inset). The sample/capillary transport capabilitiesand the high-voltage (HV) power supply of a Dionex Model CES-1
instrument was used for complete automation of the SuCCESSbased gas sampling and analysis. This instrument maintains thesampling end of the capillary and the HV electrode affixed to a
common head that can make limited but programmable move
ments in three dimensions. A typical "normar sequence is tomove the sampling end of the running electrolyte-filled FSC intoa sample vial located in a programmable rotatable turret. The
sampling head makes a gasket-based seal with the vial. The
sample can be introduced either by (a) electromigration, (b)applymg a pneumatic pressure pulse through a port in the head,
or (c) grasping the vial, lifting the head along with it andintroducing the sample by gravity. The head is then returr:ed toa "source via]" chamber where the head again makes a seal and
dips into the running electrolyte; electrophoresis is then begun.The source vial contains connections that allow refilling with freshrunning electrolyte or other wash liquids and pneumatic pres
surization for flushing the FSC. In this work, the source vial wasused as the gas sampling chamber. Minor changes were made
to the source vial chamber to accommodate this, as shown inFigure 1. The bottom port (B) was enlarged and connected to a
poly(tetrafluoroethylene) (PTFE) tube through which the sample
3854 Analytical Chemistry, Vnl 67, No. 21, November 1, 1995
House air
N15P~t, I
i 0 WFB
I'
RHPS
W
Figure 2. Schematic of SO, gas generation arrangement: (A-C) activated charcoal, silica gel, and soda-lime columns, respectl'/ely, (EC)the'mal equlilbretion call, (S) stir bar, (WB) water bath, (U) glass permeation chamber, (PW) SO, permeation wafer, (TR) thermoregulator, (R)relay controller, (D) dllLtlon air, (N1 and N2) needle valves, (WFB) water-filled bubbler, (G) glass wool trap, (W) waste, (GSC) gas samplingchamber, (FM) fiow meter, (SP) sampling pump, (RH) relative humidity probe, and (PS) primary standard buble meteL
RESLILTS AND DISCUSSIONTest Gas and Choice of Film-Fonning Solution. We chose
SO, as the test gas not only because of its importance as anatmospheric pollutant but also because the performance of thesystem with SO, in tenns of LODs, etc., is likely to represent thelower limit Positive polarity is used in SuCCESS, and ionselectromigrate opposite to the electroosmotic flow. Weaker acidgases like HCOOH have lower mobility anions that elute fast,resulting in more easily detectable peaks relative to sulfateresulting from SO,. Other common acid gases like HONO or HCIhave larger diL"usion coefEcient than SO, and should thus resultin more efficient collection by the film, assuming that the filmcomposition is chosen to be an effective sink for the gas.
Experiments with wet effluent diffusion denuders (WEDDs)have ShO\;l1 that H,O, is an efficient absorbing liquid for capturingSO" wherein the collected gas is oxidized to sulfate." Initialexperiments indicated, however, that 1 mM or lower H,O,concentrations used with WEDDs arc quite insufficient in thepresent case; the observed signal for 10-100 ppb SO, increaseswith increasing H20, concentrations in the range 1-35 mM. Inthe present case, the solution contained in the film is essentiallystagnant. Only the reagent present on the sunace is effective forcapturing the analyte. Unlike the WEDD, where the absorberflows down a surface and convective/frictional/turbulent forcescan hring new reagent to t.1.e surface, here the only motive force
for replenishment of the sunace reagent is diffusion, a slowprocess in the liquid phase. Consequently, the absorber reagentconcentration used should be higher. However, reagent blankIncreases \\ith increasing concentration as well; this is detrimentalto any type of trace analysis. We have experimented with twodifferent H::Oz stock reagents from two different manufacturers:one was 3% and the other 30% in concentration. The presence ofsuliate as an impurity is particularly noticeable in the 3% H20,stock solutions that we have experimented with: after appropriate
(22) Simon, P. K: Dasgupta, P. K. A1!al. Chern. 1993.65.1134-1139.
dilution, impurity levels are significantly lower in 30% H20,solutions.
The minimum concentration of H20, necessary to function asa fully effective sink also depends on the concentration of S02 tobe salnpled and the sampling duration. Based on our experiencerelated to ambient levels of 502, we decided on a maximumanticipated S02 concentration of 50 ppb and a sampling durationof 60 s. A concena'alion of 45 mM (~O, 15%) H20, was found tobe adequate for dealing with these maximum anticipated levels.If higher amounts must be determined, the concentration of H20,will need to be increased further. li LODs must also bemaintained at previcus levels, the HzO, used may need to becleaned to remove residual sulfate (vide infra).
Water by itself may serve as a suitable collection medium forsome gases, but it is not ideal for collecting SO,. Aside from lowersensitivity relative to the use of H,Oz, in the absence of reactiveuptake, the film becomes quickly sunace saturated-strongnonlinearity is obserred as a function of either sampling time orsample concentration. An alkaline medium, such as the boratesolution used as the electrolyte, can also serve as an effective sinkfor an acidic analyte gas such as 502. However, in this case, it isanalyzed as sulfite and detected as a monoprotic acid aftersuppression with consequent loss of sensitivity. Further, thesample can be partially oxidized to sulfate during electrophoresis,resulting in a broad peak that appears at a retention timeintermediate for that of sulfite and suliate, leading to difficultiesin quantitation. An alkaline absorbent also absorbs CO2 efficiently,and this results in a large carbonate peak. One other advantagewith HzO, as the collecting medium, relative to the use of therunning electrolyte for the purpose, is electrostacking. This caneffectively occur with a low-janie-strength, low-conductance me
dium but not with an equal or higher conductance medium" (ifan electrolyte is llser] for collection, some concentratiou is boundto occur during sanlpling due to evaporative losses of the solvent),
(23) Chien, R-L.; BClrgi, D. S. Anal. Chem. 1992,64,189A-496A.
Analytical Chemistry. Vol. 67, No. 21. November I, 1995 3855
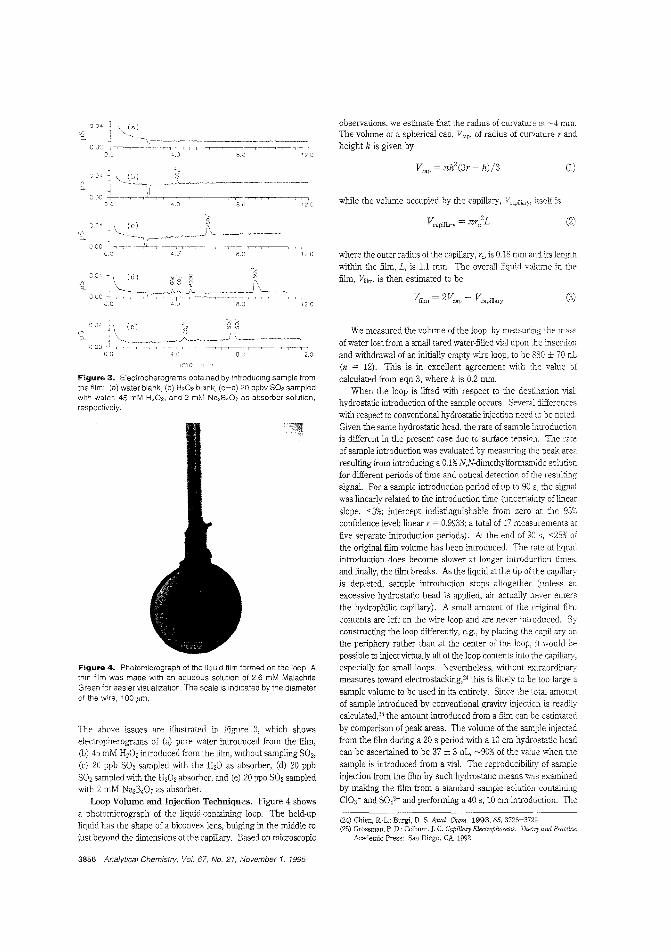
observations, we estimate that the radius of curvature is "-"4 mrn.The volume of a spherical cap, Veo" of radius of curvature r andheight h is given by
where the outer radius of the capillary, 'e, is 0.18 mm and its lengthwithin the film, L, is 1.1 mm. The overall liquid volume in thefilm, Vfilm , is then estimated to be
Veap = nh'(3r - h)/3
while the volume occupied by the capillary, Veo,m,cy, itself is
(1)
(2)
(3)
o o~
GOO·2.0
figure 3. Electropherograms obtained by Introducing sample fromthe film: (a) water blank, (b) H,O, blank, (c-e) 20 ppbv SO, sampledwith water, 45 mM HzOz, and 2 mM Na2B40y as absorber solution,respectively,
Figure 4. Photomicrograph of the liquid film formed on the loop. Athin film was made with an aqueous solution of 2.6 mM MalachiteGreen for easier visualization. The scale is indicated by the diameterof the wire, 100 I'm.
The above issues are illustrated in Figure 3, which showselectropheragrams of (a) pure water introduced from the film,(b) 45 mM H20, introduced from the film, without sampling SO"(c) 20 ppb SO, sampled with the H20 as absorber, (d) 20 pphSO, sampled with the H20 2absorber, and (e) 20 ppb S02 sampledwith 2 mM Na2B40, as absorber.
Loop Volume and Injection Techniques. Figure 4 showsa photomicrograph of the liquid-containing loop. The held-upliquid has the shape of a biconvex lens, bulging in the middle tojust beyond the dimensions of the capillary. Based on microscopic
3856 Analytical Chemistry, Vat. 67, No. 21, November 1, 1995
We measured the volume of the loop, by measuring the massof water lost from a small tared water-fillet! vial upon the insertionand withdrawal of an initially empty wire loop, to be 880 ± 70 nL(n = 12). This is in excellent agreement with the value of
calculated from eqn 3, where h is 0.2 mm.When the loop is lifted with respect to the destination vial.
hydrostatic introduction of the sample occurs. Several differenceswith respect to conventional hydrostatic injection need to be noted.Given the same hydrostatic head, the rate of sample introductionis different in the present case due to surface tension. The rateof sample introduction was evaluated by measuring the peak arearesulting from introducing a 0.1% N,N-dimethylfonnamide solutionfor different periods of time and optical detection of the resuitingsignal. For a sample introduction period of up to 90 s, the signalwas linearly related to the introduction time (uncertainty of linearslope, <3%; intercept indistinguishable from zero at the 95%confidence level; linear r = 0.9933; a total of 17 measurements atfive separate introduction periods). At the end of 90 s, <25% ofthe original film volume has been introduced. 11,e rate of liquidintroduction does become slower at longer introduction times,and finally, the film breaks. As the liquid at the tip of the capillaryis depleted, sample introduction stops altogether (unless anexcessive hydrostatic head is applied, air actually never entersthe hydrophilic capillary). A small amount of the original filmcontents are left on the wire loop and are never introduced. Byconstructing the loop differently, e.g., by placing the capillary onthe periphery rather than at the center of the loop, it would bepossible to inject virtually all of the loop contents into the capillary,especially for small1oops. Nevertheless, without extraordinarymeasures toward electrostacking,24 this is likely to be too large a
sample volume to be used in its entirety. Since the total amountof sample introduced by conventional gravity injection is readJycalculated,25 the amount introduced from a film can be estimated
by comparison of peak areas. The volume of the sample injectedfrom the film during a 20 s period with a 10 em hydrostatic headcan be ascertained to be 37 ± 3 nL, ~90% of the value when t'lesample is introduced from a vial. The reproducibility of sampleinjection from the film by such hydrostatic means was examinedby making the film from a standard sample soluticn containingCl03- and SO,2- and perfonning a 40 s, 10 em introduction. The
(24) Chien, R-L; Burgi, D. S. Anal. Chem. 1993,65,3726-3729.(25) Grossman, P. D.; Colburn,]. C. Capillary Electrophoresis: 17zeory and Practice;
Academic Press: San Diego, CA, 1992.
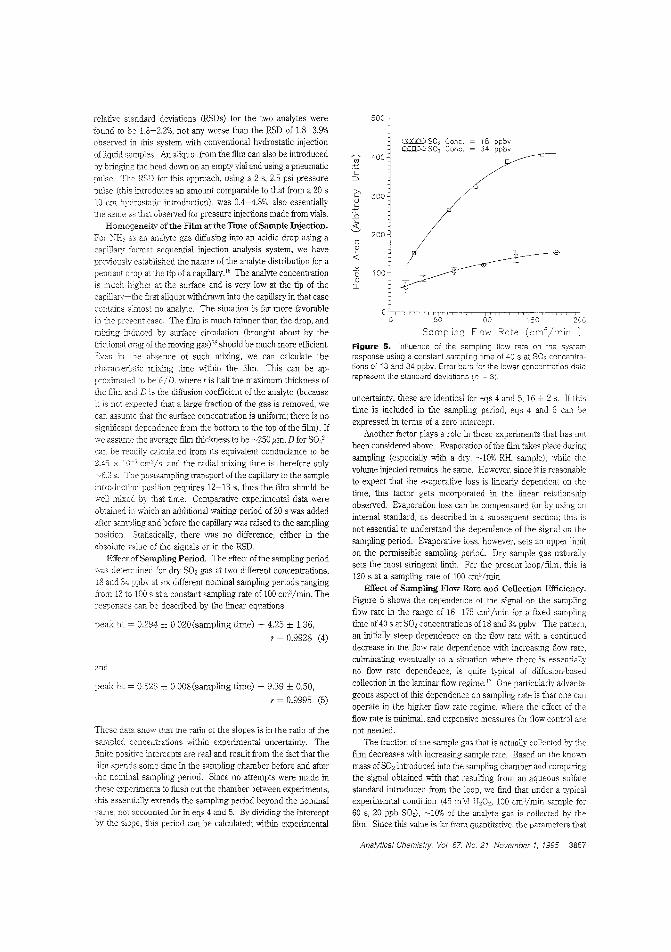
relative standard deviations (RSDs) for the two analytes were
found to be 1.8-2.2%, not any wcrse than the RSD of 1.8-3.9%observed in this system with conventional hydrostatic injection
of liquid samples. An aliquot from the film can also be introducedby bringing the head down on an empty vial and using a pneumaticpulse. The RSD for tbis "pproach, using a 2 s, 2.5 psi pressure
pulse (this introduces an amount comparable to that from a 20 s10 em hydrostatic introduction), was 0.4-4.8%, also essentiallythe same as that observed for pressure injections made from vials.
Homogeneity of the Film at the Time ofSample Injection.For NI-I, as an analyte gas diffusing into an acidic drop using acapillary format sequential injection analysis system, we have
prEviously established the nature of the anaMe distribution for apendant drop at the tip of a capillaryI8 The analyte concentration
is much h:gher at the surface and is very low at the tip of thecapillary-the first aliquot withdrawn into the capillary in that caseconLaiLs almost no analyte. The situation is far more favorablein the present case. The film is much thinner than the drop, and
mixing induced by surface circulation (brought about by theDictional drag of the moving gas) 18 should be much more efficient.
Even in absence of such mixing, we can calculate thecharaceristic mixing time within the film. This can be approximated to be t'I D. where t is half the maximum thickness ofthe film and D is the diffusion coefficient of the analyte (becauseit is not expected that a large fraction of the gas is removed, we
can assume that the surface concentration is uniform; there is nosignificant dependence from the bottom to the top of the film). Ifwe assume the average film thickness to be ~250 i'm, D for 50,'can be readily calculated from its equivalent conductance to be2.45 x 10 ' em'/s. and the radial mixing time is therefore only~6.3 s. The postsampling transport of the capillary to the sample
introduction position requires 12-13 s, thus the film should hewell mixed by that time. Comparative experimental data wereobtained in which an additional waiting period of 30 s was addedafter sampling and before the capillary was raised to the samplingposition. Statistically, there was no difference, either in the
absolutc value of tl1C signals or in the RSD.Effect ofSampling Period. The effect of the sampling period
was determined for dry SO, gas at two different concentrations,18 and 34 ppbv at six different nominal sampling periods rangingfrOJll 13 to 100 s at a constant sampling rate of 100 cm3/min. Theresponses can be described by the linear equations
peak ht = 0.294 ± 0.020(sampling time) + 4.25 ± 1.36,
r = 0.9928 (4)
and
peak 0.528 "= 0.008(sampling time) + 9.39 ± 0.50,
r = 0.9995 (5)
These data show that the ~atio of the slopes is in the ratio of thesampled concentrations within experimental uncertainty. The
finite positive intercepts are real and result from the fact that thefilm spends some time in the sampling chamher before and afterthe nominal sampling period. Since no attempts were made inthese experiments to flush out the chamber between experiments,this essentially extends the sampling period beyond the nominalvalue, not ~'_ccounted for in eqs 4 and 5. By dividing the interceptby tbe slope, this period can be calculated; within experimental
o
"<.-'"o
"0..
Sompli.1g F,ow Rote
Figure 5. Influence of the sampling flow rate on the systemresponse using a constart sampling time of 40 s at 802 concentrations at 13 and 34 ppbv. Error bars for the lower concentration daiarepresent the standard deviations (n 3).
uncertainty, these are identical for eqs 4 and 5, 16 ± 2 s. If thistime is included in the sampling period, eqs 4 and 5 can beexpressed in terms of a zero intercept.
Another factor plays a role in these experiments that has nolbeen considered above. Evaporation of 10'1e film takes place during
sampling (especially with a dry, ~10% RH, sample), while thevolume injected remains the same. However. since it is reasonableto expect that the evaporative loss is linearly dependent on thetime, this factor gets Incorporated in the linear relationshipobselved. Evaporation loss can be compensated for by using aninternal standard, as described in a subsequent section; this is
not essential to understand the dependence of the signal on the
sampling period. Evaporative loss, however, sets an upper limiton the permissible sampling period. Dry sample gas naturallysets the most stringent limit. For the present loop/film, this is120 s at a sampling rate of 100 cm:J/min.
Effeet of Sampling Flow Rate and Collection Efficiency.Figure 5 shows the dependence of the signal on the sampling
flow rate in the range of 16-175 cm"/min for a fixed sampling:time of 40 s at SO, concentrations of 18 and 34 ppbv. The pattern,an initially steep dependence on t.he flow rate with a continueddecrease in the flow rate dependence with increasing now rate,culminating eventually to a situation where there is essentialiyno flow rate dependence, is quite typical of diffusion-basedcollection in the laminar flow regime." One particularly advanta·
geous aspect of this dependence on sampling rate is that one canoperate in the higher fiow rate regime, where the effect of the
flow rate is minimal, and expensive measures for flow control arcnot needed.
The fraction of the sample gas that is actually collected by thefilm decreases with increasing sample rate. Based on the know11mass of SO, L'1troduced into the sampling chamber and CDmpaJingthe signal obtained with that resulting from an aqueous sulfatestandard introduced from the loop, we find that under a typicalexperimental condition (45 mM H,O" 100 cm:l/min sample for60 s, 20 ppb S02), ~10% of the analyte gas is collected by thefilm. Since this value is far from quantitative, the parameters that
Analytical Chemistry, Vol. 67, No. 21, November 1, 1995 3857
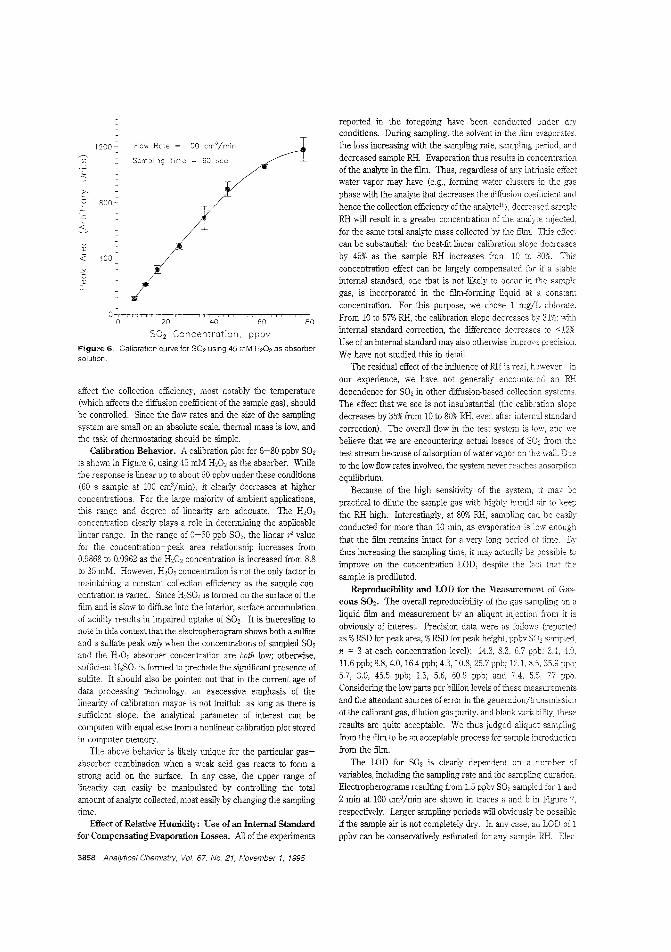
''"0 Flow Rete ~ DO cmJ/min
~ Sampling Time ~ 60 sec
c
eco1::J
C2
T.D
~
wol
-L
Q)
4'ex
~~CL
]
oi" , I2'0
I I0 40 60 80
SO, Concentration, ppbv
Fagull'e 6. Calibration curve for 802 using 45 mM H20 2 as absorbersolution.
affect the collection efficiency, most notably the temperature(which affects the diffusion coefficient of the sample gas), shouldbe controlled. Since the flow rates and the size of the samplingsystem are small on an absolute scale, thernlal mass is low, andthe task of thermostating should be simple.
Calibration Behavior. A calibration plot for 6-80 ppbv S02is shown in Figure 6, using 45 mM H20, as the absorber. Whilethe response is linear up to about 50 ppbv under these conditions(60 s sample at 100 cm3/min), it clearly decreases at higherconcentrations. For the large majority of ambient applications,this range and degree of linearity are adequate. The H,O,concentration clearly plays a role in determining the applicablelinear range. In the range of 0-50 ppb SO" the linear 1'valuefor the concentration-peak area relationship increases from0.9868 to 0.9962 as the H20, concentration is increased from 8.8to 35 mM. However, H,O, concentration is not the only factor inmaintaining a constant collection efficiency as the sample concentration is varied. Since H,S04 is formed on the surface of thefilm and is slow to diffuse into the interior, surface accumulationof acidity results in impaired uptake of SO,. It is interesting tonote in this context that the electropherogram shows both a sulfiteand a sulfate peak only when the concentrations of sampled S02and the H20 2 absorber concentration are both low; otherwise,sufficient H,SO, is formed to preclude the significant presence ofsulfite, It should also be pointed out that in the current age ofdata processing technology. an execessive emphasis of thelinearity of calibration maybe is not fruitful: as long as there issufficient slope, the analytical parameter of interest can becomputed with equal ease from a nonlinear calibration plot storedin computer memory.
The above behavior is likely unique for the particular gasabsorber combination when a weak acid gas reacts to form astrong acid on the surface. In any case,the upper range oflinearity can easily be manipulated by controlling the totalamount of analyte collected, most easily by changi.ng the samplingtime.
Effect of Relative Humidity: Use of an Internal Standardfor Compensating Evaporation Losses. All of the experiments
3858 Analytical Chemistry, Vol. 67, No, 21, November 1, 1995
reported in the foregoing have been conducted under dryconditions. During sampling, the solvent in the film evaporates.the loss increasing with the s~~pling rate, sampling period, anddecreased sample RH. Evaporation thus results in CDncentrationof the analyte in the film. Thus, regardless of any intrinsic effectwater vapor may have (e.g., forming water clusters in the gasphase with the analyte that decreases the diffusion coefficient andhence the collection efficiency of the analyte12), decreased sanlpleRH wiII result in a greater concentration of the analyte injected,for the same total analyte mass coIIected by the film, 111is effectcan be substantial: the best-fit linear calibration slope decreasesby 45% as the sample RH increases from 10 to 80%. Thisconcentration effect can be largely compensated for if a stableinternal standard, one that is not likely to occur in the samplegas, is incorporated in the film-forming liquid at a constantconcentration. For this purpose, we chose 1 mg/L chlorate.From 10 to 57% RH, the calibration slope decreases by 31%; withinternal standard correction, the difference decreases to < 12%,Use of an internal standard may also otherwise improve precision.We have not studied this in detaiL
The residual effect of the irnluence of RH is real, however Inour experience, we have not generally encountered an Rl{dependence for SO, in other diffusion-based collection systems.The effect that we see is not insubstantial (the calibration slopedecreases by 35% from 10 to 80% RH, even after intemal standardcorrection). The overall flow in the test system is low, andbelieve that we are encountering actual losses of SO, from thetest stream because of adsorption of water vapor on the walL Dueto the low flow rates involved, the system never reaches adsorptionequilibrium.
Because of the high sensitivity of the system, may bepractical to dilute the sample gas with highly humid air to keepthe RH high. Interestingly, at 80% RH, sampling can be easilyconducted for more than 10 min, as evaporation is low enoughthat the film remains intact for a very long period of time. Bythus increasing the sampling time, it may actually be possibleimprove on the concentration LOD, despite the fact that thesample is prediluted.
Reproducibility and WD for the Measmement of Gaseous S02. The overall reproducibility of the gas sampling on aliquid film and measurement by an aliquot injection from it isobviously of interest. Precision data were as follows (reportedas %RSD for peak area, %RSD for peak height, ppbv SO, sampled.n = 3 at each concentration level): 14.3, 8.3. 6.7 ppb; 3.1, 4.911.6 ppb; 8.8, 4.0, 16.4 ppb; 4.3, 10.8, 25.7 ppb; 12.1, 8.5. 35.9 ppb5.7, 3.0, 45.5 ppb; 1.5, 5.6, 60.8 ppb; and 7.4, 5.5, 77 ppb.Considering the low parts per billion levels of these measurementsand the attendant sources of error in the generation/transmissionof the calibrant gas, dilution gas purity. and blank vatiability, these
results are quite acceptable. We thus judged aliquot samplingfrom the film to be an acceptable process for sample introductionfrom the film.
The LOD for SO, is clearly dependent on a numbervariables, including the sampling rate and the sampling duration.Electropherograms resulting from 1.5 ppbv S02 sanlpled for 1 and
2 min at 100 cm3/min are shown in traces a and b in Figurerespectively. Larger sampling periods will obviously be possibleif the sample air is not completely dry. In any case, an LOD of 1ppbv can be conservatively estimated for any sample RH. Elec-
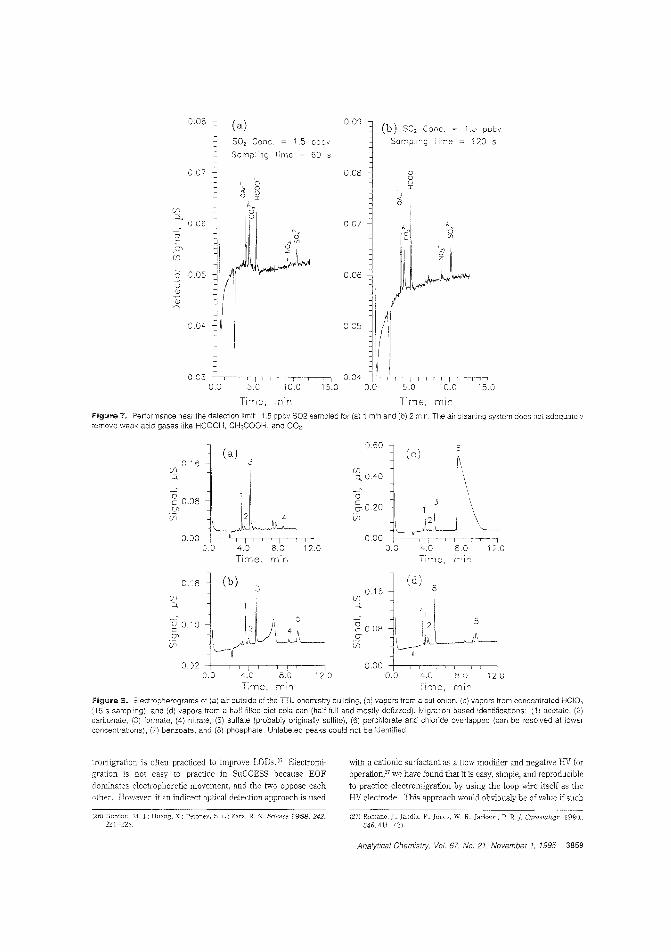
ooUI
(b) SO, Cone. ~ 15 PDCV
SorrpllCg Time ~ ',20 s
o 09 ~
008 ]
0.07
0.00 j ~i~oco l(i
] I, I0.04~"
0.0 5.0
T:ne, minTime, mir,
003
008 - (a)
SO, Cone. ~ 1.5 ppbv
Sampling Time ~ 60 s
0.07
u'00
"' ()0 I
(j)
::J...0.06
OJ
.2'(j)
:? 0.05J'1)
OJ0
0.04
f'ugure 1" Performance near the detection limit: 1.5 ppbv 802 sampled far (a) 1 min and (b) 2 min. The air cieaning system does not adequately'emove weak acid gases like HCOOH, CH3COOH, and CO2.
g 0.08G1
(j)
~ (a) 3
Vi 0',6 J1
I
Ll~~O.JO I II Iii I
0.0 4.0 8.0Time, min
I I12.0
060
U1=<.0.40
og, 020
(j)
5
8016
0.00
g 008Q'I
U1
o 0.10cQ'I
v,
018 J (b)
1\1 j'L\~JL1~
0.D2 I iii Iii I I I0.0 4.0 8.0 12.0
lime, min Ime, mlrFigure 8. Electrop_'lerograms of (a) air :>utside of the TTU chemistry building, (b:1 vapors from a cut onion, (c) vapors from concentrated HCIO~
:15 s sampling), and (d) vapors from a half-filled diet coia can (half-full and mostly defizzed). Migration-based identifications (1) acetate, (2)carbonate. (3) formate, (4) nitrate, (5) sulfate (probably originally sulfite), (6) perchlorate and chloride overlapped (can be resolved at lowerc.oncentrations), (7) benzoate, and (8) phosphate. Unlabeled peaks could not be identified.
tromigration is often practiced to improve LODs.'" Electromigration is not easy to practice in SuCCESS because EOFdominates electrophoretic movement, and the two oppose eachother. However. if an indirect optical detection approach is used
with a cationic surfactant as a flow modifier and negative HV foroperation," we have found that it is easy, simple, and reproducibfeto practice electromigration by using the loop wire itself as theHV electrode This approach would obviously be of value if such
(26):~ordon. :·A. ].; Huang, X.; Petoney, S L.; Zan:',R N. Science 1988.242.224~22S
(27) Romano,.f.; Jandik. P.: Jones, W, R; Jackson, P. Kj. Chromatogr. 1991.546,411-421.
Analytical Chemistry, Voi. 67, No. 21, November 1, 1995 3859
detection methods, rather than suppressed eE, are used fordetection; a detailed account will be published subsequently.
Illustrative Applications. The present instrument could beuseful for a variety of applications. Examples are shown in Figure8 for (a) the significant occurrence of fomtic and acetic acids inthe air outside the TID chemistry building. (b) a sniff over afreshly cut onion, (c) volatile impurities over a concentrated BelO,bottle, and (d) CO, peak observed over a can of a carbonatedbeverage.
Future Possibilities. To our knowledge, this is the firstexample of direct detemtination of gases by capillary electrophoresis. The simple technique reported here opens the door ofCE, possibly the most powerful and elegant separation techniqueof the decade, to gaseous analyies. It is likely that the horizon ofapplications for organic vapors, using micellar electrokineticchromatography or nonaqueous electrophoretic media, will bemuch greater than what has been explored here. We also believe
3860 Analytical Chemistry. Vol. 67, No. 21, November I, 1995
that the concept of sampling from a film fonned on a loop hasmany unique features. In the future, we expect to report onelectromigrative injections from a loop and the use of the loop asa sample extraction interface ln other biphasic systems.
ACKNOWLEDGMENTThis research was supported by the U.S. En'oironmental
Protection Agency, Office of Exploratory Research. throughR-8201117-01-1. This manuscript has not been subjected to reviewby the agency, and no official endorsement should be inferTed.We thank Dr. Kazimierz Surowiec for the data on DMF introduction from the loop/film.
Received for review June 19, 1995. Accepted August 18.1995"
AC950622G
o Abstract published in Advance ACS Abstracts, OClober 1,
Anal. Chem 1995, 67,3861-3865
Separation of Colloidal Latex Aggregates byCluster Mass and Shape Using SedimentationField-Flow Fractionation with Steric Perturbations
Bhajendra N. Bannant and J. Calvin Giddings*
Fieid-Flaw Fractionation "Iesearch Center, Department of Chemistry, University of Utah, Salt Lake City, Utah 84112
l-\.ggregated colloidal clusters consisting of different numbers of monodisperse latex spheres can be cleanly separated from on.e another on. the basis of differences incluster mass using the nonnal mode of sedimentationfield-flow fractionation. However, sterlc effects perturbthe experimental retention volumes and affect the spacingbetween cluster peaks. Most remarkably, the magnitudeof the sterlc disturbance varies with the cluster shape,causing a shape-dependent shift in retention for clustershaving the same number n of elementary spheres andthus having the same mass. The shape-dependent shiftis verified by electron microscopy of fractions collected"ithin Individual cluster peaks; this shows a secondaryfractionation within the peak according to cluster shape.The secondary fractionation is selective between compactand elongated clusters of equal aggregation number n.These and other sterlc perturbations are examined Insome detail in this paper. In particular, the change inpeak spacing with increasing n is discussed, and thefactors affecting the transition from the normal mode tothe sterlc mode are investigated. The theoretical conceptspresented are verified using samples ofaggregated PMMAcolloidal latex.
Field-flow fractionation (FFF) techniques provide a broadspectrum of approaches for characterizing colloidal particles andassociated colloidal phenomena. 1., The unique capabilities ofsedimentation field-flow fractionation (SdFFF) in studying particleaggregation by means of the separation and characterization of'ndividual clusters of different mass were demonstrated first inthe separation of viral rods1 and more recently in the separationof latex aggregates.'-7 As the separation process is described bywell-defined theoretical principles. it is possible to establishresolution criteria for the separation of different cluster masses4
P,esen1 "ddress: Texaco Inc.. P.O. Box 1608, Port Arthur, TX 7764l.(1) ':;iddings,]. C Science 1993,260, 1456-1465.(2) Giddings, J. c. Anal. Chern., in p:-ess.(3) CuldwelL K. D.: Nguyen, T. T.; Giddings,]. c.; Mazzone, II. M.]. Virol.
.'VIethods 1980, 1,241-256.(4) : ones. H. :z.; Barman. B. N.; 1988, 455. 1-15.(5) Gidd'T1gS. J C: Ra:mar. B. N.: Sci. 1989. 132,
554-565(6) 3<lnnan, B. N.; Giddings,]. C. In Particle Size Distribution II: Assessment
58.
0003-2700/95'0367-3861$9.0010 © 1995 American Chemical Society
It is also possible to determine the mass and polydispersity ofaggregated clusters' and the kinetics of their formation andbreakup.'.?
The "normal mode" of SdFFF has been used in the abovestudies of colloidal aggregates. In normal-mode SdFFF, a steadystate particle cloud or layer is formed when particle Brownianmotion away from the accumulation wall is balanced against thecentriJugal field. The layer thickness is smaller for the largerparticles that are driven more strongly toward the accumulationwall. The particle diameter d is usual1y small (in the submicrometer range) compared to the average layer thickness I, the lattertypically 2-20 pm. It is assumed that d « 1 for unperturbednormal-mode SdFFT. However, steric perturbations (due to thephysical size of the particles) become important with increasingcluster size as the increasing d approaches a decreasing i.Therefore, steric effects can become significant for higher orderlatex aggregates, those having a large number n of elementarjparticles in the cluster. Steric effects are obviously most importantfor clusters that have relatively extended conformations.'.!; Ultimately, the physical size determines the cluster retention afterpassing through a steric transition region.
The steric transition region refers to a range of particle sizesand corresponding elution volumes in which the dominantmechanism of retention is undergoing a transition from nonnalmode to sterie mode. The elution order undergoes inversion inthe steric transition region: for smaller particles, the retentionvolume increases with particle size, whereas for larger (steriemode) particles, the retention volume decreases with particle size.Steric transition phenomena have been characterized theoreticallyfor both SdFFF and flow field-flow fractionations The experimental verification of such phenomena in SdFFF has been earnedout using polydi"perse poly(vinyl chloride) latex beads as well asnarrow polystyrene beads,' The retention characteristics ofirregularly shaped particles, which can be strongly influenced bysteric effects, have also been studied by SdFFFlo.IJ The mostrecent studieslJ have shown that steric effects, which are not yetfully characterized even for sphencal particles, are quite complexand poorly understood for particles of nonspherical configuration.Because of the inlportance of nonspherical particles in many fields,it is important to better understand their steric behavior.
(8) C. Analyst 1993, 118, 1487-1494.
(9) Lee, C. A?wl. Chem. 1988, 60. 2328-2333(10) Kirkland, J. J: Schallinger, L E,; Vau, W. W. Anal. Chem. 1985,57. 2271
2275.(11) Beckett R.; Jiang, 1.: Liu, c.; Moon, M. E,; Giddings, J. C Pari. Sri. Techno/.
1994, 12, 89-113.
Analytical Chemistry, Vol. 67. No. 21, November 1, 1995 3861
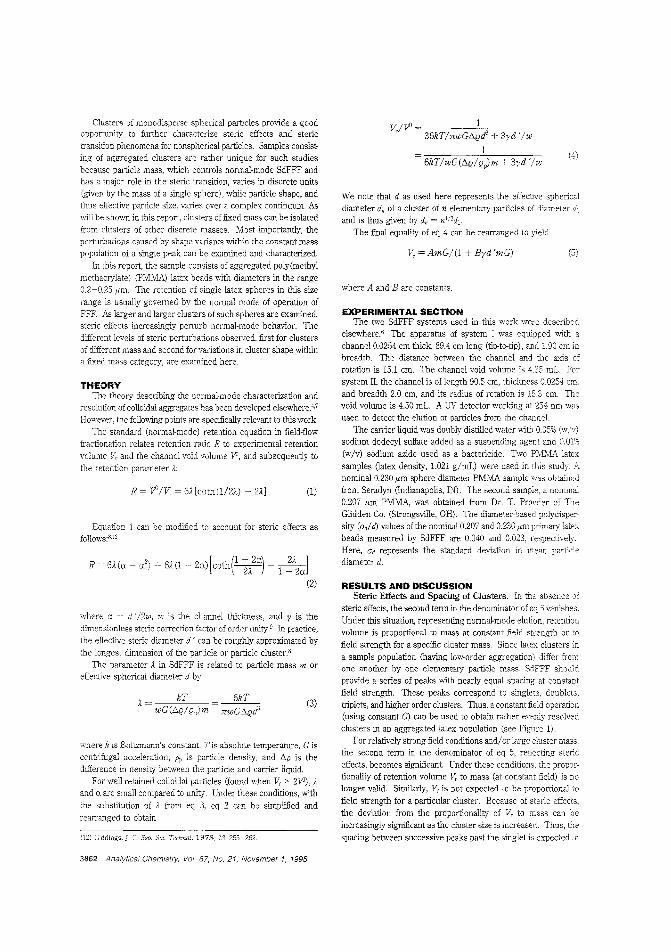
(12) Giddings, l C. Sep. Sci. Technol. 1978. 13, 255-262
Equation 1 can be modified to account for steric effects asfollows:'w
R = 6,,1.(0. - (12) + 6}J1 20.) [coth(l ;/(1) - 1 2,,1.20.1
(2)
(4)
(5)v; = AmGI(l + Byd 'mG)
6kTlwG(IlQIQ;Jm 3yd'/w
V,Iv" = 1 "36kThwG6.Qtf' + 3yd 'Iw
1
where A and B are constants.
We note that d as used here represents the effective sphericaldiameter d" of a cluster of n elementary particles of diameterand is thus given by d" = nl/3d,.
The final equality of eq 4 can be rearranged to yield
RESULTS AND DISCUSSIONStenc Effects and Spacing of Clusters. In the absence of
steric effects, the second term in the denominator of eq 5vanishes.Under this situation, representing normal-mode elution, retentionvolume is proportional to mass at constant field strength or tofield strength for a specific cluster mass. Since latex clusters ina sample population (having low-order aggregation) differ fromone another by one elementary particle mass. SdFFF shouldprovide a series of peaks with nearly equal spacing at constantfield strength. These peaks correspond to singlets, doublets,triplets, and higher order clusters, Thus, a constant field operation(using constant G) can be used to obtain rather evenly resolvedclusters in an aggregated latex population (see Figure 1).
For relatively strong field conditions and/or large cluster mass,the second term in the denominator of eq 5, reflecting stericeffects, becomes significant Under these conditions, the proportionality of retention volume V, to mass (at constant field) is nolonger valid. Similarly, V, is not expected to be proportional tofield strength for a particular cluster. Because of steric effects,the deviation from the proportionality of V to mass can beincreasingly significant as the cluster size is increased. Thus, thespacing between successive peaks past the singlet is expected to
EXPERIMENTAL SECTIONThe two SdFFF systems used in this work were described
elsewhere.' The apparatus of system I was equipped with achannel 0.0254 cm thick, 89.4 em long (tip-to-tip), and 1.90 cm inbreadth. The dist2nce between the channel and the axis ofrotation is 15.1 em. The channel void volume is 4.25 mL. Forsystem II, the channel is of length 90.5 em, thickness 0.0254 em,and breadth 2.0 em, and its radius of rotation is 15.3 em. Thevoid volume is 4.50 mL. A UV detector working at 254 nm wasused to detect the elution of particles from the channel.
The carrier liquid was doubly distilled water with 0.05% (w/v)sodium dodecyl sulfate added as a suspending agent and 0.01%(wIv) sodium azide used as a bactericide. Two PMMA latexsamples (latex density, 1.021 g/mL) were used in this study. Anominal 0.230 I'm sphere diameter PMMA sample was obtainedfrom Seradyn (Indianapolis, IN). The second sample, a nominal0.207 I'm PMMA, was obtained from Dr. T. Pravder of TheGlidden Co. (Strongsville, OH). The diameter-basee! polydispersity (ad/til values of the nominal 0.207 and 0.230 I'm primary latexbeads measured by SdFFF are 0.040 and 0.023, respectively:'Here, ad represents the standard deviation in mean particlediameter d.
(3)
(1)= 6Mcoth(l/2},) - 2..l]
,,1.= kTwG(/:,QIQ;Jm
R=
Clusters of monodisperse spherical particles provide a goodopportunity to further characterize steric effects and sterictransition phenomena for nonspherical particles. Samples consisting of aggregated clusters are rather unique for such studiesbecause particle mass. which controls normal-mode SdFFF andhas a major role in the steric transition, vroies in discrete units(given by the mass of a single sphere), while particle shape, andthus effective particle size, varies over a complex continuum. Asv-i)l be shown in this report, clusters of fixed mass can be isolatedfrom clusters of other discrete masses. Most importantly, theperturbations caused by shape variants within the constant masspopulation of a single peak can be examined and characterized.
In this report, the sample consists of aggregated poly(methylmethacrylate) (PMMA) latex beads with diameters in the range0.2-0.25 I'm. The retention of single latex spheres in this sizerange is usually governed by the normal mode of operation ofFFF. As larger and larger clusters of such spheres are examined,steric effects increasingly perturb normal-mode behavior. Thedifferent levels of steric perturbations observed, first for clustersof different mass and second for vaJiations in cluster shape withina fixed mass category, are examined here.
THEORYThe theory describing the nonnal-mode characterization and
resolution of colloidal aggregates has been developed elsewhere.'·7However, the following points are specifically relevant to this work.
The standard (norma~mode) retention equation in field-flowfractionation relates retention ratio R to experimental retentionvolume V, and the channel void volume V', and subsequently tothe retention parameter ..l:
where a = d'/2w, w is the channel thickness, and y is thedimensionless sterie correction factor of order unity.s In practice,the effective steric diameter d ' can be roughly approximated bythe longest dimension of the particle or proticle clusterS
The parameter ..l in SdFFF is related to particle mass m oreffective spherical diameter d by
where k is Boltzmann's constant, T is absolute temperature, Giscentrifugal acceleration, Pv is particle density, and 6.p is thedifference in density between the particle and carrier liquid.
For well-retained colloidal particles (found when V, > 2V'), ..land 0. are small compared to unity. Under these conditions, withthe substitution of ..l from eq 3, eq 2 can be simplified andrearTanged to obtain
3862 Analytical Chemistry, Vol. 67, No. 21, November 1, 1995
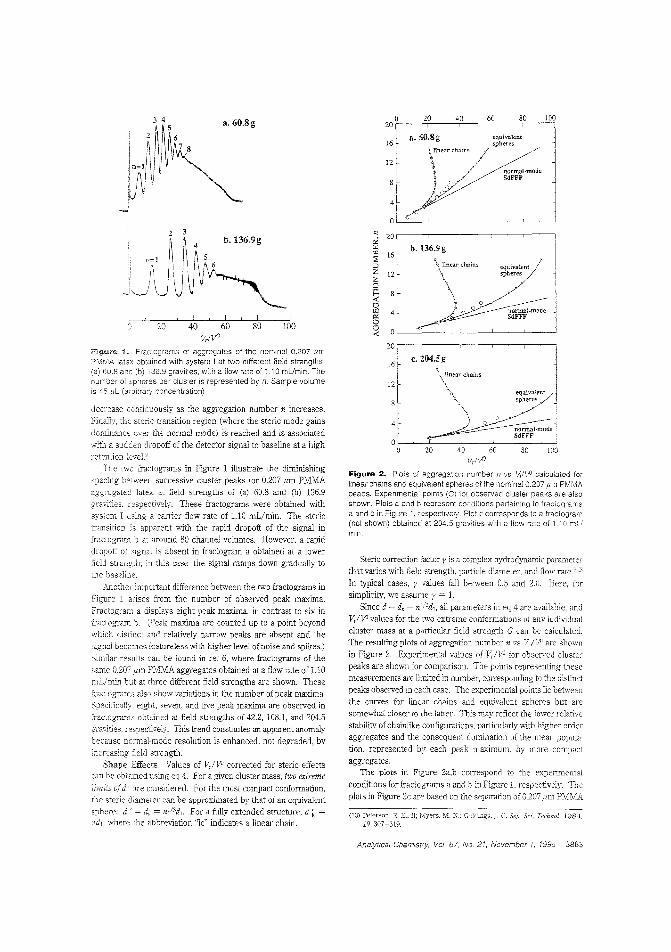
iDO80
equivalentspheres
normal-modeSdFFF
equivalent//spheres /
equivalentspheres
I
\~_ linea, chains.\
'\\
\
20
\ linear chains\"\.\
fj; 0 0 ----------1 ,,~-------normal-mode
.....,:~ SdFFF
,<~I !
c.204.5g
b.13ii.9g
a. iiO,Sg
) ~---------~l]-o~l-mode<E SdFFFO__--L__~__-'--__L__,.,j
o
12
16
ci20
W
'" 16~;:0Z 12Z0
~0W0::00<{
20
16
12
(13) Peterson, R E.. If; j\ilyers. !VI. N,; Giddings. J C. Scpo Sci. TechnoL 1984.19.307-319.
40 60
lI,lyO
Figure 2. Piots of aggregation number n vs V,/I/l calculated forlinear chains and equivalent spheres of the nominal 0.207 11m PMMAbeads. Experimental points (0) for observed cluster oeaks are alsoshown. Plots a and b represent conditions pertaining 'to fractogramsa and b 'In Figure 1, respective':y. Plot c corresponds to a fractogram(not shown) obtained at 204.5 gravities with a flow rate of 1.10 mUmin.
20 ['-0__-=;20"--_-=,40"--_-6'T0'---_...:8T°'-----'1-":.;00
Sterle correction factor y is a complex hydrodynamic parameter
!hat varies with field strength. particle diameter, and flow rate."·i!1
In typical cases, y values fall between 0.5 and 2.0. Here. lor
simplicity, we assume y = 1.Since d= d, = nt/3d], all parameters in eq 4 are available. and
Vc!0' values for the lwo extreme conformations of any indiVldual
cluster mass at a particular field strength G can be calculated.
The resulting plots of aggregation number n vs VIP' are shown
in Figure 2. Experimental values of 11,1V' for observed cluster
peaks are shown for comparison. The points representing these
measurements are limited in number, corresponding to the distinct
peaks observed in each case. The experimental points lie between
the curves for linear chains and equivalent spheres but are
somewhat closer to the latter. This may reflect the lower relative
stability of chainlike configurations, particularly with higher order
aggregates and the consequent domination of the mean popula
tion, represented by each peak maximum, by more compact
aggregates.
The plots in Figure 2a,b c01Tespond to the experimental
conditions for fracto grams a and b in Figure 1, respectively. The
plots in Figure 2c are based on the separation of 0.207 I'm PMMA
1008020c
decrease continuously as :he aggregation number n increases.
Finally, the stcric transition region (where the stelic mode gains
dominance over th2 normal mode) is reached and is associated
with a sudden dropoff 01 the detec'cor signal to baseline at a high
retention levelYThe two Iractograms in Figure 1 illustrate the diminishing
spacing between successive cluster peaks lor 0.207 I'm PMMA
aggregated latex at field strengths 01 (a) 60.8 and (b) 136.9
gravities, respectively. These fractograms were obtained vl·tithsystem I using a carrier flow rate of 1.10 mUmin. The sterie
transition apparent with the rapid dropoff of the signal in
[yactogram b at around 80 channel volumes. However, a rapid
dropoff of signal is absent in Iractogram a obtained at a lower
field strength; il1 this case. the sigual ramps down gradually to
G1e baseline.Another important difference between the two Iractograms in
Figure 1 a,ises Irom the number of observed peak maxima.
Fractogram a displays eight peak maxima, in contrast to six in
fraetogram b. (peak maxima are c:ounted up to a point beyend
which distinct and relatively narrow peaks are absent and the
signal becomes leatureless with higher level of noise and spikes.)
':)imih.r results can be found in ref 6, where fractograrns of the
same 0.207 um PM\1A aggregates obtained at a flow rate 01 1.10
mLlmin but at three different field strengths are shown. These
frac:ograms also show variations ir, the number of peak maxima.
Specifically, eight, seven, and five peak maxima are observed in
j-actograms obtained at field strengths 0142.2, 108.1, and 204.5
gravities, respectively. This trend constitutes an apparent anomaly
'lecause nonnal-mode resolution is enhanced, not degraded, hy
incr"asing field strength.
Shape Effects. Values of V/V' corrected for steric effectscan be oblamed using eq 4. For a given cluster mass, two extreme
o!d' are considered. For the most compact conformation,
the sterk diameter can be approximated by that of an equivalent
sphere, d' = d, = nl/"d,. For a fully extended structure, d 'e =
nd" where the abbreviation "lc" indicates a linear chain.
40 60VrlViJ
iF~gulre Fractog,arns 0' aggregates of the nomina! 0.207 flmPMMA latex obtained with system I at two different field strengths,(a) 60.8 anc (b) ',36.9 gravltes, with a flow rafe of 1.10 mUmin. Thenumber of spheres per cluster is represented by n. Sample volumeis 45 ,uL (a~bitrary concentration).
Analytical Chemislcy, Vol. 67, No. 21, November 1, 1995 3863
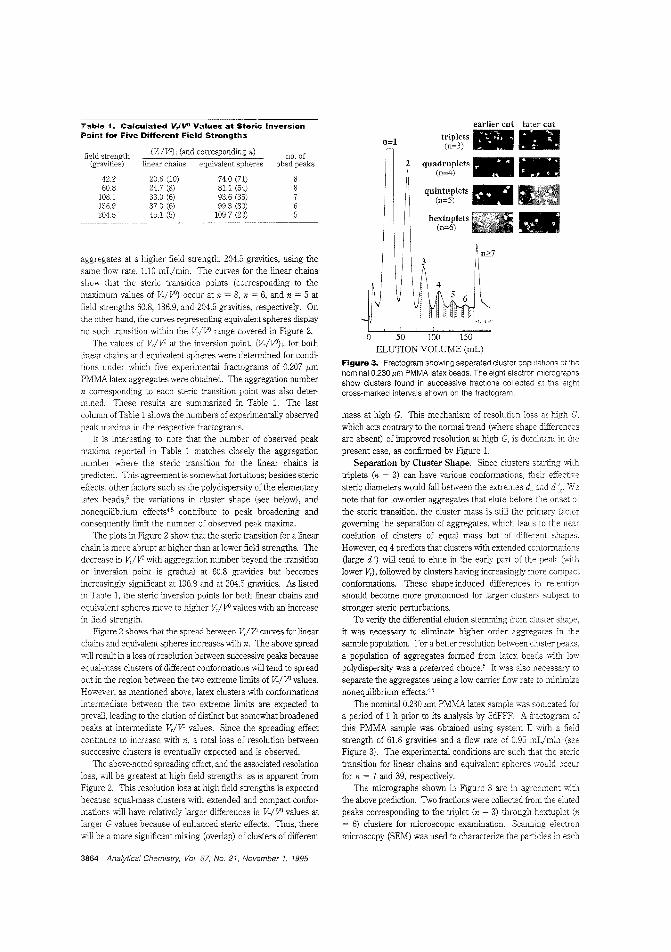
Table 1 ~ Calculated Vr/VO Values at Steric InversionPoinl for Five Different Field Strengths
-hextuplets(n=6)
earlier cut later cut
triPlets..•.(n=3)
quadruplet.__(n=4) .
qUintuP.lets _(n=5,
2
n=l
no. ofobsd peaks
n)
74.0 (71)81.1 (54)93.6 (35)99.3 (30)
109.7 (22)
(V,/0') , (and
20.6 (10)24.7 (8)33.0 (6)37.0 (6)45.1 (5)
42.260.8
1081136.9204.5
aggregates at a higher field strength, 204.5 gravities, using thesame flow rate, 1.10 mL/min. The curves for the linear chainsshow that the steric transition points (corresponding to themaximum values of V,/0') occur at n = 8, n 6, and n = 5 atfield strengths 60.8, 136.9, and 204.5 gravities, respectively. Onthe other hand, the curves representing equivalent spheres displayno such transition within the VJV' range covered in Figure 2.
The values of Vc!V' at the inversion point, (V,/V')" for bothlinear chains and equivalent spheres were determined for conditions under which five experimental fractograms of 0.207 ,urnPMMA latex aggregates were obtained. The aggregation numbern corresponding to each steric transition poim was also determined. These results are summarized in Table 1. The lastcolumn ofTable 1 shows the numbers of experimentally observedpeak maxima in the respective fyactograms.
It is interesting to note that the number of observed peakmaxima reported in Table 1 matches closely the aggregationnumber where the steric transition for the linear chains ispredicted. This agreement is somewhat fortuitous; besides steric
effects, other factors such as the polydispersity of the elementarylatex beads," the variations in cluster shape (see below), andnonequilibrium effects4•s contribute to peak broadening andconsequently limit the number of observed peak maxima.
The plots in Figure 2 show that the steric transition for a linearchain is more abrupt at higher than at lower field strengths. Thedecrease in V,/V' with aggregation number beyond the transitionor inversion point is gradual at 60.8 gravities but becomesincreasingly significant at 136.9 and at 204.5 gravities. As listedin Table 1, the steric inversion points for both linear chains andequivalent spheres move to higher V/V' values with an increasein field strength.
Figure 2 shows that the spread bet"een VJV' curves for linearchains and equivalent spheres increases with n. The above spreadwill result in a loss of resolution between successive peaks becauseequal-mass clusters of different conformations "ill tend to spreadout in the region between the two extreme limits of ll,/V' values.However, as mentioned above, latex clusters with conformationsintermediate between the two extreme limits are expected toprevail, leading to the elution of distinct but somewhat broadenedpeaks at intermediate V,/V' values. Since the spreading effectcontinues to increase with n, a total loss of resolution betweensuccessive clusters is eventually expected and is observed.
The above-noted spreading effect, and the associated resolutionloss, will be greatest at high field strengths, as is apparent fromFigure 2. This resolution loss at high field strengths is expectedbecause equal-mass clusters with extended and compact conformations will have relatively larger differences in Vr/V' values atlarger G values because of enhanced steric effects. Thus, therewill be a more significant mixing (overlap) of clusters of different
3
o SO 100 150
ELUTION VOLUME (mL)
Figure 3. Fractogram showing separated cluster popUlations of thenominal 0.230,um PMMA latex beads. The eight electron micrographsshow clusters found in successive fractions collected at the eightcross-marked intervals shown on the fractogram.
mass at high G. This mechanism of resolution loss at high G,which acts contrary to the normal trend (where shape differencesare absent) of improved resolution at high G, is dominant in Ute
present case, as confirmed by Figure 1.Separation by Cluster Shape. Since clusters starting with
triplets (n = 3) can have various conformations, their effectivesteric dIameters would fall between the extremes d" and d Ie Wenote that for low-order aggregates that elute before the onset ofthe steric transition, the cluster mass is still the primary factorgoverning the separation of aggregates, which leads to the nearcoelution of clusters of equal mass but of different shapes.However, eq 4 predicts that clusters with extended conformaticns(large d 1 will tend to elute in the early part of the peak (withlower V,), followed by clusters having increasingly more compactconformations. These shape-induced differences in retentionshould become more pronounced for larger clusters subject tostronger steric perturbations.
To verify the differential elution stemming from cluster shape,it was necessary to eliminate higher order aggregates in the
sample population. For a better resolution between cluster pea{s.a population of aggregates formed from latex beads with lowpolydispersity was a preferred choiceS It was also necessary toseparate the aggregates using a low carrier flow rate to minimizenonequilibrium effects.4.s
The nominal 0.230,um PMMA latex sample was sonicateda period of 1 h prior to its analysis by SdFFF. A fractogram ofthis PMMA sample was obtained using system I1 with a fieldstrength of 61.6 gravities and a flow rate of 0.95 mL/min (seeFigure 3). The experimental conditions are such that the sterietransition for linear chains and equivalent spheres would occurfor n = 7 and 39, respectively.
The micrographs shown in Figure 3 are in agreement withthe above prediction. Two fractions were coliected from the elutedpeaks corresponding to the triplet (n = 3) through hextuplet (n
= 6) clusters for microscopic examination. Scanning electron
microscopy (SEM) was used to characterize the particles in each
3864 Analytical Chemistry, Vol. 67, No. 21, November 1, 1995
fraction. TI,e SEM micrographs of the above fractions (shownin Figure 3; indicate that for all four peaks examined, clusterswith relatively extended conformations elute in the early part ofthe peak, and clusters with more compact conformations are foundin the later cul. (Clusters with n > 6 did not form distinct peaksfor reasons explained above. All higher order clusters were eluted
as a single peak once the field was turned off. The size of this
peak shows that the population of latex clusters with n > 6 wasrelatively snall in the sonicated sample.)
The small number of aggregates shown in each micrographof Figure 3 are representative of what was observed in a largerpopulation of clusters with scanning electron microscopy. Manychainlike or relatively extended clusters were observed in theimages obtained frcm the earlier cuts for triplets or quadruplets.The later cuts of triplets and quadruplets were found to containtightly packed clusters. The marked difference in compactnessin cluster coni1guration was less pronounced in the twodimensional images of aggregates with five and six latex beads.Sonication may be responsible for the absence of chainlike (or
relatively extended) clusters in the earlier cuts of quintuplets andhextuplets; a relatively larger proportion of extended (less stable)aggregates would likely be broken up during sonication of the
sample.
CONCLlJSIONSWhile colloidal latex aggregates can be resolved by sedimenta
tion FFF into separate peaks according to their mass or degreeof aggregation, the peaks are broadened by a secondary fractionation caused by steric perturbations. The secondary fractionationdepends on cluster shape. The ability to fractionate large clustersof equa~ mass according to differences in shape supports the
possibility that FFF techniques might be adaptable to thecharacterization of colloidal particles by shape factors, whichsignificantly influence the mechanical and optical properties ofmaterials produced from the colloids.
The capability of sedimentation FFF to discriminate betweendifferent cluster masses as well as unlike cluster shapes for
aggregated latexes is rather unique among instrumental systems.The generation of latex fractions differing in mass and shape has
not been achieved by any other technique. The isolation of thesemajor populations and subpopulations of latexes makes it possibleto probe further details of colloidal structure by utilizing otheranalytical tools, such as clcctron microscopy and light scattering.Thus, the ability of serliment2tion FFF to separate colloidal
fractions according to well-established principles not only hasdirect analytical applications but also makes possible powerfulcombinations of FFF with a host of other analytical techniques.
ACKNOWLEDGMENTThis work was supported by Grant CHE-9322472 from the
National Science Foundation.
GLOSSARY
A constant in eq 5
B constant in eq 5
d effective spherical diameter
d ' particle steric diameter
d I, d' for linear chains
d1 diameter of elememary sphere
do effective spherical diameter of cluster of n particles
G field strength measured. as acceleration
Boltzma.nIl's constallt
average palticle layer thickness
m particle mass
n aggregation number
R retention parameter
T absolute temperature
Vr retention volume
0l channel void volume
w channel thickness
Greeks
a. d '/2w in eq 2
)' sterie colTection factor
6.p density difference between particle and carrier
A retention parameter
PP particle density
ad diameter-based polydispersity
Received for review March 2, 1995. Accepted August 181995@
AC950219+
0) Abstract published i:l Advance ACS Abstmcts, October 1, 1995.
Analytical Chemist,y Vol. 67, No. 21, November 1, 1995 3865
Anal. Chem. 1995, 67. 3866-3870
Separation of Diastereomers by Capillary ZoneElectrophoresis with Polymer Additives: Effect ofPolymer Type and Chain Length
Wolfgang Schlitzner,t and Salvatore Fanali
Istituto di Cromatografia del CNR, Area della Ricerca di Roma, via Salaria km 29.300, C.P. 10,00016 Monterotondo Scalo,Rome, Italy
Andreas Rizzi,* and Ernst Kenndler
Institute for Analytical Chemistry, University of Vienna, Wahringerstrasse 38, A-to90 Vienna, Austria
Diastereomenc derivatives of enantiomers are separatedby capillary zone electrophoresis in nonchiral separationsystems in the presence of linear polymers. These polymers significantly influence the mobilities of the analytesas well as the stereoselectivity of the system. Threetypes of linear polymers, poly(vinylpyrrolidone),poly(ethylene glycol), and poly(acrylamide), are investigated to determine their influence on the stereoselectiveseparation of diastereomeric derivatives of a-amino acidsobtained by reaction with optically pure (+ )-O,O'-dibenzoylL-tartaric anhydride. Differences are found in the strengthof the polymer effect and the effected migration order.Polymer chain length had no impact on stereoselectivity.
In previous papers, J-:) the electrophoretic separation of dia
stereomeric derivatives of racemic amino acids has been reported,where the diastereomers were obtained by reaction with (+)-0,0'dibenzoyi-L-tartaric anhydride (DBT anhydride). It was shownthat in free solution using no further additives, many of theinvestigated compounds are resolved at appropriate pH conditions.It has been found that the presence of linear poly (vinylpyrrolidone)in the electrolyte solution significantly increases stereoselectivityand allows one to separate a larger number of diastereomericanalytes. U This increased stereoselectivitv is supposed to bebased on intennolecular interactions between the analytes andthe polymeric pseudophase. In aqueous electrolyte solutions, itcan be assumed that the pseudophase acts predominantly on thebasis of free energy contributions responsible for "hydrophobic"beha\ior, as well as on the basis of dipole and .7-" interactionsbetween appropriate structural moieties in analyte and polymer.Interactions between aromatic and ,,-electron-rich structuralgroups seem to be of special significance.'
In this paper, three different types of polymers are comparedwith respect to this observed effect on stereoselectivity: poly(vinylpyrrolidone) (PVP) , poly(ethylene glycol) (pEG), and poly-
Pt:l"lllanent address: Institute for }\nalytical Chemistry, :Jniversity of Vienna.
(1) Schlitzner, CapoDE'C"chi, G.; Fanali, S.: Rizzi, A~ Kenndler. E. Electro-phoresis 1994, 15, 769.
(2) SchLitmer. Fanali, S.: Rizzi, A; Kcnndler. E.}. Chromatogr. 1993,639,
Co)) SchQtzner. W.; Fanali, S.; Rizzi, Kenndler, E.]. Gramatogr., in press.Blatny, P.: Fischer, H.-C.; Rizzi, A; Kenndler, E.]. Chromatogr., in press.
3866 Analytical Chemistry, Vol. 67, No. 21, November 1, 1995
(acrylamide) (PAA). As stereorecognition might be affected by
the confonnation of the polymer, the parameter of chain leng1:his investigated, too, using PVP and PEG'i\1th three different chainleng1hs. Test analytes were racentic ex-amino and ex-hydroxy acidsconverted to diastereomeric derivatives by reaction with DETanhydride.
EXPERIMENTAL SECTION
Apparatus. The experiments were carried out using a
laboratory-made apparatus as described in refs 1 and 5. 11,edimensions of the fused silica capillary used (polymicro Technologies, Phoenix, A7J were 56 cm x 100 I'm Ld., 'i\ith 39 cm lengthto the detector (UV absorption at 233 nm). A constant voltage of
12 kV was applied to the capillary during electrophoresis in theanionic mode. The capillary was coated to suppress the dec
troosmotic flow; it was kept at ambient temperature (24-26 "C)without thennostating. Sampling was done by the hydrodynamicmethod (6 s at a height of 10 em).
For measurements of dynamic viscosities at three differenttemperatures, an automated microviscosimeter U\.MV 200, A Paar,Graz, Austria) was used.
Chemicals. Optically pure (optical purity> 99.6%) and racemicex-amino acids, as well as buffering electrolytes and coatingreagents, were purchased from Aldrich (Steinheim, Gelmany) inthe purest obtainable quality. (+)-O,0'·diacetyl-L-ta11aric anhy
dride (optical purity >99.6%) was obtained from ""Jdrich, and (-'-)O,O'-dibenzoyl-L-tartaric anhydride was synthesized as described
in refs 1 and 6, ending with an optical purity >99.5%.PVP-15, PVP-25, and PVP-90, as well as PEG-200. PEG-20 000
and PEG 100000, were obtained from Serva (Heidelberg. Germany). PAA was polymerized according to ref 6, "ith the givenconcentration of acrylamide.
Procedure. The derivatization of the racemic or optically pureanalytes with DBT anhydride was perfonned as in refs 7 and S;the poly(acrylamide)-type coating was made according to theprocedure given in ref 6.
(5) Fanali, S.; OssicinL L Foret. I .; Bocek P. ]. Microcoluml1 Sep. 1989190.
(6) Kilar, F'.: S. Electrophoresis 1989. 10, 2~i.
(7) Zetzsche, Hubacher, M. He/v. Chim. Acta 1926, 9. 291(8) Lindner, W.: Leitner, c.: Uray, G.]. Chromatr;gr. 1984,316, 605.
0003-2700/95/0367-3866$9.0010 © 1995 American Chemical Socieiy
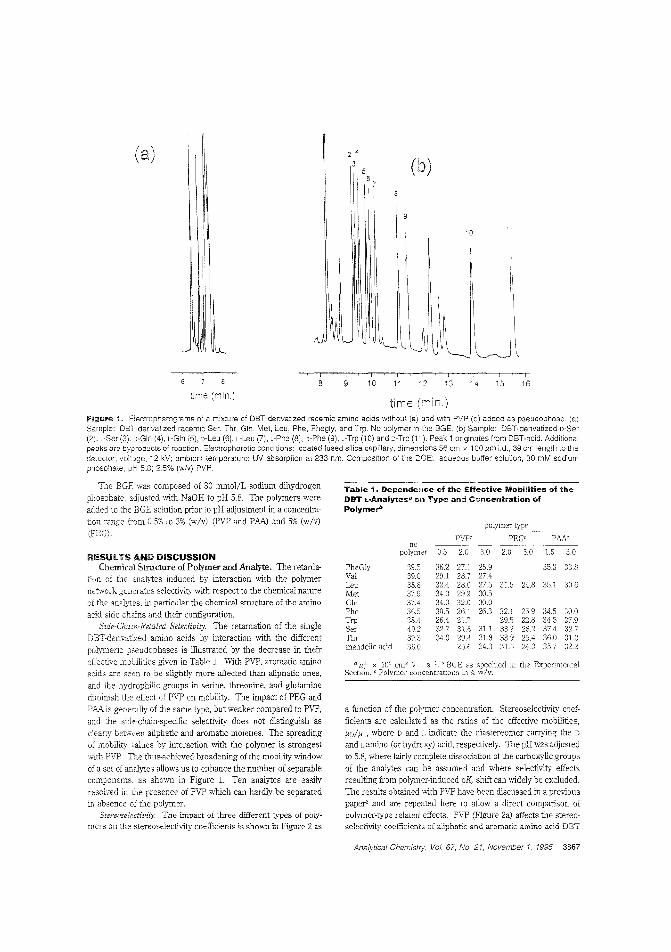
(a) 2 4
3
10
S 10 11 2 13 14 15 16
time (min.)
polymec type
PVP' PEG' PAN
0.5 20 3_0 2.0 :5_0 1.:5 3.0
PheGly 39.5 36_2 27.1 25.9 35.3 338Val 39.0 29_1 28.7 27.4Leu 38.8 32.4 28.0 27_5 31.5 24.8 35.1 306Met 37.9 34.0 29_2 30_5GIn 37.4 34.0 :12_0 30_0Phe 36.5 30_5 26_: 26.3 321 25.9 34.5 300Trp 38.4 26.4 21_7 29_5 22.8 34.5 27_9Ser 40.2 32.7 31.6 31.1 33.2 26.2 37,4 :12.7Thr 39.3 34.0 29,4 31.S 33_9 25.4 36.0 :31.0mandelic acid 36_0 2'_6 24.3 31.(j 24_0 3:5.7 32.2
in the Experimental
a function of the polymer concentration. Stereoselectivity coef
ficients are calculated as the ratios of the effective mobilities,
I'DII'L, where D and indicate the diastereomer carrying the D
and l. anlino (or hydroxy) acid, respectively. The pH was adjusted
to 5.8, where fairly complete dissociation of the carboxylic groups
of the analytes can be assumed and where selectivity effects
resulting from polymer-induced pK, shift can widely be excluded.
The results obtained with PVP have been discussed in a previous
paper' and are repeated here to allow a direct comparison of
polymer-type relaled effects. PVP (Figure 2a) affects the stereoselectivity coefficients of aliphatic and aromatic amino acid DBT
Table 1. Dependence of the Effective Mobilities of theDBT L"Analytesa on Type and Concentration ofPolymer"
IFIESlJlTS AN[lI)lSCUSSIONChemical Structure of Polymer and Analyte. The retarda
tion of the analytes induced by interaction with the polymer
network generates selectivity with respect to the chemical nature
of the analytes, in particular the chemical structure of the amino
acid side chains and their configuration_
Side-Chain-Related Selectivity. The retardation of the single
DBT-derivatized amino acids by interaction with the different
polymeric pseudophases is illustrated by the decrease in their
effective mobilities given in Table 1. With PVP, aromatic amino
acids are seen to be slightly more affected than aliphatic ones,and the hydrophilic groups in serine, threonine, and glutamine
diminish the effect of PVP en mobility_ The impact of PEG and
PAA is generally of the same type, but weaker compared to PVP,
and ite side-chain-specific selectivity does not distinguish as
clear'y between aliphatic and aromatic moieties. The spreading
of mobility values by interaction with the polymer is strongest
with PVP. The tbus-achieved broadening of the mobility window
of a set of analytes allows us to enhance the number of separablecomponents, as shown in Figure 1. Ten analytes are easily
resolved in fle presence of PVP which can hardly be separated
in absence of the polymer.Stereoselec/ivity. The impact of three different types of poly
mers on the stereoselectivity coefficients is shown in Figure 2 as
Figure 1. Electropj-,erograms 0: a mixture cf DBT-derivatized racemic amino acids without (a) and with PVP (b) added as pseudophase (a)Sample: OBT-derivatized racemic Ser. Thr, Gin, Met, Leu, Phe, Phegly, and Trp. No polymer in the BGE. (b) Sample OBT-derivatized D-Ser(2), L-Ser (3). D-Gln (4), L-Gln is), D-Leu (6), L-Leu (7), L-Phe (S:, D-Phe (9), _-Trp (10) and D-Trp (1-,)_ Peak 1 originates from OBT-acid_ Additionalpeaks are byproducts of reaction. Electrophoretic conditions: coated fused silica capillary, dimensions 56 em x 100 ,urn i.d., 39 Gill length to thedetector; voltage, 12 kV; ambient temperature; UV absorption at 233 nm. ComposItion of the 8GE: aqueous buffer solution, 30 mM sodiumphosphate, pH 5_S; 2_5% (w/v) PVP_
Tle BGE was composed of 30 mmDl/L sodium dihydrogen
phosphate, adjusted with NaOH to pH 5_8. The polymers were
added to the BGE solution prior to pH adjustment in a concentra
tion range from 0_5% to 3% (w/v) (rVP and PAA) and 5% (w/v)(pEG)
Analytica! Chemislr;, Vol 67, No. 21, November 1, 1995 3867
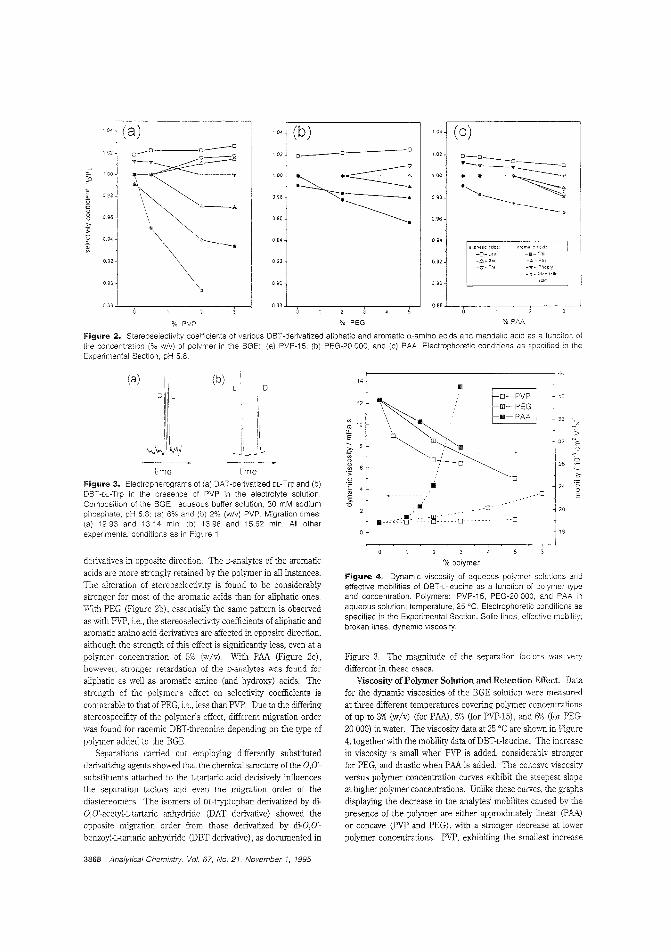
1 o~ (a) ," (b) '" j (c)~ ____o 0_0 a1C2
;-~=''" D--O 102 0-0__
~:~:J ."-,,,___~--o
~''0
~:=::,,:--~
OJ o,ge 0,98 0,98
~. .
------------.----~. -----------.8 0,96 096 09B
'"I
5
°"1U 0,9~ 0,94
~ \--~. Gllphi\lcnclds "'cmn\IC "Cid~
"'1-O-I.~U -11- "tc
0.'32 092 -6-Sl' _.li._ Ph~
~'V- Tn! -'Y-PhC\lly
1 _ '" _ M~~c~J1c
oaooso1
.:1(1
ose 08e ose
% PV? % PEG % PM
Figure 2. Stereoselectivity coefficients of various DBT-derivatized aliphatic and aromatic a.-amino acids and mandelic acid as a funciton ofthe concentration (% w/v) of polymer in the BGE: (a) PVP-15, (b) PEG-20 000, and (c) PAA. Electrophoretic conditions as specified in theExperimental Section; pH 5.8.
time timefigure 3. Electropherograms of (a) OAT-derivatized DL-Trp and (b)OBT-DL-Trp in the presence of PVP in the electrolyte solution.Composition of the BGE: aqueous buffer solution, 30 mM sodiumphosphate, pH 5.8: (a) 6% and (b) 2% (w/v) PVP. Migration times:(a) 12.93 and 13.14 min; (b) 13.96 and 15.62 min. All otherexperimental conditions as in Figure 1.
g~ooE
16
20
40
Eu
o28
32
c
ill ~ - .. - - ..--_.---
-·0-,-
12
'"ro 10"-E
OJD(b)(a)
derivatives in opposite direction. The D-analytes of the aromaticacids are more strongly retained by the polymer in all instances.The alteration of stereoselectivity is found to be considerablystronger for most of the aromatic acids tban for aliphatic ones.With PEG (Figure 2b), essentially the same pattern is observedas with PVP, i.e., the stereoselectivity coefficients of aliphatic andaromatic amino acid derivatives are affected in opposite direction,although the strength of this effect is significantly less, even at apoiymer concentration of 5% (w/v). With PAA (Figure 2c),however, stronger retardation of the D-analy1es was found foraliphatic as well as aromatic amino (and hydroxy) acids. Thestrength of the polymer's effect on selectivity coefficients iscomparable to that of PEG, i.e., less than PVP. Due to the differingstereospecifity of the polymer's effect, different migration orderwas found for racemic DBT-threonine depending on the type ofpolymer added to the BGE.
Separations camed out employing differently substitutedderivatizing agents showed that the chemical structure of the 0,0'substituents attached to the L-tartaric acid decisively influencesthe separation factors and even the migration order of thediastereomers. The isomers of DL-tryptophan derivatized by diO.O'-acetyl-L-tartaric anhydride (DAT derivative) showed theopposite migration order from those derivatized by di-O,O'benzoyl-L-tartaIic anhydride (DBT derivative), as documented in
% poiymer
Figure 4. Dynamic viscosity of aqueous polymer solutions andeffective mobilities of DBT-L-Ieucine as a function of polymer typeand concentration. Polymers: PVP-15, PEG-20 000, and PAA inaqueous solution; temperature. 25 'C. Electrophoretic conditions asspecified in the Experimental Section. Solid lines, effective mobility;broken lines, dynamic viscosity.
Figure 3. The magnitude of the separation factors was verydifferent in these cases.
Viscosity of Polymer Solution and Retention Effect, Datafor the dynamic viscosities of the BGE solution wefe measuredat three different temperatures covering polymer concentrationsof up to 3% (wIv) (for PAA), 5% (for PVP-15), and 6% (for PEG20 000) in water. The viscosity data at 25 'C are shown in Figure4, together with the mobility data ofDBT-L-leucine. The increasein viscosity is small when PVP is added, considerably strongerfor PEG, and drastic when PAA is added. The concave viscosityversus polymer concentration curves exhibit the steepest slopeat higher polymer concentrations. Unlike these curves, the graphsdisplaying the decrease in the analytes' mobilites caused by thepresence of the polymer are either approximately linear (P)\,/\.)
or concave (PVP and PEG), with a stronger decrease at lowerpolymer concentrations. PVP, exhibiting the smallest increase
3868 Analytical Chemistry. Vol. 67. No. 21. November 1, 1995
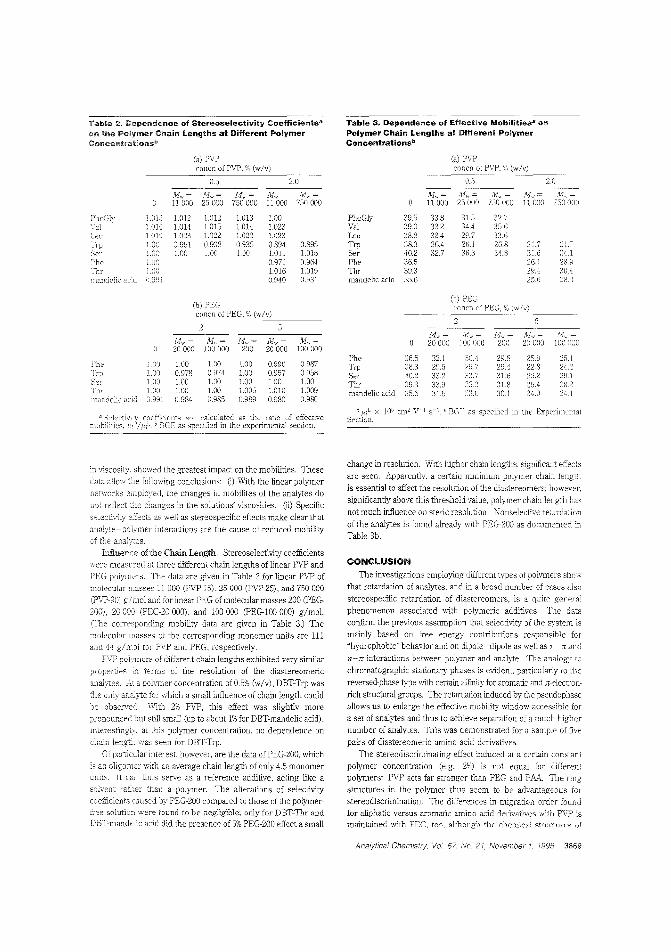
TabUs 2. Dependence of Stereoselectivity Coefficientsa
on tile Polymer Chain Lengths at Different PolymerConcentratucmsb
Table 3. Dependence of Effective Mobilitiesa onPolymer Chain Lengths at Different PolymerConcentrationsb
(a) PVPconen of PVP, (w/v)
0.5 2.0
Mw = Mw - Mw Mw750000 II 000 750000 0 11 000
1.013 1.012 J.012 1.013 1.00 PheGly 39.5 33.8 31.5 32.7LOIO 1.014 l.O15 1.014 1.023 Val 39.0 322 34.4 35.61019 1.023 1.022 l.022 1.023 Leu 38.8 324 29.7 33.6
Trp l.OO J951 0.938 0.935 0.894 0.895 Trp 38.3 264 26.1 26.8 217l.00 100 l.OO l.OO 1.0ll 1.01:' Ser 40.2 327 36.3 34.3 31.6 3U
Phe 1.00 0.971 0964 Phe 36.5 26.1 28.91.016 1.019 ll1r 39.3 294 30.4
,').991 0.940 0.931 mandelic Reid 35.6 28.3
(b) PEG (w/v)conen of PEG. (w/v)
Mw~ M\\'= Mw~
Mw~ Mw = Mw = .M\'>, = 20000 200110 100011020000 JOO 000 200 100000
Phe 36.5 32.1 30.4 29.8 25.9 25.11.00 I.CO 1.00 0.990 0.987 Trp 38.3 29.5 29.7 29.4 22.8 24.20.978 OW4 1.00 0.957 0.958 Ser 10.2 33.2 33.7 31.6 26.2 29.11.00 U:O 1.00 1.00 1.00 Thr 39.3 33.9 35.3 31.8 25.4- 28.21.00 1.00 1.005 1.010 1.009 mandelic zcid 35.6 3Ui ;"]3.0 30.1 24.00.981 0.985 0.989 0.980 0.980
x lOs cm2 V 1 S-1. Ii BGE as specified in the Expcrim('ntal
in viscosity showed the greatest impact on the mobilities. These
data anow the foiiowing conclusions: 0) With the linear polymer
networks employed, the changes in mobilites of the analytes do
not reflect be changes in the solutions' viscosities. (ii) Specificselectivity dects as well as stereospecific effects make clear that
analyte-poiymer interactions are the cause of reduced mobility
or the analytes.Influence of the Chain Length. Stereoselectivity coefficients
'vere measured at three different chain lengths of linear PVP and
PEG polymers. The data are given in Table 2 for linear FliP of
molecular n',asses 11 000 (pVP-15), 25 000 (pVP-25) , and 750 000
(FVP-90) g/mol and for linear PEG of molemlar masses 200 (pEG
200), 20000 (pEG-20 000), and 100000 (PEG-lOa 000) g/mo!.eThe cOITe,ponding mobil'ty data are given in Table 3.) The
molecular rnasses of the corresponding monomer units are 111
and 44 g/mJI for PVP and PEG, respectively.
FVP polymers of differer.t chain lengths exhibited very similar
proPf'rt.1PS terms or the resolution of the diastereomeric
analytes. a polymer concentration of 0.5% (w/v) , DBT-Trp was
the only analyte for which a small influence of chain length could
be observed. With 2% FVP, this effect was slightly more
pronounced but still small (up to about 1% for DBT-mandelic acid).
Interestingly, at this polymer concentration, no dependence onchain length was seen for DBT-Trp.
Of panicular interest. however, are the data of PECr200, which
is an oligomer ",ith an average chain length of only 4.5 monomer
units. It thus serve as a reference additive, acting like a
solvent ratber than a polymer. The alterations of selectivity
coefficients caused by PEG-200 cOIllpared 10 those of the polymer-
solution were found to be negligible; only for DBT-Thr andDBT-mandClic acid did the presence of 5% PEG-200 effect a small
change in resolution. With higher cbain lengths, significant efects
are seen. Apparently, a certain minimum polYII~er chain lengthis essential to affect the resolution of the diastereomers; however,
significantly above this threshold value, polymer chah length has
not much influence on steric resolution. Nonselective retardation
of the anaiytes is found already with PEG-200 as documented in
Table 3b.
CONCLUSION
The investigations employing different types of polymers show
that retardation of analytes, and in a broad number of cases also
stereospecific retardation of diastereomers, is a quite gerera·
phenomenon associated with polymeric additives. The dat2
confirm the previous assumption that selectivity of the system is
mainly based on free ener",! contributions responsible for
"hydrophobic" beha,ior and on dipole-dipole as well as rr-J[ and
n-Jl interactions between polymer and analyte. The analogy re
chromatographic stationary phases is evident, panicularIy to the
reversed-phase type ",ith certain affinity for aromatic and iT-electron
rich structural groups. The retardation induced by the pseudophase
allows us to enlarge the effective mobility window accessible for
a set of analytes and thus to achieve separation of a much higher
number of analyles. This was demonstrated for a sample of five
pairs of diastereomeric amino acid derivatives.The stereodiscriminating effect induced at a certain constant
polymer concentration (e.g., 2%) is n~t equal for different
polymers: PVP acts far sTonger than PEG and PAA The ring
structures in the polymer thus seem to be advantageous for
stereodiscrimination. The differences in migration order found
for aliphatic versus aromatic amino acid derivatives will] P"VP ismaintained with PEG, too, ahhOl~gh the chemical structures of
Analytical ChemlstlY. Vol. 67, No. 21, November 1. 1995 3869
the polymers differ widely. On the other hand, PAA does notexhibit such different migration order. The influence of polymerchain length on stereoselectivity is marginal. The aromaticmoieties in the DBT group of the derivatization reagent lead toimproved separation, accompanied by inversion of migration order,compared to the short aliphatic group in the corresponding DATderivatives.
A comparison of the viscosity effects induced by the threedifferent polymers again underlines that reduction of the analytemobility is not a consequence of an increase in viscosity but rathera result of intennolecular interactions similar to "adsorption ontoa pseudophase". The most pronounced effect related to thepolymer was found for PVP, where the smallest viscosity increasewas observed. This polymer can thus be favored in the practicaluse as the BGE additive that allows selectivity enhancement and
3870 Analytical Chemistry, Vol. 67, No. 21, November 1, 1995
stereodiscrimination for diastereomeric analytes, particularly inthose cases where aromatic moieties are present
ACKNOWLEDGMENTFinancial support ofthis work by the Italian Ministry of Foreign
Affairs and the Austrian Academic Exchange Service within theframework of the scientific technical agreement between Italy andAustria (project no, 89) is acknowledged, The authors thank G,Ribitsch, University Graz, Austria, and Rheocoll Co. for the kind
permission to use the rnicroviscosimeter.
Received for review March 28, 1995. Accepted August 18,1995.@
AC950310D
o Abstract published in Advance ACS Abstracts, September 1995.
Ana!. Chern. 1995, 67, 3871-3878
XPS and TOF·SIMS Microanalysis of a Peptide!Polymer Drug Delivery DeviceC. M. John,t R. W. Odom,*'; L. Salvati,§ A. Annapragada,§ and M. Y, FI.I LI.I§
Department of Pharmaceutical Chemistry, School of Pharmacy, University of California,San FrancIsco, Ga!ifomia 94143-0446, Charles Evans & Associates, Redwood City, California 94063, andAbbott Laboratories, Abbott Park, Illinois 60064-3500
The localization of a peptide drug dispersed in a solidmatrix of hydroxypropyl cellulose (lIPC) was determinedat micrometer lateral resolution using secondary ion massspectrometry (SThIS)/ion microscopy. Leuprolide formulated as a sustained release drug delivery device has beenselected as a model compound for this investigation. Onekey facet of this study was to attempt to understand thedistribution and ultimate bioavailability of the peptidedispersed in an inert polymer matrix. The results reported in this paper demonstrate that the lateral distribution of leuprolide along the surfaces of cross sectionsprepared from different polymer formulations is different.Ion microscopy directly measures the lateral distributionof protonated molecular ions as well as specific fragmentpeaks and provides a direct method of determiningpeptide distributions in polymers. Ion images of leupolide dispersed in HPC demonstrate that the peptidedistribution is critically dependent on polymer composition. The mass spectrometry results augment quantititative X·ray photoelectron (XPS) measurement of C andN levels in different polymer/peptide formulations. Thecombination ofXPS and TOF-SIMS techniques providesa powerful method for determining the distribution ofpeptides polymer matrices.
The localization of organic molecules in biological tissues andbiopolymers is becoming increasingly important in phannaceuticalresearch and development.' For example, the ability to localizeselected pharmaceutical compounds or metabolites within specificregions of a :issue or organ can provide tremendous advantages
over existing methodologies for development and evaluation ofdrug deliver; and efficacy.' Biomaterials utiiized as artificial
tissue, skin, prosthetic devices, and intraocular lens are typical1ysynthetic poiymers \vith some form of biocompatible surfacelayer:; The ultimate acceptance or rejection of the artificialmaterial by an organism depends on the compatibility of theimplallt surface with the cells with which it makes intimate
contact."Another important. practical application ofbiopolymers is their
use as solid media for innovative time-release pharmaceutical
Univer::;iry of California.Charles Evans & Associa:.es.
~ Abbott Laboratories.CJ Kasedmo, Lausmaa,].:n SUi/ace Chuructenzati,m ojBiomaterials: Ratner,
B. D.. Elsevier: :-Jew York. 1988: Chapter 1.(2) Prescol1. L F. In Sovel Drug and Its Therapeutic
Pre<o,co'J.. L F.. S., & Sant":Chapter
CJ Ratner. B Biamed. AIatet. Res 1993,27,837.
0003-2700/95/0367-3871S9.00/0 © 1995 American Chemical Society
formulations' For example, the development of protein and
peptidic drugs that can regulate a number of physiological
processes such as growth, immune responses, blood pressure,
blood clotting, and bone calcification has been limited by the
necessity of administering these drugs by injection since oral
administratioin is generally ineffective.' Polymer matrices con
taining peptidic drugs could provide a highly efficient merhod for
drug administration. However, the polymer matrices must have
well-characterized drug release rates, and of course, the polymers
must be biocompatible.
The work reported in this paper illustrates one of the first
examples of direct molecular microanalysis of a medicinal patch
in which the distribution of a peptide is detennined using
molecular imaging secondary ion mass spectrometry. Th,s study
was performed on samples containing the drug ieuprolide,
dissolved in a matrix of hydroxypropyl cellulose (fIPC). Lcupro
lide is an orally inactive synthetic Jonapeptide analog of ovine or
porcine gonadotropin-releasing hormone (GnRH), which is used
as an antineoplastic agent in the treatment of endometriosis and
precocious puberty. The structure of leuprolide is 5-oxoPro-His
Trp-Ser-Tyr-o-Leu-Leu-Arg-Pro-NHC,H,. Leuprolide is more po
tent than GnRH and differs from the naturally occurring hormone
by the presence of the D isomer of leucine at position 6 and rhe
ethylamide which replaces the glycine at position 10. A research
effort was initiated to design a device that can be placed in direct
contact with a biological membrane, and hence, the drug distribu
tion in the polymer matrix is a critical parameter in these
experimental devices.Time-af-flight secondary ion mass spectrometry (TOr-SIMS)
provided a direct method of determining the leuprolide distribution
along cross sections of different peptide/polynler blends. TOF
SIMS localized the distribution of protonated molecular ions, (M
+ H)+, and fragment ions of leuprolide at lateral resolutions on
the order of 3-5 ,um along cross sections 100,um or more thick.
The cross-sectional distributions of the drug were found to be
strongly dependant on the drug-to-polymer ratio. The addition
of 12% oleic acid to the drug/HPC blend significantly changed
the axial distribution of leuprolide compared to formulaticns that
contained only leuprolide and HPC. X-ray photoelectron spectroscopy (XPS) was also employed in this study to measure the
atomic concentrations and functional fomls of C, 0, and N on the
sample surfaces.
T 1..,
Analytical Chemistry, VOl. 67, No. 21, November 1. 1995 3871
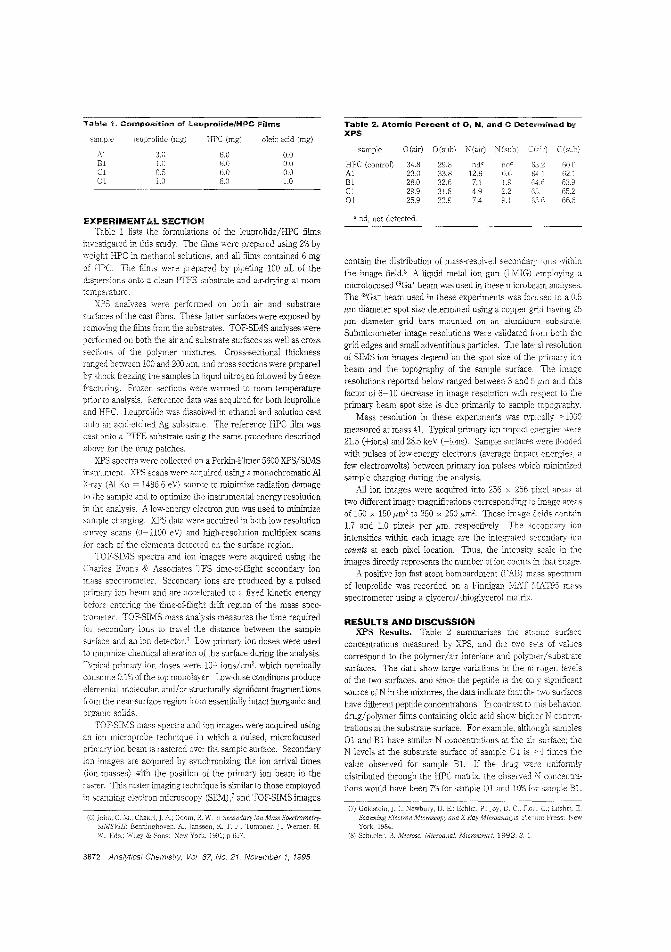
Table 11. Composition of Leuprolide/HPC Films
sample Jcuprolide (mg) HPC (mg) oleic acid (mg)
Al 3.IJ 6.0 0.0BI l.IJ 6.0 IJ.IJC1 0.5 6.0 0.001 l.IJ 6.0 1.0
Table 2. Atomic Percent of O. N. and C Deter-mined! byXPS
sample o(air) o(sub) Nfair) N(sub) C(aic) C(sub)
HPC (conlTol) 34.8 29.8 nde ndc 6,).2 60J;Al 23.0 33.8 12.6 0.6 64.1 62.1Bl 280 32.6 7.1 1.9 6<.6 63.9C1 29.9 31.8 4.9 2.2 65.201 259 22.9 7.4 9.1 66.6
EXPERIMENTAL SECTIONTabie 1 lists the fonnulations of the leuprolide/HPC films
investigated in this study. The illms were prepared using 2% byweight HPC in methanol solutions, and all 5lms contained 6 mg
of HPC. The films were prepared by pipeting 100 ,uL of thedispersions onto a clean PTFE substrate and air-drying at roomtemperature.
XPS analyses were perromled on both air and substratesurfaces of the cast films. 11,ese latter surraces were exposed byremoving the films from the substrates. TOF-SIMS analyses wereperformed on both the air and substrate surraces as well as crosssections of the polymer mixtures. Cross-sectional thicknessranged between 100 and 200.um, and cross sections were preparedby shock freezing the sanoples in liquid nitrogen followed by freezefracturinO" Frozen sections were warmed to room temperatureprior to a~·alYSis. Reference data was acquired for both leuprolide
and HPC. Leuprolide was dissolved in ethanol and solution castonto an acid-etched Ag substrate. The reference HPC film wascast onto a PTFE substrate using the same prooedure describedabove for the drug patches.
XPS spectra were collected on a Perkin-Elmer 5600 XPS/SIMSinstTlment. XPS scans were acquired using a monochromatic AI
X-ray (AI Ka. = 1486.6 eV) source to minimize radiation danoageto the sample and to optimize tbe instrumental energy resolutionin the analysis. A low-energy electron gun was used to minimizesample charging. XPS data were acquired in both low-resolutionsurvey scans (0-1100 ev) and high-resolution multiplex scansfor each of the elements detected on the surfaoe region.
TOF-SIMS spectra and ion images were acquired using theCharles Evans & Associates ITS time-of-flight secondary ionmass snectrometer. Secondary ions are produced by a pulsedprimary ion beam and are accelerated to fixed kinetic energy
before entering the time-of-flight drift reg',on of the mass spectrometer. TOF-SIMS mass analysis measures the time requiredfor secondary ions to travel the distance between the samplesurface and an ion detector. ii Low primary ion doses were usedto minimize chemical alteration of the surrace during the analysis.Typical primar! ion doses were 101, ions/em'. which nominallyconsume 0.1% oIthe top monolayer. Low-dose conditions produceelemental, molecular, and/or structurally significant fragment ionsfrom the near-surrace region from essentially intact inorganic andorganic solids.
TO F-SIMS mass spectra and ion images were acquired usingan ion microprobe t~chnique in which a pulsed, microfocusedprimary ion beam is rastered over the sanopie surrace. Secondaryion images are acquired by synchronizing the ion arrival times(ion masses) with the position of the primary ion beam in theraster. 111is raster imaging technique is similar to those employed
in scanning electron microscopy (SEM),7 and TOF-SIMS images
(G) c.!vI; ChakeI,j. A.; Odom, R. W. InSIMSVlIl: A.. Janssen, K. T
Eels.; ;,[ew York, 1991; p 657.]., Werner. H.
a nd, not detected.
contain the distribution of mass-resolved secondary ions "itl1inthe image fieldS A liquid metal ion gun (LMIG) employing amicrofocused "Ga' beam was used in these microbeam analyses.The 69Ga+ beano used in these experiments was focused to a 0.5I'm diameter spot size detennined using a copper grid having 25.urn diameter grid bars mounted on an aluminum substrate.Submicrometer image resolu1ions were validated from both thegrid edges and small adventitious particles. The lateral resolutionof SIMS ion images depend on the spot size of the primary ionbeam and the topography of the sample surface. The imageresolutions reported below ranged between 3 and 5 um and thisfactor of 6-10 decrease in image resolution with respect to theprimary beano spot size is due primarily to sample topography.
Mass resolution in these experiments was typically > 1000
measured at mass 41. Typical primary ion impact energies were21.5 (+ions) and 28.5 keV (-ions). Sanople surfaces were floodedwith pulses of low-energy electrons (average impacl energies, afew electronvolts) between primary ion pulses which minimizedsanople charging during the analysis.
ll.11 ion images were acquired into 256 x 256 pixel areas attwo different image magnifications corresponding to image areasof 150 x 150 ,urn' to 250 x 250,um'. These image fields oont8in1.7 and 1.0 pixels per ,urn, respectively. The secondary ionintensities within each image are the integrated secondary ioncounts at each pixel location. Thus, the intensity scale in theimages directly represents the number of ion counts in that image.
A positive ion fast atom bombardment (FAB) mass spectrumof leuprolide was recorded on a Finnigan MAT MlcT95 massspectrometer using a glycerol!thioglycerol matrix.
RESULTS AND DISCUSSIONXPS Results. Table 2 summarizes the atomic surraec
concentrations measured by XPS, and the two sets of valuescorrespond to the polymer/air interrace and polymer/substratesurfaces. The data show large variations in the nilTogen levelsof the two surraces, and since the peptide is the only significantsource of N in the mixtures, the data indicate that the two surraceshave different peptide concentrations. In contrast to this behavior,drug/polymer films containing oleic acid show higher N concentrations at the substrate surrace. For example, although samples01 and B1 have similar N concentrations at the air surrace; theN levels at the substrate surface of sample 01 is >4 times thevalue observed for sanople B1. If the drug were uniformlydistributed through the HPC matrix, the observed concentrations would have been 7% for sanople 01 and 10% for sample B1.
(7) Goldstein,]. L; Newbury, D. E.; Echlin, P.: Joy, D. c.; C.: Lifshin. E.Sc<,nn,'ng .!':I"ctron M'iCY(>scoPY cmdX-ii'ayM!rroana!:ris; Plenum Press:York,
(8) Scheler, B. Microsc. Microanal. Microstrurt. 1992, 3, :
3872 Analytical Chemistry. Vol. 67, No. 21, November 1, 1995
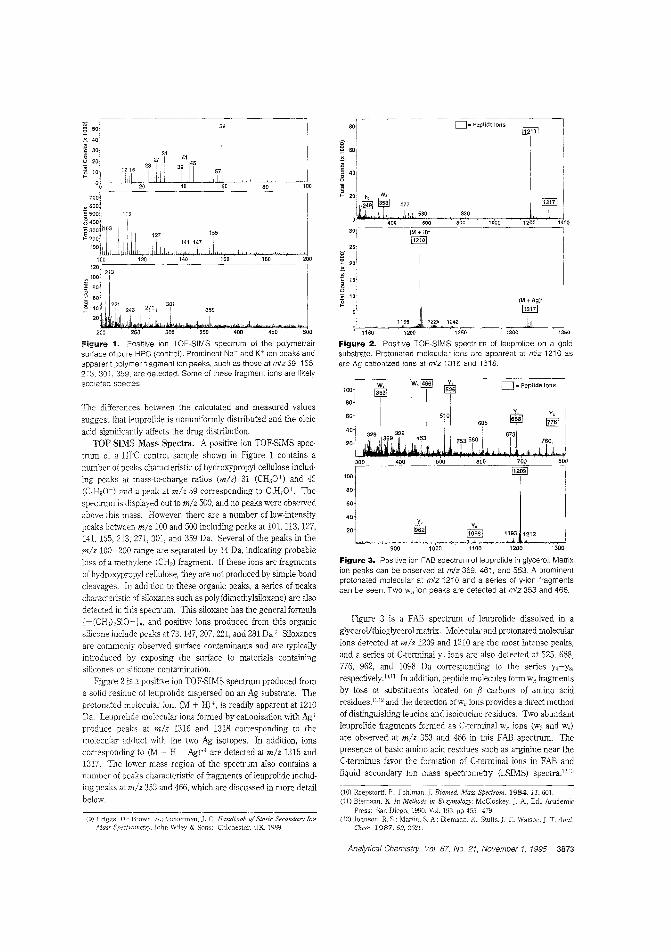
I1350
(M + Ag)+
@ill
~i,1300
D ~-Peptide Ions
IiliQJI,
II
@ill,580 830
'00 800 1000 1200 1400
(M+H)+
[IillJ
Figure 2. Positive TOF-SIMS spectrum of leuprolide on a goldsubstrate. Protonated molecular ions are apparent at mjz 1210 asare Ag cationized ions at mlz 1316 and 1318.
Figure 3. Positive ion r AB spectrum of leuprolide in glyceroL Matrixion peaks can be observed at mlz 369, 461, and 553. A prominentprot01ated molecular at mlz 1210 and a series of y-ion fragmentscan be seen. Two W n ion peaks are detected at mlz 353 and 466.
(10) Roepstorff, P.; Fohlman.]. Biomed. Mass 1984,11, 60l.(11) Biemann, K. In Methods in EI:zymology: A, Ed.: Academic
Press: San Diego, 1990; Vol. 193, pp 455-479(12) Johnson, R S,; Martin, S. A.: Riemann, K: Stults.]. T.: Watson,]. T. Ana!.
Chcm. 1987,59, 2621.
300 400 __50_0 ---"6"'Oo'___~~70~O'---_~800
'00 j IilljJ I
~LI ",9~.~ rr&J. I,~_~.__--'Y,-_~~'~1.,l93,....',,2'~2~~900 1000 1100 1200 1300
[J = Peptide Ions~--w,~ ~
':j ~ 5~5
GOl 51°40-]
20
Figure 3 is a FAB spectrum of leuprolide dissolved in a
glycerol/thioglycerol matrix. Molecular and protonated molecularions detected at mlz 1209 and 1210 are the most intense peaks,and a series of C-tenninal y, ions are also detected at 525, 688,776, 962, and 1098 Da corresponding to the series y'-Y8,respectively. 10.11 In addition, peptide molecules form w, fragments
by loss of substituents located on fJ carbons of amino acidresidues, 11." and the detection ofw" ions provides a direct methodof distinguishing leucine and isoleucine residues. Two abundantleuprolide fragments formed as C-terminal w" ions (w', and w,,)
are observed at mlz 353 and 466 in this FAB spectrum. Thepresence of basic amino acid residues such as arginine near theC-tenninus favor the fonnation of C-terminal ions in FAB andliquid secondary ion mass spectrometry (LSIMS) spectra."'::;
(9) Briggs. D.; Brown, A.; Vickerman, J. C. Handbook of Static Secondary JonMass Spectrmnctry, John Wiley & Sons: Chichester. "JK 1989
The differences between the calculated and measured valuessuggest that leuprolide is nonuniformly distributed and the oleic
acid significartly affects the drug distribution.TOF-SIMS Mass Spectra. A positive ion TOF-SIMS spec
trum of a HPC control sample sho'iVJ1 in Figure 1 contains anumber of peaks characteristic of hydroxypropyl cellulose including peaks at mass-to-charge ratios (mlz) 31 (CH:;O+) and 45(C,H,O") and a peak at mlz 59 corresponding to C;;H,O+ The
spectrum is displayed out to mlz 500, and no peaks were observedabove this mass. However, there are a number of low-intensitypeaks between mlz 100 and 500 including peaks at 101, 113, 127,141, 155,213,271,301, and 359 Da. Several of the peaks in themlz 100-200 range are separaled by 14 Da, indicating probableloss of a methylene (CHz) fragment. If these ions are fragments
of hydroxypropyl cellulose, they are not produced by simple bondcleavages. In addition to these organic peaks, a series of peakscharac:eristic of siloxanes such as poly (dimethylsiloxane) are also
detected in this spectrum. This siloxane has the general formula[-(CH::l,SiO-]", and positive ions produced from this organicsilicone include peaks at 73, 147, 207, 221, and 281 Da." Siloxanesare commonly observed surface contaminants and are typically
introduced by exposing the surface to materials containingsilicones or silicone contamination.
Figure 2 is a positive ion TOF-SIMS spectrum produced froma solid residue of leuprolide dispersed on an Ag substrate. Theprotonated molecular ion, (Iv! + H)+, is readily apparent at 1210Da Leuprolide molecular ions formed by cationization with Ag+produce peaks at mlz 1316 and 1318 corresponding to themo:ecular adduct with the two Ag isotopes. In addition, ionscorresponding to (M - H + Ag)'+ are detected at mlz 1315 and1317. The lower mass region of the spectrum also contains anumber of peaks characteristic of fragments of leuprolide including peaks at mlz 353 and 166, which are discussed in more detail
below.
Analytical Chemistry, Vol. 67, No. 21, November 1, 1995 3873
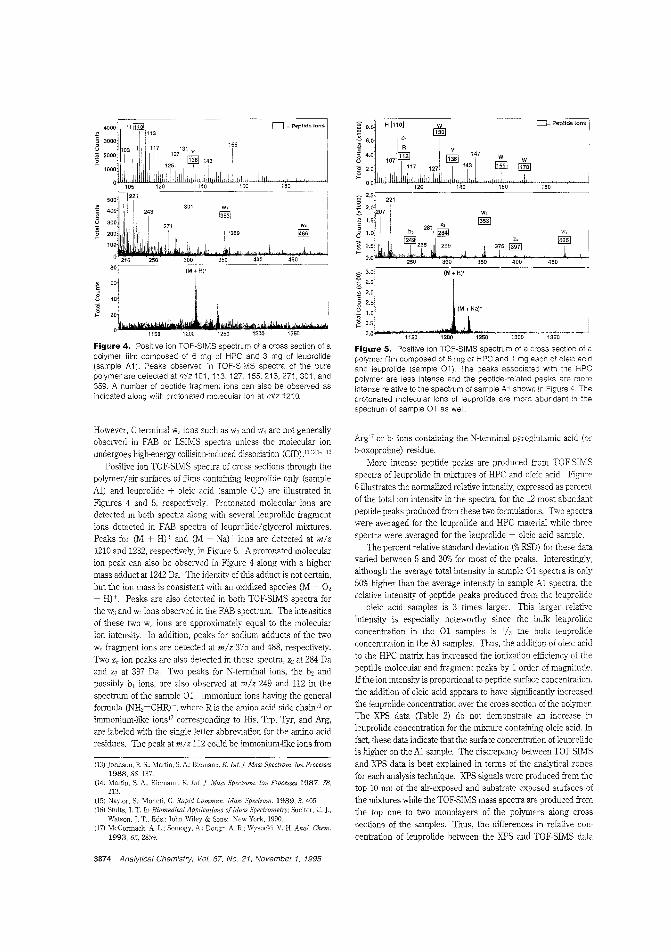
0'" Peptide Ions I
147
H IlliJI, b,
(M+ H)+
,- ,.le1150 1200 "1~25"'O---''''30'''O--~1'''35-0---'
Figure 5. Positive ion TOF-SIMS spectrum of a cross section of apolymer film composed of 6 mg of HPC and 1 mg each of oleic acidand leuprolide (sample 01). The peaks associated with the HPCpolymer are less intense and the peptide-related peaks are moreintense relative to the spectrum of sample A1 shown in Figure 4. Theprotonated molecular ions of leuprolide are more abundant in thespectrum of sample 01 as well.
~
1
450
- --------o = Pep'Ide Ions I
I
~~~:~'~IJ180
J ::: 1 I
~ 2:1W!"_M~ ~~~JI!!WI\l""'~IM!J!.k,~""'Jllj!IJ1150 1200 ,250 1300 1350
Figure 4. Positive ion TOF-SIMS spectrum of a cross section of apolymer film composed of 6 mg of HPC and 3 mg of leuprolide(sample Ai). Peaks observed in TOF-SiMS spectra of the purepolymer are detected at mlz 101. 113, 127, 155, 213, 271, 301, and359. A number of peptide fragment ions can also be observed asindicated along with protonated mo,'ecular ion at mlz 1210
However, C-terminal w, ions such as W, and W4 are not generallyobserved in FAE or LSIMS spectra unless the molecular ionundergoes high-energy collision-induced dissociation (CID).1l·""4-lIi
Positive ion TOF-SIMS spectra of cross sections through thepolymer/air surfaces of films containing leuprolide only (sample
AI) and leuprolide + oleic acid (sample 01) are illustrated inFigures 4 and 5, respectively. Protonated molecular ions aredetected in both spectra along with several leuprolide fragmentions detected in FAE spectra of leuprolide/glycerol mixtures.Peaks for (M H)+ and (M + Na)+ ions are detected at m/z1210 and 1232, respectively, in Figure 5. A protonated molecularion peak can also be observed in Figure 4 along with a highermass adduct at 1242 Da. The identity of this adduct is not certain,but the ion mass is consistent with an oxidized species (M + a,+ H)+ Peaks are also detected in both TOF-SIMS spectra forthe w, and w, ions observed in the FAE spect:um. The intensitiesof these two w, ions are approximately equal to the molecularion intensity. In addition, peaks for sodium adducts of the twow, fragment ions are detected at m/z 375 and 488, respectively.
Two z, ion peaks are also detected in these spectra, Z2 at 284 Daand Z3 at 397 Da. Two peaks for N-terminal ions the b" andpossibly b, ions, are also observed at m/z 249 and 112 i~ thespectrum of the sample 01. Immonium ions having the generalformula (NH2~CHR)+, where R is the amino acid side chain lO orimmonium-like ions'7 corresponding to His, Trp, Tyr, and Arg,are labeled with the single letter abbreviation for the amino acidresidues. The peak at mlz 112 could be immonium-like ions from
(13) Johnson, R S.: Martin, S. A.: Biemann. K. Int. I Mass Spectrom. Jon Processes1988, 86, 137.
(14) ~;~iin. S. A.; Riemann. K. Int. I Mass Spectrom. Ion Processes 1987, 78,
(15) Naylor, S.; Moneti, G. Rapid Commun. Mass(16) Stults,). T. In Biomedical Appfications o/Mass
Watson,]. T, Eds.: John & Sons: New York, 1990.(17) McCormack. A. L: Somoh'Y, Dongr, A R.: Wysocki, V. H. Anal. Chem.
1993,65,2859.
Arg 17 or b, ions containing the N-terminal pyroglutamic acid (or5-oxoproline) residue.
More intense peptide peaks are produced from TOF-SIMSspectra of leuprolide in mixtures of HPC and oleic acid. Fi911re6 illuslr-ates the normalized relative intensity, expressed as per~entof the total ion intensity in the spectra, for the 12 most abendantpeptide peaks produced from these two formulations. Two spectrawere averaged for the leuprolide and HPC mateJial while threespectra were averaged for the leuprolide + oleic acid sample.
The percent relative standard deviation (% RSD) for these datavaJied between 5 and 30% for most of the peaks. Interestingiy,although the average total intensity in sample 01 spectra is only50% higher than the average intensity in sample Al spectra, therelative intensity of peptide peaks produced from the leuprolide+ oleic acid samples is 3 times larger. This larger relativeintensity is especially noteworthy since the bulk leuprolideconcentration in the a1 samples is Ih the bulk leuprolideconcentration in the Al samples. Thus, the addition of oleic acidto the HPC matrix has increased the ionization efficiency of thepeptide molecular and fragment peaks by 1 order of magnitude.If the ion intensity is proportional to peptide surface concentration,the addition of oleic acid appears to have signiJicantly increasedthe leuprolide concentration over the cross section of the polymer.The XPS data (fable 2) do not demonstrate an increase inleuprolide concentration for the mixture containing oleic acid. Infact, these data indicate that the surface concentration of leuprolideis higher on the Al sample. The discrepancy between TOF-SIMSand XPS data is best explained in terms of the analytical zonesfor each analysis technique. XPS signals were produced from thetop 10 nm of the air-exposed and substrate exposed surfaces ofthe mixtures while the TOF-SIMS mass spectra are produced fromthe top one to two monolayers of the polymers along crosssections of the samples. 11ms, the differences in relative con
centration of leuprolide between the XPS and TOF-SIMS data
3874 Analytical Chemistry, Vol. 67, No. 21, ."Iovember 1, 1995
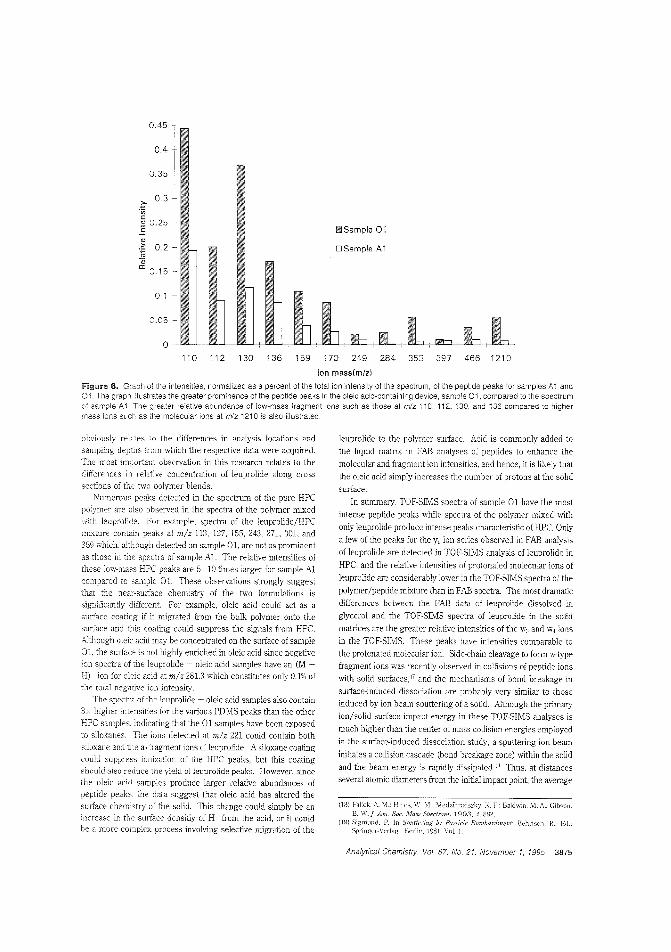
0.45
0.4
0.35
;:- 03'iiic~ 0.25E
"..'; 0.2
'"a;0:: 0.15
I
01
0.05
o1'0 112 130 136 159 170 249 284 353 397 4661210
ion mass(m/zl
Figure 6. Graph of the intensities, normaJizec as a percent of the total ion intensity of the spectrum, of the peptide peaks for se.mples A1 and01. The graph illustrates the greater prominence of the peptide peaks in the oleic acid-containing device, sample 01, compared to the spectrumof sample .A 1. The greater relative abLndance of low-mass fragment ions such as those at m/z i 10, 112, 130. and 136 comparee to highermass ions such as the molecular ions at m/z 1210 is also illustrated.
obviously relctes to the differences in analysis locations andsampling depths from which the respective data were acquired.
The most importtnt observation in this research relates to thedifferences in relative concentration of leuprolide along cross
sections of the two polymer blends.Numerous peaks detected in the spectrum of the pure HPC
polymer are also observed in the spectra of the polymer mixedwilh leuprolide. For excmple, spectra of the leuprolide/HPCmixture contain peaks at m/z 113, 127, 155,243, 271, 301, and359 which, although detectedJn sample 01, are not as prominent
as those in the spectra of sample AI. The relative intensities ofthese low-mass HPC peaks are 5-10 times larger for sample Al
compared to sample 01. These observations strongly suggestthat the near-surface chem'stry of the two formulations issignificantly different. For example, oleic acid could act as asurrace coating if it migrated from the bulk polymer onto thesurface and this coating could suppress the signals from HPC
Although oleic acid may be cmcentrated on the surface of sample01, the smiace is not hIghly enriched in oleic acid since negativeIon spectra of the leuprolide oleic acid samples have an (MH) Ion for oleic acid at m/z 281.3 whIch constitutes only 0.1% ofthe total negative ion intensitj.
The spectra of the leuprolide + oleic acid samples also contain3x higher intensities for the various PDMS peaks than the otherHFC samples. indicating that the 01 samples have been exposed
w siloxanes. The Ions detected at m/z 221 could contain bothsiloxane and tte a, tragment ions of leuprolide. A siloxane coating
could suppress ionization of the HPC peaks, but this coatingshould also reduce the yield of leuprolide peaks. However, since
the oleic aciel samples produce larger relative abundances ofpeptide peaks, the elata suggest that oleic acid has altered the
surface chemistry of the solid. This change could simply be anincrease in the surface densitiy of H-i from the acid, or it couldbe a more complex process involving selective migration of the
leuprolide to the polymer surface. Acid is commonly added to
the liquid matrix In FAB analyses of peptides to enhance the
moleculer and fragment ion intensities, and hence, it is likely that
the oleic acid simply increases the number of protons at the solId
surrace.
In summary, TOF-SIMS spectra of sample OJ have the most
intense peptide peaks while spectra of the polymer mixed with
only leuprolide produce intense peaks characteristic of HPC. Only
a few of 'he peaks for the y" ion series observed in FAB analysis
of leuprolide are detected in TOF-SIMS analysis of leuprolide in
HPC, and the relative intensities of protonated molecular ions of
1euprolide are considerably lower in the TO F-SIMS spectra of the
polymer/peptide mixture than in FAB spectra. The most dramatic
differences between the FAB data of leuprolide dissolved in
glycerol and the TOF-SIMS spectra of leuprolide in the solid
matrices are the greater relative intensities of the w" and w, ions
in the TOF-SIMS. These peaks have intensities comparable to
the protcnated molecular ion. Side-chain cleavage to form w-type
fragment ions was recently observed in collisions of peptide ions
with solid suriaces,17 and the mechanisms of bond breakage in
suIiace-ineluced dissociation are probably very similar to those
induced by ion beam sputtering of a solid. Although the primary
ion/solid surface impact energy in these TOF-SIMS analyses Is
much higher than the center of mass collision energies employed
in the stnface-induced dissociation study, a sputtering ion beam
initiates a collision cascade (bond hreakage zone) within the solid
and the beam energy is rapidly dissipated.:'! Thus, at distances
several atomic diameters from the initial impact point, the average
(18) Falick A. M.: I-lines. \V. M.: Medzihradszky. K F.: Baldwin. M. A.; Gibscn.B. 'vV.]. Am. Soc. Spedrom. 1993. 4.882.
(1~) S:gmund. P. In Partide Bombardmcnt: Behrisch, r<.. Ed.:Springer-Verlag: Herlil;, Vol. 1.
Analytical Chemistry. Vot. 67. No. 21. November 1, 1995 3875
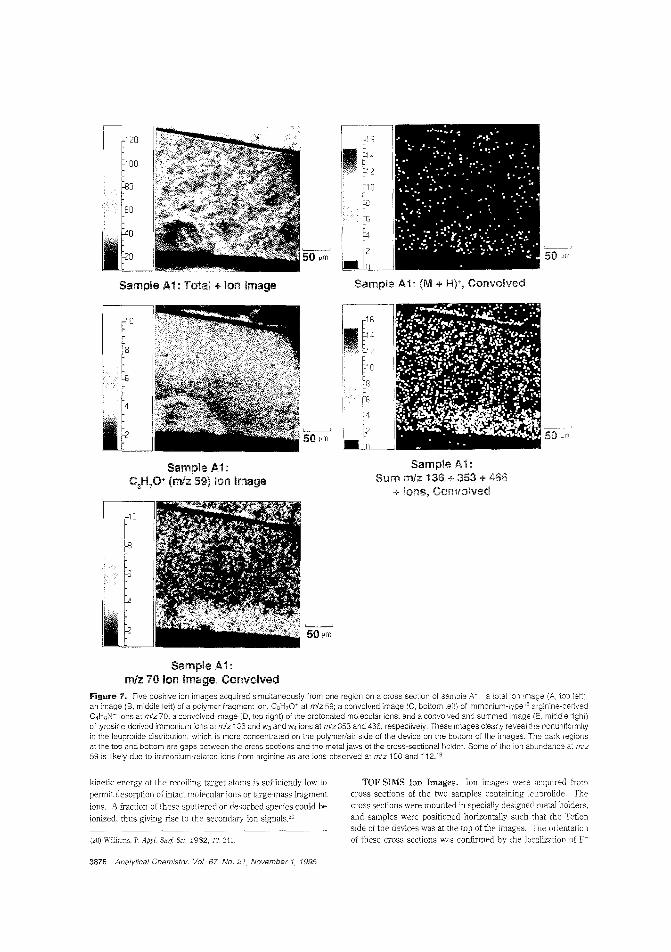
~
50 em 50
Sample Ai: Total + Ion Image
-10
ISample Ai:
C3H70+ (mlz 59) Ion Image
~
50 em
Sample A1: (M + H)+, Convolved
-10
-2-ISample Ai:
Sum m/z 136 + 353 + 466+ Ions, Convolved
50
I
10
Sample Ai:mlz 70 Ion Image, Convolved
50em
Figure 7. Five positive ion images acquired simultaneously from one region on a cross section of sample AI: a total ion image (A, top iaft);an image (B, middle left) of a polymer fragment ion, C3H70~ at mlz 59; a convolved image (C, bottom left) of immonium-iype18 arg;inille-der'!vejC4 HsN'':- ions at mlz 70; a convolved mage ::0, top right) of :he protonated molecular ions; and a convolved and surrmed image middle right)of tyrosine-derived immonium ions at m/z 136 and W3 and W4 ions at m/z 353 and 466, respectively. These images clearly reveal the nonuniformityin the leuprolide distribution, which is more concentrated on the polymer/air side of the device on the bottom of the images. The dark regionsat the top and bottom are gaps between the cross sections and the metal jaws of the cross-sectional hoideL Some of the ion abundance at mlz59 is likely due to immonium-related ions f:om arginine as are ions observed at m/z 100 and 112.18
kinetic energy of the recoiling target atoms is sufficiently low topermit desof]ltion of intact molecular ions or large-mass fragment
ions_ A fraction of these sputcered or desorbed species could beionized, thus giving rise to the secondal-y ion signals_20
(20) Williams, p, Appl. Surf Sci, 1982,13,241.
3876 Analytical Chemisiry, Vol. 67, No_ 21, November 1, 1995
TOF-SIMS Ion Images. Ion irr,ages were acquired fromcross sections of the two samples containing leuprolide_ Thecross sections were mounted in specially designed metal holders,and samples were positioned horizontally such that the Teflonside of the devices was at the top of the images_ The orientationof these cross sections was confirmed by the localization of F-
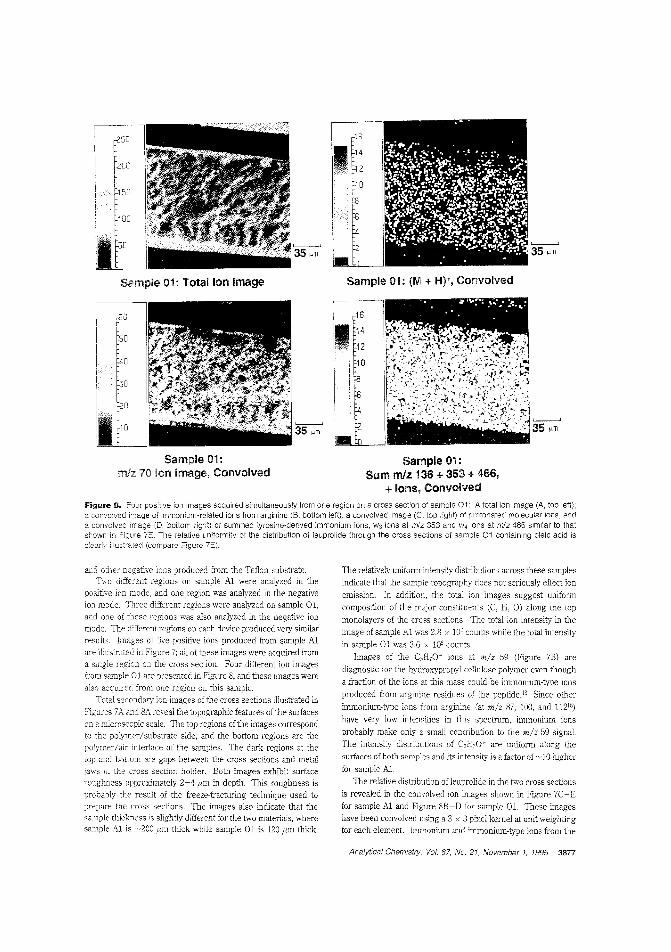
150
, 10e
II" 35 em
I
Sample 01: Total Ion Image
Sample 01:mlz 70 Ion Image, Convolved
Sample 01: (M + Hy, Convolved
r-----I!I 16
ii,'" :: ..I \ 10 ,
I:I
Sample 01:Sum mlz 136 + 353 + 466,
+ Ions, ConvolvedFigure s. Four positive ioll images acquired simultaneously from one region on a cross section of sample 01: A total ion image (A, top left);a convolved inage of :mmonjum~related ions from arginine (8, bottom left): a convolved image (C, top ~ight) of rmtonated molecular ions; anda convolved image (D, bottom rig1t) of summed tyrosine-derived immonium ions, W3 ions at m/z 353 and W4 ions at m/z 466 similar to thatsrown in Figure lE. The relative uniformity at the distribution of leuproljde through the cross sec:ions of sample 01 containing oleic acid isclearly illustraied (compare Figure 7E).
ard other negative ions produced from the Teflon substrate.Two different regions or. sample Al were analyzed in the
positive ion mode, and one region was analyzed in the negativeim mode. Three different regions were analyzed on sample 01,and one of these regions was also analyzed in the negative ionmode. TI-~e different regions on each device produced very similarresults. Images of live positive ions produced from sample Al
are illustrated in Figure 7; all of these images were acquired froma single region or. the cross section Four different ion imagesfrom sample 01 are presented in figure 8, and these images werealso a:::quired from one region on this sample.
Total seco~dary ion images oithe cross sections illustrated in
Figures 7A and 8A reveal the topographic features of the surfaceson a microscopic scale. The top regions of the images correspondto the polymer/substrate side, and the bottom regions are thepolymer/air interrace of the samples. The dark regions at theLOi! all" bottom are gaps between the cross sections and metaljaws of the cross section holder. Both images exhibit sunfaceroJghness approximately 2-4 /im in depth. This roughness is
probably the result of the freeze-fracturing technique used toprepare the cross sections. The images also indicate that thesample thickness is slightly different "or the two materials, wheresample Al is~2CO ,urn thick while sample 01 is 120 I'm thick.
The relatively uniform intensily distributions across these samples
indicate that the sample topography does not seriously effect ion
emission. In addition, the totai ion images suggest uniform
composition of the major constiwents (C, H, 0) along the top
monolayers of the cross sections. The total ion intensity in the
image of sample Al was 2.8 x 10" counts while the total intensity
in sample 01 was 3.6 x 10⁶ counts.
Images of the C"H70~ ions at m/z 59 (Figure 7B) are
diagnostic for the hydroxypropyl celiulose polymer even though
a fraction of the ions at this mass could be immonium-type ions
produced from arginine residues of the peptide. IS Since other
immonium-type ions rrom arginine (at m/z 87, 100, and 11218)
have very low intensities in this spectrum, immonium ions
probably make only 2 small contribution to the m/z 59 signal.
'TIle illlellsily distributions of (",R70' are uniform along the
surfaces of both samples and its intensity is a factor of'~10 n.igher
for sample AI.
The relative distribCltion ofleuprolide in the two cross sections
is revealed in the convolved ion images shown in Figure 7C- E
for sample Al and Figure 8B-D for sample 01. These images
have been convolved using a 3 x 3 pixel kernel at unit weightingfor each element. Immonium and immonium-type ions from the
Analytical Chemistry, Vol, 67, No. 21, November 1. 1995 3877
C-tenninal proline and arginine residues of sample Al areillustrated in Figure 7C. This image clearly shows a nonuniform
ion intensity distribution with a greater relative concentration of
the peptide at the polymerI air interface of the cross section, whichcorroborates the XPS results (Table 2). Nonuniform distributions
of other peptide peaks on the sample A1 cross section are revealed
in the protonated molecular ion image in Figure 7D and thesummed ion image shown in Figure 7E. Th:s latter image was
created by summing the images of the immonium ion for tyrosine
at mlz 136 with images of the w" (mlz 353) and w, (mlz 466)ions. The intensity distrihutions for each of these fragments were
similar, and hence, summing the signals produces a more intense
image, which better illustrates the distribution of the leuprolide.
Imaging low-mass fragment ions could piay a significant role inTOF-SIMS imaging oflarge peptides or proteins since these moremassive structures often have low molecular ion yields which
produce low contrast images. However, lower mass fragment ionsof peptides or proteins are normally produced at adequate
intensities for ion imaging, and these fragment ions can be used
to determine the surface distribution of parent molecules.Although the images clearly reveal the cross section of the
saople, we also observe ion signals arising from regions above
and below the actual sample. The total ion image of sample A1in Figure 7£ hest illustrates this off-sample signal. These ions
are most likely produced by inadvertent smearing of the samplesurface onto the sides of the cross-sectional holder during sample
mounting. The extent of this smearing is more noticeable in theimages of sample Al.
The uniformity ofleuprolide in the device formulated with oleic
acid is clearly shown in the convolved images in Figure 8B-D,where the more uniform distribution of the leuprolide molecular
and fragment ions is obvious. ln particular, the protonated
molecular ion image in Figure 8C shows almost uniform intensity
3878 Analytical Chemistry. Vol. 67. No. 21, November 1, 1995
along the cross section as do the sum of tyrosine immoniurn ionswith the W; and w, ions as illustrated in Figure 8D.
CONCLUSIONSMolecular ion microscopy provides a sensitive method fa:'
determining the distribution of organic molecuies in organic
matrices. The determination of the drug distribution along the
polymer device would he extremely difficult withoUl the molecular
visualization provided by this microscopic imaging technique. Ion
microscopy also dramatically demonstrates that leuprolide dis
solved in HPC, as represented in the cross-sectional surface, isclearly nonuniform and concentrates at the polymerI air interface.By contrast, images of leuprolide ions produced from polymer
containing oleic acid demonstrate more uniform cross-sectionaidistribution of the leuprolide. These ion microscopy results aresupported by XPS data, and the increased uniformity of leuproiide
is definitely related to the presence of oleic acid although the exactnature of the interaction of the acid with the mixture is not knO\>Vl1
at this time. However, possible explanations for the detection of
higher intensity and more uniform leuprolide peaks from the acidtreated polymer are the reduced surface free energy of leuprolide
in the acidic solid or an increased degree of solvation of the
peptide in the acidic matrix
ACKNOWLEDGMENTThe authors thank Dr. Kenneth Matuszak for suppling the FAB
mass spectrum of leuprolide.
Received for review May 8, 1995. Accepted July 27,1995.°
AC950439N
·3 Abstract published in Advaure ACS Abstracts. September 1. 1995.
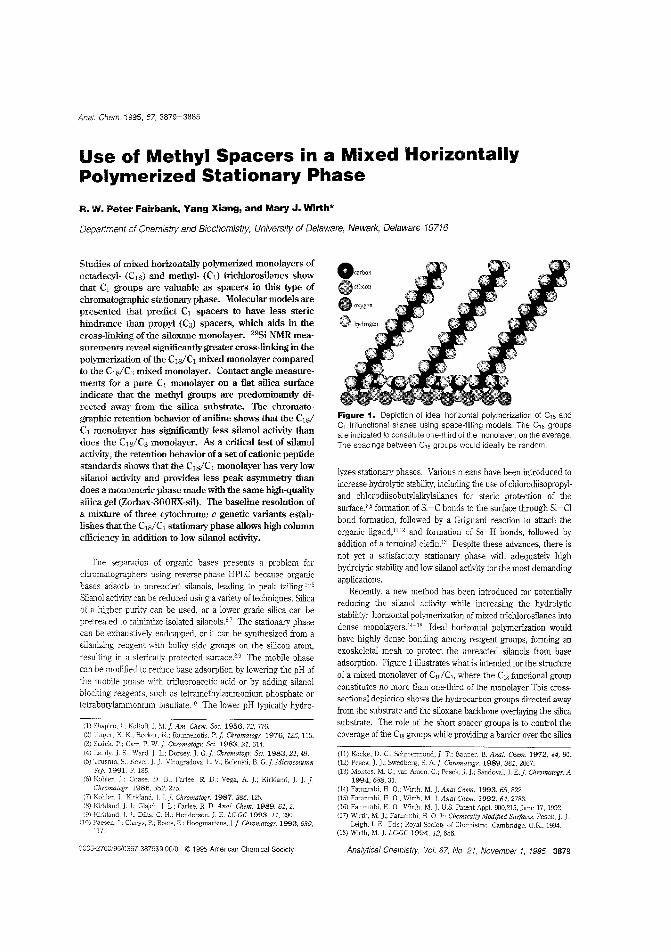
Anal. Chem. 1995, 67, 3879-3885
Use of Methyl Spacers in a Mixed HorizontallyPolymerized Stationary Phase
R. W. Peter Fairbank, Yang Xiang, and Mary J. Wirth*
Department of Chemistry' and Biochemistl}', University of Delaware, Newark, Delaware 19716
Studies of mixed horizontally polymerized monolayers ofoctadecyl- (C18) and methyl- (Cl) trichlorosilanes showthat C1 groups are valuable as spacers in this 1ype ofchromatographic stationary phase. Molecular models arepresented that predict C1 spacers to have less sterlehindrance than propyl (C.3) spacers, which aids in thecross-linking of the siloxane monolayer. 298i NMR measurements reveal significantly greater cross-linking in thepolymerization of the ClslC1 mixed monolayer comparedto the C1S/C:l mixed monolayer. Contact angle measurements for a pure C1 monolayer on a flat silica surfaceindicate that the methyl groups are predominantly directed away from the silica substrate. The chromatographic retention behavior of aniline shows that the C181C, monolayer has significantly less silanol activijy thandoes the C18/C3 monolayer. As a critical test of silanolactivijy, the retention behavior of a set of cationic peptidestandards shows that the ClslCl monolayer has very lowsilanol activijy and provides less peak asymmetry thandoes a monomeric phase made with the same high-qualilysilica gel (7..orbax-300RX-sil). The baseline resolution ofa mixture of three cytochrome c genetic variants establishes that the ClslC, stationary phase allows high columnefficiency in addition to low silanol activijy.
TIle separation of organic bases presents a problem forchromatographers using reverse-phase HPLC because organicbases adsorb -'0 unreacted silanols, leading to peak tailing. H
Silanol activity can be reduced using a variety of techniques. Silicaof a higher purity can be used, or a lower grade silica can bepretreated to minimize isolated silanols.',7 The stationary phasecan be exhausdvely endcapped, or it can be synthesized from asilanizing reagent with bulky side groups on the silicon atom,resulting in a sterically protected surfaceS ,9 The mobile phase
can be modified to reduce base adsorption by lowering the pH ofthe mobile phase with trifluoroacetic acid or by adding silanolblocking reagents, such as tetramethylammonium phosphate ortetrabutylammonium bisulfate IO The lower pH typically hydro-
(1) Shapiro, 1.; Koltoff, LAm. Chem. Soc. 1956, 72, 776.(2) Ungec K. K; Becker, P. j. Chromatogr. 1976, 125,115.(3) Sadek. P.: Ca:-r, P. W. I Chromatogr. Sci. 1983,21,314.(4) S.: '\Vard, J 1.; Dorsey.]. Sci. 1983,21,49.(5) S.; Kever, j. ].: Vinogradova, B. G.]. Microcolumn
Sep. 1991. 3,185(6) Kohler. Chase. D. B.; Farlee, R D.; Vega, A. ].; Kirkland, ]. ]. ].
Chromatogr. 1986, 352, 275.(7) Kohler, l: Kirkland. l J.] 125.(8) Kirkland, J. l: Glajch, l L.: Farlee, R. Chem. 1989,61,2.(9) Kirkland.]. j.: Dilts, C. I-L Henderson,]' E. LC-GC 1993, 11, 290
(10) Paesen,].: ClilCYS, P.; Raets, E.; Hoogmartens,].j. Chromatogr. 1993,630,
0003-2700/9510367-3879$9.00/0 © 1995 American Chemical Society
.carbon
OSllicon
Ooxyecn
Figure 1. Depiction of ideal horizontal polymerization at C'8 andC, trifunctional silanes using space-filling models. The C18 groupsare indicated to constitute one-third of the monolayer, on the average.The spacings between C18 groups would ideally be random
Iyzes stationary phases. Various means have been introduced toincrease hydrolytic stability, including the use of chlorodiisopropyland chlorodiisobutylalkylsilanes for steric protection of thesurface,8,' fonnation of Si-C bonds to the surface through Si-Clbond fonnation, followed by a Grignard reaction to attach theorganic ligand,']l2 and formation of Si-H bonds, followed byaddition of a terminal 01efin13 Despite these advances. there isnot yet a satisfactory stationary phase with adequately highhydrolytic stability and low silanol activity for the most demandingapplications,
Recently, a new method has been jntroduced for potentiallyreducing the silanol activity while Increasing the hydrolyticstability: horizontal polymerization of mixed trichlorosilanes intodense monolayers.14-l8 Ideal horizontal polymerization wouldhave highly dense bonding among reagent groups, fanning anexoskeletal mesh to protect the unreacted silanols from baseadsorption. Figure 1 illustrates what is intended for the structure
of a mixed monolayer of ClalC), where the C'8 functional groupconstitutes no more than one-third of the monolayer This crosssectional depiction shows the hydrocarbon groups directed awayfrom the substrate and the siloxane backbone overla)1ng the silicasubstrate. The role of the short spacer groups is to control thecoverage of the C'8 groups while providing a barrier over the silica
(11) Kocke, D. C.: Schmermund,]. T.; Banr:er, B. Anal. Chem. 1972, 44, 90.(12) Pesek, J. L Swedberg, S. A]. Chromatogr. 1989,361,2067.(13) Montes, M. C.; van Amen. C.; Pesek, J. J.; Si3.ndoval,]. E.]. Chromatogr. A
1994,688,31.(14) Fatunmbi, H. 0.; Wirth, M. J. AnalChem. 1993,65,822.(15) Fatuombi, H. 0.: Wirth, M.]. Anal.Chem. 1992,64,2783.(16) Fatunmbi, H. 0.: Wirth, M. J. U.S. Pateet Appl. 900,215. June 17, 1992.(17) Wirth, M. ].; Fatunmbi, H, O. In Chemically Modified Surfaces; Pesek, ]. J.,
Leigh, I. E., Eds.; Royal Society of Chemistry: Cambridge. U.K. 1994(18) Wirth, M. j. LC-GC 1994, 12, 656.
Analytical Chemistry, Vol. 67, No. 21, November 1, 1995 3879
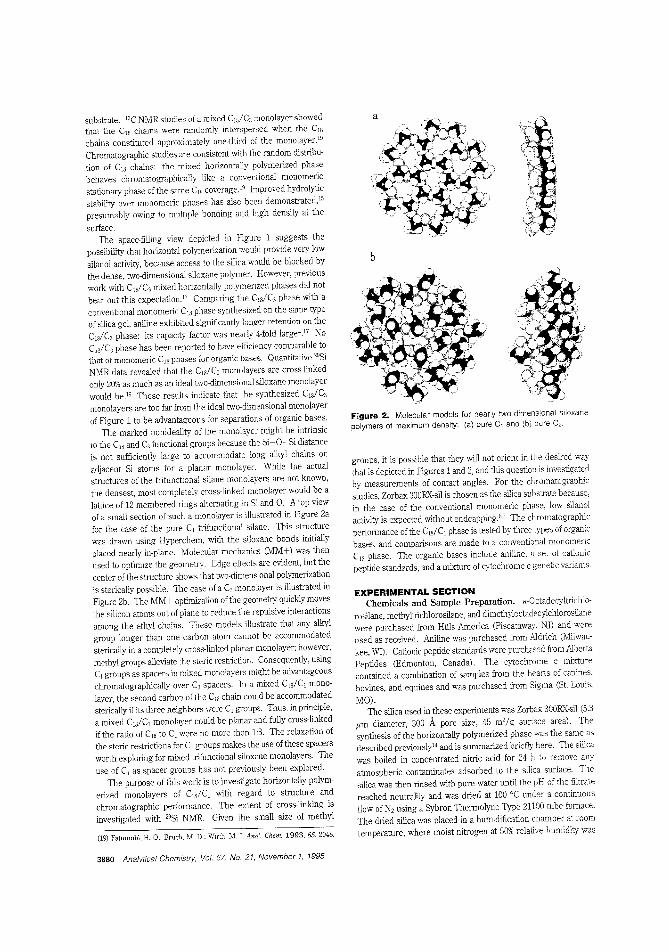
b
Figure 2. Molecular models for nearly two-dimensional siloxanepolymers of maximum density: (a) pure C, and (bi pure C,.
EXPERIMENTAL SECTIONChemicals and Sample Preparation_ n-Octadecyltrichlo-
rosilane, methyltrichlorosilane, and dimethyloctadecylchlorosilanewere purchased from Hiils America (Piscataway, NJ) and wereused as received. Aniline was purchased from Aldrich (Milwaukee, WI). Cationic peptide standards were purchased from AlbertaPeptides (Edmonton, Canada). The cytochrome c mixturecontained a combination of samples from the hearts of canines.bovines, and equines and was purchased from Sigma (St. Louis,
MO).The silica used in these experiments was Zorbax 300RX-sil (5.3
,urn diameter, 300 A pore size, 45 m'/g sur:ace area). Thesynthesis of the horizontally polymerized phase was the same asdescribed previously14 and is summarized briefly here. The silica
was boiled in concentrated nitric acid for 24 h to remove anv
atmospheric contaminates adsorbed to the silica surface. 111~silica was then rinsed with pure water until the pH of the filtratereached neutrality and was dried at 100 '( under a continuousflow of N, using a SybronTherrnolyne Type 21100 tube furnace.The dried silica was placed in a humidification chamber at roomtemperature, where moist nitrogen at 50% relative humidity was
groups, it is possible that they will not orient in the desired waythat is depicted in Figures 1 and 2, and this question is investigatedby measurements of contact angles. For the chromatographicstudies, Zorbax 300RX-sil is chosen as the silica substrate because,in the case of the conventional monomeric phase, low silanolactivity is expected without endcapping6 .7 The chromatographicperformance of the C1s1Cj phase is tested by three types of organicbases, and comparisons are made to a conventional monomericCIS phase. The organic bases include aniline, a sel of cationic
peptide standards, and a mixture of cytochrome c genetic variants.
substrate. BC NMR studies of a mixed C1S/C3 :nonolayer showedthat the CIS chains were randomly interspersed when the CISchains constituted approximately one-third of the monolayer19
Chromatographic studies are consistent with the random distribution of C18 chains: the mixed horizontally polymerized phasebehaves chromatographically like a conventional monomericstationary phase of the same C18 coverage. 19 Improved hydrolyticstability over monomeric phases has also been demonstrated 15presumably owing to multiple bonding and high density at the
surface.The space-filling view depicted in Figure 1 suggests the
possibility that horizontal polymerization would provide very low
silanol activity, because access to the silica would be blocked bythe dense, two-dimensional siloxane polymer. However, previouswork with C1s1C?, mixed horizontally polymerized phases did notbear out this expectation. 17 Comparing the (lS/C" phase with aconventional monomeric ClS phase synthesized on the same typeof silica gel, aniline exhibited signifcantly longer retention on theC1s1C3 phase: its capacity factor was nearly Hold larger.17 NoC18/C3 phase has been reported to have efficiency comparable tothat of monomeric C18 phases for organic bases. Quantitative 29Si
NMR data revealed that the (lS/(3 monolayers are cross-linkedonly 20% as much as an ideal two-dimensional siloxane monolayer
would be.l9 These results indicate that the synthesized C18/C3
monolayers are too far from the ideal two-dimensional monolayerof Figure 1 to be advantageous for separations of organic bases.
The marked nonideality of the monolayer might be intrinsicto the C18 and C" functional groups because the Si-O-Si distanceis not sufficiently large to accommodate long alkyl chains on
adjacent Si atoms for a planar monolayer. While the actualstructures of the trifunctional silane monolavers are not knownthe densest, most completely cross-linked m-onolayer would be ~lattice of 12 membered rings alternating in Si and O. A top viewof a small section of such a monolayer is illustrated in Figure 2afor the case of the pure C1 trifunctional silane. This structurewas drawn using Hyperchem, with the siloxane bonds initiallyplaced nearly in-plane. Molecular mechanics (MM+) was thenused to optimize the geometry. Edge effects are evident, but thecenter of the structure shows that two-dimensional polymerization
is sterically possible. The case of a C2 monolayer is illustrated inFigure 2b. The MM+ optimization of the geometry quickly movesthe silicon atoms out of plane to reduce the repulsive interactionsamong the ethyl chains. These models illustrate that any alkylgroup longer than one carbon atom cannot be accommodatedsterically in a completely cross-linked planar monolayer; however,methyl groups alleviate the steric restriction. Consequently, usingC1groups as spacers in mixed monolayers might be advantigeous
chromatographically over C3 spacers. In a mixed ClS/C1monolayer, the second carbon of the C18 chain could be accommodatedsterically if its three neighbors wcre C1groups. Thus, in principle,a mixed C18/Cj monolayer could be planar and fully cross-linkedif the ratio of C18 to C1were no more than 1:3. The relaxation ofthe steric restrictions for (1 groups makes the use of these spacersworth exploring for mixed tri.functional siloxane monolayers. The
use of C1 as spacer groups has not previously been explored.The purpose of this work is to investigate horizontally polym
erized monolayers of C1S/C1 with regard to structure andchromatographic performance. The extent of cross-linking isinvestigated with 29Si NMR. Given the small size of methyl
(19) Fatunmbi, H. 0.: Bruch, M. D.: Wlrth, M. J. And. Chern. 1993.65,2048.
3880 Analytical Chemistry. Vol. 67, No. 21, ,rvovember 1, 1995
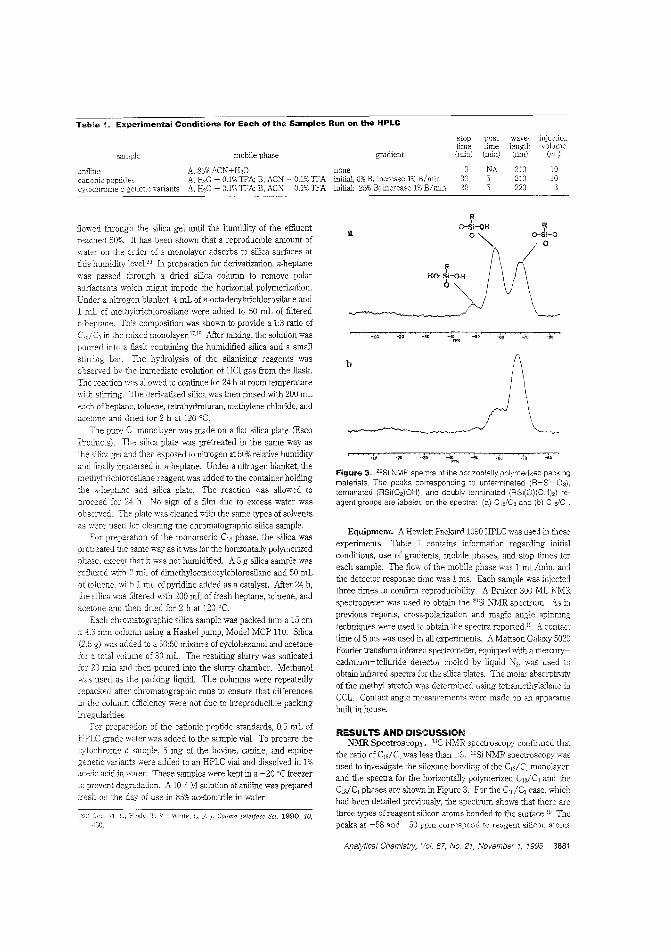
Table j. Experimental Conditions for Each of the Samples Run on the HPLC
mobile phasesample
aniline A, ~o'" f\'~1'-rrl2Ucationic peptides A,cytochrJme c genetic variants A,
gradient
TIeneE, ACN + 0.1% TFA initial, 0% B; increase 1% BirniE 3CB, ACN + 0.1% TFA initial: 25% B; increase Blmln 20
po~t
time(min)
NA55
wavelength(nm)
210210220
10103
flowed through the silica gel until the humidity of the effluentreached 50%. it has been shown that a reproducible amount ofwater on the order of a monolayer adsorbs to silica sunaces atthis humidity leveJ.2° In preparation for derivatization, n-hepUrnewas passed though a dried silica column to remove polarsurfacUrnts wh'ch might impede the horizontal polymerization.Under a nitrogen blanket, 4 mL of n-octadecyltrichlorosilane and1 mL of methyltrichlorosiiane were added to 50 mL of filteredn-hepUrne. This composition was shown to provide a 1:3 ratio ofeiS/e:; in the mixed monolayer,17.19 After mixing, the solution was
poured into a flask containing the humidified silica and a smallstirring bar. The hydrolysis of the silanizing reagents wasobserved by the immediate evolution of HCl gas from the flask.The reaction was allowed to continue for 24 h at room temperaturewith sti:Ting. The denvatized silica was then rinsed with 200 mLeach of hepUrne, toluene, tetrahydrofuran, methylene chlOlide, andacetone and dried for 2 h at 120°C.
The pure C monolayer wa, made on a flat silica plate (E,coProducts). The silica plate was pretreated in the same way asthe silica gel and then exposed to nitrogen at 50% relative humidityand iindly immersed in n-heptane. Under a nitrogen blanket, themethyltrichlorosilrne reagent was added to the container holdingthe n-hepume and silica plate. The reaction was allowed toproceed for 24 h. No sign of a film due to excess water wasobs,erved. The plate was cleaned with the same types of solventsas were used for cleaning the chromatographic silica sample.
For preparation of the monomeric C18 phase, the silica waspretreated the same way as it was for the horizontally polymerizedphase, except that it was not humidified. A 5 g silica sample wasrefluxed with 2 mL of dimethyloctadecylchlorosilane and 50 mLof toluene, with 1 mL of pyridine added as a catalyst. After 24 h,the silica was filtered with 200 mL of fresh heptane, toluene, andacetone and then dried for 2 h at 120°C.
Each chromatographic ,ilica sample was packed into a 15 cmx mm column using a Haskel pump, Model MCP 110. Silica(2.5 g) was added to a 50:50 mixture of cyclohexanol and acetonefor a total volume of 30 mL. The resulting slurry was sonicatedfor 20 min and then poured into the slurry chamber. Methanolwas used as the packing liquid. The columns were repeatedlyrepacked after chromatographic runs to ensure that differencesin lhe column efficiency were not due to irreproducible packingirregularities_
For preparation of the cationic peptide standards, 0.5 mL ofHPLC grade waer was added to the sample vial. To prepare thecytochrome c sample, 5 mg of the bovine, canine, and equinegenetic variants were added to an HPLC vial and dissolved in 1%acetic acid in water. These samples were kept in a - 20°C freezer
prevent degradation. A 10-4 M solution of aniline was preparedfresh on the day of use in 85% acetonitrile in water.
Figure 3. 29Si NMR spectra of the horizontally polymerIzed packingmaterials. The peaks corresponding to unterminated (R-S·,-031.terminated (RSi(02)OH), and doubly terminated (RSi(O)(OH),) reagent groups are labeleel on the spectra: (a) C,alC3 and (b) C,alC,.
RESULTS AND DISCUSSIONNMR Spectroscopy. l3C NMR spectroscopy conficned that
the ratio of C18/ C1was less than 1:3. 295i NMR spectroscopy wasused to investigate the siloxane bonding of the C1,\/C1monolayer.and the spectra for the horizontally polymetized C13/C, and theC18/C1 phases are shown in Figure 3. For the C18/C3 case, whichhad been detailed previously, the spectrum shows that there arethree types of reagent silicon atoms bonded to the surface.19 Thepeaks at -58 and -50 ppm correspond :0 reagent silicon atoms
Equipment. A Hewlett Packard 1090 HPLC was used in theseexperiments. Table 1 contains information regarding initialconditions, use of gradients, mobile phases, and stop times foreach sample. The flow of the mobile phase was 1 mUmin, andthe detector response time was 1 ms. Each sample was injectedthree times to confirm reproducibility. A Bruker 300 ML NMRspectrometer was used to obtain the 2<'Si NMR spectrum. As inprevious reports, cross-polarization and magic angle spinningtechniques were used to obtain the spectra reported." A contacttime of 5 ms was used in all experiments. A Matson Galaxy 5020Fourier transform infrared spectrometer, equipped with a mercurycadmium-telluride detector cooled by liquid N2, was used toobtain infrared spectra for the silica plates. The molar absorptivityof the methyl stretch was determined using tetramethylsilane inCCL. Contact angle measurements were made on an apparatusbuilt in-house.
",Vhite, L. R]. Coltoid intciface Sci. 1990,40,;20) Gee,
450.
Analytical Chemistry, \/01.67, No. 21, November 1, 1995 3881
The terms y" and Yi, are the interfacial cens'ons of the sUrfacevapor and liquid-vapor interfaces. In general, the contact angleis large (>90") for a hydrophobic surface and small (-00) for a
hydrophilic surface.
For the flat silica plate, infrared spectroscopy revealed acoverage of 11 ± 2pmol/m2 of Cl groups, which is in agreement
with the model of Figure 2a that predicts 10 pmol/m'- The contact
ha;ing one tem1inal hydroxy group and two tenninal hydroxygroups, respectively, Both of these peal(S are considered to be
due to defects in the monolayer because these groups terminaterather than propagate the two-dimensional polymer. The peakat -68 ppm is due to reagent silicon atoms having no terminalhydroxy groups. This type of silicon atom would be the only type
in the spectrum if there were ideal two-dimensional polymerization, "WiLh all silicon atoms attached through oxygens to other
silicon atoms. Previous work revealed that the C18/C3 monolayer
is stmctured as linear polymer chains with most reagent siliconatoms attached to a tenninal hydroxy group, and only 20% of the
reagent silicon atoms cross-linked to reagent silicon atoms in
adjacent chains. 19 Since these terminal hydroxy sites amount to
defects, it is likely that aniline cailed when eluted from this phase,because the silica substrate is exposed between the polymer
chains.For the C 8/C, case, the -68 ppm peak, due to the untermi
nated reagent silicon atoms, is much larger than either of the other
DNO peaks. Qualitatively, this is consistent with the idea that C,spacers allow two-dimensional polymerization. Quantitatively, onemust account for occasional bonding of the reagent silicon atoms
to the silica substrate, which would be spectrally indistinguishable.
Analogous to the CIslC, studY,l9 the 29Si NMR spectmm of theunderivatized silica gel was 0 btained to account for the numberof reacted surface silanol groups. Quanti'ative results wereobtained as detailed before,19 where the buildup and decay of the
magnetization from the cross-polarization was measured for each
type of silicon atom. The primary source of error was the slow
relaxation of the Si atoms of the bare silica gel. The results
revealed that no more than 15% of the peak intensity at -68 ppmis due to attachment to the surface. Accounting for the smallintensity of the peak at -60 ppm, at least 60% of the reagent silicon
atoms are cross-linked, which is three times higher than for the
C,,/el case. The C18/C, monolayer thus approaches the two
dimensional monolayer more closely than does the CIslC" monolayer. This agrees with the predictions from the molecular modelsthat the C, spacers allow fonnation of a d'enser barrier monolayer
over the silica substrate.Contact Angle Measurements. 111e C1 spacers allow for
extensive cross-linking, but their sizes may not be large enough
to force them to orient away from the substrate. The orientations
of the methyl groups in the ClslC, monolayer are important for
assessing its prospects in chromatography, and these orientations
can be inferred from measurements of contact angles. The
hydrophobicity of the surface is expected to be higher if themethyl groups are oriented away from the substrate. Surfacehydrophobicity is fundamentally related to the interfacial tension
between the surface and the water droplet, y~:- The contact angle,e, between a surface and a drop of water is related to y,1 throughYoung's equation,
Ylv cos e Ysv - }lsl (1)
angle was measured to be 77° ± 1°, which is in agreement Vv1.tha pre;ious report." By way of comparison, for methanethiol on
gold, it is known that the methyl groups are oriented away from
the substrate. because a gold-sulfur bond is formed. The contactangle for methanethiol on gold was reponed to be 78",22 which isvirtually the same as that for the C, monolayer on silica. The
methyl coverages are comparable for the two surfaces: therefore,the similarity in contact angles suggests that the methyl groups
are oriented away from the substrate for the silica case. Contact
angles for C'8 were reported to be 110" for both octadecyltrichloro,ilane on silica" and octadecanethiol on gold." The C K
monolayer is expected to have a higher contact angle because
the chain lengths are longer. The contact angle data are thus
consistent with the methyl groups being oriented away from the
substrate for C, on silica.As a check, it would be valuable to know what the contact
angle would be if the methyl groups were directed toward thesubstrate and the sHoxane backbone was in contact with the water
droplet. To approximate this case, a clean, bare silica place(contact angle, 0') was heated at 600 'C for 2 h. This is sufficientto dehydrate 70% of the suliace SiOH groups, fanning siloxanc
(Si-O-S1) Iinkages,23 lea;ing an SiOH concentration of 1.5/1mol/
m'. This is lower than the estimated2.5pmol/m' SiOH concentration in the pure Cj monolayer, based on 25% OH gra1lps in a
10 pmol/m' monolayer. However, the bare siloxane surface wasmeasured to have a contact angle of only 21 0 ± 1', which is
significantly more hydrophilic than the surface coated witl1 the
CI monolayer. The contact angle data thus support strongly the
notion that the methyl groups are predominantly directed away
from the substrate, and this is promising for the use of C, spacersin chromatographic stationary phases.
It may at first seem surprising that the methyl groups Client
away from the substrate, because methyl groups are expected tobe too short to self-assemble at room temperaillre, based on
investigations of longer chain lengths." Rather than being due
to a cooperative affect, such as self-assembly, the orientation Islikely due to orientation of the reactants at the heptane/waterinterface during the reaction. The heptane/water interface is
created by the thin layer of water adsorbed to the silica surfaceupon humidification, and this water layer is in contact wiIh theheptane that is used as the solvent for the hor:zontal polyme1i
zation. The methyl groups would tend to orient toward the
heptane at this interface, resulting in an orien ted monolayerwithout requiring the cooperati;ity of alkyl chains that is involved
in self-assemblyChromatography, While the structural features of the Cj
C1 monolayer, as revealed by the NMR and contact anglemeasurements, portend a favorable chromatographic phase, the
chromatographic study of hase retention is required as a final test.For each chromatographic measurement, the C:.s/C1 phase wascompared with a monomeric phase prepared on the same silica
gel. The monomeric C'K phase synthesized for this work onZorbax-300RX-sil was detennined by microanalysis to have a C,s
coverage of 3.3 ± 0.lpmol/m2, which is the same as the coverage
for the commercial phase. However, this monomeric phase is
not the same as the commercial product. Zorbax-RX-C18, because
(21) Wassennan, S. R; Tao, Y-T.: Vilhitesides, G. M.(22) Bain, C. D.: Troughton, E. B.; Tao, Y.-T.: Evan,].; w m"'S'Ge;" C>. "L
R G.]. Am. Chern. Soc. 1989,111,321.(23) Zhuravlev, 1. T. Langmuir 1987, 3, 316.(24) Brzoska,]. E.; Shahidzadeh, N.; Rondelcz, F. Nature 1.992,360. 7L9.
3882 Analytical Chemistry, Vol. 67, No. 21, November 1, 1995
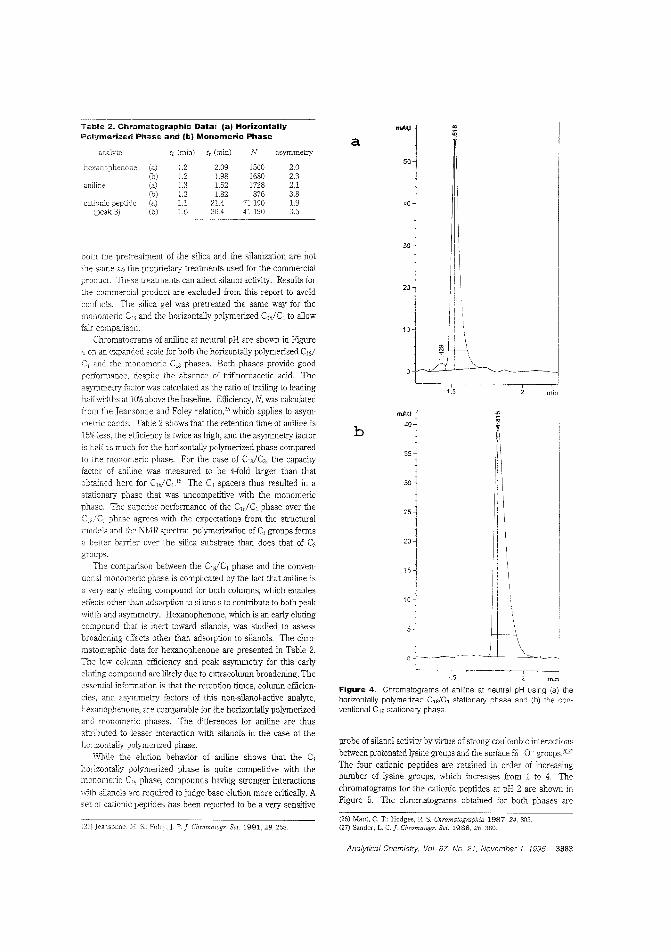
Figure 4. Chromatograms of aniline at neutral pH uSing (a) thehorizontally polymerized C1sJ'C 1 stationary phase and (b) the conventional C,8 stationary phase.
probe of silanol activity by virtue of strong coulombie interactionsbetween protonated lysine groups and the surfaoe 5i-0- groupS.2627
The four cationic peptides are retained in order of increasingnumber of lysine groups, whioh increases from 1 to 4. The
chromatograms for the cationic peptides at pH 2 are shown inFigure 5. The chromatograms obtained for bot.lJ. phases are
Table 2. Chromatographic Data: (a) HorizontallyPo~ymerizedPhase and (b) Monomeric Phase
ar.ulytC: tu(mh) if (:l1in) N asymmetry
hcxanophenODe (a) 1.2 2.09 1500 20(b) 1.2 1.98 1680 2.3
anlline (a) 1.3 1.52 1728 2.1(b) 1.3 1.82 876 3.8
cationic (a) 1.1 21.4 71190 1.9(peak (t) 1.6 26.4 41190 3.5
the pretreatment of the silica and the silanization are not
the same as the proprietary treatments used for the commercialproduct. These treatments can affect silanol activity. Results forthe commercial product are exeluded from this report to avoid
conflicts. The silica gel was pretreated the same way for the
monomeric c., and the horizontally polymerized ClsiCI to allowfair comparison.
Chromatograms of aniline at neutral pH are shovm in Figure
" on an expanded scaie for both the horizontaily polymerized C,sIC, ane.. the monomeric C18 phases. Both phases provide goodperfonnance, despite the absence of trifluoroacetic acid. Theasymmetry factor was calculated as the ratio of trailing to leadinghalicwidths at 10% above the baseline. Efficiency, N, was calculatedfrom the Jeansonne and Foley relation,2s which applies to asymmetric bands. Tabie 2 shows that the retention time of aniline is
15% less> the efficiency is twice as high, and the asymmetry factoris half as much for the horizontally polymerized phase compared
to the monomeric phase. For the case of CIslC" the capacityfactor of aniline was measured to be 4-fold larger than thatob:ained here for C,slC,I5 The C" spacers thus resulted in astationary phase that was uncompetitive with the monomericphase. n,e superior performance of the CldC, phase over theC,dC, phasc agrees with the expectations from the s1ructuralmodels and the NMR spectra: polymerization of C, groups forms
better barrier over the silica substrate than does that of C3
groups.
The comparison between the C,sIC, phase and the conventional monomeric phase is complicated by the fact that aniline is
a vely early eluting compound for beth columns, which enables
effects other than adsorption to silanols to contribute to both peal'width and asymmetry. Hexanophenone, which is an early elutingcompound that is inert toward silanols, was studied to assessbroadening effects other thar, adsorption to silanols. The chromatographic data for hexanophenone are presented in Table 2.The lew coiumn efficiency and peak asymmetry for this earlyeluting compound arc likely due to extracoiumn broadening. Theessential information is that the retention times, column efficien"
cies, and asymmetry factors of this non-silanol-active analyte.hexanophenone, are comparable for the horizontally polymerizedand monomeric phases. The differences for aniline are thusatt.-ibuted to iesser interaction vl'ith silanols in the case of thebo:izo:1taily polymerized phase.
Whiie the elution behavior of aniline shows that the C,
ho:izo:Jtaliy polymerized phase is Quite competitive with themonomeric phase, compounds having stronger interactions
with silanols are required to judge base elution more critically. Aset of cationic peptides has been reported to be a very sensitive
S_; Foley,]. P.]. Chromat'Jgr. Sci. 1991,29, 258.(26) Mant. C. T.;(27) Sander, L. c.].
"1.5
-\
1987.24.805.26, 380
min
Analytical Chemistry, Vol. 67, No. 21. November 1 1995 3883
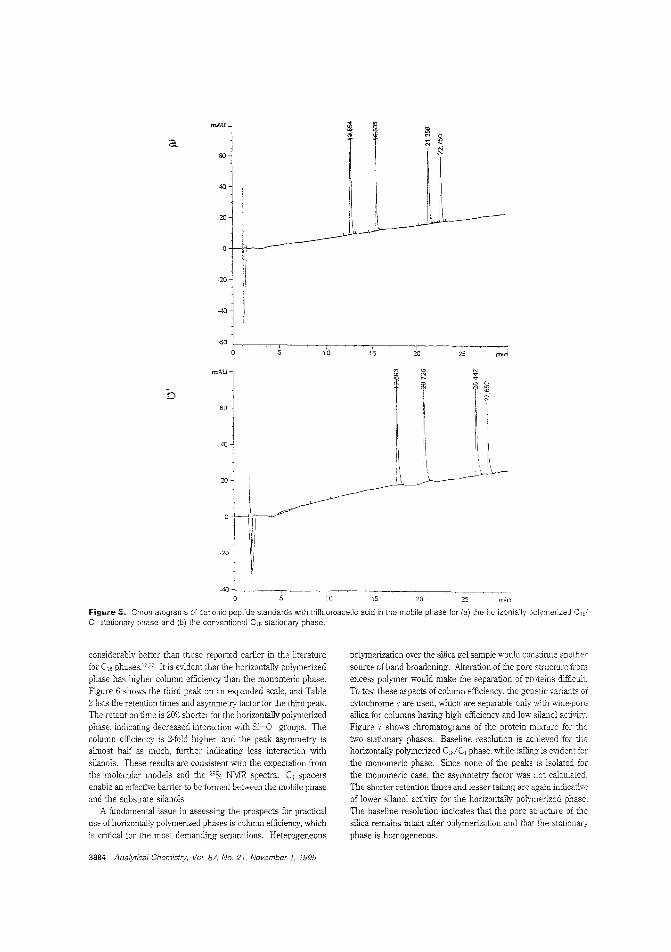
mAU ~ !lla N ~
60 i'1
40
2()
-20~
~j-60 ~
0
b-Ul
60 ~
-1"U
OJ r' I:]1
0
i Im;~10 15 2() 25
~ ~ Nm N :j:N
1~ N
I ~~ \
Ii I, "II [\ I'
" :'1 II
!\,I '\I' I, ,
,
figure 5. Chromatograms of cationic peptide standards with trlfluoroacetic acid in the mobile phase for (a) the horizontally polymerized CdC, stationary phase and Ib) the conventional C18 stationary phase.
considerably better than those reported earlier in the literaturefor C" phases_'6.27 It is evident that the horizontal1y polymerized
phase has higher column efficiency than the monomeric phase.Figure 6 shows the third peak on an expanded scale, and Table2 lists the retention times and asymmetry factor for the third peak.The retention time is 20% shorter for the horizontally polymerizedphase, indicating decreased interaction with Si-O- groups. Thecolumn efficiency is 2-fold higher. and the peak asymmetry isalmost half as much, further indicating less interaction withsilanols. These results are consistent with the expectation fromthe molecular models and the 29Si NMR spectra: C, spacersenable an effective barrier to be formed belween the mobile phase
and the substrate silanols.A fundamental issue in assessing the prospects for practical
use of horizontally polymerized phases is colul'm efficiency, which
is critical for the most demanding separations. Heterogeneous
polymerization over the silica gel sample would constitute anothersource of band broadening. Alteration of the pore structure fromexcess polymer would make the separation of proteins difficult.To test these aspects of column efficiency, the genelic variants ofcytochrome c are used, which are separable only with wide-poresilica for colunms having higb efficiency and low silanol acti'ity.Figure 7 shows chromatograms of the protein mixture for thetwo stationary phases. Baseline resolution is achieved for thehorizontally polymerized C18/C1 phase, while tailing is evident for
the monomeric phase. Since none of the peaks is isolated forthe monomeric case, the asymmetry factor was not calculated.TIle shorter retention times and lesser tailing are again indicative
of lower silanol activity for the horizontally polymerized phase.The baseline resolution indicates that the pore structure of thesilica remains intact after polymerization and that the stationary
phase is homogeneous.
3884 Analytical Chemistry, Vol. 67. No. 21. November 1, 1995
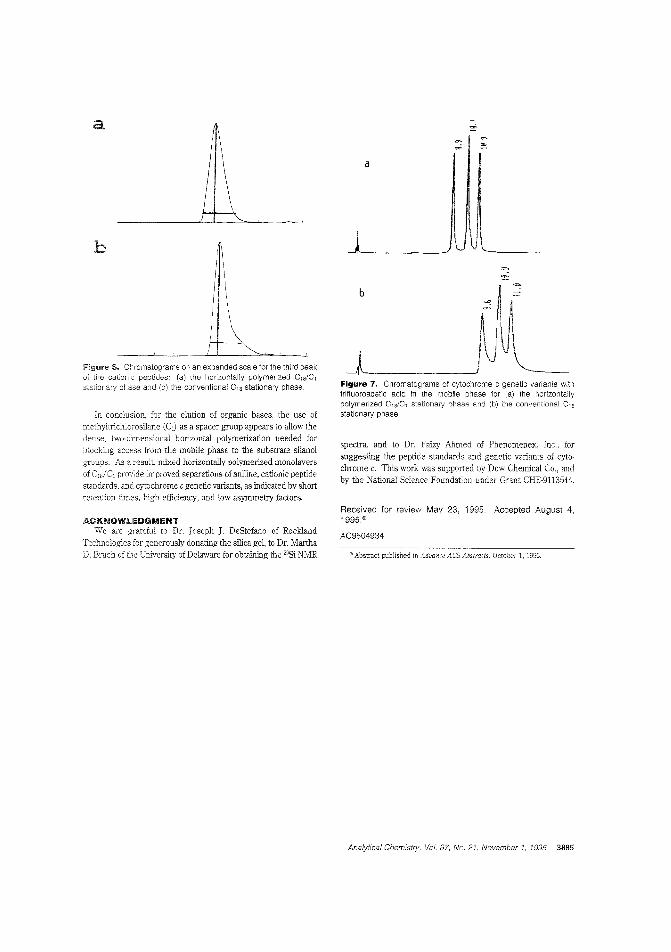
a
spectra, and to Dr. Faizy Ahmed of Phenomenex, Inc., forsuggesting the peptide standards and genetic variants of cytochrome c. This work was supported by Dow Chemical Co., andby the National Science Foundation under Grant CHE-9113544.
Figure 7. Chromatograms of cyiochrolle c genetic varianls withtrifluoroacetlc acid in the nobila phase for (a) the horizontallypolymerized C1S./C1 stationary phase and (b) the conventional C18
stationary phase,
J_Nb
Figure 6. Chromatograms or an expanded scale for the third peak01 the catonic peptides: (a) the horzontally polymerized C,dC,stationary phase and (b) the conventional C18 stationary phase.
a _
In conclusion, for the elution of organic bases, the use ofmethyltrichlorosilane (e,i as a spacer group appears to allow thedense, two-dimensional horizontal polymerization needed forblocking access from the mobile phase to the substrate silanolgroups, As a result, mixed horizontally polymerized monolayersof C,slC, provide improved separations of aniline, cationic peptidestandards, and cytochrome c genetic variants, as indicated by shortretention times, bigh efficiency, and low asymmetry factors.
ACKNOWLEDGMENTWe are grateful to Dr. Joseph J DeStefano of Rockland
Technologies for g:enerously donating: the silica g:el, to Dr. MarthaD. Bruch of the University of Delaware for obtaining the 29S1 NMR
Received for review May 23, 1995. Accepted August 4,1995."
AC9504934
o Abstract published in Advance ACS Abstracts, October 1, 1995.
Analytical Chemistry, Vol. 67, No. 21, November 1, 1995 3885
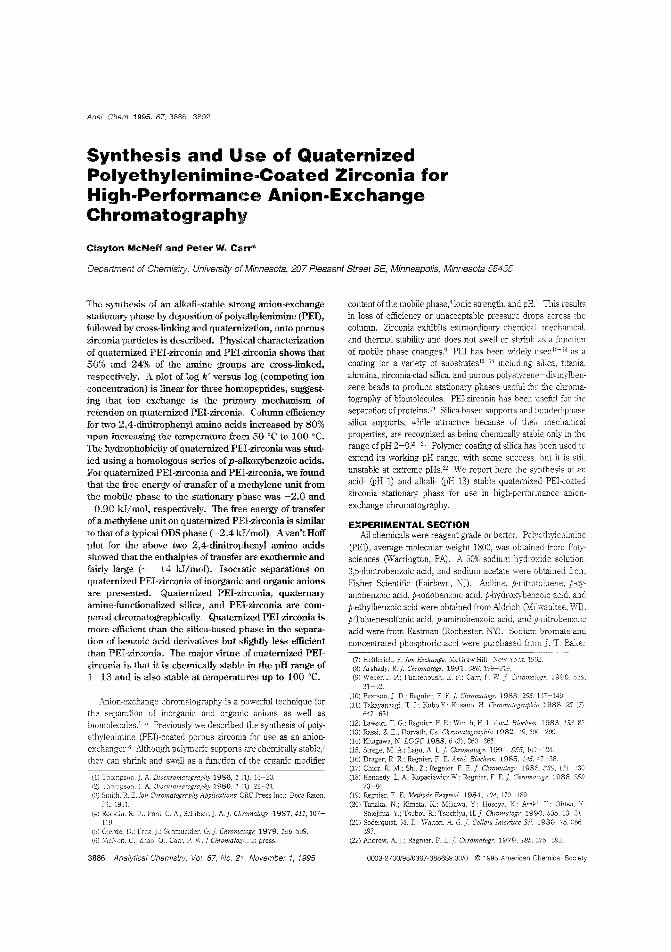
Anal. Chern. 1995, 67,3886-3892
Synthesis and Use of QuaternizedPolyethylenimine-Coated Zirconia forHigh-Performance Anion-ExchangeChromatography
Clayton McNeff and Peter W. CalT*
Department of Chemistry, University of Minnesota, 207 Pleasant Street SE, Minneapolis, Minnesota 55455
1990,
1'.: Ohtsu, Y
1990.535.Sc; 1980. 75.386-
The synthesis of an alkali-stahle strong anion-exchangestationary phase by deposition ofpolyethylenimine (PEl),followed by cross-linking and quaternization, onto porouszirconia particles is described. Physical characterizationof quatemized PEl-zirconia and PEl-zirconia shows that50% and 24% of the amine groups are cross-linked,respectively. A plot of log k' versus log (competing ionconcentration) is linear for three homopeptides, suggesting that ion exchange is the primary mechanism ofretention on quatemized PEl-zirconia, Column efficiencyfor two 2,4-dinitrophenyl amino acids increased by 80%upon increasing the temperature from 50 'C to 100 'C.The hydrophobicity ofquatemized PEl-zirconia was studied using a homologous series ofp-alkoxybenzoic acids.For quatemized PEl-zirconia and PEl-zirconia, we foundthat the free energy of transfer of a methylene unit fromthe mobile phase to the stationary phase was -2.0 and-0.90 kllmol, respectively. The free energy of transferof a methylene unit on quatemized PEl-zirconia is similarto that of a typical ODS phase (-2.4 kl/mol). Avan't Hoffplot for the above two 2,4-dinitrophenyl amino acidsshowed that the enthalpies of transfer are exothennic andfairly large (~ -14 kl/mol). Isocratic separations onquatemized PEl-zirconia of inorganic and organic anionsare presented. Quatenrized PEl-zirconia, quaternaryamine-fullctionalized silica, and PEl-zirconia are compared chromatographically. Quatemized PEl-zirconia ismore efficient than the silica-based phase in the separation of benzoic acid derivatives but sligbtly less efficientthan PEl-zirconia. The major virtue of quatemized PEIzirconia is that it is chemically stable in the pH ranl:(e of1-13 and is also stable at temperatures up to 100°C.
Anion-exchange chromatography is a powerful technique forthe separation of inorganic and organic anions as well asbiomolecules. H Previously we described the synthesis of polyethylenimine (PED-coated porous zirconia for use as an anionexchanger.' Although polymeric supports are chemically stable,'they can shrink and swell as a function of the organic modifier
(1) Thompson.]. A. Biochromatography 1986, 1 (1),16-20.(2) Thompson.]. A BiochroJJlatography 1986, 1 22-31.(3) Smith, R. E. Ion Chromatography Applications; eRe Press Inc.: Boca Raton,
FL, 1951.(4) Rocklin. R. D.; Poh]' C. A.; Schibjer.]. AI Ch70matogr. 1987,411,107
119.(:)) Gjerde, D.; Fritz, j.; Schmuckler. G.]. 1979,186,509.(6) c.; Zhao, Q.: Carr, P. "1J,,'. ] Chromatogr., press.
3886 Analytical Chemistry, Vol. 67, No. 21, November 1, 1995
content of the mobile phase,' ionic strength, and pH.' This resultsin loss of efficiency or unacceptable pressure drops across thecolumn. Zirconia exhibits extraordinary chemical. mechanical.and thermal stability and does not swell or shrink as a functionof mobile phase changes9 PEl has been widely used lll- l1 as acoating for a variety of substrates l5-18 including silica. titania.alumina, zirconia-clad silica, and porous polystyrene-divinylbenzene beads to produce stationary phases useful for the chromatography of biomolecules. PEl-zirconia has been useful for theseparation of proteins. 19 Silica-based supports and bonded-phasesilica supports, while attractive because of their mechanicalproperties, are recognized as being chemically stable only in therange of pH 2-9.'0-21 Polymer coating of silica has been used toextend its working pH range, with some success, but it is stillunstable at extreme pHs." We report here the synthesis of anacid- (pH 1) and alkali- (pH 13) stable quatemized PEl-coatedzirconia stationary phase for use in high-performance anionexchange chromatography.
EXPERIMENTAL SECTIONAll chemicals were reagent grade or better. Pclyethylenimine
(PED, average molecular weight 1800, was obtained from Polysciences (Warrington, PAl. A 50% sodium hydroxide solution.3,5-dinitrobenzoic acid, and sodium acetate were obtained fromFisher Scientific (Fairlawn, NJ). Aniline, p-nitrotoluene, p-cyanobenzoic acid, p-iodobenzoic acid, p-hydroxybenzoic acid. andp-ethylbenzoic acid were obtained from Aldrich (J\;lilwaukee, W1).
p-Toluenesulfonic acid, p-aminobenzoic acid, and p-nitrobenzoicacid were from Eastman (Rochester, NY). Sodium bromate andconcentrated phosphoric acid were purchased from J. T. Baker
(7) Helfferich, F. loti Exchange; ?v1cGraw-Hill: Ne\''' York,(8) Acshady. Rj. 1991. 586. 199-219.(9) Weber,T. P.; E. F.; Carr, P. W.].
31-52.(10) Pearson,]. D.; Regnier, F. E,]. 1983.255.137-149(11) Takayanaagi, T. L; Kubo,y': Kusano. H. CI"mn,'loirrai,Jjla 1988. 25
647-65l.(12) Lawson, T. G.; F. E.;Wenth, H. LAnal. Biochem 1983.133,(13) Rassi. Z. E.; es. 1982, 19,290--299.(14) Kitagawa, N. LC·GC 1988. 6 (3),(15) Strege, M. A.; ugu, A. 1991, 555, 109-124.(16) Drager, R. R.; Regnier, F. Anal. 1985, 145,(17) Chicz. R. M.; Shi, Z.; F. E. I Chro!natogr. 1986.339,(18) Kennedy. L A.; K01Jaciewicz,',V Regnier, F. E.]. Chromf1!ogr. 1986,
73-84.(19) Regnier, F. E. Methods Enzymol. 1984,104,170-189.(20) Tanaka, N.; Kirnata, K; Mikawa. Y: Hosoya, K.:
Shiojima. Y.; Tsuboi, R.; Tsuchi:ya,(21) Soderquist. M. E.; Walton, A G.].
397,(22) Andrew, A.].; Regnier. F. E. J. Chromatogr. 1979. 185. 375-392.
0003-2700/95/0367-3886$9.0010 © 1995 American Chemical Society
Table 1. Chemical Characterization of Supports
a Micromoles of nitrogen per square meter on the byelemental analysis. " Micrornoles of nitrogen per square on thezirconia by picric acid assay. C Micromoles of carbon per square meteron the scpport by elemental analysis. d Micro:noles of hydrogensquare meter on the support by elemental analysis. (" M!cromole~PEl per square meter on the zirco~iaby elemeJ.~ analYSIS /assu!TIlJ.g42 nitrogens per PEl molecule).) Carbon to mtrogen mOle ratIO byelemental analysis.
RESULTS AND DISCUSSION
Stationary Phase Characterizations. Quaternized PEI
zirconia, PEI-zirconia,6 and a commercial silica-based quaternary
amine-functionalized phase were characterized by elemental
analysis and by the picric acid assay." The picric acid assay issensitive to nonionized primary, secondary, and tertiary amines.
Bare zirconia was also subjected to the picric acid assay to ensurethat interactions vvith bare zirconia sites would not bias test results.
The results are given in Tahle 1. Bare zirconia has an ion
exchange capacity of 0.26 I'mollm2 by the picric acid assay.
According to the results of the elemental analysis, the PEl loadingsof both the quaternized PEl-zirconia and PEl-zirconia are verysimilar: 13.0 and n.o I'mollm2 of nitrogen, respectively. The
heated at 65°C in an oil bath overnight. The amine groups on
be stationary phase were quaternized the next day by addition
of 6 mL of iodomethane and heated at 65 'C for an additional 6 h.
The coated and cross-linked particles were collected on a sintered
glass funnel.
Washing Procedure for Quatemized PEl-Zirconia Par
ticles. The quatemized PEl-zirconia particles were washed in
acid and base solutions. First, the particles were suspended in50 mL of 0.5 M hydrochloric acid and sonicated for 10 min. 1l1e
particles were then allowed to stand for 4 h. The particles were
collected on a sintered glass funnel and washed with 50 mL of
0.5 M hydrochloric acid, 100 mLof water, and 100 mL of methanol.
The ahove procedure was repeated using 0.5 M sodium hydroxideinstead of 0.5 M hydrochloric acid. The particles were collected,
washed as above, dried at 120 'c at atmospheric pressure for 6h, and stored in a vacuum desiccator.
Physical Characterization of Stationary Phases. The PEl·
zirconia and quatemized PEI~zirconiaphases were characterized
hy elemental analysis (C, H, and N) and small-molecule ionexchange capacity (lEC). The elemental composition of the
coatings was determined by lVI-H-W laboratories (phoenix, AI!.The lon-exchange capacity was determined by a small-molecule
binding assay as previously described6
3.214.52
12.9
4.687.24
D.26
(iN ratiofPEl'
0.3100.260
no1.44
elementalC
86.211336.3
Elemental J\nalysiscoverage
31.550.318.5
Elemental 1\.nalysis versus IPCcoverage
phase
QPEI-lr02PEl-lrO,silica-basedbare lr02
phase
QPEI-lr02PEI,ZrO,silica-based
(Phillipsburg, N], Sodium nitrite, benzoic acid, and sodium
nitrate were from Mallinckrodt (St. Louis, MO). The quaternaryamine-functionalized strong anion-exchange silica-based stationary
phase was produced by Macherey-Nagel (DUren, Germany) and
obtained from Phenomonex (Torrance, CA).
PJI chromatograms were collected on a Hewlett-Packard 1090
(palo Alto, CAl chromatograph with a photodiode array detector
(PDA) and a Hewlett-Packard ChemStation for data collection.
The all,ali stability study was done using an Altex pump, a Hitachi:vIodell00-01O UV spectrophotometric detector, an Alltech pres
sure gauge (Deerfield. IL), a'ld a Rheodyne 7125 injector valve
equipped'1-ith a 10 ,uL fixed sample loop. The acid stability study
was done using the Altex pump. All zirconia-based phases werepacked into either 5 em x 4.6 mm i,d. or 15 cm x 4.6 mm i.d.
stainless steel cobmns by the stirred upward slurry method at
5000 PSI in 2-1JrOpanol. The silica-hased phase was packed into
5 CI:1 x 4.6 mm i.d. stainless steel column at 4000 PSI in2-propanol. 1Nater was obtained from a Barnstead Nano-Pure
system with an "organic-free" final cartridge and boiled to remove
dissolved carbon dioxide. loJl buffer solutions were filtered using
lVIillipore (type HA) 0.45-l'm membrane filters.
The dead volume marker used for all chromatographic
investigations was the negative peak ohtained upon injection of
Dure water. The dead volume was checked for each mohile phase
~sed and was found to devia:e less than 3% over the course of
this work.The PEl-coated zirconia stationary phase, previously de
scribed,' was produced by an adsorption method using a 2% (wiv) solution of PEl solution in methanol and a 5% (w/v) 1,4butanediol diglycidyl ether (BUDGE) solution in methanol for
cross-linking.Zirconia Substrate Particles. Porous zirconia particles
(barch Coac 15). prodllced hy the polymerization-induced colloid
aggregation"'''' method, were used as the suhstrate material for
this work. particles have an average diameter of 6 I'm. a
surface area of 29 m'I g, and an average pore size of 220 A, as
analyzed by SEM and BET nitrogen adsorption. An energetically
more homogeneous smiace was obtained by washing in acid andbase: 85 g of zirconia was suspended in 300 mL of 0.5 M
hydrochloric acid and sonicated under vacuum for 5 min. The
slurry was further sonicated for 45 min and then allowed to stand
for 4 h wi:h occasional mixing. The pa-ticles were allowed tosettle, and the liquid was decanted. The particles were collected
on a sintered glass fuunel and rinsed with 500 mL of water nntil
neutral. This procedure was repeated using 0.5 M sodiumhydroxide, and then the particles were rinsed with another 500mL of water. dried at 150°C overnight in a vacuum oven, and
stored in a vacuum desiccator.Synthesis of Quatemized PEl-Zirconia Particles, Synthe
sis of quatemized PEl-coated zirconia was camed out by a
modification of the procedure developed by Kennedy et ajIB Nine
grams of dry zirconia was placed in 45 mL of 2% (wIv) PEl in
methanol. The mixture was then sonicated under vacuum for 5min. capped, and allowed to stand for 2 h. The product was
isolated on a sintered glass funnel and cross-linked with 45 mLof 5% (v/v) 1,1Q-diiododecane in 2-propanol, and then 1 mL of
1,22,6,6-pentamethylpiperidine was added. This mixture was
(23) Sun, L.; Annen, M. J.: Lorenzano-Porras. C. F." Carr, P. W.; McCormick ACol1oid in
(24) :'-lawrocki. J; A.; Carr, P. W. J. Chromatogr.1993,657,229-232.
Analytical Chemistry, Vol. 67. No. 21, November 1, 1995 3887
Table 2. Capacity Factor and Reduced Plate Height Comparison of Inorganic and Organic Anions on Qu:aternizedPE;.Zirconia, Silica-Based~and PEl-Zirconia Anion Exchangers3
k' ,;ili<~,,-h:l,;pd hsiIic<l-bas('('
solute k'QPEl-zirc k'QPEI'zirc hQPE1.zirc hQPEI.zirc
water 0.00benzvlamine 0.32 2.2 5.0 7.9 1.2 0 7
benz~llnide 0.44 1.7 3.8 6.4 2.1 0.7sodium nitrite 0.50 1.5 1.1 47 0.6 06
acid 066 1.4 3.4 84 0.6 0.5acid 088 1.0 3.1 6.5 1.4 0.7
o-ioclobenzcic acid 1.25 0.7 2.8 7.4 1.1 0.6sodium nitrate 1.48 0.6 0.6 5.0 0.7 0.6m-toluic acid 1.49 0.6 3.1 7.3 2.3 0.6
acid 1.94 0.5 5.0 7.9 0.8 0.6acid 2.20 0.4 1.2 8.2 1.2 0.9
acid 2.47 0.5 1.1 8.0 0.9 0.7acid 2.55 0.4 3.3 8.4 2.0 0.6
acid 3.09 0.3 2.0 7.6 2.8 0.6p-nitrobenzoic acid 400 0.2 0.9 8.6 1.8 0.5p-chlorobenzoic acid 4.67 0.3 1.6 8.2 O.S 0.6
-....:357;C.;~i;:~;i(p;~hase A, 100 roM potassium phosphate dibasic at pH 7.4, 40 mM sodium chloride; JJow rate.'e volume, 5 ,uL; solute concentration. 10 mM: detection at 240 nm.
(25) BlackweiL]. A Ph.D. Thesis, University :If MinneSOla, :v1inneapolis, MN,1991.
where N is the number of theoretical plates, H is the height ofthe peak, IR is the retention time, A is the peak area, h is thereduced plate height, L is the column length, and dp is the averageparticle diameter. In general, quaternized PEI·zirconia wassomewhat more efficient than the silica-based support and slightly
The same solutes were much more retained on both the quater·nized PEI·zirconia and the silica·based anion·exchangers. Inspection ofTable 2 shows that the capacity factors of all well-retained(k' > 1) solutes on PEl-zirconia are systematically lower than thoseon quaternized PEl·zirconia. In contrast, the ratio of capacityfactors of the silica·based support to the quaternized PEI·zirconiasupport shows no systematic variation with capacity factor. Therewas no observable correlation between the pK" values of thep-benzoic acid derivatives and retention on any of Loe three phases.This is in contrast to a strong dependence on pK, of the retentionofp-benzoic acids on bare zirconia,'" These retention ratio resultssuggest that retention on quaternized PEl-zirconia is due to a"mixed·mode" process and is not purely an ion·exchange process.If the only mechanism of retention on the three phases were ion·exchange. then we would expect the ratio of capacity factors onthe two columns to be the same for all probe solutes. Further·more, we would expect the ratio of capacity factors to be directlyproportional to the ratio of phase ratios. This is ciearly not tbecase for the data shown in Table 2.
Comparison of Column Efficiency for Quatemized PEl·Zirconia, PEl-Zirconia and a Silica-Based Strong Anion·Exchanger. The column efficiency for small anions on quater·nized PEI·zirconia, PEI·zirconia, and the silica-based phase is alsoshown in Table 2. The height/area method was used to calculatethe number of theoretical plates and reduced plate heights:
silica-based phase had a nitrogen coverage of 1.44 pmol/m' byelemental analysis. The silica·based phase had a surface area of350 m2/g, whereas the zirconia supports had a surface area of 29m' / g, but zirconia's density is approximately twice that of silicage!.'"' giving the zirconia·based stationary phases a much higheroverall ion·exchange capacity per column. The picric acid assayresults for quaternized PEI·zirconia and PEI·zirconia were 4.68and 7.24 pmol/m' of nitrogen, respectively. Because the picricacid assay is not sensitive to quaternized amine sites, the capacitiesobtained by its use represent the amount of unquaternized (thatis, residual) primary, secondary, and tertiary amines.
Cross·Linking of Quatemized PEl-Zirconia and PEl·Zirconia, Two different cross·linking agents were used for thesynthesis of quaternized PEl-zirconia and PEI·zirconia, namelyBUDGE and 1,1(}diiododecane, respectively. As will be seen, theresulting phases differ markedly in stability and chemical proper·ties. BUDGE and l,1(}diiododecane have elemental formulas ofCwH"O, and CwH2o!', respectively. The theoretical molar ratioof carbon to nitrogen (C/N) for PEl is 2.0, so values greater than2.0 provide information about the amount of cross-linking. Asshown in Table 1, the C/N ratios of quaternized PEl-zirconia andPEI·zirconia were 3.2 and 4.5, respectively. If we assume thatPEl has a formula (C,HeN)" and both ends of the cross·linker arelinked with PEl, then 50% and 24% of the amine groups on thesurface are cross·linked for each respective phase. This estimateof ,:ross·linking for the quatemized PEI·zirconia phase may besomewhat high, as more than one cross·linking agent moleculemay react ",ith a singie amine site. For installce, in the case of aprimary amine, three molecules of 1,1Q.diiododecane can, inprinciple, react with a single primary nitrogen.
Comparison of Quatemized PEl-Zirconia, PEI·Zirconia,and a Silica·Based Strong Anion-Exchanger in the Chroma·tography of Inorganic and Organic Anions. Quaternized PEl·zirconia, PEI·zirconia, and a silica·based quaternary amine ftmctionalized stationary phase were compared c'1romatographicallyusing some carefully selected inorganic and organic anions.Retention and column efficiency data are sho'NI1 in Table 2. Thecapacity factors on the PEI·coated zirconia ranged from 0.7 to 1.4.
3888 Analytical Chemistry, Vol. 67, No. 21, November 1, 1995
N = 2n(HIR/ A)'
h L/(Nd~
(1)
(2)
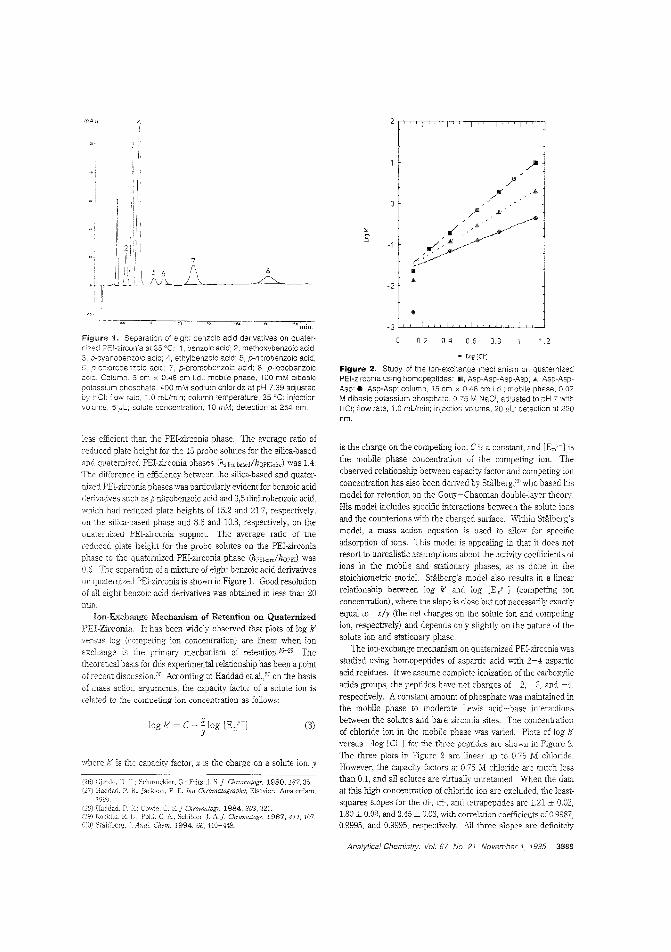
- Loe1C1-j
Figure 2. Study of the ion-exchange mechanism on quaternizedPEI'zirconia using hornopeptides: Ill, Asp·Asp-Asp-Asp: .., Asp-AspAsp; •. Asp-Asp; column, 15 cm x 0.46 em id; mobiie phase, 0.02M dibasic potassium phosphate, 0.75 M NaCl, to pH 7 wthHel; tlow rate, 1.0 mUmin; in.ection volume. detection at 220nm.
,f.•mm.
Figure 11. Separation of eigh~ benzoic acid derivatives on quaternized PEl-zirconia at 35°C: 1, benzoic add; 2, methoxybenzoic acid3, acid; 4, ethy!benzoic acid; 5, p-nitrobenzoic acid;6. acid; 7, p-bromobe1zoic acid; 8, p·iodobenzoic8cid. Column, :; em x 0.46 em Ld.; mobile phase, 100 mM dibasicpotassium phosphate, 400 mM sodium chloride at pH 7.39 adjusted
HCI: flow rate, 1.0 mUmin; column temperature, 35°C; injection5 ,aL; solute concentration: 10 mM; detection at 254 nm.
-1
-2
i
/'/
(~.",:<,.~
.,/.""" .
/'
II..
0.2 0.4 C.6 0.8 1.2
where k' is the capacity factor, x is the charge on a solme ion, Y
;99'J.(28) Haddad, P. Cowie. C. 1984.303,321.(:0:9) Rocklin, 1<. Foh!. CA.; Chromatogr. 1987,411, 107.
nO) Stahlberg,.i Anai, Chem. 1994,66,440-449.
less efficient than the PEI·zirconia phase. The average ratio of
reduced plate height for the 15 probe solutes for the silica-based
and quatemized PEl-zirconia phases (hsilica-based/hQPEkirc) was 1.4.The difference in efficiency between 'l:te silica-based and quater
nized PEl-zirconia phases was particularly evident for benzoic acidderivatives such as p-nitrobenzoic acid and 3,5-dinitrobenzoic acid,
which had reduced plate heights of 15.2 and 21.7, respectively,
on '[he silica-based phase and 8.6 and 10.3, respectively, on thequatemized. PEl-zirconia support. The average ratio of the
reduced plate height for the probe solutes on the PEl-zirconia
phase to the quatemized PEl-zirconia phase (hPEki,JhQPEi) was
0.6. The separation of a mixture of eight benzoic acid derivativeson quatemized PEl-zirconia is shown in Figure L Good resolution
of all eight benzoic acid derivatives was obtained in less than 20min.
Ion-Exchange Mechanism of Retention on QuatemizedPEl-Zirconia, It has been widely observed that plots of log k'versus log (competing ion concentration) are linear when ion
exchange is the primarJ mechanism of retention26- 29 The
theoretical bass for this experimental relationship has been a point
of recent discussion.:'{1 According to Haddad et al}' on the basis
of mass action arguments, the capacity factor of a solute ion is
related to :he competing ion concentration as follo"WS:
is the charge on the competing ion, C is a constant, and [E,r] is
the mobile phase concentration of the competing ion. The
observed relationship between capacity factor and competing ion
concentration has also been derived by Sti\lberg,3li who based his
model for retention on the Gouy-Chapman double-layer theory,
His model includes specific interactions between the solute ions
and the counterions with the charged smiace. Within Sffiberg's
model, a mass action equation is used to allow for specific
adsorption of ions. This model is appealing in that it does notresort to unrealistic assumptions about the activity coefficients of
ions in the mobile and stationary phases, as is done in the
stoichiometric model. StaIberg's model also results in a linearrelationship between log k' and log [EmY-] (competing ion
concentration), where the slope is close but not necessarily exactlvequal to -x/y (the net charges on the solute ion and c;mpetin~ion, respectively) and depends only slightly on the nature of thesolute ion and stationary phase,
The ion-exchange mechanism en quatemized PEl-zirconia wasstudied using homopeptides of aspartic acid with 2-4 aspartic
acid residues. Ifwe assume complete ionization of the carboxylic
acids groups, the peptides have net charges of -2, -3, and -4.respectively. A constant amount of phosphate was maintained inthe mobile phase to moderate Lewis acid-base imeractions
between the solutes and bare zirconia sites. The concentration
of chloride ion in the mobile phase was varied. Plots of log k'versus-log [Cl-] for the three peptides are shown in Figure 2.
The three plots in Figure 2 are linear up to 0.75 M chloride.
However, the capacity factors at 0.75 :VI chloride are much lessthan 0,1, and all solutes are virtually unretained. When the data
at this high concentration of chloride ion are excluded. the leastsquares slopes for the di-, trio, and tetrapeptides are 1.21 ± 0.02,1,80 ± 0.02, and 2.45 ± 0.03, with con'elation coefficients of 0.9987,0.9995, and 0.9995, respectively All three slopes are definitely
(3)log k' = C - '" log [E Y-jY m
(26)(27)
Analytical Chemistry, Vol. 67, No. 21, November 1. 1995 3889
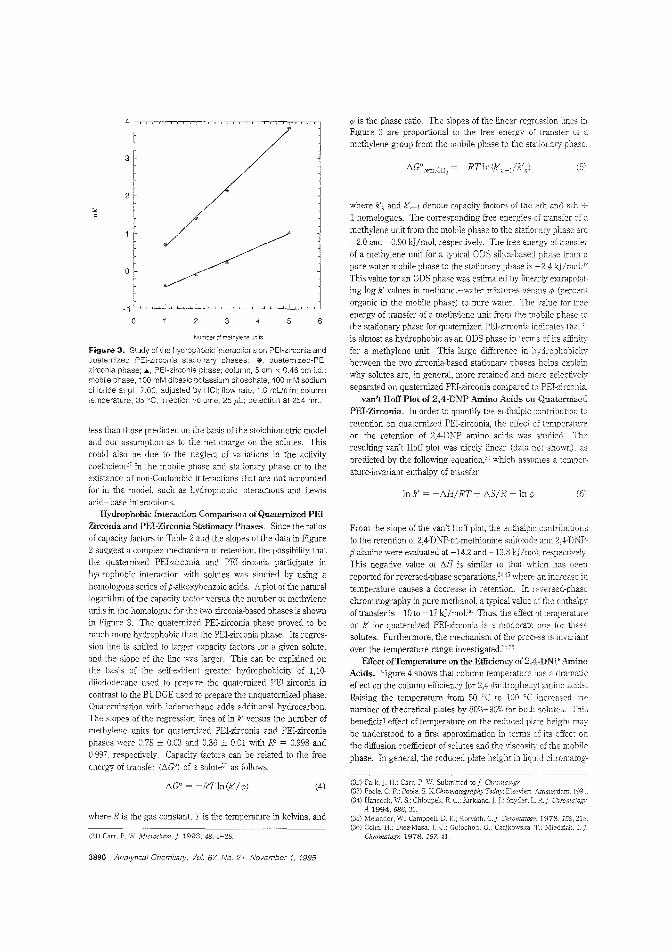
Figure 3. Study of the hydrophobic interactions on PEi-zirconia andquaternized PEl-zirconia stationary phases: e, quatern:zed-PEIzirconia phase; .A., PEl-zirconia phase; coluMn, 5 em x 0.46 em Ld.;mobile phase, '00 mM dibasic pctassium phosphate, 400 mM sodiumchloride at pH 7,00, adjusted by Hel; flow raie, 1,0 mUmin; columntemperature, 35 "C; injection volume, 25 pL: detection at 254 nm.
less than those predicted on the basis of the stoichiometric modeland our assumption as to the net charge on the solutes, Thiscould also be due to the neglect of vaJiations in the activitycoefficient" in the mobile phase and stationary phase or to theexistence of non-Coulombic interactions that are not accountedfor in the model, such as hydrophobic interactions and Lewisacid- base interactions.
Hydrophobic Interaction Comparison of Quaternized PEIZirconia and PEl-Zirconia Stationary Phases. Since the ratiosof capacity factors in Table 2 and the slopes of the data in Figure2 suggest a complex mechanism of retention, the possibility thatthe quatemized PEl-zirconia and PEl-zirconia participate inhydrophobic interaction with solutes was studied by using ahomologous series of p-a1koxybenzoic acids, A plot of the naturallogarithm of the capacity factor versus the number of methyleneunits in the homologue for the two zirconia-based phases is shownin Figure 3. The quatemized PEl-zirconia phase proved to bemuch more hydrophobic than the PEl-zirconia phase, Its regression line is shifted to larger capacity factors for a given solute,and the slope of the line was larger. This can be explained onthe basis of the self-evident greater hydrophobicity of 1,10diiododecane used to prepare the quatemized PEl-zirconia in
contrast to the BUDGE used to prepare the unquatemized phase,Quatemization with iodomethane adds additional hydrocarbon.The slopes of the regression lines of In k' versus the number ofmethylene units for quatemized PEl-zirconia and PEl-zirconiaphases were 0,78 ± 0,03 and 0.36 ± 0,01 with R2 = 0.998 and0.997, respectively, Capacity factors can be related to the freeenergy of transfer (f>G') of a solute3l as rollows;
¢ is the phase ratio. The slopes of the linear regression lines inFigure 3 are proportional to the free energy of transfer of 2
methylene group from the mobile phase to the stationary phase;
(5)
(6)in k' = - MIRT + 1151R In q)
where k'" and k'''+l denote capacity factors of the nth and nth -'1 homologues. The corresponding free energies of transfer of a
methylene unit from the mobile phase to the stationary phase are-2.0 and -0,90 kJ/mol, respectively. The free energy of transferof a methylene unit for a typical ODS silica-based phase frompure water mobile phase to the stationary phase is -2.4 kJ/mo;':"This value for an ODS phase was estimated by linearly extrapolating log k' values in methanol-water mixtures versus ¢ (percemorganic in the mobile phase) to pure water. The value for freeenergy of transfer of a methylene unit from the mobile phase tothe stationary phase for quatemized PEl-zirconia indicates that it
is almost as hydrophobic as an ODS phase in terms of its affinityfor a methylene unit. This large difference in hydrophobicitybetween the two zirconia-based stationary phases helps explainwhy solutes are, in general. more retained and more selectivelvseparated on quatemized PEl-zirconia compared to PEl-zirconia.
van't Hoff Plot of 2,4-DNP Amino Acids on QuatcmizcdPEl-Zirconia. In order to quantify the enthalpic contributiou to
retention on quatemized PEl-zirconia, the effect of temperatureon the retention of 2,4-DNP amino acids was sUldied. Theresulting van't Hoff plot was nicely linear (data not sho\vn) aspredicted by the following equation,3;; which assumes a temper
ature-invariant enthalpy of transfer;
From the slope of the van't Hoff plot, the enthalpic contributions
to the retention of 2,4-DNP-OL-methionine sulfoxide and 2,4-DNPIi-alanine were evaluated at -14.2 and -13.81<J/mol, respectively
This negative value of !'!B is similar to that which has beenreported for reversed-phase separations,"';" where an increase intemperature causes a decrease in retention, In reversed-phasechromatography in pure methanol, a typical value of the enthalpyof transfer is -10 to -17 kJ/moJ.31i Thus, the effect of temperatureon k' for quatemized PEl-zirconia is a moderate one for thesesolutes. Furthermore, the mechanism of the process is invariantover the temperature range investigated,:",:16
Effect ofTemperature on the Efficiency of2,4-DNP AminoAcids. Figure 4 shows that column temperature has a dramaticeffect on the column efficiency for 2,4-dinitrophenyi amino acids.Raising the temperature from 50 'C to 100 'C increased thenumber of theoretical plates by 80%- 90% for both solutes. Thisbeneficial effect of temperature on the reduced plate height maybe understood to a first aporoximation in terms of its effect onthe diffusion coefficient of solutes and the viscosity of the mohile
phase. In general, the reduced plate height in liquid chromatog-
652
Number cf methylene unts
4
3
2 /"
0
(31) Carr, P. w. Microchem.j. 1993,48,4-28.
where R is the gas constant, T is the temperature in kelvins, and
f>G' = -RTIn(k' /1) (4) (32) Park,], H.; Carr, P. W. Submit1ed(33) Poole, C. F.; Poole, S. KC:hrc'matog"apl,y loM.y: Else'ner: Amsterdam,(34) Hancock, W. S.; Chloupek, R c.; Suy'cler, L. R]. ChromaLogr.
A 1994, 686, 31.(35) Melander, W.; Campbell, D. E.; Horvath, C]. Chromatogr. 1978,158,215.(36) Colin, H.; Diez-Masa, ]. c.; Guiocho:1, G.; Czajkowska, T.; :YIiedziak,
Chromatogr. 1978,167,41.
3890 Analytical Chemistry, Vol, 67 No. 21, November 1, 1995
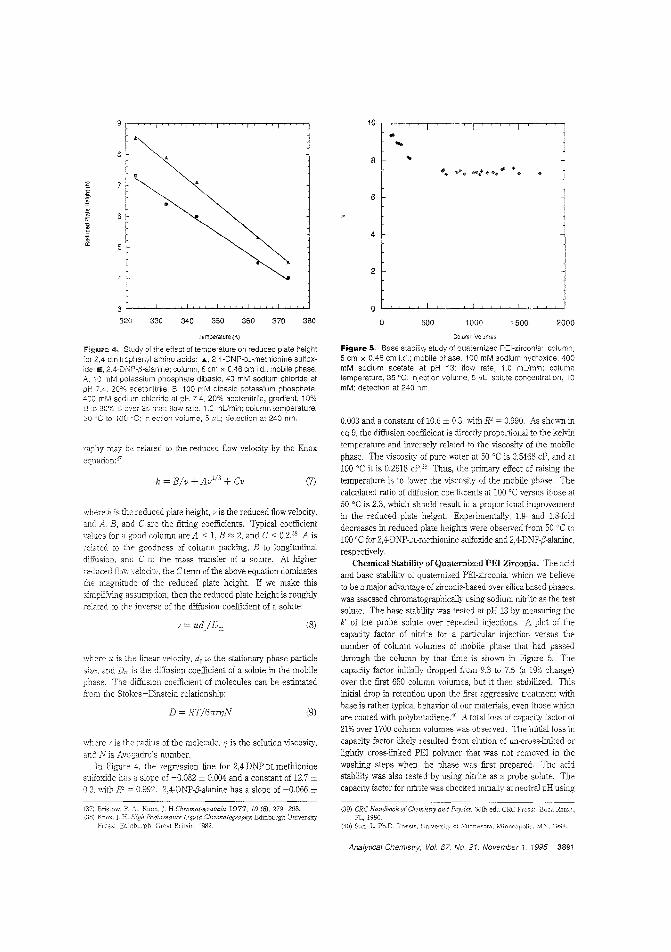
200015001000
, I ' I '
500
10 .....~
6
'"4
2
0
0380370360350340330
3L-..~..L..~....L~---W.~~L......~--'--'-~.w
320
raphy may be related to the reduced flow velocity by the Knox
equation:37
where u is the linear velocity, dp is the stationmy phase particle
size. and D" is the diffusion coefficient of a solute in the mobile
phase. The eliffusion coefficient of molecules can be estimatedfrcm the Stokes-Einstein relationship:
Coiumn Voumes
(39) eRe Handbook ofChe'i1'i1'stry and Physics, 66th ed.; eRe Press: Boca Raton,FL, 1986.
(40) Sun, L. Ph.D. Thesis, ljniversity of !v1i:-mesota, Minneapolis. \1N. 1994.
Figure S. Base stability study of quaternized PEl-zirconia: column,5 em x 0.46 em Ld.; mobile ahase. 100 mM sodium hydroxide, 400mM sodium acetate at pH 13; flow rate, 1.0 mUm in; columntemperature, 35 "C: injection volume; 5 ,uL; solute concentration, 10
mM; detection at 240 nm.
0.003 and a constant of 10.6 ± 0.3, with R' 0.990 As shown in
eq 9, the diffusion coefficient is directly proportional to the kelvin
temperature and inversely related to the viscosity of the mobile
phase. The viscosity of pure water at 50 'C is 0.5468 cP, and at
100 'C it is 0.2818 cP." Thus, the primmy effect of raising the
temperature is to lower the viscosity of the mobile phase. The
calculated ratio of diffusion coefficients at 100 'C versus tl'ose at
50 'C is 2.3, which should result in a proportional improvement
in the reduced plate height. Experimentally, 1.9- and 1.8-folel
decreases in reduced plate heights were observed from 50 'C to
100 'C for 2,4-DNP-DL-methionine sulfoxide and 2,4-DNP-j5-alanine,
respectively.
Chemical Stability of Quatemized PEl-Zirconia, u,e acidand base stability of quatemized PEl-zirconia, which we belleve
to be a major advantage of zirconia-based over silica-based phases,
was assessed chromatographically using sodium nitrite as the testsolute. The base stability was tested at pH 13 by measuring the
k' of the probe solute over repeateel injections. A plot of the
capacity factor of nitrite for a particular injecticn versus the
number of column volumes of mobile phase that had passeel
through the column by that time is shown in Figure 5. Tne
capacity factor initially dropped frem 9.3 to 7.5 (a 19% change)
over the nrst 650 column volumes, but it then stabilized. Thisinitial drop in retention upon the nrst aggressive treatment with
base is rather typical behavior of our materials, even those which
are coated "ith polybUt::ldiene.40 A total loss of capacity factor of21% over 1700 column volumes was observed, TIle initial Joss in
capacity factor likely resulteel from elution of un-crass-linked or
lightly cross-llnked PEl polymer that was not removed in the
washing steps when the phase was nrst prepared. The acid
stability was also testeel by usIng nitrite as a probe solute. Thecapacity factor for nitrite was checkeel initially at neutral pH using
(9)
(8)
(7)
Edinbcrgh :Jniversity1977. 10 (6), 279 298.
D = RT/6JI1'rJN
h = B/v+AVl/3 + Cv
Knox, j,
Pn::ss: Edinburgh, Great Britain. 1922
where r is the radius of the molecule, ?J is the solution viscosity,and N is Avogadro's number.
In Figure 4, the regression line for 2,4-DNP-Dt-methioninesuioxiele has slope of -0.082 ± 0.004 and a constant of 12.7 ±
with R' = 0.992. 2,4-DNP-j5-alanine has a slope of -0.066 ±
where h is the reduced plate height, v is the reduced flow velocity,
anel A. B, anel C are the ntting coefficients, Typical coefficientvalues for a gooel column are A < 1, B '" 2, and C < 0,2,38 A is
recateel to the goodness of column packing, B to longituelinal
eliffusion, anel C to the mass transfer of a solute. At higher
reeluceel flow velocity, the C term of the above equation dominates
the magnituele of the reduced plate height. If we make this
simplifying assumption, then the reduced plate height is roughly
related to the inverse of the diffusion coefficient of a solute:
Temperature (K)
Figure 4. Study of the effect of temperature on reduced plate heighttor amino acids: &, 2A~DNP~DL-methionjnesulfox-ide: ill, column, 5 em x 0.46 em id,; mobile phase,A, 10 'nM potassium ptlOsphate dibasic, 40 mM sodium chloride atpH 7. L , 2C% acetonitrile, B, 100 mM dibasic potassiun phosphate,400 mM sodium chloride at pH 7.4. 20% acetcnitri:e, gradient, 10%8 ~o 90% B over 25 min; flow rate, 1.0 mUmin; column temoerature,50°C to 100 )C; injection volume, 5 pL; detection at 240 nm.
Analytical Chemistry, Vol. 67, No. 21, November 1. 1995 3891
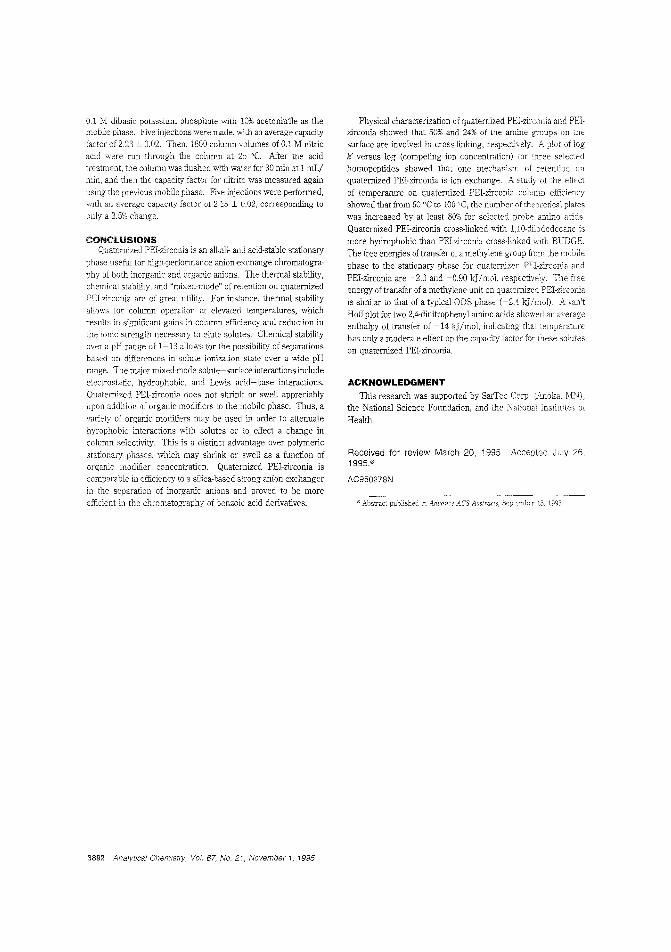
0.1 M dibasic potassium phosphate with 10% acetonitrile as themobile phase. Five injections were made, with an average capacity
factcr of 2.23 ± 0.02. Then, 1600 column volumes of 0.1 M nitric
acid were nm through the column at 25 'c. After the acidtreatment, the column was Hushed with water for 30 min at 1 mLimin, and then the capacity factor for nitrite was measured again
using the previous mobile phase. Five injections were performed,with an average capacity factor of 2.15 ± 0.02, corresponding to
only a 3.5% change.
CONCLUSIONSQuatemized PEl-zirconia is an alkali- and acid-stable stationary
phase useful for high-performance anion-exchange chromatogra
phy of both inorganic and organic anions. The thermal stability,chemical stability, and "mixed-mode" of retenti:m on quatemized
PEl-zirconia are of great utility. For instance, thermal stabilityallows for column operation at elevated temperatures, which
results in significant gains in column efficiency and reduction inthe ionic strength necessary to elute solutes. Chemical stabilityover a pH range of 1-13 allows for the possibility of separations
based on differences in solute ionization state over a wide pH
range. The major mixed-mode solute-surface interactions includeelectrostatic, hydrophobic, and Lewis acid-base interactions.
Quatemized PEl-zirconia does not shrink or swell appreciablyupon addition of organic modifiers to the mobile phase. Thus, a
variety of organic modifiers may be used in order to attenuate
hyrophobic interactions with solutes or to effect a change incolumn selectivity. This is a distinct advantage over polymeric
stationary phases, which may shrink or swell as a function oforganic modmer concentration. Quatemized PEl-zirconia iscomparable in efficiency to a silica-based strong anion-exchanger
in the separation of inorganic anions and proved to be moreefjjdent in the chromatography of benzoic acid derivatives.
3892 Analytical Chemistry Vol. 67. No. 2'1, November 1, 1995
Physical characterization of quaternized PEl-zirconia and PElzirconia showed that 50% and 24% of the amine groups on thesurface are involved in cross-linking, respectively. A plot of log
k' versus log (competing ion concentration) for three selected
homopeptides showed that one mechanism of reLenlion onquatemized PEl-zirconia is ion exchange. A study of the effect
of temperature on quatemized PEl-zirconia column efjjciency
showed that from 50 'C to 100 'C, the number of theoretieai plates
was increased by at least 80% for selected probe amino acids.
Quaternized PEl-zirconia cross-linked with 1,I0-diiododecane is
more hydrophohic than PEl-zirconia cross-linked wiLh BUDGE.
The free energies of transfer of a methylene group from the mobile
phase to the stationary phase for quatemized PEl-zirconia and
PEl-zirconia are -2.0 and -0.90 kJ/mal, respectively. The freeenergy of transfer of a methylene unit on quatemizeci PEl-zirconia
is similar to that of a typical ODS phase (-2.4 kJI mol). A van't
Hoff plot for two 2,4--dinitrophenyl amino acids showed an average
enthalpy of transfer of -14 kJ/mol, indicating thaL temperature
has only a moderate effect on the capacity factor for these solutes
on quatemized PEl-zirconia.
ACKNOWLEDGMENT
This research was supported by SarTec Corp. (Anoka, M'\i).the National Science Foundation, and the National Institutes of
Health.
Received for review March 20, 1995. Accepted July 26.1995°
AC950278N
;,) Abstract published in Advance ACS Abstracts, Sept('mber 1995.
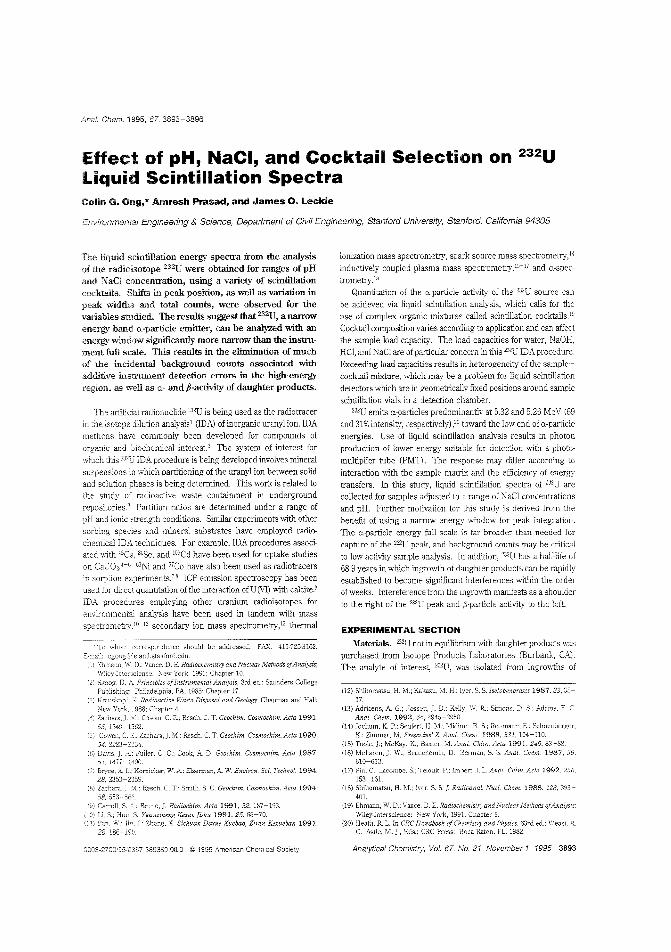
Anal. Chem. 1995, 61, 3893-3896
Effect of pH, NaCI, and Cocktail Selection on 232U
liquid Scintillation SpectraColin G. Ong,* Amresh Prasad, and James O. Leckie
Environmental Engineering & Science, Department of Civil Engineering, Stanford University, Stanford, Califomia 94305
The liquid scintillation energy spectra from the analysisof the radioisotope 232U were obtained for ranges of pHand NaCi concentration, using a variety of scintillationcocktails. Shifts in peak position, as well as variation inpeak widths and total counts, were observed for thevariables studied. The results suggest that 232U, a narrowenergy band a.-particle emitter, can be analyzed with anenergy window significantly more narrow than the instrument full scale. This results in the elimination of muchof the incidental background counts associated withadditive instrument detection errors in the high-energyregion, as well as 0.- and p-activity of daughter products.
The artificial radionuclide "'u is being used as the radiotracerin the isotope dilution analysis1 (IDA) of inorganic uranyl ion. IDAmethods have commonly been developed for compounds oforganic and biochemical interest.2 The system of interest forwhich this 133lj IDA procedure is being developed involves minedsuspensions in which partitioning of the uranyl ion between solidand sclution phases is being determined. This work is related tothe study of radioactive waste containment ip undergroundrepositories." Partition ratios are determined under a range ofpI! and ionic 2trength conditions. Similar experiments 'With othcrsorbing species and mineral substrates have employed radiochemicallDA techniques. For example, IDA procedures associated "ith "Ca, 8fISe, and lD9Cd have been used for uptake studieson CaC03.'-6 63Ni and 57CO have also been used as radiotracersIn sorption experiments.7S ICP emission spectroscopy has beenused for direct quantitation of the interaction of U(VI) with calcite.'IDA procedures employing other uranium radioisotopes forenvironmental analysis have been used in tandem with massspectrometry.lil-J2 secondary ion mass spectrometry,J3 thermal
To whom correspondence should be addressed. F.A.X: 415-725-3162.E-mail: cgongc••ieland.st<m[ord.(.du.
(1) D. E. Radiochemistry and Nuclear Methods ofAnalysis;Wilcy-Inlcrscicncc: Nc'vv York 1991: Chapter 10.
(2) D. 3rd eC:.: Saunders College1985: Chapter 17.
(3) Krausk::lpf, K.. Rcdioactive Was:e Disposaf and Geology; Chapman and Hall,
New York :988; C11apter 4.Zac-hara, l Cowan. C. E.; Resch, C. T. Geochim. Cosmochim. Acta 1991,55. 1549-1':;62.
(5) Cowan, C. E.; Zacnara, J. 1'.1.: Resch, C. T Geochim. Cosmochim. Acta 1990,54.2223-2234.
(6) Davis, ]. Fuller. C. c.; Cook. A D. GeocMm. Cosmochim. Acta 1987,51. 1477-l-<[90.
(7) Bryce, i\.. L; Komicker, W. A.; Elzerman, A. W. Environ. Sci. Techno!. 1994,28.2353-2359.
(8) Zachara, J. M.; R~sch, C. T.; Smith, S. C. Geochim. Cosmochim. Acta 1994,58,
(9) Carroll, S. Bruno, J. Radiochim. Acta 1991,52, 187-193.(10) Li, S.; Hou. S. 1991,25,68-70.(1l) Pan, W.; Daxue Xuebao, Ziran Kexueban 1991,
28. 186-190.
0003-2700/95/0367-3893S9.0010 © 1995 American Chemical Society
ionization mass spectrometry, spark source mass spectrometry. Jc:
inductively coupled plasma mass spectrometry,1H7 and a-spectrometry. JS
Quantitation of the a-particle activity of the 233U source canbe achieved via liquid scintillation analysis, which calls for theuse of complex organic mixtures called scintillation cocktails.'9Cock1lail composition varies according to application and can affectthe sample load capacity. The load capacities for water, NaOH,HCI, and Nael are of particular concern in this 2"U IDA procedure.Exceeding load capacities results in heterogeneity of the samplecocktail mixture, which may be a problem for liquid scintillation
detectors which are in geometrically Jixed positions around samplescintillation vials in a detection chamber.
232U emits a.-particles predominantly at 5.32 and 5.26 MeV (69and 31% intensity, respectively) ,20 toward the low end of a.-particleenergies. Use of liquid scintillation analysis results in photonproduction of lower energy suitable for dctcction wit" a photomultiplier tube (PMT). The response may differ according to
interaction with the sample matrix and the efficiency of energytransfers. In this study, liquid scintillation spectra of 232lj arecollected for samples adjusted to a range of NaCI concentrationsand pH. Further motivation for this study is derived from thebenefit of using a narrow energy window for peak integration.Thc a-particle energy full scale is far broader than needed forcapture of the 232U peak, and background counts may be criticalto low activity sample analysis. In addition, 332lj has a hali-life of68.9 years in which ingrowth of daughter products can be rapidlyestablished to become significant interferences within the orderof weeks. Intereference from the ingrowth manifests as a shoulderto the right of the 232U peak and ,B-pmiicle activity to the left.
EXPERIMENTAL SECTIONMaterials. 232U not in equilibrium vdth daughter products was
purchased from Isotope Products Laboratories (Burbank. CAl.The analyte of interest, 232U, was isolated from ingro\\ths of
(12) Shihomatsu, H. M..; K<:kazu, \1. H.: Iyer, S. S.lsotopenpraxis 1987,23,3537
(13) Adric..ens, A G.; F2..ssett, ]. D.: Kelly, 'N, R.; Simons, D. S.; Adams. FAnal. Chem. 1992,64,2945-2950
(14) Jochum, K. P.; Seufert, H. M.; Midinet, B. S.; Rettmann, E.: Schoenberger,K.: Zimmer. M. FrescJ:ius' Z. Anal. Chern. 1988,331,104-110.
C15) Toole, J.; K.: Baxter, M. Anal. Chim. Acta 1991,245,83--88.(16) McLaren, J. D.; Berman, S. S. Anai. Chem. 1987,59.
610-613.(17) Pin, C; Lacombe. S Telouk P.: Imbert. J. L AnaL Chim, Acto 1992.256.
153-161.':18) Shihomatsu, H. IvL; Iyer, S. S. f. Radioanal. Nucl. Oem. 1988, 128,393
401.(19) Ehmann, W. D.; Vance. D. E. Radiochemistry and Nuclear Methods of4nalysi.s;
Wiley-Interscience, :--':ew York, 1991; Chapter 8.(20) R L. In CRC H'anGlbook o)'Chemistry an,d Pllysi,,,.63rd ed.; Weast. R
c., M. J" Eds.; C~C Press: Boca 1982.
Analytical Chemistry, Vol 67. No. 21 November 1. 1995 3893
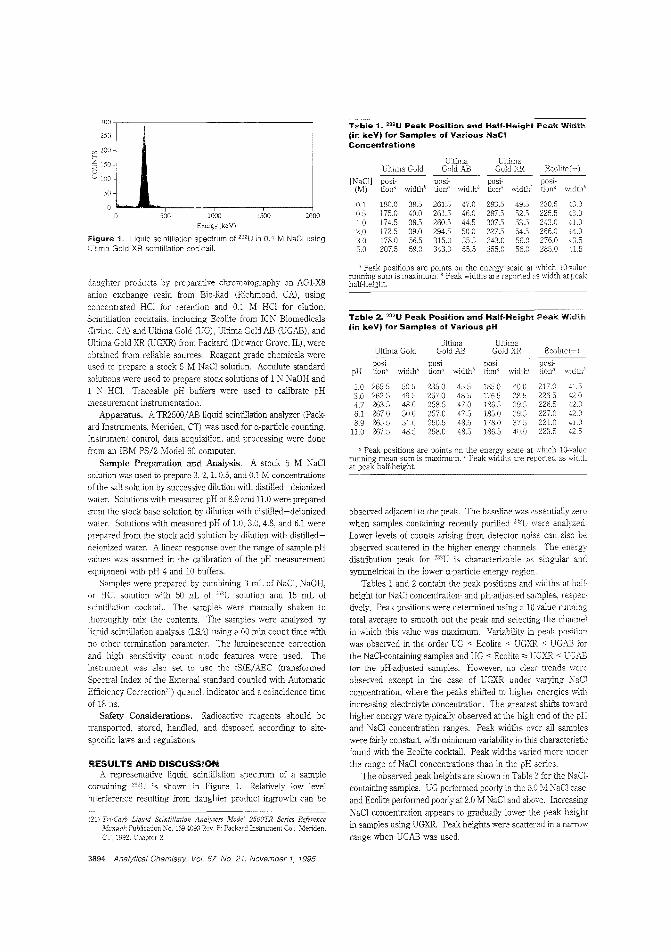
50
:;O()-,-------------------,
zso
observed adjacent to the peak. The baseline was essentially zero
when samples containing recently purified 2l"U were analyzed
Lcwer levels of counts arising from detector noise can also beobserved scattered in the higher energy channels. The energydistribution peak for 2l12U is characterizable as singular and
symmetrical in the lower o.-partic1e energy region.
Tables 1 and 2 contain the peak positions and widths at halfheight for NaCl concentration- and pH-adjusted samples, respectively. Peak positions were determined using a la-value running
total average to smooth out the peak and selecting the channelin which this value was maximum. Variability in peak position
was observed In the order DG < Ecolite < UGXR < UGAB for
the NaCl-containing sanoples and UG < Ecolite '" CGXR < UGlillfor the pH-adjusted samples. However, no clear trends were
observed except in the case of UGXR under varying Nael
concentration, where the peaks shifted to higher energies with
increasing electrolyte concentration. The greatest shifts towardhigher energy were typically observed at the high end of the pHand NaCl concentration ranges. Peak widths over all samples
were fairly constant, with minimum variability in this characteristicfound with the Ecolite cocktail. Peak widths varied more under
the range of NaCl concentrations than in the pH series.The observed peak heights are shown in Table 3 for the NaCI
containing sanoples. UG performed poorly in the 5.0 M NaCl case,
and Ecolite performed poorly at 2.0 M NaCl and above. Increasing
NaCI concentration appears to gradually lower the peak heightin sanop1es using UGXR Peak heights were scattered in a narrow
range when UGAB was used.
Table 2. 232U Peak Position and Half·Height Peak Width(in keV) for Samples of Various pH
Ultima UltimaUltima Gold GoldAB Gold XR EcoliLe(,)
posi- posi- posi- posi-pH tiona width' tiona widthb tiona widthb tiona width!)
1.0 265.5 50.5 235.0 45.5 l85.1l 40.1l 217.0 41.530 2625 495 2570 485 1765 38-5 2265 L204.7 263.5 48.1l 258.5 47.1l 186.5 39.5 226.5 (2.06.1 2671l 50.0 257.0 47.5 185.0 39.5 227.1l L2.08.9 2655 51.0 250.5 48.5 178.0 37.5 221.0 0.0
11.0 267.5 48.5 258.1l 485 186.5 41l.0 223.5
() Peak positions are points on. the energy scale atrunning mean sum is maximu:n. 0 Peak V\idths areat peak half-height.
Ultima Gold Ecolite ':-:-)
[NaCll posi- posi-(M) tiona width/! width? width" tiona width'
0.1 180.0 38.5 261.5 47.0 283.5 49.5 230.5 4::.01l.5 l75.1l 40.0 261.5 46.1l 287.5 52.5 225.5 43.01.0 174.5 38.5 260.5 44.5 307.5 53.5 243.0 41.1l2.0 172.5 39.0 294.5 51l.0 327.5 54.5 266.03.0 17S.0 56.5 ,15.0 55.5 34'l.1l ;)6.0 276.1l5.0 207.5 59.1l 343.1l 55.5 355.0 56.1l 285.0 41.5
, Peakrunning sumhalf-height.
Table 1. 232U Peak Position and Half~HeightPeak Widthlin keV) for Samples of Various HaCIConcentrations
0.1 M NaC! using
:500 2000o I
o 500 1000
Energy (keY)
Figure 1. liquid scintillation spectrum of 232UUltima Goid XR scintillation cocktail.
RESULTS AND DISCUSSIONA representative liquid scintillation spectmm of a sanople
comaining is shown in Figure 1. Relatively low level
interference resulting from daughter product ingrowth can be
~ 200
5 150CJG 100
(21) Tri-Carb Scintillation Analyzers Mode! 2500TR SeriesManual: No. 169-4093 Rev. B; Packard Instrument Co.:(j, 1992; Chapter 2.
daughter prociucts by preparative chromatography on AGI-X8
anion exchange resin from Bio-Rad (Richnond, CAl, using
concentrated HC1 for retention and O.l M HC1 for elution.Scintillation cocktails, including Ecolite from ICN Biomedicals(Irvine, CAl and Ultima Gold (UG), Ultima GoliAB (UGAB) , and
Ultima Gold XR (UGXR) from Packard (Downer Grove, IL), were
obtained from reliable sources. Reagent grade chemicals wereused to prepare a stock 5 M NaCl solution. Acculute standard
solutions were used to prepare stock solutiom of 1 N NaOH and
1 !\' HCl. Traceable pH buffers were used to calibrate pHmeasurement instrumentation.
Apparatus_ A TR2500/AB liquid scintillation analyzer (pack
ard Instruments, Meriden, C1) was used for a.-particle counting.Inslmmenl conlrol, data acquisition, and processing were done
tram an IBM PS/2 Model 60 computer.
Sample Preparation and Analysis. A stock 5 M NaCIsolution was used to prepare 3, 2, 1,0.5, and 0.1 M concentrations
of the salt solution by successive dilution v.ith distilled-deionizedwater. Solutions with measured pH of 8.9 and 11.0 were prepared
from the stock base solution by dilution with distilled-deionizedwater. Solutions with measured pH of 1.0, 3.0, 4.8, and 6.1 were
prepared tram the stock acid solution by dilution with distilleddeionized water. A linear response over the range of sample pH
values was assumed in the calibration of the pH measurementequipment with pH 4 and 10 buffers.
Samples were prepared by combining 3 mL of NaC!, NaOH,or HCI solution with 50 I'L of 232U solution and 15 mL of
scintillation cocktail. The sarnples were manually shaken to
thoroughly mix the contents. The samples were analyzed byliquid scintillation analysis (LSA) using a GO min count time with
no other termination parameter. The luminescence correctionand high sensitivity count mode features were used. Theinstrument was also set to use the tSIE/AEC (transformed
Spectral Index of the External standard coupled with Automatic
Efficiency Correction") quench indicator and a coincidence timeof 18 ns.
Safety Considerations. Radioactive reagents should be
transported, stored, handled, and disposed according to site
specific laws and regulations.
3894 Analytical Chemistry. Vol. 67, No. 27. November 1, 1995
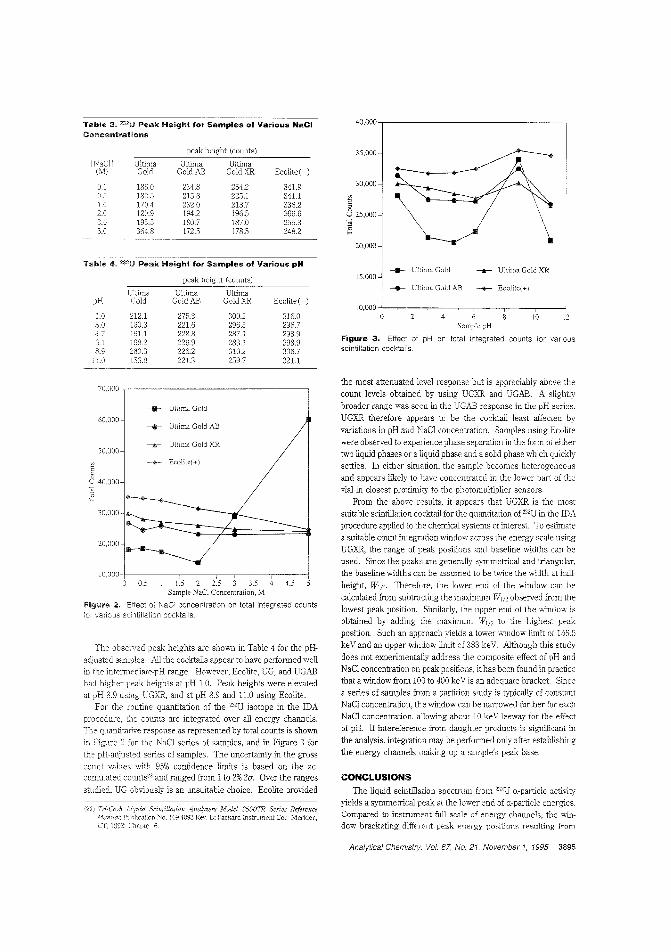
Ta.ble 3. ?3?U Peak Height for Samples of Various HaCIConcentrations
40.000,---------------
0.51.02.03.05.0
1860182.5170.4120.9195..6364.8
peak height (counts)
Ultima UltimaGold AL Gold XR
234.8 254.2215.8 225.1232.0 213.7194.2 196.5180.7 187.0172.5 178.5
Ecolite(+)
341.9341.1336.2266.6255.3248.2
35.000
30.000
c~ 25,000
~20.000
\
--<Il- Ultim, Gold AB
50.000
........- Ultima Gold XR___ Ultima Gold
-.- Ultima Gold AB ---+- Ecoljte(+l
15.000
CONCLUSIONS
The liquid scintillation spectrum from ""u a.-particle activityyields a symmetrical peak at the lower end of o.-particle energies.Compared to instrument full scale of energy channels, the window bracketing different peak energy positions resulting from
the most attenuated level response but is appreciably above thecount levels obtained by using UGXR and UGAB. A slightlybroader range was seen in the UGAB response in the pH series.
UGXR therefore appears to be the cocktail least affected byvariations in pH 3.11d NaCI concentration. Samples using Ecolitewere observed to expeiience phase separation in the fonn of eithertwo liquid phases or a liquid phase and a solid phase which quicklysettles. ln either situation. the sample becomes heterogeneousand appears likely to have cOllceulraled ill the lower part of thevial in closest proximity to the photomultiplier sensors.
From the above results. it appears that UGXR is the mostsuitable scintillation cocktail for the quantitation of j32U in the IDAprocedure applied to the chemical systems of interest To estimatea suitable count integration window across the energy scale usingUGXR, the range of peak positions and baseline widths can beused. Since the peaks are generally symmetrical and triangular.the baseline widths can be assumed to be twice the width at half
height. W,J2. Therefore. the lower end of the window can becalculated from subtracting the maximum Win observed from thelowest peak position. Similarly, the upper end of the window isobtained by adding the maximum Win to the highest peakposition. Such an approach yields a lower window limit of 156.5keV and an upper window limit of 383 keV. Although this studydoes not experimentally addre" the composite effect of pH andNaCl concentration on peak positions. it has been found in practicethat a window from 100 to 400 keY is an adequate bracket. Sincea series of samples from a partition study is typically of constantNaCl concentration. the window can be narrowed further for eachNaCl concentration, allowing aboUl 10 keY leeway for the effectof pH. If intereference from daughter products is significant inthe analysis, integration may be performed only after establishingthe energy channels making up a sample's peak base.
10.000+------,--,---,--_--,--o 6 10 12
Sample pH
Figure 3. Effect of pH on total integrated counts for variousscintillation cocktails
4.5
Scin/iUG/i01! Analyzers Model 2500TR SeriesNo. 169-4093 Rev. B: Packard Instrument Co.
LT 1992: Chapter 6.
Ultima UltimaGoldAL Gold XR Ecolite(+)
1.0 212.1 275.3 300.2 316.03.0 HiO.3 221.6 296.5 296.74.7 161.1 228.8 287.1 293.96.1 168.2 226.9 283.1 298.98.9 260.3 226.2 310.2 336.7
156.8 221.3 2597 321.1
70.000
10.000+-,,---,.--,--r----,--,-,--,--'o 0.5 J:5) 2:5 3 3.5
Sample NaCl Concentration,:vi
Figullre 2. Effect of ~JaCI concentration on total integrated countsfor various Sciltil12tion cocktails.
c
:3 40,000
"2
60.000
___ Ultima Gold
20.000 ,.------30.000
The observed peak heights are shown in Table 4 for the pHadjusted samples. illl the cocktails appear to have performed wellin the intermediate-pH range However. Ecolite. UG. and UGABhad higher peak heights at pH 1.0. Pea.l{ heights were elevatedat pH 8.9 using CGXc,," a.nd at pH 8.9 and 11.0 using Ecolite.
For the routine quantitation of the 23'U isotope in the IDAprocedure. [he counts are integrated over all energy channels.The quantitative response as represented by total counts is shown
in Figure 2 for the NaCI series of samples. and in Figure 3 forthe pH-adjusted series of samples. The uncertainty in the grosscount valJes with 95% confidence limits is based on the accumulated counts" and ranged from 1 to 2% 20. Over the rangesstudied. UG obviously is an unsuitable choice. Ecolite provided
.........-. Ultim" Gold XR
- <t- Ecolile(+)
Table 4. 232U Peak Height for Samples of Various pH
peak height (counts)
Analytical Chemistry. Vol. 67. No. 21. November 1, 1995 3895

variations in pH or NaCI concentration is small. Dse of a narrowintegration window may improve the quantitation of the analyte.
The pH of samples has a relatively small effect on the positionof the analyte peak in the liquid scintillation spectrum of 232D. Incontrast, NaCI concentration has a large effect but this does notpose a serious problem since the series of samples from anyindividual experimental run have uniform electrolyte concentration.
Phase separation can result from exceeding the sample loadingcapacities of scintillation cocktails. Although this can be ameliorated by increasing the ratio of cocktail to sample, it may requirethe use of larger volumes or longer count times to accumulate astatistically adequate number of counts.
3896 Analytical Chemistry, Vol. 67. No. 21. November 1. 1995
ACKNOWLEDGMENTThe autbors gratefully aclmowledge funding from Sandia
National Laboratories operated for the United States Departmentof Energy under Contract DE-AC04-94AL85000. The manuscripthas not been subjected to official funding agency review. and noofficial endorsement by the agency should be inferred.
Received for review May 24, 1995. Accepted August 4,1995@
AC950504T
({') Abstract published in Advance ACS Abstracts, September 15, 1995.
Anal. Chem. 1995, 67. 3897-3902
Novel Dye-Solvent Solutions for the SimultaneousDetection of Oxygen and Carbon Dioxide
Min!! lFat Choi* and Peter Hawkins
Faculty of Applied Sciences, University of the West of England, Coldharbour Lane, Frenchay, Bristol B816 lOY, u.K.
The effects of the compositions of N ,N-dimethyl-p-toluidine/N,N-dimethylfonnamide (DMf/DMF) solvent mixtures, the types of bases, the initial base concentrations,and the water content on the performance of alkalinefluorescein (FL)-DMf/DMF (dye-solvent) solutions indetermining oxygen (02) and carbon dioxide (C02) havebeen investigated. Increased [021 causes the absorbance01 dye-solvent solutions at 400 nm to increase because01 a contact charge transfer existing between DMf and O2
molecules, and increased [C02] produces a nonlineardecrease absorbance at 520 nm as the color of FLchanges from its orange manion (FL2-) to the colorless,neutral, lactonic forms. The sensitivity to 02 can beenhanced by increasing [DMfI in the DMf/DMF solventmixture. A linear equation (i.e., 10g(A, A)/A = Zp log[C02J + log(0.2/K), where Ao and A are the absorbancesof dye-solvent solutions with nitrogen and CO2 standardspassing through, respectively, a. and pare constants, andK is the dissociation constant for FL) is derived to relatethe change of absorbance and applied [C02 1. The sensitivity of dye-solvent solutions to O2 is independent of thetypes ofbases, but the sensitivity to CO2 is not. Increasedbase concentration canses a change in the sensitivity toC02 but has no effect on 02. The higher water concentration in dye-solvent solutions has two effects. First, dyesolvent solutions are more sensitive to C02. Second,there is a hypsochromic shift of FL2- ions in DMf/DMFsolvent IDh:ture. A fiber-optic detecting system based ona solution of 10 pM FL and 336 pM tetrabutylammoniumhydroxide in 1:1 (v/v) DMf/DMF has been developed forthe determination of 02 and C02. Their responses arereversible and independent. 1bis solution can be usedfor future development of a single fiber-optic-based O2/
CO2 sensor.
O):ygen (0,) ane carbon dioxide (C00 are the two mostimportant gases in our environment, being found as eitherreactmts or products in vast numbers of chemical and biochemicalreactions. Considerable effort has been devoted to the development of analytical techniques for qualitative and quantitativedetermination of these two gases. The oldest stmdard methodof analysis for dissolved O2 is probably the Winkler method,'which is based on the colorimetric titration of liberated iodine inreaction mixtures with thiosulfate. This analytical method is timeconsuming and cannot be used for in situ measurements orcontinuous rronitoring. Another commonly used method for 0,employs the Clark-type amperometric electrode, which is based
en Winkler, L W. Ber. Dtsch. Chern. Ges. 1888,21,2843.
0003-2700/95/0367-3897S9.00/0 © 1995 American Chemical Society
on the elcctrorcduction of O2 on a polalizcd cathode. It is amoderately fast, simple, and convenient technique. However. itsuffers from several drawback, such as the flow dependence ofthe O2 response and interierences from easily reducible specieslike hydrogen sulfide.' Potentiometric 0, sensors are based onthe Nemstian response of some solid oxide ion conductingelectrolytes operating at high temperatures.:H ParamagneticqUful.titation of gaseous O2 suffers from interference by other
paramagnetic species. such as nitric oxide or free radicals.ii Thefluorescence quenchIng effect of 0, on some fluorophores,analyzed by the Stem-Volmer equation,' is another promisingapproach for O2, but this method suffers from competitivequenching by other imerierems.
There are fewer CO2 detection techniques, due to its relative
chemical inertness. Indirect detection is often used. based onthe pH modulation of a detecting system upon exposure to CO2.
pH changes can be measured and related to the [CO,]8 orindirectly detected by absorbance or fluorescence changes ofsome pH-sensitive dyes. Direct detection of CO2 can be basedon its intense infrared (IR) absorption band at 4.2 ,urn, which isparticularly useful for its detennination9 .lG However. this technique also suffers from intetierence from other absorbing species,such as water (H20) vapor and carbon monoxide. PotentiometricCO, sensors based on the Nernstian response of a solie metaicarbonate electrolyte were employed by other workers,11.12 butthe sensors required high operation temperatures. Sawyer etal. l314 employed an amperometric technique for CO, based onthe electroreduction of CO, at a stationary electrode in dimethylsulfoxide. However, it is essential to exclude 0" because 0, ismore easily reduced than CO2, which becomes aserious drawbackto this design.
With the advent of modern optic and electronic technologies,there is now a growing interest in multianalyte sensors for
biomedical and environmental ficlds. 0" CO2, and pH are threeclinical target analytes desired for simultmeous detenninations.
(2) Hitchman, M. L. Measurement a/Dissolved Oxygen; John Wiley & SOilS:York, 1978; B2-1:i8.
(3) Heyne, L .4.cta 1970, 15, 1251-1266.(4) Agrawal, Y. K; Shan. D. W.; Gruenke, R.; Rap;J, R. A.]. Electrochem. Soc
1974. 121. 354-360.(5) Lukaszewicz,]. P.; Miura, N.; Yamazoe, N. Sens. Actuators B 1990. 1, 195-
198.(6) Refe:-ence(7) Stem, 0.; M. Z. 1919.20, t83.(8) Severinghaus,]. W.; A. F.]. AppL Ph)tsiol. 1958,13,515-520.(9) Ammann, E. C. E.; Galvin, R. D. f. PhysioL 1968,25,333-335.
(10) Ellis, R. E.; Schurin, 8. 2265-2268.(11) Imanaka, N.; G. CJum. Lett. 1990,4,497-500.(12) Yao, S.; Shimizu, Y; lvIiura, N.; Yamazoe, N. Chem. Lett. 1990,11,2033-
2036.(13) Roberts, J. L.; Sa"lV"'!er. D. EfecircanaL Chem. 1965,9, :-7.(14) Haynes, L. V.; Sawyer. D. Chem. 1967,39,332-338.
Analytical Chemistry. Vol. 67, No. 21. November 1. 1995 3897
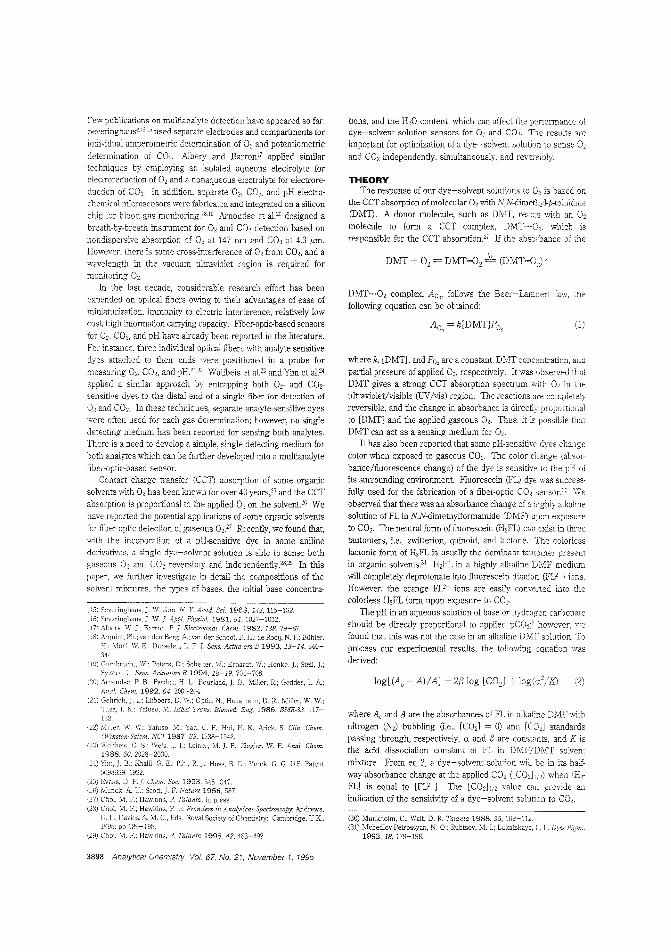
Few publications on multianalyte detection have appeared so far.SeveringhausH,iiHi used separate electrodes and compartments for
individual amperometric determination of O2 and potentiometricdetennination of CO,. Alberj and Barron:7 applied similartechniques by employing an isolated aqueous electrolyte foreleclToreduction of 0, and a nonaqueous electrolyte for electroreduction of CO,. In addition, separate O2, CO" and pH electrochemical microscnsors were fabricated and integrated on a silicon
chip for blood gas monitoling. lS.l9 Arnoudse=t a1.20 designed abreath-by-breath instrument for 0, and CO2 detection based onnondispersive absorption of 0, at 147 nm and CO2 at 4.3 1"m.However, there is some cross-interterence of O2 from CO" and awavelength in the vacuum ultraviolet region is required formonitoring O2.
In the last decade, considerable research effort has beenexpended on optical fibers ov,ing to their advantages of ease ofminiaturization, immunity to electric interfere:lce, relatively lowcost, high information carrying capacity. Fiber-optic-based sensorsfor O2, CO2, and pH have already been reported in the literature.
For instance, three individual optical fibers with analyte-sensitivedyes attached to their ends were postitioned in a probe for
measuring 0" CO2, and pH.2l·" Wolfbeis et al. 23 and Yim et aJ.24applied a similar approach by entrapping both 0,.- and CO,.sensitive dyes to the distal end of a single fiber for detection of0, and CO2. In these techniques, separate analyte-sensitive dyeswere often used for each gas determination; however, no singledetecting medium has been reported for sensing both analytes.There is a need to develop a simple, single detecting medium forboth analytes which can be further developed into a multianalytefiber-optic-based sensor.
Contact charge transfer (Cen absorption of some organicsolvents with 0, has been known for over 40 years,'" and the CCTabsorption is proportional to the applied 0, on the solvent.26 Wehave reported the potential applications of some organic solvents
for fiber-optic detection of gaseous 0,27 Recently, we found that,with the incoporation of a pH-sensitive dye in some anilinederivatives, a single dye-solvent solution is able to sense both
gaseous O2 and CO, reversibly and independently.28." In thispaper, we further investigate in detail the compositions of thesolvent mixtures. the types of bases, the initial base concantra-
(15) Scveringhaus,]' \V, Ann. N. Y Acad. Sci. 1968,1·18,115-132.OS) Severing-haus,]. W.]. Appl. Physiol. 1981,51,1027-1032.(7) /\Ib(~ry Barron. P-l- Rledmnnn!. Chern. 1982, 138, 79-87OS) Arquint, Ph.: ',ran den Berg, A; van der Schoot, B. H.; de Rooij, N. F.; Buhler,
11: Morf, E.: DUrselen, L. F. Sens. Actua,:ors B 1993, 13-14, 340-344.
(19) GumbrechL W.: Peters, :C.: Schelter, W.: Erhardt, IV.; Henke,]'; Steil,].;Sykora. Sens. Actuators B 1994, 18-19, 704-708.
(20) Arnoudse, P. B.; Pardue, H. Bourland, ]. D.; Miner, R.; Geddes, L. A.;Ana!. Chetn. 1992.64,200-204
(21) Gchrich, J. LUbbers, D. IV.: O;)tiz, N.; Hans;nann, D. R; Miller, W. W.~l'usa,). K.: Yafuso, M. IEEE Trans. Biamed. Eng. 1986, BME-33, 117132.
(22) Miner. "{'ii. Vy'.; Yafuso. M.; Yan, C. F.: Hui, K: Ariek, S. Clin. Chem.(Winston-Salem, NO 1987,33,1538-1542.
(23) \Nolfbcio;, O. S.; \Meis, L. J.; L-einer, M. J. P.; :~iegler, W. E. Anal. Chern.1988. 60. 2028-2030.Vim, J. B.: Knlil. G. E.; Pihl, R Huss, B. D.; Yurek. G. G. U.S. Patent5098659, 1992.
(25) Evans, D. Chern. Soc. 1953.345-347.(2(-;) Munck. A. Scott, J. F. Nature 1956,587.(27) Choi, M. F.; Hawkins, P. Talanta. in press.(28) Choi, M. F.; Hawkins, P. In Frontiers ill AnalYiical Spectroscopy; .A.ndrews,
D. L., Davies, A. M. c., Eds.: Royal Society of Chemistry: Cambridge, U.K,1995: pp 189-195.
(29) ChoL F.: Hawkins, P. Ta/auto 1995,42, 483-492.
3898 Analytical Chemistry. Va!. 67, No. 21. Ncvember 1, 1995
tions, and the H20 content. which can affect the pE,rfonnance ofdye-solvent solution sensors for 0, and CO,. The resuits areimportant for optimization of a dye-solvent solution to sense 0 ,
and CO2 independently, simultaneously, and reversibly.
THEORYThe response of our dye-solvent solutions to 0, is based on
the CCT absorption of molecular O2 with N,N-dimethyl-p-toluidine(DM1). A donor molecule, such as DMT, reacts with an O2
molecule to form a CCT complex, DMT.. ·02• which is
responsible for the CCT absorptionn If the absorbance of the
DMT + 02 += milT-02 I" (DMT-O)*
DMT···02 complex, Ao" follows the Beer-Lambert law, thefollowing equation can be obtained:
(1)
where k, [DMTJ, and Po, are a constant, DMT concentration, andpartial pressure of applied O2, respectively. It was observed thatDMT gives a strong CCT absorption spectrum witl1 O2 in theultraviolet/visible (UV/vis) region. The reactions are completelyreversible, and the change in absorbance is directly proportienalto [DMT] and the applied gaseous 0,. Thus. it is possible thatDMT can act as a sensing medium for O2.
It has also been reported that some pH-sensitive dyes changecolor when exposed to gaseous CO2. The color change (absorbance/fluorescence change) of the dye is sensitive to the pH ofits surrounding environment. Fluorescein (FL) dye was successfully used for the fabrication of a fiber-optic CO, sensor.::o Weobserved that there was an absorbance change of a highly alkalinesolution of FL in N,N-dimethylformarnide (DMF) llpon exposure
to CO2. The neutral fonn of fluorescein (H2FL) can exist in threetautomers, i.e., zwitterion, quinoid, and lactone. The colorless1actonic form of H2FL is usually the dcminant tautomer presentin organic solvents.3l H2FL in a highly all'aline DMF mediumwill completely deprotonate into fluorescein dianion (FU-) ions.However, the orange FU- ions are easily converted into thecolorless H,FL form upon exposure to CO2.
The pH in an aqueous solution of base or hydrogen carbonateshould be directly proportional to applied pC02;' however, wefound that this was not the case in an alkaline DMF solution. Toprocess our experimental results, the follo\Ving equation wasderived:
log[(Ao-A)/A] = 2jJ log [C02] log(c//KJ (2)
where AD and A are the absorbances of FL in all'aline DMF withnitrogen (N2) bubbling (i.e., [C02] = 0) and [CO,] standardspassing through, respectively, a. and f3 are constants, and K isthe acid dissociation constant of FL in DMF/DMT solventmixture. From eq 2, a dye-solvent solution will be in its halfway absorbance change at the applied CO2 ([C02] :/2) when [H2FL] is equal to [FU-]. 1110 [C02hl2 value can provide anindication of the sensitivity of a dye-solvent solution to CO2.
(30) Munkholm. c.; Walt, D. R. Ta!.anta 1988.35. t09-112.(31) Mc1:edlov-Petrossyan, N. 0.; Rubtsov, M. 1.; Lukatskaya. L. Dyes Pigm..
1992.18.179-198.
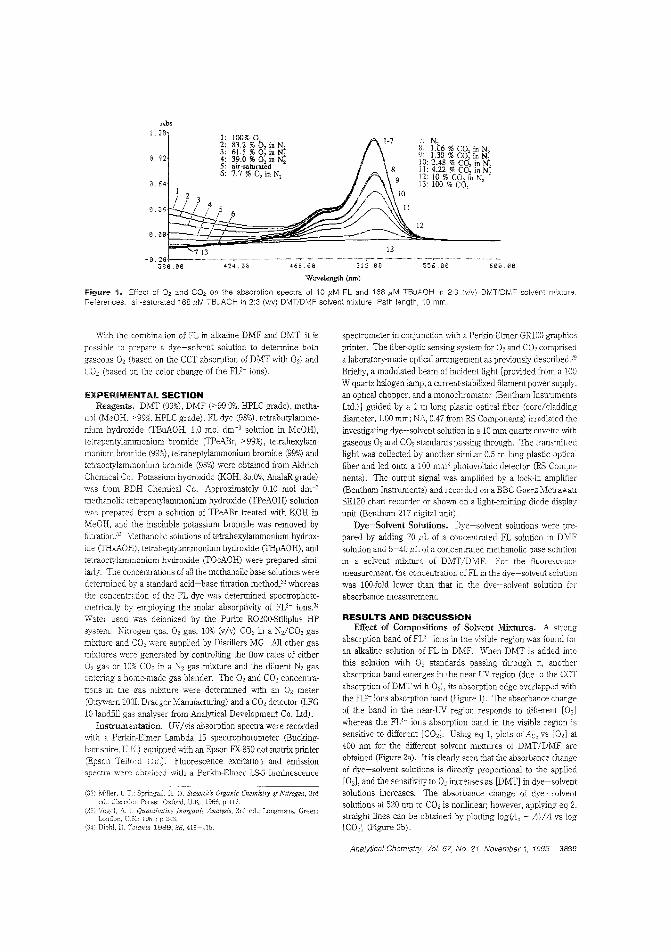
H0 aa556.80
7: N..8: l.u6 % CO2 in N
29: 1.30 % CO2 in N10: 2.48 % CO, in N',11: 4.22 % CO, in N,12: 10 % CO, in N,!3: 100 % CU,
12
13
424.60
1: ~if!'%°6, in N,3: 61.5 % 0, in N,4: 39.0 % 0, in N,5: aIr-saturated6: 7.7 % 0, in N,
5I
'7-13
Abs.2B
B.64
-B.26388. aa 468.8B 512 aB
Wavelength (nm)
Figure 1. Effect of O2 and CO2 on the absorption spectra of 10.uM FL and 168,uM TBuAOH in 2;3 (v/v) DMT/Df'vlF solvent mixtureReferences: air-saturated 166 11M TBJACH in 2:3 (vlv) DMT/DMF solvent mixture. Path length, 10 mm.
With the combination of FL in alkaline DMF and DMT, it ispossible to prepare a dye-solvent solution to determine both[[eseous O2 CQased on the ccr absorption of DMT with O2) andCO2 (based on the color change of the FU- ions).
EXPERIMENTAL SECTIONReagents. DMT (99%), DMF (>99.9%, HPLC grade), metha
nol (J\leOH, >99%. HPLC grade), FL dye (98%), tetrabutylammoniJm hydroxide (TBuAOH, 1.0 mo dm-3 solution in MeOH) ,te:rapentylammonium bromide (TPeABr, >99%), tetrahexylammonium bromide (99%), tetraheptylanunonium bromide (99%) andtnaoctylammonium bromide (98%) were obtained from AldrichChemical Co. Potassium hydroxide (KOH, 85.0%, A~alaR grade)was from BDH Chemical Co. Approximately 0.10 mol dm-3
methanolic tetrapentylammonium hydroxide (TPeAOH) solutionwas prepared from a solution of TPeABr treated with KOH inMeOH, and the insoluble potassium bromide was removed byfiltrati:m.32 Methanolic solutions of tetrahexylammonium hydroxide (THxAOH), letraheptylarrmonium hydroxide (THpAOH), andte'Craoctylammonium hydroxide (TOcAOH) were prepared simi·larly. The concentrations of all the methanolic base solutions weredetennined by a standard acid-base titration method,33 whereasthe concentrction of the FL dye was detennined spectrophotometrically by employing the molar absorptivity of FU- ions."Water used was deionized by the Purite R020o-Stillplus HPsystem. Nitrogen gas, O2 gas, 10% (v/v) CO2 in a Nz/CO, gasmXture and CO, were supplied by Distillers MG. All other gasmixtures were generated by controlling the flow rates of either0: gas or 10% CO2 in a N2 gas mixture and the diluent N2 gasentering a home-made gas blender. The O2 and CO2concentrations in the gas mixture were detennined with an 0, meter(Oxywarn war, Draeger Manufacturing) and a CO, detector (LFG10 landfill gas analyser from Analytical Development Co. Ltd).
Instrumentation. UV/vis absorption spectra were recordedwith a Perkin-Elmer Lambda 15 spectrophotometer (Buckinghamshire, U.K.) equipped with an Epson FX-850 dot-matrix printer(Epson Telford Ltd.). Fluorescence excitation and emissionspectra were obtained with a Perkin-Elmer LSS lurninescence
(32) Miller, 1. SpringaL H. D. Sidwick's Organic Chemistry of Niiroge,z, 3rdcd,; Clarec!oIl Press: OxJOI-d. U.K.., 1966; p 117.
A. I. Inorganic Analysis, 3rel eel.; Longmans, Greer.:1961; Ie 243
Diehl, H. Tclanta 1989,36. 113-(15.
spectrometer in conjunction with a Perkin-Elmer GRI00 graphicsprinter. The fiber-optic sensing system for 0, and CO2 compriseda laboratory-made optical arrangement as previously described. '9Briefly, a modulated beam of incident light [provided from a 100W quartz halogen lamp, a current-stabilized filament power supply.an optical chopper, and a monochromator (Bentham InstrumentsLtd.)J guided by a Imlong piastic optical fiber (core/claddingdiameter, 1.00 rum; NA" 0.47 from RS Components) irradiated theinvestigating dye-solvent solution in a 10 mm quartz cuvette withgaseous O2 and CO2 standards passing through. The transmittedlight was collected by another similar 0.5 m long plastic opticalfiber and led onto a 100 mm' photovoltaic detector (RS Components). The output signal was amplified by a lock-in amplifier(Bentham Instruments) and recorded on a BBC Goerz MetrawattSE120 chart recorder or shown on a light-emitting diode displayunit (Bentham 217 digital unit).
Dye-Solvent Solutions, Dye-solvent solutions were prepared by adding 70 I:L of a concentrated FL solution in DMFsolution and 5-40 I'L of a concentrated methanolic base solutionin a solvent mixture of DMT/DMF. For the fluorescencemeasurement, the concentration of FL b the dye-solvent solution
was 10o-foid lower than that in the dye-solvent solution forabsorbance measurement.
RESULTS AND DISCUSSIONEffect of Compositions of Solvent Mixtures, A strong
absorption band of FU- ions in the visible region was found foran alkaline solution of FL in DMF. When DMT is added intothis solution with 0, standards passing through it, anotherabsorption band emerges in the near CV region (due to the CCTabsorption ofDMTwith O2), its absorption edge overlapped withthe FL'- ions absorption banri (Figure 1). The absorbance changeof the band in the near-UV region responds to different [0,1whereas the FU- ions absorption band in the visible region issensitive to different IC021. Using eq 1, plots of Ao, vs 102J at
400 nm for the different solvent mixtures of DMT/DMF areobtained (Figure 2a). It is clearly seen that the absorbance changeof dye-solvent solutions is directly proportional to t.'"Ie applied
[02], and the sensitivity to O2 increases as [DMTJ in dye-solventsolutions increases. The absorbance change of dye-solventsolutions at 520 nm to CO2 is nonlinear; however, applying eq 2,straight lines can be obtained by plotting 10g(Ac - A) IA vs log[C02] (Figure 2b).
Analytical Chemistry. Vol. 67, No. 21, November 1, 1995 3899
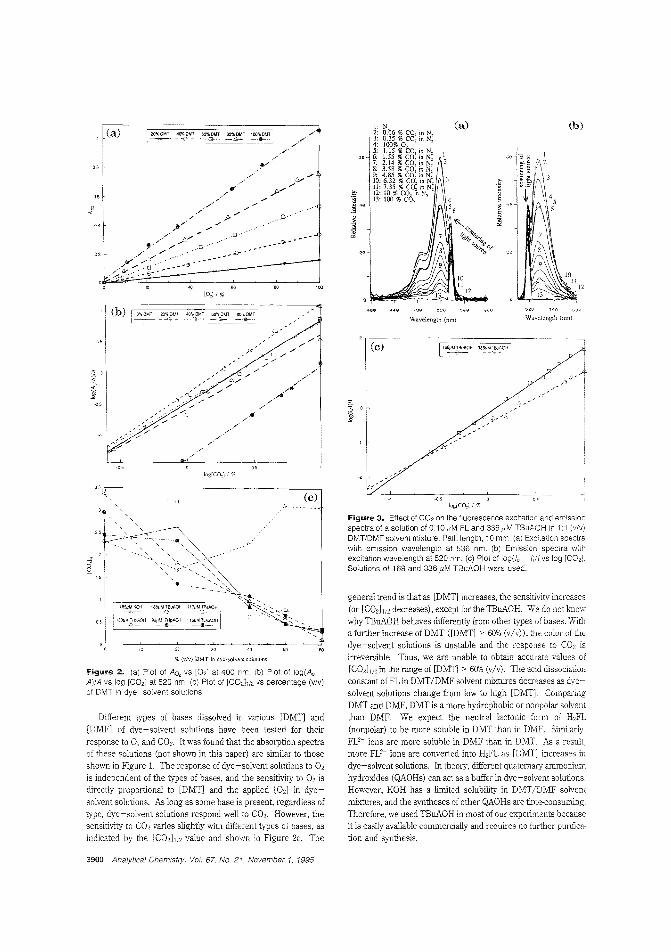
(b)
!O~ j %
/""
.//
./"
././
///
Wavelength (nm)Wavelength (nm)
(c)
/
1 /_.',",'3 J//""
6//
/
/.... ..D.. ··"...·
.... l71 ....
;~
figure 2. (a) Plot at Ao, vs [0,] at 400 nm. (b) Plot of log(Ao
A)IA vs log [CO,] at 520 nm. (c) Plot of [CO'],/' ,s percentage (v/v)of DMT in dye-solvent solutions.
Different types of bases dissolved in various [DMT] and[DMF] of dye-solvent solutions have been tested for their
response to 0, and CO2. It was found that the absorption spectraof these solutions (not shown in this paper) are similar to thoseshown in Figure 1. The response of dye-solvent solutions to O2
is independent of the types of bases, and the sensitivity to O2isdirectly proportional to [DMT] and the applied [02] in dye
solvent solutions. As long as some base is present, regardless oftype. dye-solvent solutions respond well to CO2. However, thesensitivity to C02 varies slightly with different types of bases, asindicated by the [CO'],/2 value and shown in Figure 2c. The
Figure 3. Effect of C02 on the fluorescence excitation and emissionspectra of a solution of 0.10 ,aM FL and 336 /IM TBuAOH in 1:1 (v/v)DMT/DMF solvent mixture. Path length. 10 mm. (a) Excitation spectrawith emission wavelength at 536 nm. (b) Emission spectra withexcitation wavelength at 520 nm. (c) Plot of log(l, - 0;! vs log [CO,].Solutions of 168 and 336 pM TBuAOH were used.
general trend is that as [DMT] increases, the sensitivity increases(or [CO,] 1/2 decreases), except for the TBuAOH. We do not knowwhyTBuAOH behaves differently from other types of bases. Witha further increase ofDMT ([DMT] > 60% (v/v», the color of thedye-solvent solutions is unstable and the response to CO, isirreversible. Thus, we are unable to obtain accurate values of[CO,L;z in the range of [DMT] > 60% (v/v). The acid dissociationconstant of FL in DMT/DMF solvent mixtures decreases as dyesolvent solutions change from low to high [DMT]. CompalingDMT and DMF, DMT is a more hydrophobic or nonpolar solventthan DMF. We expect the neutral lactonic form of H,FL(nonpolar) to be more soluble in DMT than in DMF. Similarly,FU- ions are more soluble in DMF than in DMT. As a result,more FU- ions are converted into H,FL as [DMT] increases indye-solvent solutions. In theory, different quaternary ammoniumhydroxides (QAOHs) can act as a buffer in dye-solvent solutions.However, KOH has a limited solubility in DMTIDMF solventmixtures, and the syntheses of other QAOHs are time-consuming.Therefore, we used TBuAOH in most of our experiments becauseit is easily available commercially and requires no further purification and synthesis.
(c)
log!CO,j / %
% (vlv) DMT in dye-solvent solutions
25
35,\
3900 Analytical Chemistry. Va!. 67. No. 2'/. November 1, 1995
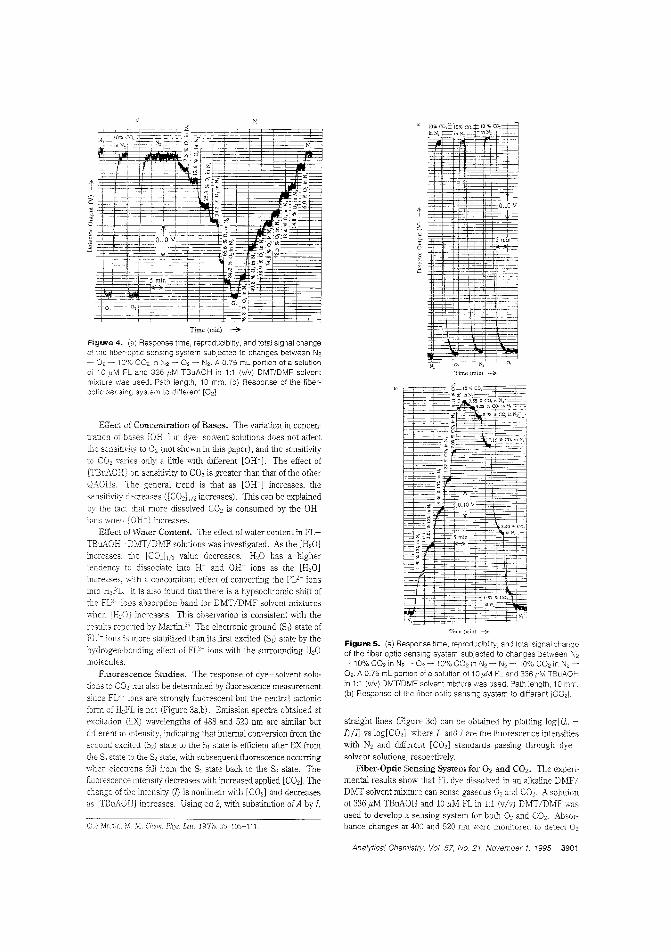
O.10~
10%inN:
bl
Imi
;t)
Time (min) ~
fig"r., 4. (2) Response time, reproducibiity, and totai signai changethe fiber-optic sensing sys1em sUbjected to changes between N2
-- 02 ~· 1O~/O CO2 in \)2 - O2 - N2. A 0.75 mL portion of a solutionof 10 .LiM FL and 336 ,uM TBuAOH in 1:1 (v/v) DMT/DMF solventmixture was Jsed. Path leng'h, 10 mm. Ib) Response of the fiberoptic sensing system to different [02]
N. 0, N,
Thne (min) -?
Effect of Concentration of Bases. The variation in ccncentration of bases [OE-] in dye-solvent solutions does not affectthe sensitivity to O2 (not shewn in this paper), and the sensitivityto CO, varies only a little with different [OH-]. The effect of
[TBuAOH] on sensitivit'J to CO, is greater than that of the otherQAOHs. The general trend is that as [OW] increases, thesensiti,ity decreases ([C02]:n increases). This can be explained
by the fact that more dissolved CO2 is consumed by the OHions when [OH-] increases.
Effect of Water Content. The effect of water content in FLTBuAOH-DMT/DMF solutions was investigated. As the [H20]
increases, the [C0211n value decreases. H20 has a highertendency to dissociate into Wand OW ions as the [H,O]increases, "ith a concomitant effect of converting the FU- ionsinto H,FL. is also found that there is a hypsochromic shift ofthe FU- ions absorption band for DMTIDMF solvent mixtures\vher. [H20] increases. This observation is consistent with the
results reported by Martin.'" The electronic ground (S,,) state ofFU- ions is more stabilized than its first excited (S]) state by thehydrogen-bonding effect of FU- ions with the surrounding H,Omolecules.
Fluorescence Studies. The response of dye-solvent solutions to CO:; can also be determined by fluorescence measurement
since FU- ions are strongly fluorescent but the neutrallactonicfonn of H2FL is not (Figure 3a,b). Emission spectra obtained atexcitation (EX) wavelengths of 488 and 520 nm are similar butdifferent in intensity, indicating that internal conversion from thesecoud excited (52) stale to lhe 51 s::ale is efficient after EX from
the Si state to the Sz state, with subsequent fluorescence Decuning
when elew-cns fall from the S1 state back to the S0 state. Thefluorescence intensity decreases '~ith increased applled [CO,I. Thec'1ange of the intensity (I) is nonlinear with [CO,] and decreasesas [TBu.i\.OH] increases. Using eq 2. with substitution of A by I.
:VI. Chon. Plzys. Lett. 1975. .i5. 105-111
ITim" (min) --iii>
Figure 5. (a) Response time, mprcducblity, and total signal changeof the fiber-optic sensing system subjected to changes between N,-10% CO2 in N2 - O2 -10% C02 in N2 - N2 -10% C02 in N2
O2. A 0.75 mL portion Df a solution of 10 I'M FL and 336 I'M TBupOHin 1:1 (v/v) DMT/D!V1F solvent mixture was used. Path length, 10 mm.(b) Response of the fii)er-optic sensing system to different [COd.
straight lines (Figure 3c) can be obtained by plotting log[(I"I)1l1 vs 10g[COz], where 10 and J are the !1uorescence intensitieswith N, and different [C02] standards passing through dyesolvent solutions, respectively.
Fiber-Optic Sensing System for O2 and CO,. The expe!imental results show ,hat FL dye dissolved in an alkaline DMFIDMT solvent mixture can sense gaseous O2 and CO2. A solutionof 336 I'M TBuAOH and 10 I'M FL in 1:1 (vl'l) DMT/DMF wasused to develop a sensing system [or both O2 and CO2. Absorbance changes at 400 and 520 nm were monitored to detect O2
Analytica! Chemistrj, Vol. 67, No. 21, November 1, 1995 3901
and CO:!, respectively. Although fluorescence measurement ofFU· ions, in principle, can be adapted to sense CO" we foundthat there was a cross-interference Dn CO, from 0, due to thefluorescent quenching effect of molecular 0 , on FU· ions (Figure3a, line 4). Thus, all the studies were based on absorptionspectroscopy. Using the expelimental setup described earlier,the response time, reproduciblily, and total signal change of thesensing system for 0 1 and COL were invesiiga:ed.
Figure 4a shows the response of the sensing system monitoredat 400 nm to step changes in gas concentration from 100% N, to100% O2 and from 100% 0, to 10% CO, in N]. The reversibility isgood, and there is no cross-interference from 00,. The responsetimes are 0.67 and 1.75 min for a 90% signal change from N2 to0, and from 0, to N2, respectively. The response to differentlevels of 0, was investigated (Figure 4b), and the decrease insignal level with increasing [0,] is nonlinear bul obeys the BeerLambert law in a plotting of log(h!IoJ vs [0,], where I" and10 ] are the signal levels recorded in'N, ~nly and O2, respectively.Figure 5a shows the response of the sensing system at 520 nmto step changes in gas concentration from 100% N2 to 10% CO, inN, and from 10"10 CO2 in N2 to O2. The reversibility is good, andthere is no cross-interference from 0,. l10e response times are0.35 and 4.75 min for a 90% signal change from N, to 10% CO, inN, and from 10"10 CO, in N, to 1\2, respectively. The response todifferent levels of CO2 was investigated (Figure 5b), and thedecrease in signal level with increasing [CO,] was found to benonlinear, but a straight line can be obtained by plotting log (A"
AliA vs log [CO,], where A" = 10g(I"II,) and A = log (I"I!co). Ib is the signal level obtained by using a solution of 336uM TBuAOH in 1:1 (vlv) DMT/DMF, whereas h, and Ico, aresignai levels recorded with N2 and CO, passing through a sol~tionof 336 pM TBuAOH and 10 pM FL in l:l ('flv) DMT/DMF,respectively.
The precision of the detecting system is 1.59% (n = 5) in agas mixture of 40.1% 0, in N, and 0.89% (n = 5) in a gas mixtureof 6.95% CO2 in N,. The stability is good, having 0.83-2.92% signaldrift per hour of operation. This dye-solvent solution is fairly
3902 Analytical Chemistry, Vol. 67, No. 21. November I, 1995
stable for over a peIiod of 6 months at ambient conditions, havingonly 1.98% loss in sensitivity to O2 and 5.03% loss in FL due to
photobleaching of FL
CONCLUSIONSThe sensitivity of dye-solvent solutions to 0, and CO, can be
tuned by adjusting the compostition of the DMT/DMF solventmixture, the initial base concentration, and the water content.There are several advantages to using these dye-solvent solutionsto determine O2 and CO2. There is no cross-interference betweenthe two gases. Preparation of dye-solvent solutions is simpleand fast. The two absorption bands in the visible region allowthe use of plastic optical fibers. The chemicals used are cheapand easily available commercially.
Finally, to avoid a slight signal drift caused by a smallevaporation of the solvents, the dye-solvent solution can bereplaced with a fresh one at ~2 h intervals. Alternatively, thereagent can be confined behind a small-pore-size gas-permeablehydrophobic [poly(tetrafluoroethylene) ] membrane so as toprevent any solvent loss and water contamination. The stabilityof the output signal can be further improved by ratioing theintensities at an analytical wavelength to a reference wavelength(e.g., above ~550 nm, free from 0, and CO, interferences). Thedye-solvent solution can possibly be used as a sensing mediumfor the development of a fiber-optic O';CO" sensor in the future.
ACKNOWLEDGMENTThe authors express their thanks to Dr. A. Tubb (University
of the West of England) for the loan of the oxygen and carbondioxide detectors and to the University of the West of Englandfor financial support.
Received for review October 5, 1994. Accepted August 4.1995.°
AC9409849
<') Abst;-act published in Advance ACS Abstracts, October 1, :995.
Anal. Cham 1995, 67, 3903-3910
Automated In-Line Extraction of Uranium(VI) fromRaffinate Streams with On-Line Detection byCathodic Stripping Voltammetry
Johannes T. van Elteren,t Constant M. G. van den Berg,*,t Hao Zhang,t,§ Trevor D. Martin,* andEric P. Achterbergt
Oceanography Laboratories, University of Liverpool, P.D. Box 147, Liverpool L69 3BX, u.K., and Analytical ServicesTecnnical Department B229, Chemical Analysis, BNFL, Sel/afield Seascale, Cumbria CA 20 1PO, u.K.
An automated memod for on-site monitoring of uranium(\'1) in raffinate streams originatinf.( from nuclear fuelreprocessing plants is described. An in-line strippingprocedure (based on liquid/liquid extraction) was developed to extract U(VI) from this stream, a solvent mixtureof 20% tributyl phosphate and nitric acid in kerosene, intoan aqueous sodium sulfate solution. Degradation products in me solvent mixture, especially dibutyl phosphate,give rise to very strong complexes and are responsible formoderate but constant U(VI) recoveries (~50%). Optimalconditions for in-line stripping comprise a mixing ratioof e.xtractant (0.5 M sodium sulfate in water)/solventmixture of ~3 and a pumping rate of ~0.4 mL min-I ofthe solvent mixture. The determination of U(VI) was byon-line cathodic strippingvoitannnmetry (CS"), precededby adsorptive collection of the U(VI) as an oxine complexonto a hanging mercury drop electrode. Quantities of1-2 mL of the aqueous extract were pumped into the'Voltammetric cell and diluted (1/5 to 1/10) with abackground electrolyte containing 0.1 M PIPES buffer,2 x 10-4 l'I1 oxine, 10-4 M EDTA, and 0.2 M hydrazinehydrate (pH 9.0). The CSV peak for U(VI) was obtainedat -0.68 Vwith a detection limitof20 nM in the raffinatestream using an adsorption time of 120 s. Both the inlinc stripping procedure and the on-line measurementwere. fully automated, with a relative standard deviation
the measurements of <5%.
This study describes a method for the determination ofhexavalent uranium (U (V1)) in mixtures of tributyl phosphate(fBP) and kerosene. These solvents are used in the reprocessing
nuclear fuels. In this process, the "unburnt" uranium isseparated from plutonium ard other radioactive fission products.To this end, the "spent" fuel elements are dissolved in concentrated nitric acid, and the U(VI) in the resulting solution isextracted, purified, and preconcentrated with a TBP/kerosenemixture (usually ~20% TBP in kerosene) in a three-step procedure:: In the first step, uranium (VI) and plutonium (IV) are
separated together from the fission products; uranium (VI) andplutonium (IV) are ex1Tacted into the organic phase, and the fission
Un:wrsit:, d Liverpool., B'\FL.
Current address: Emironmental Science Department, Lancaster University,LlIlcaster 4YQ,I;.K
(1) Collins.]. C. Radt'oaclive Wastes, Their Treatment and Disposal; Wiley: NewYork, 1960: Chapter 2.
0003-2700/95/0367-390389.00/0 © 1995 American Chemical Society
products remain in the aqueous phase. In the second step,
plutonium (IV) is transferred to the aqueous phase hy reducing itto the trivalent state, while uranium (VI) remains in the organicphase. In the third step, the uranium (VI) is stripped from theorganic phase by washing with dilute nitric acid. Although mostof the uranium is back-extracted into the aQueous nitric acid phase,trace amounts remain in the organic phase. Insight into theremaining uranium in this phase is of eminent importance in thereprocessing of nuclear fuels.
The chemistry of the uranium (VI) -nitric acid- TBP systemhas been reviewed by De et al.' The extraction is generallyfonnulated as an ion exchange reaction, the extractant beingregarded as a liquid ion exchanger. The ex1Taction reactions (sidereactions are ignored) are
and
Dotea, + 2NOS-aq + 2TBPOCg = U02(N°3)2'2TBPocg(2)
In nuclear fuel reprocessing, several beneficial decompositioneffects have been observed in the extraction of U(VIi with TBPin kerosene. Due to [adiolytic and hydrolytic decomposition, the
extractant partially decomposes to mono- and dibutyl phosphoric
acids, which complex and extract U(VI) as welL Even smallamounts of dibutyl phosphate (DBP) can alter the extraction
properties of the TBP solvent. DBP (protonated and dimerizedunder the given conditions) extracts U(VI) with high distributionratios even at low pH values of the aqueous phase according tothe reaction3
U022\Q + 2(HDBP)2 ocg = U02{H(DBP)2h ocg + 2H\q
(3)
Under comparable conditions the extraction coefficient for reaction3 is a factor of 1()3-1O' grealer than that for reaction 2. Synergisticeffects from a combination ofTBP and DBP further enhance theextraction of U(VI).'
(2) De, A K; Khopkar, S. M.; Chalmers, R. A &;!vent Extraction of Metals:Van Nostrand Reir.hold Co.: London, 1970.
(3) Baes, C. F.; Zingaro, R. A; Coleman, C. Chem. 1958,62, :29.(4) Hahn, H. T.; Van lier Wall, E. M. j. Inorg. 1964,26. 191.
Analytical Chem/slr;, Vol. 67 No. 21, November 1, 1995 3903
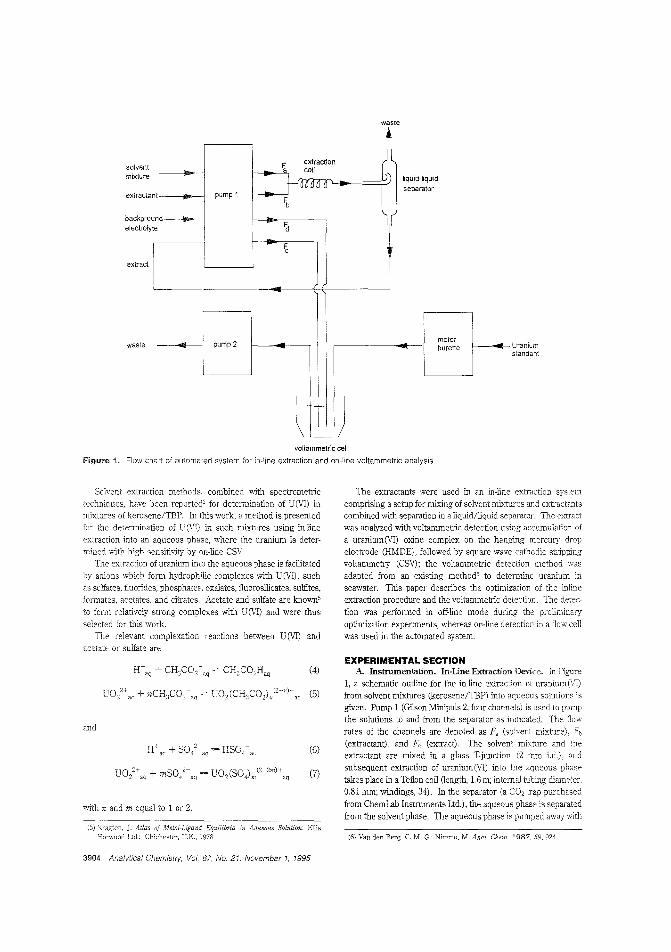
solvent =:Jmixture
extractant
background _____
electrolyte I
extract
waste
pump 1
pump 2
waste
t
i) liquid-liquidseparator
motorburette Uranium
standard
voltammetric cell
Figure 1. Flow chart of automated system for i'l-line extraction and on-line voltammetric analysis.
Solvent extraction methods, combined with spectrometrictechniques, have been reported' for determination of U(VI) inmixtures of kerosene/TBP. In this work, a method is presentedfor the determination of U(VI) in such mixtures using in-lineextraction into an aqueous phase, where the uranium is determined with high sensitivity by on-line CSv.
The extraction of uranium iIlIO the aqueous phase is facilitatedby anions which form hydrophilic complexes with U(VI), suchas sulfates, fluorides, phosphates, ox,Jates, tluorosilicates, sulfites,formates, acetates, and citrates. Acetate and sulfate are known5
to form relatively strong complexes with U(V1) and were thusselected for this work.
The relevant complexation reactions between U (VI) andacetate or sulfate are
H\q + CHsCOz- nq = CHSCO,Haq (4)
nq + nCH3CO,- ao = t-02(CH3COZ)n12-n)\0 (5)
and
H'aq+SO/ aq=HSO,-" (6)
UO/\q + mSO/-aq = U02 (SOJn,12-2m)+,q (7)
with nand m equal to 1 or 2.
Aqueous Solution; Ellis
3904 Analylical Chemlslry, Vol. 67, No. 21. November 1, 1995
The extractants were used in an in-line extraction systemcomprising a setup for mixing of solvent mixtures and extractmtscombined with separation in a liquid/liquid separator. The extractwas analyzed with voltammetric detection using accumulation ofa uranium (VI) oxine complex on the hanging mercury dropelectrode (HMDE), followed by square wave cathodic strippingvoltammetry (CS\~; the voltammetric detection method wasadapted from an existing method6 to determine uranium inseawater. This paper describes the optimization of the inlineextraction procedure and the voltammetric detection. The detection was performed in off-line mode during the preliminaryoptimization experiments, whereas on-line detection in a flow cellwas used in the automated system
EXPERIMENTAL SECTIONA Instrumentation. In·line Extraction Device. In figure
1, a schematic outline for the in-line extraction of uranium (\;1)from solvent mixtures (kerosene/TEP) into aqueous solutions isgiven. Pump 1 (Gilson Minipuls 2, four channels) is used to pumpthe solutions to and from the separator as indicated. The flowrates of the channels are denoted as F, (solvent mixture), Fb(extractant), and F, (extract). The solvent mL'(ture and theextractant are mixed in a glass T-junction (2 mm i.d.), andsubsequent extraction of uranium (VI) into the aqueous phasetakes place in a Teflon coil (length, L6 m; internal tubing diameter,0.81 mm; windings, 34). In the separator (a CO2 trap purchased
from ChemLab Instruments Ltd.), the aqueous phase is separatedfrom the solvent phase. The aqueous phase is pumped awaY'hith
(6) Van den Berg, C. M. G.; Nimmo, M. Anal. Chem. 1987. .59, 924.
a flow rate which is smaner than the combined flow rates F,and Fe of the incoming solutions. This gives an excess of solutionin the separator, resulting in a waste flow rate (of solvent andaqueous phase) of F, +Fi, - }~. T~e pumped aqueous phase iscollected (off-line measurements) or pumped into the vullamrnetDc
cell (on-line measureme~ts) The internal diameters of the pump
tubing (PVC) were 0.64 mm for the solvent mixture. 1.14 rum forthe extracta:lt, and 1.02 (off-line) or 0.64 mm (on-line) for theaqueous extract. PVC tubing was used throughout, as thecompatibility of the kerosene/TBP mixture with other types oftubing is unpredictable.
Electrochemical Equipment. Iill Autolab polarograph (EcoChemie BV) with a 'vIetroh-n Model 663 hanging :neroury drop
electrode was used for the en- and off-line voltammetric uraniumdetenninations. Potentials ITe given with respect to an Ag/AgCI,saturated Agel in 3 M KCI reference electrode (SSCE). For off1me measurements, the computer program General PurposeElectrochemical System 3.1 (Eco Chemie BV) was used. For online measuremenrs, the soft01are for automated analysis (ElectroAnalytical System 1.0: Eco Chemie BV) was moclified with featurespreviously used for automated seawater analysis? The modifications made possible to central the pumps for automated flow
cell measurements. Pump 1 delivers the extract to the voltammetric cell (see above) and also pumps the cell buffer (flow rateF,,) using PVC pump tubing with an internal diameter of 1.85 mm.Pump 2 (1Vletrohm 683 pump Unit) is a high-capacity pump for
emptying the cell. A Metrohm 665 Dosimat autoburet was usedto perrorm standard additions to the cell, generally a constant
volume of ])0 I'L a uranium working solution (10 ,uM, seebelow).
B. Matclia!s. A Milli-Ro system and a Milli-Q systemCVlillipore) were used in tandem to produce pure water (MQw)
for preparation of the reagents. All chemicals used were ofanalytical reagent grade. An aqueous stock solution of 0.02 Mweine (8-hydroxyquinoline, BDH) was prepared in 0.05 M HC!.
aqueous stock solution of 0.1 M EDTA (ethylenediaminetetraacetic aciel, sodium salt, BDH) was prepared in MQW, and thepH was adjusted to 7 using NaOH. An aqueous pH buffer stock
solution was prepared containing 0.1 M PIPES (l,4-piperazinediethanesulfonic acid. monosodium salt, BDH) with a pH adjustedto 7 '0,ith NaOH. Aqueous stock solutions of 0.1 M acetate and0.5M sulfate were prepITed by dissolving sodium acetate (BDH)and sodium sulfate (BDH) in MQW. Hydrazine hydrate solution(}9.0%) was from BDH. Kerosene (low odor), tributyl phosphate(99%). And ammonia solution (about 30% NH,,) were from Aldrich.Dibutyl phosphate (DBP) was from Fluka. The cell buffer forautomated measurements contained 250 mL of 0.1 M PIPES buffer(pH 7), 2.5 mL of 0.02 M oxine stock solution, 2.5 mL ofhydrazinehydrate (99%), and 0.5 mL of 0.1 M EDTA stock solution.
An aqueous U(VI) working solution containing 10 {'M U indilute Hel (0.035%) was prepared from a commercially available
standard solution (Aldrich, 9751'g/mL (4.1 mM) U in 1% HNO,).A synthetic U (VI) solutioE in a solvent mixture (20% TBP/kerosene) was prepared as follows: a mixture containing 10 mL
of water, 4 mL of 70% HNO:;, 8 mL of kerosene, and 2 mL ofTBPwas shaken in a separation funnel for about 1 min; after settling
of the phases. the upper layer was separated and spiked with U (\11)
on tbe 1 level. The aqueous spike was ultrasonically mixed
G. Anal. Chim. Acta 1994,284,
with the sample for 15 min. It can be calculated that >99.5% ofthe U (VI) is transfen-ed to the solvent as a result of complexationbyTBP.
A degraded raffinate was obtained from BNFL (British NuclearFuels pic) to test the system. This simulated sample containedkcroscnc (80%), TBP (--20%), nit-ic acid (0.2- 0.3 M), RN01 (0.9%),RNa,! (05%), RjR,CO (05%), RCOOH «0.2%), and DBP (1000
I'g/mL). The sample had a bright yellow color. Most experiments were carried cut willi this sample. For optimization of themethod, the solution was spiked with U (VI) on the 2 ,uM level.Here, too, the aqueous spike was ultrasonically mixed ,vith the
sample for 15 min.e, Prooedures, In-Line Extraction Procedure, The
uranium iT, the sample solvent is extracted into sodium acetate
or sulfate solutions using flow rates of 0.44 (F,J, 1.32 Ctb), and1.07 (off-line) or mL min' (on-line) (F,.) according to the
scheme set out Figue 1. The mixing ratio R (Fb/F,J is 3. Theflow rates are average values, as the day-to-day variation was ....... 5%.The solvent mixtu:"es were thus extracted in-line, awl all extractwas collected continuously (for off~line measurements) or deliv
ered to the voltammetric cell (for on-line measurements). Thevoid volume of the liquid/liquid separator (~1 mL) made itnecessary to flush with the solvent mixtures between IT,easure
ments.Off-Line Voltammelrie Procedure, One millfliter of the
extract was pipelted into the voltammetric cell, to which 8.8 mL
0.1 M PIPES buffer. 100 ,uL of the Olane stock solution (final
cOEcentration,2 " M), 100 I'L of 99% hydrazine hydrate (finalcor.centration, 20 uM), and 20 pLofthe EDTAstock solution (finalconcentration 0.1 mM) were added; the final pH of this solutionwas 9.0, and the tota! volume of the solution in the cell was 10.0mL. After deaeration of the solution by purging v'lith water
saturated nitrogen fer 5 rr-in, the CSV cycle was started. A newmercury drop was ex;mded (drop size setting, 3), and adsorption
at a potential of -0.5 V for 30-120 s (depending on theconcentration) was pe:iormed under continuous stirring (stirrerselting, 5), followed by a period of quiescence of 10 s. Thepotential scan was carried out using a square wave modulation at50 I-lz and a scan rate of 25 mV S-l, Usually, the potential scanning
range was from -0.5 -0.85 V. The peak appeared at a potential
of -0.68 V. The measurement was repeated after standard
addition of uranium to quantify the uranium concentration in the
voltammettic eeLOn-Line Voltammetric Procedure. The pumping time of
pump 1 was set deliver 10.0 mL of a solution with a ratio ofbackground electrolyte/extract of 5 10 to the voltammetric cell.
The flow rate (Fel ) of the background electrolyte was 2.71 mLmin-I. The pumping time (to empty the cell) of pump 2 was set
to 60 s. The sequence of the automated procedure was asfollows: empty the cell, rinse with the background electrolyte/extract solution, empty again, and fin with the same solution forthe rneasuremenl. The voltarnmetric measurement is the sameas for the off-line procedure but is now pe:iormed automatically,
including the standard addition.
D. Calculations. Uranium Extraction Efficiency fromSolvent. In order to establish the extraction of uranium fromsolvent mixtures. an amount of sample was spiked with U(VI) to
yield an additional concentration of A Assuming original Uconcentrations of x~ and for sample and spiked sample,respectively, the mea::C,llreo conc:en1rations in the voltammetric. cell.
Analytical Chemistry. Vol. 67 No. 21. November 1, 1995 3905
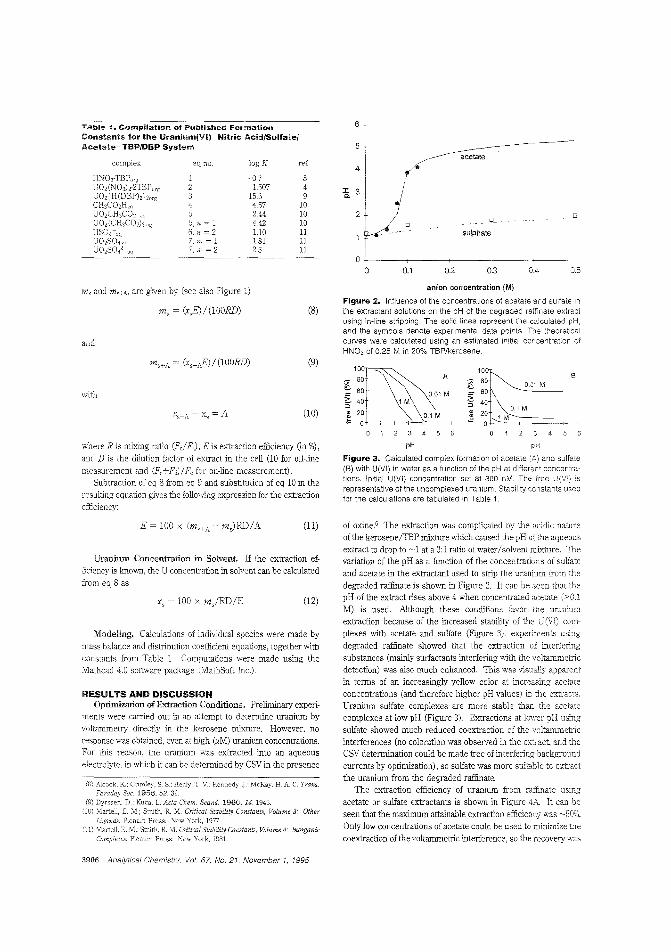
6Table 1 ~ Compilation of PubHshed FormationConstants for the Uranium(VI)-Nitric Acid/SulfatelAcetate-TBP/DBP System
0.50.4
o
0.3
sulphate
0.2
o
0.1
logK ref4
-0.7 81.507 4 :I: 315.5 9 Q.
4.57 102,44 10 24.42 101.10 11
:11.81 112.5 11
0
eq no.
55, n = 16. n = 27, rn = 17, rn = 2
complex
m, and m,+A, are given by (see also Figure 1)
ms = (x,pj / (100RD)
and
(8)
anion concentration (M)
Figure 2. Influence of the concentrations of acetate and sulfate inthe extractant solutions on the pH of the degraded raffinate extractusing in-line stripping. The solid lines represent the calculated pH,and the symbols denote experimental data points. The theoreticalcurves were calculated using an estimated initial concentration ofHN03 of 0.25 M in 20% TBP/kerosene.
ms+A = (xs+AE) / (100RD)
with
(9)
(10)
~1~~A60 0.01 M
2. 40 1 M::>~ 20 0.1 M~ a .
o
10
C 80 0.01 M60
2. 40:; 20 0.1 M~ 1M
0"'-'-
o 1
B
where R is mixing ratio (Fb/ F,,), E is extraction efficiency (in %),and D is the dilution factor of extract in the cell (10 for off-linemeasurement and (F,.+Fd)/F, for on-line measurement).
Subtraction of eq 8 from eq 9 and substitution of eq 10 in theresulting equation gives the following expression for the extractionefficiency:
pH pH
Figure 3. Calculated complex formation of acetate (A) and sulfate(B) with U(VI) in water as a function of the pH at different concentrations. Initial U(VI) concentration set at 300 nM. The rree U(Vlj isrepresentative of the uncomplexed uranium. Stability constants usedtor the calculations are tabulated in Table 1.
Uranium Concentration in Solvent. If the extraction efficiency is known, the U concentration in solvent can be calculatedfrom eq 8 as
Modeling. Calculations of individual species were made bymass balance and distribution ccefficient eqnations, together withconstants from Table 1. Computations were made using theMathcad 4.0 software package (MathSoft Inc.)
(8) Alcock, K.; S.; Healy. T. V.; Kennedy, l; McKay, H. A C. Trans.Faraday Soc. 52, 39.
(9) Dyrssen, D.; Kuca. L. Acta Chem. Scand. 1960, 14,1945.(10) Martell, E. M.; Smith, R. M. Critical Stability Constants, Volume 3: Other
Ligands: Plenum Press: New York, 1977.(11) Martell, E. M.: Smith, R M. Critical Stability Constants, Volume 4: Inorganic
Complexes: Plenum Press: New York, 1981.
RESULTS AND DISCUSSIONOptimi7~tionof Extraction Conditions. Preliminary experi.
ments were canied out in an attempt to determine uranium byvoltammetry directly in the kerosene mLxture. However, noresponse was obtained, even at high CuM) uranium concentrations.For this reason, the uranium was extracted into an aqueouselectrolyte, in which it can be detennined by CSV in the presence
of oxine6 The extraction was complicated by the acidic natureof the kerosene/TBP mixture which caused the pH of the aqueousextract to drop to ~1 at a 3:1 ratio of water/solvent mixture. Thevariation of the pH as a function of the concentrations of sulfateand acetate in the extractant used to strip the uranium from the
degraded raffinate is shown in Figure 2. It can be seen that thepH of the extract rises above 4 when concentrated acetate (>0.1M) is used. Although these conditions favor the uraniumextraction because of the increased stability of the U(VI) complexes with acetate and sulfate (Figure 3), experiments using
degraded raffinate showed that the extraction of inteIieringsubstances (mainly suIiactants inteIiering with the voltammetricdetection) was also much enhanced. This was visually apparent
in terms of an increasingly yellow color at increasing acetateconcentrations (and therefore higher pH values) in the extracts.Uranium sulfate complexes are more stable than the acetatecomplexes at low pH (Figure 3). Extractions at lower pH usingsulfate showed much reduced coextraction of the voltammenicinteIierences (no coloration was observed in the extract, and theCSV detennination could be made free of inteIiering backgroundcurrents by optimization), so sulfate was more suitable to extractthe uranium from the degraded raffinate.
The extraction efficiency of uranium from ra[finate usingacetate or sulfate extractants is shown in Figure 41\.. It can beseen that the maximum attainable extraction efficiency was ~50%.
Only low concentrations of acetate could be used to minimize thecoextraction of the voltammetric inteIierence. so the recovery was
(12)
(11)
Xs = 100 x m/RD/E
E = 100 x (m s+A - mJRD/A
3906 Analytical Chemistry. Vol 67. No. 21 November 1. 1995
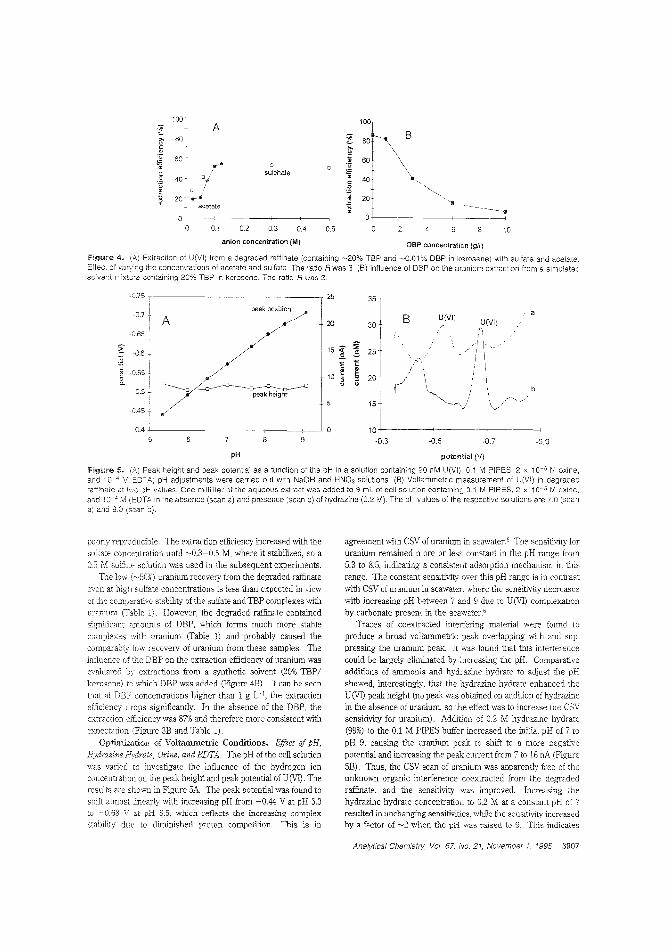
~ 1::tA. 1001
", c solf----. Bu
sol \~
60 t [;'
~t:W
0
~ I \1 sulphate.~ 40 1 " 40+ .~
I t:0 1 ",~ Ttl~
20]'il 20] ~ '1lacetate 1< ------........-..---m0 1 " 0 1
----f
0 0.1 0.2 0.3 OA 0.5 10
anion concentration (M) DBP concentration (gil)
!Figure 4. (A) Extraction of U(VI) from a degraded raffinate (containing .-....-20% TBP and ---0.01 "/0 DBP in kerosene) with sulfate and acetate.Effect of varying fhe concentrations of acetate and sulfate. The ratio R was 3. (B) Influence of DBP on the uranium extraction from a simulatedsolve'lt mixtve containing 20:>/0 TBP in kerosene. The ratio R was 3.
aBI:
L5 ~ i'.s .sc ~
" ~10 t~
~u
0.7 +
·0.5
·0.75 c ------------- ,
·0.45
·0.65
~06~~ ·0.55-00..
·0.4 +.'----+c---+----I----+----'-
-0.3 -0.5 -0.7 -0.9
pH potential (VI
5. Peak height and peak potential as a function of Ihe pH in a solution containing 20 nM U(VI). 0.1 M PIPES. 2, 10-5 Maxine,'0-4 pH adjustments were carried out with NaOH and HNO, solutions. (6) Voltammetric measurement of U(VI) in degraded
raffinate at two values. One milliliter of the aqueous extract was added to 9 mL of cell solution containing 0.1 M PIPES, 2 x 10⁻⁵ Maxine,and 10- 4 M in the absence (scan a) and presence (scan b) of hydrazine (0.2 M). The pH values of the respective soutions are 7.0 (scana) and 9.8 (scan b).
poorly reproducible. The extraction efficiency increased with thesulfaie concentration until -0.3-0.5 M, where it stabilized, so a0.5 1\1 sulfate solution was used in the subsequent experiments,
The low (-50%) uranium recovery from the degraded raflinate
even at high sulfate concentrations is less frlarl expected in viewof the comparative stability of the sulfate and TBP complexes withuran'um (Table 1). However, the degraded raflinate containedsignificant amounts of DBP, which forms much more stablecomplexes with uranium (Table 1) and probably caused thecomparably low recovery of uranium from these samples. Theinfluence of the DBP on the extraction efficiency of uranium wasevaluated by extractions from a synthetic solvent (20% TBP/kerosene) to which DBP was added (Figure 4B) It can be seen
that at DBP concentrations higher than 1 g Vi, the extractionefficiency drops significantly. In the absence of the DBP, theextraction efficiency was 87% and therefore more consistent withexpectation (Figure 3B and Table 1).
Optimization of Voitammetric Conditions. Effect of pH,Hydrazine Hydrate, Oxine, and EDTA. The pH of the cell solution
was varied to investigate the influence of the hydro."en ionconcentration on the peak height and peak potential of U(VI). Tneresults are shown In Figure 5A The peak potential was found toshift almost linearly with increasing pH from -0.44 V at pH 5.3
-0.68 V at pH 8.5, which reflects the increasing complex
stability due to diminished proton competition. This is in
agreement with CSV of uranium in seawater. Ii The sensitivity foruranium remained more or less constant in the pH range from5.3 to 8.5, indicating a consistent adsorption mechanisrr in thisrange. The constant sensitivity over this pH range is in contrast
with CSV of uranium in seawater, where the sensitivity decreases
with increasing pH between 7 and 9 due to U(VI) complexationby carbonate present in the seawater.'
Traces of coextraeted interferlng materlal were found toproduce a broad voltammetrlc peak overlapping with and suppressing the uranium peak It was found that this interferencecould be largely eliminated by increasing the pH. Comparativeadditions of ammonia and hydrazine hydrate to adjust the pHshowed, interestingly, that the hydrazine hydrate enhanced theU(VI) peak height (no peak was obtained on addition of hydrazinein the absence of uranium, so the effect was to increase the CSVsensitivity for uranium). Addition of 0.2 1\1 hydrazine hydrate
(99%) to the 0.1 M PIPES buffer increased the inilial pH of 7 to
pH 9, causing the uranium peak to shift to a more negativepotential and increasing the peak ClllTent from 7 to 16 nA (Figure
5B). Thus, the CSV scan of uranium was apparently free of theunknown organic interference coextracted from the degradedraflinate, and the sensitivity was improved. Increasing thehydrazine hydrate concentration to 0.2 M at a constant pH of 7resulted in unchanging sensitivities, while the sensitivity kcreasedby a factor of "-'2 when the pH was raised to 9. This indicates
Analytical Chemislry Vol. 67, No. 27, November 1, '995 3907
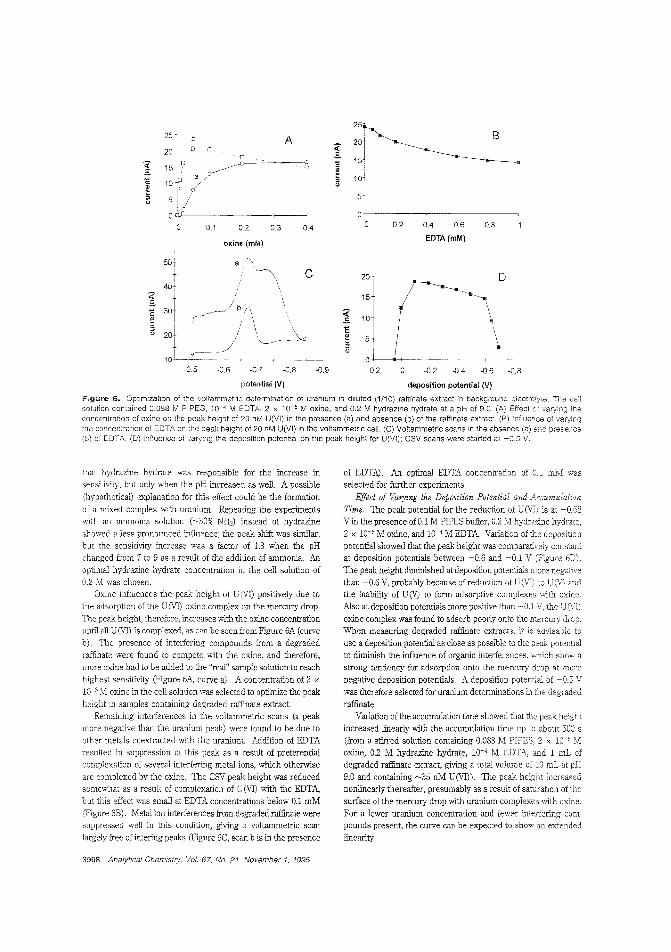
25-
25 T b A 2020 I CJ ~
T [ ..s15
~
"V="-~c
..s I a ~C
10r~
':i!:Q
5" 5T
00 0.1 0.2 0.3 0.4 0
oxin. (mM)
0.2 0.4 0.6
EDTA(mM)
B
0.8
c
-os -0.6 ..(J7 ..(J.8 ..(J.9 0.2 -0.2 ..(J.4 -06 -08
potential (V) deposition potential (V)
Figurre 6. Optimization of the voltammetric determination of uranium in diluted 1:1/10) raffinate extract in background electrolyte. The cellsolution contained 0.088 M PIPES. 10-4 M EDTA, 2 x 10⁻⁵ M oxine, and 0.2 M hydrazine hydrate at a pH of 9.0. (A) Effect 01 varying theconcentration of oxlne on the peak height of 20 nM U(VI) In the presence (a) and absence (b) of the rafflnate extract. (6) Influence of varyingthe concentration of EDTA on the peak height of 20 nM U(VI) in the voltammetric cell. (C) Voltammetric scans in the ebsence (a) and presence(b) of EDTA. (D) Inlluence of varying the deposition pOfential on the peak height fcr U(VI); CSV scans were started at -0.5 V.
that hydrazine hydrate was responsible for the increase insensitivity, but only when the pH increased as well. A possible
(hypothetical) explanation for this effect could be the formation
of a mixed complex with uranium. Repeating the experimentswith an ammonia solution (~30% NH,) instead of hydrazine
showed a less pronounced influence; the peak shift was similar,but the sensitivity increase was a factor of 1.3 when the pHchanged from 7 to 9 as a result of the addition of ammonia. Anoptimal hydrazine hydrate concentration in the cell solution of0.2 M was chosen.
Oxine influences the peak height of U (VI) positively due to
the adsorption of the U(VI) oxine complex on the mercury drop.The peak height, therefore, increases with the oxine concentrationuntil all U(VI) is complexed, as can be seen from Figure 6A (curveb). The presence of interfering compounds from a degraded
raffinate were found to compete with the oxine, and therefore,more oxine had to be added to the "real" sample solution to reach
highest sensitivity (Figure 6A, curve a). A concentration of 2 x
lO-c'M oxine in the cell solution was selected to optimize the peakheight in samples containing degraded raffinate extract.
Remaining interferences in the voltammetric scans (a peakmore negative than the uranium peak) were found to be due toother metals coextracted with the uranium. Addition of EDTAresulted in suppression of this peak as a result of preferentialcomplexation of several interfering metal ions, which otherwiseare complexed by the oxine. The CSV peak height was reducedsomewhat as a result of complexation of C(VI) with the EDTA,but this effect was small at EDTA concentrations below 0.1 mM(Figure 6B). Metal ion interferences from degraded raffinate weresuppressed well In this condition, giving a voltammetric scanlargely free of intering peaks (Figure 6C, scan b is in the presence
3908 Analytical Chemistry, Vol. 67, No. 21, November 1, 1995
of EDTA). An optimal EDTA concentration of 0.1 mM wasselected for further experiments.
Effect of Varying the Deposition Potential and AccumulationTime. The peak potential for the reduction of U (VT) is at -0.68V in the presence of 0.1 M PIPES buffer, 0.2 M hydrazine hydrate,2 x 10-5 M oxine, and 10-4 M EDTA Variation of the depositionpotential showed that the peak height was comparatively constantat deposition potentials between -0.6 and -0.1 V (Figure 6D).
The peak height diminished at deposition potentials more negativethan -0.6 V, probably because of reduction of U(VI) to U(V) andthe inability of U (V) to form adsorptive complexes with oxine.Also at deposition potentials more positive than -0.1 V, the U(VI)oxine complex was found to adsorb poorly onto the mercury drop.When measuring degraded raffinate extracts, it is advisable touse a deposition potential as close as possible to the peak potentialto diminish the influence of organic interferences, which show astrong tendency for adsorption onto the mercury drop at more
negative deposition potentials. A deposition potential of -0.5 Vwas therefore selected for uranium determinations in the degradedraffinate.
Variation of the accwnulation time showed that the peak heightincreased linearly with the accumulation time up to about 500 s(from a stirred solution containing 0.088 M PIPES, 2 x 10⁻⁵
oxine, 0.2 M hydrazine hydrate, 10-4 M EDTA, and 1 mL ofdegraded raffinate extract, giving a total volume of 10 mL at pH9.0 and containing ~35 nM U(VI). The peak height increasednonlinearly thereafter, presumably as a result of saturation of thesurface of the mercury drop with uranium complexes with oxine.
For a lower uranium concentration and fewer interiering compounds present, the curve can be expected to show an extended
linearity
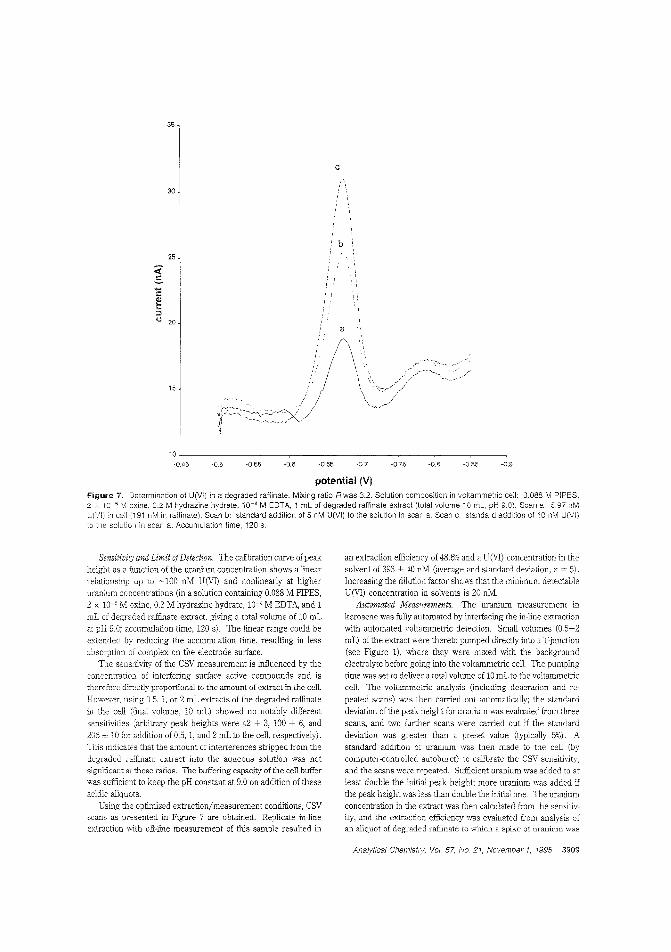
35
c
30
25
<?..s....<:Qll::::I<.\ 20
1:5
-0.9-0.85-0.8-0.65-0.6-0.55-0.5
10 +--- ~---~--~--~---~--~--~--~
-0.45
potential (V)Figure 7. Determination of U(VI) in a degraded raffinate. Mixing ratio Rwas 3.2. Solution composition in voltammetrio oell: 0.088 M PIPES,2 x 10-5 M exine, 0.2 M hydrazine hydrate, 10-4 M EDTA, 1 mL of degraded raffinate extract (total volume 10 mL, pH 9.0). Scan a: 5.97 nMLtVI) in cell (191 nM in raffinate). SCEn b: standard addition of 5 nM U(VI) to the solution in scan a. Scan c: standard addition of 10 nM U(Vi)to the solution in scan a. Accumulation time, 120 s.
Sensitivity and Limit QfDetection. The calibration curve of peakheight as a femction of the uranium concentration shows a linearreiationship up to -100 nM U(VI) and nonlinearly at higheruranium concentrations (in a solution containing 0.088 M PIPES,2 x 10-5 M oxine, 0.2 M hydrazine hydrate, 10-4 M EDTA, and 1mL of degraded raffinate extraot, giving a total volume of 10 mLat pH 9.0; accumulation time, 120 s). The linear range could beextended by reducing the accumulation time, resulting in lessabsorption of complex on the electrode surlace.
The sens'tivity of the CSV measurement is influenced by theconcentration of interlering surface active compounds and istherefore directly proportional to the amount of extract in the ccll.However, usmg 05, 1, or 2 mL extracts of the degraded raffinatein L'Je cell (final volume, 10 mL) showed no notably differentsensitivities (arbitrary peak heights were 42 ± 3, 100 ± 6, and206 10 for addition of 0.5,1, and 2 mL to the cell, respectively).This indicates that the amount of interferences stripped from thedegraded faffinate extract into the aqueous solution was notsigni.:Bcant at these ratios. The buffering capacity of the cell buffer
was sufficient to keep the pH constant at 9.0 on addition of theseacidic aliquots.
Using the optimized extraction/measurement conditions, CSVscans as presented in Figure 7 are obtained. Replicate in-lineextraction with off-line measurement of this sanlple resulted in
an extraction efficiency of 48.6"10 and a U(VI) concentration in thesolvent of 393 ± 40 nM (average and standard deviation, n = 5).Increasing the dilution factor shows that the minimum detectableU(VI) concentration in solvents is 20 nM.
Automated JvJeasurements. The uranium measurement inkerosene was fully automated by interlacing the in-line extractionwith automated voltammetric detection. Small volumes (0.5-2mL) of the extract were thereto pumped directly into aT-junction(see Figure 1), where they were mixed with the backgroundelectrolyte before going into the voltammetric cell. The pumpingtime was set to deliver a total volume of 10 mL to the voltammetriccell. The voltammctric analysis (including dcacration and re
peated scans) was then carried out automatically; the standardde,iation of the peak height for uranium was evaluated from threescans, and two further scans were carried out if the standarddeviation was greater than a preset value (typically 5%). Astandard addition of uranium was then made to the cell (bycomputer-controlled autoburet) to calibrate the CSV sensitivity,and the scans were repeated. Sufficient uranium was added to at
least double the initial peak height; more uranium was added ifthe peak height was iess than double the initial one. The uraniumconcentration in the extract was then calculated from the sensitivity, and the extraction efficiency was evaluated from analysis ofan aliquot of degraded raffinate to which a spike of uranium was
Analytical Chemistry. Vol. 67, No. 21, November 1, 1995 3909
added .A,JJ eX1T.:J.ct;on f'fficiency of 88.S;1~ and a U (VI) concentrationin the solvent of 35.24 ± 1.69 nM (average and standard deviation)was o~)tained using the automated on-line voltarnmetric method
with the optimized conditions for automated in-line extraction ofU (VI) (1 I'M) from a synthetic solvent mixture (20% TBP/kerosene containing I g L-l DBP) This is consistent withexpectation in view of the complexation of uranium by sulfate(Figure 3B) and the preceding experiments in which the extractedfractions were collected. The mixing ratio R was 3.44, and thedilu tion factor D in the eel] was 7.29.
COilllCUJSIONSsuccessful automated method has been developed to
determine U (VI) in mixtures of tlibutyl phosphate and keroseneusing an in-line extraction into an aqueous phase, combined withon-lIne electrochemical detennination. Traces of degradationproducts as a result of radiolytic and hydrolytic decomposition indegraded raffinate were found to interfere with the on-lineextraction and measurement. Dibutyl phosphate was found to
be responsible for the reduced extraction of uranium from theraffillate since it fom1s very strong complexes with U(V1) in theorganic phase. 111e maximum attainable extraction efficiency wastherefore ......,50% when acetate or suliate extracrants were used.ill extractant containing 0.5 M sulfate was found to be optimal toextract the uranium, giving a maximum attainable extraction
3910 Analytical Chemistry. Vol 67. No_ 21. November 1. 1995
efficiency of ~50%, which was constant Acetate was found to giverise to the extraction of an excess of electrochemically interferingcompounds. Residual interferences from the extraction usingsulfate were suppressed by addition of EDTA (to complex
interfering metal ions) and hydrazine hydrate (to suppress L'Ieinterference of surfactants). 11,e latter compound was found toenhance the sensitivity by a factor of ~2. The detection limit ofthe method (including extraction and voltammelIic analysis) was20 nM uranium in the degraded raffinate using extractant/solventratios of 3, dilution factors of extract in the cell of 5-10, and anadsorption time of 120 s. Important advantages of this methodare the small san1ple size required for each analysis (0.5-2 mL),leading to very small waste product votumes, which could berecycled back into the system, and the full automation, whichrequires little supervision.
ACKNOWLEDGMENTThis investigation was financially supported by Bridsh Nuclear
Fuels pIc.
Received for review January 23, 1995. Accepted August2, 1995.~
AC950071U
o Abstract published in Advance ACS Abstracts, Seplcmber 1
Anal Chem. 1995, 67, 3911~3915
Selective Detection in RP-HPLC of Tyr-, Trp-, andSulfur-Containing Peptides by Pulsed Amperometryat Platinum
Johannes A. l1li. van Riel and Comelis Olieman*
Department of Analytical Chemistry, Netherlands Institute of Dairy Research, P.o. Box 20, 6710 BA Ede, The Netherlands
A technique for electrochemical detection of Trp-, Tyr-,and sulfur-containing peptides, using a two-step potentialwaveform at a platinum wall-jet electrode, has beendeveloped. The detection is fu]]y compatible willi reversedphase HPLC employing gradients ofacetonitrile in water/triiluoroacetic acid. At ~+1.2 V (first potential) versus
AglAgCI, Trp-, Tyr-, and Cys-containing peptides arepredominantly detected, while at +1.4-1.6 V, Met- and(Cysh-contairrirrg peptides are additionally detected, Theelectrode surface is cleaned by the second potential (+2.0V), The linearity is at least 2 orders of magnitude. The
sensitivity is in the picomole range. By using postcolumnelectrochemical conversion, the selectivity toward Metand Cys-contairring peptides can be enhanced. Applications are shown for the determination of caseinomacropeptide (6.6 kDa) and a tryptic map of p-casein.
In the European Community, the subsidized utilization of milkand b'jltecmilk powders for animal feed requires the absence ofrenne', whey solids.' The characteristic component of rennet wheyis caseinomacropeplide (CMP), which is fanned in the milk
clottir.g process by the enzymatic cleavage of the Phe105~Metle6
peptide bond of K-casein. Para-K-casein (1-105) remains in theprecipitated caseins, while CMP (106-169.6.6 kDa) is recoveredin the rennet whey. In a fennenled milk product. such asbuttenniIk, pDteolytic enzymes of the starter culture cause proteindegradation. On rare occasions, ,,-casein is split at position 106~
107, resulting in the fonnation of pseudo-CMP,' lacking theN-tem1inaJ Met. The (fraudulent) addition of rennet whey to milkand rrjlk products can be detected by the detennination of CMPwith revecsed-phase HPLC (RP-HPLC).2 This method employsan extremely Hat gradient of acetonitrile (ACN), which generatesjust enough resolution between CMP and pseudo-CMP to prevent
faise positive results; however, under certain conditions, falsenegative resuits cannot be excluded. In principle, there are two
possibilities fer improving the analysis: (1) increase the resolution
of the separation system and (2) apply selective detection.Capillary electrophoresis (CE) fulfilled the first cption." This
paper deals ]"ith the second option.Electrochemical detection of amino acids, peptides, and
proteins has been reviewed by Krull et a1. 4.5 Glassy carbon
electrodes afford reasonable sensiti,ities for easily oxidized amino
n Regulation 1725/79 ofLhc Committee. Off]. Eur. Communities 1979.1228,9-14.
(2) Olieman. van Riel,]. AM. Neth. Milk Dairy). 1989.43,171-84.en v;1::1 T{]eL J i\. VL: Clliem:'ll, C F:lpdmphorps£~ 1995. 16, .'529-33(i',) DOll. L.: Mazzeo, J: Krull. L S, BioChromatography 1990,5,74-96.
elicH, 1.; L S. ElectmanQtysis 1994, 6, 1-8.
0003-2700/95/0367-391139.0010 © 1995 American Chemical Society
acids. like Tyr and Trp, The compatibility 'Nith gradients of ACNin water is poor. In combination with posicoluIIlIl photolyticderivatization, peptides and proteins containing Phe, Tyr, Trp, Met,and Cys can be detected6 at glassy carbon; however, ACN shouldbe replaced with a mixture of alcohols to ensure durable operation
of the photolytic reactor. Modification of a glassy carbon electrode
willi a film of Ru(III.IV) oxide stabilized "ith cyano crosslinkspennits the amperomemc detection of Cys, (Cys),. and Met atpH 27 The preparation of the electrode and its limited life of about2 weeks hamper application for routine analyses. A similar
electrode was used in the simultaneous detection of several thiolsand disulfides after separation by CE"
Conventional voltammemc and amperomemc techniques atPt cr Au electrodes have not been considered applicable forquantitative detection of most sulfur compounds, because of theobserved loss of electrode activity due to accumulation of sulfurous
adsorbates. Pulsed electrochemical detection (PED) at noblemetal electrodes was recently reviewed by laCourse" and Johnsonet aII" Sulfur-containing pesticides could be detected in thepresence of ACN at pH 5.0 at a Au electrode using a two-steppotential wavefonn.]: Evidence was given that the mechanism
involved adsorption of the analytes at the oxide-free sunace duringcathodic polarization and subsequent amperomemc detectioncatalyzed by oxide formation following anodic polarization. Thesame mechanism was proposed for the detection of sulfurcontaining analytes at Pt electrodes in alkaline solutions_"
Glutathione. (CysJ" Cys, and Met were detected at a Auclccrrodc in acidic medium using integrated PEDYU4 The currentis integrated during <': fast scan from I) to +1.6 to 0 V, thereby
eliminating the current originating from the fennation of the Auoxide. Subsequently. the surface is reactivated by an anodicpolarization of +1.9 V and a cathodic polarization of ~0.6 V.
We have investigated the possibility of oxidative PED of sulfurcontaining amino acids at a Pt electrode at low pH.
EXPERIMENTAL SECTIONChemicals. All amino acids, dipeptides, and trypsin !TPCK
created, type XlII, bovine pancreas) were received from Sigma(St. Louis, MO). ACN (HPLC Ultra Gradient Grade) and trifluo-
(6) DOli, L.: Kn1il, 1. S. A;,-ol. Chon. 1990,62,2599-606.(7) Cox,]' 1\.; Dabck-Zlotorzynska, C'hromatogr. 1991,543.226-32(8) Zhou,).; O'Shea, T. ].: Lunk, S. lvI.I Chromatogr. /l. 1994, 680, 271-7.(9) :..aCourse, \V. R. Anai:'!.5is 1993.21. l81-9.5.
:10) Johnson, D. c.; Dobberpuhl, D.: Ro!)erts. R.: V<"ndeberg, P.j. Chromatogr.1993. 640. 79-96
~11) Ngoviwatchai, 1\.: Johnson. D. C. Ana!. Cilim. Acta 1988,215, 1-12,·:12) ?olta, T. Z_: Johnsen, D Electromwi. Chem, 1986,209, 159-69.(13) Vandeberg, P.].: Johrson, C. Alia!. Chem. 1993,65,2713--8.~14) Vandeberg, P. L Jol11\sol1, D. Acta 1994,290,317-27
Analytical Chemistry, Vol. 67, No. 21, November 1, 1995 3911
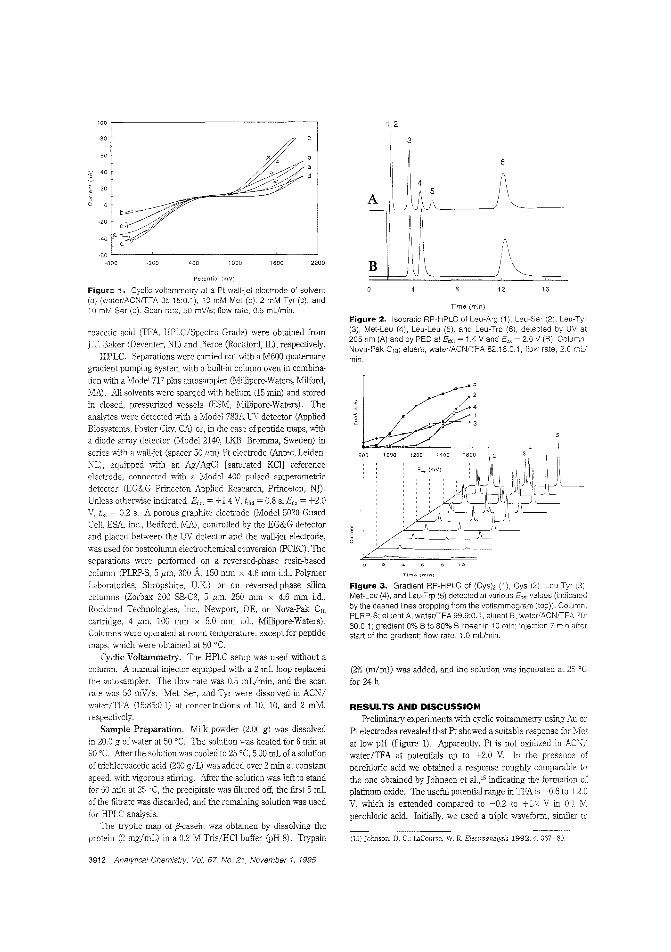
(15) Johnson, D. c.; LaCourse, W. R Electroanalysis 1992,4. 367-80.
(2% (m/m)) was added, and thc solution was incubated at 25 'cfor 24 h.
Figure 3. Gradient RP-HPLC of (Cys), (1). (3)Met-Leu (4), and Leu-Trp (5) detected at various Ed'" VI'!UI3S i:inolicatecby the dashed lines dropping from the voltammogram (top)). Column.PLRP-S; eluent A, waterfTFA 99.9:0.1, eluent B, water/ACNfTFA 70:30:0.1; gradient 0% B to 80% B linear in 10 min; injection 7 min afterstart of the gradient; flow rate, 1.0 mUmin.
Tim .. (mLn)
RESULTS AND DISCUSSIONPreliminary experiments with cyclic voltammetry using Au or
Pt electrodes revealed that Pt showed a suitable response for Metat low pH (Figure 1). Apparently, Pt is not oxidized in ACN/water/ITA at potentials up to +2.0 V. In the presence ofperehloric acid we obtained a response roughly comparabie tothe one obtained by Johnson et a1.,15 indicating the formation ofplatinum oxide. The useful potential range in TFAis -0.6 to +2.0V, which is extended compared to -0~2 to +1.2 V in 0.1 Mperchloric acid. Initially, we used a triple waveform, similar to
.5
Time (min)
Figure 2. Isocratic RP-HPLC of Leu-Ar9 (1). Leu-Ser (2), Leu-Tyr(3), Met-Leu (4), Leu~Leu (5), and Leu-Trp (6), detected by UV at205 nm (A) and by PED at Ed" = 1.4 Vand Eo> ~ 2.0 V (B). Column.Nova-Pak C18; eluent, water/ACNfTFA 82:18:0.1; flow rate, 2.0 mUmin.
12 16
1,2
220016001DOC400-200
~60 L ~ ~ ~ ~__---'
-800
,00
80
60
1 40
20
{;
~20
~40
Potential (mV)
Figure 1. Cyclic voltammetry at a Pt wall-jet electrode of solvent(a) (water/ACNfTFA 85:15:0.1),10 mM Met (b). 2 mM Tyr (c), and10 mM Ser (d). Scan rate, 50 mV/s; flow rate, 0.5 mUmin.
roacetic acid (TFA, HPLC/Spectro Grade) were obtained from].T. Baker (Deventer, NL) and Pierce (Rockford, IL), respectively.
HPLC. Separations were camed out with a M600 quaternarygradient pumping system with a built~in column oven in combination with a Model 717 plus autosampler (Millipore-Waters, Milford,MA). All solvents were sparged with helium (15 min) and storedin closed, pressurized vessels (ESM, Millipore--Waters). Theanalytes were detected with a Model 783A UV detector (AppliedBiosystems, Foster City, CAl or, in the case of peptide maps, witha diode array detector (Model 2140, LKB. Bromma, Sweden) inseries with a wall-jet (spacer 50 j1m) Pt electrode (Antec, Leiden,NL), equipped with an Ag/AgCI [saturated KCI] referenceeleotrode, connected with a Modcl 400 pulsed amperometlicdetector (EG&G Princeton Applied Research, Plinceton, NJ).Unless otherwise indicated, Edd = --'-1.4 V, Idel = 0~8 s, Eo> = +2.0V, I,," = 0.2 s. A porous graphite electrode (Model 5020 GuardCell, ESA, Inc, Bedford, MA), controlled by the EG&G detectorand placed between the UV detector and the wall-jet electrode,
was used for postcolumn electrochemical conversion (PCEC). Theseparations were performed on a reversed~phase resin~based
column (PLRP-S, 5 j1m, 300 A. 150 mm x 4.6 mm i~d., Polymer
Laboratolies, Shropshire, U.K) or on reversed-phase silicacolumns (Zorbax 300 SB-C8, 5 j1m, 250 mm x 4.6 mm Ld.,Rockland Technologies, Inc., Newport, DE, or Nova-Pak C18
cartlidge, 4 j1m, 100 mm x 5.0 mm i.d., Millipore--Waters).Columns were operated at room temperature, except for peptidemaps, which were obtained at 50 'C.
Cyclic Voltammetry. The HPLC setup was used without acolumn. A manual injector equipped with a 2 mL loop replacedthe autosampler. The flow rate was 0.5 mL/min, and the scanrate was 50 mVIs. Met, Sec, and Tyr were dissolved in ACN/water/TFA (15:85:0~1) at concentrations of 10, 10, and 2 mM,respectively.
Sample Preparation, Milk powder (2.00 g) was dissolved
in 20.0 g of water at 50 'C. The solution was heated for 6 min at90'C. After the solution was cooled to 25 'C, 5.00 mL of a solutionof trichloroacetic acid (200 gil) was added over 2 min at constantspeed, with vigorous stirling. After the solution was left to standfor 60 min at 26°C, the precipitate was filtered off, the first 5 mLof the filtrate was discarded, and the remaining solution was usedfor HPLC analysis.
TIle tryptic map of ;'!-casein was obtained by dissolving theprotein (2 mg/mL) in a 0.2 M Tris/HCI buffer (pH 8). Trypsin
3912 Analytical Chemistry. Voi. 67. No.2:, November 1, 1995
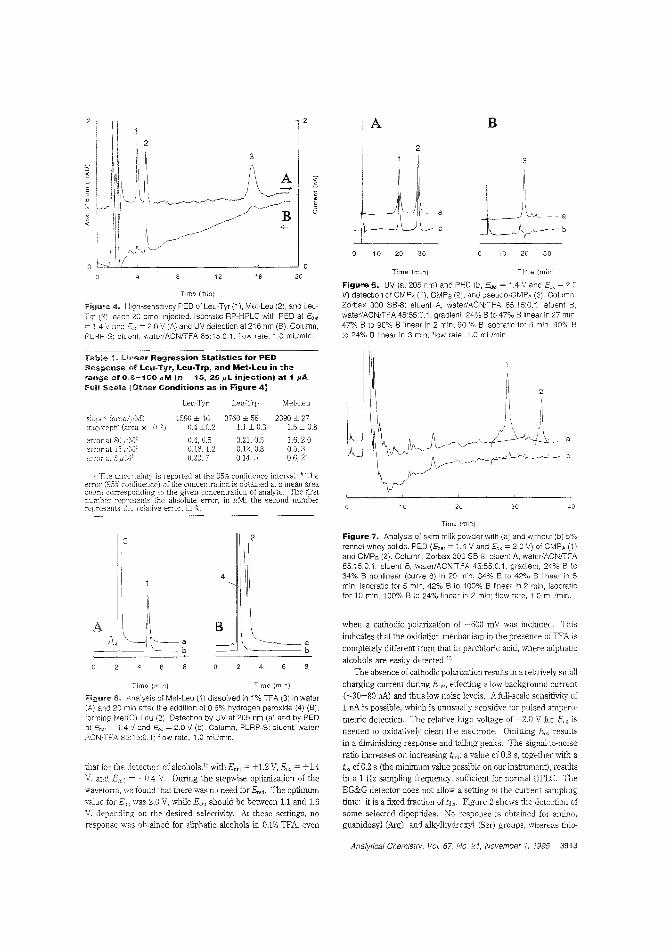
A B
i 0 20 30'0 20 30
Time (min)
Figure 6. UV (a, 205 em) and PED (b, Ed" = 1.4 V and E" ~ 2.0V) detection of CM,DA (f), CMPB (2), and pseudo-CMPA (3). ColunnZorbax 300 88-8; eiuent A, water/ACNffFA 85:15:0.1, eluent 8.water/ACNffFA 45:55:0.1; gradient, 24% 8 to 47% 8 linear in 27 min47% B to 90% B linear in 2 min, 90 % B isocratic fa:' 5 min, 90% Bto 24% B linear in 3 min; flow rate, 1.0 mUmin.
.8
16
3
12
t..::c'---1"'-~ ~ ---' -'O
2C
Time (min)
Figure 4. High-sensitivity PED of Leu-Tyr (1), Met-Leu (2), and LeuTrp (3), each 20 pmol injected, Isocratic RP-HPLC with PED at Ed"= 1.4 V and E" = 2.0 V and UV detection at 216 nm (8). Column,PLRP-S; eluent, 85: 15:0.1; flow rate, 1.0 mUm in.
l'abUe 1. linear Regression Statistics for PEDResponse of leu-Tyr, leu-Yrp, and Met-Leu in therange of 0.8-100 JIM (n '--' 15, 25,uL injection) at 1 pA1',,01 Scate IOther Conditions as in Figure 41
slove" (area!,:tM)ir.t~rccpfi (area x 10-:')
en-or alerror at 15ermr
Leu-Tyr
1590 ± 460.4 ±0.2
0.51.27
Leu-Trp
3760 ± 581.1 ± 0.3
0.21, 0.30.12,0.8014.5
Met-Leu
2390 ± 271.5 ± 0.8
1.6,2.00.5,30.6,21
10 20 30 40
Time (min)
lF~gurre 5. Analysis of Met-Leu (i) dissolved in 1% TFA (3) in water(A) and 20 min after the addition of 0.6% hydrogen peroxide (4) (6),forming Mei(O)-Leu (2). Detection by UV at 205 nm (a) and by PEDat Ede: - 1.4 V and Eox = 2.0 V (b). Column, PLRP~S: eluent, water!ACNffFA 85:15:0.1; flow rate, 1.0 mUmin.
that for the detection of alcohols,15 with Ectel = +1.2 V. E" = +1.4V. ar,d E,."" = -0.4 V. Dunng the stepwise optimization of thewaveform, we found that there was no need for Beed. The optimumvalue for E", was 2.0 V, while Ed'" should be between 1.1 and 1.6V. depending on the desired selectivity. At these settings, noresponse was obtained for aliphatic alcohols in 0.1% TFA. even
Figure 7. Analysis of skim milk powder with (a: and without (b) 5%rennet whey solids. PED (Ede, ~ 1.4 Vand Eo, = 2.0 V) of CMPA (1)and CMPB (2). Coiumn, Zorbax 300 88-6; eluent A, water/ACNffFA85:15:0,1, eluent 8, water/ACNiTFA 45:55:0.1; gradien', 24% B to34% B nonlinear (curve 8) in 2D mn, 34% B to 42% B linear in 5min, isocratic for 5 min, 42% B to 100% B linear in 2 min, isocraticfor 10 min, 100% B to 24% linear ir 2 nin; flow rate, i.8 m'Jmin.
when a cathodic polarization of -600 mV was included. Thisindicates that the oxidation mechanism in the presence ofTFA iscompletely different from that in perchloric acid, where aliphaticalcohols are easily detectedJS
The absence of cathodic polarization results in a re12tiveiy smallcharging current during Ee,,,,, effecting a low background current(-30-80 nA) and thus low noise levels. Afull-scale sensitivity of1 nA is possible, which is unusually sensitive for pulsed amperometric detection. The relative high voltage of +2.0 V for B", isneeded to oxidatively clean the electrode. Omitting E" resultsin a diminishing response and t2iling peaks. The signal-w-noiseratio increases on increasing I"""f a value of 0.8 s, together with aI" of 0.2 s (the minimum value possible on our instrument), resultsin a 1 Hz sampling frequency, sufficient for normal HPLC. TheEG&G detector does not allow a setting of the current samplingtime; it is a fixed fraction of Ict",. Figure 2 shews the detection ofsome selected dipeptides. No response is obtained for amino,guanidosyl (Arg) , and alkylhydroxyl (Ser) groups, whereas thio-
Time (min)
ab
Time (min)
A
Analytical Chemislry, Vol. 67, Nc. 21, November 1, 1995 3913
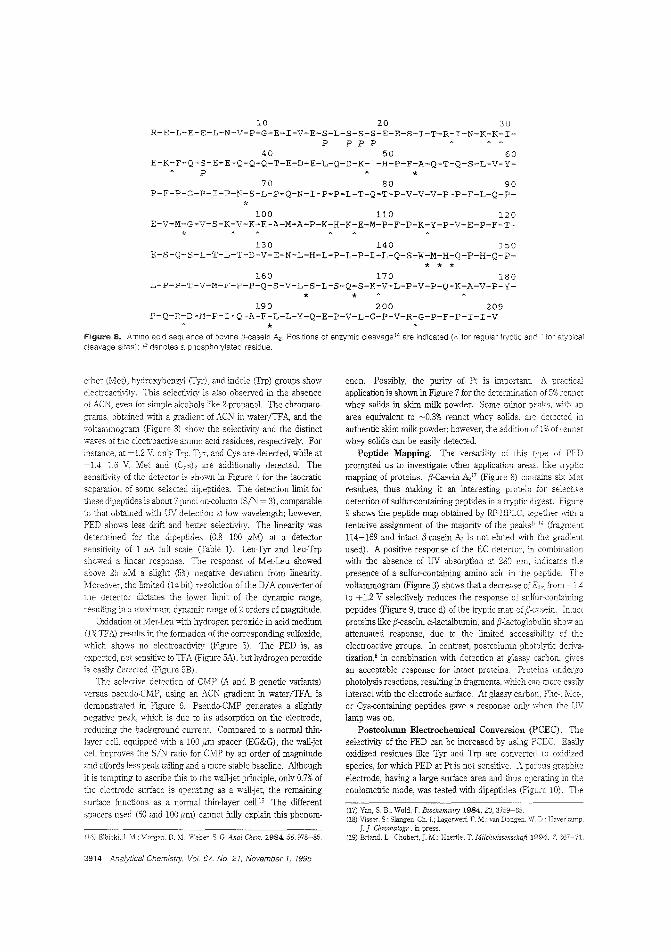
10 20 30R-E-L-E-E-L-N-V-p-G-E-r-V-E-S-L-S-S-S-E-E-S-r-T-R-r-N-K-K-I
p P P P40 50 60
E-K-F-Q-S-E-E-Q-Q-Q-T-E-D-E-L-Q-D-K-I-H-P-F-A-Q-T-Q-S-L-V-Y-A P *
70 80 90P-F-P-G-P-I-P-N-S-L-P-Q-N-I-P-P-L-T-Q-T-P-V-V-V-P-P-F-L-Q-P-
*100 110 120
E-V-M--G-V-S-K-V-K-E-A-M-A-P-K-H-K-E-M-P-F-P-K-Y-P-V-E-P-F-T-
*130 140 150
E-S-Q-S-L-T-L-T-D-V-E-N-L-H-L-P-L-P-L-L-Q-S-W-M-H-Q-P-H-Q-P-
* * *160 170 180
L-P-P-T-V-M-P'-P-P-Q-S-V-L-S-L-S-Q-S-K-V-L-P-V-P-Q-K-A-V-P-Y-
* *190 200 209
P-Q-R-D-M-P-I-Q-A-F-L-L-Y-Q-E-P-V-L-G-P-V-R-G-P-F-P-I-I-V
*Figure S. Amino acid sequence of bovine /)-casein A2 . Positions of enzymic cleavage14 are indicated (/\ for regular tryptic and for atypicaicieavage sites); P denotes a phosphorylated residue.
ethe- (Met), hydroxybenzyl cryr) , and indole (rrp) groups showelectroactivity. 111is selectivity is also observed in the absenceof ACN, even for simple alcohols like 2-propanol. The chromatograms, obtained with a gradient of ACN in water/TFA, and thevoltammogram (Figure 3) show the selecdvity and the distinctwaves of the electroactive amino acid residues, respectively. Forinstance, at +1.2 V, only Trp, Tyr, and Cys are detected, while at-1.4-1.6 V, Met and (Cys), are additionally detected. Thesensitivity of the detector is shown in Figure for the isocraticseparalion of some selected dipeptides. The detection limit forthese dipeplides is about 7pmol on-column (SIN = 3), comparablelo that obtained with IN ddeCl'ton at low wavelength; however,PED shows less drift and better selectivity. The linearity wasdetennined for the dipeptides (0.8-100 ,uM) at a detectorsensitivity of 1 I'A full scale (Table 1). Leu-Tyr and Leu-Trpshowed a linear response. The response of Met-Leu showedabove 25 I'M a slight (5%) negative deviation from linearity.Moreover, the limited (14 bit) resolution of the DIA converter ofthe detector dictates the lower limit of the dynamic range,resulting in a maximum dynamic range of 2 orders of magnitude.
Oxidation of Met-Leu with hydrogen peroxide in acid medium(1%TFA) results in the fonnation of the corresponding sulfoxide,which shows no electroactivity (Figure 5). The PED is, asexpected, not sensitive to TFA (Figure 5A), but hydrogen peroxideis easily detected (Figure 5B).
The selective detection of CMP (A and B genetic variants)versus pseudo-CMP, using an ACN gradient in water/TFA, isdemonstrated in Figure 6. Pseudo-CMP ger.erates a slightlynegadve peak, which is due to its adsorption on the electrode,reducing the background current. Compared to a nonnal thinlayer cell, equipped with a 100 ,urn spacer (EG&G), the wall-jetcell improves the SIN ratio for CMP by an order of magnitudeand affords less peak tailing and a more stable baseline. Althoughit is tempting to ascribe this to the wall-jet principle, only 0.7% ofthe electrode surface is operating as a wall-jet, the remainingsurface functions as a normal thin-layer cell16 The differentspacers used (50 and 100 urn) cannot fully explain this phenom-
(16) Elbicki, J. M.; .'Vforgan. D. ]\1,; Weber, S. G. Anal. Chem. 1984,56,978-85.
3914 Analytical Chemistry. Vol. 67, No. 21, November I, 1995
enon, Possibly, the purity of Pt is important. A practicalapplication is shown in Figure 7 for the detennination of 5% rennetwhey solids in skim milk powder. Some minor peaks, "ith anarea equivalent to ~0.3% rennet whey solids, are detected inauthentic skim milk powder; however, the addition of 1% of rennetwhey solids can be easily detected.
Peptide Mapping. The versatility of this type of PEDprompted us to investigate other application areas, like trypticmapping of proteins. fJ-Casein AP (Figure 8) contains six Metresidues, thus making it an interesting protein for selectivedetection of snlfur-containing peptides in a tryptic digest. Figure9 shows the peptide map obtained by RP-HPLC, together ,villi atentative assignment of the majority of the peal,s''''',! (fragIT.ent114-169 and intact fJ-casein A, is not eluted ,vith the gradientused). A positive response of the EC detector, in combinalionwith the absence of UV absorption at 280 nm, indicates thepresence of a sulfur-containing amino acid in the peptide. Thevoltammogram (Figure 3) shows that a decrease ofEdct from -+- 1.4to -+-1.2 V selectively reduces the response of sulfur-containingpeptides (Figure 9, trace d) of the tryptic map of j5-casein. Intaclproteins like fJ-easein, a.-lactalbumin, and fJ-lactoglobulin show anattenuated response, due to the limited accessibility of theelectroactive groups. In contrast, postcolumn phololydc denvatization,' in combination with detection at glassy carbon, givesan acceptable response for intact proteins. Proteins undergophotolysis reactions, resulting in fragments, which can more easilyinteract with the electrode surface. At glassy carbon, Phe-, Met-,or Cys-containing peptides gave a response only when the UVlamp was on.
Postcolumn Electrochemical Conversion (PCEC). Theselectivity of the PED can be increased by using PCEC. Easilyoxidized residues like Tyr and Trp are converted to oxidizedspecies, for which PED at Pt is not sensitive. A porous graphiteelectrode, having a large surface area and thus operating in thecoulometric mode, was tested with dipeptides (Figure 10). The
(17) Yan, S. B.; Wold, F. Biochemistry 1984,23,3759-65.(18) Visser, S.; Slangen, Ch.].; Lagenverf, F, M.; van Dongen, W. Haverkamp,
J.]' Chromatogr., in press.(19) Briand, L.; Chobert, ].-M.; Haertle, T. MilchwissenscJzaft 1994, 7,367-71.
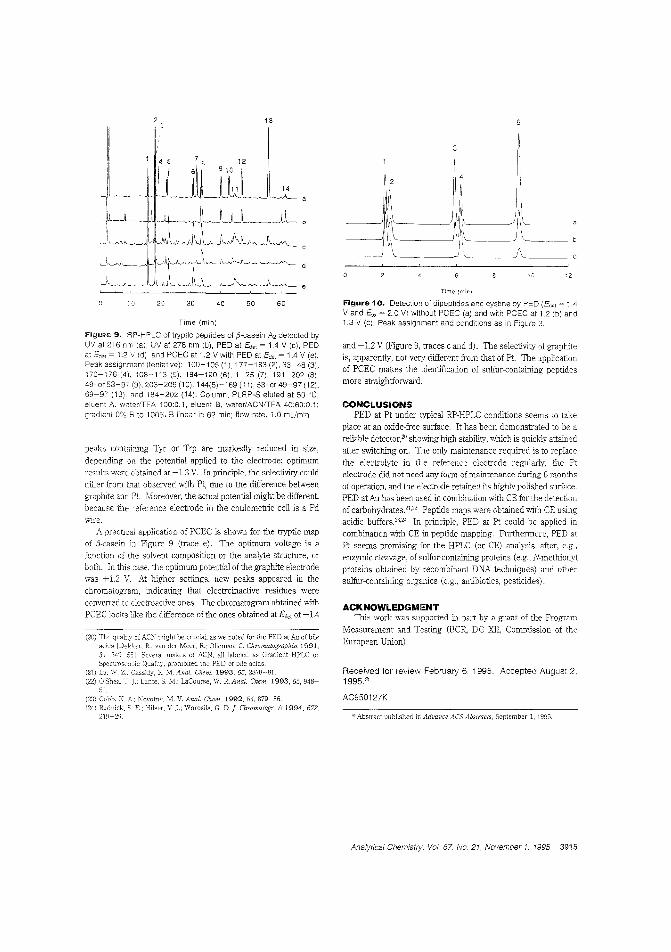
13
10 12
Time (mir)
(23) Cobb, K. Novotny, M. V. Anal. Chem. 1992,64,879-86.(24) Rudnick, S. E.; :Inser, v.].; Worosila, G. D.]. Chromatogr. A 1994, 672,
2]9-29.
(20) The qt:aliry of ACN as we noted for the FED at Au of bileacids [Dekker, R; van Meer, R; Olieman, C 1991,31, 549-551. Several makes of ACN, all labeled a;;: HPLC orSpeclroscopic Quality, prohibited the FED of bile acids.
(21) "I";', Z.; Cassidy, R_ M. Anal. Chem. 1993,65, 2878--8l.(22) O'Shea. Lunte, S. M.; laCourse, W. R. Anal. Chem. 1993,65,948-
Time (min)
Fig",,, 9. RP-HPLC of tryptic peptides of fl-casein A2 detected byUV at 216 om (a), UV at 278 nm (b), PED at Ed" = 1.4 V (c), PEDat Ed" ~ 1,2 V (d), and PCEC at 1,2 V with PED at E"l = 1.4 V (e),Peak assignment (tentative): 100-105 (1),177-183 (2), 33-48 (3),170-176 (4),108-113 (5),184-190 (6),1-25 (7),191-202 (8),49- or 53-97 (9), 203-209 (10), 144(5)-169 (11), 53- cr49-97 (12),69-97 (13), and 184-202 (14), Colomn, PLRP-S eluted at 50 'C;eluent A, waterrrFA :00:0.1, eluent B, walerfACNrrFA 40:60:0.1;gradient 0% 6 to 100% B linear in 62 min; flow rate, 1.0 mUmin.
peaks containing TYT or Trp are markedly reduced in size,depending on the potential applied to the electrode; optimumresults were obtained at -1.3 V. In principle. the selectivity coulddiffer [rom that observed with Pt, due to the difference betweengraphite and Pt. Moreover, the actual potential might be different,because the ~eferenoe electrode in the coulometric cell is a Pdwire.
A practical application of PCEC is shown for the tryptic mapof IS-casein in Figure 9 (trace e). The optimnm voltage is afunction of the solvent composition or the ana1yte structure, orboth. In this case, the optimum potential of the graphite electrodewas +1.2 V. At higher settings, new peaks appeared in thechromatogram, indicating that electroinactive residues wereconverted to electroactive ones. TIle chromatogram obtained withPCEC looks like the difference of the ones obtained atEdct of +1.4
and +1.2 V (Figure 9, traces 0 and d). The selectivity Df graphiteis, apparently, not very different from that of Pt. The applicationof PCEC makes the identification of sulfur-containing peptidesmore straightforward.
Received for review February 6. 1995. Accepted August 2.1995@
AC950127K
Figure 1o~ Detection of dipeptides and cystine by PED (EctAl = 1.4V and Eo> = 2.0 V) witllout PCEC (a) and with PCEC at1.2 (b) and1.3 V (C). Peak assignment and conditions as in Figure 3.
ACKNOWLEDGMENT111is work was supported in part by a grant of the Program
Measurement and Testing (BCR, DG XII, Commission of theEuropean Union).
o Abstract published in Advance AC5 Abs[racts, September 1, 1995
CONCLUSIONSPED at Pt under typical RP-HPLC conditions seems 'co take
place at an oxide-lree surface. It has been demonstrated to be areliable detector,211 showing high stability, which is quickly attainedafter switching on. The only maintenance required is to replacethe electrolyte in the reference electrode regularly; the Ptelectrode did not need any form of maintenance during 6 monthsof operation, and the electrode retained its highly polished surface.PED at Au has been used in combination with CE for the detectionof carbohydrates."·22 Peptide maps were obtained wit.l CE usingacidic buffersn ." In principle, PED at Pt could be applied incombination with CE in peptide mapping. Furthermore, FED atPt seems promising for the HPLC (or CE) analysis, after, e.g.,enzymic cleavage, of sulfur-containing proteins (e.g., N-methionylproteins obtained by recombinant DNA techniques) and othersulfur-containing organics (e.g., antibiotics, pesticides).
60504030201G
Analytical Chemistry, Vol. 67, No. 21, November 1, 1995 3915
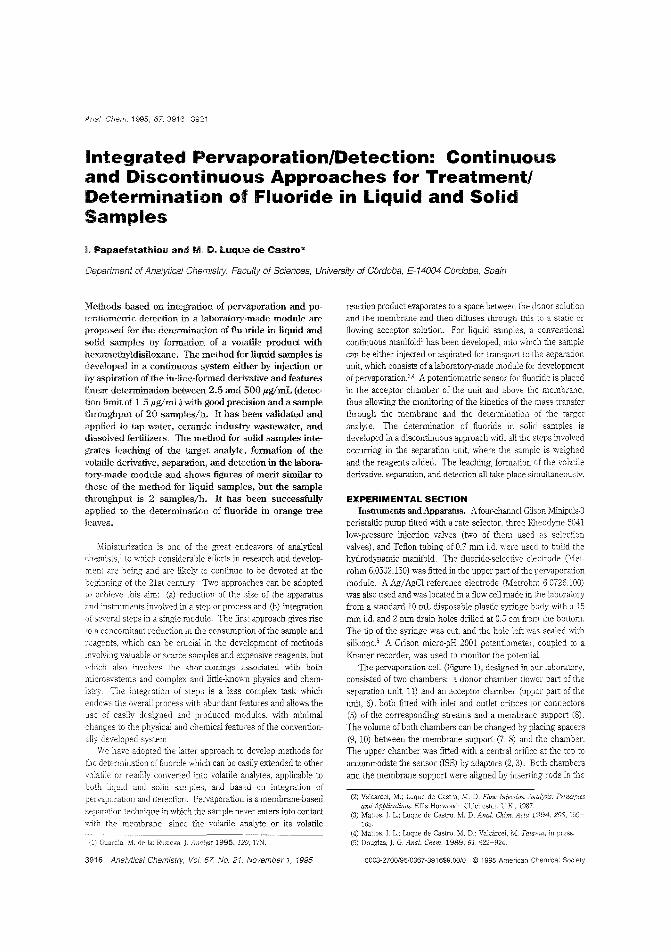
Anal. Chern. 1995, 67.3916-3921
Integrated Pervaporation/Detection: Continuousand Discontinuous Approaches for TreatmentlDetermination of Fluoride in Liquid and SolidSamples
Papaefstathiol.l and M. D. Luque de Castro*
Department of Analytical Chemistry, Faculty of Sciences, University of Cordoba, E-14004 Cordoba, Spain
Methods based on integration of pervaporation and potentiometric detection in a laboratory-made module areproposed for the determination of fluoride in liquid andsolid samples by formation of a volatile product withhexamethyldisiloxane. The method for liquid samples isdeveloped in a continuous system either by injection orby aspiration of the in-line-formed derivative and featureslinear determination between 2.5 and 500 flg/mL (detection limit of 1.5 flg/mL) with good precision and a samplethroughput of 20 samples/h. It has been validated andapplied to tap water, ceramic industry wastewater, anddissolved fertilizers. TI,e method for solid samples integrates leaching of the target analyte, formation of thevolatile derivative, separation, and detection in the laboratory-made module and shows figures of merit similar tothose of the method for liquid samples, but the samplethroughput is 2 samples/h. It has been successfullyapplied to the determination of fluoride in orange treeleaves.
l'vliniatUlization is one of the great endeavors of analyticalchemists,: to which considerable efforts in research and development are being and are likely to continue to be devoted at thebeginning of the 21st century. Two approaches can be adopted
achieve tbis aim: (a) reduction of the size of the apparatusand instruments involved in a step or process and (h) integrationof several steps in a single module. The first approach gives riseto a concomitant reduction in the consumption of the sample andreagents, which can be crucial in the development of methodsinvolving valuable or scarce samples and expensive reagents, bnt\vhich also involves the shortcomings associated with bothmicrosystems and complex and little-known physics and chemistry The integration of steps is a less complex task whichendews the overall process with abundant featu:es and allows theuse of easily designed and produced modules, with minimalchanges to the physical and chemical features of the conventionally developed system.
We have adopted the latter approach to develop methods forthe detem1ination of flnoride which can be easily extended to othervolatile or readily converted into volatile ana1y1es, applicable toboth liquid and solid samples, and based OIl integration ofpervaporation and detection. Pervaporation is a membrane-basedseparation techniqne in which the sample never enters into contact"ith the membrane, since the volatile analy1e or its volatile
(11 Gunrdia, de 1<1; Ruzicka,.I. Analyst 1995, 120, 17N.
3916 Analytical Chemlstn;. Vol. 67. No. 21. November 1, 1995
reaction product evaporates to a space between the donor solutionand the membrane and then diffuses through this to a static orflowing acceptor solution. For liquid samples, a conventionalcontinnons manifold' has been developed, into which the samplecan be either injected or aspirated for transport to the separationunit, which consists of a laboratory-made module for developmentof pervaporation.3•4 A potentiometric sensor for fluoride is placedin the acceptor chamber of the nnit and above the membrane,thns allowing the monitoring of the kinetics of the mass transferthrough the membrane and the determination of the targetanalyte. The determination of fluoride in solid samples isdeveloped in a discontinuous approach with all the sleps involved
occurring in the separation unit, where the sample is weighedand the reagents added. The leaching, formation of the volatilederivative, separation, and detection all take place simultaneously.
EXPERIMENTAL SECTIONInstruments and Apparatus. A four-channel Gilson I'vlinipu1s-3
peristaltic pnmp fitted with a rate selector, three Rheodyne 5041low-pressure injection valves (two of them nsed as selectionvalves), and Teflon tubing of 0.7 mm Ld. were used to bnild thehydrodynamic manifold. The fluoride-selective electrode (Metrohm 6.0502.150) was fitted in the npper part of the pervaporationmodnle. A Ag/AgCl reference electrode (Metrohm 6.0726.100)was also used and was located in a flow cell made in the laboratoryfrom a standard 10 mL disposable plastic syringe body with a 15mm i.d. and 2 mm drain holes drilled at 0.5 em from. the bottom.The tip of the syringe was cut, and the hole left was sealed with
silicone.' A Crison micro-pH 2001 potentiometer, coupled to aKnauer recorder, was nsed to monitor the potential.
The pervaporation cell (Figure 1), designed in our laboratory,consisted of two chambers: a donor chamber Oower part of theseparation nnit, 11) and an acceptor chamber (upper part of thennit, 6), both fitted with inlet and ontlet orifices for connectors(5) of the corresponding streams and a membrane support (8).The volnme of both chambers can be changed by placing spacers(9, 10) between the membrane support (7. 8) and the chamber.The npper chamber was fitted with a central orifice at the top toaccommodate the sensor (ISE) by adaptors (2, 3). Both chambersand the membrane snpport were aligned by inserting rods in the
(2) Valcarcel, M.; Luque de Castro, \1. D. Flow Injection AlIaZysis: Princij)iesand Applications; Ellis Horwood: Chichester, U.K, 1987
(3) Mattos, I. L; Luque de Castro, M. D. Anal. Chim. Acta 1994,298. 159165.
(4) Mattos, 1. L.; Luque de Castro, M. D.; Valcarcei, M. TalaJita, in press.(5) Douglas.]. G. Anal. Chern. 1989, 61. 922-924.
0003~2700/95/0367-3916$9.00/0 © 1995 American Chemical Society
IFjgure (A) Parts of the pervapcration cell: 1, 'on selectiveelectrcde: 2, ,daptor: 3, rubber ring: 4, aluminum supports: 5,COlnectors; 6. (eceJtorchambe~; I, membrane; 8, membrane support;9 and 10, spacers of 2 an::! 5 mm; 11, donor chamber; 12 and 13,
screws. (8) Cross-sectioral views and dimensions, in mm, of thereceptor (6) and donor (11) chambers,
orifices, and a closer contact was achieved by fixing them with
four s:rews (12, 13) between two ahminum supports (4). Thecross-sectional views in Figure IB show the dimensions and shape
of the module. which was made of methacrylate.Reagents. Sodium fluoride (extra pure, Merck) was dried at
130 "C for ~1 h, and 5.528 g of the dried product was dissolved
A
2
6
Pi :SEr~
12
13
,3
in 250 mL of Mi1li-Q purified water to make a 10 gil fluOlide
stock solution, All standard solutions within the working range
were prepared by appropriate dilution of be stock solution. A
1.5% (v/v) hexamethyldisiloxane (HMDSA) solution was prepared
wherever required by measuring out 25 mL of 2 M H2SO" into aflask, adding the appropriate VOIUlYle of HMDSA (organic so]ution~
Aldrich), and stirring for 5 min, After the solution was ieft to
stand for -15 min, tbe upper organic layer was aspirated oft The
1 and 2 M H2SO" solutions were prepared by diluting the
appropriate volume of concentrated aciti (96% purissimum, Pan
reac) in Mi1li-Q water. The acceptor buffer, 0.2 M Na,HPO" (pro
analysi, Merck)/O.l M ciuie acid (pro ana1ysi, Merck)/l M KCl
(oro analysi, Merck) of pH 7.8, was also prepared in Milli-Q water.
Stock aqueous solutions of Fe aID and Al(IID, used in the studyof interferences, were orepared from their nitrate salts. A 0,5 :vIsodium citrate solution, used for the masking of Al(IID and Fearn,was also prepared by dissolving the appropriate amount of tbesalt in Milli-Q water. Poly(vinylidene fluoride) (PVDF) and poly
(tetrafluoroethy1ene) (PTFE) membranes of 5.0 I'm and 47 mm
diameter, respectively, purcha:=.;ed from Millipore, were also llsed.Sample Treatment Liquid Samples. Fiuoride was deter
mined in tap water, fertilizers, and ceramic industry wastewateI',
Tap water was directly introduced into the flow injection (H)system. For fertilizers, 50 g of each sample was dissolved in 200mL of Milli-Q water. The remaining solids vvere removed byfiltration 'With a double filter (\'lhatman quaiitative filter paper) in
order to avoid clogging the system. Solids were also removed
from the ceramic industry wastewater as desclibed above
Solid Samples, Leaves fTom orange trees were washed withdoubly distiEed water and then '\~rirh a 0.05% v/v detergent/O.05%wIv EDTA solution by stirring .-......1 min. TIle leaves were
thoroughly rinsed with doubly distilled water and oven-dried at
60-80 "C for 48 h. Higher temperatures were not recommended,
as these could result losses of lhe volatile fluoride. The driedleaves were ground to a very fine powder using a Sorva]] Omni
Mixer 17106 (DuPont bstrumems), and the desired amount of
fluoride standard soluLioll was added. The ~(iIIlples were then
dried at 60-80 'C for 24 h and kept in plastic bottles previously
washed with 1:3 Eel/H,O solution and rinsed thoroughly with
doubly distilled water. All the samples were stored in a desicca
tor.") Solid standards were prepared in the same way as solid
samples, but the standard solution of fluoride was added direcJyto the sample chamber after the ground leaves were weighed.
Manifold and Procedure for lLiquid Samples, The samples
were introduced into the dynamic manifold shown in Figure 2A,either bv injection or by aspiration, Using the sample injection
procedure, the sample or standard soluton is mixed with HlvlDSA
in an acidic medium in which the volatile product (trimethylfluo
rosilane, TMFS) is formed in a 300 em coil at 80 'C. This TMFS
is then injected into a H2S04 stream and led to the donor chamber,also thermostated at 80:JC. During the evaporation and diffusion
of the TMFS through the PTFE membrane, the acceptor buffer
stream is halted, anti the decrease in the potential due to the
accumulation of fluoride by hydrolysis of the volatile product is
monitored. For direct aspiration, the sample or standard solutionis mtxed with HMDSA as in the former method, bUl both the
channel of acid solution and the injection valve are removed by
(6) Cooke, J ll..; M. s,: Davisoc.. :"i. w. Enuimn. Polllt!. 1976, 11,
257-26ft(7) of Official Analytical Chemists,
15lh ~d.; Hcirich, K_. VA. 19CJO: pp -Sf>
Analytical Chemistry 'fo/' 67. No, 21, November J, 1995 3917
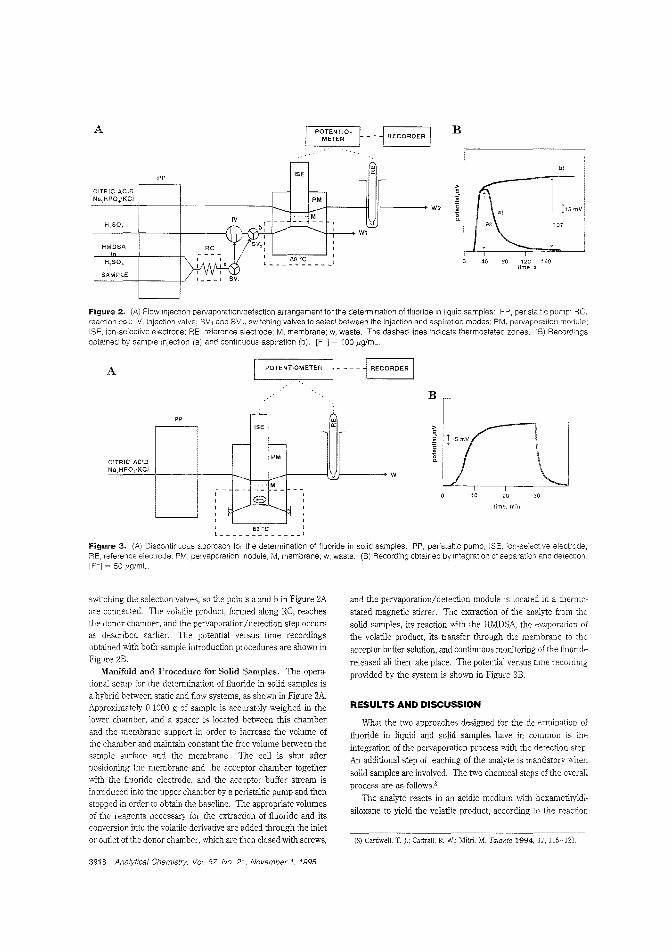
A --i RECORDER I B
CITRIC ACiDNa2HP04/KCJ
PP
c--
ISE
- r--PM
wc:
- r-
11----.......1 W2
b)
Figure 2. (A) Flow injection peNaporation!detection arrangement for the determination of fluoride in liquid samples: PP, peristaltic pump; RC,reaction coil; IV, injection valve; SV, and SV2, sV:itching valves to select between the injection and aspiration modes; PM, pervaporation module;ISE, ion-selective electrode; RE, reference electcode; M, membrane; w, waste, The dashed lines indicate thermostated zones. (B) Recordingsobtained by sampie injection (a) and continuous aspiration (b). [F-] ~ 100 I'g!mL,
A POTENTIOMETER! - - - - i RECORDER
PP-
~~~ISE
- -PM
CITRIC ACIDNa2 HPOJKCl
·M'-=--
I- - - - " - - -
I
I e I
I FV'-=-'----~ I
I ,I I
w
B
10 20
time, min
30
l
I 80 QC IL I
Figure 3. (A) Discontinuous approach for the determination of fluoride in solid samples: PP, peristaltic pump; ISE, ion-selective elect'ode;RE, reference electrode; PM, pervaporation module; M, membrane; w, waste. (8) Recording obtained by integration of separation and detection.[F"] ~ 50 .ug!mL.
switching the selection valves, so the points a and b in Figure 2Aare connected. The volatile product, formed along Re, reachesthe donor chamber, and the pervaporation/detection step occursas described earlier. The potential versus time recordingsobtained with both sample introduction procedures are shown inFigure 2B.
Manifold and Procedm'e for Solid Sanlples. The operational setup for the determination of fluoride in solid samples isa hybrid between static and flow systems, as shown in Figure 3AApproximately 0.1000 g of sample is accurately weighed in thelower chamber, and a spacer is located between this chamberand the membrane support in order to increase the volume ofthe chamber and maintain constant the free volume between thesample surface and the membrane. The cell is shut afterpositioning the membrane and the acceptor chamber togetherwith the fluoride electrode, and the acceptor buffer stream isintroduced into the upper chamber by a peristaltic pump and thenstopped in order to obtain the baseline. The appropriate volumesof the reagents necessary for the extraction of fluoride and itsconversion into the volatile derivative are added through the inletor outlet of the donor chamber, which are then closed with screws,
3918 Analytical Chemistry. Vol 67, No. 2'1, November 1, 1995
and the pervaporation/detection module is located in a thermo
stated magnetic stirrer. The extraction of the analyte from thesolid samples, its reaction with the HMDSA, the evaporation ofthe volatile product, its transfer through the membrane to the
acceptor buffer solution, and continuous monitoring' of the fluolide
released all then take place. The potential versus time recordingprovided by the system is shown in Figure 38.
RESULTS AND DISCUSSION
What the two approaches designed for the determination of
fluoride in liquid and solid samples have in common is theintegration of the pervaporation process with the detection step.
An additional step of leaching of the analyte is mandatory when
solid samples are involved. The two chemical steps of the overallprocess are as followss
The analyte reacts in an acidic medium with hexamethyldi
sHoxane to yield the volatile product, according to the reaction
(8) Cardwell, T.].; Cattrall, R W.; Mitri, M. T'llanta 1994,41,115-123.
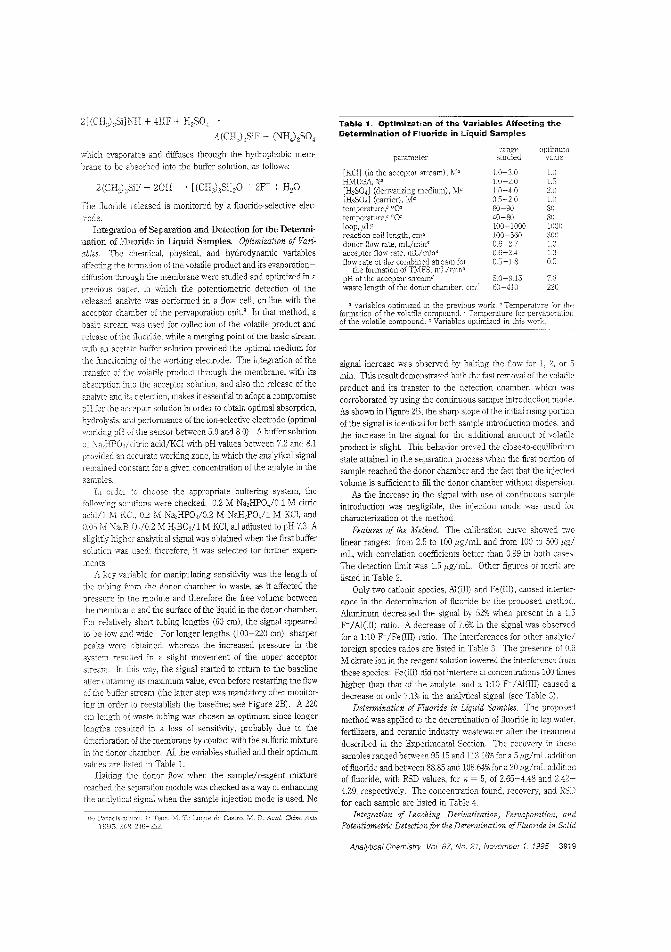
2[(CH,):JSi]NH + 4HF + H2SO , -'
4(CH)3SiF + (NH4),SO,
Table 1 ~ Optimization of the Variables Affecting theDetermination of Fluoride in Liquid Samples
signal increase was ohserved by halting the flow for 1, 2, or 5ntll. This result demonstrated bolh the fast removal of the volatileproduct and its transfer to the detection chamber, which wascorroborated by using the continuous sample introduction mode.As shown in Fignre 2B, the sharp slope of the initial rising portionof the signal is identical for both sample introduction modes, andthe increase in the signal for the additional amount of volatileproduct is slight This behavior proved the close-to-equilibriumstate attained in the separation process when the first portion ofsample reached the donor chamber and the fact that the injectedvolume is sufficient to fill the donor chan1ber without dispersion.
As the increase in the signal with use of continuous sampleintroduction was negligible, the injection mode was used forcharacterization of the method.
Featur'S of (he Method. The calibration curve showed two
linear ranges: from 2.5 to 100 pg/mL and from 100 to 500 pg/mL, with correlation coefficients better than 0.99 In both cases.The detection limit was 1.5 pg/mL Other figures of merit arelisted in Table 2.
Only two cationic species, ,">1(11!) and Fe (1m , caused irterference in the determination of fluoride by the proposed methoclAluminum decreased the signal by 52% when present in a 1:5F-/ Al(ll!) ratio. A decrease of 7.6% in the signal was observedfor a 1:10 F-/Fe(lIl) ratio. The interierences for other analyte/foreign species ratios are listed in Table 3 The presence of 0."M citrate ion in the reagent solution lowered the interference fromthese species: FeOID did not interiere at concentrations 100 timeshigher than that of the analyte, and a 1:1D F-jA1(I1D ca'lsed adecrease of only 7.1% in the analytical signal (see Table 3).
Determination of Fluoride in Liquid Samples. The proposedmethod was applied to the determination of fluoride in tap water,fertilizers, and ceramic industry wastewater after the treatmentdescribed in the Experimental Section. The recovery in thesesamples ranged between 95.15 and 11316% for a 5/Jg/mL additionof fluoride a~d between 88.85 and 108.64% for a 20 pg/mL additionof fluolide, with RSD values, for" = 5, of 2.65-4.48 and 2.424.39, respectively. The concentration found, recovery, and RSDfor each sample are listed In Table 4.
Integration of Leaching, Derivatization, Pervaporatiol1, andPotentiometric Detection for the Determination ofFluoride in Solid
1.01.52.0!.OSOSO111003001.31')0.5
n220
5.0-8.1560-410
1.0-3.01.0-2.01.0-4.005-2.060-9040-S0lOO-IOOO100-5600.6-2.70.6-2.40.5-1.S
parameter
[Ken (in the acceptor stream), M"HMDSA, %a[H2S04] (derivatizing medium), M"[H2S041 (carner), M'temperature b °eotemnerature:c °eoloor::"uUreactiondonor flow rate,acceptor flow rate,flow rate of the combined stream for
the formation ofTMFS, mL/rnina
pH of the acceptor s~Teamd
waste length of the donor chamber, cmr!
L; Tepa, M. T.: Luque de Castro, M. D. A,wt. Chim. Acta
which evaporates and diffuses through the hydrophobic membrane to be absorDed into the buffer solution, as follows:
2(CH3)"SiF - 20W -. [(CH3hSi]20 + 2F- + H20
'The fluoride re1e,-sed is monitored by a fluoride-selective elecefode_
Integration of Separation and Detection for the Determination of Fluoride in Liquid Samples. Optimization of Variables. The chemical, physical, and hydrodynamic variablesaffecting the formation of the volatile product and its evaporationdiffusion through the mernbr2"ne were studied and optimized in a
previous paper, in which the potentiometric detection of thereleased analyte was periormed in a flow cell, on-line with theacceptor chamber of the pervaporation unit' In that method, abasic stream was used for collection of the volatile product and'-elease of the Huoride, while a merging point of the basic streamwith an acetate buffer sobtion provided the optimal medium forLhe functionIng of the working electrode. The integration of the:ransfer of the volatile product through the membrane, wit!) itsabsorotior, into the accepcor solutIon, and also the release of theanalyt~ and its detection, makes it essential to adopt a compromise"H for the acc~ptor solution in order to obtain optimal absorption,11ydroiysis, and pe:iormancc of tho ion-selective electrode (optimalwerking pH of the sensor between 5.0 and 8.0). Abuffer solutionof:'-Ja,HPO';citric acid/KCI with pH values between 7.2 and 8.1Tlrovided an accurate working zone, in which the analytical signal~emained constant for a given concentration of the analyte in thesamples.
II! order choose the appropIiate buffeling system, thei'oilownrr solutions were checked: 0.2 M Na2HP04/0.l M citlic:cic1/{ ~ KC., 0.2 M Na2HP04/O.2 M NaH,P04/l M KCI, and0.05 M Na,BO;/O.2lVl H3BOJI M KCI, all adjusted to pH 7.3. Aslightly higher analytical signal was obtained when the first buffersolution was used; therefore, it was selected for further experi
ments.A kev variable for manipLiating sensitivity was the leng"ch of11]bi~g Ji-om the donor chamber to waste, as it affected the
oressure in tbe module and therefore the free volume between;he membrane and the surface of the liquid in the donor chamber.Fer relatively short tubing lengths (60 em), the signal appearedto be low anei wide. For longer lengths (100-220 em), sharperpeaks were obtained, whereas the increased pressure in thesvstem resulTed in ? slight movement of the upper acceptor
s;ream. In this way, the signal started to return to the baselineafter obtaining its maximum value, even before restarting the flowof [he buffer stream (-che latter step was mandatory after monitormg m order to reestablish the baseline; see Figure 2B). A 220em length waste tubing was chosen as optimum since longerlengths resulted in a loss of sensitivity, probably due to thedeterioration of the membrane by contact with the sulfulic mixtureIn the donor chamber. All the variables studied and their optimumvalues are listed In Table 1.
Halting the donor flow when the sample/reagent mixturereached the separatioIJ mouule was checked as a way of enhancing
the analytical sIgnal when the sample injection mode is used. No
Analytical Chemistry Vol. 67, No. 27, November 1, 1995 3919
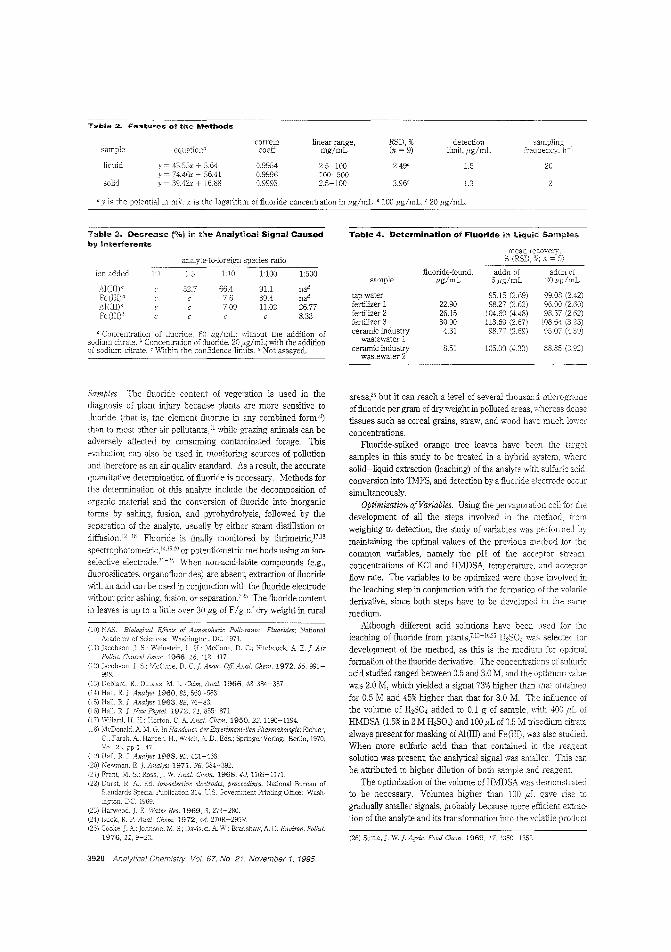
Table 2. Features of the Methods
sample
liquid
solid
equation"
y 43.55x + 5.64y ~ 74.46x - 56.41y = 3S,42x + 16.88
0.99540.99960.9993
linear range, RSD,% detectionmg/mL (n = 9) Iimit,lig/mL frequency,
2.5-100 2.49' 1.5 20100-5002.5-100 3.96' 1.3
"y is the potential in mY; x is the logarithm of fluoride concentration in !ig/mt b 100 pg/mL. c20 pg/rnL
Table 3. Decrease (%1 in the Analytical Signal Causedby Interferents
Table 4. Determination of Fluoride in Liquid Samples
analyte-to-foreign species ratio
ion added 1:1 1:5
.52.7
1:10
66.47.67.09
1:100
91.139.411.02
1:500
nad
nad
26.778.33
sample
tap waterfertilizer 1fertilizer 2fertilizer 3ceramic industry
wastewater 1ceramic industry
wastewater 2
fluoride-found,I'g/mL
22.9026.1530.90
4.31
8.51 105.00 (433) 88.85 (3.92)
Samples. The fluoride content of vegetation is used in thediagnosis of plant injury because plants are more sensitive tofluoride (that is, the element fluorine in any combined form10)
than to most other air pollutants,11 while grazing animals can beadversely affected by consuming contaminated forage. Thisevaluation can also be used in monitoring sources of pollution
and therefore as an air qualily standard. As a result, the accuratequanti1ative determination of fluoride is necessary. Methods for
the determination of this analyte include the decomposition of
organic material and the conversion of fluoride into inorganicf011n8 by ashing, fusion, and pyrohydrolysis, followed by the
separation of the analyte, usually by either steam distillation or
diffusionl 2-l6 Fluoride is finally monitored by titrimetric,l7.l8
spectrophotometric,"·!9,2I) or potentiometric methods using an ionselective electrode.'H' When non-acid-Iabile compounds (e.g.,
fluorosilicates, organofluorides) are absen~ extraction of fluoride
with an acid can be used in conjunction with the fluoride electrodewithout prior ashing, fusion, or separation.7.," The fluoride content
in leaves is up to a little over 30 fig of F/ g of dry weight in rural
(lD) NAS. Biological Effects 0/ Atmospheric Polbtmlts: Fluorides; NationalAcademy of Sciences: Washington, DC, 1971.
(11) Jacobson, J. S.; Weinstein. L. H.; McCune, D. C.; Hitchcock, A. E.]. AirPollza. Control Assoc. 1966, 16, <12-417.
(2) Jacobson,]. S.; McCune, D. c.]. Assoc. Off Aua!. Chern. 1972.55, 991)98
(13) Debiard, R; Dupraz. M. L. Chim. Anal. 1966. 48, 384-387.(14) Hall, R.]. Analyst 1960, 85, 560-563.
Han, R. ]. A.naiyst 1963, 88, 76-83.(16) Hall, R.]. New Phytol. 1972, 71, 855~871.(17) Willard, H. Horton, C. A. Anal. Chern. 1950,22,1190-1194(18) \1cDonalcL A M
Farah, A, Harben. H., Welch, ,~\... D., Eds.; Springer-Verlag: 1970;Vol. 22, pp 1 47.
(19) Hail, R.]. Analyst 1968, 93, 4.·61-468.(20) Newman, E. J. Analys! 1971. 96. 384-392.(21) Frant, S.; Ross, J. W. Anal. Chern. 1968,40,1169-1171.(22) Durst. R. A. EeL lon-selective electrodes, proceedings; National Bureau of
Standards Speciai Publication 314: U.S. Govemment Printing Office: Washngton, DC, 1969.
(23) Harwood, J. E. Water Res. 1969, 3, 273-280.(24) Buck, R. P. Anal. Chern. 1972,44. 270R-295R(2:')) Cooke, J. A: Johnson, M. S.; Davison, A W.; Bradshaw, A D. Environ. Pollut.
1976,11.9-23.
3920 Analytical Chemistry. Vol. 67, No. 21. November 1, 1995
areas,26 but it can reach a level of several thousand micrograms
of fluoride per gram of dry weight in polluted areas, whereas dense
tissues such as cereal grains, straw, and wood have much lowerconcentrations.
F1uoride-spiked orange tree leaves have been the larget
samples in this study to be treated in a hybrid system, where
solid-liquid extraction (leaching) of the analyte with sulfuric acid.conversion into TMFS, and detection by a fluoride dectTode occursimultaneously.
Optimization o/Variables. Using the pervaporation cell for the
development of all the steps involved in the method, from
weighing to detection, the study of variables was perfomled
maintaining the optimal values of the previous method for the
common variables, namely the pH of the acceptor streamconcentrations of KCl and HMDSA, temperature. and acceptor
flow rate. The variables to be optimized were those invoived inthe leaching step in conjunction with tbe formation of the volatile
derivative, since both steps have to be developed in the same
medium.
Although different acid solutions have been used for theleaching of fluoride from plants,1.!:)-16.25 H2SO, was selected for
development of the method, as this is the medium for optimalformation of the fluoride derivative. The concentrations of sulfuricacid studied ranged between 0.5 and 3.0 M, and the optimum valuewas 2.0 M, which yielded a signal 73% higher th.,l that obtained
for 0.5 M and 45% higher than that for 3.0 M. The influence of
the volume of H2S04 added to 0.1 g of sample, "ith 400 flL ofHMDSA (1.5% in 2 M H2S04) and 100 fiL of 0.5 M trisodium cin'ate
always present for masking ofAlam and Feam, was also studied.'When more sulfuric acid than that contained in the reagent
solution was present, the analytical signal was smaller. This em]
be attributed to higher dilution of both sample and reagent.
The optimization of the volume of HMDSA was demonstratedto be necessary. Volumes higher than 100 fiL gave rise to
gradually smaller signals, probably because more efficient extraction of the analyte and its transformation into the volatile product
(26) Suttle,]. W.j. Agric. Food Chern. 1969, 17, 1350-1352.
;;) Abstract published in Advance ACS Abstracts, September 15, 1995
AC950357Z
Table 5. Determination of FhJoride in Solid Samples
100.96 (3.67)92.86 (0.99)9g.84 (08:J)
103.30 (1.52)
98.54 (2.54)97.2:: (::.02)
10248 (257)98.86 (2.44)
10.6014.9635.4850.12
orange tree leaves 1orange tree leaves 2orange tree leaves 3orange tree leaves -1
sample
Received for review April 10, 1995. Accepted August 7,1995."
ACKNOWLEDGMENTDirecci6n Intelministerial de Clenda y Tecnologia is thanked
for financial support (Project PB-93/0827). I.P. expresses gratitude to the Human Capital and Mobility Programme (ED).
CONCLUSIONSContinuous and disoontinuous methods for the determination
of fluoride in liquid and solid samples, respectively, involving u'1cintegration of separation with potentiometric detection in bothcases, are proposed.
The response time is shortened as compared to the conventional1ocation of the sensor after the separation mOdule," sincethe transport of the target species kom the separation module tothe detector is avoided. In additioll, the monitoring of the kineticsof the mass transfer through the membrane is feasible, thusallowing a better llnderstRnding DC the separation step and aneasier and in-depth optimization.
The danger of clogging the separation membrane is avoIdedby using pervaporation rather than gas-diffusion for the separationof the volatile compound formed kom the analyte.
Miniaturization of the setup for the determination of an anaIytceasily convertible into a volatile derivative in solId samples isachieved by integration of the leaching, derivatization, separation.and detection steps.
The approach can be applied to the determination of anyvolatile or any easily formed volatile species for which ion-selectiveelectrodes exist (e.g., l\H3, CO" halogenides, etc.). In addition,both species v,.it't redox properties can be monitored voltammen
cally, while colored or luminescent species or derivatizationproducts can be monitored via optical fiber-assisted moleculardetectors.
surpassed by its dilution. Consequently, the volumes addedto ~·0.1000 g of samples were lOOIAL of HMDSA (1.5% in 2 M
sulfuric ac',d) and ]00 uL of 0.5 M trisodium citrate. A higher or
lower weight of solid sample, followed by the positioning or
removal of suimble spacers and addition of proportional volumes
of reagent and masking solutions, was checked. Greater orsmaller signal>, respectively, were obtained, but they were notproportional to the amount of sample, due to the difficulty inkeeping the volume betvveen the sample surface and the membrane constant 'I'h.us, an amount of sample similar to the amount
of matrix for calibration must be always used.
i'Jter the absence of fluoride in unspiked leaves was verified,this material was used as a blank in order to estimate the strengthof the retention of the analyte by the organic matrix and thus thefacility for calibration. Three different experiments were performed witb the same amount of fluoride used for (1) spikingground leaves, which were then over.-dried at 60-80 'C for ~24
before the method was applied, (2) spiking the dried leaves,
whIch were then oven-dried as above and ground, and (3) adding
the spike directly to the ground and dried leaves previouslyweighed in the donor chamber of the separation/detectionmodule. Idemical results obtained in experiments 1 and 3provedthe quantitativeness of the leaching step. The lower recoveriesachieved by experiment 2 were foreseeable because of the lackof homogeneity of the lcavcs/F- mixture.
Features of the Method. The similarity of the resll]ts obtainedby spiking the ground leaves and determining the spiked analyte
cr without a drJing step made it easier to carry out thecalibration by the latter procedure. Therefore, the calibrationcurve was prepared by weighing 0.1000 g of the solid matrix inthe pervaporation cell and adding the appropriate amount of
1100ride standard solution, followed by that of the reagents. Thecalibration graph showed a linear range between 2.5 and 100 flg/
mL The equations describing this behavior and other significant
figures are listed in Table 2.As was expected, the potential interferences from FeCII!) and
AI(llD showed the same behavior as in the liquid samples method(see Table 3)
Determination ofFluoride in Solid Samples. The applicabilityof the proposed method was evaluated by dctcnnining the targetanalyt2 in leaves from orange trees. The recovery ranged from
97.22 :0 102.48% and kom 92.86 to 103.30% for addition of 10 and20 .ug/mL of fluoride, respectively. All the results obtained inthe determination of nuoride in these samples are listed in Table5.
AnalyUcal Chemistry. Vol. 67, No. 21, November 1. 1995 3921
Anal. Chern 1995,67,3922-3927
Gas-Phase Microbiosensor for Monitoring PhenolVapor at ppb Levels
Manus J. Dennison, Jennifer M. Hall, and Anthony P. F. Turner*
Cranfield Biotechnology Centre, Cranfield University, Cranfield, Bedfordshire MK43 GAL, UK
A microbiosensor capable of measuring very low levelsof phenol vapor directly in the gas phase has beenconstructed. The microbiosensor is based on the enzymepolyphenol oxidase, which catalyzes the oxidation ofphenols to catechols and then to quinones. Polyphenoloxidase was immobilized in a glycerol-based gel which didnot dehydrate significantly over time. An interdigitatedmicroelectrode array was used as transducer. Phenolvapor partitioned into the glycerol gel, where it wasenzymatically oxidized to Cjuinone. Signal amplificationwas achieved by redox recycling of the quinone/catecholcouple. This redox recycling produced a biosensor capable of measuring phenol vapor concentrations of 30ppb. The biosensor produced a constant signal after 5days of continuous use at room temperature and haspotential application in the field of health and safetymonitoring, where its ease of use, selectivity, and realtime monitoring would provide personnel with accuratedata.
Gas-phase sensing has been dominated by nonbiologicalsensors, such as electrochemical, semiconducting, and pellistertype sensors, Commercial semiconducting sensors exist for manygases.' while chemical sensors based on colorimetric principlesare commercially available for over 100 different gases.2 Thereis a great variety of applications for sensors which can detect thepresence of hazardous gases in industrial environments, andcurrent equipment suffers from a lack of portability and theinability to determine cumulative exposure" Potentiometric andamperometlic gas sensors are, in general, limited to a narrowrange of electroactive gases.' Semicondncting gas sensors, whileable to detect a v.ide range ofgases, have high power consumptionand suffer from a serious lack of specificity. Pellister-type sensorsare used for volatile organic carbons and cannot effectivelydistinguish between different gases, There exists a need for gassensors with low power consumption and which are selective forunreactive gases or vapors, gas-phase biosensors could fulfill aniche requirement here.
Biological recognition proteins, such as enzymes and antibodies, have high inherent selectivity. These proteins, when incorporated into sensors, confer this property of selectivity on thebiosensor. Biosensors have been developed for a large range of
0) Butt G.: rhorpc, s. C.lnP. T.. J o. w.. IVi!iiams. D. E., Eds.: Adam
pp 139-160.(2) handbook, 8th Draeger Ltd" >ubeck, Germany, 1992,(:3) ], Sens. Rev. 1993, 13,32-33,
I-Iobbs, B. S.; Tantrarn, D. S.; Chan-Henry, R. In Techniques andmechanisms in gas sensing, MoseL::y, P. T., NorT~s, J. O. W., Williams, D. E.,
Adam Hilger: BJistoL UK, 1991: pp 161-181
3922 Analytical Chemistry, Vol, 67, No, 2:, November 1, 1995
analytes, including glucose,' cholesterol,ii alcohol,' and lactate,Sand have made their mark mainly in the field of clinical analysis,although recently many have been developed for environmentalanalysis,9 Biosensors can also operate in certain organic phases, 10
provided that some water is available to the enzyme.Certain problems are involved with applying biosensors for gas
phase sensing. As all enzymes need water for activity, and asthe gas phase is usually a drier environment than the aqueousphase, water from the biosensor will evaporate to the gas phase,This loss of water will eventually affect enzyme activity and willalso change the concentrations of the substrates and products,Hence, biosensor response, stability, and lifetime v,ill be affectedby the relative humidity, The fact that enzyme activi", isdependent on the availability of water has been the largestlimitation on the advancement of biosensors into the field of gasmonitoring.
Early gas-phase biosensors were essentially bioreactors containing the sensing element (usually bacteria or enzymes) in anaqueous phase, into which was pumped the gas in question, Thegas then dissolved in the aqueous phase, where it was detectedby the sensing element. Using a bioreactor fom1at overcomesthe problem of water evaporation by avoiding direct interfacingwith the gas phase, Biosensors based on this principle includethe earliest reported gas-phase biosensor. J) This biosensor wasbased on a methane oxidizing bacterium, Methylomonas flagellata.dissolved in buffer which, when exposed to methane in solution,oxidized the gas, reducing aqueous levels of 0" which weredetected by a Clark-type oxygen electrode, A similar biosensorhas also been constructed for nitrogen dioxide,'1 A carbonmonoxide sensor incorporating CO oxidoreductase similarlyinvolved dissolution of the analyte in a layer retained in a reactoror as a probe. 13 A mediator was used to effect electron transferfrom the enzyme to the electrode, GuilbauJt1 producedbiosensor for formaldehyde based on formaldehyde dehydrogenase immobilized on a piezoelectric crystal detector which could
(5) (ass, A. E. G.; Davis, G.; Francis. G. D.; I-n, H. A 0.: ASLon, IV. LI. J.: Plotkin, E. Y: Scott, L D. L; Turner, A P Anal
667-671.(6) Ball, M. R.; Frew,]. E.; Green. M.].; Hill, H. O. Proc. fieetrochem. Soc
1986,86, t4-2i(7) .T.: Romero, E. G.; Reviejo, A ]. j. Electroanal. 1993, 353,
(8) Mullen, W. H.; Churchouse, S.].; Freedy, F. H.: Vadgama. M.Arta 1986, 157, 191-198,
(9) Dennison, M. ].; Turner, A P. F. Biolechnol. Adu. 1995. 23, 1-12.(10) Hall. G.; Best, D.; Turner. A. Enzyme Microb. ·Fechnol. 19:58, 10, 543-540.(11) Karube, 1.; Okada, T.; Suzuki. S. Anal. Cht:m. Acta 1982. 135, 61-67(12) Okada, T.; Karube, L; Suzuki, S. BiotechnoL. Bioeng. 1983,25 (6), 1641-
t651.(13) Turner, II.. P. P.; Aston, W.].; Higgins. 1.].: Beli,]. M.; Coiby, J.; Davis, G.:
Hill, A O. Anal. Chern. Acta 1984, 163, 161-171.(14) Gui:bauit, G. G. .4nal. Chem. 1983,455,1682-1684.
0003-2700/95/0367-3922$9.00/0 © 1995 American Chemical Society
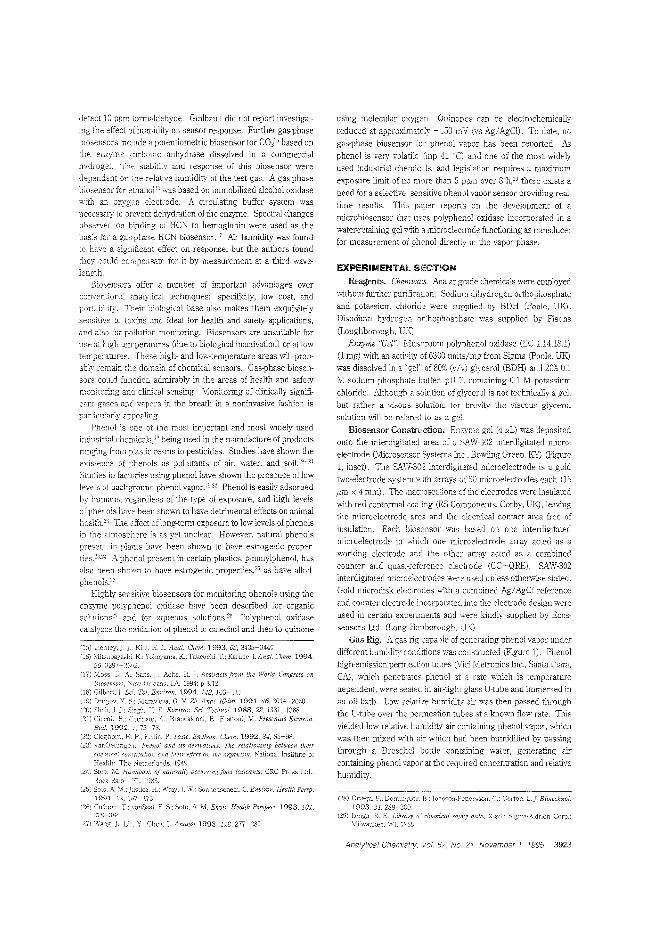
Sigma-Aldrich Corp.:data, ;,;
(28) Cnega, F.; Dominr;L0%. E ; ]oilssOn-Pet1crsson. G.; Gorton. L.]. BimcelInal.1993,31,289-300
(29) Lenga. 1-<' E. LibruryMilwaukee. \VI, 1~.18S
using molecular oxygen. Quinones can he electrochemically
reduced at approximately -150 mV (vs Ag/AgCl). To date, no
gas-phase biosensor for phenol vapor has been reported, As
phenol is very volatile (mp 41 'C) and one of the most widely
used industrial che:micals, and legislation requires a rnaxi:num
exposure limit of no more than 5 ppm over 8 h,:29 there exists a
need for a selective, sensitive phenol vapor sensor providing real
time results. This paper reports on the development of a
microbiosensor thaI uses polyphenoi oxidase incorporated in a
water-retaining gel ",th a microelectrode functioning as transducerfor measurement of phenol directly in the vapor phase.
EXPERIMENTAL SECTION
Reagents. Chemica,s, Anaiar grade chemicals were employed
withom further purificaLion. Sodium dihydrugell orthophosphate
and potassium chloridc: were supplied by BDH (poole, UK).
Disodium hydrogen mihophosphate was supplied by Fisons
(Loughborough, UK)
Enzyme "Gel", Mushroom polyphenol oxidase (EC 1.14.18.1)
(1 mg) with an activity of 6300 units/mg from Sigma (Poole, UK)
was dissolved in a "gel" of 80% (v/v) giycerol (BDH) and 20% 0.1
M sodiun phosphate buffer, pH "(, containing 0.1 M potassium
chloride. Although a solution of glycercl is not technically a gel,
but rather a visous solution, for brevity the viscous glycerol
solution \vi.ll ')e refered to as a gel.
Biosensor Construction. Enzyme gel (4 j-lL) was deposited
onto the interdigitated area of a SAW-302 interdigitated micro
electrode (Microsensor Systems Inc., Bowling Green, K'l) (Figure
1, inset). The SAW-302 interdigitated microelectrode is a goid
two-electrode system with arrays of 50 microelectrodes each (15
I,m x 4 mm). The macosec:ions of :he electrodes were insulated
with red conformal coating (RS Components, Corby, UK), leavingthe microelectrode area and the electrical contact area free of
insulation. Each biosensor was based on one interdigitated
microelectrode in which one microelectrode array acted as a
working electrode ane the other array acted as a combined
counter and quasi-reference electrode (CC+QRE). SAW-302
interdigitated microelectrodes were used unless otherwise stated,
Gold microdisk electrodes with a combined Ag/AgCI reference
and counter electrode incorporated into the electrode design were
used in certain experiments and were kindly supplied by Ecos
sensors Ltd. (Long Hanborough, UK).
Gas Rig. A gas rig capabie of generating phenol vapor under
different humidity conditions was co~s1J:Ucted (Figure 1). Phenol
high-emission pem1eation tubes (Vici Metronics Inc" Santa Clara,
CAl, which penetrates phenol at " rate which is temperaturedependent, were sealed in air-tight glass U-tube and immersed in
an oil bath. Low relative humidity air was then passed through
the U-tube over the pe:-meation tubes at a known flow rate. This
yielded low relative humiditf air containing phenol vapor, which
was then mLxed with air which had been humidified by passing
through a Dreschel bottle containing water, generating air
containing phenol vapo· at tbe required concentration and relativehumidity.
378-38(.
Wang. Chen. L. Anmyst 1993. 118,277-280.
Tiemey, J J' Kim. L. Anal. Chem. 1993, oS, 3435-3440,(16) \1itsubayash;. K; Yokoyama, K; Takeuchi, T; Karube, LAna!. Chem. 1994.
66, ;)297-;:\302,
(17) Moss, D. Sans, J: Act.e, H. J. Abstr2cts from the World Congress onOrlf'Cl'1s. lA. 1994: p 3.12
Tal. EJltJiron. 1994. 143, 103-111.:VIurav'eva, G. V. Zh. Anal. Khim. 1991, 46, 2014-2020.
I-I. B. Environ. Sci. Technol, 1988, 22. 1381-13881\.: Brancaleoni, E.: Frattoni. M. Frescnius Environ.
j. 73-78.P.; Fellin, P. Toxic. Enuiron, Chern. 1992,34,85-98
VacOenin"c", Phenol and its den-wtivts: The relationship between thdreild effect f!f1 nrgflnism; National Institute of
Health: Netherlands, 1949Sto:J, M. }fmldboofl of naturally occu,ring food toxicants: CRC Press Lcd.:
Boca Raton. lY83.{2S; Solo. A. E.; IiI/ray, J. W.: Sonnenschein, C. Environ. Health Pcrsp.
1991,92. 173Colborn, T.: '/OnSaa1. F. 5.; Soto, A. M. Envir. Heal/h Perspect. 1993. 101.
detect 10 ppm formaldehyde. Guilbault did not report investigat
ing the effect of humidity orr sensor response. Further gas-phase
biosensors indude a potentiometric biosensorfor CO/' based onthe enzyme carbonic anhydrase dissolved in a commercialhydrogeL The stzbilily amI response of this biosensor weredependent Gn the relative hurrjdity of the test gas. A gas-phase
biosensor for ethanol''' was based on immobilized alcohol oxidase'With an oxygen electrode. A circulating buffer system wasnecessary to prevent dehydration of the enzyme. Spectral changesobserved OIl binding of HCN to hemoglobin were used as thebas's fer a gas-phase HCN biosensor. 17 Air humidity was foundto have a signiii.caJt effect on response, but the aut.~ors foundthey could c:ompensatf' for it by measurement at a third wavelengTh.
Biosensors offer a number of important advantages overconventional analy1ical techniques: specificity, low cost, and
portability. TI1eir biological base also makes them exquisitelysensitive to toxins and ideal for health and safety applications,and alSD for pollution monitoring. Biosensors are unsuitable for
use at high ten1peratures (due to biological inactivation) or at lowtemperatures. These high- and low-temperature areas will probably remain the domain of chemical sensors. Gas-phase biosensors could function admirably in the areas of health and safetymonitoring a11d clinical sensing. Monitoring of clinically significam gases and vapors in the breath 1.'1 a noninvasive fashion isparticu:arly appearing.
Phenol is one of the most important and most v;idely usedindustrial chemicals, l' being used in the manufacture of productsranging from plastic resins to pesticides. Studies have shown theexistence of phenols as pollutants of air, water, and soill9 - 21
Studies in factorie:: using phenol have shown the presence of lowlevels of background phenol vapor-I'!,,, Phenol is easily adsorbed
by humans, regardless of the type of exposure, and high levelsof phenols have been sho"'11 to have detrimental effects on animalhealth.'" 11,e effect of long-tenn exposure to low levels of phenolsin the atmosphere is as yet unclear. However, natural phenolspresem in plants have been shown to have estrogenic proper-
A phenol present in certain plastics, p-nonylphenol, has21so been shown to have estrogenic properties,'" as have alkylphenols.25
Highly sensitive biosensors for monitoring pheno}s using theemyme polYP1enol oxidase have been described for organicsolutions27 and for aqueous solutions.is Polyphenol oxidasecatalyzes thc oxidEtion of phenol to catechol and then to quinone
Analytical Chemisl,y, Vol. 67, No. 21, November 1. 1995 3923
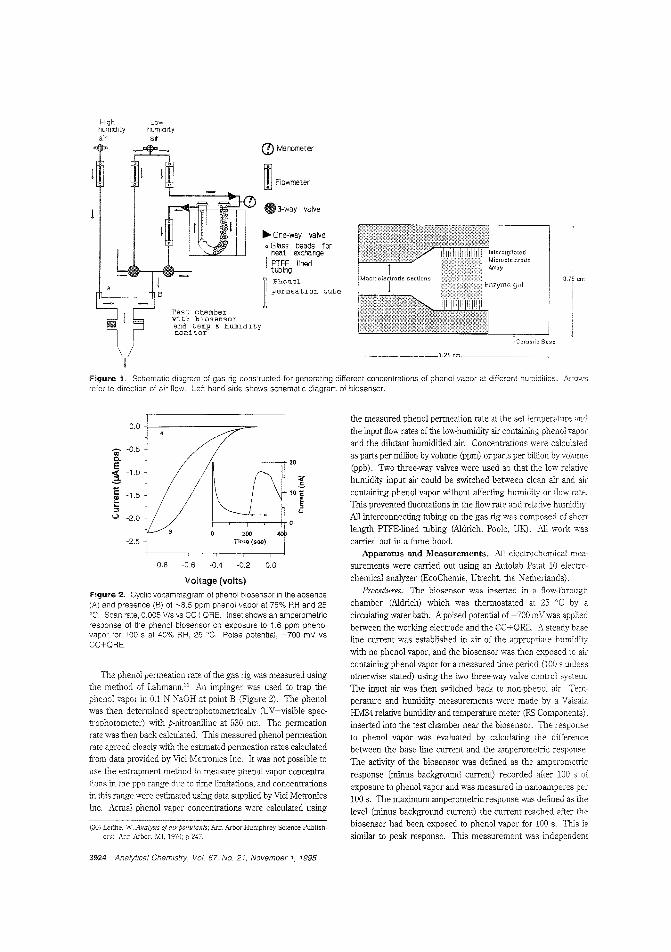
Highhumidityair
)I
Lowhumloltyair
Test chambervith biosensora:;td tem.p & hmnidi tymoni tor
(]) Manometer
rn Flowmeter
G 3-way valve
~ One-way valveo Glass beads for
heat exchangeI PTFE lined
tUbing
~ Phenolil permeation tube
lnterdlgit<ltedMicroclcCirodc
Array
LCCr:1111ic: Bust:
~ . 1.25 em _
Figure 1. Schematic diagram of gas rig cons:ructed for generating different concentrations of phenol vapor at different humidities. Arrowsrefer to direction of air flow. Left-hand side shows schematic diagram of biosensor.
(30) Leithe, W. Analysis ofair pollutants; Ar.n Arbor-Humphrey Science Publishers: Ann Arbor. MI, 1970; p 247.
the measured phenol permeation rate at the set temperature and
the input flow rates of the low-humidity air containing phenol vaporand the dilutant humidified air. Concentrations were caleulatedas parts per million by volume (ppm) or parts per billion by volume
(Ppb). Two three-way valves were used so that the low relativehumidity input air could be switched between clean air and air
containing phenol vapor without affecting humidity or flow rate.This prevented fluctuations in the flow rate and relative humidity.All interconnecting tubing on the gas rig was composed of shan
length PTFE-lined tubing (Aldrich, Poole, UK). All work was
carried out in a rJme hood.Apparatus and Measurements. All electrochemical mea
surements were carried out using an Autolab Pstat 10 electro
chemical analyzer (EcoChemie, Utrecht, the Netherlands).Procedures. The biosensor was inserted in 8 flow-through
chamber (Aldrich) which was thermostated at 25 'C by a
circulating water bath. A poised potential of -700 mV was applied
between the working electrode and the CC+QRE. A steady baseline current was established in air of the appropliate humidity
with no phenol vapor, and the biosensor was then exposed to aircontaining phenol vapor for a measured time period (100 sunlessotherwise stated) using the two three-way valve control system.
111e input air was then switched back to non-phenol air. Temperature and humidity measurements were made by a VaisalaHM34 relative humidity and temperature meter (RS Components),inserted into the test chamber near the biosensor. The responseto phenol vapor was evaluated by calculating the differencebetween the base line current and the amperometric response.
The activity of the biosensor was defined as the amperometric
response (minus background current) recorded after 100 s ofexposure to phenol vapor and was measured in nanoamperes per
100 s. The maximum antperometric response was defined as thelevel (minus background current) the current reached after thebiosensor had been exposed to phenol vapor for 100 s. This issimilar to peak response. This measurement was independent
0.0
U> -0.5Q. 2.E1 -1.0
1C -1.5 10 'Ee §5 "(,) -2.0
-0.8 -0.6 -0.4 -0.2 0.0
Vollage (volts)
Figure 2. Cyclic voltammagram of phenol biosensor In the absence(A) and presence (8) of -8.5 ppm phenol vapor at 75% RH and 25'C. Scan rate, 0.005 Vis vs CC+ORE. Inset shows an amperometricresponse of the phenol biosensor on exposure to 1.6 ppm phenolvapor for 100 s at 40% RH, 25 'C. Poise potential, -700 mV vsCC+ORE
-2.5
The phenol permeation rate of the gas lig was measured usingthe method of Lahmann30 An impinger was used to trap thephenol vapor in 0.1 N NaOH at point B (Figure 2). The phenolwas then detem1ined spectrophotometrically (UV-visible spectrophotometer) with p-nitroaniline at 530 nm. The permeationrate was then back calculated. This measured phenol permeationrate agreed closely with the estimated permeation rates calculatedfrom data provided by \lici Metronics Inc. It was not possible to
use the entrapment method to measure phenol vapor concentrations in the ppb range due to time limitations, and concentrationsin this range were estimated using data supplied by Vici MetronicsInc. Actual phenol vapor concentrations were calculated using
3924 Analytical Chemistry, Vol. 67, No. 21, November 1, 1995
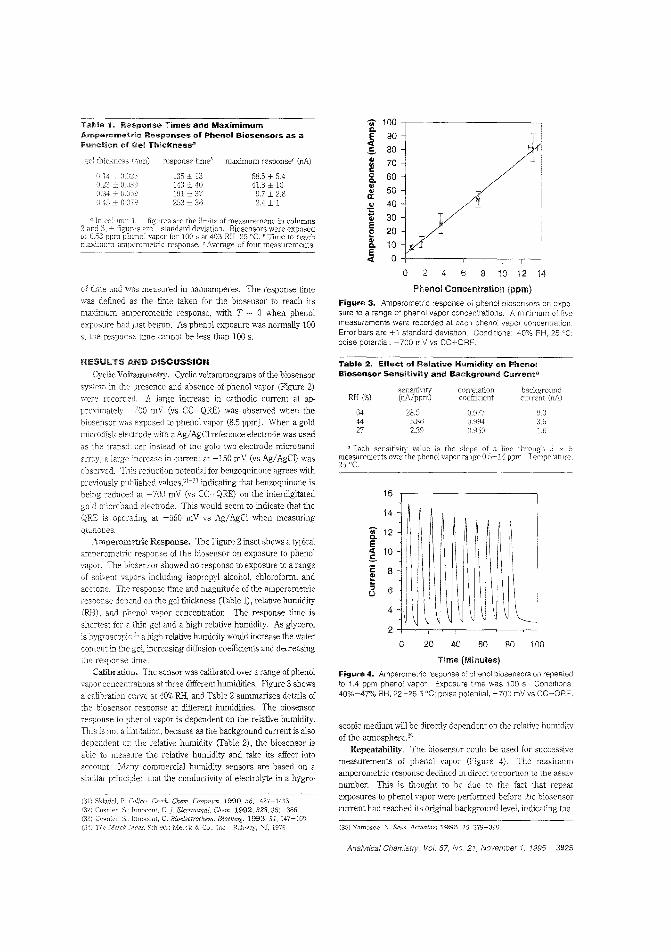
TalMe 1" Response Times and MaximimumAmpel"omebic Responses of Phenol Biosensors as aFunction of Gel Thickness3
of time and was measured in nanoamperes. The response time
was defined as the tinle taken for the biosensor to reach itsmaximum amperometdc response, with T 0 when phenolexrosure had just begun. As phenol exposure was normally 100s, the response time cannot be less than 100 s.
Ten 100CoE 90c(
80.E-el> 70tilC0 60e-til
50el>a:f.l 40'r:Gi 30E
20eel>
10CoE
0c(
0 2 4 6 8 10 12 14
Phenol Concenlration (ppm)
Figure 3. Amperometric response of phenol biosensors onsure to a range of phenol vapor concentrations. A minimum ofmeasurements were recorded at each pheno: vapor concentration.Error bars are ±1 standard deviation. Conditions 40% PH, 25°C:poise potential, -700 rnV vs CC+ORE.
68.5 ± 5.441.3 ± 109.7 1- 2.82.4 ± 1
maximum responsec enA)
135 ± 13143 ± 40191 ± 37253 ± 36
response timebLhickncss (rnm)
O.U25O.O:~9
CJ.:]4 ± O.G;)!!0.45 ± 0.079
(35) Yamozoe, N. Sen,>. Acfuators 19R6. 10. 379-398.
S )<
3.5:.6
!!.O0.9770.9940.950
sensithity(nA/ppm)
28.55.862.3!)
16
14
~u;- 12 ICoE<t 10.E-C 8
~~ I,::I 6 I() I
I4
2
0 20 40 60 80 100
RH (%)
644427
scopic medium will be directly dependent on the relative ht:midityof the aunosphere."5
Repeatability. The biosensor could be used for successivemeasurements of phenol vapor (Figure 4) The maximt:mamperometric response declined in direct proportion to the assay
number. This is thought to be due to the fact that repeatexposures to phenol vapor were performed before the biosensorcurrent had reached iiS odginal background level, indicating that
Time (Minutes)
Figure 4. Amperometric response 0; phenol biosensors on repeatedto 1.4 pprn phenol vapor. Exposure lirne was 100 s. Conditions:40%-47% RH, 22-26.5 "C; poise potential, -700 rnlJ vs CC+QRE.
Table 2. Effect of Relative Humidity on PhenolBiosensor Sensitivi~~yand Background Currenta
Czech. ('hem. CCmmlin. 1990,56, }l1Z7-1433.InnoCf'lll. C.j. Electroanal. Chem. 1992.328,361-366
s. Innocent, C. Bl:oclectrochem. 1993.31,147-:60.9th cll.; Merck & Co., Inc. NJ, 1976.
RIESUI.TS AND DISCUSSION
Cyclic Voltanunelry. Cyclic voltammograrns of the biosensorsystem in the presence and absence of phenol vapor (Figure 2)were recorded. A large increase in cathodic current at approximately -700 mV (vs CC+QRE) was observed when thebiosensor was exposed to phenol vapor (8.5 ppm). When a goldmicrodisk electrode with a Ag/AgCl reference electrode was usedas the transdccer instead of the gold two-electrode microband
an-ay, a large increase in current at -150 mV (vs Ag/AgCl) wasobserved. This recluction potential for benzoquinone agrees withpreviously published values,:l1-3:l indicating that benzoquinone isbeing reducee! at -700 mV (vs CC+QRE) on the interdigitatedgold rricroband electrode. This would seem to indicate that theQRE is operating at -550 mV vs Ag/AgCl when measuringqum01:es.
Amperometric Response. The Figure 2 inset shows a typicalarr:penmetdc response of the biosensor on exposure to phenolvapor. The bioser.sor showed no response to exposure to a rangeof solvent vapors including isopropyl alcohol, chloroform, andacetone. The response time and magnitude of the amperometric
response depend on the gel thickness (fable 1). relative humidity(RH) , and phenol vapor concentration. The response time isshortest for a thin gel and a high relative humidity. As glycerolis 11ygrosCO;lic-""\ a high relative humidity would increase the watercontent in the gel, increasing diffusion coefficients and decreasing
response time.
Calibration. The sensor was calibrated over a range of phenolvapor ::::oncenlTations at three different humidities. Figure 3 shows
a calibratiDn curve at 40% RH, and Table 2 summarizes details ofthe biosensor response at d'fferent humidities. The biosensorresponse to phenol vapor is dependent on the relative humidity.This is not a limitation. because as the background current is alsodependent or the relative humidity (fable 2). the biosensor isable to measure the relative humidity and take its affect intoaccount. Many commercial humidity sensors are based on asimilar princi)le: that the conductivity of electrolyte in a hygro-
Analytical Chemistry Vol. 67, No. 21, November 1. 1995 3925
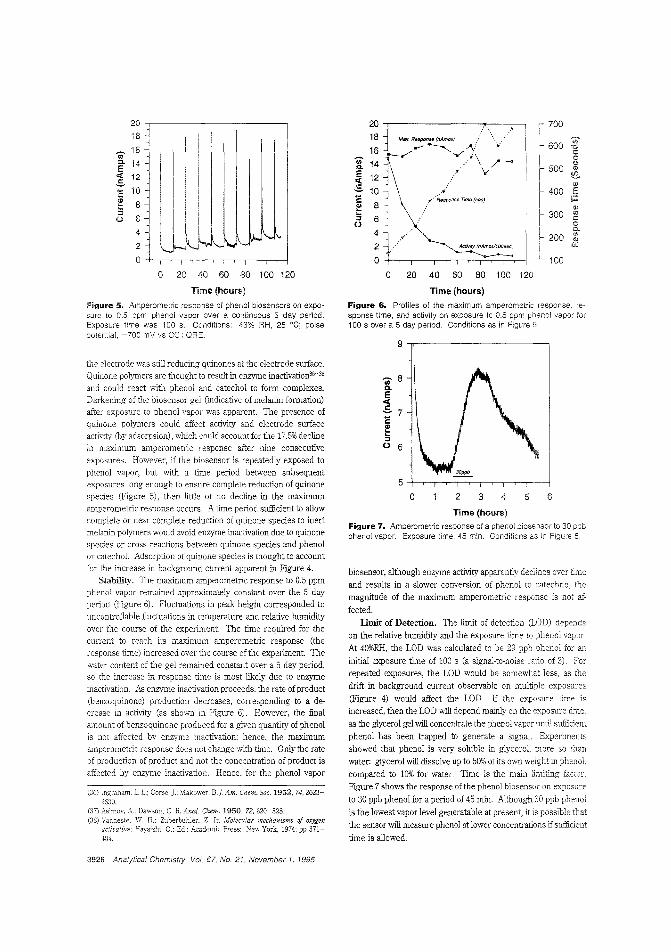
2018
u;- 16Q. 14E« 12SE 10~ 8~0 6
42
0
o 20 40 60 80 100 120
Time (hours)
Figure 5~ Amperometric response of phenol biosensors on expo~
sure to 0.5 ppm phenol vapor over a continuous 5 day period.Exposure time was 100 s. Conditions: 43% RH, 25°C; poisepotential, -70C mV vs CC+QRE,
the electrode was still reducing quinones at the electrode surtace,Quinone polymers are thought to result in enzyme inactivation36-38
and could react with phenol and catechol to fonn complexes,Darkening of the biosensor gel (mdicative of nelanin fonnation)after exposure to phenol vapor was apparent. The presence ofquinone polymers could affect activity and electrode surfaceactivity (by adsorpsion), which could account for the 17.5% declinein maximum amperometric response after nine consecutiveexposures. However, if the biosensor is repeatedly exposed tophenol vapor, but with a time period belween subsequentexposures long enough to ensure complete reduction of quinonespecies (Figure 5), then little or no decline in the maximumamperometric response occurs. A time period sufficient to allowcomplete or near complete reduction of quinone species to inertmelanin polymers would avoid enzyme inactivation due to quinonespecies or cross reactions between quinone species and phenolor catechol. Adsorption of quinone species is thought to accountfor the increase in background current apparent in Figure 4.
Stability. TIle maximum amperometric response to 0.5 ppmphenol vapor remained approximately constant over the 5 dayperiod (Figure 6). Fluctuations in peak height corresponded touncontrollable fluctuations in temperature and relative humidityover the course of the experiment. The time required for thecurrent to reach its maximum amperomet.ric response (theresponse time) increased over the course of the experiment. Thewater content of the gel remained constant over a 5 day period,so the increase in response time is most likely due to enzymeinactivation. As enzyme inactivation proceeds, the rate of product(benzoquinone) production decreases, corresponding to a decrease in activity (as shown in Figure 6). However, the finalamount of benzoquinone produced for a given quantity of phenolis not affected by enzyme inactivation; hence, the maximumamperometric response does not change with time. Only the rateof production of product and not the concentration of product isaffected by enzyme inactivation. Hence, for the phenol vapor
(36) Ingraham, L L; Corse,].; :'IAakower, B.]. Am. (fum. Soc. 1952, 74,262326.30.
(37) Asimov, A.; Dawson. C. R. Anal. Chem. 1950, 72,820-828.(38) Vanneste, W. H.; Zuberbuhler, Z. In Molecular mechanisms of oxygen
activation; Hayaishi, 0.; Ed.; Academic Press: New York, 1974; pp 371;j·0!,.
3926 Analytical Chemistry, Vol. 67, No. 21, November 1, 1995
20 70018 MtJX. ResponS9 (nAmps) if>16 --~""" --'\....
,,,,' 600 "0
~ Y./\ cu;- /~
014 (,)a. .. 'If 500 .,
E !E..« 12 .'
S.,
10 .. 400 EE 8
},"RB8pOflSe TJm6 (sac) i=~
.,300 '"::> 6 c
U 0
4 a.200 '".,
2 a:
0 100
0 20 40 60 80 100 120
Time (hours)
Figure 6. Profiles of the maximum amperometric response. re-sponse time, and activity on exposure to 0.5 phenol vapor for100 s over a 5 day period. Conditions as in 5.
9
u;- 8Q.
Ec(
S 7Ee50 6
5
0 2 3 4 5 6
Time (hours)Figure 7. Amperometric response of a phenol biosensor to 30 ppbphenol vapor. Exposure time, 45 min. Conditions as in Figure 5.
biosensor, although enzyme activity apparently dedines over time
and results in a slower conversion of phenol to catechno, themagnitude of the maximum amperometric response is not affected.
limit of Detection. The limit of detection (LOD) depends
on the relative humidity and the exposure time to phenol vapor.
At 40%RH, the LOD was calculated to be 29 ppb phenol for aninitial exposure time of 100 s (a signal-to-noise ratio of 3). Forrepeated exposures, the LOD would be somewhat less, as thedrift in background current observable on multiple exposures
(Figure 4) would affect the LOD. If the exposure time isincreased, then the LOD will depend mainly on the exposure time.
as the glycerol gel will concentrate the phenol vapor until sufficientphenol has been trapped to generate a signal. Experimentsshowed thal phenol is very soluble in glycerol, more so [hanwater: glycerol will dissolve up to 50% of its own weight in phenoL
compared to 10% for water. Time is the main limiting factor.Figure 7 shows the response of the phenol biosensor on exposure
to 30 ppb phenol for a period of 45 min. Although 30 ppb phenol
is the lowest vapor level generatable at present, it is possible that
thc sensor will measure phenol at lower concentrations if sufficient
time is allowed.
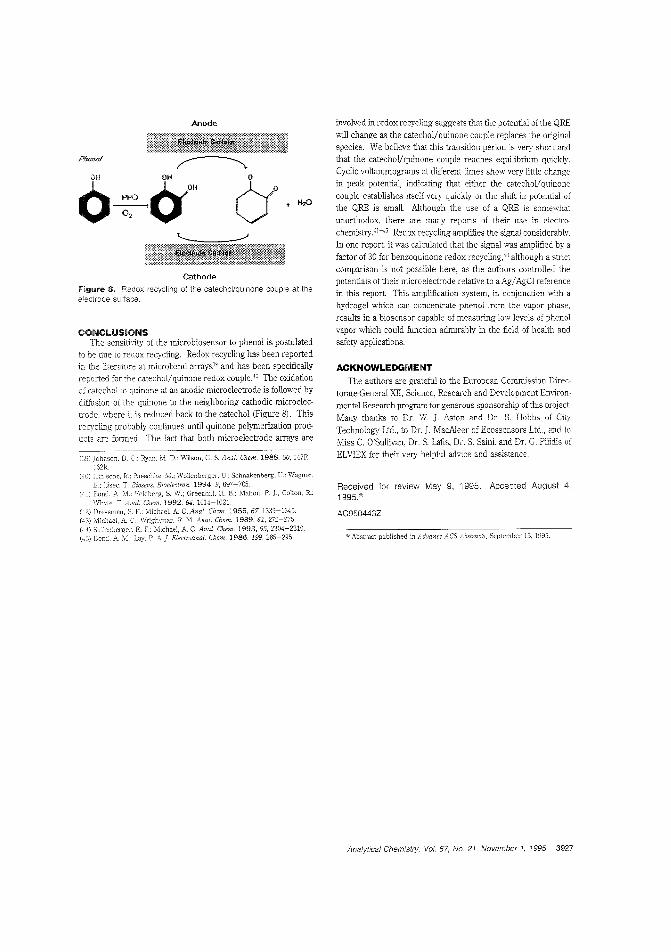
Anode
Cathode
Figure II. Redox recycling of the catechol/qu;none couple at theeiectrode surface.
Received for review May 9, 1995. Accepted August 4,1995.0
AC950443Z
ACKNOWLEDGMENTThe authors are grateful to the European Commission Direc
torate-General XlI, Science, Research and Development Environmental Research progr""~ for generous sponsorship of this project.Many thanks to Dr. W J Aston and Dr. B. Hobbs of City
Technology Ltd., to Dr. J. MacAleer of Ecossensors Ltd., and toMiss C. O'Sullivan, Dr. S. Lafis, Dr. S. Saini, and Dr. G. Pilidis ofELVIEX for their very helpful advice and assistance.
o Abstract published in Advance ACS Abstracts, September 15, 1995.
involved in redox recyding suggests that the potential of the QRE
will change as the catechol!quinone couple replaces the originalspecies. We believe that this transition period is very short andthat the catechol!quinone couple reaches equilibrium quickly.Cyclic voltammograms at different times show very little changein peak potential, indicating that either the catechol/quinonecouple establishes itself very quickly or the shift in potential ofthe QRE is smalL Although the use of a QRE is somewhatunorthodox, there are many reports of their use in electro·
chemistry.'H5 Redox recycEng amplifies the signal considerably.In one report it was caiculated that the signal was amplified by afactor of 30 for benzoquinone redox recycling,") although a strictcomparison is not possible here, as the authors controlled thepotentials of their microelectrode relative to a Ag/AgCI referencein this report. This amplification system, in conjunction with a
hydrogel which call concentrate phenol from the vapor phase,
results in a biosensor capable of measuring low levels of phenolvapor which could function admirably in the field of health andsafety applications.
Ryan. D.: Wilson, G. S. Anal. Chern. 1988,60, 147R-
Pf;cnol
Paeschke. Nt; WoHenberger, U.; Schnakenberg, D.; Wagner.Biosens. Bioelectron. 1994,9,697-705.Feldberg, S. W.; Greenhill. H. B.; Mahon, P. l: Colton, R.;
1992,64,1014-1021.F.; tvIichael, A C.Ana!. Chern. 1955, 67, 1339-1345.
:'v1ichael, A. WrighL'11an, R. M. Anal. Chern. 1989,61,272-275.Sullenben2:er, E. L Michael, A C. Anal. Chern. 1993.65, 2304-2310.Bond, A. Lay, P. A]. Electroanaf. Chern. 1986, 199, 285-295.
CONCLUSIONSThe sensiti\ity of the microbiosensor to phenol is postulated
to be due to redox recycling. Redox recycling has been reportedin the literature at microband arrays39 and has been specificallyreported for the catechol/quinone redox couple.'o The oxidationof catechol to quinone at an anodic microelectrode is followed bydiffusion of the quinone to the neighboring cathodic microelecb'ode, where it is reduced back to the catechol (Figure 8). Thisrecycling probably continues until quinone polymerization products are fonned. The fact that both microelectrode arrays are
~
6~&oo u.~
Analytical Chemistry, Vol. 67, No. 21, November 1. 1995 3927
Anal. Clem 1995, 67.3928-3935
Electrochemical Sensors Based on ImpedanceMeasurement of Enzyme-Catalyzed PolymerDissolution: Theory and ApplicationsCaium J. McNeii,*,t Dale AtheY,t,§ Mark Ball,t Wah On Ho,* Steffi Krause,t Ron D. Armstrong,*
Des Wright,§ and Keith Rawson§
Department of Clinical Biochemistry, The Medical School, University of Newcastle upon Tyne, Framlington Place,Newcastle upon Tyne, NE2 4HH UK, Department of Chemistry, Bedson Building, University of Newcastle upon Tyne,Newcastle upon Tyne, NEt TRU UK, and Cambridge Ufe Sciences pic, Cambridgeshire Business Park,Angel Drove, Ely, Cambs, CB7 4DT UK
A novel sensor approach based on ac impedance measurement ofcapacitance changes produced during enzymecatalyzed dissolution of polymer coatings on electrodes,leading to a 4 orders of magnitude change in capacitance,
described. Electrodes were coated with an entericpolymer material, Eudragit S 100, which is based onmethyl methacrylate, and dissolution was exemplified byutilizing the catalytic action of the enzyme urease. Theresulting alkaline pH change caused dissolution of thepolymer film with a consequent large increase in capacitance. A mechanism for pOJymer breakdown is proposedwlllch has been validated experimentally using both acimpedance measurements and electron microscopy. Thelarge changes in capacitance that are apparent using thistechnique allow much greater sensitivity ofmeasurementthan, for example, potentiometric electrodes. The potential broad clinical analytical applicati.on of this techniqueis demonstrated in this report by application to ureameasurement and to enzyme immunoassay. Urea measurement between 2 and 100 mM has been achieved witha change in response over this concentration range by over4 orders of magnitude. We have taken account of both
effect of protein adsorption on the surface of thepolymer-coated and bare electrodes and the effect ofbuffer capacity when carrying out these measurements inbuffered solutions containing 8% (w/v) protein and havedemonstrated that the method should allow simple,interference·free measurement of urea in serum andwhole blood. In addition, both competitive and noncompetitive enzyme immunoassays for human IgG based on
use of urease-antibody conjugates are reported.IgG, or goat anti-human IgG (Fab specific), were
immobilized covalently onto cellulosic membranes via adiamine spacer group and the membranes placed overenteric polymer-coated electrodes. Specific measurementofIgG in both formats was achieved over ilie concentrationrange 0.0001-100 pg mL-l. The performances of theimpedance-based enzyme immunoassays were compareddirectly with identical assays employL'lg spectrophotomet-
detection.
The concept of sensors based on an electrochemical transducersensitized with a biological moiety is both simple and elegant and
Lkpaftmcnt Clinical Biochemistry. Cnivers:,y of Newcastle upon Tyoe.
3928 Analytical Chemislry. Vol. 67, No, 21, November 1, 1995
offers the prospect of reagelltless clinical analysis '1vith minimum
sample preparation. The major advantage of this approach formedical use is ease of operation, thus allowing deployment ofsensors in decentralized laboratories and facilitating a more rapidreturn of clinical infonnation, the net benefit being an earlierinstitution of appropriate therapy.! In efforts to decrease overallanalysis time and to produce methods suitable for decentralizedlaboratory measurement, attempts have been made to produceelectrochemical sensors for clinically important analytes. To date,these have mainly been based on amperometric or potentiometricmeasurement using enzyme electrodes which for certain anal)teshave drawbacks for biosensor exploitation, TI,e purpose of thisreport is to introduce a new electrochemicai approach to circumvent these problems and to produce a specific, sensitive techniquesuitable for interference-free clinical measurement of analytes suchas urea and creatinine and for application to immunoassay, Inthe method described in this rcport, we have investigated thefeasibility of constructing sensors based on enteric polymercoatings which dissolve in the presence of anaiyte leading tohighly sensitive impedance changes at underlying electrodes.Relatively little effort has been directed at the exploitation ofelectrode impedance measurements which have, potentially.distinct advantages for analysis including a dynamic range e~tend
ing over 4 orders of magnitude and the lack of an absoluterequirement for a reference electrode
Principle of the Proposed Method. TI,e impedance anelectrode is detemlined by applying a sinusoidal pO'cential of smailpeak-ta-peak amplitude to the electrode and measuring theresultant sinusoidal current. The frequency range used formeasurement of electrode impedance is typically between 103 anu10-3 Hz. There is generally a phase difference (8) between thepotential and current so that the ratic of potential to current isessentially a vector quantity (Z) which has magnitude C1ZIJ aTlddirection (8). The impedance of an electrode can be changed inmany ways, For example, the adsorption of protein to an electrodewill cause the electrode impedance to change.' However, in orderto be useful as a sensor, the change of impedance must be highlyspecific to the substance being measured and give high sensitivity.The capacitance of the electrical double layer at aD electrode can
~ Cambridge Life Sciences ple.of Chemistry, University of :Jewcaslle upon Tyne.
(1) KG. M. M., Price, C. P., Eels. Recent Advances in Of"fenl rh,",i,t~,·Churchill Livingstone; Edinburgh, 1985; VoL 3.
(2) Bernabeu, P.; Tamisier, 1.: De Cesare, A; Caprani, A1988. 33. 1129-1136,
0003-2700/95/0367-3928$9.00/0 © 1995 American Chemical Society
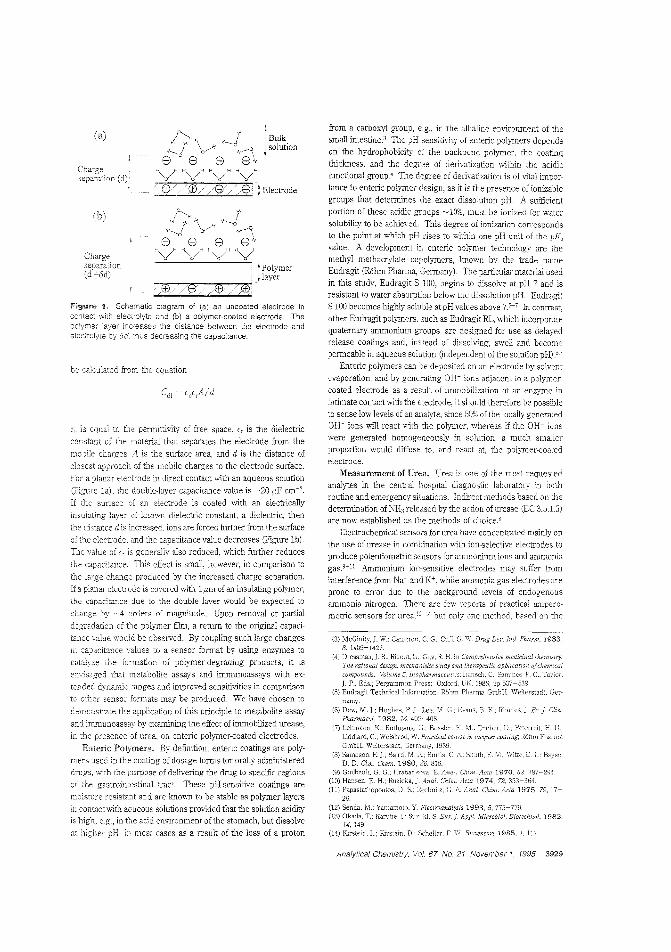
be calculated tram tbe equation
Figur'e 11, Schematic diagram of (a) an uncoated eleGtrode incontact with eleci<olyte and (b) a polymer-coated electrcde. ThepOlymer layer increases the distance between the electrode andelectrolyte by :Jd, :hus decreasing the cap3.citance.
is equal to the pennittivity oi tree space, E, is the dielectric
constant of the material that separates the electrode trom the
mobile cbarges. .4 is the surface area, and d is the distance of
closest approach of the mobile charges to the electrode surface.
For a planar electrode in direct contact with an aqueous solution
(Figure 1a), the double-layer capacitance value is '-20 ,uf cm-'.
If the surface an electrode is coated with an electrically
insulating layer of Imouln dielectric: constant, a dielectric, then
the distance d is increased. ions are forced further trom the sunace
of tile electrode. and the capacitance value decreases (Figure 1b).
The value of E, is generally also reduced, which further reduces
tbe capacitance. This effect is small, hcwever, in comparison to
tbe large change produced by t'1e increased charge separation,
If a planar e1ectrOlle is covered with l('m of an insulating polymer,
the capacitar:ce due to the double layer would be expected to
change by ~4 orders of magnitude. Upon removal or partial
degradation of the polymer film, a return to the original capaci
tance value would be observed. By coupling such large changes
if. capacitance values to a sensor format by using enzymes to
catalyze the fonnation of polymer-degrading products, it is
eJ.'/isaged that metabolite assays and immunoassays with ex
tended dynamic :-anges and improved sensitivities in comparison
to other sensor formats may be produced. We have chosen to
demcnstrate the application of this principle to metabolite assay
aJd immunoassay by examining the effect of immobilized urease,
in the presence of urea, on enteric polymer-coated electrodes.
Enteric Polymers. By definition. enteric coatings are poly
mers used in the coating of dosage forms for orally administereddrugs, vvith the purpose of delivering the drug to specific regions
of the gastrointestinal t'act These pH-sensitive coatings are
moisture resistant and are known to be stable as polymer layers
in contact with aqueous solutions provided that the solution acidityis high, e.g., in the acid environment of the stomach, but dissolve
at higher pH, most cases as a result of the loss of a proton
3. K.; Rhodes. J Br.].many.
(6) Dew. M.].: Hughes, P. l: Lee, M. G,:Pharmacal. 1982, 40S~408.
(7) Lehmann, K; Rothgang, Bo~sler Dreher. D.: Petcrreit, H.Liddiard, c.; Weisbrod, W. Practical COime in lacquer coaling; Rbhm PhannaGmbH, Weilerstadt, Gennany, 1989.
(8) Baird. Burtis. C. A; Smith, E. M.: 'iVitte, D. L: Baysc.D. 1980.26.815.
(9) Guilbault. G. G.: Hrabankova, E, /lnal. .1eta 1970. 52. 287~2~)';.
(10) Hansen, E. H.; Ruzicka, J Anal. Chim. Aria 1974, 72,353-364,(ll) Papastathopoulos, D. S.: r:?echni:z. G Ana!. Chim. Acia 1975 79,17-
26.
(12) Senda, M.: Yamamoto. Y. Electraanaiysis 1993. 5, 775-779(3) Okada. T.; Karube, 1.; Su;cuki, S. Eur.j. .4ppl, Microbial. Biotr:cfulOl. 1982,
14,149.(14) Kirstein. L.; Kirstein. D.; Scheller. F. v\'. Biosensors 1985, 1. 117
(3) McGinity,]. Vi.; Cameron, C. G.: Cuff. C. \\/. Drug Dev.lnd. Pharm. 1983,8,140B-1427
(4) DreSSm3Jl, J. B.; Ridout, G.: GUY. R. H. In C""pr')",,,iv,, m"dicina,' du,m",lry.17le rational design, mechanistic s:udy and therapeutic application
Volume 5, Biopharmaceu6cs: IJansch, C. Sammcs, P. C , Tajlor.Press: Oxford, UK, 1988; 537-539.
"",,.""",." "roohn;,'" Information, Rohm Pharma Weiterstadt, Gcr-
from a carboxyl group, e.g" in the alkaline environment of thesmall imestine.3 TIle pH sensitivity of enteric polymers dependson the hydropbobicity of the backbone polymer, the coating
thickness, and the degree of derivatization within the acidicfunctional group<' The degree of derivatization is of vital impor
tance to enteric polymer design, as it is the presence of ionizablegroups that detennines the exact dissolution pH. A sufficientportion of these acidic groups ~10%, must be ionized for water
solubility to be achieved. This degree of ionization con<espondsto the point at which pH rises to within one pH unit of the pK,value. A development in enteric polymer technology are themethyl methacrylate copolymers, known by the trade nameEudragit (Rahm Pharma, Gennany). Tne particular material usedin this study, Eudragit S 100, begins to dissolve at pH 7 and isresistant to water absorption below the dissolution pH. EudragitS 100 becomes highly soluble at pH values above In contrast,other Eudragit polymers, such as Eudragit RL, which incorporatequaternary ammonium groups, are designed ior use as delayedrelease coatings and, instead of dissolving, swell and becomepenneable in aqueous solution (jndependent of the solution pH) .C.7
Enteric polymers can be deposited on an electrode by solventevaporation. and by generating OH- ions adjacent to a polymcr
coated electrode as a result of immobilization of an enzyme in
intimate contact with the electrode, it should therefore be possibleto sense low levels of an analyte, since 50% of the locally generatedOR- ions will react with the polymer, whereas if the OI-l- ionswere generated homogeneously in solution, a much smallerproportion would diffuse to, and react at, the polymer-coatedelectrode.
Measurement of Urea. Urea is one of the most requestedanalytes in the cent-al hospital diagnostic laboratory in bothroutine and emergency situations. Indirect methods based on thedetennination of NH:; released by the action of urease (EC 3.5.1.5)are now established as the methods of choiceS
Electrochemical sensors for urea have concentrated mainly on
the use of urease in combination with ion-selective electrodes toproduce potentiometric sensors for ammonium ions and ammoniagas9 - n Ammonium ion-sensitive elect-odes may suffer tramintenerence from Na" and K+, while ammonia gas electTodes areprone to error due to the background levels of endogenousammonia nitrogen. There are few reports of practical ampero
metric sensors for urea, ~>'14 but only Gile method, based on the
Bulksolution
"~ 0-_J
0-..--.j ~-\
8 8 8 8",.; C
H"O/HH H H H
'-/ '-/ '-0/
~ Polymerpayer
/)±l//W/ /ZeiY//~
H H H
"0/ ""0/ ""..'':)/ '0/
"):8/ /fEi//W/):8;: Electrode
(a)
Analytical Chemlst~/. Vol. 67. No. 21. November 1. 1995 3929
use of oxygen detection via horseradish peroxidase, is usedcommercially.
Enzyme Immunoassay. Theoretically, urease has advantages over both horseradish peroxidese (HRP) and alkalinephosphatase (AP) in enzyme immunoassay as it has considerablyhigher activity on a molar basisp therefore allowing a greater
turnover of substrate to measurable product, and thus potentiallycreating assays with improved limits of detection and sensitivity.This shouid be particularly true when used in combination withthe electrode impedance measurement system described in thisreport.
number of urease-labeled immunoassays have been developed which utilize pH-sensitive chromogens as indicatorsI6- 18
Typically, urease has Leen used in semiquantitative, yes/no,immunoassays, due to the sharp and unequivocal color changeproduced. Potentiometric immunoassays based upon ureaseconjugates have also been produced. 19.:W YIeyerhoff and Rechnitz19
reported the use of urease conjugates with potentiometric detec
tion, using an ammonium ion-selective electrode, in a modelimmunoassay for BSA and a fully optimized competitive immunoassay for cAMP. Such sensors suffered from the drawbacksusually associated with potentiometric measurement, i.e., interference from sample components and poor sensitivity.
Relatively recently, urease-based sensors based on the measurement of conductance have been produced.'H3 An immunoassay based on this principle has been developed by Thompsonet al.,'" using a steel rod eiectrode, which could be lowered intostandard polystyrene microtiter wells in which a two-site immu
noassay, using a urease-labeled second antibody, for humanchorionic gonadotrophin (hCG) had been performed.
Immunosensors not based on enzyme labels have also beendeveloped which measure the change in the dielectric propertiesof an electrode as a direct result of a specific binding interactionbetween antibody and antigen."'·!H It was shown by Gardies and
Martelet," using silicon/silicon dioxide electrodes to which antia-fetoprotein had been covalently coupled, that after exposure toserum containing a-fetoprotein, concentratien-dependent changesin electrode capacitance couid be measured. However, the directbinding of protein on an electrode surface produced impedancechanges of typically less than 15%,'" a change considered too smallto be of practical use in a commercial device. In addition,
(:5) Zerner. 13. Chem. 1992.19, 116-El.C6) Chandler, H. Cox, J C: Healey, K.; I\lacCregor, A.; Premier. R. R.;
HUfreL J G. Rj. Immunol. /V/ethods 1982. 53, I87-194.(:7) Bradley'. M. P.: Ebensperger. c.; \Yilberg, E. Hum. Genet. 1987, 76.
352.CS) L.n, C. Y.: Notcmboom. R Kayioka, Rj. !mrti'tnol. lvlethod$ 1988, 114,
127-137.(9) Meyerhoff. E.; Rechnitz, A. Methods Enzymoi. 1980, 70,439-454.(20) Olsen, .J. D.; Panfili. P. R: Armenta, R.; FemmeL M. B.; Merrick H.;
GU!11pcrzJ; Goltz. M.: Luk. R. F.j. M9tllOds 1990,134,71-79.(21) Bili1ewski. L; Drewes. \V.: Schmid, R. D. Scns. Actuators B 1992, 7,321-
.126.(22) Lawton, B. A.: Ltl, Z. H.: F'ethig, R.; Wei, Y. j. Mol. Liq. 1989,42.83-89.(23) PClhig. R Biochcm. Soc. Trans. 1991. 19. 21-25.(24) Thompso:1,.r. C.: NIazoh, j. Hochberg, A.: Tse,1.g, S. Y.; Seago. J. L. Anal.
Biochern. 1991, 194,295-301.Bruno, Mandrand, S.: c.; N. European patent
024/,326, 1987.(Z6) V.: Martclet, C.; P. Therasse, J Anal. Chim. Acta 1991,
249.367-372(27) Carciles, 0'.; Mandet. C:. Sens. Actuators 1989, 17,461-464.(28) Bataillard, P.: Gardies, F'.; Jaffrezic. X; Manelet. C.; Bruno, c.; Mandrand,
B. Ana!. Chnn. 1988.60,2374-2379.(29) Lacour. L Torresi, R.; GabIielli, c.: Capran:, A /. Electrochem. Soc. 1992,
139,161.9--1622.
3930 Analytica! Chemistry. Vol. 67. No. 21, November 1. 1995
nonspecific binding is a major problem \vhcn sud). small change.,;in signal are considered.
In this paper we report preliminary studies of both competitiveand noncompetitive enzyme immunoassay formats for human IgGbased on the use of urease conjugates and impedance measurement of enteric polymer dissolution.
EXPERIMENTAL SECTIONReagents, Jack bean urease (Type VI), j3-!\ADH (disodium
salt), a-ketoglutarate (disodium salt), L-giutamate dehydrogenase(EC 1.4.1.3, Type !II from bovine liver), human immunoglobulinG (h·IgG, technical grade), goat anti-h-lgG (Fab specific), bovineserum albumin (BSA, Fraction V), glutaraldehyde (Grade II, 25%),Tween 20, putrescine (tetramethylenediamine, 98%) and 1,1'.carbonyldiimidazole were obtained from the Sigma Chemical Co.(Dorset, UK). Goat anti-h-IgG-urease conjugate (heavy- and lightchain specific) was obtained from Biogenesis (Bol1memouth, UK).Urea was obtained from BDH Chemicals Ltd. (Dorset, UK).Dibutyl phthalate and bromocresol purple (indicator grade,sodium salt) were obtained from Aldlich (Dorset, UK). Regenerated cellulose membranes (0.2-;.nn pore size) were obtained fromSartorius AG (Giittingen, Germany). Eudragit S 100 polyrr,er wasobtained from Dumas (UK) Ltd. (Kent, UK). Acetone wasobtained from Fisons Scientific Equipment (Loughborollgh, UK)Buffer solutions were prepared using AnaiaR grade reagents fromBDH Ltd. All buffers and solutions were prepared using distilledwater passed through a MiIli-Q purillcation system (Millipore).
Apparatus, Impedance measurements were perforn1ed usinga Schlumberger Solartron 1253 gain-phase analyzer and Schlumberger Solartron 1286 electrochemical interface (ScblumbergerTechnologies, Hampshire, UK). T~e Schlumberger Solalironequipment was interfaced to an IBM-compatible personal computer via an IEEE card obtained from National Instruments UK(Berkshire, UK). Instrument operation and data acquisition wascontrolled using "in-house" software. All impedance measurements were performed in the two-electrode mode. The counterelectrode was a 4-mm-diamctcr glassy carbon disk sealed in a 10
em-long PTFE tube. This was placed clirectly opposite and parallelto the gold ink working electrode in the template "ith a separationof ~3 mm. All impedance measurements were periormed at zerodc potential, with respect to the counter electrode. with an ac peal,to-peak amplitude of 30 mV using a 5-s integration time Eiectrades for impedance measurements were manufactured by GwentElectronic Materials Ltd. (Wales, UK) using a goid organometallicink screen printed onto a ceramic substrate. The electrodes werefitted into a l().well Perspex template containing silicone 0 tings,which exposed a 6-mm-diameter (0.28 em') working area at thebottom of a well to applied solutions. The total capacity of eachwell was 1 mL Electrodes were spray-coated with Eudragit S100 polymer solution using an air brush system (BioDot Ltd.,
Cambridgeshire, UK). Spectrophotometric measurement of urease activity was carried out using a Titertek Multiscan MCC/340microliter plate reader (TQ Systems, Cambtidge, UK).
Spray Coaling of Electrodes with Eudragit S 100. 1,1-gsample of Eudragit S 100 polymer was dissolved in 13.7 g ofacetone containing 0.25 g of dibutyl phthalate. A total of threelayers (three spray passes) were sprayed over the working areaof the gold ink electrodes, with each layer being allowed to dryfor ~20 min before the next layer was applied. To ensure effectivedrying of the polymer film the electrodes were left for at ieast 24h at room temperature before use.
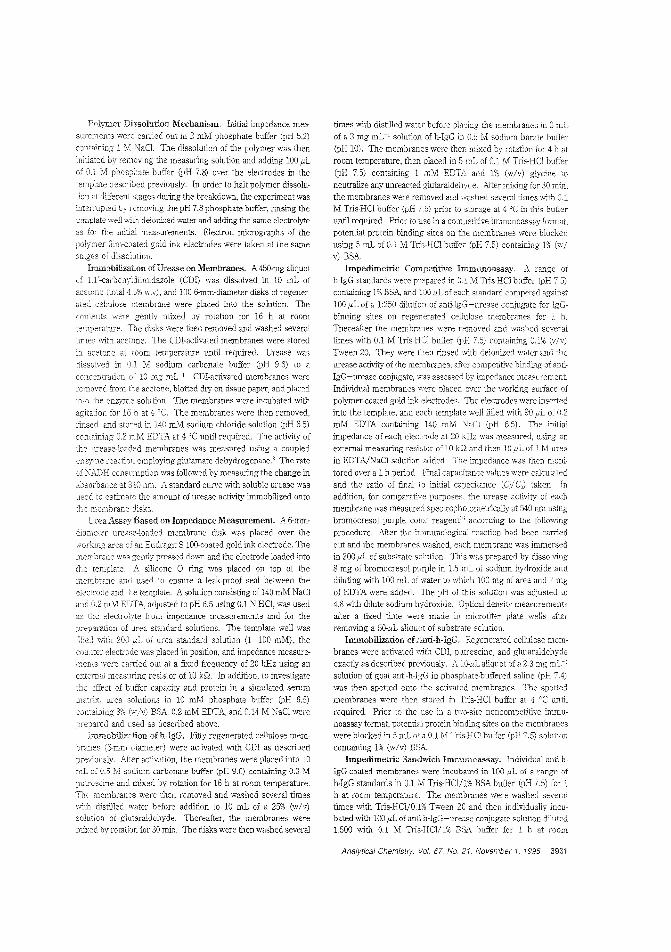
Polymer Dissolution Mechanism, Initial impedance mea·
surements were carried out in 2 mM phosphate buffer (pH 5.2)
containing 1 M NaCt The dissolution of the polymer was then
initiated by removing the measuring solution and adding 100 flL
of !vi phosphate buffer (pH 7,8) over the electrodes in the
template desClibed previously, In order to halt polymer dissolu·
tion at different stages dnring the breakdo¥iIl, the experiment wasilltemlpted by removing the pH 7.8 phosphate buffer, r:nsing the
template well wit1 deionized water and adding the S3il1e electrolyte
8S for tre initial measurements, Electron micrographs of the
polymer film·coated goid ink electrodes were taken at the same
stages of dissolution.
Immobilization of Urease on Membranes. A 450-mg aliquot
cf l,l'·carbonyldiimidazole (CDD was dissolved in 10 mL of
ace lone (total 4.:)% w.v) , and lOC 6-mm~diameter disks of rcgener
2ted ceEulose c1ernbrane were placed into the solution. Thewere gently mixed by rotrtion for 16 h at room
tempera:ure, The disks were then removed and washed severai
\\ith acetone, The CDl-activated membranes were stored
acetone at room temperature until required, Urease was
dissolved In OJ M sodium carbonate buffer (pH 9,6) to a
concentration 10 mg mL-l. CDI-activated membranes were
removed from the acetone~ blotted dry on tissue paper, and placed
the enzyme solution, The membranes were incubated wlth
agitaior, for 16 h at 'c, The membranes were then removed,
rinsed, and stored iJ 140 mM sodium chloride solution (pH 6.5)
containing 0,2 mM EDTA at 4 'C until required, The activity of
the urease-loaded membranes was measured using a coupled
reaction employing glu':.amatc dehydrogenase.s The rate
of NADH ccnsumption was followed by measuring the change inabsorbance at 310 nm, A standard curve wlth soluble urease was
used to estimate the amount of urease activity immobilized onto
The membrane disks,
Urea Assay Based on Impedance Measurement, A 6-mm·
diameter urease·loaded membrane disk was placed over the
Norking area 01 an Eudragit S 100·coated gold ink electrode, The
membrane was gently pressed down and the electrode loaded into
template. A silicone 0 ring was placed on top of the
membrane and used to ensure a leak·proof seal between the
eleeic'ode and tr.e template, A solution consisting of 140 mM NaCl
a"d 0,2 mM EDTA, adjusted to pH 6,5 using 0,1 N HCI, was used
as electrolyte from impecance measurements and :Ear ilie
preparation of urea standard solutions, The template well was
with 200 of urea standard solution (1-100 mM), the
COU:lter electrode was placed in position, and impedance measure
ments Viere carried out at a fixed frequency of 20 kHz using an
erztemal measuring resistor of 10 kQ, In addition, to investigate
the effect of buffer capacity and protein in a simulated serum
matlix, urea solutions in 10 mM phosphate buffer (pH 6,5)
containing 8% (w/v) BSA, 0,2 mM EDTA, and 0,14 M NaCI were
prepared and ,sed as described above,
Immobilization of h·IgG. Fifty regenerated cellulose mem·
branes (6-mm diameter) were activated wlth CD! as described
previously, After activation, tte membranes were placed into 10
mL of 0.5 Iv! sodium carbunate buffer (pH 9.6) containing 0.3 M:putrescine and mixed by rotation for 16 h at room temperature.
The membranes were then removed and washed several times
\"itt distilled \Vater before addition to 10 mL of a 25% (w/v)solution of glutaraldehyde. Thereafter, the membranes were
mLxed by rotation for 30 min, The disks were then washed several
times Viith distilled water before placing the membranes in 3 mL
of a 3 mg mL-l solution of h·IgG in 0,5 M sodium borate buffer
(pH 10), The membranes were then mixed by rotation fer 4 at
room temperature, then placed in 5 mL of 0,1 M Tris-HCI buffer
(pH 7,5) containing 1 mM EDTA. and 1% (w/v) glycine to
neutralize any unreacted glutaraldehyde, After mixing lor 30 min,
the membranes were removed and washed several times 'mth 0,1
M Tris·HCI buffer (pH 7.5) prior to storage at 4 °C in this hulfer
until required. Prior to use in a com1)etitive immunoassay fonnat,
potential protein binding sites on the membranes were blocked
using 5 mL of 0,1 M Tris·HCI buffe,' (pH 7,5) containing 1% (wiv) BSA
lmpedimetric Competitive Immunoassay, A range of
h·IgG standards were prepared in 0,1 M Tris·HCl buffer (pH 7.5)
containing 1% BSA, and 1)0 flL of each standard competed against
100 flL of a 1:250 dilution of anti·lgG-urease conjugate for IgG
binding sites on regenerated cellulose membranes lor h,
Thereafter the membranes were removed and washed several
times with OJ M Tris-Hel buffer (pH 7,5) containing 0,]% (v/v)
Tween 20, They were then rinsed \vith deionized water and the
urease activity of the membranes, after competitive binding of anti
IgG-urease conjugate, 'Vras assessed by impedance meaS11rement.Individual membranes were placed over the working surface of
polymer·coated gold Ink electrodes, The electrodes were inserted
into the template, and each template well filled wlth 90 Ii.L of 0,2
mM EDTA containing 140 mM NaU (pH 6,5), The initiai
impedance of each electrode at 20 kHz was measured, using an
external measuring resistor of 10 kQ and then 10 flL of 1 M urea
in EDTNNaCI solution added, The impedance was then moni·
tored over a 1 h period, Final capacitance values were calculated
and the ratio of final to initial capacItance (Gil Go) taken. in
addition, lor comparative purposes, the urease activity of each
membrane was measured spectrophowmetrically at 540 nm using
bromocresol purple color reagent" according to the follo'mng
procedure. After the immunological reaction had been carriedout and the membranes washed, each membrane was immersed
in 200 flL of substrate solution, This was prepared by dissoi.ving
8 mg of bromocresol purple in 15 mL of sodium hydroxide and
diluting wlth 100 mL of water to which 100 mg of area and 7 mg
of EDTA were added, The pH of this solution was adjusted to
4,8 wlth dilute sodium hydroxide, Optical density measurements
after a fixed time were made in microliter plate wells after
remo\~ng a 50-flL aliquot of substrate solution,
Immobilization of Anti-h·IgG,. Regenerated cellulose mem·
branes were activated with CD!, putrescine, and glutaraldehyde
exactly as described previously, A 11}flL aliquot of a 2.3 mg mL-:
solution of goat anti·h·IgG in phosphate-buffered saline (pH 7.4)
was then spotted onto the activated membranes, The spotted
membranes were then storer! in Tris·HCl buffer at 4 'C until
required, Prior to the use in a two·site noncompetitive immu·
noassay format, potential protein binding sites on the membranes
were blocked in 5 mL oC a OJ M Tris·HCl buffer (pH 7,5) solution
containing 1% (w(v) BSA.
Impedimetric Sandwich ImnlUDoassay. Individual anti-b
IgG-coated membranes were incubated in 100 fiL of a range of
h-IgG standards in 01 Tris·HCl/l% BSA buffer (pH 7.5) for 1
h at room temperature. The membranes were washed several
times wlth Tris-HCl/O,l% Tween 20 and then individual1y incu·
bated wlti1 100 flL 01 anu·h·lgG-urease conjugate solution diluted11500 with 0,1 M Tris·HCl/1% BSA buffer for 1 h at room
Analytical Chemistry, Vol, 67, No. 21, November I, 1995 3931
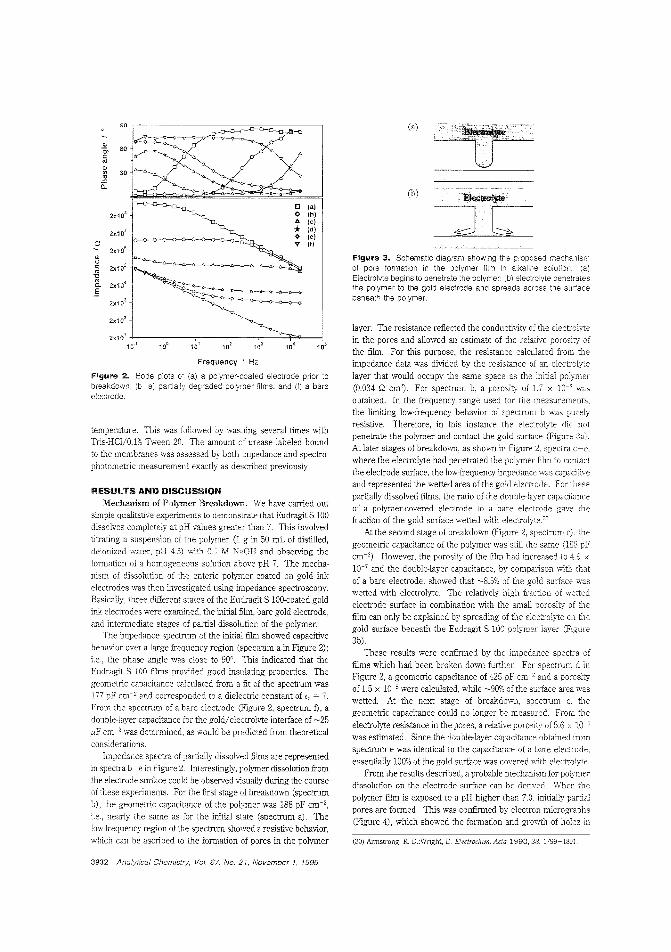
Frequency Hz
Figure 2. Bode plots of (al a poymer-coated electrode prior tobreakdown. (b-el partially degraded polymer IlIms, and (f) a bareelectrode
temperature. This was followed by washing several times withTris-HCI/O.I% Tween 20. The amount of urease labeled boundto the membranes was assessed by both impedance and spectrophotometric measurement exactly as described previously,
(b)
layer. The resistance reflected the conductivity of the electrolytein the pores and allowed an estimate of the relative porosity ofthe film. For this purpose, the resistance calculated from theimpedance data was divided by ~'le resistance of an electrolytelayer that would occupy the same space as the initial polymer(0,034 Q cm2). For spectrum b, a porosity of x lO-d wasobtained. In the frequency range used for the measurements,the limiting low-frequency behavior of spectrum b was purelyresistive. Therefore, in this instance the electrolyte did notpenetrate the polymer and contact the gold surface (Figure 3a).At later stages of breakdowll, as shown in Figure 2, spectra O-C,
where the electrolyte had penetrated the polymer film to contactthe electrode surface, the low-frequency impedance was capacitiveand represented the wetted area of the gold electrode. For thesepartially dissolved films, the ratio of the double-layer capacitanceof a polymer-covered electrode to a bare electrode gave thefraction of the gold surface wetted with electrolyte."11
At the second stage of breakdown (Figure 2, spectrum c), the
geometric capacitance of the polymer was still the same (188 pFcm-2), However, the porosity of the film had increased to 4.9 x
10-7 and the double-layer capacitance, by compalison with thatof a bare electrode, showed that ~8.5% of the gold surface waswetted with electrolyte. The relatively high fraction of wettedelectrode surface in combination with the small porosity of thefilm can only be explained by spreading of the electrolyte on thegold surface beneath the Eudragit S 100 polymer layer (Figure3b).
These results were confirmed by the impedance spech-a of
films which had been broken down further. For spectrum dFigure 2, a geometric capacitance of 425 pF cm-2 and a porosityof 1.5 x 10⁻⁵ were calculated, while ~90% of the surface area waswetted. At the next stage of breakdow1', spectrum e, thegeometric capacitance could no longer be measured. From theelectrolyte resistance in the pores, a relative porosity of 5.6 x 10"5was estimated. Since the double-layer capacitance obtained fromspectrum e was identical to the capacitance of a bare electrode,essentially 100% of the gold surface was covered with electrolyte.
From the results described, a probable mechanism for polY1l1erdissolution on the electrode surface can be derived. W11en the
polymer film is exposed to a pH higher than 7.0, initially partialpores are formed. This was confirmed by electron micrographs(Figure 4), which showed the formation and growih of holes in
Figure 3. Schematic diagram showing the proposed mechanismat pore formation in the polymer flln In alkaline solution: (a)Electrolyte begins to penetrate the polymer; (bl electrolyte penetratesthe polymer to the gold electrode and spreads across the surfacebeneath the polymer.
(0)
(30) Armstrong, R D.;Wright, D. E!ectrochim. Acta 1993,38, 1799-1801.
o (a)o (b).I> (e)* (d)* (e)V if)
2x1Q7
c:2x10
6
"()2x10
5c:
'"~2x10
4C.
.§2x10
3
2x10²
RESULTS AND DISCUSSiONMechanism of Polymer Breakdown. We have carried out
simple qualitative experiments to demonstrate that Eudragit S 100dissolves completely at pH values greater than 7. This involvedtitrating a suspension of the polymer (I g in 50 mL of distilled,deionized water, pH 4.5) with 0.1 M NaOH and observing theformation of a homogeneous solution above pH 7. The mechanism of dissolution of the enteric polymer coated on gold inkelectrodes was then investigated using impedance spectroscopy.Basically, three different states of the Eudragit S 10o-coated goldink electrodes were examined, the initial film, bare gold electrode,and intermediate stages of partial dissolution of the polymer.
The impedance spectrum of the initial film showed capacitivebehavior over a large frequency region (spectrum a in Figure 2);i.e., the phase angle was close to 90'. This indicated that theEudragit S 100 films provided good insulating properties. Thegeometric capacitance calculated from a fit of the spectrum was177 pF cm-' and corresponded to a dielectric constant of E, = 7.From the spectrum of a bare electrode (Figure 2, spectrum f), adouble-layer capacitance for the gold/electrolyte interface of ~25IiF em -2 was determined, as would be predicted from theoreticalconsiderations.
Impedance spectra of partially dissolved films are representedin spectra b-e in Figure 2. Interestingly, polymer dissolution fromthe electrode surface could be observed visually during the courseof these experiments. For the first stage of br'cakdown (spectrumb), the geometric capacitance of the polymec was 188 pF cm-2,
Le., nearly the same as for the initial state (spectrum a). Thelow-frequency region of the spectrum showed a resistive behavior,which can be ascribed to the formation of pores in the polymer
~ 60c:
'""'" 30'".c:a..
3932 Analytical Chemistry, Vol. 67. No. 21, November 1, 1995
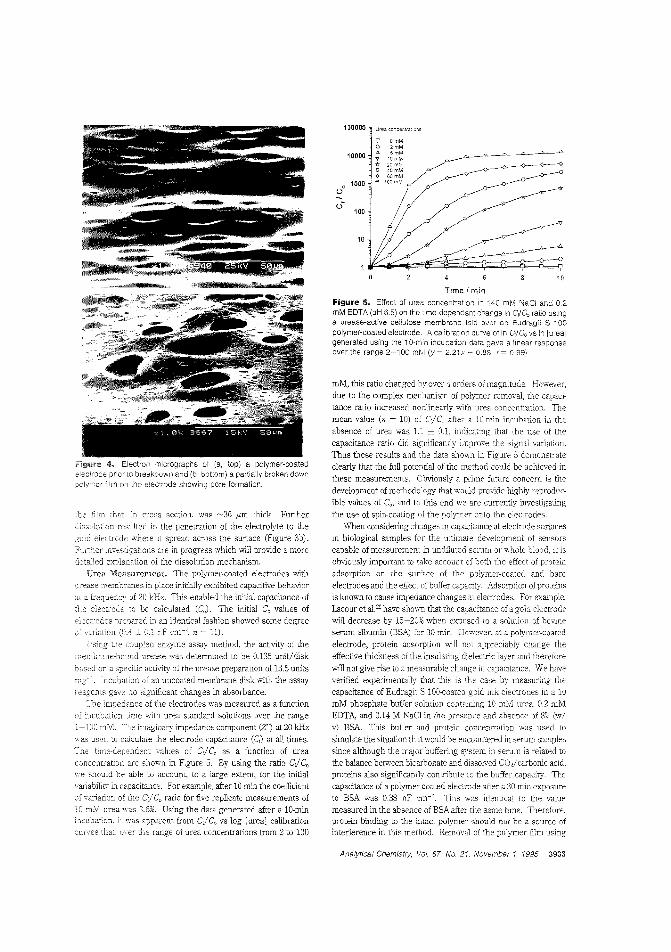
4. Eiectron micrographs of (a, top) a polymer-coatedelectrode prior te breakdown and (b, bottom) a partially broken downpolymer film on ihe electrode showing pore formation.
that cross section, was -36 ,urn thick Further
dissoluton resultec in the penetration of the electrolyte to the
,;?;cid electrcde ,vhere spread across the su:iace (Figure 3b).
investigations are in progress which will provide a more:letaiied explanation of the dissolution mechanism.
Measuremen.t. The polYIIler~coated electrodes withurease membranes in place initially exhibited capacitive behavior
a irequer.cy of 20 kHz. 111is enabled the initial capacitance of
electrode be calculated (Co). The initial Co values ofelectrodes prepared in an identical fashion showed some degree
variation (0.4 ± 0.1 nF cm-', n = 11).
toe coupled enzyme assay method, the activity of ::he
membrane-bacmd urease was determined to be 0.135 unitldisk
based on a specific activity of the urease preparation of 13.5 units
mg' Incubation of an uncoated membrane disk with the assay
reagents gave :10 significant changes in absorbance.
The impedance of the electrodes was measured as a functionincu"Jation ::lme with urea standard solutions over the range
i-lOO mM. imaginary impedance component (2:") at 20 kHz
',;\-as used to calculare the elecTode capacitance (Cu at all times.
The time-dependent values of C,I Co as a function of urea
concentration are shown in Figure 5. By using the ratio C,I Cowe shculd be able to account, to a large extent, for the initialvariability in capacitance. For example, after 10 min the coefficientof variation of Lhe eil Co ratio for five replicate measurements of
urea was 3.696. Using the data generated after a 10-minil1cuba:ion. it was apparent from Cf/Co vs log [urea} calibrationcurves tha.. over the range of urea concentrations from 2 to 100
100000 Urea concentra::ons
10
Timelmin
Figure S. Effect of urea concentraUo,'l in 140 mM NaCI and 0.2mM EDTA (pH 6.5) on the time-dependent change in G,ICo ratio usinga urease-active cellulose membrane laid over an Eudragit S 100polymer-coated electrode. Acalibration curve of in Q/C, vs In [wealgenerated using the 10-m,:n incubation data a linear respo.'lseover the range 2-100 mM (y = 2.21 x - r = 0.99'1.
mM, this ratio changed by over 4 orders of magnitude. However,
due to the complex mechanism of polymer removal, the capacitance ratio increased nonlinearly with urea concentration. 111e
mean value (n = 10) of CelC, after a 1Cc min incllbarion in the
absence of urea was 1.1 ± 0.1, indicating that the use of the
capacitance ratio did significan tly improve the signai variation.
Thus ::hese results and the data shown in Figure 5 demonstrate
dearly that the full potential of the method could be achteved in
these measureme!lts. Obviously a pdme future concern is thedevelopment of methodology that wodd provide highly reproduc·
ible values of Co, and to this end 'Ne are cun'entiy investigating
::he use of spin-coating of the polymer onto the electrodes.
When considering changes in capacitance at electrode surfaces
in biological samples for the ultimate development of sensorscapable of measurement in undiluted serum or whole blood, it is
obviously important to take account of bDth the effect of proteinadsorption on the sur-face of the polymer-coated and bare
electrodes and ::he effect of buffer capacity. Adsorption of pro-eins
is known to cause impedance changes at elect-odes. For example,Lacour et a1. 29 have shown that the capacitance of a gold electrode
will decrease by 15-20!1i when exposed to a solution of bovineserum album.in (BSA) for 30 min. However, at a polymer-coated
electrode, protein adsorption will not appreciably change the
effective thickness of the insulating dielectric layer and ::herefore
will not give rise to a measurable change in capacitance. We have
verified expe'imentally ::hat this is the case by measuring ::he
capacitance of Ecdragit S 10D-coated goid ink eiectrodes in a 10
mM phosphate huffer solution containing 10 mM urea, 0.2 mMEDTA, and 0.14 M NaCI in the presence and absence of 8% (wi
v) BSA This buffer and protein concentration was used to
simulate the situation ::hat would be encountered in serum samples
since al::hough the major bufferi~g system in serum is related tothe balance between bicarbonate and dissolved CO';carbonic acid,proteins also significandy contribute to the buffer capacity. The
capacitance of a polymer-coated electrode after a 3D-min exposure
to BSA was 0.38 nF em-'. 111is was identical to the value
measured in ::he absence of BSA after the same time. Therefore,protein binding to the intact polymer should not be a source ofinterference in ::his me::hod. Removal of the polymer film using
Analytical Chemistry, Vol. 67, No. 21, November 1, 1995 3933
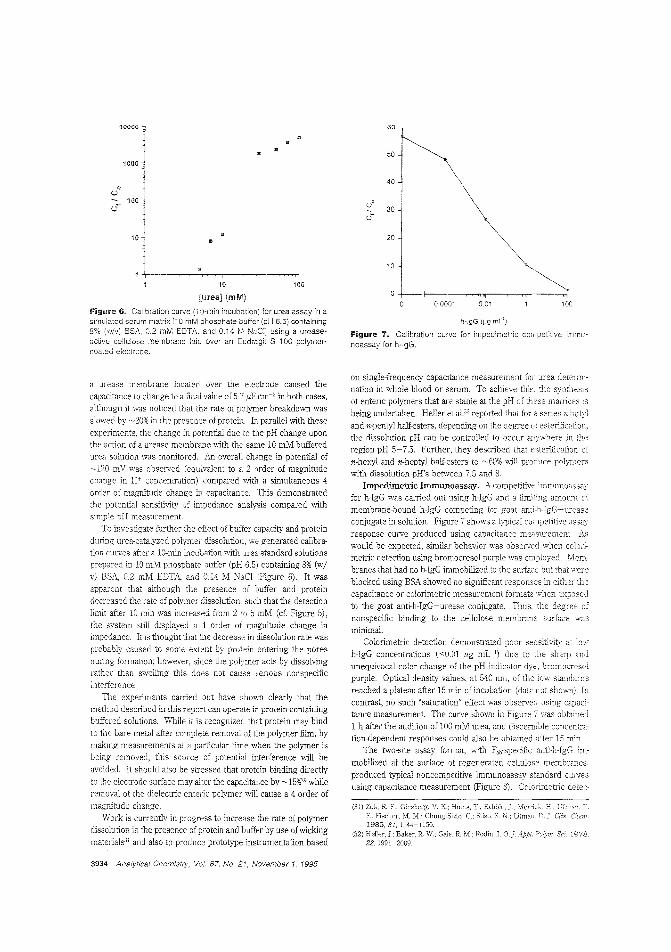
1000.010.0001
10
GO
20
40
50
30
h-lgG (~g ml
Figure 7. Calibration curve for impedimetric competitive immunoassay for h-lgG.
100
10
1000
10000
100
10
[urea] (mM)
Figure 6~ Calibration curve (1 O~min incubation) for urea assay in asimulated serum matrix [10 mM phosphate buffer (pH 6.5) containing8% (w/v) BSA, 0.2 mM EDTA, and 0.14 M NaCI] using a ureaseactive cellulose membra18 laid over an Eudragit S 100 polymercoated electrode.
a urease membrane located over tbe electrode caused thecapacitance to change to a final vahw of 5.7 ,uF cm-2 in botb cases,
although it was noticed that the rate of polymer breakdown was
slowed by ~20% in the presence of protein. In parallel with these
experiments, the change In potential due to the pH change uponthe action of a urease membrane witb the same 10 mM bufferedurea solution was monitored. An overall change in potential of
~ 120 mV was observed (equivalent to a 2 order of magnitudechange in H' concentration) compared with a simultaneous 4
order of magnitude change in capacitance. This demonstratedthe potential sensitivity of impedance analysis compared witbsimple pH measurement.
To investigate furthe, the effect of butEer capacity and protein
during urea-catalyzed polymer dissolution, we generated calibration curves after a 10-min incubation with ureCi standard solutions
prepared in 10 mM phosphate buffer (pH 6.5) containing 8% (wiv) BSA, 0.2 mM EDTA, and 0.14 M NaCl (Figure 6). It was
apparent tha: although the presence of buffer and proteindecreased the rate of polymer dissolution, such that tbe detection
limit after 10 min was increased from 2 to 5 mM (d. Figure 5),the system still displayed a 4 order of magnitude change inimpedance. I: is thought that the decrease in dissolution rate was
probably caused to some extont by protein entering tbe pores
during fonnation; however, since the polymer acts by dissolvingrather than swelling this does not cause serious nonspecificinterference.
TIle experiments carried out have shown clearly tbat themethod descIibcd in this report can operate in protein-containing
buffered solutions. While it is recognized thet protein may bindto the bare metal after complete removal of the polymer film, by
making measurements at a parl·icular time when the polymer isbeing removed, this source of potential interference will be
avoided. It should also he stressed that protein binding directly
to the electrode surface may alter the capacitance by ~15%" while
removal of the dielectric enteric polymer will cause a 4 order ofmagnitude change.
Work is currently in progress to increase the rate of polymerdissolution in tbe presence of protein and buffer by use ofwicldngmatelials:J! and also to produce prototype instrumentation based
on single-frequency capacitance measurement for urea determination in whole blood or serum. To achieve this, the synlllesis
of enteric polymers that are stable at the pH of these matrices isbeing underta<:en, Heller et aj32 reported that for a series n:butyl
and n-pentyl half-esters, depending on the degree of esterification,the dissolution pH can be controlled to occur anywhere in the
region pH 5-7.5. Further, they described that esterification ofn-hexyl and n-heptyl half-esters to ~60% will produce polY111ers
witb dissolution pH's between 7.5 and 8.Impedimetric Immunoassay, A competitive immunoassay
for h-lgG was carried out nsing h-IgG and a limiting amount ofmembrane-bound h-lgG competing for goat ami-h-IgG-ureaseconjugate in solution. Figure 7 shows a typical competitive assay
response curve produced using capacitance measurement. Aswould be expected, similar behavior was observed when colorimetric detection using bromocresol purple was employed.
branes tbat had no h-lgG immobilized to the surface but tbat were
blocked using BSA showed no significant responses in either thecapacitance or colorimetric measurement fom1ats when exposedto tbe goat anti-h-IgG-urease conjugate. Thus. the degree of
nonspecific binding to tbe cellulose membrane surface wasminimal.
Colorimetric detection demonstrated poor sensitivity a"h-IgG concentrations «0.01 ,ug mL-I) due to sharp and
unequivocal color change of the pH indicator dye, bromocresoipurple. Optical density values, at 540 nm, of the low standards
reached a plateau after 15 min of incubation (data not shown). In
contrast, no such "saturation" effect was observed nsing capacilance measurement. The curve shown in Figure 7 was obtained
1 h after the addition of 100 mM urea, and discernible concentra
tion-dependent responses could also be obtained after 15 min.The two-site assay format, with F,b-specific anti-h-IgG Im
mobilized at tbe surface of regenerated cellulose membranes,
produced typical noncompetitive immunoassay standard curvesusing capacitance measurement (Figure 8). Cololimetric detee-
(31) Zuk, R. F.;
F.; Fischer, M. M.;1985,31,1144-1150.
(32) Heller, J.; Baker, R. W.; Gale. R. M.; Rodin. J. O.j. Appi. Polyin. St . 1978.22, 1991-2009.
3934 Analytical Chemistry, Va/. 67, No. :21, November 1, 1995
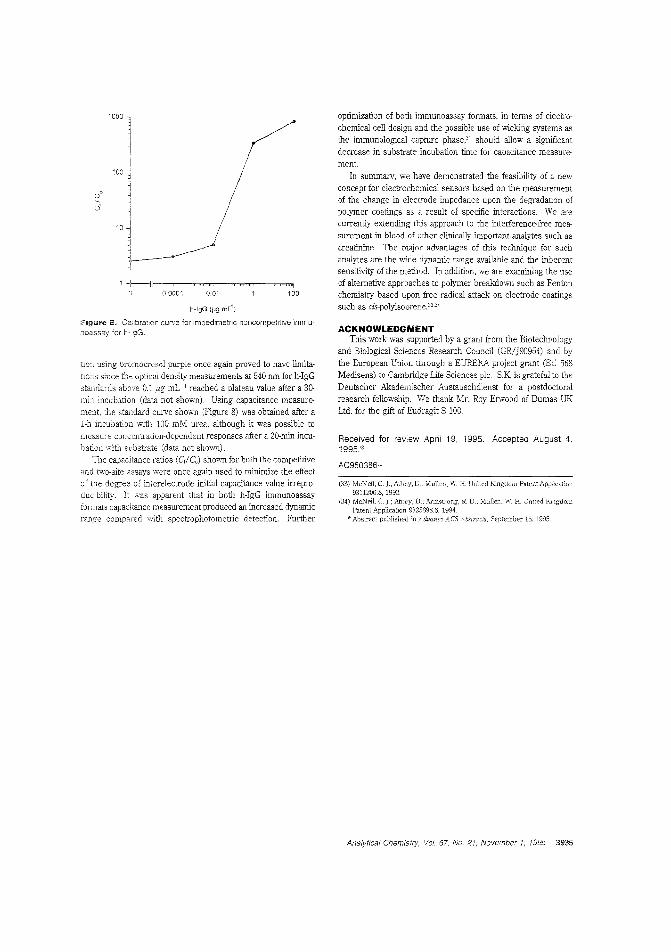
Received for review Aprii 19, 1995, Accepted August 4,1995@
AC950386+
ACKNOWLEDGMENTThis work was supported by a grant from the Biotechnology
and BiolDgical Sciences Research Council (GR/J90954) and bythe European Union through a EUREKA project grant (EU 568Medisens) to Cambridge Life Sciences plc. S.K is grateful to thc
Deutscher Akademischer Austauschdienst for a postdoctoral
research fellowship. We thank Me. Roy Erwood of Dumas UKLtd, for the gift of Eudragit S 100.
(33) McNeil, C. ],; Athey, D.: Mullen, W. H. United Kingdom Patent Application9311206.8, 1993.
(34) McNeil, C1-: Athey, D.: Armstrong, R D.; Mullen, W. H. united KingdomPatent Application 9325898.6, 1994.
o Abstracr published in Advanc'! JiCS A.bstracts, September 15. 1995.
optimization of both immunoassay formats, in terms of electrochemical cell design and the possible use of wicking systems asthe immunological capture phase," should allow a significant
decrease in substrate incubation time for capacitance measurement
In summary, we have demonstrated the feasibility of a new
concept for electrochemical sensors based on the measurementof the change in electrode impedance upon the degradation ofpolymer coatings as a result of specific interactions. We arecurrently extending this approach to the intetference-free measurement in blood of other clinically important analytes such ascreatinine. The major advantages of this technique for such
analytes are the wide dynamic ranRe available and the inherentsensitivity of the method, In addition, we are examining the useof alternative approaches to polymer breakdown such as Fentonchemistry based upon free radical attack on electrode coatingssuch as cis-polyisoprene.33,3<
1000.0001 0.01
h-lgG (~g mr')
Figure a. Ca',ibration cun;e for impedimetric noncompetitive immunoassay for 1l-lgG.
tion using bromocresol purple once again proved to have limita
tions since the optical density measurements at 540 nm for h-IgG
standards above O.lug mL-' reached a plateau value after a 30min incubation (data not shown), Using capacitance measurement, the standard curve shovm (Figure 8) was obtained after aI-h incubation witb 100 mM urea, although it was possible tomeasu:-e concentration-dependent responses after a ZQ-min incu
bation with substrate (data not shown),Tne capacitance ratios (Cr/Co) shovm for both the competitive
and two-site assays were once again used to minimize the effectof the degree of interelectrode initial capacitance value irreproducibility. It was apparent that in both h-IgG immunoassayformats capacitance measurement produced an increased dynamicrange compared with spectrophotometric detection, Further
Analytical Chemistr;, Vol, 67, No. 21, November 1, 1995 3935
Anal. Chem. 1995, 67,3936-3944
Aldehyde Biosensor Based on the Determination ofNADH Enzymatically Generated by AldehydeDehydrogenase
F. Pariente,t E. Lorenzo,t F. Tobalina,t and H. D. Abrufia*'*
Departamento de QWmica Anantica y Ana/isis Instrumentai, Universidad AutOnoma de Madrid,Canto Bianco 28049, Madrid, Spain, and Baker Laboratory, Department of Chemistry, Cornell University,Ithaca, New York 14853-1301
We describe the preparation, characterization, and performance of an aldehyde biosensor based on the determination ofNADH generated by the enzymatic activity ofimmobilized (on a nylon mesh membrane) aldehydedehydrogenase. The enzymaticallY generated NADH is,in tum, electrocatalytically oxidized at a glassy carbonelectrode modified with an electropolymerized film of3,4dihydroxybenzaldehyde (3,4-DHB). We have characterized the response of the biosensor in terms of the effectsof the immobilization procedure, enzyme loading, pH ofthe solution, and the presence of anionic species withparticular emphasis on the role of phosphate anions. Inaddition, we have carried out studies of the kinetics ofthe catalytic reaction, as well as permeability studies. Thesensor exhibits high sensitivity and a limit of detection inthe micromolar regime (5.0 pM), as well as rapid response (60 s to reach 90% of its steady state value). Wehave also carried out analytical determinations ofaliphaticand aromatic aldehydes and consistently find that aromatic aldehydes give superior results.
There continues to be a great deal of interest in the development of materials capable of the electrocatalytic oxidation ofNADH, in order to diminish the typically large overpotentialsencountered in its direct oxidation at most electrode surfaces.
Particular interest has centered on materials that can be immobilized onto electrode surfaces. This interest derives, in part,because of the very large number (over 300) of dehydrogenases
that employ NADH as a cofactor." In addi:ion, because dehydrogenase activity can be employed in biosensor design, thecoupling of such enzymatic activity with the ability to catalyze the
product of such reactions (NADH) opens numerous possibilitiesin senSOr design and development.
Numerous materials and procedures as well as several modified electrodes:1~5 have been identiiied for the electrocatalytic
oxidation ofNADH. Althongh most of these can react with NADHadded to a solution, examples where the mediator or modifier
Lniversiclac Aut6noma de Madrid.Cornell University
(1) (a) Chenault, H. K; Whitesides, G. M. Appl. Biochem. Biotechnof. 1987,14, 147. (b) Dugas, H.; Penney, C Chemistry; Cantor, C. R.,Ed.: Springer Verla,.lf New York, 1981; p
(2) Willner, 1.; Mandler, D. Microb. Technol. 1989, 11,467.C·;) Laval, j. M.: Bourdillon, C.: Chem. Soc. 1984, 106,4701
(4) (a) Gorton, L.]. Chern. Soc., Faraday Trans. 1 1986,82,1245. (b) Persson,B.]. Electroanai. Chern. 1990,286, 61.
3936 Analytical Chemistry, Vol. 67, No. 21, November 1, 1995
reacts with enzymatically generated NADH are less common. Inone of the more recent examples where enzymatically generatedco-factors were detected, Willner and Riklin' reported en anamperometric biosensor utilizing the NAD+ cofactor-dependentenzyme, malic enzyme, using a quinone-enzyme monolayermodified electrode. In thIS work, they were able to detectenzymatically generated products. If enzyme activity, coupled toother cofactors, is to be exploited in biosensor design anddevelopment, new approaches for coupling these need to bedeveloped.
We recently' reported that the electrooxidation of 3,4-dihydroxybenzaldehyde (3,4-DHB) on glassy carbon electrodes givesrise to stable redox-active electropolymerized films. These filmsexhibited very high and persistent electrocatalytic activity for the
oxidation of NADH.We have now combined ti,e electrocatalytic activity of glassy
carbon electrodes modified wity electropolymerized films of 3,4DHB with the enzymatic activity of immobilized (on a nylon mesh)aldehyde dehydrogenase (ALDH) to develop an aldehyde biosensor. ALDH, with a molecular weight of about 200 000 andcomposed of four subunits, catalyzes the oxidation of a broadrange of aromatic and aliphatic aldehydes to the correspondingcarboxylic acids with the concomitant reduction of NAD+ toNADH8 The sensor we describe herein is based on the determination of NADH enzymatically generated by the reaction ofaldehyde dehydrogenase. We describe the preparation, characterization, and utility of such a sensor. The approach describedhere can, in principle, be extended to the use of other dehydroge;;;se enzymes, including alcohol and glutan18te dehydrogenase,
among others.
EXPERIMENTAL SECTIONA. '\faterials. Aldehyde dehydrogenase (ALDH; EC 1.2.1.:5,
from baker's yeast) was obtained from Sigma Chemical Co. as alyophilized powder containing 7.7 units of enzyme activity permilligram of protein or as an ammonium sulfate-stabilized solutioncontaining 12.0 units/mg of protein. Both preparations werestored below 0 'c. Under these conditions. no loss of enzymeactivity was observed for several months. 3,4-Dihydroxybenzaldehyde (3,4-DHB; 97% purity) from Aldrich Chemical Co. was
(5) Gorton, L.; Persson, B.; Hale, P. D.; L. 1.: Karan, H. 1.:H. S.; Skotheim, T.; Lan, H, L.: Okamoto, Y. In and ChemicalSensors; Edelman, P. G., Wang, ]., Eds.: ACS Symposium Series 487:American Chemical Society: Washington, DC, 1992: Chapter 6, p
(6) Willner, f.; RikJin, A. AnaL Chem. 1994,66, Ei35(7) Pariente, F.; Lorenzo, E.; Abrun.a, H. D. A.rwi. Chem. 1994, 66. 4337.(8) Clark,]. F.; Jacob. W. B.]. BioI. Chem. 1970,245, 6072.
0003-2700/9510367-3936$9.00/0 © 1995 American Chemical Society
recrjstallized twice ii'om water using activated charcoal. Oxidized
and reduced forms of nicotine adenine dinucleotide (NAD+ and
NADH, gTade lID, glutaraldehyde (grade I, 50% aqueous solution),
and bovine serum albumin (BSA, fraction V, 96% purity) were
obtained from Sigma Cherrical Co and used as received. Ben
zaldehyde, 4-pyrldinecarboxaldehyde, formaldehyde, acetalde
hyde. and heptaldehyde used as substrates of ALDH were high
purity reagents (>99%) obtained from Aldrich Chemical Co. All
ether reagents were of at least analytical grade and were used as
received. Tris and phosphate buffers (0.1 M) with 0.1 M KN03
were employed. Nylon mesh (Nytal) with 50 x 50 I'm pores and
70 .urn in thickness were employed for enzyme immobilization.
Water was purified 'With a Millipore Milli-Q system. All solutions
were prepared just prior to use.
R ,<\ppm-ams, Cyelic voltammetric and chronoarnperometric
s:udles were canied out w.th a BAS CV-27 potentiostat and alinseys X- Y recorder or a Nicolet digital oscilloscope. Teflon
shrouded glassy carbon electrodes (geometric area, 0.071 cm2)
'Nere used a::; wo:-king electrodes. A coiled platinum wire served
as the auxiBary electrode. All potentials are reported against a
sodium saturated calomel electrode (SSCE) without regard for
the liquid junction. Pine Instruments rotating disk electrode
system with aglassy carbon disk electrode (geometric area, 0.26
em') was employed in rotating disk electrode experiments.
C. Procedures_ Electrode Activation and Modification3,4-DHR Plior to each experiment, glassy carbon elec
trodes were polished and activated as described previously.' For
modification. the activated electrodes were placed in a 0.5 mM
solution cf 3,4-DHB in Tlis/C.l 1\1 KN03 or phosphate buffer (pH
7.) or 8.0), ani the potential was held at about +0.20 V (depending
on pH: vide infra) for 3 min. Subsequently, the modified electrode
was rinsed with water and placed in fresh buffer solution. The
potential was scanned for 3 min at 100 mV/s over the range of
-J20 to +0.25 V so as to obtain a stable redox response for the
su:iace-immobilized film of 3,4-DHB. Surface coverages were
deternlined from integration of the charge under the voltammetric
wave.
2. Enzymatic Immobilization on Nylon Meshes. Thesolubilized AlDH preparation was used as received, whereas the
AIDE available as a lyophilized powder was dissolved, plior to
lmmo'oillzation, in buffer containing at least 50% glyceroL In the
absence of glycerol, we observed a complete loss of activity after
the immobiiization process. The presence of ammonium sulfatein the solulJilized ALDH preparation did not appear to affect the
immobilization procedure with glutaraldehyde. Nylon meshes
were cut into 5.0 mm diameter disks, dipped in methanol, linsed
"","lith water, and dried in an air stream prior to use. For enzymelmmobi1ization, the follo\l1ng solutions were added to each disk
2.0 uL of glutaraldehyde (2.5% vlv) , 2.5 I'L of BSA (1% w/v) , and
5.0 I'L of ALDH (0.1-0.5 unit in 50 mM phosphate buffer
containing 50% (v/v) glyce:ol). The mixture was carefully
homogenized on the surface of the disk. Gelification of glutaral
dehyd" and protein was carried out at room temperature for
30 min and afterward at -4 cC overnight The unreacted
carboxaldehyde groups were inactivated by immersing the disksin 50 mL of 010 l\l phosphate buffer (pH 7.0) containing 0.10 M
glycine for 15 min at room temperature. The disks were washedtimes 'With 25 mL of fresh phosphate buffer (pH 7.0). After
use, the disks were washed \lith phosphate buffer and stored at-4 °C in 50% (vIv) glycerol/0.10 M phosphate buffer solution.
3. EIectrocatalytic Oxidation ofNADH. Cyclic voltamrnelc
ric studies of NADH oxidation at glassy carbon electTodes
modified with electropolymerized films of 3,4-DHB were carried
out at different sweep rates and in the presence of various anions.
In these studies, the solutions employed were either 0.10 M Trisl
0.10 M NaN03 orO.10 M phosphate buffer (pH 8.0), and the sweep
rate was valied from 5 to 625 mV;s over the range from -0.20 to
+0.25 V. The pH value of 8was chosen as it falls within the range
over which the enzyme exhibits maximal activity. In addition.rotating disk electrode (RDE) and potential step chronoarnpero
metric experiments were canied out in order to investigate
permeability and other transport effects. RDE experimerJs werecanied out by sweeping the potential at 5 mV/s fr'Olll -0.20 to
+0.25 V. The rotation rate (OJ) was varied from 0 to 4000 rpm. In
the chronoarnperometric experiments, the potential was stepped
from -0.20 (where no electrochemical activity was observed for3,4-DHB layers) to +0.25 V. In some instances (see belcw) , the
potential was stepped to a value beyond the direct oxidation of
NADH. The resulting current/time transients were recorded on
a digital oscilloscope and transferred to a personal computer for
further analysis.
4. Biosensor Preparation and Response. The biosensor
was assembled by securing, with a holed cap, an enzyme-modified
nylon mesh disk (prepared as desclibed above) over a glassy
carbon electrode previously modified with a film of 3,4-DHB. Theassembled biosensor was placed in buffer solution for 1 2 min
prior to use to ensure solvent equilibration.
The biosensor response was assayed in buffer solution containing 2.0 mM EDTA Control voltammograms were carried out in
the absence of either NAD+ or substrate (see results). For
substrate (aldehydes) determinations, the sensor was placed in
3.0 mL of buffer solution, containing 2.0 mM EDT.-\ at an applied
potential of +0.25 V .lllier the background current had decayed
to a steady value, aliquots (typically microliter) of a stock solution
of substrate (typically 50 mM) in buffer were added. After the
mixture was stirred for 30 s and allowed 2 min for equilibration,
the steady-state current (typically achieved in less than 60 s) in
the 'lnstirred solu tion was recorded.
RESULTS AND DISCUSSIONA. Biosensor Description, The biosensor used in this work
is schematically depicted in Figure 1. It consists of a 6 mm
diameter nylon mesh disk modified with ALDH as describedearBer. The disk is held over a glassy carboll electrode previously
modified with an electropolymerized film of3,1-DHB with a plastic
cap with a 4 mm hole which defined the active area of the sensor
From optical microscopy studies (not shown), we have found that
enzyme immobilization takes place preferentially on the fibers ofthe mesh, without occlusion of the pores. Under these conditions,
transport to the electTode surface is not impeded, malting this
immobilization procedure superior to direct protein immobiEzation
over the electrode surface as we have reported previously.'
Moreover, in this assembly, the enzyme component is physically
separated, thus allowing for its ready reuse with other electrodes.'The immobilized enzyme (ALDH) oxidizes aldehydes to the
corresponding carboxylic acids in the presence of NAD+ This
cofactor acts as an acceptor of electrons generated in theenzymatic reaction and is transformed to its reduced form, NADH.
(9) Parier.te, F.; Hernandez, 1.; Lorenzo, E. Bioelectrochem. Bioenerg. 1992,27,73.
Analytical Chemistry. Vol. 67. No. 21, November 1, 1995 3937
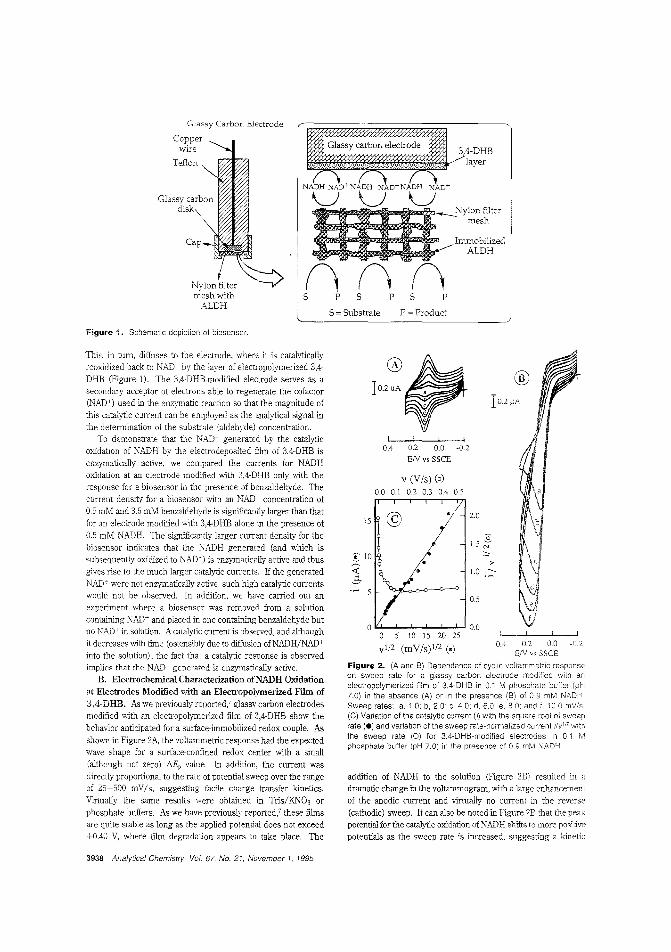
nnnS P S P S P
Glassy Carbon Electrode
Copperwire
S = Substrate
3,4-DHBlayer
NAD+
U---.Nylon filter
mesh
ImmobilizedALDH
P = Product'------------------~
Figure 1. Schematic depiction of bi:Jsensor.
addition of NADH to the solution (Figure 2B) resulted in adramatic change in the voltammogram, with a large enhancementof the anodic current and virtually no current in the reverse(cathodic) sweep. It can also be noted in Figure 2B that the peal,potential for the catalytic oxidation of NADH shifts to more positivepotentials as the sweep rate is increased, suggesting a kinetic
®
[,__-'----_--l-_---J
0.4
I 0.2 ~A
~:S1.) N
0.5
>1.0.:::-
2.0
..©
o 5 10 15 20 25
v 1/2 (mV/s)1/2 (0)
v (Vis) (0)0.0 0.1 0.2 0.3 0.4 0.5
"-'--'---'_L.-.............. 0.0
15
0.2 0.0 ·0.2EN vs SSCE
Figure 2. (A and B) Dependence of cyclic voltammetric responseon sweep rate for a glassy carbon electrode modified with aneleclropolymerized film of 3.4-DHB in 01 M phosphate buffer (pH7.0) in the absence (A) or in the prese1ce (B) of 0.9 mM NADHSweep rales: a, 1.0; b, 2.0; c. 4.0; d, 6.D; e, 8.0; and f, 10.0 mV/s(C) Variation of the catalytic current (I) with the square root of sweeprate (e) and variation of the sweep rate-normalized current IIv1/2 withthe sweep rate (0) for 3,4-DHB-modified electrodes in 0.1 Mphosphate buffer (pH 7.0) in the presence of 09 mM NADH
0.4 0.2 0.0 -0.2
EN vs SSCE
This, in tum, diffuses to the electrode, where it is catalyticallyreoxidized back to NAD- by the layer of electropolymerized 3,4DHB (Figure 1). The 3,4-DHB-modified electrode serves as asecondary acceptor of electrons able to regenerate the cofactor(NAD+) used in the enzymatic reaction so that the magnitude ofthis catalytic current can be employed as the analytical signal inthe determination of the substrate (aldehyde) concentration.
To demonstrate that the NAD'c generated by the catalyticoxidation of NADH by the electrodeposited fibn of 3,4-DHB isenzymatically active, we compared the currents for NADHoxidation at an electrode modified with 3,4-DHB only with theresponse for a biosensor in the presence of benzaldehyde. Thecurrent density for a biosensor with an NAD' concentration of0.5 mM and 3.5 mM benzaldehyde is significantly larger than thatfor an electrode modified with 3,4-DHB alone in the presence of0.5 mM NADH. The significantly larger current density for thebiosensor indicates that the NADH generated (and which issubsequently oxidized to NAD") is enzymatically active and thusgives rise to the much larger catalytic cun'ents. If the generatedNAD- were not enzymatically active, such high catalytic currentswould not be observed. In addition, we have carried out anexperiment where a biosensor was removed from a solutioncontaining NAD+ and placed in one containing benzaldehyde butno NAD I in solution. A catalytic current is observed, and althoughit decreases with time (ostensibly due to diffusion ofNADH/NAD+into the solution), the fact that a catalytic response is observedimplies that the NAD+ generated is enzymatically active.
B. Electrochemical Characterization ofNADH Oxidationat Electrodes Modified with an Electropolymerized Film of3,4-DHB. As we previously reported,' glassy carbon electrodesmodified with an electropolymerized fibn of 3,4-DHB show thebebavior anticipated for a surface-immobilized redox couple. Asshown in Figure 2A, the voltammelnc response had the expectedwave shape for a surface·confined redox center with a small(although not zero) !'!.Ep value. In addition, the current wasdirectly proportional to the rate of potential sweep over the rangeof 25-500 mV/s, suggesting facile charge transfer kinetics.Virtually the same results were obtained in Tris/RN03 orphosphate buffers. As we have previously reported,? these filmsare quite stable as long as the applied potential does not exceed+0.40 V, where film degradation appears to take place. The
3938 Analytical Chemistry, Vol. 67, No. 21, November 1, 1995
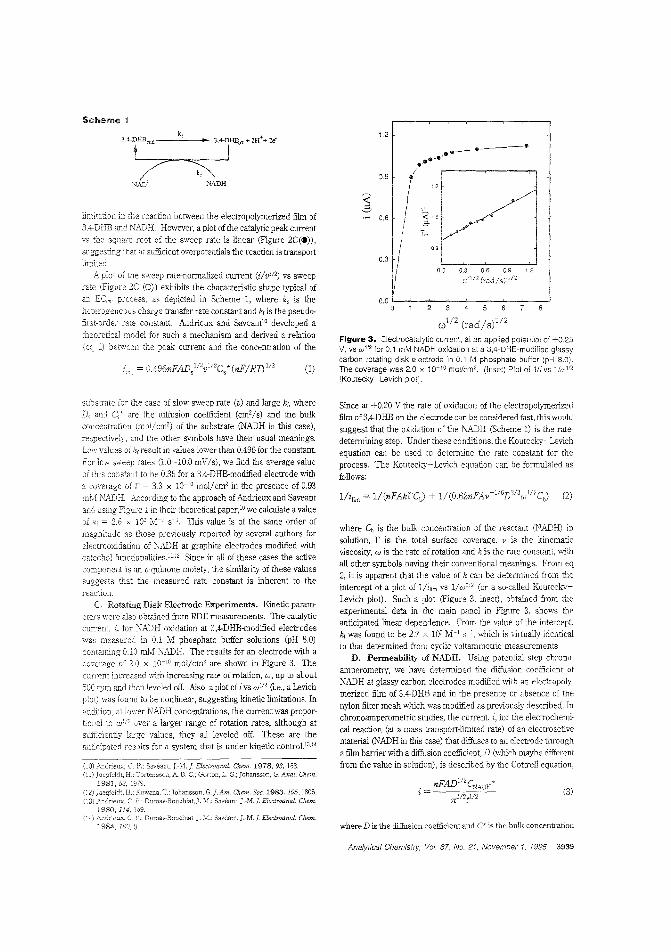
Scheme
jimitation ill the reaction between the electropolymerized film of3A-DHB and NADH. However, a plot of the catalytic peak currentvs the sauare root of the sweep rate is linear (Figure 2CC-),suggestin~ sufficient overpotentials the reaction is transportlimited.
A plot of the sweep rate-nonnalized current (ilvl/") vs sweeprate (Figure 2C (0» exhibits the characteristic shape typical ofall process. as depicted in Scheme 1, where k, is theheterogeneous charge transfer rate constant and kr is the pseudofirst-order rate constant. Andrieux and Saveant'° developed atheoretical model for such a mechanism and derived a relation(eq betweon the peak current and the concentration of the
L-~_~~_-,-,
0.0 0.3 0,6 0.9 1.2
c/i/
2 (rad/sr1/2
03
1.2
~.9
0.0 L-'-__-'--'-_-'--'-_~~_.......Jo 3
CU1/ 2 (rad/s)1/2
Figure 3.~lectrocatalyticcurrent, at an applied potential of +025V, vs W 1f2 for 0.1 rnM NADH oxidation at a 3,4-DHB-rnodified glassycarbon rotating disk electrode in 0.1 M phosphate buffer 8.0).The coverage was 2.0 x 10⁻¹⁰ moi/em'. (inset) Plot of lIw 1/2
(KoLtecky-Levich piot).(1)= 0.496nFAD,
where D is the diffusion coefficient and C* is the bulk concentration
Since at +0.20 V the raLe of oxidation of the electropclymerizedfilm of 3,4-DHB on the electrode can be considered fast, this wouldsuggest that the oxidation of the NADH (Scheme 1) is the ratedetermining step. Under these conditions, the Koutecky-Levichequation can be used to determine the rate constant for theprocess. The Koutecky-Levich equation can be fonnulated asfollows:
(3)
(2)
where Cli is the bulk concentration of the reactallt (NADH) insolution, r is the total surface coverage. v is the kinematicviscosity, w is the rate of rotation and k is the rate constant, withall other symbols having their conventional meanings. From eq2, it is apparent that the value of k can be detennined from theintercept of a plot of Ilium 'IS 1/w I: 2 (or a so-calied KouteckyLevich plot). Such a plot (Figure 3, inset), obtained from theexperimental data in the main panel in Figure 3, shows theanticipated linear dependence. From the value of the intercept,kr was found to be 2.7 x 10³ M-l S-1, which is virtually identicalLa that detennined from cyclic voltammetric measurements.
D. Permeability of N.ADIl. Using potential step chronC}amperomelry, we have determined the diffusion coefficient ofNADH at glassy carbon electrodes modified with an electropolymerized film of 3,4-DHB and in the presence or absence of thenylon filter mesh which was modified as previously described. Inchronoamperometric srudies, the current, i, for the electrochemical reaction (at a mass trdnsport-Iimited rate) of an electroactivematerial (NADH in this case) that diffuses to an electrode througha film barrier with a diffusion coefficient, D (which maybe differentfrom the value in solution), is described by the Cottrell equation,
. nFADl/2CNADH *t = ]'[1/2[1/2
1984, 169. l'
(0) /l.ndrieux, C. P.; Saveanl,Jaegfcldt, H.: Tortenssoo, A B.
(:2:' ja,egl"ldt. H.i Kuw"la.IUohanssontGJ:A'~. C/l;r,: .•,,~c 1983,105,1805.C P.: Dumas-Bou::hiat,]. M ; Saveant, J-M.]. Electroanal. Chern.
1980.1:4,159.t\nclrif.:ux. C. Dumas-Bouchiat j. M, Saveant, J.-M.j. Electroanal. Chern.
substrate for the case of slow sweep rate (v) and large kr, whereD, and C/ are the diffusion coefficient (cm'/s) and the bulkconcentration (mollem') of the substrate (NADH in this case),resnectively, and the other symbols have their usual meanings.Le,;' values of krresult in values lower than 0.496 for the constant.Fer low sweep rates (1.0-10.0 mVIs), we find the average valueof this constant to be 0.35 for a 3.4-DHB-modified electrode witha coverage of r = 3.3 x 10⁻¹⁰ mol/cm2 in the presence of 0.93
NADH. According to the approach of Andrieux and Saveantand using Figure j in their theoretical paper, 10 we calculate a valueof = 2.6 x 10³ M- i S-1 TIlis value is of the same order ofmagnitude as those previously reported by several authors forelectrooxidation of NADH at graphite electrodes modified withcatechol funclionalities1 l.:2 Since in all of these cases the activecomponent is an a-quinone moiety, the similarity of these valuessuggests thal the measured rate constant is inherent to thereaction.
C. Rotating Disk Electrode Experiments. Kinetic parameters were also obtained from RDE measurements. The catalyticcUlTent, i, for NADH oxidation at 3,4-DHB-modified electrodeswas measured in 0.1 M phosphate buffer solutions (pH 8.0)containing 0.10 mM NADR The results for an electrode with acoverage of 2.0 x 10⁻¹⁰ mol/em' are shown in Figure 3. Thecu.n-em increased 'v-,rith increasing rate of rotation, w, up to about50C rpm and then leveled off. Also, a plot of i VS w1/2 (i.e., a Levichpiot) was found to be nonlinear, suggesting kinetic limitations. Inaddition, at lower NADH concentrations, the current was proportIonal to win over a larger range of rotation rates, although atsufficiently large values, they all leveled off. These are theanticipated results for a system that is under kinetic controp3.l4
Analytical Chemistry, 1/0/. 67, No. 21, November 1. 1995 3939
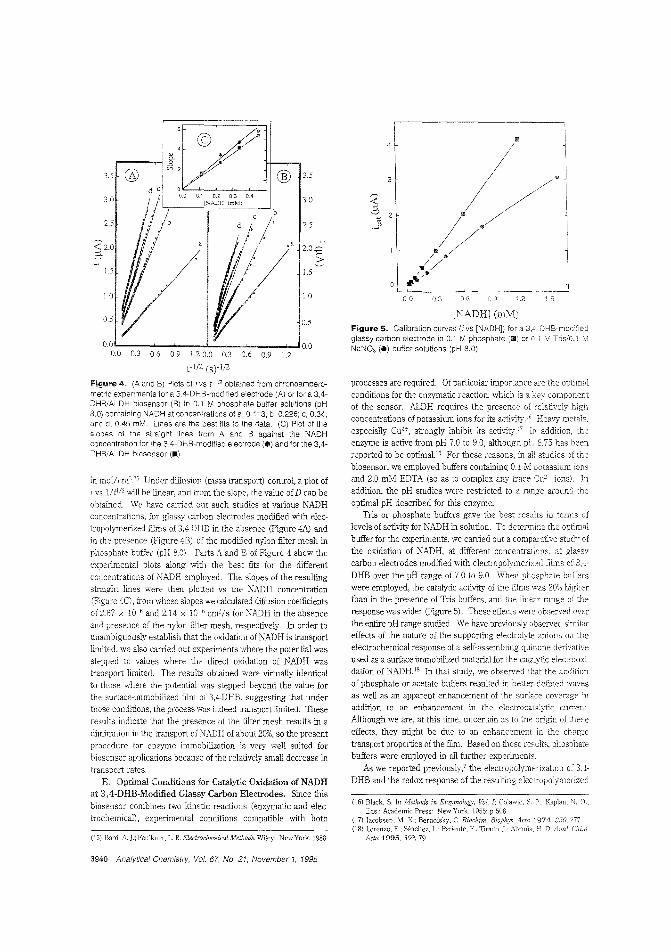
0 ..
..2090.60.30.0
(16) Black, S. In Methods inEds.; Academic Press:
(17) Jacobsen, M. K;(18) Lorenzo, E.; S,bchez, L.;
Acta 1995, 309, 79.
processes are required. Of particular importance are the optimalconditions for the enzymatic reaction, which is a key componentof the sensor. ALDH requires the presence of relatively highconcentrations of potassium ions for its activity.'" Heavy metais,especially Cu
'+, strongly inhibit its activity." In addition, the
enzyme is active from pH 7.0 to 9.0, although pH 8.75 has beenreported to be optima]16 For these reasons, in aii studies of thebiosensor, we employed buffers containing 0.1 M potassium ionsand 2.0 mM EDTA (so as to complex any trace CU"c ions). In
addition, the pH studies were restricted to a range around theoptimal pH described for this enzyme.
Tris or phosphate buffers gave the best res\.llts in terms oflevels of activity for NADH in solution. To determine the optimalbuffer for the experiments, we carried out a comparative study ofthe oxidation of NADH, at different concentrations, at glassycarbon electrodes modified ",ith electropolymerized films ofDHB over the pH range of 7.0 to 9.0. 'When phosphate buffers
were employed, the catalytic activity of the films was 20% higherthan in the presence of Tris huffers, and the linear range of theresponse was wider (Figure 5). These effects were observed overthe entire pH range studied. We have previously observed similareffects of the nature of the supporting electrolyte anions on theelectrochemical response of a self-assembling quinone derivativeused as a surface-immobilized material for the catalytic electrooxidation of NADH.18 In thal study, we observed that the additionof phosphate or acetate buffers resulted in better defined wavesas well as an apparent enhancement of the surface coverage inaddition to an enhancement in the electrocatalyiic currentAlthough we are, at this time, uncertain as to the origin of these
effects, they might be due to an enhancement in the chargetransport properties of the film. Based on these results, phosphatebuffers were employed in all further experiments.
As we reported previously,' the electropolymerization oj' 3,4DHB and the redox response of the resulting electropolymerized
[NADH] (mM)Figure 5. Calibration curves (ivs [NADH]) for a 3A-DHB-madifiedglassy carbon electrode in 0.1 M phosphate (lIIl) or 1 M Tris/O.1 Iv!NaNO, (.) buffer solutions (pH 8.0).
1.5
2.5
3.0
2.01='
2:;
1.0
0.5
® 3.5
04
'---'-_"-- oI-..I-........ ......_-'-.J 0.0
US) Barel, A..J.: Faulkner. L. R. Electrochemical Me/hods: Wiley: New York, 1980.
in mol/cmJl5 Under diffusion (mass transpo:t) control, a plot ofi vs lltl /2 will be linear, and from the slope, tr,e value of D can beobtained. We have carried out such studies at various NADHconcentrations, for glassy carbon electrodes modified with electropolymerized films of 3,4-DHB in the absence (Figure 4A) andin the presence (Figure 4B) of the modified nylon filter mesh inphosphate buffer (pH 8.0). Parts A and B of Figure 4 show theexperimental plots along with the best fits for the differentconcentrations of NADH employed. The slopes of the resultingstraight lines were then plotted vs the NADH concentration(Figure 4C), from whose slopes we calculated diffusion coefficientsof 2.67 x 10⁻⁶ and 2.14 x 10⁻⁶ cm'ls for NPJ)H in the absenceand presence of the nylon filter mesh, respectively. In order tounambiguously establish that the oxidation of NADH is transportlimited, we also carried out experiments where the potential wasstepped to values where the direct oxidation of NADH wastransport limited. The results obtained were virtually identicalto those where the potential was stepped beyond the value forthe surface-immobilized film of 3,4-DHB, suggesting that underthose conditions, the process was indeed transport limited. Theseresuits indicate that the presence of the filter mesh results in a
diminution in the transport of NADH of about 20%, so the presentprocedure for enzyme immobilization is very well suited for
biosensor applications because of the relatively small decrease intransport rates.
E. Optimal Conditions for Catalytic Oxidation of NADHat 3,4-DHB-Modified Glassy Carbon Electrodes. Since thisbiosensor combines two kinetic reactions (enzymatic and electrochemical), experimental conditions compatible with both
0.3 0.6 0.9 1.2 0.0 0.3 0.6 0.9 1.2
t- 1/2 (S)-1/2
Figure 4. (A and B) Plots of ivs r '12 obtained from chronoamperometric experiments for a 3,4-DHB-modified electrode (A) or for a 3,4DHB/ALDH biosensor (B) in 0.1 M phospr,ate buffer solutions (pH8.0) containing NADH at concentrations of a, 0.113; b, 0.226; c, 0.34:and d, 0.45 mM. Lines are the best fits to the data. (C) Plot of theslooes of the straight lines from A and B against the NADHconcentration for the 3,4-DHB-modified electrode (e) and for the 3,4DHB/ALDH biosensor (.).
3940 Analytical Chemistry, Vol. 67, No. 21, November 1, 1995
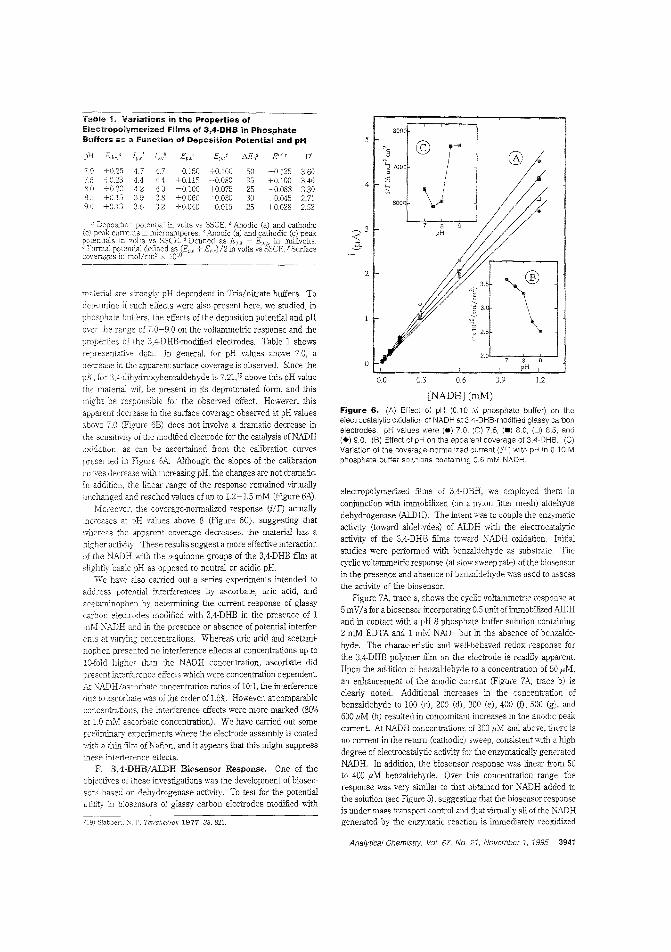
8000
[NADH] (mM)Figure 6. (A) Effect of pH (0:10 M phosphate buffer) on theelectrocatalytic oxidation of NADH at 3,4-DHB-modifled glassy carbonelectrodes. pH values were (a) 70, (0) 7.5, (.) 8.0, (0) 8.6, and(+) 9.0. (B) Effect of pH on the apparent coverage of 3,4-DH8. (e)VariatIOn of the coverage-normal:zed current (iff) with pH in 0.10 Mphosphate buffer solutions containing 0.6 mM NADH.
1.20.9
2.0'--,';_~,_-=----J
pH
'; 2.5
'-
06030.0
8pH
] 7000
:5~
6000
electropolymerizecl films of 3,4-DBH, we employed them in
conjunction with immobilized (on a nyion filter mesh) aldehydedehydrogenase (ALDH). The intent was to couple the enzymatic
activity (toward aldehydes) of ALDH witb the electrocatalydcactivity of the 3,4-DHB films toward NADH oxidation. Initialstudies were performed with benzaldehyde as substrate. Thecyclic voltammetric response (at slow sweep rate) of the biosensorin the presence and absence of bellZaldehyde was used to assess
the activity of the biosensor.FiRUre 7A, trace a, shows the cyclic voltammetric response at
5 mV/s for a biosensor incorporating 0.5 unit of h'llillobilized AIDHand in contact with a pH 8 phosphate buffer solution containing2 mM EDTA and 1. mM NAD+ but in the absence of benzalde
hyde. The characteristic and well-behaved redox response forthe 3,4-DHB polymer film on the clcctrode is readily apparent.
Upon the addition of benzaldehyde to a concentration of 50 pM,an enhancement of the anodic current (Figure 7A, trace b) isclearly noted. Additional increases in the concentration ofbenzaldehyde to 100 (e), 200 (d), 300 (e), 400 (t), 500 (g), and600 I'M (h) resulted in concomitant increases in the anodic peakcurrent. At NADH concentrations of 300 I'M and above, there isno current in the return (cathodic) sweep, consistent with" highdegree of electrocatalydc activity for the enzymatically generatedNADH. In addition, the biosensor response was linear from 50to 400 I''v! benzaldehyde. Over this concentration range, theresponse was very similar to that obtained for NADH added tothe solution (see Figure 5), suggesting that tl1e biosensor responseis under mass transport control and that virtually all of the NADHgenerated by the enzymatic reaction is immediately reoxidized
7.0 +0.25 4.7 4.7 +0.150 +0.100 50 +0.125 3.607.S +0.23 4.4 4.4 +0.115 +0.080 35 +0.100 3.4680 +0.20 4.2 4.0 +0.100 +0.075 25 +0.088 3.308.5 +0.1;) 3.9 3.8 +0060 +0.030 30 +0.045 2.7190 +0.13 3.6 3.2 +0.040 +0.015 25 +0028 2.52
(19) Slabbert, l\. P. Tetrahedron 1977,33.821.
material are strongly pH dependent in Tris(nitrate buifers. To
detennine if such effects were aiso present here, we studied, in
phosphate buffers, the effects of the deposition potential and pH
over the range of 7.0-9.0 on the voltammetric response and theproperties of the 3,4-DHB-modiJied electrodes. Table 1 showsrepresentative data. In general, for pH values above 7.0, adecrease in the apparent surface coverage is observed. Since thepIr,. for 3,4-dihydroxybenzaldehyde is 7.21,19 above this pH value
the material will be present in its deprotonated fonn, -and this
might be responsible for the observed effect. However, thisapparent decr2ase in the surface coverage observed at pH valuesabove 7.0 (Figure 6B) does Qot involve a dramatic decrease in
the sensitivity of the modified electrode for the catalysis of NADHoxidation, as can be ascertained from the calibration curvespresented in Figure 51\.. Although the slopes of the calibration
cu:ves decrease with increasing pH, the changes are not dramatic.In addition, linear range of the response remained virtually
'1ilchanged and reached values of up to 1.2-1.5 mM (Figure 6A).Moreover, the coverage-normalized response (i(O actually
increases at pH values above 8 (Figure 6e), suggesting thatwhereas the apP2rent coverage decreases, the material has a
higher activity These results suggest a more effective interactionof the NADH v.ith the o-quinone groups of the 3,4-DHB film atslightly basic pH as opposed to neutral or acidic pH.
We have also carried out a series experiments intended toaddress potential interferences by ascorbate, uric acid, andacetaminophen by detennining the current response of glassycarbon electrodes modiJied with 3,4-DHB in the presence of 1mM NADH ad in the presence or absence of potential interfer
ents at varying concentrations. Whereas uric acid and acetaminoph en presented no interference effects at concentrations up to1.e-fold higher than the NADH concentration, ascorbate didpresent interference effects which were concentration dependent.At NADH/ascorhate concentration ratios of 10,1, the interference
due to ascorbate was of the order of 1.5%. However, at comparableconcentratons, the interference effects were more marked (80%at mM ascorbate concentration). We have carried out somepreliminary experiments where the electrode assembly is coated\,,"6 a thin film of Nalion, and it appears that this mighl suppressthese lnterlerence effects.
F_ 3,4-DHB/AlDH Biosensor Response. One of theobjectives of these investigations was the development of biosensors based on dehydrogenase activity. To test for the potentialutility in b'osensors of glassy carbon electrodes modiJied with
Table 1. Variations in the Properties ofEleciropoilimerized Films of 3,4.DHB in PhosphateBuffers as a Function of Deposition Potential and pH
pH El!{'/.l Jvi Ep.ac Ep,l M r/ £0' e rJ
Analytical Chemistry, Vol. 67, No. 21, November 1, 1995 3941
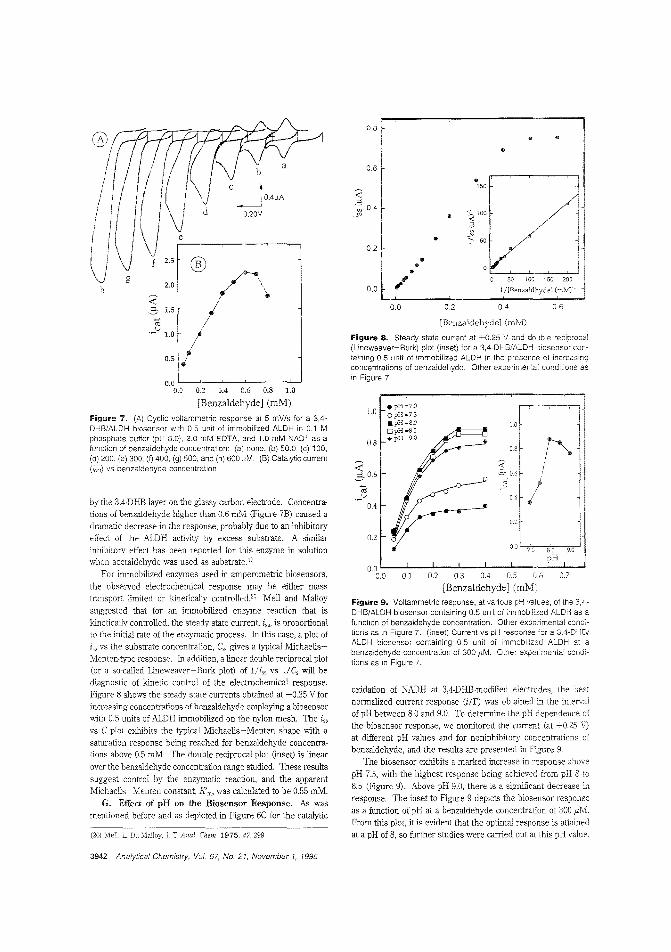
0.7
0.60.40.2
0.1
0.0
• pH=?:)o pH =7.5.pH=8.JOpH=8.5.pH",9.8
. .•
.150
• ::..... 100V<:2-. 38::;::. 50
•. a•
"0 50 100 150 200
l/[Benzaldhydel (m~Yl}:
0.2
0.4
0.0 '--_......._ ......._ ......._-'-_-'-_-'-_-'-_10.0
0.8
0.0
1.0
0.2
0.6
0.8
oxidation of NADH at 3,4-DHB-modified electrodes, the bestnonnalized current response (iff) was obtained in the intervalof pH between 8.0 and 9.0. To detennine the pH dependence ofthe biosensor response, we monitored the current (at +0.25 V)at different pH values and for noninhibitory concentrations ofbenzaldehyde, and the results are presented in Figure 9.
The biosensor exhibits a marked increase in response abovepH 7.5, with the highest response being achieved from pH 8 to8.5 (Figure 9). Above pH 9.0, there is a significant decrease in
response. The inset to Figure 9 depicts the biosensor responseas a function of pH at a benzaldehyde concentration of 300 I'M.From this plot, it is evident that the optimal response is attainedat a pH of 8, so further studies were canied out at this pH value.
0.2 0.3 0.4 0.5 06
[Benzaldehyde] (mM)
Fagure 9. Voltammetric response, at various pH values, of the 3,4DHB/ALDH biosensor containing 0.5 un,t of immobilized ALDH as afunction of benzaldehyde concentration. Other experimental conditions as in Figure 7. (Inset) Current vs pH response for a 3,4-DHB/ALDH biosensor containing 0.5 unit of immobilized ALDH at abenzaldehyde concentration of 300 I'M. Other experimental conditions as in Figure 7.
[Benzaldehyde] (mM)
Figure 8. Steady state cureent at +0.25 V and dcuble reciprocal(Lineweaver-Burk) plot (inset) for a 3,4-DHB/ALDH biosensor containing 0.5 unit of immobilized ALDH in the presence of increasingconcentrations of benzaldehyde. Other experimental conditions asin Figure 7.0.0 L-_~--,_--,_--,_--,---'
0.0 0.2 0.4 0.6 0.8 1.0
[Benzaldehyde] (mM)
Figure 7. (A) Cyclic voltammetric response at 5 mV/s for a 3,4DHB/ALDH biosensor with 0.5 unit of immobilized ALDH in 0.1 Mphosphate buffer (pH 8.0), 2.0 mM EDTA, and 1.0 mM NAD+ as afunction of benzaldehyde concentration: (a) none, (b) 50.0, (c) 100,(d) 200, (e) 300, (f) 400, (g) 500, and (h) 600 aM. (B) Cataly1ic current(feat) vs benzaldehyde concentration.
(201 Mell. L. D.; Maltoy,]. TAnal. Chern 1975,47,299.
0.5
by the 3,4-DHB layer on the glassy carbon electrode. Concentrations of benzaldehyde higher than 0.6 mM (Figure 7B) caused adramatic decrease in the response, probably due to an inhibitoryeffect of the ALDH activity by excess substrate. A similarinhibitory effect has heen reported for this enzyme in solutionwhen acetaldehyde was used as substrate. 17
For immobilized enzymes used in amperometric biosensors,the observed electrochemical response may be either masstransport limited or kinetically controlled." Mell and Malloysuggested that for an immobilized enzyme reaction that iskinetically controlled, the steady state current, i,,, is proportionalto the initial rate of the enzymatic process. In this case, a plot of
i" vs the substrate concentration, C" gives a typical MichaelisMenten-type response. In addition, a linear double reciprocal plot(or a so-called Uneweaver-Burk plot) of Iii" vs 1/C, will bediagnostic of kinetic control of the electrochemical response.Figure 8 shows the steady state currents obtained at +0.25 Vforincreasing concentrations of benzaldehyde employing a biosensorwith 0.5 units of ALDH immobilized on the nylon mesh. The i"vs C plot exhibits the typical Michaelis-Menten shape with asaturation response being reached for benzaldehyde concentrations above 0.5 mM. The double reciprocal plot (inset) is linear
over the benzaldehyde concentration range studied. These resultssuggest control by the enzymatic reaction, and the apparentMichaelis-Menten constant, K'm, was calculated to be 0.55 mM.
G, Effect of pH on the Biosensor Response. As wasmentioned before and as depicted in Figure 6C for the catalytic
:<2- 1.5
!ilu
.~ 1.0
3942 Analytical Chemistry, Vol. 67, No. 21, November 1, 1995
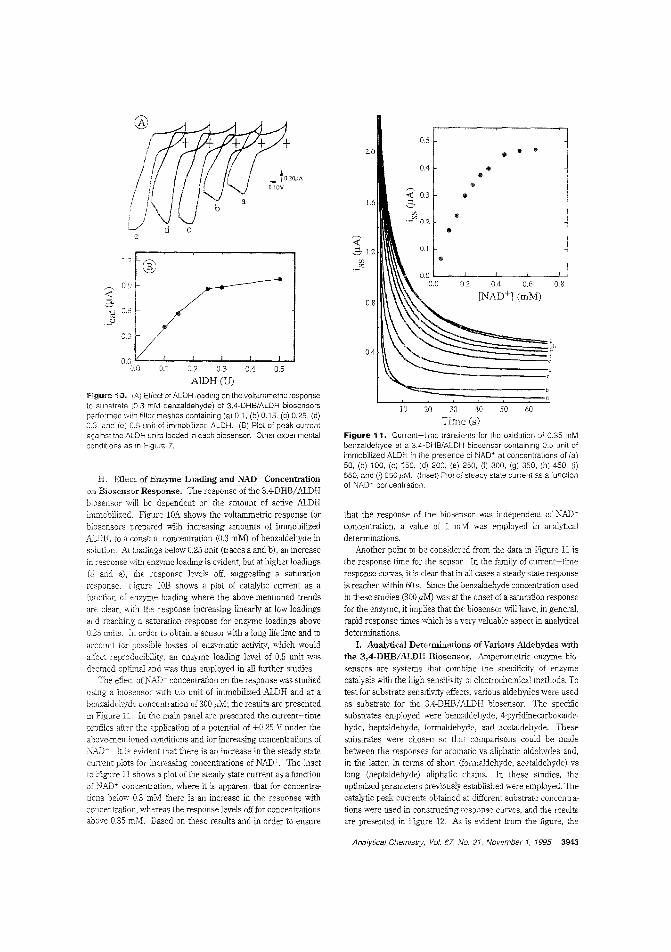
Figure 10. CA) Effect of ALDH loading on the voltammetric responseto substrate (03 mM benzaldehyde) of 3,4-DHBIALDH biosensorsperfocmed with filler meshes containing (a) 0.1, (b) 0.15, (c) 0.25, (d)0.3. Bnd (e) C.5 unit of immobilized ALDH. (8) Plot 01 peak currentagainst tho ALDH units loaded in each oiosensor. Other experimentalconditions as in Figure 7.
6050
0.5
.. .. ..0.4 ......
~ 0.3 ..20-'" ..
. _V'; 0.2 ..0.1 ..
0.2 0.4 0.6 0.8
[NAD+] (mM)
10
1.6
2.0
that the response of the biosensor was independent of NADcconcentration, a value of 1 mM was employed in analyticaldeterminations.
Another point to be considered from the data in Figure II isthe response time for the sensor. In the family of current-timeresponse curves, it is clear that in aJl cases a steady state response
is reached within 60 s. Since the benzaldehyde concentration usedin these studies (300,uN!) was at the onset of a saturation responsefor the enzyme, it implies that the biosensor will have, in general.rapid response times which is a very valuable aspect in analytioal
determinations.I. Analytical Determinations of Various Aldehydes with
the 3,4-DHB/ALDH Biosensor. Amperometric enzyme biosensors are systems that combine the specificity of enzymecatalysis with the high sensitivity of electrochemical methods. Totest for substrate sensitivity effects, various aldehydes were usedas substrate for the 3,4-DHB/ALDH biosensor. The specificsubstrates employed were benzaldehyde, 4-pyridinecarboxaldehyde, hepUlldehyde, formaldehyde, and acetaldehyde. These
substrates were ohosen so that comparisons could be madebetween the responses for aromatic 'IS aliphatic aldehydes and,in the latter, in terms of short (formaldehyde, acetaldehyde) vslong (hepUlldehyde) aliphatic chains. In these studies, theoptimized parameters previously established were employed. '111ecatalytic peak currents obtained at different substrate concentrations were used in cons:ructing response curves, and the resultsare presented in Figure 12. As is evident from the figure, the
20 30 40
Time (8)
Figure 11. Current-time transients for the oxidation of 035 mMbenzaldehyde at a 3,4~DHB/ALDH biosensor containing 0.5 unit ofimmobilized ALDH In the presence of NAD+ al concentrations of (a)50, (b) 100, (c) 150, (d) 200, (e) 250, (f) 300, (9) 350, (h) 450, (i)550, and U) 650 I'M. (Inset) Plot of sleady slate current as a tunctionof NAD+ concentration.
0.5
-la.20IlAO.lOV
J.2 0.3 0.4
AlDH (D)
d
0.1
®
e
0.9
0.6
0.3
1.2
<.3
H. Effect of Enzyme Loading and NAIY Concentrationon Biosensor Response. The response of the 3,4-DHB/ALDHbiosensor will be dependent on the amount of active ALDHimmobilized. Figure lOA shows the voltammetric response forbiosensors prepared with increasing amounts of immobilizedALDH, to a constant oonoentration (0.3 mM) of benzaldehyde insolution. Alloadings below 0.25 unit (traces a and bJ, an increasein response \"iith enzyme loading is evident, but at higher loadings(d and eJ, the response levels off, suggesting a saturation
response. Figure lOB shows a plot of catalytic current as afunotion of €'lzyme loading where the above-mentioned trendsare clear, with the response increasing linearly at lnw loadingsand reaching a saturation response for enzyme loadings above0.25 units. fn order to obtain a sensor with a long lifetime and toaccount for possible losses of enzymatic activity, which wouldafect reproducibility, an enzyme loading level of 0.5 unit wasdeemed optimal and was thus employed in all further studies.
The efect of K'\.Dc concentration on the response was studiedusing a biosensor with C.5 unit of immobilized ALDH and at abenzaldehyde concentration of 300 I'M; the results are presentedin Figure 11. In the main panel are presented the current- timeprDfiles after the application of a potential of +0.25 V under theabove-mentIoned conditions and for increasing concentrations ofNAD'. It is evident that there is an increase in the steady stateCUITent plots for increasing ooncentrations of NAD+ The insetto Figure 11 shows a plot of the steady state current as a functionof NAD+ concentration, where it is apparent that for concentrations below 0.3 mM there is an incease in the response withcO'1oentration, whereas the response levels off for concentrationsabove 0.35 mM. Based on these results and in order to ensure
Analytical Chemistry, Vol. 67, No. 21, November 1, 1995 3943
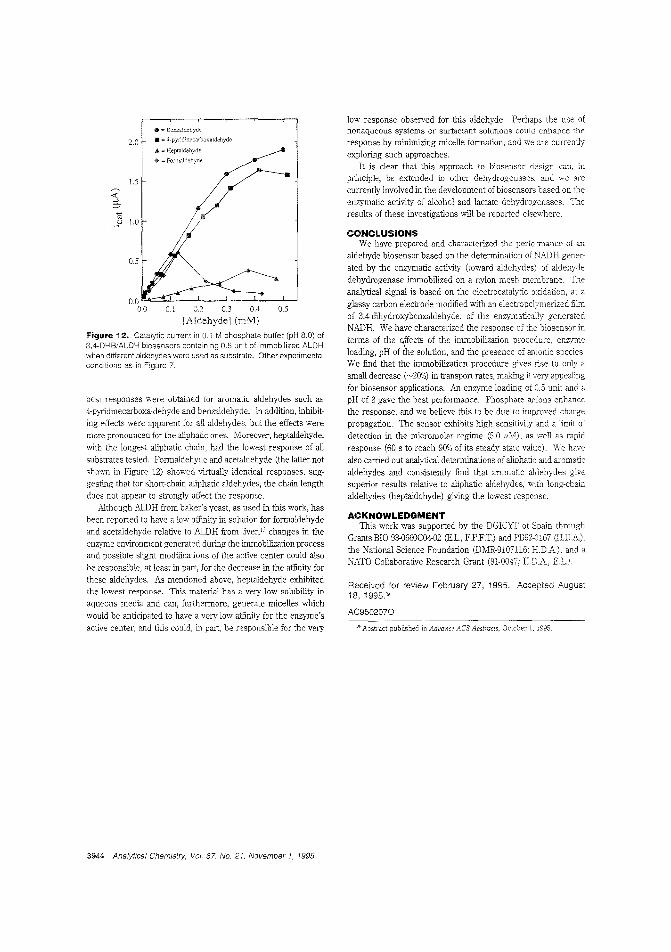
ACKNOWLEDGMENTThis work was supported by the DGICYT of Spain through
Grants BIO 93-0660C04-02 (E.L, F.P.F.T.) and PB92-0167 (H.DA)the National Science Foundation (DMR-9107116; HDA). and aNATO Collaborative Research Grant (91-0047; HD.A, E.L).
low response observed for this aldehyde. Perhaps the use ofnonaqueous systems or surfactant solutions could enhance theresponse by minimizing micelle formation, and we are cun-eorlyexploring such approaches.
It is clear that this approach to biosensor design can, inprinciple, be extended to other dehydrogenases, and we arecurrently involved in the development 01 biosensors based on theenzymatic activity of alcohol and lactate dehydrogenases. 111eresults of these investigations will be reported elsewhere.
o Abstract published in Advance ACS Abstracts, OClober 1. 1995.
Received for review February 27, 1995. Accepted August18, 1995.'"
AC9502070
CONCLUSIONSWe have prepared and characterized the performance of an
aldehyde biosensor based on the determination of NADH generated by the enzymatic activity (toward aldehydes) of aldehydedehydrogenase immobilized on a nylon mesh membrane. Theanalytical signal is based on the electrocatalytic oxidation, at aglassy carbon electrode modified with an electropolymerized filmof 3,4-dihydroxybenzaldehyde, of the enzymatically generatedNADH. We have characterized the response of the biosensor interms of the ~ffects of the immobilization procedure, enTimeloading, pH of the solution, and the presence of anionic species.We find that the immobilization procedure gives rise to only asmall decrease (~20%) in transport rates, making it very appealingfor biosensor applications. An enzyme loading of 0.5 unit and apH of 8 gave the best peIiormance. Phosphate anions enhancethe response, and we believe this to be due to improved chargepropagation. The sensor exhibits high sensitivity and a limit ofdetection in the micromolar regime (5.0 lIM), as well as rapidresponse (60 s to reach 90% of its steady state value). We havealso carried out analytical determinations of aliphatic and aromaticaldehydes and consistently find that aromatic aldehydes givesuperior results relative to aliphatic aldehydes, with long-chainaldehydes (heptaldehyde) giving the lowest response.
• -= Benzaldehyde
.:: 4-pyr.dinecarboxaldehyde
£. -= Heptaldehyde
... = Fonnaldehyde
1.5
2.0
best responses were obtained for aromatic aldehydes such as4-pyridinecarboxaldehyde and benzaldehyde. In addition, inhibiting effects were apparent for ail aldehydes, but the effects weremore pronounced for the aliphatic ones. Moreover, heptaidehyde,witb the longest aliphatic chain, had the lowest response of allsubstrates tested. Formaldehyde and acetaidehyde (the latter notshmvn in Figure 12) showed virtually identical responses, suggesting that for short-chain aliphatic aldehydes, the chain lengthdoes not appear to strongly affect the response.
Although ALDH from baker's yeast, as used in this work, hasbeen reported to have a low affinity in solution for formaidehydeand acetaldehyde relative to ALDH from liver,!' changes in theenzyme environment generated during the irnrrcobilization processand possible slight modifications of the active center could alsobe responsible, at least in part, for the decrease in the affinity forthese aldehydes. As mentioned above, heptaldehyde exhibitedthe lowest response. This material has a very low solubility inaqueous media and can, furthermore, generate micelles whichwould be anticipated to have a very low affinity for the enzyme'sactive center, and this could, in part, be responsible for the very
~l ~ 03 M 05
[Aldehyde] (roM)
Figure 12. Catalytic current In 0.1 M phosphate buffer (pH 8.0) of3,4-DHB/ALDH biosensors containing 0.5 unit of immoblilzed ALDHwhen different aldehydes were used as substrate. Other experimentalconditions as in Figure 7.
3944 Analytical Chemistry, Vol. 67. No. 21, November I, 1995
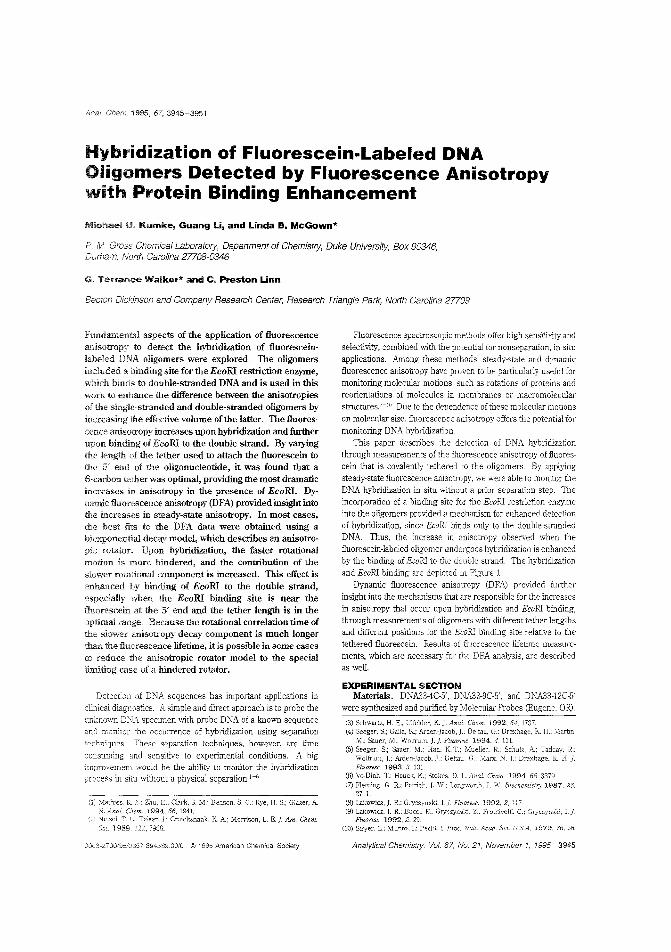
Anal. Chem. 1995, 67,3945-3951
Hybridization of Fluorescein-Labeled DNAOiigomers Detected by Fluorescence Anisotropywith Protein Binding Enhancement
Michael Kumke, Guang Li, and Linda B. McGown"
P M Gross Chemical Laboratory, Department of Chemistry, Duke University, Box 90346,Durham, North Carolina 27708-0346
G. Ter.ance Walke." and C. Preston Linn
Becton Dickinson and Company Research Center, Research Triangle Park, North Carolina 27709
Fundamental aspects of the application of fluorescenceanisotropy to detect the hybridization of fluoresceinlabeled DNA oligomers were explored. The oligomersincluded a binding site for the EcoRI restriction enzyme,which binds to double-stranded DNA and is used in thiswork to enhance the difference between the anisotropiesof the single-stranded and double-stranded oligomers byincreasing !he effective volume of the latter. The fluorescence anisotropy increases upon hybridization and furtherupon binding of EcoRI to the double strand. Byvarying
length of the tether used to attach the fluorescein to5' end of the oligonUcleotide, it was found that a
6-carbon tether was optimal, providing the most dramaticincreases anisotropy in the presence of EcoRI. Dynamic fluorescence anisotropy (DFA) provided insight intothe increases in steady-state anisotropy. In most cases,the best fits to the DFA data were obtained using abie:\:ponenti.aI decay model, which descrihes an anisotro-
rotator. Upon hybridization, the faster rotationalmotion is mOrc hindered, and the contribution of theslower rotational component is increased. This effect isenhanced by binding of EcoRI to the double strand,especially when the EcoRI binding site is near thefluorescein at the 5' end and the tether length is in theoptimal lange. Because the rotational correlation time of
slower anisolI~opydecay component is much longert.han the fluorescence lifetime, it is possible in some casesto reduce the anisotropic rotator model to the specialiimiting case of a hindered rotator.
Detection of DNA sequences has important applications inclinical diagnostics. A simple and direct approach is to probe !heunknowl1 DNA specimen with probe DNA of a mown sequenceand. ITconitor :he occurrence of hybridization using separation
techniques. These separation techniques, however, are time
consuming and sensitive to experimental conditions. A bigimprovement would be the ability tc monitor the hybridizationprocess in situ without a physical separation.l-6
:v1athies, R. Zhu, Clark, S. M,; Be:lson, S. C.: Rye, H. S.; Glazer, A.Ana!. Chern. 1994, 66, 194L
(:Z'I NetzeL T. Telser. J: Cr..lickshank, K A; Morrison, L. E.]. Am. Chern.Soc 1989 6966.
oom-2700/95/0337-3945$9.00/0 © 1995 A'nerican Chemica! Society
Fluorescence spectroscopic methods oiler high sensiti,ity andselectivity, combined wi!h the potential for nonseparation, in situapplications. Among !hese methods, steady-state and dynamicfluorescence anisotropy have proven to be particularly useful formonitoring molecular motions, such as rotations of proteins andreorientations of molecules in membranes or macromolecularstIllctures7 - JO Due to t"e dependence of !hese molecular motionson molecular size, fluorescence anisotropy offers the potential fa!monitoring DNA hyhddization
This paper describes the detection of DNA hybridization!hrough measurements of the fluorescence anisotropy of fluores~
cein !hat is covalently tethered to the oligomers. By applyingsteady-state fluorescence anisotropy, we were able to monitor theDNA hybridization in situ without a p['ior separation step. Theincorporation of a binding site for the EcoRl restriction enzymeinto !he oligomers provided a mechanism for enhanced detectionof hybridization, since EcoRl hinds only to the double-strandedDNA Thus, !he increase in anisotropy observed when thefluorescein-labeled oligomer undergoes hybridization is enhancedby the binding of EcoRl to the double strand. The hybridizationand EcoRl binding are depicted in Figure 1.
Dynamic fluorescence anisotropy (DFA) provided furtherinsight into the mechanisms that are responsible for !he increasesin anisotropy !hat occur upon hybridization and EcoRl binding,!hrough measurements of oligomers with different tether lengthsand different positions for the EcoRl binding site relative to thetethered fluorescein. Results of fluorescence lifetime measurements, which are necessary for the DFA analysis, are describedas well.
EXPERIMENTAL SECTIONMaterials. DNA33-4C-5', DNA33-9C-5', and DNA33-12C-5'
were synthesized and purified by Molecular Probes (Eugene, OR).
(3) Schwartz, H. E.; LTlfelder. K J. Anal. Chem. 1992,64, 1737.(4) Seeger, S.; Galla, K.; Arc.en-Jacob, J: Deltau, G.: Drexhage. K. H.; Martin.
M.; Sauer, M.: Wolfrum.]. J Flu.fJr('sc 1994.4. lIt.(5) Seeger, S.; Sauer. M.; Han. K-T; Mueller, R; SC:1Ulz, A.; R.;
WolfL.un, J.; Arden-Jacob, ].; Deltau, G.; \1arx, ].; Drexhage, KFluoresc. 1993,3. 131.
(6) Vo-Dinh, T; Houck, K.: Stokes. D. L Anal. Chern. 1994, 66, 3379.(7) Fleming, G. R; PCtridi,]. W.; Longworth. J. W. Biochemistry 1987, 26.
2711.(I:!) Lakowicz, J. R; Gryczynski, I.]. Fluoresc. 1992,2, 117.(9) Lakowicz, J. R; Bucci. E.; Gryczynski. Z.; Fronticelli, c.; GrycZ}'nski, 1. j.
Fluoresc. 1992, 2. 29.(10) Stryer, L.; Munro, 1.; Pecht. 1. Proc. :Vet!. Acad. Sci. u.s.A, 1979.76.56.
Analytical Chemistry. Vol.. 67, No. 21, November 1, 1995 3945
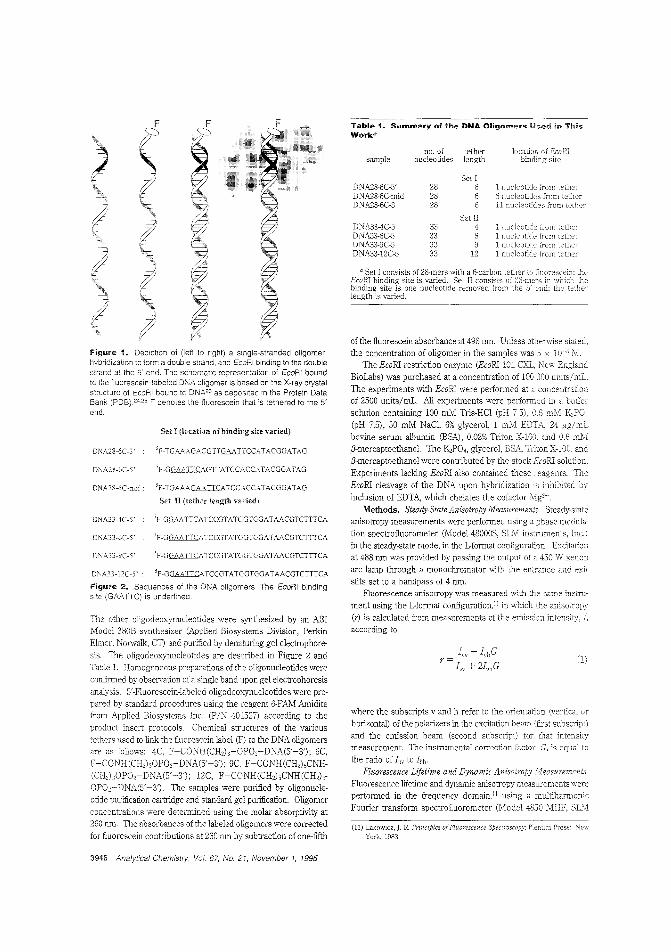
1 nucleotide from tethc"6 nucleotidc~ from11 nucleotides from
1 nucleotide from1 nucleotide from1 nucleotide LYall lethe I'
1 nucleotke [rom tether
tetherlength
Set I666
Set 11469
12
282828
33333333
DNA28-6C-5'DNA28-6C-midDNA28-6C-3
sample
DNA3HC-5DNA33-6C-5DNA33-9C-5D NA33-l2C-5
a Set I consists of 28-mersKeaRT hinding f.>ite is vaned.binding site is one nucleotidelength is varied.
Table 1. Summary of the DNA Oligomell's Used in Th~s
Work3
where the subscripts v and h refer to the Olientation (vertical orhorizontal) of the polarizers in the excitation beam (first subsclipt)
and the emission beam (second subscript) for that intensitymeasurement. The instrumental correction factor, G, is equal to
the ratio of I,,, tc hi;.Fluorescence Lifetime and Dynamic AnisotropyVIeasurements.
Fluorescence lifetime and dynamic anisotropy measurements \"'ereperformed in the frequency domain," using a multihaml0nic
Fourier transform spectrofiuorometer (Model 4850 MHF, SL\1
(11) La:<owicz,]. R Principles ofFluorescence Spectroscopy:York, 1983.
of the fluorescein absorbance at 496 nm. Unless othenvise stated,the concentration of oligomer in the samples was 5 x 10's M.
The EcoRI restriction enzyme (EcoRI 101 CXL, New England
BioLabs) was purchased at a concentration of 100 000 units/mL.
11,e experiments with EcoRI were performed at a concentrationof 2500 units/mL. All experiments were peliormed in a buller
solution containing 100 mM Tris-HCl (pH 75), 06 mM IZ,PO:
(pH 7.5), 50 mM NaCl, 6% glycerol, 1 mM EDTA, 24 ,ug/mLbovine serum albumin (BSA), 0.02% Triton X-lOO. and 0.6 m1\!!
p-mercaptoethano1. The IZ,PO" glycerol, BSA, TriLOn X'lOO, andp'mercaptoethanol were contributed by the stock EcoRI solution.
Experiments lacking EcoRI also contained these reagents. The
EcoRI cleavage of the DNA upon hybridization inhibited b)'
inclusion of EDTA, which chelates the cofactor Mg'-Methods. Steady-State Anisotropy Measurements. Steady-state
anisotropy measurements were performed using a phase-modula
tion spectrofluorometer (Model 48000S, SLM instruments, Inc.)in the steady-state mode, in the L-format configuration. Excitationat 488 nm was provided by passing the out-put of a 450 W xenon
arc lamp through a monochromator with the entrance and exit
slits set to a bandpass of 4 nm.Fluorescence anisotropy was measured with the same instru
ment llsing the L-format configuration,ll in which the anisotropy
(r) is calculated from measurements of the emission intensity, J,according to
DNA28-6C-mid: 'F-TGAAAGAAIKATCCACCATACGGATAG
Set II (tether length variedl
DNA33-4C-5' sF-GGAAIKATCCGTATGGTGGATAACGTCTTTCA
DNA33-6C-S' sF-GGAAIKATCCGTATCGTCGATAACGTCTTTCA
The other oligodeoxynucleotides were synthesized by an AB!Model 380B synthesizer (Applied Biosystems Division, Perkin
Elmer, Norwalk, en and purified by denaturing gel electrophore
sis. The oligodeoxynucleotides are described in Figure 2 andTable 1. Homogeneous preparations of the oligonucleotides were
confirmed by observation of a single band upor_ gel electrophoresis
analysis. 5'-Fluorescein-labeied oligodeoxynucleotides were pre
pared by standard procedures using the reagent 6-FAM Amiditefrom Applied Biosystems Inc. (P/N 401527) according to theproduct insert protocols. Chemical structures of the various
tethers used to link the fluorescein label (F) to the DNA oligomersare as follows: 4C, F-CONH(CH,h-OP02-DNA(5'-3'); 6C,
F-CONH(CH2),OPO,-DNA(5'-3'); 9C F-CONH(CH,lsCNH
(CH2),OPOc DNA(5'-3'); 12C, F-CONH(CH,lsCNH(CH,JsOP02-DNA(5'-3'). The samples were purified by oligonucle
otide purification cartridge and standard gel purification. Oligomer
concentrations were determined using the molar absorptivity at260 nm. The absorbances of the labeled oligomers were corrected
for fluorescein contributions at 260 nm by subtraction of one-fifth
DNA28-6C-3' 'F-TGAAAGACGTTGAAIKCATACGGATAG
DNA28-6C-5' 5F-GGAAIKAGTTATCCJ\CC\TACGGATAG
Set I (location of binding site varied)
DNA33-9C-S' 'F-G.G.Mll..CATCCGfATCiGTCGAT.A.A.CGTCTTTCA
DI'A33-i2C-5': 'F-GGAAIKATCCGTATGGTGGATAACGTCTTTCA
Figure 2. Sequences of the DNA oligomers. The EcoRI bindingsite (GAATTC) is underlined.
Figure 1. Depiction of (ieft to right) a singie-stranded oiigomer,hybridization tc 'form a double strand, and EcoRI binding to the doublestrand at the 5' end. The schematic representation of EcoRi boundto the fluorescein-labeled DNA oligomer is based on the X-ray crystalstructure of EcoRI bound to DNA23 as depositec in the Protein DataBank (PDB).2425 F denotes the fluorescein that is tethered to the 5'end.
3946 Analytical Chemislry, Vol. 67, No. 21, November 1, 1995
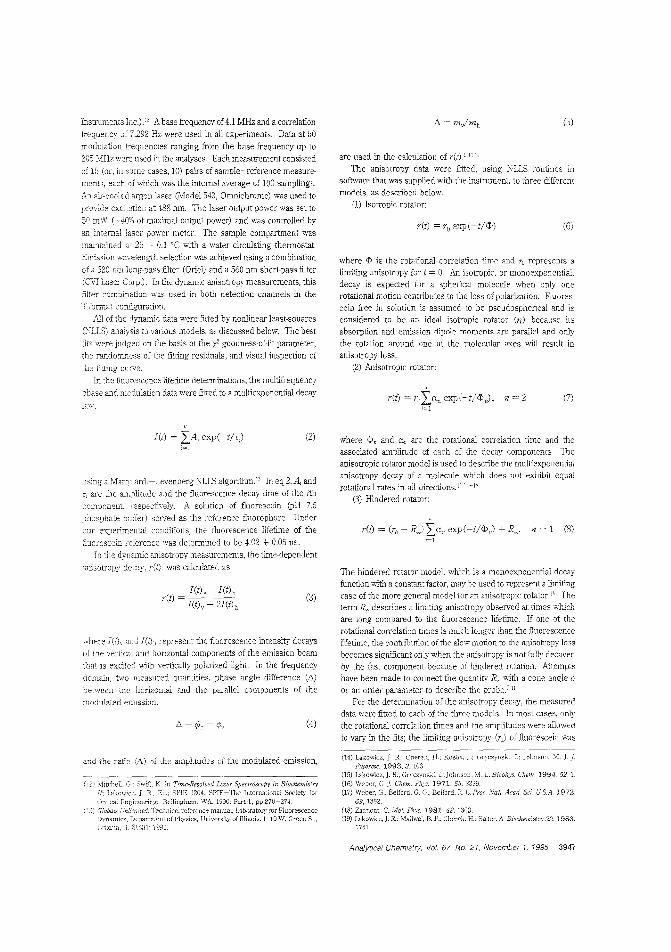
ret) = rcLa, exp(-tliP), n = 2 (7)j=l
are used in the calcuiation of r(l) .'I.!!.1'
The anisotropy data were filted, using NLLS routines insoftware that was supplied with the instrument, to three differentmodels. as described below.
(1) Isotropic rorator:
where <P is the rotational correlation time and Yo represents a
limiting anisotropy for i = O. An isotropic, or monoexponential,decay is expected for a spherical molecule when only onerotationai motion contributes to the loss of polarization. Fluores·cein free in solution is assumed to be pseudosphencal and isconsidered to be an ideal isotropic rotator (re) because itsabsorption and emission dipole moments are parallel and only
[he rotation around one of the molecular axes will result inanisotropy loss.
(2) Anisotropic rotator:
(6)
(5)
7(i) = roexp(-tl<P)
Instruments Inc.).:1 A base frequency of 4.1 MHz and a correlation
frequenC'j 7.292 Hz were used in all experiments. Data at 50moddation c-equencies ranging from the base frequency up to
205 MHz were used in the analyses. Each measurement consisted
of 15 (or, in some cases, 10) pairs of sample-reference measure
ments, eech of which was the internal average of 100 samplings.
An air·cooled argon laser (Model 543, Omnichrome) was used to
provide excitation at 488 run. The laser output power was set to
50 mVV (~40% of m""'Zimal output power) and was controlled by
""" internal laser power meter. The sample compartment wasmaintained 25 ± 0.1 '( with a water circulating thennostat.
Emission wavelength selection was achieved using a combination
of a 520 nm long·pass filter (Oriel) and a 560 nm short·pass filter
(CVI Laser Corp.). In the dynanlic anisotropy measurements, this
5!ler combination was used in both detection channels in the
T-formar configuration.All of the dynamic data were fitted by nonlinear least·squares
(NLLS) analysis to various models, as discussed below. The best
fits were judged on the basis of the goodness-of·fit parameter,
the randomness of the fitting residuals, and visual inspection of
fitting curve.
In d1e fluorescence lifetime determinations, the multifrequency
phase and modulation data were filtec to a multiexponential decay
la\v,
where lei), and I(t)" represent the fluorescence intensity decays
of the vertical and horizontal components of the emission beam
that is excitet] with vertically polarized llght. In the frequency
domain, two measured quantities, phase angle difference (C,)
between the horizontal and the parallel componenls of the
modulated em.ission,
us'ng a MarCjLardt-Levenberg NLLS algorithm.]3 ln eq 2, A, and
T, are the amplitude and the fluorescence decay time of the ith
cOD1penent, respectively. A solution of fluorescein (pH 7.5
vhosphate bWler) served as the reference flnorophore. Under
our experimental conditions, the fluorescence lifetime of the
iluorescein reference was detennined to be 4.02 ± 0.05 ns.
In the dynamic anisotropy measurements, the time·dependent
anisotropy decay, 1'(1). was calculatecl as
l(t) = IA exp(-t/Ti)
l(t) , -lei),r(i) = I(t)v + 2I(t)h
(2)
(3)
(4)
where <1>, and 0., are the rotational correlation time and theassociated amplitude of each of the decay components. Theanisotropic rotator model is used to describe the multiexponentialanisotropy decay of 8. molecnle which does not exhibit equalrotational rates in aU directions, I: 1:;"-11i
(3) Hindered rotator:
ret) = (ro - R~)La" exp(-fliP,) + R~, n = 1 (8)i=l
The hindered rotator model, which is a monoexponential decay
function with a constant factor, may be used to represent a limitingcase of the more general model for an anisotropic rotator1') Thetenn R~ describes a limiting anisotropy observed at times whichare long compared to the fluorescence lifetime. If one of therotational correlation times is much longer lhan the fluorescencelifetime, the contribution of the slow motion to the anisotropy 103S
becomes significant only when the anisotropy is not fully decayedby the fast component because of hindered rotation. Attemptshave been made to connect the quantity R" with a cone angle iJor an order parameter to describe the probe.ill
For the determination of the anisotropy decay, the measureddata were fitted to each of the three models. In most cases, only
the rotational correlation times and the amplitudes were allowedto vary in the fits; the limiting anisotropy (10) of fluorescein was
and the ratio (A) of the ampEtudo, of the modulated emission,
i1! BiochemistrySPIE 1204; International Society [or
WA, 1090; Part t, pp270-274Technical:ceferencernanual; Laboratory for Fluorescence
Department of PhysiL'S, University of Illinois, 1110 W. Greer: St.,:L GtSOl: 1990.
(14) Lakowicz, .1. R.; Cherek, H.; Kusba, ].; Gryczynski, L; Johnson, .I. j.Fiuoyesc. 1993,3, 103.
(15) Lakowicz,]. R: Gryczyns:-,:j, 1.;John50n, M. L. Biophys. Chem. 1994.52, L(16) Weber, Chem. Phys. 1971, 55, 2399.
(17) Weber, G.; G. G.; Belford, R 1.. Proc. Nat:. Acad. Sd. US.A. 1972,69, 1392.
(18) Zannoni, C. Mol. Phys. 1981, 42. 1303.(19) Lakowicz,]. R: MaHwaI, B. P.; Cl1erek I-I.; Ba:ter. A Biochemistry 22. 1983,
1711.
Analytical Chemistry, Vol 67, No. 21. November 1, 1995 3947
Table 2~ Steady~StateFluorescence AnisotropyResults for Set I and Set II Oligomers
Table 3~ Fluorescence Lifetime Results for Set;Oligomersa'
T! A, '[2 /
DNA28-6C-5'S5 3.83 0_98 0 0.02ds 4.00 0.98 0 002 1.2ss+EcoRl 3.87 0.97 0.43 O.U3 12ds+EcoRl 4.06 0.98 0.30 6.2
DI\A28-6C-rnidS8 4.07 0.98 0.67 iJ.ll2ds 4.26 0.97 1.36 0.03 2.3ss+EcoRI 4.06 0.98 0.44ds+EcoRl 4.26 0.97 1.23 om
DNA28-6C-3'8Sb 4.15 0.81 3.56
4.03 I 1.7ds 4.04 0.98 0.60 0.02 1.7ss+EcoRl 4.09 0.98 1.50 0.02 0.8ds+EcoRI 4.08 0.98 1.34 0.ll2 l.l
Table 4. Fluorescence lifetime Results for SetOligomersa
T) A] T:;
DNA33-4C-5'S5 3.92 0.94 1.46 o.ll6 l.lds 3.36 0.84 l.06ss+EcoRl 3.90 0.95 l.36 0.05 1.5ds+EcoRl 3.87 084 0.96 3.0
DNA33-6C-5'ss 3.97 0.97 0.019 2.3ds 4.05 0.99 0.18 o.GJ l.2ss+EcoRl 3.95 0.97 0.:)3 0.03ds+EcoRl 4.13 0.98 1.40
DNA33-9C-5'ss 4.05 0.99 0.13 1.3ds 4.01 ll.99 0.19 (H)) 0.8ss+EcoRl 4.07 0.98 0.23 0.02ds+EcoRl 4.05 0.97 0.32 fU)3 ! 2
DNA33-12C-5'&~b 4.12 0.89 274 CUI 10
3.95 t :l.8ds 3.97 O.99 0.19 0.01 0.9SS+EcoRIb 4.07 0.95 2.42 0.9
3.97 1ds+EcoRl 4.04 0.97 0.39 003
biexponential decays, the shorter lifetime component generallycontributed < 5% of the total intensity and showed poor run-torun reproducibility. Similar results for the dominant lifetimecomponent, which is in the range of 3.8-4.3 ns. were obtainedwhen the second lifetime component was allowed to float, as inthe results presented in Tables 3 and 4, and when it was fixed toons to account for scattered light (results not shown). Therefore,Chern, Phys. 1976, 17, 91.
fluorescence anisotropy
ss ds ds+EcoRI
Set I(HW 0.056 0.0730.034 0.053 0.0670.040 0.0·[4 0.053
Set 1I0.061 0.0:!l 0.100O.()49 0.076 0.106().O40 0.048 0.0730.038 0.060 0.055
DNA28-6C-5'DNA28-6C-midDNA28-6C-3'
sample
:)NA33-4C-5'DNA33-GC-S'DNA33-9C-S'[) NA33-12C-5'
(20) Fleming, G. R.; Morris.].
fixed to a value of 0.40,21) and the fluorescence lifetime was fixedto the expelimentally detennined value. In the few cases in whichTil was allowed to vary, a limiting anisotropy of 0.40 was recoveredfrom the fit.
RESULTSOligomer Samples. Two different sets of fluorescein-labeled
DNA oligomers were used in the experiments. These aresummarized in Table 1, which also gives the abbreviations usedin this paper for the different oligomers. The sequences of thetwo sets are shown in Figare 2. Set I consists of 28-base oligomers(28-mers) in which the fluorescein was attached by a 6-carbontether. In this sample set, the location of the binding site of theEcoR! enzyme was varied. Three different binding locations wereinvestigated: I base from the 5' end of the DNA strand (referredto as the 5' binding site), 5 bases from the 5' end (referred to asthe middle binding site), and 11 bases from -ehe 5' end (referred-eo as the 3' binding site). The second set of oligomers, set II,consists of 33-base oligomers (33-mers) ir_ which the EcoRIbinding site is located one base from the 5' end and the length ofthe tether was varied. Oligomers with 6-, 9-, and 12-carbontethers were used to attach the fluorescein to the oligomer. Foreach oligomer, four different samples were prepared: singlestranded DNA (ss), single-stranded DNA EcoRI (ss+EcoRl),double-stranded DNA (ds) , and double-stranded DNA + EcoR!(ds+EcoR!).
Steady-State Anisotropy. The steady-state anisotropy resultsare shown in Table 2. For the single strands, the anisotropy isgreatest for the 4-carbon tether and decreases with increasingtether length. Anisotropy increases upon hybridization and againupon EcoRI binding to the double strand. The greatest increaseis observed for the oligomers with the !J..carbon tether and theEeaR! binding site at the 5' end, which is closest to the fluoresceinlabel. The increase becomes smaller as the tether length isincreased or as the EcoRI binding site is moved toward the 3'end.
fluorescence lifetime Measurements, In order to perfonnDJ7A experiments, it is necessary to first analyze the fluorescence
lifetime characteristics of the labeled oligomers. The fluorescencelifetime results are shown in Table 3 for set I (the oligomers withthe EcoRI binding site in various positions) and in Table 4 for setII (the oligomers with different tether lengths). For most of thesamples, the data were best fit by biexponential decays. In theother cases, monoexponential decays were indicated. For the
3948 Analytical Chemistry. Vol. 67, No. 21, November 1, 1995
long tethers, the isotropic model gave results that were compa
rable to one or both of the other models). For tbe 6-carbon tether,
the data are fit equally well by tbe anisotropic rotator and the
hindered rotator models. This trend from biexponentia], aniso
tropic behavior for sbort tethers to hindered rotator behavior for
long tethers is discussed later.
In the anisotropic rotator model, @j is largest for the single
strand when the EcoRI binding sile is at the 5' position and when
the tether length is 6 carbons. Similar trends are observed for (I>in the hindered rotator modeL The fractional intensity contlibn
tion of <P2 is small « 6%), except for the 4-carbon tether. In ,he
anisotropic rotator model, hybridization generally causes increases
in both cD, and the D-actional intensity of cjj,. In the bindered
rotator model, hybridization similarly increases both cD and R~.
This effect is largest for the shorter teL1er lengths. For the
oligomers with the binding site at the 5' end and a tether length
of 4 or 6 carbons, there is an additional increase in the contrIbution
of cjj, upon addition of EcoRL For the longer tethers, the fractional
contribution of <P, is negligible, and in some cases, the isotropic
model is sufficient to describe the data; much less bindrance is
observed in these samples compared to the shorter tethers.
(21) Murakami, A.; Nakam-a, M.: Nakatsuji, Y: Nagahar;:l, S.: Tran-Ccng, 0.:Makino, K Res 1991, ~9, 4097.
DISCUSSIONUnder the experimental conditions of these studies (pH = 7.5),
the dianionic form of l1uorescein predominates. It is known that
fluorescein does not intercalate in Di\A2I and its fluorescence
characteristics are relatively insensitive to environmental condi
lions other tban pH. In experiments with free fluorescein in the
presence of unlabeled oligomers (results not shown), both single-
it is most likely that Ihe second lifelime component is an artifact
caused by small amounts of scattered light and noise. A possible
exception is the hybridized oligomer with the 4-carbon tether,
which may have a signi5cant second decay component. Further
studies would be needed to verify such biexponential decay. In
this work, only the dominant lifetime was used in the analysis of
the DFA data [or all samples.
For the single strands, slight increases In lifetime were
obselVed when the EcoRI binding site was moved away from the
5' end or wben tbe tether length \V-as increased. Hybridization
causes smar but reproducible increases in lifetime for the
oligomers that have a 6-carbon tether and in which the EcoRIbinding sire in the 5' or middle position, but it has no effect on
the other oligomers. Addition of EcoRI has no significant effecton the lifetimes in any of the samples.
Dynamic Fluorescence Anisotropy. The DFA results are
shown in Tables 5 and 6 for the set I and set II oligomers,
respectively. The data for both sets of samples were evaluated
by Ihree different models: the isotropic rotator, the anisotropic
rotator with cwo rotational correlalion limes (<P" cI>2), and the
hinde:"ed rotator Fits to an anisotropic rotator with threerotational correlation times (not shown) gave no improvement over
[he two-component anisotropic rotator model and recovered a zero
fractional intensity for the third correlation time.
In most cases, the experimental data could be reasonably fit
(based on the random residnal distribution and the x' values) by
either the biexponential anisotropic rotator or the hindered rotaLor
:TIodeL yieldirg similar values for the rotational correlation time
cjj, of the anisotropic rotator model and rotational correlation time
cl> of the hindered rotator modeL There is, however, an interesting
relationship between the goodness-of-fit to the different models
and Lhe length of the fluorescein tether. For the shortest
(4-carbon) tether, the bicxponential anisotropic rotator gives the
'Jcst fit, while for the long (9- ann 12-carbon) tethers, the hindered
rotator model generally gives tbe best fits (in a few cases for the
TableS. Dynamic Fluorescence Anisotropy Results for Table 6. Dynamic Fluorescence Anisotropy Results forSet Oligomersa Set II Oligomers"
anisotropic hindered isotropic anisotropic
(I) (1)1 0-, (I)~ 0.2 x2 c!) R~ ;(2 cD x2 (I>, 0-, c!)2 0-,
DNA28-GC-S' lJNA:J3·4C-5'().61 822 C.51 0.97 0.03 3.6 0.51 0.012 3.3 ss 0.62 0.41 0.87 12.:~ 013 18 0.47 0.035 27.2
cis C.87 258.9 C.63 0.92 25 0.08 9.0 0.66 0.026 9.9 ds U4 0.72 0.83 10.9 0.17 6.5 0.83 0.042 21.9
ss+F:coRT 0.63 69.2 0.53 0.96 - 0.04 8.6 0.53 0.013 5.1 ss+EcoRI 0.86 71 0045 0.78 4.0 0.22 L2 0.65 0.026 119ds+EcoRl 0.97 68LJ 0.57 0.88 23 0.12 4.9 0.62 0.038 8.9 ds+EcoRI 1.02 lJ2 0.52 0.72 5.5 0.29 0.5 0.77 0.049 11.9
DNA28-6C·mid DNA)3·6C·5'
CiS 0.38 0.95 23 0.05 1.7 0040 0.0]5 2.6 S3 0.74 73 0.62 0.96 ~ 0.04 6.9 062 O.OW 6.3
068 :)95A 0.41 0.86 13 0.11 1.7 0.46 0.028 9.5 ds 0.92 270 0.68 0.91 25 0.09 8.4 071 0.027 9.0
ss+EcoRI 056 99.6 0.46 0.96 59 0.04 4.2 0.46 0.015 4.1ss-'-EcoHl 0.89 150 0.69 0.94 ~ 006 13.5 068 0.023 12.0
ds+EcoRl 411.6 0.17 0.90 16 0.10 2.4 0.52 0.029 7.9 ds+EcoRI 1.24 727 070 085 37 [US 8.6 0.74 0.052 10.2
DNA28-6C-3' ss 0.33 22 0.31 0.99 0.01'3<:3 3.5 0.37 1 4.4 0.37 -0.002 3.6
26.0 0.38 ~O.Ul1 1.9
0.62 148.5 0.36 0.84 0.16 1.9 0.49 23.4ds 0.39 11 0.39 11.8 0.43 -0.008 2.3
4 0.021 ss"":"'EcoRI 0.38 31 0.38ss+EcoRI 0.39 2.7 0.39 1 2.9 0.:'19 -0.001 2.6
31.8 0.43 -0.011 2.9ds+EccRI 0.53 7 0.48 0.97 0.03 :).3 0.5 0.C05
c:.s+EcoRI 0.69 141.~) 0.44 0.86 0.14 2.4 0.55 Om8 12.23.7
DNA33-12CS58 0.32 18 0.32 0.99 99.2 0.01 18.9 0.36 -0.01l 0.7ds 0.36 9 0.36 0.99 99.1 0.01 9.2 0.39 -0.006 4.0ss+EcoRI 0.36 2 0.:16 1 1.7 0.36 1:.000 1.7ds+EcoRJ 0.49 0.48 099 95 0.01 H 0.48 0.001 34
Analytical Chemistry, Vol. 67. No. 21. November 1. 1995 3949
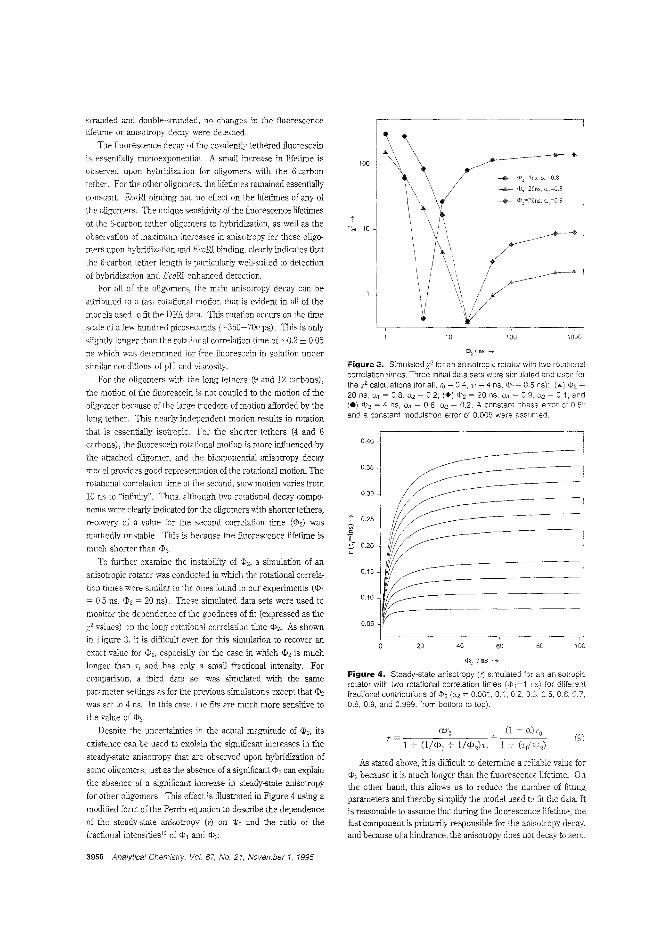
<1>2 Ins --7>
Figure 4. Steady-state anisotropy (r) simulated for an anisotropicrotator with two rotational correlation times (<P:~1 ns) for differentfractional contributions of 1:>2 (02 = 0.001, 0.1,0.2,0.3.0.5,0.8,0.7,0.8, 0.9, and 0.999, from bottom to top).
<Dz I os ......,.
Figure 3. Simulated X2 for an anisotropic rotator with two rotationalcorrelation times. Three initial data sets were simulated and used forthe x2 calculations (for ali, ro = OA, Ti = 4 ns, (1):~ 0.5 ns): (AI <P, ~20 ns, a' = 0.8, 02 ~ 0.2; (+) <])2 = 20 ns, a' ~ 0.9. ~ 0.1: and(el <1>2 = 4 ns, a, ~ 0.8, 02 = 0.2. A constant phase error of 0.5 0
and a constant modulation error of 0.005 were assumed.
As stated above, it is difficult to detemline a reliable valne for1>2 because it is much longer than the fluorescence lifetime. Ontl,e other hand, this allows us to reduce the number of fittingparameters and thereby simplify the model used to fit the data. Itis reasonable to assume that during the fluorescence lifetime, thefast component is primarily responsible for the anisotropy decay,and because of a hindrance, the anisotropy does not decay to zero.
100
(9)
1000
80
10C
(1-
1-;-
6040
10
20
0.40
100
0.35 ~0.30
tP------~--~ 0.25
j
~~~~-"- 0.20-::-
0.15
ff=0.10
0.05
stranded and double-stranded, no changes in the fluorescence
lifetime or anisotropy decay were detected.
The fluorescence decay of the covalently tethered fluorescein
is essentially monoexponentiaL A small increase in lifetime is
observed upon hybridization for oligomers veith the 6-carbon
tether For the other oligomers, the lifetimes remained essentially
constant EcoRI binding had no effect on the lifetimes of any of
the oligomers. The unique sensitivity of the fluorescence lifetimes
of the 6-carbon tether oligomers to hybridization, as well as the
observation of maximum increases in anisotropy for these oligo~
mers upon hybridization and EcoRI binding, clearly indicates that
the 6-carbon tether length is particularly well-suited to detection
of hybridization and EcoRI enhanced detection.
For all of the oligomers, the main anisotropy decay can be
attributed to a fast rotational motion that is evident in all of the
models used to fit the DFA data. This rotation occurs on the time
scale of a few hundred picoseconds (~350-700 ps). This is only
slightly longer than the rotational correlation time of ~0.2 ± 0.05
ns which was determined for free fluorescein in solution under
similar conditions of pH and ,iscosity.
For the oligomers with the iong tethers (9 and 12 carbons),
the motion of the fluorescein is not coupled to the motion of the
oligomer because of the large freedom of motion afforded by the
long tether. This nearly independent motion results in rotation
that is essentially isotropic. For the shorter tethers (4 and 6
carbons), the fluorescein rotational motion is more influenced by
the attached oligomer, and the biexponential anisotropy decay
model provides good representation of the rotational motion. The
rotational correlation time of the second, siow motion varies from
10 ns to "infinity". Thus. although two rotational decay compo
nents were clearly indicated for the oligomers \lith shorter tethers,
recovery of a value for the second correlation time (1),) was
markedly unstable. This is because the fluorescence lifetime is
much shorter than CD,.
To further examine the instability of ell 2, a simulation of an
anisotropic rotator was conducted in which the rotational correla
tion times were similar to the ones found in our experiments (¢l 1
= 0.5 ns, ell, = 20 ns). 111ese simulated data sets were used to
monitor the dependence of the goodness of fit (expressed as the
values) on the long rotational correlation time 1>2. As shown
in Figure 3, it is difficult even for this simulation to recover an
exact value for ell" especially for the case in which ell, is much
longer than !f and has only a small fractional intensity. For
comparison, a third data set was simulated with the same
parameter settings as for the previous simulations except that 1>2was set to 4 TIS. In this case, the fits are much more sensitive to
the valne of 1>,.
Despite the uncertainties in the actual magnitude of 1>2, its
existence can be used to explain the significant increases in the
steady-state anisotropy that are observed upon hybridization of
some oligomers, just as the absence of a significant ell, can explain
the absence of a significant increase in steady-state anisotropy
for other oligomers. This effect is illustrated in Figure 4 using a
modified form of the Perrin equation to describe the dependence
of the steady-state anisotropy (r) on ill, and the ratio of the
fractional intensities!9 of 1>1 and 1>2:
3950 Analytical Chemistry, Vol. 67, No. 21, November 1, 1995
E. F., Jr.; Brice,M.]. Mol.
The longer decay component can be represented in a first
approximation by a constant term, Rw This can be modeled as a
hindered retator. Application of tbis model to the DFA dataproduced results that were similar to the steady-state anisotropyresults. R, increases upon hybridization and increases furtherupon EcoRI binding to the double strand if the binding site is nearthe 51 end. Similar increases in R", are observed for the 1C and6C tether lenRths. This tendency is less pronounced for the 9Cand 12C tethers.
CONCLUSIONSThe results demonstrate the detection of DNA hybridization
by fluorescence anisotropy. The detection can be improved byincluding a binding site for the enzyme EcoRI on the oligomerprobe. EcoRI, which binds only to double-stranded DNA, increases the effective volume 01 the double strand complex andthereby amplifies the difference between the anisotropies of thesing:e strand and the double strand. EeoRl enhancement of
polarization can be applied to the detection of any sequence whenused in conjunction with a nucleic acid amplification method suchas polymerase chain readon (PCR) or strand displacementamplification (SDA). The approach involves the use of anamplification primer or detector probe that contains tJle specifictarget sequence at its 3f-end and the EcoRI site at its 5'-end. ThepJimer or detector probe is converted from a single strand to adouble-stranded form that binds EcoRI during amplification of toetarget sequence.~2
(22) \\falker. T.: al., unpublished results.Kim, '( : Grable, J. c.: Love, R; Greene, ?J; Rosenberg,]. M. Science 1990,
c.: Koctzle, T. F.: Willians, G. ]. E.:D; Rodgers, .r. R.: Kennard, 0.: Shimanouchi, T.;
] 977. 772, 53:)L Bernstein, F. C; Bryant, S. H.; Koetzle, T. F.; Weng, ]. In
Apphcat{o,lls; Allen, F. H.. G" Sievers, R, Eds; DataCommisslc 1 of UX' Illlemational Un:on Bonn/Cambridge/Chester. pp 107-132.
The results show that the EcoRI-enhanced polarization detec
tion scheme is effective only if (1) the fluorescein tether is short(-6 carbons or less) and (2) the EcoRI binding site is near the
fluorescein attachment site at the 5' end. The 6C tether is theoptimal length for the particular system investigated here, yieldingthe largest anisotropy differences upon hybridbition in both theabsence and the presence of EcoRI binding. Further investigationsare needed to determine the depennence of the optimium tether
length on the sequence and length of the probe, the dye used fordetection, and the location of the EcoRI binding site.
The anisotropy decay in the singie strand is dominated by thevery fast motion of the fluorescein molecule about the tether. Onlya very small portion, if any, of the anisotropy decay is caused bymotion of the whole molecular unit (oligomer + fluorescein). For
the oligomers with a short (4 or 6 carbons) tether, the contributionof the slow rotational component to the anisotropy decay increasesupon hybridization and further upon binding of EcoRI to thedouble strand near the 5' end, due to hindrance of the fast
fluorescein motion, and the anisotrupy does not decay to zero.When the tether length is increased, the motion of the fluoresceinis less influenced by hybridization and EcoRI binning, andanisotropy decay is due to the fast motion of the fluorescein only.
ACKNOWLEDGMENTThe authors are grateful to Michael Mitchell of Becton
Dickinson and Co. Researcb Center for performing tJ,e molecular
modeling of the EcoRI bound to the fluorescein-labeled DNAoligomer and providing the graphical depiction of this system that
is shown in Figure L
Received for review May 17, 1995. Accepted August 13,1995.&
AC950478Z
o Abstract published in .4dvance ACS Abstracts, September 15, 1995.
Analj1ical Chemistry, Vol. 67, No. 21, November 1. 1995 3951
Anal. Chem. 1995, 67. 3952-3957
Tandem Reflectron Time-of-Flight MassSpectrometer Utilizing Photodissociation
Douglas J. Beussman, Paul R. Vlasak, Richard D. McLane,t Mary A. Seeterlin, and Christie G. Enke"
Department of Chemistry, Michigan State U~iversity, East Lansing, Michigan 48824
A tandem time-of-flight (fOF) mass spectrometer hasbeen designed to obtain complete MS/MS spectra fromcompounds eluting from a gas chromatograph. Thisapplication requires high spectral generation rate, unitmass resolution for both precursor selection and productspectra, and efficient ion utilization. These objectives areachieved by reflectron TOF mass separation in both stagesand laser photoinduced dissociation as the ion fragmentation method. Careful thning of the laser pulse relative toion extraction allows ions of a single m/z value up to m/z1000 to be photodissociated while ions with adjacent m/zvalues are essentially unaffected. The convergent foci ofthe ion packet and laser pulse results in ion fragmentationefficiencies as high as 79%. An ion gate prevents thenonselected precursor ions from convoluting the productspectra. Product spectra can be generated at the maximum laser repetition rate (currently 200 Hz). To achieveunit mass resolution for all product m/z values sImultaneously, a novel reflectron was designed for the secondTOF stage.
Tandem mass spectrometers have the capability of providingsubstantial improvements over single-stage mass spectrometers
in both chemical selectivity and the amount of structural information obtained about an analyte. TIle complete tandem mass
spectrometry (MS/MS) characterization of an analyte requires
obtaining the product mass spectrum for each of the mlz valuesof interest in Ihe primary mass spectrum. One of the most
severely felt limitations is the amount of MS/MS data that canbe collected on a compound introduced to the mass spectrometer
after chromatographic separation, due to the requirement that theanalyte partial pressure remain relatively constant in the source
during the analysis time. For this application. it is desirable tobe able to collect 100 or more product spectra per second. Thehigh sensitivity desired for such an application also requires that
at least the second mass amlysis be performed ')y array detection
rather than by scanning a mass filter. The existing true arraydetection mass spectrometric techniques include magnetic sectorwith spatial array detection and Fourier transform mass spec
trometry, while time-of-flight erOF) with time array detection andthe ion trap are batch 3.1Tay detection techniques.
In this paper. the design and performance of an instrument
intended to obtain MS/MS spectra on the chromatographic time
scale is described. The emphasis is on design considerations and
Address reprint requesL~ to Christie G. EnJ<e, Dep<lrtment of Chemistry,103 Clark HalL University of New Mexico, .Albuquerque, NM 87131. E-mail:[email protected].
Current address: The Procter and Gamble Co., Sharon Woods TechnicalCenter, 11450 Grooms Rd., Cincinnati, OR 45241.
3952 Analytical Chemistry, Vol. 67. No. 27. November 7, 1995
initial performance characterizations. This instrument (see Figure1) utilizes TOF separation in both stages of mass analysis and alaser pulse to provide unit resolution selection of the precursor
ion packet of interest, achieve high-efficiency photoinduceddissociation (PlD), and yield a complete, unit-resolved production spectrum for each laser pulseI
Photon-induced fragmentation by pulsed laser beam allows
precursor ion selection by laser timing and provides efficientfragmentation in a manner that does not compromise the TOFanalysis of the products. The high degree of photon-ion overlap
at the interaction region, resulting from a focused ion packet anda focused laser pulse, results in the excitation of a large frection
of the selected ions and thus high fragmentation efficienc'es.
Because a useful normal or product spectrum can be obtainedfrom each source extraction, it is practical to generate productspectra at the maximum laser repetition frequency (e.g., 200 Hz
for pulsed excimer lasers). Since this rate of extraction is quite
slow forTOF mass analysis, the generation of normal or primaryspectra can be interspersed 'mth product spectrum generation.
Several other researchers have designed tandem mass spec
trometers which use photodissociation as the fragmentationmethod. Duncan et a1. pertormed photodissociation in a singie
reflectron TOF mass spectrometer by intersecting a laser puise
and an ion packet at the turnaround point of the reflectron.'Schlag and co-workers also used a single rel1ectron TOF insh·u
ment to photodissociate benzene." This was accomplished by
focusing a laser pulse at the space focus plane outside the ion
source and timing the laser pulse suoh that it intersected theisomass ion packet of choice. V'lhile demonstrating d1e practicality
of PID in TOF instruments, these designs have not achieved our
goal of unit mass resolution to mlz 1000 for both precursor andproduct ions.
Another related instrument is that of Cotter and Cornish.'
They have constructed a tandem reflectron TOF mass spectrometer and used it to collect MS/MS data. Instead of using a laser
for photodissociation in the fragmentation process, a gas pulsewas used to perform collision-induced dissociation (Cm) experiments.
EXPERIMENTAL SECTIONThe instrument chamber has inner dimensions of 60 in. bng
x 11 in. wide x 9 in. tall with three removable access panels (~20
(1) Seeterlin, M. A: Vlasak. P. R.: Beussman, D, J.; Md...anc. P. Enkc. C. G.Am. Suc Mass 1993, 4, 751~754.
Cheng, G.; \Villey, K M.: Duncc'.!1,M. A Anal. Chem. 1989,61,1458-1460.
(3) Boesl, D.; Weinkauf, R.: Walter, K; Weickhardt. c.: Schlag. E. 'iV. Ber.Bunsenges. Chem_ 1990,94, 1357-136?
(4) Cornish, T.; R.l Rapid Commun. IV/ass S;bectrom. 1992,6.242-248.
0003-2700/95/0367-3952$9.00/0 © 1995 American Chemical Society
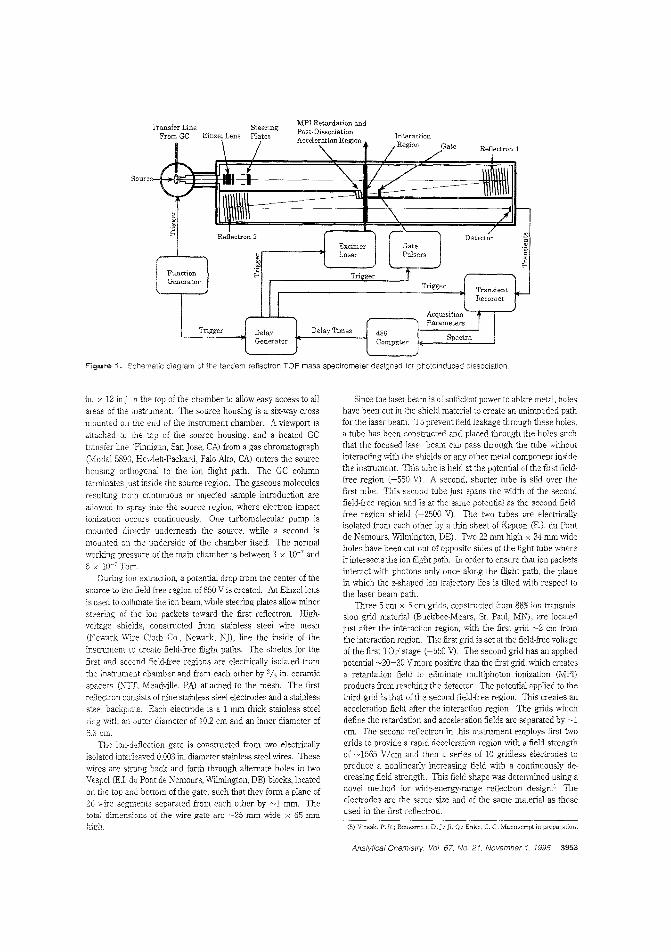
Reflectron 1
InteractionRegion Gate
Reflectron 2
Trigger
Transfer Line SteeringFrom GC Einzel Lens Plates
Source-l:"'G£EE~~Iit-::-I---------~",,-I-I-~7"
Figure 1. 2chematic diagram of the tardem reflectron TOF mass spectrometer designed tor photoinduced jissociation.
in. x 12 in.) .n the top of the chamber to allow easy access to allareas of the mstrument The source housing is a six-way crossmounted on the end of the instrument chamber. A viewport is
at:cached to the top of the source housing, ,md a heated GCtransfer line (Finnigan, San Jose, CAl from a gas chromatograph
(Model 5890, Hewlett-Packard, Palo Alto, CAl enters the source
housing orthogonal to the ion flight path. The GC columnterminates just inside the source region. The gaseous moleculesresulting from continuous or injected sample introduction are
allowed to spray into the source rebJ10n, where electron impactionization occurs continuously. One turbomolecular pump is
mounted directly underneath the source, while a second ismounted on the underside of the chamber itself The normalworking pressure of the main chamber is between 3 x 10⁻⁷ and6 x 10 7 Torr.
During ion extraction, a potential drop from the center of the
source to the field-free region of 650 V is created. An Einzellensis used to collimate the ion beam, while steering plates allow minorsteering of the ion packets toward the first reflectron. Highvoltage shields, constructed from stainless steel wire mesb(l';ewark Wire Cloth Co., Kewark, NJ), line tbe inside of the
instrument to create field-free flight paths. The shields for thefirst and second field-free regions are electrically isolated fromthe instrument chamber and from each other by:lls in. ceramic
spacers (';TI, Meadville, PAl attached to the mesh. The firstreDectron consists of nine stainless steel electrodes and a stainlesssteel backplate. Each electrode is a 1 mm thick stainless steelring with an outer diameter of 10.2 em and an inner diameter of6.3 em.
The ion-deflection gate is constructed from two electrically
isolated interleaved 0.003 in. diameter stainless steel wires. Thesewires are strung back and forth througb alternate holes in twoVespel (EJ du Pont de Nemours, Wilmington, DE) blocks, locatedon the top and bottom of 11,e gate, such that they form a plane of26 wire segments separated from each other by ~1 mm. Thetotal dimensions of the wire gate arc --25 mm wide x 65 mmhigh.
Since the laser bea!n is of sufficient power to ablate meW, holeshave been cut in the shield material to create an unimpeded pathfor ,he iaser beam. To prevent field leakage through these hoies,a tube has been constructed and placed through the holes suchthat the focused beer beam can pass through the tube withoutinteracting with the shields or any other metal componem insidethe instrument. This tube is held at the potential of the first fieldfree region (-550 V). A second, shorter tube is slid over thefirst tube. This second tube just spans the width of the secondfield-free region and is at the same potential as the second fieldfree region shield (-2500 V). The two tubes are electricallyisolated from each other by a thin sheet of Kapton (E.L du Pontde Nemours, Wilmington, DE). Two 22 mm high x 34 mm wideholes have been cut out of opposite sides of the light tube whereit intersects the ion flight path. In order to ensure that ion packetsinteract witb photons only once along the flight path, the planein which the z-shaped ion trajectory lies is tilted with respect tothe laser beam path.
Three 5 em x 5 em grids, constructed from 88% ion transmission grid materiai (Buckbee-Mears, SI. Paul, MN), cre locatedjust after the interaction region, ",ith the first grid ~2 em fromthe interaction region. The first grid is set at the field-free voltageof the first TOF stage (-550 V). The second grid has an appliedpotential ~20-30 V more positive than the first grid, which createsa retardation field to eliminate multiphcton ionization (MPI)products from reaching the detector. Tho potential applied to thethird grid is that of the second field-free region. This creates anacceleration field after the interaction region. The grids whichdefine the retardation and acceleration fields are separated by ~1em. The second reflectron in this instrument employs first t.vogrids to provide a rapid deceleration region with a field st~ength
of ~1565 V/ em and then a series of 10 gridless electrodes toproduce a nonlinearly increasing field with a continuously decreasing field strength. This field shape was determined using anovel method for wide-energy-range reflectron design." Theelectrodes are the same size and of the same maLerial as those
used in the first rf':t1ectron.
(5) Vlasak. P. R; Beussm,u, D.] ; Ji, Q.; Enkc, C. G. Manuscr~pt in preparation.
Analytical Chemistry Vol 67, No. 21. November 1, 1995 3953
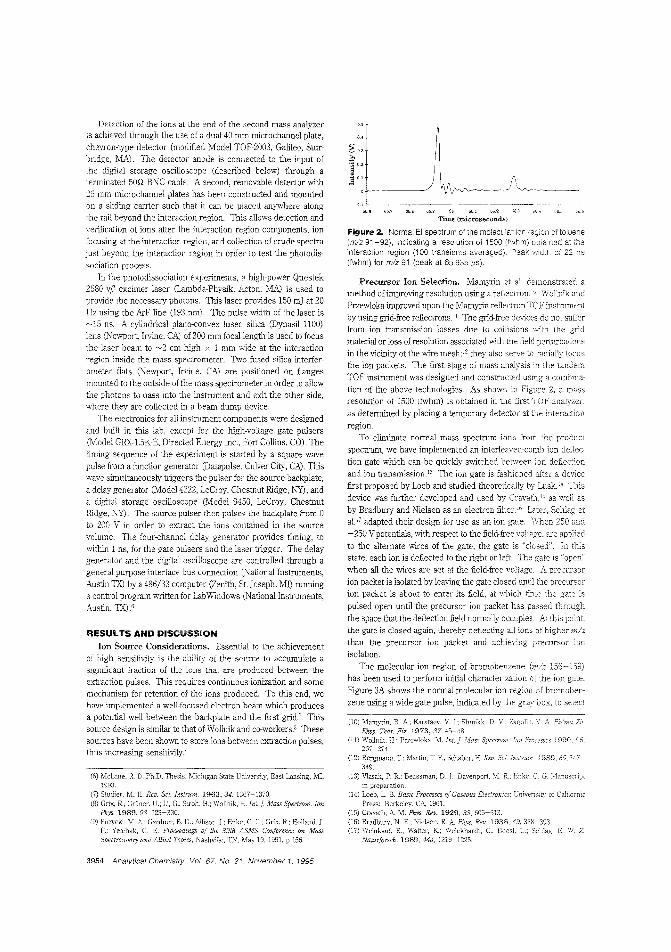
Detection of the ions at the end of the ::o;econd mass analyzeris achieved through the use of a dual 40 mm microchannel plate,chevron-type detector (modified Model TOF-2003, Galileo, Sturbridge, MA). The detector anode is connected to the input ofthe digital storage oscilloscope (described below) through aterminated 50Q BNC cable. A second, removable detector with25 mm microchannel plates has been constructed and mountedon a sliding carrier such that it can be placed anywhere alongthe rail beyond the interaction region. This allows detection andverification of ions after the interaction region components, ionfocusing at the interaction region, and collection of crude spectrajust beyond the interaction region in order to test the photodissociation process.
In the photodissociation experiments, a high-power Questek2580 vf3 excimer laser (Lambda-Physik, Acton, MA) is used toprovide the necessary photons. This laser provides 150 mJ at 20Hz using the ArF line (193 nm). The pulse width of the laser is-15 ns. A cylindrical plano-convex fused silica (Dynasil 1100)lens (Newport, Irvine, CAl of 300 mm focal length is used to focusthe laser beam to -2 cm high x 1 mm wide at the interactionregion inside the mass spectrometer. Two fused silica interferometer flats (Newport, Irvine, CAl are positioned on flangesmounted to the outside of the mass spectrometer in order to allowthe photons to pass into the instrument and exit the other side,where they are collected in a beam dump device.
The electronics for all instrument compone3ts were designedand built in this lab, except for the high-voltage gate pulsers(Model GRX-1.5K-E, Directed Energy Inc., Fort Collins, CO), Thetiming sequence of the experiment is started by a square wavepulse from a function generator (Datapulse. Culver City, CA). Thiswave simultaneously lJiggers the pulser for the source backplate,a delay generator (Model 4222, leCroy, Chestnut Ridge, 1\"y), anda digital storage oscilloscope (Model 9450, leCroy, ChestnutRidge, NY). The source pulser then pulses the backplate from 0to 200 V in order to extract the ions contained in the sourcevolume. The four-channel delay generator provides timing, towithin 1 ns, for the gate pulsers and the laser lJigger. The delaygenerator and the digital oscilloscope are controlled through ageneral purpose interface bus connection (National Instruments,Austin TX) by a 486/33 computer (Zenith, St. Jcseph, MI) runninga control program written for LabWindows (National Instruments,Austin, TX)6
RESULTS AND DISCUSSION
Ion Source Considerations, Essential to the achievementof high sensitivity is the ability of the source to accumulate asignificant fraction of the ions that are prod'lCed between theextraction pulses. This requires continuous ionization and somemechanism for retention of the ions producec'. To this end, wehave implemented a weU-focused electron beam which producesa potential well between the backplate and the first grid.' Thissource design is similar to that ofWollnik and co-workers.' Thesesources have been shown to store ions between extraction pulses,thus increasing sensitivity."
(6) Mclane, R. D. Ph.D. Thesis, Michigan State University, East Lansing, MI,1993.
(7) Studier, M. H. Rev. Sci.lnstmm. 1963,34,1:367-1370.(8) Grix, R; Gruner, U.; L~ G.; Stroh. I-I.; Wollnik, H. In,.]. Mass Spectrom. Ion
Phys. 1989,93,323-330.(9) Puzycki. M. A.: Gardner, B. D.: Ailison. J.; Enkc, C. G.: Grix, R: Holland, J.
F.: Yekhak, G. E. of the 39th ASMS Conference on MassSpectrometry and Allied T'Jpics: TN, May 19, 1991; P 156.
3954 Analytical Chemistry, Vol 67, No, 21. Nnvember 1. 1995
:;-'~]0.1
66.1
Time (microseconds)
Figure 2. Normal EI spectrum of the molecular ion reoion of toluene(m/z 91-92), indicating a resolution of 1500 (fwhm) olJtained at theinteraction region (100 transients averaGed). Peak width of 22 ns(fwhm) for m/z 91 (peak at 65935 .us),
Precursor Ion Selection. Mamyrin et aL demonstrated amethod of improving resolution using a reflectron.:: WoUnik andPrzewloka inlproved upon the Mamyrin reflectron TOF inslJ'Umentby using grid-free reflectrons. '] The grid-free devices do not sufferfrom ion transmission losses due to collisions 'hith the gridmaterial or loss of resolution associated with the field perturbationsin the vicinity of the wire mesh; 12 they also serve to l:adiallv focusthe ion packets. The first slage of mass analysis in the ~ndemTOF instrument was designed and constructed using a combination of the above technologies. As shown in Figure 2, a massresolution of 1500 (fwhm) is obtalned in the first TOF analyzer,as determined by placing a temporary detector at the interaction
region.To eliminate normal mass spectrum ions from the prodLlet
spectrum, we have implemented an interleaved-comb ion deflection gate which can be quickly switched between ion deflectionand ion transrnission.B The ion gate is fashioned after a devicefirst proposed by Loeb and studied theoretically by Lusk.:· 1111sde'ice was further developed and used by Cravath,le as weD asby Bradbury and Nielsen as an electron filter. '6 Later, Schlag etaJ.l7 adapted their design for use as an ion gate. l,Vhen 250 and-250 V potentials, with respect to the field-free voltage, are applied
to the alternate ",ires of the gate, the gate is "closed". In thisstate, each ion is deflected to the right or left. The gate is "open'when all the wires are set at the field-free voltage, A precursorion packet is isolated by leaving the gate closed until the precursorion packet is about to enter its field~ at which time the gate ispulsed open until the precursor ion packet has passed throughthe space that the deflection field normally occupies. At this point.the gate is closed again, thereby deflecting all ions of higher mlzthan the precursor ion packet and achieving precursor ionisolation.
The molecular ion region of bromobenzene (mlz 156-159)has been used to perform initial characterization the ion gate.Figure 3A shows the nornlal molecular ion region of bromobenzene using a wide gate pulse, indicated by the gray box, to select
(10) B. A: Karataev, V. 1.: Shmikk, D. Zagulin. \'. A. Pis'ma ZhFiz. 1973, 37, 45-48.
(11) I-I.; Przewloka. M. Int. j. Mass Spc.ctrom. Ion Processes 1990, 96267-274.
(12) Bergmann, T.: Martin, T. P.: Schaber, I-I. Rev. Sci. 1989.349,
(13) Vlasak, P. R; Beussman, D. J.; Davenport, M. R.: Enkc, C. G.tn
(14) L. B. Basic Processes ofGaseous Electronics: Univeri:3iLy of CaliforniaPress: Berkeley, CA, 1961.
(15) Cravath, A M. Phys. Rev. 1929,33, 605-513(16) Bradbury, N. E.; Nielsen. R A. Rev. 1936.49, 388-393.(17) Weinkauf, R; Walter, K; c.; BocsL U.; Schlag, E. Z.
Naturforsch. 1989, 44a, 1219-1225.
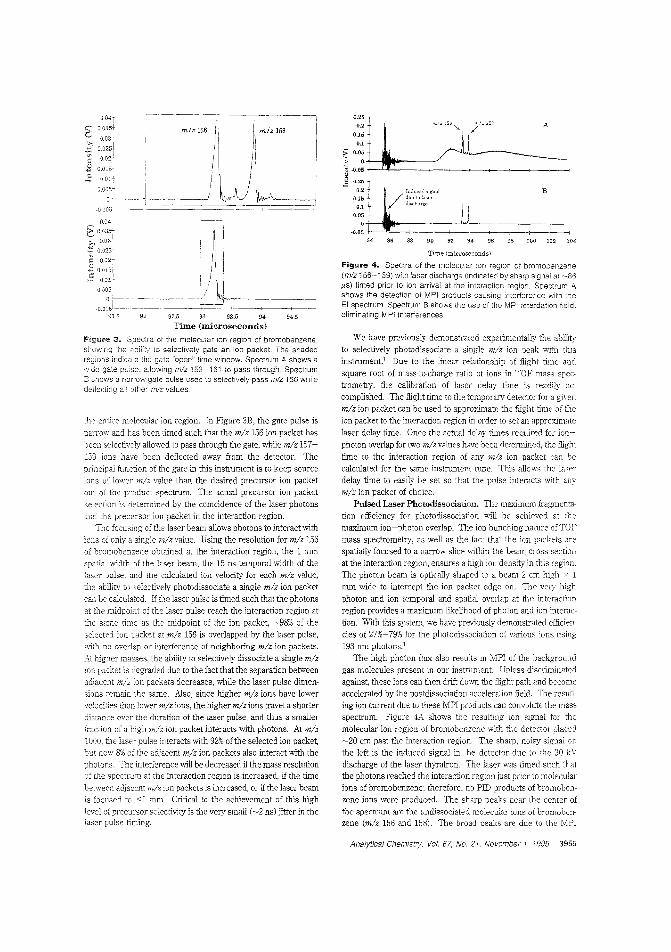
91.5 92 92.5 93 93.5 94 94.5
Time (microseconds)
Figure 3. Spectra 0'[ the molecular ion regbn of bromobenzene,showing the ability io selectively gate an ion packet. The sradedregions indicate the gate "open" time wincow. Spectrum A. shows awoe gate pUise, aHowing m/z 153-161 to pass through. SpectrumB shows a narrow gate pulse used io selectively pass mlz 156 whiledeilecting ali othe' m/z values.
the entire molecular ion region. In Figure 3B, the gate pulse is
narrow and has been timed such that the mlz 156 ion packet has
been selectively allowed to pass through the gate, while mlz 157159 ions have been deflected away from the detector. The
plincipal function of the gate in this instrument is to keep source
ions of iower mlz value than the desired precursor ion packetout of the product spectrum. The actual precursor iOll packet
sfiection is detennined by the coincidence of tbe laser photons
and the precursor ion packet in the interaction region.
The focusing of the laser beam allows photons to interact with
ions of only a single mlz value. Using the resolution for mlz 156of bromobenzene obtained at the interaction region, the 1 mm
spatial width of the laser beam, the 15 ns temporal width of the
iaser pulse, and the calculated ion velocity for each mlz value,
the ability to selectively photodissociate a single mlz ion packet
can be calculated. If t"te laser pulse is timed such that the photons
at the midpoint of the laser pulse reach the interaction region at
same time as the midpoint of the ion packet, ~98% of the
selected iOll packet at mlz 156 is overlapped by the laser pulse,
with no overlap or interference of neighboring m/z ion packets.
At higher masses, the ability to selectively dissociate a single mlzlaD packet is degraded due to the fact that the separation between
adjacent mlz ion packets decreases, while the laser pulse dimen·
sions remain ',he same. Also, since higher mlz ions have lowervelocities than lower mlz ions, the higher mlz ions travel a shorter
distance over the duration of the laser pulse, and thus a smaller
fraction of a 11igh mlz ion packet interacts with photons. At mlz1000, the laser pulse interacts with 92% ofthe selected ion packet,
but now 8% of the adjacent mlz ion packets also interact with the
photons. The interference wili be decreased if the mass resolutionof the spect111m at the interaction region is increased, if the time
between adjacent m/z ion packets is increased, or if the laser beam
is focused to < 1 mm Critical to the achievement of this high
ievel of precursor selectivity is the very small (~2 ns) jitter in thelaser pulse timing.
B
0, I ,., 94 96 98 100 102 104
0.
25il~:~j '2C~_'@-O.05 - ~:5 o:~u 1"',"0'''01
015 / due to laser01 dlsclurge
005
o ....-----~·005 --1,---1,---1--+--+--+---;----...,
84 86 88 90
Time (microseconds)
We have previously demonstrated experimentally the ability
to selectively photodissociate a single mlz ion peak with this
instrumentl Due to the linear relationship of flight time and
square root of mass-to-charge ratio of ions in TOF mass spec
trometry, the calibration of laser delay time is readily ac
complished. The flight time to the temporary detector for a given
mlz ion packet can be used to approximate the flight time of the
ion packet to the interaction region in order to set an approximate
laser delay time. Once the actual delay times required fer ion
photon overlap for two mlz valnes have been determined, the flight
time to the interaction region of any mlz ion packet can becalculated for the sanle instrument tune. This allows the laser
delay time to easily be set so that the pulse Interacts with any
mlz ion packet of choice.
Pulsed Laser Photodissociation. The m2Ximum fragmentation efficiency for photodissociation will be achieved at the
maximum ion~photon overlap_ The ion bunching nature afTOF
mass spectrometry, as well as the fact that the ion packets are
spatially focused to a narrow slice within the beam cross section
at the interaction region, ensures a high ion density in this region.The photon beam is optically shaped to a beam 2 em high x 1
mm wide to intercept the ion packet edge on. The very highphoton and ion temporal and spatial overlap at the interaction
region provides a maximum likelihood of photon and ion interac
tion. With this system, we have previously demonstrated efficien
cies of 27%-79% for the photodissociation of various 'ons using193 nm photons.1
The high photon flux also results in MPI of the background
gas molecules present in our instnJment Unless discriminated
against, these ions can then drift down the flight path and become
accelerated by the postdissociation acceleration field. The resulting ion current due to these MPI products can convolute the mass
spectrum. Figure 4A shows the resulting ion signal for the
molecular ion region of bromobenzene with the detector ulaced
~20 cm past the interaction region. The sharp, noisy signal on
the left is the induced signal in the detector due to the 30 kV
discharge of the laser thyratron. The laser was timed such thatthe photons reached the interaction region just prior to molecularions of bromobenzene: therefore, no PID products of bromobon
zene ions were produced. The sharp peaks near the center of
the spectrum are the undissociated molecular ions of bromobenzene (mlz 156 and 158). The broad peaks are due to the MPI
Figure 4~ Spectra of the molecular ion region of bromotenzene(m/z 156-159) with iaser dischacge (iodicated by sharp sigoal at ~86jls) timed prior to ion arrival at the interaction cegion. Spectrum Ashows the detection of MPI products causing interfererce with theEI spectrum. Spectrum B shows the use of the MPI retardation field.eliminating MPI intenerences.
mlz 158mlz 156
Analytical Chemlst'Y, Vol. 67, No. 21, November 1. 1995 3955
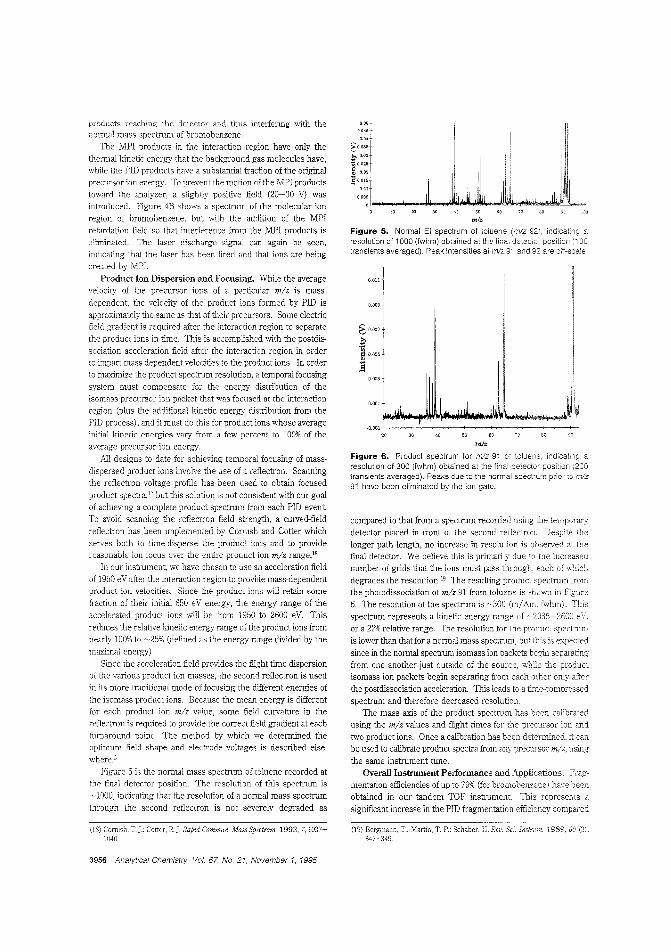
9C
III1, ",Iul0.001
0.003
-o.oOl1-I~~~':"""~~~~~~~~~-~~-~~-
20
0.05T
~:::;tI.?;-0.03
·~O.025
! 0.021
,.90.015TO.OJ
mi.
Figure 6. Product spectrum for mlz 91 of toluene. indicatn9 aresolution of 300 (fwhm) obtained at the final detector position (200transients averaged). Peaks due to the normal spectrum priol- to m/z91 have been eliminated by the ion gate.
~0.007
~
.~ 0.005
'":s
OOll t0.009
1
Figure 5. Normal EI spectrum of toluene (mlz 92). indicatng aresolution of 1000 (fwhm) obtained at the final detectm position (100transients averaged). Peak intensities at m/z 91 and 92 are off-scale.
compared to that from a spectrum recorded using the temporary
detector placed in front of the second reflectron. Despite thelonger path length, no increase in resolution is observed at thefinal detector. We believe this is primarily due to the increasednumber of grids that the ions must pass through, each of which
degrades the resolution. 19 The resulting product spectrum fromthe photodissociation of mlz 91 from toluene is showTI in Figure
6. The resolution of the spectrum is ~300 (m/L'.m. fwhm). This
spectrum represents a kinetic energy rarge of -2035-2600 eY.or a 22% relative range. The resolution for the proollct spectrum
is lower than that for a normal mass spectrum. but this is expected
since in the normal spectrum isomass ion packets begin separatingfrom one another just outside of the source, while the productisomass ion packets begin separating from each other only after
the postdissociation acceleration. This leads to a time-compressed
spectrum and therefore decreased resolution.The mass axis of the product spectrum has been calibrated
using the mlz values and flight times for the precursor ion and
two product ions. Once a calibration has been determined, canbe used to calibrale producl spectra from any precursor mlz, using
the San1e instrument tune.Overall Instrument Perlormance and Applications. Frag
mentation efficiencies of up to 7!J% (for bromobenzene) have been
obtained in our tandem TOF instrument. This represents a
significant increase in the PID fragmentation efficiency compared
products reaching the detector and thus interfering with thenOlmal mass spectrum of bromobenzene.
The MPI prodncts in the interaction region have only the
thermal kinetic energy that the background gas molecules have,while the PID products have a substantial fraction of the originalprecursor ion energy. To prevent the motion cf the MPI productstoward the analyzer, a slightly pDsitive field (20-30 vi wasintroduced. Figure 4B shows a spectrum of the molecular ion
region of bromobenzene. but with the addition of the MPIretardation field so that interference from the MPI products iseliminated. The laser discharge signal can again be seen,indicating that the laser has been fired and that ions are beingcreated by MPL
Product Ion Dispersion and Focusing. While the averagevelocity of the precurscr ions of a particular mlz is mass
dependent, the velocity of the product ions formed by PID is
approximately the same as that of their precursors. Some electricfield gradient is required after the interaction region to separate
the product ions in time. TIlis is accomplished with the postdissociation acceleration field after the interacti·)n region in orderto impart mass-dependent velocities to the product ions. In order
to maximize the product spectrum resolution, a temporal focusing
system must compensate for the energy distribution of theisomass precursor ion packet that was focused at the interaction
region (plus the additional kinetic energy distribution from the
PID process), and it must do this for product ions whose averageinitial kinetic energies vary from a few percent to 100% of the
average precursor ion energy.
All designs to date for achieving temporal focusing of mass
dispersed product ions involve the use of a reflectron. Scanningthe reflectron voltage profile has been used to obtain focused
product spectra. 17 but this solution is not consistent with our goalof achieving a complete product spectrum from each PID eventTo avoid scanning the reflectron field strength, a curved-field
reflectron has been implemented by Cornish and Cotter whichser,es both to time-disperse the product ions and to providereasonable ion focus over the entire product ion m/z range. IS
In our instrument, we have chosen to use an acceleration field
of 1950 eV after the interaction region to provide mass-dependentproduct ion velocities. Since the product ions will retain some
fraction of their initial 650 eV energy, the energy range of the
accelerated product ions will be from 1950 to 2600 eV. This
reduces the relative kinetic energy range of the product ions fromnearly 100% to -25% (defined as the energy rcnge divided by the
maximal energy).
Since the acceleration field provides the flight time dispersionof the various product ion masses, the second reflectron is used
in its more traditional mode of focusing the different energies of
the isomass product ions. Because the mean energy is differentfor each product ion mlz value, some field curvature in thereflectron is required to provide the correct field gradient at each
turnaround point The method by which we determined theoptimum field shape and electrode voltages is described else
where.5
Figure 5 is the normal mass spectrum of toluene recorded atthe final detector position The resolution of this spectrum is
-1000, indicating that the resolution of a normal mass spectrum
through the second reflectron is not severely degraded as
(18) Cornish. T J; Cotter, R]. Rapid Commun. Mass Spectrom. 1993, 7, 1037!040.
(19) Bergmann, T; Martin, T P.: Schaber, H. Rev. Sci. Ius/rum. 1989,60 (3),347~349.
3956 Analytical Chemistry. Vol. 67. No. 21, November 1, 1995
\vith earlier results obtained in an ion cyclotron mass spectrometer'" The efficiencies obtained in this instrument are comparableLU those obtained using CID in a triple quadrupole mass specTrometer. 21
Unit mass resolution to at least m/z 300 has been demonstratedfor all components of the tandem TOF mass spectrometer. This
is not a theoretical limit, but one that can be improved "ith furtherdesign refinements. Even the current resolution allows for boththe selection of a single m/z ion packet for further fragmentationand dIe collection of resolved product spectra over the entire massrange. Since the instrument voltages do not need to be adjustedduring an experimeilt, and since the photodissociation process isefnc.ent, a full product spectrum of any m/z can be obtained foreach ion extraction from the source.
In the analytical application of this instrument, a laser with arepetition rate of 200 Hz will be used, allowing up to 200 productspectra to be produced each second. With the incorporation ofan integrating transient recorder like that developed at MichiganState University," the continuous acquisitioil and storage of thesespectra will be feasible. This will allow full MS/MS data to becollected on the time scale of a component elution from a gasChromatograph.
D.: Delbert, 5.S: McIver, R. T., Jr. Anal. Chem. 1986, 58.
En!,c, C. G.: McG'lvery, D. c.; Smith, D.; Monisur:,]. D. Inl.].
fall Phys. 1979,30,127-136.(22) F.: Newccmbe, B.; Teck:enburg, R. E.,]r.; Daver.port, M.: .CI..Iiison,
]. T.: Enke, C. G. Rev. Sci. lnstrnm. 1991. 62, 69-75.D.: Vlasak, P. R.; Beuss01<·.n, D.].; Enke, C. G.~ Watson,]. T.of tiw 42i!d ASMS (O?;{erclice on Mass Spectrometry and Allied
Tobies: IL, June 2, 1993; p 1037(2'1) Ji, Q.: VIas",1\. P. R.: Holland,]. F.; Enke, C. G. Proceedings ofthe 42ndASMS
Confcrclnc on )vlu~' Spectrometry and Allied TIJpics: Chicago, IL, june 2. 1993;
p 1042.
This instrument is also proving to be an ideal platform forstudying the photodissociation of small ions. Laser wavelengthand pulse energy can be varied to determine the effects on thefragmentation process. Also, the structural usefulness oj theproduct ions can be detennined and compared with those obtainedusing CID in other tandem mass spectrometers. This will allowfor a determination of the analytical utility of photodlssociatian
as a fragmentation method in MS/MS.We intend also to increase the mass range of ions introduced
into our tandem mass spectrometer by eitber replacing the E[source with a MAUlI source,·l or using a novel ion trap source,being built by our group," to attach an electrospray source to aTOF mass spectrometer. Since the energy imparted to an iOll bya photon is independent aithe iOil's mass (unlike in eID, wherethe imparted energy decreases with increasing ion mass). PIDmay prove to be an advantageous fragmentatioil technique forhigh-mass ions. The implementation of the above sources willallow this to be investigated.
ACKNOWLEDGMENTWe gratefully acknowledge the National Institutes of Health
for supporting this work (NIH GM 44077). H. Wollnik madeseveral valuable suggestions du.ring the initial design phase ofthis work. M. Rabb did mu.ch of the electronics system designand construction.
Received for review March 23, 1995. Accepted August 10,1995.°
AC9502880
~ Abstract publis;lwo iT' Ad1.IQ;U(! ACS Abstracts, September 15, 1995.
Analytical Chemistry. Vol. 67, No. 21, November 1, 1995 3957
Anal. Chem. 1995, 67, 3958-3964
Electrospray as a Controlled-Current ElectrolyticCell: Electrochemical Ionization of NeutralAnalytes for Detection by Electrospray MassSpectrometry
Gary J. Van Berkel* and Feimeng Zhout
Chemical and Analytical Sciences Division, Oak Ridge Nationai Laboratory, Oak Ridge, Tennessee 37831-6365
In this paper an electrospray ion source is shown to be acontrolled-current electrolytic flow cell which, when operated so that three key requirements are met, can be usedfor efficient neutral analyte ionization (i.e., completeanalyte electrolYsis) and sensitive gas-phase detection(i.e., minimized gas-phase signal suppression) in electrospray mass spectrometry (ES-MS). These three requirements are as follows: (1) the magnitude of the EScurrent, iES, must be sufficient for the oxidization of themolar equivalent of all species available for reaction inthe ES capillary that are as easily or more easilY oxidizedthan the targeted analyte, including all of the analyte; (2)the analyte must be available for reaction at the metal/solution interface in the ES capillary; and (3) the stepstaken to ensure the first two requirements must not inhibitthe formation of gas-phase ions from the ions generatedelectrolytically in solution. The means to meet theserequirements are discussed, including the addition of anappropriate electrolyte to the electrosprayed solutions(e.g., lithium triflate), the use of slower flow rates (e.g.,5.0 vs 40 pUmin), and the use of a platinum capillary inthe ES device, rather than the more commonly usedstainless steel capillary. Neutral metallocenes, metalloporphyrins, and polycyclic aromatic hydrocarbons areused as the model compounds. Operation of the ES ionsource in the manner described e"..pands the neutralcompound types amenable to low level detection by ESMS to include even those that are relatively difficult tooxidize (i.e., E > 1.0 V vs SeE) and, therefore, alsoexpands the universality of ES as an ionization source.From the electrochemical point of view, this operation ofthe ES ion source might be viewed as a means to providemolecular weight information, and possiblY the structure,for the ionic products formed during a controlled-currentelectrolysis experiment.
As a means to further the analytical utility of electrospray massspectrometry (E5-MS),1 many recent fundamental investigationshave been aimed at obtaining definitive descriptions of the variousprocesses in ES that lead ultimately to the generation of gas-phaseions.:;';-'-- Hi Along these lines, we have focused on understanding
Current address: of Chemistry, University oJ Wisconsin-EauClaire, Eau Claire, WI
(1) Kcbark, P.: Tang. L. Anal. Chern. 1993, 65, f172A-986A
(2) Ikonomou, M. G.: Blades, AT.: Kebarle, P. AnaL. Chem. 1991. 63, 19891998.
3958 Analytical Chemistry, Vol. 67, No. 21, November 1, 1995
the electrolytic process,"-19 originally described by Kebarle and
co-workers.2.3 that is inherent to the operation of the ES ion source.This electrolytic process maintains charge balance in the ESdevice, necessitated by the selective loss of one ion polarity in
the charged ES droplets, via oxidation/reduction of the excessions in the ES capillary or via creation of ions of tho appropriatepolarity, or both.
Our study of the electrolytic nature of ES has been motivated,in part, by the desire to exploit the process for analytical purposes.In particular, we have focused on determining the means by whichthe electrolysis process could be used to oxidize (positive ionmode) or reduce (negative ion mode) certain types of neutralanalytes (e.g., aromatics and other highly conjugated systens),thereby forming their respective E5-active cations anions." 19
Reports from our group17-21 and a few other groups22-25 have
demonstrated that the electrolysis process in ES Can be used toionize neutral analytes in solution and that these ionized analytes(if relatively long-iived in solution) can be detected in the gas
(3) Blades, A, T.: lkonomou. M. G.: Kebarlc, P.Anai. Chern. 1991, 63, 21092114
(4) L Kebarle. P, Annl. CJum. 1991. 63. 2709-2715.(5) A; Bruins, A P. Rapid Commun. Mas., Spec/roi'!:'. 1991, 5,2W-
275.(6) Guevremont, R; Siu, K W. M.; Le Blanc,]. C. Y.; Bl'rman. S. S.]. Soc.
Mass 1992.3,216-224.(7) B. ]. Am. Soc. Mass Spectrom. 1993, 4,(8) Tang, L; Kebarle, P. Anal. Chern. 1993, 65. 3654-:3668(9) Siu, K. w. M.; Guevremont, R; Le Blanc]. C. VBlie:;, T.; Bennan,
S. S. Mass Spectrom. 1993. 28, 579~584.(10) Am. Soc. Mass Soectrom. 1993, ,,1.(11) Kostiainen. R; Bruins, A P. Rapid Commun. Mass 5.occtrom. 1994.3.
558.(12) Wang. G.: Cole, R. B. Anal. Chern. 1994, 66, ~;702-37CF.
(13) Le Blanc, l C. Y; Wang, l: GuevremeonL R.: K (JIg.
Spectrom. 1994, 29, 587-593(14) GatLn, C. L.; Tun:(~ek, F. A,Wr Cnem. 1994.66,(15) Hagar, D. B.; Dovichi, N.].; Klassen,,l.; Kebarlc, P.Ana!. 1994·.66.
3944-3949.(16) Wilm, M. S.: Mann, M. lilt.]. tv!ass Spectrom, 1011 Pyoccs.,cs 1994. 136,
180.(17) Van Berkel, G. J: McLuckey, S. A; Glish, G. 1.. Ana!. 1992. 64.
1586-1593.(18) Van Berkel, G. ].; Zhou, F. Alial. Chon. 1995, 67. 2916-:!923.(19) Van Berkel, G.].; Zhou, F.]. Am. Soc. Mass Speclrom., in press.(20) Zhou, F.; Van Berkel, G.].]. Am. Chem. Soc. 1994,116.5485-:3485.(21) Zho'l, F.; Van Berkel, G. J, Anal. Clwn. 1995. 3643-;)649.(22) Xu, X,; Nolan, S. P.; Calc, R B. Anal. Chem. 1994. 66,(23) Dupont, A; Gisselbrechl, J,-P.; Leize, E.; Wagncr, L.: Dorssc1aer. A
Tetrahedron Lett. 1994,35, E083-6086.(24) Liu, T.-Y.: Shiu, L.-L.; Luh, T.-Y.: Her, G.-R. Rapid Commu1i. Mass SfJectrom
1995, 9, 93-96.(25) Bond, A. M.; Colton, R.; D'Agnostino, A.; Downard, A Traeger. .L C
Anal. Chern. 1995,67, 1691-1695.
0003-2700j95/0367~3958$9.00jO © 1995 American Chemical Society
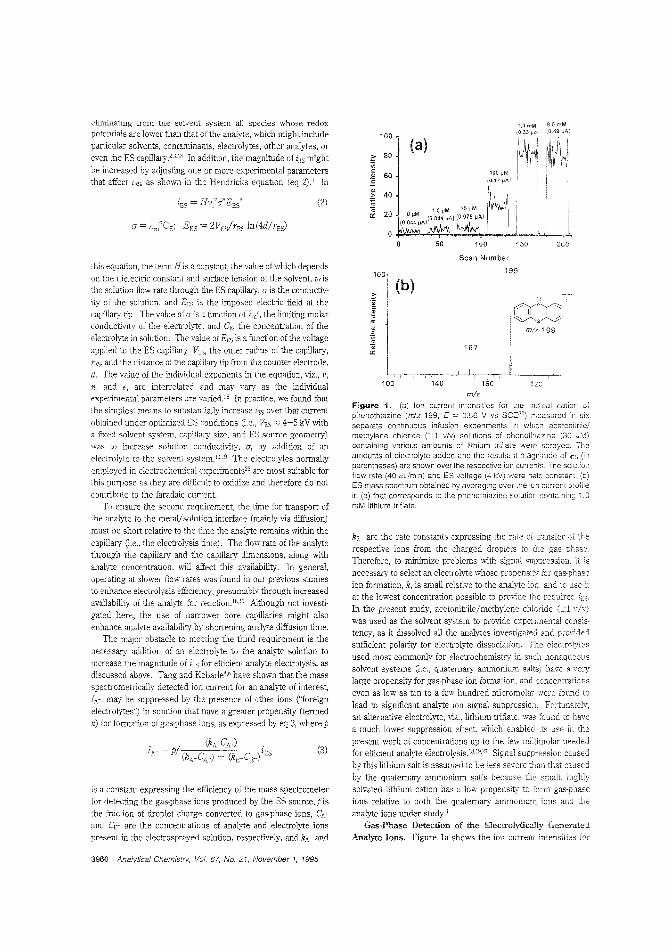
eliminating from the solvent system all species whose redoxpotentials are lower than that of the analyte, which might include
particular solvents, contaminants, electrolytes, other analytes, oreven the ES capillary.'·"·1S In addition, the magnitude of iES might
be increased by adjusting one or more experimental parametersthat aflect iES, as shown in the Hendricks equation (eq 2).1 In
(2)
100
C 80'Vi~
602E~
40~OJ
20'"
mlz
Figure 1. (a) Ion current intensities for the radical cation ofphenothiazine (niz 199, E = 0.56 V vs SeE30) measured SiX
separate continuous infusion experiments in which acetonitrile!methylene chloride (1:1 v/v) solutions of phenothiazine (3Ccontaining various amounts of lithium trifiate were sprayed. Theamounts of electrolyte added and the resultant magnitUde of IES
parentheses) are shown Qverthe respective ion currents. The sclutionflow rate (40 ,uUmln) and ES voltage (4 kV) were helei constant. (b)ES mass spectrum obtained by averaging over the ion current pmfiieIn (a) that corresponds to the phenothiazine solutior, containing 1.0mM lithium trlflate.
200150100
Scan Number
so
(b)
kE- are the rate constants expressing the rate of transfer the
respective ions from the charged droplets to the gas phase.Therefore, to minimize problems with signal suppression, it is
necessary to select an electrolyte whose propensity for gas-phaseion formation, k, is small relative to the analyte ion, and to use
at the lowest concentration possible to provide the requiredIn the present study, acetonitrile/methylene chloride (1:1
was used as the solvent system to provide experimental consis~
tency, as it dissolved all the analytes investigated and provided
sufficient polarity for electrolyte dissociation. The electrolytes
used most commonly for electrochemistry in such nonaqueoussolvent systems (i.e., quaternary ammonium salts) have a verylarge propensity for gas-phase ion formation, and concentrations
even as low as ten to a few hundred micromolar were found to
lead to signiiicant analyte ion signal suppression. Fortunately,
an alternative electrolyte, viz., llthium trit1ate. was found to have
a much lower suppression effect. which enabled its use in the
present work at concentrations up to the few millimolar neededfor efficient analyte electrolysis.i8,19.'] Signal suppression caused
by this lithium salt is assumed to be less severe chan that caused
by the quaternary ammonium salts because the small. highlysolvated lithium cation has a low propensity to form gas-phase
ions relative to both the quaternary ammonium ions and the
analyte ions under study.:Gas-Phase Detection of the ElectrolyticaJ.1y Generated
Analyte Ions, Figure 1a shows the iOll current intensities for
(3)
this equation, the teim H is a constant, the value of which depends
on the dielectric constant and surface tension of the solvent, Vf isthe solution flow rate through the ES capiilary, a is the conductiv
ity of the solution, and EES is the imposed electric field at the
capillary tip. The value of a is a function of A,n", the limiting molarconductivity of the electroiyte, and CE, the concentration of the
electrolyte in solution. The value of EES is a function of the voltage
applied to the ES capillary, VES, the outer radius of the capillary,and the distance of the capillary tip from the counter electrode,
d. The value of the individual exponents in the equation, viz., v,
n, and E, are interrelated and may vary as the individualexperimental parameters are varied. 18 In practice, we found that
the simplest means to substan dally increase iES over that current
obtained under optimized ES conditions (i.e., VES '" 4-5 kV witha !'xed solvent system, capillary size, and ES source geometry)
was to increase solution conductivity, a, by addition of an
electrolyte to the solvent system. IS.l9 The electrolytes normally
employed in electrochemical experiments21i a"e most suitable forthis purpose as they are difficult to oxidize and therefore do notcontribute to the faradaic cun-ent.
To ensure the second requirement, the time for transport ofthe analyte to the metal/solution interface (mainly via diffusion)
must be short relative to the time the analyte remains within the
capillary (i.e., the electrolysis time). The flow rate of the analytethrough the capillary ~md the capillary dimensions, along with
analyte concentration, "ill affect this availability. In general,operating at slower flow rates was found in our previous studiesto enhance electrolysis efficiency, presumably through increasedavailability of the analyte for reaction.iS,J') Although not investi
ga:ed here, the use of narrower bore capillaries might alsoenhance analyte availability by shortening analyte diffusion time.
The major obstacle to meeting the third requirement is the
necessary addition of an electrolyte to the analyte solution toincrease the magnitude of iES for efficiem analyte electrolysis, asdiscussed above. Tang and Kebarle'·8 have shown that the massspectrometrically detected ion current for an analyte of interest,
may be suppressed by the presence of other ions ("foreign
electrolytes") in solution that have a greater propensity (termed
k) for formation of gas-phase ions, as expressed by eq 3, where p
is a constant expressing the efficiency of the mass spectrometerfor detecting the gas-phase ions produced by the ES source,/is
the fraction of droplet charge converted to gas-phase ions, CA'"and CE- are the concentrations of analyte and electrolyte ions
present in the electrosprayed solution, respectively, and kA~ and
3960 Analytical Chemistry. Vol. 67, No. 21, November 1, 1995
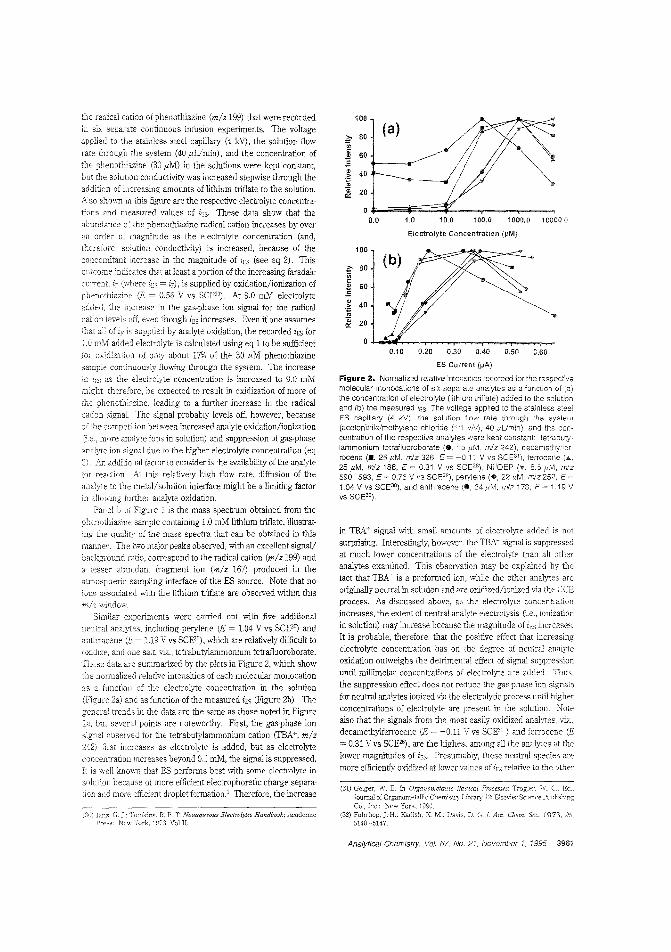
Electrolyte Concentration (lJM)
EeL
DAD 0,50 0,60
Radical Processes;
0,10 0,20 0,30
100
~ 80'iiic2l 60E
" 40>';
"(ij 200::
100
~ 80(a)
'iiic" 60E" 40,~...(ij 200::
00,0 1,0 10.0 100,0 1000,0 100000
(31) Geiger. W. E. In
ES Current (~A)
Figure 2. Normalized relative intensities recorded for the respeet'lvemolecular mo~ocations of six separate analytes as a function of ,:Q)the concentration of electrolyte (lithium triflate) added to the solutionand (b) the measured IES, The voltage applied to the stainless steelES capillary (4 kV), the solution flow rate the system(acetonitrile/methylene chloride (1:1 V/v) , 40 anj the con-centration of the respective analytes were keDt constant: tetrabutylammonium tetrafluoroborate (e, 15flM, miL 242), decamethyiterrocene (_, 25 pM, mlz 326, E = -0.11 V vs SCE"), ferrocene (A.
25 I'M, m/z 186, E = 0,31 V VS SCE26), Ni"OEP ('0', 8.5 ,11M, m/z590-593, E = 0,73 V VS SCE3'), pen;lene (+, 2211M, m/z 252, E =1.04 V vs SCE30), and anthracene (*, 34 pM, mlz 178, E = i .19 V
vs SCE"),
in TBA+ signal with small amounts of electrolyte added is notsurprising, Interestingly, however, the TBN signal is suppressedat much lower concentrations of the electrolyte than all otheranalytes examined. This observation may be explained by thefact that TBA' is a preformed ion, while the other analytes areoriginally neutral in solution and are oxidized/ionized via the eeEprocess_ As discussed above, as the electrolyte concentrationincreases, the extent of neutral analyte electrolysis (J.e., ionization
in solution) may increase because the magnitude of i"" increases.It is probable, therefore, that the positive effect that increasingelectrolyte concentration has on the degree of neutral analyteoxidation outweighs the detrimental effect of signai suppressionuntil millimolar concentrations of electrolyte are added, Thus,the suppression effect does not reduce the gas-phase ion signais
for neutral analytes ionized via the electrolytic process until higherconcentrations of electrolyte are present if the solution, Notealso that the signals from the most easily oxidized analytes, viz"decamethylferrocene (E = -0,11 V vs SCE,I ) and felTocene (E
0.31 V vs SCE26) , are the highest among ali the analytes at thelower magnitudes of i Es, Presumably, these neutral species aremore efficiently oxidized at lower values of i ES relative to the other
the radicai cation of phenothiazine (m/z 199) that were recorded
in six separate continuous infusion experiments, The voltageapplied to the stainless steel capillary (4 kV), the solution flowrate through the system (40 pL/min), and the concentration of
the phenothiazine (30 I"M) in the soiutions were kept constant,but the solution conductivity was increased stepwise through theaddition of increasing amounts of lithium trif1ate to the solution,Also shOVl11 in this figure are the respective electrolyte concentrations and measured values of These data show that theabundance of the phenothiazine radical cation increases by overan order of magnitude as the electrolyte concentration (and,thereiore, soiution conductivity) is increased, because of theconcomitant increase in the magnitude of iES (see eq 2), Thisoutcoene indicates that at least a portion of the increasing faradaicCUTent, (where = iF), is supplied by oxidation/ionization ofphenothiazine (E ~ 0,56 V vs SeE30) , At 9,0 mM electrolyte
added, the increase in the gas-phase ion signal for the radicalcation levels off, even though i ES increases, Even if one assumes
that ail of iF is supplied by analyte oxidation, the recorded i ES for1.0 mM added electrolyte is calculated using eq 1 to be sufficient
for oxidization of only about 17% of the 30 I"M phenothiazinesample continuously flowing through the system. The increasein as the electrolyte concentration is increased to 9.0 mMmight therefore, be expected to result in oxidization of more ofthe phenothiazine, ieading to a further increase in the radical
cacion signaL The signal probahly levels off, however, hecauseof the competition between increased analyte oxidation/ionization(Le., more andyte ions in solution) and suppression of gas-phase
amlyte ion signal due to the higher electrolyte concentration (eq3), An additirnai factor to comider is the availability of the analyte
reaction. At this relatively high flow rate, diffusion of the
analyte to the metal!solution interface might be a limiting factorin allowing further analyte oxidation,
Panel b of Figure I is the mass spectrum obtained from thephenothiazine sample containing 1.0 mM lithium trif1ate, illustrating the quality of the mass spectra that can be obtained in thismanner. The two major peaks observed, with an excellent signal/background ratio, correspond to the radical cation (m/z 199) anda lesser abundant fragment ion (m/z 167) produced in theatmospheric sampling interface of the ES source, Note that noions associated Winl the lithium triflate are observed within thism/z window.
Similar experiments were camed out with five additionalneutral analytes, including perylene (E = 1.04 V vs SCpO) andanthracene (E = 1.19 V VS SCE30) , which are relatively difficult tooxidize, and one salt, viz" tetrabutylammonium tetrafluoroborate,'I11cse data are summatized by the plots in Figure 2, which show
normalized relative intensities of each molecular monocationas a hmction of the electrolyte concentration in the solution(Figure 2a) and as function of the measured ies (Figure 2h). Thegeneral trends ill the data are the same as those noted in Figurela, but severa] points are noteworthy. First, the gas-phase ionsignal observed for the tetrabutylammonium cation (I'BA+, m/z242) first increases as electrolyte is added, but as electrolyteconcentration increases beyond 0,1 mM, the signal is suppressed,It is well known that ES performs best with some electrolyte insolution because of more efficient electrophoretic charge separation and more efficient droplet fJrmation, I Therefore, the increase
0) ian;;:Pres,;"
Tomkins. R. P, T N01!Gqueous Electrolytc,s HandbO?k; Academic'y'ork, 1973, Vol II.
Co., Inc.: New York, 1990.(32) FuhrhoIJ, J.-H.; Kadish, K. M.: Davis, D. G. .f. Am. Chern. Soc. 1973,
5140-5147.
Analytical Chemistry, '10/, 67, No, 21, November 1, 1995 3961
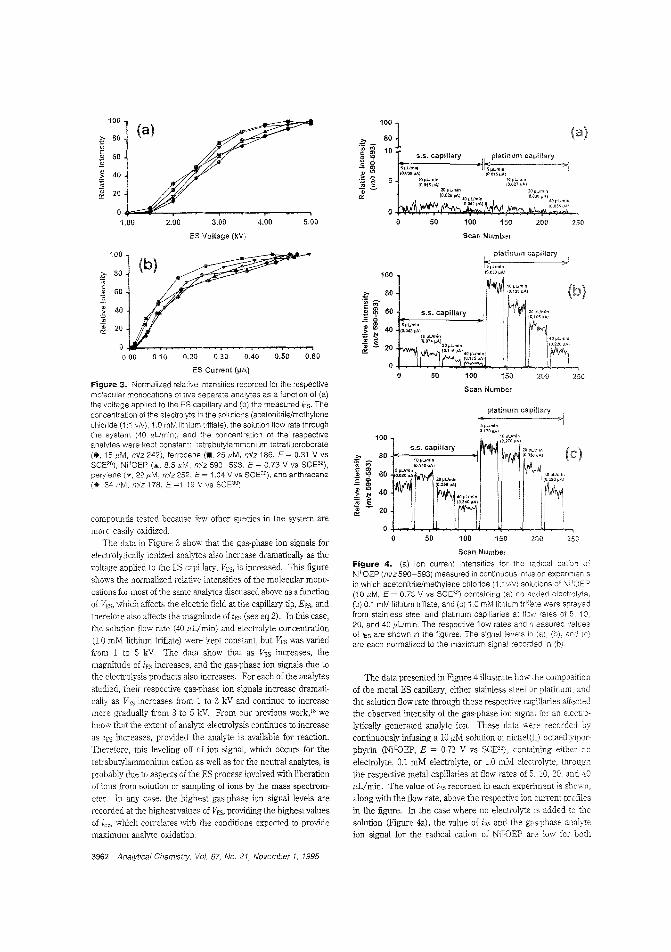
100
Z- 80';;;r::
602oS. 40.~0;ill 20cr:
01.00 2.00 3.00
ES Voltage (kV)
4.00 5.00 250
Scan Number
Scan Number
Figure 4. (a) Ion current intensities for tile radical cation 01NiliOEP (m/z 590-593) measured in continuous infusion experimentsin which acetonitrile/methylene chloride (1 :1v/v) solulions of Ni"OEP(10 I'M, E = 0.73 V vs SCE") containing (a) 110 added electrolyte.(b) 0.1 mM lithium triflate, and (c) 1.0 mM lithium triflaie were sprayedfrom stainless steel and platinum capi1'aries at flo\lv rates of 5, 10.20, and 40 I'Umin. The respective flow rates and measured valuesof iES are shown in the figures. The signal levels in (a), (b), and (c)are each normalized to the maximum signal recorded in (b).
The data presented in Figure 4 illustrate how the compositionof the metal ES capillary, either stainless steel or platinum. andthe solution flow rate through these respective capillades affectedthe observed intensity of the gas-phase ion signal for a,"] electrolytically generated anajyte ion. These data were recorded bycontinuously infusing a 10 I'M solution of nickel(lI) octaethyiporphyrin (Ni"OEP, E = 0.73 V vs SeE"), containing either no
electrolyte, 0.1 mM electrolyte, or 1.0 mM electrolyte, throughthe respective metal capillaries at flow rates of 5. 10, 20, and 40flL/min. The value of iES recorded in each experiment is ShO\','11,
along with the flow rate, above the respective ion current profilesin the figure. In the case where no electrolyte is added to thesolution (Figure 4a), the value of iEs and the gas-phase analyteion signal for the radical cation of NiIlOEP are low for both
250
250
200150
platinum capillary
1~f.lUmln 31(ll,OBOIlAI
100
Scan Number
50
100
Z- 80'iii
"r:: '" 602 '\'1: 0
" '"> '" 40:; ~
Qj .§. 200::
100
~-80
'" Mr:: '"S "1 60oS 0
'"" '" 40> ~~ .§.Qj 20cr:
100
Z- 80'wr::
602oS. 40>.~
ill 20cr:
compounds tested because few other species in the system are
more easily oxidized.The data in Figure 3 show that the gas-phase ion signals for
electrolytically ionized analytes also increase dramatically as the
voltage applied to the ES capillary, VES, is increased. This figureshows the normalized relative intensities of the molecular monocations for most of the same analytes discussed above as a function
of Vi,s, which affects the electric field at the capillary tip, EES, andtherefore also affects the magnitude of iES (see eq 2). In this case,the solution flow rate (40,uLlmin) and electrolyte concentration(1.0 mM lithium triflate) were kept constant but VES was variedfrom 1 to 5 kV. The data show that as VES increases, themagnitude of iEs increases, and the gas-phase ion signals due tothe electrolysis products also increases. For each of the analytes
studied, their respective gas-phase ion signals increase dramatically as VES increases from 1 to 3 kV and continue to increasemore gradually from 3 to 5 kV. From our previous work," weknow that the extent of analyte electrolysis continues to increaseas h,s increases, provided the analyte is available for reaction.Therefore, this leveling off of ion signal, which occurs for the
tetrabutylammonium cation as well as for the neutral analytes, is
probably due to aspects of the ES process involved with liberationof ions from solution or sampling of ions by the mass spectrom
eter. In any case, the highest gas-phase ion signal levels arerecorded at fhe highest values of VES, providing the highest valuesof iES, which correlates ",ith the conditions expected to providemaximum analyte oxidation.
ES Current (~A)
Figure 3. Normalized relative intensities recorded for the respectivemo,'ecular monocations of five separate analytes as a function of (a)the voltage applied to the ES capillar; and (b) th8 measured iEs. Theconcentration of the electrolyte in the solutions (acetonitrile/methylenechloride (1:1 v/v), 1.0 mM lithium tritlate), the solution !low rate throughthe system (40 ,uUmin), and the concentration of the respectiveanalytes were kept constant: tetrabutylammonium tetrafluoroborate(., 15 ,liM, m/z 242), ferrocene (., 25 I'M, m/z 186, E = 0.31 V vsSCE'S), Ni"OEP (A, 8.5 I,M, m/z 590-593. E = 0.73 V vs SCES'),perylene (T, 22 ,uM, m/z 252, E = 1.04 V vs SeE30), and anthracene(+.34 ,uM. m/z 178, E=1.19 V VS SCE30).
3962 Analytical Chemistry, Vol. 67, No. 21, November 1, 1995
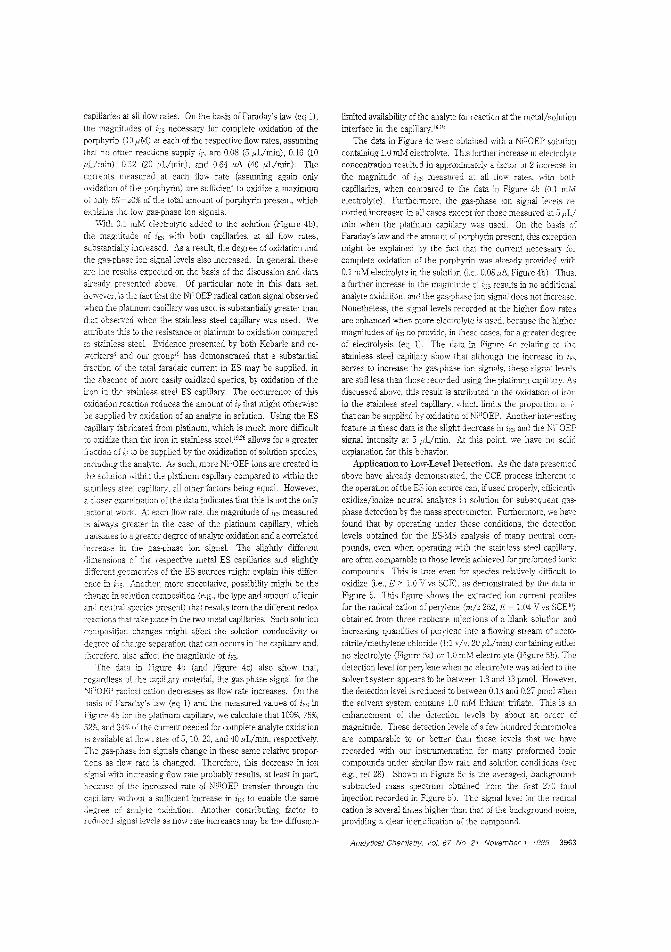
capiLaries at all flow rates. On the basis of Faraday's law (eq 1),
the magnitudes of iES necessary for complete oxidation of the
porphyrin (10 flM) at each of the respective flow rates, assuming
that no othe" reactions supply iv, are 0.08 (5 flL/min), 0.16 (10
flLlmin), 0.32 (20 flL/min), and 0.64 flA (40 IlL/min). The
CClrrents measured at each flow rate (assuming again only
oxidation of the porphyrin) are sufficient to oxidize a maximumof only 5%-20% of the total amount of porphyrin present, which
explains the low gas-phase ion signals.
With 0.1 mM electrolyte added to the solution (Figure 4b),
the magnitude of with both capillaries, at all flow rates,
substantially increased. As a result, the degree of oxidation and
the gas-phase ion signal levels also increased. In general, these
are the results expected on the basis of the discussion and data
already presented above. Of particular note in this data set,
however, is the fact tilat n,e Ni"OEP radical cation signal observed
when the platinum capillary was used is substantially greater than
that observed when the stainless steel capillary was used. We
atuibute this to the resistance of platinum to oxidation comparedto stainless steeL Evidence presented by both Kebarle and co
wxkers" and our group" has demonstrated that a substantial
fraction of the total faradaic current in ES may be supplied, in
the absence of more easily oxidized species, by oxidation of theiron in the stainless steel ES capillary. The occurrence of this
OJddation reaction reduces the amount of iF that might otherwise
be supplied by oxidation of an analyte in solution. Using; the ES
capillary fabricated from platinum, which is much more difficultto oxidize than the iron in stainless steel,'9.26 allows for a greater
fraction of iF be supplied by the oxidization of solution species,
including the analyie. As such, more NiI:OEP ions are created in
solution within the platinum capillary compared to within the
stainless steel capillary, all other factors being equaL However,
a closer examination of the data indicates that this is not the only
factor at work. At each flow rate, the magnitude of hcs measured
is always greater in the case of the platinum capillary, which
translates to a greater degree of analyce oxidation and a correiated
increase in the gas-phase ion signal. The slightly differentdimensions the respective metal ES capillaries and slightly
different geometries of the E3 sources might explain this differ
ence hiES. fmother, more speculative, possibility might be the
change in solution composition (e.g., the type and amount of ionic
and neutral species present) that results from the different redox
'Tactions that take place in the two metal capillaries. Such solution
composition changes might affect the solution conductivity or
cle,zree of charge separation that can occurs in the capillary and,
therefore, also affect the magnitude of !los.
The data in Figure 410 (and Figure 4c) also show that
regardless of the capillary material, the gas-phase signal for the
Ni"OEP radical cation decreases as flow rate increases. On the
basis of Faraday's law (eq 1) and the measured values of iES inFigure 410 for the platinum capillary, we calculate that 100%, 75%,
52%, ar,d 34% of the current needed for complete analyte oxidation
is available at How rates of 5, 10, 20, and 40 flL/min, respectively.
The gas-phase ion signals change in these same relative propor
tions as flow rate is changed. Therefore, this decrease in ionsignal 'Nith increasing flow rate probably results, at least in part,
because of the increased rate of Ni1iOEP transfer through the
capillary without a sufficient increase in iE, to enable the same
degree of analyte oxidation. Another contributing factor toreduced signalleve1s as flow rate increases may be the diffusion~
limited availability of the analyte for reaction at the metal/solutioninterface in the capillaryI8.n,
The data in Figure 4c were obtained with a NillOEP solution
contailling 1.0 mM electrolyte. This further increase in electrolyte
concentration resulted in approximately a factor of 2 increase in
the magnitude of measured at all flow rates, with both
capillaries, when compared to the data in Figure 4b (0.1 mM
electrolyte). Furthennore, the gas-phase ion signal levels re
corded increased in all cases except for those measured at 5,,,L/
min when the platinum capillary was used. On the basis of
Faraday's law and the amount of pcrphyrin present, this exception
might be explained by the fact that the current necessary for
complete oxidation of the porphyrin was already provided with
0.1 mM electrolyte inche solution (i.e.. 0.081'A Figure 4b) Thus,
a further increase in the magnitllde of iE, results in no additienal
analyte oxidation, and the gas-phase ion signal does not increase.
Nonetheless, the signal levels recorded at the higher flow rates
are enhanced when more electrolyte is used, because the higher
magnitudes of ics do provide, in these cases, for a greater degree
of electrolysis (eq 1). The data in Fignre 4c relating to the
stainless steel capillary show that although the increase in
serves to increase the gas-phase ion signals, these signa' levels
are still less than those recorded using the platinum capillary. Asdiscussed above, this result is arcributed to the oxidation of iton
in the stainless steel capillary, which limits the proportiun
that can be supplied by oxidation of NiIIOEP. Another interesting
feature in these data is the slight decrease in iI'S and the NillOEP
signal intensity at 5 uL/min. At this point, we have no solid
explanation for this behavior.
Application to Low-Level Detection. As the data presented
above have already demonstrated, the CCE process inherent to
the operation of the ES ion source can, if used properly, efficiently
oxidize/ionize neutral analytes in solution for subsequent gas
phase detection by the mass spectrometer. Furthem10re, we have
found that by operating under these conditions, the detection
levels obtained for the ES-MS analysis of many neutral com
pounds, even when operating with the stainless steel capillary.
are often comparable to those levels achieved [or preformed ioniccompounds. This is true even for species relatively difficult to
oxidize (I.e., E > LO vs SCE). as demonstrated by the data in
Figure 5. This figllre shows the extracted ion cun'ent profilesforthe radical cation of perylene (m/z 252, E = 1.04 V vs SCE"))
obtained from three replicate injections of a blank solution and
increasing quantities of perylene into a flo'iI'ing stream of acew
nitrile/methylene chloride (Ll v/v, 20 ilL/min) containing either
no electrolyte (Figure "a) or 1.0 mM electrolyte (Figure 5b). The
detection level for perylene when no electrolyte was added to the
solvent system appears to be between 1.3 and 13 pmoL However,the detection level is reduced to between 0.13 and 0.27 pmol when
the solvent system contains LO mM lithium triflate. 111is is an
enhancement of the detection levels by about an oreer of
magnitllde. These detection levels of a few hundred femtomoles
are comparable to or better than those levels that we have
recorded with our instrumentatior. for many preformed ionic
compounds under similar flow rate and solution conditions (seee.g., ref 28). Shown in Figure 5c is the averaged, hackground
subtracted mass spectrum obtained frOIT. the first 2'70 fmol
injection recorded in Figure 5b. The signal level for the radical
cation is several times higher than that of the background noise,providing a clear identification of the compDund.
Analytical Chemistry. Vol. 67. No. 21. November 1, 1995 3963
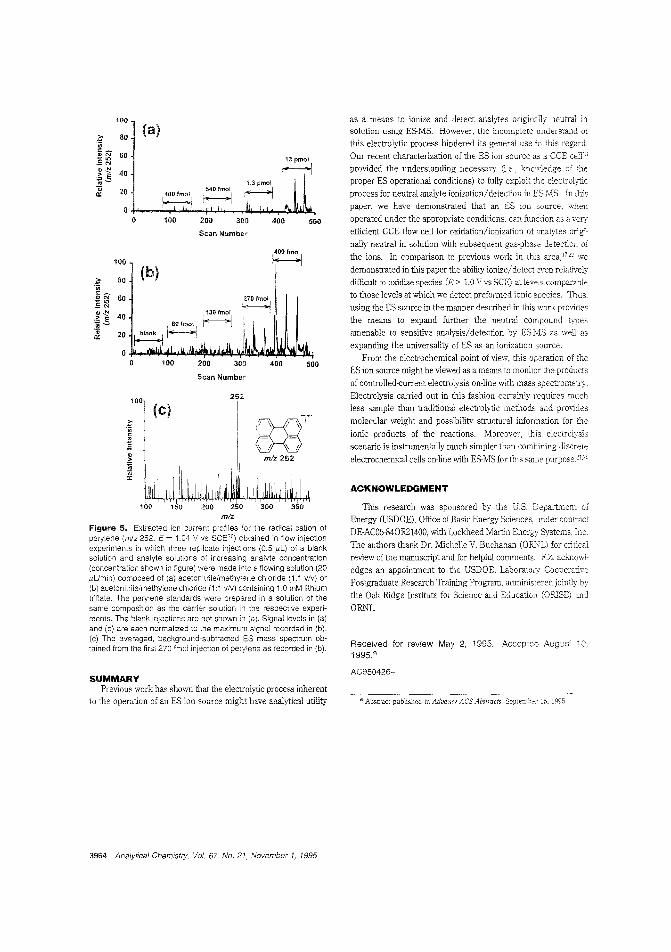
SUMMARYPrevious work has shown that the electrolytic process inherent
to the operation of an ES ion source might have analytical utility @ Abstract published in Advance ACS Abstracts. Seplembet IS. 1995.
This research was sponsored by the US Department of
Energy (USDOE), Office of Basic Energy Sciences, under contract
DE-AC05-840R21400, with Lockheed Martin Energy Systems, Inc.
The authors thank Dr. Michel1e V. Buchanan (ORl\lL) for critical
review of the mar.uscript and for helpful comments. F.Z. acknowl
edges an appointment to the USDOE, Laboratory Cooperative
Postgraduate Research Training Program, administered jointly by
the Oak Ridge Institute for Science and Education (ORiSE) and
ORNL.
Received for review May 2, 1995. Accepted August iC,i995.@
AC950426+
ACKNOWLEDGMENT
as a means to ionize and detect analytes originally neutral insolution using E5-MS. However, the incomplete understand of
this electrolytic process hindered its general use in this regard.
Our recent characterization of the ES ion source as a CCE ce1118
provided the understanding necessary (i.e., knowledge of the
proper ES operational conditions) to fully exploit the electrolytic
process for neutral analyte ionization/detection in ES-MS. In this
paper, we have demonstrated that an ES ion source, when
operated under the appropriate conditions. can function as a very
efficient CCE flow ce11 for oxidation/ionization of analytes origi
na11y neutral in solution with subsequent gas-phase detection of
the ions. In comparison to previous work in this area,17.22 we
demonstrated in this paper the abilily ionize/detect even relatively
difficult to oxidize species (E> 1.0 V vs SCE) at levels comparable
to those levels at which we detee! preformed ionic species. Thus.
using the ES source in the manner described in this work provides
the means to expand further the neutral compound types
amenable to sensitive analysis/detection by ES-MS as we11 as
expanding the universality of ES as an ionization source.
From the elee!rochemical point of view, this operation of the
ES ion source might be viewed as a means to monitor the products
of contro11ed-current electrolysis on-line with mass spectrometry.
Electrolysis carried out in this fashion certainly requires much
less sample than traditional electrolytic methods and provides
molecular weight and possibility structural information for the
ionic products of the reactions. Moreover, this electrOlysis
scenario is instrumentally much simpler than combining discrete
electrochemical cells on-line with ES-MS for this same purposen .",
350
13pmol
f--:j
400 500
300
252
I
I
Scan Number
150
(c)
100
100
100
i:' 80(3)
'in,,-~N 80-'"';;N~~ 40~SQi 20 540 fmola:: 400 fmol
~0~
0 100 200 300
Scan Numbe~·
100l~oofm~'1
i:' 80(b)
'in,,-<>N 60 12~70 1m:ll-'"';;N<>~ 130 fmol
~g40
SOrmal ~Qi 20 A~a::
00 100 200 300 400 500
200 250mlz
Figure 5. Extracted ion current profiles ior the radical cation ofper;lene (mlz 252. E = 1.04 V vs SCE30) obtained in flow Injectionexperiments in which three replicate Injections (0.5 .uL) of a blanksolution and analyte solutions of increasing analyte concentration(concentration shown in figure) were Clade into a flowing solution (20I,UClin) composed of (a) acetonitrile/methylene chloride (1:1 v/v) or(b) acetonitrile/methylene chloride (1:1 v/v) containing 1.0 mM lithiumtriflate. The perylene standards were prepared in a solution of thesame composition as the carrier solution in the respective experiments. The blank injections are not shown in (a). Signal levels in (a)and (b) are each normalized to the maximum signal recorded in (b).(c) The averaged, background-subtracted ES Class spectrum obtained from the first 270 fmol injection of perylene as recorded in (b).
3964 Analytical Chemistry, Vol. 67, No. 21, November 1, 1995
Anal. Chern. 1995, 67, 3965-3970
Direct Temperature Resolved HRMS ofFire·Retarded Polymers by In-Source PyMS on anExternal Ion Source Fourier Transform IonCyclotron Resonance Mass Spectrometer
Ron M. A. Heeren,* Chris G. de Koster, and Jaap J. Boon
FOM-Institute for Atomic and Molecular Physics, Krulslaan 407, 1098 SJ Amsterdam, The Netherlands
Rapid microscale analysis with high mass accuracy isdemonstrated by direct temperature resolved desorptionand pyrolysis from a Pt/Rh filament probe inside theexternal ion source of a 7-T meR-MS. High pressuregenerated during desorption and pyrolysis in the ionsource does not interfere with analysis in the hydrocarbonfree UHV of the ICR cell, thus allowing short observationcycles at high resolution. The typical conditions achieved,a mass resolution (m/&m)50% equals 50 000 atm/z 600with cycle times of 100 ms, were used to analyze isobariccompound mixtures generated by pyrolysis ofbromlnatedfire-retarded polymers spiked with antimony-containingsynergists. Unknown fire-retarded polymer blendssampled from household appliances were found to containbrominated biphenyls, brominated diphenyl ethers, tetra·bromoBispbenol-A and its butylated isomers, polystyrene,and antimony oxides. High-resolution temperatureresolved analysis by "in-source" pyrolysis mCR-MSconfirms the elemental composition. The resolution issufficient to separate the nominally isobaric ions from theantimony(IH) oxide (Sb406) synergist and the n-butylether derivative of tctrabromoBisphenol-A.
IdenlificatiGn of additives in compounded polymers is generallyraber difficult because of the wide variety of available substances.Complex additive mixtures will nonnally be present at quite low«1-5% w/w) concentrations compared to polymer and fillerlevels. Extraction of the additives from the polymer matrix is oftenr~qllired prior to chromatographic and spectroscopic analysis.Methods used for structural determination, separation, and quantitation of residual monomers and additives and determination ofthe molecular weight of polymers and additives include liquidchromatography, X-ray fluorescence, UV analysis, pyrolysis techniques, infrared and Raman spectroscopy, mass spectrometry,nuclear magnejc resonance spectroscopy, electron spin resonancespectroscopy. and thermal analysis.' Particularly, mass spectrometr! offers a sensitive and selective method for the analysis ofpolymer systems and is v.idely applied in this field of research.Laser desorption (LD) , laser-assisted pyrolysis, secondary ionmass spectrometry (SIMS), fast atom bombardment (FAB),plasma desorption (PD), and electrospray (£SI) ionization have
been used to detect and to identify various nonvolatile compoundsin polymers.'-;
,. Fax: "';'-31·20-:':;684L06. E-mail: [email protected]) Smi'.h. G. S.: Smith, P. B.; Paszto[, A L Jr.; McKdvy, M. L Meunier, D.
\II.; FroeEc:wr, S. Ellaboudy, A. S, Anal. Chou. 1993,65. 217R-243R.
0003-2700/95/0367-396589.00/::1 © 1995 American Chemical Society
Direct temperature resolved pyrolysis mass spectrometry(PyMS) has proven to be an analytical tool for fast analysis ofunknown mixtures of polymers and for the presence of flameretarding additivess ,', Employment of a !!hairpin-type" filamentpyrolysis probe in an in-source configuration provides fasterheating rates and exact knowledge of the temperature of thesample on the probe during the experiment. Only minimalamounts of sample, typically 1 f/-g, are necessary to obtain thetotal desorption/pyrolysis profiles. The hlgh heating rate contrasts to the more conventional DP'I1S techniques using a smalloven with a crucible inserted (or direct probe), where heatingrates are much slower and sample :emperature is dependent onthermal conductivity of the oven, the crucible, and both the IRabsorption coefficient and the thermal conductivity of the sample,especially when a large amount of sample is used. iG-j4 In-sourcefilament pyrolysis offers the possibility of studying the degradationcharacteristics of fire-retarding polymer blends as a function oftemperature with a minimal sample amount and minimal samplepretreatment1il6 Volatile molecules are thermally desorbed atthe low-temperature end; pyrolysis of macromolecules and evaporation of metals take place at the high end of the temperaturescale. Structural identification of unknown materials would befacilitated by perfonning accurate mass measurements of theirmolecular and fragment ions at high resolving power. If massmeasurement accuracy of 5-10 ppm or better is obtained,elemental compositions of fragment ions can usually be deter-
(2) Lattimer, R. P.; Ilimis, R. E. ivlass Sj:cdrum. Rev. 1985.4,369-390.(3) Lattimer. R P.; Hanis, E.: H..hcc, C. K.: Schulten, H.-R. Anal, Cacm. 1986,
58. 188-195.(4) Hsu, A. T,; Marshall, G. Anal. Chon. 1988,60, :);32-037.(.5) Asamoto, E.: Young,]. R; Citerin. R. ]. Aila!. Gem. 1990, 62, 61-70.(6) Johlman, C. L; Wilkins. C 1-.: Hogan, D.: Donavan. T. L.; Laude. D. A,
Jr.: Youssef!. M.-J. Aual. Chem. 1990, 62. 1167-1172(7) Creasy, W. R. 1992. 33, 44H6-4492.(8) B'Jol1 J. J. into f. Spectrom, Ion Processes 1992,118/119, i;,):)-7B7.(9) Luijk, R: Pureveen, J.; C~mlT.andeur, J Boon, J. J. Makromol. Chem.
Macromol. Symp. 1993,,74, 235-25L(10) Dumler, R.: Thorn". H.: knoil", D.; Hutzinger. O. Chemosphere 1986. 19,
2023-2031(11) Dumler, R: Lenoi" D.: ThoIT.<l, H,; Hutzinger, O. f. Anal. Appl. Pyrolysis
19R9. 76,153-158(12) Thoma, Ii.: l-Iauschulz. G.; KlOrr, E.: I-IutZ:nger, O. Chemosphere 1987,
16,277-285.(3) Hutzinger. 0.: Dumlec. R; Lenoir, Ted!, c.; Thoma. H. Chemosphem
1989.18.1235(14) DJmlcr. R.; Lenoir. D.; Thoma, f-r.: f-Iutzinger, O. Chemosphere 1990, 20,
1867-1873.(15) Luijk, R.: Wever. H.: Olic. K: Gaven;. f-I. A..L Boon,J.]' Chemosphere 1991,
23. 1173-1183.
(16) Luijk. R.: GOV<:'l"S, H. A .1.: Eijkel, G. B.: Boon. J. J..f. AnaL Appl. Pyrolysis1991. 20, 303-31~J.
Analytical Chemistry. Vol. 67, No. 21. November 1 1995 3965
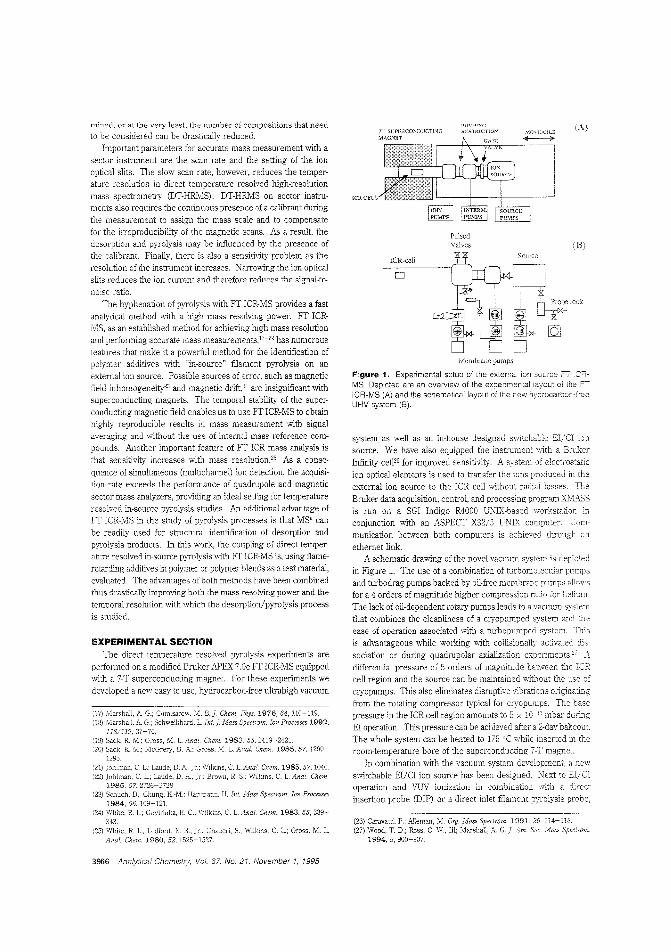
MGlIlbranc pumps
(AJ
1991, 26.514-518.A.. G.]. Am. Soc. Mass Spectrom
(26) Caravatti, P.; Alleman, M.(27) Wood, T. D.; Ross, C. W..
1994, 5. 900-907.
PulsedValves
Figure 1. Experimental setup of lhe external ion source FT tCRMS. Depicted are an overview of the iayout of the FTICR-MS (A) and the schemalicallayout the new hydrocarbon-freeUHV system (B).
system as well as an in-house designed s'kitohable EIICI ionsource. We have also equipped the instrumen- 'kith a B--uker
Infinity cell26 for improved sensitivity. A system electrostaticion optical elements is used to transfer the ions produced in theexternal ion source to the ICR cell without radial losses. TheBruker data acquisition, control, and processing program XMASSis run on a SGI Indigo R4000 UNIX-based workstationconjunction with an ASPECT X32j3 UNIX computer. Communication between both computers is achieved through an
ethernet link.A schematic dra'king of the novel vacuum system is depicted
in Figure 1. The use of a combination of turbomolecular pumpsand turbodrag pumps backed by oil-free membrane pumps allowsfor a 4 orders of magnitude higher compression ralio for helium.
The lack of oil-dependent rotary pumps leads to a vacuum systemthat combines the cleanliness of a cryopumped system and theease of operation associated with a turbopumped system. Thisis advantageous while working with collisionally activated dis
sociation or during quadrupolar axialization experiments."differential pressure of 5 orders of magnitude between the ICRcell region and the source can be maintained without the use ofClyopumps. This also eliminates disruptive vibrations originatingfrom the rotating compressor typical for cryopumps. The basepressure in the ICR cell region amounts to 5 x 10⁻¹' mbar duringEIoperation. Ths pressure can be achieved after a 2-day bal,eout.The whole system can be heated to 175 °C while inserted in theroom-temperature bore of the superconducting 7T magnet.
In combination with the vacuum system development, a news\vitchable EIICI ion source has been designed. Next to EIICIoperation and "VUV ionization in combination with a directinsertion probe (DIP) or a direct inlet filament pyrolysis probe,
(171 Marshall, A G.; Comisa:-ow, M. B.]. Chern. Phys. 1976,64,110-119.(18) Marshall, A G,; Schweikhard, L.Int. j. Mass Spectfom. Ion Processes 1992,
118/119.37-70.(19) Sack, R. M.; Gross, !VI, L. Anal, Chem. 1983,55,2419-2421.(20) Sack, R. M.: IVIcGrery, D. /'1..: Gross, M. 1. Aizal. Chem. 1985,57,1290
1295.(21) Johlman, C. 1.; Laude, D. A, Jr.; Wilkins, C. 1. Anal. Chern. 1985,57,1040.(22) Johlman. C. 1.; laude, D. Jr.; Brown, R. S.; Wilkins, C. 1. Anal. Chem.
1985,57,2726-2728(23) Schuch, D.; Chung, K.-M.; Hartmann, H. Int. Mass Spectrom. Ion Processes
1984.56. 109-121.(24) \Vhite, R. L.; Onyiriuka, E. c.; Wilkins, C. L. Anal. Chem. 1983,55,339
343.(25) VVhite, R. 1.; Ledford, E. B., ]r.; Ghaderi, S.; Wi1l\ins, C. L.; Gross, M. L
Anal. Chern. 1980,52,1525-1527.
EXPERIMENTAL SECTIONThe direct temperature resolved pyrolysis experiments are
pdormed on a modified Bruker APEX 7.0e FT ICR-MS equipped'kith a 7-T superconducting magnet. For these experiments wedeveloped a new easy to use, hydrocarbon-free ultrahigh vacuum
mined, or at the very least, the number of compositions that need
to be considered can be drastically reduced.Important parameters for accurate mass measurement with a
sector instrument are the scan rate and the setting of the ionoptical slits. The slow scan rate, however, reduces the temperature resolution in direct temperature resolved high-resolutionmass spectrometry (DT-HRMS). DT-HRMS on sector instruments also requires the continuous presence of a calibrant duringthe measurement to assign the mass scale and to compensatefor the irreproducibility of the magnetic scans. As a result, thedesorption and pyrolysis may be influenced by the presence ofthe calibrant. Finally, there is also a sensitivity problem as theresolution of the instrument increases. Narrowing the ion opticalslits reduces the ion current and therefore renllces the signal-to
noise ratio.The hyphenation of pyrolysis with FT ICR-MS provides a fast
analytical method with a high mass resolving power. FT ICRMS, as an established method for achieving high mass resolutionand performing accurate mass measurements,17-22 has numerous
features that make it a powerful method for :he identification ofpolymer additives with "in-source" filament pyrolysis on anextemal ion source. Possible sources of error, such as magneticfield inhomogeneity23 and magnetic drift." are insignificant withsuperconducting magnets. The temporai stability of the superconducting magnetic field enables us to use FT ICR-MS to obtainhighly reproducible results in mass measurement with signalaveraging and \:vithout the use of internal mass reference com
pounds. Another important feature of FT ICR mass analysis is
that sensitivity increases with mass resolution." As a consequence of simultaneous (multichannel) ion detection, the acquisition rate exceeds the performance of quadnlpole and magnetic
sector mass analyzers, providing an ideal setting for temperatureresolved in-source pyrolysis studies. An additional advantage ofIT ICR-MS in the study of pyrolysis processes is that MS' canbe readily used for structural identification of desorption andpyrolysis products. In this work, the coupling of direct temperattIre resolved in-source pyrolysis with IT ICR-MS is, using flameretarding additives in polymer or polymer blends as a test material,evaluated. The advantages of both methods have been combinedthus drastically improving both the mass resolving power and the
temporal resolution with which the desorptiolljpyrolysis processis studied.
3966 Analytical Chemistry, Vol 67, No 21, November 1, 1995
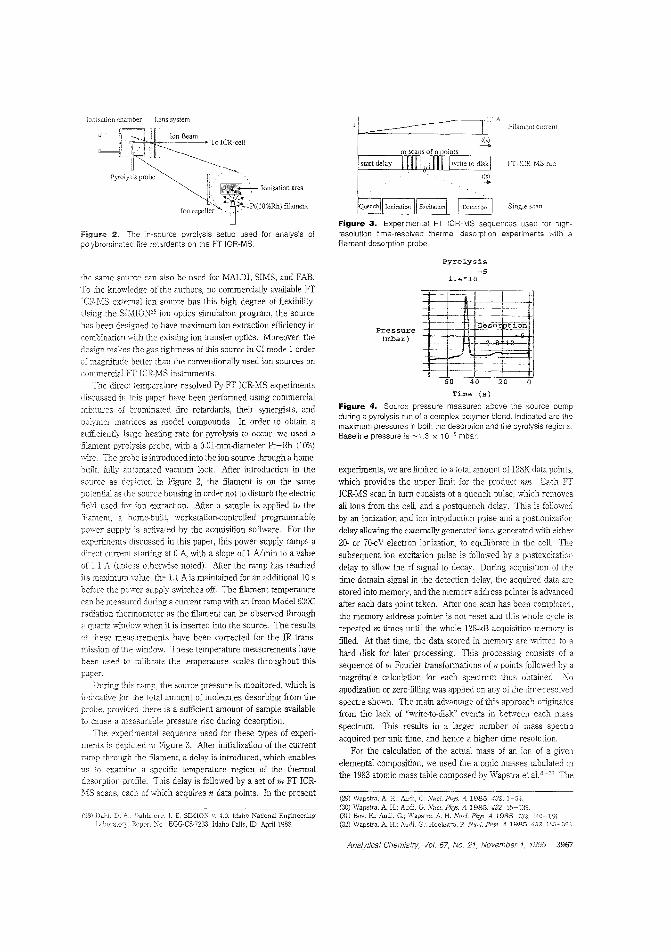
Fr-!CR-MS mn
Single scun
«(s)-+
start delay
__--~.LlA
Filament current
Ionisation area
iJ,"'-,.:Pfil O'lf,Rh\ filamentIon repeller
,~;ihJW_I::o::.n::.B::.,a::.m:- To ICR-cell
IDnisz.tion chamber L:;ns system
Pyrolysis probe
FijgllJre 2. The n-source pyrolysis setup used for analysis ofpo.ybrominated fire retardants on the FT ICR-MS.
Figure 3. Experimenlal FT ICR-MS sequences used tor hlghresolution time-resolved thermal desorption experiments with afHament desorption probe.
(29) Wapstra, A. R: Audi, G. Nucl. Phys. A 1985, 432.(30) Wapstra, A H.; Audi. G. Nue!. A 1985, 432. 55-139(31) Has. K; Audi, G.; A. H. Phys. A 1983. 432,(32) Wapstra. A H.; Auc1i Hoekstra. R .:Vue!. Phys. A 19B5. 482.
Time (5)
Figure 4. Source pressure measured above the source pumpduring a pyrolysis run of a complex polymer blend. Indicated ere themaximum pressures in both the desorption and the pyrolysis regiors.Baseline pressure is "'-'1.3 x 10⁻¹⁵ mbar.
experiments, we are limited to a total amount of 128K data points.
which provides the upper limit for the product nm. Eacb ITICR-MS scan in tum consists of a quench pulse, which removes
all ions from the cell, and a postquench delay. This is followed
by an ionization and ion introductiun pulse and a postionizationdelay allowing the externally generated ions, generated with either
20. or 7Q..eV electron ionization, to equilibrate in the cell. The
subsequent ion excitation pulse is followed by a postexcitation
delay to allow the Ii signal to decay. During acquisition of the
time domain signal in the detection delay, the acquired data are
stored into memory, and the memory address pointer is advanced",'ter each data point taken. After one scan has been compteted,
the memory address pointer is not reset and this whole cycle isrepeated m times until the whole 128-kB acquisitien memory is
filled. At that time, the data stored in memnry are written to a
hard disk for later processing. This processing consists of a
sequence of m Fourier transformations of n points followed by amagnitude calculation for each spectrum thus obtained. No
apodization or zero-filling was applied on any of the lime-resolvedspectra shown. The main advantage of this approach originates
from the lack of "write-to-disk" events in between each mass
spectrum. This results in a larger number of mass spectra
acquired per unit time, and hence a higher time resolution.
For the calculation of the actual mass of an ien of a given
elemental composition, we used the atomic masses tabulated inthe 1983 atomic mass table composed by Wapstra et a1."'·12 The
204060
pyrolysis
-5:1.4*10saOle somce can also be used for MALDI, SIMS, and FAB.
To the knowledge of the authors, no commercially available ITICR-MS external ion source has this high degree of flexibility.Using the SIMION" ion optics simulation program the sourcebas been designed to have maximum ion extraction efficiency in
combination \vith Lhe existing ion transfer optics. Moreover, thedesign ma..L;:es the gas tightness of this source in CI mode larderof magnitude better than -che conventionally used ion sources on
commercial IT ICR-MS instruments.The direct temperature resolved Py-IT ICR-MS experiments
discussed in this paper have been performed using commercial
mixtures of brominated fire retardants, their synergists, andpolymer matrices as model compounds. In order to obtain a
sufficiently large heating rate for pyrolysis to occur, we used at;lament pyrolysis probe, with a O.Ol-mm-diameter Pt-Rh (10%)
'Nire. The probe is introduced into the ion source through a homebuiit. fully automated vacuum lock. After introduction in thesource as depicted in Figure 2, the filament is on the samepotential as the source housing in order not to disturb the electric
field used for ion extraction. After a sample is applied to thefilanlent, a home-built, workstation-controlled programmable
power supply is activated by the acquisition software. For theexperiments discussed in this paper, this power supply ramps a
direct current starting at 0 A, with a slope of 1 A/min to a value1.1 A (unless otherwise noted). After the ramp has reached
its maximum value. tbe 1.1 A is maintained for an additional 10 sbefore the power supply switches off. The filament temperaturecan bE' me::lsured during a current ramp with an Ircon Model 600C
radiation thermometer as the filament C~lI1 be observed througha quartz window when it is inserted into the source. The results
of these measurements have been corrected for the IR transmission of the window. These temperature measurements havebeen used to calibrate the temperature scales throughout thispa~er.
During this ramp,. the source pressure is monitored, which isindicative for the total amount of molecules desorbing from theprobe. provided there is a sufficient amount of sample availableto cause a me"surable pressure rise during desorption.
The expelimental sequence used for these types of experiments is depicted in Figure 3. After initialization of the current
ramp through 'he filament, a delay is introduced, which enablesus to examine a specific temperature region of the thermaldesorption profile. This delay is followed by a set of m IT ICRMS scans, each of which acquires n data points. In the present
(28) Dahi. D. DahlmUlC.]. E. SIMlOi\' v. .:1.0. Idaho National Engineering
LaboralO:-Y. F;,('por EGG-C5-7233. Idaho falls, ID. April198S.
Analytical Chemistry. Vol. 67, No. 21. November 1. 1995 3967
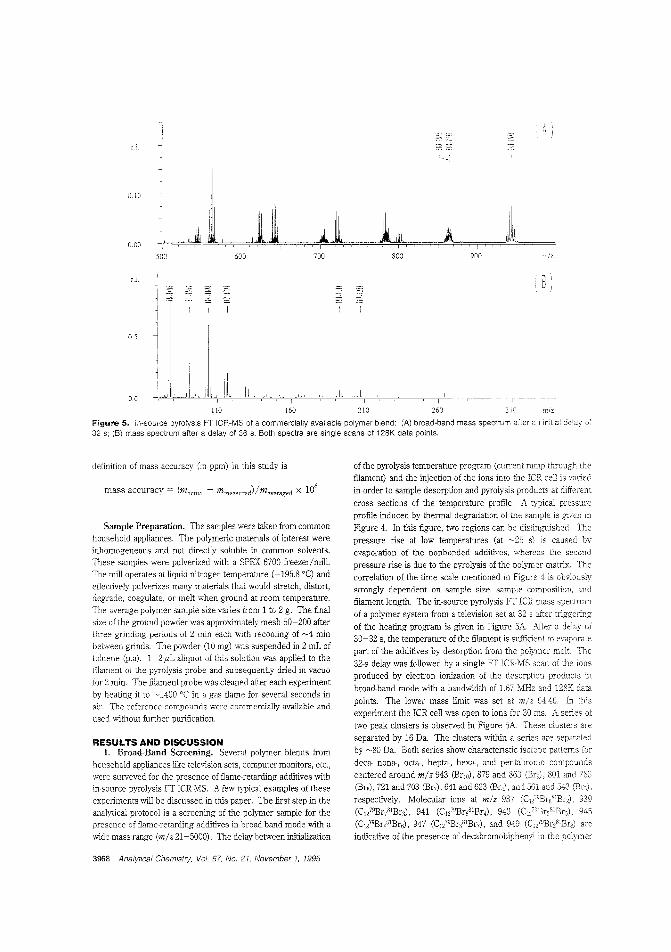
L1.
0.10
0.00
r.i.
0.5
0.0
500 600 700 800 900 rrJz
R\L !
llO 160 21O 260 m/z
Figure 5. In-source pyrolysis FT ICR-MS of a commercially available polymer blend: (A) broad-band mass spectrum after an initial delay of32 s; (B) mass spectrum after a delay of 36 s. Both spectra are single scans of 128K data points.
definition of mass accuracy (in ppm) in this study is
Sample Preparation. The samples were taken from commonhousehold appliances. The polymeric materials of interest wereinhomogeneous and not directly soluble in common solvents.'These samples were pulverized with a SPEX 6700 freezer/mill.The mill operates at liquid nitrogen temperablre (-195.8 'C) andeffectively pulverizes many materials that would stretch, distort,degrade. coagulate. or melt when ground at room temperature.The average polymer sample size varies from 1 to 2 g. The finalsize of the ground powder was approximately mesh 50-200 afterthree grinding periods of 2 min each with recooling of -4 minbetween grinds. The powder (10 mg) was suspended in 2 mL oftoluene (p.a). 1-2-1'1 aliquot ofthis solution was applied to thefilament of the pyrolysis probe and subsequently dried in vacuo
for 2 min. The filament probe was cleaned after each experimentby heating it to -1400 'C in a gas flame for several seconds inair. The reference compounds were commercially available and
used without further purification.
RESULTS AND DISCUSSIONI. Broad-Band Screening. Several polymer blends from
household appliances like television sets, computer monitors, etc.,were surveyed for the presence of flame-retarding additives within·source pyrolysis IT lCR-MS. A few typical examples of theseexperiments will be discussed in this paper. The first step in theanalyiical protocol is a screening of the polymer sample for thepresence of flame-retarding additives in broad-band mode with awide mass range (m/z 21-5000). The delay between initialization
3968 Analytical Chemislry, Vol. 67, No. 21, November 1, 1995
of the pyrolysis temperature program (cun'ent ramp through thefilament) and the injection of the ions into the ICR celi is varied
in order to sample desorption and pyrolysis products at different
cross sections of the temperature profile. A typical pressureprofile induced by thermal degradation of the sanlple is given in
Figure 4. In this figure, two regions can be distinguished. The
pressure rise at low temperatures (at -25 s) is caused byevaporation of fbe nonbonded additives, whereas fbe second
pressure rise is due to the pyrolysis of the polymer matrix, The
correlation of the time scale mentioned in Figure is obviouslystrongly dependent on sample size, sample composition. and
filament length. The in-source pyrolysis IT ICR mass spectrumof a polymer system from a television set at 32 s after triggeling
of fbe heating program is given in Figure 5A Alter a delay of30-32 s, the temperature of the filament is sufficient to evaporate
part of the additives by desorption from the polymer melt The
32-s delay was followed by a single IT ICR-MS scan of the ionsproduced by electron ionization of the desorption products
broad-band mode with a bandwidth of 1.67 MHz and 128K data
points. The lower mass limit was set at m/z 64.46. In thisexperiment the fCR cell was open to ions for 30 ms. A series oftwo peak clusters is observed in Figure 5A. These clusters are
separated by 16 Da. The clusters within a series are separatedby -80 Da. Bofb series show characteristic isotope patten1S for
deca- nona-, octa-, hepta-, hexa-, and pentabromo compounds
centered around m/z 943 (BrlO), 879 and 863 (Brg), 801 and 783(Brs), 721 arld 703 (Br7), 641 and 623 (Br,,) , and 561 and 543 (13r,,),
respectively. Molecular ions at m/z 937 (Cl/'Br881Brz), 939(Cl/9Br781Br3), 941 (C1279Br681Br4), 943 (C 127':Br,,81Brs), 945
(C\279Br4S1Br6), 947 (C1279Br;PBr7), and 949 (C\279BrpBrs) are
indicative of the presence of decabromobiphenyl in the polymer
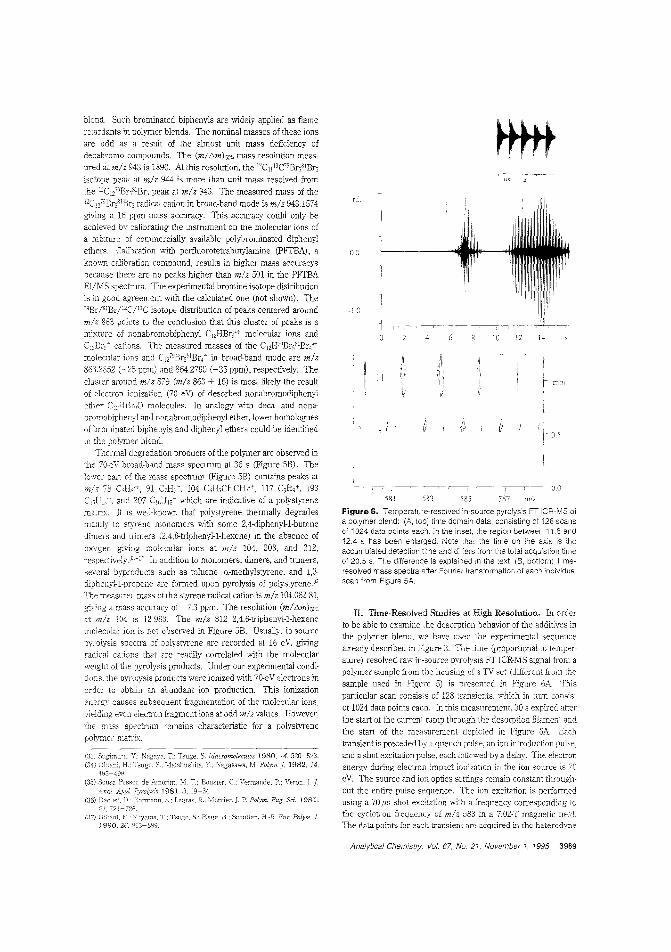
Uli.1rrrrr
58t 583 585 587 miL
Figure 6. Temperatu';-e-resolved \n-sQurce pyrolysis FT lCR-MS ofa poymer blend: (A, top) time domain data, consisting of 128 scansof 1024 data points each. In the inset, the region between i 1.8 and12.4 s has been enlarged. Note that the time on the axis is theaccumulated detection time and differs from t18 total acquistion timeof 20.5 s. The difference is explained in the text. (B, bottom) Timeresolved mass spectra after Fourier transformation of each incividua[scan from Figure 5A.
II. Time-Resolved Studies at High Resolution. In orderto be able to examine the desorption beha,ior of the additives inthe polymer blend, we have used the experimental sequencealready desclibed in Figure 3. The time (proportional '0 temperature) resolved raw in-source pyrolysis IT ICR-MS signal from apolymer sample from the housing of a TV set (different from thesample used in Figure 5) is presented in Figure 6A This
particular scan consists of 128 transients, which in tum consisl
of 1024 data points each. In this measurement, 30 s expired after
the start of the cun-ent ramp through the desorption fllame'lt andthe start of the measurement depicted in Figure 6A. Eachtransient is preceded by a quench pulse, an ion introduction pulse,and a shot excitation pulse, each follcwed by a delay. The electronener,l.?Y during electron :mpact ionization in the ion source is 70eV. The source and ion optics settings remain constant throughout the entire pulse sequence. The ion excitation is performedusing a '10-fls shot excitation with a frequency corresponding tothe cyclotron frequency of mlz 583 in a 7.02-T magnetic field.The data points for each transient are acquired in the heterodyne
min
0.5
-,---~__~-,--~I 0.0
II
-LO
00
LL
blend. Such brominated biphenyls are widely applied as flameretardants in polymer blends. The nominal masses of these ionsare odd as a result of the almost unit mass deficiency ofdecabromo compounds. The (mllimhs. mass resolution measured at mlz 943 is 1890. At this resolution, the 12Cl113C'9Br,81Br5
isotope peak at mlz 944 is more than unit mass resolved fromthe 12CI2'9Brc,81Br, peak at mlz 943. The measured mass of the
"C,,"IBreS1Br, radical cation in broad-band mode is mlz 943.1574giying a 16 ppm mass accuracy. This accuracy could only beachieved by calibrating the lnstrument on the molecular ions ofa mixture of commercially available polybrominated diphenylethers. Cali')ration with perfluorotetrabutylamine (pFTBA) , a
known calibration compound, results in higher mass accuracysbecause there are no peaks higher than m/z 501 in the PFTBAEl/MS spectrum. The experimental bromine isotope distributionis in good agreement with the calculated one (not shown). The,9Br/Sl Br/12C/13C isotope distribution of peaks centered aroundm/z 863 poirts to the conclusion that this cluster of peaks is amixture of nonabromobiphenyl CI2HBr,+ molecular ions and
e,Br" - cations. The measured masses of the C1,W9Br,81Br,+molecular iOllS and Cl/9Br5,lBL~c in broad-band mode are m/z863.2852 (-25 ppm) and 864.2790 (-35 ppm), respectively. The
cluster around m/z 879 (mlz 863 + 16) is most likely the resultof electron ionization (70 eV) of desorbed nonabromodiphenylether C12HBr!lO molecules. In analogy 'With deca- and nona
bromobiphenyl and nonabromodiphenyl ether, lower homologJJesof brominated biphenyls and diphenyl ethers could be identifiedin the polymer blend.
Thermal degradation products of the polymer are observed inthe 70-eV bmad-band mass spectrum at 36 s (Figure 5B). Thelower part of the mass spectrum (Figure 5B) contains peaks at
m/z 78 CiH(', 91 C,Hi", 104 C8H,CHCH,+. 117 C,H9+, 193C1CHL~, and 207 C"iH1, - which are indicative of a polystyrenematrix. It is well-known that polystyrene thermally degradesmainly to sl:)Tene monomers with some 2,4-diphenyl-1-butenedimer, and tlimers (2,4,6-triphenyl-1-hexene) in the absence of
oxygen giving molecular ions at m/z 104, 208, and 312,respectively.:;:;'-37 In addition to monomers, dimers l and trimers,several byproduc's such as toluene a-methylstyrene, and 1,3diphenyl-l-prcpene are formed upon pyrolysis of polystyrene.';
The measured mass of the styrene radical cation is mlz 104.062 81,giving a IT,ass accuracy of -7.3 ppm. The resolution (m/ limJso"at mlz 104 is 12983. The m/z 312 2,4,6-triphenyl-l-hexenemolecular ion is not observed in Figure 5B. Usually, in~source
pyrolysis spectra of polystyrene are recorded at 16 eV, givingradical cations that are "eadily correlated with the molecularweight of the pyrolysis products. Under our experimental condidaDS, the pyrolysis products were ionized with 7G-eV electrons in
order to obtain an abundant ion production. This ionizationenergy causes subsequent fragmentlltion of the molecular ions:vielding even electron fTagment iODs a'. odd m/z values. However.
the mass spectrum remains characteristic for a polystyrenepolymer matrix.
n3; Nagaya, T.; Tsuge, S. j1;jacromolecuies 1980, 74, S?-O-523(34) E.; Tsuge, S.; Matshushita, Y.; Nagasawa, M. Polym. j. 1982. 14,
195-499.
(35) Sousa Pessoil de Amorim, M. T.; Bouster, c.; Vermande, P.; Veron, J IAppl. Pyrolysis 1981. 3, 19-34.
(36) Dac'lJst, S.; Legra~, R.; Mercier,]. P. Polym. Eng. Sci. 1981,21.721-726.
em Ot1J<lni, E.; Y,tyama. Tsuge, S.; Plage, B.; Schulten, H.-R. EuY_ Po/ym.].1990, 26,S~':<)-899.
Analylical Chemistry. Vol. 67. No. 21. November 1. 1995 3969
mode with a sample frequency of 8000 Hz. The acquisition timefor each data set is 128 ms, which combined with the preceding32 ms for quench (1 ms), ion introduction (30 ms), ion excitation(70 I's), and the corresponding delays (1 ms total) yields a cycle
time of 160 ms. The acquired transients in I'lgure 6A clearly showtwo desorption regions. Region I starts at 37.5 s after the start ofthe current ramp, which corresponds to a fila'lent temperatureof ~700 K (Itil = 0.41 A). Region II starts at ·~43.1 s (1m= 0.52A) after the start of the desorption ramp, corresponding to afilament temperature of ~1000 K. This second desorption profileshows a structJre that closely resembles the characteristics of acombined first- and second-order thermal desorption process.'8The envelope of the absolute signal intensity of the first point ofeach transient depicted in Figure 6A corresponds to the ionchromatogram for the mass range m/z 589.4-576.7. If thetransients in Figure 6A are examined more closely (see insetFigure 6A), it can be seen that the acquisition stops before thecoherently excited ions in the cell have fully dephased. Thisobviously causes the resolution of the individual mass spectra tobe significantly lower than what would be possible based on thedephasing time of the ions. This is an example of a situation
where mass resolution has been sacrificed in order to obtain ahigher temporal and, therefore, higher thermal resolution.
After Fourier transformation of each indi,idual data set, theresulting mass spectra have been combined in a contour plot asshown in Figure 6B. In this figure, the two desorption regions Iand 1I are shown to originate from two different compounds.Region I originates from the thermal desorption of the n-butylether of tetrabromoBisphenol-A (TBBA) ,with a cluster of peakscentered around the [12CJ9H,oO/9Br28JBr, - CH3]+ peak at m/z584 displaying the 79Br/8JBr/J2C/J3C isotope distribution indicativeof a tetrabrominated compound given the ~50% natural abundancefor both bromine isotopes. The polymer matrix of this particularsample was determined to be polystyrene and is not shown inFigure 6 as it falls outside of the mass range examined. RegionII contains a clnster of peaks centered at m/z 583.2 C2JSb,JZlSb20 6'+)with an isotopic spacing typicai for antimony. Sb,06 is commonlyused as a synergist in combination with TBBA to enhance thefire-retarding action of this compound. '5 If we examine theindividual peaks in both regions, a resolution (m/Limlso% of 10947is found for the J'C"HJ70/9Br28JBr,+ peak at scan 60 and a
(38) Woodruff, D. P.: Delchar, T A. Modern techniques of sulface science;Cambridge University Press: Cambridge, UK, 1983.
3970 Analytical Chemistry, Vol. 67, No. 21, November 1, 1995
resolution (m/Limhrfl, of 11 646 for the 12:Sb,":iSbJOr peak inscan 110. A 4-fold increase in the number of data points takenincreases the resolution by a factor of ~4. The mass of theindividual compounds has been detennined with a 7 ppm accuracy
which, in combination with the short cycle time of 160 ms, to theknowledge of the authors has not been previously shown in tnsource pyrolysis MS studies on, e.g., magnetic sector massspcctrometers. 16
In conclusion, we have successfully coupled direct temperatureresolved in-source pyrolysis with an external ion source IT ICRMS. The ultrahigh vacuum conditions achIeved with the newlydesigned vacuum system resulted in a sufficiently long lOndephasing time to enable the rapid dynamic high-resolutionanalysis required for temperature-resolved in-source PyMS. Forthese experiments, the trade-off between high mass resolutionand high temporal resolution has resulted in a typical scan timeof 0.1 s with a mass resolution of (m/"'mho'::, equal to ~50 000 atmlz 747 for a 4096 points data set in heterodyne mode. In OUI
opinion, these instrumental capabilities open new pathways for asensitive and selective mass spectrometric analysis of polymersand their additives. Moreover, the high temporal resolution ofour experimental sequence also allows for fundan1ental stuclie,of the kinetics involved in desorption and thernMlly induceddissociation processe8 of macromolecules.
ACKNOWLEDGMENTThe authors gratefully acknowledge A Vijftigschlld, Ivl. de
Wilde, and I. Stavenuiter for their technical assistance clUling thevarious stages of the experiment. We also acknowledge Dr. P.Caravatti for useful discussions in the design stage of the externalion source. Dr. T. Weeding is acknowledged for her carefulreading of the manuscript. ThIs work was financially supportedby the lAS instrument development program for Aclvanced MassSpectrometry, the Foundation for Fundamenteel Onderzoek del'Materie (FOM), and the Nederlandse Organisatie voor Wetenschappelijk Onderzoek, NlVO (Dutch organization for scientificresearch).
Received for review March 24, 1995. Accepted August 9,1995.0
AC950294K
o Abstract published in Advance ACS Abstracts, Seplembc' 1995.
Anal. Chem. 1995, 67. 3971 -3978
c-Terminal Ladder Sequencing via Matrix-Assistedlaser Desorption Mass Spectrometry Coupled withCarboxypeptidase Y Time-Dependent andConcentration-Dependent Digestions
Dale H. Patte.son, George E. Ta.r, Fred E. Regnier, and Stephen A. Martin*
PerSeptive I:3losystems, 500 Old Connecticut Path, Framingham, Massachusetts 01!O 1
Mass Spectrom. 1987,14.
The utility of matrix-assisted laser desorption/ionizationtime-of-flight (Ml\LDI-TOF) mass spectrometly for theanalysis of C-terminal peptide ladders from carboxypeptidase Y (CPt) digestions is discussed. MALD! analysisofaliquots of an optimized time-dependent CPY digestionof ACTH 7-38 fragment allowed for the sequence of thefirst 19 amino acids from the C-terminus to be determinedin 25 min of digestion time. A strategy for performingparallel concentration-dependent digestions on the MALDI plate is proven to be superior to the time-dependentapproach as the method development time and practicalamounts of both peptide and enzyme consumed arereduced significantly. The on-plate approach offered thesame sequence information from the ACI1I 7-38 fragment and was used to digest 22 peptides ofvarious aminoacid composition, size, charge, and polarity. Of the 22peptides digested on-plate, sequence information wasderived from 19 of them. A statistical analysis strategyfor ladder sequencing utilizing t-statistics is offered as amethod for placing confidence intervals on residue assignments.
Protein and peptide chemists frequently desire reliable andfast determinations of amino acid sequences. This informationis crucial for the identification and analysis of (1) known and novelproteins as an end in itseJf or as a preliminary to cloning or further
analysis by other methods, (2) peptides isolated from protelndigests or from the screening of combinatorial or natural libraries,and (3) synthetic products as one component of quality control.Existing methods for sequence determination include the Nterminal chemistry of d,e Edman degradation, N- and C-terminalenzymatic methods. C-terminal chemical methods, and MS/MSappo-oaches, with the first and last being most widely used. Eachmethod possesses inherent limitations that frustrate its use alonefor the complete primary structure identification of all proteinsand peptides. The most glaring deficiency in the current set ofmethods is one that offers reliable C-terminal information.
C-termir:al sequencing via chemical methods has provendifficult and is marginally effective, at best, after many years ofdevelopment.1-: For this reason, the C-terminus remains a region
(:) SLark G. R. j1;icthods Enzymo!. 1972.25, 369-::H:\4.(2) )Jethods Proiein Sequence Analysis: Wittmann-Leibold, R.,
Berlin. 1989: 129-136.(3) /l1:al. Biochcm. 1991, 183-196.C'l) :vIa:mharu. K.; Takamoto, K; Sat.:'lke, K.]. Protein Chem. 1994,
0003-2700/9Si0367 -397iS900/C © 1995 American Chemical Socie:y
of proteins and peptides that is often not analyzed because of lackof a dependable probe. An alternate approach to chemicalsequencing is enzymatic sequencing. Serine carboxypeptidaseshave drawn attention over the last two decades as they offer asimple method by which amino acids can be sequentially cleavedfrom the C-terminus of a protein or a peptide. CarboxypeptidaseY (CPY) , in paricular. is an attractive enzyme as it has beenreported to nonspeciJically cleave ail residues from the C-temlinus,proline included.Hi! Sequencing of peptides by carboxypeptidasedigestion has traditionally been perrormed by the direct analysisof the released amino acids, which is complicated by amino acidcontaminants in the enzyme and protein/peptide solutions as wellas enzyme autolysis. Further hindering the sequencing effort isthe requirement for good kinetic infonnation conccl11ing thehydrolysis of each residue.
With the advancement of mass spectrometric techniquescapable of high rna" analysis such as field desorption,l1·"electrospraY,";·I'1 252·Cf plasma desorption,'i-lS FABS,lil-" andthermospraY,,"-27 it has become possible to perform direct mass
(5) j. M.Tu. 0.; bal. G.; Ha. A.; Slively. j. E. Anal. Blochem. 1995.224.
(fi) i\;T;;niin, B. Carlsbe,g Res. Commun. 1.977, -12, 99-102.(7) Breddam, Ottesen, Carlsberg Res. Commun. 1987, 52,55-63.(8) Breddam, K Commui1. 1986,51, 83-128..(9) Hayashi. R 1977. 74.84-94
(IO) Hayashi, R.: Moore, S.; Stein, W. H.]. BiD!. Chem. 1973,248,2296-2302.(11) Hong, Y.-M.: Takao, T.: AJmoio, S.; Shirnonishi. Y. Biomed. Mass Spectrom.
1983. 10.450-457.(2) A.: Broek. V. D.: PrzybylskL M. FEES Lett. 1982, 137, 19-24.(13) C. E.: Dufnj" K L. In Techniques in Pl'Otei~z Chemi,try,rv: ,An"e1elti.
R H.. Ed.: Academic P,ess, Inc.: San D:ego, CA, 1993: pp(H) Rosnack K J: Stroh, J. (;. Rapid Commun. i4ass Spectrom. 1992.6.637
640.(15) KLarskov. K:. Bred dam. K: Roepstorfr, P. AnaL Biochcm. 1989.180.28
37(16) Woods, A. S.: Cotter. R. J; Yoshiol,a. M.; Bullesbach. F,: Schwabe, C
j. }viass Spectrom. Ion Processes 1991. 111, 77-88.(17) Wang, R; Colter, R J.; :'\Ieschia, J. L Sisodia, S. S. In Techniques in Protein
III; R. H.. Eel.: AcaC:cmic Press, Inc.: San Diego. CA1992; pp
0/1) Woods, A So: Gibson, VI'.; (ottel-. R J. In Fm,,-o,'-""ghIMass ,pec.I",,,!!y;Cotter, R. J., Ed.: ACS Symposium Series ,m; run",ca" Chemical Society:Washinglon, DC, 1994: :)P 194-21C.
(19) R. M.: Fraser. 3. A Biomed.
(20) R Fan T. Allal. Biochem. 1986. 154. 596-603.(21) R.: Parente, A. Biomed. Mass Sprclrom. 1983, 10. 78-82.(22) Bradley. C. V.: Williams. D. H.: Hanley. M. R. Biochern. Biophys Res
COmmll11. 1982.4,122:->1230.(23) Kim.].: Kim. K.: Km. J: Ok,]. H.: Kim. .r. Biochern. ]\;[01. BioI. lnt, 1994,
33.55-64.(24) Chern. Soc. lPn, 19Rfi>
59.
Analytical Chemistry. Vol. 67. No. 21. November 1, 1995 3971
analysis on peptide fragments resulting from CPY digestion where
the sequence order is preserved in a simple qualitative way,
circumventing the need for amino acid analysis. In this "ladder"sequencing approach, a sequence can be read, in the correctorder, by simply calculating the differences in mass of adjacentpeptide peaks, representing the loss of amino acids Morerecently, matrix-assisted laser desorption/ionization time-of-flight(MALDl-TOF) mass spectrometry has been shown as a suitable
tool for ladder sequence analysis due to its high sensitivity,resolution, and mass accuracy."-]·' Chait and co-workers exploited the assets of MALDl-TOr for the ladder sequencing of
N-tenninalladders formed from partial blockage at each step ofan Edman degradation.28.1,) Pappin and co-workers used MALDITor to study N-terminalladders made by adding fresh peptideat the start of each Edman cycle.'o These two methods still suffer
from the same limitations of traditional Edman chemistry, including the lack of C-terminal information, but demonstrate the utilityof MALDl-TOF for direct sequence determination from ladders.Combining the MALDl-TOF detection scherre with carboxypeptidase digestion of peptides, direct analysis of the resulting mixtureof truncated peptides can be performed. thereby offering easyto-interpret sequence information. This has been shown to be a
promising technique as eight consecutive amino acids werereported sequenced from the C-telminus of human parathyroidhormone 1-34 fragment.'l Recent articles from Cotter's laboratory:!:!,:)' have reported the transfer of classical time coursedigestions with carboxypeptidases and aminopeptidases to an "onslide" format for convenient integration with MAlDI-TOF analysis.
This paper demonstrates the viability of C-terminal enzymaticsequencing using a time-dependent carboxypeptidase Y digestioncoupled with MALDI-TOF mass analysis of the resulting peptideladders. An alternate and novel digestion strategy involving theuse of the microliter wells machined into be Voyager MALDIplate for a concentration-dependent digestion of the peptide ispresented. Sequence information analogous to the optimized timedependent digestion is obtained in a matter oi a few minutes whilecircumventing time-consuming melhod development This methodis shown to require only a few picomoles of total peptide as a
combined result of the sensitivity of MALDI and no sample lossupon moving from digestion to analysis. Using this on-plateconcentration-dependent digestion strategy, 22 peptides of variousamino acid composition, size, charge, and polarity were digestedto explore the generality of the technique. Finally, a statistical
(25) Stachowiak, K: Wilder, c.: Vestal, M. L.; Dyckes, D. F.]. Am. Chern. Soc.1988,110.1758-1765.
(26) Kim, H. Y; PiJosof. D.; Dyckes. D. F: VestaL M. L.]. Am. Chern. Soc. 1984,106.7304-7309.
(27) PilosoL D.; Kim, H. Y.: Vestal, M. L.: Dyckes, D. F. Biomed. Mass Spectrom.19R4, 11, 403-407.
(28) Chait, B. T.: \Vang, R: Beavis, R. c.; Ken'c, S. 13. H. Science 1993, 262,89-92.
(29) Wang. R.; Chait. B. L Kent. S. B. H. In 'fechniques Protein ChemistryIV: R. H., Ed.: Academic Press, rnc.: San Diego, CA, 1993: pp
(30) Bartlett-Jones: M., Jeffery. Hansen, H. F.; ~appin, D. ]. C.]. ProteinChern. 1994, 13,455-456.
nl) Schar. M.; Bornsen. K. 0.; Gassmann E.; Widmer. H. Chimia 1991,45,123-126.
(32) Aldrich, c.J.; DeCloux, A; Woods, A S.; Colter, RJ.; Soloski, M. J.; Forman,). Cell 1994. 79, 649-658.
(33) Thiede, B.; VYittmann-Liebold. E.; Bienert. !VI.; Krause, E. FEES Lett. 1995,357.65-69.
(34) Woods, A. S.; 1. c.; Cotter, R. J.; Pasternack, G. R.; Pardoll, D.M.; Jaffee, E. Biochem. 1995,226,15-25.
3972 Analytical Chemistry, Vol. 67, No 21. November 1, 1995
analysis strategy is offered as a tool for applying statistical levelsof confidence to amino acid assignments.
EXPERIMENTAL SECTION
Solution-Phase Digestion ofACIH 7 -38 Fragment Forthe time course digestion, 500 pmol of synthetic human adrenocorticotropic hormone fragment (7-38) (FRWGKPVGKKRRPVKVYPNGAEDESAEAFPLE) from Sigma Chemical Co. (St. Louis.
MO), pre\~ously dried down in a O.5-mL Eppendorf vial, wasresuspended with 33.3 ,uL of HPLC grade water a. T Balzer.Phillipsburg, NJ). In a previously dried down O.5-mL Eppendoritube, 3.05 units (one unit hydrolyzes 1.0 ,umol of N-CBZ-Phe-Alato N-CBZ-phenylanine + alanine per minute at pH 6.75 and 250C) of carboxypeptidase Y from balzer's yeast (EC 3.4.16.1),purchased from Sigma, was resuspended with 610 ,uL of HPLCgrade water. To 20,uL of the ACTH 7-38 fragment solution wasadded 10 I'L of the CPY solution to initiate the reaction. The finalconcentrations were 10 pmol!I'L ACTH and 1,67 x 10⁻³ mits/I'L CPY, yielding an enzyme-to-substrate ratio of 1.67 x lOS unitsof CPY/ mol of ACIH (1:37 molar ratio by assuming the CPY MW= 61 000). Aliquots of II'L were taken from the reaction vial atreaction times of 15 s, 60 s, 75 s, 105 s, 2 min, 135 s, 4 min, 5 min.6 min, 7 min, 8 min, 9 min. 10 min, 15 min. and 25 min. At 25min, 15 I'L of 5 x 10⁻³ units/uL CPY was added LO the reactionvial. Aliquots of 2 I'L were removed at total reaction times of 1and 24 h. The reaction proceeded at room temperature until 2min, when the temperature was elevated to 37°C. All aliquotswere added to 9 I'L of the MALDI matrix, a-cyano-4-hydroxycinnamic acid (CHCA) from Sigma, at a concentration of 5 mg/mLin 1:1 acetonitrile (ACNJ/0.1% trifluoroacetic acid (IFA) \vith theexception of the 1 and 24-h aliquots that were added to 8 ,aL ofthe matrix. The final total peptide concentrations of the ACTHdigestion aliquots in the matrix solutions were 1 pmol/,llL. Apooled peptide solution was prepared by combining 2 .aL of the15-s, 105-s, 6-min, and 25-min aliquots. Into indi0,dual microliterswells on the MALDI sample plate was placed 11'L oi each aliquotsolution and allowed to evaporate to dryness before insertion into
the mass spectrometer.On-Plate Digestions. All on-plate digestions were performed
by pipeting 0.51'L of the peptide at a concentration of 1 pmol/aLinto each of 10 l-I'L wells across one row of the Voyager sampleplate (Figure 1). All peptides given in Table 1 were purchasedfrom Sigma and were of the highest purity offered. To initi?tethe reaction in the first well, 0.5 ,uL of 0.0122 unitS/ilL CPY wasadded. To the subsequent nine wells was added CPYat concentrations of 6.10 x 10-3,3.05 x 10-3,1.53 x 10-3,6.10 x 3.05x 10-4, 1.53 X 10-', 7.63 x 10⁻⁵, 3.81 x 10⁻⁵, and 0 mit/,uL,
respectively. Mixing was assured in each well by pulling the l-.uLreaction back and forth through the pipet tip. The reaction wasallowed to proceed at room temperature until the l-.aL total volumeevaporated on the plate (~10 min). At such time, 0.5 I'L of 5mg/mL CHCAin 1:1 ACN/O.1% TFAwas added to each well, I'ithno further mixing, and allowed to evaporate for ~10 min before
mass analysis.MALDI-TOF Mass Spectrometry. MALDi·TOF mass analy
sis was performed using :he Voyager Biospect'ometry V;orkstation (perSeptive Biosystems, Framingham, !viA). A 28.125-kV
potential gradient was applied across source containing the sampleplate and an ion optic accelerator plate in order to introduce thepositively charged ions to the 1.2-m linear flight tube for mass
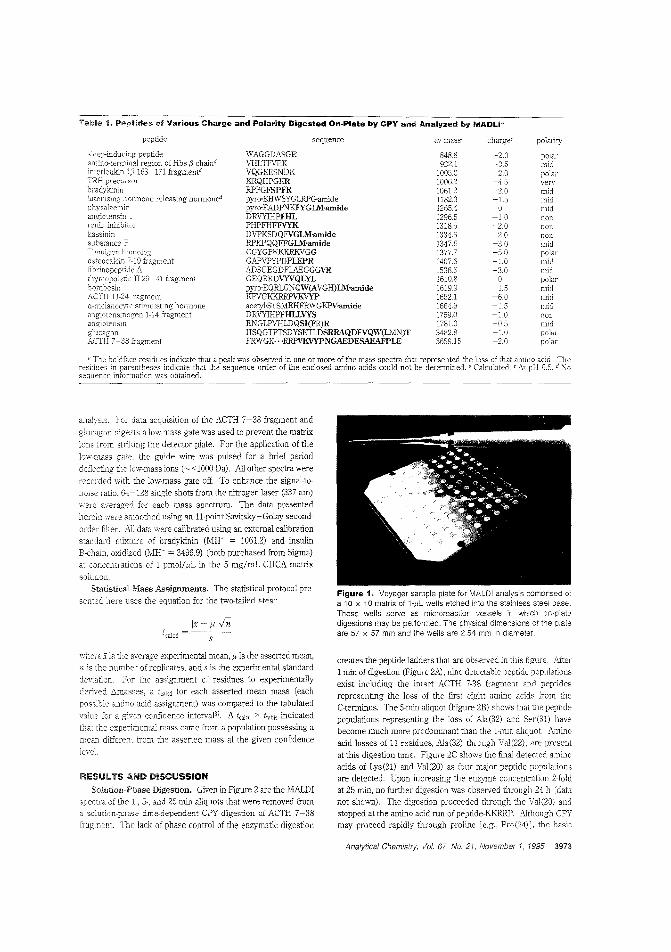
sequence av massb chargee pob-ity
WAGGDASGE 8488 -2.0 pOlarVHLTPVEK 922.1 +0.5 midVQGEESNDK 1005.0 -2.0 po:arKRQHPGKR 1006.2 +4.5RPPGFSPFR 10612 +2.0pyro'EHWSYGLRPG-amide 11823 +1.5 midpyro·EADPNKFYGL'I1·amide 1265.4 0 midDRVYIHPFHL 1296.5 +1.0 nonPHPFHFFVYK 13185 +2.0 nonDVPKSDQFVGL'I1'amide 1334.5 -2.0 nonRPKPQQFFGlM'amide 1347.6 -'-3.0 midCGYGPKKKRKVGG B'I7.7 -5.0 polarGAPVPYPDPLEPR 14076 -1.0 midADSGEGDFLAEGGGVR 1536.6 -30 midGEQRKDVYVQLYL 1610.8 0 polarpyrD·EQRLGNQW(AVGH)lM·amide 1619.9 +1.5 midKPVGKKRRPVKVYP 1652.1 +6.0 midacetyl·STSMEHFRWGKPV·amide 1664.9 +1.5 midDRVYIHPFHLLVYS 1759.0 +1.0 nonENGLPVHLDQSI(FR)R 1781.0 -0.5 midHSQGTFTSDYSKTLDSRRAQDFVQW(LMN)T 3482.8 +1.0 polarFRWGK·· ·RRPVKVYPNGAEDESAEAFPLE 3659.15 +2.0 polar
observ'ed in one or more of the mass spectraorder of the enclosed amino acids could not
Fragment
ACTa 11-24
'fable 1. Peptides of Various Charge and Polarity Digested On-Plate by CPY and Analyzed by MADU-
peptide
analysis. For data acquisition of the ACfH 7-38 fragment and
glucagon digo,ts a low-mass gate was used to prevent the matrix
ions from striking the detector plate. For the application of the
low-mass gate. the guide wire was pulsed for a brief period
det1ecting he jow-mass ions (~< 1000 Da). All other spectra were
recorded with the low·mass gate off. To enhance the signal-to
Doise ratio, 64-128 single shots from the nitrogen laser (337 nm)
were averaged for each mass spectrum. The data presented
herein '.vere smootherlllsing an 11~poi:1t Savitsky-Golay second
order fiiter. Aij data were calibrated usinf( an external calibration
standard mixture of bradykinin (MW = 1061.2) and insulinB-chain, oxidized (MW = 3495.9) (both purchased from Sigma)
at concentrations of I pmol/IIL in the 5 mg/mL CRCA matrix
solution.Statistical Mass Assignments. The statistical protocol pre
sented here uses the equation for the two-tailed t-tes"
Ix - I'lvntcalcd ='--s--
Figure 1. Voyager sample plate for MALDI analysis comprised ofa 10 x 10 matrix of 1·,uL wells etched Into the stainless steel base.These wells serve as microreactior vessels in which on-platedigestions may be performed. Tbe pbysical dimensions of tbe plateare 57 x 57 mm and the wells are 2.54 mm in diameter.
where i is the average experimental mean,,U is the asserted meCh'1,
n is the Dumber of replicates, and s is the experimental standard
dev:ation. For the assignment of residues to experimentally
derived I\.masses, a t"kd for each asserted mean mass (each
possible amino acid assignment) was compared to the tabulated
value a given confidence intervaJ37. A. tcalCd > ttable indicatediliat the experimemal mass came from a population possessing a
mean different from the asserted mass at the given confidence
level.
RESIJl'l"S AND DISCUSSION
Solution-Pbase Digestion. Given in Figure 2 are the MALDIspectra of the 1-, 5-, and 25-min aliquots that were removed from
" soiution-phase time-dependent CPY digestion of ACfH 7-38
fragment. The lack of phase control of the enzymatic digestion
creates the peptide ladders that are observed in tbis fIgure. After1 min of digestion (Figure 2A), nine detectable peptide populations
exist including the intact ACfH 7-38 fragment ~nd peptides
representing the loss of the first eif(ht amino acids from theC-terminus. The 5-min aliquct (Figure 2B) shows that the peptide
populations representing the loss of Aia(32) and Ser(31) have
become much more predominant than the I·mif. aliquot. Amino
acid losses of 11 residues. Ala(32) through Val(22). are presenl
at this digestion time. Figure 2C shows the final detected a:nino
acids of Lys(21) and Val(20) as four major peptide populations
are detected. Upon increasing the enzyme concentration 2-fold
at 25 min, no further digestion was observed through 24 h :datanot shown). The digestion proceeded through the Val(20) andstopped at the amino acid run of peptide-KKRRP. Aithough CPYmay proceed rapidly through proiine ie.g., Pro (24)], tbe basic
Analytical Chemistry, Voi. 67. No. 21, November 1. 1995 3973
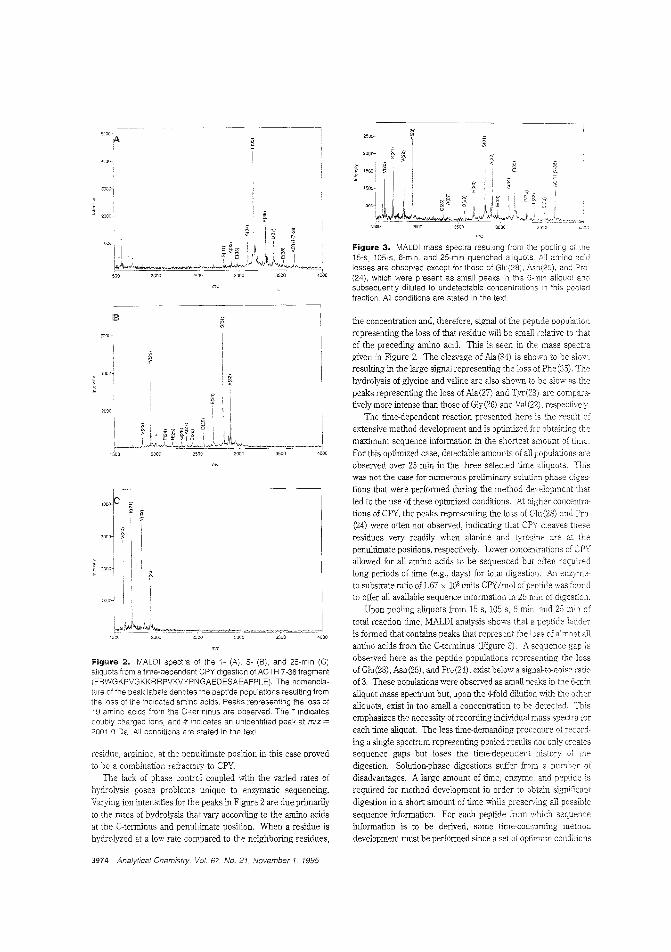
Figure 2. MALO I spectra at the 1- (A), 5- (6), and 25-min (C)aliquots from a time-dependent CPY digestion at ACTH 7-38 fragment(FRWGKPVGKKRRPVKVYPNGAEDESAEAFPLE), The nomenciature of the peak labels denotes the peptide populations resulting fromthe [ass of the indicated amino acids. Peaks representing the loss of19 amino acids from the C~terminus are observed. The'" indicatesdoubly charged ions, and # indicates an unidentified peak at mlz =2001,0 Da, All conditions are stated in the text
residue, arginine, at the penultimate positior in this case provedto be a combination refractory to CPY
The lack of phase control coupled with the varied rates ofhydrolysis poses problems unique to enzymatic sequencing.Varying ion intensities for the peaks in Figure 2 are due primarily
to the rates of hydrolysis that vary according to the amino acidsat the C-terminus and penultimate position, When a residue ishydrolyzed at a low rate compared to the neighboring residues,
3974 Analytical Chemistry, Vol, 67, No, 21, November I, 1995
Figure 3. MALO I mass spectra resulting from the pooling of the15-s, 105-s, 6-min, and 25-min quenched aliquots, All amino acidlosses are observed except for those of Glu(28), Asn(25), and Pro-(24), which were present as small peaks in the 6-min andsubsequently diluted to undetectable concentrations in pooledfraction, All conditions are stated in the text
the concentration and, therefore, signal of the peptide populationrepresenting the loss of that residue ",ill be small relative to thatof the preceding amino acid, This is seen in the mass spectragiven in Figure 2, The cleavage of Ala (34) is sho"'ll to be slow,resulting in the large signal representing the loss of Phe (35), Thehydrolysis of glycine and valine are also shown to be slow as thepeaks representing the loss of Ala(27) and Tyr(23) are comparatively more intense than those of Giy(26) and Val (22) , respectively,
The time-dependent reaction presented here is the resultextensive method development and is optimized for obtaining themaximum sequence information in the shortest amount of tillie,For this optimized case, detectable amounts of all populations areobserved over 25 min in the three selected time aliquots, 'Th',swas not the case for numerous preliminary solution-phase diges
tions that were performed during the method development thatled to the use of these optimized conditions, At higher concentrations of CPY, the peaks representing the loss of Gle (28) and Pro(24) were often not observed, indicating that CPY cleaves theseresidues very readily when alanine and tyrosine are at thepenultimate positions, respectively, Lower concentrations of CPYallowed for all amino acids to be sequenced but often requiredlong periods of time (e,g" days) for total digestion, An enzymeto-substrate ratio of L67 x 108 units CFY/mol of peptide was foundto offer all available sequence information in 25 min of digestion,
Upon pooling aliquots n-om 15 s, 105 s, 6 min. and 25 min oftotal reaction time, MALDI analysis shows that a peptide ladderis formed that contains peaks that represent the loss of almost ailamino acids from the C-terminus (Figure 3), A sequence gap isobserved here as the peptide populations representing the lossof Glu(28) , Asn(25), and Pro (24), exist below a signal-to-noise ratioof J These populations were observed as small peaks in the 6-minaliquot mass spectrum but, upon the Hold dilution with the otheraliquots, exist in too small a concentration to be detected, TIlisemphasizes the necessity of recording individual mass spectra [oreach time aliquot The less time-demanding procedure of recording a single spectrum representing pooled results not only createssequence gaps but loses the time-dependent history of thedigestion. Solution-phase digestions suffer from a num')er of
disadvantages, A large amount of time. enzyme, and peptide isrequired for method development in order to obtain signillcantdigestion in a short amount of time while preserving ail possible
sequence information, For each peptide from which sequenceinformation is to be derived, some time-consuming methoddevelopment must be performed since a set of optimum conditions
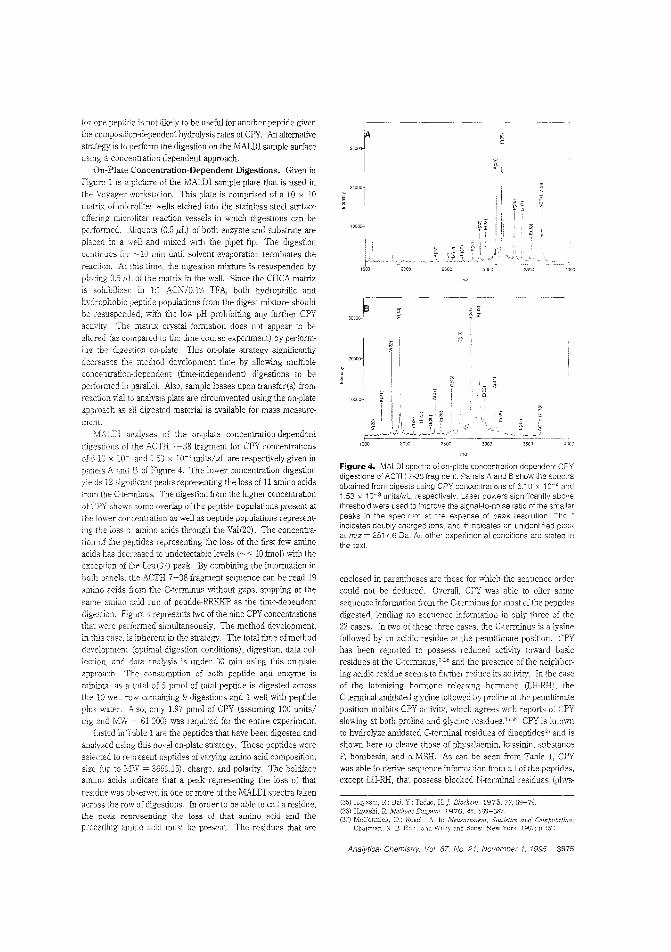
for Olee peptide is not likely to be useful for another peptide giventhe composition-dependent hydrolysis rates of CFY. An alternative
strategy is tc perform the digestion on the MALDI sample surfaceusing a concentration-dependent approach.
On-Plate Concentration-Dependent Digestions. Given in
Figure 1 is a picture of the MALDI sample plate that is used inthe Voyager workstation This plate is comprised of a 10 x 10
matrix of microliter wells etched into the stainless steel surfaceoffering microliter reaction vessels in which digestions can bepeIiOlmed. Aliquots (0.5,uL) of both enzyme and substrate areplaced in a well and mixed with the pipet tip. The digestion
ccntir"ues for'"" 10 min until solvent evaporation terminates the
reaction. At this time, the digestion mixture is resuspended byplacing 0.5 ,uL of the matrix in the well. Since the CHCA matrix
is solubilized in 1:1 ACN/0.1% TFA, both hydrophilic andhydrophobic peptide populations from the digest mixture shouldbe resuspended, with the low pH prohibiting any further CPY
activity. The matrix crystal formation does not appear to bealtered (as compared to the time course experiment) by pert01mlng the digestion on-plate. This on-plate strategy significantly
decreases method development time by allowing multipleconcentration-dependent (time-independent) digestions to beperformed in )arallei_ Also, sample losses upon transfer(s) from
reaction vial to analysis plate are circumvented using the on-plate
approach as all digested "llaterial is available for mass measure-
i\1ALDi analyses of the on-plate concentration-dependent
digest'ons of the ACTH 7-38 fragment for CPY concentrationsof d.1C x and 1.53 x 10-) unitS/ilL are respectively given in
panels A and B of Figure 4. The lower concentration digestionyields 12 significant peaks representing the loss of 11 amino acidsfrom the C-terminus. The digestion from the higher concentration
of CPY shows somc overlap of the peptide populations present atthe lower f:oncentration as well as peptide populations representing the loss of amino acids through the Val(20). The concentra
tiOJ of the peptides representing the loss of the first few aminoacids has decreased to undetectable levels (~< 10 fmo!) with theexception of the Leu (31) peak. By cembining the infommtion in
both panels, the ACTH 7-38 fragment sequence can be read ISamino acids from the C-terminus without gaps, stopping at the
same "Inino a6d run of peptide-RRKKP as the time-dependent
cligestiDn. Figure 4 represents twe of the nine CPY concentrationsthat were performed simultaneously. The method development,in this case, is inherent in the strategy. The total time of methoddevelopment (optimal digestion conditions), digestion, data collec~ion, and data analysis is under 30 min using this Dn-plateapproa,ch. The consumption of both peptide and enzyme is
minimal as a total of 5 pmol of total peptide is digested acrossthe 10 well row containing 9 digestions and 1 well with peptideplus water. l\.lso, only 1.97 pmol of CPY (assuming 100 units/mg and MW = 61 OOC) was required for the entire experiment.
Listed in Table 1 are the peptides that have been digested andanalyzed using this nove] on-plate strategy. These peptides wereselected to represent pfptides of varying amino acid cDmposition,
size (up to !VITI! = 3659.15), charge, and polarity The boldfaceamino acids indicate that a peak representing the loss of that
residue was observed in one or more of the M,I\l.Dl spectra takenacross the row of digestions. In order to be able to call a residue,the peak representing the loss of that amino acid and thepreceding amino acid must be present. The residues that are
Figure 4. MALOI spectra of on-platE concentration-dependent CPYdigestions of ACTH 7-38 fragment. Panels A and B show theobtained from digests using CPY concentrations of 6.10 >: and1.53 x 1D··'3 units~uL, respectively. L&ser powers significantly abovethreshold were used to improve the signal-to-n8ise ratio of the smal!erpeaks in the spectrum at tre expense of peak resolution. ThEindicates dOLbly ions, and #" indicates an unidentified peakat mlz = 2517.6 Da. other experimen:ai conditions are stated inthe text.
enclosed in parentheses are those for which the sequence ordercould not be deduced. Overall, CPY was able to offer somesequence infOImation from the C-terminus for most of the peptides
digested, lending no sequence infOlmation in only three of the22 cases. In two of these three cases. the C-terminus is a iysinefollowed by an acidic residue at the penultimate position. CPYhas been reported tc possess reduced activity toward basicresidues at the C-terminus,""';;" and the presence of the neighboring acidic residue seems to further reduce its activity. In the caseof the lutenizing hormone releasing homlonc (LH-RH). theC-terminal amidated glycine followed by proline at the penultimateposition inhibits CPY activitj, which agrees with reports 0:' CPYslowing at both proline and glycine residues.:J5.:Jfi CPY is kno'\11to hydrolyze amidated C-terminal residues of dipeptides:1C and isshown here to cleave those of physalaemin, kassinin, substanceP, bombesin, and a-MSH. As can be seen from Table 1, CFYwas able to derive sequence infoffilation from all of the peptides.except LH-RH, that possess blocked N-terminal residues (Phys-
(35) Hayashi, R; Bai, Y.; Tadao, H.]. Biochem. 1975.77,69-79.(36) Hayashi, R. Methods Enzymnl. 1976, 45. 568-587.(37) McCormick, D.; Roach. A. Ir~ MeasHrcment, Statistics and Comp/dation:
Chapman, N. D. EeL.: Jo:,]]1 Wiley and Sons', New York, 1987: p 132
Analytical Chemistry. Vol. 67, No. 21. November 1. 1995 3975
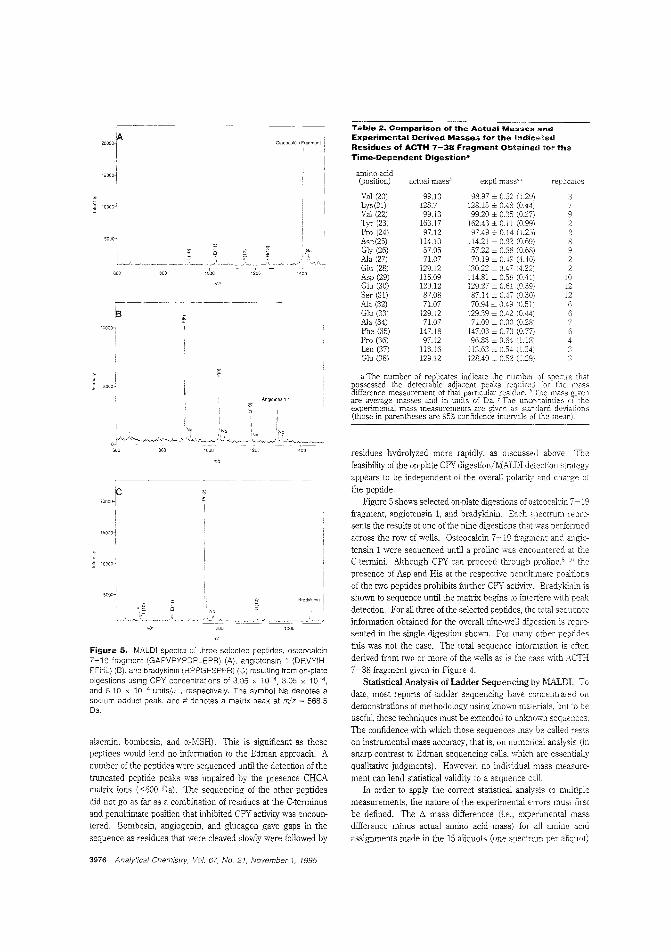
Osteoc;liClnFragmon\
Table 2~ Comparison of the Actual Masses and
Experimental Derived Masses for the IndicatedResidues of ACTH 7-38 Fragment Obtained lor theTime-Dependent Digestion8
'6
amino acid(position)
Vat (20)Lys(21)Val (22)Tyr (23)Pro (24)Asn(2S)Gly (26)Ala (27)Glu (28)Asp (29)Glu (30)Ser (31)Ala (32)Glu (33)Ala (34)Phe (35)Pro (36)Leu (37)Glu (38)
actual massb
99.13128.799.13
163.1797.12
114.1057.0571.07
129.12115.09129.1287.0871.07
129.1271.07
147.1897.12
113.16129.12
exptl massb,r
98.97 ± 0.52 (1.29)128.15 I 0,48 (0.44)99.20 ± 0.35 (0.27)
162.43 ± 0.11 (0.99)97.49 ± 0.14 (1.25)
114.21 = 0.82 (0.69)57.22 = 0.88 (0.68)70.19 = 0-19 (4.40)
130.22 = 0.'l7 (4.22)114.81 I 0.58 (0.41)12927 ± 0.6l (0.39)87.14 ± 047 (0.30)70.94 ± 0.49 (0.51)
129.39 ± 0.42 (0.44)71.09 .L 0.30 (0.28)
147.03 ± 0.73 (0.77)96.83 ± 0.64 (1.18)
113.63 ± 0.54 (1.34)128.40 ± 0.52 0.29)
replicaLcs
22
10121266
---------------
Figure 5. MALOI spectra of three selectad peptides, osteocalcin7-19 fragment (GAPVPYPDPLEPR) (A), angiotensin 1 (DRVYIHPFHl) (6), and bradykinin (RPPGFSPFR) (C) resulting from on-platedigestions using CPY concentrations of 3.05 ,. 10-4 , 3.05 X 10⁻⁴ ,
and 6.10 x 10⁻⁴ units/Ill, respectively. The symbol Na denotes asodium adduct peak, and # denotes a matrix peak at m/z = 568.5Da.
alaemin, bombesin, and a.-MSH). This is significant as thesepeptides would lend no infonnation to the Edman approach. Anumber of the peptides were sequenced until the detection of thetruncated peptide peaks was impaired by the presence CHCAmatrix ions «600 Da). The sequencing of the other peptidesdid not go as far as a combination of residues at the C-tenninusand penultimate position that inhibited CPY activity was encountered. Bombesin, angiogenin, and glucagon gave gaps in thesequence as residues that were cleaved slowly were fonowed by
3976 Analytical Chemistry, Vol. 67, No_ 21, November 1, 1995
residues hydrolyzed more rapidly, as discussed above. Thefeasibility of the on-plate CPY digestion!MALDI detection strategyappears to be independenl of the overall polarity and charge ofthe peptide,
Figure 5 shows selected on-plate digestions of osteocalcin 7-19fragment, angiotensin 1, and bradykinin Each spectrum represents the results of one of the nine digestions that was performedacross the row of wells, Osteocalcin 7-19 fragment and angiotensin 1 were sequenced until a proline was encountered at theC-tennini. Although CPY can proceed through proline. li - li, thepresence of Asp and His at the respective penultimate positionsof the two peptides prohibits further CFY activity. Bradykinin isshown to sequence until the matrix begins to interfere with peakdetection. For all three of the selected peptides, the total sequenceinformation obtained for the overall nine-wel1 digestion is represented in the single digestion shown. For many other peptidesthis was not the case. The total sequence infonnation is oftenderived from two or more of the wells as is the case with ACTH7-38 fragment givCll in Figure 4.
Statistical Analysis of Ladder Sequencing by MALDI. Todate, most reports of ladder sequencing bave concentrated ondemonstrations of methodology using knO"l1 matclials, but to beuseful, these techniques must be extended to unknowl1 seqnences.The confidence with which those sequences may be called restson instrumental mass accuracy, that is, on numeri.cal analysis (insharp contrast to Edman sequencing calls, which are essentiallyqualitative judgments). However, no individual mass measurement can lend statistical validity to a sequence call.
In order to apply the correct statistical analysis to multiplemeasurements, the nature of the experimental e,Tors must firstbe defined. The J':, mass differences (i.e., experimental massdifference minus actual amino acid mass) for all amino acidassignments made in the 15 aliquots (one spectrum per aliquot)
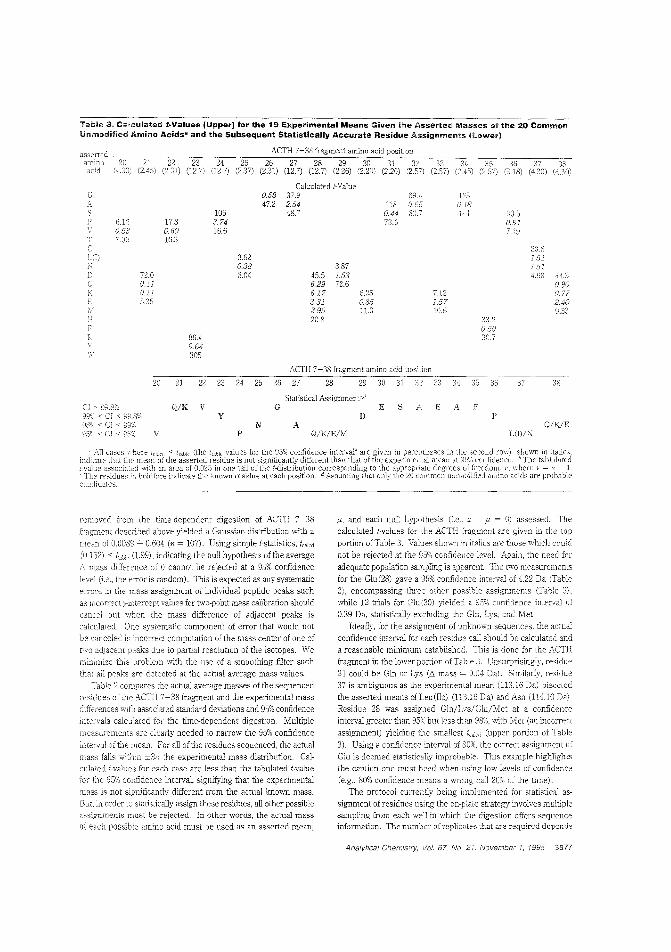
Table 31. Caiculated t..Values (Upper) for the 19 Experimental Means Given the Asserted Masses of the 20 CommonUnmodified Am~no Acidsa and the Subsequent Statistically Accurate Residue Assignments (Lower)
ACTH 7-38 fragment amino acid position
20 21 22 23 24 20 26 27 28 29 30 31 :i2 33 34 35 36 37 33('i.3m (2.45) (2.31) (l2."il 112.7) (237) (231) (12.7) (12.7) (2.26) (2.20) (2.20) (2.57) (2.57) (2.45) (2.57) (318) (4.30) (4.30)
Calculated I-Value0.58 37.9 69.4 12347.2 2.54 118 0,65 0.18
105 48.7 0.44 807 30.5p 17.8 3.74 73.6 0.91
0.53 0.60 16.6 7197.0~) 16.3
C 33.6VI) 3.62 1.51
0.38 3.87 1.51D 72.0 3.04 45.5 1.53 4.08 44.:3
0.11 6.29 72.6 0.90K 0.11 6.17 6.25 7.12 0.77
5.35 3.31 0.85 1.57 2.402.95 11.0 lO.6 9.3320.8 33.2
0.50L 80.4 30,7y' 9.64
305
ACTH 7-38 fr2.gment amino acid jJosi:.ion
20 21 22 23 24 25 26 27 28 29 30 31 CJ;) 36 37 38
Statistical Assignmentr.dQ/K V G E S E
Y PN A Q/K/E
P Q/K/E/M L(l)/N
removed D-om the time-dependent digestion of ACTH 7-38fragment desctibed above yielded a Gaussian distribution with a
mean of 0.0089 ± 0.604 (n = 107). Using simple I-statistics, b"'d(0.152) < (1.99), indicating the null hypothesis of the average
6. mass difference of 0 cannot be rejected at a 95% confidence
level (Le., the error is random). This is expected as any systematicin the mass assignment of indi;idual peptide peaks such
as incorrect y-imercept values for tv.'O-point mass calibration should
caDcel out \vhen the mass difference of adjacent peaks is
calculated. One systematic component of error that would notbe canceled is incorrect COmpLtatiOn of the mass center of one of
two adjacent peaks due to partial resolution of the isotopes. We
minimize this problem with the use of a smoolhing filter suchthat all peaks are detected at the actual average mass values.
Table 2 compares tbe actual average masses oftho sequenced
residues of the ACE 7-38 fragment and the experimental mass
differen:es 'Nith associated standard deviations and 95% confidenceintervals calculated for the time-dependent digestion. Muitiple
me,,"sur~ments are clearly needed [Q narrow the 95% confidence
of tbe mean. For all of the residues sequenced, the actual
mass falls with:n ±30 the experimental mass distribution. Cal
culated l-va1ues for each case are less than the tabulated I-valuethe 95% confidence interval, signifying that the experimental
mass is not significantly different from the actual known mass,8ut, in order to statistically assign these residues, all other possibleassignments must be rejected. In other words, the actual mass
of each possible amino acid must be used as an asserted mean,
1', and each null hypothesis (i.e .. x - ,u = 0) assessed. Thecalculated I-values for 'he ACTH fragment are given in the top
portion of Table 3. Values shown in ij}llies are those which could
not he rejected at the 95% confidence level. ..A,gain, the need for
adequate population sampling is apparent. The two measurements
for the Glu (28) gave a 95% confidence interval of 4.22 Da (Table
2), encompassing three other possible assignments Crable 3),while 12 trials for Glu (30) yielded a 95% confidence inter'/al of
0.39 Da, statistically excluding the Gln, Lys, and Met.
Ideally, for the assignment of unknown sequences, the actual
confidence interval for each residue call should be calculated anda reasonable minimum established. This is done for the ACTH
fragment in the lower portior ofTabie 3. Unsurplisingly, residue
21 could be Gin or Lys (,; mass 0.04 Dai. Similarly, residue37 is ambiguous as the experimental mean (113.16 Da) bisected
the asserted means of Leu(Ile) (113.16 Da) and Asn (114.10 De)
Residue 28 was assig:led Gln/Lvs/Glu/Met at a conficence
interval greater than 95% but less tban 98%, with Met (an incorrect
assignment) yielding the smaliest (upper portion of Table
3). Using a confidence interval of 80%, the correct assignment of
Glu is deemed statistically improbabie. This example highlights
the caution one must heed whf'TI lJs:ng low levels of confidence
(e.g., 80% confidence means a wrong call 20% the time).
The protocol currentiy being implemented for statistical as
signment of residues using the on-plate strategy involves multiplesampling from each well in which the digestion offers sequenceinfonnation. The number of replicates that are required depends
Analytical Chemistry, Vol. 67. No. 21, November 1, 1995 3977
on amino acid(s) that is (are) being sequenced at that CPYcon·::::entration. For example, more replicates are required for massdifferences around 113-115 (IJe/Leu, Aso, and Asp) and 128
129 Da (Gln/Lys/Glu) than for mass differences around 153 (Tyr)
or 57 Da (Gly) in order to be able to assure that all but oneassignment are statistically unlikely The experimental errors for
this method appear to be as random (multiple replicates persample) as for the time-dependent digestion (one replicate per
sample).
This general statistical approach to residue assignment canbe extended to adjacent peaks that represent the loss of rna or
more amino acids. In this case, the asserted means of alldipeptides, tripeptides, eT., can also be used to calculate I-values.'Tl1e information concerning the order of the residues will be lo~t
but the composition can be deduced. Using only single amino
acid and dipeptide masses as asserted meal:s, this is done forangiogenin, which has a sequence gap of Phe-Arg (Table 1). The
average experimental mass differe:1ce between the peaks repre
senting the loss of Arg(15) and Phe(13) was 203.45 ± 0.328 (n =
5). For all single amino acid and dipeptide masses except Phe/Arg, the calculated I-values are greater than the tabulated I-value
at" confidence interval of 99.8%. This statistical strategy can easilybe incorporated into a computer algorithm that performs interactive data acquisilion, analysis and interpretation of ladder sequenc~
ing/MALDI experiments.
CONCLUSIONSThe use 0' CPY digestion coupled with MALDI detection has
been shown to be an effective method for obtaining C-terminal
sequence information. The ACTH 7-33 fragment yielded sequ,ence information 19 amino acids from the C-terminus without
3978 Analytical ChemCstry. \fol. 67, No 21. ,'liovember 1, 1995
gaps for a 25-min optimized time-dependent The OrJ-
plate concentration-dependent approach was demonstrated
novel method for performing multiple digestions in parallel.
circumvents the need for tb1e- and reagent-consuming methoddevelopment. This on-plate strategy requires less physicalnipulations and practically less total amounts onzy,ne
peptide. Of the 22 peptides attempted using the orrp ate approach,all but three were successfully digested to yieid C-tenninal
sequence information. CPY was also shown to amidatedC-terminal residues, but possessed no activity C\)ward certaincombinations of residues existing at the C-termim:s and
mate position.A protocol for statistical analysis of the resulting peptide
ladders was offered. Statistical levels of confidence can beon am:no acid assignments of residues usingThis strategy affords the opportunity to derive primary a..m.inocomposition infonnation from experiments th2t produce sequencegaps. It also offers quantitative information regal'ding
that reduction in the expelimcntal elTor plays on number
measurements needed for accurate amino acid assi.gnmem.general statistical strategy can be implemented any type of
mass ladder experiment (i.e., DNA PNA and ]Jolysllcchalide) and
can be used to offer composition infonnation in casessequence gaps are present.
Received lor review May 24, 1995. Accepted .lIugust1995.&
AC950501G
e Abstract published in Advance ACS /liJstracts
Anal. Chern. 1995, 67, 3979-3984
Structural Characterization of Phospholipids byMatrix-Assisted Laser Desorption/IonizationFourier Transform Ion Cyclotron Resonance MassSpectrometry
Jarrod A. Mal10t
Department of Chemistry, The Ohio State University, Columbus, Ohio 43210
forest M. White, 5taci Seldomridge, and Alan G. Marshall*'*
Center for Interdisciplinary Magnetic Resonance, National High Magnetic Field Laboratory, 1800 East Paui Dirac Drive,Flonda State University, Tailahassee, Florida 32310
E.; Pi:pi, n.: \I1:lrhury, G. D.: I-Iass, J. R,: Dj(,fass;,Am. Chern. 1984,106.524,(-)-5251.
(23) Demirev, P. A Biomed. J\1ass Spectmm. 1987, 14.24]-246.(24) Kim, H. Y; Salem, )J. A/,ul. Gem. 1986, 58, 9-14(25) Kim, H. Y.; Salem, :.J.Aiid Gem. 1987,59,722-726.(26) Cotter, R ].: Tabet.]. C. Int. j. Mass Spec/rom. Ion rhys. 198~-3. 53, [;jl
166.t2't)
(3) Lewis. R. A; Austen, K. Clin. hvest. 1984, 73,889-897(4) Low, M. G.: Saltiel. A R 1988.239.268-275.(5) Thomes, ]. R.; Dv\'ek, R. A; R,;,dem;;:cLcr, T. W, Biochemistry 1990, 29,
5413-5422.(6) Kamit2.ni, 1.; Menon, A. K.; Hallaq, Y: Warren, C. D.: Yeh, E. 1. H.I BioI.
Chem. 1992,267,24611-24619.(7) GOlh, A.: Adams, H. R.: Knoohuizen. l\L Science 1971. 173, :034-1035.(8) Martin, T. W.: Lagur.ofL D. Nature 1979, 279, 250-252.(9) Martin, T W.: LagumfJ. D. Binrhemist?"') 1980, 19, 3106-3113.
(10) Klein, R. Lipid. Res. 1971, 12. 123-131.(11) Klein, R. Lipid Res. 1971, 12, 628-63£_,.(12) Ohash~ Ol'lashi, y.: Shida, y. Org. jvlas.s Sptcfrom
1985.20,642-643.(13) Wood, G. W.; uu, P. Y. Bionud. Mass Spectrom. 1974. 1,(14) Wood, G. W.; uu. P. Y; Rao, G. N. S. Biamed. ",yfass Spec/rom. 1976.3.
172-176.(15) Wood, G. W.: Lau. P. Y.: \!larrow. G.: Rae. G. 1\. S.; Schmidt, D.I.: TUe'bner,
]. Chem. Phys. Lipids 1977, 18, 316-333.(16) J.; Kino, M.: Saito, K.: Matsuo, T: Matsuda, IL Kalakusc,
Mass 1982.9.293-301.(17) Lehma1.n, W. Kessler, M. Chem. PlIys. Lipids 1983, 32. 12?,- E2..(18) Foltz, R. L. 1972,35, 344-32.i3.(19) Crawford, C. Plattner. R D. I Res. 1983. 24. 456-460.(20) Bisseret. P.; Nakatani, Y.; Ourisson, Hueber, R.; Teller, G. Oem. Phy;;.
LipidS 1983, 33, 333-;:;92.(21) ]ungalwala, F.; Evan:", J E.; McCiuer. R. H.]. Li/Jid Res. 1984.25.738
749.(22)
Lindner. B.: Z8:hringer, U.: Rietschel, E. T.: Kusumo1.O, S.: S11iba,MassSpectmm. 1984,11,132-141.
(28) W2.hl, M. c.: Kim, H. S.: Wood, T D.: Guan. S.: Marshal1. A. G. Anal. Chem.1993,65,3669-3676.
(29) Fenwick, G. R.; F..agles,.r.: Self. R. Biomed. ]'vlcss Speetrom. 1983. ]0,382386.
phatidylethanolamine (GPE) and -inositol (GPDHi have beenidentified as key elements in anchoring various proteins to cellmembranes. Finally, glyerophosphatidylserine (GPS) has beenshown to stimulate histamine secretion from mast cells.H
Mass spectrometric analysis of phospholipids has previouslybeen attempted by eleen-on ionization (El), ](1-12 field desorption, H-17
chemical ionization (CI).18-22 plasma nesorption. 23 thennosprayjEI,24.25 laser desorption,2H8 and fast atom bombardment (FAB)?'-:J:JTo date, FAB has been the most successful ionization methodfor phospholipid mass analysis; much of that work Jas been
addr(',~~S; Nmiomtl High Magnetic Field Laboratory, Florida State
Matrix-assisted laser desorption/ionization (MALDI) Fourier transform ion cyclotron resonance mass spectrometryprovides for structural analysis of the principal biologicalphospholipids: glycerophosphatidylcholine, -ethanolamine, -serine, and -inositol. Both positive and negativemolecular or quasimolecular ions are generated in highabundance. Isolated molecular ions may be collisionallyactivated in the source side of a dual trap mass analyzer,yielding fragments serving to identify the polar head group(positive ion mode) and fatty acid side chains (negativeion mode). Azimuthal quadrupolar excitation followingcollisionally activated dissociation refocuses product ionsclose to the solenoid axis; subsequent transfer of productions to the analyzer ion trap allows for high-resolutionmass analysis. Cyro-cooling of the sample probe "ithliquid nitrogen greatly reduces matrix adduction encountered in the negative ion mode.
Phospholipids are the principal components of biological cellbilayer membranes and of various subcellular organelles. Thebasic phosphobid structure consists of a glycerol backbone joinedto an alkyl chain at sn-l, through either an ester or ether linkage,and a second alkyl group esterified at sn-2. A phosphate diester<1\ the 5n-3 position joins one of four typical polar head groups,which in tum define the particular phospholipid class: phosphatidylcholine (PC), ,ethanolamine (PE). -serine (PS), or -inositol(PD. The alkyl chain length (s) and degree of unsaturation furtherspecify a par1icular phospholipid within each class. (Otherohospholipid classes, such as sphingomyelins and cardiolipins,ar'e not considered here.) The biological role of phospholipids'n bet extends beyond that of membrarle building blocks. Forexample, glyerophosphatidylcholines (Gpes) containing arachidonic acid yield, upon hydrolysis. free arachidonic aoin, which isin tern converted to oxygenated species such as prostaglandins,thromboxanes. and leukotrienes.l-3 In addition, glycerophos-
" member of of Chemistrj, Florida State University.Smnue!sson, Gra:lstrcm, E.; Hamberg, M.; Hammarstrom,S.: Malms1.('n. ~. Ai1J1U. Rev. Biochem. 1978,47,997-1029.
(2) SmnllClsson, Sci?;/ce 1983, 220, 560-~)'i5.
0003·2700/95/0367·397989.00/0 © 1995 American Chemical Society Analytical Chemistry, Vol. 67, No. 21, November 1, 1995 3979
thoroughly ,'eviewed by Murphy and Harrison."' Recently, Kimand co-workers'" and Han and Gross?'1i have applied electrospray
ionization to phospholipid mass analysis.
From its introduction in 1988,37.38 matrix-assisted laser de
sorption/ionization (MALOI) has provided a versatile and sensitivemeans for producing singly-charged gas-phase biomolecules for
mass analysis.:)!";:' In particular, the combination of MAIDI and
Fourier transfonn ion cyclolTon resonance mass spectrometry (FT
ICR/MS) offers ultrahigh mass resolution, unparalleled mass
accuracy, and MS' capabilities. Recent advances in FT-ICRinSlTIlmentatiol1, most notably ion axialization,41 allow for all of
these advantages to be realized simultaneously. For example,
Huang et a1." have recently shown that simultaneous application
of dipolar and azimuthal quadnlpolar excitation in the source sideion trap of a dual trap mass analyzer allows for MS" up to n = 4;
at each stage, product ions fcrmed during collisional activation
may be refocused along the central axis cf the eiectrostatictrapping potential and passed through a conductance limit to a
second low-pressure analyzer ion trap for analysis at ultrahighmass reso1ving power.
Here, we demonstrate the as-yet unrecognized potential of
MAIDI FT-ICR/MS for mass analysis of phospholipids. We find
that MS/MS based on sustained off-resonance (dipolar) irradiation(SO RI) 4:1 of both positive and negative molecular ions generates
structurally informative fragment ions, which may be axialized
by broadband azimuthal quadrupolar irradiation in the presenceof argon coliision gas.4:!,'14 The fragment ions may then be
transferred to a second low-pressure anaiyzer ion trap for high
resolution mass analysis. We discuss and interpret preliminary
results for a variety of matrices. We also demonstrate a samplecryo-cooling technique which minimizes matrix adduct formation
encountered in negative ion mode.
EXPERIMENTAL SECTION
Instrumentation, All FT-ICR mass spectra were acquired at
3 T with an EXITe] FTM5-Z000 FT-ICR mass spectrometer (Extrel
Waters, Madison, WI), equipped with a dual ion trap massanalyzer, an automatic insertion probe. and an Odyssey data
station. A LTV laser beam from either a frequency-tripled 355 nm
Nd:YAG (Surelite II, Continuum, inc., Santa Clara, CAl or a 337
urn nitrogen laser (VSL-337, Laser Science, Inc., Newton, Ml\.)
(::;0) Sherman. W. R.: K E.; Bateman, R. F.; Green, B. N.: Lewis, l.iv/a.ss Sj){;crfOiil. 1985. 12, 409-413
(31) ':enS('l1, :\. j.; Tomcr. K B.; Gross, M. L. Lipids 1986.21,580-588.Jensen. Tomer. K B.: Gross, L. Lipids 1987,22,480-489.
('l::) M. J.: Enkc, C. c; 1991.63. :032-1038.(34) \!Iurphy, R c.: Harrison. K Alass Spectrom. Rev. 1994,13,57-75.(3:')) l<..im, l-l. Y.: \Vang, T. C Y. Anal. 1994,66,3977-3982.(36) Han, X.: R. V'...'. Proe. Acad. Sci. U.s.A. 1994,91.106:35-10639.(3~') Karas, F. Anai. Chem. 1988, 6C. 2299-2301
(3S) Tanaka. K: \\'aki. H.: Ido. Y.: Akira. S.: Yoshida. Y; Yoshida, T. Ra.-Did.Iv/ass $perimm 1988, 2,
(39) I-fillE'nkam:). F.: Karas. T. Anal. Chem. 1991,63,1193A-120:IA.
(40) Karas. Bahr, U. ,Wass Spectrom. Rev. 1991, 10, 335-
Guan. S.: Kim. H. S,; Marshall. A. G.: Wahl, Wood, T. D.: Xiang, X.Chem. Rev. 1994.94. 2l()l-21K2.
(42) Huang, Y.: Pa;';a-Tolic. L: Gmm, S.; Marshal, A. Anal. Chem. 1994, 66,
4:-385-4389.(43) Gauthier, J. \Y.: TraULl1\,UL 1'. K: Jacobson, B. Anal. Chim. Acta 1991,
246, 211-225.(44) Guan. S.: Wahl. M. c.: :Vlarshal1, A. G.]. Phys. 1994,100,6137-
6140.
3980 Analytical Chemistry. Vel. 67, No. 21, November 1, 1995
was directed through a window in the analyzer of the mainvacuum chamber. The beam was focused by a telescope lensassembly (Nd:YAG laser) or aIm focal length (nitrogen
laser) through the conductance limit separating sourceanalyzer traps and onLo the sample probe. TI1C relay' for swi.tchingbetween dipolar and quadrupolar excitation was similar to
described previously.'" Due to the higb capacitive load presentedby this circuit, a low~power (,,-,27 Vp __ p) Nicolet excit3tion amplifier
was used in place of the high-power amplifier supplied with the
FTM5-2000 mass spectrometer.Sample Preparation, Appropriate aliquots of swck solutions,
1 mM phospholipid (Sigma Chemical Co __ St Louis. MO) in
chloroform or 50:50 (v/v) chlorofom:/methano'. and
matrix in methanol acidified with 0.1% (vIv) trifboroaceticwere combined to make sample solutions, each conrmning (unless
othef'-'~se noted) matJix/analyte at 5000:1 mole ratio.
all phospholipids were used as received (Tom Sigma, withoutfurther purification. Twenty microliters of sample solution,
containing "-'3.5 nmol of sample, was then applied to a stainless
steel probe tip and allowed to dry completely before insertion intothe mass spectrometer. Based on the relative size of the sanple
probe and laser spot, and assuming even sample distlibutio:l
the probe surface, we estimate that -1.5 pmol of lipid is desorbc-dper laser shot
FT-ICR Experimental Event Sequence. Ion trapping was
facilitated by biasing the conductance limit plate to ±9 V (positi"eion/negative ion), the source trap plate to ground potentiaL and
the sample probe to ±2 V for 50-7511S during the laser fire event[laser pulse width was -7 ns (Nd:YAG) or -3 (nitrogen) I.After ionization, the source tyap and conductance limit plates wereset to ±2 V, and the ions were allowed to relax to ~he central L1"2P
axis for 2-4 s. Note that each sprectrum presentecl was generated
from a single laser shot For broadband excitation and detection[Figures 1 and 6 (top)], standard chirp excitation (1-500 liE-Iz al
a sweep rate of 100 Hz//is at -27 Vp_p amplitucie) and dipolar
detection (256K time domain data acq'lired with a 1 MHz Nyquistbandwidth) were then canied out in the source-side ion trap.
time domain signal was Fourier transformed ",O,hC"'70,-".iin]""
or apodization and displayed in magnitude mode.For collisional activation [Figures 2-5 and (bottom)].
molecular ion isotopic distribution of interest was first isolated
by use of SWIFT radial ejection of undesired followed
by sustalned off-resonance (single-frequency) in-adiation'11'_1' for 300-500 ms) 43 One hundred milliseconds later, a series
of broadband SWIFT azimuthal quadrupolar excitation waVef0l111S
(spaced 250 ms apart) served to axialize the p'-oductPressure in the source-side ion trap was held constant at
10--7 Torr during collisionally activated dissociation and axializa
tion. Following transfer of ions through a conductance limit tothe analyzer ion trap, dipolar frequency sweep excitation (1-500
kHz at a sweep rate of 1000 Hzlps at ~78 '11'_;' amplitude) and
detection (1 M time domain data acquired with 1 MHz Nyquist
bandlNidth) were perionned, The time domain signal was Fourier
(45) Speir.]. P.: Gonnan, G. S.: Pitsenbergcr. C.Amster. L lAnaI. Chem. 1993. 65,
(46) Marshall, A. G.: Wang, T.-c. L Ricca. T.7893-7897.
(47) Marshall, A. G.:
A'lass Spectrometry: E,~'~d'~~I~;~'o;,~,t~~~a~:'~~~~,~~~~l~:::;ie;~C~:~;,~~::, ~;;::'::Series 359: Buchanan. M. v..DC, 1987; pp 21- 33.
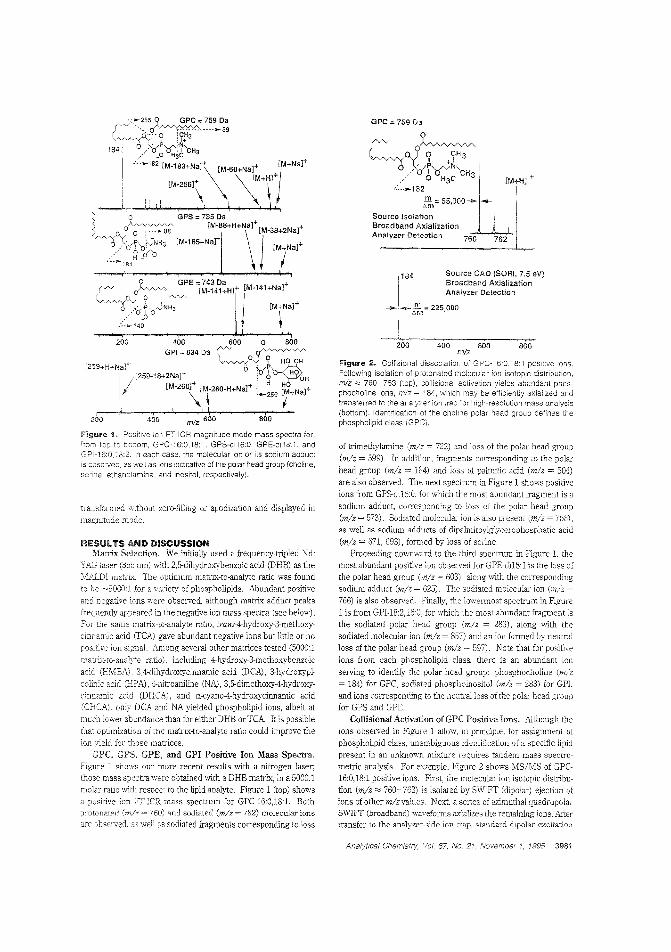
GPC = 759 Da
or Q?~~ '( ~ +~°.. "(/ I 'o/V I ' CH3 !
.-.' _0 H3C lM+HJ+0':---...182 I
1*,= 55,000--...... iSource Isolation .Broadband P,xi~lization 1 J I IAnalY2cr Deteotlon 760 762.
[M-141+Na]+
I
J
184 Source CAD (SORI, 7_5 eV)Broadband AxializationAnalyzer Detection
225,000
200m/z
Figure 2~ Collisional dissociation of GPC-'i6:0,18:1 positive ions.Following isolation of protonated molecular ion isotopic distribution,m/z '" 760-763 (top), collisiona activation yields abundant phosphOc'101ine ions, m/z = 184, which may be efficiently axiaiized andtransferred te the analyzer ion IraJ for high-resolution mass annlysis(bottom). tdentification of the choline polar head group defines thephospholipid class (GPC).
of trimethylamine = 722) and loss of the polar head group(mlz = 599). In addition, fragments corresponding to the polar
head group (mlz = 184) and loss of palmitic acid (mlz = 504)are also observed. The next spectn.:m in Figure 1 shows positiveions from GPS-diI6:0, for which the most abundant fragment is asodium adduct, corresponding to loss of the polar head group(mlz ~ 573). Sodiated molecular ion is also present (mlz = 758),as well as sodium adducts of dipalmitoy1g1ycerophosphatic acid
(mlz = 671, 693), formed by loss of serineProceeding dO\;llward to the third spectrum in Figure 1, the
most abundant positive bn observed for GPE-diI8:1 is the bss ofthe polar head group (mlz = 603). along \Yith the correspondingsodium adduct (mlz - 625), TIle sodiated molecular ion (mlz =766) is also observed. Finally, the lowemlOst spectrum in Figurc1 is from GPI-18:2,16:0, for which the most abundant fragu,ent isthe sodiated polar head group (mlz 283), along with thesodiated molecular ion (mlz = 857) and an ion fonned by neutralloss of the polar head group (m/z = 597). Note that for positiveions from each phospholipid class, there is an abundant ion
serving to identify the polar head group: phosphocholine (mlz= 184) for GPC, sodiated phosphoinositol (mlz = 283) for GPl,
and ions corresponding to the neutral loss of the polar head groupfor GPS and GPE.
Collisional Activation of GPC Positive Ions. Although theions observed in Figure 1 aHow, in principle, for assignment ofphospholipid class, unambiguous identiiicaLioIl of a specific lipidpresent in an unknowll mixture requires tandem mass spectrometric analysis. For example, Figure 2 shows MS/MS of GPC16:0,18:1 positive ions. First, the molecular ion isotopic distIibution (mlz'" 760-763) is isolated by SVVIFT (dipolar) ejection ofions of other m/zvaiues. Next, a series of azimuthal quadrupolarSWIFT (broadband) waveforms axializes ihe remaining ions. Aftertransfer to the analyzE':r~side ion trap, standard dipolar exCitatiO:1
400 600 ~800
GPI = 834 Da /VVLvy Q '/vV'-
+ ' 0y 9 HO OH[259+H+NaJ ° '" /p,~
!I [25S-18+2Nat jO 6°H~6H: [M-260]+ [M-260-H+NaJ+ i H [HM N J+
ill \ t '-259 ! + a
2~' 400 " m/z '6bo 860'
Figure i. Positive ion FT-lCR magnitude mode mass spectra for.hom tco to beJom, GPC-16:0, 18:~. GPS-di16·.O, GPE-di18: 1, andGPI-16:0.18:2. In each case. the molecular ion or its sodium adductis cbseved, as well as ions indicative of the polar head group (choline,serine, ethanolamine, and inositol, respectively).
transformed \Yithout zero-filling or apodization and displayed inmagnitude mode.
I'IESULTS AND DISCUSSIONMatrix Selection, We initially used a frequency-tripled Nd:
YAG laser (355 nm) with 2,5-dihydroxybenzoic acid (DHB) as the]'vlALDI matrix. The optimum matrix-to-analyte ratio was foundto be ~5000:1 for a variety of phospholipids. Abundant positive
ane: negative ions 'Nere observed, although matrix adduct peaksfrequently appeared in the negative ion mass spectra (see below).For the same matrix-to-analyte ratio, rrans-4-hydroxy-3-methoxycinnamic acid (TCA) gave abundant negative ions but little or nopositive ion signaL Among several other matrices tested (5000:1matrix-to-anaij~e ratio), including 4-hydroxy-3-methoxybenzoic
acid (HMBA) 3,4-dihydroxyc'nnamic acid (DCA), 3·hydroxypi
colinic acit! (EPA), 4-nitroaniline (NA), 3,5-dimethoxy-4-hydroxycinnamic ccid (DHCA) , and a-cyano-4-hydroxycinnamic acid(CHCA), only DCA and NA yielded phospholipid ions, albeit atmuch lower abundance tha'l for either DHB orTCA It is possiblethat optimization of the matrix-to-analj1e ratio could improve theion yield for those matlices.
GPC, GPS, GPE, and GPI Positive Ion Mass Spectra_Figure 1 shows our more recent results with a nitrogen laser;those mass spectra were obtained 'i'lith a DHB matrix, in a 5000:1molar ralio with respect to the lipid analyte. Figure 1 (top) showsa positive ion FT-ICR mass spectrum for GPC-16:0,18:1. BothproronaterJ (m/z. = 760) and sodiated (m/z= 782) molecular ions
are J bserved, as well as sodiated fragments corresponding to loss
200 400 600 800
Analytical Chemistry, /01.67. No. 21. November 1, 1995 3981
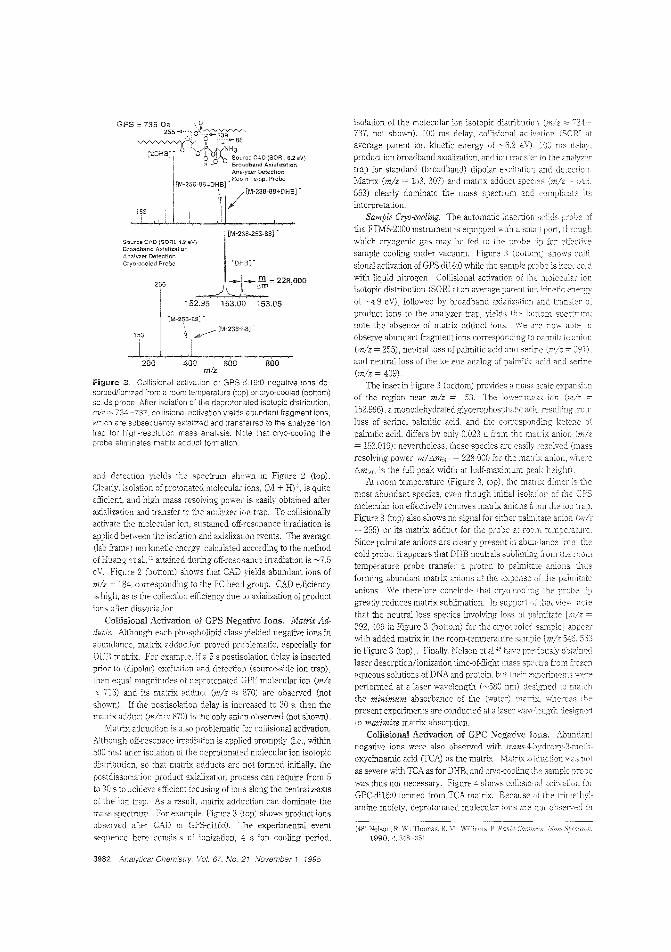
m/zFigure 3v Collisional activation or GPS-di16:0 negative ions desorbed/ionized from a room temperalure (top) or cryo-cooled (bottom)so ids probe. After isolation of the deprotor,ated isotopic distribution,mjz::::::. 734--737. collisional activation yields ablndant fragment ions,wrich are subsequently axialized and transferred to the analyzer iontmp for high-resolution mass analvsis. Note that cryo-cooling theprobe eliminates matrix adduct formation.
(48) Nelson. R. \V.: Thomas. R.1990.4,348-'351.
isolation of the molecular i)n isotopic distribution (mlz734737, not shown), 100 ms delay, collisional activation (SORIaverage parent ion kinetic energy of "-6.2 ev;, 100 msproduct ion broadband axialization, and ion LTansfer to the analyzertrap for standard (broadband) dipolar excitation andMatrix (mlz = 153, 307) and matrix adduct species (m/z =563) clearly dominate the mass specD'um and complicate itsinterpretation.
Sample Cryo-cooling. "The automatic insertion solids probethe FTMS-2000 instrumenl is equipped w,th smail port, throughwhich cryogenic g<'lS may be fed to the probe forsample cooling under vacuum, Figure 3 (lJottom) showssional activation of GPS-diI6:0 while the sample probe is keptvvith liquid nitrogen. Collisional activation of molecular ienisotopic distribution (SORI at an average parent ion kinetic enerxli"of ~4,9 eV), followed by broadband axializationproduct ions to the analyzer (Tap, yields the borcomnote the absence of matrix adduct ions. Weobserve abundant fragment ions corresponding to palmitate anien(m!z = 255), neutral loss of palmitic acid and (mlzand neulralloss 01 the ketene analog of palmitic and
(mlz = 409),The inset in Figure 3 (bottom) provides a rnass scale expansion
of the region near mlz = 153, The lower-mass (mlz
152.996), a monodehydrated glycerophosphatic resultingloss of serine, palmitic acid, and the corresponding ketenepalmitic acid, differs by only 0,023 u [rom the anior= 153,019): nevertheless, these species are easily resolved (massresohing power, m/6.m,ill = 228 000 for the matrix anion,!::"mso',', is the full peak width at half-maximum peak height).
At room temperature (Figure 3, top), thE mat:ix dimermost abundant species, even though ini[ial isolation of GPSmolecular ion effectively removes matrix anions theFigure 3 (top) also shows no signal for either palmitate anion (mlz
= 255) or its matrix adduct for the probe temperature.Since palmitate anions are clearly present abundancecold probe, it appears that DHB neutrals 3ubliminis from room
temperature probe transfer a proton to palmitate anions,forming abundant matrix anions at the expense the pahr:itateanions. We therefore conclune I~hat cryo-coolir,c..?; the probegreatly reduces matrix sublimation. In supportthat the neutral loss species involving loss of palmitate392,409 in Figure 3 (bottom) for the cryocooled sample] appearwith added matrix in the room-temperature sample [m!z
in Figure 3 (top)], Finally, Nelson et al." have previously obtainedlaser desorption/ionization rime-DE-flight mass spectra fromaqueous solutions of DNA and protein, but their expeliments wereperfonned at a laser wavelength (~580 nm) designedthe minimum absorbance of the (water) whereaspresent expeliments are conducted al a laser wavc'cngthto maximize matrix absorption,
Collisional Activation of GPC Negative Abundantnegative ions were also observed 'l7.ith trans-4-hydroxy-3-meth
oxycinnamlc acid (TCA) as the matrix, Matrix aclduction was notas severe with TeA as for DHB, and clyo-cooling the smnplewas thus not neceSSaly. Figure 4 shows collisional activationGPC-di16:0 formed from TCA matrix, Because the trimothy'-amine moiety, deprotonated molecular ions are
800
[DrSrI
........... ~ = 228,000
IM-238-S8] -
152.95 153.00 i 53.05
153
~L,~.L,I--,200
Analyzer DetectionCryo-cooled Probe
Source CAD
GPS = 735 Da "~.... ·S:AAAAAAA250 : 0".:.:no:239 ? v '
O,J 0 ····~88
~\/~ :+NH[20HB]" 0 0 I 'or( 3
I Q d 0 Sou~ce CAD (SORI, 6.2 eV)I H - Br03dband Axialization
I
, Analyzer DetectionRoom Temp. Probe
[M w 256-88+DHB] •
I ~, '/ [M-238-88+DHB] -
153 I I IJLX~~[M-238-256"88] -
and detection yields 6e spectrum shown in Figure 2 (top).Clearly, isolation of protonated molecular ions, (M + H)7, is quiteefficient. and high mass resolving power is easily obtained afteraxialization and transfer 10 analyzer ion trap. To coiJisionallyactivate the molecular ion, sustained off-resonance ilTadiation is
appiled between the isolation and axialization events, The average(lab frame) Ion kinetic energy calcuiated according to the methodof Huang et ai.,!~ attained during off·resonance in-adiation is -----7.5eV. Figure 2 (bottom) shows that CAD yields abundant ions ofm!z = 184, corresponding to the PC head group, CAD efficiencyis high, as is the collection efficiency due axialization of productions after dissociation.
Collisional Activation GPS Negative Ions. J'yfatrix Ad-ducts. Although each phospholipid class yielded negative ions inabundance, matrix adduction proved problematic, especially forDHB matrix, For eXalnple, if a 5 s postisolation delay is insertedplio; to (dipolar) excitation and detection (source-side ion trap),then equal magnitudes of deprotonated GPE molecular ion (mlz
'" 716) and its matrix adduct (mlz '" 870; are observed (notshown). If the postisolation delay is increased to 30 s, then thematlix adduct (mlz'" 870) is the only anion observed (not shown),
Matrix aclduction is also problematic for collisional activation,Although off-resonace in-adiation is applied promptly (i,e" within500 ms) after isolation of the deprotonated molecular ion isotopicdistribution, so that matrix adducts are not fonned initially. thepostdissociation product axialization process can require from 5to 30 s to achieve efficient focusing of iODS along the central z-axisof the ion trap. As a result, matrix adduction can dominate themass spectrum. For example, Figure 3 (top) shows product ionsobserved after CAD of GPS-diI6:0, The experimental eventsequence here consists of ionization, s ion cooling period,
3982 Analytical Chemistry, Vol. 67, No. 21, November 1, 1995
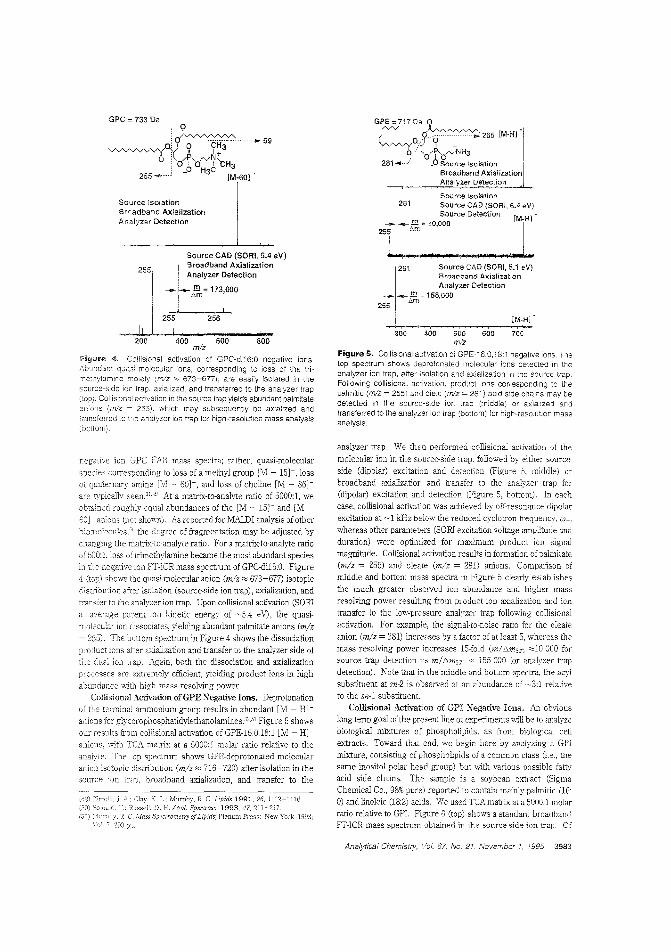
GPC = 733 Da GPE =717 Da 0
) ~~255 [M-HI-I~O 11 +
0./ O\'O/VNH3281 ...···: _0 Source Isolation
Broadband AxializationAnalyzer Detection
Source ~solation
Broadband AxializationAnalyzer Detection
Source CAD (SORI, 5.4 eV)Broadband AxializationAnalyzer Detection
___~= 173,000
mlzfigure 4. Collisional activation of GPC-di16:0 negative ions.Abundant quasi-molecular ions, corresponding to loss of the trimetilylamire moiety (mlz :':;; 673-677), are easily isclated in tilesource-side ion trap. axialized, and transferred 10 the analyzer trap(top). Collisions: activation in the source trap yields abundant palmitateanions (m/z = 255). which may subsequently be axialized andtransferred to tile analyzer ion trap for high-resolution mass analysis(bottom).
200
255
!400
256
600! !
800
I
Source Isolation281 Source CAD (SORI. 6.4 eV)
m Source DetectIon [M~H] "___ ...,- - = 10,000 j
265 "'rrIkJ Pap ...
281 Source CAD (SORI, 5.1 eV)Broadband AxializationAnalyzer Detection
...... .....-~;::155,OOO
255
j [M-H]
300 400 500 600 700m/z
Figure 5. Collisional aolivation of GPE-16:0, 18:1 negative ions, Thetop spectrum shows deprotcnated molecula- ions detected in theanalyzer ion trap, after isolation and axialization the source trapFollowing collisional activation, product ions corresponding to thepalmitic (m/z = 255) and oleic (m/z = 281) acid side chains may bedetected in the source-side ion trap (middle) or axiaJized andIranslerred to the analyzer ior. trap (bottom) for high-resolution massanalysis,
negative ion GPC FAR mass spectra; rather. quasi-molecularspecies corresponding to loss of a methyl group [M - 15] -. lossof quaternary amine [~1 - 60]-, and loss of choline [M - 86]are lypically seen."",9 At a matrix-to-analyte ratio of 5000:1, weobtained roughly equal abundances of the [M - 15]- and [M 60]- anion' (net ShO"l1), As reported for MAiD! analysis of otherbiml01ecules. -, the degree of fragmentation may be adjusted bychanging the matrix-to-analyte ratio, For a matrix-to-analyte ratioof 500:1, loss of trimethylamine became the most abundant species
negative ion IT-ICR mass spectrum of GPC-dil5:0, Figure4 (top) shows the quasi-molecular anion (mlz'" 673-677) isotopicclistlibll.tiof; after isolation (source-side ion trap), axialization, and
transfer to the analyzer ion trap. Upon collisional activation (SORIaverage parent ion kinetic energy of ~5.4 eV), the quasi
moiecular ion ciissociates, yielding abundant palmitate anions (mlz= 255), The bottom spectrum in Figure 4 shows the dissociationproduct ions after <Lxializaton and transfer to the analyzer side ofthe dual ion lrap. Again, both the dissociation and axializationprocesses are extremely efficient, yielding product ions in highabundance "ith high mass resolving power.
Collisional Activation ofGPE Negative Ions. Deprotonationthe terminal ammonium group results in abundant [M - H]
anions for giycerophosphatidylethanoiamines,32";1 Figure 5 showsour results ITom collisional activation of GPE-l6:0,18:l [M - H]anions, with TCA matrix at a 5000: 1 molar ratio relative to theanalyle. The top spectmm shows GPE-deprotonated molecularanion isotopic distribution (mlz'" 716-720) <L'ter isolation in thesource ion trap, broadband axialization, and transfer to the
.r. T..: M.lrphy, R. C. Lipids 1991, 26, 1112- ~1l6.Soiouki. ~.: R,lssel!. D. H. App!' Specrrosc. 1993,47,211-217,
~. C. Mass Spcuroml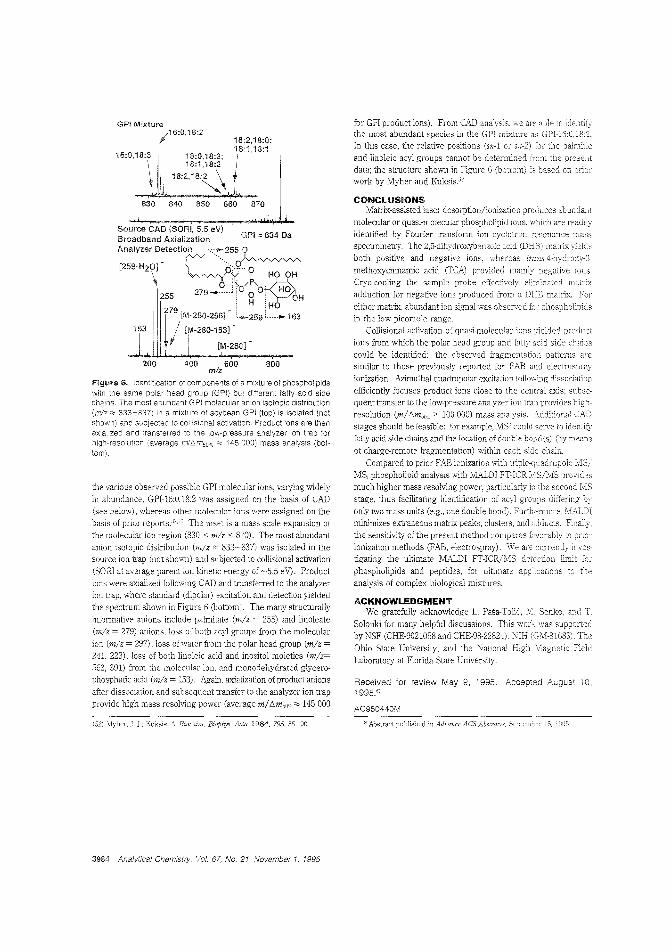
200 400 600 800m/z
figure 6. Identification of components of a mixture of phospholipidswith the same polar head group (GPI) but different fatty acid sidechains. The most abund2.nt GPI molecular anion isotopic distribution(mlz'" 833-837) in a mixture of soybean GPi (top) is isolated (notshown) and SUbjected to collisional activation. Product ions are thenaxalized and transferred to the low-pressure analyzer ion trap forhigh-resolution (average m/[';mSO% '" 145 DOO) mass analysis (bottom).
ACKNOWLEDGMENTWe gratefully acknowledge L. Pasa-Tolic, M. Senko, aEd T.
Solouki for many helpful discussions. This work was supportedby NSF (CHE-9021058 and CHE-93-22824), NIH (GiVI-31683). TneOhio State University, and the National High ylagnetic Field
Laboratory at Florida State University.
Received for review May 9, 1995. Accepled August1995@
AC950440M
for GPI product ions). From CAD analysis, wo are able to ide!1tilythe most abundant species in the GPI mixture as GPI-16:0,18:2.In this case, the relative positions (sn-1 or sn-2) the palmitic
and linoleic acyl groups cannot be determined from the presentdata; the structure shown in Figure 6 (bottom) is based onwork by Myher and Kuksis."
CONCLUSIONSMatrix-assisted laser desorption/ionization produces abundant
molecular or quasi-molecular phospholipid ions, which are
identified by Fourier tra.nsform ion cyclotron :-c'sonance massspectrometry. The 2,5-dihydroxybenzoic acid (DHB) matrlx ylel(le
both positive and negative ions, vlhereas [uills-4-hydrDxy-3methoxycinnamic acid (TCA) pro'ided mainly negativeCryo~cooling the sample probe effectively elirninatecl
adduction for negative ions produced from a DEB matrix. For
either matrix, abundant ion signal was observed for phospholipidsin the low picomo]e range.
Collisional activation of quasi-molecuiar ions vielded product
ions from which the polar head group and fatty acid side
could be identified: the observed fragmentation paltemssimilar to those previously reported for FA13 and electrospny
ionization. Azimuthal quadrupolar excitation follO\\iing" dissociation
efficiently focuses product ions dose to the cemral axis; subeequent transfer to the low-pressure analyzer lon trap prOVIdes
resolution (m/<im511'.:. > 100 000) mass analysis. Additional CADstages should be feasible: for example, MS' could serve to identifyiatly acid side chains and the location of double bond(s) O)y means
of charge-remote fragmentation) within each side- chain.
Compared to prior FAE ionization 'kith triple-ouadrupoie MS/MS, phospholipid analysis with MAiD! FT-ICR !vIS/MS provides
much higher mass resolving power, particularly in the second MSstage, thus facilitating identification of acyl groups differing
only!'kO mass units (e.g., one double bond). FurtlJC1TllOre. llHLDIminimizes extraneous manu peaks, clusters, and8dducts. Finally,
the sensitivity of the present method compares f8vorably toionization methods (FAE, electrospray). We are cun-ently investigating the ultimate M..A,LDI FT-ICR/MS detection limit for
phospholipids and peptides, for ultimate applications to
analysis of complex biological mixtures.
GPI = 834 Da
18:2,18:0;
.~. MO. .~~L;:",lSource CAD (SORI, 5.5 eV)Broadband AxializatlonAnalyzer Detection .,:_ 255 0
~""")~
[259-H
20
] ~d8 If ~OH\ 0 \/)' .
255 279 ........ ·"' 00, HO; H; OH
279 _ i i H
1/~~~:~~~~:;l-:,,-259 ' __ 163
[M-280]
GPI Mixture/16:0,18:2
the various observed possible GPI molecular ions, varying widely
in abundance, GPI-16:0,18:2 was assigned on the basis of CAD(see below). whereas other molecular ions were assigned on thebasis of prior reports.:;i.ji The inset is a mass scale expansion of
the molecular ion region (830 :s; mlz:s; 8(0). The most abundant
anion isotopic distribution (mlz '" 833-837) was isolated in thesource ion trap (not sho'kTl) and subjected to collisional activation(SORI at average parent ion kinetic energy of ~5.5 eV). Product
ions were axialized follo'Ning CAD and transferred to the analyzerion trap, where standard (dipolar) excitation and detection yielded
the spectrum shown in Figure 6 (bottom). The many structurally
informative anions include palmitate (rnlz = 255) and linoleate
(mlz = 279) anions, loss of both acyl group, from the molecular
ion (mlz = 297), loss of water from the polar head group (mlz =
241,223), ioss of both linoleic acid and inositol moieties (mlz=553, 391) fTom the molecular ion, and monodehydrated glycerophosphatic acid (mlz = 153). Again, axializaton of product anions
after dissociation and subsequent transfer to the analyzer ion trap
provide high mass resolving power (average m/<im511% '" 145 000
(52) .vlyheL l J.: Kuk:-;is, A. Biochim. Biophys..Acta 1984, 795, &'5-90. o Abstract published in Advailcc ACS AbslraCis,
3984 Analytical Chemistry. Vol. 67. No. 21, November 1, 1995
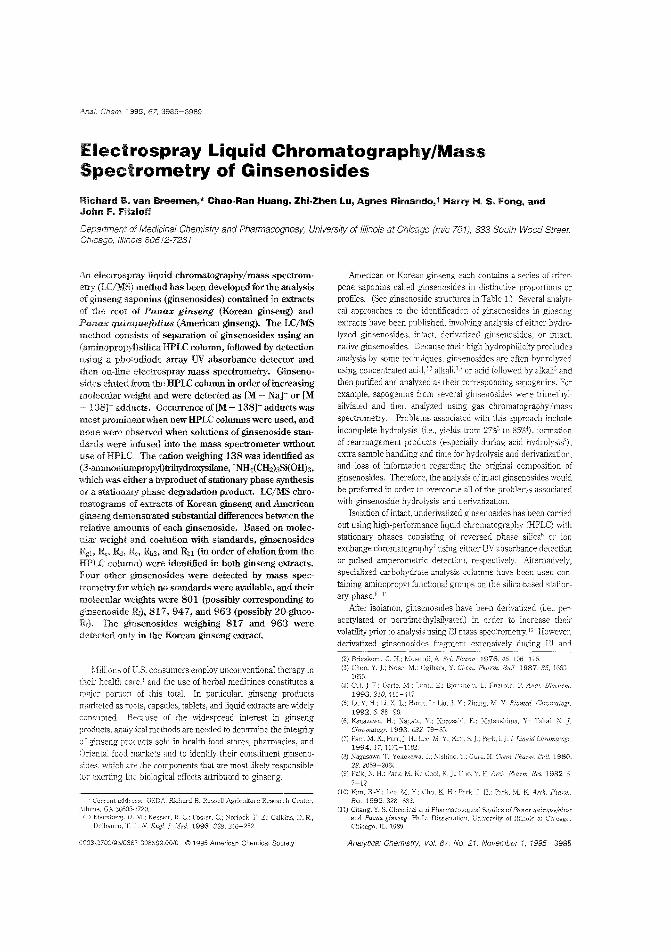
Anal. Chem. 1995, 67, 3985-3989
Electrospray Liquid Chromatography/MassSpectrometry of Ginsenosides
Richard B. van I3reemen,* Chao·Ran Huang, Zhi·Zhen Lu, Agnes Rimando,t Harl')l H. S. Fong, andJohn F. Fih:loff
Department of Medicinal Chemistry and Pharmacognosy, University of illinois at GiJ/cago (m/c 781), 833 South Wocd Street,Chicago, Illinois 60612-1231
.An electrospray liquid chromatography/mass spectrometry (LC/MS) method has been developed for the analysisof ginseng saponins (ginsenosides) contained in extractsof the root of Panax ginseng (Korean ginseng) andPanax quinquefolius (American ginseng). The LC/MSmethod consists of separation of ginsenosides using an(aminopropyl)silica HPI£ column, followed by detectionusing a photodiode array UV absorbance detector andthen on-line electrospray mass spectrometry. Ginsenosides eluted from the HPLC column in order of increasingmolecular weight and were detected as [M + Na]- or [M-- 138]" adducts, Occurrence of[M + 138]+ adductswasmost prominentwhen new HPLC columns were used, andnone were observed when solutions of ginsenoside standards were infused into the mass spectrometer withoutuse of HPtC. The cation weighing 138 was identified as(3-ammonimnpropyl)trihydroxysilane, ':N!Lt(CH2hSi(OHh,which was either a byproduct of stationary phase SYDthesisor a stationary phase degradation product. LC/MS chromatograms of e"tracts of Korean ginseng and Americanginseng demonstrated substantial difference. between therelative amounts of each ginsenoside. Based on molec-
weight and coelution with standards, ginsenosidesRgl, R" Ri, I"" Rb2, and RJ,1 (in order of elution from theHPLC column) were identified in both ginseng extracts.Four other ginscnosides were detected by mass spectrometry for which no standards were available, and theirmolecular weights were 801 (possibly corresponding toginsenoside Rr), 817, 947, and 963 (possibly 20-glucoRr). The ginsenosides weighing 817 and 963 weredetected only in the Korean ginseng extract.
Millions of U.S. conSumers employ unconventional therapy inhealth care.' and the use of herhal medicines constitutes a
major portion of this total. In particular, ginseng productsmarketed as roots, capsules, tabletE, and liquid extracts are widelyconsumed. Because of the widespread interest in ginsengproducts. analytical methods are needed to detcnnine the integrity
ginseng products sold in health food stores, pharmacies, and
Orientai food markets and to identify their constituent ginsenosides. which are the components that are most likely responsible
exerting the biological effects attributed to ginseng.
address: USD}'.. Richard B. Russell Agriculture Research Center,.\lhens, GA 30605..2720.
(i) Eisenberg. D, :vI.: Kessier, R c.; Foster, c.; Narlock. F. E.; Calkir;s, D. R.;Delbanco, T. lv'. Eng!,]. jlfed. 1993,328.246-2,)2
0003-270J/95/0367 -3985S9.0010 © 1995 American Chemical Socie:y
American or Korea;'} ginseng ea,::h contains a series of triter
pene saponins called f.,~nsenosides in distbctive propol1ions orprofiles. (See ginsenoside structures in Table I) Several analytical approaches to the identification of ginsenosides in ginsengextracts have been published, involving analysis of either hydrolyzed ginsenosides, intact, derivatized ginseIl8sides, or intact,native ginsenosides. Because their high hydrophilicity precludes
analysis by some techniques, ginsenosides are often hydrolyzedusing concentrated acid,!.'l alkali,:!·' or acid followed by alkali' andthen purified and analyzed as their corresponding sapogenins. Forexample, sapogenins ]j'om severa] ginsenosides were trimethyl
silylated and then analyzed using gas chromatographyImassspectrometry." Problems associated with this approach includeincomplete hydrolysis (ie., yields from 27%3 to 85%"), formation
of rearrangement products (especially during acid hydrolysis').extra sample handling 'md time for hydrolysis and derivatization,and loss of ;nfonnation regarding the original composition ofginsenosides. Therefore, the analysis of intact ginsenosides 1Nouldbe preferred in order to overcome all of the problems associatedwith ginsenoside hydrolysis and derivatization.
Isolation of intact, underivatized ginsenosides has been carriedout using high-perfornnnce liquid chromatography (HPLC) with
stationary phases consisting of reversed phase silicaii or ionexchange chromatography' using eit'ler UV absorbance detectionor pulsed amperometlic detection, respectively. Alternatively,specialized carbohydra~e analysis columns iave been used con
taining aminopropyl functional groups on the silica-based stationary phases-L
After isolation, ginsenosides have been derivatized (i.e., peraoetylated or peruimethylsilyated) in order to increase theirvolatility prior to analysis using EI mass spectrometry. W However,derivatized ginsenosides fragment extensively during EI and
(2) Bricskom, C. H.; l'\10Silf1dL A. Sci. Ph arm. 1978,46,106-116.(3) Chen, Y. ].; Nose, Ogihara. Y. Pharm. Bui{ 1987,35,
1655.(4) Cui. ].-F.; Carle. M.; Lend. E.: Bjorkbcm. I.: En':'r0\h. P. Anai. Bioclicm.
1993,210,411-417.(S) Li, Y. H.: Li, X. 1.: 1.; Liu. J. Zhang, !vI, Y. Biomed. ChrofJ.'alogr.
1992.6. 88-90.(6) Kanazawa, H.: .: Matsushima, Y,: Taka!,
(7) Parr, M. Parr,]. , S. J: Park. 1. J.] Liqilid CiJromatogr1994,17.1171-1182.
(8) :\agasawa. T.: Yo~ozawa, r.; ~ishino, Y: Oura. II. Chern. Ph(1:1iI. Bull. 1980.
28. 2059-2064.(9) Pa:k, N. H.: Park, K.: Choi. K. j.: H. Arch. Res. 1982,5,
7-12(10) Kim, B.-Y.; Lee, M. Y.; Cho, K. H.; P"rk J. H.: Park K. Arch.
Res. 1992,328-332.(11) S. Chemical cu,d Phannacoio:,;(.ca~, Studies of Panax ql(~nqJl{folius
and Ph.D. Dissertation. University of IJlinoi~ ae Chicagc,Chicago,
Analytical. Chemistry, Vol. 67, No. 27. November 7, 7995 3985
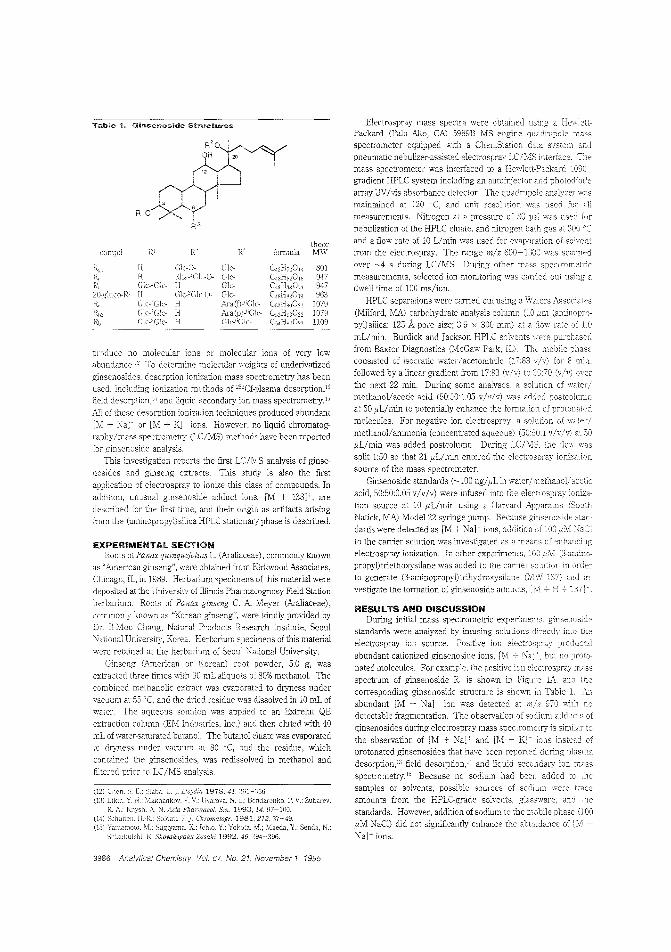
(l2) s. L Staba. E. j. 1978. 41, )61~:166.
(1:) Elkii , Y, Makhankov. V. V_l trvarova. N. Bcndarenko. P. V.: Zubarev,R. A.l Knysh. A. N. Acta Phm';nacoi. Sin. 1993, 14, 97-100.
(14) H.-R: Soldati. 1981, 212. 37-49.(15) Yal112.l11oto. Sugiyama, Ichia, :vI.; Maeda, Y.: Senda, N.;
Shi:wkui~hi, K. Shoyalwgaim Zasahi 1992. 46, ::,94-396.
lheorcompel 1\1 E' E: formula MW
R,' H Ole-O- 801R H Eha-'Gle-O- 947kd Gic-1GJc- H 94720-}.;-luco-Rr H 01c-'Ole-O- 963r" G1c-1Clc- H 1079Rb:~ Gic-2G1c- I-I 1079Rbl Glc-~G1c- I-I 1109
produce no molecular ions or molecular ions of very lowabundance. l :; To determine molecular \veights of underivatizedginsenosides, desorption ionization mass spectrometry has beenused, including ionization methods of '''Cf-plasma desorption,!:field desorption,1'1 and liquid secondary ion mass spectrometryIC
Ali of these desorption :onizadon techniques produced abundant
1M -I- Na] or lM -I- K] ions. However, no liquid chromatography/mass spectrometry (LC/MS) methods have been reported
for ginsenoside analysis.
This investigation reports the first LC/lViS analysis of ginsencsides and ginseng extracts. This study is also the first
application of eiectTospray to ionize this class of compounds. In
addition, ull'lsual ginsenoside adduct ions, 1M + 138]+, are
described for the first time, and their origin as artifacts arisingfrom the (aminopropyl) silica HPLC stationary phase is described.
RESULTS AND DlSCUSSIOIIIIDuring initial mass spectrometric expelimens, ginsenoside
standards were analyzed by infusing solutions di.rectly ir.to theelectrospray ion source. Positive ion electrospray produced
abundant cationized ginsenoside ions, 1M 7 , but no proto
nated molecules. For exaMple, th~ positive ion electrospray massspectrum of ginsenoside R- is shown in Figure lAo andcorresponding ginsenoside structure is shown Table 1.
abundant lM + Na]~ ion was detected at m/z 970 withdetectable fragmentation. The obselvation of sodium adducts ofginsenosides dming electrospray mass spectrometry is similar tothe observation of [M -I- Na]' and [M Kj+ ions instead ofprotonated ginsenosides that have been reported during plasmadesorption,r: field desorption,": and liquid secondary lOll mass
spectrometry." Because no sodium had been added tosamples or solvents, possible sources of sodium wereamounts from the HPLC-grade solvents, glassware, and rhe
standards. However, addition of sodium to the mobile phase (100I'M NaG) did not significantly enhance the abundance of 1M
Na]+ ions.
Electrospray mass spectra were obtained using aPackard (Palo Alto, CAl 5989B MS engine quadrupoie massspectrometer equipped with a ChemStation systempneumatic nebulizer-assisted electrospray LC/MS interface. TI,emass spectrometer was imertaced to a Hewlett-Packard 1090gradient HPLC system incbding an autoinjector and photodiocltalTay UV/vis absorbance detector. The quadrupole analyzer wasmaintained at 120 DC, and unit resolution used all
measurements. Nitrogen at a pressure of 80 was usecl fornebulization of the HPLC eluate, and nitrogen bath gas at 300 'cand a flow rate of 10 L/min was used for evaporation of solventfrom the electrospray. Tne range m/z 600-1300 was scanned
over '"'-'4 s during LC/MS. During other mass spectrometric
measurements, selected ion monitoring was can-ied out using adwell time of 100 ms/ion.
HPLC separations were eamed out using a \Vaters Associates
(Milford, MA) carbohydrate analysis column (10 um (amino pro-pyl)silica; 125 Apore size; 3.9 x 300 mm) at a rate of 1.0
mL/min. Burdick and Jackson HPLC solvents purcbasedfrom Baxter Diagnostics (McGaw Park, fL). The mobile phaseconsisted of isocratic water/acetonitrile (17:83 v/v) for 8
followed by a linear gradient from 17;83 (vIv) to 30:70 (vIv)
the next 22 min. During some ana~yses, a solution of water/methanol/acetic acid (50:50:105 v/v/v) was adried postcolulltD
at 50 ilL/min to potentially enhance the formation of protonatcd
molecules. For negative ion electrospray, a solution of
methanol/ammonia (concentrated aqueous) (50:50:1 v/v/v) 50flL/min was added postcolumn. During LC/MS. the fiow wassplit 1:50 so that 21liL/mln entered the electrospray ionization
source of the mass spectrometer.Ginsenoside standards (-100 ng/I'L. in water/methanol/acetic
acid, 50:50:0.05 v/vIv) were infused into the elec':rospray
tion source at 10 flL/min usi;]g a Harvard Apparatus !SouthNatick, Mi\) Model 22 syringe pump. Because ginsenoside
dards were deteoted as 1M -I- Na]' ions, addition 100,uM
to the carrier solution was investigated as a means of enhancingelectrospray ionization. In other experiments, 100 pM (3~amino
propyl)triethoxysilane was added to the carrier solution in orderto generate (3-aminopropyl) trihydroxysilane (MW 137) md
vestigate the formation of ginsenoside adducts, H
GUll'Ilsenoside Structures
EXPERIMENTAL SECTIONRoots of Panax quinque/alius 1. (Araliaceae), commonly known
as "American ginseng", were obtained from BJrkwood Associates,
Chicago, IL, in 1989. Herbarium specimens of this material weredeposited at the University of minais Pharmacognosy Field Station
herbarium. Roots of Panax ginseng C. A Meyer (Araliaceae),
commonly know;] as "Korean ginseng", were kindly provided byDr II-Moo Chang. Nahlral Products Research Institute, Seoul
National University, Korea. Herbarium specimens of this material
were retained at the herbarium of Seoui National University.
Ginseng (American or Korean) root powder, 5.0 g, was
extracted three times with 30 mL aliquots of 80% methanol. The
combined methanolic ex"racl was evaporated to dryness undervacuum at 55 cc, and the dried residue was dissolved in 10 mL ofwator. The aqueous soiution was applied to an Extrelut QE
extraction column (EM Industries, Inc.) and then eluted with 40
mL of water-saturated butanol. The butanol eluate was evaporatedto dryness under vacuum at. 80 OCt and the residue, whichcontained the ginsencsides, was redissolved in methanol and
filtered prior to L.C/MS analysis
Table
3986 Analytical Chemislry. /01. 67. No. 21, November 1, 1995
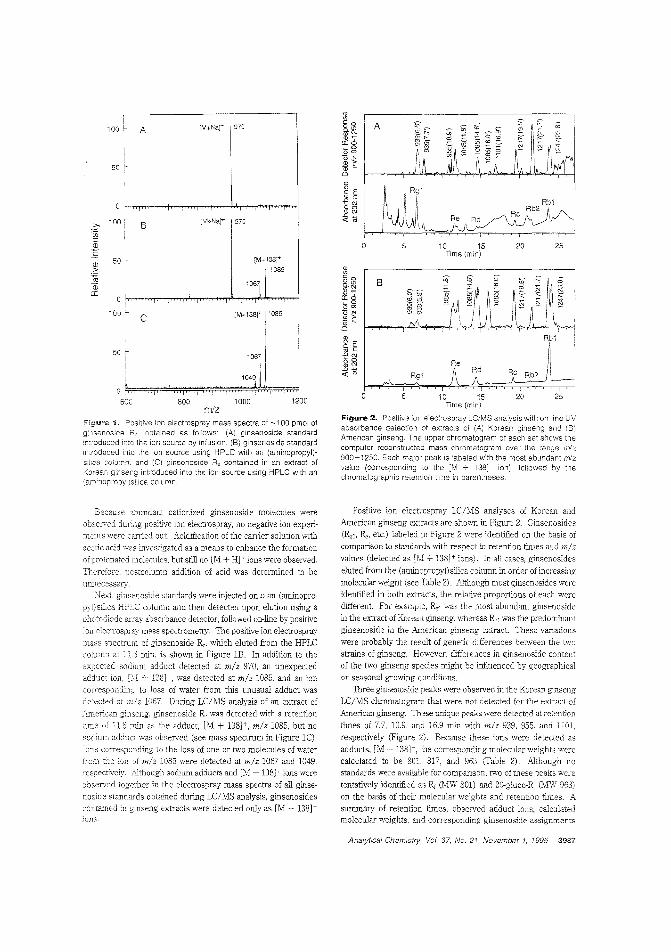
Figurre 1. Positive ion eiectrospray mass spectra of "-100 pmol ofginsenoside Re , obtained as follows' (A) ginsenoside standardintroduced into thE ion source by infusion, (8) ginsenoside standard,ntroduced into the ion source using HPLC with an (aminopropyl)sil!ca:olumn. and (C) ginsenoside Re contained in an extract ofKorean introduced intD the ion source using HPLC with anran1in()prop\li)silica column,
~ A [M+l\a]+ 970
B ~M+Nar- 970
[M+138t
[1085
I,
1067
1
C [M-1381+ 1085
106
1104~
25
25
20
20
Rb1
Re j i
~I~
10 15Time (min)
Rg1
5
B
o 10Time
Figure 2. Positive ior: eJectrospray LC/MS analysis with online UVabsorbance detection of extracts of (A) Korean ginseng and (B)American ginseng, The upper chromatogram of each set shows thecomputer reconstructed mass chromatogram over the ran':;Je miL900-1250. Each major peak is labeied with the most abondant mlz'Jalue (corresponding to the [M -:- 13S]+ (on), followed by thechromatographic retention time in parentheses
12001000mlz
SOOo
60C
50
.2:'100
.(jic:2c:
Ql 50>~Q5a:
100
50
100
Because 2~bundant cationized ginsenoside molecules wereobserved during positive ion electrospray, no negative ion experiments were carried out Acidification of the carrier solution withaC2tic acid was invcst:gated as a means to enhance the fOffi1ationof prolonated molecules, but still nO [M + H]+ ions were observed.
Therefore, postcolurrn addition of acid was determined to belJunecess2.ry.
"leKi, ginsenoside standards were injected onto an (aminopropyl) silica HPLC column and then detected upon elution using aphotodiode array absorbance detector, fol1owed on-line by positiveion electrospray mass spectrometry. The positive ion electrospray
mass spectrum of ginsenoside R" which eluted from the HPLCcolumn at 11.6 min, is shown in Figure IE. In addition to theexoected sodium adduct detected at mlz 970, an unexpectedadduct ion. -:- 138]7, was detected at mlz 1085, and an ioncorresponding to loss of water from this unusual adduct wasde'ected at mlz 1067, During LC/MS analysis of an extract of
JUllerican ginseng, ginsenoside R was detected with a retentiontime of 11.6 min as the adduct, [M + 138]+, mlz 1085, but nosodium adduct was obseried (see mass spectrum in Figure 1C),
cOITesponding to the loss of one or two molecules of waterbe ion of mlz 1085 were detected at mlz 1067 and 1049,
respectively. Although sodium adducts and [M + 138]+ ions were
observed together in the electrospray mass spectra of all ginse
noside standards obtained during LC/MS analysis, ginsenosidescontained in gInseng extracts were detected only as [M 138]+lons.
Positive ion eiectrospray LC/MS anaiyses of Korean and
American ginseng extracts are shovm in Figure 2. Ginsenosides(]\gl, Re, etc) labeled in Figure 2 were identified on the basis of
comparison to standards with respect to retention times and rn/zvalues (detected as [M + 138J+ ions), In all cases, ginsenosides
eluted from the (aminopropyl) silica column in order of increasing
molecular weight (see Table 2). Although most ginsenosides wereidentified in both extracts, the relative proportions of each weredifferent For example, R;l was the most abundant ginsenosidein the extract of Korean ginseng, whereas 1<"., was the predominantginsenoside in the ~l\nlerican ginseng extract. These variationswere probably the result of genetic differences between the twostrains of ginseng. However, differences in ginsenoside contentof the two ginseng species might be influenced by geographicalor seasonal growing conditions.
Three ginsenoside peaks were observed in the Korean ginsengLC/MS chromatogram that were not detected for the extract ofAmerican ginseng. These unique peaks were detected at retention
times of 7.7, 10.9, and 16.9 min \\~th mlz 939, 955, and 1101,respectively (Figure 2). Because these ions were detected asadducts, [M -:- 138] -, the corresponding molecular weights werecalculated to be SOl, 817, and 963 (Tahle 2). ,AJthough nostandards were available for comparison, two of these peaks weretentatively identified as Rr (MW 801) and 2G-gluco-R, (MW 963)on the basis of their moiecular weights and retention times. A
summary of retention times, observed adduct ions, calculatedmolecular weights, and corresponding ginsenoside assignments
Analytical Chemistry Vol. 67, No. 21, November 1. 1995 3987
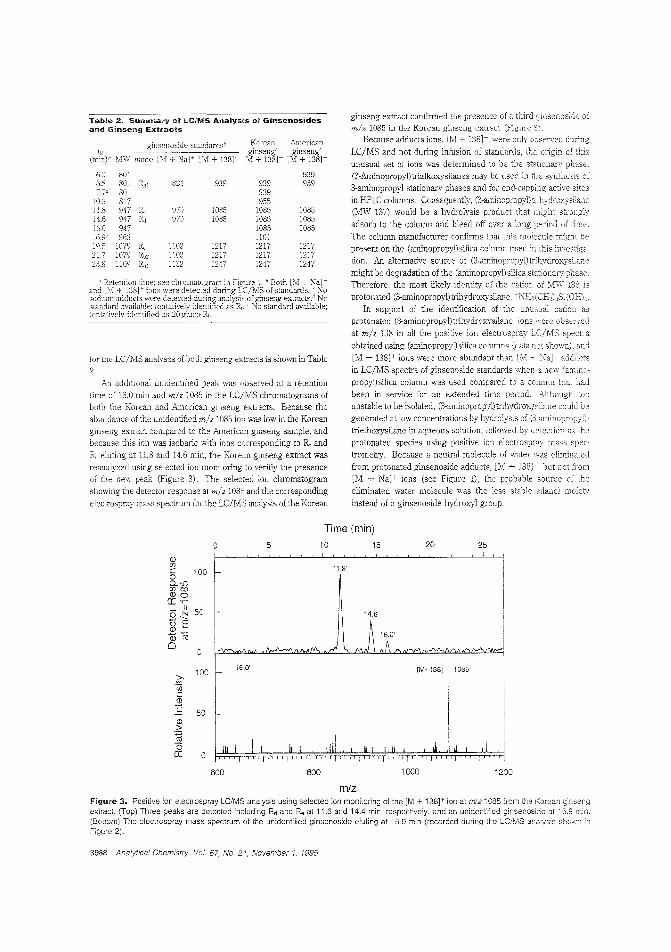
Table 2. Summall"y of LC/MS Analysts of Ginsenosidesand Ginsen.g Extracts
ginscnoside standards/! AmericanginsengC
Na] [M + 1381+ [M + 1381+
6.:) 801 9396.S SOl Ei!] 824 939 939 9397.7d 801 939
HH 817 95511.8 947 R, 97') 10% 1085 108514.6 947 Ed 97D 10S5 1085 108516.0 947 1085 108516.9' 963 !lOl195 1079 Rc 1102 1217 1217 121721.7 1079 Rb2 1102 1217 1217 121723.8 1109 R" 1132 1247 1247 1247
for the LC/J'vlS analyses of both ginseng extracts is shown in Table
2.An additional unidentified peak was observed at a retention
time of 160 min and m/z 1085 in the LC/J'vlS chromatograms of
both the Korean and American ghseng extracts. Because the
abundance oflhe unidentified m/z 1085 ion was low in the Koreanginseng extract compared to the American ginseng sample, and
because this ion was isobaric with ions corresponding to Re and
Rei eluting at 11.8 and 14.6 min, the Korean ginseng extract wasreanalyzed using selected ion monitoring to verifiy the presenceof the new peak (Fih'Ure 3). The selected Ion chromatogram
showing u'1e detector response at m/z 1085 and the corresponding
electrospray mass spectrum for the LC/J'vlS analysis of the Korean
ginseng extract confinued the presence of a third ginsenosidem/z 1085 ill the Korean ginseng extract (Figure
Because adducts ions, [J'vl 138J+, were only observed during
LC/MS and not during infusion of standards, the origin of thisunusual set of ions was detemlined to be the stacionary phase.(3-Arninopropyl)trialkoxysilanes may be used in the synthesis of
3-aminopropyl stationary phases and for end-capping active sites
in HPLC columns. Consequently, (3-arrinopropyl)J-Ihydroxysiiane(MW 137) would be a hydrolysis product that might strongly
adsorb to the column and bleed off over a long period of time.
The column manufacturer confirms that this molecule might bepresent on the (aminopropyl) silica column used in this investlga
lion. An alternative source of (3-aminopropyl)trihydroxysilane
might be degradation of the (aminopropyl) silica stationary phase.T11erefore, the most likely identity of the catlor. Y[VIj- 138 Is
protonated (3-aminopropyl) lJihydroxysllane" NH] (CH,) lSi (0 H),.
In support of the identification of Ihe unusual cation asprotonated (3-aminopropyl)trihydroxysilane, ions were observed
at m/z 138 ln all the posltive lon electrospray LC/MS spema
obtained using (ammopropyl) silica columns (data not shown), and
[M + 138]+ ions were more abundant tha..~ [M adducts
in LC/J'vlS spectra of ginsenoside standards when a new (amlnopropyl)silica column was used compared to a column that had
been in service for an extended time period. Although toounstable to be isolated, (3-aminopropyl)trihydroxysilane could be
generated at low concentrations by hydrolysis of (3-aminopropyl)
triethoxysilane in aqueous solution, followed by detection as theprotonated species using positive ion electrospr<lY mass speo
trometry. Because a neutral molecule of water was eliminated
from protonated ginsenoside adducts, [M -+- 138] . but not [Tom[J'vl + Na]~ ions (see Figure 1), the probable source o[ the
eliminated water molecule was the less stable silanol moiety
instead of a ginsenoside hydroxyl group.
o 5
Time (min)
10 15 20 25
0)[f)
15 100CUD[f)Cf)0)0CC.,-o ~ 50
of*"(6o o
11.8'
,~~~ ."""",M", .1Ii
j;AOA~~MNAJ
o III I I I
100 f-
50
16.0'
Ii I Ii
[M+138l+ 1085
.I J
600 800 1000 1200
m/zFigure 3. Positive ion electrospray LC/MS analysis using selected ion monitoring of the [M + 138]+ ion at mlz 1085 from the i<orean ginsengextract. (Top) Three peaks are detected including Rd and R, at 11.6 and 14.4 min, respectively, and an unidentified ginsenoside at 15.9 min.(Bottom) The electrospray mass spectrum of the unidentified ginsenoside eluting at 15.9 min (recorded during the LC/MS analysis shovm nFigure 2).
3988 Analylical Chern/sin;, Vol. 67, No. 21, November 1, 1995

CONCLUSIONThe first application of electrospray mass spectrometry and
LC/MS to the analysis of ginsenosides is reported. Besidesfacilitating the identification of ginsenosides in extracts of ginseng.electrospray LC/MS also provided a ginsenoside profile thatdistinguished one variety of ginseng from another. Ginsenosideseluting from the (aminopropyl)silica HPLC column were detectedas adduct" ['vi + 138]+, which were the result of (3-ammoniumpropyl)trihydroxysilane (probably a manufacturing byproduct ofthe HPLC stationary phase) eluting from the column. Because(aminopropyl) silica HPLC columns are frequently used for avariety of carbohydrate analyses, including ginsenoside separations, anc sir:ce electrospray LC/MS is rapidly becoming morewdely used and available, other researchers using electrospray
LC/MS for carbohydrate research are likely to encounter [M -"1381- adducts and should be careful when determining themolecular weight of the analyte.
ACKNOWLEDGMENTUse of the electrospray mass spectrometer was generously
provided by the Hewlelt-Packard Co. Support from the AmericanBotanical Council (Austin, TX) is gratefully acknowledged.
Received for review May 2. i 995. Accepted August 23.i 995.0
AC950420K
o Abstract ".)Ublishcd AdvQUC ACS Abstrcrls. OClo:X;f 1.
Analytical Chemist.y. Vol. 67, No. 21. November 1. 1995 3989
Ana/. Chem. 1995, 67, 3990-3999
Sequence-Specific Fragmentation ofMatrix-Assisted Laser-Desorbed Protein/PeptideIons
Robert S. Brown* and John J. L,,,nnon
Uepa,1ment of Chemistry And Biochemistnj, Uta!1 State University, Logan, Utah 84322-0300
By utilizing delayed pulsed ion extraction of ions generated via the matrix-assisted laser desorption/ionization(MALDl) technique, fast «320 ns) metastable ion fragmentation is observed fo,- both peptide and proteinanalytes in the ion source of a linear time-of-flight massspectrometer. Small peptides such as the oxidized Bchain ofbovine insulin exhibit fragmentation at the amidelinking bond between peptide residues. Overlappingsequence information is provided by fragmentation fromboth the C- and N-terminal ends ofthe peptide (cn-, Yn-,and z*n-i:ype fragment ions). Larger proteins can alsoexhibit a wealth of sequence specific fragment ions infavorable cases. One example is cytochrome c, whichundergoes substantial (·~80%) fast fragmentation at theamide bonds along the amino acid backbone of theprotein. Only amide bond cleavages initiating from theC-terminal end (cn fragments) are observed. The obselVed fragmentation pattern provides a significant amount
potential sequence information for these molecules.External mass calibration of the intact protonated molecular ions is demonstrated with mass accuracies typicallyaround 100 ppm. Mass accuracies for the observedfragrnent ions ranged from ±O.20 Da for the smallerpeptides studied (i.e., oxidized B chain ofbovine insulin)to ±O.38 Da for the largest protein studied (cytochromec), based upon the lmovm sequences.
Matlix-assisted laser desorption/ionization (MAi,D1) has untilrecently been thought of as primarily a technique for the simpleand fast determination of the molecular mass of an analyte.Numerous reports on its successful application in this area haveappeared in recent years.'-" this regard, M.ALDI is generallyperceived as a "soft" ionization technique. A high degree of
metastahle behavior of l\I1ALDI-generateci ions is known fran;reflector tirne-ofcflight (REID!') mass spectrometer exporiJllents. 1,For larger proteins, this metastable decay in the field-freeprior to the ion mirror can severely limit the obtainable massresolution with these instruments. ~(bis "postsource decay" (PSD)has been utilizedJ:j-l:l in conjunction with the stepping ofRETOF mass spectrometer's reflector voltagesHi.17 correctthe lower kinetic energies of the PSD ions. Signifkant amounts
of structural infonnation can be obtained for moderate mass-tocharge (m/z) peptides via this techniqu,c. These PSD ions appearto be dJ.e at least;n part to collisional activation proc:csscs during
ion acceleration in the initially dense Ml'ILDl "plume" orbackground gases in the field-free drit region. I -, One drawbackto this approach is the need to change the mirmr voltagesdiscrete steps in order to produce a complete energy focused E1assspectrum. These individual sections of the mass spectrum arethen combined to produce a composite mass spectrum offragment ions. Accurate mass calibration is much moredemanding process in this experiment than with conventionaltime-at-flight mass spectrometers crO F-MS). With precursor ionselection prior to the field-free region (typical1y via pulseddeflection methods), tandem mass spectrometry (MS/YIS) canbe perfom1ed.
In linear MALDI TOF-MS equipped with cuntinuousacceleration, such metastable ion behavior is normanyobserved. Ions which fragment during the initial acceleralionperiod appear as incoherent background ion signals. Those ionswhich fragment in the field-free region (PSD ions) retain essentially the same velocity as intact ions and cannot be distinguished from st2ble ions. The use of delayed pulsed ion extractioncombined with a linear TOF-MS and Ml'ILDi has already beendiscussed lS for mass resolution enhancement. This samenique can also be utilized to observe any fast «300-4000 n8)metastable ion fragmentation which occurs dUling the Mc'\.LDl
1985,
1993,6.i
(10) Spengler, B.: Kaufmann. R Analusis 1992, 20.(11) Karas, M.; Bahr, 11.; Strupat K..: Hilknkamp, ; T,;c;·bop,,·.,:o~. A_; P"aman;<
B. N. Anal. Chern. 1995,67,675-679(12) Yu, W.: Vath, J E.: Huberty. c.: Martin. S. Awl
3015-3023.(13) Spengler. B.: KiT's"h, D.: Kaufmann. R:
1992. 6. 105.(14) B.; Kirsch, D.; Kaufmann, R Rapid
1991.5.198.(15) Kaufmann, R: Kirsch, D.: Spengler, B.
1994. 131.355-385-(16) Tang, X.: Ens, \V.: St'1l1ding. K. G.; Wcstn-,ort'.).
1791.(17) Tang, X.: Ens, \V.; MayeL F.: Standing. K
Conzmun. Mass Spectrom. 1989,3, H3.(18) Brown. R. S.; Lennon, J. J. Anal. L"hem. 1995. 67,
U.S.A. 1990,87.6873-
K. F"pi.d 0"""",,·. Mass Spectrom. 1991,
HilJenkann F. Biamed Em/iron. Mass
A.: E.: Stahl, E.: Strupat, K.;1990.241. 175-185.
ConnnuJl. Mass Spectrom. 1989,3,432-
RS.:Bier
Ch,clt, B. T. Pmc. Nat!. Acad.
(6)
(Ii h:aras, M.: Ingcncloh,1989,18.841-{-;43.
(:2'1 Bahril!cnkamp, F. Anal
(3) BeaVIS. R. c.; Chait, 13. T
5, 395-399(7) Castoro. J. Koster, c.: C. L Rapid Commun. Mass Spectrom.
1992,6,2:)9--241.(8) Castoro, J A.; Wilkins, C. L AEal. 1993,55,2621-2627.(9) Karas. Bahr, Ingendoh. A: E llenkamp, F. Angew Chem., Int. Ed.
Eng!. 1989,28,760-761
(5) Stahl, 3.: Sleup, KaniS, :\11.: E llcnkamp, F iinaL Chem. 1991,63.1463-
3990 AnalyffcaJ Chemistry. Vol. 67, No. 21, November 1, 1995 0003-2700/95/0367-3990$9.00/0 © 1995 Arnericar Chemical Society
process. Unlike the PSD ions observed in MALDl with ion mirror
based TOF mass spectrometers, the metastable ions observedwith delayed pulscd ion extraction are produced much earlier inthe desorplion process. Although not fonned early enough to
be observed with continuous ion extraction TOF mass spectrometers (i.e., not prompt fragmentation), they are observed as earlyas 300 ns after the laser desorption event and do not appear toincrease in intensity at longer extraction delay times. EnergeticcoUisions. believed to playa major role in the generation of PSDions in MALDI, should be absent with delayed pulsed ion
extraction dee to the expansion of the desorbed neutral plumeduring the extraction delay period. Possible mechanisms for thisfast metastable ion fragmentation process, the effects on theobserved fragmenffition of simple peptides and proteins of chemically different MilLD I matrices, and the influence of the laserfluence are reported elsewhere.:9
This report will demonstrate the analytical utility of these fast
time frame metastable ions with several peptides and a protein of
known sequence. It will be shawn that delayed pulsed ionextraction TOF-MS coupled with MAWI ionization offers a simpleand relatively fast method which can provide significant amountsof detailed sl111ctural information for small quantities of moderatesiled peptides. In favorable cases, small proteins have also
provided significant primary structure information.
EXPERIMENTAL SECTIONexperimental arrangement for the delayed pulsed ion
eXlraclionlil1earTOF-MS employed in these studies is presentedin detail in a separate report. 18 MALDI-generated ions areproduced in an initially field-free region of a standard three-grid
ion source maintained at high (24 kV) voltage. The repeller gridof the source is connected to a high-voltage pulser (0-3 kV)floated at the source potential After a variable delay period (300
4000 ns), the repelle:- grid is pulsed to higher volffige (Positiveio:1s) , ami the M'\LDI ions are accelerated through the secondreg"ion of the ion sow"Ce into the ground potential flight tube of
che TOF mass spectrometer.The samples of subsffince P (S 6883), melittin (M 2272), the
oxidized B chain of bovine insulin (16383), porcine insulin (13505),and equine cytochrome c (C 7752) employed in these studies werepurchased from Sigma Chemical 00. (St. Louis, MO) and usedas received "1,vithout additional purification. lv1A.LDI matrices werepurchased from Aldrich Chemical Co. (Milwaukee, WD and usedas received. \!Iatrix solutions were prepared as ~10 mM solutionsin acetonitriie/water (30:70 v/v) to which 0.1% trifluroacetie acid
was addee. A.nalyte solutions were prepared in distilled deionizedwaler at the I'M concentration lev,e!. Samples were deposited(1 uL of analyte followed by 2 ,uL of matrix) via a microsyringeonto a :J mm diameter stainless steel probe tip and allowed toair-evaporate. We have found that this sample preparationprocedure produces ]\;lALDI results identical to those obtainedwith premixing the solutions prior to depositing them on thesample ffirget. as long as the less volatile analyte solution is appliedtlfst to the probe tip.
A pulsed nitrogen laser (337.1 nm) is focused to a spot size of
~100 I,m x 250,um. The laser thus samples on any given surfacea maximum of ~40 frnol of analyte (assuming equal deposition ofanalyte across the probe tip). Total analyte loading on the sample
Brown. 1<. s,: Len:10n, J. J Submitted for publicarion in f- Am Soc. MassSpectroln.
probe tip (from which at least 10-20 surfaces may be sampled)
is 10 pmol. 'Ibese somewhat higher than nonnal MIILDI analyte
concentrations were employed to ensure good SIN for theresulting low-intensity fragment ions. As the analyte concentration
is lowered, fragment ion SIN degrades until only major fragment
ions are discernible. For the MALDI TOF-MS spectra presented,the ion signals from 50 laser shots were signal averaged at 5 nsfpoint time resolution (LeCroy 8828 transient digitizer;. Ionssource bias volffiges of 24 kV and pulsed ion extraction delay timesof 340 ns were utilized for aU of the results presented.
Mass calibration of the time-af-f1ight spect"a utilized a simple
linear fit of two ions with known m/z values and their experimentalflight times. This procedure is discussed in more detail in theResults and DisCllssion section. Because of the small abundanceof the fragment ions relative to the protonated molecular ion, thelimited dynamic range of the transienl digitizer (200 MHz/8 bits)becomes problematic. Accurate sampling of the low-abundance
fragment ions cannot be accomplished if the large intensity
protonated molecular ion is kept on scale. To avoid this, the gainon the signal amplifier was initiaUy adjusted so that the dominantprotonated molecular ion signal was within the range of thetransient digitizer. A signal-averaged time-of-f1ight spectrum for
the initial 20 laser shots on a sample surface was collected, andthe center of mass of the [1.1 + H] ~ and the [M + 2H]'+ ions was
determined. The gain of the signal amplifier was then increased
so that the analyte-protonated molecular ions were no longer onscale. A time-of.f1ight spectrum was then accumulated from thenext 50 laser shots on the same sample surface. This approacheffectively improves the dynamic range 01 Lhe experiment for the
much lower intensity fragment ions. The previously determinedflight times can then be used in the mass calibration procedue
RESULTS AND DISCUSSION111e extent of fast metastable ion fragmentation that is observed
with delayed pulsed ion extraction in a linear TOF mass spectrometer is very matrix dependent. All of the common MALDImatrices studied to date exhibit fast metastable fragment ions.The effects on the fast metastable ior. fragmentation of severalcommon MALDI matrices are reporLed elsewhere. EJ The mostgenerally useful MALDI matrices found to date which provideextensive, nonspecific fragmentation include 3-methoxy-4-hydroxycinnamic acid (feruEc acid), 3,5-dimethoxy-4-hydroxycinnamic acid(sinapinic acid), and 2,5-dihydroxybenzoic acid (DHB). The twocinnamic acid derivatives tend to produce better results for largerpeptides and small pruleins, while d1e DHB matrix provides some
enhancement in fragmentation \v1th small and intc:mediate-sizedpeptides. The results presented here will be restricted to DHB
and sinapinic acid matrices. Fellllic acld produces resuJis verysimilar to those obtained "ith sinapinic acid.
11,e peptides and proteins chosen for study are listed in theExperimental Section. and their known sequences and averagechemical molecular weights are provided in the correspondingtables of fragment ions. The analytes chosen produce fast
metastable ion fragmeJlffition results which are typical for peptidesin the 1000-6000 Da mass range that have been examined in ourlaboratory to date by this technique. The fast meffisffible ion decayprocess appears to be complete") within the shortest pulse delaytime (340 TIs) possible with current 1llstrumenlation. 18 As the
\videst mass range of iOlls is optimally focused at the shortest
delay time,18 all fragmentation studies reported invoive a 340 nsdelay period after lnitiation of the laser event.
Analytical Chemistry, Vol. 67, No. 21, November 1. 1995 3991
A standard nomenclature'" that is widdy utilized to describethe amide bond cleavages that normally occur in the massspectrometry of peptides is employed in fbese discussions. Suchcleavages have primarily been observed with various collisionalactivation~l or unimolecular22,2:: ion decay processes. Possible
mechanisms for these bond cleavages in the case of fast metastabie MALDl ion decay have been discussed elsewhere'" and
will only be briet1y summarized here. Our current model of fbefast fragmentation process observed for MALDI-generated ions
centers around the proton transfer event. It is believed that fbe
exothermicity of this proton transfer reaction controls the degreeof fast fragmentation that is observed. Other researchers have
proposed": such a model previously to account for longer tennmetastable ion decay in 'vlALDI (i.e., pOSi:Source metastable iondecay). This model can also account for rhe dependence on the
fast fragmentation ion species observed with the MALDI matrix
that is utilized. '" Differences in the exothemcicity of the protontransfer reaction as a function of the chemical structure of the'vlALDI matrix would be expected, arld this would detennine fbe
relative extent of intemal activation of fbe analytes. This wouldpresumably affect the favored fast metast.ahle ion decay pathways.
Fast metastabie ion decay of smaller to moderate-sized peptides
is dominated by the production of y, ancl c, fragment ions. In
addition, complementalY N-terminal fragments are also observed
with a distribution similar to the y" series of ion fragments. These
ions are observed at a somewhat unusual 15 amu below the Yl:series ions (i.e., y, - 15) and are believed to be due to arearrangement around the amide bond with a loss of NH from
the y, series ions. TIley occur in a distribution similar to that of
the series of ions with approximately equal intensity. Theyhave tentatively been designated as z* It ions to be most compatible
with the common nomenciature'" utilized to describe peptide
fragmentation. For the present studies, only the c" and y" ionse!"'es will be discussed. The fast time frame metastable fragmentions observed with MALDl are similar to the prompt ion
fragmentation observed with fast atom bombardment (FAB)ionization of peptides,:;:l
A major benefit of utilizing the fast metastable ion fragments
observed with the delayed pulsed ion extraction TOF-MS tech
nique instead of the more abundant PSD ions with a reflectingTOF mass spectrometer involves the ease of conducting fbe
experiment. For a moderately sized protein such as cytochrome
c. the entire analytical useful mass range (400-13000 Da) canbe examined in a single TO F mass spectrum. This can be
obtained with good mass resolution (ml6.m between 450 and 800)across the entire mass range of fbe speccrum. Mass calibrationis accomplished in the same manner as ~lth continuous ionextraction linear TOF..MS by employing a simple iinear fit of two
known masses and their associated Hight times.As the molecular mass of the analyte is increased, SOme
tradeoff in optimal focusing conditions (i.e .. the pulse voltage
(20:, Johnson. 1<. S.; Mar-tin, S, l\..; Bie,nann, K.1nt.1- Mass Spectrom. Ion Processes]988.86.
(21) Bean, M. F,; Carr, S. A.; Thorn" G. Rein:;, M. H.: Gaskell, S. J. Anal.Olem. 1991. 63, 147J~1481.
(22i KinseL G. R;].; Schlag. W. Proceedings aftheflSMS Confert!u:e Oil NJass and Allied Topics; Nashville,
May 19-24, 1991: pp :35()-351.(23) Downard. K. M.; Bicmann, K. I Am. Soc. Mess Spectrom. 1993, 4, 874
881(24) Slnrpat, K; K<lras. Hi110Ilkanp, F.; Eckerskom, c.; Lottspeich, F. Anal.
OWfil. 1994, 66, 464-470.
3992 Analytical Chemistry, Vol. 67. No. 21, November 1, 1995
employed) must be made when employing the dciayed pulsedion extraction technique. This t:YPically involves optimizing
experimental pulsed extraction conditims to maximize the obtain
able mass resolution for the largest ion of interest. Some
degradation in the optimal mass resolution occurs lowerions in the spectTa. In the case of the largest analytc (cytochrome
c) which has currently produced useful fast metastable ion decay
products, the mass resolution for lower mlz ions typically noworse than what is observed in the best case with continuous
extraction on the same instrument (ml6.m '" 500) If imprJ\'cd
mass resolution is required, additional fast metastable ion decalspectra can be acquired under pulsed extraction condi':ions
optimized for lower mlz fragment ions. illl the results
presented here were obtained with a single set of pulsed extraction
conditions optimized for the singly protonated molecular ion.
In order to sort out the structural infonnation contained in the
fast metastable ion decay fragment spectra that are observed witl1l\1ALDI, sample prepurification is required. Unl.ike with PSD
fragmentation, there is no way to preson protonated molecular
ion species from samples containing multiple analytes noMS/MS capability). As long as any potential peptide impliCities
are minimized, the probability of interferences due to low-level
peptide impmities fragmen~ing and producing spurious ions
extrerrely small. This is due to the small fraction (about infavorable cases) of protonated molecular ions that exhibit fastmetastable ion fragmentation under typical MALDI conditions.
Any low-level impurity species present that generate stable ions
can be distinguished by continuous ion extraction [Tom
metastable ion species. All of the fast metastable ions reported
here are not observed when the instrument operatedcontinuous ion mode. In this regard, care must be taken
synthetic peptide samples not to confuse the protonated molecular
ions from low levels of incomplete synthesis impurities with acmalfast metastable ion decay fragmentation.
The mass calibration employed for ali of the metastable
ion fragmentation spectn presented utilized the known moiecularweights of the analytes based upon their published sequences.The singly and doubly protonated molecular ion flight times were
recorded as described in the Experimental Section andutilized along mth the known sequence-based molecular It/eights
to internally calibrate each spectrum. 1n the case unknowil
analytes, an additional initial step would be required to accurately
detennine an unknown's molecular weight. This would 1nvo1>,;e
utilizing other calibrant compounds of known m/z. as is typicaliy
done in MALDI TOF-MS. 111e mass accuracy possible using
conventional intema1 and external calibration (average of sixdetenninations) '""jth delayed pulsed ion extraction for a selies of
common peptides is presented in Table For the intendcalibration results, a standar-d procedure typicaiiy employed withlinear TOF mass spectrometers was utilized.~;),::lj
For the extemal calibration procedure. an a1tenwtive approach
was utilized. Two samples were applied sequentially to alten1atehalves of the direct insertion probe's S2IIlplillg area 8Jch a
manner fbat they did not mix during solvent evaporation. One
dried sample spot contained only the analyte whose molecular
mass was to be determined. The ober sample spot contained
the required mass calibrants. The caJibrant sample was brDught
(25) Beavis, R ChClit B. T. Ana!. Chem. 1990, 62.(26) Brown, R. S.: Gilfrich. N. L. Chim. Acre 1991,
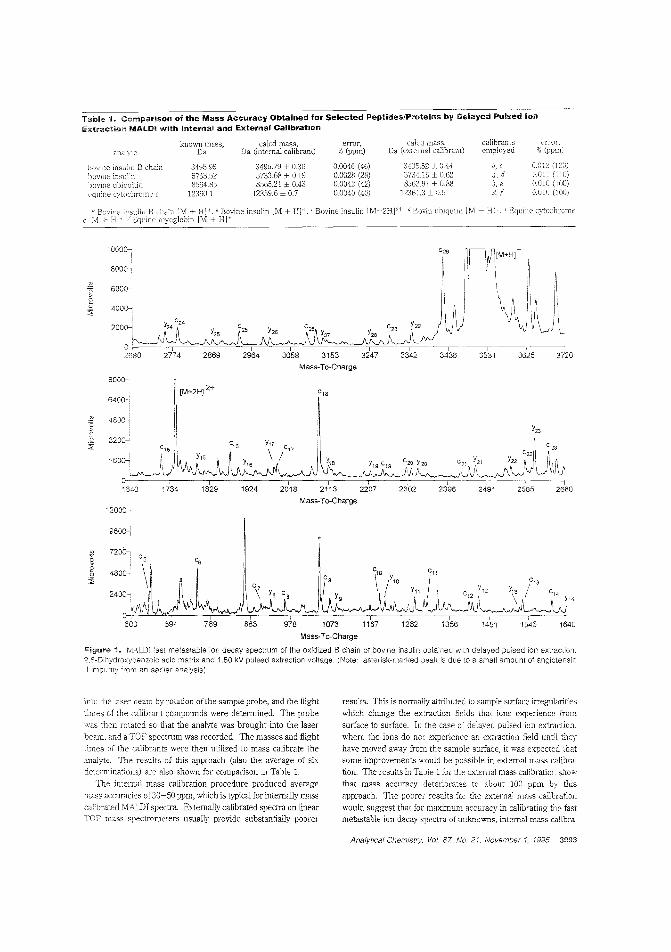
Table 1. Comparison of the Mass Accuracy Obtained for Selected Peptides/Pmteins by Delayed Pulsed IonExtraction MALDI with Internal and External Calibration
known mass, ca1cd mass, error, cakd;"nnlYlc Da Da (inte:-nal calibrant) % (ppm) Da
bovine insulin B chain 3195.95 3495.79 ± 0.36 0.0046 (46) 349:,.52 0.44 0, C (i.012 (120)
bovine inSU',ln 5733.52 5733.68 ± 0.19 0.0028 (28) 573C5 ± 0.62 a. d ().Oll (110)bovine ubiquiLin 8554.8;:) 8565."1 ± O.4:J 0,(1042 (42) 856::.97 ± 0.88 e O.OlC (lOO)vCjuine cytochrome c 12360.1 12359.6 ± 07 0.0040 (40) 1236:.3 ± 0.5 (i.01e (100)
'-.}; Bovine insulin [M + H] . {Bovine insulin lM+2H]2+ I: Bovin ubiqutin 1M + 1-Ij-;-. ' Equine cytochromeHI".
ooo~ r ~ ~["."[' I
:::~~JVlJ \\J~Jlre·~8-0":"::''--2-;i7-4--'--==2-c8T6=9--==-''2-o96r,=4'-"-=.::3:..,d5-=8=-=--=3-1"5-=3=-==3-C2T-'4-"7:....::--=-=3-3r~2---34"3-6---3-5T'3-1---3-;6'2-5---3-720
Mass-To-Charge
8000-
[M+2HJ 2+
CiS :'\ C16
160~~U~uo : iii1640 1734 1829 1924
12000--
I I i2018 2113 2207
Mass-To-Charge
2302,
2396:
2491I
2585,
2680
1640,
1545,
13561262,
883600
720~
:::~~lAL694 789
,978 1073
Mass-To-Charge
Figure 11. [VlALDJ last metastable ion decay spectrum of the oxidized B chain of bovine insulin ojtained with delayed puised ion extraction.?,5-Dihydroxybenzoic acid matrix and 1.50 kV pulsed extraction voltage. (Note: asterisk~marked peak is due to a smal! amount o'f angiotensin'il impurity frorn an earlier analysis;.
'.nto the laser '"eam by rotation ofthe sample probe, and the flighttimes of the calibrant compounds were determined. The probewas then rotated so that the analyte was brought into the laserbeam, and a TOF spectrum was recorded. The masses and flighttimes of the calibrants were then utilized to mass calibrate theanalyte. The results of this approach (also the average of sixdeTerminations) are also shown for comparison in Table 1.
The imemal mass calibration procedure produced averagemass accuracies of 30-50 ppm, which is typical for internally masscalibrated MiLD! spectra. Externally calibrated spectra on linearTOF mass spectrometers usually provide substantially poorer
results. This is normally attributed to sample surface irregularitieswhich change the extraction fields that ions experience fromsurface to surface. In the case of delayed pulsed ion extraction.where the ions do not experience an extraction field until theyhave moved away from the sample surface, it was expected thatsome improvements would be possible in extemal mass calibration. The results in Table 1 for the exlernal mass calibration showthat mass accuracy deteriorates to about 100 ppm by thisapproach. TI1e poorer results for the exlemal mass calibrationwould suggest that for maxImum accuracy in calibrating the fastmetastable ion decay spectra of unknovms, internal mass calibra-
Analytical Chemistry Vol 87, No. 21, November 1, 1995 3993
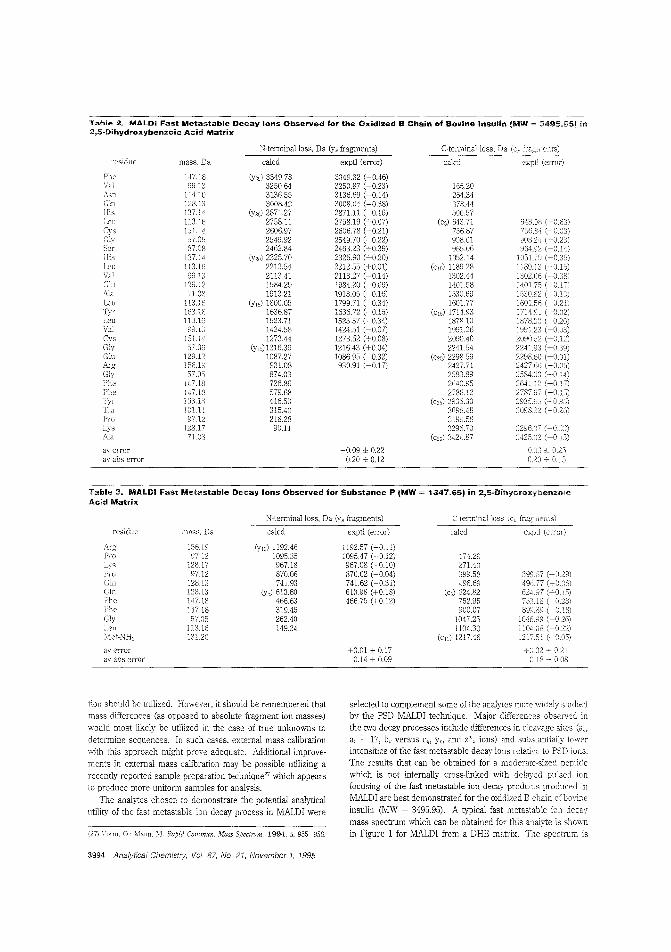
Table 2~ MALD& Fast Metastable Decay Ions Observed for the Oxidized B Chain of Bovine Insulin (MW = 3495.95) in2,S-Dihydroxybenzoic Acid Matrix
residuE' mass. Da
\i·tenninalloss, Da (Y, fragments)
calcd exptl (error)
C~terminalloss, Da (eli fragrncnts)
ca1cd expt] (error)
PheValAsnGillHisLeu
SCI
HisLeuValG1uAlaLeuTyrLeuVal
Phe
Pro
averrorav abs error
147.189913
114.10128.13137.141131615Ll4
:")7.0S87.0S
137.14113.1699.13
129.127L0S
113.16163.18113.1(i99.B
13Ll<57.06
12912156.1957.05
147.18147.18163.18
9712128.177L0S
(Y29) 3349.783250.643136553008.42
(Y",) 2871.272758.112606.972549.922462.84
(Y20) 2325.702212542113.411984.291913.21
(Y15) 1800.051636.871523.711424.581273.44
(Y1O) 1216.391087.27931.08874.03726.8657968416.50315.40218.2890.11
3349.32 (-0.46)3250.87 (+0.23)3136.69 (+0.14)3008.04 (-038)287Ll1 (-0.16)2758.19 (+0.07)2506.78 (-0.21)2549.70 (-022)2463.23 (+0.39)2325.90 (+0.20)2212.55 (+0.01)2113.27 (-0.14)1984.20 (-0.D9)1913.05 (-0.16)1799.71 (-0.34)1636.72 (-0.15)1523.37 (-0.31)142451 (-0.07)127352 (+0.08)1216.43 (+0.04)1086.95 (-0.32)930.91 (-017)
-0.09 ± 0.220.20 ± 0.12
16520264.34:J78.44506.57
(C5) 64371756.87908.01965.06
1052.14(CJII) 1189.28
1302.441401.081530.691601.77
(C15) 1714.931878101991.262090.402241.54
(C20) 2298592427.712583.892640.952788.12
(c,,) 2935.303098.4831995832%.70
(C29) 3424.87329637;)425,0:2
± 0.250.20 ± 0.15
Table 3. MALDI Fast Metastable Decay Ions Observed for Substance P (MW = 1347.65) in 2,5.Dihl'<IIroxlibenzoicAcid Matrix
N-terminal1oss, Da ''.:ill fragments) C-Lerminalloss (e l
residue mass, Da caled exptl (error) caled expl] (errOi")
Arg 156.19 (YlO) 1192.46 1192.57 (+0.11)Pro 97.12 1095.35 1095.47 (+0.12) 174.29
128.17 967.18 967.08 (-0.10) 271.409712 870.06 870.02 (-0.04) 399.58
Gin 128.13 741.93 741.62 (-0.31) 496.69GIn 128.13 (Y5) 613.80 613.98 (+0.18) (d 624.82Phe 147.18 466.63 466.75 (+0.12) 752.95File 147.18 319.45 900.07Gly 57.05 262.40 104725L,eu ln16 149.24 1104.30Mel-NH, 13120 (Cll,) 1217.46
averror +0.01 ± 0.17 ± 0.21av abs CITor 014 ± 0.09 11.18 0.08
tion should be utilized. However, it should be remembered thatmass differences (as opposed to absolute fragment ion masses)would most likely be utilized in the case oi true unknowns todetermine sequences. In such cases, external mass calibrationwith this approach might prove adequate. Additional improvemenlS in external mass calibration may be possible utilizing arecently reported sample preparation technique" which appearsto produce more unifonn samples ior analysis.
The analytes chosen to demonstrate the potential analyticalutility of the fast metastable ion decay process in MALDl were
(27) VOnll, 0.; Mann, M. Ra.!Jid Commun. Mass S.fJectrom. 1994.5,955-958.
3994 Analytical Chemistry, Vol. 67, No. 21, November 1, 1995
selected to complement some of the analytes more widely studiedby the PSD MALDI technique. 'vIajor differences observed inthe two decay processes include differences in cleavage sites (a"an - 17, b l ! versus en, YIi' and z* r. ions) and substantially lowerintensities of the fast metastable decay ions relative to PSD ions.The results that can be obtained for a moderate-sized peptidewhich is not internally cross·linked with delayed pulsed ionfocusing of the fast metastable ion decay products produced inMALDI are best demonstrated for the oxidized B chain of bovineinsulin (MW = 3495.95). A typical fast metastable ion decaymass spectrum which can be obtained for this analyte is shownin Figure 1 for MALDI from a DHB matrix. The spectmm is
TabUe 4. MAUl! fast Metastable Decay Ions Observed for Melittin IMW = 2846,49) in 2,5·Dihydroxybenzo;c AcidMatrix
N-terminalloss. Da (Y" fragments) (-terminal :oss (el : fragmcnLs)
mass, Da ca1cd exptI (error) caled c~xpll (error)
5?r)5 (Y,,) 2790.45 2790,21 (-0.24)113.16 26'17,29 2677.84 (+055) 75.07S7.05 2620.23 2620,97 (+0,64) 188.2:,71.08 2519,16 2549.40 (+0,24) 245.2999.13 2450,OZ 317.29
IEUG (Y2C) 2336.85 2337.40 (c,) 415.50128.17 2208.69 2208,74 528.669'1.13 2109.56 2109.51 656.83 \:i55.~.l~)
IIU6 19%40 1995.77 755.97 7S6.0k1Ol.1I 1895,29 1894.91 86913 869,46HILI I (y,,) 1794.19 1794.57 970.23 970.3157.05 1737.13 1736,71 107Ui7
11316 1623.97 1623.83 1128.39 1128.5097.12 1526.86 1211.S!)71.08 1455,78 1455.92 (+J.l4) 1338.66 1338.68
11:3.16 (YIO) 1342.62 (c,,) 14 09,7~ 1410.05113.111 1229.46 1228.94 (-0.521 1522.9087.08 1142.38 1142.64 1636.01i 1636.01
188.21 9:)6.17 056.50 (+ D.33) 1722.99113.16 843.01 1909.3~, 1909.191211.17 (Y,,) '114.8:' (C2()~ 2022.51 2022.7415G.19 SS~L64 2150,(3£ 2151.011211.17 4'3047 2301i.88 2:306.57156.19 274.28 243;).:];) 2435.37128.13 146.15 25~)1_'2Lj 2590.34128.13 (c,,,) 2719.37 2719.31
0.03 ±OAI -Cl.DI =:~ (L{)
035 ± 0.20 0.26 0.23
Pro
lk
av
5. MAL.IO, Fast Metastable Decay Ions Observed
P"r"i,," Insuli" IMW = 5777.58) in3,5~Dimethoxy~4~hydroxycinl1lamicAcid Matrix
dominated by y", and z",. (not labe:ed) ions. These fragmentsprovide overl2pplng sequence infonnation. Typical of the fast
metastable lon decay spectra we have recorded, Lhe last severa]possib~e fragn:ent ions in a series are not observed. Fragmenta
tion at a proline residue is also weak or absent in most fast metastable ion decay spectra. This is discussed in more detail below.
Matrix interferences also preclude observation of fragments below
a m/z of around 400-500, depending upon the matrix utilized.A detailed compilation of the c,. and y" fragments observed
and the absolute mass accuracy for each fragment which can beobtained with the above calibration procedure for a typical fastmetastable ion decay spectrum of the oxidized B cJ.ain of bovineinsulin is presented in Tahle 2 These data represent typical a~dnot "best-case" results. Only the absolute mass accuracy basedupon the predicted theoretical mass :oss frOD the known se(uencehas been reported. Mass differences between metastable fragmen: ions can also be easily calculated and utilized to confinn(or establish) possible sequences. For each fragment type, overallaverage erTor and average absolute error have been calculatedand tabulated. The small negative average error suggests a sli.ghtsystematic bias in the calibration procedure. Overa'! averageabsolute errors are about 0.2 Da for both the and y" fragmentseries. This mass accuracy is sufficient to differentia1e all co:nmonamino acid residues except for leucine versus isoleucine and lysine
versus glutamine, Due to the similar (or idf''ltical) residuE' masses
of these two pairs of amino acids, their identification will probablyalways remain problematic witIlOut additional fragmentationinfonnation to aid in their iden1ification, Side chain cleavagefragments thaL can be utilized to distinguish these amino acids;;I'do not appear to be produced in the fast metastable ion decay
process.In the case of the oxidized B chain of insuli"" delayed pulsed
ion extraction coupled to a linear TOF mass spectrometer doesnot mord sufficient mass resolution to resolve the isotopic
multiplets for the majority of fragment ions. 'iVllile mass resolution of about 4000 (fwhm) is not difficult to obtain under ideaif\1ALDI conditions for Slmal1er pe:ptides such as melittin with our
current delayed pulsed ion extraction design, the higher laser
exptl (error)cake!ITSiduc mass, Da
Terminal Loss (c i
7l.08 5706.30 (-0.20)12817 5578.33 5578.19 (-014)97.12 5481.21
Thr 11:1.11 5:380.11 5380.27 (+IU6)1E3.18 5216.93 5211i.88 (-005)14718 501i9.75 5070.07 (+032)
Phc 147.18 4922.58 1922,83 (+0.25)Gly 57.05 4865.52 4865.34 (-(U8)
156.19 4709.34 4'109.48 (+014)12912 4;'80.22 4;'79.84 (-03,S)
Glv 57.05 4523.17 4522.65 (-052)Cj:s 103.15 4420.02
av 0.06 ± 0.28<lvab;:; 0.23 ± 014
N-Tc:'minal L0SS5631.28 (-013)
Val 99.13 5532.28 5;'32.36 (+0.08)Am 114.10 ;'418.18 5418.06 (-0.12)GIn 128.1:3 5290.0G 5289.74 (-0.31)His 137.14 5152.90 5152.42 (-0.48)Lcu 113.16 5039.74
-019 ± 0.21av ab:: CiTor 0.22 ± 0.17
Analytical Chemist"y. Vol. 67, No 27. November 7, 7995 3995
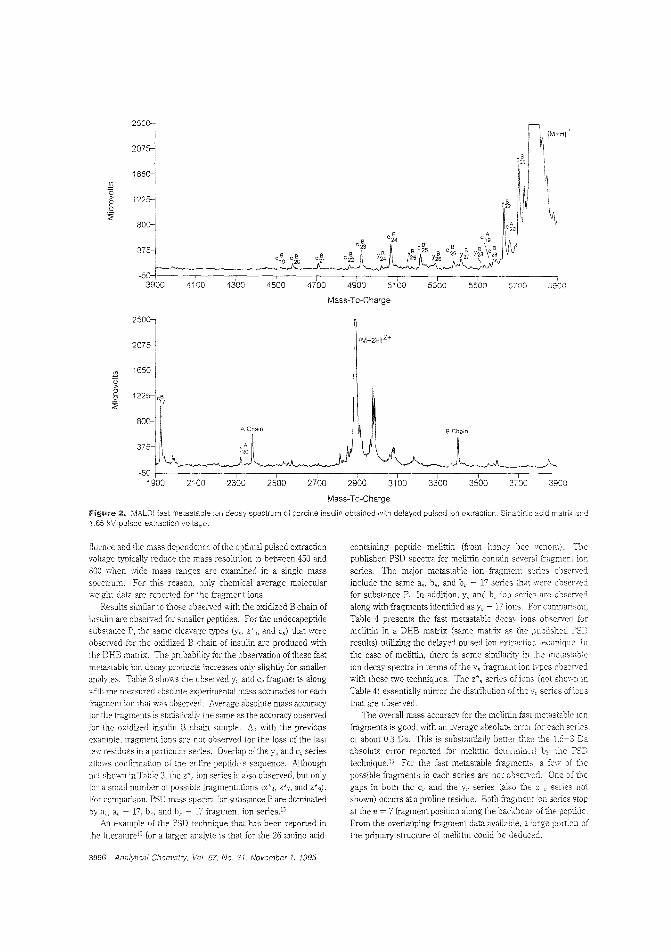
2(5>2u~
25012070rl
I1650-1
I12251
I80o-j
3751-50 r==-==,
3900 4100
cJ38 8 B B
~;4300 4500 4700 4900
i5100
I5300
i5500 5700
,5900
Mass-Ta-Charge
25]
207 I
165011225~C?7
:L~·~"~i·1900 2100 2300 2500 2700
[M+2H]2+
Mass-Ta-Charge
Figure 2u MALOI fast mefastaole ion dec2y spoctrum of porcine insulin obtained with delayed pulsed ion extraction. Sinaoinic acid matrix and1_65 kV pulsed extraction voltage.
f:uence and the mass dependence of the optimal pulsed extractionvoltage typicaliy reduce the mass resolution to between 450 and
800 when wide mass ranges are examIned in a single massspectrum. For this reason. only chemical average molecularweight data are reported for the fragment ions.
Results similar to those observed with the oxidized B chain ofinsulin are observed for smailer peptides. For the undecapeptidesubstance P, the same cleavage types (Y" z*;;, and cJ;) that wereobserved for the oxidized B chain of insulin are produced with
the DHB matrix. Tne probability for the observation of these fastmetastable ion decay products increases only slightly for smaller
analytes. Table 3 shows the observed y" and c" fragments along;;;ith me measured absolute experimental mass accuracies for each
fragment ion that was observed. Average absDlute mass accuracyfor the fragments is statistically the same as the accuracy observed
for the oxidized insulin B chain sample. As with the previous
example, fragment ions are not observed for the loss of the lastfew residues in a particular seJies. Overlap o~ the y!; and e;1 seriesanows confirmation of the entire peptide's sequence. Although
not shown in Table 3. the ion series is also observed, but onlyfor a small number of possible fragmentations (z'4, Z"7, and Z*9).
For comparison, PSD mass spectra for substance P are dominated
by 8;:, ail - 17, bl:, and bl: fragment ion seriesYiAn example of the PSD technique that has been reported in
the literature" for a larger analy1e is that for the 26 amino acid-
3996 Analy'ical Chemistry. Vol. 67. No. 21, November 1. 1995
containing peptide melittin (from honey bee venom). TIrcpublished PSD spectra for melittin contain several fragment ien
series. The major metastable ion fragment observedinclude the same a,,., b"., and b" - 17 series that observedfor substance P. In addition, Ylt and b1i ion series are observedalong with fragments identified as y" - 17 ions. For comparison,
Table 4 presents the fast metastable decay ions obsen·eel formelittin in a DHB matrix (same matrix "5 the published PSI)results) utilizing the delayed pulsed ion extractlon technique. 10the case of melittin1 there is some similarity in mecastable
ion decay spectra in tenus of me y" fragment ior, types observedwith these two techniques. The z*" series of ions (not ShO\\l1
Table 4) essentially milTor the disuibutioll of the v, selies 01' ions
that are observed.The overall mass accuracy for the melittin fast metastable ion
fragments is good, with an average absolute errCr [Dr each sClicsof about 0.3 Da. This is substantially better than the 1.5-3 Daabsolute error reported for meIittin deLennillt'd by the PSDtechnique." For the fast metastable fragments. a few of the
possible fragments in each series are not observed. One oj thegaps in both the en and the YII series (also the series noi
shown) occurs at a proline residue. Both fragment ion series stopat me n = 7 fragment position along the backbone of the peptide.
From the overlapping fragment data available, a iarge portion of
the primary structure of melittin could be deduced.
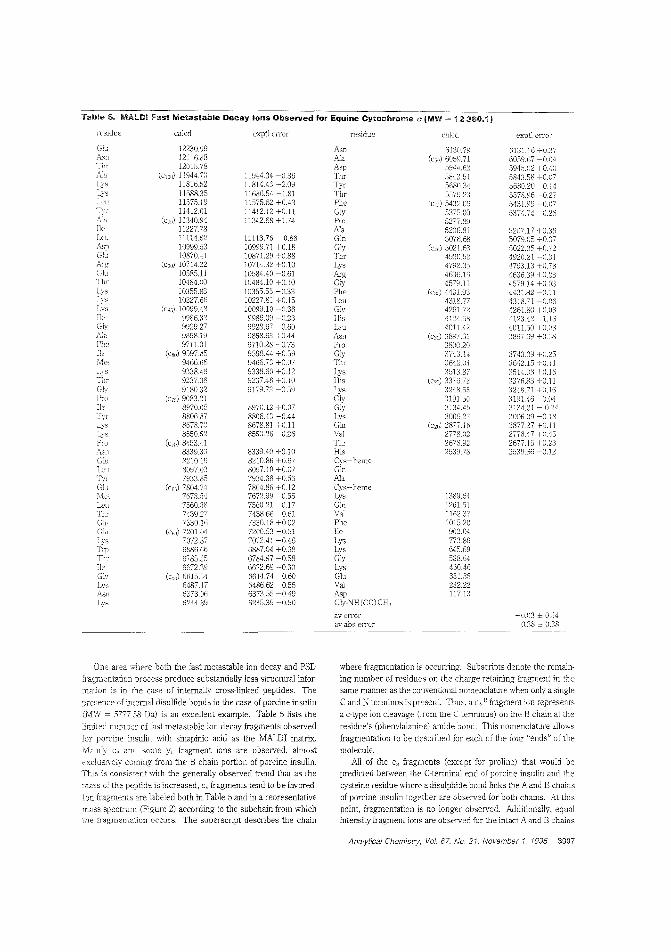
TableS, MAI.O! fast Metastable Decay Ions Observed for Equine Cytochrome IMW ~ 12360,1)
residue ealed exptl error residue calcd exptl en-o.-
Glu 12230.99 Asn 6130.79 6131.16 +0.37Asn 12116.38 Aa (C50) 6059.71 6059.67 -OMThr 12015.78 594"J.62 594:).IJ2 +O.4IJAJa (ClOU) 11944.70 11944.34 -0.36 584:3.5] 581 :JS8 +Oil7
11816.02 11814.43 -2.09 5680.34 5680.20 -0.1411688.35 11686.54 -1.81 5579.23 5578.96 -0.2711575.19 11575.62 +0.43 Phe (c,,) 5432.0li ';431.99 -0.il71H12.01 11412.12 +C.11 Gly 5375.00 5374.74 -0.26
(c~J::;) 11340.94 11342.68 + 1.74 Pro 5277.89lie 11227.78 Ala 520li.81 52()7.17 +0.36Leu 11114.62 11113.75 - 0.86 G:n 501K.58 5079.05 +0.37
10999.53 10999.71 +(1.18 (Cl,o) 5021.6:':; li022.35 +0.7210870.41 10871.29 +0.88 4920.52 4920.21 -lUI
(c~J(J) 10714.22 10711.32 +0.10 4792.35 4793.13 +0.7810585.11 10584.40 -0.61 46%.11; 4636.39 +0.23
Till' 104K4.0IJ 1IJ484.10 +0.10 457!!.11 4579.14 +O.OlJ10355.83 1035.S55 -0.33 (eJ:) 4431.91: 443~.82 -O.ll10227.66 10227.81 +0.15 Leu 4318.77 4318.71 -0.06
(esci 10099.48 10099.10 -0.38 1261.72 4261.80 +0.089986.32 9986.09 -0.23 4124-58 4123.42 -LIG9929.27 9928.67 -0.60 Leu 4011.42 4011.,,0 +0.089858.19 9858.63 10.44- Asn (c;;c) 3897.31 3897.69 +U.;;8
PIll' 9711.01 971 0.28 -0.73 Pro 3800.20lie (cso) 9597.85 9598.4<' +059 3743.1<j ;}7411.39 +0.25
9466.66 9466.73 +0.07 3642.0·) 3642.15 +0.] 19338.48 9338.60 +0.12 35l3.87 351<-.03 +0.169237.38 9237.48 +0.10 (c2~") 3376.72 3376.83 +0.11
Glv 9180.32 9179.7:'] -059 Lys 3248.55 3248.71 +0.16(e",) 9083.21 Gly 3191.50 :119146 -0.04
Ik 8970.05 8970.12 +0.07 Gly 3134.45 3J:J4.21 - 0.248806.87 8806.43 -044 3006.27 ':W06.09 -0.188678.70 8678.81 +011 (c,o) 2877.16 2877.27 +0. j 18550.52 8550.26 -0.26 Val 2778.02 2778,47 +0.45
(e,,,) 8'53.41 Thr 2676.92 2677.15 +0.238;)39.30 8339.40 +0.10 His 2539.78 2539.66 -0.12
Glu 8210.19 8210.86 +0.67Leu 8097.03 8097.10 +007
7933.85 7934.38 +0.53 Ala(elii) 7804.71 7804.86 +012 Cys-heme
7673.54 7672.99 -0.55 11389.647560.38 7.560.21 -0.17 1261.517459.27 7458.66 -0.61 Val 1162.37
CJu 7330.16 7330.18 +002 Phe 101520Glu (err.,) 7201.04 7200.53 -051 lie 902.01
7072.87 7072.41 -046 Lys 773.866886.66 6887.04 +0.38 Lys 645.696785.55 6784.97 -0.58 ely 588.64
lie 6672.39 6672.69 +0.30 Lys 460.46Gly (c,,) 6615.34 6614.74 -0.60 Glu 331.35
6487.17 6486.62 -0.55 Val 232.226373.06 6373.55 +0.49 Asp 117.13
Lys 6214.89 6245.39 +0.50 Gly-NH(CO)CH,
averror -0.03 ± 054av abs error O.:J8 ± (U8
One area where both the fast metastable ion decay and PSD
fragmentation process produce substantially less structural infor
mation is in the case of internally cross-linked peptides_ The
presence of internal disulfide bonds in the case of porcine insulin
(MW = 577758 Da) is an excellent example. Table 5 lists the
limited number of fast metastable ion decay fragments observed
for po,cine insulin with sinapinic acid as the MALDI matrix.
Mainly c" and some y" fragment ions are obser/ed, almost
exciuslve!y coming from ~he t3 chain portion of porcine insulin.This is consistent vvith the generally observed trend that as themass of the peptide is increased, c,. fragments tend to be favored.
Ion fragments are labeied both in Table 5 and in a representative
mass spectrum (Figure 2) according to the subchain from whichthe fragmenta:ion occurs. The superscript describes the chain
where fragmentation is occurring. Subscripts denote the remain
ing number of residues on the charge-retaining fragment in the
same manner as the conventional nomenclature when only a single( and N terminus is present. Thus, a c,,1l fragment ion represe11lS
a e-type ion cleavage (from the ( terminus) on thc B chain at the
residue's (phenylalanine) amide bond. This nomenclature allows
fragmentation to be described for each of the four "ends" of the
molecule.
All of the c" jj'agments (except for proline) that would bepredicted between L'1e (-terminal end of porcine insulin and the
cysteine residue wherc a disulphide ')and links the A and D chains
of porcine insulin together 2re observed for both chains. At this
point, fragmentation is no longer observed. Additionally, equalintensity fragment ions are observed for the intact A and B chains
Analytical Chemistry. Vol. 67, No. 21. November 1 1995 3997
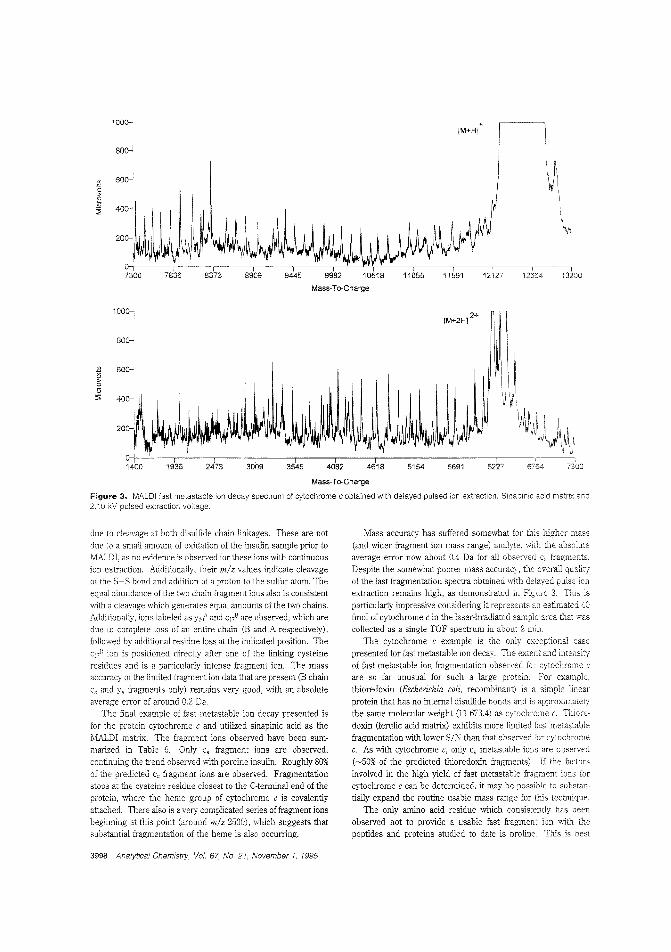
100(), +[M+Hl
80
iJ60\ \
m' \c
>§~
\
"\fJ
ii i12127 12664 13200
Mass-To-Charge
100
80
~ 60C>§~ 40
20
1400 1936 2473 3009 3545 4082 4618 5154 5691 6227
Mass-To-Charge
Figure 3. MALD! fast metastable ion decay spectrum of cytochrome c obtained with delayed pulsed ion extraction. Sinapinic acid matrix and2.10 "V pulsed extractior voltage.
due to cleavage at both disulfide chain linkages. These are notdue to a small amount of oxidation of the insulin sample prior toMALDI, as no evidence is observed for these ions with continuousion extraction, Additionally, their mlz values indicate cleavageof the S-S bond and addition of a proton to the sulfur atom. Theequal abundance of the two chain fragment ions also is consistentwith a cleavage which generates equal amounts of the two chains,Additionally, ions labeled as and Cns are observed, which aredue to complete loss of an entire chain (B and A respectively),followed by additional residue loss at the indicated position, Thec,i' ion is positioned directly after one of the linking cysteineresidues and is a particularly intense fragment ion. The massaccuracy of the limited fragment ion data that are present (B chainc" and y, fragments only) remains very good, with an absoluteaverage error of around 0.2 Da,
TI,e final example of fast metastable ion decay presented isfor the protein cytochrome c and utilized sirrapinic acid as theMALDI matrix, The fragment ions observed have been summarized in Table 6. Only c" fragment ions are observed,continuing the trend observed with porcine insulin, Roughly 80%of the predicted c" fragment ions are observed, Fragmentationstops at the cysteine residue closest to the C-terminal end of theprotein, where the heme group of cytochrome c is covalentlyattached. There also is a very complicated series of fragment ionsbeginning at this point (around m/z 2000), which suggests thatsubstantial fragmentation of the heme is alsc occurring,
Mass accuracy has suffered somewhat for this higher mass(and wider fragment ion mass range) analyte, with the absoluteaverage error now about 0.4 Da for all observed fragments.Despite the somewhat poorer mass accuracy, the overall qualityof the fast fragmentation spectra obtained with delayed pulse ionextraction remains high, as demonstrated in Figure 3. This isparticularly impressive considering it represents an estimated 40fmol of cytochrome c in the laser-irradiated sample area that wascollected as a single TOF spectmm in about 2 min.
The cytochrome c example is the only exceptionai casepresented for fast metastable ion decay. The extent and intensityof fast metastable ion fragmentation observed for cytochrome care so far unusual for such a large protein. For example,thioredoxin (Escherichia coli, recombinant) is a simple linearprotein that has no internal disulfide bonds and is approximateiythe same molecular weight (11 673.4) as cytochrome c. Thioredoxin (femlic acid matrix) exhibits more limited iast metastabiefragmentation with lower SIN than that observed ior cytochromec, As with cytochrome c, only c" metastable ions are observed(~50% of the predicted thioredoxin fragments). If the factorsinvolved in the high yield of fast metastable fragment ions fercytochrome c can be determined, it may be possible to substan·tially expand the routine usable mass range for this technique.
The only amino acid residue which consistently has beenobserved not to provide a usable fast fragment ion with thepeptides and proteins studied to date is proline. This is best
3998 Analyticai Chemistry, Vol. 67, No. 21, November 1, 1995
demonstrated by the lack of a Cc; ion for the oxidized B chain of
insuliJ and tbe lack of the c", C71i, 0"" and c,.j ions in cytochromec. This is perhaps not surprising if the different bonding which
occurs for pnline residues is considered along with the lack of
any observed tendency for multiple bond cleavages. Because of
the cyclic nature of tile proline residue that results in a tertiary
instead o~ a secondary amide structure, en and z\ ions wouldrequire two lands to be broken in order for these fragment
species to be observed. The Yn fragmem ion series observed forother amino acid residues can still cccur, but this process mustalso CJill[.,ete vvith ring' opening and rearrangement, which would
provide my apparent change in mass. In the case of smaller
peptic:,es, a low-intensity fragment can sometimes be seen forproline and almost always a y, type, as in the case of substance
P :,Table 3).
CONCUJSiONIS1110 fast metastable fragmentation data available with the
delayed pulsed ion extraction technique on a linear TOF mass
spectrometer have clear analytical utility in aiding in primary
structure deLenninations of small and intenllediate-sized peptides.
If the unique aspects of cytochrome c which are responsible forthe high yield of fast metastable fragment ions can be identified,
the pcssibility exists for expanding the utility of this technique to
iarger pepticles and proteins, While considerable work is neces-
sary before this methodology can be utilized \Yith tme unkno\YTIs,
its application with small to medium-sized peptides purified fromenzymatic digests of larger proteins has obvious potentiel Utiliza
tion of the delayed pulsed ion extraction technique in conjunctionwith reflecting TOF mass spectTometers might also allow ad
ditional improvements in the obtainable mass resolution of
fast metastable ion fragmentation spectra. Such improvements
in mass resolution should yield better sequence-specific infom1ation for unknowns.
ACKNOWLEDGMENT
The authors greatly acknowledge the assistance cf D:rcctcdEnergy, Inc., both for donation of the initial GRX 3.0K pul,er and
for helpful discussions with the staff concerning the pulser's use
for this project This research was sUPPOlted, in part, by grants
from the National Institutes of Health, Divisions of Research
Resources (RR05311) and General Medical (GM47914), and withfunds provided by U",h State University.
Received for review May 2, 1995. Accepted August 10,1995,0
AC9504225
'" Abstract published Advai1O' ACS Abstracts. September l~, 1995
Analytical Chemistry, Vol. 67, rvo. 21, November 1, 1995 3999
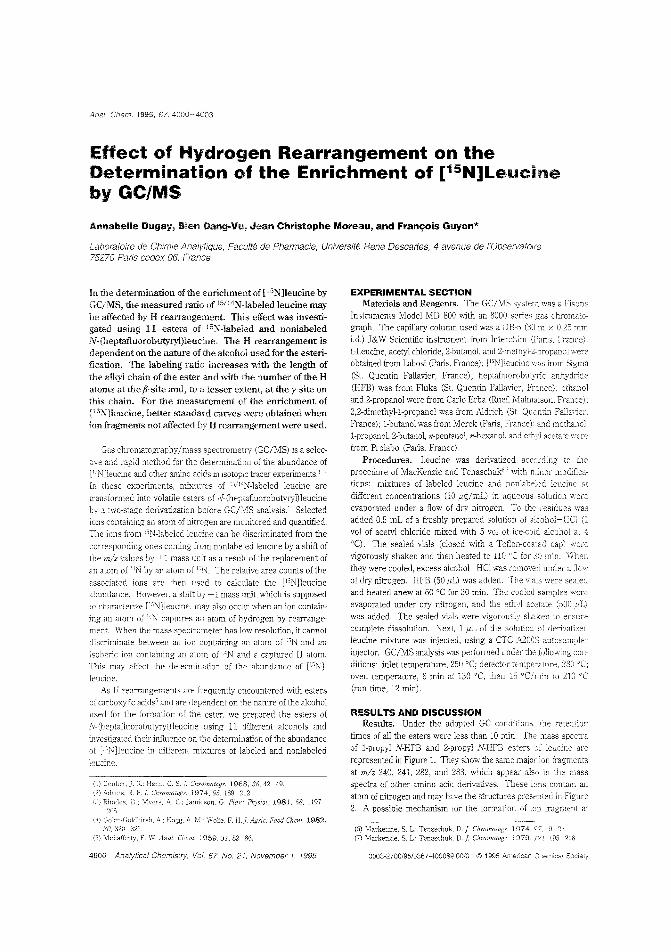
Anef. Chem. 1995, 67.40004003
Effect of Hydrogen Rearrangement on theDetermination of the Enrichment of [15N]Leucineby GC/MS
Annabelle Dugay, Bien Dang,VlI, Jean Christophe Moreau, and Franc;:ois Gll.lyon*
Laboratoire de Chimie Analytique, Faculte de Pharmacie, Universite Rene Descartes, 4 avenue de rObservatolre75270 Paris cedex 06, France
In the determination of the enrichment of [l5N]leucine byGC/MS, the measured ratio of l5/l4N-labeled leucine may
be affected by H rearrangement. This effect was investigated using 11 esters of loN-labeled and nonlabeled
N-(heptafluorobutyryl)leucine. The H rearrangement is
dependent on the nature of the alcohol used for the esterification. The labeling ratio increases with the length of
the alkyl chain of the ester and with the number of the H
atoms at the fJ-site and, to a lesser e)c1:ent, at the y-site on
this chain. For the measurement of the enrichment of[15N]leucine, better standard curves were obtained when
ion fragments not affected by H rearrangement were used.
Gas chromatography/mass spectrome:ry (GC/MS) is a selec
tive and rapid method for the determination of the abundance of[LJN.jleucme and other amino acids in isotopic tracer experiments. j-~In these experiments, mixtures of I'/I'N-labeled leucine are
transformed into volatile esters of N-(hepIafluorobutyryl)leucineby a two-stage derivatization before GC/MS analysis] Selectedions containing an atom of nitrogen are monitcred and quantified.
The ions from loN-labeled leucine can be discriminated from the
corresponding ones coming from nonlabeled leucine by a shift ofthe mlz values by +1 mass unit as a result of the replacement of
an atom of !IN by an atom of The relative area counts of the
associated ions are then used to calculate the [LiNlleucineabundance. However, a shift by +1 mass unit. which is supposedto characte!ize [lsN]leucine, may also occur when an ion contain~
ing an atom of !"N captures an atom of hydrogen by rearrangement. VVhen the mass spectrometer has low resolution, it cannotdiscriminate between an ion containing an atom of LiN and an
isobaric ion containing an atom of "N and a captured H atom.This may affect the determiration of the ahundance of P'N]
leucine.As H rearrangements are frequently encountered with esters
of carboxylic acids' and are dependent on the nature of the alcoholused [or the formation of the ester. we prepared the esters of
N~(heptafluorobutyryl)leucine using 11 different alcohols and
investigated their influence on the determination of the abundanceof [lC'N]leucine in different mixtures of labeled and nonlabeled
leucine.
(1) Coulter, J. k: Hal1ll. C. S. J. CMtJmatcgl'. 1968, 36, 42-49.Adams, R f. I 1974.95. 189-212.I~hodes. Myers. A. Jamieson, G Ph~,siol. 1981,68.1197-1205.
EXPERIMENTAL SECTIONMaterials and Reagents. The GC/MS system was a Fisons
Instruments Model MD 800 with an 8000 series gas chromatograph. The capillary column used was a DB-5 (30 m x 0.25
i.d.) J&W Scientific instrument from lnterchim (Paris, France).L-Leucine, acetyl chloride, 2-butanol. and 2-methyl-2-propanol wereobtained from Labosi (palis. France); [LiNlleucine was from Sigma
(St. Quentin Fallavier, France); heptafluorobutyric anhydlide
(HFB) was from Fluka (St. Quentin Fallavier, France); ethanoland2-propanol were from Carlo Erba (RueD MallIlaison, Fra:1Ce);
2,2-dimethyl-l-propanol was from Aldlich (St. QLentin Faiiavier,France); I-butanol was from Merck (paris, France); and methanol.
1-propanol, 2-buta.'1ol, n-pentanol. n-hexanol, and etl""l acetatefrom Prolabo (palis, France).
Procedures. Leucine was clerivatized accDrding to
procedure of MacKenzie and Tenaschuk", with minor modifications! mixtures of labeled leucine and nonlabeled leucine at
different concentrations (10 !lg/mL) in aqueous solutionevaporated under a flow of dlY nitrogen. To the residues wasadded 0.5 mL of a freshly prepared solution of alcohol- HCI
vol of acetyl chloride mixed with 5 vol of ice-cold alcohol at
'C). The sealed vials (closed with a Teflon-coated cap)
vigorously shaken and then heated to no 'c for 30 min. W11enthey were cooled, excess alcohol-HCI was removed under a flow
of dry nitrogen. HFB (50 ilL) was added. The vials were serledand heated anew at 60 'C for 30 min. The cooled samplcs
evaporated under dry nitrogen, and the ethyl acetate (500
was added. The sealed vials were vigorously shaken to ensurecomplete dissolution. Next.] Ill, of the 80hltion of delivatized
leucine mixture was injected. using a CTC -'\200S autosarnpler
Injector. GC/MS analysis was performed under the following COD
ditions: inlet temperature, 250 'C; detector temperature. 280 'C:oven temperature, 6 min at 130 'C. then 15 'C/min to 210 'c(mn time, 12 mIn).
RESULTS AND DISCUSSIONResults. Under the adopted GC conditions the retention
times of all the esters were less than ]0 min. The mass spectraof I-propyl N-HFB and 2-propyl N-HFB esters of leucine are
represented in Figure L They show the same major ion fragments
at mlz 240. 241, 282, and 283. which appear also the massspectra of other amino acid derivatives. These ions contain anatom of nitrogen and may have the stnJctures presented in Figure2. A possible mechanism for the formation of fragment at
(4) Golan-Goldhirsh. A.; Hogg, A. rvL; Woife. F. H ]. Agric Food Chcm. 1982,30, :::\20-:523.
(:")) ::Y1cLaffer\y. F. \V. Anal. Chnll. } 959.31.82-86.(6) Mackenzie, S. L; Tenaschuk(7) Mackenzie. S. L; Tenaschuk
4000 Analytical Chemistw Vol. 67. No. 21. November 1. 1995 0003-2700/95/0367-4000S9.0010 © 1995 American Chemicai Society
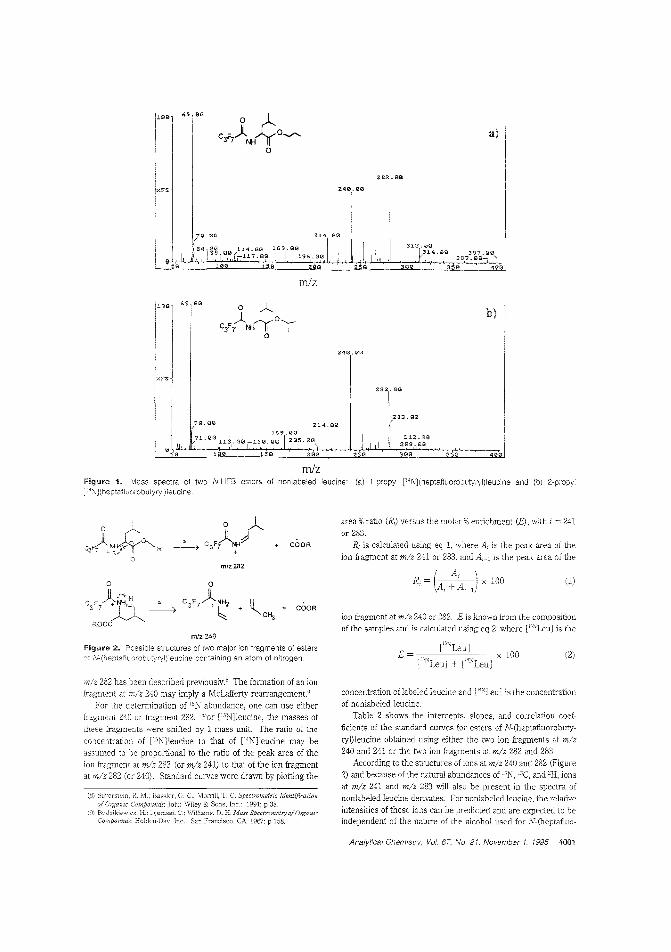
69 91<1
a)
282.9g:
xFS
@ II,o
7Q.9G/
8.t;\."H3 11.4.Qg19';l.l9~.r_1.l7 99
lee
169.Qg 2.l\
QO
II 1%.001
200
313i·.~'Hay3l.4.B2
gO
397,1;)lj!~87.9g "
m/z
69 gra
b)
2413. laG
%FS
282. ta0
/9.913/283. gG
21fO169.IJG71- gg 113. g",1.39.Q9'r213S.gg, I
.1 1,1::HZ.""G
• I 3129,.112-9
50 '00 150 200 250 00 ". 400
mlzFigure i. Mass spectra of two N-HFB esters of nonlabeled leucine: (a) i-propyl [14Nj(heptafluorobutyryl)leuGlne an·j (b) 2-propylii' \lJ (hep!afl uOlobutyryl) leucine.
m/z 240
Figure 2. Possible structures of two major ion fragments of estersof N-(heptafluorobutyryl)leucine containing an atom of nitrogen.
m/z282
(1)
(2)['''NLeU]
E = ~ x 100[ "Leu] + ('NLeU]
area %ratio (Ri) versus the molar %enrichment (f<,), with i = 241or 283.
Ri is calculated using eq 1, where A; is the peak area of theion fragment at mlz 241 or 283, and A i - 1 is the peak area of the
Ri = (Ai :~lJ x 100
ion fragment at mlz 240 or 282. E is known from the compositionnfthe samples and is calculated using eq 2, where [i~"Leuj is the
COOR
COQR
+ ~ +CH,
o
)l''''HC F + NH,,-, a3 7 ~ I -------:>ROOC J..-...
282 has been described previously.' The formation of an ionfragment at mlz 240 may imply a Mclafferty rearrangement."
For the determination of "N abundance, one can use eitherfragment 240 ur fi-agment 282. For [l"N]Jeucine, the masses ofthese fragments \Vere shifted by 1 mass unit. The ratio of theconcentration of [l5N]Jeucin.e to that of [14N]leucine may beassumed to be proportional to the ratio of the peak area of theion fragment at mlz 283 (or mlz 241) to that of the ion fragmentat mlz 282 (or 240). Standard curves were drawn by plotting the
(tl) SilverSkin, M.; Bassler, G. C; Morrill, T C. Spectrometric IdentificationCompounds: John Wiley & Sons, be.: 1991; p 38.
(9) H.: Djer;:lssi. C'.; Wjlliams. D. H. ,'Jm"sl,,,t,,md'J' of,9,g,ani,COi"l1.Domuis: Hold(;n-Day, Inc.: San Francisco, CA, 1967; p
concentration oflabelcd leucine and [' 'Leu] is the concentrationof nonlabeledleucine.
Table 2 shows the intercepts, slopes, and correlation coefficients of the standard curves for esters of N(heptafluorobutyryl)leucine obtained using either the two ion fragments at mlz240 and 241 or the two ion fragments at mlz 282 and 283.
According to the structures of ions at mlz 240 and 282 (Figure2) and because of the natural abundances of 15N, tile, and 'H, ionsat mlz 241 and mlz 283 will also be present in the spectra ofnonlabeled leucine derivates. For nonlabeled leucine, the relativeintensities of these iors can be predicted and are expected to beindependent of the nature of the alcohol used for N-(heptafluo-
Analytical Chemislry Vol. 67, No. 21. November 1, 1995 4001
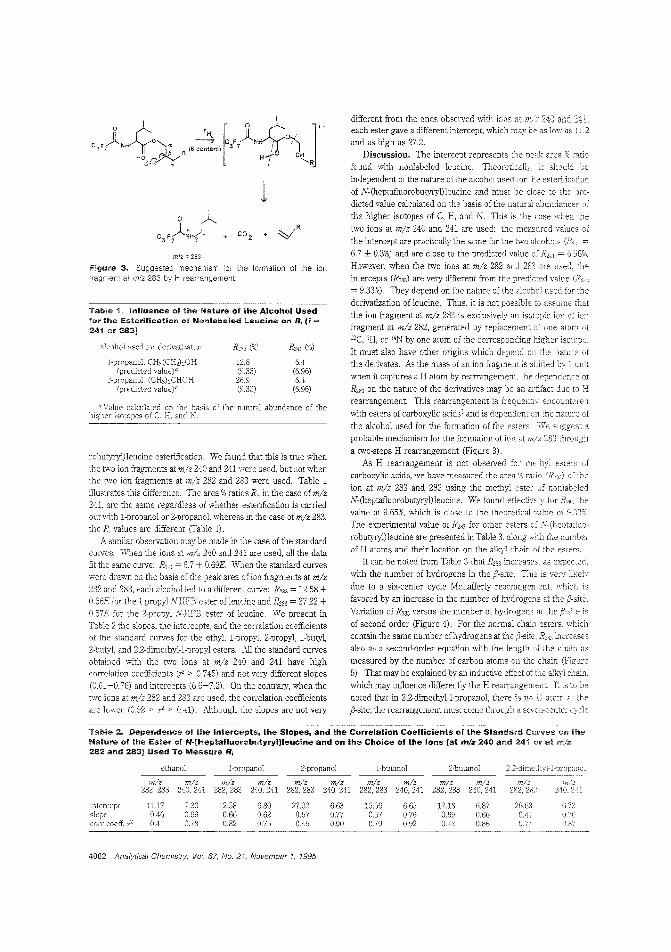
Table 1. Influence of the Nature of the Alcohol Usedfor' the Esterification of Nonlabeled Leucine on R i (i =
241 or 283)
m!z = 283
Figure 3. Suggested mechanism for the formation of the ionfragment at m/z 283 by H rearrangement.
different from the ones observed with ions at 240 andeach ester gave a different intercept, which may be as low as 11.2
and as high as 27.2.
Discussion. The intercept represents the peal.::: area %found with nonlabeled leucine. 111eoretically, should be
independent of the nature of the alcohol used for the esterification
of N-(heptafluorobutyryl)leucine and must be close to the pre
dicted value calculated on the basis of the natural abundances of
the higher isotopes of C, H, and N. This is the case when [he
two ions at mlz 240 and 241 are used: the measured values of
the intercept are practically the same for the two aioahols (R,,;; =
6.7 ± 0.3%) and are close to the predicted value of R241 = 6.96%.
However, when the two ions at mlz 282 and 283 are used, theintercepts (R2R.o) are very different from the predicted value (R,q
= 9.33%). They depend on the nature of the alcohol used for the
derivatization of leucine. Thus, it is not possible assume that
the ion fragment at mlz 283 is exclusively an isotopic ion of i011fragment at mlz 282, generated by replacement one atom of
l2C, lH, or 14N by one atom of the corresponding higher isotope.
It must also have other origins which depend on the nature ofthe derivates. As the mass of an ion fragment is shifted by : unit
when it captures a H atom by rearrangement, the dependence of
R2S:! on the nature of the derivatives may be an artifact due to I-Irearrangement. This rearrangement is frequently encountered
with esters of carboxylic acids' and is dependent the nature of
the alcohol used for the formation of the esters, We suggest
probable mechanism for the formation of ion at 283
a two-steps H rearrangement (Figure 3).
As H rearrangement is not observed for methyl esters of
carboxylic acids, we have measured the area %rutlo (Rzs:J of the
ion at mlz 283 and 282 using the methyl este' of noniabeled
N-(heptafluorobutyryl)leucine. We found effectively for thevalue of 9.65%, which is close to the theoretical ","alue of 9.3391,The experimental value of R283 for other esters N-(heptaHuo
robutyryl) leucine are presented in Table 3, along \Vith the number
of H atoms and their location on the alkyl chain of the esters.It can be noted from Table 3 that R2S3 increases, as expected.
with the number of hydrogens in the j3-site. This is very likely
due to a six-center cycle Mclafferty rearrangement, is
favored by an increase in the number of hydrogens at the j3-slte.
Variation of R283 versus the number of hydrogens at the ;3-site is
of second order (Figure 4). For the nonnal chain esters, which
contain the same number of hydrogens at the (,-site, R,,, increases
also as a second-order equation with the length of the chain as
measured by the number of carbon atoms on the chain \'Figure5). That may be explained by an inductive effect 0: the alkyl chain,
which may influence differently the H rearrangement. It is to be
noted that in 2,2-dimethyl-l·propanol, there is no atom at the
fi-site; lie rearrangement must corne lbrough a seven-center cycle
R241 (%)
12.8 6.4(6.96)6 '
(9.33) (6.96)
R2:C:J (%)
of the natural abundance of the
8.lcohol used for denvatization
1
robutyryI)leucinc esterification. We found that this is true when
the two ion fragments at mlz 240 and 241 were used, but not whenthe two ion fragments at mlz 282 and 283 were used. Table 1
illustrates this difference. The area %ratios R" in the case of mlz241, are the same regardless of whether esterification is carriedout",ith I-propanol or 2-propanol, whereas in the case of mlz 283,
the R values are different (Table 1).
A similar observation may be made in the case of the standardcurves. When the ions at mlz 240 and 241 are used, all the datafit the same curve: R", = 6.7 + 0.69£. When the standard curves
were drawn on the basis of the peak area of ion fragments at mlz232 and 283, each alcohol led to a different curve: R283 = 12.58 +0.66E for the I-propyl N-HFB ester of leucine and R283 = 27.22 +0.57£ for the 2-propyl N-HFB ester of leucine. We present in
Table 2 the slopes, the intercepts, and the correlation coefficientsof the standard curves for the ethyl, I-propyl, 2-propyl, I-butyl,
2-butyl, and 2,2-dimethyl·l-propyl esters. All the standard curves
obtained with the two ions at mlz 240 and 241 have highcorrelation coefficients (r" > 0.745) and not very different slopes
(0.61-0.76) and intercepts (6.6-7.2). On the contrary, when the
twc ions at mlz 282 and 283 are used, the correlation coefficientsare lower (0.92 > r' > 0041). Although the slopes are not very
o ~ 't 0 j( J+')l H)l , ,_ ° ---7 CF' N ; .:C 3 '7 N '1" R (6 centers) 37 : l
+0.r-~ H-t C~t.<~H' "( f R
Table 2. Dependence "f the Intercepts, the Slopes, and the Correlation Coefficients of the Standard Cu,ves on theNature of the Ester of N·IHeptafluo,obutyryllleucine and on the Choice of the Ions (at m/z 240 and 241 at m/z282 and 283) Used To Measure R;
ethanol l·propanol 2-propanol 1-bulanol 2·butanol 22-dimc:.hyl-l-propanol
interceptslopecorr coeft,
1Ll70.460.41
7.200.690.78
12.580.660.82
6.800.620.75
27.22D.57D.45
6.630.770.90
15.560.570.79
6.650.760.92
17.180.690.72
1i.870.660.86
26.630.470.74 (l.S:
4002 Analytical Chemistry, Vol 67, No. 21. November 1, 1995
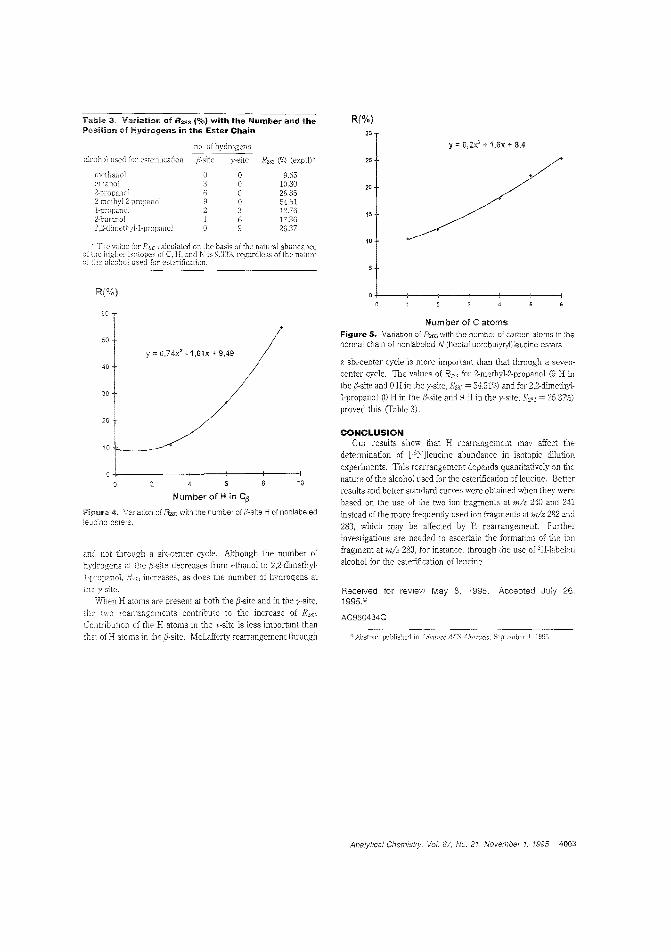
Table 3. Variatkul of R283 (0/0) with the Number and thePositnon of Hydrogens in the Ester Chain
R(%)30
no, of hydrogens y = O,2x' + 1,6x + 8,4
cSleriilCation f}-site y-site R2a:i (%) (exprl)!i 25
methanolethanol
2,2-dimetl'1~ll-prop(ino]
9.6510.8026.8554.5112.7617.3626.37
20
15
10
R(%)
eo
0+---+---+---+---+---+----1o
50
y = O,74x' -1,61x + 9,49
40
30
Number of C atoms
Figure 5" Variation of R283 with the number of carbon atoms in thenormal chain of non labeled N-(heptafluorobutyryl)leucine esters.
a six-center cycle is more imponant than that through a sevencenter cycle. The values of !I"" for 2-methyl·2-propanol (9 H inthe /i-site and 0 H in the y-site, R,s: = 54.51%) and for 2,2-dimethylI-propanol (0 H in the /i·site and 9 H in the y-site, !/"', = 2637%)proved this (Table 3).
20
10
-;01"-- -
o Abstract published in Advance ACS Abstracts. S'cj)lcmbcr 1. 1995.
Received for reView May 8, i 995. Accepted July 26.1995.°
AC950434C
CONCLUSiONOur results show that H rearrangemen'. may affect the
determination of [15N]leucine abundance in isotopic dilutionexperiments. This rearrangement depends quantitatively on thenature of the alcohol used for the esterification of leucine. Betterresults and beller standard curves were obtained when they werebased on the use of the two ion fragments at m/z 240 and 241instead of the more frequently used inn fragments at m/z 282 and283, which may be affecled by H rearrangement. Furtherinvestigations are needed to ascertain the formation of the ionfragment at m/2 283, for instance, through the use of 'H-labeledalcohol for the esterification ofleucine.
0-1---;---+-----+---+---1o
an:] not through a six-center cycle. Although the number ofhydrogens at the /3-site decreases from ethanol to 2,2-dimethyl·1~propanol, increases, as does the number of hydrogens at[he y-site.
Wl,en H a:oms are present at botb the /3-site and in the y-site,two reartangements contribute to the increase of R!.I.{;'
Contribution of the H atoms in the y-site is less important thanof H atoms in the /3-site. Mclafferty rearrangement through
6
Number of H in Cs
V2,iation of R283 wit1 the number of if-site H of nonlabeiedleucine esters.
Analytical Chemistry Vol. 67. No. 21. November 1. 1995 4003
Anal. Chem 1995. 67. 4004-4009
This Research Contribution is in Commemoration of the Life and Science ofM Kalthoff (1894-1993).
Measurement of TI(III/I) Electron Self.ExchangeRates Using Enriched Stable Isotope Labels andInductively Coupled Plasma Mass Spectrometry
Michael E. Ketterer* and Michael A. Fiorentino
Department of Chemistry, john Carroll University, University Heights, Ohio 44118
An approach is described for measuring electron selfexchange rate constants (lell) in solution based uponstable isotope-labeled reactants, chemical separations,and inductively coupled plasma mass spectrometry. Thetechnique is demonstrated for the exchange between 11llI
and 'fiI aquo ions in aqueous HC104. 11llI is preparedusing 20811-enriched 11203 (20311 abundance, -36%), andTIl is prepared from natural abundance 11 reagents(natural 20311 abundance, 29.52%). The exchange ismonitored by mixing the labeled and unlabeled reactantsand performing timewise separations through selectiveprecipitation of TIl as TlBr. Isotope abundances aremeasured in the TlBr precipitate and TIIIi solution phasesusing ICPMS with minimal sample preparation; an NISI981 (common lead) spike is added, and the 2osPbj206Pbis measured as an internal standard to correct for massdiscrimination. The self-exchange rate constant is determined from a McKay plot obtained from the 205J1 abundances of either oxidation state. A le ll of (1.0 ± 0.1) x10 4 M-I S-I was obtained in 1.5 !VI aqueous HCI04 at25 'C. The obtained k" compares favorably to a value of1.1 x 10-4 M-l s-' based upon a previously publishedstudy of this exchange reaction using radiolabeled e04TI)reactants.
into a "precursor complex". More recently, MacarTney and Sunnhave also proposed extentions to these equations." Accuratelyknown kll values are important when comparing ':heoretical ratepredictions for cross-reactions with experimental values. wbicJ.enables inferences to be drawn about reaction mechanisms andthe intlinsic properties of the reactants. Furthermore, accuratelydeterTIlined kll values are prefen-ed to the alternative of relying
on the Marcns correlation's validity while using cross·reaction datato evaluate a given kll , which has shortcomings which arcmentioned elsewhere.1 :i Unfortunately, direct measurement of k],is difficult, since no net chemical change takes place in theelectron exchange (*Ox + Red = *Red Ox). Numerous elegamprocedures have been used to measnre kll , including loss of opticalactivity of chiral complexes," infrared measurements of complexes"'ith 'H-labeled ligands,' and electrochemical exchange betweensolution-phase and electrode-adsorbed reactants. Extensivelyused procedures include NMR relaxation!·'·' .. ·.. and isotopicequilibration of radiolabeled reactantslti- n The aforementionedprocedures aU entail certain experimental and practical difficulties,which have tended to limit the systems and conditions for whichkll has been directly detennined.
A plausible but little-exploited approach for k" measurementis to incorporate stable isotope-labeled atoms into either the Oxor the Red species. perform timewise separations of an Ox/Red
Phys, Oem. 1963, 67. 853- 857.Chern. Phys 1965, ..~'3, G79-70l.
(3) Macartney, D. /1.,: Sutin, N. Inorg. Chcm. 1983,22,0) Koval, C. A; Margerum, D. 'iV. lnorg. Chern. 1981, 20.(5) Vande Linde, A. M. Q.; Junlunen, K L;
Ochlymowycz. L A; Rorabaciler. D.«(j) Farina, R: Wilkins. R G Own.(7) Meyer, T. l: Taube, H. Inorg. 1968. 7.(8) Lee, C W.; Anson, F. C. Inorg. Chern. 1984, 23,(9) Dietlich, M. W.: WahL A Chern. Phys. 1963.38,
Char:. M. S.; WahL A. C. I Clzem. 1978, 82,Shprorer, M.; Ron, G.; Lowewenstein. A: Navor1, G.J!Wig.361-365
(12) Yang, E. A: Chan, M. S.: \VahL A C..f. ')094-<)()9~j.
(13) Macartney, D. H.lnorg. CJwn. 1991,(14) Hoddenbagh, J. A.: Mac<t1tncy, D. H.(13) Takagi. H.: Swaddle, T. \V. lnorg. Chern.(16) Silverman, J,; Dodson, R. W.]. Phys. Oem. 1952, 56,(17) Krishnamuny, K. V.: WahL c.j. Am. Gem. Soc. 1938,80.(18) Bonner, N. A.; Hunt,]. P. I Am. Chem. Soc. 19GO. 82 \326-3828
(19) Jolley, \V. H.: Stranks, D. R: Swaddle T. Inorg 1990.29,389.
(20) Jolley, W. H; St:1mks, D. R,; Swaddle, T. V .1"'org. Chem. 1990.29.1951.
(21) JoHey, H.: Stranks, D. R: SW3ddlc, 1'. \V.lnorg 1992,31. S07-511.
(1)
(2)logIt, = (log
Research into solution-phase electron transfer reactions has
been an active and productive area of study since Marcus'.' firstlaid his theoretical framework. Marcus's theory describes singleelectron transfer rate constants (k· ,) for solution-phase reactantsas ~ol1ows:
where k)! and kn are self-exchange rate constants for the tworeelox couples, K" is the equiliblium constant, and Z" is thereactant collision frequency. For systems where both reactantsare charged. additional con'ective tem1S are used to account forthe electrostatic work required to bling the reactants together
4004 Analytical Chemistry. Vol. 67. No. 21. November 1. 1995 0003-2700/95/0367-4004S9.00/0 © -1995 American Chemicai Society
mixture, md monitor the change in stable isotope abundances ofOx and/or Red using mass spectrometry, Stanbury et aL"recently used this approach for determining ku for the NO,/N02
couple: 15N-Iabeled NO" separations via ion chromatography, andnegative ion FAB mass spectrometrj were used, While this, in
principle, is identical to the well-known radioisotope exchangeprocedure, the stable isotope approach is advantageous for two
reasons. Fira, large advances in separation science have takenplace since radioexcbmge studies were first performed. Newer
techniques such as reverse-phase ann ion-pair HPLC, ion chro
matography, and continuous liquid-liquid extraction are allpotentially suited to peliOlTIling the requisite separations, Anotherrelevant factor is that ICPMS enables pragmatic detenninations
of elemental isotope abundances to be made directly in solutionswith microgram per liter levels of aLalyte.n
A key limitation of both radio tracer-based and enriched stableIsotope schenes for kll measurements is the requirement for[imewise separations of Ox and Red. Ideally, the separationpl'Clcess is accomplished in a time frame which is negligiblecompared to the time scale of the exchange, Moreover, theseparE.uon process IIlust not cause an excessive degree of "zerotime exchange", which is the apparent degree of exchange
occuning as a resull of the separation process, U1timately,
separation precesses and zere-time exchange, along with reactantconcentrations, determine the upper rate limits of either stableor radiolabeicd isotope-based measurement schemes,
The present study was undertaken to demonstrate the conceptJf usirg enriched stable isotope labels, chemical separations, and
TePMS iSOtOp-2 abundance measurements as a practical, versatile
means of measuring k:). We have chosen the well-characterized
cWCl-electron exchange of11(lII/I),
as an appropriate reaction te demonstrate the concept Usingradiol"beled "'·'11It . Prestwood and Wahl'" were able to measure
using avariety 'Jf selective precipitations. This reaction is idealas a demonscrative example since the reactants are not airsensitive and the exchange takes place over a relatively long timescale (i.e., several hours to a few days). We have undertaken a
study Df k: 1 for the above reaction llsing 2o:lTI-labeled TlZO:l and
separation by selective precipitation of TP as 11Br, to lay the!i-amevork for a Lseful means of stndying many additional selfexchange reactions of contemporary interest. We demonstrate
th2.t the time dependencies of 11 isotope abundances
contain encoc:cd kinetic information about the self-exchange
process and that k: 1 may be obtained through the experiment.
EXPERIMErnAL SECTION"nTI-labeled 11,0:: (97% '0"11) was obtained from Cambridge
Isotope Labor<:tories, Based Lpon cost considerations, 1 part (w/w) of the labeled material was mixed with about 9 parts of the
natural abundance 11,0" (Alia Products) to produce the labeledstarting material for most experiments. This labeled 11IlI
U;}) Jarvi::;. K E.: HO'.lK, R S. Handbook ofInductively Coupled PlasmaMass SP"CtFf;Jzetry: Blackie: (;lz:sgow, 1992.\tI2ckay. I-I. C. 1938, 142. 9~7-998
R.I.: A, C.]. Am. Chem, Soc. 1949,71, :n37-3145.
material had a 203'11 abundance of "'36-37%, which compares to
the naturally occurring "':lTI abundance of 29.52%, 11"1 soiutionswere prepared by microwave dissolution of labeled 11,0:1 in HCIO,
(70%, Baker Optima Grade) in a dosed fluorinated ethylene
propylene test tube (Nalgene). Caution: The microwave dissolution step is ,De?fonned cautiously with 2-3 mL batches, using5-10 s pulses of 50-100 W applied power, 111 solutions wereprepared by dissolution of natural abundance Tl,CO: (Aldrich,99,999%) in HC104, ilIlI solutions were Eltered through PTfEsyringe filters to remove small arnounts of undissolved ThO:;; all
solutions were diluted with deionized water to produce the desired
HCIO, and 11 concentrations, Thallium concentrations of allsolutions were established by ICPMS using Pb as an intenalstandard,
Most kinetic experiments were conducted in 1,5 M aqueousHCIO, at 25 ± 0,2 "C, with a [11 111 -;- 1111of ~0,05 M, and with the
11IlI and 111concentrations being approximately equal, Additiooalstndies were conducted with unequal11IlI and 111concentrations,at a [TIm + 11
'] of ~0,025 M, in 30 M HCIO" anel using a 11'1I
tracer prepared from smaller relative amounts of 97% 1IlTI-labeled
1120:J,Reaction mixtures were formulaed by mixing equal volumes
of11111 and 111 solutions in a sma]] test tube, which was plc.ced in
a constant temperature bath. One hundred microliter aliquotswere withdrawn; these were mixed with 25 of 2 1\1 aqueousNaBr in the barrel of a 3 mL disposable syringe to form a 11Br
precipitate: 2 mL of additional 2 M aqueous NaBr was added, andthe mixture was filtered through a 0.2 I'm V]'FE syringe filter.The degree of zero-time exchange was somewhat sensitive to the
precise steps used in forming and rinsing the precipitate; it was
found to be imDortant to perform these steps in a consistent,
reproducible manner. The 11IH -containing filtrate was coHectedand diluted to 10 mL with 5% vIv aqueous nitric acid, The TJiBrprecipitates were dissolved by slowly passing 2 mL of aqua regiathrough the syringe lilter; the aqua regia solution was conectedand diluted to 10 mL 'mth deionized water, The TjIll and 11!
reaction mLxture products were approp!iately diluted with asolution of 0,6 mg/L NISf 981 Ph in 5% v/v aqueous nitric acid:
the optimal 11 concentration for isotope abundance measurementswas ~O,·S mg/L The same dilution and analysis scheme (seebelow) was also used co measure the isotopic composition of all11Ill and Til reactant solutions.
Isotope abundance measurements were conducted using a
Perkin-Elmer Sciex EIAN 500 ICPMS instrument This instrument utilized an unpumped (free-aspirating) Meinhard TR-30-CO.5nebulizer; the deflector and CEM detector have been replacedby an active film multiplier (Model AF561, UP Scientific, Auburn,MA). Ion lens settings were Initi"liy adjusted to produce a ""'11/203Tl 'ATithin ±4% relative to the value for naturally occurring 11. A
duplicate abundance measurement was made for each sample:each measurement collected signals for a total of 30 s per m/zusing peak hopping (one measurement per mass spectral peak)and a dwell time of 50 ms, Signals were collected at m/z 203,205, 206, and 208. nie NISf 981 Pb internal standard, with acertified 10sPb/' °opb value of 2,1681 ± 0.0008, was used to correctfor mass discrimination ;n the observed 2lJ?I1j20311 ratio using the
raw ion intensities i203-i208 and the equation shown below:
("°'11/'0:11\011 = (i205/i203) ob, (21681) / (i208/i206) Db,
(3)
Analytical ChemistfY, Vol. 67, No. 21, November 1. /995 4005
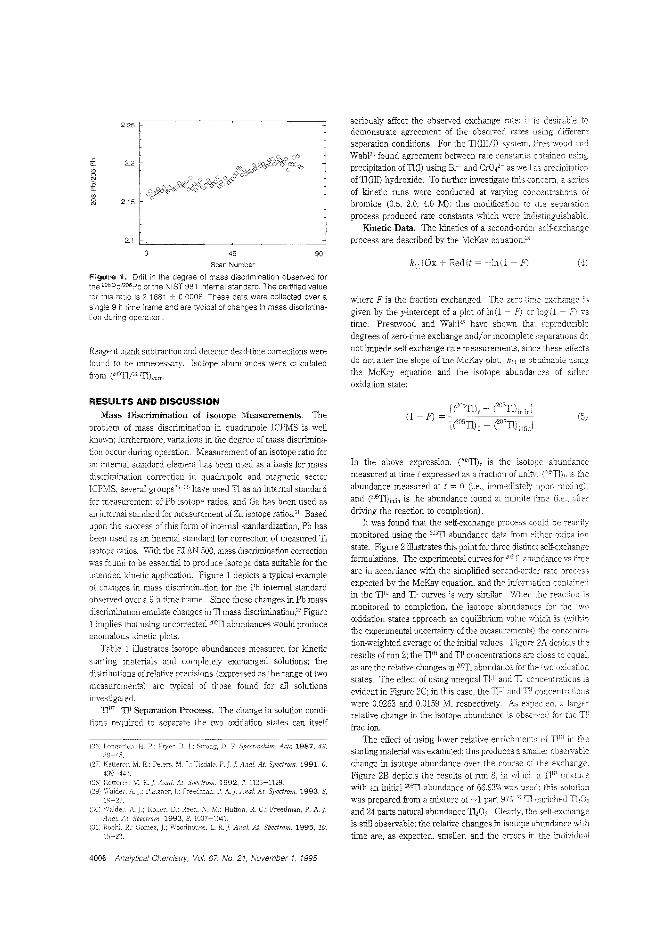
2.25
.a 2.2
~~CL
'"~ 2.15
2.1
sedously affect the observed exchange rate: it is desirable todemonstrate agreement of the observed rates using differentseparation conditions. For the 11(IIIID system, Prestwood and
Wahl" found agreement between rate constants obtained usingprecipitation of11(1) using Br- and CrO,2- as well as precipitation
of11(1I!) hydroxide. To further investigate this concern, a series
of kinetic runs were conducted at val)~ng concentrations ofbromide (0.5, 2,0, 4,0 M); this modification to the separation
process produced rate constants which were indistinguishable.Kinetic Data. The kinetics of a second-order self-exchange
process are described by the McKay equation;'"
Reagent blank subtraction and detector dead-time corrections werefou~d to be unnecessary. Isotope abundances were calculated
from e(fJ11/2°:rrl) CUIT'
Scan Number
Figure 1. Drift in the degree of mass discrimination obs8Ned forthe 208Pb/206Pb of the NIST 981 internal standard. The certified valuelor this ratio is 2.1681 ± 0.0008. These data were collected over asingle 9 h time frame and are typical of changes In mass discrimina~
tion during operation.
where F is the fraction exchanged. The zero-time exchange is
given by the y-intercept of a plot of In(l - F) or log(l - F) 'IS
time. Prestwood and WahV' have shown that reproducible
degrees of zero-time exchange andlor incomplete separations donot impede self-exchange rate measurements, since these effects
do not alter the slope of the MeKay plot. k" is oVminable usingthe McKay equation and the isotope abundances of either
oxidation state;
45 90kn[Ox + Red]! = -In(l - F) (4)
At. Spectrom. 1995, 10,
E.: Peters, M. J.: risdale, P. J.J. Anal. At. Spcctrom. 1991.6,
Longcl·ich. H. P.; Fryer, B. 1.: SLrong. D. F. Spccti'Ochim. Acta 1987,42,
In the above expression, (l0''11) , is the isotope abuncance
measured at time t expressed as a fTaction of unity, (l"''11) " is theabundance measured at t = 0 (i.e., immediately upon mixing),
and (205']1)'0110 is the abundance found at infinite time (i.e., after
driving: the reaction to completion).It was found that the self-exchange process could be readiiy
monitored using the 2°511 abundance data from either oxidation
state. Fignre 2 illustrates this point for :bree distinct self-exchangeformulations. The experimental curves for ":C11 abundance vs time
are in accordance with the simplified second-order rate process
expected by the McKay equation, and the infornJation containedin the 11Jll and Til curves is very similar, v\11eL the reaction is
monitored to completion, the isotope abundances for the twooxidation states approach an equilibrium vaiue which is (withinthe experimental uncertainty of the measurements) the concentra
tion-weighted average of the initial values. Fignre 2A depicts the
results of run 2; the 11ll! and11! concentrations are close to equai,
as are the relative changes in ,0''11 abundance for the two oxidation
states. The effect of using unequal11:u and 111 concentrations is
evident in Fignre 2C; in this case, the 11m and 11' concentrations
were 0.0263 and 0.0159 M, respectively. As expected, a largerrelative change in the isotope abundance is observed for the Ti'
fraction,
The effect of using lower relative enrichments of 11::' in thestarting material was examined; this produces a smailer observabie
change in isotope abundance over the course of the exchange.
Fignre 2B depicts the results of run 8, in which a 11III mIxturewith an initial 205Tl abundance of 66.93% was used: this solutionwas prepared from a mixture of ~1 part 97% 2()::11-emiched 11,0::and 24 parts natural abundance 1120,. Clearly, the self-exchangeis still observable; the relative changes in isotope abundance with
time are, as expected, smaller, and the errors in the individuai
].; Koller, D.; Reed. N. M.: Hutton, R. c.; Freedman. P. A.].1993,8,1037-1041.
].: Woodhouse, L. R.].
Ketterer,'1-:';9-44-3.
C28: Ketterer. M. E.]. Anal. Ai. Sj)cdrom. 1992, 7, 1125-1129.(29:- \Valder, A].: Plalzner, l.; Freedman, P. A.I Anal. At. Spectrom 1993.8,
19-23.C~O:- 'v\"alder,
Ana!. At.(31;' Hoehl. R.;
RESULTS AND DISCUSSION
Mass Discrimination of Isotope Measurements. The
problem of mass discrimination in quadrupole ICPMS is wellknovm; furthermore, vanations in the degree of mass discrimina
tion occur during operation. Measurement of an isotope ratio for
an internal standard element has been used as a basis for mass
discrimination correction in quadrupole and magnetic sector
ICPMS; several groupS21i-l0 have used 11 as an internal standard
for measurement of Pb isotope ratios, and Ga has been used as
an internal standard for measurement of Zn isotope ratios.31 Based
upon the success of this form of imernal standardization, Pb has
been used as an internal standard for correction of measured 11isotope ratios. With the E!Al\J ,,00, mass discrimination correction
was found to be essential to produce isotope data suitable for the
intended kinetic application. Fignre 1 depicts a typical example
of changes in mass discrimination for the Ph internal standard
observed over a 9 h time frame. Since these changes in Pb mass
discrimination emulate changes in 11 mass discrirnination,2i Figure1 implies that using uncorrected 2IJSTI abundances would produceanomalous kinetic plots.
Table I illustrates isotope abundances measured for kinetic
starting materials and completely exchanged solutions; the
distributions of relative precisions (expressed as the range of two
measurements) are typical of those found for all solutions
investigated.
11nT-TI' Separation Process. The change in solution condi
tions required to separate the two oxidaticn states can itself
4006 Analyticai Chemislry, Vol. 67, No. 21, November 1, 1995
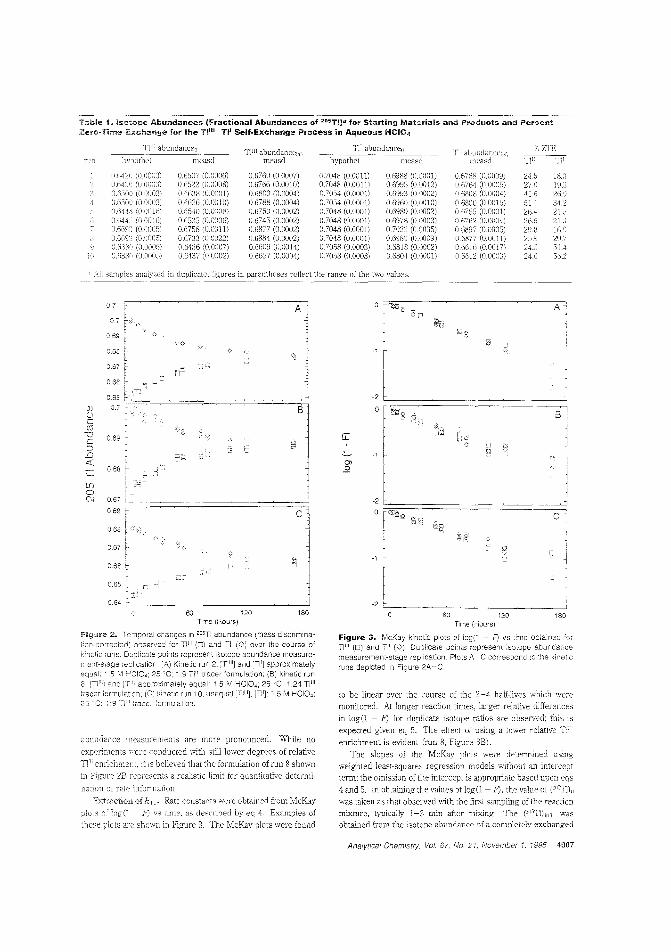
Table 1. isotope Abundances (Fractional Abundances of 205TI)a foB' Starting Materials and Products al11d Perce.,!Zei'o·Time "x"hange fo. Ihe TI"'-TII Self-Ex"hange Process in Aqueous HCI04
1'11 abundanceo
hypothet meascl
ZTETIl' TI!
24.5 18.')27.0 19.3cj 1.6 26.~)
5J.] 01.22]j
26.S 21.:l29.8 16.9
'2.9.7
24,0 56.2
0.69RS (11.0001)0,6995 (11.\)012)11.6993 (0.0002)0.6960 (OJ)010)0.6980 (0,0002)II 697S (0.0003)0,7022 (0.0035)0,6980 (IU009)0,6818 (IU002)0.6804 (0,0001)
0.7048 (O,(IOll)0.7048 (0,0011)0,7054 (0.0001)0.7054 (O,OOlll)0.71l48 (0.01l01)0.704R (OIiIlOJ)07048 (O,OIlOl)0.7048 (0.0001)0.7058 (0,0003)0.705S (0,0003)
0.6760 (0.0007)0,6766 (1J.()01O)0.6803 (0,0004)0.6788 (0.0004)0.6750 (0,0002)
(0,0002)(0.0002)
IJ,GSS4 (IJ.IJ002)0,ljfj09 (0,0014)06627 (0,(1004)
TIIlI abllndancc,,,,
0,6507 (0.0006)06522 (O.OOOS)0('[i38 (00001)0.6626 (OOI)jO)0.E540 (O.OIJ06)OE5:J5 (0,()1106)0.1;758 (()(lOll)O,le7:l3 (0.0022)0,6436 (0.IJ:)07)0.6437 (0,0:)02)
abundanceo
hyr)()lhct measd
All sample::, analyzed in duplicalc; figures in parentheses reflect the range of the two values.
18012060
to be linear over the course oj the 2-4 half-lives which weremonitored, At longer teaction times, larger relative differencesin log(l - F) for duplicate isotope ratios are observed; this isexpected given eq 5. The effecl o[ using a lower relative Tllilenrichment is evident (run 8, Figure 3B),
The slopes of the McKay plots were cletem1ined usingweighted least-squares regression models without an intereeDtterm; the omission of the intercept is appropriate based upon eqs4 and 5, In obtaining tbe values of log(l - F), the value oj ("C'Ti) I'was taken as that observed with the first sampling of tbe reactionmixture, typically 1-3 min after mixing. The ell~,'T1)illriii wasobtained from the i.sotope abundance of a completely exchanged
Tinl€ (hours)
Figure 3. McKay kinetic plots of log(1 - F) vs time ottained forTpll (0) and Ti' (0). Dupl'cate points represent isotope abundancemeasurement-stage replication Plots A-C corresJond to :he kineticruns depicted in Figu~e 2A-C.
»e Iii0 -1
-2
(j) B 00cm
-0 LLc:l :s.0 -1
« Q)
i=.Q
til0C'J -2
0 g~,~:
abund2.I1ce measurements are more pronounced. \Nhile nocxpclimclEs were conducted with still lower degrees of relative
'enrichment, it is believed that the formulation of run 8 showllin figure 2B represents a realistic limit for quantitative detenni
of rale infomUlion.
Ex1:raction of k i 1- Rat~ constants were obtaiued from McKay
plo':s o~ Jog(T - F) vs Lime. as described by eq 4. Examples of
these rIots art· shewn in Figure 3. 1lte McKay plots were found
60 120 180Tille (Hours)
Figure 2. Temporal Changes in 205TI abun:lance (mass discrimination-corrected) observed for Til I (0) and Til (0:) over the course of
runs. Duplicate points represent isotope abundance measure-ne:lt~siage replication. Kinejc run 2. [Til ll ] and [Til] approximatelyequal: 1.5 M HCIO<1; 25 1:9 Till! imcer formulation; (8) kinetic run8, and. approximalely equali 15 MHCI04; 25°C; 1:24 TI'''tracer formulation; (C) kinetic run 10, unequal [TI"I], [Ti']; 1.5 MHClO,:25C; 1:9 lrace!- fOr-nlUBtiol.
Analytical Chemistry. Vol, 67, 110. 21, November 1, 1995 4007
Table 2. Kinetic Results Obtaiined forr the TIIII_TII Self.Exchange Process in Aqueous HCI04 B
tl/2
M [TI!j,M 21:ifl.i!1111I [I-leIO"l.M 11m 1'1' Tlii Tr0.0234 1-0271 0,6420 L50 36,3 40,0 L06 x lO-(1-0234 'UJ271 OJ1420 L50 39,6 37,2 9.72 xOJJl17 (1,0131 0,6500 1,50 78,8 76J) 9,85 x lO- xOJli 17 0.01:)1 0,6500 1,50 71-8 71-6 L08 x lO-' ,,08 x(1,0260 ().O24:3 0,6448 (1,00 57.4 59,6 6.71 x 10-'-'(U)260 1,0243 0,6448 3,00 62-1 61,4 6,20 x lO-0.0251 0,0271 0,6693' 1,50 39.5 34.4 9.55 x 1O-~
0-025! )O27l 0,6693' L50 375 40,7 LO! x lO-0.0263 UJIl59 0.6380 L50 38.4 46,0 1.19 x 10-
10 OJ)263 TO]SiJ 0.6380 LSO 44-8 47,0 L02 x
ponion of reaction mixture, prepared as described in the Experi
mental Section. 'vVeighted least-squares regression was performedusing [("ufi), - ("o'rn),,,,,,] as weighting factors, The hali-life and
were obtained from toe sloDe, m:
The 10 relative uncertainties in individuaJ kll measurements are
expected to be "'3-5% based upon the relative uncertainties in
-+ TlI] and
Presented in Table 2 are concentration parameters as well as
and k"
results for 10 kinetic runs, The kn values derived from
runs 1-4 and 7-10 provide a composite value of (1,0 =0,1) x
s at 25,0 cC in L5 HClO,( this value compares very
favorably to a kl: of 1.1 x l(J'~! M-I S-, which was obtained
graphically from results presented by Presrwood and \Vahl.z:) The
average k iI values obtained from TIll! and TIl were indistinguish
able at the 80% confidence level, as can be seen [yom Table 2.
BEserl upon the limited data of Table 2, isotope ab'Jndance
moniwring of either oxidatior:. state wou:d appear to suffice for
determining using the technique described herein, It is
c2:tainly appropriate to investigate isotope abundance changes
in both oxidation states \vhen attempting- to use this technique
new redox couples.
The effect of changing fTom 1.5 to 3,0 M HCIO,! is seen in the
results of runs 5 and 6; a composite kll of (6A ± 0,3) x 10'5 M-!
is obtained at 25,0 'C in 30 M HClO, This decrease in kl!
paraliels the decrease in with increasing HCIO,: concentration
observed by Prestwood and WahL" The change in the observed
may be inteIln"eted in ten115 of changes in the work required
to form the precursor cornplex and/or elimunition of the impor
tanco of the hydroxide-bnrlgeci inner-sphere-eaction path,
Although a rigorous test the rate law was not conducted,
expected changes in were produced by changes in [TIl!!
and the rate constants for runs 1-4 and 7-10 are in close
agreement. It follows from rhe resulls of lllns conducted at
different [E-] and [TIill + TI'I that the technique is capable of
producing interpretable rate constants which have chemical
significance.
II' = log O,5!m
kj] = In 2/TIll1-:-
(6)
(7)
Zero-Thne Exchange. The degree of zero-time exchange
established by using a modified fom1 8f eq 5:
(1- F) = (8)
In this expression, (2lffJ'lh~'JI refers to the hypothetical value
the isotope abundance at I = O( this is simply the abundance
measured for the applicable reactant prior to mixing, As is seen
in Table 1, the observed ("ern)" values were systematicallv
different from (''''rn)"yp, which indicates that zerO-lime exchange
exists in all cases, The effect of the zero-time exchange is
"consume" part of the observable difference between and
(''''Tl),o''o; provided the Ox/Red separation is reproducibie one
can circumvent a large zero-time exchange by USiIlg a
relative isotope emichment in the labeled reactant.
The percent zero-time exchange (ZfE) values shown
1 were determined by subs:ituting eq 8 in eq 1; \veightecl
regression parameters, indJCling an intercept, were determirled
for eq 4, Weighting was again peliormecl using [("'-TI)
e((fJ'lLnnl as weighting factors: the y-intercept obtained COlTC
sponds to log(l - Fm,), The ZfE values wore fairly consiSlom
for a given set of conditions: they are obviously influenced byreactant concentrations, The differences in ZTE observed be
tween run 7 and run 8 forTI' are most likely due to low degree
of relative TIlli enrichment used,
Figure 4 illustrates the lack of any appare I L relationshiT)
between kn and TIE, Although similar investgations be
needed in extending our approach to additional redox eoupies,
this finding suggests that the technique presented herein is
tolerant of incomplete separation and/or sep8ration-inducecl
exchange, A plausible interpretation of the physical significance
of the zero-time exchange is that it reflects a period
accelerated electron transfer betvveen l1 iIi and TIl. This may arise
due to a bromide-bridged homogeneous inner-sphere pathway;
halide ions are known to catalyze the seli-exdlange reaction
between aquo metal ions such as Cu!i(aq)"!Cu'(acD it is also
possible that the exchange is accelerated by the presence
Br(s) particles, which are in contact with the exchanging solution
for a few seconds until the filtration is completed,
(32) Si,,:ey. M. l: Jordan, 1<.. B. hiorg. Chem. 1992,31. 28S0-2B8·'1-
4008 Analytical Chemistw Vol. 67. No, 21, November 1. 1995
0.00015
Percent Zero-Time Exchange
Figure 4. Plot ot k11 vs ObS8IYsd percent zero-time exchange foreight kinetic runs, 25 'C. 1.5 M HCI04 . Varying [Ti'" I Til condit'lonsinfluenced the % ZTE. Numerical symbols indicate the TI oxidationsta:e being mOlitored.
CONCLUSIONWe have demonstrated that ku can be measured using
enriched stable Isotope labels, chemical separations, and ICPMS.For the 11II1/ I reaction studied, the self-exchange rate found bythis technique is in good agreement with those obtained fromanalogous radiotracer experiments. The stable isotope methodappears to be insensitive to varying degrees of zero-time exchangeand to the reladve concentrations of the two redox forms; changesin isotope abundances for boL'! redox forms are readily monitored,and it is found that the rate constants derived from either oxidationstate are indistinguishable. With mass discrimination-corrected (,: Ajstract published in Advance ACS Abstracts, October 1, 1995.
Received for review March 23, 1995. Accepted August 21,1995.0
AC9S0285B
ICPMS isotope abundance measurements of 0.1-0.5% RSD,kinetic events can be monitored with as little as a ~3% relativechange in isotope abundance over the course of the reaction.
This method may potentially be extended to the study of otherredox couples which can be suitably prepared in metal-ionlabeled form and for which a suitable separation of the redox formscan be deveioped. Of obvious interest is extending the methodto faster exchange reactions. Work in progress involves identh'ying the upper rate limits of the technique, comparing results ofL'lis technique to k'l values obtained by NMR line-broadeningmethods, and measuring ku for some systems of theoreticalinterest where kll has not been characterized to date.
Acknowledgment is made to the donors of the PetroleumResearch Fund, administered by the American Chemical Society,for partial support of this research (28639-GB3). This work wasalso suppOlied by the Society for Analytical Chemists of Pittsburgh(Starter Grant Award) and John Carroll University. The ICPMSinstrument is a donation of VVi'R Corp., which the authorsgratefully acknowledge. The authors also thank M. L. Waiwoodfor preliminary studies. J P. Guzowski, B. Ohlson, and KHumphries assisted with the isotope abundance measurements.
Scientific Parentage ofthe Author. M. E. Ketterer, Ph.D. ;lnderC. A Koval, Ph.D. under F. C. Anson, Ph.D. under J J Ungane,Ph.D. under 1. M, Kalthoff,
100806040
1 ~3 l
"
20o
Analytical Chemistry, Vol. 67, No. 21, November 1, 1995 4009
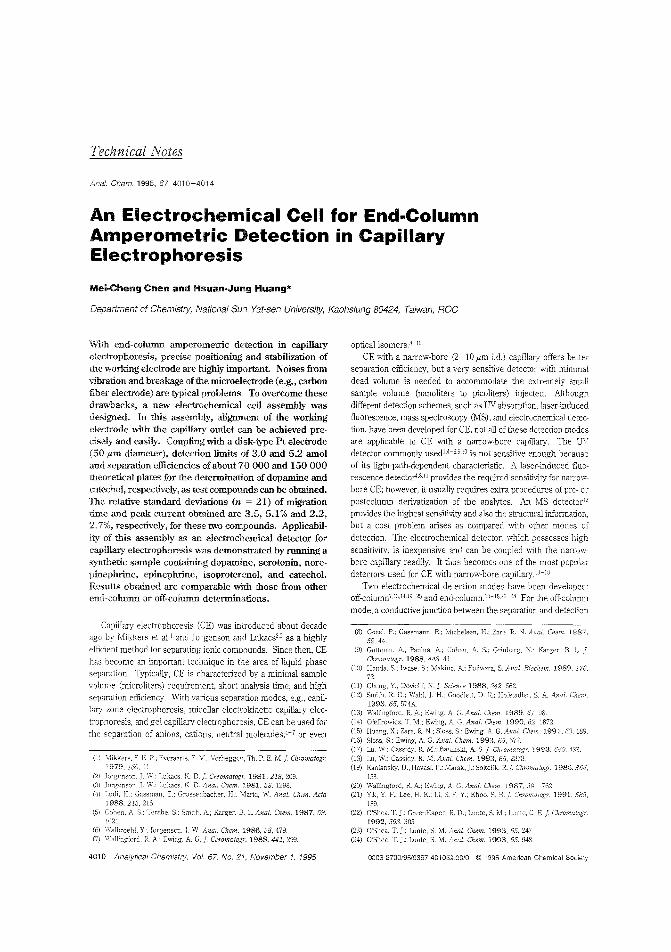
Technical Notes
Anal. Chem. 1995, 67,4010-4014
An Electrochemical Cell for End-ColumnAmperometric Detection in CapillaryElectrophoresis
Mei.Cheng Chen and Hsuan·Jung Huang*
Department of Chemistry, National Sun Yat-sen University, Kaohsiung 80424, Taiwan, ROC
With end-column amperometric detection in capillaryelectrophoresis, precise positioning and stabilb.ation ofthe working electrode are highly important. Noises fromvibration and breakage of the microelectrode (e.g., carbonfiber electrode) are typical problems. To overcome thesedrawbacks, a new electrochemical cell assembly wasdesigned. In this assembly, alignment of the workingelectrode with the capillary outlet can be achieved precisely and easily. Coupling with a disk-type Pt electrode(50,um diameter), detection limits of 3.0 and 5.2 amoland separation efficiencies of about 70 000 and 150 000theoretical plates for the determination of dopamine andcatechol, respectively, as test compounds can be obtained.The relative standard deviations (n = 21) of migrationtime and peak current obtaincd are 3.5, 5.1% and 2.2,2.7%, respectively, for these two compounds. Applicability of this assembly as an electrochemical detector forcapillary electrophoresis was demonstrated by running asynthetic sample containing dopamine, serotonin, norepinephrine, epinephrine, isoproterenol, and catechol.Results obtained are comparable with those from otherend-column or off-column determinations.
Capillary electrophoresis (CE) was introduced about decadeago by Mikkers et a1. I and Jorgenson and Lukacs"" as a highly
efficient method for separating ionic compounds. Since then, CEhas become an important technique in the area of liquid phaseseparation. Typically, CE is characterized by a minimal sample
volume (microliters) requirement, short analysis time, and highseparation efficiency. With various separation modes, e.g., capil
lar! zone electrophoresis, micellar electrokinetic capillary elec
trophoresis, and gel capillary electrophoresis, CE can be used for
the separation of anions, cations, neutral molecules,4-7 or even
(1'1 Mikkers, F. E. P.; EveraerLS, F. :\11.; Verheggc:l, Th. P. E. MJ Chromatogr.1979, 169. 1L
(2.1 Jorgenson.]. ViI.: Lukacs. K D.]. C'hromatogr. 1981,218,209.(:),1 )o!'genson,]. W.; Lukacs. K. D. Anai. Chem. 1981,53, 1298.
Ludi, E.: Gassman, E.; Grossenbacher. H.; Marl,i, W. Anal. Chim. Acta1988. 213, 215.
(5) Cohen, A. S.; Terabe. S.: S:nith. A.; Karger, L. Anal. Chern. 1987, 59,102l.
(6) \Valbroehl, Y: Jorgenson,]. W. Ana!'. Chern. 1986,58,479.(7) \Vallingford. R. A.: Ewing, A. C,]. Chromatogr. 1988,441,299.
4010 Analytical Chemistry, Vol. 67. No. 21, November 1, 1995
optical isomers:':HO
CE with a narrow-bore (2-10 11m i.d.) capillary offers betterseparation efficiency, but a very sensitive detector with minimal
dead volume is needed to accommodate the extremely small
sample volume (nanoliters to picollters) injected. Although
different detection schemes, such as IN absorption, laser-inducedfluorescence, mass spectroscopy (MS), and electrochemical detec
tion, have been developed for CE, not all of these detection modesare applicable to CE with a narrow-bore capillaly. The 'lTVdetector commonly used L4 - 6.9.!o is not sensitive enough because
of its light-path-dependent characteristic. A laser-induced fluorescence detectort 8.11 provides the required sensitivity for nalTOW
bore CE; however, it usually requires extra procedures of pre- or
postcolumn derivatization of the analytes. An MS detector"provides the highest sensitivity and also the structural infonnation,
but a cost problem arises as compared with other modes of
detection. The electrochemical detector, which possesses high
sensitivity, is inexpensive and can be coupled with the narrowbore capillary readily. It thus becomes one of the most populardetectors used for CE with narrow-bore capillary. :H8
Two electrochemical detection modes have been developed:off~column7.l3.J4.1g-2S and end_column. 1S- 18,2(i-28 For the off-column
mode, a conductive junction between the separation and detection
(8) Goze], P.; Gassmann, E.; Michelsen, E.; Zarc. R. N. Chem. 1987,59, !4.
(9) Guttman, A; Paulus, A; Coben, A. S.; Grinberg, N.: Karger, B. L.}.Chromatogr. 1988,448,41.
(0) Honda. S.: lwase, S.: Makino, Fujiwara, S. Anal. Bioci/em. 1989. 176,n.
(11) Cheng. 1.; Dovichi, N. J. Sdence 1988, 242, 562.(12) Smith. R. D.; Wahl. ]. H.; Goodlett, D. R.; Hofstadler. S. A. Anal.
1993. 65, 574A(13) vVallingford, R A; Ewing, A G. Anal. Chem. 1989, 98.
(14) Olefirowicz, T. M.; Ewing, A G. Anal. Chem. 1990,62.1872.(15) Huang, X.; Zare, R. N.; Sloss. S.; Ewing, A G. Anal. Chern. 1991. 63. 189,(16) Sloss, S.: Ewing, A G. Anal. Chern. 1993, 65, 577.(17) Lu, W.: Cassidy, R. M.; Bai<inski, AS.]. Chromatogr. 1993, 640,433.(18) Lu, W.; Cassidy, R. M. AnaL Chern. 1993, 65, 2878,(19) Kaniansky, D.; Havasi. P.; Marak,].; Sokoiik, Rj. Chromafogr. 1986,366,
153.(20) Wallingford, R. A.; Ewing, G_ Anal. Chern. 1987,59. 1762.(21) Yik, Y. F.~ Lee, H. K: Li, S. F. Y: Khoo, S. B.]. Chromatogr. 1991, 585,
139.(22) O'Shea, T. j,: GreenHagen, R. D.; Lunte, S. M.; Lunte, C. E.]. Chromatogr.
1992,593,305.(23) O·Shea. T l; Lunle. S. M. AnaL Ozem. 1993. 65. 247(24) O'Shea, T l; Lunte. S. M. Anal. Chem. 1993.65,948
0003-2700/95/0367-4010$'3.00/0 © 1995 American Chemical Society
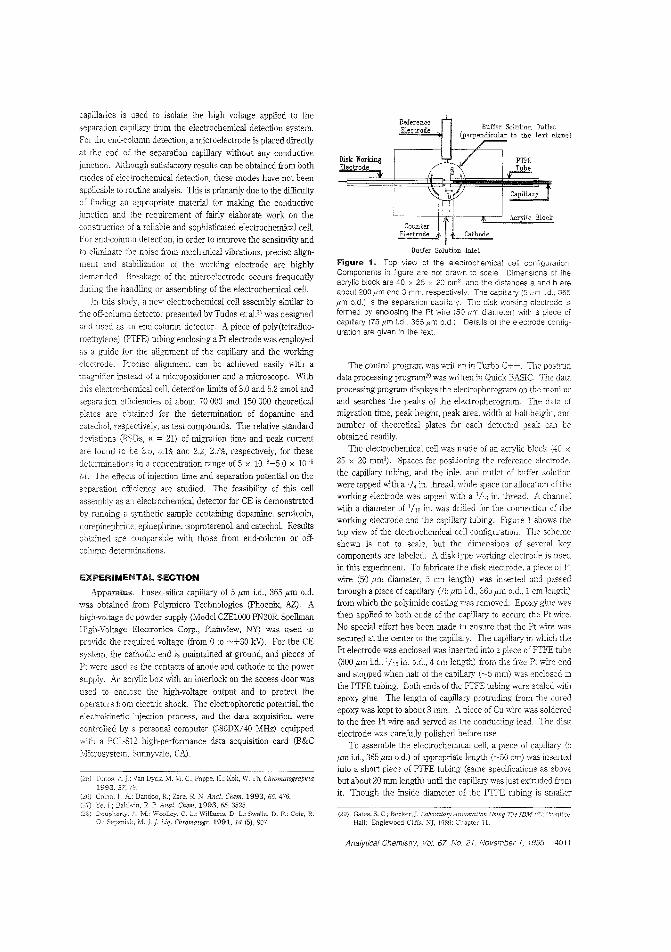
capillaries is lsed to isolate the high voltage applied to the
separajon capillary from the electrochemical detection system.
For the end-column detection, a microelectrode is placed directly
at thc cnd of the separation capillary without any conductive
junction. Although satisfactory results can be obtained from hath
modes of electrochemical detection, these modes have not been
applicahle to routine analysis. This is primarily due to the difficultyof finding an appropriate material for making the conductive
junction and the requirement of fairly elaborate work on the
construction of a reliable and sophisticated electrochemical celLFor end-column detection, in order to improve the sensitivity andto eliminate the noise from mechanical vibrations, precise align
ment and stabilization of the working electrodc are highlydemanried Breakage of the microelectrode occurs frequently
during the handling or assembling of the electrochemical celL
In this study, a new electrochemical cell assembly similar to
the off-column detector presented by Tudos et aL" was designed
and used as an end-column detector. A piece of poly(tetrafluo
roethylene) (PTFE) tubing enclosing a Pt electrode was employed
2S a guide for the alignment of the capillary and the workingelectrode. Precise alignment can be achieved easily with a
magnifier instead of a micropositioner and a microscope. With
this electrochemical cell, detection limits of 3.0 and 52 amol and
separation efficiencies of about 70000 and 150000 theoreticalplates are obtained for the determination of dopamine and
catechol, respectively, as test compounds. The relative standardde,iations (RSDs, n = 21) of migration time and peak current
2re found to be 3.5, 5.1% and 2.2, 2.7%, respectively, for thesedeterminattons in a concentration range of 5 x 10 '-5.0 X 10'
The effects of injection time and separation potential on the
separation efficiency are studied. The feasibility of this cell
assembly as electrochemical detector for CE is demonstrated
by running a synthetic saluple containing dopamine. serotonin,
norepinephrine, epinephrine, isoproterenol, and catechoL Resultsobtained are comparable wit'! those from end-column or offcolumn determinations.
EXPERIMENTAL SECTION
Apparatus. Fused-silica capillary of 5 I'm i.d., 365 I'm o.d.was obtained !'rom Pclymicro Technologies (phoenix, AZ). Ahigh-voltage de powder supply (Model CZE1000 PN30R, Spellman
High-Voltage Electronics Corp., Plainview, NY) was used to
provide the required voltage (from 0 to -+30 k\~. For the CE
system. the cathodic end is maintained at ground, and pieces of
Pt were used as the contacts of anode and cathode to the powersupply. An acrylic box with an interlock on the access door was
used to enclose the high-voltage output and to protect theoperatcrs tram electric shock. The electrophoretic potential, theeiectrokinetic injection process, and the data acquisition were
controlled by a personal computer (386DX/40 MHz) equipped'With a PCL-S12 high-perlormance data acquisition card (B&C
Microsystem, Sunnyvale, CA).
(25) Tucos, A.].; Van Dyck. M. M. c.; Poppe, H.; Kok, W. Th. Chromaiographia1993, :;7, 79.
(26) Col:m, L. Dandoo, R.; Zare, R N, linGl. Chern. 1993, 65, 476.(27) Ye, J.; Baldwin. R. P. Anal. Chem. 1993. 65, 3525(28) M.: C. :.....; Williams, D. L.; $wa'llc, D. F.; Cole, R
0.: M. J. I Liq. 1991,14 (5),907.
ReferenceElectrode
Disk WorkingElectrode
Acrylic Block
Buffer Solution Inlet
Figure 1. Top view cf the electrochemical cell configurntio'i.Components in figure are not drawn to scale. Dimensions of theacrylic block are 40 x 25 x 20 ems, and the distances a and bareabout 200.urn and 3 mm, respectively. The capillary (5,un i.d., 365,um a.d.) is the separation capillary. The disk working electrode isformed by enclosing the Pt wire (50 um dianeter) with a piece ofcapillary (75 pm Ld. 365 f,m o.d.). Details of the eiectrode contlguration are given in the text
The control progran1 was written in Turbo C-+-+. The postrundata processing program" was written in Quick BASIC. The dataprocessing program displays the electropherogram on the monitor
and searches the peaks of :he electropherogram. The data ofmigration time, peak height, peak area, width at half-height, andnumber of theoretical plates for each detected peak can beobtained readily.
TI,e electrochemical cell was made of an aClyiic block (40 x25 x 20 mm3). Spaces for positioning the reference electrode,
the capillary tubing, and the inler and outlet of buffer solutionwere tapped with a '';4 in. thread, while space for allocation of theworking electrode was tapped with a :;/1, in. thread. A channelwith a diameter of I/ lG in. was drilled for the connection of theworking electrode and the capillary tublng. Figure 1 shows thetop view of the electrochemical cell configuration. The schemeshoVJTI is not to scale, but the dimensions of several key
components are labeled. A disk-type working electrode is usedin this experiment To fabricate the disk electrode, a piece of Ptwire (50 I'm diameter, 5 cm length) was inserted and passedthrough a piece of capmary (75 I'm i.d., 365,um o.d., 1 em length)from which the polyimide coating was removed. Epoxy glue wasthen applied to both ends of the capillary to secure the Pt wire.No special effort has been made to ensure that the Pt wire wassecured at the center 01 the capillary. The capillary in which thePt electrode was enclosed was inserted into a piece of PTFE tube(300 I'm i.d., '/16 in. o.d., 4 cm length) from the free Pt wire endand stopped when half of the capillary (-5 mm) was enclosed inthe PTFEtubing. Both ends of the PTFE tubing were sealed withepoxy glue. The length of capillary pnotruding from the curedepoxy was kept to about 3 mm. A piece of Cu "ire was solderedto the free Pt wire and served as the conducting lead. The diskelectrode was carefully polished before use
To assemble the electrochemica: cell, a piece of capillany (5!tm i.d., 365!tm o.d.) of apprcpriate length (~SO em) was insertedinto a short piece of PTFE tubing (same specifications as abovebut about 20 mm length) until the capillary was just extruded fromit. Though the inside diameter of the PTFE tubing is smaller
(29) Gates, s. c.; Becke:-, J. LaboratOlY Auwmatfon Using TIle IBN! PC; Pn nlicl'Hall: Englewood CEffs, NJ, 1989; Chapter i 1.
Analytical Chemistry, '101.67, No. 2/, November 1. 1995 4011
where PB is the resistivity of buffer solution, Ie is the length of
capillary, II' is the length of the working electrode enclosed inside
the PTFE tubing (11' "" 200 ,urn), and Ac, A" and Aware the crosssectional areas of capillary, PTFE tubing, and working electrode.
respectively. From eqs 1 and 2, the ratio ReiRp estimated to
be 106 As the internal resistance for the buffer-solulion-filled,
I'm Ld. capillary, Rc is approximately equal to 1 x Q,lli a value
ofl x 106 Q is estimated for the average resistance of the buffer
solution-filled PTFE tubing. In the studied system, application of
a 20 kV separation potential to the capillary should result in a 20
kV potential drop across the capillary and an ~10 mV potential
drop across the PTFE tubing. That means the e1ectlic field across
the capillary is 8 V1200 I'm, and that between the capillary outlet
and the end of PTFE tubing is about 10 mV12DO ,um. As the
surface of the disk electrode is perpeclicular to the vector of applied
separation potential. there should be no potential drop across the
surface of the disk electrode due to the separation potentiaL It is
feasible to carry out the amperometric detection with the designed
electrochemical cell assembly. To further justify the feasibility
of the conclusion made, staircase voltammetry for dopamine and
isoproterenol was run in the CE system with the electrochemical
cell assembly. Peak potentials found at 0.40 and 0.46 V for these
two compounds, respectively, match well the half-wave potentials
obtained from batch-type experiments. This Implies that the
voltammetric behavior of the Pt disk electrode is not affected by
the possible iR drop resulting from the applied separation
potential.
For end-column detecticn~ precise alignment of the working
electrode with the capillary outlet is a prerequisite and is usually
achieved by careful manipulation of a micropositioner with the
help of a microscope.lIi.17 Poor alignment belween the electrode
and the capillary outlet will result in a significant loss of sensitivity
and the deterioration of the detection limit:; For a system with
a carbon fiber microelectrode, once optimized alignment is
achieved, minor displacement of the electrode due to ,-oom
vibrations or other unavoidable phenomena produces marked
changes in tlle detection cU1Tents. 17
In this system, the capillary and the electrode are secured with
the PTFE tubing and are guided within the same channeL
Additionally, the cross-sectional area of capillary outlet to the
surface area of the working electrode is in a ratio of 1;100, so
proper positioning and good alignment for the capillary and
working electrode can be easily attained. As the working
electrode and capillary are secured inside the celi assemblv, the
noises that arise from mechanical vibrations and air drafts arethus eliminated. This would lower the noise level and improve
the sensitivity of the electrochemical detector; a similar result has
been illustrated in Baldwin's work" It takes ~20 min to assemble
the electrochemical cell. Once assembled, it takes only about 5
min to replace either the working electrode or tlle capillary tubing.
11,e reproducibility of the alignment operations is evaluated by
measuring the detection current of dopamine after each operation
cycle of disassembling and assembling the working electrode and
separation capillary. The RSDs (n = 8) for the variations of
migration time, peak height, and peak area obtained in alignment
operations were found to be 3.0, 6,0, and 3.2%, respectively. The
than the outside diameter or the capillary, due to the slightsof1ness characteristic of the PTFE tubing, insertion of the
capillary into the PTFE tubing can be achieved without difficulty.
After the capiliary was filled buffer solution and the extruded
end of the PTFE tubing submerged in the same buffer solution,
the capillary was pulled gently back into the PTFE tubing until
the capillary end was 150-250 ,lim inside the PTFE tubing. The
channels of the electrochemical cell were filled with buffer
solution, and the PTFE in which the working electrode
was enclosed was inselied the cell along the i I lIi In. channel
and secured with a PTFE fingel' tight fitting when the Pt electrode
reseed at the center of the chmneL The PTFE tubing in which
the separation capillary was enclosed was then inserted from the
other end of the in. channel and pushed gently until the
capillary outlet was close contact with t'le disk electrode. The
intimate contact between the disk electrodie and the capillary end
can be examined with a magnifier ("vith a magnifying ractor of
20x). After the alignment was done, the PTFE tubing in which
the separation capillary was enclosed was secured with an O-ring
an(: a PTFE flanged tilting. 1\8 the surf?ce of disk electrode is
much larger than the dimensions :)f the capillary outlet, a wall~
jet-tille thin-lr,yer electrochemical cell is thus fonned. A home
made AgiAgCl reference electrode surround with male screw (11
'±~28 thread) was screwed inte the celL ,,\ piece of Pt wire was
used as tbe counter and was sealed into tbe block
directly. Amperomctric deterrnination and Jther voltammetry
experiments were done \vith a pclarographic analyzer (Model
264A PARC). A CLllTent preamplifier (Model PA-1, BAS) was used
ror the measurement of very low current. To minimize theinterference of external electric noise, electrochemical cen
assembly was housed Faraday cage (Model C2, BAS).
Current was recorded with a strip-chan recorder (Yokogawa
Medel 3025).
For most of the following experiments, CE was run by
employing a capi11ary (Slim 365 ,urn o.d., 50 em length) at a
separation potential of 25 or 20 kV. TI'te buffer solution used
contained of 20 mM morpholinoetbanesulfonic acid (MES) with
pH adjusted to 6.0. Sample injectim was perfonned by electromi
gration at 12 5 s. constant elecrrochemical potential of
0.700 V vs A~IAgCI was usee! for amperometric detennination.
Buffer solution in the electrochemical cell was refreshed by
syIinging after each electrophoretic run.
Chemicals. MES anel dODamine were obtained fTom Tokyo
Chemical Industry Co. Serotonin, norepinephrine, epinephrine,
isoproterenoL and catechol were obtained from Sigma. All
chemicals were used as received. The buffer solution used was
20 mM MES with pH adjusted to 6.0. Stock solutions (0.01 M)
were prepared in 0.1 M perchloric acid. Sample solutions were
prepared by dilution of stock solutions to t}lC desired conceniration
with buffer solution.
RESIJLTS AND DISCUSSION
Characteristics of the CeJ1 Assembly. Literature for CE with
small capillaries indicates that the applied separation potential
would drop to an insignificant magnitude at the end of the higb
resistance capillaries.]li In system cUlTently studied) the
internal resisrance of the capillary (5 I'm i.d., 50 em length), Rcand the internal resistance the PTFE tubing, Rp, can be
estimated from the following equations,
4012 Analytical Chemistry. Vol. 67, No. 21. November 1, 1995
Rc = PBlclAc
Rp = PDI,,/ (AI' - Aw)
(1)
(2)
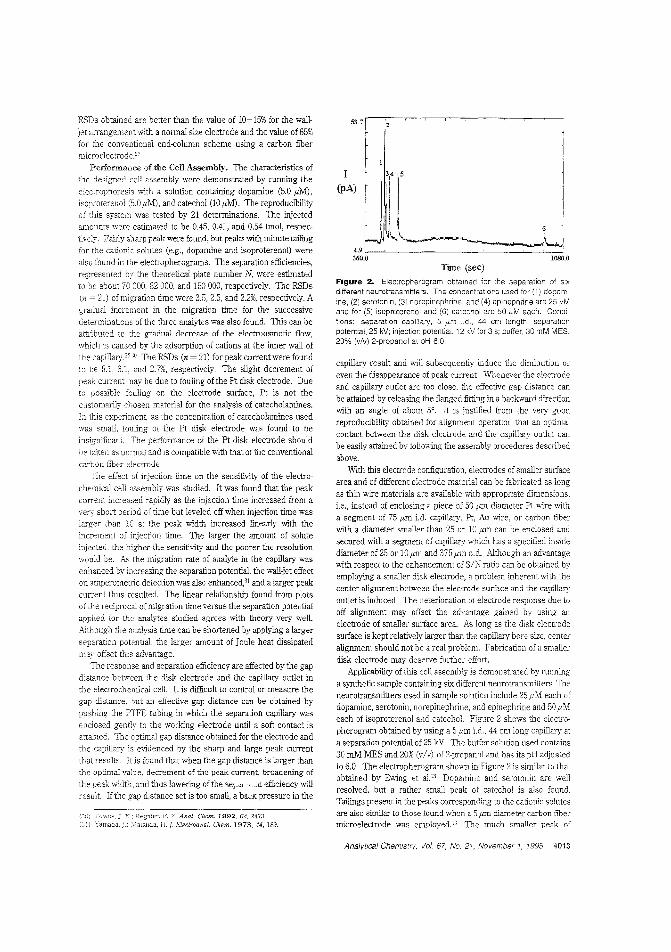
1080.0
RSDs obtained are better than the value of 10-15% for the wall
jet arrangement with a normal size electrode and the value of 65%for the conventional end-column scheme using a carbon fibermicroelectrode.27
Performance of the Cell Assembly. The characteristics ofthe designed cell assembly were demonstrated by running the
electrophoresis with a solution contalning dopamine (5.0 I'M),iSODroterenol (5.0 I'M), and catechol (10 I'M). The reproducibilityof thIS system was tested by 21 determinations. The injectedamounts were estimated to be 0.45, 0.41, and 0.54 finol, respectively. Fairly sharp peak were found, but peaks with minute tailingfor the cationic solutes (e.g., dopamIne and isoproterenol) were
also found in the electropherograms. The separation efficiencies,represented by the theoretical plate number N, were estimatedto be about 70 000, 82 000, and 150 000, respectively. The RSDs(n = 21) of migration time were 3.5, 2.5, and 2.2%, respectively. Agradual increment in the migration time for the successivedeterminations of the three analytcs was also found. This can beattributed to the gradual decrease of the eiectroosmotic flow
which is caused by the adsorption of cations at the inner wall ofthe capillary."·:o The RSDs (n = 21) for peak current were foundto bE 5.1, 6.1, and 2.7%, respectively. The slight decrement of
peak CUlTent may be due to fouling of the Pt disk electrode. Dueto possible fouling on the electrode surface, Pt is not thecustomarily chosen material for t1-re analysis of catecholamines.
In this experimen~ as the concentration of catecholamines usedwas small, fouling of the Pt disk electrode was found to beinsignificant. The performance of the Pt disk electrode should
be taken as normal and is compatible with that of the conventionalcarbon fiber electrode.
The effect of injection time on the sensitivity of the electro
chemical cell assembly was studied. It was found that the peakcurrent increased rapidly as the injection time increased from avery short period of time but leveled off when injection time waslarger than s; the peak width increased linearly with the
increment of Injection time. The larger the amount of soluteinjected. the higher the sensitivity and the poorer the resolutionwould be. As the migration rate of analyte in the capillary wasenhanced by increasing the separation potential, the wall-jet effecton amperometric detection was also enhanced,3! and a larger peakcurrent thus resulted. The linear relationship found from plotsof the r'ociprocal of migration time versus the separation potentialapplied for the analytcs studied agrees with theory very well.Although the ~oalysis time can be shortened by applying a larger
separation potential, the larger amount of Joule heat dissipated
may offset this advantage.111e response and separation efficiency are affected by the gap
distance between the disk electrode and the capillary outlet inthe electrochemicai celL It is difficult to control or measure thegap distance, but an effective gap distance can be obtained by
pushing the PTFE tubing in which the separation capillary was
enciosed gently to the working electrode until a soft contact isattained. The optimal gap distance obtained for the electrode andthe capillary is evidenced by the sharp and large peak currentthat results. It is found that when the gap distance is larger thanthe optimal value, decrement of the peak. current, broadening of
the peak \vidth. and thus lowering ofthe S8i'" ., ,.,n efficiency willresult. If the gap distance set is too small, a bacK pressure in the
(30) 1 Q"dl';. j. K; Regnier. F. E. Anal. Chern. 1992, 64 2473.
(31) Yamada, .I.: \[aLsuda, H.]. Electroanai. Chern. 1973,44, 189.
1
I 34
(PA)
'.9 H \I '-_....-.-....~-_..,....,~J!--J360.0
Time (sec)
F.igure 2. Electropherogram obtained for the separation Jf six?:fferent neurotransmitters. The concentratior,s used for (1) dopamrne, (2) serotonin, (3) norepinephrine, and (4) epinephrine are 25 liMand for (5) isoproterenol and (6) cateGhol are 50 .LlM each. CO~ditions: separation capilla!y, 5 ,urn Ld., 44 ern length; separaticnpotential, 25 kVI injection potential, 12 kV for 3 Sl buffer. 30 mM MES20% (v/v) 2-propanol at pH 6.0. '
capillary result and will subsequently induce the diminution oreven the disappearance of peak current. 'Whenever the electrode
and capillary outlet are too close, the effective gap distance canbe attained by releasing the flanged fitting in a backward directionwith an angle of about 5°. It is justified from the very goodreproducibility obtained for alignment operation that an optimalcontact between the disk electrode and the capillary outlet canbe easily attained by following the assembly procedures described
above.With this electrode configuration, electrodes of smaller surface
area and of different electrode material can be fabricated as longas thin wire materials are available with appropriate dimensions,i.e., instead of enclosing a piece of 50 I'm diameter Pt wire witha segment of 75 I'm i.d. capillary, Pt, Au wire, or carbon fiberwith a diameter smaller than 25 or 10 lim can be enclosed and
secured with a segmem of capillary which has a specified insidedi.ameter of 25 or 10 I'm and 375 I'm o.d. Although an advantageWIth respect to the enh2JIcement of SIN ratio can be obtained byemploying a smaller disk electrode, a problem inherent with thecenter alignment between the electrode sunace and the capillaryoutlet is induced. The deterioration of electrode response due tooff alignment may offset the advantage gained by using anelectrode of smaller surface area. As long as the disk elec~odesurface is kept relatively larger than the capillary bore size, centeralignment should not be a real problem. Fabrication of a smaller
disk electrode may deserve further effort.Applicability of this cell assembly is demonstrated by running
a synthetic sample containing six different neurotransmitters Theneurotransmitters used in sample solution include 25 I'M each ofdopamine, serotonin, norepinephrine, and epinephrine and 50 I'Meach of isoproterenol and catechoL Figure 2 shows the electropherognun obtalned by using a 5 I'm i.d., 44 cm long capillary ata separation potential of 25 kYo The buffer solution used contains30 mM MES and 20% (vIv) of 2-propanol and has its pH adjusted
to 6.0. The electropherogram shov/ll in Figure 2 is similar to thatobtalned by Ewing et aL 13 Dopamine and serotonin are wellresolved, but a rather small peak of catechol is also found.Tailings present in the peaks corresponding to the cationic solutesare also similar to those found when a 5 Jim diameter carbon fibermicroelectrode was employed13 The much smaller peak of
Analytical Chemistry, Vol. 67, No. 21, November 1, 1995 4013
TaMe Comparison of the Electrode Configuration and Detection Limits among Different End-Column and theOptimnized Elruj~ColumnAmperometr1!C Detectors
electrode
electrode surface area (um~)
detection Jimitrl forapparent injection
detection Jimitd for catecholappan:'nl injection volume
end-columna
Pt disk50 pm diam2000
2.0133
3.580
end-columnb
carbon fiber10,um diam x 200 I'm6400
64>160
56160
optimized er.d-columnc
carbon fiber11 diam x 200 pm
1845
1927
or estimated from Effing's results.21 Conditions: separation potential, 20 kV;capillary, ,5 11m i.d., 56.6 em length; buffer, 20 mM MES at pH 6.0. (Data
potential, 20 kV; injection, 10 kV for 10 s; electrochemical detection at 0.3 V;at pH 5,65. d The detection limit obtained is based on SIN = 2 criterion.
catechol ShO\;l1 in Figure 2 is due to the effect of 2-propanol onthe ekctroosmotic behavior of 'VIES buffer solution. The additionof 2-propanol to the 'VIES buffer solution results in a decrementof be electroosmotic flow in the capillary tl1at influences favorablythe separation of serotonin cmd dopamine in solution. Thedecrement of electroosmotic flow influences further the sensitivityof catechol in the studied solution. As catechol is an almostneutral molecule in the pH 6 buffer solution and the sample isinjected by the electrokinetic method, the amount of catechol
injected into the capillary is thus much smaller than the amountof other neurotransmitters in the sample solution. A much lowersensitivity for catechol thus results.
Standard calibration gnphs based on the peak current fordopamine, isoproterenol, and catechol are plotted. With injectionamDnnts ranging from 6.3 to 3500 amol (0.05-25 I'M) fordopamine and isoproterenol and from 7.9 to 3400 arnol (0.10-50 ',uM) for catechol, calibration graphs \\ith linear correlationcoefficients better than 0.999 are obtained. The detection limitsbased on the criterion of SII\ = 3 are estimated to be 3.0 (23nM), 3.6 (28 nM), and 5.2 amol (66 nM) for dopamine, isoproterenol, and catechol, respectively. Though it can be improvedby proper optimization, no further effort has been made to pursuea lower detection limit. A comparison of the electrode configuration and the detection limit of the designed electrochemical cellassembly with those of carbonl1ber end-column and the optimizedond-oolumn detector for the determination ofne two neurotrans
mitters is shown in Table 1. From Table 1, the detection limitobtained from this work is about one order lower than thatobtained fTom the optimized end-column detector and the carbonfiber end-column detector. 'D,e better performance of this work
4014 Analytical Chemistry, Vol, 67, No, 21, Aiovember 1, 1995
may be attributed to the smaller electrode surface adopted in theelectrochemical cell, which enhances the SIN ratio and the largersample volume injected.
CONCI.USIONSThe primary advantage of this electrochemical cell assembly
is its easier construction compared with other end-columnelectrochemical detectors, in which a micropositioner is needed,"-'"With the help of a piece of guide tubing, alignment between thecapillary outlet and the working electrode can be achieved easilyand reliably. The noise from mechanical vibrations and drafts iseliminated. With the proposed fabrication procedures, electrodesof various materials such as Au, Cu, Ni, or other metal "ire andeven carbon fiber, can be fabricated, thus extending the applicability of this cell assembly. The easy construction of this electrochemical cell assembly, the flexibility of adopting differentelectrode material, the high reproducibility inherent "ith theassembling processes, and the feasibility of reconditioning t.he diskelectrode should make this electrochemical detector more acceptable to other CE researchers and the electrochemical detection method more useful for CE routine anaiysis.
ACKNOWLEDGMENTThe authors thank the National Science Council of the ROC
for financial support of this work (Contract No. NSC 83-0421-M110-025-Z) .
Received for review May 2, 1995. Accepted August 18,1995.0
AC950428U
® Abstract published in Advance ACS Abstracts, Seplembe' 15, 199.').
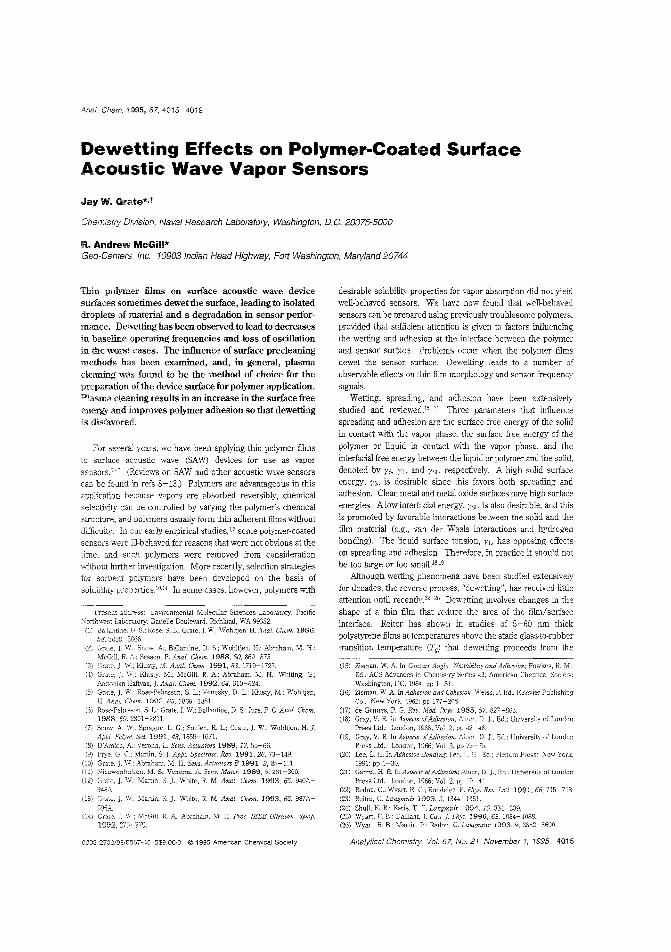
Anal. Chern. 1995, 67, 4015 4019
Dewetting Effects on Polymer-Coated SurfaceAcoustic Wave Vapor Sensors
Jay W. Grate*,f
Chemistry Division, Naval Research Laboratory, Washington, D.C. 20375-5000
R. Andrew McGiII*Geo-Centers Inc., 10903 Indian Head Highway, Fort Washington, Maryland 20744
Thin polymer films on surface acoustic wave devicesurfaces sometimes dewet the surface, leading to isolateddroplets of material and a degradation in sensor performance. Dewetting has been obsetved to lead to decreasesin baseline operating frequencies and loss of osci11ationin the worst cases. The influence of surface precleaningmethods has been examined, and, in general, plasmacleaning was found to be the method of choice for thepreparation of the device surface for polymer application.Plasma cleaning results in an increase in the surface freeenergy and improves polymer adhesion so that dewettingis disfavored.
For severa, years, we have been applying thin polymer filmsto surface acoustic wave (SAW) devices for use as vaporsensorsI -; (Reviews on SAW and other acoustic wave sensorscan be found ;n refs 8-13.) Polymers are advantageous in thisapplication because vapors are absorbed reversibly, chemicalselectivity can be controlled by varying the polymer's chemicalstructure, and polymers usually fOlm thin adherent fihns withoutdifficulty. In our early empirical studies,1.6 some polymer-coated
sensors were ill-behaved for reasons that were not obvious at thetime, and such polymers were removed irom consideration"ithout further investigation. More recently, selection strategiesfor sorbent polymers have been developed on the basis ofsolubility properties. lO,,4 In some cases, however, polymers with
Present address: Envimomental Molecular Sciences Laboratory, PacificNorthwest Laboratory, Battelle Boulevard, Richland, WA 99352.
(1) BaJantine, D. S.; Rose, S. 1.; Grate,]. W.; Wohltjen. H.AlIal. Chern. 1986,58.3058-3066.
(2; Grate, j. W:. Snow, A; BallanLne, J. S.: Wohlljen, H.; Ab~aham, M. H.;McGill. R A.: Sasson. P. AnaL Chem. 1988,60,869-875
(3) Grate, J W.: KJusty, M. Alw!. Chem. 1991, 63.1719-1727.(4) Grate, Klusty, M.; McGill, R. A; Abraham, M. H.: \iV1'jting, G.;
A'1donian-Haftvan, J. Anal. Chern. 1992. 64, 610-624.(5) Grate,]. \>V.: Rose-Pehrsson, S. L; Venezh-y, D. L; Klusty, M.; Wohltjen,
H. Anal. Chern. 1993, 65, 1868 1881.(6) L.; Grate,]. W.; Ballantine, D. S.: ]urs, P. C.A,la!. Chem.
1985,60.(7) Snow, Spr3gue, L G.; Soulen, R. 1.; Grate, ]. W.; Wohltjen, H.].
Appl. Polym. Sci. 1991,43,1659-1671.(8) D'Amico, A.: Verona, E. Sens. Actuators 1989, 17, 55-66.(9) G. c.; Martin, S.]. AppL. Spectrose. Rev. 1991,26,73-149.
(0) W.: Abraham. M. H. Sens. r1ctuztors B 1991, 3, 85-1:l.(11) Nkuwcnhuizcn, M. S.: Venema, A Sens. Mater. 1989,5,261-300.
(i2) Grate, 1. Ma"tin, S.].; White, R. M. Anal. Chern. 1993,65, 940A-948A.
(13) Grate. j. Ma:1:in, S.].: White, R. M. Anal. Chem. 1993,65, 987A-996A.
(14) Grate.]. McGill, [.( A.; Abraham, M. H. Fmc, IEEE UltrasQn. Symp.1992,275-279.
0003-2700/95/0367-4015$2.00/0 © 1995 American Chemical Society
desirable solubility properties for vapor absorption did not yieldwell-behaved sensors. We have now found that well-behaved
sensors can be prepared using previously troublesome polymers,provided that sufficient attention is given to factors influencingthe wetting and adhesion at the interface between the polymerand sensor surface. Problems occur when the polymer filmsdewe! the sensor surface. Dewetting leads to a number ofobservable effects on thin-fihn morphology and sensor irequency
signals.Wetting, spreading, and adhesion have been extensively
studied and reviewed. 15- 21 Three parameters that influencespreading and adhesion are the surface free energy of the solid
in contact with the vapor phase, the surface free energy of the
polymer or liquid in contact with the vapor phase, and theinterfacial iree energy between the liquid or polymer and the solid,
denoted by Ys, YL. and YSL, respectively. A higb solid surfaceenergy, YS, is desirable since this favors both spreading andadhesion. Clean metal and metal oxide surfaces have high surface
energies. A low imerfacial energy, iSt., is also desirable, and thisis promoted by favorable interactions between the solid and thefilm material (e.g., van der Waals interactions and hydrogen
bonding). The liquid surface tension, YL, has opposing effectson spreading and adhesion. Therefore, in practice it should notbe too large or too smalP8.19
Although welling phenomena have been studied extensivelyfor decades, the reverse process, "dewetting", has received littleattention until recently22-26 Dewelling involves changes in the
shape of a thin film that reduce the area of the fihn/ surface
interface. Reiter has sho...m in studies of 5-60 nm thickpolystyrene films at temperatures above the static glass·to-rubbertransition temperature (Tg) that dewelling proceeds from the
(15) lisman, W. A In Contact Angle. Weitability and Adhesion; Fowkes, R M.,Ed.; ACS Advances in Chemistry SeriES 43; American Chemical SocieyWashington, DC. 1964: 1-5l-
(16) lisman, W. A rnb<,'",,· "'"i", P. EeL Elsevier PublishingCo.: Nt'w York, 1962; pp 177-208.
(7) <ie Gennes, P. G. Rev. Mod. 1985,57.827-863.(18) Gray, V. R In .Aspects Alner, D. J. Ed.; University of London
Press Ltd.: London, 1966; Vol. 2, PP(19) Gray, V. R ofAdhesion: Alner, D. J. Ed.; Universii-y of London
Press Ltd.: 1966; Vol. 3, pp 73-75.(20) Lee, L. H. In Adhesive Bondi;)£, Lef', L H., Ed.; Plem'.m Press: New York,
1991; pp 1-30.(21) Garrel, H. E. In Aspects ofAdhesion; Alner, D. j., Ed.; University of London
Press Ltd.: London, 1966; Vol. 2, PP 19-4~.
(22) Redon, c.; Wyart, B. c.; Rondelez. F. Phys. Rev. Lett. 1991,66,715-718.(23) Reiter, G. Langmuir 1993, 9,1344 1351.(24) Shull, K. R.; Kmis, T. i:. 1994.10.334-339.(25) Wyar:, F. 8.: Dailiant, J Can 1990,68,1084-1088.(26) Wyar:, R B.; Martin, P.; Redan, Langmuir 199~. 9. ::\hR2-~fi90
Analytical Chemistry, '101.67, No. 21, November 1, 1995 4015
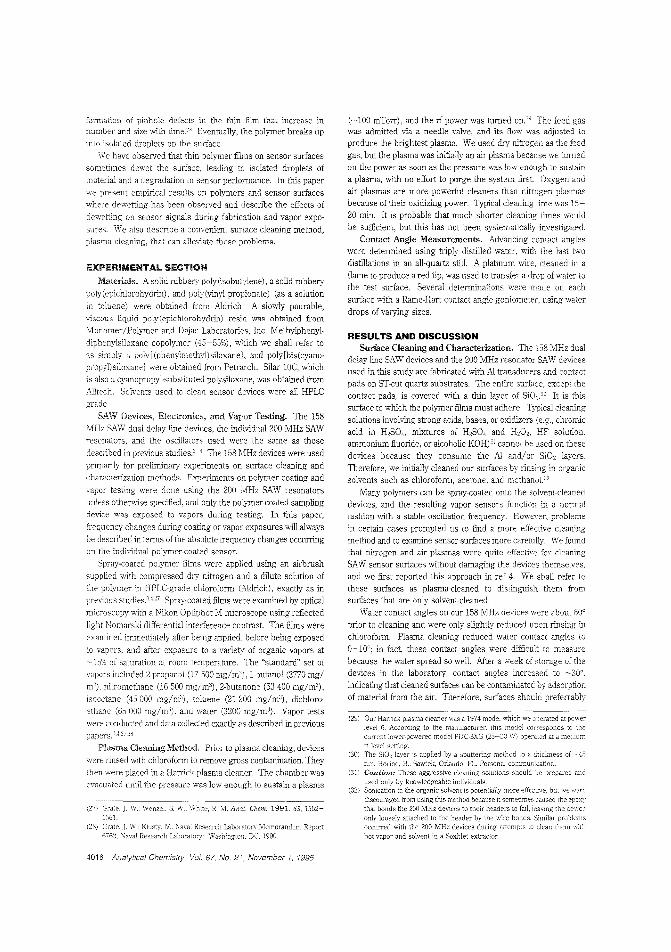
focmation of pinhole defects in the thin film that increase innumber and size with timeD Eventually, the polymer breaks upinto isolated droplets on the surface.
We have observed that thin polymer films on sensor surfacessometimes dewet the surface, leading to isolated droplets ofmaterial and a degradation in sensor performance. In this paper
we present empirical results on polymers and senSOr surfaceswhe:e dewelling has been observed and describe the effects of
dewelling on sensor signals during fabrication and vapor expo
sures. We also descJibe a convenient surface cleaning method,plasma cleaning, that can alleviate these problems.
EXPERIMENTAL SECTION
Materials. A solid rubbery poly(isobutylene), a solid rubbery
poly(epichlorohydJin), and poly(vinyl propionate) (as a solution
in toluene) were obtained from Aldrich. A slowly pourable,viscous liquid poly(epichlorohydrin) resin was obtained fromMonomer/Polymer and Dajac LaboratoJies, Inc. MethylphenyldiphenylsHoxane copolymer (45-55%), which we shall refer toas simply a poly[ (phenylmethyl)siloxane], and poly[bis(cyanopropyl)siloxanel were obtained from Petrarch. SHar 10C, which
is also a Lyanopropyl-substituted polysiloxane, 'Nas obtained fromAlltech. Solvents used to clean sensor devices were all HPLCgrade.
SAW Devices, Electronics, and Vapor Testing. The 158MHz SAW dual delay line devices, the individual 200 MHz SAWresonators, and the oscillators used were the same as thosedescribed in previous studies.'-C: The 158 MHz devices were used
primarily for preliminary experiments on surface cleaning andcharacterization methods. Experiments on polymer coating and
vapor testing were done using the 200 MHz SAW resonatorsunless otherwise specified, and only the polymer-coated samplingdevice was exposed to vapors during testing. In this paper,
r[oquency changes during coating or vapor exposures will always
be described in tenns of the absolute frequency changes occuningon the individual polymer-coated sensor.
Spray-coated polymer films were applied using an airbrush
supplied with compressed dry nitrogen and a dilute solution ofthe polymer in HPLC-grade chloroform (Aldrich), exactly as inprO\10US studies.'IA·" Spray-coated films were examined by opticalmicroscopy with a Nikon Optiphot M microscope using reflected
light Nomarski differential intetierence contrast. The films wereexamined immediately after being applied. before being exposed
to vapors, and after exposure to a vaJie('ol of organic vapors at~15% of saturation at room temperature. The "standard" set ofvapors included 2-propanol (17500 mg/m'), 1-butanol (3770 mg/ml). nitromethane (16500 mg/m'l), 2-butanone (53400 mg/m'l),
isocctane (45000 mg/m'l), toluene (21200 'llg/m3), dichloroethane (65000 mg/m'), and water (3200 mg/m3). Vapor testswere conducted and data caileeted exactly as described in previouspapers.:1i!,'27.2B
Plasma Cleaning Metlwd. Prior to plasma cleaning, devices
were linsed with chloroform to remove gross contamination. Theythen were placed in a Harrick plasma cleaner. The chamber wasevacuated until the pressure was low enough to sustain a plasma
(27) Gr"atc, j. \\,. : Wenzel. S. '01,; v'ifhite, R M. Anal. Chern. 1991,63. 15521:;61.
(28) C;ratc, j. KJusty, Naval I<csearch Laboratof'j Memorandum Report6762: \:aval Research Laboratory: Washington, DC, 1990.
4016 Analytical Chemistry. Vol. 67, No. 21, November 1. 1995
(~100 mToIT), and the rf power was turned on.29 The feed gaswas admitted via a needle valve, and its flo\v was adjusted toproduce the brightest plasma. We used dry nitrogen as the feedgas, but the plasma was initially an air plasma because we turnedon the power as soon as the pressure was low enough to sustaina plasma, with no effort to purge the system first Oxygen andair plasmas are more powerful cleaners than nitrogen plasmasbecause of their oxidizing power. Typical cleaning time was 15
20 min. It is probable that much shorter cleaning times wouldbe sufficient, but this has not been systematically investigated.
Contact Angle Measurements. Advancing contact angleswere deternlined using tJiply distilled water, with the last twodistillations in an all-quartz stilL A platinum wire, cleaned in aflame to produce a red tip, was used to transfer a drop of water tothe test surface. Several detenninations were made on eachsurface with a Rame-Hart contact angle goniometer, using waterdrops of varying sizes.
RESULTS AND DISCUSSIONSmface Cleaning and Characterization. The 158 MHz dual
delay line SAW devices and the 200 MHz resonator SAW devicesused in this study are fabricated with AI transducers and contactpads on ST-cut quartz substrates. The entire surface, except thecontact pads, is covered with a thin layer of SiO,,3o It is thissurface to which the polymer films must adhere. Typical cleaningsolutions involving strong acids, bases, or oxidizers (e.g., chromicacid in H,SO,co mixtures of H2S04 and H,O" HF solution.ammonium fluoJide, or alcoholic KOH)"l cannot be used on these
devices because they consume the AI and/or SiO, layers.Therefore, we initially cleaned our surfaces by rinsing in organicsolvents such as chlorofornl, acetone, and methanoj32
Many polymers can be spray-coated onto the solvent-cleaneddevices, and the resulting vapor sensors function in a nornlalfashion with a stable oscillation frequency. Howevee problems
in certain cases prompted us to find a more effeclive cleaningmethod and to examine sensor surfaces more carefully. We foundthat nitrogen and air plasmas were quite effective for cleaning
SAW sensor surfaces without damaging the devices themselves,and we first reported this approach in ref 4. We shall refer tothese surfaces as plasma-cleaned to distinguish them fromsuJiaces that are only solvent-cleaned.
Water contact angles on our 158 MHz devices were about 60'
prior to cleaning and were only slightly reduced upon rinsing inchloroform. Plasma cleaning reduced water contact angles to0-10'; in fact, these contact angles were difficult to measurebecause the water spread so welL After a week of storage of thedevices in the laboratory, contact angles increased to ~30°.
indicating that cleaned surfaces can be contanlinatecl by adsorptionof material from the air. Therefore, surfaces should preferrably
(29) Out Banick plasma cleaner was a 1974 model which we operated at powerlevel 6. According to the manufacturer, lhis model conesponds to thccun"eot lower-powered model PDC-3XG (25-30 \V) operated at a mediumrf level s(~1ting
(30) The 5;02 layer :s applied by a sputtering method to a Ulickness ofnm. Horine, B.. Sawtek, Orl<mdo. FL. Personal communication.
(31) Caution: These aggressive cleaning solutions should prepared andused only by individuals.
(32) Sonication in more effective. but we "ven:discouraged from using this ry,ethod becau:::e it sometimes caused the epox:\that bonds the 200 MHz devices to their headers to fail, ieaving the deviceonly loosely att2.ched to the header by the wire bonds. Similar problemsoccurred with the 200 MHz devices during attempts to clean lhem witl!hot vapor and solvent in a Soxhlet extractor.
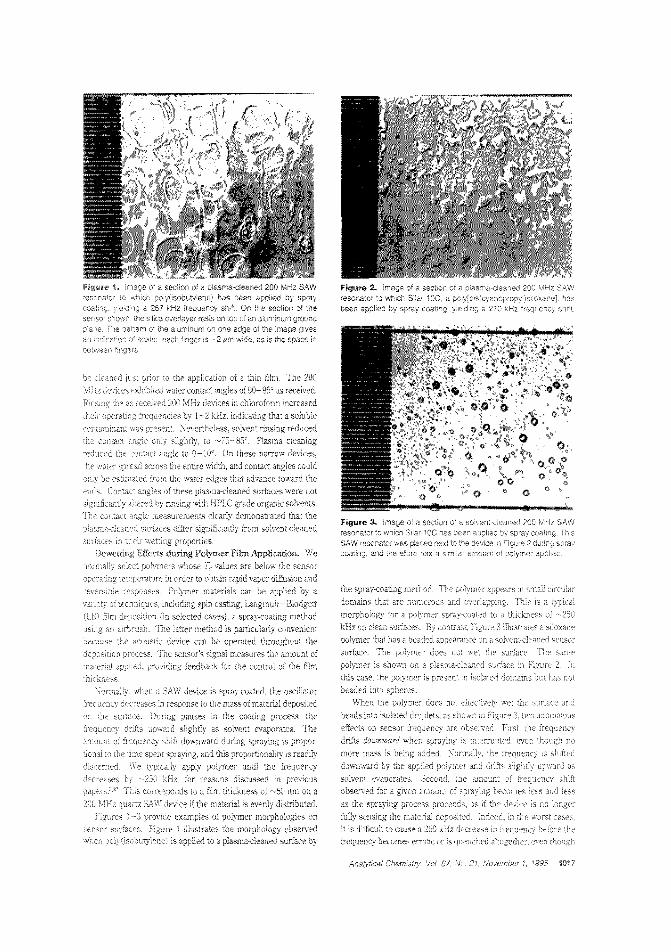
subsequent examination i..mdCf the microscope shows that aconsiderable amount of polymer is present.
These effects were particularly severe when poly[ (phenyl
methyl)- and poly[bis(cyanopropyl)siloxanes] were applied ontosolvent-cleaned sensors. These polymers are viscous liquid andstiff greasy materials, respectively, On solvent-cleaned 200 MHz
devices, we could not make functional vapor sensors from these
polymers since oscillation bf'crlme quite elTatic before the device
registered a 250 kHz frequency sh'ft Under the optical micro
scope, it was clear that the siloxanes had t'om1ed isolated round
droplets of material on these surfaces (e.g., see Figure 3), When
these two polysiloxanes were spray-coated onto plasma-cleaned
devices, coating proceeded normally without the anomalous
downward drift, and functional vapor sensors were obtained,Before we investigated plasma-cleaned sensor surfaces, we
made some preliminary efforts alter the surf,'ces with silanizing
reagents. Treatment of a solvent-cleaned device with hexameth
yldisilazane vapors at room temperature Dvernight significantly
influenced the subsequent coating process. (Hexamethyldisila
zane converts surface hydroxyl groups to bimethylsiloxy groups,)Using poly[ (phenylmethyl)siloxaneJ as the test polymer, the
material could be applied in the nonna1 fashion to the usual 250kHz thickness, 111e frequency did drift downward after coating,
but this phenomenon was significantly reduced relative to thatobserved with the soivent-cleaned devices, Another solvent
cleaned device was treated with a freshly prepcred solution made
by adding dichloramethylpheny1silane to methanoL In this case,
coating proceeded nonnally (without downward drift), Although
the efijciencies of the above silanization methods on the solvent
cleaned surfaces are uncertain, the results demonstrate that
surface modification can influence the coating deposition process
in difficult cases and that the behaviors we have described are
related to the surface charactelistics. Since these preliminary
experiments, we have developed si1z.nization procedures for SAW
devices that ')lock surface hydroxyls md improve polymerwetting.'::':;:'
A less severe example devvetting behavior involved a poly-
(epichlorohydrin) resin, a viscous liquid with physical character
istics similar to those of the siloxanes, It could be easily coated
onto a solvent-cleaned device to a thickness 0: 300 kHz, Never
theless, slight downward freqllency drifl observed after pauses
in the coating process suggested that a dewetting problem mightexist. Results consistent with this suspicion were obtained in
subsequent vapor tests (see below). The application of this same
resin a plasma-cleaned proceed-::d ,\;vithout anomalous
frequency drift.
Additional evidence for improv::d film stability on plasma"
cleaned surfaces can be seen observing polymers on solvent~
and plasma-cleaned sUlfaces at elevated tEmperatures. Forexample, poly (vinyl propionate) was solvent cast into continuous
thin films on solvem-cleaned and plasma-cleanecl158 MHz devices.
These were heated to 85 'C in a convection oven, and the film on
the solvent-cleaned device broke up into isolated droplets within
miL However, the film on plasma-cleaned device remained
continuous, even a11er 24 at elevated temperature. Similar
effects of surface cleaning have been observed on flexural plate
;V1. R In /nterjacial Design andHarTlson, C. J.. ACS Symposium
Washngton, DC. 1994: pp 280-
j. W.. in preparation.
4018 Analytical Chemistry Va! 67. No. 21. November 1, 1995
wave (FPW) devices,'" After initial experiments where po1y(vinylpropionate) dewet the FPW device surface, the device was cleaned
with an H20,jH2SO" solution,:;; The same polymer did not dewet
this cleaned surface, even after repeated heating and cooling
cycles,
Dewetting Effects during Vapor Exposures. We have
observed that sensors exhibiting the anomalous effects noted
above during film application sometimes cease to oscillate during
exposures to organic vapors, This cannot be demonstrated in the
severe cases where the sensor does not function at alL but it can
be observed in "borderline" cases, For example, when a dich10romethylphenylsilane-treated sensor coated with poly[ (phenyl
methyl)siloxaneJ was exposed to vapers, it stopped oscillating.
Reexposure to clean carrier gas restored oscillation. but thebaseline was shifted to a lower frequency, This process was
repeated many times with a variety of vapors (see Experimental
Section), The shifts in baseline frequency after vapor exposures
were in the same direction as the dO"nlward drift observed after
the siloxanes were coated onto solvent-cleaned de\ices, where
beading was observed, Oscillation difficulties and baseline
frequency shifts were not a problem when this polymer was coated
onto a plasma-cleaned senser.
The sensor described above with po1y(epichlorohydrin) resin
deposited on a solvent-eleaned surface produced normal responses
to most vapors at the test concentrations, but two (ciichloroethane
and butanone) caused it to stop oscillating. These problems did
not occur when the same resin was tested on a plasma-cleaned
sensor. [A solid poly(epichlorohydrin) polymer we have used in
past studies coats normally and responds to vapors 'Without loss
of oscillation using either solvent- or plasma-cleaned devices.]
Discussion.. To summarize, the following effects are associ
ated with poor wetting and adhesion of the polymer: the matotial
visibly beads into droplets (as observecl under the optical
microscope) after coating or oIler vapor exposures; the frequency
drifts downward during pauses in spray coating and after stopping
spray coating; spray-coated polymer may not produce consistent
frequency decreases throughout the coating process, and in the
worst cases, one may not be able to obtain a functional sensor
because of loss of oscillation, Vapor exposures may quench the
oscillation, and the baseline may be shifted after the vapor Is
removed, (The latter effect is observable in borderline cases,)
Plasma cleaning sensor surfaces prior to film application can
prevent these problems from arising; we have obtained well
hehaved vapor sensors from a great variety of polymers by spray
coating them onto plasma-cleaned 200 MHz SAW resonators.
is presumably the high surface energy of the plasma-cleaned
device that favors wetting, although it is also likely that different
polymer/surface interfacial free energies result when polyoers
are applied to plasma-cleaned versus solvent-cleaned surfaces.::"In our experience, these effects are more likely to be obsen:ed
if the polymer is a viscous liquid than if it is a solid rubber and
more likely to be seen after vapor exposures than without such
expo~ures_ Presumably, lower viscosity facilitates more rapid
dewetting, The physical appearance of the coated material may
change with time and/or vapor exposures, depending on the
viscosity and wetting properties of the polymer. Beading is
observed if the polymer dewets the surface, but in other cases,
(:35) Grate. J. W.: Wenzel, S. W.; Vi/hite, R. M. Anal. Gem. 1992,64.(36) One reviewer noted that plasma cleaning with Barrick plasma cleaners can
change surface roughness and that this mi\.;h' alsoproperties.
sharper features of the overlapping circle morphology (Figure 1)soften, and in some cases polymer domains spread. The latterobservation indicates that the surface forces favor wetting ratherthan dewetting, and a stable film and well-behaved sensor can beexpected.
When dewetting occurs, it indicates that the coated polymerfilm was not in a thermodynamically stable state. Reiter23
investigated continuous thin polymer films where dewetting wasinitiated by the formation of cylindrical holes whose diametersincrease >Yith time. Our sprayed-on films are not necessarilycontinuous and may have holes from which dewetting mayproceed. Nevertheless, Reiter's studies showed that dewettingof thin films can occur regardless of whefher the film has defectsto begin with or not, and our own experiments with an apparentlycontinuous thin film of poly(vinyl propionate) confirm this.Therefore. applying a polymer film by a method that gives acontinuous thin film '-"ill not necessarily prevent dewetting. Inthis regard, the initial film morphology is probably less importantthan fhe balance of forces that determine its equilibrium morphol
Og'l·
Further, believe that it is the wetting and adhesion of thepolymer on the surface, rather than slmply the shape of thedeposited polymer domains, fhat influenoe sensor performance.In previous studies, poly(vinyltetradecanal)-eoated SAW senSorsprepared with continuous thin films applied by the LB methodwere oompared wifh films applied by the spray-coating method.yielding the overlapping circle morphology described above(Figure 1), and fhese responded similarly to organic vapors3
The possibility of dewetting has a number of consequencesfor polymer-coated SAW sensor development. The SAW deviceswe used are purchased and used in many other laboratories, and
is common practice for polymer films to be applied and used>Yith no microscopic observations of film morphology or behavior.The possibility fhat unobserved polymer dewetting processes may
influence sensor behavior could lead to irreproducible results orerroneous interpretations and conclusions. It has also been ourobservation that dewetting problems have become more commonas our research has progressed to higher frequency SAW deviceswith thinner films3 Since this is the general direction for SAWsensor development, attention to polymer film wetting andadhesion is likely to become increasingly important.
We wish to emphasize that physically adherent films wifh longlifetimes can be easily made provided attention is paid to thecleaning and surface preparation of the sensor prior to coating.In previous studies, we have described polymer-coated SAW vaporsensors that were repeatedly exposed to vapors over periods ofmonths.2.5 fn our experimental work~ we routinely place afiuoropolyokoated 158 MHz dual delay line SAW sensor in seriesafter our test sensors whenever we test new sensors >Yith ourvapor generation system.3.".28 The responses of this controlsensor are used to confirm that the system is generating vaporproperly. We have used tl,e same sensor in this application for~5 years and countless vapor exposures with consistent performance and no problems with polymer dewetting.
ACKNOWLEDGMENTWe acknowledge Mark Klusty for careful observations during
several of fhe initial experiments that led to fhis study; WilliamR Barger and Arthur Snow for helpful discussions on wetting,adhesion, and surface characterization; and Richard Colton forsuggesting the plasma-eleaning method and providing the apparatus. This work was supported by the Office of NavalTechnology/Naval Surface Warfare Center, Dahlgren, VA
Received for review March 15. 1995. Accepted August 9.1995.®
AC950262X
® Abstract published in Advance ACS Abstracts, September 15, 1995.
Analytical Chemistry, Vol 67, No. 21. November 1. 1995 4019
Ana!. Cham. 1995, 67.4020-4023
An Improved Method for the Construction ofUltramicroelectrodes
P. Tschunckll' and J. Heill1ze*
Institut fUr Phys/kaJische Chem/e, Un/vers/tat Fre/burg, Albertstrasse 21, 79104 Fre/burg, Germany
(;arrc<!u. D,; Hapiol. P' SaV('aiL, J. M. j. Eledroanal. Oem. 1989, 272,
EXPERIMENTAL SECTION
Electrodes. Much has been Wlitten on the problem of howone connects an ultramicroelectrode, and the latest developmentsconcern the use of shieldings J8- 23 which enable one to decreasethe stray capacitance." But the proposed methods for theconstruction of shielded electrodes are often very complicated.
Usually, ultramicroelectrodes consist of a hookup wire toconnect the working electrode to the potentiostat, which itself isconnected to a microwire with the help of silver epoxy. The
microwire is sealed into soft glass (Figure la)_
(16) Arnatore, c.; LefrOli. c.]. Electroanal. Chern. 1989.324, 3:J-5S.(17) Howell, J. 0.: Kuhr. W.·C.; Ensman, R. E.; Wightman. M. Eleclro01Jai
Chern. 1986,209,77-90.(18) Bond, A M,; Fleischmann, M.; Robinson. J.]. ElcctroanoL. Chern. 1984.
168.299-312.(19) Besenhard, j. 0.; Schulte, A; ]annakoudakis, P. D.; Heinze.].; TschLl1cky.
P. Tagungsband DECHElvlA Symp. Mikroelel~trochemie, friedrichroda.1992.
(20) Dayton, M, A; Brown, ]. c.; StUlts, K .1.: Wighlman, R M. Anal.1980,52,946.
(21) Baer, C. D,; Stone, N. J.; Sweigart, D. A. Anal. Chern, 1988, 60, 188.(22) Suarez Fernandez, A L.; Garcia Calz6n, J. A: Garcia, A. c.; Blanco, P, T.
Rler.trnanalysi.~ 1991, 3, 413-417.(23) Nomurra, S.; Nozahi, K; Okazaki, S, Anal. Chern. 1991,63,2665-2668.(24) Wightman, R. M.]. Electroanaf. Chern, 1989.269,15-25.
Generally, all experiments performed under fast-scan conditions suffer from the problem that faradaic currents rise proportionally to V1/2, while capacitive currents change directly propor
tional to the scan rate v. Unexpectedly, the capacitive currentnormalized for the electrode area also increases with decreasingelectrode radii.
It is the so-called stray capacitance that is responsible for this
effect This capacitance is caused by the counter and referenceelectrodes, on the one hand, and the working electrode, on theother hand.
Normally, at very high scan rates the faradaic peal{-shapedsignal is predominated by a huge, mainly capacitive backgroundsignaL Under these conditions, the evaluation of cyclic voltammograms becomes difficult
For this reason, often very high concentrations of the elecn-oactive species are used.2
However, an increase in concentration involves disadvantlges.On the one hand, the current measured at the electrode tipincreases and therefore iR distortions develop. On the other hand.the reaction rates of second- and higher-order reactions increase.and thus the determination of kinetic parameters becomes moreand more difficult.
In order to work with small concentrations and iast scan ratesat the same time, tricks such as shielding the ultramicroelectrodeshave to be used.
1991.305. t53-
1993.32. 1268.1988. 60. 2460.
~vI. ]. Phys. Oem. 1988, 92, 5987-
c. P.]. EL'Ctro(,llal. Chem. 1991,304,
f.j. Electrocnal,'::hem. 1989.270.43-
F. j. Electroaml.
, A. c.~ WighLman, R M. I. Elcctroanal. Chern. 1989,
E!eCiroanal. Chern. J 986.331,913-924.).J ~""",unUL Chem. 1991,306,87-109.
Barel, A. J. j. ElectrOQJial. Clem. 1992,331,913-
1.: D.]. EJectroand. Chern. 1986, 200, 371-
269, 15-2SAmalorc. Co: Lcfrou,
S992.
(5) Llrumbc. D.: Callanlo.
Interest In ultramicroelecn-odes is largely due to their unusualmass transport properties at low scan rates and the small currentsmeasured. 1
The latter fealure enabled a series of new, transient electrochemical techniques such as fast-scan vollammetry and potentialslep methods. The iR drop problem can be widely avoided, evenat very high scan rales up to the megavolt per second range, whensufficiently small electrodes are used.H4
\iever1heless, only a few groups have published papers on thisspecial topic. The reason for this is the difficdty of constructingthe potentiostat and electrode IS-17
this paper different techniques to decrease straycapacitance effecta on fast-scan cyclic voltammetry withultramicroelectrodes are discussed, The use of newmethods of connecting the electrode microwire and thedevelopment of effective shieldings for the electroderesulted in a drop of a factor of 5 in the capacitive currentsobtained in a standard electrolyte solution. Furthermore,
a new method for constructing ultramicroelectrodes hasbeen developed, which is almost 100% effective In supressing stray capacitance. Electrodes down to radii of 1pm have been constructed. The electrodes have beenused to determine the rate constant of heterogeneouselectron transfer for the reduction of anthracene. Theresults dearly demonstrate that the proposed methods areeffective for the decrease the stray capacitance and easyto perform.
(61 HapioL Pinson, J.; Francesch, Mhamoli. F.; Rolando. c.; Schneider,S.]. E!ecirounal. Chem. 1992.328,327-331
m !\nc1rivux, C. P.: Audebert. P.: BaDia!. P.; Sav{'ant, J. M.]. Am. Chern. Soc.1990.112,24:)9-2440.
Nloiroux, J: &,veant,]. Electroanl. Chern. 1992,331,
4020 Analytical Chemistry. Vol. 67. No. 21. November 1, 1995 0003~2700/95/0367-4020$9.00/0 © 1995 AmerIcan Chemical Society
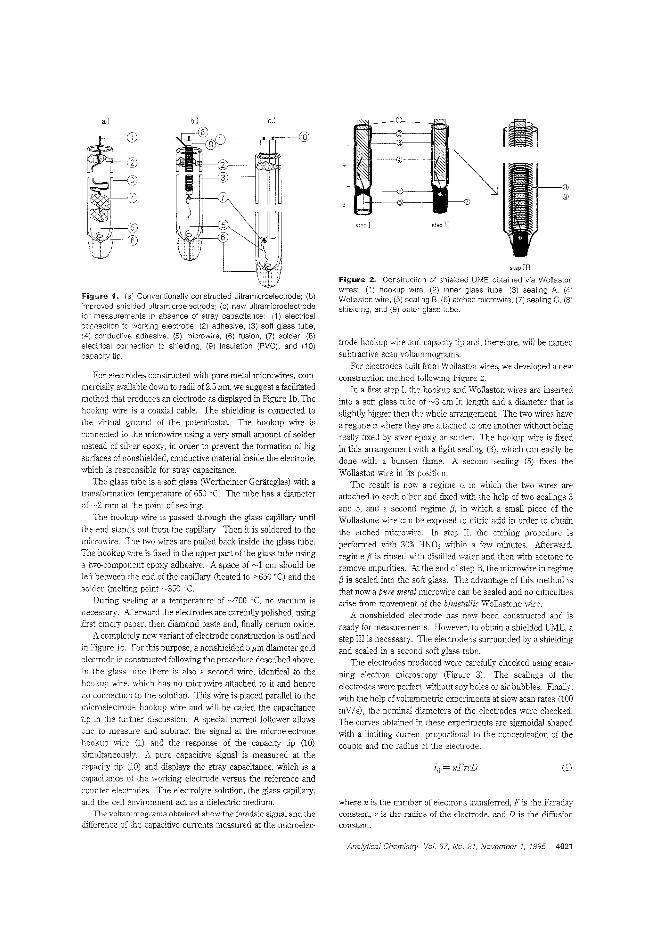
Figu.e 1. (a: Conventionally constructed uitramicroelectrode; (b)improved shielded ultramicroelectrode; (c) new ultramicroelectrodefor measurements in absence of stray capacitance: (1) electricalconnection to working electrode, (2) adhesive, (3) soft glass tube,(4) conductive adhesive, (5) nicrowire, (6) fusion, (7) solder, (8)electrical connection to shielding, (9) insulation (PVC), and (10)capacity tip,
For electrooes constnlcterl with pure metal microwires, commercially available dovm to radii of 2,5I"m, we suggest a facilitatedmethod that produces an electrode as displayed in Figure lb, Thehookup wire is a coaxial cable. The shielding is connected tothe virtuai ground of the potentiostat. The hookup wire isconnected to the microwire using a very small amount of solderinstead of silver epoxy, in order to prevent the formation of big
surfaces of nonshielded, conductive material inside the electrode.which is responsible for stray capacitance.
The glass tube is a soft glass (Wertheimer Gerateglas) with atransformation temperature of 650 vc. The tube has a diameterof '~2 mm at the point of sealing,
The hookup wire is passed through the glass capillary until
the end stands out from w'le capillary Then it is soldered to themicrowire, Tne two wires are pulled back inside the glass tobe,The hookup wire is fixed in the upper part of the glass tube usinga two-component epoxy adhesive. A space of -1 cm should beleft between the end of the capillary (heated to >650"C) and thesolder (melting point ~-350 'C.
During sealing at a temperature of ~700 'C, no vacuum is
necessary, Afterward the electrodes are carefully polished, usingfirst emery paJer, then diamond paste and, finally cerium oxide,
A cDmpletely new variant of electrode construction is outlined
in figure lc. for this purpose. a nonshielded 5 fAm diameter goldelectrode is constructed folloVYing the procedure described above.
in the glass tube there is also a second wire, identical to the
hODkuJ wire, which has no microwire attached to it and henceno connection to the solution. This "ire is placed parallel to the
microelectrode hookup wire and will be called the capacitancetip in the further discussion. A special current follower allowsone to measure and subtract the sibrna1 at the microelectrode
hooku? wire (1) and the response of the capacity tip (10)
simultaneously, A pure capacitive signal is measured at thecapacity tip (10) and displays the stray capacitance, which is acapacitance of the wcrking electrode versus the reference andcounter electrodes. The elec::rolyte solution, the glass capill81y.and the cell environment act as a dielectric medium.
-The voltammograms obtained show the faradaic signal and the
difference of the capacitive currents measured at the microelec-
(1)i" = nFrcD
",pIlIFigure 2. Construction of shie:ded UME obtained via Wollastonwires: n hookup wire, (2) inner glass tube, (3) sealing A, (4)Wollaston wire, (5) sealing B. (6) etched micrcwire< (7) sealing C, (8)shielding, and (9) outer glass tube,
where n is the number of electrons transferred, F is the Faradayconstant r is the radius of the electrode, and D is the diffusionconstant.
trode hookup wire and capacity tip and, therefore, will be namedsubtractive scan voltammograms,
For electrodes built from Wollaston wires, we developed a newconstruction method following Figure 2.
In a Erst step I, the hookup and Wollaston "ires are insertedinto a soft glass tube of ~3 em in length and a diameter that is
slightly bigger then the whole alTangemenl. The two wires havea regime a where they are attached to one another without beingreally fixed by siver epoxy or solder. The hookup wire is fixedin this alTangement with a tight sealing (3). which can easily bedone with a bunsen flame, A second sealing (5) fixes the
Wollaston wire in its position.The result is now a regime a in which the two wires are
attached to each other and fixed with the help of two sealings 3and S, and a second regime f3. in which a small piece of theWollastone wire can be exposed to nitric acid in order to obtainthe etched microwirc, In stcp II, the etching procedure is
perfcrmed with 30% ENG" within a few minutes, Afterward.regime f3 is rinsed with distilled water and then with acetone toremove impurities. At the end of step B. the microwire in regime{3 is sealed into the soft glass, The advantage of this method ist.hat now a pure metal microwire can be sealed and no difficultiesarise from movement of the bimetallic Wollastone wire.
A nonshielded electrode has now been constructed and is
ready for measurements, However, to obtain a shielded UME, astep III is necessary, The electrode is surrounded by a shieldingand sealed in a seconcl soft glass tube<
The electrodes procluced were oarefully checked using scanning electron microscopy (Figure 3), The sealings of the
electrodes were pedect, without any holes or air bubbles. Finally,with the help of voltammetric experiments at slow scan rate, (100
mV/ s), the nominal diameters of the electrodes were checked.The curves obtained in these experiments are sigmoidal shapedwith a limiting CUITem proportional to the concentration of thecouple and the radius of the eleCTrode,
a)
Analytical Chemistry, Vol, 67, No, 21< November 1, 1995 4021
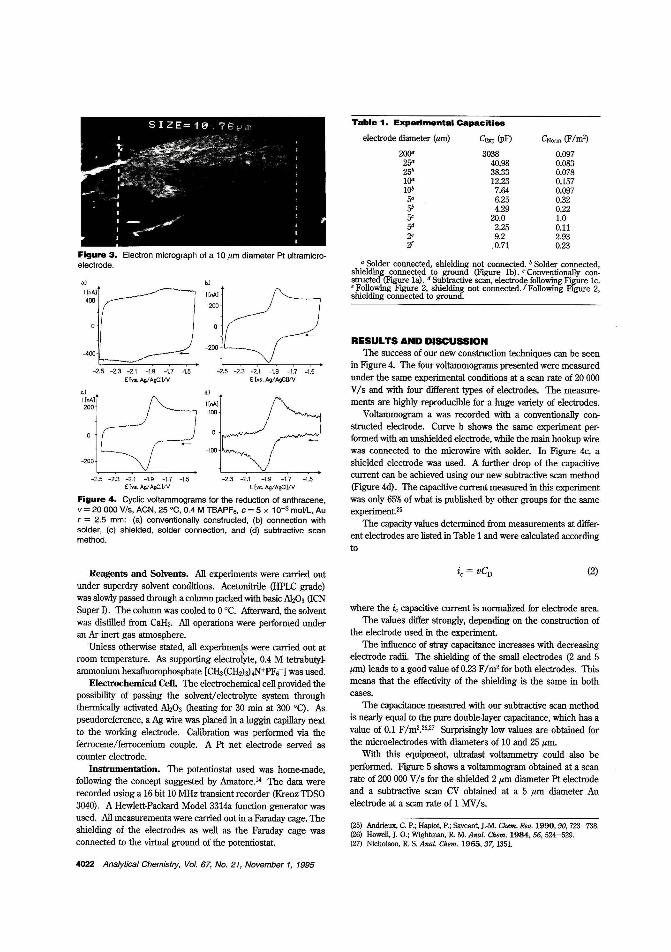
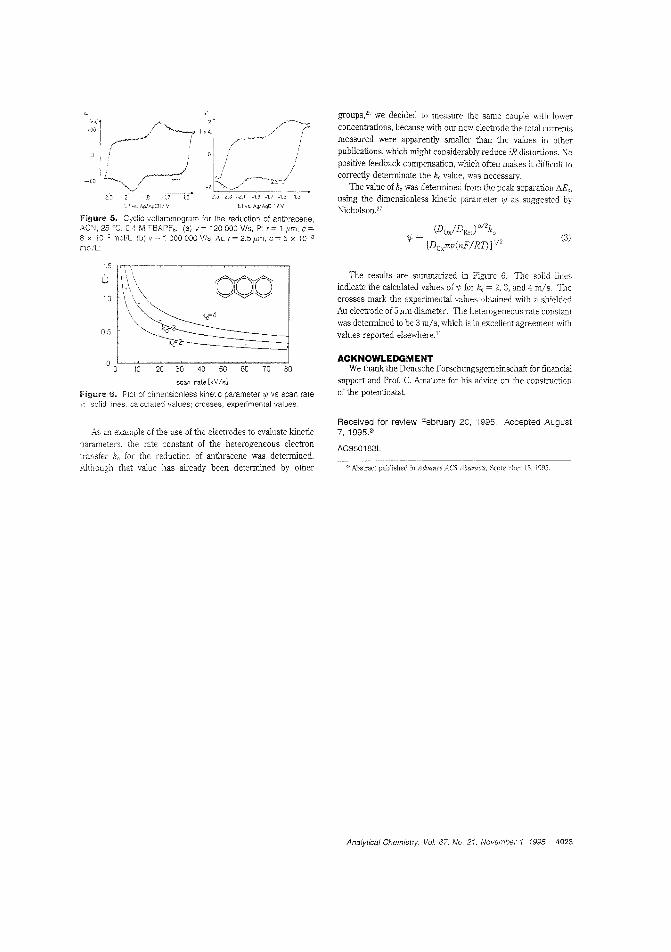
b,)
5. Cyclic voltammogram tor the reduction of anthracene,25 "C, 0.4 M TBAPF,: (a) v = 120000 Vis, Pt r = 1 I'm, c =
8 x 10 3 moliL (b) 1 000000 Vis, Au r~ 2,5 I'm, c = 5 X 10⁻³
molL:
groups,'S we decided to meaSUEe the same couple ",ith 10weE
concentrations, because with our new electEode the total curEentsmeasured were apparently smaller than the values in otheEpublications, which might considerably reduce iR distortions, Nopositive feedback compensation, which often makes it difficult tocorrectly detenmnate the k" value, was necessary,
The value of k, was determined from the peak separation 1'1£,,,using the dimensionless kinetic parameter ljJ as suggested byNicholson,27
(3)
scan rate [kV/s]
Figllre 6. Plot 01 dimensi8nless kinet'c parameter VI vs scan ratev: solid lines, calcclate:l values; crosses, experimental values
0,5
10
000
20 30 40 50 60 70 80
The results are summarized in Figure 6, The solid linesindicate the calculated values of 1fJ for k, = 2, 3, and 4 m/s, Thecrosses mark the experimental values obtained with a shieldedAu electrode of 5 f1m diameter. The heterogeneous rate constantwas deter1Ilined to be 3 mis, which is in excellent agreement "'ithvalues reported elsewherell
ACKNOWLEDGMENTWe thank the Deutsche FOEschungsgemeinschaft for financial
support and Prof. C. Amatore for his advice on the constructionof the potentiastat
As an example of the use of the electrodes to evaluate kineticparameters, the rate constant of the heterogeneous electrontransfer k" for the reductioE of anthracene was determined,Although that value has already been determined by other
Received for review f'ebruary 2C, 1995 Accepted August7, 1995@
AC950183L
o Abstract published in Advance ACS Abstracts, September 15, 1995.
Analytical Chemistry, Vol, 67, No, 21, November r 1995 4023
Anal. Chem. 1995, 67, 4024-4027
Channel Flow Cell for Attenuated Total ReflectionFourier Transform InfraredSpectroelectrochemistry
Rachael Barbour, Zhenghao Wang, In Tae Bae, Yuriy V. Tolmachev, and Daniel A. Scherson*
Department of Chemistry, Case Western Reserve University, Cleveland, Ohio 44106-7078
pattern developed within this CE arrangement, the same cell usedfor the UV-vis experiments was modified to probe the solutionpast the electrode surface with attenuated total reflection (ATR)Fourier transform infrared (Fr-IR) spectroscopy. This approachmakes it, in principle, possible to take advantage of the highspecificity of IR spectroscopy for the identification of solutionphase products, and possibly relatively stable intermediates.formed at electrode surfaces as a function of the applied potentialand other operating conditions.
This note describes the cell employed in these infrared studiesand provides the first illustration of the use of ATR-IT-IR for thedetection and identification of solution phase products of anelectrochemical reaction under well-defined conditions of laminarflow.
EXPERIMENTAL SECTIONSpectroelectrochemical Channel Cell. The CE-type cell
designed for in situ UV-vis spectroscopic measurements anddescribed in an earlier paper" (width, a = 0.9 cm; height, 2 II =0.11 em) was modified to accept a parallelepiped-type ZnSe internalreflection element (IRE, 50 x 20 x 3 mm, 45', InternationalCrystal), placed adjacent to, and forming a common plane \Vith.the Au working electrode (WE, length, I = 0.5 cm; width,0.6 em) cast in Kel-F (see lower section of Figure 1). As indicatedin the figure, the long axis of the IRE was aligned normal te thedirection of fluid flow. Contributions to the IR signal originatingfrom sections of the channel outside the area defined by theelectrode width downstream from the electrode edge (andtherefore, unaffected by the electrochemical reactions) wereeliminated by sputtering a thick gold layer onto the large face ofthe prism (see Figure 1). The back side of the IRE was alsocoated "ith a thick layer of gold to avoid other artifactual effects.A saturated calomel electrode (SCE) and a gold piece cast in Kel-Fplaced downstream from the Kel-F-east Au ViE on the oppositeside of the channel were used as reference and counter electrodes.respectively (see upper section of Figure 1).
Instrumentation. All IT-IR spectra were acquired in an IBMIR-98 equipped with a liquid nitrogen-cooled Mer detector atcm -1 resolution (zero-filling factor, 2) with the cell mounted on acustom-made reflection absorption attachment. The potential of
the electrode was controlled with a PAR Model 173 potentiostatand a PAR Model 175 Universal programmer. The pumpingsystem employed in these studies was the same as that reportedelsewhere,,5
A channel-iype spectroelectrochemical cell is described
for the acquisition ofpotential difference (PD) attenuated
total reflection Fourier transfonn infrared (A'IR-FT-IR)spectroscopy of solution phase species generated at anelectrode sutface under conditions ofwell-defined laminarflow. The capabilities of the cell have been assessed using
the reduction of bisulfite (2 M) in a weakly acidic (pH =5.25), unbuffered, aqueous electrolyte as a model system.
The PD A'IR-FT-IR spectrum obtained at -0.85 V vs SCE,a potential negative enough for the reduction of HS03- toproceed, compared to the spectrum recorded at a poten
tial at which no reaction occurs (0.0 V vs SCE) as areference, was dominated by negative- and positivepointing contributions due to the reactant, bisulfite, andthe predominant product, dithionite, respectively. Also
identified in the spectrum was sulfite, which is producedby the dissociation of bisulfite induced by the increase inthe pH of the medium during the reduction reaction.
Theoretical aspects regarding the quantitative analysis ofthese data are briefly discussed.
Considerable progress has been made in this laboratory towardthe development of in situ optical spectroscopic techniques in thepresence of convective flow. H Attention has been centered on
the coupling ofUV-vis spectroscopy with rotating disk (RDE)I-3and channel-type (CE) electrodes' to monitor the integrated
concentration profile of solution phase species. In the first case,
a beam of light is reflected off the surface of the RDE at nearnormal incidence, whereas for the CE, the spectrum is collected
in the transmission mode through the solution past the electrodesurface. More recently, lTV-vis spectroscopy was employed tomap the flow in a CE celJ.5 The results of the :atter investigationshowed that, under steady state, diffusion-limited conditions, the
absorbance measured along an axis nOlmal to the electrodesurface (y), at a fixed distance from the electrode downstream
edge (X2), denoted as Ay (x2), is invariant across the width of theelectrode along the full length of the channel. In addition, it wasfound that Ay(X2) as a function of X2 matches the theoretical
predictions of the standard formalism,6 without the introduction ofany adjustable parameters. Prompted by the close-ta-ideal flow
(1) Zhao, M.: Scherson, D. A Anal. Chem. 1992. 64,3064.(2) Zhao, M.: Scherson, D. A.]. Electrochem. Soc. 1993, 140, 1671.(3) Zhao, M.: Scherson, D. A]. Electrochem. Soc. 1993, 140, 2877.(4) Wang, Z.: Zhao, M.; Scherson, D. A Anal. Chern. 1994,66,4560.(:3) Wang, Z.: Scherson, D. A]. Electrochem. Soc., submitted.
(6) Ca) Albery, W. J,; Coles, B. A; Couper, A65,901. (b) Coles, B. A; Compton, R G.j.87.
EicctroGnaL. Chem. 1975.Chem. 1983,144,
4024 Analytical Chemistry, Vol. 67, No. 21, November t, 1995 0003-2700/95/0367-4024$900/0 © 1995 American Chemical Society
reaction takes place, and at E,,," ~ -0.8.5 V vs SCE, at which the
reduction of bisulfite proceeds at significant rates, for flow rates
in the range 0.07-0.8 mLis. The spectral collection was effected
either by coadding 1000 interferometric scans sequentially, first
at E"m and then at En', or by acquiring 10 scans alternately at
E"m and End, with a 20 s time delay after each potential switch(by a step) to allow the concentration profile to achieve steadystate. A total of 1000 scans were recorded at each potential, which
were then coadded and stored in the computer for further
processing, In both cases, the results are displayed in the for:n
-log I"m/lcervs wavenumber, where I~"m and In,rrepresent single
beam spectra obtained at the sanlpling E~"n and reference E""potentials, respectively.
ATR-FT-IR Spectra of Reference Materials, ATR-FT-IR
spectra of 2 M NaHS03 (curve B. Figure 2) and 0.4 M Na,SO"
(curve C, Figure 2), ratioed against water, and 0.5 M Na,S,O,
(sodium dithionite) in 2 'V!!\aHS03, ratioed against 2 M NaHSO,
(curve D, Figure 2), were collected under stagnant conditions
using an uncoated ZnSe crystal. These were used as referencesfor the analysis of potential difference (PD) ATR-FT-IR spectra
obtained in situ.
Wavenumbers, cm- j
Figure 2. Curve A (solid line): Potential difference JlTR-FT-lRspectrum for the eduction of bisulfite ion in an aqueous solution atpH = 5.25, obtained using the sequential method (see text for details)with Ere! = 0.0 V and Esam = -0.85 \J vs SeE. Flow rate, V = 0.07mUs. CUN8 B: Solution phase spectrumof a 2 M bisulfite ion solutionratioed against water. Curve C: Solution phase spectrum of a 0.5 Mdithionite solution in 2 M bisulfite solution ratioed against a 2 M bisulfitesolution. Curve 0: Solution phase spectrum of a 0.5 M sulfite solutionratioed against water. Curve A' (do'ted line) was obtained by acombination of spectral contributions due to bisultite (0,0073 x curveB), dithionlte (0.011 x curve C), and sulfite (0.019 x curve D) (seelext for details)
RESULTS AND DISCUSSIONReduction of BisuJJite Ion in a Weakly Acidic, Unbuffered,
Aqueous Electrolyte. A typical PD ATR-FT~IR spectrum for the
reduction of a 2 M HSO"-, unbuffered, aqueous solution (pH ~
5.25) on a galrl electrode in a channel-type cell (flow rate, V =0,07 mLls), obtained using the sequential method (En" = 0.0 V
y
counter electrode
a .
~~l .. gasket Iightin
X·<" .~-/""'-'Z--" /.U-_~,_~_~
light oul AJ layer
2h
figure 1. Schematic diagram of a channel-type spectroelectrochemical cell for ATR-FT-IR measurements of solution phase electrogenerated species under well-defined conditions of !aminal' flow(lower 'igure). For the sake of clari'y, some of 'he cell componentshave been Dmitted. ; anj w are the length and width of the electrode,respectively. ,~ partial view of the cell along the direction of fluid flowis shown in the upper figure, where 2h is the full height of the channelcell. The darke- area in the center of the component di·ectly abovethe gasket represents the counter electrode cast in Kel-F.
__1-
fiow~"".".•.~••.4••. ""'. i.' '.~:W.
' \." , "-c----.-:"'.,;; "
Electrochemical Standardization of the Spectroelectro
chemical CE-Type Cell. After assembly, and prior to the
spectroelectrochemical experiments, the proper operation of the
CE-type cell was tested with a 10 mM Fe (NH,),SO'i solution in
0.11\1 H,S04' A plot of the diffusion limited current vs jIl/3, where
V is the flow rate (in mLls), was linear in the range 0.Q7 < V <
2.0 mLis (slope, S = 0.73 ± 0.02 llLA.(s/mL):J:l; intercept, 0.007;
correlation, R 0.9993). The magnitude of S was found to be in
excellent agreement 'with that calculated on the basis of the
dimensions of the channel and the electrode (see abeve) and the
diffusion coeffcient of the ferrous species evaluated from independent rotating disk measurements (5.3 x 10-& em'/ s), I.e., S= 0.71 mA(s/mL)l!3
ATR~FT~IR Spectroclectrochemical Arrangement. After
thorough rins;ing, the r.ell was mounted on the reflecTjon absorp
tion attachment and placed in the sample compartment (SC) of
the spectrometer. Two openings on the lid of the SC were used
to house the inlet and outlet solution feedthroughs to the cell.
During spectral acquisition, the SC was purged with nitrogen to
minimize spectral contributions due to water vapor and carbon
dioxide.
In SituATR-FT-IR Measurements under Forced Convection, Possible spectral artifacts derived from the continuous flow
of liquid through the cell were examined by ratioing two sets of
100 coadded scans obtained in sequence using a 0.22 M bisulfite
solution in an aqueous phosphate buffer. The results obtainedrevealed no differences between ratioed spectra recorded underforced convec:ion and stagnant conditions, indicating that the
operation of the pump does not affect to any signiiicant extent
the spectral quality. Following these measurements, the solutionreservoir, including the cell, was filled with a 2 M NaHS03 solution
(Fisher, ACS analyzed) prepared with ultrapure water obtained
fTom a modified Gilmont distillation system and adjusted to pH= .52.5 with conccnlTaterl NaOH. Spectra were recarrlerl 'mlh theelectrode polarized at a potential Ee", = 0.0 V vs SCE, at which no
Analytical Chemistry, Voi. 67, No 21, November 1, 1995 4025
~1.0
\-04
0 001
II 0.8'b . I 10 \'f\
0.05x C~ 0
0.60.10:;:;
6~_1 c:
~Q)Clc 0.40
L:..:: B 0If) 100
OIl If)
.f Q)
C 0.2 X20
-1.ti)
cOJE0 00
1400 1200 1000 800 -1 0 2 3 4 5
Wavcnumbcrs. em-]
Figure 3. Comparison between PO-ATR-FT-lR spectra obtainedin the sequential mode under the experimental conditions specifiedfor curve A in Figure 2 for flow rates V~ 0.07 (curve A) and 0.35mUs (curve B).
and E"", = -0.85 V vs SCE). is shown in curle A (solid line) of
Figure 2. As may be expected on the basis of hydrodynamic
considerations, an increase in V gives rise to a decrease in themagnitllrlf: of the spectral features, as the differences in thesolution composition become smaller with increased convection.
This effect is illustrated in Fignre 3, which compares spectraobtained for V = 0.G7 (curve A) and 0.35 mLis (curve B).
Only a slight improvement in signal-to-noise was observed for
measurements performed using the switching instead of thesequential mode (not shown), indicating that effects due to long
tenTI drifts are not very significant.
Spectral Assignment. Tile positions of the negative- andpositive-pointing bands of typical PD ATR-FT-IR recorded in theseexperiments (see solid liue, curve 11.., Figure 2) are in agreement
"ith those of bisulfite and dithionite (S20,2-") shown in curves B
and C in the same fignre. Ti1is indicates that 5204'- is one of thepredominant products or the reduction of HS03- on Au under
the experimental conditions selected for these studies.
Careful inspection of these curves, however, revealed that the
ieature attributed to S'!0,2- In the PD ATR-FT-IR specrra (918em ') Is much broader than that of pure S20,2- in the same
medium (see curve C in this figure). The most likely explanatIonfor this effect may be due to the presence of S032-, for which thespectmm shows a band centered at 927 cm-1 (see curve D in
this fignre). Sulfite can be generated via acid-base equilibriumdue to an increase in pH derived frem the reduction of HS03- onthe electrode surface in iliis unbuffered media. In fact, the
expelimental PD ATR-FT-IR spectrum (see curve A, Fignre 2)could be successfully resolved in terms of the sum of negativepointing bisullite (0.0073 x curve B) and positive-pointing diiliion
Ite (0.011 x curve C) and sulfite (0.019 x curve D) contributions,
to yield curve A' (dotted line) in this fignre. Each of the numericalfactors in parentheses can be multiplied by the specific concentra
tion of the reference spectrum to obtain ilie average concentration
Figure 4. Plots of the dimensionless concentration of a product (c~ dd'), generated at the suliace of an electrode in a channel understeady state, diffusion-nm'ltcd conditions, as a function of the dimen
sionless distance normal to the plane of electrode; past the electrodesurface. The values next to each of the GUN8S represent dimensionless distances from the downstream edge of the electrode along thedirection of fluid flow, %2. The inset shows olots of the relative changesin the surface concentration of the product (Clc;;=o == c1c~=o) as afunction of the distance from the suliace. over the range 0 < 2 <
0.5, for different values of %2.
of each of the species generated or consumed by the electro
chemical reaction.Theoretical Considerations. Considerable Insight into a
quantitative interpretation of PD ATR-FT-IR spectra of the typeshown in curves A of Fignres 2 and 3 can be gained on ilie basis
of an analysis of the concentration profile past the electrodesurface along x and y (see FIgnre 1). Fignre 4 shows plots of the
steady state, dimensionless concentration (CI) = ci r lo) profile of aproduct generated at the surface of an electrode under diffusionlimited conditions along a dimensionless axis normal to the
electrode surface, ~ = (3VI2ah2Dol)l!3y, where is the bulkconcentration of ilie reactant, a the channel 'kidth, h the half-cell
thickness (cm), and Do the diffusion coefficient of ilie product
(cm2Is). These curves were calculated by a numerical integrationof the standard governing differential equation," for vaJious values
of the dimensionless vaJiable %2 = x2/1, where x, is the actual
distance along x measured from the downstreanl, edge of theelectrode. Except for %2 = 0, the downstream electrode edge.the profile along ~ (or y) is charactelized by a fairly flat region
close to the channel surface ~, i.e., y = 0, followed by a linearsection, which decays exponentially into the bulk of the solution.A detailed inspection of ilie behavior close to the surface showsthat for values of X2 > 1/10, the actual product concentration in
the region 0 < X < 0.5 differs by no more than 5% from its value
on ilie surface (see inset in l'ignre 4). This observation is of much
significance, as for reasonable values for the parameters involved,
e.g., h = 0.055 em, a = 0.9 em, Do = 5 X 10⁻⁶ cm2/s, 1= 0.5 cm.and for flow rates in the range V = 0.1-1 mLls, ~ = 0.5corresponds to actual distances from 18 down to 8 I'm, and
4026 Analytical Chemistry, Vol. 67. No. 27. November 1, 1995
therefore longer than the theoretical penetration depth of the IRradiation for the ZnSe!solution interface in the fingerprint region(3-5,um). Since the concentration profile at a fixed X2 is invariantalong the 'Nidth of the electrode, the region probed by the FT-IRbeam displays only X2 dependences This is particularly convenient, as c(;O.0), the surface concentration of the product past theelectrode surface under diffusion-limited conditions (see Figure
for S= 0), can be expressed in analytic form based on theintegral fom13lism introduced originally by LighthilF
The application of chemometric techniques, such as thoseimplemented by Bennett and co-workers' for the rigorous analysis
situ ATR-FT-IR aqueous mixtures of sulfur-oxygen anions,
may be expected to provide the necessary information to establishquantitatively "eaction rates and mechanisms as a function of theapplied potential for a wide variety of electrode processes. Itshould be pointed oul that, despite the high concentration ofbisulfite in the solution, the signals observed are relatively small.
(7) Lighthi:J, M. J. Proc. R. Soc. Londo}) 1950, A202, 359(8) Ilclmar., D 1\.; TlOmpson, A W.; BellIlell, D. W.; Otvos, J. D. AMi. Gtem.
1994, 66. 1378.
This is due to the fact that under the conditions selected for theseexperiments, the current is well beiow its diffusion-limited valuefor the reduction of bisulfite, and therefore, the amount of productgenerated is rather small. Furthermore, the dimensions of theelectrode and the cell used in these studies enable only one ortwo reflections at the IRE element!solution interface. Both ofthese factors should be carefully considered in the search ofstrategies for the further optimization of this type of channel cellin situ ATR-FT-IR experiments.
ACKNOWLEDGMENTThis work was supported by iIRPA Grant No. N-OOO-14-92-]
1848. Valuable discussions with Prof. Bennett are gratefullyacknowledged.
Received for review May 8, 1995. Accepted August 15,1995."
AC950436A
o Abstract published in .Advauce ACS Abstrads, September 15. 1995.
Analytical Chemistry. Vol. 67. No. 21, November 1, 1995 4027
Anal. Chem. 1995, 67. 4028-4031
Use of the Derivatizing Agent 4-Aminobenzoic Acid2-(Diethylamino)ethyl Ester for High-SensitivityDetection of Oligosaccharides by ElectrosprayIonization Mass Spectrometry
Ken·ichi Yoshino,t Toshifumi Takao,* Hiroshi Murata, and Yasulsugu Shimonishi
Institute for Protein Research, Osaka University, Yamadaoka 3-2, Suita, Osaka 565, Japan
A method for the high-sensitivity detection of oligosacchalides hy electrospray ionization mass spectrometry(ESI-MS) is reported. The method involves the chemicalderivatization with 4-aminobenzoic acid 2-(diethylamino)ethyl ester (ABDEAE). This derivative, which contains a2-(diethylamino)ethyl group, having a high proton affinity,enhances the ionization efficiency of analytes in thepositive ESI mode. Experiments using maltohexaose asa model oligosaccharide revealed that derivatization withABDEAE gave a remarkably large increase in molecularion abundance. Using a mixture of acetonitrile, 2-methoxyethanol, 2-propanol, and water (1:L1:1 v/v/v/v) assolvent for ESI, ABDEAE-derivatized maltohexaose couldbe detected at a level of 10 froo!. This represents a 5000fold improvement in sensitivity over underivatized maltohexaose. ESI tandem mass spectrometry of the ABDEAE·derivatized maltohexaose provides structural infonnation at the low-picomole level. In this spectrum,LoX' and 0,2An series of sequence ions, arising from ringcleavage, were observed as the predominant ions.
It is widely known that the carbohydrate chains of glycoconjugates contribute significantly to the functional properties ofglycoconjugates.1.2 As a result, one of the most challengingstructural problems in cell biology and chemistry involves thestructural determination of these groups. Several mass spectrometric techniques have proven to be useful analytical tools forthe determination of oligosaccharide structure,3., all of which havethe advantage over chemical or chromatographical methods inthat they yield molecular mass information \\1th relatively highsensitivity. Electrospray ionization mass spectrometry (ESI-MS)has been shown to be valuable in the structural characterizationof carbohydrate chains ofglycoconjugates. i - g The poor ionization
Current address: Department Infectious Diseases Research, NationalChildren's Medical Research Center Taishido 3-35-31, Setagaya-ku, Tokyo 154,Japan.
(1) Radamacher, T W,: Parekh, R E.; Dwek, R. A Anm!. Rev. Biochem. 1988,57, 785-838.
(2) Cumming, D. A. 1991,1,115-130.e)) Dwck. R Edge, D.].: Parekh. R. B. Annu. Rev. Biochem.
1993. 62. 65-100(4) Burlingame, A. 1-.: Boyd, ~ K.: Gaskell, S.l.Awl. Chem. 1994,66. 634R
683R(5) Duffin, K. L; Welply, ]. K.; Huang, E.; Henion,]. J. Anal. Chem. 1992,
64, 1440-1448.(() Conboy.].].: Henion,]. OJ Am. Soc. Mass Spectrom, 1992,3,804-814.(7) Huddleston, M. J,; Bean, M. F.; Carr S. A. Anal. Chern. 1993,65, 877
884.
4028 Analytical Chemistry. Voi. 67. No.2" November 1, 1995
efficiency of free carbohydrate chains in ESI, however, limits theutility of ESI-MS in stl1lctural carbohydrate studies. Attempts havebeen made to overcome these problems by imprO\~ng the solventsystem for ESI5 and by labeling oligosaccharides with cl1romophores or fluorophores, which were originally developed toimprove sensitivity in high-performanoe liquid chromatography(HPLC) 10.11
In this study, we report a highly sensitive method for thedetection of oligosaccharides by ESI-MS. The method involveschemical derivatization with 4-aminobenzoic acid 2·(diethylamino)ethyl ester (ABDEAE). The UV chromophore, a benzoyl group.not only penuits sensitive detection by UV but also mal<es analytesamenable to separation on an octadecylsilica column by reversedphase (RP)-HPLC"2 The amino group is used for the covalentattachment of the compound to the reducing termini of oligosaccharides through reductive aminationI3 The basic tail [a 2-(diethylamino)ethyl group] possesses a high proton affinity. whichenhances the ionization efficiency of analytes in the positive ESImode, The method has wide applicability and can be used inconjunction with any oligosaccharide which contains a reducingterminus.
EXPERIMENTAL SECTIONChemicals. ABDEAE hydrochloride was purchased from
Tokyo Chemical Industry (Tokyo, Japan). Sodium cyanoborohydride and 4-aminobenzoic acid ethyl ester (ABEE) were obtainedfrom Sigma Chemical Co. (St. Louis, MO). A high-mannose·typeN-linked oligosaccharide (Man,GlcNAc2). derived from ribonuclease B (RNase B), is a product of Oxford GlycoSystems(Abingdon, U.K). Maltooligosaccharides were purchased fromNakano Vmeger (Handa, Japan). D-Glucose, maltohexaose, andother reagents of analytical grade are products of Nacalai Tesque(Kyoto, Japan).
Derivatization of Oligosaccharides. ABDEAE-derivatizedoligosaccharides were prepared,14 with slight modifications. usingthe methodology reported for the preparation of the ABEE
(8) Carr, S. A; Huddleston. M. ].: Bean, M. F. Protein Sci. 1993. 2. 183-196.(9) Liu,].; Volk, K J.; Kems, E. H.: Klahr, S. E.; Lee, M. S.: Rosenberg, 1. E.
]. Chromatogr. 1993,632,45-56.(10) Suzuki-Sawada, J.; Umeda, Y: Kondo, A.: KaLO. I. Ana!. Biochem. 1992.
207,203-207.(11) Gu.].; Hiraga. T.; Wada, Y. Bio!. Mass Spectrom. 1994,23,212-217.
(12) Wang, W. T.; leDonne, N. c., Jr.; Ackerman, B.: Swec1ey, C. C. AllaiBiochem. 1984, 141, 366-38L
(13) Hase, S.; Hara, S.; MatsushiDa Y.f Biochem. 1979,85,217-220.(11) Yoshino. K; Takao, T.; Murata, H.; Shimonishi, Y. Proceedings o/the 12nd
Annual ASMS Conference on Mass Spectrometry and AWed Topic: Chicago.IL, May 29-June 4, 1994; P 932.
0003-2700/95/0367-4028$9.0010 © 1995 American Chemical Societv
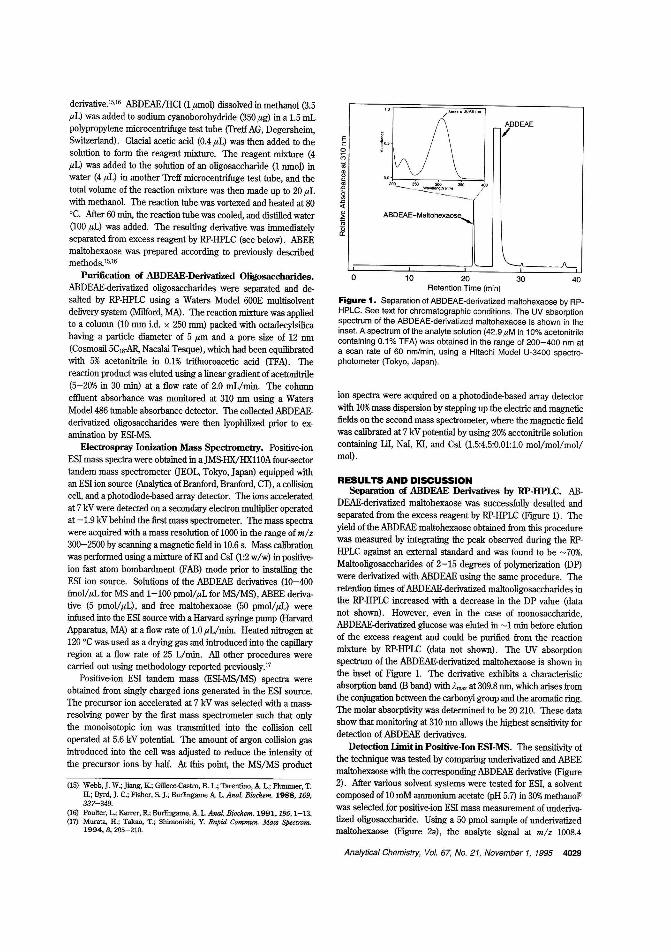
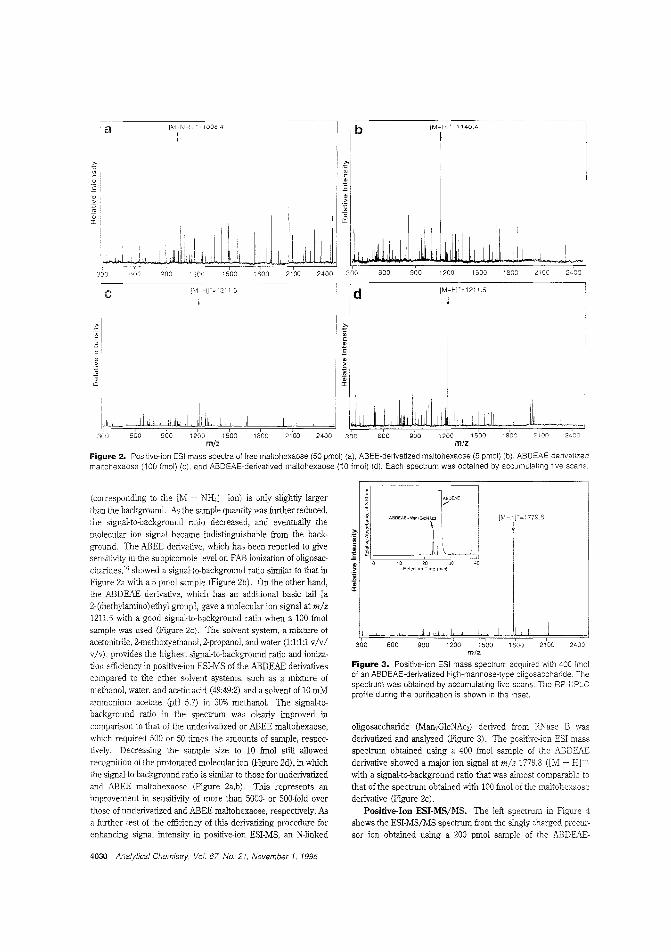
a [M~NH-1r 100&4
jb [M+H] = 1140.4
I
300
~'inc.E..~..a:
300 600 900 1200 1500 1800 2100 2400 120C 1500m/z m/z
Figure 2. Positive-ion ESI mass spectra of free maltohexaose (50 pmol) (a), ABEE-derivatized maltohexaose (5 pmol) (b), ABDEAE-derivatizedmaitohexaose (100 fmol) (c), and ABDEAE-derivatived maltohexaose (10 fmol) (d). Each spectrum was obtained by accumulating five scans.
240021001800
L900 12DO
i
600i
1500m/z
Figure 3. Positive-ion ESI mass spectrum acquired with 400 fmolof an ABDEAE-derivatized high-mannose-type oligosaccharide. Thespectrum was obtained by accumulating five scans. The RP-HPLCprofile during the purification is shown in the inset.
oligosaccharide (Man,GlcNAc2) derived from Rl'\Tase B wasderivatized and analyzed (Figure 3). The positive-ion ESI massspectrum obtained using a 400 fmol sample of the ABDEAEderivative showed a major ion signal at mlz 1779.8 ([M + Hjc')with a signal-to-background ratio that was almost comparable tothat ofthe spectrum obtained with 100 fInol of the maltohexaosederivative (Figure 2c).
Positive-Ion ESI-MS/MS. The ieft spectrum in Figure 4shows the ESI-MS/MS spectrum from the singly charged precursor ion obtained using a 200 pmol sample of the ABDEAE-
(corresponding to the [M + NH4" ion) is only slightly larger
than the background. As the sample quantlty was further reduced,the signal-to-background ratio decreased, and eventually themolecular ion signal became indistinguishable from the background. The ABEE derivative, which has been reported to givesensitivity in the subpicomole level on FAB ionization of oligosaccharides,16 showed a signal-to-background ratio similar to that inFigure 2a with a 5 pmol sample (Figure 2b). On the other hand,the ABDEAE derivative, which has an additional basic tail [a2-(diethylamino) ethyl group], gave a molecular ion signal at mlz1211.5 with a good signal-to-background ratio when a 100 fmolsample was used (Figure 2c). The solvent system, a mixture ofacetonitrile, 2-methoxyethanol, 2-propanoL and water (1:1'.1:1 v/vlvIv), provides the highest signal-tc-background ratio and ionization efficiency in positive-ion ESI-MS of the ABDEAE derivativescompared to the other solvent systems, such as a mixture ofmethanol, water, and acetic acid (49:49:2) and a solvent of 10 mMammonium acetate (pH 5.7) in 30% methanol. The signal-tobackground ratio in the spectrum was clearly improved incomparison to that of the underivatized or ABEE maltohexaose,which required 500 or 50 times the amounts of sample, respeclively. Decreasing the sample size to 10 fmol still allowedrecognition of the protonated molecular ion (Figure 2d), in whichthe signal-to-background ratio is similar to those for underivatizedand ABEE maltohexaose (Figure 2a,b). This represents animprovement in sensitivity of more than 500D- or SOD-fold over
those of underivatized and ABEE maltohexaose, respectively. Asa further test of the efficiency of this derivatizing procednre forenhancing signal intensity in positive-ion ESI-MS, an N-linked
4030 Analytical Chemistry, Voi. 67, No. 21, November 1, 1995
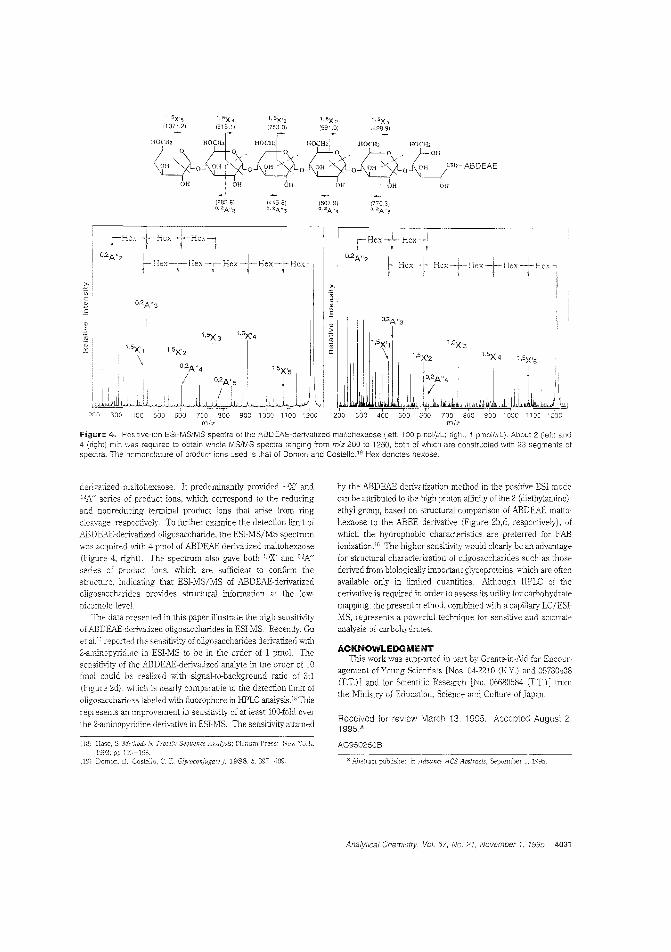
HOC."'!/i\~~O
OH
(607.9)o,2A"4
HOUb;011 ,O~CI-l2- ABDEAE
OJ!
'. Hex-ji-HeX--j, 1
O?-A"2
7(0 800m/z
Figure 4. Positive-ion ESI-MS/MS spectra of the ABDEAE-derivalized maltohexaose (left, 100 pn,ol/pL: righl, 1 pmol/pL). About 2 (left) and4 (right:1 min was required tJ obtain whole MS/MS spectra ranging from mlz 200 to 1250, both of which are constrL:cted with 23 segments atspectra. The nomenclature of product ions Jsed is :hat of Domon and Costello.19 Hex denotes hexose.
derivatized maltohexaose. It predominantly provided LOX' and
IJ1A" series of product ions, which correspond to the reducingand nonreducing tenninal product ions that arise from ringCleavage, respectively. To furher examine the detection limit ofP,.EDEAE-derivatized oligosaccharide. the ESI-MS/MS spectrum
was acquired '''ith 4 pmol o[ ABDEAE-derivatized maltohexaose(Figure 4, right). The spectrum also gave both l.ex' and 1111\:'
series of product ions, which are sufficient to confirm thestructure, indicating that ESI-MS/MS of ABDEAE-derivatizedoligosaccharides prov'ides structural information at the low
piomole level.The data presented in this paper iLustrate the high sensitivity
ofABDEAE-dcrivatizcd oligosaccharides in ESI-MS. Recently. Guet a1..l. 1 reported the sensitivity of oligosaccharides derivatized ,/lith2-aminopyridine in ESI-MS to be in the order of 1 pmoL Thesensitivity of the ABDEAE-de:ivatized analyte in the order of 10fmol could be realized with signal-to-background ratio o[ 3:1(Figure 2d), which is nearly comparable to the detection limit of
oligosacchalides labeled with fluorophore in HPLC analysis. 1s 111isrepresents an improvement in sensitivity of at least lOD-fold over
the 2-a'11inopytidine delivative in ESI-MS. The sensitivity attained
([8; Sequence Analysis; Plenum Pres,,: New Yurk,
GlycocorJuga!ej. 1988,5,397-409.
by the ABDElili derivatization method in the positive ESI mocecan be attributed to the high proton affinity of the 2-(diethylamino)ethyl group, based on structural comparison of ABDEAE maltohexaose to the ABEE derivative (Figure 2b,d, respectively), ofwhich the hydrophobic characte:istics are preferred [or FAB
ionization." The higher sensitivity would clearly be an advantagefor structural characterization of oligosaccharides such liS thosp.
derived from biologioally important glycoproteins, which are oftenavailable onLy in limited quantities. Although HPLC thederivative is required in order to assess its utility for carbohydratemapping, the present method, combined with a capillary LUESIMS, represents a powerful technique for sensitive and accurateanalysis of carbohydratEs.
ACKNOWLEDGMENTThis work was supported in part by Grants-in-Aid for Encot:r
agement of Young Scientists [Nos 04--2210 (KY.) and 05780438
(TT.)] and for Scientific Research [No. 06680584 (TT.)] fromthe Ministry of Education, Science and Culture of Japan.
Received for review March 13 1995. Accepted August 2,1995."
AC950250B
o Abstracl pJblishecl in. ldvance ACS Abstracts, September L 199.'5.
Analytical Chermstry, Vol. 57, No. 21, November 1, 1995 4031

A u I h 0 r In de r ,,.L _
AbrUfla, H. D., 3936Achterberg, E. P., 3903Annapragada, A, 3871Armstrong, R. D., 3928Athey, D., 3928
Bae, T., 4024Ball, M.., 3928Barbour, R., 4024Barman, B. N., 3861Beussman, D. J., 3952Boon, J. J., 3965Brown, R. S., 3990
Carlson, R. E., 3829Carr, P. W., 3886Chen, M.-C., 4010Chiu, Y-W, 3829Choi, M. F., 3897
Dang-Vu, B., 4000Dasgupta, P. K., 3853de Koster, C. G., 3965Dennison, M. J., 3922Dugay, A., 4000
Enke, C. G., 3952
Fairbank, R. W. P., 3879Fanali, S., 3866Faruque, A., 3846Fiorentino, M. A, 4004Fitzloff, J. F., 3985
H. H. S., 3985Fu M. Y, 3871
Giddings, J. C., 3861Grate, J. W., 4015Guyon, F., 4000
Hall, J. M., 3922Hawkins, P., 3897Heeren, R. M. A, 3965
Heinze, J., 4020Ho, W.O., 3928Huang, C.-R., 3985Huang, H.-,J., 4010
John, C. M., 3871
Kar, S., 3853Karu, A E., 3829Kenndler, E, 3866Ketterer, M. E., 4004Krause, S., 3928Kromann, P. R., 3846Kumke, M. U., 3945
Lavine, B. K., 3846Leckie, J. 0., 3893Lee, M. L., 3840Lennon, J. J., 3990Li, G., 3945Linn, C. P., 3945Liu, Z., 3840Lorenzo, E., 3936Lu, Z.-Z., 3985Luque de Castro, M. D., 3916
Marcus, K. L., 3829Marshall, A. G., 3979Martin, S. A, 3971Martin, T. D., 3903Marto, J. A., 3979Mayfield, H., 3846McGill, R. A, 4015McGown, L. B., 3945McLane, R. D., 3952McNeff, C., 3886McNeil, C. J., 3928Moreau, J. C., 4000Murata, H., 4028
Odom, R. W., 3871Olieman, C., 3911Ong, C. G., 3893
Papaefstathiou, I., 3916Pariente, F., 3936Patterson, D. G., Jr., 3840Patterson, D. H., 3971Prasad, A., 3893
Rawson, K., 3928Regnier, F. E., 3971Rimando, A, 3985Rizzi, A, 3866
Salvati, L., 3871Scherson, D. A, 4024Schotzner, W., 3866Seeterlin, M. A, 3952Seldomridge, S., 3979Shimonishi, Y., 4028
Takao, T., 4028Tarr, G. E., 3971Tobalina, F., 3936Tolmachev, Y. V., 4024Tschuncky, P., 4020Turner, A. P. F., 3922
Van Berkel, G. J., 3958van Breemen, R. B., 3985van den Berg, C. M. G., 3903van Elteren, J. T., 3903van Riel, J. A. M., 3911Vlasak, P. R., 3952
Walker, G. T., 3945Wang, Z., 4024White, F. M., 3979Wirth, M. J., 3879Wright, J. D., 3928
Xiang, Y., 3879
Yoshino, K., 4028
Zhang, H, 3903Zhou, F., 3958
4032 Analytical Chemistry, Vol. 67, No. 21. November 1, 1995

New EdItortaI Mix
Exp8nded N4MS
""e.:h ArtIcIeI
lnelghta Into 1NndI.cI ControvenI..
Th6/~Publicationfor Environmental Sci8ntists
and Pr0f9ssi0n81s
FocusInsight
DepthTheNewDimension toEnvil'Dl1menfaScience&'R!ch1101ogy
Our..-.cled edIIDrIIII -.... ,.,..... • IlIMMe
of --. --.-' lIIepIh In ............. fIoonI_ ....Uon -' ........ tit I'8gIIIIIIIoM -' pubIIo
poIIc». Two ...., d.p."'ts. "R1I1.reb WIIeII" -'
"IPJ\~" hIghIIgIIt cWNnt ecthIIIM.,..,..... ..Iheee two ... of the apeGtnIm.
Critical anattsis of policy, WOI1dwide. news, innovations In
rneasu-ement. research artides by wei-known lllAhoriliiM - III of
these features olIer)'O\l II broader base 01~ then~
before. /\rd, our new 00YfJ( and irierior dllsign spolIglt ihIorme1ion
90 )'0\11' know exactly~te b look for new deYelopmenls In areas
lhaI are beginni1g to affect your work.
In acll:Mion 10 !he eutting-edge research klI' whcI'l,Ns~
is hlg1ly acxIaIned, tie new edi10rial mix includes i'Kleplh feature
aJtides CCNering the areas hI dr~ tie erlYil'OfYT1Ell1lal field:
SCieoo9,~. !PJerJYTl9rt. and sociEly.
'MliIe manyOltler Ell'lYirorfroen publicab)s are de'.ooled b
one dsdpline or <rdhef, no other ,oomal COITfIIeleIy irtegrates all
cIscipIInes of Ihe enWormentaIliekl.
Experieflce the new ErM'rrxmentaI ScIence & Technology.
&bscribe today!
To order your one-year subscription nght away can
toll-,,", 1·800-333-9511 (US. onlyl. Outside~ U.s. calt
614-447-3776. Faa to 614-447-3671.-WtIIiam KGlaze~,,_e..-,~HII
Wolle<~£AW,<G,-"
RonUlA.~_~aI~
Caos T. Milo<~"_CMh,OwptIll
JofaIdLSdYlOOr,-01_JoM SeinIeld__"-..owJooeph lA, S<AilI~01~
u.s.
S«
SIlO
$585
Canada &MexiCO
$68
5114
$609
Eur_' AM OlhorCOOO'(<e$'
5ge 5113
$142 $159
S63J 56&4
~ .PUBUOOlONS1.'. .....tiI..J '''_til' u,l'tIM. (.Jx'llXM :-.."'........
For Those %0 Can't Alwaystween The L· eSt
aVi Your Syring .
• P!Jurpr 0".,. NUlty tiJjUJt./ftJ ytNII'iitfu'u-
.'~~'-__~--'--"-~1
Related Documents